Global Research Unit Working Paper #2020-016 - CityU ...
24
© 2020 by Tiwari & Rao. All rights reserved. Short sections of text, not to exceed two paragraphs, may be quoted without explicit permission provided that full credit, including © notice, is given to the source. Global Research Unit Working Paper #2020-016 The Housing Conundrum in India Piyush Tiwari, University of Melbourne, Australia Jyoti Rao, University of Melbourne, Australia
-
Upload
khangminh22 -
Category
Documents
-
view
0 -
download
0
Transcript of Global Research Unit Working Paper #2020-016 - CityU ...
© 2020 by Tiwari & Rao. All rights reserved. Short sections of text, not to exceed two paragraphs, may be quoted without explicit permission provided that full credit, including © notice, is given to the source.
Global Research Unit
Working Paper #2020-016
The Housing Conundrum in India
Piyush Tiwari, University of Melbourne, Australia Jyoti Rao, University of Melbourne, Australia
The Housing Conundrum in India
Piyush Tiwari and Jyoti Rao,
Abstract
Recent housing policy discourse in India, which aims to achieve housing for all, has ignored
the way households meet their housing needs and adjust deviation between desired and
actual housing consumption. As in the past housing programs, there is reliance on an
aggregate notion of housing shortage in recent central government program for housing for
all, Pradhan Mantri Awas Yojana (PMAY), which gives credence to new housing construction.
This chapter highlights the importance of distinguishing new housing construction from the
requirements to upgrade or extend an existing house to adjust gaps in housing consumption.
These other methods of adjusting housing gap is the practice that households adopt on
ground. The other emphasis that this chapter places is on the understanding of housing gap
at the state level as due to cultural, climatic and institutional differences, the nature of
housing problem at the state level differs. As discussed in the chapter, there are differences
in housing affordability and housing gap at the state-level. Access and penetration to formal
finance and development approval processes also differ. These together indicate that an
approach to addressing housing gap will require a shift away from the macro notion of
housing shortage and would need sub-national interventions, which are contextual to states
and augment households’ own efforts to adjust their housing consumption. This would
mean programs should place larger emphasis on self-help construction activities and
improving penetration of formal finance in less well-off states. Experience of PMAY also
indicates that assisting upgradation or extension will have better success than building new
to meet household housing consumption requirements.
JEL classification number: O18, R31
Keywords: Housing gap, housing policy
Correspondence: Both authors are from the University of Melbourne, Australia. Piyush Tiwari, [email protected], Jyoti Rao, [email protected].
1
The Housing Conundrum in India Piyush Tiwari and Jyoti Rao University of Melbourne
1. Introduction This chapter presents a brief review of housing situation in India at the sub‐national (states and union territories) level. Due to significant economic and cultural differences across states and union territories, this review will provide much nuanced insights into housing problem for housing policies and programs to consider in their design and implementation. Starting with oft cited notion of housing shortage, based on Census 2011 (ORGCC,2020), The Technical Group on Urban Housing Shortage constituted by the Government of India to advise them in preparation of Twelfth Five Year Plan (2012‐17) estimated a shortage of 18.78 million housing units for 2012 (MoHUPA, 2012). This macro number captured the imagination of policy makers and developers more so because this was nearly 17 percent of existing urban housing stock. The Census 2011 also reported that about 9 percent houses were vacant, and an additional 18 percent were not in use exclusively for residential purposes, together comprising 27 percent of housing stock (ORGCC,2020). In this context, shortage at macro‐level is a bizarre notion as it hides the nature and factors that can affect underlying gap in housing. The word “gap” rather than “shortage” has been used deliberately here because gap illustrates deviation of the desired from actual and this may or may not translate into new housing need, which is the usual interpretation of housing shortage. Where new households1 are formed or those who don’t have a house and need to be housed, a new unit is required but where there is a mismatch between the desired from actual, it generates need to extend or upgrade an existing unit but not for a new house unless extension or upgradation of existing house is not possible. Failure to recognize this aspect has resulted in policies that implicitly promote new construction despite that they only partially meet the gap between desired2 and actual and often lead to unoccupied houses. Housing debate in India has conspicuously omitted discussion on regional dimension of housing shortage, let alone housing gap. Though housing is a state subject and any policy needs implementation through different states and their agencies, regional specificities
1 A ‘household’ is usually a group of persons who normally live together and take their meals from a common
kitchen unless the exigencies of work prevent any of them from doing so. Persons in a household may be related or unrelated or a mix of both. 2 A desired house is the one that a household wishes for, which is very specific to a household depending on their preferences. This is a utopian state, which gets constrained by budget, household composition, affordability, access to resources including finance, supply of housing and facilitating government policies and programs. These constraints determine the housing that gets consumed by a household. There is a state which is intermediate between the actual and desired, referred here as optimal housing, which is based on certain norms related to health and others, and determines what should be the housing consumption to meet these norms. In this chapter, we refer to optimal housing as desired housing. The norm based optimal housing allows us to look at the housing question at sub‐national level from the perspective of “gap” between optimal and actual housing consumption.

2
have been missing from policy discourses particularly those which are formulated by the national government such as the flagship policy of current central government, Pradhan Mantri Awas Yojana (translated as Prime Minister Housing Scheme – PMAY in short), which aims to achieve housing for all by 2022 through assistance provided to economically weaker section (EWS) of the society. As assessment of state‐wise distribution of assisted housing (presented later) illustrates that beneficiary of this central government policy have been households in those states which are economically better off. This highlights the importance of understanding housing gap at regional or state level. The objectives of this chapter are two‐fold (i) to provide an overview of state of housing and (ii) to examine the nature and causes of housing gap in India at the state level. A review of current central government housing scheme, PMAY, is also presented with the intention to identify shortcomings for policies and provide roadmap for future policies. Rest of the chapter is organized as follows: Section 2 presents a brief literature review. Section 3 presents macro context for housing in India. Section 4 discusses the regional disparity in economic growth. Section 5 examines the regional variation in housing gap and its nature. The section also discusses the question of affordability. Section 6 and 7 discuss various demand (availability and access to formal finance) and supply side factors (efficiency of planning approvals) at the state‐level that are necessary mitigants of housing gap. Section 8 assesses the effectiveness of PMAY and section 9 presents a discussion and concludes. 2. Literature Population growth, rising affluence and declining cost of home purchase for those who can access formal finance has led to substantial increase in the share of property holdings (in value terms) of households at macroeconomic level (Purfield, 2007). However, the linkages between the volatility in house price and the macroeconomy are weak as most of asset purchases, including housing, are financed by own savings of households rather than through bank finance or capital markets (Purfield, 2007). The nexus of supply induced housing demand has resulted in growth in investment in housing that is largely concentrated towards luxury investment housing purchased by higher income groups while leaving a large proportion of EWS, LIG and MIG households crowded out of market (Singh, 2013). Despite noteworthy activity in housing market as noted by Purfield (2007), the lopsidedness of private housing development activity has resulted in housing shortage being discussed in policy circles in India. While housing shortage has been an issue for policy making, the academic literature on understanding and modelling housing shortage has been limited. Technical Group of the Government for Twelfth Five Year Plan (2012‐17) has estimated housing shortage based on estimates of homelessness, congestion and obsolescence, as discussed later. There are studies that have critiqued estimates of housing shortage by the Technical Group of the Government for Twelfth Five Year Plan (2012‐17). Singh (2013) criticizes these estimates as they use same norm related to congestion and obsolescence for the whole country without recognition of regional/state‐wise differences. Singh (2013) emphasizes the importance of state/region level estimation of housing shortage as there are cultural,

3
climatic and geographical differences across states which impact preferences towards formation of households, size of houses, type of houses and building materials used and affect housing demand. Basing on the essential components of adequate house by United Nations Committee on Economic Social and Cultural Rights: legal security of tenure; availability of services, material, facilities and infrastructure; affordability; habitability; accessibility; location and cultural adequacy, and recommendation No. 115 of 1961 of the International Labour Organisation on worker’s housing, Singh et al (2017) derived criteria for adequate housing in rural areas. Based on a survey of 15 villages and projecting it to national level, Singh et al (2017) estimated that 140 million households in rural areas do not live in adequate houses in 2011, a much higher number compared to Government housing shortage estimate of 40 million houses in rural India. Tiwari and Rao (2016) have also estimated housing shortage, which is way higher than government estimates.
Over the last two decades, microeconomic studies have been conducted that analyse household determinants of housing demand in India (see Ahmad (2019); Roy (2018); Tiwari and Parikh (1998); Tiwari, Parikh and Parikh (1999)). These conclude that housing demand is income and price inelastic. The changes in income and house price do not result in significant change in housing consumption, particularly for homeowners, due to huge transaction cost involved in such adjustments (Roy, 2020). Highlighting housing market imperfections in India, Singh (2013) points towards incomplete information in terms of lack of data base about mortgages, transparency in transactions, proper laws, robust indices for benchmarking, which make it difficult to undertake rigorous market analysis. Absence of regulator(s) to supervise non‐financial aspects of housing market has resulted in housing being developed in an ad hoc and unplanned manner across the country (Singh, 2013).
Harish (2016) highlights the lack of discussion on rental housing particularly in recent government policy discourse on affordable housing. They find a strong positive correlation between urban workforce participation rate and percent of rental housing and argue that facilitating rental housing (both public and private) would be an essential enabler for household and city economic development. The public housing system in cities where it has been tried has failed due to fiscal and institutional challenges. Various innovative mechanisms (such as land lease to households living in slums on public land; land tax parity between ownership and rental housing; parity on electricity and water changes between ownership and rental tenures such as hostels) are necessary to facilitate rental housing development and provisioning (Harish, 2016). On the supply of affordable housing, Ram and Needham (2016) have investigated the challenges that developers face in supplying affordable housing and their survey results identify land availability, lengthy planning processes and lack of formal finance for EWS and LIG households as top three reasons. They argue that instruments such as higher floor area ratio norms for projects with affordable housing, transferable development rights which provide extra floor area ratio that can be applied elsewhere and tax exemptions for developers for affordable housing construction can reduce cost of affordable housing.
4
Sengupta (2010) emphasizes that incremental self‐help construction is a common and traditional method of housing production in India, especially in rural parts of the country but it finds little mention in housing policies. High land price, lack of tenure security in slums, discouragement from the government to undertake self‐help construction in informal settlements, lack of formal finance has hindered self‐help housing production resulting in housing poverty (Sengupta, 2010). In the context of low income households living in slums, despite unfavourable institutional framework for self‐help housing construction, Nakamura (2014) finds that households living in non‐notified slums are more likely to adjust their housing consumption through self‐help construction in an incremental manner, much more than their counterparts living in notified slums. The difference between notified and non‐notified slums is that the former is recognized by the government and has better tenure security. Households in slums (notified and non‐notified) largely spend their own savings for construction as the access to formal finance is miniscule. In the long run, the nature of housing that results from the incremental self‐help construction process is durable housing. The short literature review presented in this section highlights the importance of understanding the nature of housing problem, processes that households adopt to adjust deviation between current and optimal housing requirements, role of government affordable housing programs and the role of state‐level financial and non‐financial institutions in facilitating access to optimal housing for a household at the state level (district, block or village level, though preferable, would be difficult due to lack of availability of disaggregated data). 3. Macro context for housing in India Last three decades have seen an acceleration in economic growth in India (World Bank, 2020). The per capita income grew 3.5 times during this period (World Bank, 2020). The growth in income in cities has been much faster than villages (Sengupta, 2019). The phenomenal growth has also been accompanied by increase in inequalities across income, consumption expenditure and wealth, which is far more pronounced in cities than in villages (Himanshu, 2019). The income share of top 10 percent is 56 percent (World Inequality Lab, 2018), while the bottom 50 percent had an income share of less than 15 percent (Himanshu, 2019). The rise in income has not resulted in increase in household savings. In fact, household savings as a percentage of GDP have steadily declined from 24 percent in 2011‐12 to 17 percent in 2017‐18 (Ministry of Finance, 2020). The share of savings in form of physical assets in total household savings have also declined (Prakash et al, 2020). Sengupta (2019) attributes the decline in savings to rise in expenditure on services such as education, travel and healthcare, which are not translating into demand for consumer durables and assets. Youth unemployment is also high, which is also eroding household savings (ibid). Historically, the homeownership rate in India has been high. The homeownership rate in 2018 is 85 percent. The rural homeownership rate is 96 percent while the urban rate is 63 percent (NSS, 2019). These rates are similar to countries which are largely agrarian. Compared to 2012, the homeownership rate in cities increased in 2018 (NSS, 2019). With urbanization and prosperity, aspirations for homeownership in cities will increase further.
5
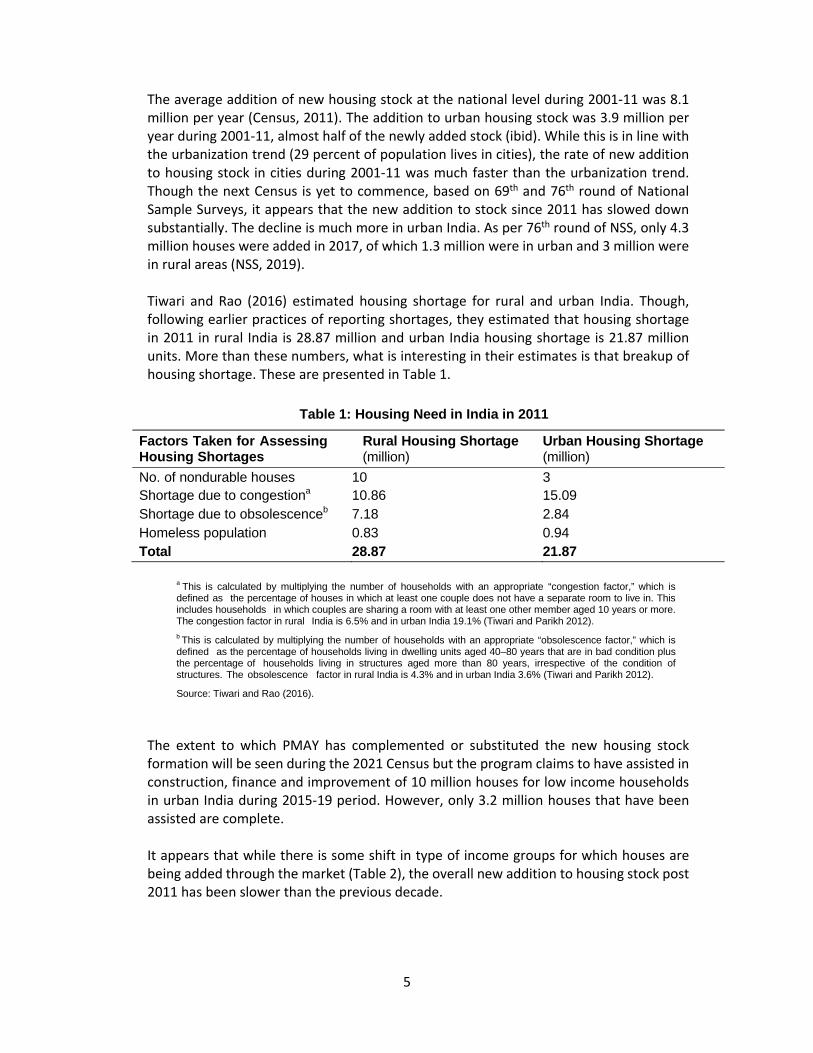
The average addition of new housing stock at the national level during 2001‐11 was 8.1 million per year (Census, 2011). The addition to urban housing stock was 3.9 million per year during 2001‐11, almost half of the newly added stock (ibid). While this is in line with the urbanization trend (29 percent of population lives in cities), the rate of new addition to housing stock in cities during 2001‐11 was much faster than the urbanization trend. Though the next Census is yet to commence, based on 69th and 76th round of National Sample Surveys, it appears that the new addition to stock since 2011 has slowed down substantially. The decline is much more in urban India. As per 76th round of NSS, only 4.3 million houses were added in 2017, of which 1.3 million were in urban and 3 million were in rural areas (NSS, 2019). Tiwari and Rao (2016) estimated housing shortage for rural and urban India. Though, following earlier practices of reporting shortages, they estimated that housing shortage in 2011 in rural India is 28.87 million and urban India housing shortage is 21.87 million units. More than these numbers, what is interesting in their estimates is that breakup of housing shortage. These are presented in Table 1.
Table 1: Housing Need in India in 2011
Factors Taken for Assessing Housing Shortages
Rural Housing Shortage (million)
Urban Housing Shortage (million)
No. of nondurable houses 10 3
Shortage due to congestiona 10.86 15.09
Shortage due to obsolescenceb 7.18 2.84
Homeless population 0.83 0.94
Total 28.87 21.87
a This is calculated by multiplying the number of households with an appropriate “congestion factor,” which is
defined as the percentage of houses in which at least one couple does not have a separate room to live in. This includes households in which couples are sharing a room with at least one other member aged 10 years or more. The congestion factor in rural India is 6.5% and in urban India 19.1% (Tiwari and Parikh 2012).
b This is calculated by multiplying the number of households with an appropriate “obsolescence factor,” which is
defined as the percentage of households living in dwelling units aged 40–80 years that are in bad condition plus the percentage of households living in structures aged more than 80 years, irrespective of the condition of structures. The obsolescence factor in rural India is 4.3% and in urban India 3.6% (Tiwari and Parikh 2012).
Source: Tiwari and Rao (2016).
The extent to which PMAY has complemented or substituted the new housing stock formation will be seen during the 2021 Census but the program claims to have assisted in construction, finance and improvement of 10 million houses for low income households in urban India during 2015‐19 period. However, only 3.2 million houses that have been assisted are complete. It appears that while there is some shift in type of income groups for which houses are being added through the market (Table 2), the overall new addition to housing stock post 2011 has been slower than the previous decade.
6
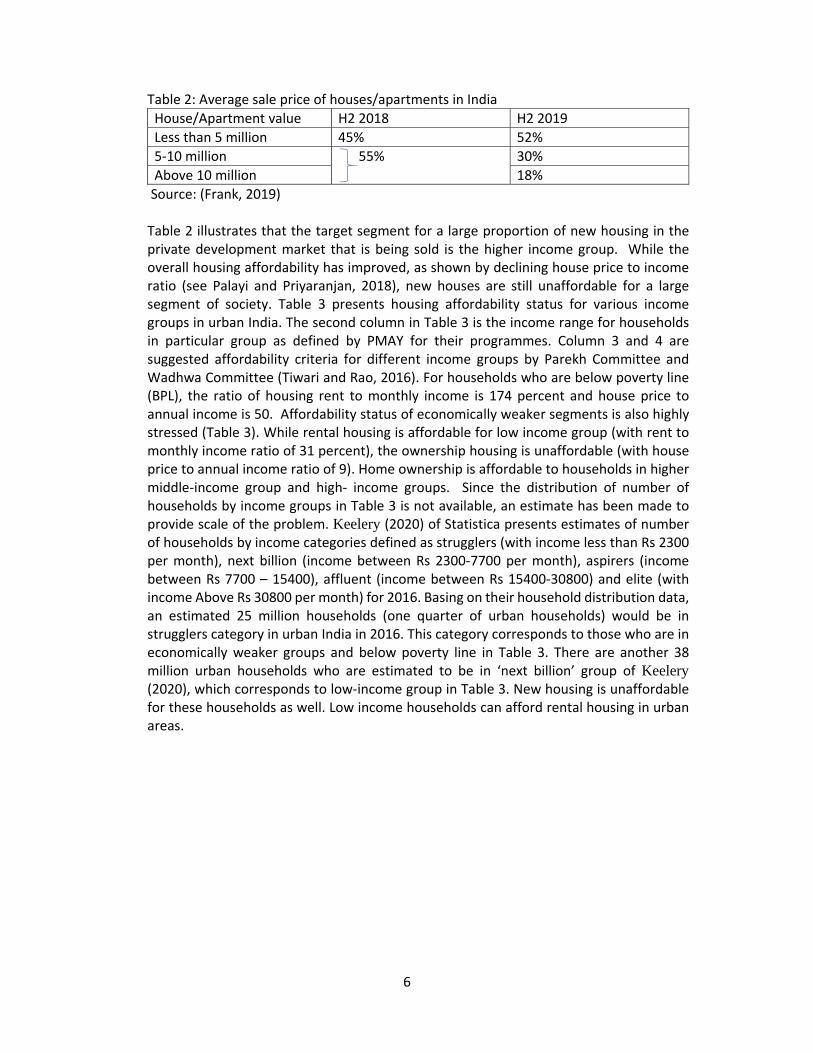
Table 2: Average sale price of houses/apartments in India
House/Apartment value H2 2018 H2 2019
Less than 5 million 45% 52%
5‐10 million 55% 30%
Above 10 million 18%
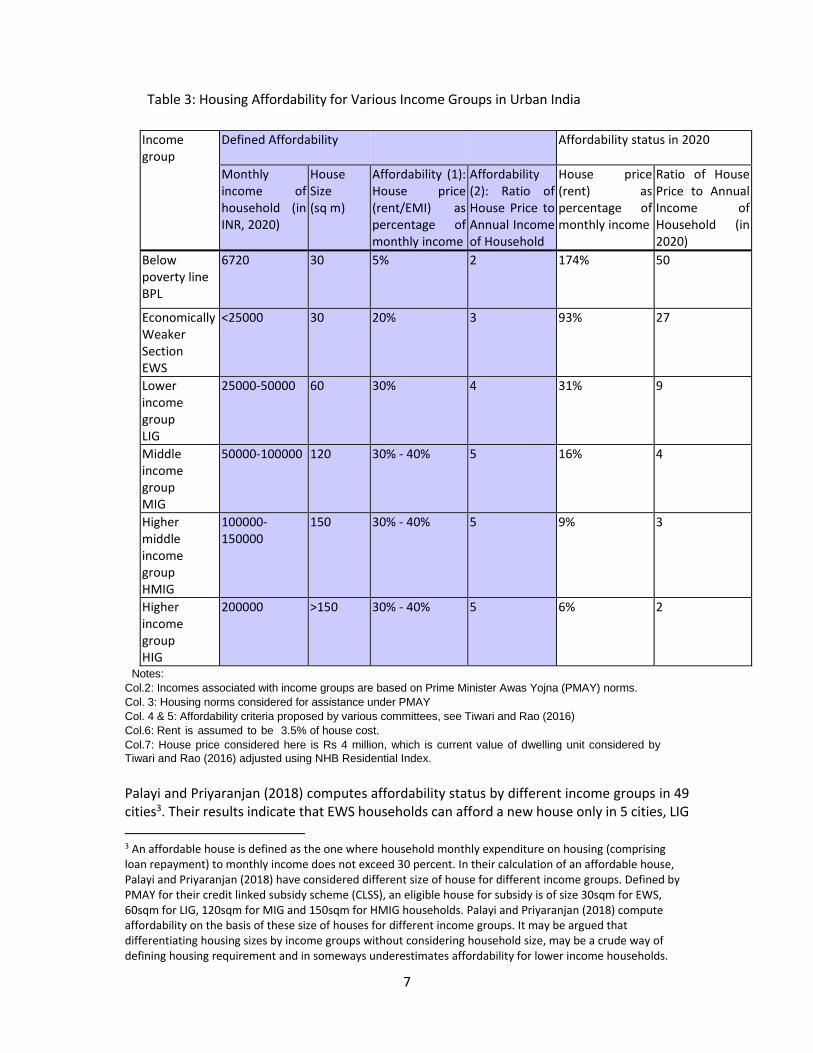
Source: (Frank, 2019) Table 2 illustrates that the target segment for a large proportion of new housing in the private development market that is being sold is the higher income group. While the overall housing affordability has improved, as shown by declining house price to income ratio (see Palayi and Priyaranjan, 2018), new houses are still unaffordable for a large segment of society. Table 3 presents housing affordability status for various income groups in urban India. The second column in Table 3 is the income range for households in particular group as defined by PMAY for their programmes. Column 3 and 4 are suggested affordability criteria for different income groups by Parekh Committee and Wadhwa Committee (Tiwari and Rao, 2016). For households who are below poverty line (BPL), the ratio of housing rent to monthly income is 174 percent and house price to annual income is 50. Affordability status of economically weaker segments is also highly stressed (Table 3). While rental housing is affordable for low income group (with rent to monthly income ratio of 31 percent), the ownership housing is unaffordable (with house price to annual income ratio of 9). Home ownership is affordable to households in higher middle‐income group and high‐ income groups. Since the distribution of number of households by income groups in Table 3 is not available, an estimate has been made to provide scale of the problem. Keelery (2020) of Statistica presents estimates of number of households by income categories defined as strugglers (with income less than Rs 2300 per month), next billion (income between Rs 2300‐7700 per month), aspirers (income between Rs 7700 – 15400), affluent (income between Rs 15400‐30800) and elite (with income Above Rs 30800 per month) for 2016. Basing on their household distribution data, an estimated 25 million households (one quarter of urban households) would be in strugglers category in urban India in 2016. This category corresponds to those who are in economically weaker groups and below poverty line in Table 3. There are another 38 million urban households who are estimated to be in ‘next billion’ group of Keelery (2020), which corresponds to low‐income group in Table 3. New housing is unaffordable for these households as well. Low income households can afford rental housing in urban areas.
7
Table 3: Housing Affordability for Various Income Groups in Urban India
Notes:
Col.2: Incomes associated with income groups are based on Prime Minister Awas Yojna (PMAY) norms.
Col. 3: Housing norms considered for assistance under PMAY
Col. 4 & 5: Affordability criteria proposed by various committees, see Tiwari and Rao (2016)
Col.6: Rent is assumed to be 3.5% of house cost.
Col.7: House price considered here is Rs 4 million, which is current value of dwelling unit considered by
Tiwari and Rao (2016) adjusted using NHB Residential Index.
Palayi and Priyaranjan (2018) computes affordability status by different income groups in 49 cities3. Their results indicate that EWS households can afford a new house only in 5 cities, LIG
3 An affordable house is defined as the one where household monthly expenditure on housing (comprising loan repayment) to monthly income does not exceed 30 percent. In their calculation of an affordable house, Palayi and Priyaranjan (2018) have considered different size of house for different income groups. Defined by PMAY for their credit linked subsidy scheme (CLSS), an eligible house for subsidy is of size 30sqm for EWS, 60sqm for LIG, 120sqm for MIG and 150sqm for HMIG households. Palayi and Priyaranjan (2018) compute affordability on the basis of these size of houses for different income groups. It may be argued that differentiating housing sizes by income groups without considering household size, may be a crude way of defining housing requirement and in someways underestimates affordability for lower income households.
Income group
Defined Affordability Affordability status in 2020
Monthly income of household (in INR, 2020)
House Size (sq m)
Affordability (1): House price (rent/EMI) as percentage of monthly income
Affordability (2): Ratio of House Price to Annual Income of Household
House price (rent) as percentage of monthly income
Ratio of House Price to Annual Income of Household (in 2020)
Below poverty line BPL
6720 30 5% 2 174% 50
Economically Weaker Section EWS
<25000 30 20% 3 93% 27
Lower income group LIG
25000‐50000 60 30% 4 31% 9
Middle income group MIG
50000‐100000 120 30% ‐ 40% 5 16% 4
Higher middle income group HMIG
100000‐150000
150 30% ‐ 40% 5 9% 3
Higher income group HIG
200000 >150 30% ‐ 40% 5 6% 2
8
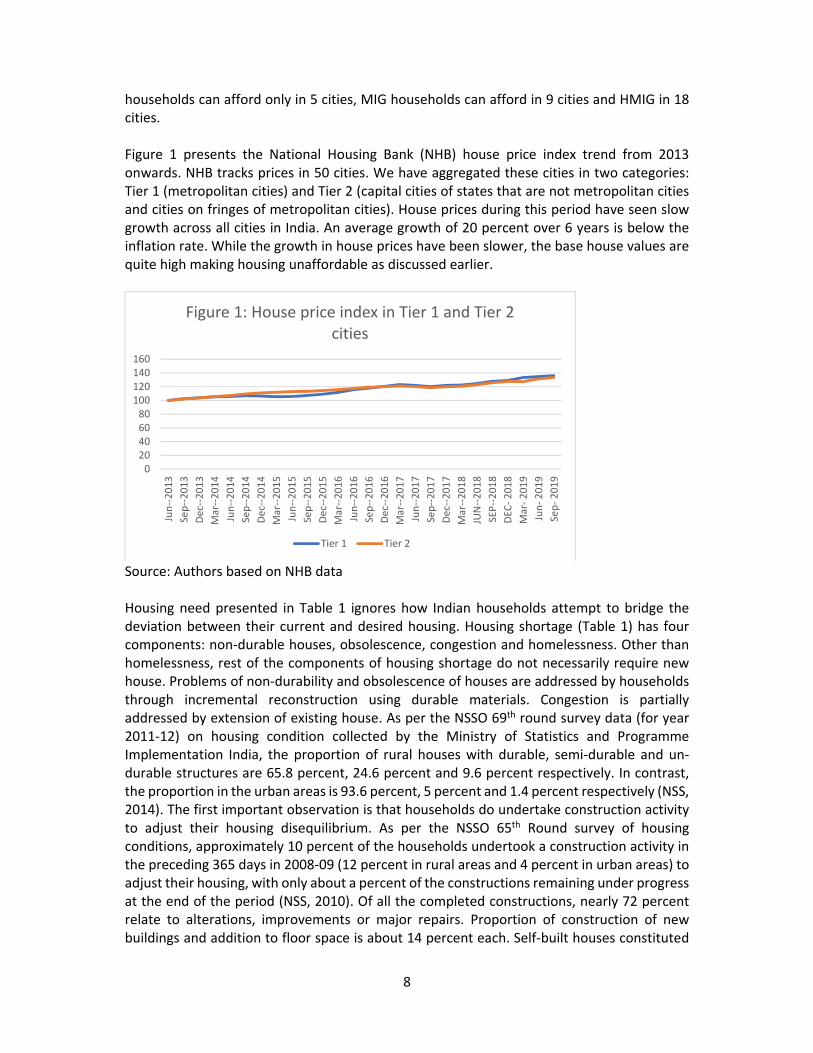
households can afford only in 5 cities, MIG households can afford in 9 cities and HMIG in 18 cities. Figure 1 presents the National Housing Bank (NHB) house price index trend from 2013 onwards. NHB tracks prices in 50 cities. We have aggregated these cities in two categories: Tier 1 (metropolitan cities) and Tier 2 (capital cities of states that are not metropolitan cities and cities on fringes of metropolitan cities). House prices during this period have seen slow growth across all cities in India. An average growth of 20 percent over 6 years is below the inflation rate. While the growth in house prices have been slower, the base house values are quite high making housing unaffordable as discussed earlier.
Source: Authors based on NHB data Housing need presented in Table 1 ignores how Indian households attempt to bridge the deviation between their current and desired housing. Housing shortage (Table 1) has four components: non‐durable houses, obsolescence, congestion and homelessness. Other than homelessness, rest of the components of housing shortage do not necessarily require new house. Problems of non‐durability and obsolescence of houses are addressed by households through incremental reconstruction using durable materials. Congestion is partially addressed by extension of existing house. As per the NSSO 69th round survey data (for year 2011‐12) on housing condition collected by the Ministry of Statistics and Programme Implementation India, the proportion of rural houses with durable, semi‐durable and un‐durable structures are 65.8 percent, 24.6 percent and 9.6 percent respectively. In contrast, the proportion in the urban areas is 93.6 percent, 5 percent and 1.4 percent respectively (NSS, 2014). The first important observation is that households do undertake construction activity to adjust their housing disequilibrium. As per the NSSO 65th Round survey of housing conditions, approximately 10 percent of the households undertook a construction activity in the preceding 365 days in 2008‐09 (12 percent in rural areas and 4 percent in urban areas) to adjust their housing, with only about a percent of the constructions remaining under progress at the end of the period (NSS, 2010). Of all the completed constructions, nearly 72 percent relate to alterations, improvements or major repairs. Proportion of construction of new buildings and addition to floor space is about 14 percent each. Self‐built houses constituted
020406080100120140160
Jun‐‐2013
Sep‐‐2013
Dec‐‐2013
Mar‐‐2014
Jun‐‐2014
Sep‐‐2014
Dec‐‐2014
Mar‐‐2015
Jun‐‐2015
Sep‐‐2015
Dec‐‐2015
Mar‐‐2016
Jun‐‐2016
Sep‐‐2016
Dec‐‐2016
Mar‐‐2017
Jun‐‐2017
Sep‐‐2017
Dec‐‐2017
Mar‐‐2018
JUN‐‐2018
SEP‐‐2018
DEC
‐ 2018
Mar‐ 2019
Jun‐ 2019
Sep‐ 2019
Figure 1: House price index in Tier 1 and Tier 2 cities
Tier 1 Tier 2

9
0.37 million in urban and 2.52 million in rural India (NSS, 2010). In this context, it would be important for policies aimed at improving housing condition to focus on these modes of adjustments in housing to be effective. However, as discussed later, policies and markets have generally favoured building of new stock over extensions or upgradation. Various affordable housing programs have been instituted in India to address the housing needs since 2007 but with limited success. For a review, please see Tiwari and Rao (2016) and NHB (2018). Among others, the main problem of these programs was fragmentation in implementation and lack of clear objective. In 2015, a new central program called Pradhan Mantri Awas Yojana (translates as Prime Minister Housing Scheme) was launched which aimed to provide 50 million affordable houses (20 million in urban and 30 million in rural India) by 2022. The PMAY‐Urban program provides central assistance to urban local bodies and other implementation agencies of state and union territories and has four components: a) In‐situ rehabilitation of existing slum dwellers using land as a resource through private
participation b) Credit Linked Subsidy Scheme is being implemented through PLIs and monitored by
Central Nodal Agencies namely NHB and HUDCO c) Affordable Housing in Partnership d) Subsidy for beneficiary‐led individual house construction/enhancement.
The program has resulted in sanctioning of 10.3 million affordable houses in urban areas by December 2019. As would be discussed later, a large part of assistance has been sought for beneficiary‐led individual house construction/enhancement, which supports the view that many households adjust deviation in housing consumption though extensions and upgradations. The PMAY‐Rural aims to assist in provision of durable houses to homeless and those living in non‐durable houses through cash assistance. The scheme also facilitates beneficiaries to avail institutional finance. By March 2019, 10 million houses were approved for assistance, of which 8.5 million have been completed. These are largely related to upgradation as the program envisages. The second aspect of understanding housing disequilibrium, which is ignored when we discuss at the national level, is the regional dimension. India has 29 states and 7 union territories (UTs). These states are at different stages of urbanization, economic structure, economic growth and prosperity, as discussed later. Housing conditions are different across these states and UTs, some better than others. Hence to understand housing in India, we need to investigate states and UTs and this is the focus of this chapter.
4. Regional disparity in economic growth There is disparity in economic growth across states and UTs as shown in Figure 2 which plots growth in net state domestic product. The thick black line is the growth rate for India as a whole and other lines are for state and UTs. The Figure shows the differences in growth across states. These differences were far more pronounced during the earlier periods on chart but
10
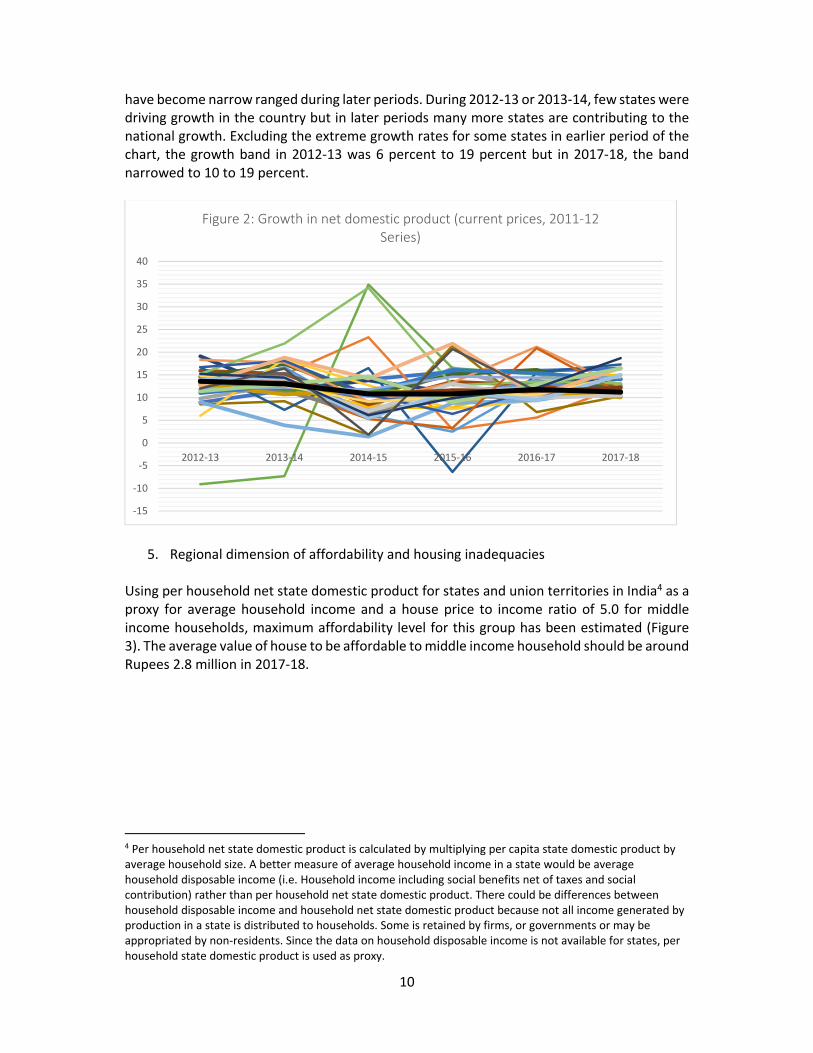
have become narrow ranged during later periods. During 2012‐13 or 2013‐14, few states were driving growth in the country but in later periods many more states are contributing to the national growth. Excluding the extreme growth rates for some states in earlier period of the chart, the growth band in 2012‐13 was 6 percent to 19 percent but in 2017‐18, the band narrowed to 10 to 19 percent.
5. Regional dimension of affordability and housing inadequacies Using per household net state domestic product for states and union territories in India4 as a proxy for average household income and a house price to income ratio of 5.0 for middle income households, maximum affordability level for this group has been estimated (Figure 3). The average value of house to be affordable to middle income household should be around Rupees 2.8 million in 2017‐18.
4 Per household net state domestic product is calculated by multiplying per capita state domestic product by average household size. A better measure of average household income in a state would be average household disposable income (i.e. Household income including social benefits net of taxes and social contribution) rather than per household net state domestic product. There could be differences between household disposable income and household net state domestic product because not all income generated by production in a state is distributed to households. Some is retained by firms, or governments or may be appropriated by non‐residents. Since the data on household disposable income is not available for states, per household state domestic product is used as proxy.
‐15
‐10
‐5
0
5
10
15
20
25
30
35
40
2012‐13 2013‐14 2014‐15 2015‐16 2016‐17 2017‐18
Figure 2: Growth in net domestic product (current prices, 2011‐12 Series)

11
Note: The desired value of a house is calculated using affordability ratio (house price/annual income) of 5. The value is derived by multiplying per household net state domestic product by the affordability ratio of 5. Table 4 presents the average price of a middle‐income household house of 120 sqm size in eight cities in India. If viewed in conjunction of Figure 3, except in National Capital Region of Delhi and Amdavad (Gujarat), the average house is not affordable to middle income households. Table 4: Average house price in major cities
Cities, State
Average price of 120 sqm house (Million Rupees), 2018
Amdavad, Gujarat 3.67
Bengaluru, Karnataka 6.05
Chennai, Tamil Nadu 5.67
Hyderabad, Telangana 5.28
Kolkata, West Bengal 4.21
Mumbai, Maharashtra 9.29
National Capital Region of Delhi 5.48
Pune, Maharashtra 5.65
Note: Using weighted average house price per sqm for H2, 2018 from Knight Frank (2018). Source: Author’s computation.
0
1000000
2000000
3000000
4000000
5000000
6000000
7000000
8000000
9000000
10000000
Goa
Delhi
Sikkim
Chandigarh
Haryana
Uttarakhand
Gujarat
Karnataka
Puducherry
Maharashtra
Kerala
Him
achal Pradesh
Telangana
Punjab
Mizoram
Tamil nadu
Arunachal Pradesh
Andam
an & Nicobar Islands
Andhra Pradesh
India
Rajasthan
Nagaland
Jammu & Kashmir
Tripura
Meghalaya
West Ben
gal
Chhattisgarh
Madhya Pradesh
Jharkhand
Odisha
Assam
Manipur
Uttar Pradesh
Bihar
Figure 3: Middle Income Household's Desired Value of a House to be Affordable (2017‐18)
12
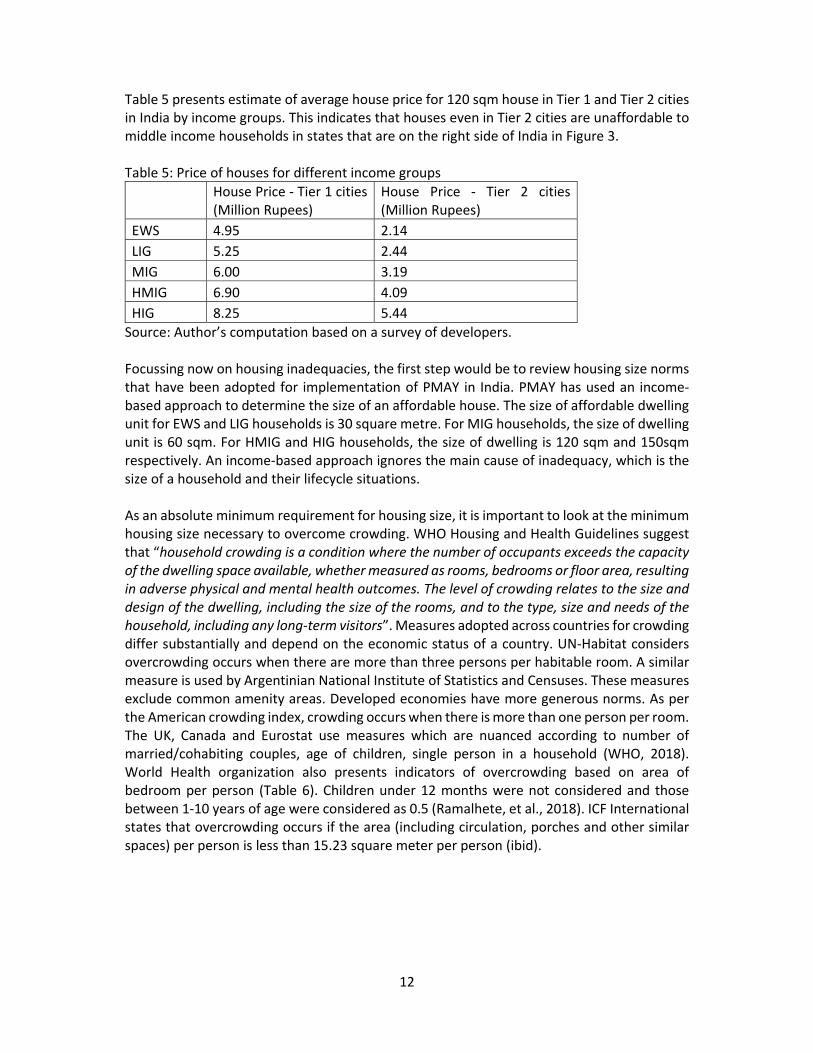
Table 5 presents estimate of average house price for 120 sqm house in Tier 1 and Tier 2 cities in India by income groups. This indicates that houses even in Tier 2 cities are unaffordable to middle income households in states that are on the right side of India in Figure 3. Table 5: Price of houses for different income groups
House Price ‐ Tier 1 cities (Million Rupees)
House Price ‐ Tier 2 cities (Million Rupees)
EWS 4.95 2.14
LIG 5.25 2.44
MIG 6.00 3.19
HMIG 6.90 4.09
HIG 8.25 5.44
Source: Author’s computation based on a survey of developers. Focussing now on housing inadequacies, the first step would be to review housing size norms that have been adopted for implementation of PMAY in India. PMAY has used an income‐based approach to determine the size of an affordable house. The size of affordable dwelling unit for EWS and LIG households is 30 square metre. For MIG households, the size of dwelling unit is 60 sqm. For HMIG and HIG households, the size of dwelling is 120 sqm and 150sqm respectively. An income‐based approach ignores the main cause of inadequacy, which is the size of a household and their lifecycle situations. As an absolute minimum requirement for housing size, it is important to look at the minimum housing size necessary to overcome crowding. WHO Housing and Health Guidelines suggest that “household crowding is a condition where the number of occupants exceeds the capacity of the dwelling space available, whether measured as rooms, bedrooms or floor area, resulting in adverse physical and mental health outcomes. The level of crowding relates to the size and design of the dwelling, including the size of the rooms, and to the type, size and needs of the household, including any long‐term visitors”. Measures adopted across countries for crowding differ substantially and depend on the economic status of a country. UN‐Habitat considers overcrowding occurs when there are more than three persons per habitable room. A similar measure is used by Argentinian National Institute of Statistics and Censuses. These measures exclude common amenity areas. Developed economies have more generous norms. As per the American crowding index, crowding occurs when there is more than one person per room. The UK, Canada and Eurostat use measures which are nuanced according to number of married/cohabiting couples, age of children, single person in a household (WHO, 2018). World Health organization also presents indicators of overcrowding based on area of bedroom per person (Table 6). Children under 12 months were not considered and those between 1‐10 years of age were considered as 0.5 (Ramalhete, et al., 2018). ICF International states that overcrowding occurs if the area (including circulation, porches and other similar spaces) per person is less than 15.23 square meter per person (ibid).
13
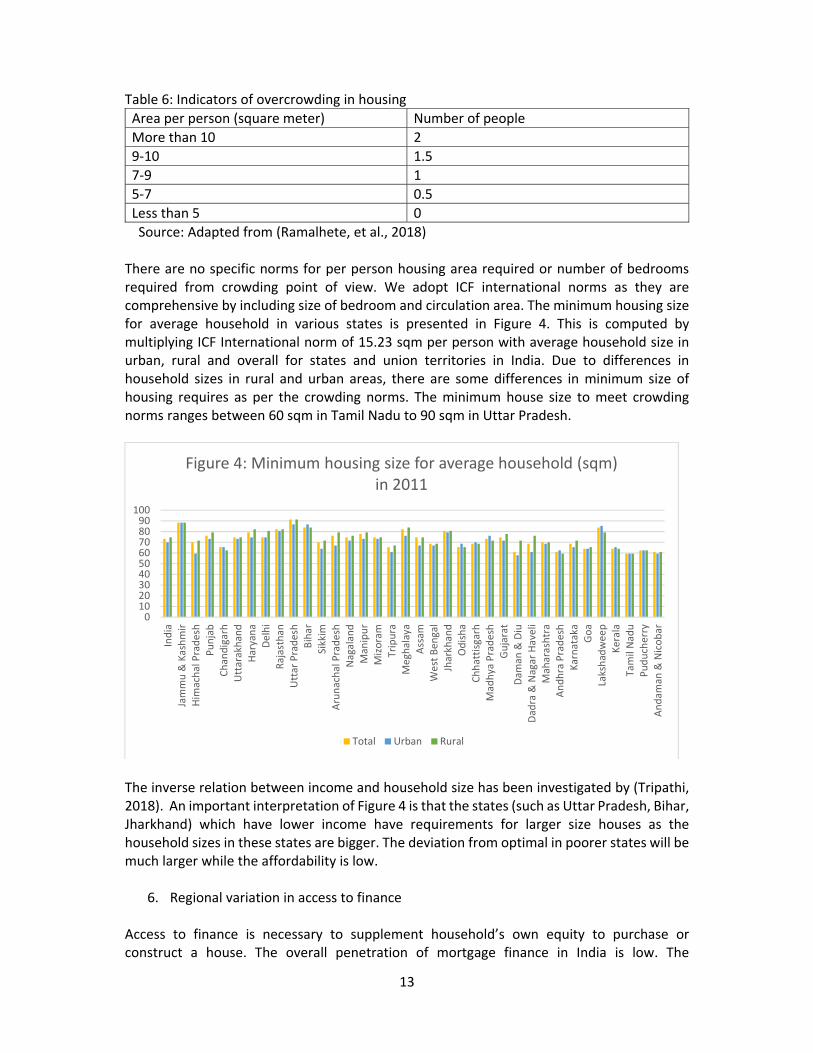
Table 6: Indicators of overcrowding in housing
Area per person (square meter) Number of people
More than 10 2
9‐10 1.5
7‐9 1
5‐7 0.5
Less than 5 0
Source: Adapted from (Ramalhete, et al., 2018) There are no specific norms for per person housing area required or number of bedrooms required from crowding point of view. We adopt ICF international norms as they are comprehensive by including size of bedroom and circulation area. The minimum housing size for average household in various states is presented in Figure 4. This is computed by multiplying ICF International norm of 15.23 sqm per person with average household size in urban, rural and overall for states and union territories in India. Due to differences in household sizes in rural and urban areas, there are some differences in minimum size of housing requires as per the crowding norms. The minimum house size to meet crowding norms ranges between 60 sqm in Tamil Nadu to 90 sqm in Uttar Pradesh.
The inverse relation between income and household size has been investigated by (Tripathi, 2018). An important interpretation of Figure 4 is that the states (such as Uttar Pradesh, Bihar, Jharkhand) which have lower income have requirements for larger size houses as the household sizes in these states are bigger. The deviation from optimal in poorer states will be much larger while the affordability is low.
6. Regional variation in access to finance Access to finance is necessary to supplement household’s own equity to purchase or construct a house. The overall penetration of mortgage finance in India is low. The
0102030405060708090100
India
Jammu & Kashmir
Him
achal Pradesh
Punjab
Chandigarh
Uttarakhand
Haryana
Delhi
Rajasthan
Uttar Pradesh
Bihar
Sikkim
Arunachal Pradesh
Nagaland
Manipur
Mizoram
Tripura
Meghalaya
Assam
West Ben
gal
Jharkhand
Odisha
Chhattisgarh
Madhya Pradesh
Gujarat
Dam
an & Diu
Dadra & Nagar Haveli
Maharashtra
Andhra Pradesh
Karnataka
Goa
Lakshadweep
Kerala
Tamil Nadu
Puducherry
Andam
an & Nicobar
Figure 4: Minimum housing size for average household (sqm) in 2011
Total Urban Rural
14
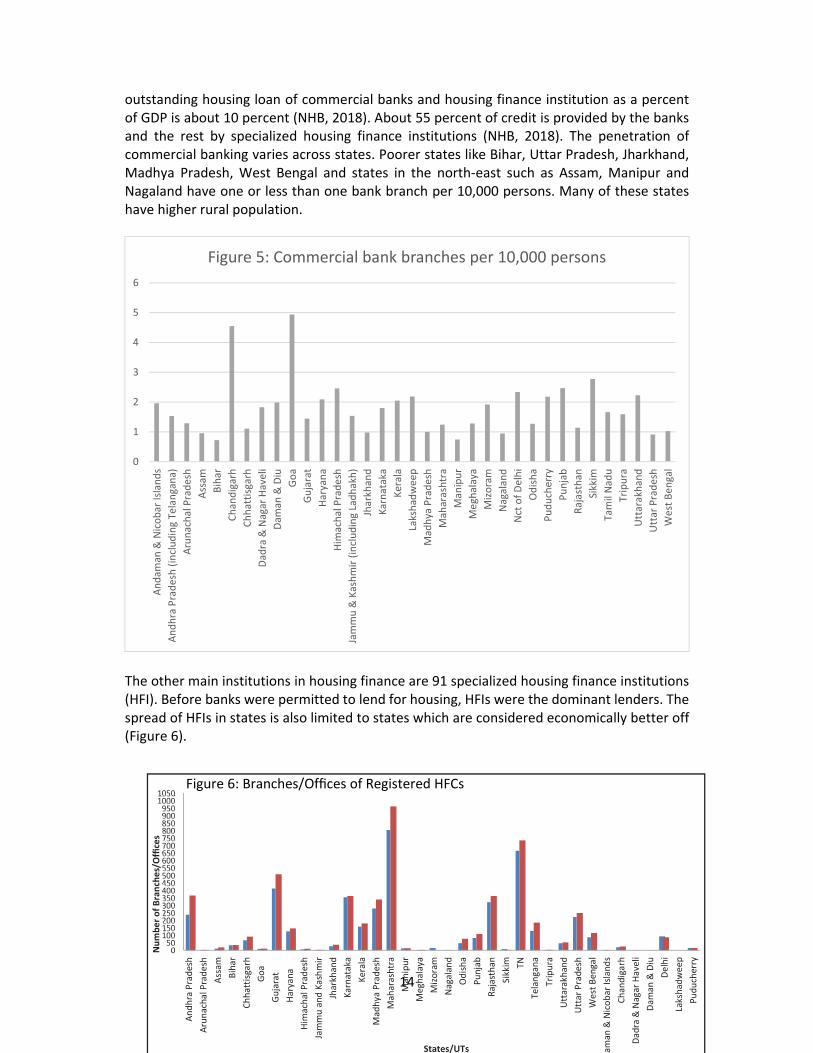
outstanding housing loan of commercial banks and housing finance institution as a percent of GDP is about 10 percent (NHB, 2018). About 55 percent of credit is provided by the banks and the rest by specialized housing finance institutions (NHB, 2018). The penetration of commercial banking varies across states. Poorer states like Bihar, Uttar Pradesh, Jharkhand, Madhya Pradesh, West Bengal and states in the north‐east such as Assam, Manipur and Nagaland have one or less than one bank branch per 10,000 persons. Many of these states have higher rural population.
The other main institutions in housing finance are 91 specialized housing finance institutions (HFI). Before banks were permitted to lend for housing, HFIs were the dominant lenders. The spread of HFIs in states is also limited to states which are considered economically better off (Figure 6).
Figure 6: Branches/Offices of Registered HFCs
0
1
2
3
4
5
6
Andam
an & Nicobar Islands
Andhra Pradesh (including Telangana)
Arunachal Pradesh
Assam
Bihar
Chandigarh
Chhattisgarh
Dadra & Nagar Haveli
Dam
an & Diu
Goa
Gujarat
Haryana
Him
achal Pradesh
Jammu & Kashmir (including Ladhakh)
Jharkhand
Karnataka
Kerala
Lakshadweep
Madhya Pradesh
Maharashtra
Manipur
Meghalaya
Mizoram
Nagaland
Nct of Delhi
Odisha
Puducherry
Punjab
Rajasthan
Sikkim
Tamil Nadu
Tripura
Uttarakhand
Uttar Pradesh
West Ben
gal
Figure 5: Commercial bank branches per 10,000 persons
1050 1000 950 900 850 800 750 700 650 600 550 500 450 400 350 300 250 200 150 100 50
States/UTs
Number of Branches/Offices
Andhra Pradesh
Arunachal Pradesh
Assam
Bihar
Chhattisgarh
Goa
Gujarat
Haryana
Him
achal Pradesh
Jammu and Kashmir
Jharkhand
Karnataka
Kerala
Madhya Pradesh
Maharashtra
Manipur
Meghalaya
Mizoram
Nagaland
Odisha
Punjab
Rajasthan
Sikkim
TN
Telangana
Tripura
Uttarakhand
Uttar Pradesh
West Bengal
aman
& Nicobar Islands
Chandigarh
Dadra & Nagar Haveli
Dam
an & Diu
Delhi
Lakshadweep
Puducherry

15
Source: NHB (2018)
NHB (2018) reports that 96 percent of disbursed funding by HFIs in 2017‐18 was for the purchase of a new or resale house or construction of a new house. Only 4 percent of the total disbursement was for upgradation of existing homes. In terms of distribution of size of loans, the biggest growth was in the upper loan segment (NHB, 2018). Access to finance has affected the way households adjust their deviations in housing requirements. As shown in Figure 7, as per the 76th round of National Sample Survey conducted in 2018, only a small proportion of households who undertook construction accessed bank finance. In general, the role of bank finance in financing household construction activity is low. The states which have low penetration of banks (Figure 5) are also the ones where the use of bank finance for construction is much lower than other states. In some states such as Uttar Pradesh, low bank finance is partially offset by government finance. Newly formed states like Andhra Pradesh have higher proportion of households accessing bank and government sources of finance.
The consequence of lack of formal finance for construction activity is that the proportion of households who undertake these activities to adjust their deviation of current housing from optimal is low (Figure 8). What is interesting, however, is that a higher proportion of
0
10
20
30
40
50
60
Andhra Pradesh
Arunachal Pradesh
Assam
Bihar
Chhattisgarh
Delhi
Goa
Gujarat
Haryana
Him
achal Pradesh
Jammu & Kashmir
Jharkhand
Karnataka
Kerala
Madhya Pradesh
Maharashtra
Manipur
Meghalaya
Mizoram
Nagaland
Odisha
Punjab
Rajasthan
Sikkim
Tamil Nadu
Telangana
Tripura
Uttrakhand
Uttar Pradesh
West Ben
gal
Andam
an & Nikobar Islands
Chandigarh
Dadra & Nagar Haveli
Dam
an & Diu
Lakshadweep
Puducherry
India
Figure 7: Proportion of households undertaking construction who accessed government or bank finance (2018)
Bank Government

16
households in poorer states and states in north‐east use incremental construction activities to adjust to their housing requirements (inadequacies and quality) than in economically better‐off states. This may also be because of better housing conditions in better off states.
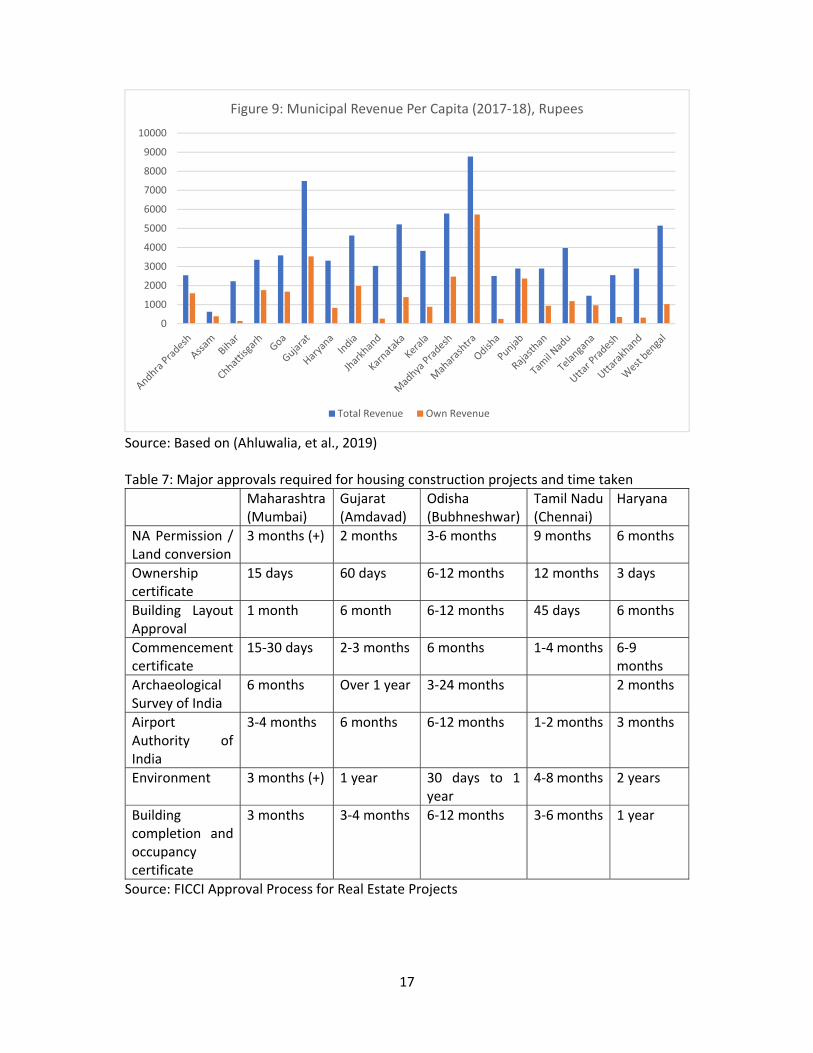
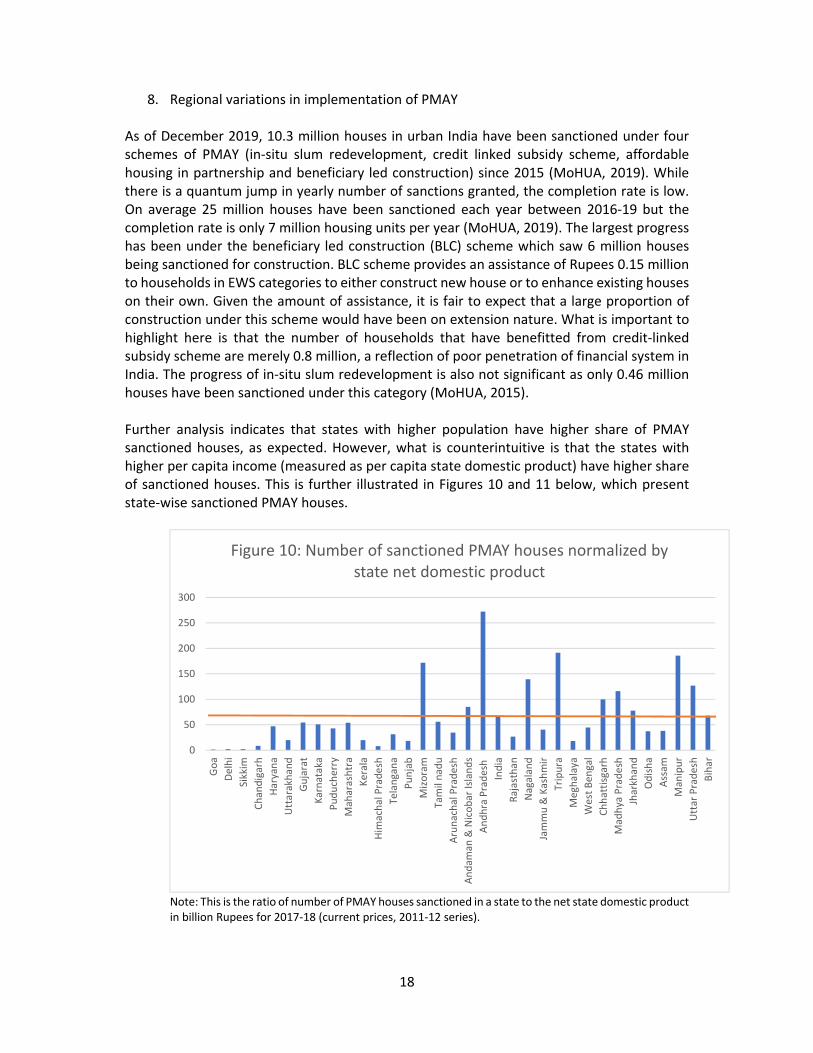
7. Regional variation in local governance, planning approval The capacity of urban local bodies (ULBs) to deliver on affordable housing program depends on their financial strength. The total revenue per capita for municipalities in various states is presented in Figure 9 (Ahluwalia, et al., 2019). The figure also presents revenues from own sources. The difference between total and own revenue is the transfers from state and centre to ULBs. For municipal sustainability it is important that own sources of revenue base are strong. The per capita revenue, in general, is low, which limits the capacity of ULBs to undertake any housing program on their own or jointly with central government. PMAY requires that housing programs are implemented through ULBs and state implementing agencies. The distribution of sanctioned PMAY houses does indicate that states where municipalities are financially strong have been able to implement these programs but then this builds in a self‐selection bias towards economically well‐off states. The planning process has also been a stumbling block for implementing housing projects. As shown in Table 7, through the time taken in getting various approvals across select cities, it could take more than a year to get a project off‐ground. Various layers of planning approvals also lead to rent seeking opportunities, which all add up to the cost of affordable housing.
0
2
4
6
8
10
12
14
Andhra Pradesh
Arunachal Pradesh
Assam
Bihar
Chhattisgarh
Delhi
Goa
Gujarat
Haryana
Him
achal Pradesh
Jammu & Kashmir
Jharkhand
Karnataka
Kerala
Madhya Pradesh
Maharashtra
Manipur
Meghalaya
Mizoram
Nagaland
Odisha
Punjab
Rajasthan
Sikkim
Tamil Nadu
Telangana
Tripura
Uttrakhand
Uttar Pradesh
West Ben
gal
Andam
an & Nikobar Islands
Chandigarh
Dadra & Nagar Haveli
Dam
an & Diu
Lakshadweep
Puducherry
India
Figure 8: Proportion of households who undertook construction activity during 2018
17
Source: Based on (Ahluwalia, et al., 2019) Table 7: Major approvals required for housing construction projects and time taken
Maharashtra (Mumbai)
Gujarat (Amdavad)
Odisha (Bubhneshwar)
Tamil Nadu (Chennai)
Haryana
NA Permission / Land conversion
3 months (+) 2 months 3‐6 months 9 months 6 months
Ownership certificate
15 days 60 days 6‐12 months 12 months 3 days
Building Layout Approval
1 month 6 month 6‐12 months 45 days 6 months
Commencement certificate
15‐30 days 2‐3 months 6 months 1‐4 months 6‐9 months
Archaeological Survey of India
6 months Over 1 year 3‐24 months 2 months
Airport Authority of India
3‐4 months 6 months 6‐12 months 1‐2 months 3 months
Environment 3 months (+) 1 year 30 days to 1 year
4‐8 months 2 years
Building completion and occupancy certificate
3 months 3‐4 months 6‐12 months 3‐6 months 1 year
Source: FICCI Approval Process for Real Estate Projects
0
1000
2000
3000
4000
5000
6000
7000
8000
9000
10000
Figure 9: Municipal Revenue Per Capita (2017‐18), Rupees
Total Revenue Own Revenue
18
8. Regional variations in implementation of PMAY
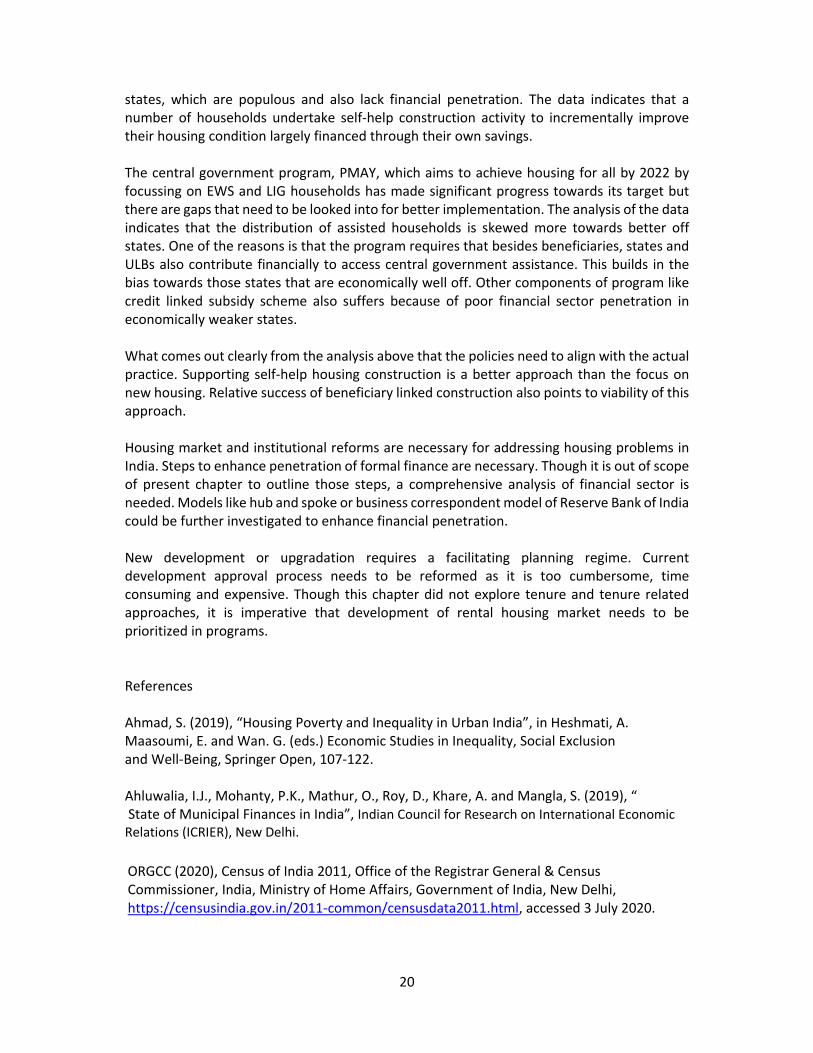
As of December 2019, 10.3 million houses in urban India have been sanctioned under four schemes of PMAY (in‐situ slum redevelopment, credit linked subsidy scheme, affordable housing in partnership and beneficiary led construction) since 2015 (MoHUA, 2019). While there is a quantum jump in yearly number of sanctions granted, the completion rate is low. On average 25 million houses have been sanctioned each year between 2016‐19 but the completion rate is only 7 million housing units per year (MoHUA, 2019). The largest progress has been under the beneficiary led construction (BLC) scheme which saw 6 million houses being sanctioned for construction. BLC scheme provides an assistance of Rupees 0.15 million to households in EWS categories to either construct new house or to enhance existing houses on their own. Given the amount of assistance, it is fair to expect that a large proportion of construction under this scheme would have been on extension nature. What is important to highlight here is that the number of households that have benefitted from credit‐linked subsidy scheme are merely 0.8 million, a reflection of poor penetration of financial system in India. The progress of in‐situ slum redevelopment is also not significant as only 0.46 million houses have been sanctioned under this category (MoHUA, 2015). Further analysis indicates that states with higher population have higher share of PMAY sanctioned houses, as expected. However, what is counterintuitive is that the states with higher per capita income (measured as per capita state domestic product) have higher share of sanctioned houses. This is further illustrated in Figures 10 and 11 below, which present state‐wise sanctioned PMAY houses.
Note: This is the ratio of number of PMAY houses sanctioned in a state to the net state domestic product in billion Rupees for 2017‐18 (current prices, 2011‐12 series).
0
50
100
150
200
250
300
Goa
Delhi
Sikkim
Chandigarh
Haryana
Uttarakhand
Gujarat
Karnataka
Puducherry
Maharashtra
Kerala
Him
achal Pradesh
Telangana
Punjab
Mizoram
Tamil nadu
Arunachal Pradesh
Andam
an & Nicobar Islands
Andhra Pradesh
India
Rajasthan
Nagaland
Jammu & Kashmir
Tripura
Meghalaya
West Ben
gal
Chhattisgarh
Madhya Pradesh
Jharkhand
Odisha
Assam
Manipur
Uttar Pradesh
Bihar
Figure 10: Number of sanctioned PMAY houses normalized by state net domestic product

19
Note: 1. This is the ratio of number of PMAY houses sanctioned in a state to state urban population in thousand based on 2011 Census. 2. Andhra Pradesh includes Telangana here as Telangana was not a separate state in 2011 Census.
The financing of PMAY projects indicates that ULBs in only few states such as Karnataka, Gujarat, Maharashtra, Odisha, Tamil Nadu have been able to contribute to the project cost. The contribution share is, however, very small. ULBs don’t have financial capacity to bear the cost of project, which has resulted in heavy reliance on centre or state for funding affordable housing projects.
9. Discussion and conclusion
This chapter examines the nature of housing problem in India. In departure from past approaches that focus on housing needs, we argue that a better approach to understand housing issues in India is to investigate housing gap, which is deviation of actual housing from the desired. Moreover, since there are state‐level differences in economic and institutional conditions, it is argued that an analysis at the sub‐national level is more appropriate. Since housing is a state subject in the Constitution, a state‐level analysis would highlight state specific differences and efficacy in implementation of housing programs. Housing gaps arise from congestion, obsolescence and poor quality of housing and the responses to adjust these range from improvement/upgradation to extension to rebuild to move to an existing or a new house that meets the household requirements. Given the complex nature of housing gap and mechanisms for adjustments, it is meaningless to combine these in a single measure called ‘need’ or ‘shortage’. Recognition of the complexity also allows programs to adopt multi‐faceted approach. State‐wise affordability analysis indicates that new housing is unaffordable to a large proportion of population across states. The issue is extenuated further in economically poor
0
10
20
30
40
50
60
70
80
90
Goa
Delhi
Sikkim
Chandigarh
Haryana
Uttarakhand
Gujarat
Karnataka
Puducherry
Maharashtra
Kerala
Him
achal Pradesh
Punjab
Mizoram
Tamil nadu
Arunachal Pradesh
Andam
an & Nicobar Islands
Andhra Pradesh
India
Rajasthan
Nagaland
Jammu & Kashmir
Tripura
Meghalaya
West Ben
gal
Chhattisgarh
Madhya Pradesh
Jharkhand
Odisha
Assam
Manipur
Uttar Pradesh
Figure 11: Number of PMAY houses normalized by state urban population
20
states, which are populous and also lack financial penetration. The data indicates that a number of households undertake self‐help construction activity to incrementally improve their housing condition largely financed through their own savings. The central government program, PMAY, which aims to achieve housing for all by 2022 by focussing on EWS and LIG households has made significant progress towards its target but there are gaps that need to be looked into for better implementation. The analysis of the data indicates that the distribution of assisted households is skewed more towards better off states. One of the reasons is that the program requires that besides beneficiaries, states and ULBs also contribute financially to access central government assistance. This builds in the bias towards those states that are economically well off. Other components of program like credit linked subsidy scheme also suffers because of poor financial sector penetration in economically weaker states. What comes out clearly from the analysis above that the policies need to align with the actual practice. Supporting self‐help housing construction is a better approach than the focus on new housing. Relative success of beneficiary linked construction also points to viability of this approach. Housing market and institutional reforms are necessary for addressing housing problems in India. Steps to enhance penetration of formal finance are necessary. Though it is out of scope of present chapter to outline those steps, a comprehensive analysis of financial sector is needed. Models like hub and spoke or business correspondent model of Reserve Bank of India could be further investigated to enhance financial penetration. New development or upgradation requires a facilitating planning regime. Current development approval process needs to be reformed as it is too cumbersome, time consuming and expensive. Though this chapter did not explore tenure and tenure related approaches, it is imperative that development of rental housing market needs to be prioritized in programs. References Ahmad, S. (2019), “Housing Poverty and Inequality in Urban India”, in Heshmati, A. Maasoumi, E. and Wan. G. (eds.) Economic Studies in Inequality, Social Exclusion and Well‐Being, Springer Open, 107‐122. Ahluwalia, I.J., Mohanty, P.K., Mathur, O., Roy, D., Khare, A. and Mangla, S. (2019), “ State of Municipal Finances in India”, Indian Council for Research on International Economic Relations (ICRIER), New Delhi.
ORGCC (2020), Census of India 2011, Office of the Registrar General & Census Commissioner, India, Ministry of Home Affairs, Government of India, New Delhi, https://censusindia.gov.in/2011‐common/censusdata2011.html, accessed 3 July 2020.

21
Knight Frank (2019) “India Real Estate: Residential and Office”, July‐December, Knight Frank India (Pvt) Ltd. Harish, S. (2016), “Public Social Rental Housing in India: Opportunities and Challenges”, Economic and Political Weekly, Vol LI, No. 5, 49‐56. Himanshu (2019), “Inequality in India: A review of levels and trends”, WIDER Working Paper 2019/42, The United Nations University World Institute for Development Economics Research, Helsinki. Keelery, S. (2020), “Households by annual income brackets India 2010-2025”, Statistica, https://www.statista.com/statistics/482584/india‐households‐by‐annual‐income/, accessed 3 July 2020. Knight Frank (2018), “India Real Estate: Residential and Office”, July‐December, Knight Frank India (Pvt) Ltd. Ministry of Finance (2020), “Economic Survey of India 2019‐2020”, Ministry of Finance, Government of India, New Delhi. Nakamura, S. (2014), “Impact of slum formalization on self‐help housing construction: A case of slum notification in India”, Urban Studies, 1‐25. NHB (2018) NSS (2010), “Housing Condition and Amenities in India 2008‐09”, Report No. 535 (65/1.2/1), National Sample Survey Office, Ministry of Statistics and Programme Implementation, Government of India, New Delhi. NSS (2014), “Drinking Water, Sanitation, Hygiene and Housing Condition in India”, Report No. 556 (69/1.2/1), National Sample Survey Office, Ministry of Statistics and Programme Implementation, Government of India, New Delhi. NSS (2019), “Drinking Water, Sanitation, Hygiene and Housing Condition in India”, Report No. 584 (76/1.2/1), National Sample Survey Office, Ministry of Statistics and Programme Implementation, Government of India, New Delhi. Palayi, A. and Priyaranjan, N. (2018), “Affordable housing in India”, Reserve Bank of India Bulletin, January, 13‐25. MoHUA (2019), “Urban transformation through housing for all”, Ministry of Housing and Urban Affairs, Government of India, New Delhi. Prakash, A., Ekka, A.P., Praiyadarshi, K., Bhowmick, C. and Thakur, I. (2020), “ Quarterly Estimates of Households’ Financial Assets and Liabilities, RBI Bulletin, June, Reserve Bank of India.
22
Purfield, C. (2007), “India: Asset Prices and the Macroeconomy”, IMF Working Paper, WP/07/221, Asia and Pacific Department, International Monetary Fund, Washington. Ram and Needham (2016), “The provision of affordable housing in India: Are commercial developers interested?”, Habitat International, Vol. 55, 100‐108. Ramalhete, I., Farias, H. and Pinto, R.D.S. (2018), “Overcrowding and Adequate Housing: The Potential of Adaptability”, International Journal of Architectural and Environmental Engineering. Vol.12, No.12, 1203‐1213.
Roy, D. (2018), “Housing demand in Indian metros: a hedonic approach”, International Journal of Housing Markets and Analysis, Vol. 13, No. 1.
Roy, D. (2020), “Shortage and demand for housing of low‐income urban households”, forthcoming, Indian Council for Research on International Economic Relations (ICRIER), New Delhi. Sengupta, U. (2010), “The hindered self‐help: Housing policies, politics and poverty in Kolkata, India”, Habitat International, Vol. 34, 323‐331. Sengupta, J. (2019) People are saving less, Commentary, Observer Research Foundation, Retrieved from https://www.orfonline.org/research/people‐are‐saving‐less‐53101/ (20 April 2020). Singh, C. (2013), “Housing market in India: A Comparison with the US and Spain”, Working Paper 406, Indian Institute of Management, Bangalore. Singh, S., Swaminathan, M. and Ramachandran, V.K. (2017), “Housing shortages in rural India”, Review of Agrarian Studies, 54‐72. MoHUPA (2012), “Report on The Technical Group On Urban Housing Shortage (2012‐ 2017)”, Ministry of Housing and Urban Poverty Alleviation, Government of India, September, New Delhi. Tiwari, P. and J. Parikh, “Affordability, effective demand and housing policy in urban India”,
Urban Studies, 1998, Vol. 35, No. 11, pp. 2111‐2129.
Tiwari, P., Parikh, K. and J. Parikh, “Effective housing demand in Mumbai (Bombay) Metropolitan Region”, Urban Studies, 1999, Vol. 36, No. 10, pp. 1783‐1809 Tiwari, P. and Rao, J. (2016), “Housing Markets and Housing Policies in India”, ADBI Working Paper 565, Asian Development Bank Institute, Tokyo. World Bank (2019), “GDP Growth(%)”,
https://data.worldbank.org/indicator/NY.GDP.MKTP.KD.ZG (accessed 3 July 2020). World Inequality Lab (2018), “World Inequality Report 2018”, World Inequality Database. WHO (2018), “WHO Housing and Health Guidelines”, World Health Organization, Geneva.