Effects of Mild Blast Traumatic Brain Injury on Cognitive - Nature
Upload
khangminh22Category
view
1download
0
1
Global functional outcome in traumatic brain injury:
Use in clinical trials, approaches to data collection,
and role in multi-dimensional outcome assessment
Lindsay Horton
Division of Psychology, School of Natural Sciences
UNIVERSITY OF STIRLING
May 2019
A thesis submitted for the degree of Doctor of Philosophy
2
General Abstract
Traumatic brain injury (TBI) affects multiple aspects of health and daily functioning.
However, TBI researchers whose primary interest is in the acute care setting have often
used single measures of global functional outcome, such as the Glasgow Outcome Scale
(GOS), to provide an overall assessment of recovery at follow-up, and have not routinely
incorporated measures that capture the multi-dimensional impact of TBI. CENTER-TBI is
part of an international initiative towards standardizing and refining outcome assessment in
TBI. The aim of this initiative is to promote the use of common measures to provide a multi-
dimensional description of TBI outcomes in a range of study contexts. This thesis uses data
collected for CENTER-TBI to examine two main issues of relevance to outcome assessment
in adult TBI: (1) methods of collecting information about global functional outcome; and (2)
implementation of multi-dimensional approaches to outcome assessment in TBI. The
systematic review in Chapter 2 examines the patterns of use and reporting quality of
outcome measures in clinical trials in adult TBI. The findings from the review demonstrate
heterogeneity in the use of outcome measures, limited use of multi-dimensional outcomes,
and highlight the issue of incomplete reporting of outcomes in these studies, providing the
impetus for the studies in Chapters 4, 5 and 6. Chapters 4 and 5 compare outcomes
assigned using clinician ratings and patient reports on the extended GOS (GOSE). The two
GOSE approaches were found to be broadly equivalent indicating that, in this context,
patient reports generally provide information that is comparable to that obtained via
clinician-rated interviews. Chapter 5 demonstrates that the GOSE has significant, but
modest, associations with prognostic factors and other outcome measures. The role of the
GOSE in implementing multi-dimensional outcome assessment is considered in Chapter 6.
Chapter 6 demonstrates that the applicability of individual outcome assessments is strongly
driven by level of disability. Thus, a tailored approach to outcome assessment is needed.
The studies in this thesis indicate that mixed modes of GOSE data collection can be used to
maximise follow-ups in studies with pragmatic constraints. Furthermore, outcome
measures need to be carefully selected to capture the multi-dimensional impact of TBI
across the spectrum of recovery. The findings have implications for further CENTER-TBI
analyses, for selecting outcome measures in future prospective studies, and for pooling data
for secondary analyses.
3
Acknowledgements
This thesis is presented with sincere thanks to my supervisors Prof. Lindsay Wilson and Dr.
Jonathan Rhodes for believing in me and providing the opportunity for me to be involved in
the CENTER-TBI project. I am particularly grateful to Lindsay Wilson for his guidance,
support, and encouragement throughout my PhD project: his knowledge, experience, and
expertise in TBI research is invaluable. I am also grateful to Jonathan Rhodes for providing a
vital link with clinical staff and patients and for his feedback on my thesis. I would also like
to thank the research staff at the Wellcome Trust Clinical Research Facility at the Western
General Hospital for recruiting patients and facilitating data collection throughout this
project. A big thank you to the clinical staff working in NHS Lothian and other health boards
who helped me organize follow-up visits, and to the patients and their families for taking
part in this research. I appreciate the time and effort spent by everyone mentioned above
for making this project a success.
I also wish to express my gratitude to the CENTER-TBI investigators and participants (listed
in Appendix 1) for their hard work, dedication, and expertise. Special thanks to Prof.
Andrew Maas and Prof. David Menon for doing an excellent job co-ordinating the CENTER-
TBI project. I am very fortunate to be part of this innovative project and I gratefully
acknowledge the funding received for this PhD from the European Commission 7th
Framework Programme CENTER-TBI (602150).
Last but not least, thank you to my family, friends, fellow PhD students, and staff working at
the University of Stirling for supporting me throughout this project.
4
Table of Contents
Title/cover page………………………………………………………….…………………………………………….………….1
General abstract……………………………………………………………………………………………….………..………..2
Acknowledgements……………………………………………………………………………….…………………….…......3
Table of contents…………………...……………………….………………………………….….……..………..…………..4
List of abbreviations……………….…..……………………………………………………….…….……….………..……..8
List of figures………………………….…………………………………………………………….……………….….……….11
List of tables…………………………….………………………………..……………………….……………………….…….12
CHAPTER 1: Rationale and aims of the thesis………………………………………………………..14
1.1. Rationale for this research…………………………………………………………….……..………….……15
1.1.1. Harmonizing data collection in TBI research…………..….….………………………...………….…15
1.1.2. Advances in outcomes research…………………….….………………..……..……………….………….16
1.1.3. Multi-dimensional outcome assessment in TBI…………………………………………..……………16
1.2. Aims of thesis……………………………………..…………………………….……………………………..…….21
CHAPTER 2: Randomized controlled trials in adult TBI: A systematic review on
the use and reporting of clinical outcome assessments………………………………………23
2.1. Abstract………………………………………………………….………..…………………………….…….………..24
2.2. Introduction……………………………………….………….…………………………………….…………………25
2.3. Methods…………………………………………………..…………………………………….…………………..….27
2.3.1. Search strategy……………………………………………………………………………………………………….27
2.3.2. Data extraction…..…………………………………………………………………………………………………..28
2.3.3. Study characteristics……………………………………………………………………………………………….28
2.3.4. Risk of bias………………………………………………………………………………………………………………29
2.3.5. Patterns of use of COAs…………………………………………………………………………………………..29
2.3.6. Quality of reporting of COAs……………………………………………………………………………………29
2.3.7. Glasgow Outcome Scale………………………………………………………………………………………….30
2.3.8. Statistical analysis……………………………………………………………………………………………………30
2.4. Results………………..………………………………………….…………………..………………………………….30
5
2.4.1. Study selection process…………………………………………………………………………………………...30
2.4.2. Study characteristics……………………………………………………………………………………………….31
2.4.3. Risk of bias………………………………………………………………………………………………………………33
2.4.4. Patterns of use of COAs…………………………………………………………………………………………..33
2.4.5. Quality of reporting of COAS………………………………………………………………………………..…36
2.4.6. Glasgow Outcome Scale………………………………………………………………………………………….38
2.5. Discussion……………………………………………………….……………………………..……………………...41
2.5.1. Limitations………………………………………………………………………………………………………………44
2.5.2. Conclusion………………………………………………………………………………………………………………45
CHAPTER 3: Multi-dimensional TBI outcomes: Research methodology………….46
3.1. CENTER-TBI recruitment….…..…………………………………….……………………..…………………..47
3.2. Measures used…………………..………………………………….…….……………….….…………….………47
3.2.1. Acute measures……………………………………………………….….………………..………………………..48
3.2.2. Outcome measures…………………………..…………………….….……………………..……………………50
3.3. Design of the studies in this thesis…………………………………………………………………………69
3.4. Ethical approval……………………………………………………………………………………………………..69
3.5. Data management……………………………………………………..……………………………………..……70
3.6. Selection of study participants……………………………………………………………………………...70
3.6.1. Characteristics of the CENTER-TBI study sample……………………………………………………..70
3.6.2. Participant selection process…………………………………………………………………………………..74
3.7. Statistical analysis………………………………………………………………………………………………....74
CHAPTER 4: Approaches to GOSE assignment: Comparison of clinician-rated
structured interviews and respondent-completed questionnaires…………….……77
4.1. Abstract…………………………………………………………………………………………………...…............78
4.2. Introduction………………..……………………………………………………………….………..…………...…79
4.2.1. Study aim………………………………………………………………………………………………………………..82
4.2.2. Exploratory analyses……………………………………………………………………………………………….82
4.3. Methods…….……………..………………………………………………………………………………………...…82
4.3.1. Participants…………………………………………………………………………………………………………….82
6
4.3.2. Design…………………………………………………………………………………………………………………….83
4.3.3. Measures and procedure………………………………………………………………………………………..83
4.3.4. Statistical analysis…………………………………………………………………………………………………..84
4.4. Results……………………………………………………………..…………………………………………............86
4.4.1. Demographics and clinical characteristics……….………………………………………………………86
4.4.2. Agreement between GOSE scores……………………………………………………………………………91
4.4.3. Exploratory analyses……………………………………………………………………………………………….95
4.5. Discussion……………..………………………….…………………………………………..…………………….…99
4.5.1. Limitations…………………………………………………………………………………………………………….103
4.5.2. Conclusion…………………………………………………………………………………………………………….103
CHAPTER 5: The GOSE as a clinician-reported
or patient-reported outcome…………………………………………………………………………………..104
5.1. Abstract………………………………………………………………………………………………….…………….105
5.2. Introduction………………………………………………………….….………………………………………….106
5.2.1. Study aims…………………………………………………………………………………………………………….109
5.2.2. Hypotheses……………………………………………………………………………………………………………109
5.3. Methods….…………………………………….……………………….………………………...…………………109
5.3.1. Participants…………………………………………………………………………………………………………..109
5.3.2. Design…………………………………………………………………………………………………………………..110
5.3.3. Measures……………………………………………………………………………………………………………...110
5.3.4. Statistical analysis……………………………..…………………………………………………………………112
5.4. Results…………………………………..……………………………………………………………………………..112
5.4.1. Demographic and clinical characteristics………………………………………………………………112
5.4.2. Associations between the GOSE and other variables……………………………………………..115
5.5. Discussion…………………..………………………………………………………………………………………..118
5.5.1. Limitations…………………………………………………………………………………………………………….121
5.5.2. Conclusion…………………………………………………………………………………………………………….122
7
CHAPTER 6: CENTER-TBI outcome measures in relation to post-TBI functional
level…………………………………………………………………………………………………………..……………………123
6.1. Abstract…………..……………………………………………….………………..………..…………….………..124
6.2. Introduction………………………..………………………………………………………..……………………..125
6.2.1. Study aims…………………………………………………………………………………………………………….129
6.3. Methods….…………………………..……………………………..……………..…………….………………….130
6.3.1. Participants…………………………………………………………………………………………………………..130
6.3.2. Design…………………………………………………………………………………………………………………..130
6.3.3. Measures………………………………………………………………………………………………………………130
6.3.4. Statistical analysis…………………………………………………………………………………………………132
6.4. Results…………………………………………………………………….……………...………….……………..…136
6.4.1. Demographic and clinical characteristics……………….……………………………………………..136
6.4.2. Scores on outcome measures……………………………………………………………………………..…141
6.4.3. Data quality and validity in relation to post-TBI functional level……..……………………143
6.5. Discussion……………………………………………………………….………………….…..….…………….….155
6.5.1. Data quality and validity in relation to post-TBI functional level……………………………155
6.5.2. Recommendations…………………………………………………………………………………………………158
6.5.3. Limitations…………………………………………………………………………………………………………….161
6.5.4. Conclusion……………….…………………………………....……………………………………………………..162
CHAPTER 7: Integrated discussion and conclusions………………………………………..….163
7.1. Integrated discussion…………………..……………………….……..…….………………………………..164
7.1.1. Participant characteristics……………………………………………………………………………….……165
7.1.2. Approaches to measuring global functional outcome……………………………………………166
7.1.3. Tailoring outcome assessment in relation to level of global outcome……………………169
7.2. Conclusions…………………………………………………………………………….………………………......173
References…………………………………………………………..………….…………..…………………………….…174
Appendices…………………………………………………….………………………………………………………..……186
8
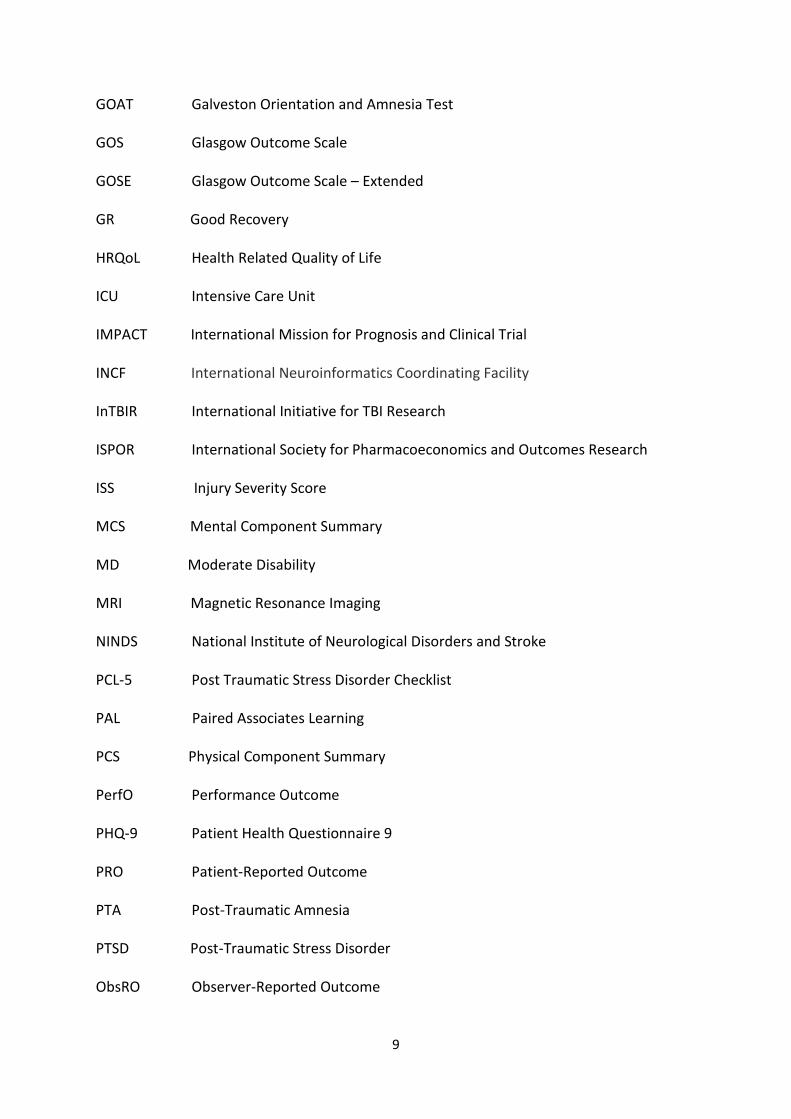
List of abbreviations
AIS Abbreviated Injury Scale
ASA American Society of Anaesthesiologists
AST Attention Switching Task
CANTAB Cambridge Neuropsychological Test Automated Battery
CDE Common Data Elements
CDISC Clinical Data Interchange Standards Consortium
CENTER-TBI Collaborative European NeuroTrauma Effectiveness Research in TBI
CER Comparative Effectiveness Research
COA Clinical Outcome Assessment
COI Concept of Interest
COU Context of Use
CONSORT Consolidated Standards of Reporting Trials
COWAT Controlled Oral Word Association Test
ClinRO Clinician-Reported Outcome
CRASH Corticosteroid Randomization After Significant Head Injury
CRS-R JFK Coma Recovery Scale - Revised
CT Computerized Tomography
DRS Disability Rating Scale
ER Emergency Room
FDA Food and Drug Administration
FIM Functional Independence Measure
GAD-7 Generalised Anxiety Disorder 7
GCS Glasgow Coma Scale
9
GOAT Galveston Orientation and Amnesia Test
GOS Glasgow Outcome Scale
GOSE Glasgow Outcome Scale – Extended
GR Good Recovery
HRQoL Health Related Quality of Life
ICU Intensive Care Unit
IMPACT International Mission for Prognosis and Clinical Trial
INCF International Neuroinformatics Coordinating Facility
InTBIR International Initiative for TBI Research
ISPOR International Society for Pharmacoeconomics and Outcomes Research
ISS Injury Severity Score
MCS Mental Component Summary
MD Moderate Disability
MRI Magnetic Resonance Imaging
NINDS National Institute of Neurological Disorders and Stroke
PCL-5 Post Traumatic Stress Disorder Checklist
PAL Paired Associates Learning
PCS Physical Component Summary
PerfO Performance Outcome
PHQ-9 Patient Health Questionnaire 9
PRO Patient-Reported Outcome
PTA Post-Traumatic Amnesia
PTSD Post-Traumatic Stress Disorder
ObsRO Observer-Reported Outcome
10
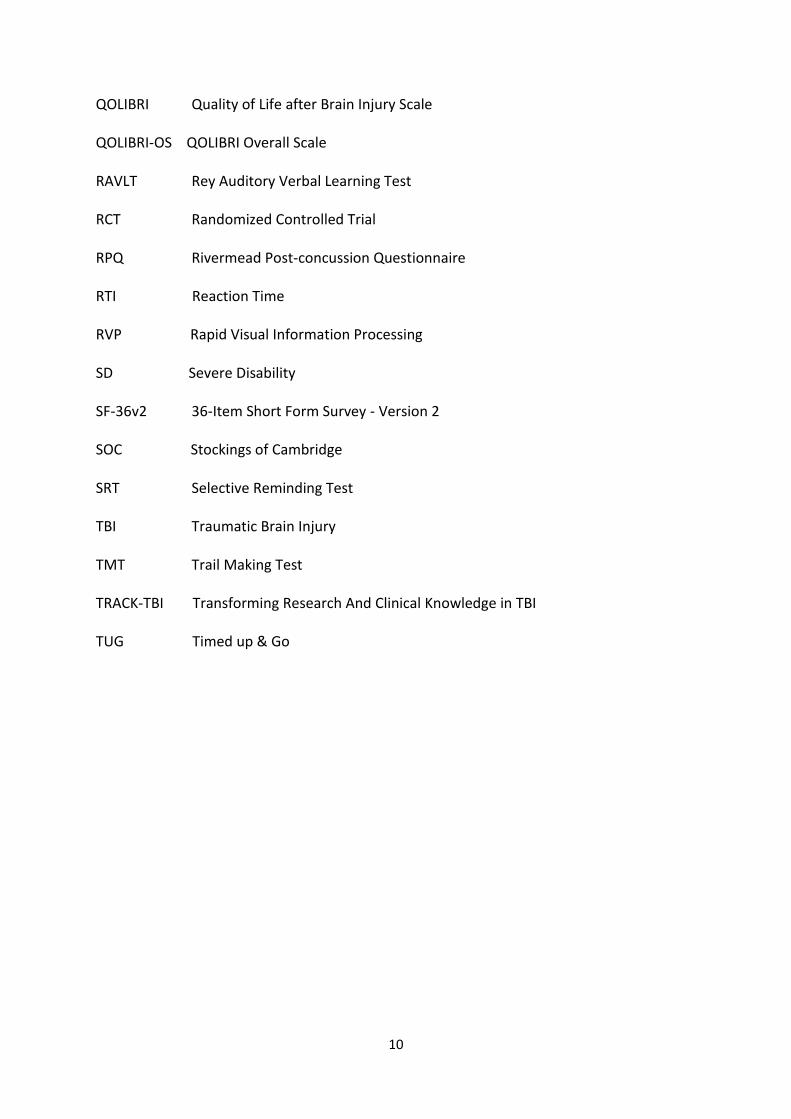
QOLIBRI Quality of Life after Brain Injury Scale
QOLIBRI-OS QOLIBRI Overall Scale
RAVLT Rey Auditory Verbal Learning Test
RCT Randomized Controlled Trial
RPQ Rivermead Post-concussion Questionnaire
RTI Reaction Time
RVP Rapid Visual Information Processing
SD Severe Disability
SF-36v2 36-Item Short Form Survey - Version 2
SOC Stockings of Cambridge
SRT Selective Reminding Test
TBI Traumatic Brain Injury
TMT Trail Making Test
TRACK-TBI Transforming Research And Clinical Knowledge in TBI
TUG Timed up & Go
11
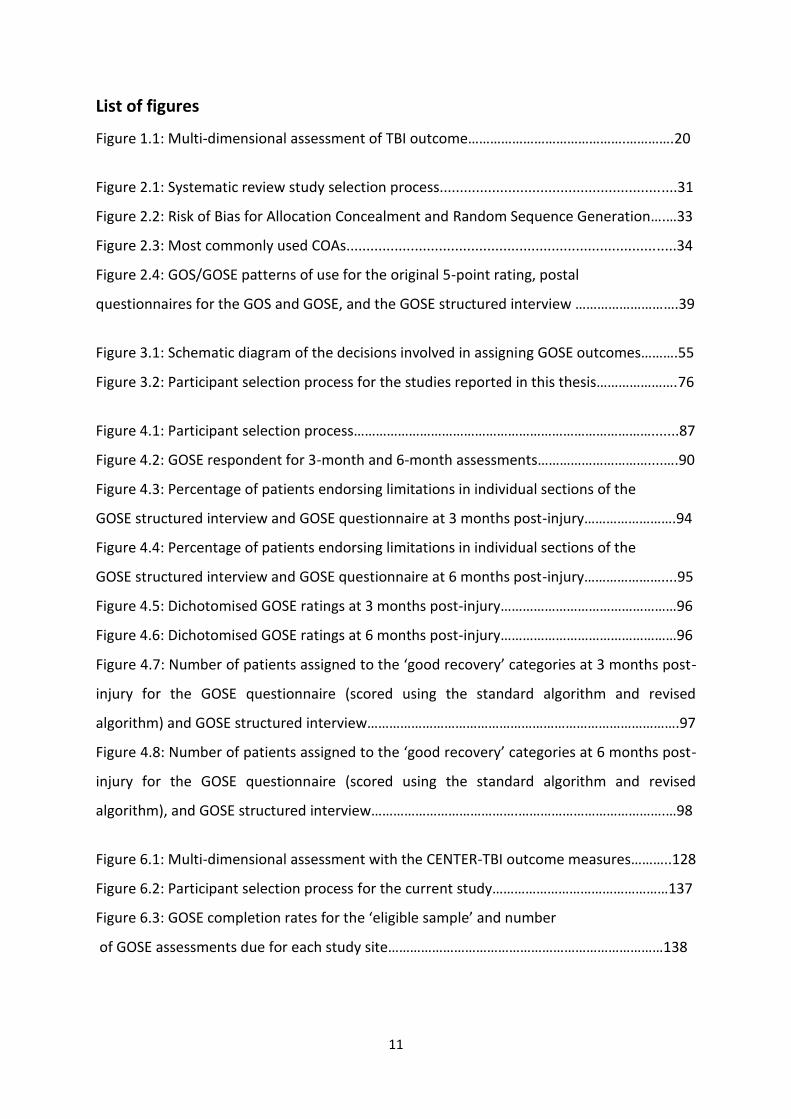
List of figures
Figure 1.1: Multi-dimensional assessment of TBI outcome…………………………………….………….20
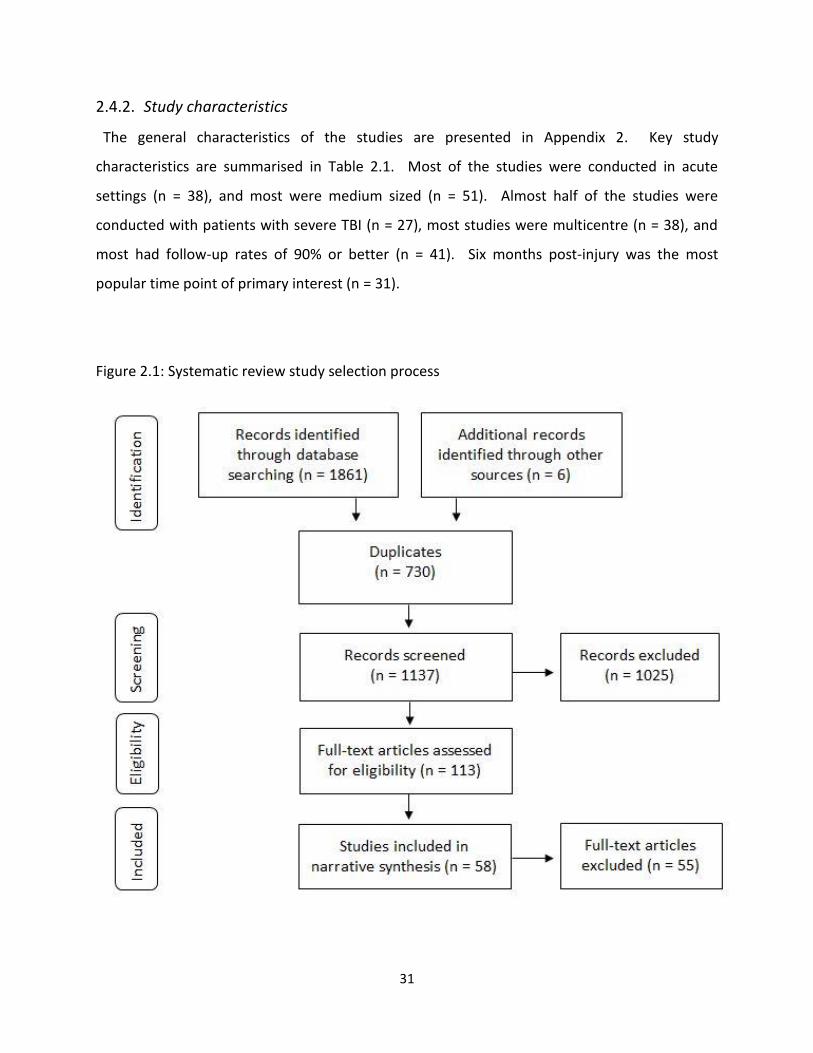
Figure 2.1: Systematic review study selection process...........................................................31
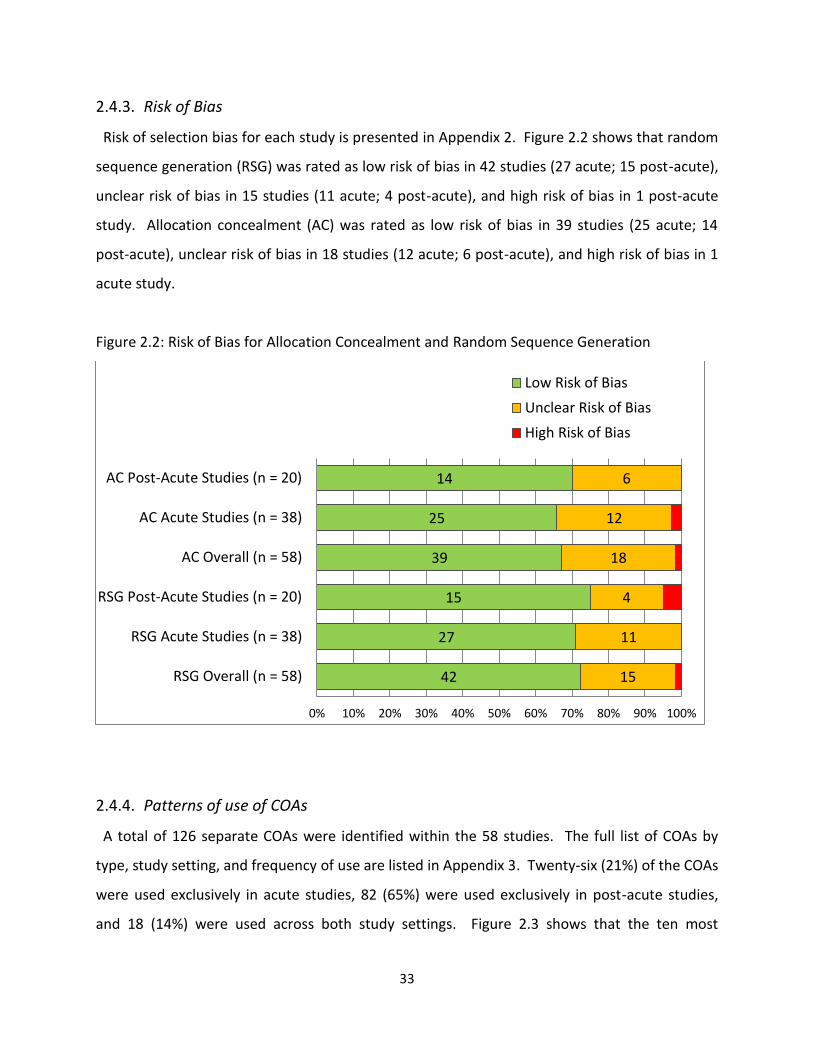
Figure 2.2: Risk of Bias for Allocation Concealment and Random Sequence Generation….…33
Figure 2.3: Most commonly used COAs..................................................................................34
Figure 2.4: GOS/GOSE patterns of use for the original 5-point rating, postal
questionnaires for the GOS and GOSE, and the GOSE structured interview ……………………….39
Figure 3.1: Schematic diagram of the decisions involved in assigning GOSE outcomes……….55
Figure 3.2: Participant selection process for the studies reported in this thesis………………….76
Figure 4.1: Participant selection process……………………………………………………………………….......87
Figure 4.2: GOSE respondent for 3-month and 6-month assessments…………………………....….90
Figure 4.3: Percentage of patients endorsing limitations in individual sections of the
GOSE structured interview and GOSE questionnaire at 3 months post-injury…………………….94
Figure 4.4: Percentage of patients endorsing limitations in individual sections of the
GOSE structured interview and GOSE questionnaire at 6 months post-injury…………………....95
Figure 4.5: Dichotomised GOSE ratings at 3 months post-injury…………………………………………96
Figure 4.6: Dichotomised GOSE ratings at 6 months post-injury…………………………………………96
Figure 4.7: Number of patients assigned to the ‘good recovery’ categories at 3 months post-
injury for the GOSE questionnaire (scored using the standard algorithm and revised
algorithm) and GOSE structured interview………………………………………………………………………….97
Figure 4.8: Number of patients assigned to the ‘good recovery’ categories at 6 months post-
injury for the GOSE questionnaire (scored using the standard algorithm and revised
algorithm), and GOSE structured interview………………………………….………………………………….…98
Figure 6.1: Multi-dimensional assessment with the CENTER-TBI outcome measures………..128
Figure 6.2: Participant selection process for the current study…………………………………………137
Figure 6.3: GOSE completion rates for the ‘eligible sample’ and number
of GOSE assessments due for each study site…………………………………………………………………138
12
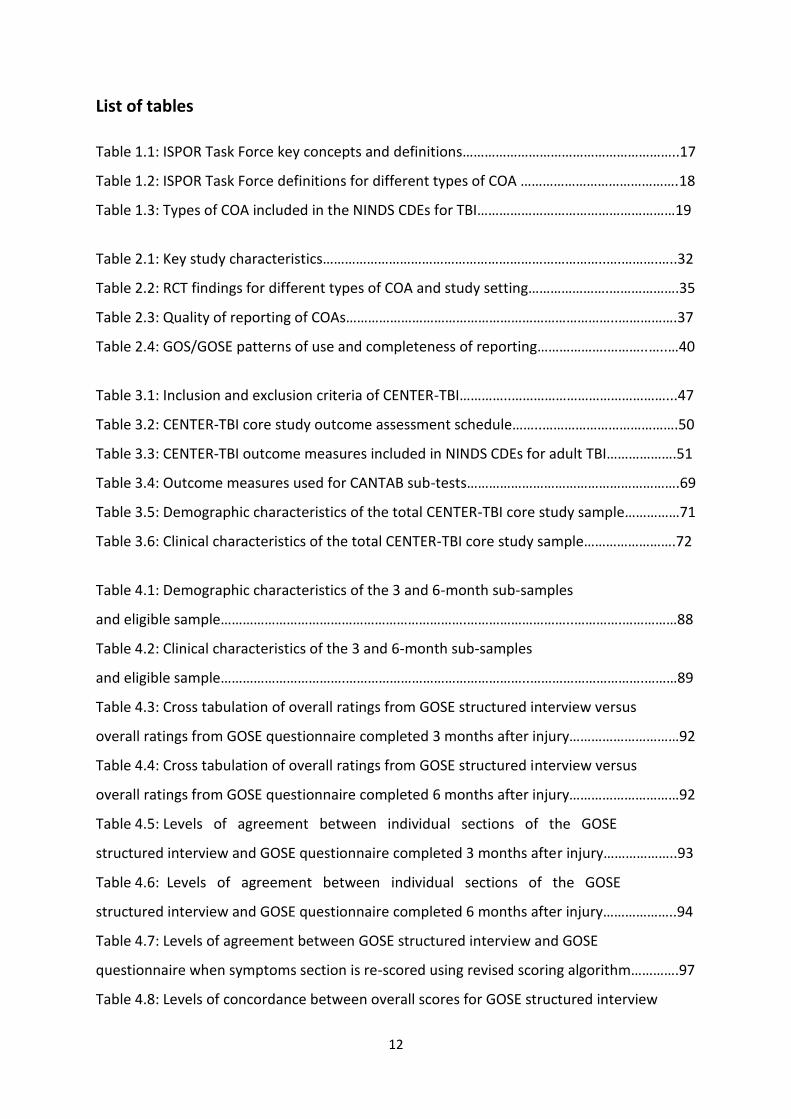
List of tables
Table 1.1: ISPOR Task Force key concepts and definitions…………………………………………………..17
Table 1.2: ISPOR Task Force definitions for different types of COA …………………………………….18
Table 1.3: Types of COA included in the NINDS CDEs for TBI………………………………………………19
Table 2.1: Key study characteristics…………………………………………………………………..….……….…..32
Table 2.2: RCT findings for different types of COA and study setting………………….……………….35
Table 2.3: Quality of reporting of COAs………………………………………………………………..…………….37
Table 2.4: GOS/GOSE patterns of use and completeness of reporting……………….………..…..…40
Table 3.1: Inclusion and exclusion criteria of CENTER-TBI…………..……………………………………...47
Table 3.2: CENTER-TBI core study outcome assessment schedule……..……………………………….50
Table 3.3: CENTER-TBI outcome measures included in NINDS CDEs for adult TBI……………….51
Table 3.4: Outcome measures used for CANTAB sub-tests………………………………………………….69
Table 3.5: Demographic characteristics of the total CENTER-TBI core study sample……………71
Table 3.6: Clinical characteristics of the total CENTER-TBI core study sample…………………….72
Table 4.1: Demographic characteristics of the 3 and 6-month sub-samples
and eligible sample………………………………………………………….………………………..………….……………88
Table 4.2: Clinical characteristics of the 3 and 6-month sub-samples
and eligible sample…………………………….…………………………………………..………………………….………89
Table 4.3: Cross tabulation of overall ratings from GOSE structured interview versus
overall ratings from GOSE questionnaire completed 3 months after injury…………………………92
Table 4.4: Cross tabulation of overall ratings from GOSE structured interview versus
overall ratings from GOSE questionnaire completed 6 months after injury…………………………92
Table 4.5: Levels of agreement between individual sections of the GOSE
structured interview and GOSE questionnaire completed 3 months after injury………………..93
Table 4.6: Levels of agreement between individual sections of the GOSE
structured interview and GOSE questionnaire completed 6 months after injury………………..94
Table 4.7: Levels of agreement between GOSE structured interview and GOSE
questionnaire when symptoms section is re-scored using revised scoring algorithm………….97
Table 4.8: Levels of concordance between overall scores for GOSE structured interview
13
and GOSE questionnaire for sub-groups at 3 and 6-months post-injury……………………..………99
Table 5.1: Distinctions between different types of COA and whether they
measure how the person functions or how the person feels………………………………….…………108
Table 5.2: Demographic characteristics of the current study sample………………………………..113
Table 5.3: Clinical characteristics of the current study sample……………………………………..….114
Table 5.4: Spearman correlations between the GOSE and prognostic factors……..……………116
Table 5.5: Spearman correlations between the GOSE and PROs………………………………….……117
Table 5.6: Spearman correlations between the GOSE and PerfOs…………………………………....118
Table 6.1: Outcome domains and scoring approaches for each measure……………………….…131
Table 6.2: Definition of floor and ceiling ranges for each outcome measure………………….…135
Table 6.3: Demographic characteristics for the current study sample
and GOSE unknown………………………………………………………………………………………………………....139
Table 6.4: Clinical characteristics of the current study sample
and GOSE unknown………………………………………………………………..…………………………………….....140
Table 6.5: Descriptive statistics for PROs for each GOSE category
and for the total study sample……………………………………………………….…………………………………146
Table 6.6: Descriptive statistics for PerfOs for each GOSE category
and for the total study sample……………………………………………………….…………………………………147
Table 6.7: Outcome measure completion rates for each GOSE category
and for the total study sample……………………………….…………………………………………………………148
Table 6.8: Reasons for non-completion of RAVLT, TMT and 10-meter walk/TUG
for each GOSE category and for the total study sample …………………………………………..……..149
Table 6.9: Reasons for non-completion of CANTAB sub-tests for each GOSE
category and for the total sample……………………………………………………………………………………150
Table 6.10: Floor/ceiling effects on the completed PROs for each GOSE category
and for the total study sample………………………………………………………………….....…………………152
Table 6.11: Floor/ceiling effects on the completed PerfOs for each GOSE category
and for the total study sample…………………………………………………………………………….……………153
Table 6.12: Cronbach’s alpha on the completed PROs for each GOSE category
and for the total study sample………………………..................………………………………………………..154
14
CHAPTER 1
Rationale and aims of the thesis
The impetus for this thesis comes from developments in three broad areas of research: (1) The
drive towards harmonizing data collection in TBI studies; (2) Advances in outcomes research;
and (3) Recommendations for multi-dimensional approaches to outcome assessment in TBI.
Current progress in these areas of research will be evaluated in this chapter. The aims of the
thesis will also be outlined.
15
1.1. Rationale for this research
1.1.1. Harmonizing data collection in TBI research
In the last decade, there has been a global drive towards the harmonization of data collection
in TBI research (Yue et al., 2013). Current initiatives which aim to promote streamlined
approaches to clinical data collection include the Clinical Data Interchange Standards
Consortium (CDISC) (Clinical Data Interchange Standards Consortium, 2015); National Institute
of Neurological Disorders and Stroke (NINDS) Common Data Elements (CDE) project (Hicks et
al., 2013; Wilde et al., 2010); and International Initiative for TBI Research (InTBIR) (Tosetti et al.,
2013). CDISC aims to harmonize data collection in a wide range of therapeutic areas, including
TBI (Clinical Data Interchange Standards Consortium, 2015). More specifically, the NINDS CDE
project aims to develop common data standards in a range of neurological research contexts,
including TBI (Thurmond et al., 2010). Consistent with these two broad data standardization
initiatives, InTBIR was set up in 2011 to tackle the global burden of TBI through international
collaboration, data sharing, and adherence to CDE recommendations for data collection in TBI
studies (Tosetti et al., 2013).
An overarching aspiration of InTBIR is to promote joint analyses of data where this yields
advantages, for example, in comparative effectiveness research (CER), prognostic studies, or
genomics, where large sample sizes are needed (Tosetti et al., 2013). A number of CER studies
have been initiated as part of InTBIR, the largest of which are Transforming Research and
Clinical Knowledge in Traumatic Brain Injury (TRACK-TBI) in the US (Yue et al., 2013) and
Collaborative European NeuroTrauma Effectiveness Research in TBI (CENTER-TBI) in Europe
(Maas, Menon, et al., 2015). TRACK-TBI and CENTER-TBI were set up in parallel and both
projects have the aim of validating the applicability of the CDEs for TBI. CENTER-TBI was
launched in 2013 and patients were recruited between December 2014 and December 2017 via
65 sites across 18 countries in Europe. It includes a core study of 4509 patients, as well as a
registry providing basic observational data on 22,782 patients presenting to the sites involved.
The project comprises a total of 22 work packages which cover a number of research strands,
16
including CER, neuro-informatics, biomarkers, magnetic resonance imaging, genetic
associations, and outcomes. This PhD is part of the outcomes strand of CENTER-TBI.
1.1.2. Advances in outcomes research
Outcomes research is a broad field of investigation, which aims to improve the quality of
health care by developing a better understanding of the end results of clinical practice (Jefford,
Stockler, & Tattersall, 2003). Current developments in outcomes research are underpinned by
the patient-centred model of health care and place emphasis upon outcomes that are
important to the patient, such as functional status, participation in major life roles, and quality
of life (Sacristan, 2013). In 2009, the US Food and Drug Administration (FDA) provided guidance
for the use of patient-reported outcomes (PRO) in medical product labelling (U.S. Food & Drug
Administration, 2009). Furthermore, in 2015, the International Society for Pharmacoeconomics
and Outcomes Research (ISPOR) Task Force for Emerging Good Practices in Outcomes Research
published a report that is consistent with the FDA’s guidance, in which the conceptual
foundations for Clinical Outcome Assessments (COAs), including PROs, are presented (Walton
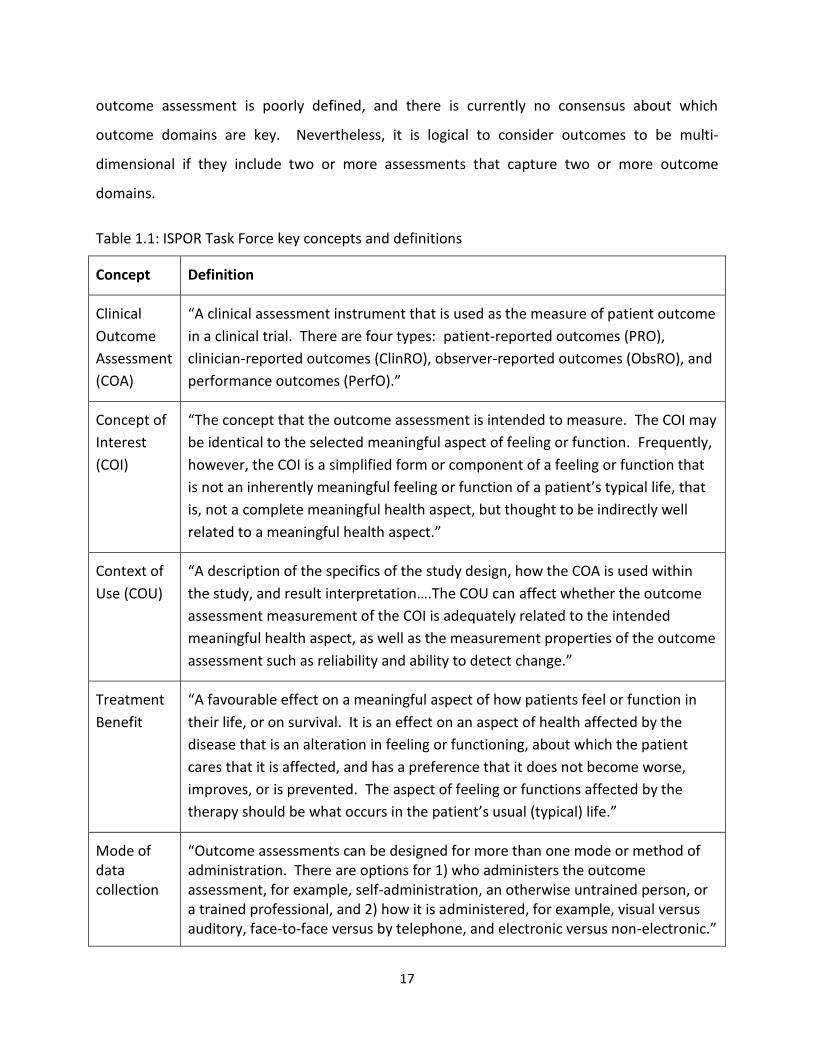
et al., 2015). ISPOR definitions (Eremenco et al., 2014; Walton et al., 2015) for the concepts of
relevance to this thesis are presented in Tables 1.1 and 1.2.
1.1.3. Multi-dimensional outcome assessment in TBI
TBI is a heterogeneous condition, which has been defined as “an alteration in brain function,
or other evidence of brain pathology, caused by an external force” (Menon et al., 2010). It can
affect multiple aspects of health and daily life. Thus, a single outcome measure is insufficient to
describe the overall burden of disability from TBI, and there is currently a drive towards the use
of multi-dimensional approaches to the measurement of TBI outcomes (Maas et al., 2017;
Nelson, Ranson, Ferguson, Giacino, Okonkwo, Valadka, Manley, McCrea, et al., 2017). The aim
of multi-dimensional outcome assessment is to capture changes in specific areas of health and
daily life using measures that reflect the outcome domains of relevance to TBI, such as
cognitive, physical, and psychosocial functioning (Maas et al., 2017; Nelson, Ranson, Ferguson,
Giacino, Okonkwo, Valadka, Manley, & McCrea, 2017). The concept of multi-dimensional
17
outcome assessment is poorly defined, and there is currently no consensus about which
outcome domains are key. Nevertheless, it is logical to consider outcomes to be multi-
dimensional if they include two or more assessments that capture two or more outcome
domains.
Table 1.1: ISPOR Task Force key concepts and definitions
Concept Definition
Clinical
Outcome
Assessment
(COA)
“A clinical assessment instrument that is used as the measure of patient outcome
in a clinical trial. There are four types: patient-reported outcomes (PRO),
clinician-reported outcomes (ClinRO), observer-reported outcomes (ObsRO), and
performance outcomes (PerfO).”
Concept of
Interest
(COI)
“The concept that the outcome assessment is intended to measure. The COI may
be identical to the selected meaningful aspect of feeling or function. Frequently,
however, the COI is a simplified form or component of a feeling or function that
is not an inherently meaningful feeling or function of a patient’s typical life, that
is, not a complete meaningful health aspect, but thought to be indirectly well
related to a meaningful health aspect.”
Context of
Use (COU)
“A description of the specifics of the study design, how the COA is used within
the study, and result interpretation….The COU can affect whether the outcome
assessment measurement of the COI is adequately related to the intended
meaningful health aspect, as well as the measurement properties of the outcome
assessment such as reliability and ability to detect change.”
Treatment
Benefit
“A favourable effect on a meaningful aspect of how patients feel or function in
their life, or on survival. It is an effect on an aspect of health affected by the
disease that is an alteration in feeling or functioning, about which the patient
cares that it is affected, and has a preference that it does not become worse,
improves, or is prevented. The aspect of feeling or functions affected by the
therapy should be what occurs in the patient’s usual (typical) life.”
Mode of data collection
“Outcome assessments can be designed for more than one mode or method of administration. There are options for 1) who administers the outcome assessment, for example, self-administration, an otherwise untrained person, or a trained professional, and 2) how it is administered, for example, visual versus auditory, face-to-face versus by telephone, and electronic versus non-electronic.”
18
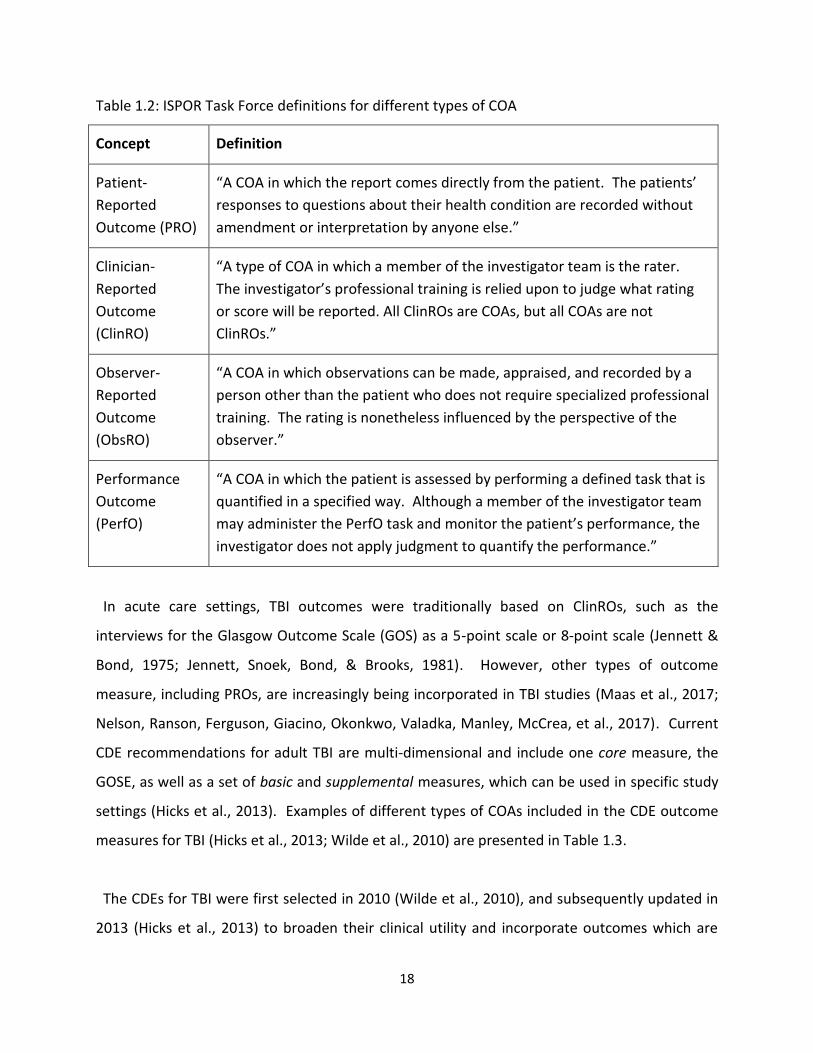
Table 1.2: ISPOR Task Force definitions for different types of COA
Concept Definition
Patient-
Reported
Outcome (PRO)
“A COA in which the report comes directly from the patient. The patients’
responses to questions about their health condition are recorded without
amendment or interpretation by anyone else.”
Clinician-
Reported
Outcome
(ClinRO)
“A type of COA in which a member of the investigator team is the rater.
The investigator’s professional training is relied upon to judge what rating
or score will be reported. All ClinROs are COAs, but all COAs are not
ClinROs.”
Observer-
Reported
Outcome
(ObsRO)
“A COA in which observations can be made, appraised, and recorded by a
person other than the patient who does not require specialized professional
training. The rating is nonetheless influenced by the perspective of the
observer.”
Performance
Outcome
(PerfO)
“A COA in which the patient is assessed by performing a defined task that is
quantified in a specified way. Although a member of the investigator team
may administer the PerfO task and monitor the patient’s performance, the
investigator does not apply judgment to quantify the performance.”
In acute care settings, TBI outcomes were traditionally based on ClinROs, such as the
interviews for the Glasgow Outcome Scale (GOS) as a 5-point scale or 8-point scale (Jennett &
Bond, 1975; Jennett, Snoek, Bond, & Brooks, 1981). However, other types of outcome
measure, including PROs, are increasingly being incorporated in TBI studies (Maas et al., 2017;
Nelson, Ranson, Ferguson, Giacino, Okonkwo, Valadka, Manley, McCrea, et al., 2017). Current
CDE recommendations for adult TBI are multi-dimensional and include one core measure, the
GOSE, as well as a set of basic and supplemental measures, which can be used in specific study
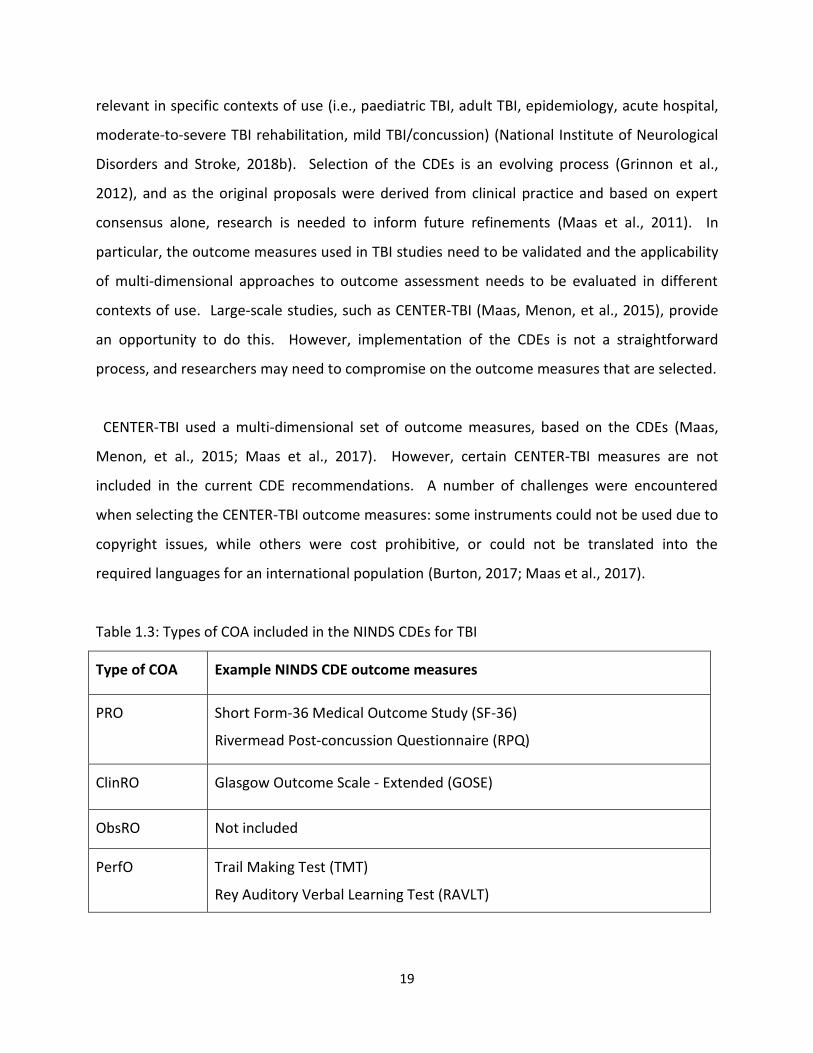
settings (Hicks et al., 2013). Examples of different types of COAs included in the CDE outcome
measures for TBI (Hicks et al., 2013; Wilde et al., 2010) are presented in Table 1.3.
The CDEs for TBI were first selected in 2010 (Wilde et al., 2010), and subsequently updated in
2013 (Hicks et al., 2013) to broaden their clinical utility and incorporate outcomes which are
19
relevant in specific contexts of use (i.e., paediatric TBI, adult TBI, epidemiology, acute hospital,
moderate-to-severe TBI rehabilitation, mild TBI/concussion) (National Institute of Neurological
Disorders and Stroke, 2018b). Selection of the CDEs is an evolving process (Grinnon et al.,
2012), and as the original proposals were derived from clinical practice and based on expert
consensus alone, research is needed to inform future refinements (Maas et al., 2011). In
particular, the outcome measures used in TBI studies need to be validated and the applicability
of multi-dimensional approaches to outcome assessment needs to be evaluated in different
contexts of use. Large-scale studies, such as CENTER-TBI (Maas, Menon, et al., 2015), provide
an opportunity to do this. However, implementation of the CDEs is not a straightforward
process, and researchers may need to compromise on the outcome measures that are selected.
CENTER-TBI used a multi-dimensional set of outcome measures, based on the CDEs (Maas,
Menon, et al., 2015; Maas et al., 2017). However, certain CENTER-TBI measures are not
included in the current CDE recommendations. A number of challenges were encountered
when selecting the CENTER-TBI outcome measures: some instruments could not be used due to
copyright issues, while others were cost prohibitive, or could not be translated into the
required languages for an international population (Burton, 2017; Maas et al., 2017).
Table 1.3: Types of COA included in the NINDS CDEs for TBI
Type of COA Example NINDS CDE outcome measures
PRO Short Form-36 Medical Outcome Study (SF-36)
Rivermead Post-concussion Questionnaire (RPQ)
ClinRO Glasgow Outcome Scale - Extended (GOSE)
ObsRO Not included
PerfO Trail Making Test (TMT)
Rey Auditory Verbal Learning Test (RAVLT)
20
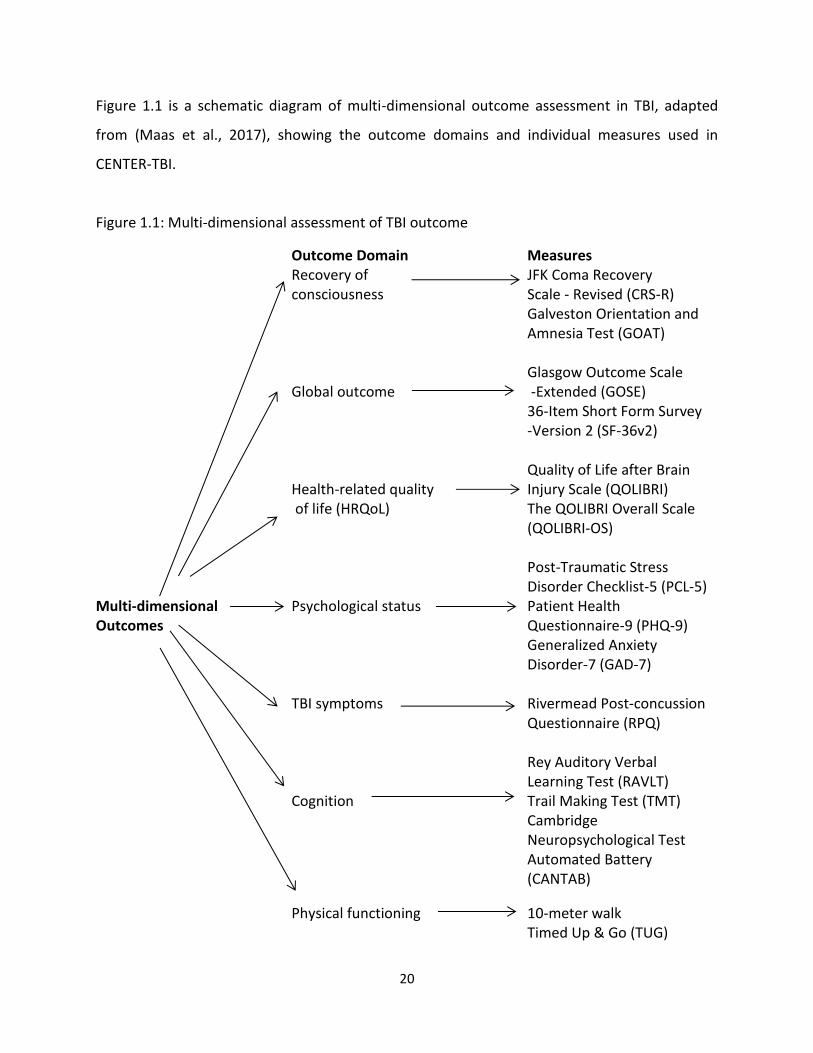
Figure 1.1 is a schematic diagram of multi-dimensional outcome assessment in TBI, adapted
from (Maas et al., 2017), showing the outcome domains and individual measures used in
CENTER-TBI.
Figure 1.1: Multi-dimensional assessment of TBI outcome
Outcome Domain Recovery of consciousness
Measures JFK Coma Recovery Scale - Revised (CRS-R) Galveston Orientation and Amnesia Test (GOAT)
Multi-dimensional Outcomes
Global outcome
Glasgow Outcome Scale -Extended (GOSE)
Health-related quality of life (HRQoL)
36-Item Short Form Survey -Version 2 (SF-36v2) Quality of Life after Brain Injury Scale (QOLIBRI) The QOLIBRI Overall Scale (QOLIBRI-OS)
Psychological status
Post-Traumatic Stress Disorder Checklist-5 (PCL-5) Patient Health Questionnaire-9 (PHQ-9) Generalized Anxiety Disorder-7 (GAD-7)
TBI symptoms Rivermead Post-concussion Questionnaire (RPQ)
Cognition
Rey Auditory Verbal Learning Test (RAVLT) Trail Making Test (TMT) Cambridge Neuropsychological Test Automated Battery (CANTAB)
Physical functioning 10-meter walk Timed Up & Go (TUG)
21
1.2. Aims of thesis
A number of aims were outlined for CENTER-TBI during the project planning phase.
Furthermore, a manual for data access, study plan proposals, and publication requests was
created, and researchers were responsible for submitting study proposals for acceptance by the
CENTER-TBI Management Committee. The CENTER-TBI project aims were defined during the
planning phase, however studies for particular work streams were not fully specified at this
stage. Thus, during project implementation there was scope to develop specific research
questions and methods for the studies presented in this thesis. The studies in this thesis were
developed in the first year of the PhD and put forward to the CENTER-TBI Management
Committee in three separate study proposals. The approved proposals are listed on the
CENTER-TBI website and are titled and numbered as follows: Agreement between approaches
for rating the GOSE in CENTER-TBI (75); The GOSE as a clinician-reported or patient-reported
outcome (76); and Relation of GOSE level of disability to data quality and validity of outcomes
in adult TBI (77).
The CENTER-TBI work plan was ambitious with respect to the collection of outcomes. Data
collection for the CENTER-TBI follow-ups was therefore done in a pragmatic and flexible way
(Maas et al., 2015). The GOSE could be completed as a structured interview and/or
respondent-completed questionnaire. Furthermore, at follow-up, investigators considered
whether specific outcome measures were appropriate for use with individual patients, and
assessments were attempted if patients were judged to be capable of completing them. The
pragmatic way in which outcomes were collected for CENTER-TBI provided an opportunity to
examine two main issues of relevance to observational TBI studies: (1) the comparability of
different approaches to measuring global functional outcome on the GOSE; and (2) the usability
of individual outcome measures across the spectrum of recovery after TBI. These issues were
selected for investigation in this thesis because they were consistent with the CENTER-TBI
objectives, and because both issues can potentially result in biased study findings (e.g.,
information collected via the GOSE structured interview and GOSE questionnaire might not be
equivalent, and TBI patients can be difficult to follow-up in longitudinal studies, potentially
22
resulting in selective attrition of patients with particular characteristics (Corrigan et al., 2003;
Krellman et al., 2014)).
There is limited research concerning the comparability of clinician ratings and patient reports
on the GOSE. Furthermore, the usability of individual outcome measures across the spectrum
of disability after TBI has not been examined in the context of TBI research. In light of this, the
studies presented in this thesis were designed to investigate the measurement of global
functional outcome and consider the implementation of multi-dimensional outcome
assessment in different contexts of use. The ISPOR Task Force framework for COAs was used to
investigate the usability of ClinROs (i.e., structured interviews), PROs (i.e., questionnaires), and
PerfOs (i.e., cognitive and functional mobility assessments) in TBI, and assessments were
considered to be multi-dimensional if they measured two or more outcome domains.
This thesis has three broad aims:
1. To assess how COAs, including the GOS/GOSE, have been used and reported in acute and
post-acute clinical trials in TBI, and to consider the extent to which multi-dimensional
outcome assessment has been implemented in these studies
2. To compare clinician ratings and respondent reports of global functional outcome in TBI, by:
Exploring whether information obtained via the GOSE structured interview provides
added value over the GOSE questionnaire
Examining how the GOSE structured interview and GOSE questionnaire relate to
prognostic factors and other outcome measures
3. To examine the usability of multi-dimensional outcome measures in relation to level of
functional recovery after TBI
23
CHAPTER 2
Randomized controlled trials in adult traumatic brain injury:
A systematic review on the use and reporting of clinical outcome
assessments1
1This chapter has been published: Horton, L., Rhodes, J. & Wilson, L. (2018). Randomized
controlled trials in adult traumatic brain injury: A systematic review on the use and reporting of
clinical outcome assessments. Journal of Neurotrauma. 35: 2005-2014.
This chapter is a systematic review on the patterns of use and reporting quality of COAs in
clinical trials in adult TBI. The findings from this review demonstrate the need for increased
consistency and improved reporting of outcome measures in TBI trials. The findings also
highlight the limited use of multi-dimensional outcome assessment in published RCTs,
especially in acute study settings.
24
2.1. Abstract
As part of efforts to improve study design, the use of outcome measures in randomized
controlled trials (RCTs) in traumatic brain injury (TBI) is receiving increasing attention. This
review aimed to assess how clinical outcome assessments (COAs) have been used and reported
in RCTs in adult TBI. Systematic literature searches were conducted to identify medium to large
(n ≥ 100) acute and post-acute TBI trials published since 2000. Data were extracted
independently by two reviewers using a set of structured templates. Items from the
Consolidated Standards of Reporting Trials (CONSORT) 2010 Statement and CONSORT patient-
reported outcomes (PRO) extension were used to evaluate reporting quality of COAs. Glasgow
Outcome Scale/Extended (GOS/GOSE) data were extracted using a checklist developed
specifically for the review. A total of 126 separate COAs were identified in 58 studies. The
findings demonstrate heterogeneity in the use of TBI outcomes, limiting comparisons and meta-
analyses of RCT findings. The GOS/GOSE was included in 39 studies, but implemented in a
variety of ways, which may not be equivalent. Multi-dimensional outcomes were used in 30
studies, and these were relatively more common in rehabilitation settings. The use of PROs
was limited, especially in acute study settings. Quality of reporting was variable, and key
information concerning COAs was often omitted, making it difficult to know how precisely
outcomes were assessed. Consistency across studies would be increased and future meta-
analyses facilitated by (a) using common data elements recommendations for TBI outcomes
and (b) following CONSORT guidelines when publishing RCTs.
25
2.2. Introduction
There is increasing awareness of the importance of clinical outcome assessments (COAs) in
evaluating health care interventions (Walton et al., 2015). Furthermore, in clinical research,
there is increasing emphasis both on standardizing data collection, and on multi-dimensional
outcome assessment including the patient’s perspective (Sheehan et al., 2016). In recognition
of the central role of outcomes in clinical studies, the US Food and Drug Administration (FDA)
has implemented a qualification program for COAs (U.S. Food & Drug Administration, 2014).
The terminology developed to describe COAs is outlined in a Task Force report by the
International Society for Pharmacoeconomics and Outcomes Research (ISPOR) (Walton et al.,
2015) and summarized in Chapter 1 of this thesis (see Tables 1.1 & 1.2). The ISPOR report
recommends that COAs should be targeted to clinical treatments; that is, in randomized
controlled trials (RCTs), selected COAs should be specifically chosen to determine whether
there is a treatment benefit on the intended aspect of patient functioning or feeling (i.e., the
concept of interest). The COAs selected should also be of clinical value to patients, in that they
should measure meaningful aspects of health that affect daily living (Walton et al., 2015).
In traumatic brain injury (TBI) research, there is currently a drive towards standardizing data
collection using a common set of measures which can be used to provide a multi-dimensional
description of outcome (Clinical Data Interchange Standards Consortium, 2015; Hicks et al.,
2013; Maas et al., 2017; Nelson, Ranson, Ferguson, Giacino, Okonkwo, Valadka, Manley,
McCrea, et al., 2017; Tosetti et al., 2013; Wilde et al., 2010). At its simplest, multi-dimensional
assessment means going beyond using a single endpoint to include two or more outcome
domains. Multiple outcome domains are relevant to TBI, including global functional outcome,
health-related quality of life, psychological status, TBI symptoms, cognition, and physical
functioning (Hicks et al., 2013; Maas et al., 2017; Nelson, Ranson, Ferguson, Giacino, Okonkwo,
Valadka, Manley, McCrea, et al., 2017). Current common data elements (CDEs)
recommendations for TBI outcomes include clinician-reported outcomes (ClinROs), patient-
reported outcomes (PROs), and performance outcomes (PerfOs) (Hicks et al., 2013). The CDE
outcomes for TBI comprise one core measure of global functioning, the GOSE, as well as a
26
variety of basic and supplemental outcome measures, which can be used in specific TBI study
types (Hicks et al., 2013). Use of common outcomes promotes meta-analyses and provides a
potential opportunity for pooling data for secondary analysis; it is particularly desirable in
medium to large-scale studies where the information collected may form a valuable legacy for
use in the future (Maas et al., 2011).
Measures of global functional outcome, such as the Glasgow Outcome Scale (GOS) and its
extended version, the Glasgow Outcome Scale-Extended (GOSE), have often been used alone as
the primary endpoint in trials of treatments for moderate to severe TBI (Alali et al., 2015;
Bragge et al., 2016; McMillan et al., 2016; Nichol et al., 2011). However, the GOS/GOSE has
been criticized for being insensitive to subtle changes in functioning (Alali et al., 2015; Maas et
al., 2017; McMillan et al., 2016; Menon & Maas, 2015; Nelson, Ranson, Ferguson, Giacino,
Okonkwo, Valadka, Manley, McCrea, et al., 2017; Nichol et al., 2011; Weir et al., 2012; Wilson,
Pettigrew, & Teasdale, 2000). In addition, the GOS/GOSE may be collected in a variety of
different ways, potentially yielding results that are not comparable. There is currently no
systematic overview of how COAs have been used in clinical trials in TBI. Furthermore, the
extent to which previous TBI trials have used a multi-dimensional set of outcomes, or a single
measure of global functional outcome such as the GOS/GOSE, is unclear, and warrants
investigation.
Transparency and completeness in the reporting of RCTs is essential to inform clinical decision-
making. However, the reporting quality of COAs in TBI trials has not specifically been
evaluated. A review by Lu et al (2015) used the CONsolidated Standards of Reporting Trials
(CONSORT) statement (Schulz, Altman, Moher, & Group, 2010) to evaluate whether the
reporting quality of methodological characteristics in adult TBI trials has improved over time (Lu
et al., 2015). Although reporting has improved over time in line with developments in the
CONSORT reporting guidelines, Lu et al (2015) concluded that there remains a need for
increased transparency in the reporting of clinical trial methodologies in adult TBI. Incomplete
reporting makes it difficult to assess the methodological rigour of RCTs and hinders ‘risk of bias’
27
assessments. Sub-optimal reporting of outcomes in clinical trials is also problematic because it
interferes with the interpretation of findings, and ultimately, limits their ability to inform clinical
practice guidelines.
The current systematic review focuses on medium to large scale RCTs in adults with TBI
published from 2000 onwards. The review had two main objectives: (1) To document patterns
of use of COAs; and (2) To evaluate quality of reporting of COAs using COA-specific items from
the CONSORT 2010 checklist, CONSORT PRO extension, and other COA-relevant reporting
criteria.
2.3. Methods
2.3.1. Search Strategy
Systematic online literature searches were conducted between October 2015 and May 2017 to
identify RCTs investigating the effectiveness of acute and post-acute treatments, interventions,
and management strategies in adult TBI. The following online databases were searched:
PubMed, CINAHL Complete, and PsychInfo. PubMed and CINAHL Complete were searched
using the MeSH terms “brain injuries” (exact subject) AND “randomised controlled
trial/randomized controlled trial" (title/abstract). PsychInfo was searched using the terms
"traumatic brain injury" (DE subjects [exact]) AND "randomized controlled trial/randomised
controlled trial" (AB Abstract). Two clinical trials registries, www.clinicaltrials.gov and the
Cochrane Central Register of Controlled Trials (CENTRAL), were searched using the MeSH term
"brain injuries" and condition "traumatic brain injury." A hand search was conducted by
searching the reference lists of two recent systematic reviews of RCTs in TBI (Bragge et al.,
2016; Lu et al., 2015). If a single study had more than one publication, linked papers were
included in the review and evaluated as one publication.
The references retrieved from the database search were imported to the Covidence system,
(Covidence, 2017) where the titles and abstracts were screened independently by two
reviewers according to the following inclusion and exclusion criteria:
28
Inclusion Criteria
1. Clinical trials investigating acute or post-acute treatments, interventions, or
management strategies for TBI
2. Adult participants (normally aged 16 and over)
3. Articles published from 2000 to the present
4. Articles published in academic journals
5. Articles published in English
6. Medium-scale (n = 100-500) and large-scale studies (n>500)
Exclusion Criteria
1. Small scale studies (n< 100)
2. Feasibility studies, pilot studies, study protocols, progress reports
3. Retrospective analyses of previously published RCTs
2.3.2. Data Extraction
Data extraction was carried out independently by two reviewers. Quality was ensured by
randomly selecting 5 studies, piloting data extraction for these studies, and refining the process
where necessary before proceeding. Further quality control measures were implemented by
completing data extraction in sets of 10, and by discussing and resolving any discrepancies that
occurred, until data extraction was complete.
2.3.3. Study characteristics
The following information relating to general study characteristics was extracted: sample size
(i.e., number randomized); study size (medium/large); participant age (overall mean/median
age, age range); TBI severity (mild/moderate/severe); setting (acute/post-acute); participation
sites (single/multicentre); intervention characteristics/type of study; treatment benefit;
treatment mechanism; hypothesis; primary COA(s); secondary COA(s); time point of primary
interest; time point of secondary interest; follow-up rate.
29
2.3.4. Risk of Bias
Selection bias has been found to influence RCT outcomes and is a central measure of study
quality. Therefore, risk of selection bias was assessed using two key domains from the
Cochrane Risk of Bias Tool: random sequence generation and allocation concealment. Risk of
bias was categorized as high, low, or unclear (if insufficient information was provided), in line
with Cochrane Collaboration definitions (Higgins et al., 2011). This approach is consistent with
that used in a recent scoping review of RCTs in moderate-to-severe TBI (Bragge et al., 2016).
2.3.5. Patterns of use of COAs
Frequency counts were made to identify: (1) How many COAs were used; (2) Which
assessments were used most often; (3) How many studies used multi-dimensional outcomes
(i.e., use of two or more measures covering different assessment domains as defined in the
CDEs); and (4) Which type of COA was used most commonly in each setting (i.e., ClinRO, PRO,
PerfO, ObsRO), both for primary outcomes and for outcomes that were used in any capacity
(including primary outcomes, secondary outcomes, and combined outcomes). Combined
outcomes consist of two or more component outcome measures which are combined into a
single endpoint (Freemantle, Calvert, Wood, Eastaugh, & Griffin, 2003; Temkin et al., 2007), or
analyzed jointly using a global test (Bagiella et al., 2010a; Zafonte et al., 2012).
2.3.6. Quality of reporting of COAs
A checklist was developed to assess the reporting quality of COAs. The checklist was based on
COA-relevant items from the CONSORT PRO extension, (Calvert et al., 2013) CONSORT 2010
Statement, (Schulz et al., 2010) and other additional COA-relevant reporting criteria. The
CONSORT PRO extension provides guidance on how to describe patient-reported outcomes
(PRO). However, as this review is concerned with COAs more generally, items from the
CONSORT checklists were evaluated for all four types of COA (i.e., ClinRO, PRO, PerfO, ObsRO).
Some additional COA-relevant items were added, and some of the CONSORT checklist items
were expanded for the purposes of this review. Expanded items are marked with asterisks in
Table 2.3.
30
2.3.7. Glasgow Outcome Scale
Patterns of use and quality of reporting were evaluated for the GOS/GOSE using a checklist,
which was developed specifically for this review. The checklist was used to assess the following
items: (1) Whether the GOS/GOSE was used as a primary outcome, secondary outcome, or not
at all; (2) Method of assessment (i.e., clinician assessed, structured interview, or questionnaire);
(3) Whether extracranial injuries were included in the rating; (4) Method of dealing with severe
pre-existing disability; (5) Method of contact for assessment (i.e., face-to-face, telephone, or
postal); (6) Source of information (i.e., patient, proxy respondent, or other sources); (7) Method
of assigning final rating (i.e., researcher rating or central review); (8) Whether the assessor was
trained; (9) Whether scores were dichotomized; and (10) Whether ordinal analysis methods
were used (including analysis of ranked data, sliding dichotomy, and proportional odds ratio
methods).
2.3.8. Statistical analysis
The results were summarized descriptively using frequencies (i.e. number of studies) and
percentages (i.e. proportion of studies) for each of the items of interest. The data were
analyzed using Microsoft Excel®.
2.4. Results
2.4.1. Study selection process
The online literature search yielded a total of 1861 references. The hand search revealed an
additional 6 articles which met the inclusion criteria for the review. After removing duplicates,
a total of 1137 separate references were left to be screened. Of these references, 1025 were
excluded. The remaining 113 full-text articles were assessed for eligibility. Fifty-five of the full-
text articles were excluded, leaving a total of 58 studies to be included in the review. The study
selection process is detailed in Figure 2.1.
31
2.4.2. Study characteristics
The general characteristics of the studies are presented in Appendix 2. Key study
characteristics are summarised in Table 2.1. Most of the studies were conducted in acute
settings (n = 38), and most were medium sized (n = 51). Almost half of the studies were
conducted with patients with severe TBI (n = 27), most studies were multicentre (n = 38), and
most had follow-up rates of 90% or better (n = 41). Six months post-injury was the most
popular time point of primary interest (n = 31).
Figure 2.1: Systematic review study selection process

32
Table 2.1: Key study characteristics
Number (%) of RCTs
Acute (n=38)
Post-acute (n=20)
Overall (n=58)
Sample size
100-500 (medium) 31 (81%) 20 (100%) 51 (88%)
>500 (large) 7 (19%) 0 (0%) 7 (12%)
TBI Severity (GCS score)
13-15 (mild) 1 (2%) 6 (30%) 7 (12%)
9-12 (moderate) 0 (0%) 0 (0%) 0 (0%)
3-8 (severe) 25 (66%) 2 (10%) 27 (46%)
3-15 (all severities) 3 (8%) 4 (20%) 7 (12%)
9-15 (mild/moderate) 0 (0%) 1 (5%) 1 (2%)
3-12 (moderate/severe) 9 (24%) 7 (35%) 16 (28%)
Participation Centres
Single Centre 14 (37%) 6 (30%) 20 (34%)
Multicentre 24 (63%) 14 (70%) 38 (66%)
Time point of primary interest
<6-months post-injury 5 (13%) 3 (15%) 8 (14%)
6-months post-injury 29 (77%) 2 (10%) 31 (53%)
1-year post-injury 0 (0%) 4 (20%) 4 (7%)
>1-year post-injury 1 (2%) 8 (40%) 9 (16%)
Other 3 (8%) 3 (15%) 6 (10%)
Follow-up rate
≥90% 32 (84%) 9 (45%) 41 (71%)
80-89% 2 (6%) 7 (35%) 9 (16%)
70-79% 1 (2%) 2 (10%) 3 (5%)
<70% 1 (2%) 2 (10%) 3 (5%)
Not stated 2 (6%) 0 (0%) 2 (3%)
33
2.4.3. Risk of Bias
Risk of selection bias for each study is presented in Appendix 2. Figure 2.2 shows that random
sequence generation (RSG) was rated as low risk of bias in 42 studies (27 acute; 15 post-acute),
unclear risk of bias in 15 studies (11 acute; 4 post-acute), and high risk of bias in 1 post-acute
study. Allocation concealment (AC) was rated as low risk of bias in 39 studies (25 acute; 14
post-acute), unclear risk of bias in 18 studies (12 acute; 6 post-acute), and high risk of bias in 1
acute study.
Figure 2.2: Risk of Bias for Allocation Concealment and Random Sequence Generation
2.4.4. Patterns of use of COAs
A total of 126 separate COAs were identified within the 58 studies. The full list of COAs by
type, study setting, and frequency of use are listed in Appendix 3. Twenty-six (21%) of the COAs
were used exclusively in acute studies, 82 (65%) were used exclusively in post-acute studies,
and 18 (14%) were used across both study settings. Figure 2.3 shows that the ten most
42
27
15
39
25
14
15
11
4
18
12
6
0% 10% 20% 30% 40% 50% 60% 70% 80% 90% 100%
RSG Overall (n = 58)
RSG Acute Studies (n = 38)
RSG Post-Acute Studies (n = 20)
AC Overall (n = 58)
AC Acute Studies (n = 38)
AC Post-Acute Studies (n = 20)
Low Risk of Bias
Unclear Risk of Bias
High Risk of Bias
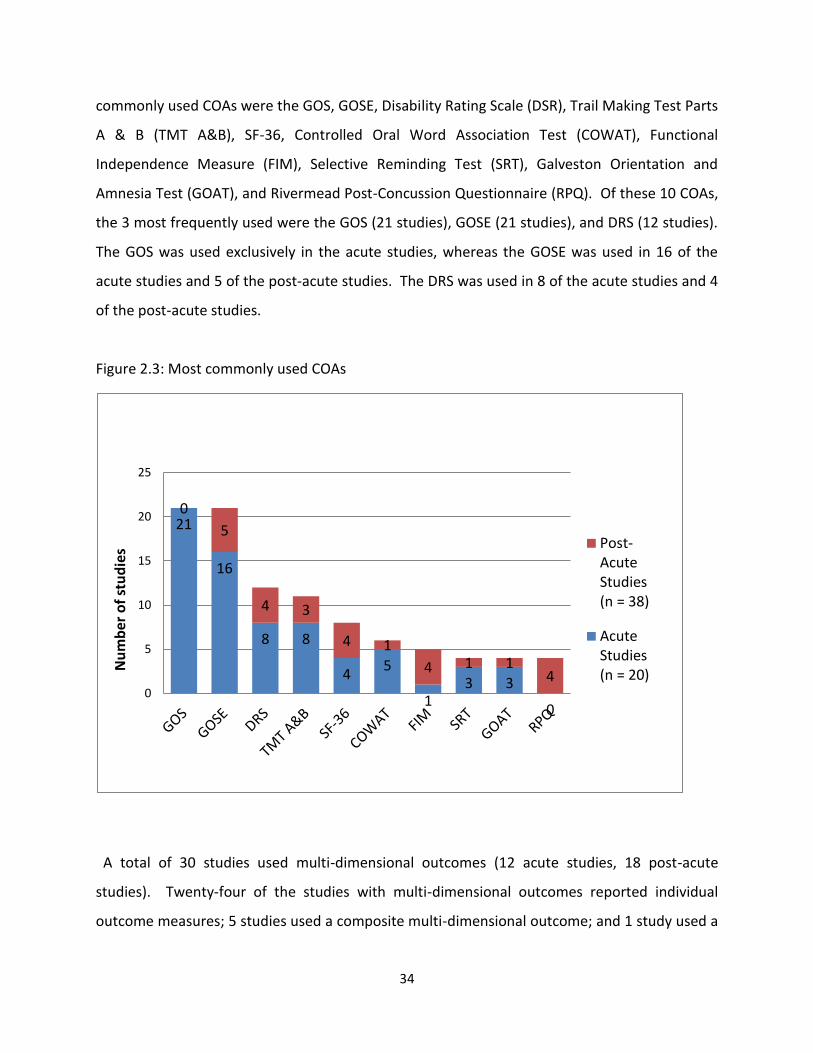
34
commonly used COAs were the GOS, GOSE, Disability Rating Scale (DSR), Trail Making Test Parts
A & B (TMT A&B), SF-36, Controlled Oral Word Association Test (COWAT), Functional
Independence Measure (FIM), Selective Reminding Test (SRT), Galveston Orientation and
Amnesia Test (GOAT), and Rivermead Post-Concussion Questionnaire (RPQ). Of these 10 COAs,
the 3 most frequently used were the GOS (21 studies), GOSE (21 studies), and DRS (12 studies).
The GOS was used exclusively in the acute studies, whereas the GOSE was used in 16 of the
acute studies and 5 of the post-acute studies. The DRS was used in 8 of the acute studies and 4
of the post-acute studies.
Figure 2.3: Most commonly used COAs
A total of 30 studies used multi-dimensional outcomes (12 acute studies, 18 post-acute
studies). Twenty-four of the studies with multi-dimensional outcomes reported individual
outcome measures; 5 studies used a composite multi-dimensional outcome; and 1 study used a
21
16
8 8
4 5
1 3 3
0
0
5
4 3
4 1
4 1 1 4
0
5
10
15
20
25
Nu
mb
er o
f st
ud
ies Post-
AcuteStudies(n = 38)
AcuteStudies(n = 20)
35
global test to create a multi-dimensional outcome, i.e., the TBI Clinical Trials Network Core
Battery (Bagiella et al., 2010a; Zafonte et al., 2012).
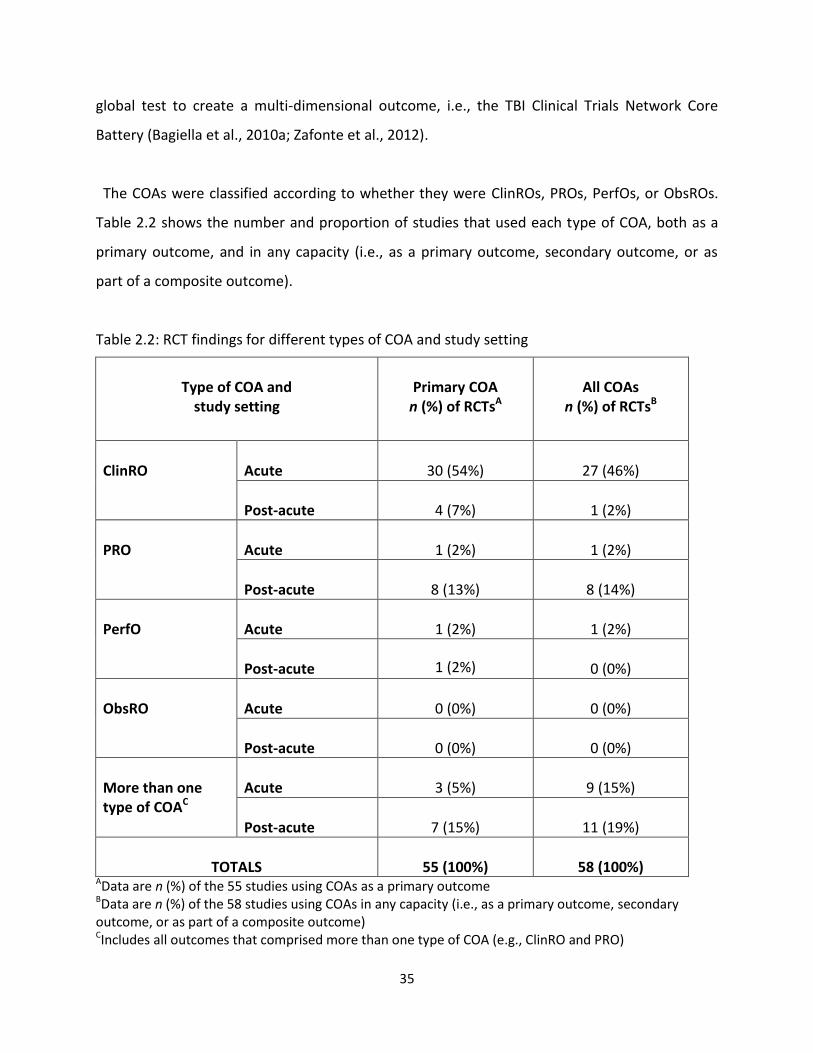
The COAs were classified according to whether they were ClinROs, PROs, PerfOs, or ObsROs.
Table 2.2 shows the number and proportion of studies that used each type of COA, both as a
primary outcome, and in any capacity (i.e., as a primary outcome, secondary outcome, or as
part of a composite outcome).
Table 2.2: RCT findings for different types of COA and study setting
Type of COA and
study setting
Primary COA
n (%) of RCTsA
All COAs
n (%) of RCTsB
ClinRO
Acute
30 (54%)
27 (46%)
Post-acute
4 (7%)
1 (2%)
PRO
Acute
1 (2%)
1 (2%)
Post-acute
8 (13%)
8 (14%)
PerfO
Acute
1 (2%)
1 (2%)
Post-acute
1 (2%)
0 (0%)
ObsRO
Acute
0 (0%)
0 (0%)
Post-acute
0 (0%)
0 (0%)
More than one type of COAC
Acute
3 (5%)
9 (15%)
Post-acute
7 (15%)
11 (19%)
TOTALS
55 (100%)
58 (100%)
AData are n (%) of the 55 studies using COAs as a primary outcome BData are n (%) of the 58 studies using COAs in any capacity (i.e., as a primary outcome, secondary outcome, or as part of a composite outcome) CIncludes all outcomes that comprised more than one type of COA (e.g., ClinRO and PRO)
36
Overall, ClinROs were the most popular type of COA: they were used mostly in acute settings
and accounted for 54% of acute study primary outcomes. PROs were used rarely in acute
settings, but they were used more commonly in post-acute settings. Overall, 20 studies used
more than one type of COA (9 acute studies; 11 post-acute studies). For primary outcomes, 10
studies used more than one type of COA (3 acute studies; 7 post-acute studies).
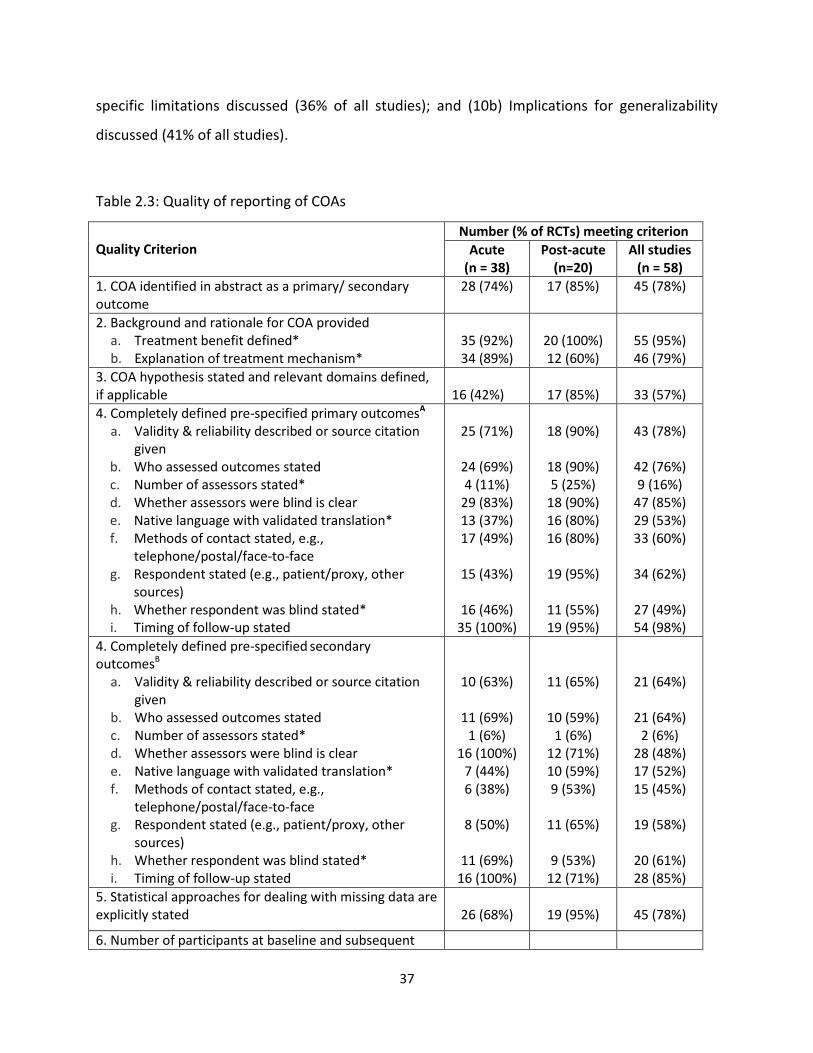
2.4.5. Quality of reporting of COAs
Reporting quality of COAs was assessed across the 58 studies. The number and percentage of
studies that met each quality criterion is reported in Table 2.3. Each article was assessed
according to whether the individual quality criteria were met. For cases where the information
was unclear, or partially met, the criterion was rated as unmet. Reporting of primary and
secondary outcome measures was assessed separately for checklist item 4. The numbers and
percentages for each criterion are adjusted accordingly for sub-groups (see Table 2.3 Legend).
Table 2.3 shows that reporting of COAs was variable across the quality criteria. The checklist
items that were reported most completely include: (2a) Treatment benefit defined (95% of all
studies); (4i) Timing of follow up for primary outcomes stated (98% of all studies); (7) Baseline
COA data provided, if collected (100% of the 20 applicable studies); (8) Numbers analysed for
COA results stated (98% of all studies); (10c) Implications for clinical practice discussed (100% of
all studies); (11) COA data interpreted in relation to clinical outcomes, including survival data,
where relevant (100% of all studies). Reporting varied between acute and post-acute studies,
and primary outcomes were generally reported more completely than secondary outcomes,
especially in the post-acute studies. Reporting quality varied across criteria for checklist item 4:
Overall, the proportion of studies meeting the criteria ranged from 6% for ‘Number of assessors
stated for secondary outcomes,’ to 98% for ‘Timing of follow-up for primary outcomes stated.’
The following checklist items were least complete: (3) COA hypothesis stated and relevant
domains defined, if applicable (57% of all studies); (9a) Effect size reported (53% of all studies);
(9aii) For binary outcomes, absolute effect size stated (28% of applicable studies); (9b)
Confidence intervals (or other measures of precision) reported (57% of all studies); (10a) COA-
37
specific limitations discussed (36% of all studies); and (10b) Implications for generalizability
discussed (41% of all studies).
Table 2.3: Quality of reporting of COAs
Quality Criterion
Number (% of RCTs) meeting criterion
Acute (n = 38)
Post-acute (n=20)
All studies (n = 58)
1. COA identified in abstract as a primary/ secondary outcome
28 (74%) 17 (85%) 45 (78%)
2. Background and rationale for COA provided a. Treatment benefit defined* b. Explanation of treatment mechanism*
35 (92%) 34 (89%)
20 (100%) 12 (60%)
55 (95%) 46 (79%)
3. COA hypothesis stated and relevant domains defined, if applicable
16 (42%)
17 (85%)
33 (57%)
4. Completely defined pre-specified primary outcomesA a. Validity & reliability described or source citation
given b. Who assessed outcomes stated c. Number of assessors stated* d. Whether assessors were blind is clear e. Native language with validated translation* f. Methods of contact stated, e.g.,
telephone/postal/face-to-face g. Respondent stated (e.g., patient/proxy, other
sources) h. Whether respondent was blind stated* i. Timing of follow-up stated
25 (71%)
24 (69%) 4 (11%)
29 (83%) 13 (37%) 17 (49%)
15 (43%)
16 (46%)
35 (100%)
18 (90%)
18 (90%) 5 (25%)
18 (90%) 16 (80%) 16 (80%)
19 (95%)
11 (55%) 19 (95%)
43 (78%)
42 (76%) 9 (16%)
47 (85%) 29 (53%) 33 (60%)
34 (62%)
27 (49%) 54 (98%)
4. Completely defined pre-specified secondary outcomesB
a. Validity & reliability described or source citation given
b. Who assessed outcomes stated c. Number of assessors stated* d. Whether assessors were blind is clear e. Native language with validated translation* f. Methods of contact stated, e.g.,
telephone/postal/face-to-face g. Respondent stated (e.g., patient/proxy, other
sources) h. Whether respondent was blind stated* i. Timing of follow-up stated
10 (63%)
11 (69%) 1 (6%)
16 (100%) 7 (44%) 6 (38%)
8 (50%)
11 (69%)
16 (100%)
11 (65%)
10 (59%) 1 (6%)
12 (71%) 10 (59%) 9 (53%)
11 (65%)
9 (53%)
12 (71%)
21 (64%)
21 (64%) 2 (6%)
28 (48%) 17 (52%) 15 (45%)
19 (58%)
20 (61%) 28 (85%)
5. Statistical approaches for dealing with missing data are explicitly stated
26 (68%)
19 (95%)
45 (78%)
6. Number of participants at baseline and subsequent
38
time points given 30 (79%) 19 (95%) 49 (85%)
7. Baseline COA data provided, if collectedC
3 (100%) 17 (100%) 20 (100%)
8. Numbers analysed for COA results stated 38 (100%) 19 (95%) 57 (98%)
9. For each primary and secondary outcome, results for each group provided
a. Effect size reported i. For binary outcomes, Drelative effect size stated
ii. For binary outcomes, Dabsolute effect size stated
b. Confidence intervals (or other measures of precision) reported
22 (58%) 19 (79%) 7 (29%)
27 (71%)
9 (45%) 1 (100%)
0 (0%)
6 (30%)
31 (53%) 20 (80%) 7 (28%)
33 (57%)
10a. COA-specific limitations discussed 10b. Implications for generalizability discussed 10c. Implications for clinical practice discussed
6 (16%) 10 (26%)
38 (100%)
15 (75%) 14 (70%)
20 (100%)
21 (36%) 24 (41%)
58 (100%)
11. COA data interpreted in relation to clinical outcomes, including survival data, where relevant
38 (100%)
20 (100%)
58 (100%)
*Expanded items marked with asterisks A Applicable in 55 studies (35 acute studies; 20 post-acute studies) B Applicable in 33 studies (16 acute studies; 17 post-acute studies) C Applicable in 20 studies (3 acute studies; 17 post-acute studies) D Applicable in 25 studies (24 acute studies; 1 post-acute study)
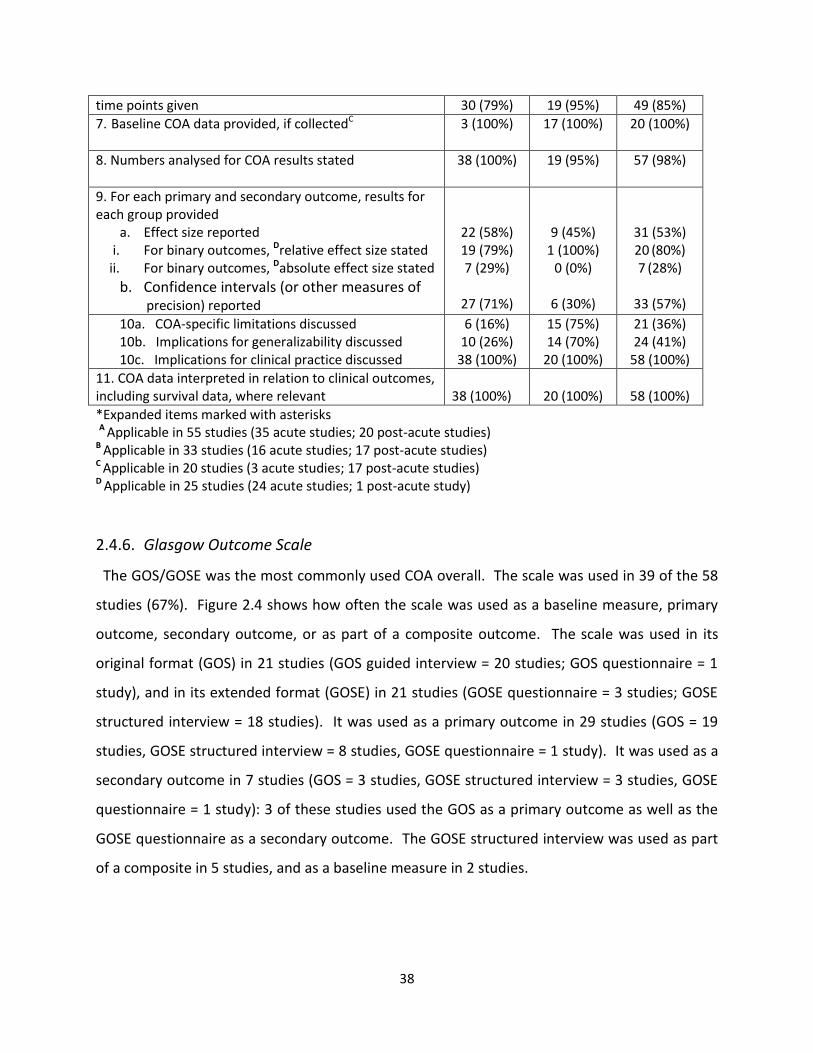
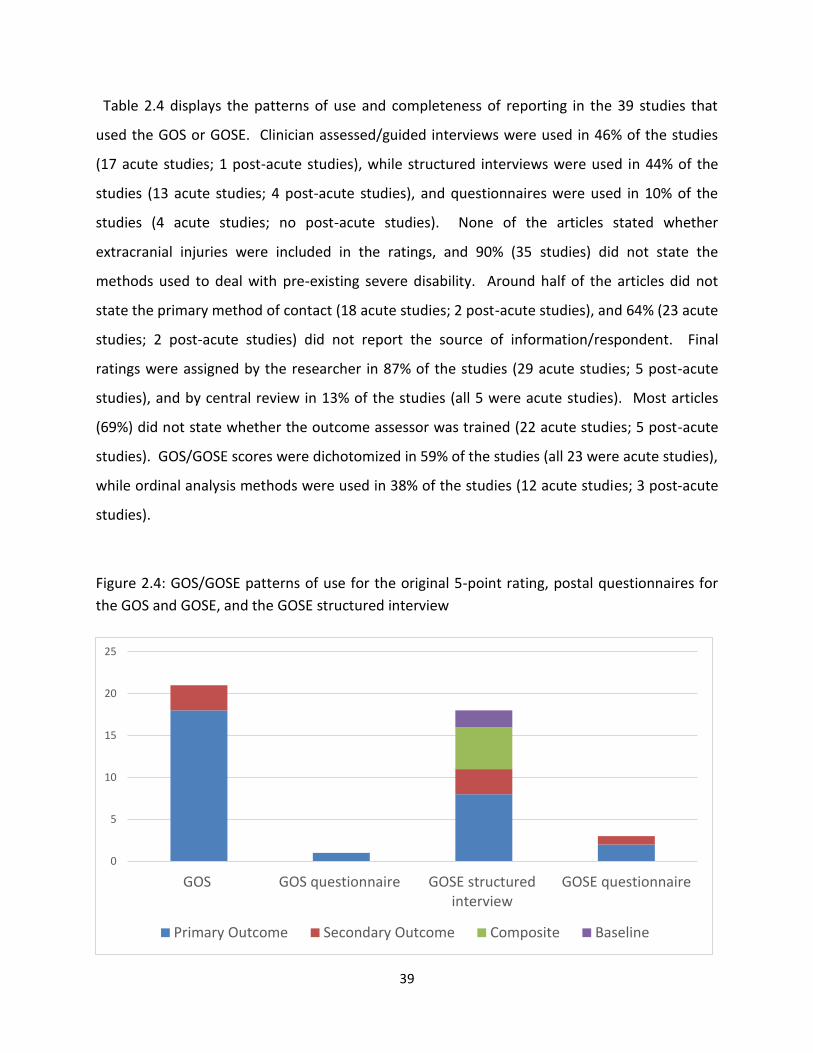
2.4.6. Glasgow Outcome Scale
The GOS/GOSE was the most commonly used COA overall. The scale was used in 39 of the 58
studies (67%). Figure 2.4 shows how often the scale was used as a baseline measure, primary
outcome, secondary outcome, or as part of a composite outcome. The scale was used in its
original format (GOS) in 21 studies (GOS guided interview = 20 studies; GOS questionnaire = 1
study), and in its extended format (GOSE) in 21 studies (GOSE questionnaire = 3 studies; GOSE
structured interview = 18 studies). It was used as a primary outcome in 29 studies (GOS = 19
studies, GOSE structured interview = 8 studies, GOSE questionnaire = 1 study). It was used as a
secondary outcome in 7 studies (GOS = 3 studies, GOSE structured interview = 3 studies, GOSE
questionnaire = 1 study): 3 of these studies used the GOS as a primary outcome as well as the
GOSE questionnaire as a secondary outcome. The GOSE structured interview was used as part
of a composite in 5 studies, and as a baseline measure in 2 studies.
39
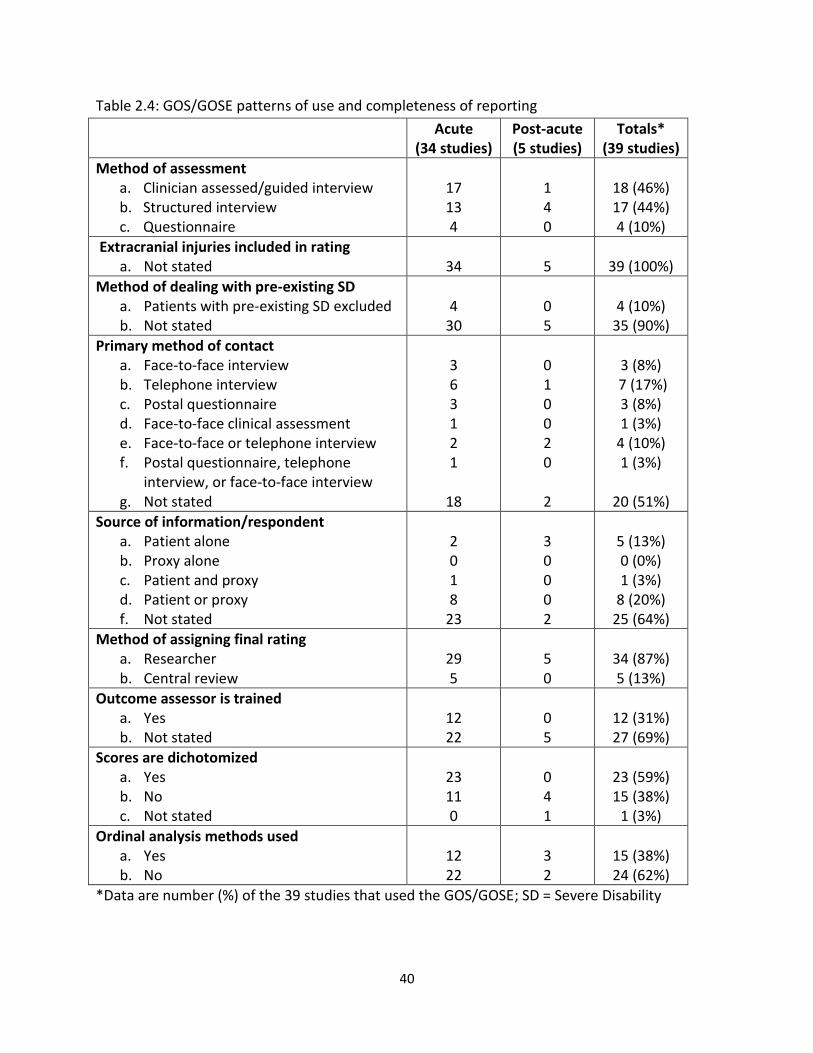
Table 2.4 displays the patterns of use and completeness of reporting in the 39 studies that
used the GOS or GOSE. Clinician assessed/guided interviews were used in 46% of the studies
(17 acute studies; 1 post-acute studies), while structured interviews were used in 44% of the
studies (13 acute studies; 4 post-acute studies), and questionnaires were used in 10% of the
studies (4 acute studies; no post-acute studies). None of the articles stated whether
extracranial injuries were included in the ratings, and 90% (35 studies) did not state the
methods used to deal with pre-existing severe disability. Around half of the articles did not
state the primary method of contact (18 acute studies; 2 post-acute studies), and 64% (23 acute
studies; 2 post-acute studies) did not report the source of information/respondent. Final
ratings were assigned by the researcher in 87% of the studies (29 acute studies; 5 post-acute
studies), and by central review in 13% of the studies (all 5 were acute studies). Most articles
(69%) did not state whether the outcome assessor was trained (22 acute studies; 5 post-acute
studies). GOS/GOSE scores were dichotomized in 59% of the studies (all 23 were acute studies),
while ordinal analysis methods were used in 38% of the studies (12 acute studies; 3 post-acute
studies).
Figure 2.4: GOS/GOSE patterns of use for the original 5-point rating, postal questionnaires for
the GOS and GOSE, and the GOSE structured interview
0
5
10
15
20
25
GOS GOS questionnaire GOSE structuredinterview
GOSE questionnaire
Primary Outcome Secondary Outcome Composite Baseline
40
Table 2.4: GOS/GOSE patterns of use and completeness of reporting
Acute (34 studies)
Post-acute (5 studies)
Totals* (39 studies)
Method of assessment a. Clinician assessed/guided interview b. Structured interview c. Questionnaire
17 13 4
1 4 0
18 (46%) 17 (44%) 4 (10%)
Extracranial injuries included in rating a. Not stated
34
5
39 (100%)
Method of dealing with pre-existing SD a. Patients with pre-existing SD excluded b. Not stated
4
30
0 5
4 (10%)
35 (90%)
Primary method of contact a. Face-to-face interview b. Telephone interview c. Postal questionnaire d. Face-to-face clinical assessment e. Face-to-face or telephone interview f. Postal questionnaire, telephone
interview, or face-to-face interview g. Not stated
3 6 3 1 2 1
18
0 1 0 0 2 0
2
3 (8%)
7 (17%) 3 (8%) 1 (3%)
4 (10%) 1 (3%)
20 (51%)
Source of information/respondent a. Patient alone b. Proxy alone c. Patient and proxy d. Patient or proxy f. Not stated
2 0 1 8
23
3 0 0 0 2
5 (13%) 0 (0%) 1 (3%)
8 (20%) 25 (64%)
Method of assigning final rating a. Researcher b. Central review
29 5
5 0
34 (87%) 5 (13%)
Outcome assessor is trained a. Yes b. Not stated
12 22
0 5
12 (31%) 27 (69%)
Scores are dichotomized a. Yes b. No c. Not stated
23 11 0
0 4 1
23 (59%) 15 (38%)
1 (3%)
Ordinal analysis methods used a. Yes b. No
12 22
3 2
15 (38%) 24 (62%)
*Data are number (%) of the 39 studies that used the GOS/GOSE; SD = Severe Disability
41
2.5. Discussion
This review aimed to evaluate how clinical outcome assessments (COAs) have been used and
reported in RCTs in adult TBI from 2000 onwards. In total, 58 clinical trials were assessed
according to key study characteristics, risk of selection bias, patterns of use of COAs, and
reporting quality of COAs. The included articles demonstrate that the majority of RCTs that fit
criteria were medium in size (i.e., n=100-500), and most studies investigated acute hospital
treatments for moderate and severe TBI.
A wide range of COAs were used across the included studies, and there were differences in the
use of outcomes depending on the setting in which the RCT was conducted (i.e., context of
use). A greater range of COAs were used in the post-acute studies, and there was little
commonality between acute and post-acute settings. The most popular COAs were measures
of global functional outcome, including the GOS, GOSE, and DRS. However, most of the COAs
were used infrequently (i.e., in 1 to 3 studies). Considerable variability therefore exists in the
use of outcome measures in TBI trials, especially in post-acute settings, making it challenging to
link acute and post-acute studies (Tosetti et al., 2013). The frequent use of the GOS/GOSE in
the reviewed studies is not surprising and is consistent with the subsequent CDE
recommendations for TBI (Hicks et al., 2013). Nevertheless, the GOS/GOSE has not been used
universally in TBI clinical trials. The introduction of outcome CDEs for TBI should help to reduce
variability in the assessments used in RCTs. However, it is notable that since first proposed
(Wilde et al., 2010), the number of outcome CDEs has grown, and compartmentalisation of
different areas of TBI assessment remains.
As multi-dimensional outcome assessment is increasingly important in the field of TBI, the
GOS/GOSE is now recognised to be insufficient on its own as an outcome measure (Maas et al.,
2017; Menon & Maas, 2015; Nelson, Ranson, Ferguson, Giacino, Okonkwo, Valadka, Manley,
McCrea, et al., 2017). Despite this, around half of the reviewed studies used a single outcome:
most of these were acute studies, and the GOS/GOSE was the most frequently used endpoint.
Around half of the studies used multi-dimensional outcomes: most of the post-acute studies

42
used multi-dimensional outcomes, whereas a minority of the acute studies used multi-
dimensional outcomes. Most studies with multi-dimensional outcomes used separate COAs to
measure multiple outcome domains, and composite multi-dimensional outcomes were
relatively rare. While ClinROs such as the GOS/GOSE were common in the acute studies, PROs
were used rarely in these studies. Regulators have encouraged the use of PROs (U.S. Food &
Drug Administration, 2009), but these assessments have not proven popular in TBI, perhaps
because they are not as closely linked to the neural substrate as functional outcome measures
(Bagiella et al., 2010a). The findings from the review demonstrate that multi-dimensional
outcomes are not used universally in TBI trials. Moreover, multi-dimensional outcomes are
more commonly used in rehabilitation settings, perhaps due to treatments that are more
clearly targeted to behavioural change and designed to tap into multiple outcome domains.
The overall reporting quality of COAs was variable across the reviewed studies, suggesting that
reporting is sub-optimal in TBI trials. Most articles provided a sufficient background and
rationale for the outcomes. Furthermore, the criteria relating to timing of follow-ups,
participant numbers, baseline outcomes data, implications for clinical practice, and
interpretation of clinical outcomes, were consistently well met across the studies. Overall, the
most incompletely reported aspects included COA hypotheses, effect sizes and confidence
intervals, COA-specific limitations, and implications for generalizability. Some key differences
were identified between the acute and post-acute studies. Although acute studies were
relatively better at explaining treatment mechanisms, more attention was paid to outcomes in
rehabilitation settings (i.e., hypotheses were stated more clearly, primary outcomes were
defined more fully, and COA-specific limitations and implications for generalizability were more
likely to be discussed). In the acute studies, there was often a lack of rationale for the choice of
endpoint, possibly because pharmaceutical trials in acute TBI tend to be motivated by animal
studies and there is a substantial gap between the behavioural measures typically used in
laboratory work and the COAs used in human studies (i.e., GOS/GOSE). In future clinical trials,
investigators should therefore ensure that outcomes are well defined and carefully selected to
43
capture treatment benefit on specific aspects of the patient’s functioning or feeling (Walton et
al., 2015).
Despite the wide use of the GOS/GOSE, certain aspects were reported particularly poorly
across the studies. None of the included articles reported whether extracranial injuries were
included in the GOS/GOSE ratings, and most studies provided no information about the method
used to deal with pre-existing severe disability. Around two thirds of the articles did not state
who the respondent was (i.e., the TBI patient or a proxy informant), or whether the outcome
assessor was trained. Furthermore, around half of the articles did not provide sufficient
information about the primary method of contact for GOS/GOSE assessments (i.e., face-to-face
contact, telephone contact, postal questionnaire). In contrast, reporting of GOS/GOSE scoring
and analysis methods was relatively complete, the method of assigning final ratings was clear in
all of the articles, and it was apparent in most studies if the GOS/GOSE scores were
dichotomized or if ordinal analysis methods were used.
Transparent reporting of how the GOS/GOSE is used and analysed is important in RCTs
because variability in methods of data collection and scoring may influence study findings.
Important issues to consider when assigning outcome on the GOS/GOSE include the influence
of extracranial injury, pre-existing disability, and source of information (i.e., TBI patient or proxy
informant) (Wilson, Pettigrew, & Teasdale, 1998). Inter-rater variability is another important
issue when assigning outcome and interviewer training is required to achieve high levels of
agreement between assessors (Wilson et al., 2007). Extracranial concomitant injury can have
an effect on functional outcome (Dacey et al., 1991; Leong, Mazlan, Abd Rahim, & Ganesan,
2013). However, the original description of the structured interview for the GOSE noted that
the scale did not distinguish the effects of brain injury from the effects of concomitant injuries
to other parts of the body: investigators needed to decide whether to include or exclude
extracranial injuries in the overall rating of disability (Wilson et al., 1998). Both approaches
have been used in RCTs, with some trials including extracranial injuries in the assessment (e.g.
the Dexanabinol Trial) (Maas et al., 2006), and others excluding the influence of non-brain
44
injuries (e.g. PROTECT III) (Wright et al., 2014). This represents a substantial difference in the
way that outcome assessments have been conducted, and one that should be documented in
future trial reports.
Previous studies suggest that the GOSE questionnaire and structured telephone interview can
be used as a reliable means of assigning functional outcome in the absence of face-to-face
contact (Pettigrew, Wilson, & Teasdale, 2003; Wilson, Edwards, Fiddes, Stewart, & Teasdale,
2002). Nevertheless, robust comparisons between these different methods of GOSE data
collection have not been made. The GOSE questionnaire is increasingly used in TBI trials
(Andrews et al., 2015; Gregson et al., 2015; Hutchinson et al., 2017; Mendelow et al., 2015).
However, as impaired self-awareness can affect TBI patients’ ability to provide an accurate self-
report (Prigatano, 2005b), the GOSE questionnaire may not be appropriate in all contexts.
Disagreements between GOSE questionnaires and GOSE interviews may occur if questionnaires
are self-completed by patients who lack insight into their own functional limitations (Wilson et
al., 2002), and investigators should take this into consideration when deciding which method of
GOSE data collection to use in future TBI studies.
2.5.1. Limitations
This review provides information about the patterns of use and reporting quality of outcomes
in adult TBI trials published from the year 2000 onwards. However, it is important to note that
the review has limitations. As changes in the use and reporting of COAs were not examined
over time, the impact of the CDE recommendations for common outcome measures in TBI
(Hicks et al., 2013; Wilde et al., 2010), and the CONSORT guidelines for RCT reporting (Calvert et
al., 2013; Schulz et al., 2010), on clinical trials in TBI is unknown. Furthermore, as the review
was restricted to medium and large scale RCTs (i.e., n≥100), the findings may have differed if
smaller scale RCTs had been included. The inclusion criteria may have been biased against
post-acute studies, as these are often smaller in scale than acute TBI studies.
45
2.5.2. Conclusion
This review demonstrates shortcomings in the use of COAs in adult TBI trials to date and
highlights the issue of incomplete reporting of outcomes in these studies. Heterogeneity in the
use of clinical trial endpoints is problematic because it interferes with meta-analyses of trial
findings and makes it difficult to pool data for secondary analyses. Incomplete reporting of
outcomes is also problematic because it limits the transparency of RCT findings and
compromises their clinical applicability. To address the issues raised in this review, future
studies in adult TBI should follow CDE outcomes recommendations to increase consistency in
the use of COAs and facilitate future meta-analyses (Hicks et al., 2013). Future RCTs in adult TBI
should also adhere to CONSORT guidelines to ensure transparency in the reporting of outcomes
and contribute to the development of clinical guidelines (Calvert et al., 2013; Schulz et al.,
2010). As the GOSE is currently recommended as the core COA within multi-dimensional
outcome assessments in TBI (Hicks et al., 2013; Maas et al., 2017; Nelson, Ranson, Ferguson,
Giacino, Okonkwo, Valadka, Manley, McCrea, et al., 2017), further research into how it is used
is now warranted, and its associations with other outcome domains should also be ascertained.
46
CHAPTER 3
Multi-dimensional TBI outcomes: Research methodology
This chapter outlines the research methodology used in this thesis and provides an overview
of the measures used in the studies reported in Chapters 4, 5, and 6.
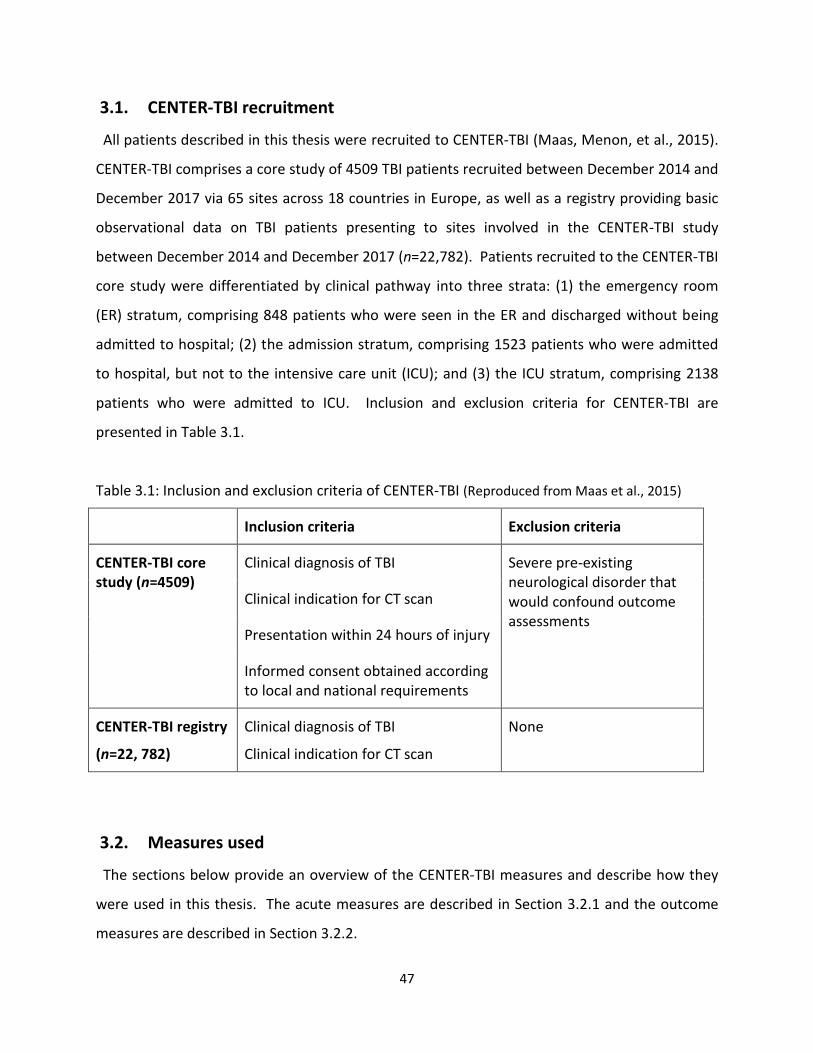
47
3.1. CENTER-TBI recruitment
All patients described in this thesis were recruited to CENTER-TBI (Maas, Menon, et al., 2015).
CENTER-TBI comprises a core study of 4509 TBI patients recruited between December 2014 and
December 2017 via 65 sites across 18 countries in Europe, as well as a registry providing basic
observational data on TBI patients presenting to sites involved in the CENTER-TBI study
between December 2014 and December 2017 (n=22,782). Patients recruited to the CENTER-TBI
core study were differentiated by clinical pathway into three strata: (1) the emergency room
(ER) stratum, comprising 848 patients who were seen in the ER and discharged without being
admitted to hospital; (2) the admission stratum, comprising 1523 patients who were admitted
to hospital, but not to the intensive care unit (ICU); and (3) the ICU stratum, comprising 2138
patients who were admitted to ICU. Inclusion and exclusion criteria for CENTER-TBI are
presented in Table 3.1.
Table 3.1: Inclusion and exclusion criteria of CENTER-TBI (Reproduced from Maas et al., 2015)
Inclusion criteria Exclusion criteria
CENTER-TBI core study (n=4509)
Clinical diagnosis of TBI Severe pre-existing neurological disorder that would confound outcome assessments
Clinical indication for CT scan
Presentation within 24 hours of injury
Informed consent obtained according to local and national requirements
CENTER-TBI registry
(n=22, 782)
Clinical diagnosis of TBI
Clinical indication for CT scan
None
3.2. Measures used
The sections below provide an overview of the CENTER-TBI measures and describe how they
were used in this thesis. The acute measures are described in Section 3.2.1 and the outcome
measures are described in Section 3.2.2.

48
3.2.1. Acute measures
Acute measures used in this thesis included the American Society of Anaesthesiologists’ (ASA)
classification of Physical Health (Dripps, 1963), Glasgow Coma Scale (GCS) (Teasdale & Jennett,
1974), CT abnormality, and Abbreviated Injury Scale (AIS) and Injury Severity Score (ISS) (Baker,
O'Neill, Haddon, & Long, 1974a). These measures were collected by medical staff in the 65
acute hospitals involved in patient recruitment for CENTER-TBI. The measures are described
below.
American Society of Anaesthesiologists’ (ASA) classification of Physical Health
Pre-injury physical health status was assessed using the ASA classification of Physical Health,
which categorises physical health according to severity of systemic disease (Dripps, 1963). ASA
Physical Health classifications are as follows: a normal healthy patient; a patient with mild
systemic disease (mild disease with no substantive functional limitation, e.g., treated
hypertension); a patient with severe systemic disease (substantive functional limitations a
result of disease, e.g., poorly treated diabetes, morbid obesity); a patient with a severe
systemic disease that is a constant threat to life (functional limitation from severe life-
threatening disease, e.g., ongoing cardiac ischemia) (American Society of Anesthesiologists,
2014; Dripps, 1963).
Glasgow Coma Scale (GCS)
TBI severity was classified using the GCS (Teasdale & Jennett, 1974). The GCS has three
components: eye opening, best verbal response, and best motor response. Each component is
assessed using a standardised approach and GCS total scores range from 3 to 15.
Conventionally, GCS scores of 3-8 are classified as severe TBI, scores of 9-12 are classified as
moderate TBI, and scores of 13-15 are classified as mild TBI (Teasdale et al., 2014; Teasdale,
Murray, Parker, & Jennett, 1979). This thesis used baseline GCS scores which were calculated
centrally by a review panel for use by CENTER-TBI investigators. The baseline GCS scores were
derived using the International Mission for Prognosis And Clinical Trial (IMPACT) approach to
combining scores at different time periods (Marmarou et al., 2007).
49
CT Abnormality
CT abnormality was analysed by Icometrix (Icometrix, 2019) and assessed by a central review
panel according to the NINDS CDEs (Duhaime et al., 2010). In this thesis, CT abnormality
indicates whether any of the following CDEs were present: mass lesion, epidural hematoma,
subdural hematoma (acute), subdural hematoma (sub-acute/chronic), subdural collection
mixed density, contusion, traumatic axonal injury, subarachnoid haemorrhage, intraventricular
haemorrhage, midline shift or cisternal compression.
Abbreviated Injury Scale (AIS) and Injury Severity Score (ISS)
The AIS was used to quantify the overall severity of injury in multiple body areas, including the
head/neck, face, chest, abdomen, extremities, and external regions, while the overall severity
of anatomical injuries was measured using the ISS (Baker, O'Neill, Haddon, & Long, 1974). AIS
scores for each body region range from 0 (no injury); 1 (minor: no treatment needed); 2
(moderate: requires only outpatient treatment); 3 (serious: requires non-ICU hospital
admission); 4 (severe: requires ICU observation and/or basic treatment); 5 (critical: requires
intubation, mechanical ventilation or vasopressors for blood pressure support); to 6
(unsurvivable). The ISS ranges from 0 to 75 and the total ISS is computed by taking the three
most severely injured body regions, squaring their AIS scores, and adding them together. Total
ISS scores >7 are indicative of severe injury and total ISS scores >15 are indicative of major
trauma (Palmer, 2007).
This thesis distinguished between injuries to the head/neck/cervical spine and injuries to other
body regions. Firstly, AIS scores were used to describe the severity of head injury (composite
AIS scores were calculated by combining AIS scores for the head/neck, brain, and cervical spine
regions). Secondly, total ISS scores for extracranial injuries were calculated using the three
worst AIS scores for peripheral body regions and excluding the head/neck/cervical spine
regions. Thirdly, total ISS scores were used to describe overall injury severity.
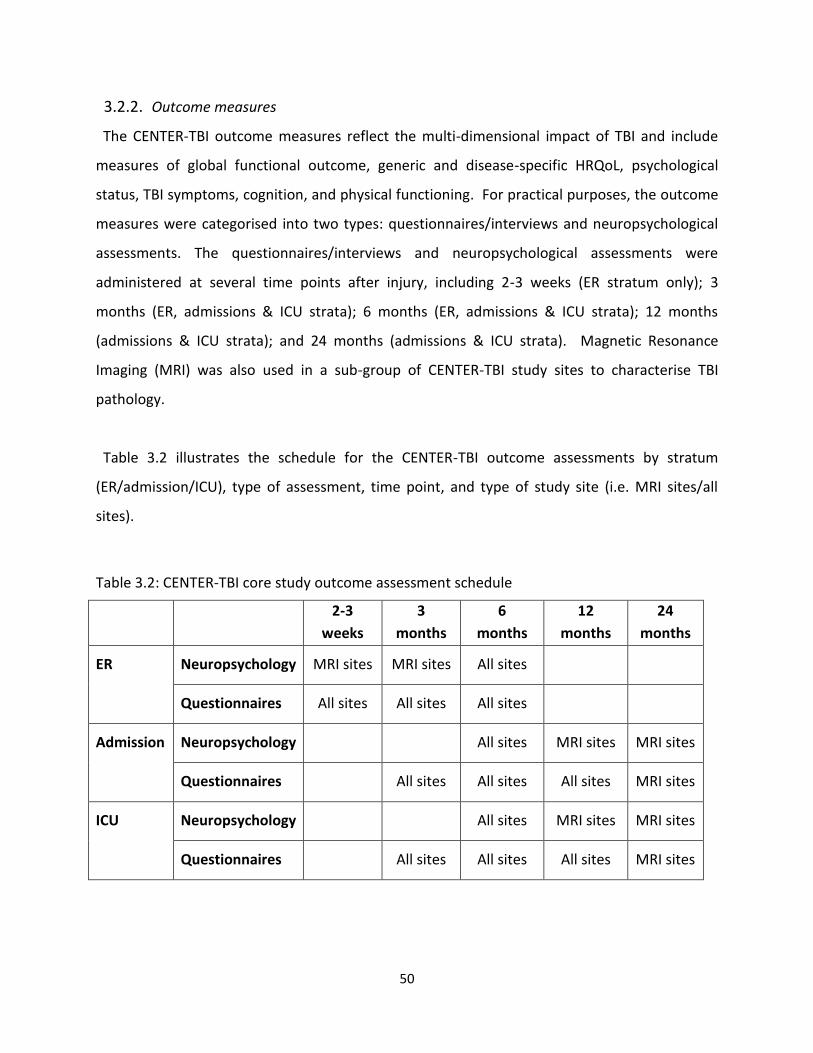
50
3.2.2. Outcome measures
The CENTER-TBI outcome measures reflect the multi-dimensional impact of TBI and include
measures of global functional outcome, generic and disease-specific HRQoL, psychological
status, TBI symptoms, cognition, and physical functioning. For practical purposes, the outcome
measures were categorised into two types: questionnaires/interviews and neuropsychological
assessments. The questionnaires/interviews and neuropsychological assessments were
administered at several time points after injury, including 2-3 weeks (ER stratum only); 3
months (ER, admissions & ICU strata); 6 months (ER, admissions & ICU strata); 12 months
(admissions & ICU strata); and 24 months (admissions & ICU strata). Magnetic Resonance
Imaging (MRI) was also used in a sub-group of CENTER-TBI study sites to characterise TBI
pathology.
Table 3.2 illustrates the schedule for the CENTER-TBI outcome assessments by stratum
(ER/admission/ICU), type of assessment, time point, and type of study site (i.e. MRI sites/all
sites).
Table 3.2: CENTER-TBI core study outcome assessment schedule
2-3
weeks
3
months
6
months
12
months
24
months
ER Neuropsychology MRI sites MRI sites All sites
Questionnaires All sites All sites All sites
Admission Neuropsychology All sites MRI sites MRI sites
Questionnaires All sites All sites All sites MRI sites
ICU Neuropsychology All sites MRI sites MRI sites
Questionnaires All sites All sites All sites MRI sites
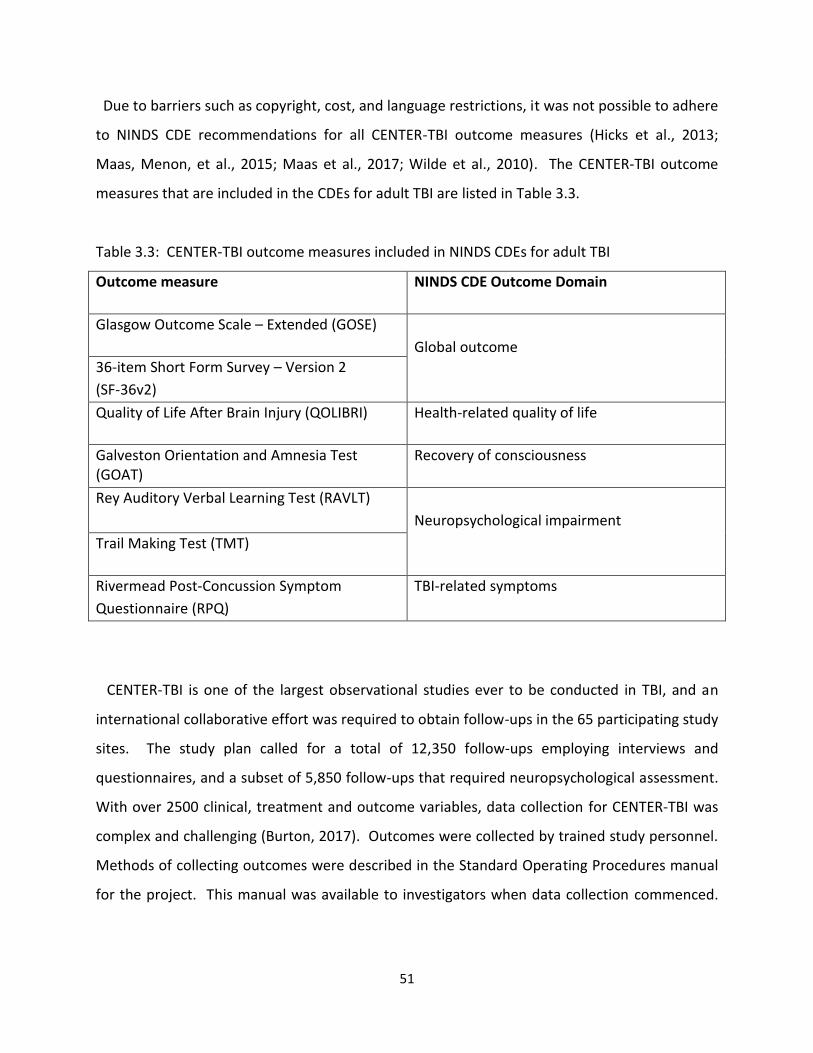
51
Due to barriers such as copyright, cost, and language restrictions, it was not possible to adhere
to NINDS CDE recommendations for all CENTER-TBI outcome measures (Hicks et al., 2013;
Maas, Menon, et al., 2015; Maas et al., 2017; Wilde et al., 2010). The CENTER-TBI outcome
measures that are included in the CDEs for adult TBI are listed in Table 3.3.
Table 3.3: CENTER-TBI outcome measures included in NINDS CDEs for adult TBI
Outcome measure NINDS CDE Outcome Domain
Glasgow Outcome Scale – Extended (GOSE)
Global outcome
36-item Short Form Survey – Version 2
(SF-36v2)
Quality of Life After Brain Injury (QOLIBRI) Health-related quality of life
Galveston Orientation and Amnesia Test (GOAT)
Recovery of consciousness
Rey Auditory Verbal Learning Test (RAVLT)
Neuropsychological impairment
Trail Making Test (TMT)
Rivermead Post-Concussion Symptom
Questionnaire (RPQ)
TBI-related symptoms
CENTER-TBI is one of the largest observational studies ever to be conducted in TBI, and an
international collaborative effort was required to obtain follow-ups in the 65 participating study
sites. The study plan called for a total of 12,350 follow-ups employing interviews and
questionnaires, and a subset of 5,850 follow-ups that required neuropsychological assessment.
With over 2500 clinical, treatment and outcome variables, data collection for CENTER-TBI was
complex and challenging (Burton, 2017). Outcomes were collected by trained study personnel.
Methods of collecting outcomes were described in the Standard Operating Procedures manual
for the project. This manual was available to investigators when data collection commenced.
52
The author of this thesis was responsible for obtaining follow-ups for patients recruited via NHS
Lothian.
The CENTER-TBI outcome measures included in this thesis are summarised below with
descriptions of how they were scored and used. The outcome measures are organised
according to the CDE outcome domains (Wilde et al., 2010). All CENTER-TBI outcome measures
are validated for use in research, but not all of them have been validated in the context of adult
TBI.
Global outcome
Glasgow Outcome Scale - Extended (GOSE) structured interview and questionnaire
Description
The GOSE is used to measure of global functional outcome following TBI. It can be completed
as a structured interview (Wilson et al., 1998) or as a self-completion questionnaire (Wilson et
al., 2002).
The GOSE structured interview uses a standardised interview format to enable the assessor to
objectively assign patients to the outcome category that reflects their current functional status
(Wilson et al., 1998). Outcome is assigned according to: the individual's current level of
independence in activities of daily living both inside and outside the home (i.e., cooking,
dressing, shopping, travelling); their ability to participate in major life roles such as work, social
and leisure activities, and relationships with family and friend; and whether they have returned
to ‘normal’ life (i.e., their previous level of functioning). The GOSE structured interview can be
completed face-to-face or via telephone and can be completed with the patient and/or a proxy
informant such as a relative or caregiver. It is designed to be administered and scored by a
researcher or clinician, and the interviewer can exercise their professional judgement, where
appropriate (Wilson et al., 1998). The inter-rater and test-retest reliability for the GOSE
structured interview is high (Weighted Kappa (w) ranges from 0.72 to 0.92) (Pettigrew et al.,
2003; Wilson et al., 1998; Wilson et al., 2007). Furthermore, the GOSE structured interview has
53
substantial correlations with measures of post-traumatic amnesia (rho = -0.52), disability (rho =
-0.89), HRQoL (rho = 0.47 - 0.71), depression (rho = -0.64), general health (rho = -0.59), and
reported head-injury symptoms and problems (rho = 0.37 to 0.69), and modest correlations
with neurocognitive tests (rho = -0.19 to 0.42) (Wilson et al., 2000).
The GOSE postal questionnaire is an alternative method of collecting information about global
functional outcome, which can be used on its own, or in conjunction with telephone or face-to-
face contact (Wilson et al., 2002). It can be completed by the TBI patient and/or a proxy
informant. It can also be completed via post or on-line, providing a means of easily and
inexpensively obtaining information about outcome instead of, or in addition to, telephone or
face-to-face contact. The GOSE questionnaire comprises 14 questions about the patient's
independence inside and outside the home, as well as their participation in major life roles, and
their return to ‘normal’ life. The test-retest reliability of the GOSE postal questionnaire is high
(w = 0.98) and it has high levels of agreement with the GOSE structured interview (w = 0.92)
(Wilson et al., 2002).
Scoring
The GOSE has eight outcome categories, ranging from worst (i.e., death) to best (i.e., upper
good recovery) (see Figure 3.1). Scores are determined by identifying the area of greatest
limitation, and by discounting pre-injury limitations. Scores can be assigned on the GOSE if
information is missing, although some judgement may be required and confidence in the rating
may decrease if items are not completed. The GOSE structured interview is usually rated by the
interviewer, but it can also be scored centrally using an algorithm (Wilson et al., 1998; Wilson et
al., 2007). The GOSE questionnaire can be rated using the criteria from the GOSE structured
interview as a guideline, or it can be scored electronically using an algorithm (Wilson et al.,
2002). The categories ‘vegetative state’ and ‘lower severe disability’ are collapsed when the
GOSE questionnaire is scored, because the self-completion form does not distinguish between
patients in these categories.
54
For CENTER-TBI, it was possible to complete the GOSE as a structured interview or
questionnaire, although priority was given to the GOSE structured interview (Maas, Menon, et
al., 2015). A pragmatic approach to data collection was used and the GOSE could be completed
face-to-face, via telephone, or via post, either with the patient alone, with a proxy informant
alone, or with the patient and a proxy together (Maas, Menon, et al., 2015). Decisions about
mode of data collection were made locally on a patient-by-patient basis and were influenced by
factors such as TBI severity, the patient’s ability to self-report, the patient’s availability for face-
to-face follow-up visits, and logistic considerations (e.g., travel time). CENTER-TBI investigators
were encouraged to complete both versions of the GOSE, if possible. The flexible approach to
data collection was employed as a means of ensuring good follow-up rates for the study and to
allow comparisons to be made between different GOSE approaches.
Composite GOSE scores were calculated centrally for the CENTER-TBI study as part of the data
curation process (Wilson & Horton, 2018). The composite GOSE scores were created using the
information available to maximise follow up rates. The categories of ‘vegetative state’ and
‘lower severe disability’ were collapsed when creating composite ratings and available
information was used in the following order of precedence:
1. Central scoring of GOSE structured interview completed by investigators
2. Central scoring of respondent-completed GOSE questionnaires
3. Interviewer ratings for survivors when neither the GOSE structured interview or GOSE
questionnaire was completed
Use in this thesis
Study 1 used the GOSE interview and GOSE questionnaire. Possible outcomes for this study
ranged from ‘vegetative state’ to ‘upper good recovery.’ GOSE interviews were rated locally by
trained interviewers in accordance with published guidelines (Wilson et al., 1998). The GOSE
questionnaire was scored in two ways. Firstly, it was scored using the standard algorithm
developed by Wilson and colleagues (Wilson et al., 2002). Secondly, it was scored using a
revised algorithm (described in Chapter 4). Study 2 also used the GOSE structured interview
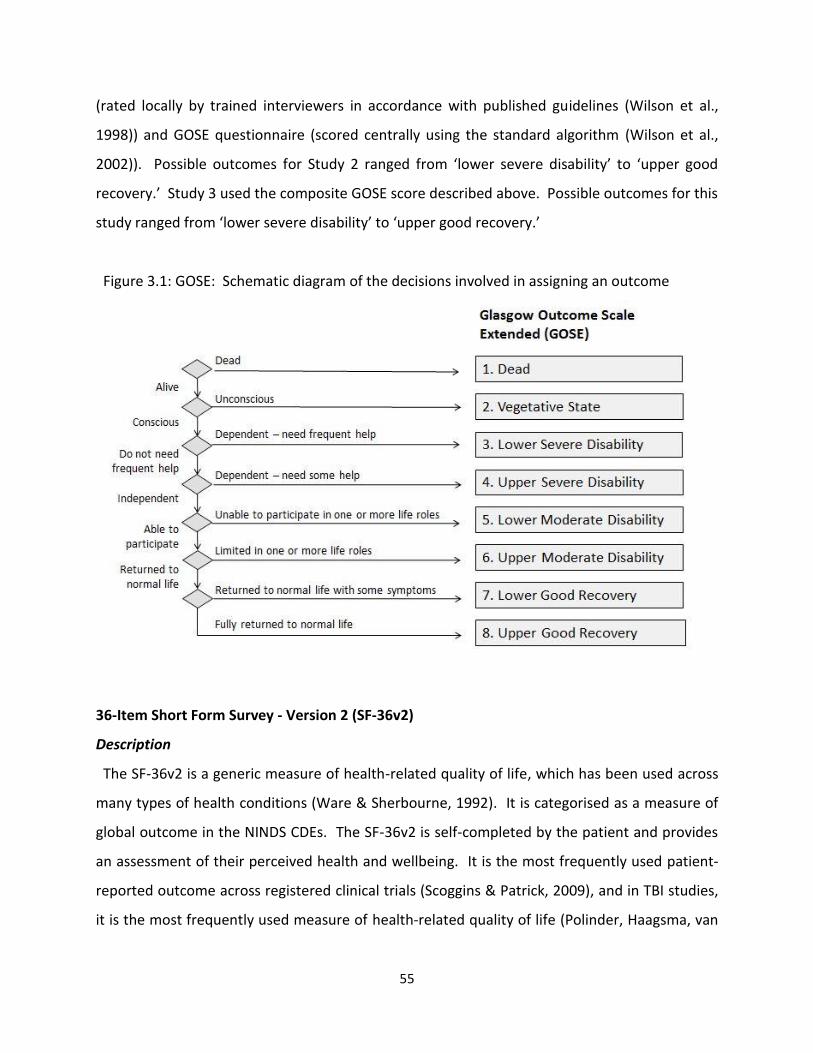
55
(rated locally by trained interviewers in accordance with published guidelines (Wilson et al.,
1998)) and GOSE questionnaire (scored centrally using the standard algorithm (Wilson et al.,
2002)). Possible outcomes for Study 2 ranged from ‘lower severe disability’ to ‘upper good
recovery.’ Study 3 used the composite GOSE score described above. Possible outcomes for this
study ranged from ‘lower severe disability’ to ‘upper good recovery.’
Figure 3.1: GOSE: Schematic diagram of the decisions involved in assigning an outcome
36-Item Short Form Survey - Version 2 (SF-36v2)
Description
The SF-36v2 is a generic measure of health-related quality of life, which has been used across
many types of health conditions (Ware & Sherbourne, 1992). It is categorised as a measure of
global outcome in the NINDS CDEs. The SF-36v2 is self-completed by the patient and provides
an assessment of their perceived health and wellbeing. It is the most frequently used patient-
reported outcome across registered clinical trials (Scoggins & Patrick, 2009), and in TBI studies,
it is the most frequently used measure of health-related quality of life (Polinder, Haagsma, van
56
Klaveren, Steyerberg, & van Beeck, 2015). The SF-36 has a 4-week reference period. It
comprises eight domains, including Physical Functioning, Role Limitations-Physical, Bodily Pain,
General Health, Vitality, Social Functioning, Role Limitations-Emotional, and Mental Health.
HRQoL can be summarised by computing a physical component summary (PCS) score and
mental component summary (MCS) score. The SF-36v2 has high levels of internal consistency
in TBI (Cronbach’s alpha (α) = 0.79 to 0.93) (Findler, Cantor, Haddad, Gordon, & Ashman, 2001;
MacKenzie et al., 2002; von Steinbüchel et al., 2016). Furthermore, the physical health sub-
scales have been found to correlate highly with the PCS score (r = 0.55 to 0.83) while the
mental health sub-scales correlate highly with the MCS score (r = 0.68 to 0.89) (MacKenzie et
al., 2002).
Scoring
The SF-36v2 was scored using Optum Software and norm-based scoring algorithms. Each
health domain and summary component measure has a mean score of 50 and a standard
deviation of 10. The minimum score for the PCS and MCS is 2 and the maximum score is 74.
Higher scores indicate better health-related quality of life. The Full Missing Score Estimation
(MSE) method was used to deal with missing data.
Use in this thesis
The SF-36v2 was used in Studies 2 and 3 to measure patient-reported HRQoL.
Health-related quality of life (HRQoL)
Quality of Life after Brain Injury Scale (QOLIBRI) and QOLIBRI Overall Scale (QOLIBRI-OS)
Description
The QOLIBRI is a TBI-specific measure of HRQoL (von Steinbüchel, Wilson, Gibbons,
Hawthorne, Hofer, Schmidt, Bullinger, Maas, Neugebauer, Powell, von Wild, Zitnay, Bakx,
Christensen, Koskinen, Sarajuuri, et al., 2010). It was developed to tap into the quality of life
domains important to TBI patients, as existing generic HRQoL measures, such as the SF-36, are
not designed to address condition-specific issues. The QOLIBRI is completed by the patient via
57
self-rating. It comprises 37 items and has 6 domains, including four 'satisfaction' scales (i.e.,
cognition, self, daily life and autonomy, and social relationships), and two 'bothered' scales (i.e.,
emotions and physical problems). The QOLIBRI has a 1-week reference period. Thus,
respondents must be able to recall how they have been feeling over the week preceding
assessment. The internal consistency of the QOLIBRI ranges from 0.75 ('physical problems') to
0.89 ('cognition' and 'self') (total score = 0.95) and the test-retest reliability ranges from 0.78
('emotions') to 0.85 (‘physical problems’) (total score = 0.91). All sub-scales correlate with the
GOSE (0.19 – 0.42), Hospital Anxiety and Depression Scale (HADS) anxiety sub-scale (-0.59),
HADS Depression Scale -0.67), SF-36 PCS (0.63), and SF-36 MCS (0.61), and the QOLIBRI total
score is associated more strongly with the SF-36 MCS (0.61) than the SF-36 PCS (0.49) (von
Steinbüchel, Wilson, Gibbons, Hawthorne, Hofer, Schmidt, Bullinger, Maas, Neugebauer,
Powell, von Wild, Zitnay, Bakx, Christensen, Koskinen, Formisano, et al., 2010).
The QOLIBRI-OS (von Steinbüchel et al., 2012) is the short version of the QOLIBRI comprising 6
items that cover the following domains: physical condition, cognition, emotions, daily life and
autonomy, personal and social life, and current situation and future prospects. It also has a 1-
week reference period. The QOLIBRI-OS has high levels of internal consistency (α = 0.86) and
test-retest reliability (0.81). Furthermore, it correlates strongly with the QOLIBRI total score (r =
0.87), and with the GOSE, SF-36 and HADS (r=0.54 to -0.76) (von Steinbüchel et al., 2012).
Scoring
Responses for the QOLIBRI and QOLIBRI-OS are recorded on a 5-point Likert-type scale ranging
from ‘not at all’ to ‘very’ and then summed and converted to total scores that range from 0 to
100. Higher scores on the ‘satisfaction’ scale indicate better HRQoL, while higher scores on the
‘bothered’ scale are indicative of poorer HRQoL. The QOLIBRI has recently been mapped
against the normative scoring criteria for the SF-36 to aid in the interpretation of QOLIBRI
scores: QOLIBRI total scores below 60 are considered to be representative of impaired HRQoL
(Wilson et al., 2017). In CENTER-TBI, prorating was used if up to one third of items were
missing on the QOLIBRI and QOLIBRI-OS.
58
Use in this thesis
The QOLIBRI and QOLIBRI-OS were used in Studies 2 and 3 to measure TBI-specific, patient-
reported HRQoL.
Psychological status
Post-Traumatic Stress Disorder Checklist-5 (PCL-5)
Description
The PCL-5 is a self-report inventory for measuring the severity of post-traumatic stress
disorder (PTSD) symptoms (Weathers et al., 2013). The earlier version of the inventory, the PCL
(Weathers, Litz, Herman, Huska, & Keane, 1993), is one of the most widely used instruments for
measuring self-reported PTSD symptoms. The PCL-5 was developed in 2013 to reflect the
revised diagnostic criteria for PTSD in the Diagnostic and Statistical Manual of Mental Disorders
Fifth Edition (DSM-5). It comprises 20 items and 4 sub-scales which relate to clusters B-E in the
DSM-5: intrusion (5 items), avoidance (2 items), negative alterations in cognition and mood (7
items), and alterations in arousal and reactivity (6 items). The PCL-5 has a 1-month reference
period and responses relate to a specific stressful event (i.e., the event which caused the TBI).
The PCL-5 has been shown to have high levels of test-retest reliability (r = 0.82) and internal
consistency (α = 0.94), and is strongly associated with other measures of PTSD symptoms (r =
0.84 to 0.85) and measures of anxiety and depression (r = 0.40 to 0.60), when used with
trauma-exposed college students (Blevins, Weathers, Davis, Witte, & Domino, 2015).
Scoring
Responses for each item are recorded on a 5-point Likert-type scale and include: ‘not at all,’ ‘a
little bit,’ ‘moderately,’ ‘quite a bit,’ and ‘extremely.’ Total symptom severity scores range from
0 to 80, and higher scores reflect greater severity. Severity scores can also be calculated for
each symptom cluster. Items rated as ‘moderately’ or higher are used to make provisional
PTSD diagnoses. Cut-off scores have been generated for the PCL-5 relative to the DSM-5
diagnostic criteria for PTSD: a score of 33 has been found to be optimally efficient for detecting
PTSD (Wortmann et al., 2016). In CENTER-TBI, PCL-5 scores were valid if up to 5 items were
59
missing. Consistent with the four DSM-5 symptom clusters for PTSD, no more than 1 missing
item was permitted in items 1-5; zero missing items were permitted in items 6-7; no more than
2 missing items were permitted in items 8-14; and no more than 2 missing items were
permitted in items 15-20.
Use in this thesis
The PCL-5 was used in Studies 2 and 3 as a self-reported measure of the severity of PTSD
symptoms in TBI patients.
Patient Health Questionnaire-9 (PHQ-9)
Description
The PHQ-9 is a self-report instrument for measuring depression severity in clinical settings
(Kroenke, Spitzer, & Williams, 2001). It is unidimensional and comprises 9 items which relate to
each of the DSM-5 diagnostic criteria for clinical depression. It has a 2-week reference period
and responses are recorded on a 4-point Likert-type scale. Respondents are required to
indicate how often they have been bothered by each of the 9 listed problems. If any item is
endorsed, respondents are also required to indicate how difficult the problem(s) have made it
for them to work, perform activities of daily living, and get on with others. Scores for each item
range from 0 (not at all), 1 (several days), 2 (more than half the days), to 3 (nearly every day).
The internal consistency of the PHQ-9 has been found to be high in primary care settings
(α=0.86) (Kroenke et al., 2001). Furthermore, when used with TBI patients, the PHQ-9 has good
test-retest reliability (r = 0.76 & =0.46) and correlates strongly with other measures of
depression (r = 0.78-0.90), functional limitation (r = 0.59), and perceived general health (r =
0.40) (Fann et al., 2005).
Scoring
Total scores range from 0 to 27 and higher scores are indicative of greater depression severity.
Scores on the PHQ-9 can be interpreted in a variety of ways. Cut-off points have been
recommended for mild (5-9), moderate (10-14), moderately severe (15-19), and severe
60
depression (20-27) (Kroenke & Spitzer, 2002). In CENTER-TBI, the PHQ-9 was scored if up to
one third of items were missing. Missing values were substituted with the mean score of non-
missing items and total scores were rounded to an integer.
Use in this thesis
The PHQ-9 was used in Studies 2 and 3 as a self-reported measure of the severity of
depression symptoms in TBI patients.
Generalized Anxiety Disorder-7 (GAD-7)
Description
The GAD-7 is a self-report instrument for measuring the severity of generalized anxiety
symptoms in clinical settings (Spitzer, Kroenke, Williams, & Lowe, 2006). It is unidimensional
and comprises 7-items which relate to the DSM-5 diagnostic criteria for generalised anxiety
disorder. Respondents indicate how often they have been bothered by each symptom during
the last 2-weeks and responses are recorded on a 4-point Likert-type scale ranging from 0 (not
at all), 1 (several days), 2 (more than half the days), to 3 (nearly every day). If any item is
endorsed, respondents are also required to indicate on a 4-point scale how difficult the
problem(s) have made their work, activities of daily living, and relationships with others. The
GAD-7 has high test-retest reliability (intraclass correlation = 0.83) and internal consistency (α=
0.92), and increasing anxiety scores are strongly associated with functional limitations and
reduced HRQoL (Spitzer et al., 2006).
Scoring
Total scores range from 0 to 21, with higher scores indicating greater symptom severity. The
cut-off for diagnosing generalized anxiety disorder in clinical populations is 10, and cut-off
points of 5, 10 and 15 can be interpreted as indicative of mild, moderate, and severe levels of
anxiety in clinical and general populations (Lowe et al., 2008; Spitzer et al., 2006). In CENTER-
TBI, the GAD-7 was scored if up to one third of items were missing. Missing values were
61
substituted with the mean score of non-missing items and total scores were rounded to an
integer.
Use in this thesis
The GAD-7 was used in Studies 2 and 3 as a self-reported measure of the severity of anxiety
symptoms in TBI patients.
TBI symptoms
Rivermead Post-concussion Questionnaire (RPQ)
Description
The RPQ is a self-report instrument which was originally developed for measuring the severity
of 16 post-concussion symptoms following mild or moderate TBI, including headaches,
dizziness, nausea/vomiting, noise sensitivity, sleep disturbance, fatigue, irritability, feeling
depressed/tearful, feeling frustrated/impatient, forgetfulness, poor concentration, taking
longer to think, blurred vision, light sensitivity, double vision, and restlessness (King, Crawford,
Wenden, Moss, & Wade, 1995). Respondents are required to indicate the extent to which each
of the 16 symptoms has been experienced in the last 7 days, and to consider whether each
symptom is more of a problem since their head injury. The RPQ also includes 2 blank spaces for
respondents to report any other difficulties they are currently experiencing. The inter-rater and
test re-test reliability of the RPQ is high (r= 0.72 to 0.91) and total scores correlate strongly with
measures of social and functional outcome (0.62 to 0.83) (Eyres, Carey, Gilworth, Neumann, &
Tennant, 2005; King et al., 1995).
Scoring
Responses are recorded using a 5-point Likert-type scale ranging from 0 (not experienced at
all), 1 (no more of a problem), 2 (a mild problem), 3 (a moderate problem), to 4 (a severe
problem). There is no established cut-off point for differentiating favourable and unfavourable
outcomes on the RPQ. However, a threshold of at least 3 symptoms rated as a moderate or
severe problem has previously been defined as being indicative of the presence of post-
62
concussion symptoms (Sterr, Herron, Hayward, & Montaldi, 2006). In the CENTER-TBI study,
the RPQ total scores were calculated using prorating if up to one third of items were missing.
Use in this thesis
The RPQ was used in Studies 2 and 3 as a self-reported measure of the severity of post-
concussion symptoms following TBI.
Recovery of consciousness
Galveston Orientation and Amnesia Test (GOAT)
Description
The GOAT (Levin, O'Donnell, & Grossman, 1979) is used to assess the extent to which a patient
is in post-traumatic amnesia (PTA) following brain injury. PTA is a state of altered
consciousness following TBI, characterised by confusion and amnesia (Marshman, Jakabek,
Hennessy, Quirk, & Guazzo, 2013). The GOAT comprises 10 questions and assesses orientation
for time, place, and person, as well as anterograde amnesia (the inability to recall events
occurring after the injury), and retrograde amnesia (the inability to recall events occurring
before the injury). The GOAT can be used as a screening test during the sub-acute phase after
TBI to determine whether the patient is sufficiently oriented to undergo formal cognitive
testing. The inter-rater reliability is high (0.99) and GOAT scores relate to measures of injury
severity such as GCS scores and CT scans (Levin et al., 1979).
Scoring
GOAT scores are calculated by awarding error points for each incorrect response and
subtracting the number of error points from 100. The total error score ranges from 0 to 108:
therefore, total GOAT scores can range from -8 to 100. Higher scores indicate the absence of
PTA, whereas lower scores reflect disorientation and amnesia. Scores between 66 and 75 are
considered to be 'borderline abnormal', while scores of 75 of more indicate that the patient is
no longer in PTA (Levin et al., 1979; Lezak, 2012). If items were missing from the GOAT in the
CENTER-TBI study database, total scores were not calculated.
63
Use in this thesis
The GOAT was used in the CENTER-TBI study to screen for PTA and to assess whether cognitive
testing was appropriate. It was included in Study 2 as a measure of PTA.
Neuropsychological impairment
Rey Auditory Verbal Learning Test (RAVLT)
Description
The RAVLT is used to measure verbal memory and learning (Schmidt, 1996). It comprises a
total of seven trials, during which participants are asked to recall concrete nouns from two 15-
word lists (List A and List B), which are spoken aloud by the assessor. During the acquisition
phase, participants are presented with the words from List A five times. Immediately after each
trial, the participant is instructed to repeat as many words as they can, in any order, whether or
not they have said the same words in previous trials. The fifth trial is immediately followed by a
sixth trial comprising a single auditory presentation of a 15-word interference list (List B). The
participant is required to repeat as many words as they can from the interference list, in any
order, before being asked to recall as many words as they can remember from List A, without
hearing it again. The seventh and final trial is presented after a 20-minute delay and requires
the participant to recall as many words as they can from the list they heard several times. The
RAVLT has adequate test-retest reliability (r ~ 0.60 to 0.70), high levels of internal consistency
(α = 0.90), and it correlates moderately with other measures of learning and memory (Strauss,
Sherman, & Spreen, 2006). It has also been found to be sensitive to neuropsychological
impairment in a range of conditions, including closed head injury in adults (Strauss et al., 2006).
Scoring
Performance on the RAVLT is scored by recording the number of words the participant correctly
recalls for each trial. Two RAVLT summary scores were used in this thesis: (1) Total score (sum
of words recalled across 5 trials), (2) 20-minute delay (number of words recalled after 20-
minute delay). Normative data exist to aid the interpretation of RAVLT scores for individuals
aged 16 to 89 years old (Schmidt, 1996). It is Important to note that performance on the RAVLT
64
declines with advancing age. However, norms for adults ages 16 to 89 range from 53.9 (6.7) to
37.1 (7.5) for the RAVLT total score, and 11.7 (2.2) to 7.0 (2.4) for the RAVLT 20-minute delay.
Use in this thesis
The RAVLT was used in Studies 2 and 3 as a measure of verbal memory and learning.
Trail Making Test (TMT) Parts A & B
Description
The TMT measures scanning and visuo-motor tracking, divided attention, and cognitive
flexibility (Strauss et al., 2006). Part A comprises 25 consecutively numbered circles distributed
randomly on a page: the participant is required to connect the numbers sequentially with lines
without lifting the pencil from the paper. Part B is more demanding and comprises
consecutively numbered (1-13) and lettered (A-L) circles distributed randomly on a page: the
participant is required to draw lines between alternate numbers and letters in sequential order.
The participant is instructed to draw the lines as quickly and accurately as possible and their
performance on both parts of the test is timed. The TMT has been shown to have adequate
test-retest reliability (r = 0.66 to 0.94) when used with neurological groups and correlates
moderately with other neuropsychological measures. The TMT is sensitive to cognitive
impairment in TBI and completion times have been found to increase with greater injury
severity (Strauss et al., 2006).
Scoring
Scoring is based on the time taken to complete each part of the test. If the participant makes
an error, the assessor draws their attention to it and instructs them to correct the error as
quickly as possible without stopping the timer. Performance is usually slower during Part B
because it requires greater executive control and demands upon working memory. Part A is
discontinued at 100 seconds and Part B is discontinued at 300 seconds.
65
Use in this thesis
The TMT was used in Studies 2 and 3 as a measure of scanning and visuo-motor tracking,
divided attention, and cognitive flexibility.
Cambridge Neuropsychological Test Automated Battery (CANTAB)
Description
CANTAB was developed in 1986 by neuroscientists at Cambridge University and comprises a
set of 25 computer-automated assessments of memory, attention and executive function
(Cambridge Cognition Ltd, 2014). The tests are administered by a clinician or researcher using
an automated touchscreen computer. Computer-based neuropsychological tests, such as the
CANTAB, provide a number of advantages over traditional pencil-and-paper based cognitive
assessments: CANTAB is user-friendly, requires little training, and is relatively quick and easy to
administer. Standardized instruction scripts are used to ensure consistency between
assessments. Data is collected automatically, resulting in increased scoring accuracy and
efficiency. The difficulty of the tests is graded to permit the assessment of a broad range of
cognitive abilities, and normative data is available for many of the tests to aid interpretation of
the scores. The tests also use non-verbal and culture-free stimuli, making CANTAB a good
choice for multicentre studies where more than one language is spoken (Levaux et al., 2007;
Parsons, 2016).
Use in this thesis
The CANTAB tests used in this thesis include 5-choice Reaction Time (RTI), Paired Associates
Learning (PAL), Attention Switching Task (AST), Spatial Working Memory (SWM), Rapid Visual
Information Processing (RVP), and Stockings of Cambridge (SOC) (outcome measures for the
tests are provided in Table 3.4). Normative data is available for all of the tests, apart from the
AST. The CANTAB has been used previously in the context of TBI. For example, in moderate-to-
severe TBI, changes in reaction time and performance on the PAL are associated with changes
in diffusion tensor imaging (Newcombe et al., 2016). Furthermore, measures of reaction time,
sustained attention, and episodic memory/ new learning have been found to be sensitive to
66
abnormalities in the cholinergic system (e.g., basal forebrain, bilateral hippocampal formation)
in patients with moderate-to-severe TBI (Salmond, Chatfield, Menon, Pickard, & Sahakian,
2005).
5-choice Reaction Time (RTI)
This test measures reaction and movement time. Five white circles are displayed on the
screen. The participant must press down the button on the press pad until they see a yellow
spot appearing inside one of the circles on the screen. When they see the yellow spot, they
must let go of the button and touch the screen where they saw the yellow spot as quickly as
they can. The button on the press pad must be pressed down at all times apart from when the
participant touches the screen where the yellow spot appeared.
Paired Associates Learning (PAL)
This test measures visual episodic memory and new learning. A set of boxes are displayed on
the screen: these boxes open and close in a random order to display one or more hidden
patterns. During each trial, once all of the boxes have opened, the patterns are displayed one
by one in the middle of the screen. The participant must then touch the box where they
originally saw each pattern. If they make an error, the boxes will re-open in a random order to
remind them where the patterns are located. The test is relatively easy at the start (one hidden
pattern) and gets progressively more difficult until there is a total of eight hidden patterns to
remember. Participants are given up to ten attempts at any stage of the test.
Attention Switching Task (AST)
This test measures cognitive flexibility and attention switching in accordance with changing
task goals. A series of arrows are displayed on the screen. Each arrow either points to the left
or the right or is located on the left or right side of the screen. Throughout the task, the arrows
may point in either direction and they may appear on either side of the screen. The participant
uses the left and right buttons on the press pad to respond to the direction or location of the
arrows. During the first stage, the instruction “which direction” is presented on the screen: the
67
participant is required to press the left button if the arrow points to the left and the right
button if the arrow points to the right (Rule 1). During the second stage, the instruction “which
side” appears on the screen: the participant is required to press the left button if the arrow is
located on the left side of the screen and the right button if it appears on the right side of the
screen (Rule 2). During the third stage, both instructions are presented on the screen in a
random order: here, the participant must pay attention to which rule is presented on-screen
before pressing the appropriate button on the press pad. Participants are instructed to
respond as quickly as possible while avoiding mistakes.
Spatial Working Memory (SWM)
This test measures the ability to retain and manipulate visuospatial information in working
memory. A series of coloured boxes are displayed on the screen. The participant is instructed
to search the box for hidden blue tokens. Using a process of elimination, the participant must
search the boxes one by one and enter the tokens in an empty ‘home’ space at the side of the
screen as they are retrieved. The test is relatively easy at the start with three boxes to search
and gets progressively more difficult until there are eight boxes to search. The likelihood of
search strategies becoming stereotyped is reduced by changing the colour and positioning of
the boxes throughout the test.
Rapid Visual Information Processing (RVP)
This test measures sustained visual attention. A series of numbers are presented in a white
box in the middle of the screen. The numbers are presented in a pseudo-random order, for
four minutes, at a rate of 100 numbers per minute. Participants are instructed to use the press
pad button to respond to three target sequences of numbers (i.e., 3-5-7, 2-4-6, and 4-6-8).
Participants must press the button after the third number in the target sequence has been
presented.
68
Stockings of Cambridge (SOC)
This test measures spatial planning. The screen is divided vertically into two displays of
coloured balls hanging in pockets. The participant must move the balls in the bottom display to
match the arrangement in the top display. The test starts relatively easy and gets progressively
more difficult until a minimum of 5 moves are required to solve each problem. The participant
is instructed to plan their moves in advance with the aim of solving each problem in the
minimum number of moves.
Physical function
10-Meter Walk Test and Timed Up & Go (TUG)
Description
The 10-meter walk is a test of mobility, in which the patient is required to walk between two
clearly marked points spaced 10-meters apart. The patient is timed walking 10-meters and the
procedure is repeated 3 times. The TUG is another test of mobility, in which the patient is
timed while they stand up from a seated position, walk to a marker on the floor 3 meters away,
turn around, and walk back to the chair and sit down (Podsiadlo & Richardson, 1991).
Scoring
For the 10-meter walk test, the time is recorded for the quickest trial of three. For the TUG,
the time taken to complete the test is recorded, and results are interpreted as follows; <10 =
normal mobility; <20 seconds = good mobility, can go out alone, mobile without a gait aid; <30
seconds problems with mobility, cannot go outside alone, requires a gait aid.
Use in this thesis
The 10-meter walk and TUG were used in Studies 2 and 3 as measures of physical mobility.
The key characteristics of the CANTAB sub-tests are outlined below and the sub-test outcome
measures used in Studies 2 and 3 are listed in Table 3.4.
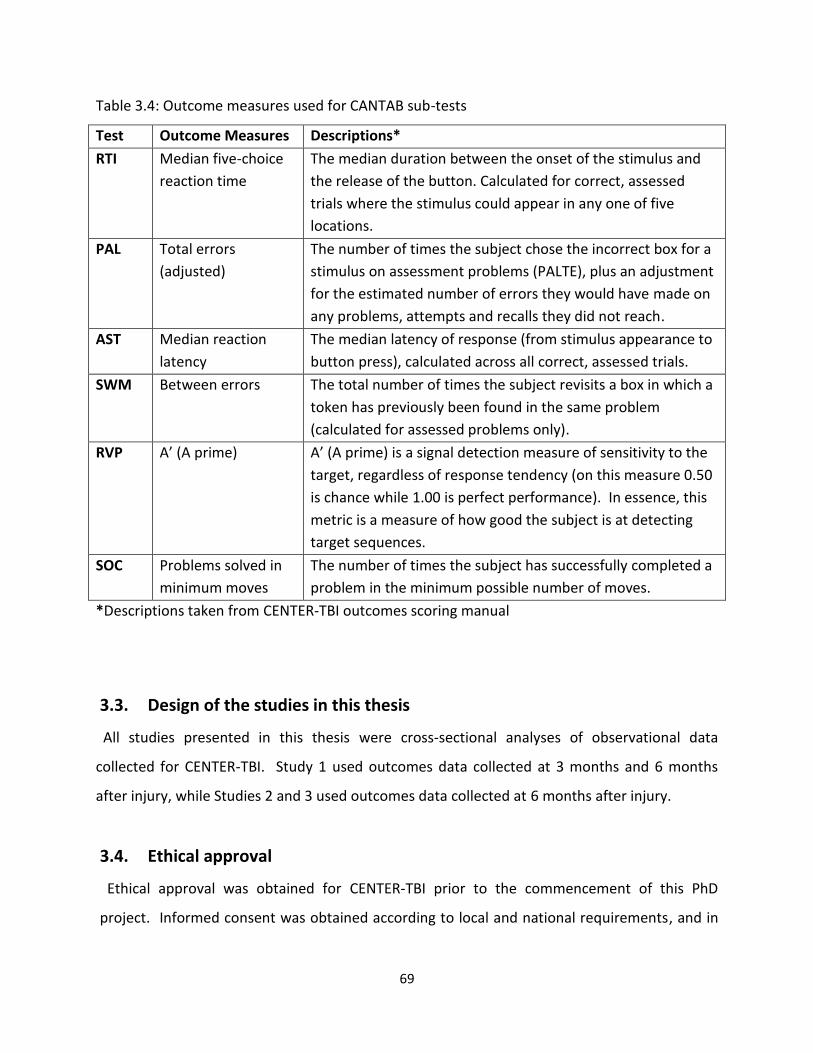
69
Table 3.4: Outcome measures used for CANTAB sub-tests
Test Outcome Measures Descriptions*
RTI Median five-choice
reaction time
The median duration between the onset of the stimulus and
the release of the button. Calculated for correct, assessed
trials where the stimulus could appear in any one of five
locations.
PAL Total errors
(adjusted)
The number of times the subject chose the incorrect box for a
stimulus on assessment problems (PALTE), plus an adjustment
for the estimated number of errors they would have made on
any problems, attempts and recalls they did not reach.
AST Median reaction
latency
The median latency of response (from stimulus appearance to
button press), calculated across all correct, assessed trials.
SWM Between errors
The total number of times the subject revisits a box in which a
token has previously been found in the same problem
(calculated for assessed problems only).
RVP A’ (A prime)
A’ (A prime) is a signal detection measure of sensitivity to the
target, regardless of response tendency (on this measure 0.50
is chance while 1.00 is perfect performance). In essence, this
metric is a measure of how good the subject is at detecting
target sequences.
SOC Problems solved in
minimum moves
The number of times the subject has successfully completed a
problem in the minimum possible number of moves.
*Descriptions taken from CENTER-TBI outcomes scoring manual
3.3. Design of the studies in this thesis
All studies presented in this thesis were cross-sectional analyses of observational data
collected for CENTER-TBI. Study 1 used outcomes data collected at 3 months and 6 months
after injury, while Studies 2 and 3 used outcomes data collected at 6 months after injury.
3.4. Ethical approval
Ethical approval was obtained for CENTER-TBI prior to the commencement of this PhD
project. Informed consent was obtained according to local and national requirements, and in
70
cases where the patient was unable to provide informed consent upon enrolment to the study,
a legally acceptable representative was identified (Maas, Menon, et al., 2015).
3.5. Data management
All local data for the CENTER-TBI core study were de-identified using Global Unique Personal
Identification (GUPI) labels before being entered on electronic case report forms (eCRFs)
managed by the QuesGen data management platform (QuesGen Systems Inc, 2016). INCF
(International Neuroinformatics Coordinating Facility, 2019) was responsible for data hosting
and created an informatics platform, Neurobot, to allow cleaned data to be stored and
downloaded for analysis. All CENTER-TBI core study data used in this thesis were downloaded
from the INCF Neurobot database (Version 1) on 8 November 2018 and saved in SPSS files.
3.6. Selection of study participants
3.6.1. Characteristics of the CENTER-TBI study sample
The demographic and clinical characteristics of the 4509 patients enrolled in the CENTER-TBI
core study are presented in Tables 3.5 and 3.6.
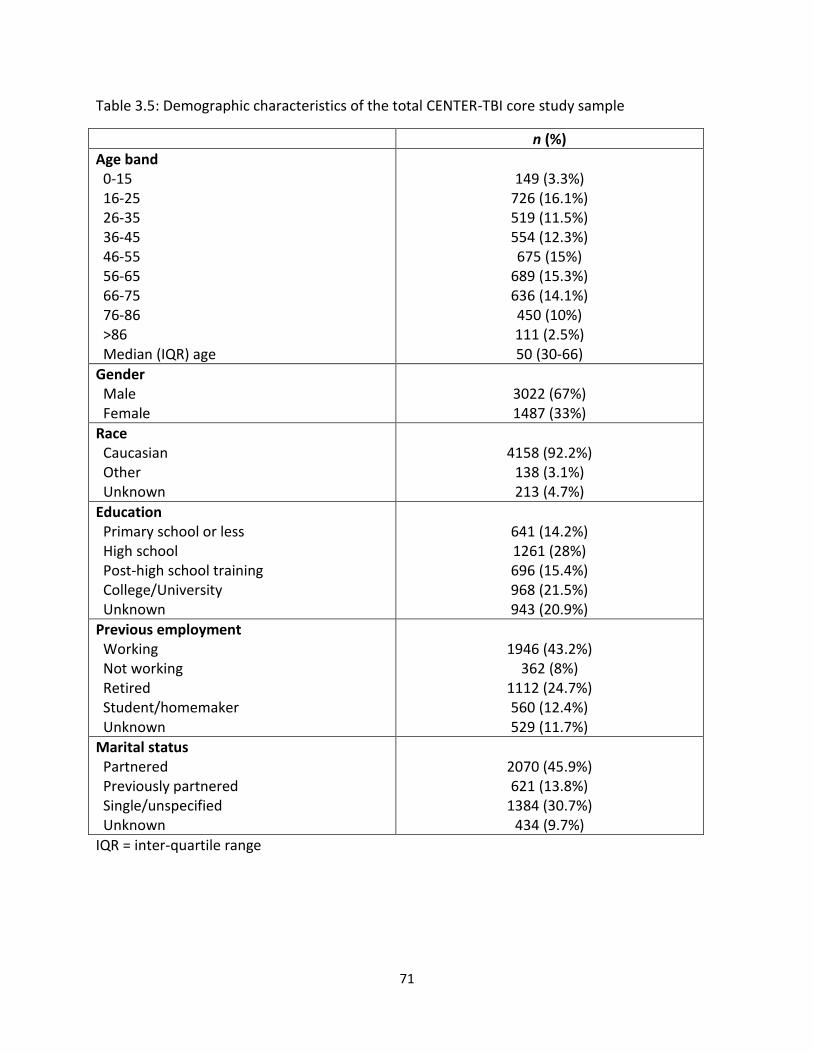
71
Table 3.5: Demographic characteristics of the total CENTER-TBI core study sample
n (%)
Age band 0-15 16-25 26-35 36-45 46-55 56-65 66-75 76-86 >86 Median (IQR) age
149 (3.3%)
726 (16.1%) 519 (11.5%) 554 (12.3%) 675 (15%)
689 (15.3%) 636 (14.1%) 450 (10%) 111 (2.5%) 50 (30-66)
Gender Male Female
3022 (67%) 1487 (33%)
Race Caucasian Other Unknown
4158 (92.2%)
138 (3.1%) 213 (4.7%)
Education Primary school or less High school Post-high school training College/University Unknown
641 (14.2%) 1261 (28%) 696 (15.4%) 968 (21.5%) 943 (20.9%)
Previous employment Working Not working Retired Student/homemaker Unknown
1946 (43.2%)
362 (8%) 1112 (24.7%) 560 (12.4%) 529 (11.7%)
Marital status Partnered Previously partnered Single/unspecified Unknown
2070 (45.9%) 621 (13.8%)
1384 (30.7%) 434 (9.7%)
IQR = inter-quartile range

72
Table 3.6: Clinical characteristics of the total CENTER-TBI core study sample
n (%)
ASA Physical Health Healthy patient Mild systemic disease Severe/life threatening systemic disease Unknown
2501 (55.5%) 1410 (31.3%) 462 (10.2%)
136 (3.1%)
Cause of injury Road traffic accident Incidental fall Violence/assault Other Unknown
1682 (37.3%) 2024 (44.9%)
246 (5.5%) 436 (9.7%) 121 (2.6%)
Clinical Care Pathway Emergency Room Admitted to hospital Intensive Care Unit
848 (18.8%)
1523 (33.8%) 2138 (47.4%)
GCS Score Mild TBI Moderate TBI Severe TBI Unknown
2955 (65.5%)
389 (8.6%) 986 (21.9%)
179 (4%)
CT abnormality Present Absent Unknown
2217 (49.2%) 1606 (35.6%) 686 (15.2%)
Injury Severity Median (IQR) total ISS
16 (9-29)
Head & neck injury1 No injury/minor injury Moderate injury Serious injury Severe injury Critical injury Unsurvivable injury
712 (15.7%) 577 (12.8%)
1289 (28.6%) 788 (17.5%)
1055 (23.4%) 88 (2%)
Non-head & neck injury2
No injury/mild injury Severe injury Unknown
2730 (60.5%) 1722 (38.2%)
57 (1.3%) IQR = Inter-quartile range; 1Head & neck injury = combined Abbreviated Injury Severity (AIS) score for head, neck & cervical regions; 2Non-head & neck injury (severe injury=total Injury Severity Score (ISS) >7)
73
The median (IQR) age of the CENTER-TBI sample was 50 (30-66). Two-thirds of the patients
were male, and most patients were Caucasian. Information about educational level was
missing for one-fifth of the patients. However, around two-thirds of the sample was educated
to high school level (28%) or better (37%). Information about previous employment and
marital status was missing for around one-tenth of the sample. However, 43% of patients were
in employment prior to injury, around one-quarter were retired, and around one-quarter were
students, homemakers or not working. Almost half of the patients were partnered prior to
injury, and the rest were previously partnered (14%), single/unspecified (31%), or unknown
(10%).
Over half of the patients were healthy prior to injury and 31% had mild systemic disease (i.e.,
conditions with no functional limitations). Incidental falls were the most common cause of
injury, accounting for 45% of all TBIs, while road traffic accidents accounted for 37% of TBIs.
Almost half of the patients were admitted to ICU, while 34% were admitted to the hospital
ward, and 19% were recruited via the ER. Two-thirds of the patients scored in the GCS 13-15
range, and CT abnormalities were present in around half of the sample. The median (IQR) total
ISS score for the sample was 16 (9-29), which is above the threshold (>15) for major trauma.
Almost 70% of the sample had head and neck injuries in the ‘serious’ or worse categories.
Moreover, 38% of patients had severe injuries to non-head and neck regions.
CENTER-TBI provides up-to-date information about the demographic and clinical
characteristics of TBI in Europe, and the registry data helps to improve the generalizability of
the core study. The core study sample reflects the changing epidemiology of TBI in Europe, in
that TBI is becoming increasingly common in elderly individuals and falls have surpassed road
traffic accidents as the most common cause of injury, especially in older adults (Brazinova et
al., 2016; Peeters et al., 2015).
74
3.6.2. Participant selection process
The studies reported in this thesis included sub-samples of CENTER-TBI patients selected from
the adults who were eligible for 3-month and 6-month follow-up (i.e., surviving patients aged
16 and over, who were still enrolled in the study at 6-months after injury). Study 1 (reported in
Chapter 4) included a 3-month sub-sample and a 6-month sub-sample. Patients were selected
for inclusion in Study 1 if GOSE scores were in the ‘vegetative state’ category or better, and if
the GOSE structured interview and GOSE questionnaire were completed within a 3-week
interval at each time-point. Study 2 (reported in Chapter 5) included patients who were
selected from the 6-month sub-sample described in Chapter 4. Patients were selected for
inclusion in Study 2 if GOSE scores were in the ‘lower severe disability’ category or better, and if
they were assessed alone, or with help from another person. Study 3 (reported in Chapter 6)
included patients who were assessed using the GOSE (as a structured interview and/or
questionnaire), alone or with help, at 6 months post-injury, and patients were included if GOSE
scores were in the ‘lower severe disability’ category or better. The participant selection process
for the studies reported in Chapters 4, 5, and 6 is presented in Figure 3.2.
3.7. Statistical analysis
Demographics and clinical characteristics
The demographic and clinical characteristics of the patient sub-groups selected for the studies
in Chapters 4, 5 and 6 were described using frequencies and percentages for categorical
variables and medians and inter-quartile ranges (IQR) for continuous variables. In Chapter 6,
the study sample was compared to patients without a 6-month GOSE using independent
samples t-tests for continuous variables and Chi-square (2) tests for categorical variables.
Study specific analyses
In Study 1 (reported in Chapter 4), strength of agreement between clinician rated GOSE
structured interviews and respondent completed GOSE questionnaires was evaluated using the
weighted kappa statistic (w) for overall GOSE ratings and kappa statistic () for ratings on
individual GOSE sections. The Wilcoxon signed-rank test was used to test for bias on overall
75
GOSE scores. McNemar’s test was used to compare ratings for patients assigned to ‘better’
(i.e., ‘moderate disability’ and ‘good recovery’ categories) and ‘worse’ (i.e., ‘vegetative state’
and ‘severe disability’ categories) outcome groups. The symptoms section of the GOSE
questionnaire was re-scored and agreement with the GOSE structured interview was evaluated
using the Kappa statistic. Weighted Kappa was also used to explore whether clinical factors and
type of respondent affected levels of agreement between overall GOSE scores. In Study 2
(reported in Chapter 5), Spearman correlations were used to examine how clinician ratings on
the GOSE structured interview and patient reports on the GOSE questionnaire related to
prognostic factors and other outcome domains. Steiger’s tests were used to examine whether
correlations for the two GOSE approaches were significantly different from each other.
In Study 3 (reported in Chapter 6), means and standard deviations (SD) were calculated for
scores on the CENTER-TBI outcome measures. Patients were divided into sub-groups based on
GOSE category and one-way analysis of variance (ANOVA) was used to test for differences on
the outcome measures. Frequencies and percentages were used to examine outcome measure
completion rates and reasons for non-completion of the RAVLT, TMT, and 10-meter walk/TUG.
Floor and ceiling effects were examined for each outcome measure. Floor and ceiling ranges
were generally defined as the top and bottom 10% of the range of possible scores for each
outcome measure. For the CANTAB sub-tests, empirical minimum and maximum scores were
defined using Tukey’s rule to exclude outliers and floor and ceiling ranges were calculated as
1.5 times the interquartile range below the 25th percentile and above the 75th percentile. The
internal consistency of the PROs was assessed using Cronbach’s alpha (α).
Multiple testing is an issue in clinical research as it increases the risk of finding spurious effects
(i.e., type 1 error). There is no universally accepted method for dealing with multiple testing
and several methods for adjusting p values have been advocated, including the Bonferroni
approach, which adjusts the significance level by the number of tests being performed (Bender
& Lange, 2001; Feise, 2002; Sainani, 2009; Walters, 2016). To reduce the risk of type 1 errors,
statistical tests were considered significant only if p<0.01. Bonferroni adjustment for multiple
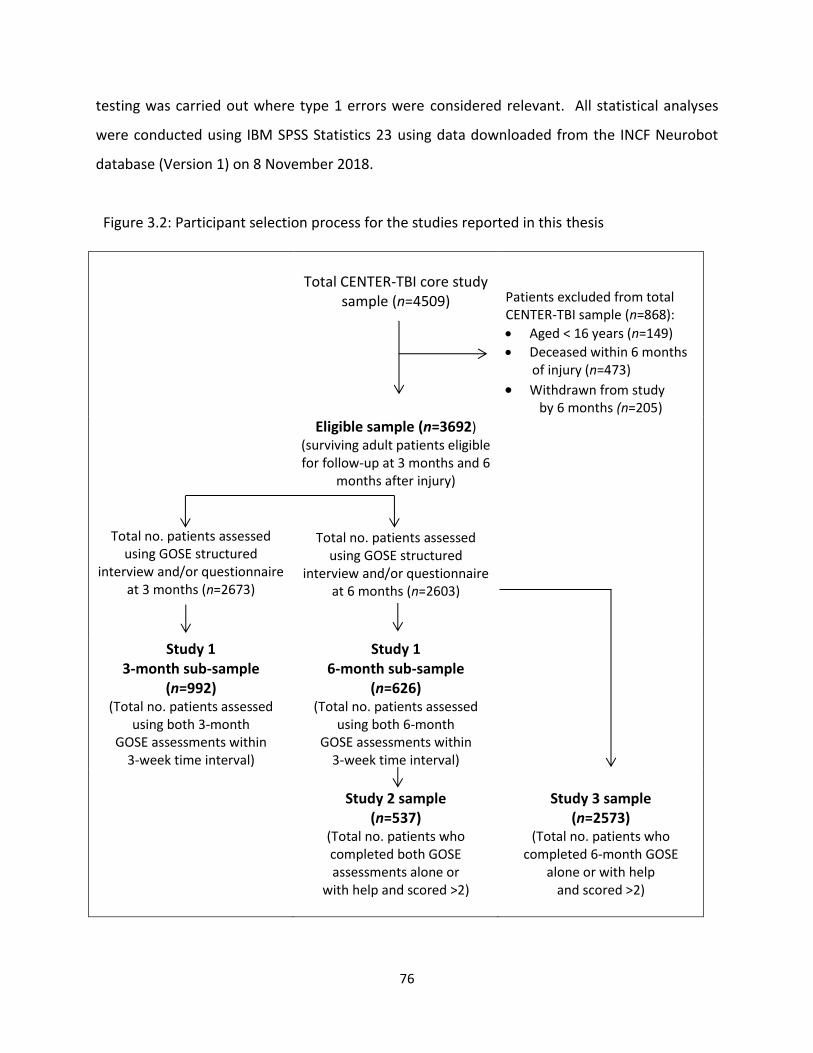
76
testing was carried out where type 1 errors were considered relevant. All statistical analyses
were conducted using IBM SPSS Statistics 23 using data downloaded from the INCF Neurobot
database (Version 1) on 8 November 2018.
Figure 3.2: Participant selection process for the studies reported in this thesis
Total CENTER-TBI core study
sample (n=4509)
Patients excluded from total CENTER-TBI sample (n=868):
Aged < 16 years (n=149)
Deceased within 6 months of injury (n=473)
Withdrawn from study by 6 months (n=205)
Eligible sample (n=3692) (surviving adult patients eligible for follow-up at 3 months and 6
months after injury)
Total no. patients assessed
using GOSE structured interview and/or questionnaire
at 3 months (n=2673)
Total no. patients assessed
using GOSE structured interview and/or questionnaire
at 6 months (n=2603)
Study 1 3-month sub-sample
(n=992) (Total no. patients assessed
using both 3-month GOSE assessments within
3-week time interval)
Study 1 6-month sub-sample
(n=626) (Total no. patients assessed
using both 6-month GOSE assessments within
3-week time interval)
Study 2 sample
(n=537) (Total no. patients who completed both GOSE assessments alone or
with help and scored >2)
Study 3 sample
(n=2573) (Total no. patients who
completed 6-month GOSE alone or with help
and scored >2)

77
CHAPTER 4
Approaches to GOSE assignment: Comparison of clinician-rated
structured interviews and respondent-completed questionnaires
The systematic review in Chapter 2 demonstrated that information for the Glasgow Outcome
Scale has been collected in various ways in previous clinical trials in TBI. As different
approaches to data collection may not be equivalent, the use of mixed modes of data collection
in clinical studies may affect study outcomes. The study presented in this chapter compares
outcomes obtained via the clinician-rated GOSE structured interview and the respondent-
completed GOSE questionnaire. This study provides information about the comparability of the
two GOSE approaches and explores whether information obtained via the GOSE structured
interview provides added value over the GOSE questionnaire.
78
4.1. Abstract
Information for the GOSE can be collected via clinician-rated interviews or by respondent-
completed questionnaires. However, there is limited evidence concerning the value that can be
added when assigning global functional outcomes via clinician ratings on the GOSE structured
interview. This chapter compared outcomes obtained using the GOSE structured interview and
GOSE questionnaire and explored whether agreement between ratings were affected by the
patient’s functional level and clinical factors, such as the presence of pre-existing functional
limitations, extracranial injury, and greater injury severity. The study used cross-sectional data
collected for CENTER-TBI and compared GOSE assessments completed at 3 months (n=992) and
6 months (n=626) after injury. Overall GOSE scores were found to be similar at 3 months
(w=0.77) and 6 months (w=0.82). Furthermore, at the item-level, agreement was good for
sections dealing with independence in everyday activities (=0.70-0.79) and moderate for
sections dealing with subjective aspects of functioning, such as relationships and symptoms
(=0.43-0.51). The greatest levels of disagreement between the two approaches were found in
the ‘good recovery’ categories, suggesting that there is some subjectivity and lower reliability in
ratings of whether significant symptoms are present. Exploratory analyses revealed that ratings
on the GOSE questionnaire were systematically less favourable for patients with poorer
outcomes at 3 months, but not at 6 months; thus, patients with greater functional limitations
may underestimate their capabilities in the first few months after TBI. Extracranial concomitant
injury/illness, in combination with TBI, was found to be associated with lower levels of
agreement between GOSE scores at 3 months after injury (w=0.55), but not at 6 months after
injury (w=0.79). Taken together, these findings indicate that the two GOSE approaches are
broadly comparable and suggest that respondent reports and clinician ratings on the GOSE
provide similar information about level of functioning after TBI. Supplementing responses on
the GOSE questionnaire with information obtained via structured interview may be useful in
certain circumstances, and in CENTER-TBI the GOSE structured interview appears to offer
modest added value over the GOSE questionnaire.
79
4.2. Introduction
The GOS/E is commonly used in clinical studies in TBI and is associated with high follow-up
rates due to its ease of use and flexibility in administration (Horton, Rhodes, & Wilson, 2018;
McMillan et al., 2016). It has undergone considerable refinement since an expanded 8-point
scale was originally proposed in 1981 (Jennett et al., 1981), including the publication of
structured interview guidelines for the GOSE in 1998 (Wilson et al., 1998), and the subsequent
introduction of the GOSE postal questionnaire in 2002 (Wilson et al., 2002). The original open-
ended approach to assigning functional outcome was criticised for its potential to result in
idiosyncratic use of the scale and a lack of consistency between assessors, particularly when the
expanded version was used (Anderson, Housley, Jones, Slattery, & Miller, 1993; Maas,
Braakman, Schouten, Minderhoud, & van Zomeren, 1983; Teasdale, Pettigrew, Wilson, Murray,
& Jennett, 1998; Wilson et al., 1998). Thus, structured interview guidelines were introduced to
improve the objectivity and reliability of the instrument (Teasdale et al., 1998; Wilson et al.,
1998), while the respondent-completed questionnaire was originally developed to assess
outcomes more easily while avoiding investigator bias (Wilson et al., 2002). The two versions of
the GOSE appear to be broadly equivalent, although existing comparisons between clinician
ratings and respondent reports of global functional outcome are limited.
The GOSE questionnaire offers pragmatic advantages over the structured interview as it
provides a means of collecting outcomes inexpensively and with minimal effort, especially in
studies with geographically dispersed populations. The GOSE questionnaire has also been
favoured in studies where blinding is not feasible and interviewer bias may be an issue, for
example, in surgical TBI trials (Mendelow et al., 2005). The structured interview is nevertheless
considered the optimal mode of data collection for the GOSE, as the interviewer can use their
clinical judgement when assigning outcomes, and there is scope to clarify any issues or
inconsistencies that may arise through discussion with the respondent (Wilson et al., 2002).
The structured interview should therefore, in theory, provide considerable added value over
simply using the respondent-completed questionnaire.
80
Previous clinical trials in TBI have collected information for the GOSE in a variety of ways,
including in-person interviews, telephone interviews, and postal questionnaires (Horton et al.,
2018). The GOSE has also been completed with the patient alone and/or with a proxy
informant, such as a relative or caregiver (Horton et al., 2018). Studies may specify a preferred
way of administering the GOSE, but employ additional data collection strategies as a means of
improving follow up rates. For example, multicentre trials such as Corticosteroid
Randomization After Significant Head Injury (CRASH) (Edwards et al., 2005) and Eurotherm
3235 (Andrews et al., 2015) used postal questionnaires as the primary method of assessing
outcomes, and also followed up non-responders by telephone interviews, thereby combining
clinician ratings with patient reports of daily functioning.
Combining data collection modes is advantageous as it can facilitate follow-ups in studies with
hard-to-reach populations. However, it is important to note that measurement error can be
introduced if different data collection methods lack sufficient comparability (Eremenco et al.,
2014). Measurement equivalence between modes cannot always be assumed because the
GOSE, like other instruments, relies on the interpretations and reports of patients, clinicians,
or other observers, all of which can be influenced by human judgement or motivation
(Powers et al., 2017; Walton et al., 2015). Scores on the respondent-completed GOSE
questionnaire may be affected by bias as patients may have a skewed understanding of their
capabilities or a lack of self-awareness, making it difficult for them to provide an accurate self
report (Prigatano, 2005a, 2005b). Clinician ratings on the GOSE structured interview may also
be affected by bias (Sherer, Roebuck-Spencer, & Davis, 2010), as study management processes
and predictors of outcome are often not masked in observational and prognostic studies.
The CENTER-TBI study employed a non-experimental design and a flexible, pragmatic data
collection approach was taken to maximise follow-ups (Maas, Menon, et al., 2015). The study
plan called for a total of 12,350 follow-ups after allowing for attrition: this included 5,850
follow-ups that involved neuropsychological assessment and, therefore, face-to-face contact,
and 6,500 follow-ups that required questionnaire assessments. Investigators were not masked
81
at follow-up. Thus, there was potential for structured interview ratings to be affected by the
interviewer’s prior knowledge of the patient.
Despite concerns about the equivalence of different modes of GOSE data collection, there is
evidence to suggest that different approaches yield comparable information about global
functional outcome after TBI. For example, in the original reliability study for the GOSE
questionnaire (Wilson et al., 2002), high levels of agreement were found between the
structured interview (completed via telephone) and the postal questionnaire (n=35, w=0.92).
High levels of test-retest reliability have also been found between in-person and telephone
structured interviews for the GOSE (n=30, w=0.92) (Pettigrew et al., 2003). Together, these
studies indicate that information can reliably be collected about global functional outcome in
the absence of face-to-face contact, and indicate that respondent-completed questionnaires
are comparable to outcomes assigned by investigators via structured interviews.
To date, no study has explored differences between clinician ratings and respondent reports
on individual sections of the GOSE. Furthermore, no study has explored whether factors known
to have a confounding effect on GOSE assignment affect levels of agreement between clinician
ratings and respondent reports. CENTER-TBI provides an opportunity to examine these issues.
Patients may rate themselves as more, or less, capable than clinicians. Furthermore, as patient
reports of subjective cognitive complaints after TBI can be unreliable (Ngwenya et al., 2018),
inconsistencies may particularly occur between clinician ratings and patient reports of TBI-
related symptoms. As factors such as pre-injury functional limitations, extracranial concomitant
injury, epilepsy, injury severity, and source of information (i.e., patient or proxy respondent)
can have an effect on the assessment of global functional outcome following TBI (Wilson et al.,
2002; Wilson et al., 1998), it is also important to examine whether these factors affect levels of
agreement between clinician-rated interviews and respondent-reported questionnaires.
82
4.2.1. Study aim
The primary aim of this study was to investigate whether the GOSE structured interview
provides additional information about global functional outcome after TBI by comparing
clinician-ratings on the GOSE structured interview and respondent reports on the GOSE
questionnaire.
4.2.2. Exploratory analyses
Exploratory analyses were conducted to:
Examine whether GOSE ratings differed for patients with ‘better’ outcomes (i.e., patients
assigned to the ‘moderate disability’ and ‘good recovery’ categories) and ‘worse’ outcomes
(i.e., patients assigned to the ‘vegetative state’ and ‘severe disability’ categories) and to
explore potential ways of improving agreement between GOSE assessments
Investigate whether factors known to have an effect on the assessment of global functional
outcome affected levels of agreement between the GOSE structured interview and GOSE
questionnaire
4.3. Methods
4.3.1. Participants
Potentially eligible patients were enrolled in the CENTER-TBI core study (see CENTER-TBI
inclusion criteria in Chapter 3).
Additional inclusion criteria for the current study were as follows:
Adults aged 16 years and over (no upper age limit)
All injury severities
GOSE score ≥2 (i.e., vegetative state (VS) or better)
The GOSE structured interview and GOSE questionnaire must be complete and scorable for
each participant at 3 months and 6 months after injury
GOSE assessments must be completed within a 3-week time interval at each time-point to
avoid introducing discrepancies due to changes in functional status
83
4.3.2. Design
The study used cross-sectional data collected for CENTER-TBI, which included pairs of GOSE
assessments completed 3 months and 6 months after injury.
4.3.3. Measures and procedure
The following acute measures were used (described in detail in Chapter 3):
American Society of Anaesthesiologists’ (ASA) classification of Physical Health (Dripps, 1963)
Glasgow Coma Scale (GCS) (Teasdale & Jennett, 1974)
CT abnormality
Abbreviated Injury Scale (AIS) and Injury Severity Score (ISS) (Baker et al., 1974)
Injury severity was also categorised according to clinical care pathway (i.e., emergency
room (ER), admission to hospital ward (Admission), intensive care unit (ICU)).
GOSE administration and scoring
The study compared two main GOSE approaches used in CENTER-TBI: the clinician-rated
structured interview (Wilson et al., 1998) and the respondent-reported questionnaire (Wilson
et al., 2002). The GOSE is described in detail in Chapter 3. For CENTER-TBI, the GOSE was
collected together with a range of other outcome measures. The overall aim was to maximize
completeness of all outcome measures mandated at each follow-up. In order to maximise
follow-up rates, CENTER-TBI employed a flexible and pragmatic approach to outcome
assessment, i.e., GOSE interviews could be completed face-to-face or via telephone, and the
GOSE could be completed with the patient and/or a proxy informant such as a relative or
caregiver (Maas, Menon, et al., 2015). Individual sites therefore administered the assessment
in different ways and the way in which the GOSE was used was not uniform across the study.
As data collection for the GOSE structured interview and GOSE questionnaire was not
managed by independent assessors, interviewers potentially had access to information
collected via the GOSE questionnaire and other assessments. Nevertheless, as the
questionnaires were scored electronically by algorithm, investigators were not provided with
84
GOSE questionnaire ratings. As described in the CENTER-TBI study manual, investigators were
expected to interview patients (or their carers/relatives), ask additional questions as needed,
form a judgement about the person’s ability to perform activities, resolve any ambiguities or
inconsistencies, and finally assign an overall rating when completing the GOSE structured
interview. Therefore, in comparison to the respondent-completed questionnaire, the
structured interview had the potential to provide additional relevant information that could be
used to assign outcomes.
GOSE structured interviews were rated locally by trained interviewers in accordance with
published guidelines (Wilson et al., 1998). GOSE questionnaires were scored centrally by
machine using the standard scoring algorithm developed by Wilson and colleagues (Wilson et
al., 2002). A revised scoring algorithm, developed for this study, was also used in exploratory
analyses to improve levels of agreement on the ‘symptoms’ section of the GOSE structured
interview and GOSE questionnaire.
4.3.4. Statistical analysis
Demographics and clinical characteristics
The demographic and clinical characteristics of the 3-month sub-sample, 6-month sub-sample,
and ‘eligible sample’ (i.e., all adult patients who were alive and eligible for follow-up
assessments at 6 months post-injury) were described using frequencies and percentages and
medians and interquartile ratios (IQR) were used for continuous data (i.e., age and total ISS
score).
Agreement between GOSE scores
Strength of agreement between the GOSE structured interview and GOSE questionnaire was
evaluated in two ways:
1. Agreement between overall ratings for the two approaches was evaluated using the
weighted kappa statistic (w), which uses quadratic weights to penalise extreme
disagreements between ratings more heavily than slight disagreements (Fleiss & Cohen,
85
1973), and in line with conventions for interpreting kappa: 0.01-0.20 = poor agreement;
0.21-0.40 = fair agreement; 0.41-0.60 = moderate agreement; 0.61-0.80 = good agreement;
and 0.81-1.00 = very good agreement (Landis & Koch, 1977). The overall percentage
agreement between scores was assessed for overall GOSE ratings and the magnitude of
disagreement (i.e., number of GOSE categories) between overall GOSE scores was
evaluated. The Wilcoxon signed-rank test was used to test for bias on overall GOSE scores.
2. Agreement between ratings for individual sections of the structured interview and
questionnaire was evaluated using the kappa statistic () (Cohen, 1960), and a kappa
threshold of 0.40 was used to indicate acceptable levels of agreement (Yip, Wilber, Myrtle,
& Grazman, 2001).
Exploratory analyses
For some analyses and in line with conventions (McMillan et al., 2016), overall GOSE scores
were dichotomised into two groups, i,e., ‘better’ outcomes (‘moderate disability’ and ‘good
recovery’) versus ‘worse’ outcomes (‘vegetative state’ and ‘severe disability’), and McNemar’s
test was used to compare outcomes on the GOSE structured interview and GOSE questionnaire
at 3 and 6-months post-injury. Potential ways of improving agreement between clinician-
ratings and respondent reports were then explored by examining individual sections of the
GOSE, and the ‘symptoms’ section of the respondent-completed questionnaire was re-scored
using a revised algorithm (Wilson & Horton, 2018).
Exploratory analyses also examined whether clinical factors (i.e., pre-existing disability,
extracranial injury, epilepsy, and injury severity) and type of respondent, had an impact on
levels of agreement between GOSE scores at 3 and 6-months post-injury.
All statistical analyses were conducted using IBM SPSS Statistics 23. The data were
downloaded from the INCF-Neurobot database on 8 November 2018 (Version 1).
86
4.4. Results
4.4.1. Demographics and clinical characteristics
A total of 3692 adults were eligible for follow-up 6 months after injury. At 3 months, 1096
patients completed both versions of the GOSE: 9.5% (n=104) were excluded as they did so
outside of the 3-week time interval. Thus, 992 patients met the inclusion criteria at the 3-
month follow-up. At 6 months, 678 patients completed both versions of the GOSE: 7.7%
(n=52) were excluded as they did so outside of the 3-week time interval. Thus, 626 patients
met the inclusion criteria at the 6-month follow-up. The participant selection process for the
study is detailed in Figure 4.1. Tables 4.1 and 4.2 summarise the demographic and clinical
characteristics of the 3-month sub-sample, 6-month-sub-sample, and eligible sample.
The median (IQR) age was 53 years (33-66) for the 3-month sample; 51 years (31-64) for the 6-
month sample; and 49 years (31-64) for the eligible sample. Around two-thirds of the patients
were male and most of them were Caucasian. Most patients had high school, post-high school,
or college/university education. Around half of the patients were in employment prior to
injury. Furthermore, around half of the patients were partnered prior to injury. Most of the
patients were healthy or had mild systemic disease (i.e., conditions with no functional
limitations) prior to injury. Road traffic accidents and incidental falls were the most common
causes of injury, each accounting for around 40% of the samples. Most patients were either
admitted to the hospital ward or intensive care unit, and emergency room admissions
accounted for around one-fifth of the samples. Around two-thirds of the patients had GCS
scores of 13-15 and CT abnormalities were present in around half of the patients. Total ISS
scores of 15 or more are indicative of major trauma: the median (IQR) total ISS was 16 (9-26)
for the 3-month sample; 16 (8-29) for the 6-month sample; and 16 (9-26) for the eligible
sample. A total of 514 (51.8%) of the 3-month sub-sample, 336 (53.7%) of the 6-month sub-
sample, and 1876 (50.8%) of the eligible sample met criteria for major trauma. Around one-
third of the patients in the samples sustained severe non-head and neck injuries.
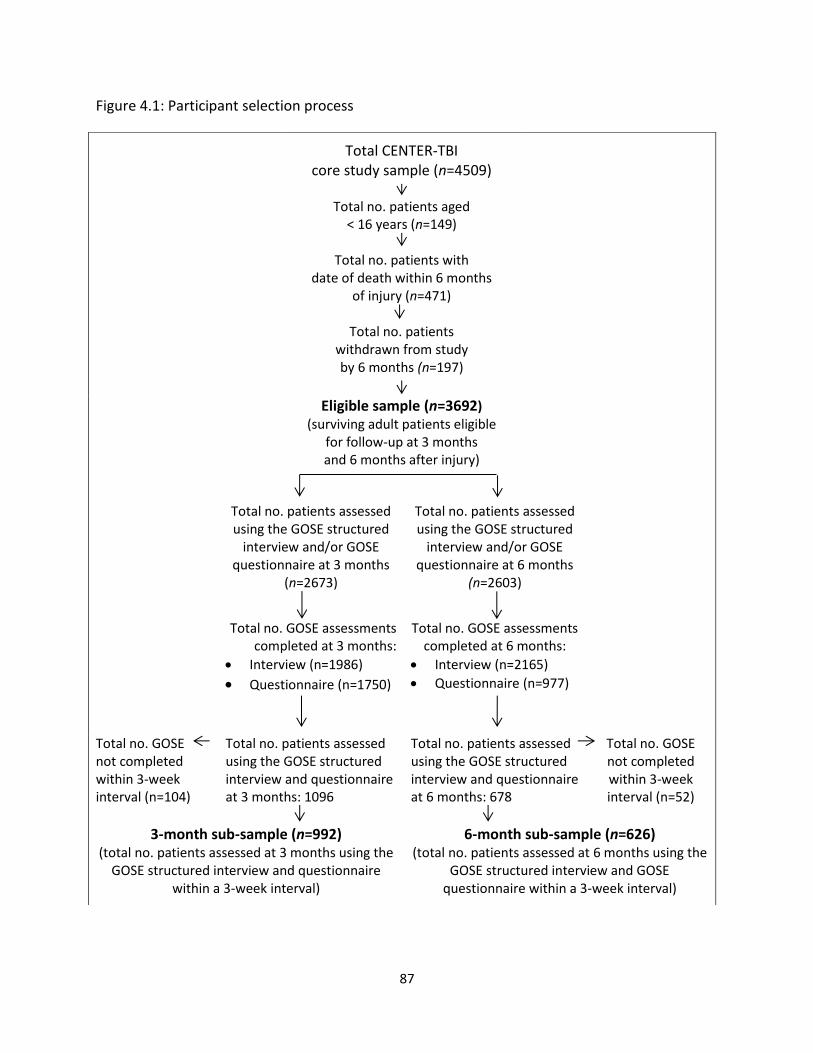
87
Figure 4.1: Participant selection process
Total CENTER-TBI
core study sample (n=4509)
Total no. patients aged < 16 years (n=149)
Total no. patients with
date of death within 6 months of injury (n=471)
Total no. patients
withdrawn from study by 6 months (n=197)
Eligible sample (n=3692) (surviving adult patients eligible
for follow-up at 3 months and 6 months after injury)
Total no. patients assessed using the GOSE structured
interview and/or GOSE questionnaire at 3 months
(n=2673)
Total no. patients assessed using the GOSE structured
interview and/or GOSE questionnaire at 6 months
(n=2603)
Total no. GOSE assessments completed at 3 months:
Interview (n=1986)
Questionnaire (n=1750)
Total no. GOSE assessments completed at 6 months:
Interview (n=2165)
Questionnaire (n=977)
Total no. GOSE not completed within 3-week interval (n=104)
Total no. patients assessed using the GOSE structured interview and questionnaire at 3 months: 1096
Total no. patients assessed using the GOSE structured interview and questionnaire at 6 months: 678
Total no. GOSE not completed within 3-week interval (n=52)
3-month sub-sample (n=992) (total no. patients assessed at 3 months using the
GOSE structured interview and questionnaire within a 3-week interval)
6-month sub-sample (n=626) (total no. patients assessed at 6 months using the
GOSE structured interview and GOSE questionnaire within a 3-week interval)

88
Table 4.1: Demographics for the 3 and 6-month sub-samples and eligible sample
3-month sub-sample
6-month sub-sample
Eligible sample
Age band 16-25 26-35 36-45 46-55 56-65 66-75 76-86 >86
161 (16.2%) 117 (11.8%) 103 (10.4%) 148 (14.9%) 192 (19.4%) 162 (16.3%)
93 (9.4%) 16 (1.6%)
111 (17.7%) 80 (12.8%) 74 (11.8%)
106 (16.9%) 112 (17.9%) 82 (13.1%) 52 (8.3%) 9 (1.4%)
663 (18%)
473 (12.8%) 501 (13.6%) 606 (16.4%) 598 (16.2%) 482 (13.1%) 307 (8.3%) 62 (1.7%)
Gender Male Female
653 (65.8%) 339 (34.2%)
407 (65%) 219 (35%)
2487 (67.4%) 1205 (32.6%)
Race Caucasian Other Unknown
994 (95.2%)
24 (2.4%) 24 (2.4%)
604 (96.5%)
12 (1.9%) 10 (1.6%)
3420 (92.6%)
113 (3%) 159 (4.3%)
Education Primary school or less High school Post-high school training College/University Unknown
90 (9.1%)
274 (27.6%) 202 (20.4%)
267 (26.9%) 159 (16%)
65 (10.4%) 183(29.2%) 101 (16.1%)
145 (23.2%) 132 (21.1%)
459 (12.4%) 1108 (30%) 647 (17.5%)
888 (24.1%) 590 (16%)
Previous employment Working Not working Retired Student/homemaker Unknown
475 (47.9%)
71 (7.2%) 256 (25.8%) 112 (11.3%)
78 (7.9%)
308 (49.2%)
52 (8.3%) 134 (21.4%) 65 (10.4%) 67 (10.7%)
1805 (48.9%)
317 (8.6%) 828 (22.4%) 409 (11.1%)
333 (9%)
Marital status Partnered Previously partnered Single/unspecified Unknown
522 (52.6%) 132 (13.3%) 283 (28.5%)
55 (5.5%)
302 (48.2%) 77 (12.3%)
195 (31.2%) 52 (8.3%)
1751 (47.4%) 520 (14.1%)
1127 (30.5%) 294 (8%)
Data are n (%)
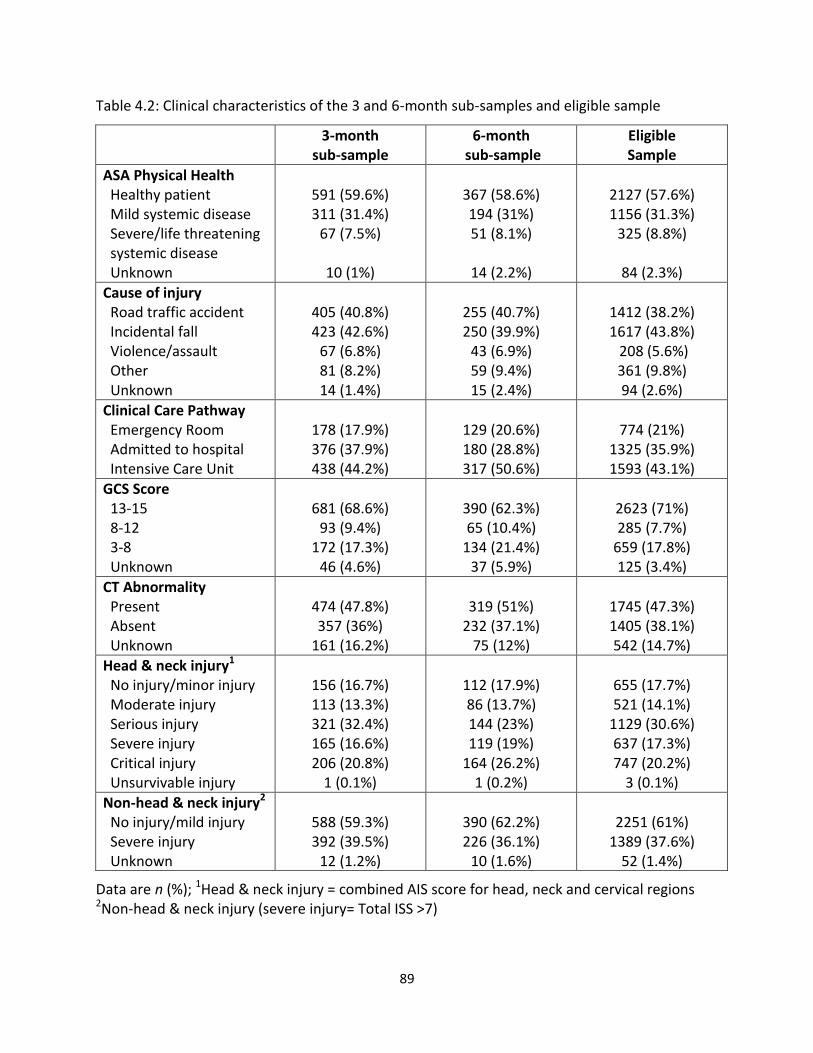
89
Table 4.2: Clinical characteristics of the 3 and 6-month sub-samples and eligible sample
3-month sub-sample
6-month sub-sample
Eligible Sample
ASA Physical Health Healthy patient Mild systemic disease Severe/life threatening systemic disease Unknown
591 (59.6%) 311 (31.4%)
67 (7.5%)
10 (1%)
367 (58.6%) 194 (31%) 51 (8.1%)
14 (2.2%)
2127 (57.6%) 1156 (31.3%)
325 (8.8%)
84 (2.3%)
Cause of injury Road traffic accident Incidental fall Violence/assault Other Unknown
405 (40.8%) 423 (42.6%)
67 (6.8%) 81 (8.2%) 14 (1.4%)
255 (40.7%) 250 (39.9%)
43 (6.9%) 59 (9.4%) 15 (2.4%)
1412 (38.2%) 1617 (43.8%) 208 (5.6%) 361 (9.8%) 94 (2.6%)
Clinical Care Pathway Emergency Room Admitted to hospital Intensive Care Unit
178 (17.9%) 376 (37.9%) 438 (44.2%)
129 (20.6%) 180 (28.8%) 317 (50.6%)
774 (21%)
1325 (35.9%) 1593 (43.1%)
GCS Score 13-15 8-12 3-8 Unknown
681 (68.6%)
93 (9.4%) 172 (17.3%)
46 (4.6%)
390 (62.3%) 65 (10.4%)
134 (21.4%) 37 (5.9%)
2623 (71%) 285 (7.7%)
659 (17.8%) 125 (3.4%)
CT Abnormality Present Absent Unknown
474 (47.8%) 357 (36%)
161 (16.2%)
319 (51%)
232 (37.1%) 75 (12%)
1745 (47.3%) 1405 (38.1%) 542 (14.7%)
Head & neck injury1 No injury/minor injury Moderate injury Serious injury Severe injury Critical injury Unsurvivable injury
156 (16.7%) 113 (13.3%) 321 (32.4%) 165 (16.6%) 206 (20.8%)
1 (0.1%)
112 (17.9%) 86 (13.7%) 144 (23%) 119 (19%)
164 (26.2%) 1 (0.2%)
655 (17.7%) 521 (14.1%)
1129 (30.6%) 637 (17.3%) 747 (20.2%)
3 (0.1%)
Non-head & neck injury2
No injury/mild injury Severe injury Unknown
588 (59.3%) 392 (39.5%)
12 (1.2%)
390 (62.2%) 226 (36.1%)
10 (1.6%)
2251 (61%)
1389 (37.6%) 52 (1.4%)
Data are n (%); 1Head & neck injury = combined AIS score for head, neck and cervical regions 2Non-head & neck injury (severe injury= Total ISS >7)
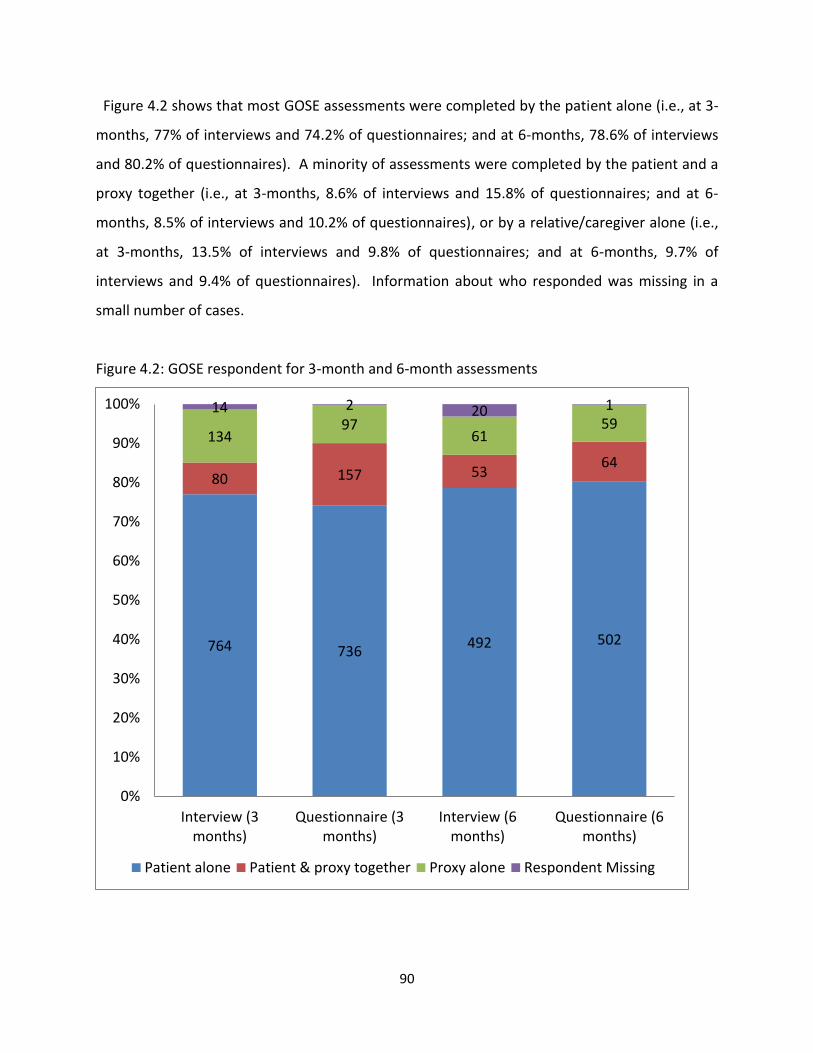
90
Figure 4.2 shows that most GOSE assessments were completed by the patient alone (i.e., at 3-
months, 77% of interviews and 74.2% of questionnaires; and at 6-months, 78.6% of interviews
and 80.2% of questionnaires). A minority of assessments were completed by the patient and a
proxy together (i.e., at 3-months, 8.6% of interviews and 15.8% of questionnaires; and at 6-
months, 8.5% of interviews and 10.2% of questionnaires), or by a relative/caregiver alone (i.e.,
at 3-months, 13.5% of interviews and 9.8% of questionnaires; and at 6-months, 9.7% of
interviews and 9.4% of questionnaires). Information about who responded was missing in a
small number of cases.
Figure 4.2: GOSE respondent for 3-month and 6-month assessments
764 736 492 502
80 157 53 64
134 97
61 59
14 2 20 1
0%
10%
20%
30%
40%
50%
60%
70%
80%
90%
100%
Interview (3months)
Questionnaire (3months)
Interview (6months)
Questionnaire (6months)
Patient alone Patient & proxy together Proxy alone Respondent Missing
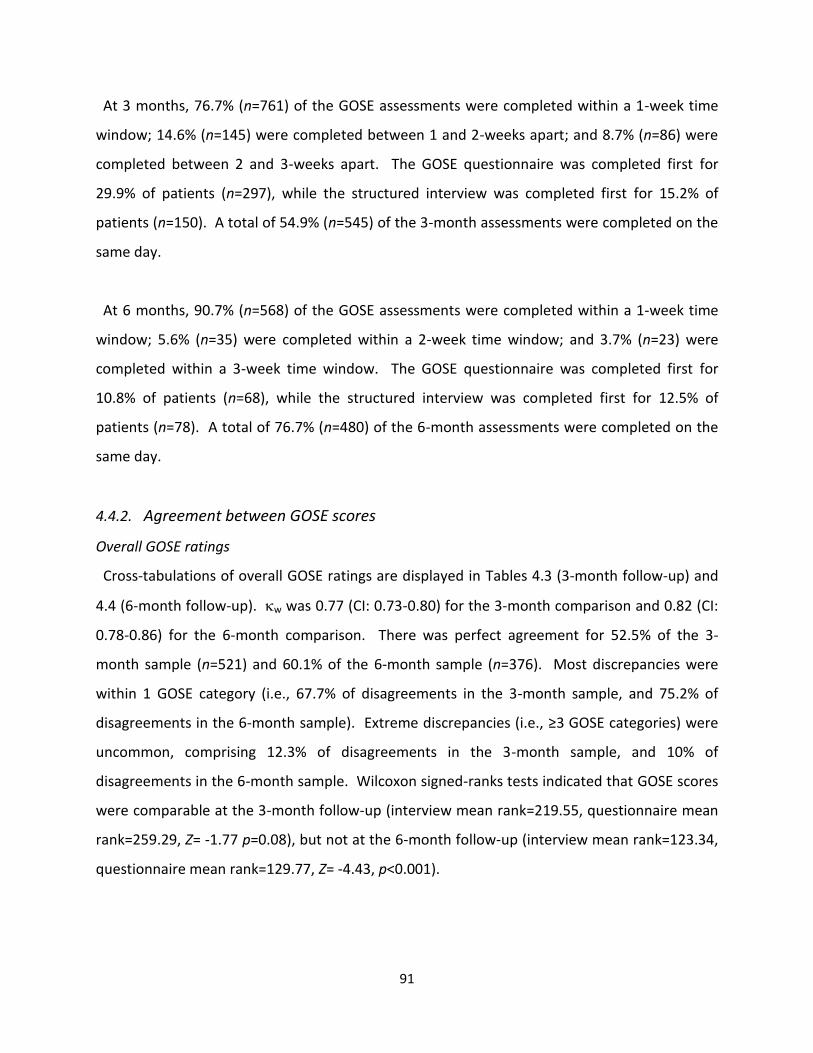
91
At 3 months, 76.7% (n=761) of the GOSE assessments were completed within a 1-week time
window; 14.6% (n=145) were completed between 1 and 2-weeks apart; and 8.7% (n=86) were
completed between 2 and 3-weeks apart. The GOSE questionnaire was completed first for
29.9% of patients (n=297), while the structured interview was completed first for 15.2% of
patients (n=150). A total of 54.9% (n=545) of the 3-month assessments were completed on the
same day.
At 6 months, 90.7% (n=568) of the GOSE assessments were completed within a 1-week time
window; 5.6% (n=35) were completed within a 2-week time window; and 3.7% (n=23) were
completed within a 3-week time window. The GOSE questionnaire was completed first for
10.8% of patients (n=68), while the structured interview was completed first for 12.5% of
patients (n=78). A total of 76.7% (n=480) of the 6-month assessments were completed on the
same day.
4.4.2. Agreement between GOSE scores
Overall GOSE ratings
Cross-tabulations of overall GOSE ratings are displayed in Tables 4.3 (3-month follow-up) and
4.4 (6-month follow-up). w was 0.77 (CI: 0.73-0.80) for the 3-month comparison and 0.82 (CI:
0.78-0.86) for the 6-month comparison. There was perfect agreement for 52.5% of the 3-
month sample (n=521) and 60.1% of the 6-month sample (n=376). Most discrepancies were
within 1 GOSE category (i.e., 67.7% of disagreements in the 3-month sample, and 75.2% of
disagreements in the 6-month sample). Extreme discrepancies (i.e., ≥3 GOSE categories) were
uncommon, comprising 12.3% of disagreements in the 3-month sample, and 10% of
disagreements in the 6-month sample. Wilcoxon signed-ranks tests indicated that GOSE scores
were comparable at the 3-month follow-up (interview mean rank=219.55, questionnaire mean
rank=259.29, Z= -1.77 p=0.08), but not at the 6-month follow-up (interview mean rank=123.34,
questionnaire mean rank=129.77, Z= -4.43, p<0.001).
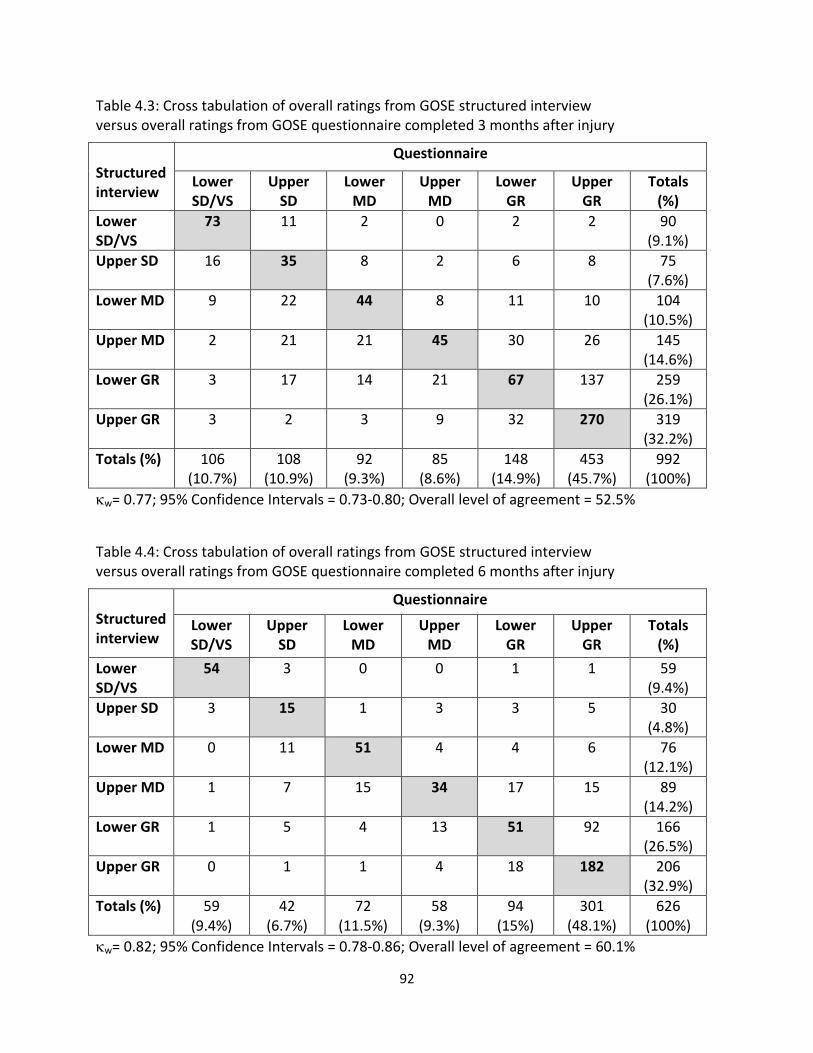
92
Table 4.3: Cross tabulation of overall ratings from GOSE structured interview versus overall ratings from GOSE questionnaire completed 3 months after injury
Structured interview
Questionnaire
Lower SD/VS
Upper SD
Lower MD
Upper MD
Lower GR
Upper GR
Totals (%)
Lower SD/VS
73
11 2 0 2 2 90 (9.1%)
Upper SD 16
35 8 2 6 8 75 (7.6%)
Lower MD 9
22 44 8 11 10 104 (10.5%)
Upper MD 2
21 21 45 30 26 145 (14.6%)
Lower GR 3
17 14 21 67 137 259 (26.1%)
Upper GR 3
2 3 9 32 270 319 (32.2%)
Totals (%) 106 (10.7%)
108 (10.9%)
92 (9.3%)
85 (8.6%)
148 (14.9%)
453 (45.7%)
992 (100%)
w= 0.77; 95% Confidence Intervals = 0.73-0.80; Overall level of agreement = 52.5%
Table 4.4: Cross tabulation of overall ratings from GOSE structured interview versus overall ratings from GOSE questionnaire completed 6 months after injury
Structured interview
Questionnaire
Lower SD/VS
Upper SD
Lower MD
Upper MD
Lower GR
Upper GR
Totals (%)
Lower SD/VS
54 3 0 0 1 1 59 (9.4%)
Upper SD 3 15
1 3 3 5 30 (4.8%)
Lower MD 0 11 51
4 4 6 76 (12.1%)
Upper MD 1 7 15 34
17 15 89 (14.2%)
Lower GR 1 5 4 13 51
92 166 (26.5%)
Upper GR 0 1 1 4 18 182
206 (32.9%)
Totals (%) 59 (9.4%)
42 (6.7%)
72 (11.5%)
58 (9.3%)
94 (15%)
301 (48.1%)
626 (100%)
w= 0.82; 95% Confidence Intervals = 0.78-0.86; Overall level of agreement = 60.1%
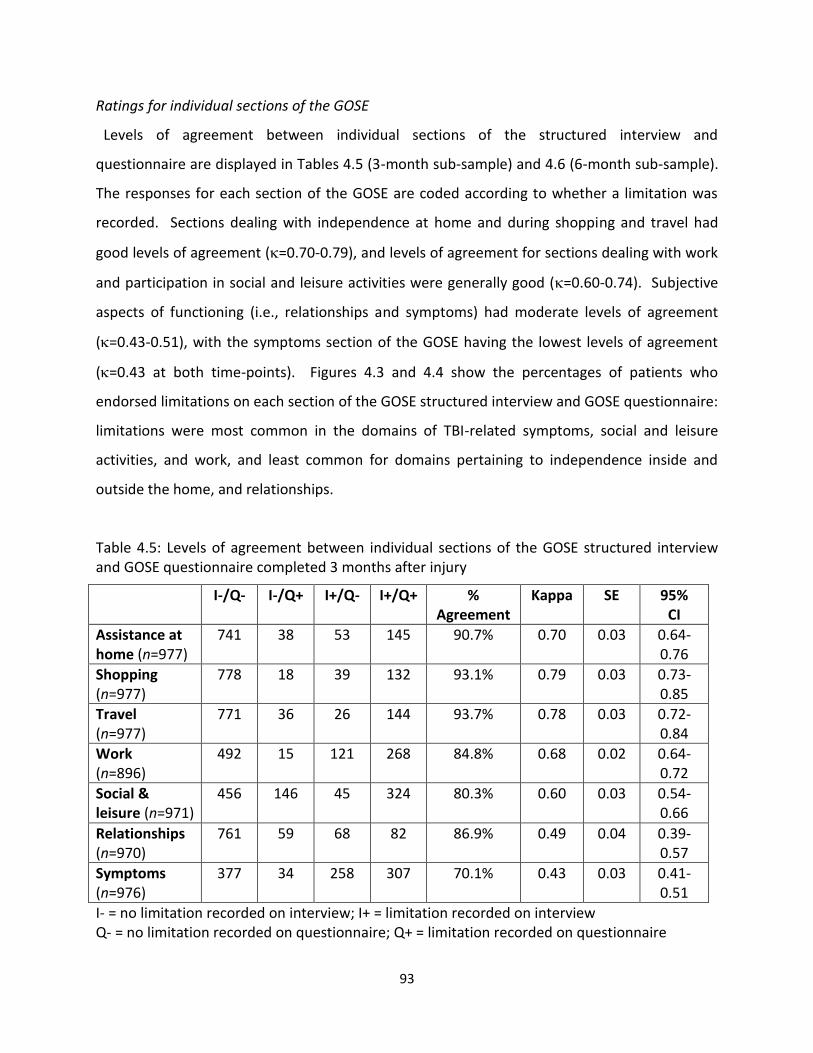
93
Ratings for individual sections of the GOSE
Levels of agreement between individual sections of the structured interview and
questionnaire are displayed in Tables 4.5 (3-month sub-sample) and 4.6 (6-month sub-sample).
The responses for each section of the GOSE are coded according to whether a limitation was
recorded. Sections dealing with independence at home and during shopping and travel had
good levels of agreement (=0.70-0.79), and levels of agreement for sections dealing with work
and participation in social and leisure activities were generally good (=0.60-0.74). Subjective
aspects of functioning (i.e., relationships and symptoms) had moderate levels of agreement
(=0.43-0.51), with the symptoms section of the GOSE having the lowest levels of agreement
(=0.43 at both time-points). Figures 4.3 and 4.4 show the percentages of patients who
endorsed limitations on each section of the GOSE structured interview and GOSE questionnaire:
limitations were most common in the domains of TBI-related symptoms, social and leisure
activities, and work, and least common for domains pertaining to independence inside and
outside the home, and relationships.
Table 4.5: Levels of agreement between individual sections of the GOSE structured interview and GOSE questionnaire completed 3 months after injury
I-/Q- I-/Q+ I+/Q- I+/Q+ % Agreement
Kappa SE 95% CI
Assistance at home (n=977)
741 38 53 145 90.7% 0.70 0.03 0.64-0.76
Shopping (n=977)
778 18 39 132 93.1% 0.79 0.03 0.73-0.85
Travel (n=977)
771 36 26 144 93.7% 0.78 0.03 0.72-0.84
Work (n=896)
492 15 121 268 84.8% 0.68 0.02 0.64-0.72
Social & leisure (n=971)
456 146 45 324 80.3% 0.60 0.03 0.54-0.66
Relationships (n=970)
761 59 68 82 86.9% 0.49 0.04 0.39-0.57
Symptoms (n=976)
377 34 258 307 70.1% 0.43 0.03 0.41-0.51
I- = no limitation recorded on interview; I+ = limitation recorded on interview Q- = no limitation recorded on questionnaire; Q+ = limitation recorded on questionnaire
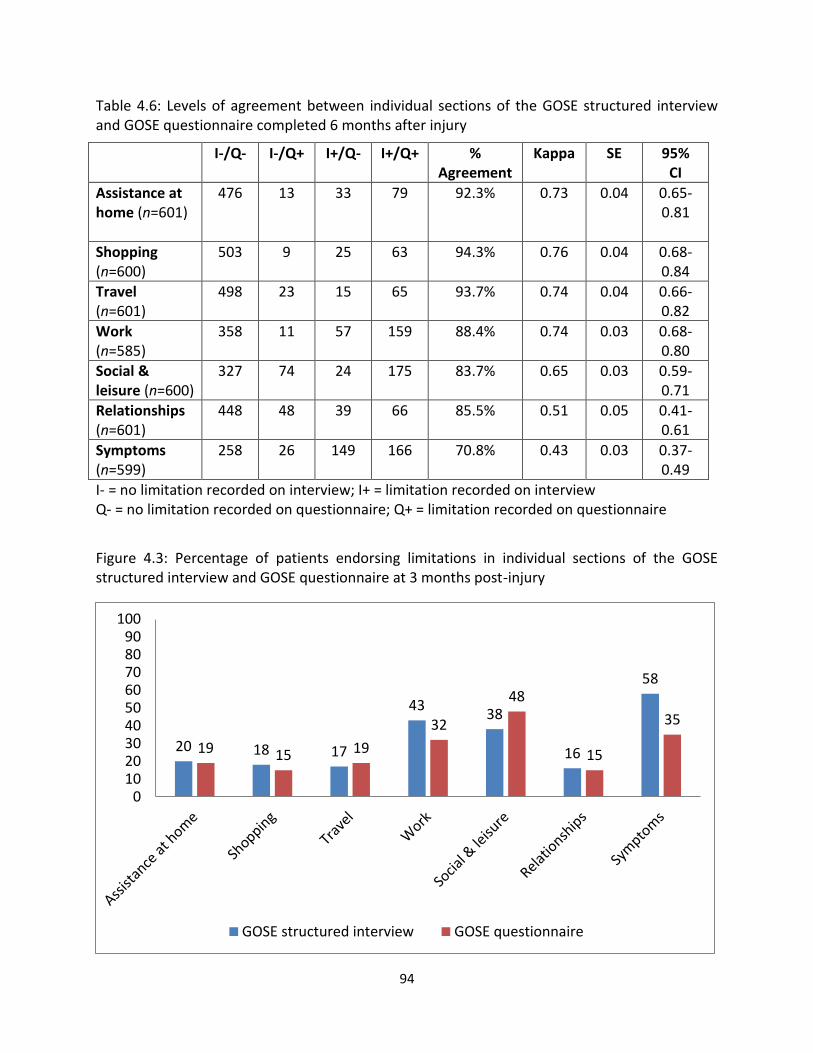
94
Table 4.6: Levels of agreement between individual sections of the GOSE structured interview and GOSE questionnaire completed 6 months after injury
I-/Q- I-/Q+ I+/Q- I+/Q+ % Agreement
Kappa SE 95% CI
Assistance at home (n=601)
476 13 33 79 92.3% 0.73 0.04 0.65-0.81
Shopping (n=600)
503 9 25 63 94.3% 0.76 0.04 0.68-0.84
Travel (n=601)
498 23 15 65 93.7% 0.74 0.04 0.66-0.82
Work (n=585)
358 11 57 159 88.4% 0.74 0.03 0.68-0.80
Social & leisure (n=600)
327 74 24 175 83.7% 0.65 0.03 0.59-0.71
Relationships (n=601)
448 48 39 66 85.5% 0.51 0.05 0.41-0.61
Symptoms (n=599)
258 26 149 166 70.8% 0.43 0.03
0.37- 0.49
I- = no limitation recorded on interview; I+ = limitation recorded on interview Q- = no limitation recorded on questionnaire; Q+ = limitation recorded on questionnaire
Figure 4.3: Percentage of patients endorsing limitations in individual sections of the GOSE structured interview and GOSE questionnaire at 3 months post-injury
20 18 17
43 38
16
58
19 15 19
32
48
15
35
0102030405060708090
100
GOSE structured interview GOSE questionnaire
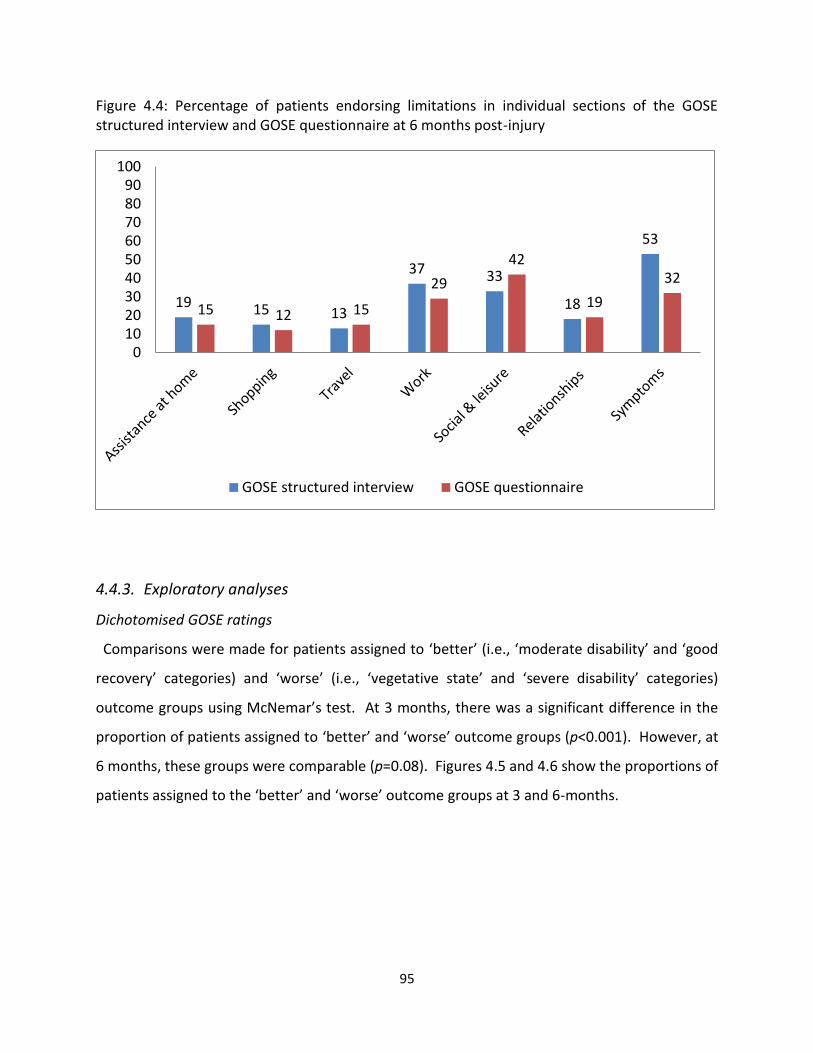
95
Figure 4.4: Percentage of patients endorsing limitations in individual sections of the GOSE structured interview and GOSE questionnaire at 6 months post-injury
4.4.3. Exploratory analyses
Dichotomised GOSE ratings
Comparisons were made for patients assigned to ‘better’ (i.e., ‘moderate disability’ and ‘good
recovery’ categories) and ‘worse’ (i.e., ‘vegetative state’ and ‘severe disability’ categories)
outcome groups using McNemar’s test. At 3 months, there was a significant difference in the
proportion of patients assigned to ‘better’ and ‘worse’ outcome groups (p<0.001). However, at
6 months, these groups were comparable (p=0.08). Figures 4.5 and 4.6 show the proportions of
patients assigned to the ‘better’ and ‘worse’ outcome groups at 3 and 6-months.
19 15 13
37 33
18
53
15 12 15
29
42
19
32
0102030405060708090
100
GOSE structured interview GOSE questionnaire
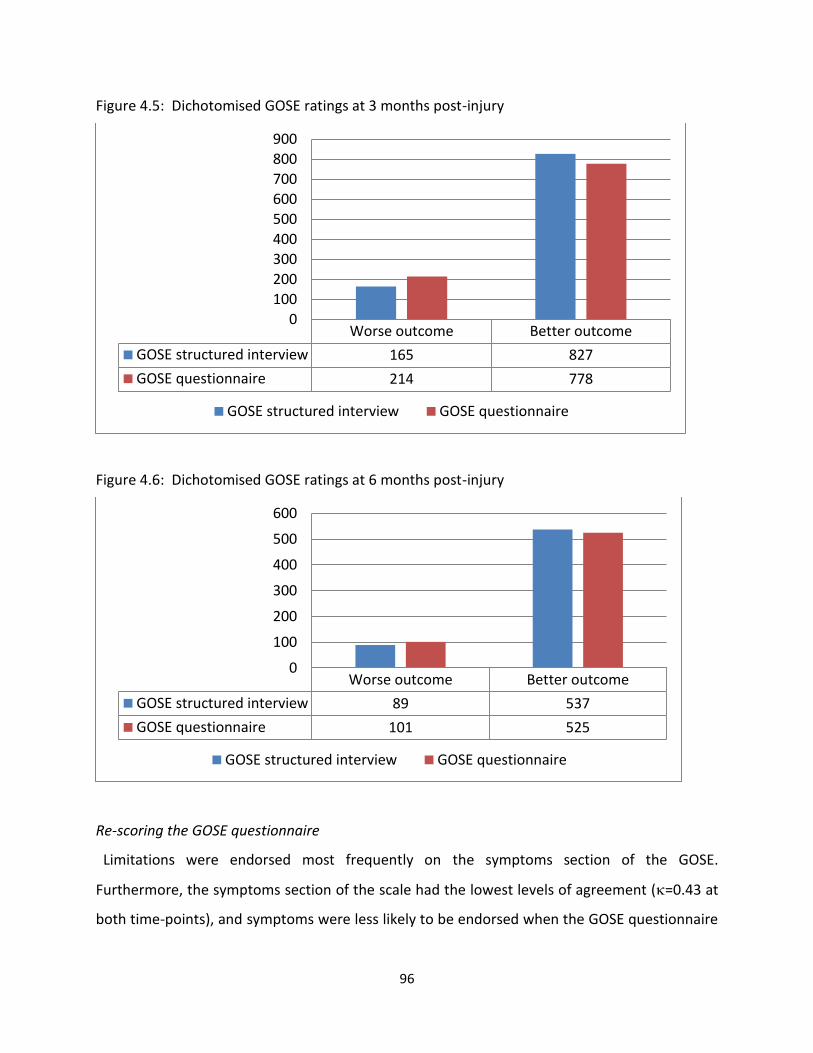
96
Figure 4.5: Dichotomised GOSE ratings at 3 months post-injury
Figure 4.6: Dichotomised GOSE ratings at 6 months post-injury
Re-scoring the GOSE questionnaire
Limitations were endorsed most frequently on the symptoms section of the GOSE.
Furthermore, the symptoms section of the scale had the lowest levels of agreement (=0.43 at
both time-points), and symptoms were less likely to be endorsed when the GOSE questionnaire
Worse outcome Better outcome
GOSE structured interview 165 827
GOSE questionnaire 214 778
0
100
200
300
400
500
600
700
800
900
GOSE structured interview GOSE questionnaire
Worse outcome Better outcome
GOSE structured interview 89 537
GOSE questionnaire 101 525
0
100
200
300
400
500
600
GOSE structured interview GOSE questionnaire
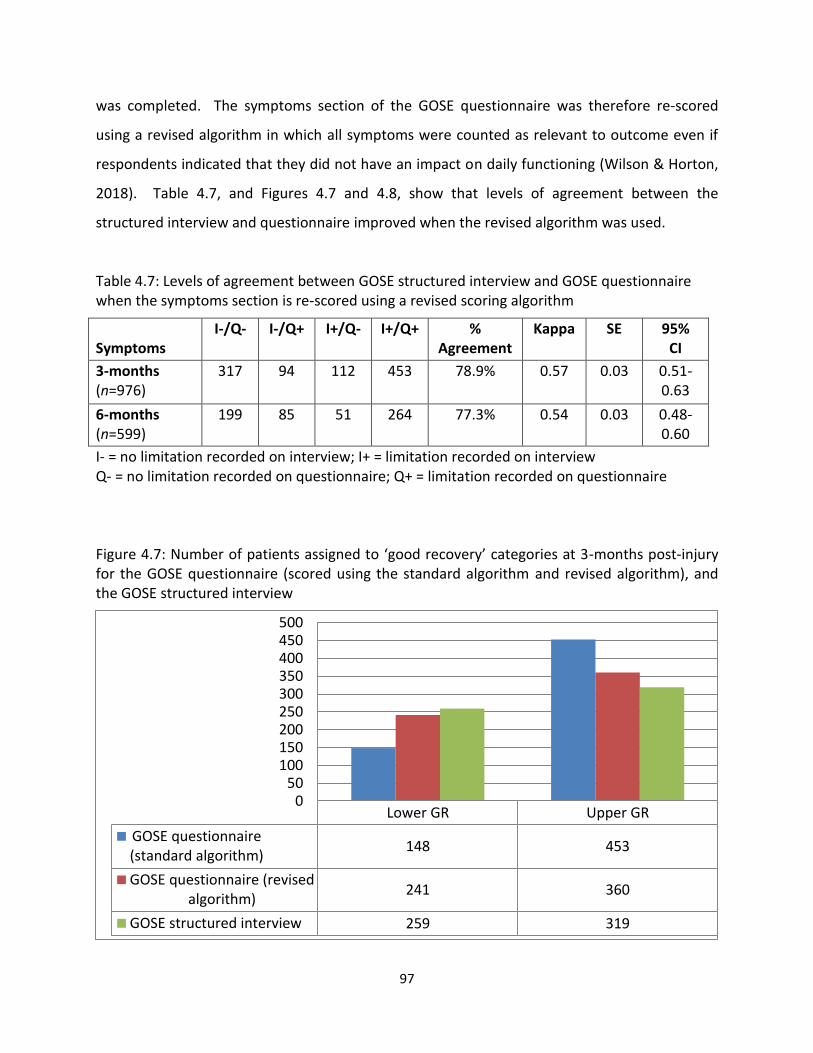
97
was completed. The symptoms section of the GOSE questionnaire was therefore re-scored
using a revised algorithm in which all symptoms were counted as relevant to outcome even if
respondents indicated that they did not have an impact on daily functioning (Wilson & Horton,
2018). Table 4.7, and Figures 4.7 and 4.8, show that levels of agreement between the
structured interview and questionnaire improved when the revised algorithm was used.
Table 4.7: Levels of agreement between GOSE structured interview and GOSE questionnaire when the symptoms section is re-scored using a revised scoring algorithm
Symptoms
I-/Q- I-/Q+ I+/Q- I+/Q+ % Agreement
Kappa SE 95% CI
3-months (n=976)
317 94 112 453 78.9% 0.57 0.03 0.51-0.63
6-months (n=599)
199 85 51 264 77.3% 0.54 0.03 0.48-0.60
I- = no limitation recorded on interview; I+ = limitation recorded on interview Q- = no limitation recorded on questionnaire; Q+ = limitation recorded on questionnaire
Figure 4.7: Number of patients assigned to ‘good recovery’ categories at 3-months post-injury for the GOSE questionnaire (scored using the standard algorithm and revised algorithm), and the GOSE structured interview
Lower GR Upper GR
GOSE questionnaire(standard algorithm)
148 453
GOSE questionnaire (revisedalgorithm)
241 360
GOSE structured interview 259 319
050
100150200250300350400450500
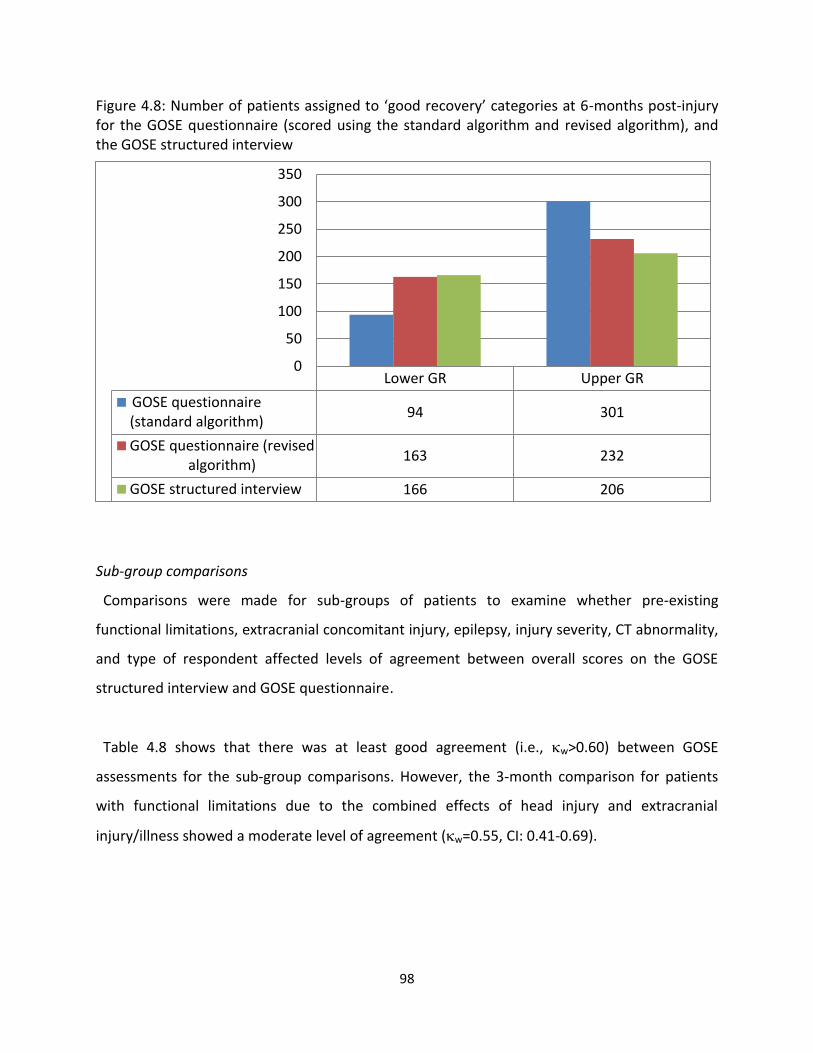
98
Figure 4.8: Number of patients assigned to ‘good recovery’ categories at 6-months post-injury for the GOSE questionnaire (scored using the standard algorithm and revised algorithm), and the GOSE structured interview
Sub-group comparisons
Comparisons were made for sub-groups of patients to examine whether pre-existing
functional limitations, extracranial concomitant injury, epilepsy, injury severity, CT abnormality,
and type of respondent affected levels of agreement between overall scores on the GOSE
structured interview and GOSE questionnaire.
Table 4.8 shows that there was at least good agreement (i.e., w>0.60) between GOSE
assessments for the sub-group comparisons. However, the 3-month comparison for patients
with functional limitations due to the combined effects of head injury and extracranial
injury/illness showed a moderate level of agreement (w=0.55, CI: 0.41-0.69).
Lower GR Upper GR
GOSE questionnaire(standard algorithm)
94 301
GOSE questionnaire (revisedalgorithm)
163 232
GOSE structured interview 166 206
0
50
100
150
200
250
300
350
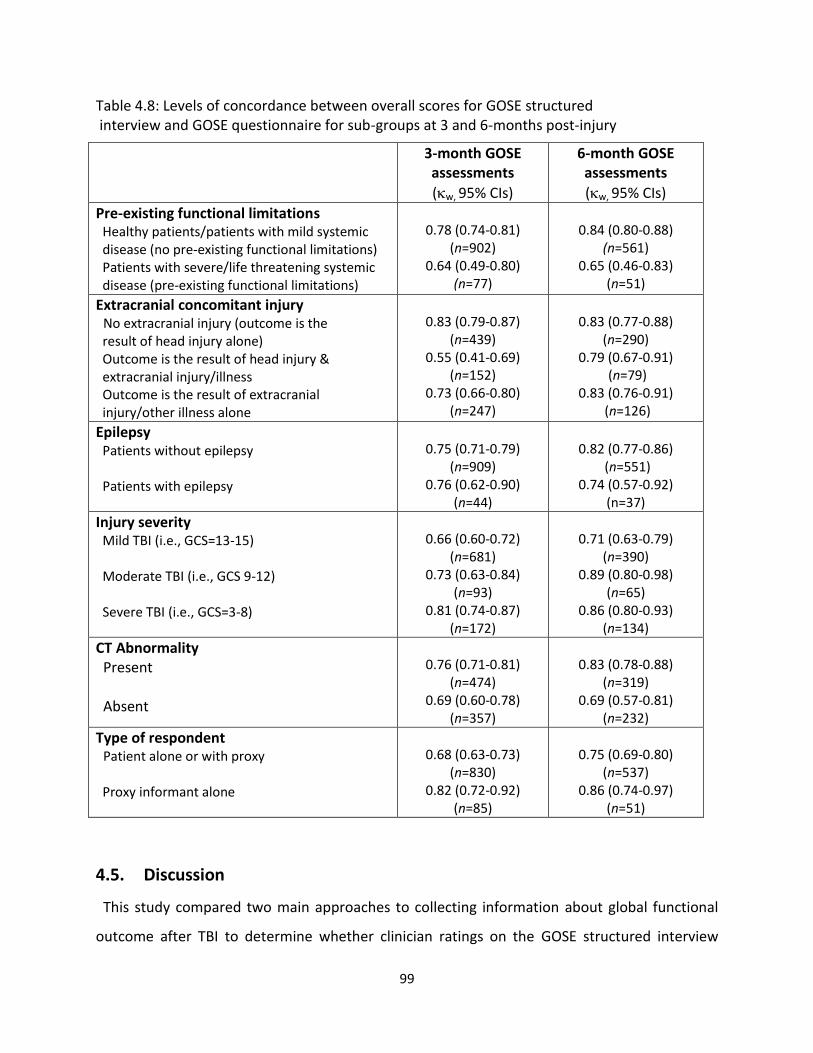
99
Table 4.8: Levels of concordance between overall scores for GOSE structured interview and GOSE questionnaire for sub-groups at 3 and 6-months post-injury
3-month GOSE assessments
(w, 95% CIs)
6-month GOSE assessments
(w, 95% CIs)
Pre-existing functional limitations Healthy patients/patients with mild systemic disease (no pre-existing functional limitations) Patients with severe/life threatening systemic disease (pre-existing functional limitations)
0.78 (0.74-0.81)
(n=902) 0.64 (0.49-0.80)
(n=77)
0.84 (0.80-0.88)
(n=561) 0.65 (0.46-0.83)
(n=51)
Extracranial concomitant injury No extracranial injury (outcome is the result of head injury alone) Outcome is the result of head injury & extracranial injury/illness Outcome is the result of extracranial injury/other illness alone
0.83 (0.79-0.87)
(n=439) 0.55 (0.41-0.69)
(n=152) 0.73 (0.66-0.80)
(n=247)
0.83 (0.77-0.88)
(n=290) 0.79 (0.67-0.91)
(n=79) 0.83 (0.76-0.91)
(n=126)
Epilepsy Patients without epilepsy Patients with epilepsy
0.75 (0.71-0.79)
(n=909) 0.76 (0.62-0.90)
(n=44)
0.82 (0.77-0.86)
(n=551) 0.74 (0.57-0.92)
(n=37)
Injury severity Mild TBI (i.e., GCS=13-15) Moderate TBI (i.e., GCS 9-12) Severe TBI (i.e., GCS=3-8)
0.66 (0.60-0.72)
(n=681) 0.73 (0.63-0.84)
(n=93) 0.81 (0.74-0.87)
(n=172)
0.71 (0.63-0.79)
(n=390) 0.89 (0.80-0.98)
(n=65) 0.86 (0.80-0.93)
(n=134)
CT Abnormality Present Absent
0.76 (0.71-0.81)
(n=474) 0.69 (0.60-0.78)
(n=357)
0.83 (0.78-0.88)
(n=319) 0.69 (0.57-0.81)
(n=232)
Type of respondent Patient alone or with proxy Proxy informant alone
0.68 (0.63-0.73)
(n=830) 0.82 (0.72-0.92)
(n=85)
0.75 (0.69-0.80)
(n=537) 0.86 (0.74-0.97)
(n=51)
4.5. Discussion
This study compared two main approaches to collecting information about global functional
outcome after TBI to determine whether clinician ratings on the GOSE structured interview
100
provide added value over respondent reports on the GOSE questionnaire. Overall GOSE scores
were found to be similar: there was perfect agreement for more than half of the patients, and
where discrepancies occurred, most were slight (i.e., within 1 category). Levels of agreement
for ratings on individual sections of the GOSE were also acceptable: concordance was strongest
for objective aspects of functioning such as independence in activities of daily living, and
weakest for subjective aspects of functioning such as TBI-symptoms and relationships. The
findings indicate that outcomes obtained using the two GOSE approaches are broadly
comparable and suggest that respondent reports on the GOSE questionnaire provide adequate
information about global functioning after TBI. Nevertheless, exploratory analyses revealed
that there are certain circumstances in which it may be preferable to supplement questionnaire
assessments with the GOSE structured interview. In particular, information obtained via the
structured interview may be particularly useful in the first 3 months after injury when assessing
patients with greater levels of disability or extracranial concomitant injuries/illness. The
structured interview may also be useful to distinguish between patients in the upper and lower
‘good recovery’ categories, as ratings for TBI symptoms were found to be inconsistent between
the two GOSE approaches.
At 3 months post-injury, dichotomized GOSE scores revealed that questionnaire responses
were systematically less favourable than structured interview ratings for patients with greater
levels of disability (i.e., those assigned to the ‘vegetative state’ and ‘severe disability’ outcome
groups). A possible explanation for this finding is that at 3-month follow-up, patients with
poorer outcomes may not have returned to previous daily activities, despite being capable of
doing so. They may therefore not have considered whether they would theoretically be
capable of activities such as looking after themselves at home, going shopping, or using public
transport. In contrast to self-reports on the GOSE questionnaire, when completing the GOSE
structured interview, investigators are encouraged to assess whether patients would
theoretically be capable of performing activities (Wilson et al., 1998). This may result in more
optimistic clinician ratings at the lower end of the scale. Small discrepancies between ratings
on the GOSE structured interview and GOSE questionnaire are not particularly important, but
101
may be problematic in study analyses, particularly if GOSE scores are dichotomized. As the
GOSE is often dichotomized in acute clinical trials, conventionally at the division between
‘moderate’ and ‘severe’ disability (Horton et al., 2018; McMillan et al., 2016), particular care
should be taken when assessing patients who may be unable to participate independently in
life roles outside the home.
A significant number of patients in the current study had characteristics that are associated
with poorer prognosis (Roozenbeek et al., 2012). For example, they were older than samples in
previous TBI studies, reflecting the increasing incidence of TBI in older adults (Brazinova et al.,
2016; Peeters, Majdan, Brazinova, Nieboer, & Maas, 2017; Peeters et al., 2015). Most of the
patients were admitted to the hospital ward or intensive care unit upon injury and around half
of them met criteria for ‘major trauma.’ Half of the patients had CT abnormalities, and more
than one-third also had severe extracranial injuries. Despite the potential for investigator
ratings to be influenced by knowledge of prognostic factors, outcomes were found to be similar
for the sub-group comparisons. Furthermore, despite the potential for respondent reports to
be influenced by lack of insight (Prigatano, 2005a, 2005b), outcomes on the two GOSE
approaches were not affected by injury severity. These results suggest that both GOSE
approaches can be used with patients with pre-existing functional limitations, epilepsy, and
moderate-to-severe TBI. Nevertheless, inconsistencies were found between the two GOSE
approaches for patients with functional limitations as a result of extracranial injury/illness in
combination with TBI. Agreement was in the moderate range at the 3-month follow-up for
patients in this sub-group, but improved at the 6-month follow-up. This finding may be due to
differences in the way in which extracranial injuries were rated on the GOSE structured
interview and GOSE questionnaire. However, the finding suggests that peripheral injury has a
substantial effect on the assessment of global functional outcome, but only in the first few
months after TBI. As severe extracranial injuries often occur alongside mild TBI and are
associated with poorer long-term functional outcomes (Leong et al., 2013), it is important to
pay attention when assessing daily functioning in patients with polytrauma, especially in the
first few months after injury.
102
The GOSE is quick and easy to administer and is associated with better follow-up rates than
other types of outcome assessment, such as neuropsychological tests (McMillan et al., 2016).
Consistent with guidance from the FDA (U.S. Food & Drug Administration, 2009), the GOSE
questionnaire is particularly useful in studies where interviewer bias may be an issue (i.e.,
surgical trials). The current study indicates that respondent reports on the GOSE questionnaire
are broadly equivalent to clinician ratings on the GOSE structured interview and can be used to
obtain information about daily functioning after TBI. The clinician-rated interview provided
modest added value over the respondent-completed questionnaire in CENTER-TBI. However,
the specific choice of outcomes will depend on the purposes of the research. For high stakes
situations in which the GOSE is the primary endpoint of the study, it is advisable to use a single
approach, and generally that will be the structured interview administered by trained assessors.
In circumstances where the GOSE is being collected together with other outcomes and there
are logistic constraints, studies may exploit the flexibility of the GOSE, and mixed data
collection modes can be utilised to facilitate participant retention at follow-up.
A key benefit of the current study is that the large sample sizes made it possible to explore
differences in that way symptoms were rated on the GOSE. Levels of agreement were weakest
for the symptoms section of the GOSE and symptoms were less likely to be endorsed by
patients if the GOSE questionnaire was completed. This finding is not surprising, as it can be
difficult to judge the impact of TBI-related symptoms on daily functioning: symptoms are the
most subjective aspect of daily functioning; they can be attributed to other causes; and they
may fluctuate over time. Different methods of eliciting information about symptoms have been
shown to result in inconsistent responses about TBI-related symptoms. For example, when
interviewed using a standardized checklist made-up of common post-mild TBI symptoms,
patients were found to report significantly more symptoms than if they are asked to freely
identify their symptoms (Villemure, Nolin, & Le Sage, 2011). With this in mind, investigators
should be aware of the potential influence different interviewing styles may have on patient
disclosures about TBI-related symptoms, and GOSE structured interview guidelines should be
followed to ensure that sufficient information is collected about whether symptoms are having
103
an impact on daily functioning (Wilson et al., 1998). For patients assigned to the ‘good
recovery’ categories, it may be necessary to include a supplementary assessment of TBI-
symptoms, such as the Rivermead Post-concussion Questionnaire (RPQ) (King et al., 1995), to
gather additional information about the impact of symptoms on daily activities.
4.5.1. Limitations
This study involved analysing CENTER-TBI data. Thus, it was not possible to employ an
experimental design. Investigators were not masked to information about prognostic factors or
scores on other outcome assessments and patient self-awareness was not measured directly.
Furthermore, as the GOSE was not collected in a uniform way across study sites, systematic
comparisons between different modes of data collection (i.e., telephone versus face-to-face
interviews; patient versus proxy informant) were not possible. Given these limitations, it would
be useful to conduct further research in which formal comparisons were made between
different data collection modes, using investigators who were masked to all other study
measures. However, conducting such a study may not be feasible, as multiple modes of GOSE
data collection would increase the burden of assessment and may prove difficult to obtain.
4.5.2. Conclusion
This study indicates that clinician-rated interviews and respondent-completed questionnaires
yield broadly comparable information concerning global functional outcome, even when used
with patients with pre-existing functional limitations, epilepsy, CT abnormalities, moderate-to-
severe TBI, and significant extracranial injuries. The study also suggests that in large-scale
studies with pragmatic constraints, information collected via interviews makes little overall
difference to GOSE ratings. However, there are certain circumstances in which the GOSE
structured interview may provide additional detail that is not captured by the GOSE
questionnaire, e.g., when assessing patients with greater functional limitations or significant
extracranial injury at 3-month follow-up, and when rating the impact of TBI-related symptoms
on daily life.
104
CHAPTER 5
The GOSE as a clinician-reported or patient-reported outcome
The study described in Chapter 4 provides evidence for the comparability of the clinican-rated
GOSE structured interview and respondent-reported GOSE questionnaire. However, it did not
examine the relationship between the two GOSE approaches and other variables. This chapter
will investigate whether there are systematic differences in the constructs being assessed using
the GOSE structured interview and GOSE questionnaire by examining how the two GOSE
approaches relate to prognotic factors and other outcome measures.
105
5.1. Abstract
The GOSE is conventionally classified as a clinician-reported outcome (ClinRO). However,
when administered as a self-completion questionnaire and scored mechanically, it can
essentially be considered a patient-reported outcome (PRO). The current study aimed to
examine the associations between the GOSE structured interview and GOSE questionnaire with
prognostic variables from the IMPACT and CRASH models, as well as with other types of
outcome measure, including PROs (measures of HRQoL, psychological status, and TBI
symptoms) and PerfOs (measures of cognition and physical functioning). The study used cross-
sectional data collected for CENTER-TBI at the 6-month follow-up and examined GOSE
assessments which were completed by TBI patients alone or with assistance from a proxy
respondent. A total of 537 patients were included in the study. On an ‘investigator bias’
hypothesis, the GOSE structured interview was predicted to have stronger associations with
prognostic variables and measures of cognition and physical functioning than the GOSE
questionnaire. On a ‘patient perspective’ hypothesis, the GOSE questionnaire was predicted to
have stronger associations with patient-reported questionnaires than the GOSE structured
interview. Most of the examined variables were found to have significant correlations with the
two GOSE approaches (-0.13 to 0.42 for prognostic factors; 0.29 to 0.65 for PROs; -0.14 to -0.32
for PerfOs), and consistent with previous research, the associations between the GOSE and
other outcome measures were modest. The correlations for the two GOSE approaches were
comparable, indicating that clinician-ratings and patient-reports of functional outcome were
equivalent in terms of how they related to prognostic factors and other outcome measures.
The findings therefore suggest that GOSE assignment is not affected by investigator bias or the
patient’s perspective. The current study also supports recommendations for the GOSE to be
used as part of a multi-dimensional approach to the assessment of TBI outcomes.
106
5.2. Introduction
The GOSE provides a global index of function after TBI, in that it addresses what the patient is
able to do, and categorises outcome by identifying the area of greatest limitation in daily
activities (Jennett et al., 1981). It has most commonly been administered as a clinician-rated
interview in RCTs in adult TBI (Horton et al., 2018). However, for pragmatic reasons, and to
avoid investigator bias in studies where blinding is not possible, the respondent-completed
questionnaire is increasingly being used as a primary mode of GOSE data collection in
multicentre clinical trials (Andrews et al., 2015; Gregson et al., 2015; Horton et al., 2018;
Hutchinson et al., 2017; Mendelow et al., 2015). The GOSE is conventionally classified as a
ClinRO, because when it is administered as a structured interview and rated by the interviewer,
outcomes are assigned using the professional judgement of the investigator (McMillan et al.,
2016; Powers et al., 2017). Nevertheless, when administered via questionnaire and scored
mechanically by algorithm, the GOSE can essentially be considered a PRO, as it offers an insight
into the perspective of the respondent without their ratings being interpreted by the
investigator (Walton et al., 2015; Wilson et al., 2002).
Evidence concerning the construct validity of the GOSE comes from the wide variety of studies
that have used it and from relationships described with clinical characteristics and other
outcome measures (McMillan et al., 2016). Recent analyses of the TRACK-TBI pilot study
sample indicate that the GOSE has small-to-medium correlations with acute measures of injury
severity (-0.18 to 0.39), psychological status (-0.40 to -0.52), TBI symptoms (-0.44 to -0.64),
satisfaction with life and HRQoL (0.38-0.42), and cognition (0.17 to 0.30) (Kreitzer et al., 2018;
Nelson, Ranson, Ferguson, Giacino, Okonkwo, Valadka, Manley, McCrea, et al., 2017).
Additionally, a recent meta-analysis of the neuropsychological predictors of functional outcome
demonstrates that the GOSE has significant correlations with assessments of immediate and
delayed verbal memory (0.43), visuo-spatial construction (0.29), set-shifting (response speed) (
-0.31), and generativity (0.44) (Allanson, Pestell, Gignac, Yeo, & Weinborn, 2017). Poorer
outcomes on the GOSE are associated with greater injury severity and longer PTA duration,
whereas better functional recovery is associated with lower levels of emotional distress, milder
107
TBI symptoms, better satisfaction with life, and better performance on cognitive tests (Allanson
et al., 2017; Kreitzer et al., 2018; Nelson, Ranson, Ferguson, Giacino, Okonkwo, Valadka,
Manley, McCrea, et al., 2017). The effect that GOSE modality of asssessment has on its
associations with clinical characteristics and other outcome measures has not specifically been
examined. It is therefore unclear whether clinician ratings and patient reports of functional
ability are comparable in terms of how they relate to prognostic variables and other outcome
domains.
In CENTER-TBI, unmasked outcome assessors may have been aware of acute prognostic
factors known to influence outcomes. The associations between the two GOSE approaches and
prognostic variables warrant exploration because ‘unmasked’ interviewers may be
unintentionally biased by their knowledge of the patient’s clinical status (Sherer et al., 2010).
Various prognostic models have been reported in TBI research (Lingsma, Roozenbeek,
Steyerberg, Murray, & Maas, 2010). However, the IMPACT (Steyerberg et al., 2008) and CRASH
(Collaborators et al., 2008) models are recommended over other prognostic models because
they were developed using large datasets and have also been externally validated (Maas,
Lingsma, & Roozenbeek, 2015; Roozenbeek et al., 2012). The IMPACT model was developed
using data from patients with moderate and severe TBI, whereas the CRASH model also
included patients with mild TBI. Both models include three core predictor variables: age,
Glasgow Coma Scale (GCS) full score or motor score, and pupillary reactivity to light. The basic
CRASH model also includes major extracranial injury as a predictor. The IMPACT and CRASH
predictions were derived using different methods of assessing functional outcome: the IMPACT
model was developed using guided interviews on the 5-point GOS (Steyerberg et al., 2008);
while the CRASH model was developed from a short questionnaire version of the 5-point GOS
which was completed primarily via mail (Roberts et al., 2004). It is therefore unclear whether
the way in which information was collected about functional outcome affected the final
prognostic models.
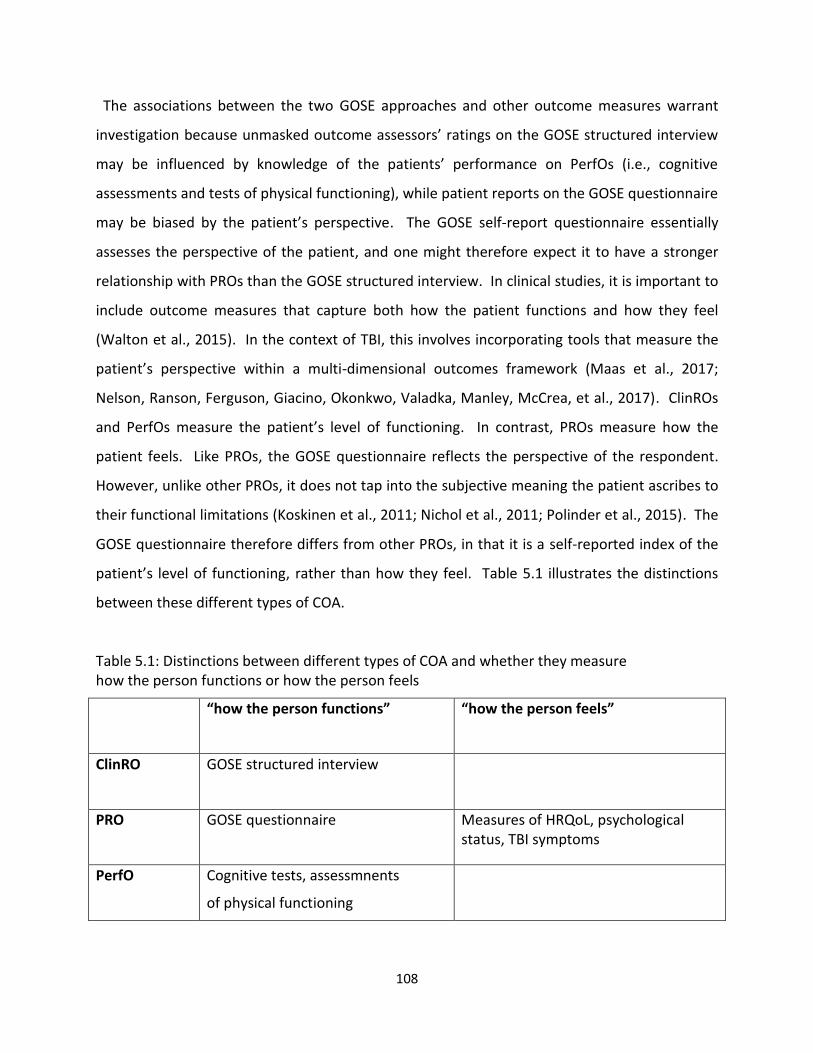
108
The associations between the two GOSE approaches and other outcome measures warrant
investigation because unmasked outcome assessors’ ratings on the GOSE structured interview
may be influenced by knowledge of the patients’ performance on PerfOs (i.e., cognitive
assessments and tests of physical functioning), while patient reports on the GOSE questionnaire
may be biased by the patient’s perspective. The GOSE self-report questionnaire essentially
assesses the perspective of the patient, and one might therefore expect it to have a stronger
relationship with PROs than the GOSE structured interview. In clinical studies, it is important to
include outcome measures that capture both how the patient functions and how they feel
(Walton et al., 2015). In the context of TBI, this involves incorporating tools that measure the
patient’s perspective within a multi-dimensional outcomes framework (Maas et al., 2017;
Nelson, Ranson, Ferguson, Giacino, Okonkwo, Valadka, Manley, McCrea, et al., 2017). ClinROs
and PerfOs measure the patient’s level of functioning. In contrast, PROs measure how the
patient feels. Like PROs, the GOSE questionnaire reflects the perspective of the respondent.
However, unlike other PROs, it does not tap into the subjective meaning the patient ascribes to
their functional limitations (Koskinen et al., 2011; Nichol et al., 2011; Polinder et al., 2015). The
GOSE questionnaire therefore differs from other PROs, in that it is a self-reported index of the
patient’s level of functioning, rather than how they feel. Table 5.1 illustrates the distinctions
between these different types of COA.
Table 5.1: Distinctions between different types of COA and whether they measure how the person functions or how the person feels
“how the person functions”
“how the person feels”
ClinRO
GOSE structured interview
PRO
GOSE questionnaire Measures of HRQoL, psychological status, TBI symptoms
PerfO
Cognitive tests, assessmnents
of physical functioning
109
5.2.1. Study aims
CENTER-TBI provides an opportunity to investigate how clinician-ratings and patient-reports of
functional outcome may differ in their associations with other factors. Thus, the current study
aimed to investigate the associations between the GOSE structured interview and GOSE
questionnaire with other CENTER-TBI measures, including:
Prognostic variables from the basic CRASH and core IMPACT models (i.e., age, GCS score,
pupil reactivity, and extracranial injury)
Other types of outcome measure, including PROs (i.e., measures of HRQoL, psychological
status, and TBI symptoms) and PerfOs (i.e., measures of cognition and physical functioning)
5.2.2. Hypotheses
Investigator bias
As the GOSE structured interview is based on investigator ratings, which can be influenced by
the interviewer’s knowledge of the patient, it will have stronger associations with acute stage
prognostic variables and PerfOs (i.e., measures of cognition and physical functioning) than the
patient-reported GOSE questionnaire.
Effect of the patient’s perspective
As the GOSE questionnaire is based on the patient’s self-report and not influenced by the
perspective of the investigator, it will have stronger associations with other PROs than the
GOSE structured interview.
5.3. Methods
5.3.1. Participants
Potentially eligible participants were selected from the 6-month CENTER-TBI sub-sample
described in Chapter 4, which comprised all surviving adult patients who were assessed using
the GOSE structured interview and GOSE questionnaire within a 3-week time interval at 6-
month follow-up. Patients were selected for the current study only if the GOSE assessments
110
were completed alone or with assistance, and not if they were completed by a proxy informant
alone.
5.3.2. Design
This study used cross-sectional data collected for the CENTER-TBI 6-month follow-up, which
included the GOSE, as well as the other outcome measures listed below.
5.3.3. Measures (all measures are described in detail in Chapter 3)
The following acute measures were used:
American Society of Anaesthesiologists’ (ASA) classification of Physical Health (Dripps, 1963)
Glasgow Coma Scale (GCS) (Teasdale & Jennett, 1974)
CT abnormality
Abbreviated Injury Scale (AIS) and Injury Severity Score (ISS) (Baker et al., 1974)
Injury severity was also categorised according to clinical care pathway (i.e., emergency
room (ER), admission to hospital ward (Admission), intensive care unit (ICU)).
The outcome measures used in this study are organised below according to the CDE outcome
domains (Wilde et al., 2010):
Global outcome
GOSE structured interview (Wilson et al., 1998)
GOSE questionnaire (Wilson et al., 2002)
36-Item Short Form Survey - Version 2 (SF-36v2) (Ware & Sherbourne, 1992)
Health-related quality of life
Quality of Life after Brain Injury Scale (QOLIBRI) (von Steinbüchel, Wilson, Gibbons,
Hawthorne, Hofer, Schmidt, Bullinger, Maas, Neugebauer, Powell, von Wild, Zitnay, Bakx,
Christensen, Koskinen, Sarajuuri, et al., 2010)
QOLIBRI Overall Scale (QOLIBRI-OS) (von Steinbüchel et al., 2012)
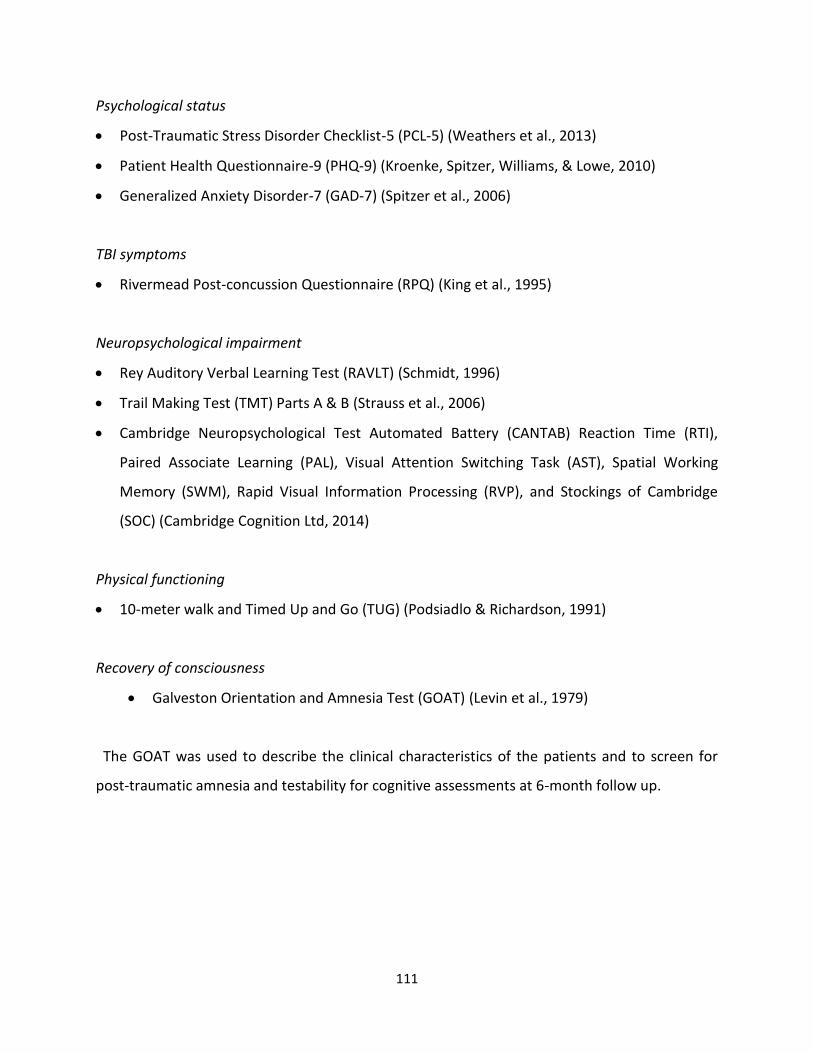
111
Psychological status
Post-Traumatic Stress Disorder Checklist-5 (PCL-5) (Weathers et al., 2013)
Patient Health Questionnaire-9 (PHQ-9) (Kroenke, Spitzer, Williams, & Lowe, 2010)
Generalized Anxiety Disorder-7 (GAD-7) (Spitzer et al., 2006)
TBI symptoms
Rivermead Post-concussion Questionnaire (RPQ) (King et al., 1995)
Neuropsychological impairment
Rey Auditory Verbal Learning Test (RAVLT) (Schmidt, 1996)
Trail Making Test (TMT) Parts A & B (Strauss et al., 2006)
Cambridge Neuropsychological Test Automated Battery (CANTAB) Reaction Time (RTI),
Paired Associate Learning (PAL), Visual Attention Switching Task (AST), Spatial Working
Memory (SWM), Rapid Visual Information Processing (RVP), and Stockings of Cambridge
(SOC) (Cambridge Cognition Ltd, 2014)
Physical functioning
10-meter walk and Timed Up and Go (TUG) (Podsiadlo & Richardson, 1991)
Recovery of consciousness
Galveston Orientation and Amnesia Test (GOAT) (Levin et al., 1979)
The GOAT was used to describe the clinical characteristics of the patients and to screen for
post-traumatic amnesia and testability for cognitive assessments at 6-month follow up.
112
5.3.4. Statistical analysis
Demographic and clinical characteristics
The demographic and clinical characteristics of the current study sample were described using
frequencies and percentages, and medians and inter-quartile ratios (IQR) were used for
continuous data (i.e., age and total ISS score).
Associations between the GOSE and other variables
Associations between the GOSE and other variables were assessed using Spearman
correlations. Non-parametric correlations were used because the GOSE is an ordinal scale and
because scores on several of the other measures were skewed. The two modes of GOSE data
collection were correlated separately with prognostic factors (i.e., age, GCS score, pupil
reactivity, and extracranial injury), and with other outcome measures (i.e., measures of HRQoL,
psychological status, TBI symptoms, cognition, and physical functioning). The significance level
was set at p<0.01 (two-tailed) for correlations, given the relatively large sample size. No formal
adjustments were made for multiple testing because both type 1 errors (i.e., finding spurious
relationships/differences) and type 2 errors (i.e., failing to detect relationships/differences) are
relevant to the study aims and hypotheses. Steiger’s test (Lee & Preacher, 2013; Steiger, 1980)
was used to examine whether the correlations for the GOSE structured interview and GOSE
questionnaire were significantly different from each other. All Steiger’s tests were two-tailed
and they were not performed if the correlations were identical, or if both correlations were
non-significant at the p<0.01 level. All statistical analyses were conducted using IBM SPSS
Statistics 23. The data were downloaded from the INCF Neurobot database (Version 1) on 8
November 2018.
5.4. Results
5.4.1. Demographic and clinical characteristics
A total of 537 patients met the inclusion criteria for this study (i.e., they were eligible for the 6-
month follow-up, scored in the ‘lower severe disability’ category or better, and completed both
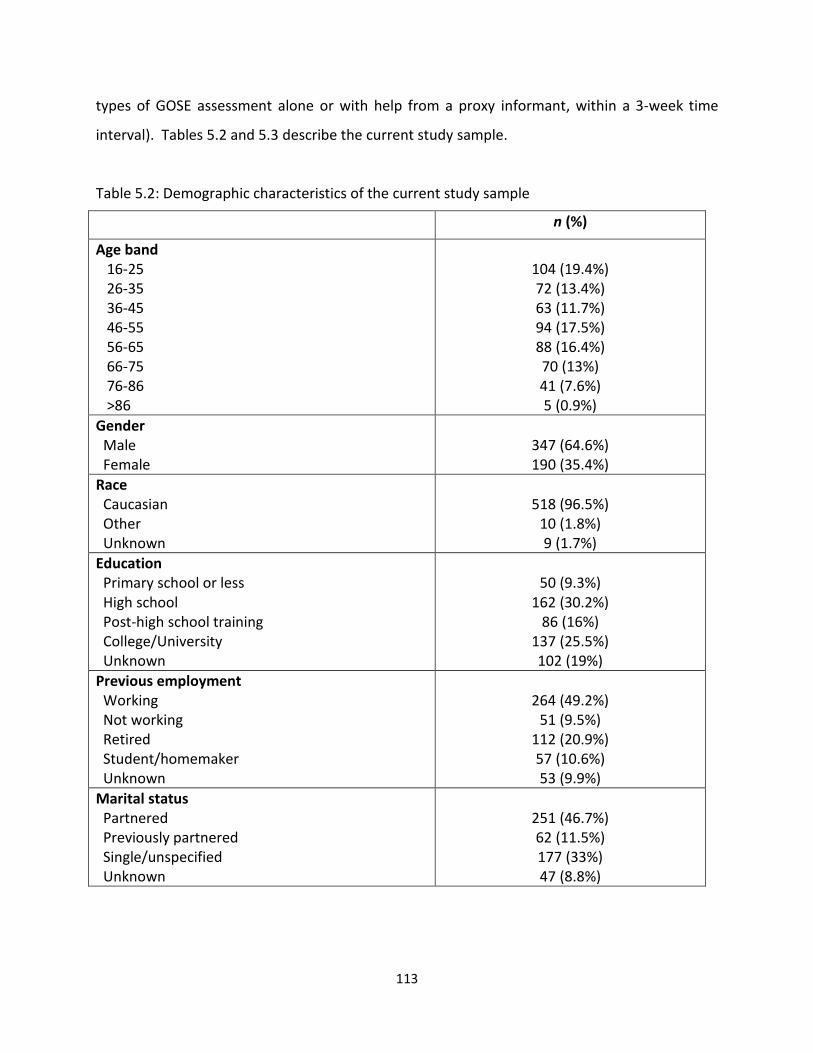
113
types of GOSE assessment alone or with help from a proxy informant, within a 3-week time
interval). Tables 5.2 and 5.3 describe the current study sample.
Table 5.2: Demographic characteristics of the current study sample
n (%)
Age band 16-25 26-35 36-45 46-55 56-65 66-75 76-86 >86
104 (19.4%) 72 (13.4%) 63 (11.7%) 94 (17.5%) 88 (16.4%) 70 (13%) 41 (7.6%) 5 (0.9%)
Gender Male Female
347 (64.6%) 190 (35.4%)
Race Caucasian Other Unknown
518 (96.5%)
10 (1.8%) 9 (1.7%)
Education Primary school or less High school Post-high school training College/University Unknown
50 (9.3%)
162 (30.2%) 86 (16%)
137 (25.5%) 102 (19%)
Previous employment Working Not working Retired Student/homemaker Unknown
264 (49.2%)
51 (9.5%) 112 (20.9%) 57 (10.6%) 53 (9.9%)
Marital status Partnered Previously partnered Single/unspecified Unknown
251 (46.7%) 62 (11.5%) 177 (33%) 47 (8.8%)
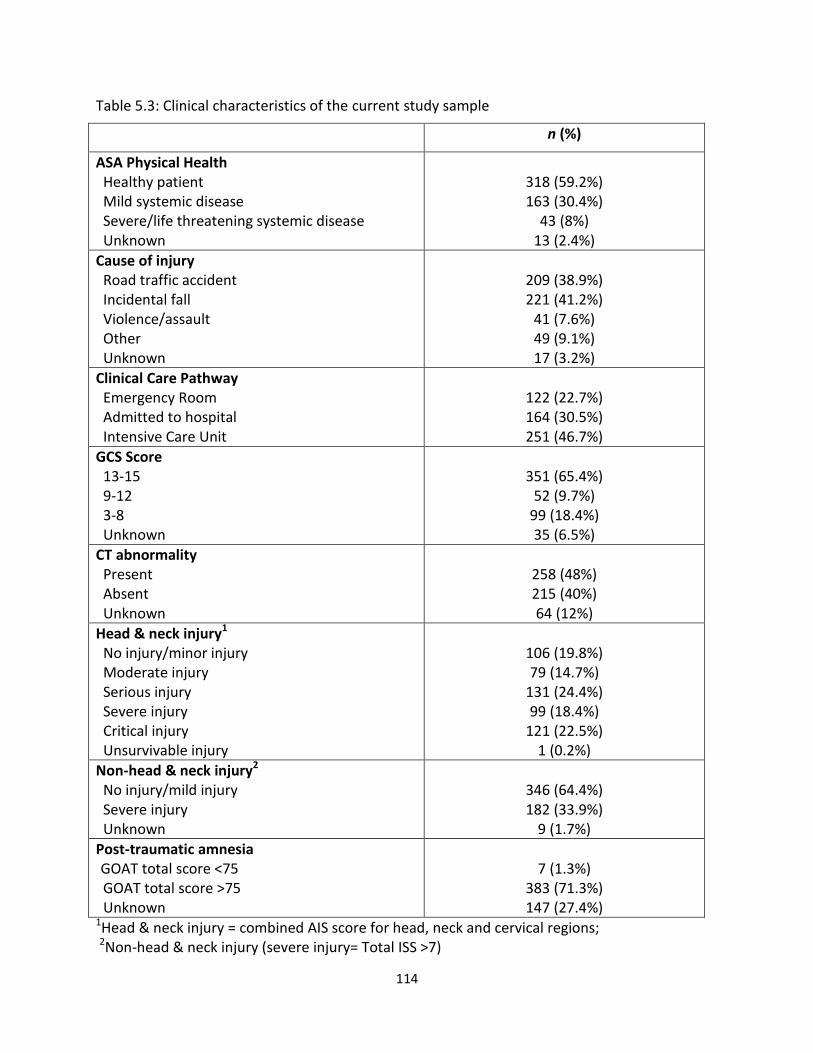
114
Table 5.3: Clinical characteristics of the current study sample
n (%)
ASA Physical Health Healthy patient Mild systemic disease Severe/life threatening systemic disease Unknown
318 (59.2%) 163 (30.4%)
43 (8%) 13 (2.4%)
Cause of injury Road traffic accident Incidental fall Violence/assault Other Unknown
209 (38.9%) 221 (41.2%)
41 (7.6%) 49 (9.1%) 17 (3.2%)
Clinical Care Pathway Emergency Room Admitted to hospital Intensive Care Unit
122 (22.7%) 164 (30.5%) 251 (46.7%)
GCS Score 13-15 9-12 3-8 Unknown
351 (65.4%)
52 (9.7%) 99 (18.4%) 35 (6.5%)
CT abnormality Present Absent Unknown
258 (48%) 215 (40%) 64 (12%)
Head & neck injury1 No injury/minor injury Moderate injury Serious injury Severe injury Critical injury Unsurvivable injury
106 (19.8%) 79 (14.7%)
131 (24.4%) 99 (18.4%)
121 (22.5%) 1 (0.2%)
Non-head & neck injury2
No injury/mild injury Severe injury Unknown
346 (64.4%) 182 (33.9%)
9 (1.7%)
Post-traumatic amnesia
GOAT total score <75 GOAT total score >75 Unknown
7 (1.3%)
383 (71.3%) 147 (27.4%)
1Head & neck injury = combined AIS score for head, neck and cervical regions; 2Non-head & neck injury (severe injury= Total ISS >7)
115
The median (IQR) age for the current study sample was 50 years (30-63). Around two-thirds of
the patients were male, and the majority were Caucasian. Most patients had high school, post-
high school, or college-university education. Around half of the patients were in employment
prior to injury, and around half of them were partnered. Most of the patients were healthy or
had mild systemic disease (i.e., conditions with no functional limitation) prior to injury. Road
traffic accidents and incidental falls were the most common causes of injury, accounting for
around 80% of the sample. Most of the patients were either admitted to the hospital ward or
intensive care unit. Around two-thirds of the sample had GCS scores of 13-15, while almost half
had CT abnormalities. The median (IQR) total ISS for the sample was 16 (8-27), which is above
the threshold for major trauma (i.e., ≥15). A total of 50.3% (n=270) of the patients met criteria
for major trauma, and around one-third had severe non-head and neck injuries. Most of
patients who were tested (i.e., 72.6% of the study sample) scored above 75 on the GOAT and
were therefore no longer in post-traumatic amnesia.
5.4.2. Associations between the GOSE and other variables
The correlation between the structured interview and questionnaire was significant at the
0.01 level (2-tailed, rho = 0.72), indicating a strong positive association between GOSE scores.
Spearman correlations for the GOSE structured interview and GOSE questionnaire against other
variables are displayed in Tables 5.4 - 5.6. Prognostic variables are displayed in Table 5.4, PROs
are displayed in Table 5.5, and PerfOs are displayed in Table 5.6.
Table 5.4 shows that most prognostic variables had significant correlations at the p<0.01 level,
apart from the correlation between age and the GOSE questionnaire, which was non-
significant. The correlations were strongest for GCS Score and total ISS (correlations ranged
from 0.37 to 0.42), and weakest for pupil reactivity and age (ranging from -0.04 to -0.19).
Steiger’s test was significant for age only (Z = -2.80, p<0.01), indicating that age correlated more
strongly with scores on the GOSE structured interview than it did with scores on the GOSE
questionnaire. Nevertheless, the strength of the relationship between age and scores on the
GOSE was very weak and accounted for only 2% of the variance. Thus, there was little support
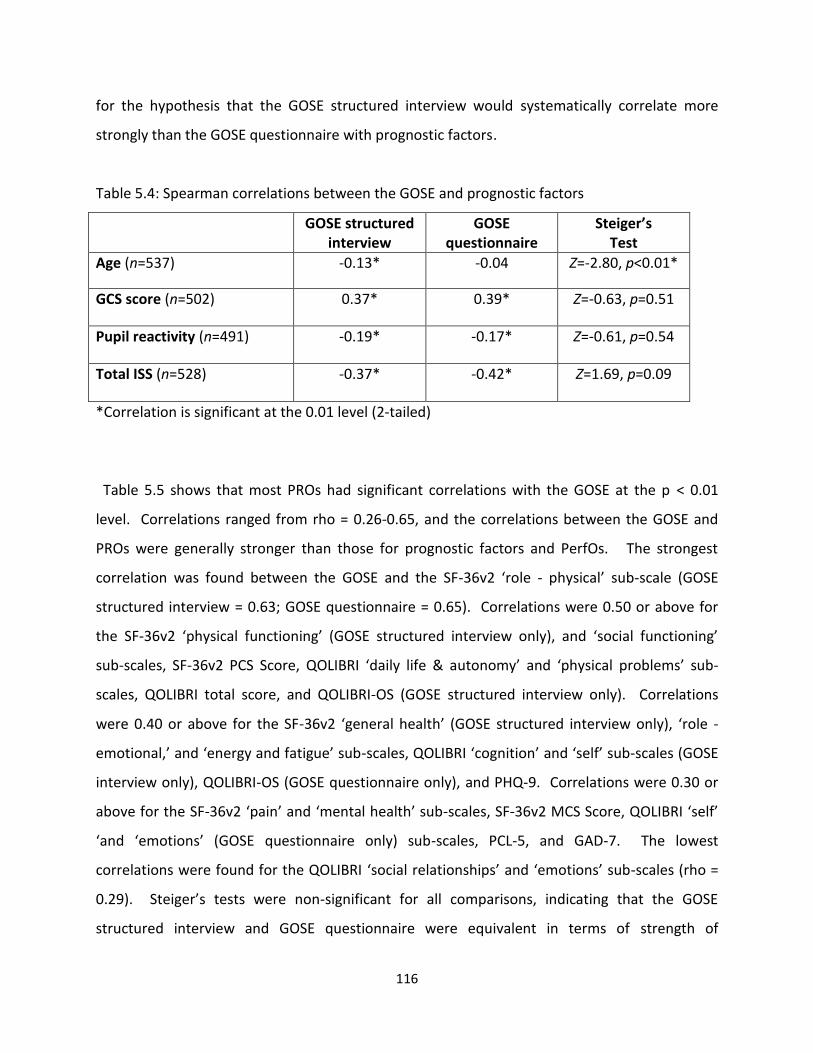
116
for the hypothesis that the GOSE structured interview would systematically correlate more
strongly than the GOSE questionnaire with prognostic factors.
Table 5.4: Spearman correlations between the GOSE and prognostic factors
GOSE structured interview
GOSE questionnaire
Steiger’s Test
Age (n=537) -0.13* -0.04 Z=-2.80, p<0.01*
GCS score (n=502) 0.37* 0.39* Z=-0.63, p=0.51
Pupil reactivity (n=491) -0.19* -0.17* Z=-0.61, p=0.54
Total ISS (n=528) -0.37* -0.42* Z=1.69, p=0.09
*Correlation is significant at the 0.01 level (2-tailed)
Table 5.5 shows that most PROs had significant correlations with the GOSE at the p < 0.01
level. Correlations ranged from rho = 0.26-0.65, and the correlations between the GOSE and
PROs were generally stronger than those for prognostic factors and PerfOs. The strongest
correlation was found between the GOSE and the SF-36v2 ‘role - physical’ sub-scale (GOSE
structured interview = 0.63; GOSE questionnaire = 0.65). Correlations were 0.50 or above for
the SF-36v2 ‘physical functioning’ (GOSE structured interview only), and ‘social functioning’
sub-scales, SF-36v2 PCS Score, QOLIBRI ‘daily life & autonomy’ and ‘physical problems’ sub-
scales, QOLIBRI total score, and QOLIBRI-OS (GOSE structured interview only). Correlations
were 0.40 or above for the SF-36v2 ‘general health’ (GOSE structured interview only), ‘role -
emotional,’ and ‘energy and fatigue’ sub-scales, QOLIBRI ‘cognition’ and ‘self’ sub-scales (GOSE
interview only), QOLIBRI-OS (GOSE questionnaire only), and PHQ-9. Correlations were 0.30 or
above for the SF-36v2 ‘pain’ and ‘mental health’ sub-scales, SF-36v2 MCS Score, QOLIBRI ‘self’
‘and ‘emotions’ (GOSE questionnaire only) sub-scales, PCL-5, and GAD-7. The lowest
correlations were found for the QOLIBRI ‘social relationships’ and ‘emotions’ sub-scales (rho =
0.29). Steiger’s tests were non-significant for all comparisons, indicating that the GOSE
structured interview and GOSE questionnaire were equivalent in terms of strength of
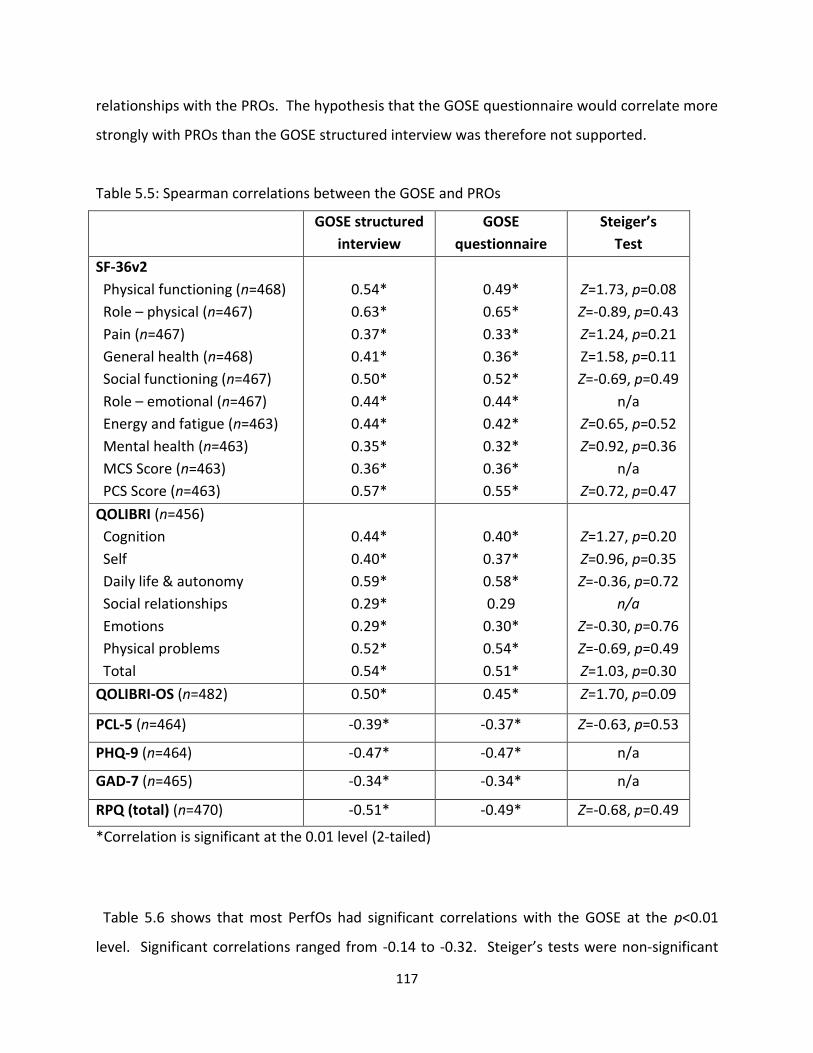
117
relationships with the PROs. The hypothesis that the GOSE questionnaire would correlate more
strongly with PROs than the GOSE structured interview was therefore not supported.
Table 5.5: Spearman correlations between the GOSE and PROs
GOSE structured
interview
GOSE
questionnaire
Steiger’s
Test
SF-36v2
Physical functioning (n=468)
Role – physical (n=467)
Pain (n=467)
General health (n=468)
Social functioning (n=467)
Role – emotional (n=467)
Energy and fatigue (n=463)
Mental health (n=463)
MCS Score (n=463)
PCS Score (n=463)
0.54*
0.63*
0.37*
0.41*
0.50*
0.44*
0.44*
0.35*
0.36*
0.57*
0.49*
0.65*
0.33*
0.36*
0.52*
0.44*
0.42*
0.32*
0.36*
0.55*
Z=1.73, p=0.08
Z=-0.89, p=0.43
Z=1.24, p=0.21
Z=1.58, p=0.11
Z=-0.69, p=0.49
n/a
Z=0.65, p=0.52
Z=0.92, p=0.36
n/a
Z=0.72, p=0.47
QOLIBRI (n=456)
Cognition
Self
Daily life & autonomy
Social relationships
Emotions
Physical problems
Total
0.44*
0.40*
0.59*
0.29*
0.29*
0.52*
0.54*
0.40*
0.37*
0.58*
0.29
0.30*
0.54*
0.51*
Z=1.27, p=0.20
Z=0.96, p=0.35
Z=-0.36, p=0.72
n/a
Z=-0.30, p=0.76
Z=-0.69, p=0.49
Z=1.03, p=0.30
QOLIBRI-OS (n=482) 0.50* 0.45* Z=1.70, p=0.09
PCL-5 (n=464) -0.39* -0.37* Z=-0.63, p=0.53
PHQ-9 (n=464) -0.47* -0.47* n/a
GAD-7 (n=465) -0.34* -0.34* n/a
RPQ (total) (n=470) -0.51* -0.49* Z=-0.68, p=0.49
*Correlation is significant at the 0.01 level (2-tailed)
Table 5.6 shows that most PerfOs had significant correlations with the GOSE at the p<0.01
level. Significant correlations ranged from -0.14 to -0.32. Steiger’s tests were non-significant
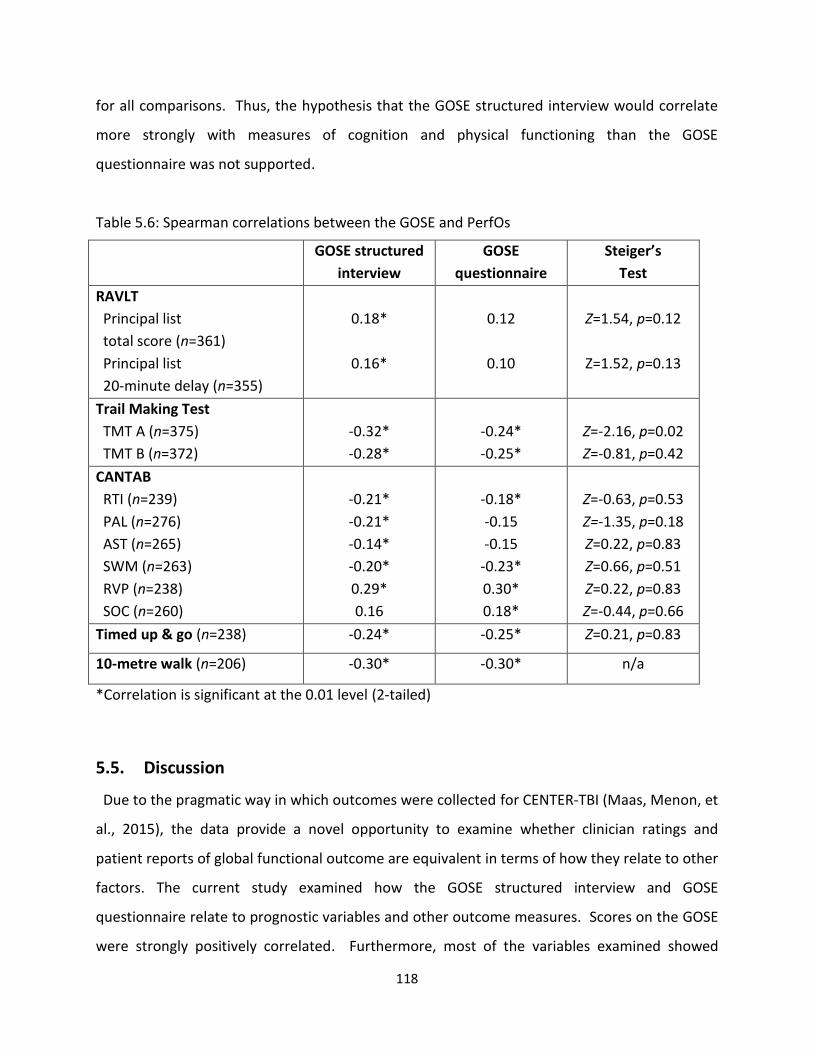
118
for all comparisons. Thus, the hypothesis that the GOSE structured interview would correlate
more strongly with measures of cognition and physical functioning than the GOSE
questionnaire was not supported.
Table 5.6: Spearman correlations between the GOSE and PerfOs
GOSE structured
interview
GOSE
questionnaire
Steiger’s
Test
RAVLT
Principal list
total score (n=361)
Principal list
20-minute delay (n=355)
0.18*
0.16*
0.12
0.10
Z=1.54, p=0.12
Z=1.52, p=0.13
Trail Making Test
TMT A (n=375)
TMT B (n=372)
-0.32*
-0.28*
-0.24*
-0.25*
Z=-2.16, p=0.02
Z=-0.81, p=0.42
CANTAB
RTI (n=239)
PAL (n=276)
AST (n=265)
SWM (n=263)
RVP (n=238)
SOC (n=260)
-0.21*
-0.21*
-0.14*
-0.20*
0.29*
0.16
-0.18*
-0.15
-0.15
-0.23*
0.30*
0.18*
Z=-0.63, p=0.53
Z=-1.35, p=0.18
Z=0.22, p=0.83
Z=0.66, p=0.51
Z=0.22, p=0.83
Z=-0.44, p=0.66
Timed up & go (n=238) -0.24* -0.25* Z=0.21, p=0.83
10-metre walk (n=206) -0.30* -0.30* n/a
*Correlation is significant at the 0.01 level (2-tailed)
5.5. Discussion
Due to the pragmatic way in which outcomes were collected for CENTER-TBI (Maas, Menon, et
al., 2015), the data provide a novel opportunity to examine whether clinician ratings and
patient reports of global functional outcome are equivalent in terms of how they relate to other
factors. The current study examined how the GOSE structured interview and GOSE
questionnaire relate to prognostic variables and other outcome measures. Scores on the GOSE
were strongly positively correlated. Furthermore, most of the variables examined showed
119
significant associations, albeit small-to-medium in magnitude, in the expected directions with
the GOSE. On an ‘investigator bias’ hypothesis, the structured interview was predicted to have
stronger associations with prognostic variables and measures of cognition and physical
functioning than the questionnaire; whereas on a ‘patient perspective’ hypothesis, the
questionnaire was predicted to have stronger associations with other patient-reported
questionnaires than the structured interview. The two GOSE approaches were comparable in
terms of the strength of their relationships with the other variables, suggesting that neither
investigator’s knowledge about patients, nor the patient’s perspective, affected GOSE ratings.
Blinding of outcome assessors is a particularly important methodological aspect of design in
clinical trials because investigator bias can give rise to misleading results which are aligned with
expected treatment benefits or predictor variables (Schulz et al., 2010; Sherer et al., 2010). A
similar problem arises with prognostic studies and observational studies in comparative
effectiveness research. As the CENTER-TBI outcome assessors were not masked to information
concerning the patient’s clinical status and GOSE interviewers potentially had knowledge about
the patient’s performance on tests of cognition and physical functioning, there was the
possibility for clinician ratings on the GOSE structured interview to be biased. Despite this, the
prognostic variables and PerfOs examined in the current study were found to have equivalent
relations with two GOSE approaches. These findings suggest that ratings on the GOSE
structured interview were largely unaffected by the investigators’ knowledge of the patient.
These findings also have implications for prognostic studies in TBI, as the IMPACT (Steyerberg et
al., 2008) and CRASH (Collaborators et al., 2008) predictions were derived using different
methods of data collection for the GOS (i.e., guided interviews and postal questionnaires). The
similarity between clinician ratings and patient reports with predictor variables suggests that
the IMPACT and CRASH models were unlikely to have been affected by the way in which
information was collected about global outcome.
Regulators have encouraged the use of PROs in TBI studies because they capture the patient’s
perspective and provide information about how they are feeling (U.S. Food & Drug
120
Administration, 2009). The GOSE and SF-36v2 are both categorised as measures of global
outcome in the NINDS CDEs (Wilde et al., 2010). Thus, in CENTER-TBI, the GOSE self-report
questionnaire and the SF-36v2 both provided information about the patient’s perspective
about their level of global functioning after TBI. In the current study, both GOSE approaches
were found to have the strongest associations with domains relating to physical functioning on
the SF-36v2 (i.e., correlations for the ‘physical functioning,’ ‘role-physical,’ and PCS score
ranged from 0.49 to 0.65). The strength of these associations indicates that the SF-36v2
captures the construct of global functional outcome in TBI, and suggests that it could be used as
a substitute for the GOSE. It is important to note, however, that unlike the GOSE, the SF-36v2
does not take prior functional limitations or changes in functional status since TBI into
consideration. The language used in the SF-36v2 may also be challenging for patients with
cognitive impairment. The SF-36v2 might therefore have limitations when used with TBI
patients with pre-existing functional limitations, cognitive impairment, or communication
difficulties, whereas the GOSE is appropriate for use with these individuals.
Concerns have been raised about the use of PROs in TBI studies, as patients with more severe
injuries may be unaware of their own limitations, and may therefore paint an overly optimistic
picture of their recovery (Prigatano, 2005a, 2005b). It may not always be advisable to use
PROs, including the GOSE questionnaire, in TBI studies. Nevertheless, in the current study, the
two GOSE approaches were found to be equivelant in terms of their associations with PROs,
suggesting that patient reports of global functioning can be used in situations where clinician-
ratings are not possible due to pragmatic constraints. These findings suggest that patients were
able to provide an accurate self-report about global functioning and a realistic appraisal of their
HRQoL, psychological status, and TBI symptoms. It would, however, be useful to conduct
further research in which self-awareness was examined directly. The use of a direct measure of
self-awareness, such as the Patient Competency Rating Scale (Prigatano & Fordyce, 1986),
along with the use of proxy only reports on the GOSE questionnaire, would enable a more
rigorous examination of this issue.
121
The associations between the GOSE and other factors were in the expected directions in the
current study. Greater disability was associated with older age, greater injury severity, and
greater severity of patient-reported PTSD symptoms, depression, anxiety, and post-concussion
symptoms. In contrast, better functional recovery was associated with better patient-reported
HRQoL and better performance on cognitive assessments and tests of physical functioning.
These findings are consistent with previous research (Allanson et al., 2017; Kreitzer et al., 2018;
Nelson, Ranson, Ferguson, Giacino, Okonkwo, Valadka, Manley, McCrea, et al., 2017), and
demonstrate that the variables examined in this study tap into the construct of global
functional outcome. Nevertheless, as the associations between the GOSE and other outcome
measures were modest, it is clear that the GOSE may miss important details about specific
aspects of functioning after TBI, especially in the cognitive domain. A multi-dimensional
approach has been recommended by TRACK-TBI and CENTER-TBI investigators to adequately
characterise outcome after TBI (Maas et al., 2017; Nelson, Ranson, Ferguson, Giacino,
Okonkwo, Valadka, Manley, McCrea, et al., 2017). It should be noted, however, that TBI
patients can be a hard to reach population and comprehensive follow-up assessments can be
challenging to obtain. Consideration should therefore be given to how feasible it is to include
multiple outcome measures in TBI studies.
5.5.1. Limitations
This study builds upon the findings reported in Chapter 4, as it provides further evidence for
the comparability of the GOSE structured interview and GOSE questionnaire and suggests that
the two approaches have shared underlying constructs. Nevertheless, some key limitations
should be mentioned. Firstly, the observational nature of the CENTER-TBI study meant that it
was not possible to employ an experimental design and systematic comparisons between GOSE
approaches, including proxy informant reports on the GOSE questionnaire, were not possible.
Secondly, as no direct measure of self-awareness was used in CENTER-TBI, the study lacks
verification about the accuracy of patients’ self-reported difficulties on the GOSE and other
PROs. Thirdly, the current study did not consider the effect of baseline predictors of outcome,
such as age and injury severity, on the strength of the correlations between the two GOSE
122
approaches and other outcome measures. The causal relationship between prognostic factors
and TBI outcomes was not examined in this thesis, but is a potential area for investigation in
future CENTER-TBI analyses.
5.5.2. Conclusion
This study provides further evidence for the comparability of the GOSE structured interview
and GOSE questionnaire and demonstrates that the variables examined tap into the underlying
construct of global functional outcome. GOSE assignment was largely unaffected by
investigator bias or by the patient’s perspective. Therefore, where appropriate, future
observational TBI studies can exploit the flexibility of the GOSE and employ a pragmatic
approach to GOSE administration, to facilitate data collection and maximise study follow-up
rates. As the associations between the GOSE and other outcome measures were modest, the
findings from this study also indicate that the GOSE is insufficient on its own for describing the
sequelae of TBI. TBI studies should therefore incorporate multiple assessments across outcome
domains to capture how the patient feels and functions. However, as the use of multiple
outcome measures might not always be feasible, further research is needed to explore how a
multi-dimensional approach to assessing TBI outcomes can be implemented.
123
CHAPTER 6
CENTER-TBI outcome measures
in relation to post-TBI functional level
This chapter examines the CENTER-TBI outcome measures with patients at different levels of
functional recovery and considers the practicality of tailoring multi-dimensional outcome
assessment to TBI sub-groups.
124
6.1. Abstract
There is increasing awareness of the importance of multi-dimensional outcome assessment in
TBI studies in acute care settings, but currently no consensus about how it might be
implemented. The current study examined the completeness, sensitivity, and internal
consistency of the CENTER-TBI outcome measures in relation to GOSE assignment and
considered how multi-dimensional outcome assessment could be tailored for patients with
different post-TBI functional levels. The study used cross-sectional data collected from 2573
survivors who were followed up 6 months after injury using the GOSE. Patients with better
levels of functional recovery were found to have better outcome completion rates than those
with poorer functional recovery, indicating that multi-dimensional outcome assessment is
particularly challenging to implement with patients with severe disabilities. Furthermore, PRO
completion rates were better than those for cognitive assessments and tests of physical
functioning; highlighting the logistic challenge posed by PerfOs in large-scale TBI studies. Most
of the PROs and some CANTAB sub-tests had ceiling effects, particularly when completed with
patients with better functional recovery. Certain measures therefore lacked sensitivity across
the spectrum of recovery. Ceiling effects were most common for patients with better levels of
recovery and were most notable on measures of emotional adjustment, TBI symptoms and the
CANTAB Paired Associates Learning test. Floor effects were minimal, but present for patients in
the ‘lower severe disability’ group on some of the SF-36v2 sub-scales, and on measures of
physical functioning. The PROs had high levels of internal consistency across the GOSE
categories, indicating that when questionnaires were completed, they were reliable across the
spectrum of recovery. The findings from this study demonstrate that the applicability of TBI
outcome measures is strongly driven by level of functional outcome. Thus, a tailored approach
to multi-dimensional outcome assessment allows investigators to capture the multi-
dimensional impact of TBI across different levels of functional recovery: this approach to
outcome assessment has not commonly been implemented in research in acute care settings.
The findings from this study have implications for selecting outcomes for retrospective analyses
of data collected for CENTER-TBI, for future prospective TBI studies, and for future refinement
of the CDE outcome measures for adult TBI.
125
6.2. Introduction
Multi-dimensional outcome assessment is important in TBI, because, in contrast to using a
measure of global functioning such as the GOSE, it enables investigators to characterise
outcomes in a comprehensive and granular way by capturing changes in domains of specific
interest. The implementation of multi-dimensional outcome assessment poses a significant
challenge to TBI studies, particularly in acute care settings. Thus, current data standardization
initiatives are aiming to increase comparability of studies and validate and refine multi-
dimensional sets of outcome measures that can be used across the TBI spectrum (Hicks et al.,
2013; Tosetti et al., 2013; Wilde et al., 2010). The heterogeneity of TBI makes the
implementation of multi-dimensional outcome assessment particularly complex, because
patients with different levels of injury severity and functional recovery represent different
contexts of use (U.S. Food & Drug Administration, 2014; Walton et al., 2015) for outcome
measures. Certain outcome measures may not be suitable for use across the TBI spectrum.
However, this has not always been properly acknowledged in TBI research. Consideration
should therefore be given to how appropriate particular assessments are for use with different
sub-groups of patients.
There are a number of potential ways of approaching multi-dimensional outcome assessment
in TBI, but currently no consensus about how it should be implemented. Selection of the NINDS
common data elements (CDE) outcome measures for TBI was based on expert opinion and took
into consideration a range of factors, including the applicability of assessments across a range
of injury severity and functional levels; how easy assessments are to administer; and their
brevity (Hicks et al., 2013; Wilde et al., 2010). The CDEs include recommendations for the use
of outcome assessments in two populations (adult and paediatric) and four study types
(epidemiology, acute hospital, moderate-to-severe TBI rehabilitation, mild TBI/concussion)
(National Institute of Neurological Disorders and Stroke, 2018b). Some advice is also provided
concerning the applicability of specific tools; for example, administration of the WAIS
processing speed index tests requires “a functional level in the severe disability or above on the
GOS/GOSE” (National Institute of Neurological Disorders and Stroke, 2018a). There are other
126
study types in addition to those included in the CDE recommendations, and in practice there
will be study-specific reasons for choosing particular outcome measures.
As the CDE recommendations are not derived from systematic empirical work, research is
required to assess the applicability of outcome measures in TBI studies. CENTER-TBI and
TRACK-TBI aim to validate the applicability of the CDEs in different contexts of use and both
projects have among their objectives that of developing a “sliding” or “flexible” approach in
which outcome assessments are tailored for different sub-groups of TBI patients (Maas et al.,
2015; Yue et al., 2018; Yue et al., 2013). This type of tailored approach could be used when
selecting outcome measures in prospective studies and could also guide retrospective analyses
of data collected for large observational studies, such as CENTER-TBI and TRACK-TBI. There are
several possible ways in which a sliding approach could be implemented. TRACK-TBI
investigators have proposed a prospective flexible outcomes assessment framework in which
patients are stratified into two tiers based on scores on the GOAT: the abbreviated outcomes
battery is suitable for patients who lack orientation (i.e., GOAT scores < 75); whereas the
comprehensive outcomes battery is suitable for patients with GOAT scores of 75 or above (Yue
et al., 2018). An alternative would be to use the GOSE to stratify patients into functional
recovery sub-groups for tailored outcome assessment. The use of functional status to guide the
selection of assessments for individual patients is common in clinical practice, but there has
been no formal evaluation of this approach in TBI research.
The CDE conception of multi-dimensional outcome assessment places the GOSE alongside
other instruments as a specific assessment in the domain of functional outcome (Kean & Malec,
2014; Maas et al., 2017; Wilde et al., 2010). An alternative conception is to consider the GOSE
as an overall description of outcome, albeit one that is lacking in detail (Nelson, Ranson,
Ferguson, Giacino, Okonkwo, Valadka, Manley, McCrea, et al., 2017). The GOSE summarises
daily functioning and social reintegration after TBI (Jennett et al., 1981; McMillan et al., 2016),
but it does not fully capture specific problems patients may experience, particularly in the
domains of emotional wellbeing, cognition, and life satisfaction (Alali et al., 2015; Maas et al.,
127
2017; McMillan et al., 2016; Menon & Maas, 2015; Nelson, Ranson, Ferguson, Giacino,
Okonkwo, Valadka, Manley, McCrea, et al., 2017; Nichol et al., 2011; Weir et al., 2012; Wilson
et al., 2000). As correlations between the GOSE and other outcome measures are often modest
(Allanson et al., 2017; Kreitzer et al., 2018; Nelson, Ranson, Ferguson, Giacino, Okonkwo,
Valadka, Manley, McCrea, et al., 2017), additional assessment tools are necessary to fully
characterise outcome after TBI. The construct of global functional outcome misses important
aspects of the patient’s feeling and functioning (Walton et al., 2015). Thus, it is important to
incorporate other types of COA in TBI studies: PROs capture the patient’s perspective and
measure changes in how the patient feels, while PerfOs are objective and tap into specific
aspects of the patient’s functioning (U.S. Food & Drug Administration, 2009; Walton et al.,
2015). Figure 6.1 is a schematic diagram, modified from Nelson and colleagues (Nelson,
Ranson, Ferguson, Giacino, Okonkwo, Valadka, Manley, McCrea, et al., 2017) depicting the
outcome domains, individual outcome measures, and types of COA that were used in the
CENTER-TBI study, and whether they assessed the patient’s functioning or feeling.
It would be informative to investigate how multi-dimensional outcome assessment could be
tailored in relation to post-TBI functional level. Patients assigned to different GOSE categories
potentially have different assessment needs and therefore represent different contexts of use
for outcome measures (Maas et al., 2017; Nelson, Ranson, Ferguson, Giacino, Okonkwo,
Valadka, Manley, McCrea, et al., 2017). Patients with severe disabilities may be unable to
complete certain assessments such as questionnaires, cognitive tests, and tests of physical
mobility, and may require assistance when completing the GOSE; whereas patients with good
functional recovery may meet diagnostic criteria for psychological conditions or have clinically
relevant TBI-related symptoms, which the GOSE is unable to fully capture (Maas et al., 2017;
Nelson, Ranson, Ferguson, Giacino, Okonkwo, Valadka, Manley, McCrea, et al., 2017). As the
measurement properties of outcome assessments can be affected by the setting in which they
are used (Walton et al., 2015), it is important to ensure that the instruments selected for
specific TBI sub-groups are appropriate for their intended context of use (U.S. Food & Drug
Administration, 2014; Walton et al., 2015). Specifically, there is a need for advice on the use of
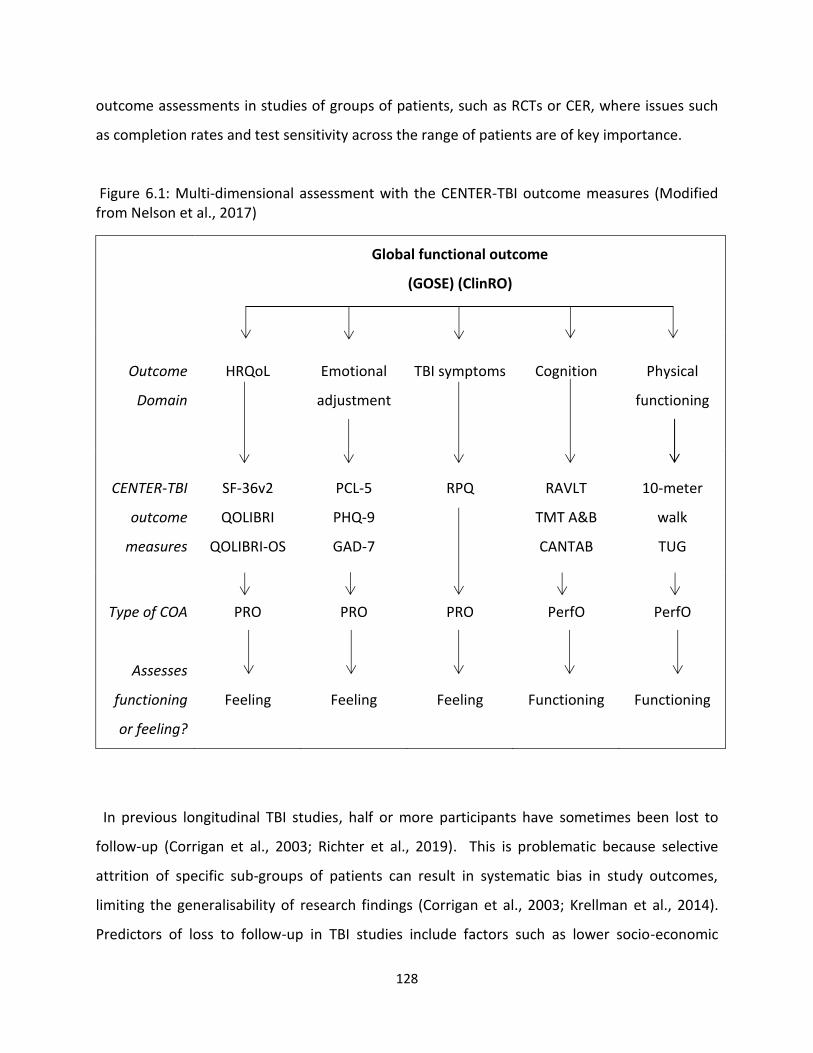
128
outcome assessments in studies of groups of patients, such as RCTs or CER, where issues such
as completion rates and test sensitivity across the range of patients are of key importance.
Figure 6.1: Multi-dimensional assessment with the CENTER-TBI outcome measures (Modified from Nelson et al., 2017)
Global functional outcome
(GOSE) (ClinRO)
Outcome
Domain
HRQoL
Emotional
adjustment
TBI symptoms
Cognition
Physical
functioning
CENTER-TBI
outcome
measures
SF-36v2
QOLIBRI
QOLIBRI-OS
PCL-5
PHQ-9
GAD-7
RPQ
RAVLT
TMT A&B
CANTAB
10-meter
walk
TUG
Type of COA
Assesses
functioning
or feeling?
PRO
Feeling
PRO
Feeling
PRO
Feeling
PerfO
Functioning
PerfO
Functioning
In previous longitudinal TBI studies, half or more participants have sometimes been lost to
follow-up (Corrigan et al., 2003; Richter et al., 2019). This is problematic because selective
attrition of specific sub-groups of patients can result in systematic bias in study outcomes,
limiting the generalisability of research findings (Corrigan et al., 2003; Krellman et al., 2014).
Predictors of loss to follow-up in TBI studies include factors such as lower socio-economic
129
status, learning disability, living alone, homelessness, history of substance abuse, and violent
injury aetiology (Corrigan et al., 2003; Krellman et al., 2014; Langley, Johnson, Slatyer, Skilbeck,
& Thomas, 2010; Yue et al., 2013). Follow-up thresholds of 60-80% have previously been
proposed to be acceptable in cohort studies (Altman, 2000; Babbie, 1973; Kristman, Manno, &
Cote, 2004). However, outcome completion rates ranged from 46-60% for the TRACK-TBI Pilot
study (Nelson, Ranson, Ferguson, Giacino, Okonkwo, Valadka, Manley, & McCrea, 2017),
indicating that follow-ups may be especially difficult to obtain in large-scale multicentre TBI
studies with multi-dimensional sets of outcome measures.
6.2.1. Study aims
CENTER-TBI outcomes were collected, where possible, for patients at all post-TBI functional
levels. CENTER-TBI did not use a prospective sliding approach to outcome assessment.
However, for patients in a vegetative state, outcomes were measured using the GOSE and JFK
Coma Recovery Scale - Revised (Giacino, Kalmar, & Whyte, 2004). The usability of multi-
dimensional outcome assessment across the spectrum of functional recovery has not been
evaluated. The CENTER-TBI data provide an opportunity to evaluate the quality and validity of
different outcome measures in relation to GOSE assignment. The current study therefore
aimed to:
Examine the quality (i.e., completeness of outcomes) and measurement properties (i.e.,
floor/ceiling effects and internal consistency) of CENTER-TBI outcomes data in relation to
post-TBI functional level
Provide guidance on contexts of use for particular outcome measures that can be used to
provide a multi-dimensional description of outcomes for patients at different levels of
functional recovery
130
6.3. Methods
6.3.1. Participants
Potentially eligible patients were enrolled in the CENTER-TBI core study (see CENTER-TBI
inclusion criteria in Chapter 3).
Additional inclusion criteria for the current study were as follows:
Adults aged 16 years and over (no upper age limit)
All injury severities
GOSE composite score ≥2 (i.e., lower severe disability or better)
The GOSE must be completed at 6 months post-injury
6.3.2. Design
The study had a cross-sectional design and used CENTER-TBI outcomes data collected 6
months after injury.
6.3.3. Measures (all measures are described in detail in Chapter 3)
Acute measures
Glasgow Coma Scale (GCS) (Teasdale & Jennett, 1974)
CT abnormality
Abbreviated Injury Scale (AIS) and Injury Severity Score (ISS) (Baker et al., 1974)
American Society of Anesthesiologists’ (ASA) classification of Physical Health (Dripps, 1963)
Clinical care pathway (i.e., ER, Admission, ICU)
Outcome measures: Assessment of level of disability
The GOSE was used to assess level of disability in this study. As the GOSE structured interview
(Wilson et al., 1998) and GOSE questionnaire (Wilson et al., 2002) were found to be broadly
comparable in Chapters 4 and 5, the GOSE composite score (described in Chapter 3), was used
to measure level of disability (Wilson & Horton, 2018). Possible GOSE scores ranged from
‘lower severe disability’ to ‘upper good recovery.’ Patients assigned to the ‘vegetative state’
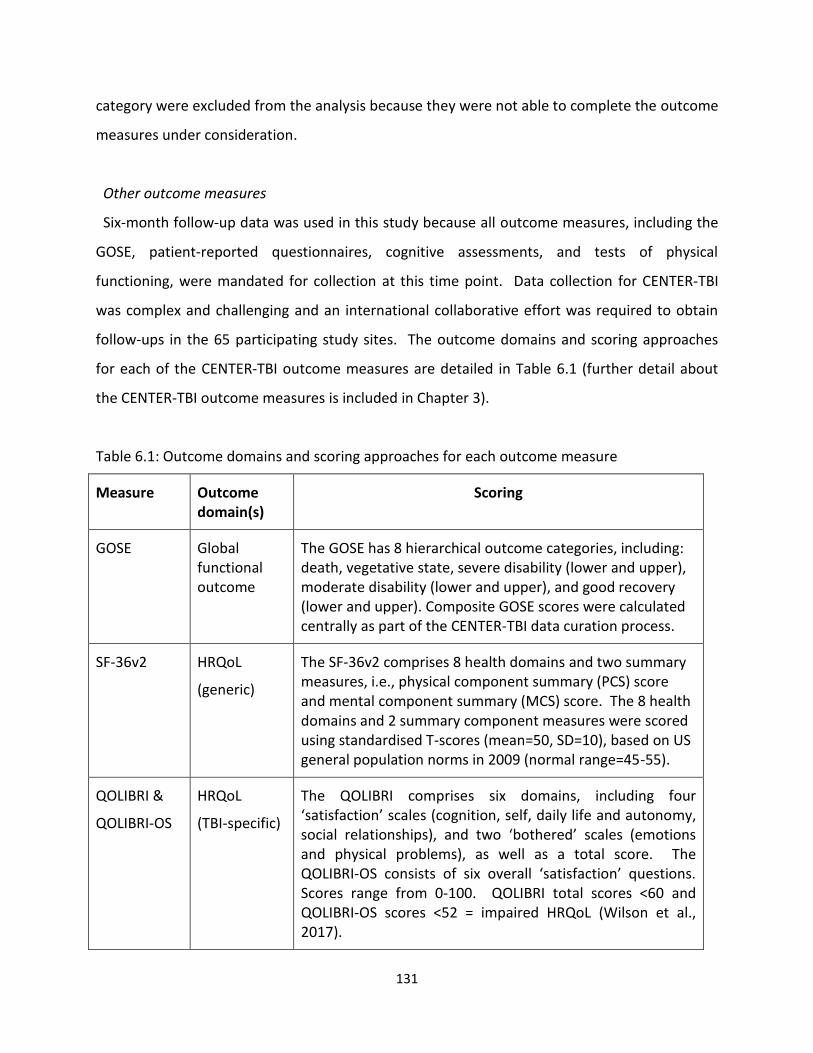
131
category were excluded from the analysis because they were not able to complete the outcome
measures under consideration.
Other outcome measures
Six-month follow-up data was used in this study because all outcome measures, including the
GOSE, patient-reported questionnaires, cognitive assessments, and tests of physical
functioning, were mandated for collection at this time point. Data collection for CENTER-TBI
was complex and challenging and an international collaborative effort was required to obtain
follow-ups in the 65 participating study sites. The outcome domains and scoring approaches
for each of the CENTER-TBI outcome measures are detailed in Table 6.1 (further detail about
the CENTER-TBI outcome measures is included in Chapter 3).
Table 6.1: Outcome domains and scoring approaches for each outcome measure
Measure Outcome domain(s)
Scoring
GOSE
Global functional outcome
The GOSE has 8 hierarchical outcome categories, including: death, vegetative state, severe disability (lower and upper), moderate disability (lower and upper), and good recovery (lower and upper). Composite GOSE scores were calculated centrally as part of the CENTER-TBI data curation process.
SF-36v2
HRQoL
(generic)
The SF-36v2 comprises 8 health domains and two summary measures, i.e., physical component summary (PCS) score and mental component summary (MCS) score. The 8 health domains and 2 summary component measures were scored using standardised T-scores (mean=50, SD=10), based on US general population norms in 2009 (normal range=45-55).
QOLIBRI &
QOLIBRI-OS
HRQoL
(TBI-specific)
The QOLIBRI comprises six domains, including four ‘satisfaction’ scales (cognition, self, daily life and autonomy, social relationships), and two ‘bothered’ scales (emotions and physical problems), as well as a total score. The QOLIBRI-OS consists of six overall ‘satisfaction’ questions. Scores range from 0-100. QOLIBRI total scores <60 and QOLIBRI-OS scores <52 = impaired HRQoL (Wilson et al., 2017).
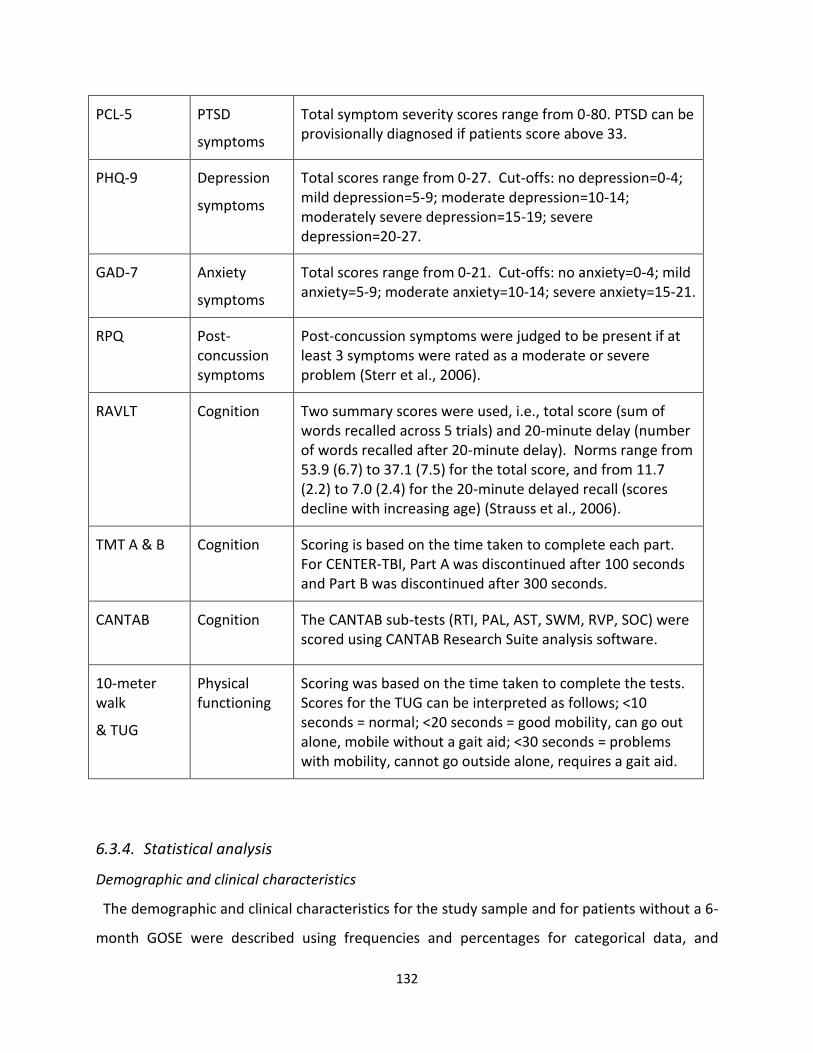
132
PCL-5
PTSD
symptoms
Total symptom severity scores range from 0-80. PTSD can be provisionally diagnosed if patients score above 33.
PHQ-9
Depression
symptoms
Total scores range from 0-27. Cut-offs: no depression=0-4; mild depression=5-9; moderate depression=10-14; moderately severe depression=15-19; severe depression=20-27.
GAD-7
Anxiety
symptoms
Total scores range from 0-21. Cut-offs: no anxiety=0-4; mild anxiety=5-9; moderate anxiety=10-14; severe anxiety=15-21.
RPQ
Post-concussion symptoms
Post-concussion symptoms were judged to be present if at least 3 symptoms were rated as a moderate or severe problem (Sterr et al., 2006).
RAVLT
Cognition Two summary scores were used, i.e., total score (sum of words recalled across 5 trials) and 20-minute delay (number of words recalled after 20-minute delay). Norms range from 53.9 (6.7) to 37.1 (7.5) for the total score, and from 11.7 (2.2) to 7.0 (2.4) for the 20-minute delayed recall (scores decline with increasing age) (Strauss et al., 2006).
TMT A & B
Cognition Scoring is based on the time taken to complete each part. For CENTER-TBI, Part A was discontinued after 100 seconds and Part B was discontinued after 300 seconds.
CANTAB
Cognition The CANTAB sub-tests (RTI, PAL, AST, SWM, RVP, SOC) were scored using CANTAB Research Suite analysis software.
10-meter walk
& TUG
Physical functioning
Scoring was based on the time taken to complete the tests. Scores for the TUG can be interpreted as follows; <10 seconds = normal; <20 seconds = good mobility, can go out alone, mobile without a gait aid; <30 seconds = problems with mobility, cannot go outside alone, requires a gait aid.
6.3.4. Statistical analysis
Demographic and clinical characteristics
The demographic and clinical characteristics for the study sample and for patients without a 6-
month GOSE were described using frequencies and percentages for categorical data, and
133
medians and interquartile ranges (IQR) for continuous data (i.e., age and total ISS score).
Differences between the groups were tested using independent samples t-tests for continuous
data and Chi-square (2) tests for categorical data.
Scores on outcome measures
Means and standard deviations were calculated for scores on the outcome measures. One-
way analysis of variance (ANOVA) was used to test for statistically significant differences
between the GOSE categories. As 28 ANOVAs were performed, Bonferroni adjusted p values
were used (i.e., 0.0018) to minimise the risk of type 1 error. The ANOVAs were conducted to
provide a context for further analysis of the CENTER-TBI data. No adjustments were made for
potentially confounding covariates (e.g., age, education level, pre-injury mental health issues),
and the ANOVAs should therefore be interpreted with caution. Detailed analysis of differences
between outcome groups is the focus of a separate CENTER-TBI study proposal.
Data quality and outcome measure validity in relation to post-TBI functional level
The distribution of GOSE scores was examined to determine the number and percentage of
patients assigned to each level of disability. Completeness of outcomes was then examined in
relation to GOSE assignment. A recent systematic review showed that at 6-months, follow-up
rates tend to be above 90% in interventional studies, whereas follow-up rates typically range
from 60% in observational TBI studies (Richter et al., 2019). Completion rates below 60% were
therefore considered particularly problematic. The number and percentage of patients who
completed each outcome measure was calculated for each GOSE category, and for the total
study sample. Some QOLIBRI-OS forms were completed by a proxy alone: these were excluded
from the completion rate analyses because the QOLIBRI-OS is a patient-reported outcome and
has unknown validity when completed by proxy respondents. Reasons for non-completion of
the RAVLT, TMT A & B, CANTAB, and 10-meter walk/TUG were examined and coded using the
following categories: (1) Non-neurological or logistic reasons; (2) Cognitive/neurological
deficits; (3) Invalid test; and (4) Reason not provided. It was not possible to examine reasons
for non-completion of PROs as this information was not collected as part of CENTER-TBI.
134
Floor and ceiling effects were examined for the completed outcome measures to assess the
sensitivity of each measure when used with patients with different levels of disability.
Consistent with previous research (Hall et al., 1996), floor and ceiling ranges were generally
defined as the top and bottom 10% of the range of possible scores for each outcome measure.
Ceiling ranges are not applicable for tests involving latencies and were not calculated for the
TMT, RTI, AST, and TUG. The range for the CANTAB sub-tests was defined as the empirical or
expected minimum and maximum scores, given the underlying distribution of scores. Outliers
are scores which lie outside this range, and present potential problems for analysis. For the
Trail Making Test, for example, this problem is dealt with by setting the maximum possible time
for the test (i.e the floor). There are no published floor and ceiling ranges for the CANTAB sub-
tests. Thus, floor/ceiling ranges were calculated for these tests in the context of adult TBI, and
the ranges defined are relative to the total study sample. In CENTER-TBI, some of the CANTAB
sub-test score distributions show substantial skew and kurtosis and may be non-normal.
Empirical minimum and maximum scores were therefore defined for the CANTAB using Tukey’s
rule (Tukey, 1977) to exclude outliers in the range. Minimum and maximum scores were
calculated as 1.5 times the interquartile range below the 25th percentile and above the 75th
percentile. For example, for the RTI sub-test, reaction times ranged from 218-1813
milliseconds (25th percentile = 324; 75th percentile = 424; IQR = 100); thus the floor range was
defined as 574-1813. Scores considered at the “ceiling” and “floor” for each relevant outcome
measure are defined in Table 6.2. Outcome measures were considered to have good sensitivity
if they had minimal floor/ceiling effects (defined in this study as ≤10% of participants).
The internal consistency of the PROs was assessed using Cronbach’s alpha (α) (Cronbach,
1951). In line with conventions, α >0.7 was interpreted as acceptable (Nunnally, 1978).
Statistical analyses were conducted using IBM SPSS Statistics 23. The data were downloaded
from the INCF Neurobot database (Version 1) on 8 November 2018.

135
Table 6.2: Definition of floor and ceiling ranges for each outcome measure
Measure Range Floor Ceiling
SF-26v2 (sub-scales)
Total score (higher = better)
0-100 0-9 91-100
QOLIBRI Total score (higher = better)
0-100 0-9 91-100
QOLIBRI-OS
Total score (higher = better)
0-100 0-9 91-100
PCL-5 Total score (higher = worse)
0-80 73-80 0-7
PHQ-9 Total score (higher = worse)
0-27 25-27 0-2
GAD-7 Total score (higher = worse)
0-21 20-21 0-1
RPQ Total moderate/severe symptoms (higher = worse)
0-16 16 0
RAVLT
Principal list items recalled (higher = better)
0-75 0-6 69-75
TMT Part A Completion time in seconds (higher = worse)
10-101 91-101 n/a
TMT Part B Completion time in seconds (higher = worse)
29-301 271-301 n/a
CANTAB RTI Median five-choice reaction time (higher = worse)
218-1813
574-1813
n/a
CANTAB PAL
Total errors (adjusted) (higher = worse)
0-194 91-194 0-8
CANTAB AST
Median reaction latency (higher=worse)
274-1654 1060-1654 n/a
CANTAB SWM
Between errors (higher = worse)
0-151 99-151 0-9
CANTAB RVP
A’ prime (higher = better)
0.71-1
0.71-0.73 0.98-1
CANTAB SOC
Problems solved in minimum moves (higher = better)
0-12 0 12
TUG Completion time in seconds (higher = worse)
0-30 20-30 n/a
136
6.4. Results
6.4.1. Demographics and clinical characteristics
The participant selection process for the current study is displayed in Figure 6.2. Of the 3692
adult patients eligible for follow-up at 6 months post-injury, 2600 were successfully followed-up
using the GOSE, and the GOSE was not obtained for 1091 patients. A total of 2573 survivors
scored in the ‘lower severe disability’ category or better. The current study sample therefore
comprised 69.7% of all patients eligible for 6-month follow-up.
Figure 6.3 displays the GOSE completion rates for the ‘eligible sample’ for each of the CENTER-
TBI study sites and shows that follow-up rates on the GOSE were variable in this multicentre
study.
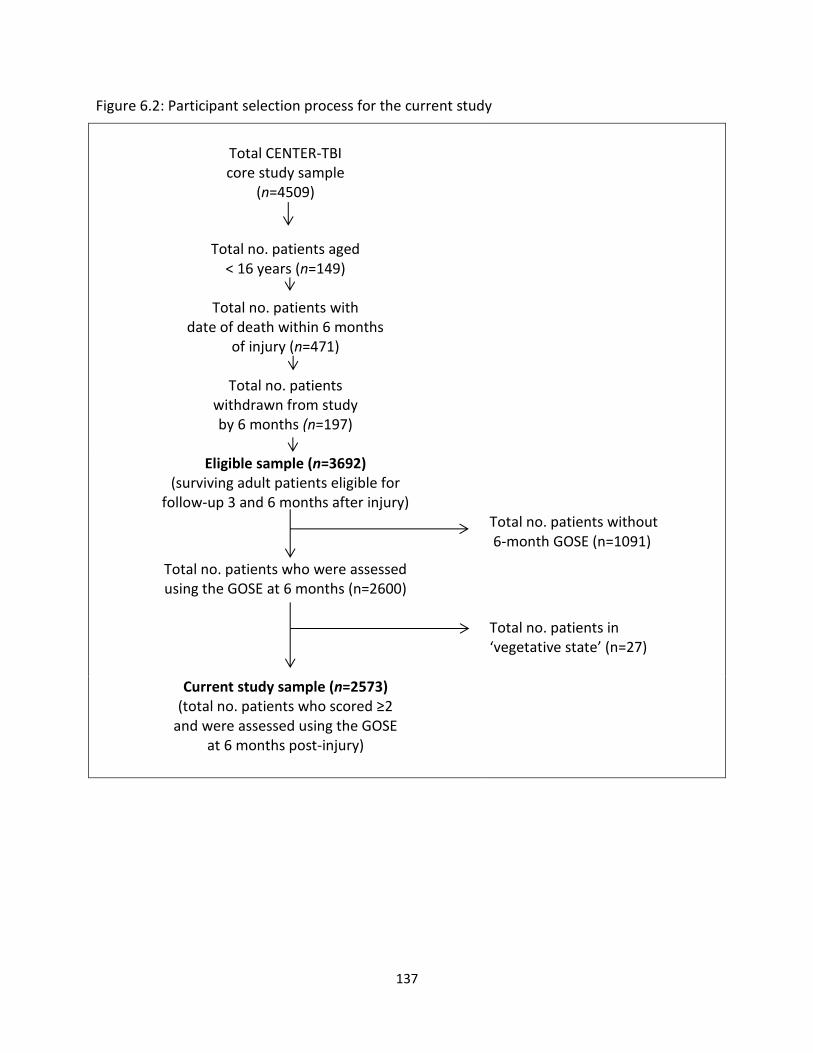
137
Figure 6.2: Participant selection process for the current study
Total CENTER-TBI core study sample
(n=4509)
Total no. patients aged < 16 years (n=149)
Total no. patients with
date of death within 6 months of injury (n=471)
Total no. patients
withdrawn from study by 6 months (n=197)
Eligible sample (n=3692) (surviving adult patients eligible for
follow-up 3 and 6 months after injury)
Total no. patients without 6-month GOSE (n=1091)
Total no. patients who were assessed using the GOSE at 6 months (n=2600)
Total no. patients in ‘vegetative state’ (n=27)
Current study sample (n=2573) (total no. patients who scored ≥2
and were assessed using the GOSE at 6 months post-injury)
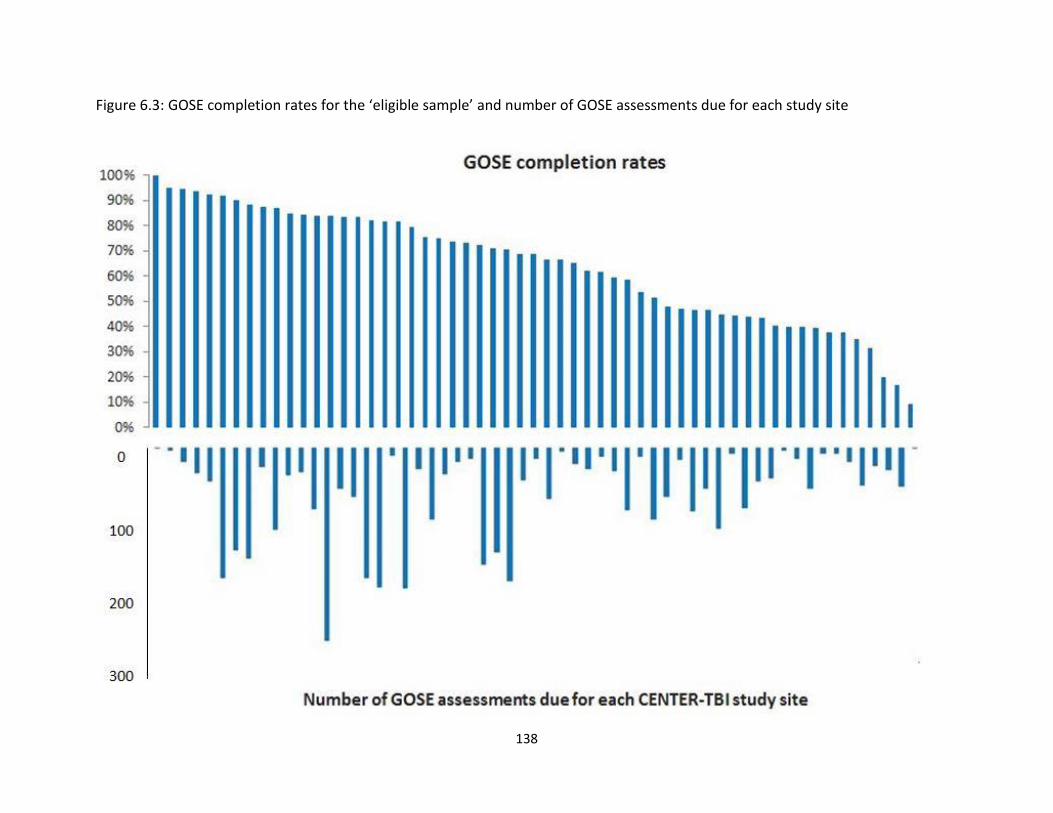
138
Figure 6.3: GOSE completion rates for the ‘eligible sample’ and number of GOSE assessments due for each study site
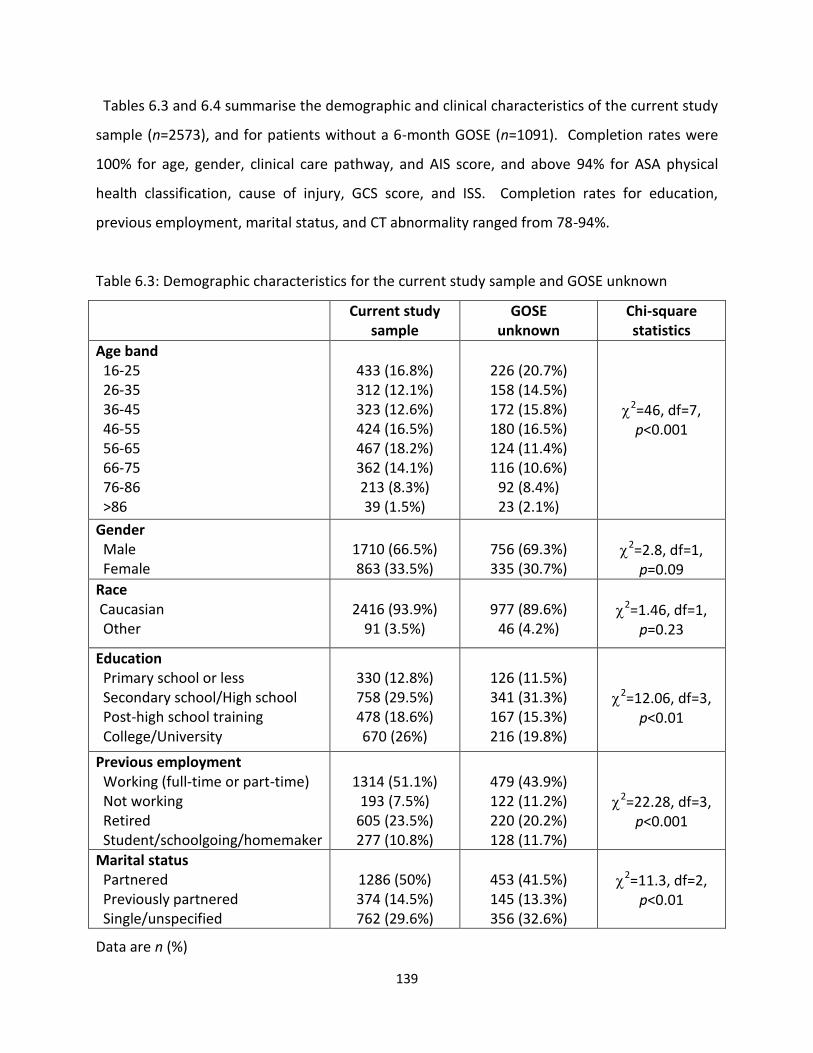
139
Tables 6.3 and 6.4 summarise the demographic and clinical characteristics of the current study
sample (n=2573), and for patients without a 6-month GOSE (n=1091). Completion rates were
100% for age, gender, clinical care pathway, and AIS score, and above 94% for ASA physical
health classification, cause of injury, GCS score, and ISS. Completion rates for education,
previous employment, marital status, and CT abnormality ranged from 78-94%.
Table 6.3: Demographic characteristics for the current study sample and GOSE unknown
Current study sample
GOSE unknown
Chi-square statistics
Age band 16-25 26-35 36-45 46-55 56-65 66-75 76-86 >86
433 (16.8%) 312 (12.1%) 323 (12.6%) 424 (16.5%) 467 (18.2%) 362 (14.1%) 213 (8.3%) 39 (1.5%)
226 (20.7%) 158 (14.5%) 172 (15.8%) 180 (16.5%) 124 (11.4%) 116 (10.6%)
92 (8.4%) 23 (2.1%)
2=46, df=7, p<0.001
Gender Male Female
1710 (66.5%) 863 (33.5%)
756 (69.3%) 335 (30.7%)
2=2.8, df=1,
p=0.09
Race Caucasian Other
2416 (93.9%)
91 (3.5%)
977 (89.6%)
46 (4.2%)
2=1.46, df=1,
p=0.23
Education Primary school or less Secondary school/High school Post-high school training College/University
330 (12.8%) 758 (29.5%) 478 (18.6%) 670 (26%)
126 (11.5%) 341 (31.3%) 167 (15.3%) 216 (19.8%)
2=12.06, df=3,
p<0.01
Previous employment Working (full-time or part-time) Not working Retired Student/schoolgoing/homemaker
1314 (51.1%)
193 (7.5%) 605 (23.5%) 277 (10.8%)
479 (43.9%) 122 (11.2%) 220 (20.2%) 128 (11.7%)
2=22.28, df=3,
p<0.001
Marital status Partnered Previously partnered Single/unspecified
1286 (50%) 374 (14.5%) 762 (29.6%)
453 (41.5%) 145 (13.3%) 356 (32.6%)
2=11.3, df=2,
p<0.01
Data are n (%)

140
Table 6.4: Clinical characteristics for the study sample and GOSE unknown
Current study sample
GOSE unknown
Chi-square statistics
ASA Physical Health Healthy patient Mild systemic disease Severe/life threatening systemic disease
1472 (57.2%) 832 (32.2%) 233 (9.1%)
639 (58.6%) 318 (29.1%)
87 (8%)
2=3.13, df=2,
p=0.21
Cause of injury Road traffic accident Incidental fall Violence/assault Other
1049 (40.8%) 1112 (43.2%)
140 (5.4%) 214 (8.3%)
349 (32%)
496 (45.5%) 67 (6.1%)
143 (13.1%)
2=35.13, df=3,
p<0.001
Clinical Care Pathway Emergency Room Admitted to hospital ward Intensive Care Unit
525 (20.4%) 927 (36%)
1121 (43.6%)
249 (22.8%) 396 (36.3%) 446 (40.9%)
2=3.43, df=2,
p=0.18
GCS Score 13-15 9-12 3-8
1840 (71.5%)
195 (7.6%) 460 (17.9%)
780 (71.5%)
87 (8%) 177 (16.2%)
2=1.24, df=2,
p=0.54
CT abnormality Present Absent
1309 (50.9%) 957 (37.2%)
415 (38%)
444 (40.7%)
2=22.51, df=1,
p<0.001
Head & neck injury1 No injury/minor injury Moderate injury Serious injury Severe injury Critical injury Unsurvivable injury
415 (16.2%) 372 (14.5%) 809 (31.4%) 461 (17.9%) 513 (19.9%)
3 (0.1%)
240 (21.9%) 149 (13.7%) 319 (29.2%) 174 (15.9%) 209 (19.2%)
0 (0%)
2=19.5, df=5,
p<0.01
Non-head & neck injury2
No injury/mild injury Severe injury
1560 (60.6%) 991 (38.5%)
682 (62.5%) 379 (34.7%)
2=3.11, df=1,
p=0.08
1Head & neck injury = combined AIS score for head, neck and cervical regions 2Non-head & neck injury (severe injury= Total ISS >7)
Patients in the current study sample were significantly older than those without a 6-month
GOSE: the median (IQR) age was 51 years (32-65) for the study sample and 45 years (28-62) for
141
patients without a 6-month GOSE (p<0.001). The two groups were comparable for gender
(most patients were male) and race (most patients were Caucasian). However, the current
study sample had a higher level of education, significantly more of them were previously
employed or retired, and significantly more of them were partnered or previously partnered
prior to injury.
Patients in the current study sample were comparable to those without a 6-month GOSE for
ASA physical health classification (most patients were healthy or had mild systemic disease
prior to injury); clinical care pathway (around 80% of the patients were admitted to the hospital
ward or intensive care unit upon recruitment to the study); GCS score (most patients had GCS
scores in the 13-15 range); and injuries to other body regions (around one-third of the patients
sustained severe non-head and neck injuries). However, the study sample had a higher
proportion of patients with injuries caused by road traffic accidents, more patients with CT
abnormalities, fewer patients with minor or moderate head and neck injuries, and more
patients who met criteria for major trauma (i.e., total ISS >15). Total ISS scores were
comparable for the current study sample (median = 16, IQR=9-26) and for patients without a 6-
month GOSE (median=14, IQR=8-25) (p=0.03).
6.4.2. Scores on outcome measures
Scores were distributed on the GOSE as follows: patients assigned to the ‘severe disability’
categories comprised 14.8% of the total study sample (lower SD = 7.8%; upper SD = 7%);
patients assigned to the ‘moderate disability’ categories comprised 23.9% of the sample (lower
MD = 10.3%; upper MD = 13.6%); and patients assigned to the ‘good recovery’ categories
comprised 61.4% of the sample (lower GR = 21.7%; upper GR = 39.7%).
Scores for the CENTER-TBI outcome measures are displayed in Tables 6.5 (PROs) and 6.6
(PerfOs). One-way ANOVAs showed that scores were significantly different between GOSE
categories on all outcome measures. Scores for the SF-36v2, QOLIBRI, and QOLIBRI-OS were
generally better (higher) for patients with better functional recovery and worse (lower) for
142
patients with poorer outcomes on the GOSE. Scores on the SF-36v2 sub-scales, QOLIBRI and
QOLIBRI-OS were generally indicative of good quality of life in patients assigned to the
‘moderate disability’ and ‘good recovery’ categories. However, patients with ‘severe disability’
generally had lower than average quality of life (i.e., below 45 on the SF-36v2 sub-scales and
below 60 on the QOLIBRI). Scores on the SF-36v2 MCS and PCS were in the normal range for
patients with ‘good recovery,’ but below average for patients in the ‘severe disability’ and
‘moderate disability’ categories. Scores on the PCL-5, PHQ-9, GAD-7, and RPQ were better
(lower) for patients with better functional outcomes. The PHQ-9 score for the total study
sample was indicative of mild depression. Patients in the ‘lower severe disability’ group scored
in the moderate depression range, patients in the ‘upper severe disability,’ ‘moderate
disability’, and ‘lower good recovery’ groups scored in the mild depression range, and the
‘upper good recovery’ group scored in the ‘no depression’ range. GAD-7 scores were in the
mild anxiety range for the ‘severe disability’ and ‘moderate disability’ groups, and in the ‘no
anxiety’ range for patients in the ‘good recovery’ groups.
Scores on the RAVLT were better (higher) for patients with better functional recovery and
worse (lower) for patients with poorer functional outcomes. RAVLT mean scores were within
the normal range for the ‘moderate disability’ and ‘good recovery’ groups, but below the
normal range for the ‘severe disability’ categories. Scores on the TMT were better (lower) for
patients with better functional outcomes, and worse (higher) for patients with poorer
outcomes, but in the normal range (i.e., <100 seconds for Part A; <300 seconds for Part B) for all
GOSE categories. Scores on the CANTAB RTI, PAL, AST, and SWM were better (lower) for
patients with better functional recovery and worse (highest) for patients with poorer functional
recovery. Scores on the CANTAB AST and RVP were more uniform across GOSE categories, but
generally better (higher) for patients with better functional recovery. Scores on the 10-meter
walk and TUG were better for patients with better functional recovery and worse for patient
with poorer functional outcomes. TUG mean times were indicative of good physical mobility
for all GOSE categories.
143
6.4.3. Data quality and validity in relation to post-TBI functional level
Data completeness
Table 6.7 displays the outcome measure completion rates. PRO completion rates were above
80% for all outcome measures for the total study sample. The RAVLT and TMT were completed
by 68% of the total study sample, while CANTAB completion rates ranged from 52-59% of the
total study sample and tests of physical functioning were completed by 51% of the total study
sample. Completion rates for all outcome measures were lowest for patients assigned to the
‘lower severe disability’ category and higher for the other GOSE categories. Completion rates
were below 60% for all outcome measures for patients in the ‘lower severe disability’ group.
Furthermore, PerfO completion rates were below 60% for patients in the ‘upper severe
disability’ group. CANTAB RVP and 10-meter walk/TUG completion rates were below 60% for
patients in the ‘lower moderate disability,’ and all CANTAB sub-tests had completion rates
below 60% for patients in the ‘upper good recovery’ group.
Tables 6.8 and 6.9 display the reasons provided for non-completion of the RAVLT, TMT, 10-
meter walk/TUG, and CANTAB sub-tests. Around one third of the total study sample did not
complete the RAVLT (n=820) or TMT (n=806): no reason was provided for the RAVLT for 50% of
these patients, and no reason was provided for the TMT for 44% of these patients. Where
reasons for non-completion were provided, ‘non-neurological/logistic reasons’ was the most
common reason given overall (RAVLT = 42% of the patients; TMT = 48% of the patients).
‘Cognitive/neurological deficits’ accounted for 7% of uncompleted RAVLT and 8% of
uncompleted TMT. A total of 1122 patients (44% of the total study sample) did not complete
the 10-meter walk/TUG: no reason was provided for 38% of these patients, and where reasons
were provided, ‘non-neurological/logistic reasons’ accounted for 57% of the patients, and
‘cognitive/neurological deficits’ accounted for 5% of the patients. ‘Invalid test’ accounted for a
minority of non-completed assessments (RAVLT = 3 patients; TMT = 4 patients; 10-meter
walk/TUG = 4 patients). More than one-half of patients in the study sample did not complete
the CANTAB sub-tests, and for around two-thirds of these patients, investigators did not
provide a reason for non-completion. Where reasons were provided, ‘non-neurological/logistic
144
reasons’ was the most common reason given overall (RTI & PAL = 24% of the patients; AST,
SWM & SOC = 29% of the patients; RVP = 31% of the patients). ‘Cognitive/neurological deficits’
accounted for 3-7% of the uncompleted CANTAB sub-tests and ‘invalid test’ accounted for less
than 1% of the uncompleted tests.
Floor and ceiling effects
The proportion of patients scoring in the floor and ceiling ranges for each of the completed
PROs and PerfOs are displayed in Tables 6.10 and 6.11. The percentages shown are based on
the total number of completed outcome measures for each GOSE category and for the total
study sample. The PROs with the largest proportion of ceiling effects overall were the RPQ
(52%), PCL-5 (49%), SF-36v2 ‘role-emotional’ sub-scale (46%), GAD-7 (44%), SF-36v2 ‘physical
functioning’ sub-scale (44%), PHQ-9 (42%), SF-36v2 ‘social functioning’ sub-scale (38%), SF-36v2
‘role-physical’ sub-scale (32%) and SF-36v2 ‘bodily pain’ sub-scale (29%). Ceiling effects were
more common for patients with better levels of functional recovery (e.g., 56-69% of patients in
the ‘upper good recovery’ category scored in the ceiling range on the SF-36v2 ‘physical
functioning,’ ‘role-physical,’ ‘social functioning,’ and ‘role-emotional’ sub-scales, and 63-81% in
the ‘upper good recovery’ category scored in the ceiling range on the PCL-5, PHQ-9, GAD-7, and
RPQ). Ceiling effects were found mainly for patients in the ‘upper moderate disability’ and
‘good recovery’ categories on the SF-36v2 sub-scales, whereas they occurred in all GOSE
categories, apart from ‘lower severe disability,’ on the PCL-5, PHQ-9, GAD-7, and RPQ. Floor
effects were found on the SF-36v2 ‘physical functioning,’ ‘role-physical’ and role-emotional’
sub-scales for patients in the ‘severe disability’ categories.
Floor and ceiling effects were absent on the RAVLT, CANTAB SOC, and CANTAB RVP. Floor
effects were minimal on the TMT and TUG, but present for patients with ‘severe disabilities.’
Floor effects were found for most GOSE categories on the CANTAB PAL and were most notable
for patients with poorer levels of functioning. Ceiling effects were found for most GOSE
categories on the CANTAB PAL and SWM and were most notable for patients with better levels
of recovery.

145
Internal consistency
Cronbach’s alpha (α) for the completed PROs are displayed in Table 6.12. For the total study
sample, internal consistency was as follows: QOLIBRI-OS, PCL-5, GAD-7, and RPQ (α ≥ 0.90);
QOLIBRI (α = 0.85); PHQ-9 (α = 0.88); SF-36v2 sub-scales (α ranged from 0.79 to 0.95). For the
individual GOSE categories, all PROs had α ≥ 0.80, apart from the SF-36v2 ‘general health,’
‘social functioning,’ and ‘energy and fatigue’ sub-scales.
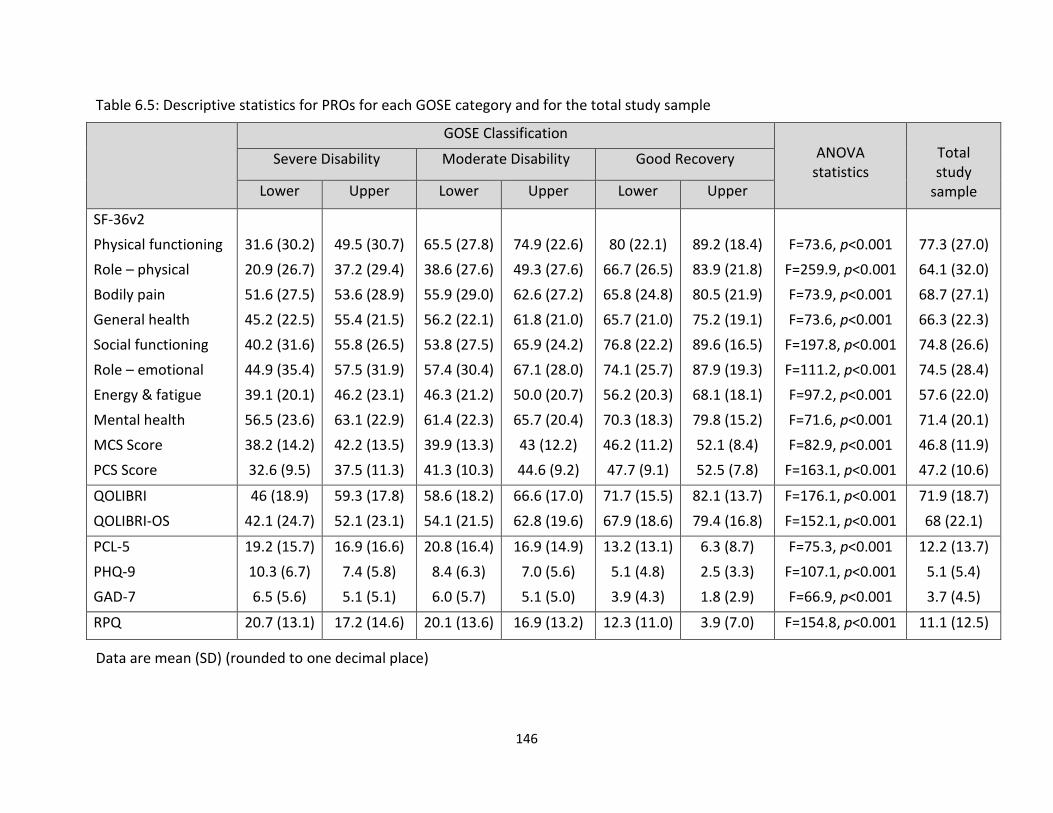
146
Table 6.5: Descriptive statistics for PROs for each GOSE category and for the total study sample
GOSE Classification ANOVA
statistics
Total study
sample
Severe Disability Moderate Disability Good Recovery
Lower Upper Lower Upper Lower Upper
SF-36v2
Physical functioning
Role – physical
Bodily pain
General health
Social functioning
Role – emotional
Energy & fatigue
Mental health
MCS Score
PCS Score
31.6 (30.2)
20.9 (26.7)
51.6 (27.5)
45.2 (22.5)
40.2 (31.6)
44.9 (35.4)
39.1 (20.1)
56.5 (23.6)
38.2 (14.2)
32.6 (9.5)
49.5 (30.7)
37.2 (29.4)
53.6 (28.9)
55.4 (21.5)
55.8 (26.5)
57.5 (31.9)
46.2 (23.1)
63.1 (22.9)
42.2 (13.5)
37.5 (11.3)
65.5 (27.8)
38.6 (27.6)
55.9 (29.0)
56.2 (22.1)
53.8 (27.5)
57.4 (30.4)
46.3 (21.2)
61.4 (22.3)
39.9 (13.3)
41.3 (10.3)
74.9 (22.6)
49.3 (27.6)
62.6 (27.2)
61.8 (21.0)
65.9 (24.2)
67.1 (28.0)
50.0 (20.7)
65.7 (20.4)
43 (12.2)
44.6 (9.2)
80 (22.1)
66.7 (26.5)
65.8 (24.8)
65.7 (21.0)
76.8 (22.2)
74.1 (25.7)
56.2 (20.3)
70.3 (18.3)
46.2 (11.2)
47.7 (9.1)
89.2 (18.4)
83.9 (21.8)
80.5 (21.9)
75.2 (19.1)
89.6 (16.5)
87.9 (19.3)
68.1 (18.1)
79.8 (15.2)
52.1 (8.4)
52.5 (7.8)
F=73.6, p<0.001
F=259.9, p<0.001
F=73.9, p<0.001
F=73.6, p<0.001
F=197.8, p<0.001
F=111.2, p<0.001
F=97.2, p<0.001
F=71.6, p<0.001
F=82.9, p<0.001
F=163.1, p<0.001
77.3 (27.0)
64.1 (32.0)
68.7 (27.1)
66.3 (22.3)
74.8 (26.6)
74.5 (28.4)
57.6 (22.0)
71.4 (20.1)
46.8 (11.9)
47.2 (10.6)
QOLIBRI
QOLIBRI-OS
46 (18.9)
42.1 (24.7)
59.3 (17.8)
52.1 (23.1)
58.6 (18.2)
54.1 (21.5)
66.6 (17.0)
62.8 (19.6)
71.7 (15.5)
67.9 (18.6)
82.1 (13.7)
79.4 (16.8)
F=176.1, p<0.001
F=152.1, p<0.001
71.9 (18.7)
68 (22.1)
PCL-5
PHQ-9
GAD-7
19.2 (15.7)
10.3 (6.7)
6.5 (5.6)
16.9 (16.6)
7.4 (5.8)
5.1 (5.1)
20.8 (16.4)
8.4 (6.3)
6.0 (5.7)
16.9 (14.9)
7.0 (5.6)
5.1 (5.0)
13.2 (13.1)
5.1 (4.8)
3.9 (4.3)
6.3 (8.7)
2.5 (3.3)
1.8 (2.9)
F=75.3, p<0.001
F=107.1, p<0.001
F=66.9, p<0.001
12.2 (13.7)
5.1 (5.4)
3.7 (4.5)
RPQ 20.7 (13.1) 17.2 (14.6) 20.1 (13.6) 16.9 (13.2) 12.3 (11.0) 3.9 (7.0) F=154.8, p<0.001 11.1 (12.5)
Data are mean (SD) (rounded to one decimal place)
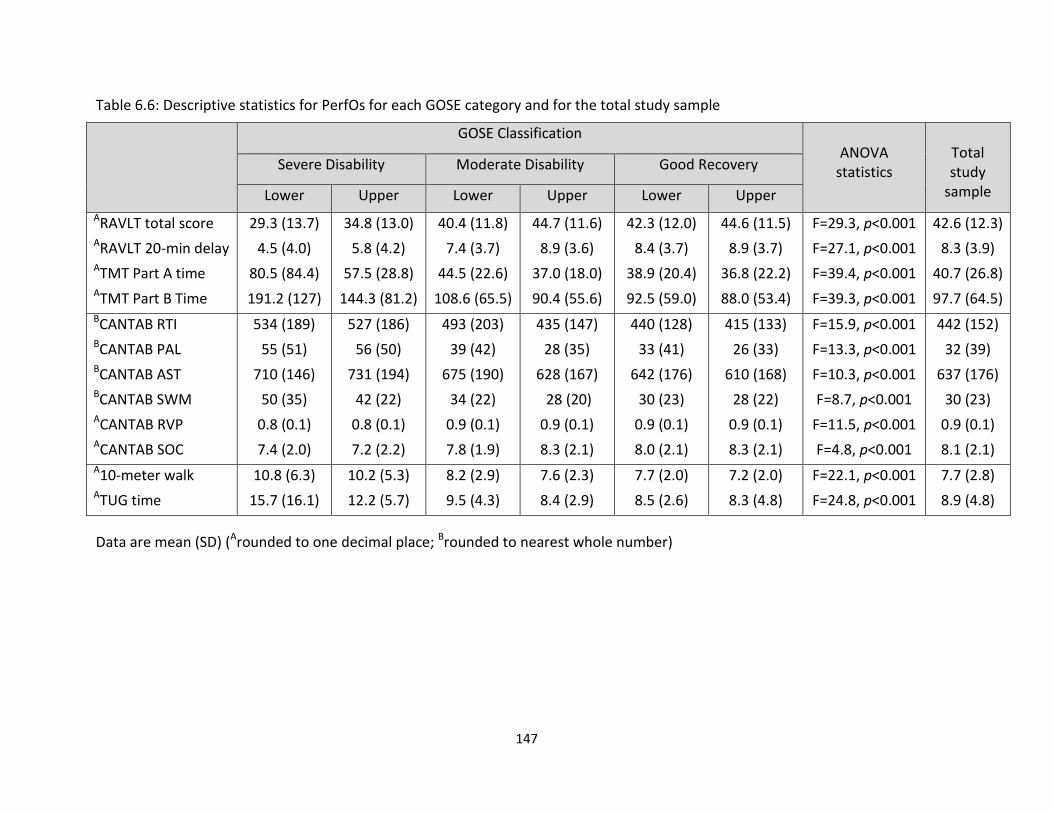
147
Table 6.6: Descriptive statistics for PerfOs for each GOSE category and for the total study sample
GOSE Classification ANOVA
statistics
Total study
sample
Severe Disability Moderate Disability Good Recovery
Lower Upper Lower Upper Lower Upper
ARAVLT total score ARAVLT 20-min delay ATMT Part A time ATMT Part B Time
29.3 (13.7)
4.5 (4.0)
80.5 (84.4)
191.2 (127)
34.8 (13.0)
5.8 (4.2)
57.5 (28.8)
144.3 (81.2)
40.4 (11.8)
7.4 (3.7)
44.5 (22.6)
108.6 (65.5)
44.7 (11.6)
8.9 (3.6)
37.0 (18.0)
90.4 (55.6)
42.3 (12.0)
8.4 (3.7)
38.9 (20.4)
92.5 (59.0)
44.6 (11.5)
8.9 (3.7)
36.8 (22.2)
88.0 (53.4)
F=29.3, p<0.001
F=27.1, p<0.001
F=39.4, p<0.001
F=39.3, p<0.001
42.6 (12.3)
8.3 (3.9)
40.7 (26.8)
97.7 (64.5) BCANTAB RTI BCANTAB PAL BCANTAB AST BCANTAB SWM ACANTAB RVP ACANTAB SOC
534 (189)
55 (51)
710 (146)
50 (35)
0.8 (0.1)
7.4 (2.0)
527 (186)
56 (50)
731 (194)
42 (22)
0.8 (0.1)
7.2 (2.2)
493 (203)
39 (42)
675 (190)
34 (22)
0.9 (0.1)
7.8 (1.9)
435 (147)
28 (35)
628 (167)
28 (20)
0.9 (0.1)
8.3 (2.1)
440 (128)
33 (41)
642 (176)
30 (23)
0.9 (0.1)
8.0 (2.1)
415 (133)
26 (33)
610 (168)
28 (22)
0.9 (0.1)
8.3 (2.1)
F=15.9, p<0.001
F=13.3, p<0.001
F=10.3, p<0.001
F=8.7, p<0.001
F=11.5, p<0.001
F=4.8, p<0.001
442 (152)
32 (39)
637 (176)
30 (23)
0.9 (0.1)
8.1 (2.1) A10-meter walk ATUG time
10.8 (6.3)
15.7 (16.1)
10.2 (5.3)
12.2 (5.7)
8.2 (2.9)
9.5 (4.3)
7.6 (2.3)
8.4 (2.9)
7.7 (2.0)
8.5 (2.6)
7.2 (2.0)
8.3 (4.8)
F=22.1, p<0.001
F=24.8, p<0.001
7.7 (2.8)
8.9 (4.8)
Data are mean (SD) (Arounded to one decimal place; Brounded to nearest whole number)
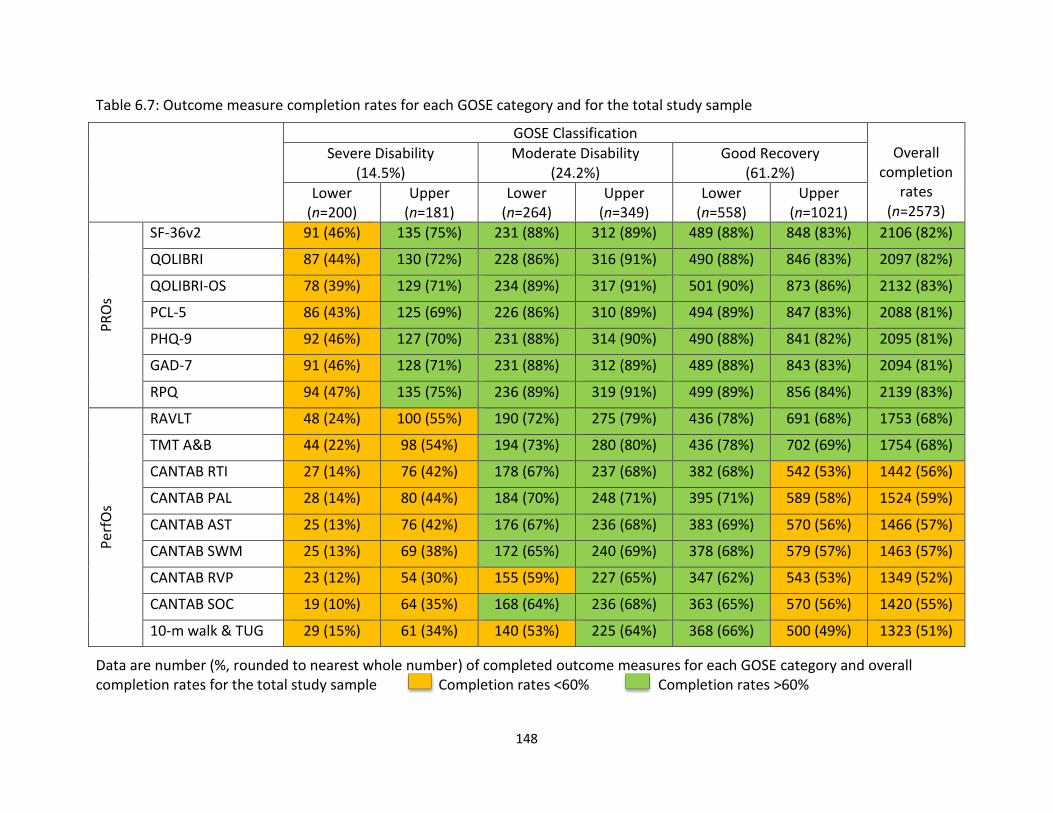
148
Table 6.7: Outcome measure completion rates for each GOSE category and for the total study sample
GOSE Classification Overall
completion rates
(n=2573)
Severe Disability (14.5%)
Moderate Disability (24.2%)
Good Recovery (61.2%)
Lower (n=200)
Upper (n=181)
Lower (n=264)
Upper (n=349)
Lower (n=558)
Upper (n=1021)
PR
Os
SF-36v2 91 (46%) 135 (75%) 231 (88%) 312 (89%) 489 (88%) 848 (83%) 2106 (82%)
QOLIBRI 87 (44%) 130 (72%) 228 (86%) 316 (91%) 490 (88%) 846 (83%) 2097 (82%)
QOLIBRI-OS 78 (39%) 129 (71%) 234 (89%) 317 (91%) 501 (90%) 873 (86%) 2132 (83%)
PCL-5 86 (43%) 125 (69%) 226 (86%) 310 (89%) 494 (89%) 847 (83%) 2088 (81%)
PHQ-9 92 (46%) 127 (70%) 231 (88%) 314 (90%) 490 (88%) 841 (82%) 2095 (81%)
GAD-7 91 (46%) 128 (71%) 231 (88%) 312 (89%) 489 (88%) 843 (83%) 2094 (81%)
RPQ 94 (47%) 135 (75%) 236 (89%) 319 (91%) 499 (89%) 856 (84%) 2139 (83%)
Pe
rfO
s
RAVLT 48 (24%) 100 (55%) 190 (72%) 275 (79%) 436 (78%) 691 (68%) 1753 (68%)
TMT A&B 44 (22%) 98 (54%) 194 (73%) 280 (80%) 436 (78%) 702 (69%) 1754 (68%)
CANTAB RTI 27 (14%) 76 (42%) 178 (67%) 237 (68%) 382 (68%) 542 (53%) 1442 (56%)
CANTAB PAL 28 (14%) 80 (44%) 184 (70%) 248 (71%) 395 (71%) 589 (58%) 1524 (59%)
CANTAB AST 25 (13%) 76 (42%) 176 (67%) 236 (68%) 383 (69%) 570 (56%) 1466 (57%)
CANTAB SWM 25 (13%) 69 (38%) 172 (65%) 240 (69%) 378 (68%) 579 (57%) 1463 (57%)
CANTAB RVP 23 (12%) 54 (30%) 155 (59%) 227 (65%) 347 (62%) 543 (53%) 1349 (52%)
CANTAB SOC 19 (10%) 64 (35%) 168 (64%) 236 (68%) 363 (65%) 570 (56%) 1420 (55%)
10-m walk & TUG 29 (15%) 61 (34%) 140 (53%) 225 (64%) 368 (66%) 500 (49%) 1323 (51%)
Data are number (%, rounded to nearest whole number) of completed outcome measures for each GOSE category and overall completion rates for the total study sample Completion rates <60% Completion rates >60%
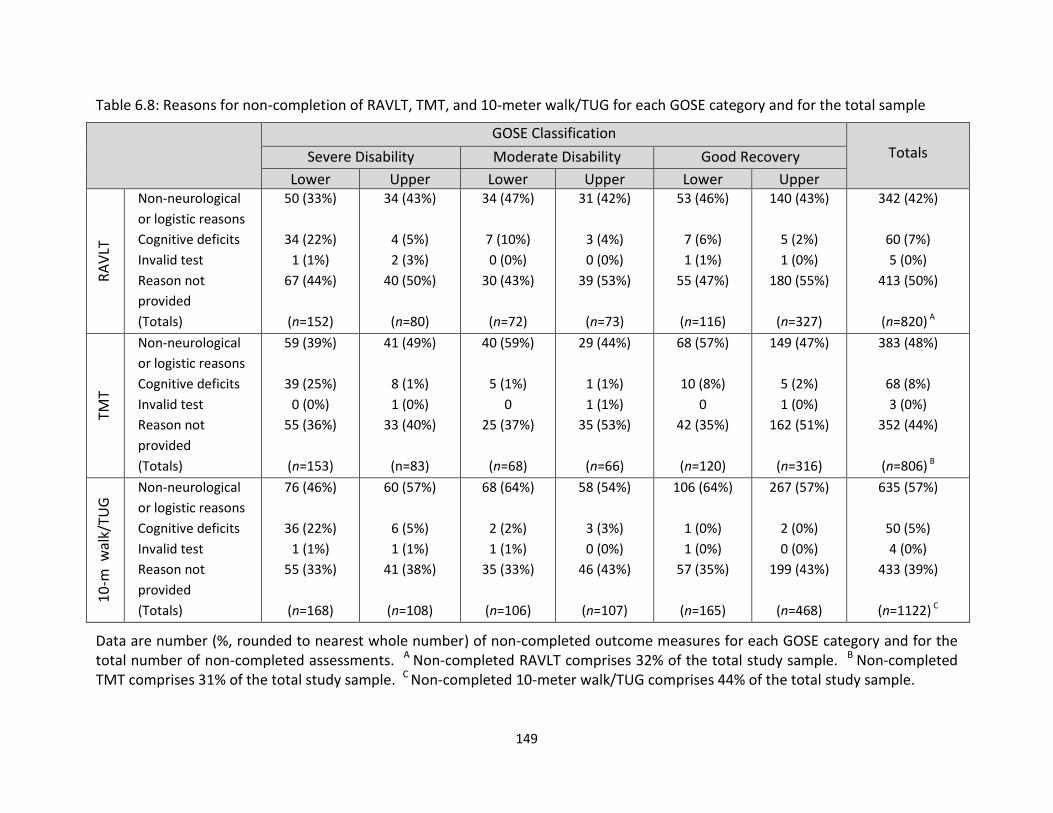
149
Table 6.8: Reasons for non-completion of RAVLT, TMT, and 10-meter walk/TUG for each GOSE category and for the total sample
GOSE Classification Totals Severe Disability Moderate Disability Good Recovery
Lower Upper Lower Upper Lower Upper
RA
VLT
Non-neurological
or logistic reasons
Cognitive deficits
Invalid test
Reason not
provided
(Totals)
50 (33%)
34 (22%)
1 (1%)
67 (44%)
(n=152)
34 (43%)
4 (5%)
2 (3%)
40 (50%)
(n=80)
34 (47%)
7 (10%)
0 (0%)
30 (43%)
(n=72)
31 (42%)
3 (4%)
0 (0%)
39 (53%)
(n=73)
53 (46%)
7 (6%)
1 (1%)
55 (47%)
(n=116)
140 (43%)
5 (2%)
1 (0%)
180 (55%)
(n=327)
342 (42%)
60 (7%)
5 (0%)
413 (50%)
(n=820) A
TMT
Non-neurological
or logistic reasons
Cognitive deficits
Invalid test
Reason not
provided
(Totals)
59 (39%)
39 (25%)
0 (0%)
55 (36%)
(n=153)
41 (49%)
8 (1%)
1 (0%)
33 (40%)
(n=83)
40 (59%)
5 (1%)
0
25 (37%)
(n=68)
29 (44%)
1 (1%)
1 (1%)
35 (53%)
(n=66)
68 (57%)
10 (8%)
0
42 (35%)
(n=120)
149 (47%)
5 (2%)
1 (0%)
162 (51%)
(n=316)
383 (48%)
68 (8%)
3 (0%)
352 (44%)
(n=806) B
10
-m w
alk/
TUG
Non-neurological
or logistic reasons
Cognitive deficits
Invalid test
Reason not
provided
(Totals)
76 (46%)
36 (22%)
1 (1%)
55 (33%)
(n=168)
60 (57%)
6 (5%)
1 (1%)
41 (38%)
(n=108)
68 (64%)
2 (2%)
1 (1%)
35 (33%)
(n=106)
58 (54%)
3 (3%)
0 (0%)
46 (43%)
(n=107)
106 (64%)
1 (0%)
1 (0%)
57 (35%)
(n=165)
267 (57%)
2 (0%)
0 (0%)
199 (43%)
(n=468)
635 (57%)
50 (5%)
4 (0%)
433 (39%)
(n=1122) C
Data are number (%, rounded to nearest whole number) of non-completed outcome measures for each GOSE category and for the total number of non-completed assessments. A Non-completed RAVLT comprises 32% of the total study sample. B Non-completed TMT comprises 31% of the total study sample. C Non-completed 10-meter walk/TUG comprises 44% of the total study sample.
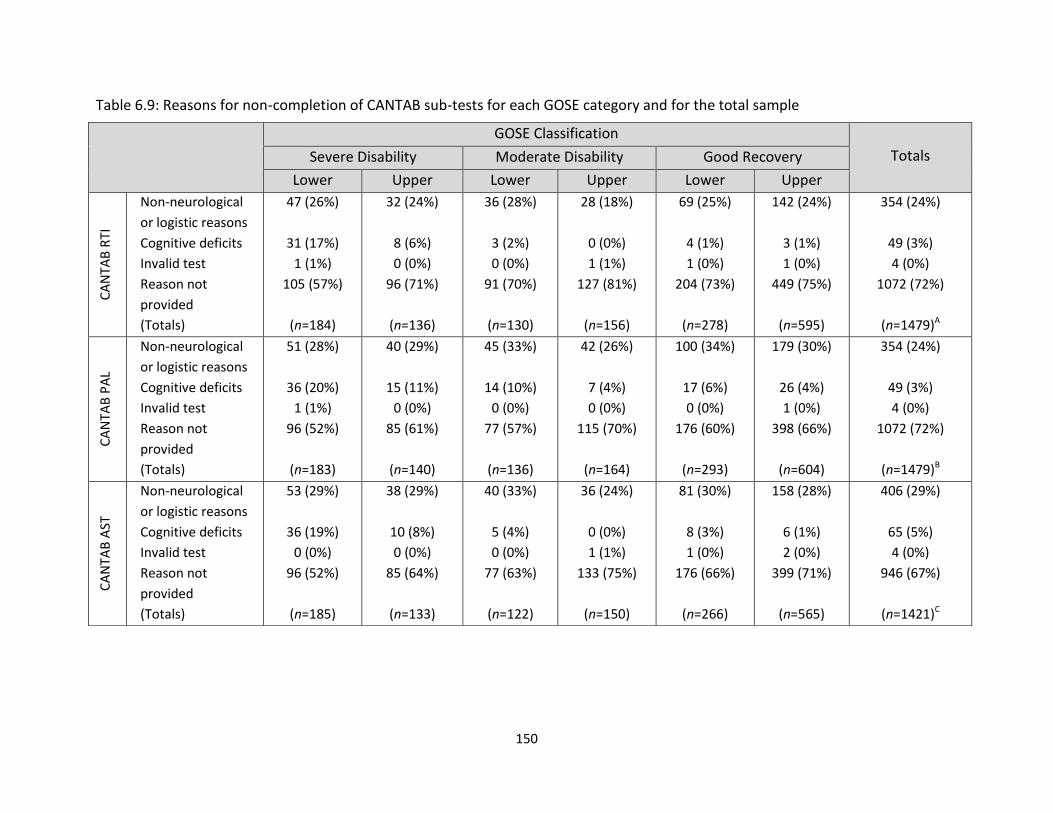
150
Table 6.9: Reasons for non-completion of CANTAB sub-tests for each GOSE category and for the total sample
GOSE Classification
Totals Severe Disability Moderate Disability Good Recovery
Lower Upper Lower Upper Lower Upper
CA
NTA
B R
TI
Non-neurological
or logistic reasons
Cognitive deficits
Invalid test
Reason not
provided
(Totals)
47 (26%)
31 (17%)
1 (1%)
105 (57%)
(n=184)
32 (24%)
8 (6%)
0 (0%)
96 (71%)
(n=136)
36 (28%)
3 (2%)
0 (0%)
91 (70%)
(n=130)
28 (18%)
0 (0%)
1 (1%)
127 (81%)
(n=156)
69 (25%)
4 (1%)
1 (0%)
204 (73%)
(n=278)
142 (24%)
3 (1%)
1 (0%)
449 (75%)
(n=595)
354 (24%)
49 (3%)
4 (0%)
1072 (72%)
(n=1479)A
CA
NTA
B P
AL
Non-neurological
or logistic reasons
Cognitive deficits
Invalid test
Reason not
provided
(Totals)
51 (28%)
36 (20%)
1 (1%)
96 (52%)
(n=183)
40 (29%)
15 (11%)
0 (0%)
85 (61%)
(n=140)
45 (33%)
14 (10%)
0 (0%)
77 (57%)
(n=136)
42 (26%)
7 (4%)
0 (0%)
115 (70%)
(n=164)
100 (34%)
17 (6%)
0 (0%)
176 (60%)
(n=293)
179 (30%)
26 (4%)
1 (0%)
398 (66%)
(n=604)
354 (24%)
49 (3%)
4 (0%)
1072 (72%)
(n=1479)B
CA
NTA
B A
ST
Non-neurological
or logistic reasons
Cognitive deficits
Invalid test
Reason not
provided
(Totals)
53 (29%)
36 (19%)
0 (0%)
96 (52%)
(n=185)
38 (29%)
10 (8%)
0 (0%)
85 (64%)
(n=133)
40 (33%)
5 (4%)
0 (0%)
77 (63%)
(n=122)
36 (24%)
0 (0%)
1 (1%)
133 (75%)
(n=150)
81 (30%)
8 (3%)
1 (0%)
176 (66%)
(n=266)
158 (28%)
6 (1%)
2 (0%)
399 (71%)
(n=565)
406 (29%)
65 (5%)
4 (0%)
946 (67%)
(n=1421)C
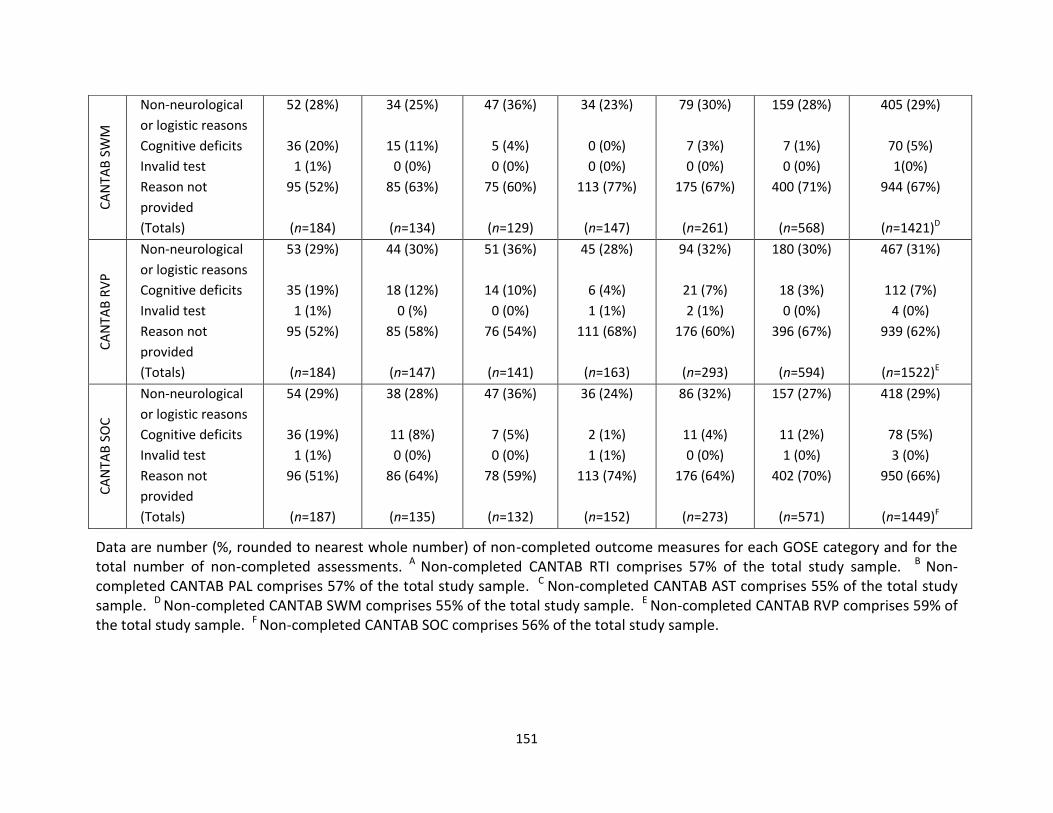
151
Data are number (%, rounded to nearest whole number) of non-completed outcome measures for each GOSE category and for the total number of non-completed assessments. A Non-completed CANTAB RTI comprises 57% of the total study sample. B Non-completed CANTAB PAL comprises 57% of the total study sample. C Non-completed CANTAB AST comprises 55% of the total study sample. D Non-completed CANTAB SWM comprises 55% of the total study sample. E Non-completed CANTAB RVP comprises 59% of the total study sample. F Non-completed CANTAB SOC comprises 56% of the total study sample.
CA
NTA
B S
WM
Non-neurological
or logistic reasons
Cognitive deficits
Invalid test
Reason not
provided
(Totals)
52 (28%)
36 (20%)
1 (1%)
95 (52%)
(n=184)
34 (25%)
15 (11%)
0 (0%)
85 (63%)
(n=134)
47 (36%)
5 (4%)
0 (0%)
75 (60%)
(n=129)
34 (23%)
0 (0%)
0 (0%)
113 (77%)
(n=147)
79 (30%)
7 (3%)
0 (0%)
175 (67%)
(n=261)
159 (28%)
7 (1%)
0 (0%)
400 (71%)
(n=568)
405 (29%)
70 (5%)
1(0%)
944 (67%)
(n=1421)D
CA
NTA
B R
VP
Non-neurological
or logistic reasons
Cognitive deficits
Invalid test
Reason not
provided
(Totals)
53 (29%)
35 (19%)
1 (1%)
95 (52%)
(n=184)
44 (30%)
18 (12%)
0 (%)
85 (58%)
(n=147)
51 (36%)
14 (10%)
0 (0%)
76 (54%)
(n=141)
45 (28%)
6 (4%)
1 (1%)
111 (68%)
(n=163)
94 (32%)
21 (7%)
2 (1%)
176 (60%)
(n=293)
180 (30%)
18 (3%)
0 (0%)
396 (67%)
(n=594)
467 (31%)
112 (7%)
4 (0%)
939 (62%)
(n=1522)E
CA
NTA
B S
OC
Non-neurological
or logistic reasons
Cognitive deficits
Invalid test
Reason not
provided
(Totals)
54 (29%)
36 (19%)
1 (1%)
96 (51%)
(n=187)
38 (28%)
11 (8%)
0 (0%)
86 (64%)
(n=135)
47 (36%)
7 (5%)
0 (0%)
78 (59%)
(n=132)
36 (24%)
2 (1%)
1 (1%)
113 (74%)
(n=152)
86 (32%)
11 (4%)
0 (0%)
176 (64%)
(n=273)
157 (27%)
11 (2%)
1 (0%)
402 (70%)
(n=571)
418 (29%)
78 (5%)
3 (0%)
950 (66%)
(n=1449)F
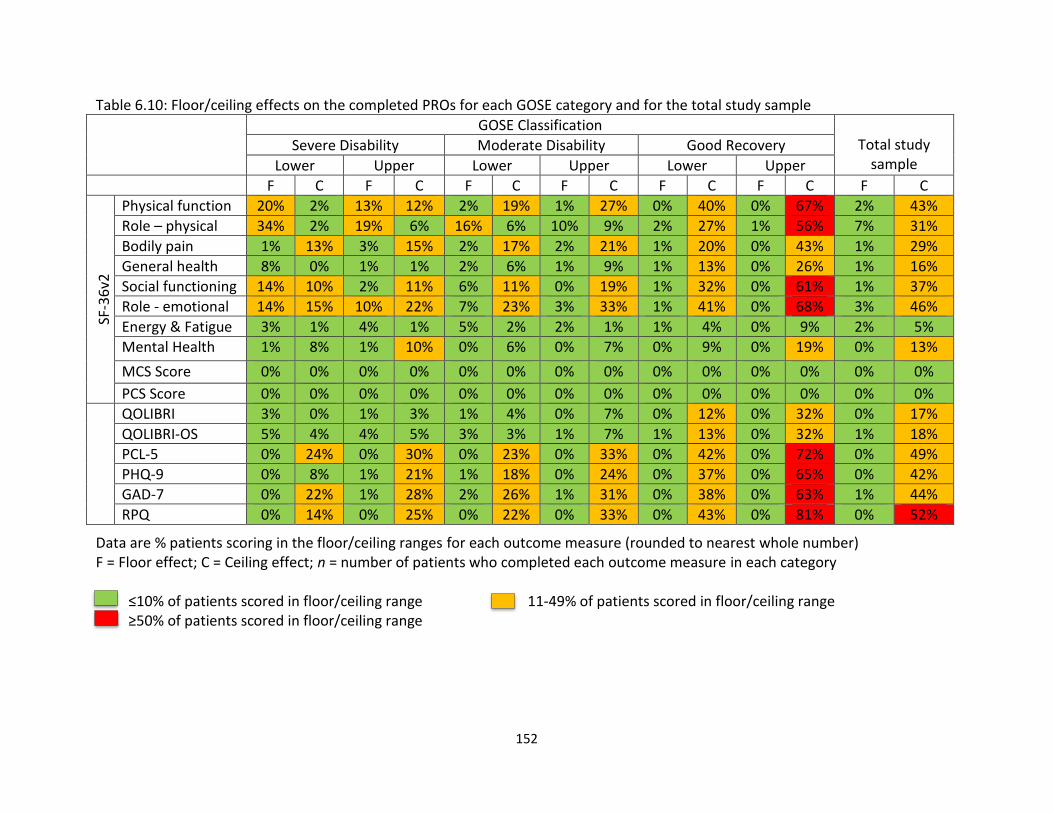
152
Table 6.10: Floor/ceiling effects on the completed PROs for each GOSE category and for the total study sample
GOSE Classification Total study
sample Severe Disability Moderate Disability Good Recovery
Lower Upper Lower Upper Lower Upper
F C F C F C F C F C F C F C
SF-3
6v2
Physical function 20% 2% 13% 12% 2% 19% 1% 27% 0% 40% 0% 67% 2% 43%
Role – physical 34% 2% 19% 6% 16% 6% 10% 9% 2% 27% 1% 56% 7% 31%
Bodily pain 1% 13% 3% 15% 2% 17% 2% 21% 1% 20% 0% 43% 1% 29%
General health 8% 0% 1% 1% 2% 6% 1% 9% 1% 13% 0% 26% 1% 16%
Social functioning 14% 10% 2% 11% 6% 11% 0% 19% 1% 32% 0% 61% 1% 37%
Role - emotional 14% 15% 10% 22% 7% 23% 3% 33% 1% 41% 0% 68% 3% 46%
Energy & Fatigue 3% 1% 4% 1% 5% 2% 2% 1% 1% 4% 0% 9% 2% 5%
Mental Health 1% 8% 1% 10% 0% 6% 0% 7% 0% 9% 0% 19% 0% 13%
MCS Score 0% 0% 0% 0% 0% 0% 0% 0% 0% 0% 0% 0% 0% 0%
PCS Score 0% 0% 0% 0% 0% 0% 0% 0% 0% 0% 0% 0% 0% 0%
QOLIBRI 3% 0% 1% 3% 1% 4% 0% 7% 0% 12% 0% 32% 0% 17%
QOLIBRI-OS 5% 4% 4% 5% 3% 3% 1% 7% 1% 13% 0% 32% 1% 18%
PCL-5 0% 24% 0% 30% 0% 23% 0% 33% 0% 42% 0% 72% 0% 49%
PHQ-9 0% 8% 1% 21% 1% 18% 0% 24% 0% 37% 0% 65% 0% 42%
GAD-7 0% 22% 1% 28% 2% 26% 1% 31% 0% 38% 0% 63% 1% 44%
RPQ 0% 14% 0% 25% 0% 22% 0% 33% 0% 43% 0% 81% 0% 52%
Data are % patients scoring in the floor/ceiling ranges for each outcome measure (rounded to nearest whole number) F = Floor effect; C = Ceiling effect; n = number of patients who completed each outcome measure in each category ≤10% of patients scored in floor/ceiling range 11-49% of patients scored in floor/ceiling range ≥50% of patients scored in floor/ceiling range
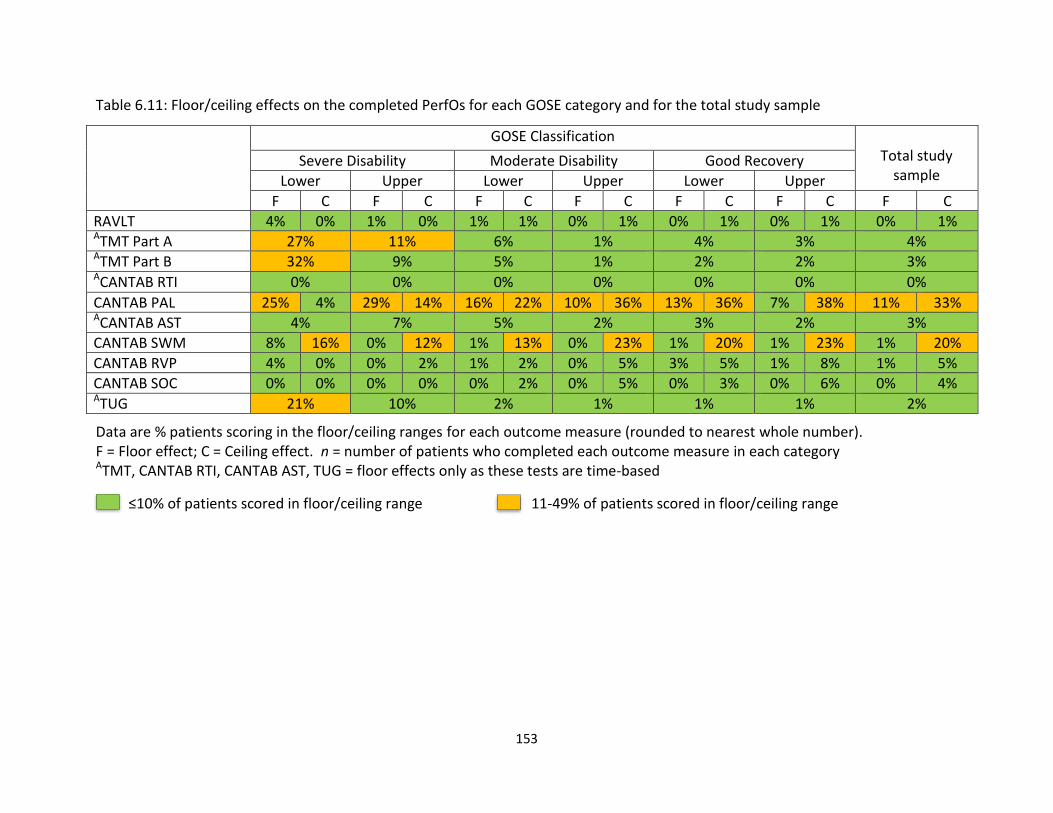
153
Table 6.11: Floor/ceiling effects on the completed PerfOs for each GOSE category and for the total study sample
GOSE Classification Total study
sample Severe Disability Moderate Disability Good Recovery
Lower Upper Lower Upper Lower Upper
F C F C F C F C F C F C F C
RAVLT 4% 0% 1% 0% 1% 1% 0% 1% 0% 1% 0% 1% 0% 1% ATMT Part A 27% 11% 6% 1% 4% 3% 4% ATMT Part B 32% 9% 5% 1% 2% 2% 3% ACANTAB RTI 0% 0% 0% 0% 0% 0% 0%
CANTAB PAL 25% 4% 29% 14% 16% 22% 10% 36% 13% 36% 7% 38% 11% 33% ACANTAB AST 4% 7% 5% 2% 3% 2% 3%
CANTAB SWM 8% 16% 0% 12% 1% 13% 0% 23% 1% 20% 1% 23% 1% 20%
CANTAB RVP 4% 0% 0% 2% 1% 2% 0% 5% 3% 5% 1% 8% 1% 5%
CANTAB SOC 0% 0% 0% 0% 0% 2% 0% 5% 0% 3% 0% 6% 0% 4% ATUG 21% 10% 2% 1% 1% 1% 2%
Data are % patients scoring in the floor/ceiling ranges for each outcome measure (rounded to nearest whole number). F = Floor effect; C = Ceiling effect. n = number of patients who completed each outcome measure in each category ATMT, CANTAB RTI, CANTAB AST, TUG = floor effects only as these tests are time-based
≤10% of patients scored in floor/ceiling range 11-49% of patients scored in floor/ceiling range
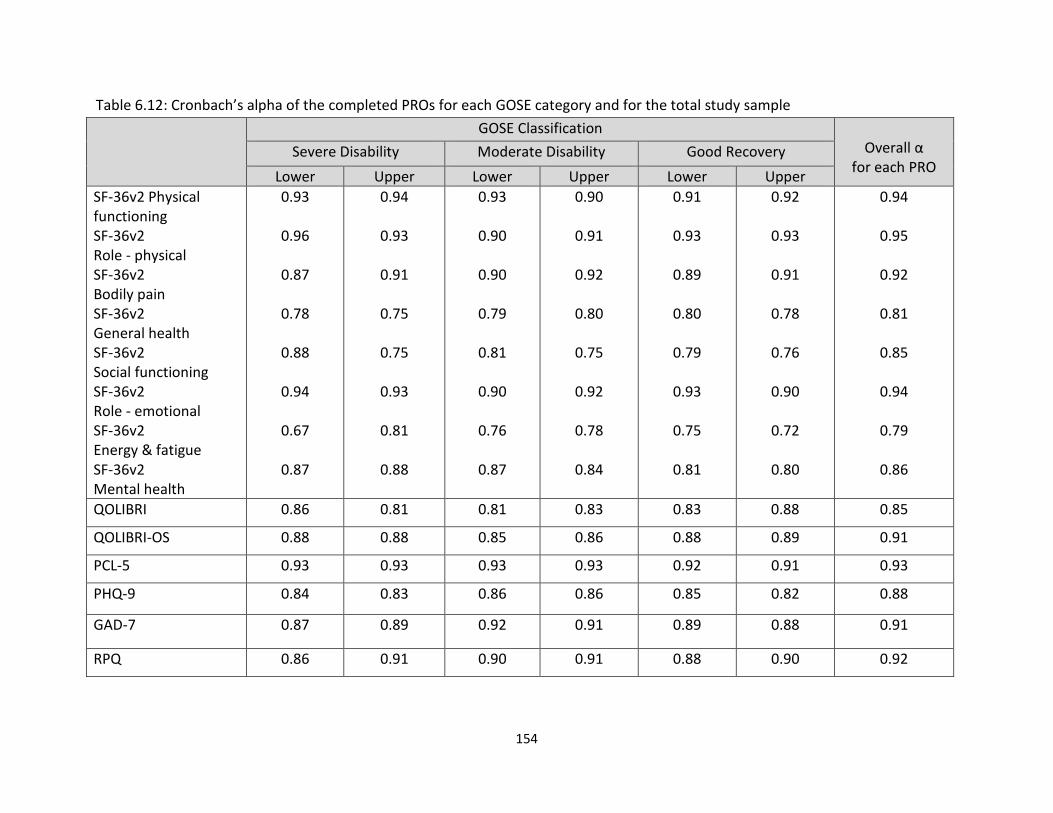
154
Table 6.12: Cronbach’s alpha of the completed PROs for each GOSE category and for the total study sample
GOSE Classification Overall α
for each PRO Severe Disability Moderate Disability Good Recovery
Lower Upper Lower Upper Lower Upper
SF-36v2 Physical functioning SF-36v2 Role - physical SF-36v2 Bodily pain SF-36v2 General health SF-36v2 Social functioning SF-36v2 Role - emotional SF-36v2 Energy & fatigue SF-36v2 Mental health
0.93
0.96
0.87
0.78
0.88
0.94
0.67
0.87
0.94
0.93
0.91
0.75
0.75
0.93
0.81
0.88
0.93
0.90
0.90
0.79
0.81
0.90
0.76
0.87
0.90
0.91
0.92
0.80
0.75
0.92
0.78
0.84
0.91
0.93
0.89
0.80
0.79
0.93
0.75
0.81
0.92
0.93
0.91
0.78
0.76
0.90
0.72
0.80
0.94
0.95
0.92
0.81
0.85
0.94
0.79
0.86
QOLIBRI 0.86 0.81 0.81 0.83 0.83 0.88 0.85
QOLIBRI-OS 0.88 0.88 0.85 0.86 0.88 0.89 0.91
PCL-5 0.93 0.93 0.93 0.93 0.92 0.91 0.93
PHQ-9 0.84 0.83 0.86 0.86 0.85 0.82 0.88
GAD-7 0.87 0.89 0.92 0.91 0.89 0.88 0.91
RPQ 0.86 0.91 0.90 0.91 0.88 0.90 0.92
155
6.5. Discussion
This chapter examined the usefulness of implementing multi-dimensional outcome
assessment across the spectrum of TBI recovery. Patients were stratified according to GOSE
category and the quality and validity of the CENTER-TBI outcome measures were evaluated
in relation to level of global functioning. The findings and their implications are discussed
below.
6.5.1. Data quality and validity in relation to post-TBI functional level
Data completeness
The completeness of the CENTER-TBI outcome measures provides information about the
feasibility of collecting individual assessments in different contexts of use, according to post-
TBI functional level at 6 months. In this study, patients with better levels of functional
recovery were found to have higher outcome completion rates than those with poorer
functional recovery. Completion rates were also found to be better for PROs than for
cognitive assessments and tests of physical functioning. PRO completion rates were
generally very good across the spectrum of recovery (i.e., >70%), but fell below 50% for
patients assigned to the ‘lower severe disability’ category. PerfOs have greater logistic
demands than PROs and were completed less frequently than PROS: certain CANTAB sub-
tests and tests of physical functioning fell below 60% across all GOSE categories. The COA
completion rates indicate that multi-dimensional outcome assessment was particularly
difficult to implement with patients with greater functional limitations. Nevertheless, there
was limited information available about the reasons for non-completion of the outcome
measures, as CENTER-TBI investigators provided reasons for non-completion of the RAVLT,
TMT, and 10-meter walk/TUG assessments, but not for the PROs, and explanations for
missing PerfOs were not always provided.
Explanations were missing for up to half of the uncompleted RAVLT, TMT, and 10-meter
walk/TUG assessments, and for more than half of the uncompleted CANTAB sub-tests.
Thus, the test completion codes were not used particularly well by CENTER-TBI
investigators. Where explanations were provided, ‘non-neurological or logistic reasons’ was
the most common reason given. While ‘cognitive/neurological deficits’ accounted for only a
156
minority of the uncompleted assessments in the ‘upper severe disability,’ ‘moderate
disability’ and ‘good recovery’ categories, this reason accounted for up to one-quarter of
uncompleted assessments in the ‘lower severe disability’ category. Previous research has
shown that patients who are more severely affected by TBI are particularly at risk of loss to
follow-up due to cognitive impairment, physical disability, or logistic problems such as
inability to travel independently to appointments (Sherer et al., 2010). The findings from
the current study appear to fit with this. However, it is important to note that there could
also be site specific reasons for non-completion of follow-ups, which could not be examined.
More than half of participants may be lost to follow-up in longitudinal TBI studies (Corrigan
et al., 2003; Nelson, Ranson, Ferguson, Giacino, Okonkwo, Valadka, Manley, & McCrea,
2017; Richter et al., 2019). Patients who are lost to follow-up often have systematically
different characteristics to those who are retained in longitudinal TBI studies (Corrigan et
al., 2003; Krellman et al., 2014; Langley et al., 2010; Yue et al., 2013). Thus, in the current
study, the demographic and clinical characteristics of patients who were followed up using
the GOSE were compared with survivors that were not followed-up. A total of 30% of the
patients eligible for follow up did not have a 6-month GOSE. Some differences were found
between the study sample and patients without a 6-month GOSE. For example, patients
included in the study were older and better educated than those not followed up. More of
them were previously employed or retired and more were partnered or previously
partnered prior to injury. In addition, more patients in the study sample were injured in
road traffic accidents, and a greater proportion had CT abnormalities and greater injury
severity. These demographic and clinical differences suggest that the study findings may
have limitations in their generalisability.
Floor and ceiling effects and internal consistency of PROs
When tailoring outcome assessments for TBI studies, investigators should consider basic
psychometric properties, such as the sensitivity of instruments and the internal consistency
of PROs (Andresen, 2000; Frost, Reeeve, Liepa, Stauffer, & Hays, 2007). In this study, PRO
ceiling effects were particularly common in the GOSE ‘upper good recovery’ categories,
indicating that patients who had returned to their previous level of functioning typically
reported good HRQoL and no clinically significant PTSD, anxiety, depression, or post-
157
concussion symptoms. PRO ceiling effects were less common for patients with greater
levels of disability, but occurred across the recovery spectrum on the PCL-5 and GAD-7, and
were also apparent on the RVP for patients in the ‘upper severe disability’ category and
better. Ceiling effects were least common on the QOLIBRI and QOLIBRI-OS, affecting around
one-third of patients in the ‘upper good recovery’ category, and a minority of patients in the
other GOSE categories. PRO floor effects were found to be minimal. However, at least 20%
of patients in the ‘lower severe disability’ category scored in the floor ranges on the SF-36v2
‘physical functioning,’ ‘role-physical’ and ‘role-emotional’ sub-scales, suggesting that the SF-
36v2 lacks sensitivity when used with patients with greater levels of functional limitation.
The findings indicate that most of the PROs, apart from the QOLIBRI/QOLIBI-OS, lacked
precision when completed by patients with better levels of functional recovery. While
measures of emotional adjustment focus on negative outcomes (i.e., symptoms of distress),
the QOLIBRI scales assess both negative and positive aspects (i.e., life satisfaction). As a
result, the QOLIBRI measures are less prone to ceiling effects than measures of emotional
distress. The ceiling effects on the RPQ are of particular concern because they indicate that
the scale does not pick up symptoms that are relevant to patients with greater functional
limitations. The RPQ was originally developed for patients with concussion/mild TBI and
focuses on cognitive, emotional and somatic post-concussion symptoms (King et al., 1995;
Potter, Leigh, Wade, & Fleminger, 2006; Smith-Seemiller, Fow, Kant, & Franzen, 2003).
Thus, it does not capture problems of relevance to patients with severe disabilities, such as
reduced mobility and communication difficulties, and should not be used with these
patients as the results can be misleading. Despite the ceiling effects, all PROs were found to
have excellent internal consistency across the GOSE categories (i.e., α generally >0.80)
(Nunnally, 1978), indicating that the internal structure of the questionnaires was not
affected by the context in which they were used.
Ceiling effects were found for most GOSE categories on the CANTAB PAL and SWM sub-
tests, but were minimal or absent on the other cognitive tests. The ceiling and floor ranges
defined for the CANTAB sub-tests may contain information about performance which was
not explored in this study. Floor effects were found for patients with ‘severe disabilities’ on
the TMT and TUG and for most GOSE categories on the CANTAB PAL. The floor effect on the
158
PAL test arises from patients who did not complete the whole test and have adjusted
scores. The adjusted scoring procedure for the PAL produces a large number of values that
are outliers in comparison to patients who completed the test, and these outliers
consequently appear in the floor range. The floor range defined for the PAL in this study
may therefore be problematic. Despite this, there may be useful discrimination among low
PAL scores. Floor effects were minimal on the RAVLT, CANTAB AST, CANTAB SWM, CANTAB
RVP, and CANTAB SOC. Taken together, these findings indicate that most cognitive tests
had good sensitivity, apart from the CANTAB PAL and SWM, which showed some lack of
sensitivity across GOSE categories, and the TMT and TUG which may not be suitable for
patients with the most severe disabilities.
6.5.2. Recommendations
The current study demonstrates that the completeness and validity of TBI outcome
measures in CENTER-TBI was affected by the context in which they were used. A “sliding” or
“flexible” approach (CENTER-TBI, 2018; Yue et al., 2018; Yue et al., 2013) may therefore be
useful in retrospective analyses of CENTER-TBI data to ensure that outcome assessments are
tailored appropriately for different TBI sub-groups. The “flexible battery approach” is
popular in clinical practice (Strauss et al., 2006; Sweet, Moberg, & Suchy, 2000a; Sweet,
Moberg, & Suchy, 2000b), but has not been used routinely in TBI research, perhaps because
the use of different measures for sub-groups of patients reduces comparability between
patients and potentially introduces bias. The use of a sliding approach to outcome
assessment is not straightforward, and selection of appropriate measures is complex given
the heterogeneous nature of TBI. Nevertheless, the current study provides information
about which outcome measures may be advisable for patients with different post-TBI levels
of functional recovery. This information will be useful when selecting measures for use in
future prospective studies and provides guidance for performing retrospective analyses of
data collected for CENTER-TBI. It may also provide guidance for other InTBIR studies, such
as TRACK-TBI. The findings from the study also have implications for further refinement of
the CDEs (Hicks et al., 2013), as they highlight the importance of selecting appropriate
measures for use with specific TBI sub-groups. There are study-specific reasons for choosing
particular outcome measures; thus a single set of instruments is not appropriate in all study
contexts.
159
Multi-dimensional outcome assessment was found to be particularly challenging to
implement for patients with severe functional limitations. Moreover, patients assigned to
the ‘lower severe disability’ category had relatively poorer HRQoL and psychological status
than patients with better levels of functional recovery, their performance was relatively
poor on cognitive tests, and floor effects were found on assessments of physical functioning,
such as the SF-36v2 ‘physical functioning’ and ‘role-physical’ sub-scales and TUG. An
abbreviated set of outcome measures could be useful for patients assigned to the GOSE
‘lower severe disability’ category. The choice of particular assessments for this group will
depend on the purposes of the research, and further work is needed to validate measures
that may be suitable. In particular, the Functional Independence Measure (FIM) (Linacre,
Heinemann, Wright, Granger, & Hamilton, 1994), could be used with patients who cannot
self-report and who are unable to complete cognitive assessments or tests of physical
functioning. The FIM can be completed via observational ratings and proxy reports, making
it suitable for use with patients who are unable to self-report (Wilde et al., 2010).
Furthermore, it measures problems that the RPQ does not capture, such as impaired
mobility and communication difficulties, making it suitable for patients with severe
functional limitations. As the FIM is best suited for in-patients settings, the potential for
ceiling effects (Hall et al., 1996) should be taken into consideration, especially if used with
patients who have been discharged from hospital.
Although as a group, most patients in the GOSE ‘good recovery’ categories reported no
psychiatric symptoms or post-concussion symptoms in this study, investigators should be
aware that some patients with good levels of functioning may meet diagnostic criteria for
psychological disorders, such as clinical depression, anxiety, or PTSD, or have clinically
relevant TBI symptoms or impaired performance on cognitive tests (Maas et al., 2017;
Nelson, Ranson, Ferguson, Giacino, Okonkwo, Valadka, Manley, McCrea, et al., 2017).
Measures that capture emotional adjustment, TBI symptoms, and cognition are therefore
useful to include when assessing outcomes in patients who might otherwise appear to have
fully recovered. These assessments may be particularly helpful in distinguishing between
patients in the ‘lower’ and ‘upper good recovery’ categories, given that the boundary
between these categories on the GOSE can be indeterminate.
160
The findings from this study indicate that multi-dimensional outcome assessment in TBI
research could be guided by stratifying patients into groups according to their level of
functional recovery on the GOSE. However, it should be borne in mind that the GOSE is not
the only measure suitable for this purpose. The GOAT has been used to stratify patients
into sub-groups for further tailored outcome assessment in TRACK-TBI (Yue et al., 2018; Yue
et al., 2013). In future TBI research, alternative screening measures could be chosen instead
of the GOSE or GOAT: one possibility is the Disability Rating Scale (DRS), another CDE
measure of global functioning that is applicable across different functional levels (Hicks et
al., 2013). Another possibility would be to stratify patients by injury severity. However, as
the relationship between injury severity and outcome is indirect, tailoring outcome
assessment according to GCS or ISS scores may not be particularly useful.
Detailed outcome assessments can be difficult to obtain in large-scale multicentre studies,
such as CENTER-TBI. Thus, a pragmatic approach was used in CENTER-TBI to maximise
follow-up rates and outcome assessments could be completed in person, via telephone, via
post, or using information from clinical records. Steps were also taken to mitigate failure to
return for follow-ups, such as contacting participants early in the follow-up time window,
obtaining contact details for relatives/caregivers, and organising and paying for participant
transportation (Bodien et al., 2018; Maas, Menon, et al., 2015). Completion of the full set of
CENTER-TBI outcome measures was estimated to take around 3 hours per participant, and
the final selection of assessments depended on whether the patient was cognitively able,
and whether the assessments were logistically feasible (Maas, Menon, et al., 2015).
In this study, PerfO completion rates were relatively low in comparison to PRO completion
rates. Investigators should therefore be mindful of practical constraints when obtaining
follow-ups. The QOLIBRI and QOLIBRI-OS were found to have good completion rates and
sensitivity across all GOSE categories. As meta-analyses have shown that response rates in
longitudinal studies are better for questionnaires that are shorter in length (Edwards,
Roberts, Sandercock, & Frost, 2004; Rolstad, Adler, & Ryden, 2011), it is advisable to use a
short multi-dimensional PRO, such as the QOLIBRI-OS, along with the GOSE, in situations
where it is difficult to complete detailed follow-ups. This will help to minimise the burden of
assessment, while incorporating multi-dimensional outcome measures that are appropriate
161
in different contexts of use. In situations where face-to-face visits are feasible, PerfOs
should be a priority, since they provide information not available from other outcome
measures.
6.5.3. Limitations
This study demonstrates how multi-dimensional outcome assessment could be tailored
according to post-TBI functional level. However, some key limitations should be considered.
Firstly, the completion rates obtained in CENTER-TBI may not be generalizable to other
studies. Outcome completion rates were better for patients with better levels of functional
recovery. However, from the information available, it was not possible to fully examine
reasons for missing outcomes. Test completion codes have previously been used in the
citicoline brain injury treatment (COBRIT) trial (Bagiella et al., 2010b; Zafonte et al., 2009),
and are useful in RCTs and CER as a means of recording reasons for missing outcome
measures. GOSE follow-up rates were highly variable between study sites, indicating that
there may have been site-specific reasons for non-completion of other outcome measures.
Furthermore, reasons were missing for up to half of the non-completed PerfOs, suggesting
that test completion codes may be difficult to implement in large-scale multicentre studies
such has CENTER-TBI. It is unclear why the completion codes were not adopted by CENTER-
TBI investigators for all follow-ups. However, investigator training and monitoring may have
helped to ensure that test completion codes were completed more fully. Secondly,
outcome completion rates were found to be lowest for patients assigned to the ‘lower
severe disability’ category. Nevertheless, CENTER-TBI did not use a prospective flexible
assessment approach and therefore did not include a suitable measure specifically suitable
for patients with severe disabilities, i.e., the FIM (Linacre et al., 1994). Further research is
therefore needed to assess which instruments are suitable for use with patients with the
greater functional limitations, who may be unable to complete measures of feeling (i.e.,
PROs) and functioning (i.e., PerfOs). Thirdly, most patients in this study were assigned to
the GOSE ‘good recovery’ categories and the sample mainly comprised patients scoring in
the GCS 13-15 range, which is conventionally categorised as ‘mild’ TBI (Teasdale & Jennet,
1974). As patients with more severe injuries and poorer outcomes were a relatively small
group, the findings may have limited applicability across the spectrum of TBI severity.
162
6.5.4. Conclusion
Outcomes can be difficult to obtain in large-scale multicentre studies, particularly for
patients with the greatest levels of disability. In this study, most of the PROs and some
CANTAB sub-tests were found to lack sensitivity when completed by patients with better
levels of functional recovery. Furthermore, floor effects were found on the TMT, CANTAB
PAL, and TUG for patients assigned to the ‘lower severe disability’ category: measures such
as the FIM may therefore be appropriate for use with this sub-group. The findings from this
study indicate that a sliding approach could be used in TBI research to tailor outcome
assessment for different contexts of use. In particular, the GOSE could be used to guide
detailed assessment in specific outcome domains for patients at different post-TBI
functional levels. An abbreviated set of outcome measures could be used with patients with
the greatest levels of post-TBI functional limitation. Furthermore, in situations where it is
difficult to obtain detailed outcome assessment, a short multi-dimensional HRQoL measure,
such as the QOLIBRI, may be used in addition to the GOSE. The findings from this study
provide information for researchers undertaking further analyses of the CENTER-TBI data,
for future prospective TBI studies, and for refinement of the CDEs. The particular measures
that are selected in future TBI studies will depend upon the purposes of the research, but
investigators should ensure that they are validated for specific contexts of use and capture
the multi-dimensional impact of TBI, while taking pragmatic constraints into consideration.
163
CHAPTER 7
Integrated discussion and conclusions
This final chapter draws together the main findings and recommendations from the thesis
and provides suggestions for future research.
164
7.1. Integrated discussion
Traumatic brain injury (TBI) affects multiple aspects of health and daily functioning.
However, in the acute care setting, researchers have often used single measures of global
functional outcome, such as the Glasgow Outcome Scale (GOS), to characterize recovery,
and have not routinely incorporated measures that capture the multi-dimensional impact of
TBI. Multi-dimensional outcome assessment is an increasingly widely used, but poorly
defined, concept in TBI research. Pragmatically, outcome assessments can be considered to
be multi-dimensional if they measure two or more aspects of health and daily life.
However, consensus is lacking on which particular domains are key. This thesis investigated
the measurement of global functional outcome in TBI research and considered the role of
the GOSE in multi-dimensional outcome assessment. The International Society for
Pharmacoeconomics and Outcomes Research (ISPOR) framework for clinical outcome
assessments (COAs) was used to examine the usability of clinician-reported outcomes
(ClinROs), patient-reported outcomes (PROs), and performance outcomes (PROs) in adult
TBI. Chapter 2 examined the patterns of use and reporting quality of COAs, including
measures of global functional outcome, in clinical trials in adult TBI. Chapters 4 and 5
evaluated the comparability of clinician ratings and respondent reports of global functional
outcome: firstly, by exploring whether the GOSE structured interview provides added value
over the GOSE questionnaire, and secondly, by examining how clinician ratings on the GOSE
structured interview and patient reports on the GOSE questionnaire relate to prognostic
factors and other outcome domains. Chapter 6 considered how multi-dimensional outcome
assessment in TBI studies could be tailored for patients with different levels of global
functional outcome.
The author of this thesis was responsible for conducting follow-up assessments with
patients in NHS Lothian. CENTER-TBI follow-ups could be completed in person, via
telephone, via post, or using information from clinical records. The outcomes data
collection process involved contacting TBI patients or their relatives/caregivers in advance
of the scheduled follow-up date, and, upon contact with the patient (and/or their relative or
carer), the most appropriate approach to completing the outcome measures was
ascertained in accordance with the needs, preferences, and circumstances of the individual.
165
CENTER-TBI investigators were encouraged to complete both versions of the GOSE, where
possible. Thus, the data provided an opportunity to compare clinician ratings and patient
reports of global functional outcome in the studies presented in Chapters 4 and 5.
Consistent with CENTER-TBI guidelines, the author of this thesis took steps to mitigate
against participant drop-out, such as contacting patients early in the follow-up time
window, obtaining contact details for relatives/caregivers, and organising and paying for
participant transportation (Maas, Menon, et al., 2015). Despite this, data collection for
some of the NHS Lothian follow-ups was found to be challenging: this experience appeared
to be common among CENTER-TBI outcome assessors. The process of contacting patients
and organising follow-ups could be laborious at times. Furthermore, clinical judgement was
required when determining which assessments were appropriate for completion with
specific individuals. Of particular relevance to this thesis, several of the NHS Lothian
patients were assigned to the GOSE ‘lower severe disability’ category upon follow-up
(particularly at 3 months after injury). These patients were unable to complete the full set
of CENTER-TBI outcome measures, highlighting the difficulties associated with implementing
multi-dimensional outcome assessment across spectrum of recovery, and providing the
motivation for the study presented in Chapter 6.
7.1.1. Participant characteristics
The participants described in this thesis were selected from the CENTER-TBI core study
(Maas, Menon, et al., 2015). The patients included in the study samples were, on average,
older than those enrolled in European studies in previous decades (Murray et al., 1999), and
approximately one-quarter were 66 years or older and retired. Around two-thirds of the
patients were male, and almost all of them were Caucasian. Incidental falls were the most
common cause of injury overall, followed by road traffic accidents. Consistent with previous
studies (Leong et al., 2013; van Leeuwen et al., 2012), a considerable proportion of the
participants in the study samples had co-morbid extracranial injuries (i.e., 34-40% had
severe injuries to non-head and neck body regions). Approximately two-thirds had scores in
the GCS 13-15 range (Teasdale et al., 1979). Furthermore, 44-51% of the participants in the
study samples were admitted to ICU, around half had CT abnormalities, and total ISS scores
(Baker et al., 1974) were above the threshold for major trauma in all study samples.
166
The demographic and clinical characteristics of the study samples are broadly comparable
to the total CENTER-TBI core study sample and reflect the changing epidemiology of TBI in
Europe: the average age of TBI is increasing, and falls are now the most common cause of
injury in high-income countries, particularly in older adults (Brazinova et al., 2016; Maas et
al., 2017; Peeters et al., 2017; Peeters et al., 2015). The increased incidence of TBI in older
adults has implications for the use of study outcome measures. For example, as cognitive
functioning declines with increasing age (Strauss et al., 2006), it may be necessary to adjust
for the effect of age on performance on cognitive assessments in TBI studies. Adjustments
for potentially confounding covariates such as age and acute stage prognostic factors (e.g.,
injury severity) were not performed in this thesis, but the impact of these factors will be
examined in further CENTER-TBI analyses.
7.1.2. Approaches to measuring global functional outcome
The first main theme of this thesis was the comparison between clinician-ratings and
patient-reports on the GOSE. This comparison is important for two main reasons. Firstly,
despite the drive towards use of PROs in clinical research (U.S. Food & Drug Administration,
2009; Walton et al., 2015), patients with TBI may be unable to provide an accurate self-
report on the GOSE questionnaire (Prigatano, 2005a, 2005b; Wilson et al., 2002). Secondly,
as investigators are often not masked in observational studies, such as CENTER-TBI, clinician
ratings on the GOSE structured interview may be influenced by knowledge about prognostic
factors, e.g., injury severity (Sherer et al., 2010), as well as knowledge about performance
on other outcome measures, e.g., cognitive tests. CENTER-TBI provided an opportunity to
examine these issues as a pragmatic approach was taken to data collection, and the GOSE
could be completed as a clinician-rated structured interview (Wilson et al., 1998) or as a
self-completion questionnaire (Wilson et al., 2002).
The systematic review in Chapter 2 (Horton et al., 2018) demonstrated that the GOS/E is
the most commonly used COA in previous clinical trials in adult TBI. However, the review
also showed that the GOS/GOSE was not used uniformly across the studies and insufficient
information was provided about how it was used. The scale was mainly used in RCTs in
acute study settings, often as a primary endpoint, and most of the studies in the review
167
collected information via guided or structured interviews rather than using the GOSE
questionnaire. In terms of reporting quality, none of the articles provided information
about whether extracranial injuries were included in GOS/GOSE ratings. Most articles did
not state whether patients with pre-existing severe disability were excluded, or who the
respondent was. Furthermore, around half of the articles did not state the primary method
of contact for GOS/GOSE assessments. As discussed previously, heterogeneity in
implementing the GOS/E is potentially problematic because different modes of data
collection may not be equivalent (Eremenco et al., 2014; Powers et al., 2017; Walton et al.,
2015). Thus, the way in which the GOS/GOSE is used may influence study findings. As
noted in Chapter 2, this is an important issue when pooling data for secondary analyses.
The findings from Chapter 2 provided the motivation for the studies presented in Chapters
4 and 5. Chapter 4 demonstrated that GOSE structured interview and GOSE questionnaire
scores were similar in different contexts of use, including with patients with pre-existing
functional limitations, epilepsy, CT abnormalities, and moderate-to-severe TBI. In addition,
Chapter 5 showed that GOSE assignment was not affected by investigator bias or by the
patient’s perspective. Together, these findings indicate that clinician ratings and patient
reports of global functional outcome are broadly comparable. Nevertheless, the findings
also revealed that there are certain circumstances in which it is advisable to supplement
information obtained via the GOSE questionnaire with information from the GOSE
structured interview. Firstly, due to the subjective nature of TBI-related symptoms, the
boundary between the ‘lower’ and ‘upper good recovery’ categories can be difficult to
determine. In Chapter 4, the impact of TBI symptoms on daily functioning was found to be
under-reported on the GOSE questionnaire. This issue can at least partly be overcome by
collecting additional information about symptoms using the GOSE structured interview, or
by re-scoring the symptoms section of the GOSE questionnaire. Secondly, Chapter 4
showed that inconsistencies can occur between clinician ratings and respondent reports
when the GOSE is completed with patients with greater levels of disability and those with
extracranial injuries, but only in the first few months after injury. The GOSE structured
interview is therefore useful at 3-month follow-up when assessing patients with greater
levels of disability, and for gathering additional information about the reasons for functional
limitations in patients with significant injuries to other body regions.
168
Previous TBI studies have provided limited information about the comparability of clinician
ratings and patient reports of global functional outcome. Thus, the studies presented in
Chapters 4 and 5 are novel because they directly compared clinician ratings and patient
reports of global functional outcome in large samples of TBI patients. The large number of
participants in CENTER-TBI made it possible to conduct a detailed investigation of
agreement on individual GOSE sections; enabled exploration of the effect of factors such as
extracranial injury on GOSE assignment; and allowed the effect of investigator bias and the
patient’s perspective on GOSE scores to be examined, none of which have formally been
investigated. Nevertheless, as CENTER-TBI was an observational project, the studies
presented in Chapters 4 and 5 did not have an experimental design. The GOSE was not
collected in a uniform way across the CENTER-TBI study sites. Thus, systematic comparisons
between different modes of data collection (i.e., face-to-face versus telephone interviews,
and patient versus proxy reports on the GOSE questionnaire) were not possible.
Additionally, as patient self-awareness was not measured directly as part of the CENTER-TBI
follow-ups, the study presented in Chapter 5 lacked verification about the accuracy of
patient’s self-reports.
In light of the limitations presented above, it would be useful to make systematic
comparisons between different modes of GOSE data collection in a future prospective study
in which investigators were masked. Information could be obtained from independent
investigators via face-to-face and telephone interviews, and then compared, to determine
whether face-to-face contact with the investigator adds any added value when assessing
functional recovery. A direct comparison between patient reports and reports from other
informants was not possible in this thesis due to the way that the CENTER-TBI outcomes
were collected. However, as lack of self-awareness may be problematic when measuring
global functional outcome, particularly when assessing patients with greater injury severity
(Prigatano, 2005a, 2005b), it would also be useful compare patient and proxy reports on the
GOSE questionnaire and use the Patient Competency Rating Scale (Prigatano & Fordyce,
1986) to verify the accuracy of patients’ self-reports. These suggestions notwithstanding, it
is important to note that systematic comparisons between GOSE approaches are difficult to
implement, as repeated administration of the scale is time consuming and potentially
169
difficult to achieve, especially if other outcome assessments are incorporated. Conducting
such a study may therefore be difficult and only practical in certain settings.
Taken together, the findings from Chapters 4 and 5 indicate that information collected via
structured interviews makes little overall difference to GOSE assignment and suggest that
mixed modes of GOSE collection can be used to facilitate participant retention in studies
with pragmatic constraints. CENTER-TBI investigators were encouraged to complete both
versions of the GOSE, if possible, and the scale was not used uniformly across study sites
(Maas, Menon, et al., 2015). A composite GOSE score (Wilson & Horton, 2018), comprising
clinician ratings and patient reports, was therefore created as part of the CENTER-TBI data
curation process, to maximise outcome completion rates. When creating the GOSE
composite, information collected via the GOSE structured interview was prioritised, if
available. As the information obtained via the GOSE structured interview and GOSE
questionnaire was found to be comparable in Chapters 4 and 5, the GOSE composite was
used in Chapter 6 of this thesis.
7.1.3 Tailoring outcome assessment in relation to level of global outcome
The second main theme in this thesis was consideration of the usefulness of tailoring multi-
dimensional outcome assessment for patients with different levels of functional recovery.
CENTER-TBI and TRACK-TBI both have the goal of validating individual outcome measures in
different contexts of use. Furthermore, both projects are investigating approaches to
tailoring outcome assessments for TBI sub-groups, for example, using the Galveston
Orientation and Amnesia Test (GOAT) (Yue et al., 2018; Yue et al., 2013) or injury severity
(CENTER-TBI, 2018) to stratify patients. In clinical practice, neuropsychological assessments
are tailored to the particular needs of the individual, and the choice of instruments often
depends on the information available about the patient, as well as the specific reasons for
referral (Strauss et al., 2006). The “flexible battery approach,” which incorporates variable
but routine sub-sets of tests for different patient types, has been favoured by clinical
neuropsychologists for decades (Sweet et al., 2000a; Sweet et al., 2000b). However, the
concept of a “flexible” or “sliding” approach to outcome assessment is relatively novel in TBI
research, and there is currently no consensus about how tailored outcome assessments
could be implemented in TBI studies.
170
Patients assigned to different GOSE categories represent different contexts of use for
outcome measures (Maas et al., 2017; Nelson, Ranson, Ferguson, Giacino, Okonkwo,
Valadka, Manley, McCrea, et al., 2017; Walton et al., 2015). Therefore, the study presented
in Chapter 6 considered the quality and validity of the CENTER-TBI outcome measures when
used with patients assigned to different GOSE categories. The applicability of individual
outcome measures has not been formally investigated in relation to the patient’s level of
functional recovery. However, it is presumably already taken into consideration by
researchers when planning and designing TBI studies. Chapter 6 showed that multi-
dimensional outcome assessment was more challenging to implement with patients with
greater functional limitations. Furthermore, ceiling effects were found to be present on
several outcome measures, mainly for patients with better functional levels, whereas floor
effects were minimal and only occurred in the ‘lower severe disability’ group. These
findings demonstrate that the applicability of outcome assessment in TBI research is
strongly driven by level of global functional outcome. Due to the heterogeneity of TBI, few
outcome measures can be applied with all patients. A one-size-fits-all approach to
characterising outcomes in TBI studies is therefore insufficient, and consistent with CENTER-
TBI and TRACK-TBI objectives, a tailored approach is necessary to characterise recovery in
different TBI sub-groups. It should be noted, however, that use of a tailored approach may
not be applicable in all TBI study types, as it reduces the comparability between patient sub-
groups and potentially introduces bias.
Detailed outcome assessments can be difficult to obtain in large-scale multicentre studies.
This is potentially problematic because selective attrition of participants in longitudinal TBI
studies can result in systematic bias is study findings (Corrigan et al., 2003; Krellman et al.,
2014; Langley et al., 2010). Completion of the full set of CENTER-TBI outcome measures was
estimated to take around 3 hours per patient and assessments were conducted if they were
logistically feasible and patients were cognitively able (Maas, Menon, et al., 2015).
Cognitive assessments and tests of physical functioning were found to have the lowest
completion rates: these measures must be completed face-to-face, making them more
difficult to obtain than outcomes that can be collected via telephone or post. Furthermore,
they can only be completed with patients who are able, making them potentially unsuitable
171
for patients with severe disabilities. Due to the limited information available, it was not
possible to make conclusions about the reasons for non-completion of these outcome
measures in Chapter 6. Failure to complete CENTER-TBI follow-ups was partly due to logistic
constraints and patient-specific limitations, but it could also be due to site-specific issues
that could not be addressed in this thesis. There was variability in the follow-up completion
rates between study-sites. Thus, the outcome completion rates presented in this thesis may
not be generalizable beyond CENTER-TBI.
The findings from Chapter 6 are relevant to other researchers as they provide guidance for
selecting outcome measures in different contexts of use (Walton et al., 2015), i.e., according
to post-TBI functional level. The findings are of relevance to further CENTER-TBI analyses.
Firstly, they will inform other CENTER-TBI outcomes analyses, which will examine the
outcome measures in more detail with the overarching objective of developing a multi-
dimensional tool for classifying outcomes after TBI (CENTER-TBI, 2018). The responsiveness,
sensitivity, and parsimony of the outcome measures will be examined by other CENTER-TBI
researchers, and structural equation modelling will be done to identify predictors,
moderators and confounders in TBI outcome assessment. The findings from Chapter 6 will
also inform other strands of the CENTER-TBI project and may be useful for investigators with
a background in acute TBI, who have limited knowledge about outcomes research. The
information obtained about outcome completion rates for different GOSE categories could
be used to help guide the selection of outcome measures for comparative effectiveness
research (CER). CER aims to improve clinical decision-making by investigating differences in
care and outcome in observational studies (Maas, Menon, et al., 2015). It exploits the
natural variability in clinical practice and allows investigators to identify which treatments
work best in ordinary clinical settings (Maas et al., 2012). Selection of sensitive outcome
measures with good completion rates is important in CER because it reduces the likelihood
of bias due to selective attrition of patients (i.e., patients with severe disabilities may have
poor completion rates due to cognitive or physical impairment).
Chapter 6 also provides guidance for designing future prospective studies as it indicates
that researchers should be aware of practical constraints when designing studies and
conducting outcome assessments in TBI. In situations where outcomes are particularly
172
challenging to obtain, a short TBI-specific PRO, such as the QOLIBRI or QOLIBRI-OS (von
Steinbüchel, Wilson, Gibbons, Hawthorne, Hofer, Schmidt, Bullinger, Maas, Neugebauer,
Powell, von Wild, Zitnay, Bakx, Christensen, Koskinen, Sarajuuri, et al., 2010; von
Steinbüchel et al., 2012), could be used in addition to the GOSE to gather information about
the multi-dimensional impact of TBI. Where more detailed follow-ups are practical, the use
of cognitive tests with good sensitivity across the spectrum of recovery is advisable.
Measures of emotional adjustment should also be included, where practical, to capture
problems such as depression and anxiety in patients who may otherwise appear to have
fully recovered on the GOSE (Maas, Menon, et al., 2015; Nelson, Ranson, Ferguson, Giacino,
Okonkwo, Valadka, Manley, McCrea, et al., 2017).
Multi-dimensional outcome assessment has not been implemented routinely in previous
TBI clinical trials, particularly in acute study settings (Horton et al., 2018). Thus, researchers
designing future studies, particularly those comparing the effectiveness of acute treatments
and interventions, should aim to select outcome measures that capture the multi-
dimensional impact of TBI, while also taking practical issues into consideration. The findings
from this thesis indicate that while completion rates for the GOSE are relatively good
compared to other outcomes, it does not provide sufficient detail about specific aspects of
the patient’s functioning and feeling which are relevant in TBI. TBI researchers may
therefore need to compromise between using a brief, but blunt measure, such as the GOSE,
which is appropriate for use across the TBI spectrum; versus a more detailed set of outcome
assessments, which capture the multi-dimensional impact of TBI, but which are time
consuming and potentially difficult to obtain.
Chapter 6 provides information about the sensitivity and internal consistency of the
CENTER-TBI outcome measures with patients with different levels of post-TBI functioning.
However, further validation of TBI outcome measures is now required. CENTER-TBI and
TRACK-TBI researchers are currently working on this task. The data from these studies will
be used to validate outcome measures in different contexts of use (i.e., paediatric TBI, adult
TBI, epidemiology, acute hospital, moderate-to-severe TBI rehabilitation, mild
TBI/concussion), and this will inform further refinement of the NINDS CDEs (National
Institute of Neurological Disorders and Stroke, 2018b). The NINDS CDEs (Hicks et al., 2013;
173
Wilde et al., 2010) were introduced to reduce heterogeneity in the use of outcome
measures in TBI studies. Future refinement of the CDEs will allow researchers to pool data
for secondary analyses. Nevertheless, variability in the use of outcome measures is likely to
remain an issue in TBI research, due to the complexity of TBI, heterogeneity in TBI studies,
and wide range of outcome measures available.
7.1. Conclusions
This thesis makes an original contribution to the field of TBI research: firstly, because it
highlights the issues of heterogeneity, limited use of multi-dimensional outcomes, and
incomplete reporting of outcome measures in clinical trials in TBI; secondly, because it
directly compares clinician ratings and patient reports of global functional outcome in TBI
using large numbers of patients; and thirdly, because it considers the applicability of multi-
dimensional outcome assessment in TBI studies in relation to level of global functional
outcome. Chapters 4 and 5 demonstrate that clinician ratings and patient reports provide
broadly comparable information about global functional outcome after TBI. Furthermore,
Chapter 6 suggests that TBI outcome measures could be tailored to capture the multi-
dimensional impact of TBI across the spectrum of functional recovery. These findings
indicate that mixed modes of GOSE data collection can be used to maximise follow-ups in
studies with pragmatic constraints. The findings also demonstrate that the applicability of
individual outcome measures is strongly driven by level of global functional outcome. This
PhD project was part of the CENTER-TBI outcomes research strand (Maas, Menon, et al.,
2015). The findings therefore have immediate implications for further CENTER-TBI analyses.
The findings also have implications for selecting outcome measures in future prospective
studies, for refining the CDE outcome measures in TBI (Hicks et al., 2013; Wilde et al., 2010),
for conducting comparative effectiveness research (CER) (Maas et al., 2012), and for pooling
data for secondary analyses conducted as part of InTBIR (Tosetti et al., 2013).

174
References
Alali, A. S., Vavrek, D., Barber, J., Dikmen, S., Nathens, A. B., & Temkin, N. R. (2015). Comparative study of outcome measures and analysis methods for traumatic brain injury trials. Journal of Neurotrauma, 32(8), 581-589. doi:10.1089/neu.2014.3495
Allanson, F., Pestell, C., Gignac, G. E., Yeo, Y. X., & Weinborn, M. (2017). Neuropsychological predictors of outcome following traumatic brain injury in adults: a meta-analysis. Neuropsychology Review, 27(3), 187-201. doi:10.1007/s11065-017-9353-5
Altman, D. G. (2000). Statistics in medical journals: some recent trends. Statistics in Medical Journals, 19(23), 3275-3289. doi: 10.1002/1097-0258(20001215)19:23<3275::AID-SIM626>3.0.CO;2-M
American Society of Anesthesiologists. (2014, October 15). ASA Physical Status Classification System.Retrieved May 13 2019, from https://www.asahq.org/standards-and-guidelines/asa-physical-status-classification-system
Anderson, S. I., Housley, A. M., Jones, P. A., Slattery, J., & Miller, J. D. (1993). Glasgow Outcome Scale: an inter-rater reliability study. Brain Injury, 7(4), 309-317. doi:10.3109/02699059309034957
Andresen, E. M. (2000). Criteria for assessing the tools of disability outcomes research. Archives of Physical Medicine and Rehabilitation, 81(12 Suppl 2), S15-20. doi:10.1053/apmr.2000.20619
Andrews, P., Sinclair, H., Rodriguez, A., Harris, B., Battison, C., Rhodes, J., & Murray, G. (2015). Hypothermia for intracranial hypertension after traumatic brain injury. The New England journal of medicine, 373(25), 2403-2412. doi:10.1056/NEJMoa1507581
Babbie, E. (1973). Survey research methods. Belmont, CA: Wadsworth. Bagiella, E., Novack, T. A., Ansel, B., Diaz-Arrastia, R., Dikmen, S., Hart, T., & Temkin, N.
(2010). Measuring outcome in traumatic brain injury treatment trials: recommendations from the traumatic brain injury clinical trials network. Journal of Head Trauma Rehabilitation, 25(5), 375-382. doi:10.1097/HTR.0b013e3181d27fe3
Baker, S. P., O'Neill, B., Haddon, W., Jr., & Long, W. B. (1974). The Injury Severity Score: a method for describing patients with multiple injuries and evaluating emergency care. Journal of Trauma, Injury, Infection and Critical Care, 14(3), 187-196.
Bender, R., & Lange, S. (2001). Adjusting for multiple testing - when and how? Journal of Clinical Epidemiology, 54, 343-349. doi: 10.1016/S0895-4356(00)00314-0
Blevins, C. A., Weathers, F. W., Davis, M. T., Witte, T. K., & Domino, J. L. (2015). The posttraumatic stress disorder checklist for DSM-5 (PCL-5): development and initial psychometric evaluation. Journal of Traumatic Stress, 28, 489-498. doi:10.1002/jts
Bodien, Y. G., McCrea, M., Dikmen, S., Temkin, N., Boase, K., Machamer, J., . . . TRACK-TBI Investigators (2018). Optimizing outcome assessment in multicenter TBI trials: perspectives from TRACK-TBI and the TBI endpoints development initiative. Journal of Head Trauma Rehabilitation, 33(3), 147-157. doi:10.1097/HTR.0000000000000367
Bragge, P., Synnot, A., Maas, A. I., Menon, D. K., Cooper, D. J., Rosenfeld, J. V., & Gruen, R. L. (2016). A state-of-the-science overview of randomized controlled trials evaluating acute management of moderate-to-severe traumatic brain injury. Journal of Neurotrauma, 33(16), 1461-1478. doi:10.1089/neu.2015.4233
175
Brazinova, A., Rehorcikova, V., Taylor, M. S., Buckova, V., Majdan, M., Psota, M., . . . Synnot, A. (2016). Epidemiology of traumatic brain injury in Europe: a living systematic review. Journal of Neurotrauma. doi:10.1089/neu.2015.4126
Burton, A. (2017). The CENTER-TBI core study: the making-of. Lancet Neurology, 16(12), 958-959. doi:10.1016/S1474-4422(17)30358-7
Calvert, M., Blazeby, J., Altman, D. G., Revicki, D. A., Moher, D., Brundage, M. D. (2013). Reporting of patient-reported outcomes in randomized trials: the CONSORT PRO extension. Journal of the American Medical Association, 309(8), 814-822. doi:10.1001/jama.2013.879
Cambridge Cognition Ltd. (2014). CANTAB research suite 6 software user guide. Cambridge: Cambridge Cognition Ltd.
Clinical Data Interchange Standards Consortium. Therapeutic Area Data Standards User Guide for Traumatic Brain Injury Version 1.0. (2015, December 2). Retrieved May 13 2019, from https://www.cdisc.org/standards/therapeutic-areas/traumatic-brain-injury
Cohen, J. (1960). A coefficient of agreement for nominal scales. Educational and Psychological Measurement, 20(1), 37-46. doi: 10.1177/001316446002000104
MRC CRASH Trial Collaborators, Perel, P., Arango, M., Clayton, T., Edwards, P., Komolafe, E., . . . Yutthakasemsunt, S. (2008). Predicting outcome after traumatic brain injury: practical prognostic models based on large cohort of international patients. British Medical Journal, 336(7641), 425-429. doi:10.1136/bmj.39461.643438.25
Corrigan, J. D., Harrison-Felix, C., Bogner, J., Dijkers, M., Terrill, M. S., & Whiteneck, G. (2003). Systematic bias in traumatic brain injury outcome studies because of loss to follow-up. Archives of Physical Medicine and Rehabilitation, 84(2), 153-160. doi:10.1053/apmr.2003.50093
Covidence. (2017). Retrieved 13 May 2019, from https://www.covidence.org/home Cronbach, L. (1951). Coefficient alpha and the internal structure of tests. Psychometrika,
16(3), 297-334. doi.org/10.1007/BF02310555 Dacey, R., Dikmen, S., Temkin, N., McLean, A., Armsden, G., & Winn, H. R. (1991). Relative
effects of brain and non-brain injuries on neuropsychological and psychosocial outcome. Journal of Trauma, 31(2), 217-222.
Dripps, R.D. (1963). New classification of physical status. Anesthesiology, 24, 111. Duhaime, A. C., Gean, A. D., Haacke, E. M., Hicks, R., Wintermark, M., Mukherjee, P., . . .
Common Data Elements Neuroimaging Working Group Members. (2010). Common data elements in radiologic imaging of traumatic brain injury. Archives of Physical Medicine and Rehabilitation, 91(11), 1661-1666. doi:10.1016/j.apmr.2010.07.238
Edwards, P., Arango, M., Balica, L., Cottingham, R., El-Sayed, H., Farrell, B., . . . CRASH Trial collaborators.. (2005). Final results of MRC CRASH, a randomised placebo-controlled trial of intravenous corticosteroid in adults with head injury-outcomes at 6 months. Lancet, 365(9475), 1957-1959. doi:10.1016/S0140-6736(05)66552-X
Edwards, P., Roberts, I., Sandercock, P., & Frost, C. (2004). Follow-up by mail in clinical trials: does questionnaire length matter? Controlled Clinical Trials, 25(1), 31-52. doi:10.1016/j.cct.2003.08.013
Eremenco, S., Coons, S. J., Paty, J., Coyne, K., Bennett, A. V., McEntegart, D., & ISPOR PRO Mixed Modes Task Force. (2014). PRO data collection in clinical trials using mixed modes: report of the ISPOR PRO mixed modes good research practices task force. Value in Health, 17(5), 501-516. doi:10.1016/j.jval.2014.06.005
176
Eyres, S., Carey, A., Gilworth, G., Neumann, V., & Tennant, A. (2005). Construct validity and reliability of the Rivermead Post-Concussion Symptoms Questionnaire. Clinical Rehabilitation, 19(8), 878-887. doi:10.1191/0269215505cr905oa
Fann, J. R., Bombardier, C. H., Dikmen, S., Esselman, P., Warms, C. A., Pelzer, E., . . . Temkin, N. (2005). Validity of the Patient Health Questionnaire-9 in assessing depression following traumatic brain injury. Journal of Head Trauma Rehabilitation, 20(6), 501-511.
Feise, R. J. (2002). Do multiple outcome measures require p-value adjustment? BMC Medical Research Methodology, 2(1), 8. doi:10.1186/1471-2288-2-8
Findler, M., Cantor, J., Haddad, L., Gordon, W., & Ashman, T. (2001). The reliability and validity of the SF-36 health survey questionnaire for use with individuals with traumatic brain injury. Brain Injury, 15(8), 715-723. doi:10.1080/02699050010013941
Fleiss, J., & Cohen, J. (1973). The equivalence of weighted Kappa and the intraclass correlation coefficient as measures of reliability. Educational and Psychological Measurement, 33, 613-619.
Freemantle, N., Calvert, M., Wood, J., Eastaugh, J., & Griffin, C. (2003). Composite outcomes in randomized trials: greater precision but with greater uncertainty? JAMA, 289(19), 2554-2559. doi:10.1001/jama.289.19.2554
Frost, M., Reeeve, B., Liepa, A., Stauffer, J., & Hays, R. (2007). What is sufficient evidence for the reliability and validity of patient-reported outcome measures? Value in Health, 10(2). doi: 10.1111/j.1524-4733.2007.00272.x
Giacino, J. T., Kalmar, K., & Whyte, J. (2004). The JFK Coma Recovery Scale-Revised: Measurement characteristics and diagnostic utility. Archives of Physical Medicine and Rehabilitation, 85(12), 2020-2029. doi:10.1016/j.apmr.2004.02.033
Gregson, B., Rowan, E., Francis, R., McNamee, P., Boyers, D., Mitchell, P., . . . Mendelow, A. (2015). Surgical trial in traumatic intracerebral haemorrhage (STITCH): a randomised controlled trial of early surgery compared with initial conservative treatment. Health Technology Assessment (Winchester, England), 19(70), 1-138. doi:10.3310/hta19700
Grinnon, S. T., Miller, K., Marler, J. R., Lu, Y., Stout, A., Odenkirchen, J., & Kunitz, S. (2012). National Institute of Neurological Disorders and Stroke Common Data Element project – approach and methods. Clinical Trials, 9, 322-329. doi: 10.1177/1740774512438980
Hall, K. M., Mann, N., High, W. M., Wright, J., Kreutzer, J. S., & Wood, D. (1996). Functional measures after traumatic brain injury: Ceiling effects of FIM, FIM+FAM, DRS, and CIQ. Journal of head trauma rehabilitation, 11(5), 27-39. doi:Doi 10.1097/00001199-199610000-00004
Hicks, R., Giacino, J., Harrison-Felix, C., Manley, G., Valadka, A., & Wilde, E. A. (2013). Progress in developing common data elements for traumatic brain injury research: version two-the end of the beginning. Journal of Neurotrauma, 30(22), 1852-1861. doi:10.1089/neu.2013.2938
Higgins, J. P., Altman, D. G., Gotzsche, P. C., Juni, P., Moher, D., Oxman, A. D., . . . Cochrane Statistical Methods Group. (2011). The Cochrane Collaboration's tool for assessing risk of bias in randomised trials. British Medical Journal, 343, d5928. doi:10.1136/bmj.d5928
Horton, L., Rhodes, J., & Wilson, L. (2018). Randomized controlled trials in adult traumatic brain injury: a systematic review on the use and reporting of Clinical Outcome
177
Assessments. Journal of Neurotrauma, 35(17), 2005-2014. doi:10.1089/neu.2018.5648
Hutchinson, P., Kolias, A., Timofeev, I., Corteen, E., Czosnyka, M., Timothy, J., . . . Kirkpatrick, P. (2017). Trial of decompressive craniectomy for traumatic intracranial hypertension. New England Journal of Medicine, 375(12), 1119-1130. doi:10.1056/NEJMoa1605215
Icometrix. (2019). Icometrix. Retrieved 13 May 2019, from https://icometrix.com/ International Neuroinformatics Coordinating Facility. (2019). INCF. Retrieved 13 May 2019,
from https://www.incf.org/ Jefford, M., Stockler, M., & Tattersall, M. (2003). Outcomes research: what is it and why
does it matter? Internal Medicine Journal, 33(33), 110-118. doi: 10.1046/j.1445-5994.2003.00302.x
Jennett, B., & Bond, M. (1975). Assessment of outcome after severe brain damage. Lancet, 1(7905), 480-484.
Jennett, B., Snoek, J., Bond, M. R., & Brooks, N. (1981). Disability after severe head injury - observations on the use of the Glasgow Outcome Scale. Journal of Neurology, Neurosurgery and Psychiatry, 44(4), 285-293. doi: 10.1136/jnnp.44.4.285
Kean, J., & Malec, J. F. (2014). Towards a better measure of brain injury outcome: new measures or a new metric? Archives of Physical Medicine and Rehabilitation, 95(7), 1225-1228. doi:10.1016/j.apmr.2014.03.023
King, N. S., Crawford, S., Wenden, F. J., Moss, N. E., & Wade, D. T. (1995). The Rivermead Post Concussion Symptoms Questionnaire: a measure of symptoms commonly experienced after head injury and its reliability. Journal of Neurology, 242(9), 587-592.
Koskinen, S., Hokkinen, E. M., Wilson, L., Sarajuuri, J., Von Steinbuchel, N., & Truelle, J. L. (2011). Comparison of subjective and objective assessments of outcome after traumatic brain injury using the International Classification of Functioning, Disability and Health (ICF). Disability and Rehabilitation, 33(25-26), 2464-2478. doi:10.3109/09638288.2011.574776
Kreitzer, N. P., Hart, K., Lindsell, C. J., Manley, G. T., Dikmen, S. S., Ratcliff, J. J., . . . Adeoye, O. M. (2018). A comparison of satisfaction with life and the Glasgow Outcome Scale-Extended after traumatic brain injury: an analysis of the TRACK-TBI pilot study. Journal of Head Trauma Rehabilitation. doi:10.1097/HTR.0000000000000457
Krellman, J. W., Kolakowsky-Hayner, S. A., Spielman, L., Dijkers, M., Hammond, F. M., Bogner, J., . . . Tsaousides, T. (2014). Predictors of follow-up completeness in longitudinal research on traumatic brain injury: findings from the National Institute on Disability and Rehabilitation Research traumatic brain injury model systems program. Archives of Physical Medicine and Rehabilitation, 95(4), 633-641. doi:10.1016/j.apmr.2013.10.016
Kristman, V., Manno, M., & Cote, P. (2004). Loss to follow-up in cohort studies: how much is too much? European Journal of Epidemiology, 19, 751-760.
Kroenke, K., & Spitzer, R. L. (2002). The PHQ-9: A new depression diagnostic and severity measure. Psychiatric Annals, 32(9), 509-515. doi: 10.3928/0048-5713-20020901-06
Kroenke, K., Spitzer, R. L., & Williams, J. B. (2001). The PHQ-9: validity of a brief depression severity measure. Journal of General Internal Medicine, 16(9), 606-613.
Kroenke, K., Spitzer, R. L., Williams, J. B., & Lowe, B. (2010). The Patient Health Questionnaire Somatic, Anxiety, and Depressive Symptom Scales: a systematic

178
review. General Hospital Psychiatry, 32(4), 345-359. doi:10.1016/j.genhosppsych.2010.03.006
Landis, J. R., & Koch, G. G. (1977). The measurement of observer agreement for categorical data. Biometrics, 33(1), 159-174. doi: 10.2307/2529310
Langley, J., Johnson, S., Slatyer, M., Skilbeck, C. E., & Thomas, M. (2010). Issues of loss to follow-up in a population study of traumatic brain injury (TBI) followed to 3 years post-trauma. Brain Injury, 24(7-8), 939-947. doi:10.3109/02699052.2010.491494
Lee, I., & Preacher, K. (2013, September). Calculation for the test of the difference between two dependent correlations with one variable in common. Retrieved 13 May 2019, from http://quantpsy.org/corrtest/corrtest2.htm
Leong, B. K., Mazlan, M., Abd Rahim, R. B., & Ganesan, D. (2013). Concomitant injuries and its influence on functional outcome after traumatic brain injury. Disability and Rehabilitation, 35(18), 1546-1551. doi:10.3109/09638288.2012.748832
Levaux, M. N., Potvin, S., Sepehry, A. A., Sablier, J., Mendrek, A., & Stip, E. (2007). Computerized assessment of cognition in schizophrenia: promises and pitfalls of CANTAB. European Psychiatry, 22(2), 104-115. doi:10.1016/j.eurpsy.2006.11.004
Levin, H. S., O'Donnell, V. M., & Grossman, R. G. (1979). The Galveston Orientation and Amnesia Test. A practical scale to assess cognition after head injury. Journal of Nervous and Mental Disease, 167(11), 675-684.
Lezak, M. (2012). Neuropsychological Assessment. Oxford: Oxford University Press. Linacre, J. M., Heinemann, A. W., Wright, B. D., Granger, C. V., & Hamilton, B. B. (1994). The
structure and stability of the Functional Independence Measure. Archives of Physical and Medical Rehabilitation, 75(2), 127-132.
Lingsma, H. F., Roozenbeek, B., Steyerberg, E. W., Murray, G. D., & Maas, A. I. (2010). Early prognosis in traumatic brain injury: from prophecies to predictions. Lancet Neurology, 9(5), 543-554. doi:10.1016/S1474-4422(10)70065-X
Lowe, B., Decker, O., Muller, S., Brahler, E., Schellberg, D., Herzog, W., & Herzberg, P. Y. (2008). Validation and standardization of the generalized anxiety disorder screener (GAD-7) in the general population. Medical Care, 46(3), 266-274. doi: 10.1097/MLR.0b013e318160d093
Lu, J., Gary, K. W., Copolillo, A., Ward, J., Niemeier, J. P., & Lapane, K. L. (2015). Randomized controlled trials in adult traumatic brain injury: a review of compliance to CONSORT statement. Archives of Physical Medicine and Rehabilitation, 96(4), 702-714. doi:10.1016/j.apmr.2014.10.026
Maas, A. I., Braakman, R., Schouten, H. J., Minderhoud, J. M., & van Zomeren, A. H. (1983). Agreement between physicians on assessment of outcome following severe head injury. Journal of Neurosurgery, 58(3), 321-325. doi:10.3171/jns.1983.58.3.0321
Maas, A. I., Harrison-Felix, C. L., Menon, D., Adelson, P. D., Balkin, T., Bullock, R., . . . Schwab, K. (2011). Standardizing data collection in traumatic brain injury. J Neurotrauma, 28(2), 177-187. doi:10.1089/neu.2010.1617
Maas, A. I., Lingsma, H. F., & Roozenbeek, B. (2015). Predicting outcome after traumatic brain injury. Handbook of Clinical Neurology, 128, 455-474. doi:10.1016/B978-0-444-63521-1.00029-7
Maas, A. I., Menon, D. K., Lingsma, H. F., Pineda, J. A., Sandel, M. E., & Manley, G. T. (2012). Re-orientation of clinical research in traumatic brain injury: report of an international workshop on comparative effectiveness research. Journal of Neurotrauma, 29(1), 32-46. doi:10.1089/neu.2010.1599
179
Maas, A. I., Menon, D. K., Steyerberg, E. W., Citerio, G., Lecky, F., Manley, G. T., . . . CENTER-TBI Participants and Investigators. (2015). Collaborative European NeuroTrauma Effectiveness Research in Traumatic Brain Injury (CENTER-TBI): a prospective longitudinal observational study. Neurosurgery, 76(1), 67-80. doi:10.1227/NEU.0000000000000575
Maas, A. I., Murray, G., Henney, H., 3rd, Kassem, N., Legrand, V., Mangelus, M., . . . Pharmos TBI Investigators. (2006). Efficacy and safety of dexanabinol in severe traumatic brain injury: results of a phase III randomised, placebo-controlled, clinical trial. Lancet Neurology, 5(1), 38-45. doi:10.1016/S1474-4422(05)70253-2
Maas, A. I. R., Menon, D. K., Adelson, P. D., Andelic, N., Bell, M. J., Belli, A., . . . InTBIR Participants and Investigators. (2017). Traumatic brain injury: integrated approaches to improve prevention, clinical care, and research. Lancet Neurology, 16(12), 987-1048. doi:10.1016/S1474-4422(17)30371-X
MacKenzie, E. J., McCarthy, M. L., Ditunno, J. F., Forrester-Staz, C., Gruen, G. S., Marion, D. W., & Schwab, W. C. (2002). Using the SF-36 for characterizing outcome after multiple trauma involving head injury. The Journal of Trauma: Injury, Infection, and Critical Care, 52(3), 527-534. doi: 10.1097/00005373-200203000-00018
Marmarou, A., Lu, J., Butcher, I., McHugh, G. S., Mushkudiani, N. A., Murray, G. D., . . . Maas, A. I. (2007). IMPACT database of traumatic brain injury: design and description. Journal of Neurotrauma, 24(2), 239-250. doi:10.1089/neu.2006.0036
Marshman, L. A., Jakabek, D., Hennessy, M., Quirk, F., & Guazzo, E. P. (2013). Post-traumatic amnesia. Journal of Clinical Neuroscience, 20(11), 1475-1481. doi:10.1016/j.jocn.2012.11.022
McMillan, T., Wilson, L., Ponsford, J., Levin, H., Teasdale, G., & Bond, M. (2016). The Glasgow Outcome Scale - 40 years of application and refinement. Nature Reviews Neurology, 12(8), 477-485. doi:10.1038/nrneurol.2016.89
Mendelow, A., Gregson, B., Rowan, E., Francis, R., McColl, E., McNamee, P., . . . Mitchell, P. (2015). Early surgery versus initial conservative treatment in patients with traumatic intracerebral hemorrhage (STITCH[Trauma]): the first randomized trial. Journal of Neurotrauma, 32(17), 1312-1323. doi:10.1089/neu.2014.3644
Mendelow, A. D., Gregson, B. A., Fernandes, H. M., Murray, G. D., Teasdale, G. M., Hope, D. T., . . . STICH Investigators. (2005). Early surgery versus initial conservative treatment in patients with spontaneous supratentorial intracerebral haematomas in the International Surgical Trial in Intracerebral Haemorrhage (STICH): a randomised trial. Lancet, 365(9457), 387-397. doi:10.1016/S0140-6736(05)17826-X
Menon, D. K., & Maas, A. I. (2015). Traumatic brain injury in 2014. Progress, failures and new approaches for TBI research. Nature Reviews Neurology, 11(2), 71-72. doi:10.1038/nrneurol.2014.261
Menon, D. K., Schwab, K., Wright, D. W., Maas, A. I., Demographics, Clinical Assessment Working Group of the International and Interagency Initiative toward Common Data Elements for Research on Traumatic Brain Injury and Psychological Health. (2010). Position statement: definition of traumatic brain injury. Archives in Physical Medicine and Rehabilitation, 91(11), 1637-1640. doi:10.1016/j.apmr.2010.05.017
Murray, G. D., Teasdale, G. M., Braakman, R., Cohadon, F., Dearden, M., Iannotti, F., . . . Unterberg, A. (1999). The European Brain Injury Consortium survey of head injuries. Acta Neurochir (Wien), 141(3), 223-236.
180
National Institute of Neurological Disorders and Stroke. (2018a, December 13). Summary of Recommendations for Neuropsychological Impairment. Retrieved 13 May 2019, from https://www.commondataelements.ninds.nih.gov/TBI.aspx#tab=Data_Standards
National Institute of Neurological Disorders and Stroke. (2018b). Table of recommended outcome measures. Retrieved 13 May 2019, from https://www.commondataelements.ninds.nih.gov/TBI.aspx#tab=Data_Standards
Nelson, L. D., Ranson, J., Ferguson, A. R., Giacino, J., Okonkwo, D. O., Valadka, A., . . . McCrea, M. (2017). Validating multidimensional outcome assessment using the TBI Common Data Elements: an analysis of the TRACK-TBI pilot sample. Journal of Neurotrauma, 34(22), 3158-3172. doi:10.1089/neu.2017.5139
Newcombe, V. F., Correia, M. M., Ledig, C., Abate, M. G., Outtrim, J. G., Chatfield, D., . . . Menon, D. K. (2016). Dynamic changes in white matter abnormalities correlate with late improvement and deterioration following TBI: a diffusion tensor imaging study. Neurorehabilitation and Neural Repair, 30(1), 49-62. doi:10.1177/1545968315584004
Ngwenya, L. B., Gardner, R. C., Yue, J. K., Burke, J. F., Ferguson, A. R., Huang, M. C., . . . Manley, G. T. (2018). Concordance of common data elements for assessment of subjective cognitive complaints after mild-traumatic brain injury: a TRACK-TBI Pilot Study. Brain Inj, 32(9), 1071-1078. doi:10.1080/02699052.2018.1481527
Nichol, A. D., Higgins, A. M., Gabbe, B. J., Murray, L. J., Cooper, D. J., & Cameron, P. A. (2011). Measuring functional and quality of life outcomes following major head injury: common scales and checklists. Injury, 42(3), 281-287. doi:10.1016/j.injury.2010.11.047
Nunnally, J. (1978). Psychometric Theory (Second Edition ed.). New York: McGraw-Hill, Inc. Palmer, C. (2007). Major trauma and the injury severity score - Where should we set the
bar? Annual Proceedings Association for the Advancement of Automotive Medicine, 51, 13-29.
Parsons, T. D. (2016). Neuropsychological Assessment 2.0: Computer-Automated Assessments. In Clinical Neuropsychology and Technology (pp. 47-63). Cham: Springer International Publishing.
Peeters, W., Majdan, M., Brazinova, A., Nieboer, D., & Maas, A. I. R. (2017). Changing Epidemiological Patterns in Traumatic Brain Injury: A Longitudinal Hospital-Based Study in Belgium. Neuroepidemiology, 48(1-2), 63-70. doi:10.1159/000471877
Peeters, W., van den Brande, R., Polinder, S., Brazinova, A., Steyerberg, E. W., Lingsma, H. F., & Maas, A. I. (2015). Epidemiology of traumatic brain injury in Europe. Acta Neurochirurgican, 157(10), 1683-1696. doi:10.1007/s00701-015-2512-7
Pettigrew, L. E., Wilson, J. T., & Teasdale, G. M. (2003). Reliability of ratings on the Glasgow Outcome Scales from in-person and telephone structured interviews. Journal of Head Trauma Rehabilitation, 18(3), 252-258.
Podsiadlo, D., & Richardson, S. (1991). The timed "Up & Go": a test of basic functional mobility for frail elderly persons. Journal of the American Geriatrics Society, 39(2), 142-148. doi: 10.1111/j.1532-5415.1991.tb01616.x
Polinder, S., Haagsma, J. A., van Klaveren, D., Steyerberg, E. W., & van Beeck, E. F. (2015). Health-related quality of life after TBI: a systematic review of study design, instruments, measurement properties, and outcome. Population Health Metrics, 13, 4. doi:10.1186/s12963-015-0037-1
181
Potter, S., Leigh, E., Wade, D., & Fleminger, S. (2006). The Rivermead Post Concussion Symptoms Questionnaire: a confirmatory factor analysis. Journal of Neurology, 253(12), 1603-1614. doi:10.1007/s00415-006-0275-z
Powers, J. H., 3rd, Patrick, D. L., Walton, M. K., Marquis, P., Cano, S., Hobart, J., . . . Burke, L. B. (2017). Clinician-reported outcome assessments of treatment benefit: report of the ISPOR clinical outcome assessment emerging good practices task force. Value in Health, 20(1), 2-14. doi:10.1016/j.jval.2016.11.005
Prigatano, G., & Fordyce, D. (1986). Neuropsychological rehabilitation after brain injury. Baltimore Johns Hopkins University Press.
Prigatano, G. P. (2005a). Disturbances of self-awareness and rehabilitation of patients with traumatic brain injury: a 20-year perspective. Journal of Head Trauma Rehabilitation, 20(1), 19-29.
Prigatano, G. P. (2005b). Impaired self-awareness after moderately severe to severe traumatic brain injury. Acta Neurochirurgica Supplement, 93, 39-42.
QuesGen Systems Inc. (2016). Quesgen Systems, Retrieved 11/02/2019, from https://www.quesgen.com/
Richter, S., Stevenson, S., Newman, T., Wilson, L., Menon, D., Maas, A., . . . Newcombe, V. (2019). Handling of missing outcome data in traumatic brain injury research - a systematic review. Journal of Neurotrauma, (in press).
Roberts, I., Yates, D., Sandercock, P., Farrell, B., Wasserberg, J., Lomas, G., . . .CRASH Trial Collaborators. (2004). Effect of intravenous corticosteroids on death within 14 days in 10008 adults with clinically significant head injury (MRC CRASH trial): randomised placebo-controlled trial. Lancet, 364(9442), 1321-1328. doi:10.1016/S0140-6736(04)17188-2
Rolstad, S., Adler, J., & Ryden, A. (2011). Response burden and questionnaire length: is shorter better? A review and meta-analysis. Value in Health, 14(8), 1101-1108. doi:10.1016/j.jval.2011.06.003
Roozenbeek, B., Lingsma, H. F., Lecky, F. E., Lu, J., Weir, J., Butcher, I., . . . Trauma Audit and Research Network (TARN). (2012). Prediction of outcome after moderate and severe traumatic brain injury: external validation of the International Mission on Prognosis and Analysis of Clinical Trials (IMPACT) and Corticoid Randomisation After Significant Head injury (CRASH) prognostic models. Critical Care Medicine, 40(5), 1609-1617. doi:10.1097/CCM.0b013e31824519ce
Sacristan, J. A. (2013). Patient-centered medicine and patient-oriented research: improving health outcomes for individual patients. BMC Medical Informatics and Decision Making, 13(6), 6. doi:10.1186/1472-6947-13-6
Sainani, K. L. (2009). The Problem of Multiple Testing. Physical Medicine and Rehabilitation, 1(12), 1098-1103.
Salmond, C. H., Chatfield, D. A., Menon, D. K., Pickard, J. D., & Sahakian, B. J. (2005). Cognitive sequelae of head injury: involvement of basal forebrain and associated structures. Brain, 128(1), 189-200. doi:10.1093/brain/awh352
Schulz, K. F., Altman, D. G., & Moher, D. (2010). CONSORT 2010 Statement: Updated guidelines for reporting parallel group randomised trials. Journal of Clinical Epidemiology, 63(8), 834-840. doi:10.1016/j.jclinepi.2010.02.005
Scoggins, J. F., & Patrick, D. L. (2009). The use of patient-reported outcomes instruments in registered clinical trials: evidence from ClinicalTrials.gov. Contemporary Clinical Trials, 30(4), 289-292. doi:10.1016/j.cct.2009.02.005
182
Sheehan, J., Hirschfeld, S., Foster, E., Ghitza, U., Goetz, K., Karpinski, J., . . . Huerta, M. (2016). Improving the value of clinical research through the use of Common Data Elements. Clinical Trials, 13(6), 671-676. doi:10.1177/1740774516653238
Sherer, M., Roebuck-Spencer, T., & Davis, L. C. (2010). Outcome assessment in traumatic brain injury clinical trials and prognostic studies. Journal of Head Trauma Rehabilitation, 25(2), 92-98. doi:10.1097/HTR.0b013e3181c9d887
Smith-Seemiller, L., Fow, N. R., Kant, R., & Franzen, M. D. (2003). Presence of post-concussion syndrome symptoms in patients with chronic pain vs mild traumatic brain injury. Brain Injury, 17(3), 199-206. doi: 10.1080/0269905021000030823
Spitzer, R. L., Kroenke, K., Williams, J. B. W., & Lowe, B. (2006). A brief measure for assessing generalized anxiety disorder - The GAD-7. Archives of Internal Medicine, 166(10), 1092-1097. doi:DOI 10.1001/archinte.166.10.1092
Steiger, J. H. (1980). Tests for Comparing Elements of a Correlation Matrix. Psychological Bulletin, 87(2), 245-251. doi: 10.1037/0033-2909.87.2.245
Sterr, A., Herron, K. A., Hayward, C., & Montaldi, D. (2006). Are mild head injuries as mild as we think? Neurobehavioral concomitants of chronic post-concussion syndrome. BMC Neurology, 6, 7. doi:10.1186/1471-2377-6-7
Steyerberg, E. W., Mushkudiani, N., Perel, P., Butcher, I., Lu, J., McHugh, G. S., . . . Maas, A. I. (2008). Predicting outcome after traumatic brain injury: development and international validation of prognostic scores based on admission characteristics. PLoS Medicine, 5(8), e165; discussion e165. doi:10.1371/journal.pmed.0050165
Strauss, E., Sherman, E., & Spreen, O. (2006). A compendium of neuropsychological tests. New York: Oxford University Press.
Sweet, J. J., Moberg, P. J., & Suchy, Y. (2000a). Ten-Year Follow-up Survey of Clinical Neuropsychologists: Part I. Practices and Beliefs. Clinical Neuropsychologist, 14(1), 18-37. doi:10.1076/1385-4046(200002)14:1;1-8;ft018
Sweet, J. J., Moberg, P. J., & Suchy, Y. (2000b). Ten-year follow-up survey of clinical neuropsychologists: part II. Private practice and economics. Clinical Neuropsychologist, 14(4), 479-495. doi:10.1076/clin.14.4.479.7201
Teasdale, G., & Jennett, B. (1974). Assessment of coma and impaired consciousness. A practical scale. Lancet, 2(7872), 81-84. doi: 10.1016/S0140-6736(74)91639-0
Teasdale, G., Maas, A., Lecky, F., Manley, G., Stocchetti, N., & Murray, G. (2014). The Glasgow Coma Scale at 40 years: standing the test of time. The Lancet Neurology, 13(8), 844-854. doi:10.1016/s1474-4422(14)70120-6
Teasdale, G., Murray, G., Parker, L., & Jennett, B. (1979). Adding up the Glasgow Coma Score. In: Brihaye, J., Clarke, P.R.R., Loew, F., Overgaard, J. Pasztor, E., Pertuiset, B…Symon, L. (Eds.) Proceedings of the 6th European Congress of Neurosurgery. Acta Neurochirurgica Supplement, 28. Vienna; Springer.
Teasdale, G. M., Pettigrew, L. E. L., Wilson, J. T. L., Murray, G., & Jennett, B. (1998). Analyzing outcome of treatment of severe head injury: a review and update on advancing the use of the Glasgow Outcome Scale. Journal of Neurotrauma, 15(8), 587-597. doi: 10.1089/neu.1998.15.587
Temkin, N., Anderson, G., Winn, H., Ellenbogen, R., Britz, G., Schuster, J., . . . Dikmen, S. (2007). Magnesium sulfate for neuroprotection after traumatic brain injury: a randomised controlled trial. The Lancet Neurology, 6(1), 29-38. doi:10.1016/S1474-4422(06)70630-5
183
Thurmond, V. A., Hicks, R., Gleason, T., Miller, A. C., Szuflita, N., Orman, J., & Schwab, K. (2010). Advancing integrated research in psychological health and traumatic brain injury: common data elements. Arch Phys Med Rehabil, 91(11), 1633-1636. doi:10.1016/j.apmr.2010.06.034
Tosetti, P., Hicks, R. R., Theriault, E., Phillips, A., Koroshetz, W., Draghia-Akli, R., & Workshop Participants. (2013). Toward an international initiative for traumatic brain injury research. Journal of Neurotrauma, 30(14), 1211-1222. doi:10.1089/neu.2013.2896
Tukey, J. W. (1977). Exploratory data analysis. Reading Addison-Wesley. U.S. Food & Drug Administration. (2009). Guidance for industry. Patient-reported outcome
measures: use in medical product development to support labeling claims. Retrieved 13 May 2018, from https://www.fda.gov/regulatory-information/search-fda-guidance-documents/patient-reported-outcome-measures-use-medical-product-development-support-labeling-claims
U.S. Food & Drug Administration. Clinical Outcome Assessment Qualification Program. (2014). Retrieved 13 May 2019, from https://www.fda.gov/drugs/drug-development-tool-qualification-programs/clinical-outcome-assessment-coa-qualification-program
van Leeuwen, N., Lingsma, H. F., Perel, P., Lecky, F., Roozenbeek, B., Lu, J., . . . Trauma and Audit Research Network. (2012). Prognostic value of major extracranial injury in traumatic brain injury: an individual patient data meta-analysis in 39,274 patients. Neurosurgery, 70(4), 811-818; discussion 818. doi:10.1227/NEU.0b013e318235d640
Villemure, R., Nolin, P., & Le Sage, N. (2011). Self-reported symptoms during post-mild traumatic brain injury in acute phase: influence of interviewing method. Brain Injury, 25(1), 53-64. doi:10.3109/02699052.2010.531881
von Steinbüchel, N., Covic, A., Polinder, S., Kohlmann, T., Cepulyte, U., Poinstingl, H., . . . Truelle, J. L. (2016). Assessment of Health-Related Quality of Life after TBI: Comparison of a Disease-Specific (QOLIBRI) with a Generic (SF-36) Instrument. Behavioural Neurology, 2016, 7928014. doi:10.1155/2016/7928014
von Steinbüchel, N., Wilson, L., Gibbons, H., Hawthorne, G., Hofer, S., Schmidt, S., . . . QOLIBRI Task Force. (2010). Quality of Life after Brain Injury (QOLIBRI): scale validity and correlates of quality of life. Journal of Neurotrauma, 27(7), 1157-1165. doi:10.1089/neu.2009.1077
von Steinbüchel, N., Wilson, L., Gibbons, H., Hawthorne, G., Hofer, S., Schmidt, S., . . . Force, Q. T. (2010). Quality of Life after Brain Injury (QOLIBRI): scale development and metric properties. Journal of Neurotrauma, 27(7), 1167-1185. doi:10.1089/neu.2009.1076
von Steinbüchel, N., Wilson, L., Gibbons, H., Muehlan, H., Schmidt, H., Schmidt, S., . . . Truelle, J. (2012). QOLIBRI Overall Scale: a brief index of health-related quality of life after traumatic brain injury. Journal of Neurology, Neurosurgery and Psychiatry, 83, 1041-1047.
Walters, E. (2016). The P-value and the problem of multiple testing. Reproductive Biomedicine Online, 32(4), 348-349. doi:10.1016/j.rbmo.2016.02.008
Walton, M. K., Powers, J. H., 3rd, Hobart, J., Patrick, D., Marquis, P., Vamvakas, S., . . .International Society for Pharmacoeconomics and Outcomes Research Task Force for Clinical Outcomes Assessment. (2015). Clinical Outcome Assessments: Conceptual Foundation-Report of the ISPOR Clinical Outcomes Assessment -
184
Emerging Good Practices for Outcomes Research Task Force. Value in Health, 18(6), 741-752. doi:10.1016/j.jval.2015.08.006
Ware, J. E., Jr., & Sherbourne, C. D. (1992). The MOS 36-item short-form health survey (SF-36). I. Conceptual framework and item selection. Medical Care, 30(6), 473-483.
Weathers, F., Litz, B., Herman, D., Huska, J., & Keane, T. (1993). The PTSD Checklist (PCL): Reliability, validity, and diagnostic utility. Retrieved 13 May 2019, from www.ptsd.va.gov.
Weathers, F., Litz, B., Keane, T., Palmieri, P., Marx, B., & Schnurr, P. (2013). The PTSD checklist for DSM-5 (PCL-5).
Weir, J., Steyerberg, E. W., Butcher, I., Lu, J., Lingsma, H. F., McHugh, G. S., . . . Murray, G. D. (2012). Does the extended Glasgow Outcome Scale add value to the conventional Glasgow Outcome Scale? Journal of Neurotrauma, 29(1), 53-58. doi:10.1089/neu.2011.2137
Wilde, E. A., Whiteneck, G. G., Bogner, J., Bushnik, T., Cifu, D. X., Dikmen, S., . . . von Steinbüchel, N. (2010). Recommendations for the use of common outcome measures in traumatic brain injury research. Archives of Physical Medicine and Rehabilitation, 91(11), 1650-1660 e1617. doi:10.1016/j.apmr.2010.06.033
Wilson, J. T., Edwards, P., Fiddes, H., Stewart, E., & Teasdale, G. M. (2002). Reliability of postal questionnaires for the Glasgow Outcome Scale. Journal of Neurotrauma, 19(9), 999-1005. doi:10.1089/089771502760341910
Wilson, L., & Horton, L. (2018). CENTER-TBI: GOSE scoring algorithms and composite outcomes. Unpubished manuscript, Universityof Stirling.
Wilson, J. T., Pettigrew, L. E., & Teasdale, G. M. (1998). Structured interviews for the Glasgow Outcome Scale and the extended Glasgow Outcome Scale: guidelines for their use. Journal of Neurotrauma, 15(8), 573-585. doi:10.1089/neu.1998.15.573
Wilson, J. T., Pettigrew, L. E., & Teasdale, G. M. (2000). Emotional and cognitive consequences of head injury in relation to the Glasgow Outcome Scale. Journal of Neurolpgy, Neurosurgery and Psychiatry, 69(2), 204-209. doi: 10.1136/jnnp.69.2.204
Wilson, L., Marsden-Loftus, I., Koskinen, S., Bakx, W., Bullinger, M., Formisano, R., . . . Truelle, J. L. (2017). Interpreting Quality of Life after Brain Injury Scores: cross-walk with the Short Form-36. Journal of Neurotrauma, 34(1), 59-65. doi:10.1089/neu.2015.4287
Wilson, L., Slieker, F., Legrand, V., Murray, G., Stocchetti, N., & Maas, A. (2007). Observer variation in the assessment of outcome in traumatic brain injury: experience from a multicenter, international randomized clinical trial. Neurosurgery, 61(1), 123-128; discussion 128-129. doi:10.1227/01.neu.0000279732.21145.9e
Wortmann, J. H., Jordan, A. H., Weathers, F. W., Resick, P. A., Dondanville, K. A., Hall-Clark, B., . . . Litz, B. T. (2016). Psychometric analysis of the PTSD Checklist-5 (PCL-5) among treatment-seeking military service members. Psychological Assessment, 28(11), 1392-1403. doi:10.1037/pas0000260
Wright, D., Yeatts, S., Silbergleit, R., Palesch, Y., Hertzberg, V., Frankel, M., . . . Barsan, W. (2014). Very early administration of progesterone for acute traumatic brain injury. The New England journal of medicine, 371(26), 2457-2466. doi:10.1056/NEJMoa1404304
Yip, J. Y., Wilber, K. H., Myrtle, R. C., & Grazman, D. N. (2001). Comparison of older adult subject and proxy responses on the SF-36 health-related quality of life instrument. Aging and Mental Health, 5(2), 136-142. doi:10.1080/13607860120038357
185
Yue, J., Winkler, E., Deng, H., Markowitz, A., Wang, K., & Manley, G. (2018). The TRACK-TBI Approach: Redefining Severity and Outcome Assessments. In K. K. W. Wang (Ed.), Neurotrauma: A Comprehensive Textbook on Traumatic Brain Injury and Spinal Cord Injury (pp. 81-100). New York Oxford University Press.
Yue, J. K., Vassar, M. J., Lingsma, H. F., Cooper, S. R., Okonkwo, D. O., Valadka, A. B., . . . TRACK-TBI Investigators. (2013). Transforming research and clinical knowledge in traumatic brain injury pilot: multicenter implementation of the common data elements for traumatic brain injury. Journal of Neurotrauma, 30(22), 1831-1844. doi:10.1089/neu.2013.2970
Zafonte, R., Bagiella, E., Ansel, B., Novack, T., Friedewald, W., Hesdorffer, D., . . . Dikmen, S. (2012). Effect of citicoline on functional and cognitive status among patients with traumatic brain injury: Citicoline Brain Injury Treatment Trial (COBRIT). Journal of the American Medical Association, 308(19), 1993-2000. doi:10.1001/jama.2012.13256
Zafonte, R., Friedewald, W. T., Lee, S. M., Levin, B., Diaz-Arrastia, R., Ansel, B., . . . Jallo, J. (2009). The citicoline brain injury treatment (COBRIT) trial: design and methods. Journal of Neurotrauma, 26(12), 2207-2216. doi:10.1089/neu.2009.1015
186
Appendix 1: CENTER-TBI investigators and participants and their affiliations
Cecilia Åkerlund1, Krisztina Amrein2, Nada Andelic3, Lasse Andreassen4, Audny Anke5, Anna
Antoni6, Gérard Audibert7, Philippe Azouvi8, Maria Luisa Azzolini9, Ronald Bartels10, Pál
Barzó11, Romuald Beauvais12, Ronny Beer13, Bo-Michael Bellander14, Antonio Belli15, Habib
Benali16, Maurizio Berardino17, Luigi Beretta9, Morten Blaabjerg18, Peter Bragge19, Alexandra
Brazinova20, Vibeke Brinck21, Joanne Brooker22, Camilla Brorsson23, Andras Buki24, Monika
Bullinger25, Manuel Cabeleira26, Alessio Caccioppola27, Emiliana Calappi 27, Maria Rosa Calvi9,
Peter Cameron28, Guillermo Carbayo Lozano29, Marco Carbonara27, Giorgio Chevallard30,
Arturo Chieregato30, Giuseppe Citerio31, 32, Maryse Cnossen33, Mark Coburn34, Jonathan
Coles35, Jamie D. Cooper36, Marta Correia37, Amra Čović 38, Nicola Curry39, Endre Czeiter24,
Marek Czosnyka26, Claire Dahyot-Fizelier40, Helen Dawes41, Véronique De Keyser42, Vincent
Degos16, Francesco Della Corte43, Hugo den Boogert10, Bart Depreitere44, Đula Đilvesi 45,
Abhishek Dixit46, Emma Donoghue22, Jens Dreier47, Guy-Loup Dulière48, Ari Ercole46, Patrick
Esser41, Erzsébet Ezer49, Martin Fabricius50, Valery L. Feigin51, Kelly Foks52, Shirin Frisvold53,
Alex Furmanov54, Pablo Gagliardo55, Damien Galanaud16, Dashiell Gantner28, Guoyi Gao56,
Pradeep George57, Alexandre Ghuysen58, Lelde Giga59, Ben Glocker60, Jagoš Golubovic45,
Pedro A. Gomez 61, Johannes Gratz62, Benjamin Gravesteijn33, Francesca Grossi43,
Russell L. Gruen63, Deepak Gupta64, Juanita A. Haagsma33, Iain Haitsma65, Raimund Helbok13,
Eirik Helseth66, Lindsay Horton 67, Jilske Huijben33, Peter J. Hutchinson68, Bram Jacobs69,
Stefan Jankowski70, Mike Jarrett21, Ji-yao Jiang56, Kelly Jones51, Mladen Karan47,
Angelos G. Kolias68, Erwin Kompanje71, Daniel Kondziella50, Evgenios Koraropoulos46,
Lars-Owe Koskinen23, Noémi Kovács72, Alfonso Lagares61, Linda Lanyon57, Steven Laureys73,
Fiona Lecky74, Rolf Lefering75, Valerie Legrand76, Aurelie Lejeune77, Leon Levi78, Roger
Lightfoot79, Hester Lingsma33, Andrew I.R. Maas42, Ana M. Castaño-León61, Marc Maegele80,
Marek Majdan20, Alex Manara81, Geoffrey Manley82, Costanza Martino83, Hugues
Maréchal48, Julia Mattern84, Catherine McMahon85, Béla Melegh86, David Menon46, Tomas
Menovsky42, Davide Mulazzi27, Visakh Muraleedharan57, Lynnette Murray28, Nandesh Nair42,
Ancuta Negru87, David Nelson1, Virginia Newcombe46, Daan Nieboer33, Quentin
Noirhomme73, József Nyirádi2, Otesile Olubukola74, Matej Oresic88, Fabrizio Ortolano27,
Aarno Palotie89, 90, 91, Paul M. Parizel92, Jean-François Payen93, Natascha Perera12, Vincent
Perlbarg16, Paolo Persona94, Wilco Peul95, Anna Piippo-Karjalainen96, Matti Pirinen89, Horia
187
Ples87, Suzanne Polinder33, Inigo Pomposo29, Jussi P. Posti 97, Louis Puybasset98, Andreea
Radoi 99, Arminas Ragauskas100, Rahul Raj96, Malinka Rambadagalla101, Ruben Real38,
Jonathan Rhodes102, Sylvia Richardson103, Sophie Richter46, Samuli Ripatti89, Saulius Rocka100,
Cecilie Roe104, Olav Roise105, Jonathan Rosand106, Jeffrey V. Rosenfeld107,
Christina Rosenlund108, Guy Rosenthal54, Rolf Rossaint34, Sandra Rossi94, Daniel Rueckert60,
Martin Rusnák109, Juan Sahuquillo99, Oliver Sakowitz84, 110, Renan Sanchez-Porras110, Janos
Sandor111, Nadine Schäfer75, Silke Schmidt112, Herbert Schoechl113, Guus Schoonman114,
Rico Frederik Schou115, Elisabeth Schwendenwein6, Charlie Sewalt33, Toril Skandsen116, 117 ,
Peter Smielewski26, Abayomi Sorinola118, Emmanuel Stamatakis46, Simon Stanworth39, Ana
Stevanovic34, Robert Stevens119, William Stewart120, Ewout W. Steyerberg33, 121, Nino
Stocchetti122, Nina Sundström23, Anneliese Synnot22, 123, Riikka Takala124, Viktória Tamás118,
Tomas Tamosuitis125, Mark Steven Taylor20, Braden Te Ao51, Olli Tenovuo97, Alice Theadom51,
Matt Thomas81, Dick Tibboel126, Marjolein Timmers71, Christos Tolias127, Tony Trapani28,
Cristina Maria Tudora87, Peter Vajkoczy 128, Shirley Vallance28, Egils Valeinis59, Zoltán
Vámos49, Gregory Van der Steen42, Joukje van der Naalt69, Jeroen T.J.M. van Dijck 95,
Thomas A. van Essen95, Wim Van Hecke129, Caroline van Heugten130,
Dominique Van Praag131, Thijs Vande Vyvere129, Audrey Vanhaudenhuyse16, 73, Roel P. J. van
Wijk95, Alessia Vargiolu32, Emmanuel Vega77, Kimberley Velt33, Jan Verheyden129,
Paul M. Vespa132, Anne Vik116, 133, Rimantas Vilcinis125, Victor Volovici65, Nicole von
Steinbüchel38, Daphne Voormolen33, Petar Vulekovic45, Kevin K.W. Wang134, Eveline
Wiegers33, Guy Williams46, Lindsay Wilson67, Stefan Winzeck46, Stefan Wolf135, Zhihui
Yang134, Peter Ylén136, Alexander Younsi84, Frederik A. Zeiler46,137, Veronika Zelinkova20,
Agate Ziverte59 , Tommaso Zoerle27
188
1 Department of Physiology and Pharmacology, Section of Perioperative Medicine and Intensive Care, Karolinska Institutet, Stockholm, Sweden 2 János Szentágothai Research Centre, University of Pécs, Pécs, Hungary 3 Division of Surgery and Clinical Neuroscience, Department of Physical Medicine and
Rehabilitation, Oslo University Hospital and University of Oslo, Oslo, Norway 4 Department of Neurosurgery, University Hospital Northern Norway, Tromso, Norway 5 Department of Physical Medicine and Rehabilitation, University Hospital Northern Norway,
Tromso, Norway 6 Trauma Surgery, Medical University Vienna, Vienna, Austria 7 Department of Anesthesiology & Intensive Care, University Hospital Nancy, Nancy, France 8 Raymond Poincare hospital, Assistance Publique – Hopitaux de Paris, Paris, France 9 Department of Anesthesiology & Intensive Care, S Raffaele University Hospital, Milan, Italy 10 Department of Neurosurgery, Radboud University Medical Center, Nijmegen, The
Netherlands 11 Department of Neurosurgery, University of Szeged, Szeged, Hungary 12 International Projects Management, ARTTIC, Munchen, Germany 13 Department of Neurology, Neurological Intensive Care Unit, Medical University of
Innsbruck, Innsbruck, Austria 14 Department of Neurosurgery & Anesthesia & intensive care medicine, Karolinska
University Hospital, Stockholm, Sweden 15 NIHR Surgical Reconstruction and Microbiology Research Centre, Birmingham, UK 16 Anesthesie-Réanimation, Assistance Publique – Hopitaux de Paris, Paris, France 17 Department of Anesthesia & ICU, AOU Città della Salute e della Scienza di Torino -
Orthopedic and Trauma Center, Torino, Italy 18 Department of Neurology, Odense University Hospital, Odense, Denmark 19 BehaviourWorks Australia, Monash Sustainability Institute, Monash University, Victoria,
Australia 20 Department of Public Health, Faculty of Health Sciences and Social Work, Trnava
University, Trnava, Slovakia 21 Quesgen Systems Inc., Burlingame, California, USA 22 Australian & New Zealand Intensive Care Research Centre, Department of Epidemiology
and Preventive Medicine, School of Public Health and Preventive Medicine, Monash University, Melbourne, Australia
23 Department of Clinical Neuroscience, Neurosurgery, Umeå University, Umeå, Sweden 24 Department of Neurosurgery, Medical School, University of Pécs, Hungary and
Neurotrauma Research Group, János Szentágothai Research Centre, University of Pécs, Hungary
25 Department of Medical Psychology, Universitätsklinikum Hamburg-Eppendorf, Hamburg, Germany
26 Brain Physics Lab, Division of Neurosurgery, Dept of Clinical Neurosciences, University of Cambridge, Addenbrooke’s Hospital, Cambridge, UK
27 Neuro ICU, Fondazione IRCCS Cà Granda Ospedale Maggiore Policlinico, Milan, Italy 28 ANZIC Research Centre, Monash University, Department of Epidemiology and Preventive
Medicine, Melbourne, Victoria, Australia 29 Department of Neurosurgery, Hospital of Cruces, Bilbao, Spain 30 NeuroIntensive Care, Niguarda Hospital, Milan, Italy 31 School of Medicine and Surgery, Università Milano Bicocca, Milano, Italy
189
32 NeuroIntensive Care, ASST di Monza, Monza, Italy 33 Department of Public Health, Erasmus Medical Center-University Medical Center,
Rotterdam, The Netherlands 34 Department of Anaesthesiology, University Hospital of Aachen, Aachen, Germany 35 Department of Anesthesia & Neurointensive Care, Cambridge University Hospital NHS Foundation Trust, Cambridge, UK 36 School of Public Health & PM, Monash University and The Alfred Hospital, Melbourne,
Victoria, Australia 37 Radiology/MRI department, MRC Cognition and Brain Sciences Unit, Cambridge, UK 38 Institute of Medical Psychology and Medical Sociology, Universitätsmedizin Göttingen,
Göttingen, Germany 39 Oxford University Hospitals NHS Trust, Oxford, UK 40 Intensive Care Unit, CHU Poitiers, Potiers, France 41 Movement Science Group, Faculty of Health and Life Sciences, Oxford Brookes University,
Oxford, UK 42 Department of Neurosurgery, Antwerp University Hospital and University of Antwerp,
Edegem, Belgium 43 Department of Anesthesia & Intensive Care, Maggiore Della Carità Hospital, Novara, Italy 44 Department of Neurosurgery, University Hospitals Leuven, Leuven, Belgium 45 Department of Neurosurgery, Clinical centre of Vojvodina, Faculty of Medicine, University
of Novi Sad, Novi Sad, Serbia 46 Division of Anaesthesia, University of Cambridge, Addenbrooke’s Hospital, Cambridge, UK 47 Center for Stroke Research Berlin, Charité – Universitätsmedizin Berlin, corporate
member of Freie Universität Berlin, Humboldt-Universität zu Berlin, and Berlin Institute of Health, Berlin, Germany
48 Intensive Care Unit, CHR Citadelle, Liège, Belgium 49 Department of Anaesthesiology and Intensive Therapy, University of Pécs, Pécs, Hungary 50 Departments of Neurology, Clinical Neurophysiology and Neuroanesthesiology, Region
Hovedstaden Rigshospitalet, Copenhagen, Denmark 51 National Institute for Stroke and Applied Neurosciences, Faculty of Health and
Environmental Studies, Auckland University of Technology, Auckland, New Zealand 52 Department of Neurology, Erasmus MC, Rotterdam, the Netherlands 53 Department of Anesthesiology and Intensive care, University Hospital Northern Norway,
Tromso, Norway 54 Department of Neurosurgery, Hadassah-hebrew University Medical center, Jerusalem,
Israel 55 Fundación Instituto Valenciano de Neurorrehabilitación (FIVAN), Valencia, Spain 56 Department of Neurosurgery, Shanghai Renji hospital, Shanghai Jiaotong
University/school of medicine, Shanghai, China 57 Karolinska Institutet, INCF International Neuroinformatics Coordinating Facility,
Stockholm, Sweden 58 Emergency Department, CHU, Liège, Belgium 59 Neurosurgery clinic, Pauls Stradins Clinical University Hospital, Riga, Latvia 60 Department of Computing, Imperial College London, London, UK 61 Department of Neurosurgery, Hospital Universitario 12 de Octubre, Madrid, Spain 62 Department of Anesthesia, Critical Care and Pain Medicine, Medical University of Vienna,
Austria
190
63 College of Health and Medicine, Australian National University, Canberra, Australia 64 Department of Neurosurgery, Neurosciences Centre & JPN Apex trauma centre, All India
Institute of Medical Sciences, New Delhi-110029, India 65 Department of Neurosurgery, Erasmus MC, Rotterdam, the Netherlands 66 Department of Neurosurgery, Oslo University Hospital, Oslo, Norway 67 Division of Psychology, University of Stirling, Stirling, UK 68 Division of Neurosurgery, Department of Clinical Neurosciences, Addenbrooke’s Hospital & University of Cambridge, Cambridge, UK 69 Department of Neurology, University of Groningen, University Medical Center Groningen,
Groningen, Netherlands 70 Neurointensive Care , Sheffield Teaching Hospitals NHS Foundation Trust, Sheffield, UK 71 Department of Intensive Care and Department of Ethics and Philosophy of Medicine,
Erasmus Medical Center, Rotterdam, The Netherlands 72 Hungarian Brain Research Program - Grant No. KTIA_13_NAP-A-II/8, University of Pécs,
Pécs, Hungary 73 Cyclotron Research Center , University of Liège, Liège, Belgium 74 Emergency Medicine Research in Sheffield, Health Services Research Section, School of
Health and Related Research (ScHARR), University of Sheffield, Sheffield, UK 75 Institute of Research in Operative Medicine (IFOM), Witten/Herdecke University, Cologne,
Germany 76 VP Global Project Management CNS, ICON, Paris, France 77 Department of Anesthesiology-Intensive Care, Lille University Hospital, Lille, France 78 Department of Neurosurgery, Rambam Medical Center, Haifa, Israel 79 Department of Anesthesiology & Intensive Care, University Hospitals Southhampton NHS
Trust, Southhampton, UK 80 Cologne-Merheim Medical Center (CMMC), Department of Traumatology, Orthopedic
Surgery and Sportmedicine, Witten/Herdecke University, Cologne, Germany 81 Intensive Care Unit, Southmead Hospital, Bristol, Bristol, UK 82 Department of Neurological Surgery, University of California, San Francisco, California,
USA 83 Department of Anesthesia & Intensive Care,M. Bufalini Hospital, Cesena, Italy 84 Department of Neurosurgery, University Hospital Heidelberg, Heidelberg, Germany 85 Department of Neurosurgery, The Walton centre NHS Foundation Trust, Liverpool, UK 86 Department of Medical Genetics, University of Pécs, Pécs, Hungary 87 Department of Neurosurgery, Emergency County Hospital Timisoara , Timisoara, Romania 88 School of Medical Sciences, Örebro University, Örebro, Sweden 89 Institute for Molecular Medicine Finland, University of Helsinki, Helsinki, Finland 90 Analytic and Translational Genetics Unit, Department of Medicine; Psychiatric &
Neurodevelopmental Genetics Unit, Department of Psychiatry; Department of Neurology, Massachusetts General Hospital, Boston, MA, USA
91 Program in Medical and Population Genetics; The Stanley Center for Psychiatric Research, The Broad Institute of MIT and Harvard, Cambridge, MA, USA
92 Department of Radiology, Antwerp University Hospital and University of Antwerp, Edegem, Belgium
93 Department of Anesthesiology & Intensive Care, University Hospital of Grenoble, Grenoble, France
191
94 Department of Anesthesia & Intensive Care, Azienda Ospedaliera Università di Padova, Padova, Italy
95 Dept. of Neurosurgery, Leiden University Medical Center, Leiden, The Netherlands and Dept. of Neurosurgery, Medical Center Haaglanden, The Hague, The Netherlands
96 Department of Neurosurgery, Helsinki University Central Hospital 97 Division of Clinical Neurosciences, Department of Neurosurgery and Turku Brain Injury
Centre, Turku University Hospital and University of Turku, Turku, Finland 98 Department of Anesthesiology and Critical Care, Pitié -Salpêtrière Teaching Hospital,
Assistance Publique, Hôpitaux de Paris and University Pierre et Marie Curie, Paris, France 99 Neurotraumatology and Neurosurgery Research Unit (UNINN), Vall d'Hebron Research
Institute, Barcelona, Spain 100 Department of Neurosurgery, Kaunas University of technology and Vilnius University,
Vilnius, Lithuania 101 Department of Neurosurgery, Rezekne Hospital, Latvia 102 Department of Anaesthesia, Critical Care & Pain Medicine NHS Lothian & University of
Edinburg, Edinburgh, UK 103 Director, MRC Biostatistics Unit, Cambridge Institute of Public Health, Cambridge, UK 104 Department of Physical Medicine and Rehabilitation, Oslo University Hospital/University
of Oslo, Oslo, Norway 105 Division of Surgery and Clinical Neuroscience, Oslo University Hospital, Oslo, Norway 106 Broad Institute, Cambridge MA Harvard Medical School, Boston MA, Massachusetts
General Hospital, Boston MA, USA 107 National Trauma Research Institute, The Alfred Hospital, Monash University, Melbourne,
Victoria, Australia 108 Department of Neurosurgery, Odense University Hospital, Odense, Denmark 109 International Neurotrauma Research Organisation, Vienna, Austria 110 Klinik für Neurochirurgie, Klinikum Ludwigsburg, Ludwigsburg, Germany 111 Division of Biostatistics and Epidemiology, Department of Preventive Medicine,
University of Debrecen, Debrecen, Hungary 112 Department Health and Prevention, University Greifswald, Greifswald, Germany 113 Department of Anaesthesiology and Intensive Care, AUVA Trauma Hospital, Salzburg,
Austria 114 Department of Neurology, Elisabeth-TweeSteden Ziekenhuis, Tilburg, the Netherlands 115 Department of Neuroanesthesia and Neurointensive Care, Odense University Hospital,
Odense, Denmark 116 Department of Neuromedicine and Movement Science, Norwegian University of Science
and Technology, NTNU, Trondheim, Norway 117 Department of Physical Medicine and Rehabilitation, St.Olavs Hospital, Trondheim
University Hospital, Trondheim, Norway 118 Department of Neurosurgery, University of Pécs, Pécs, Hungary 119 Division of Neuroscience Critical Care, John Hopkins University School of Medicine,
Baltimore, USA 120 Department of Neuropathology, Queen Elizabeth University Hospital and University of
Glasgow, Glasgow, UK 121 Dept. of Department of Biomedical Data Sciences, Leiden University Medical Center,
Leiden, The Netherlands
192
122 Department of Pathophysiology and Transplantation, Milan University, and Neuroscience ICU, Fondazione IRCCS Cà Granda Ospedale Maggiore Policlinico, Milano, Italy
123 Cochrane Consumers and Communication Review Group, Centre for Health Communication and Participation, School of Psychology and Public Health, La Trobe University, Melbourne, Australia
124 Perioperative Services, Intensive Care Medicine and Pain Management, Turku University Hospital and University of Turku, Turku, Finland
125 Department of Neurosurgery, Kaunas University of Health Sciences, Kaunas, Lithuania 126 Intensive Care and Department of Pediatric Surgery, Erasmus Medical Center, Sophia
Children’s Hospital, Rotterdam, The Netherlands 127 Department of Neurosurgery, Kings college London, London, UK 128 Neurologie, Neurochirurgie und Psychiatrie, Charité – Universitätsmedizin Berlin, Berlin,
Germany 129 icoMetrix NV, Leuven, Belgium 130 Movement Science Group, Faculty of Health and Life Sciences, Oxford Brookes University,
Oxford, UK 131 Psychology Department, Antwerp University Hospital, Edegem, Belgium 132 Director of Neurocritical Care, University of California, Los Angeles, USA 133 Department of Neurosurgery, St.Olavs Hospital, Trondheim University Hospital,
Trondheim, Norway 134 Department of Emergency Medicine, University of Florida, Gainesville, Florida, USA 135 Department of Neurosurgery, Charité – Universitätsmedizin Berlin, corporate member of Freie Universität Berlin, Humboldt-Universität zu Berlin, and Berlin Institute of Health, Berlin, Germany 136 VTT Technical Research Centre, Tampere, Finland 137 Section of Neurosurgery, Department of Surgery, Rady Faculty of Health Sciences,
University of Manitoba, Winnipeg, MB, Canada
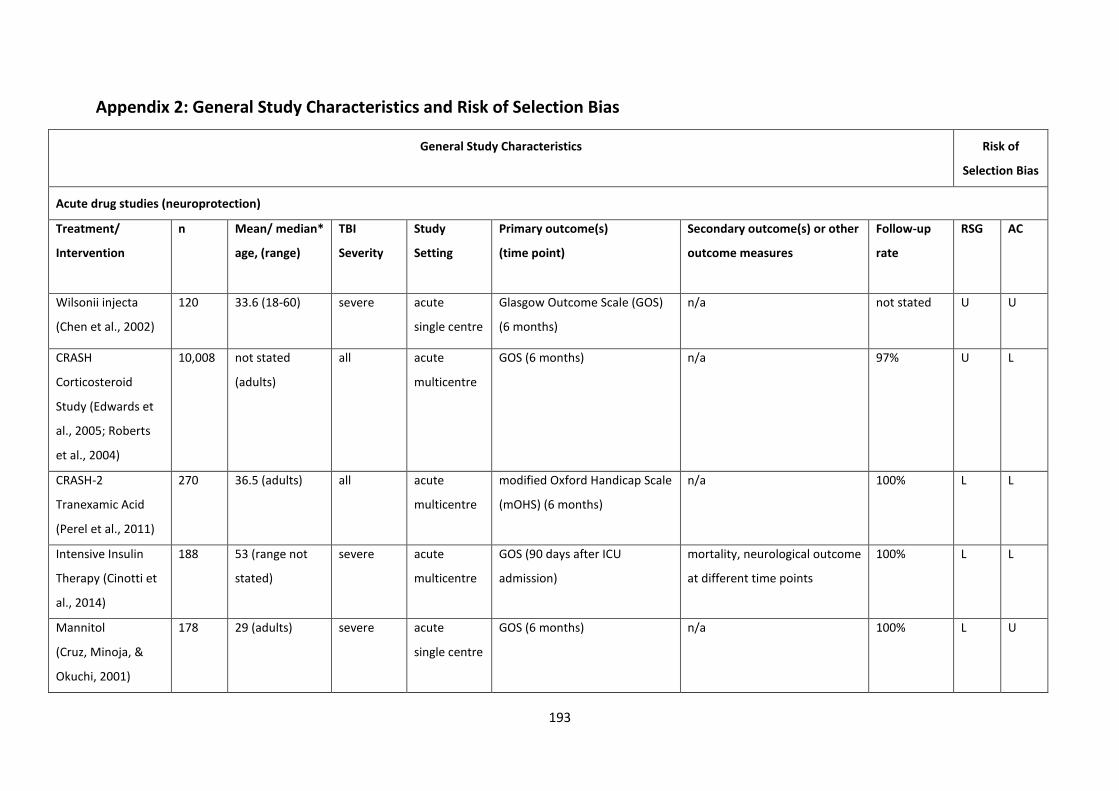
193
Appendix 2: General Study Characteristics and Risk of Selection Bias
General Study Characteristics Risk of
Selection Bias
Acute drug studies (neuroprotection)
Treatment/
Intervention
n Mean/ median*
age, (range)
TBI
Severity
Study
Setting
Primary outcome(s)
(time point)
Secondary outcome(s) or other
outcome measures
Follow-up
rate
RSG AC
Wilsonii injecta
(Chen et al., 2002)
120 33.6 (18-60) severe acute
single centre
Glasgow Outcome Scale (GOS)
(6 months)
n/a not stated U U
CRASH
Corticosteroid
Study (Edwards et
al., 2005; Roberts
et al., 2004)
10,008 not stated
(adults)
all acute
multicentre
GOS (6 months) n/a 97% U L
CRASH-2
Tranexamic Acid
(Perel et al., 2011)
270 36.5 (adults) all acute
multicentre
modified Oxford Handicap Scale
(mOHS) (6 months)
n/a 100% L L
Intensive Insulin
Therapy (Cinotti et
al., 2014)
188 53 (range not
stated)
severe acute
multicentre
GOS (90 days after ICU
admission)
mortality, neurological outcome
at different time points
100% L L
Mannitol
(Cruz, Minoja, &
Okuchi, 2001)
178 29 (adults) severe acute
single centre
GOS (6 months) n/a 100% L U
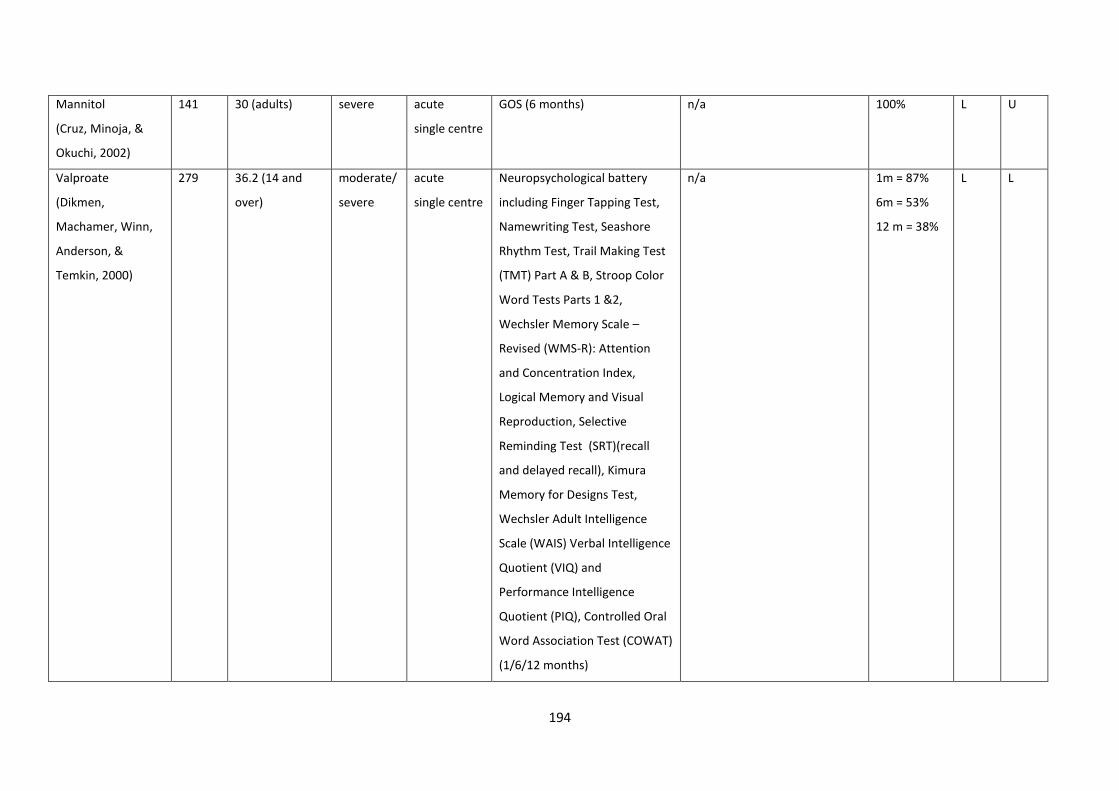
194
Mannitol
(Cruz, Minoja, &
Okuchi, 2002)
141 30 (adults) severe acute
single centre
GOS (6 months) n/a 100% L U
Valproate
(Dikmen,
Machamer, Winn,
Anderson, &
Temkin, 2000)
279 36.2 (14 and
over)
moderate/
severe
acute
single centre
Neuropsychological battery
including Finger Tapping Test,
Namewriting Test, Seashore
Rhythm Test, Trail Making Test
(TMT) Part A & B, Stroop Color
Word Tests Parts 1 &2,
Wechsler Memory Scale –
Revised (WMS-R): Attention
and Concentration Index,
Logical Memory and Visual
Reproduction, Selective
Reminding Test (SRT)(recall
and delayed recall), Kimura
Memory for Designs Test,
Wechsler Adult Intelligence
Scale (WAIS) Verbal Intelligence
Quotient (VIQ) and
Performance Intelligence
Quotient (PIQ), Controlled Oral
Word Association Test (COWAT)
(1/6/12 months)
n/a 1m = 87%
6m = 53%
12 m = 38%
L L
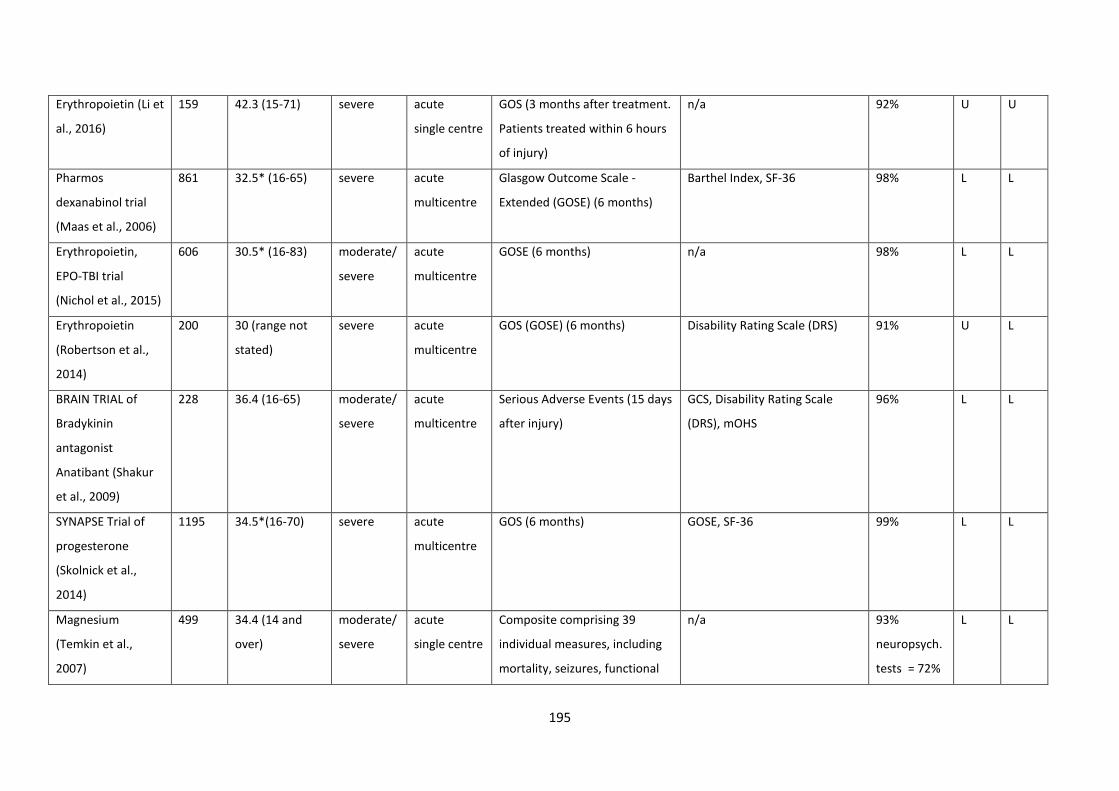
195
Erythropoietin (Li et
al., 2016)
159 42.3 (15-71) severe acute
single centre
GOS (3 months after treatment.
Patients treated within 6 hours
of injury)
n/a 92% U U
Pharmos
dexanabinol trial
(Maas et al., 2006)
861 32.5* (16-65) severe acute
multicentre
Glasgow Outcome Scale -
Extended (GOSE) (6 months)
Barthel Index, SF-36 98% L L
Erythropoietin,
EPO-TBI trial
(Nichol et al., 2015)
606 30.5* (16-83) moderate/
severe
acute
multicentre
GOSE (6 months) n/a 98% L L
Erythropoietin
(Robertson et al.,
2014)
200 30 (range not
stated)
severe acute
multicentre
GOS (GOSE) (6 months) Disability Rating Scale (DRS) 91% U L
BRAIN TRIAL of
Bradykinin
antagonist
Anatibant (Shakur
et al., 2009)
228 36.4 (16-65) moderate/
severe
acute
multicentre
Serious Adverse Events (15 days
after injury)
GCS, Disability Rating Scale
(DRS), mOHS
96% L L
SYNAPSE Trial of
progesterone
(Skolnick et al.,
2014)
1195 34.5*(16-70) severe acute
multicentre
GOS (6 months) GOSE, SF-36 99% L L
Magnesium
(Temkin et al.,
2007)
499 34.4 (14 and
over)
moderate/
severe
acute
single centre
Composite comprising 39
individual measures, including
mortality, seizures, functional
n/a 93%
neuropsych.
tests = 72%
L L
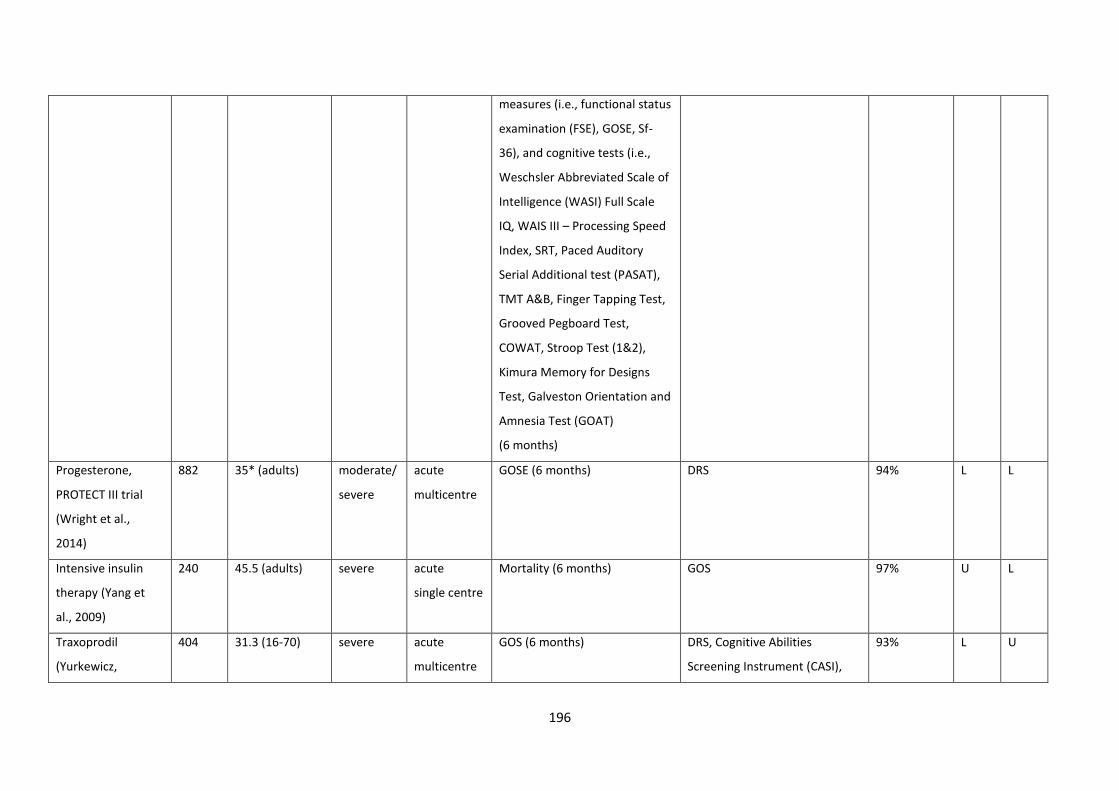
196
measures (i.e., functional status
examination (FSE), GOSE, Sf-
36), and cognitive tests (i.e.,
Weschsler Abbreviated Scale of
Intelligence (WASI) Full Scale
IQ, WAIS III – Processing Speed
Index, SRT, Paced Auditory
Serial Additional test (PASAT),
TMT A&B, Finger Tapping Test,
Grooved Pegboard Test,
COWAT, Stroop Test (1&2),
Kimura Memory for Designs
Test, Galveston Orientation and
Amnesia Test (GOAT)
(6 months)
Progesterone,
PROTECT III trial
(Wright et al.,
2014)
882 35* (adults) moderate/
severe
acute
multicentre
GOSE (6 months) DRS 94% L L
Intensive insulin
therapy (Yang et
al., 2009)
240 45.5 (adults) severe acute
single centre
Mortality (6 months) GOS 97% U L
Traxoprodil
(Yurkewicz,
404 31.3 (16-70) severe acute
multicentre
GOS (6 months) DRS, Cognitive Abilities
Screening Instrument (CASI),
93% L U
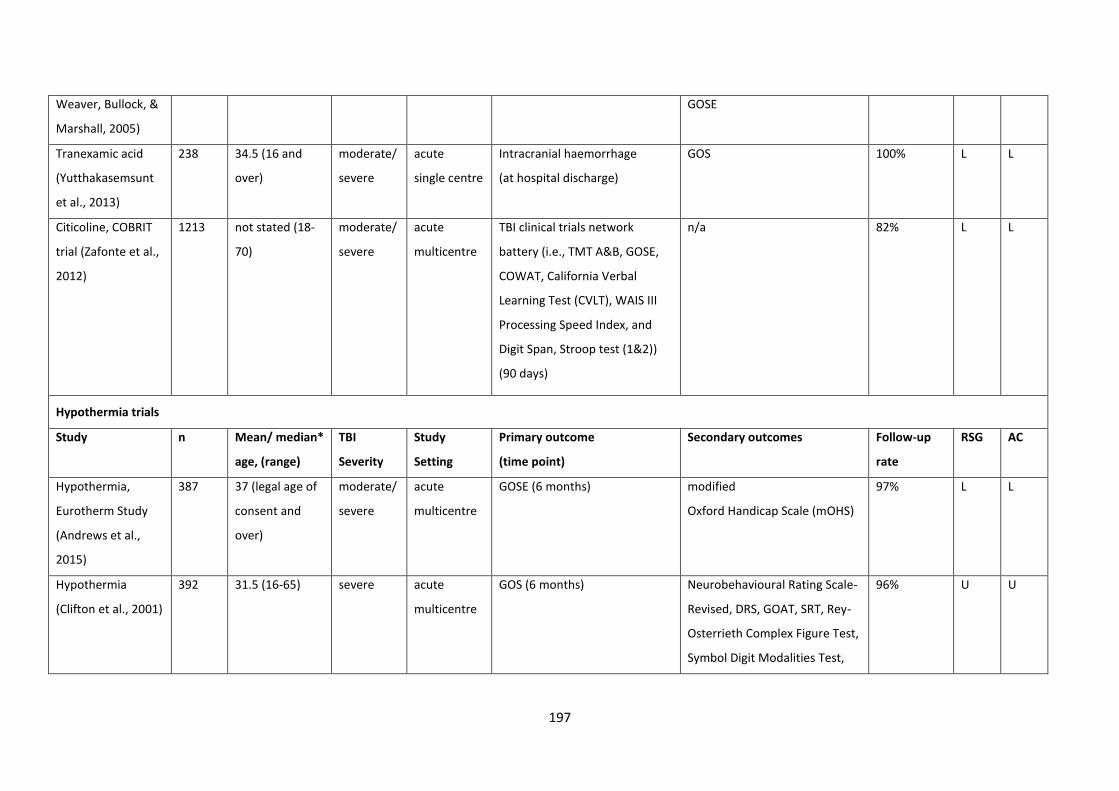
197
Weaver, Bullock, &
Marshall, 2005)
GOSE
Tranexamic acid
(Yutthakasemsunt
et al., 2013)
238 34.5 (16 and
over)
moderate/
severe
acute
single centre
Intracranial haemorrhage
(at hospital discharge)
GOS 100% L L
Citicoline, COBRIT
trial (Zafonte et al.,
2012)
1213 not stated (18-
70)
moderate/
severe
acute
multicentre
TBI clinical trials network
battery (i.e., TMT A&B, GOSE,
COWAT, California Verbal
Learning Test (CVLT), WAIS III
Processing Speed Index, and
Digit Span, Stroop test (1&2))
(90 days)
n/a 82% L L
Hypothermia trials
Study n Mean/ median*
age, (range)
TBI
Severity
Study
Setting
Primary outcome
(time point)
Secondary outcomes
Follow-up
rate
RSG AC
Hypothermia,
Eurotherm Study
(Andrews et al.,
2015)
387 37 (legal age of
consent and
over)
moderate/
severe
acute
multicentre
GOSE (6 months) modified
Oxford Handicap Scale (mOHS)
97% L L
Hypothermia
(Clifton et al., 2001)
392 31.5 (16-65) severe acute
multicentre
GOS (6 months) Neurobehavioural Rating Scale-
Revised, DRS, GOAT, SRT, Rey-
Osterrieth Complex Figure Test,
Symbol Digit Modalities Test,
96% U U
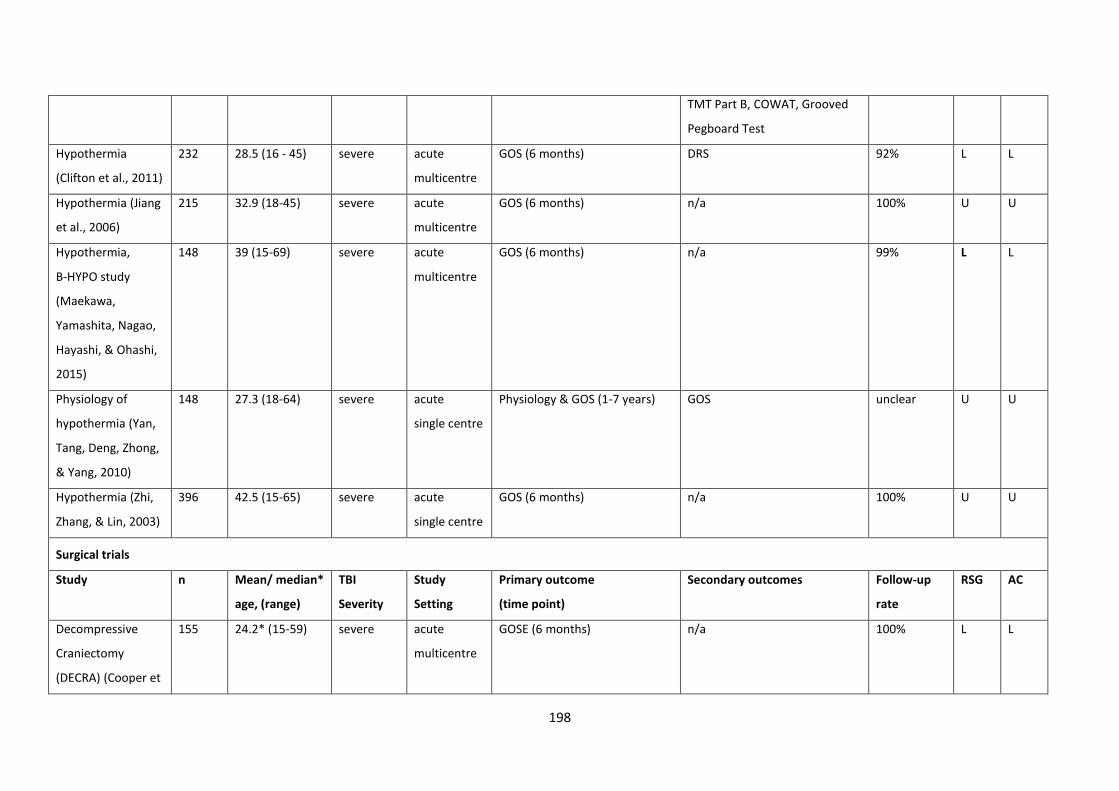
198
TMT Part B, COWAT, Grooved
Pegboard Test
Hypothermia
(Clifton et al., 2011)
232 28.5 (16 - 45) severe acute
multicentre
GOS (6 months) DRS 92% L L
Hypothermia (Jiang
et al., 2006)
215 32.9 (18-45) severe acute
multicentre
GOS (6 months) n/a 100% U U
Hypothermia,
B-HYPO study
(Maekawa,
Yamashita, Nagao,
Hayashi, & Ohashi,
2015)
148 39 (15-69) severe acute
multicentre
GOS (6 months) n/a 99% L L
Physiology of
hypothermia (Yan,
Tang, Deng, Zhong,
& Yang, 2010)
148 27.3 (18-64) severe acute
single centre
Physiology & GOS (1-7 years) GOS unclear U U
Hypothermia (Zhi,
Zhang, & Lin, 2003)
396 42.5 (15-65) severe acute
single centre
GOS (6 months) n/a
100% U U
Surgical trials
Study n Mean/ median*
age, (range)
TBI
Severity
Study
Setting
Primary outcome
(time point)
Secondary outcomes
Follow-up
rate
RSG AC
Decompressive
Craniectomy
(DECRA) (Cooper et
155 24.2* (15-59) severe acute
multicentre
GOSE (6 months) n/a 100% L L
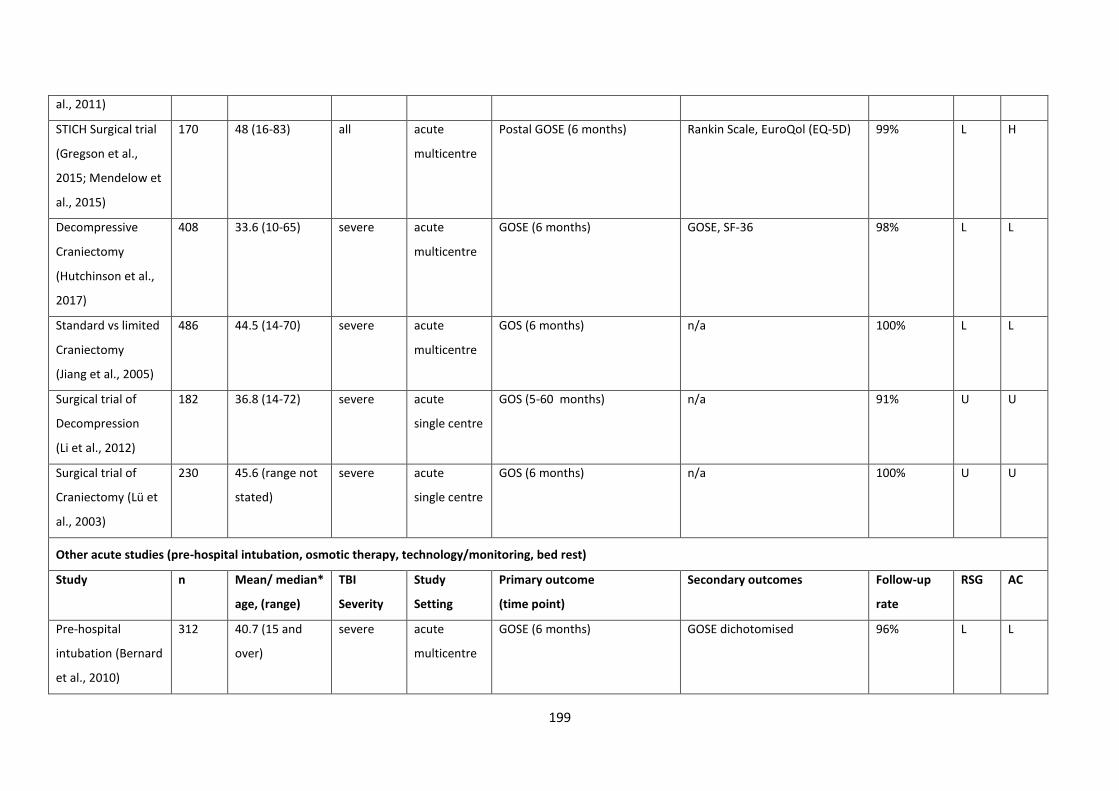
199
al., 2011)
STICH Surgical trial
(Gregson et al.,
2015; Mendelow et
al., 2015)
170 48 (16-83) all acute
multicentre
Postal GOSE (6 months) Rankin Scale, EuroQol (EQ-5D) 99% L H
Decompressive
Craniectomy
(Hutchinson et al.,
2017)
408 33.6 (10-65) severe acute
multicentre
GOSE (6 months) GOSE, SF-36 98% L L
Standard vs limited
Craniectomy
(Jiang et al., 2005)
486 44.5 (14-70) severe acute
multicentre
GOS (6 months) n/a 100% L L
Surgical trial of
Decompression
(Li et al., 2012)
182 36.8 (14-72) severe acute
single centre
GOS (5-60 months) n/a 91% U U
Surgical trial of
Craniectomy (Lü et
al., 2003)
230 45.6 (range not
stated)
severe acute
single centre
GOS (6 months) n/a 100% U U
Other acute studies (pre-hospital intubation, osmotic therapy, technology/monitoring, bed rest)
Study n Mean/ median*
age, (range)
TBI
Severity
Study
Setting
Primary outcome
(time point)
Secondary outcomes
Follow-up
rate
RSG AC
Pre-hospital
intubation (Bernard
et al., 2010)
312 40.7 (15 and
over)
severe acute
multicentre
GOSE (6 months) GOSE dichotomised 96% L L
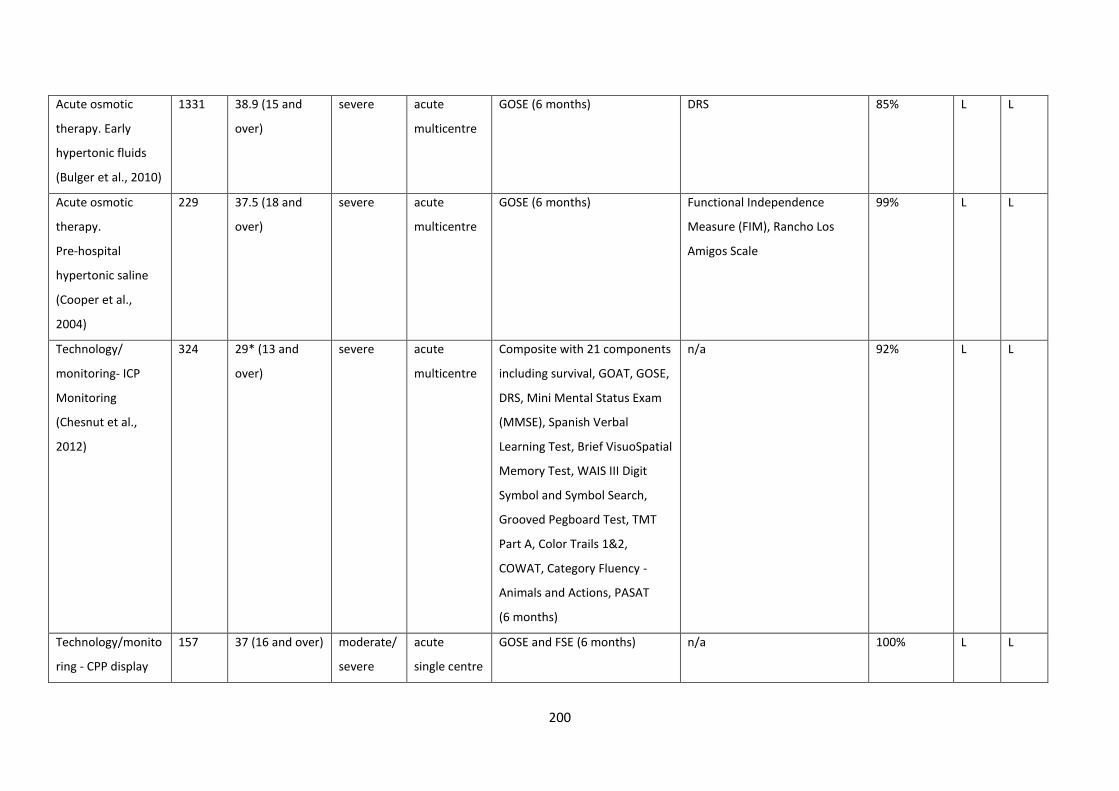
200
Acute osmotic
therapy. Early
hypertonic fluids
(Bulger et al., 2010)
1331 38.9 (15 and
over)
severe acute
multicentre
GOSE (6 months) DRS 85% L L
Acute osmotic
therapy.
Pre-hospital
hypertonic saline
(Cooper et al.,
2004)
229 37.5 (18 and
over)
severe acute
multicentre
GOSE (6 months) Functional Independence
Measure (FIM), Rancho Los
Amigos Scale
99% L L
Technology/
monitoring- ICP
Monitoring
(Chesnut et al.,
2012)
324 29* (13 and
over)
severe acute
multicentre
Composite with 21 components
including survival, GOAT, GOSE,
DRS, Mini Mental Status Exam
(MMSE), Spanish Verbal
Learning Test, Brief VisuoSpatial
Memory Test, WAIS III Digit
Symbol and Symbol Search,
Grooved Pegboard Test, TMT
Part A, Color Trails 1&2,
COWAT, Category Fluency -
Animals and Actions, PASAT
(6 months)
n/a 92% L L
Technology/monito
ring - CPP display
157 37 (16 and over) moderate/
severe
acute
single centre
GOSE and FSE (6 months) n/a 100% L L
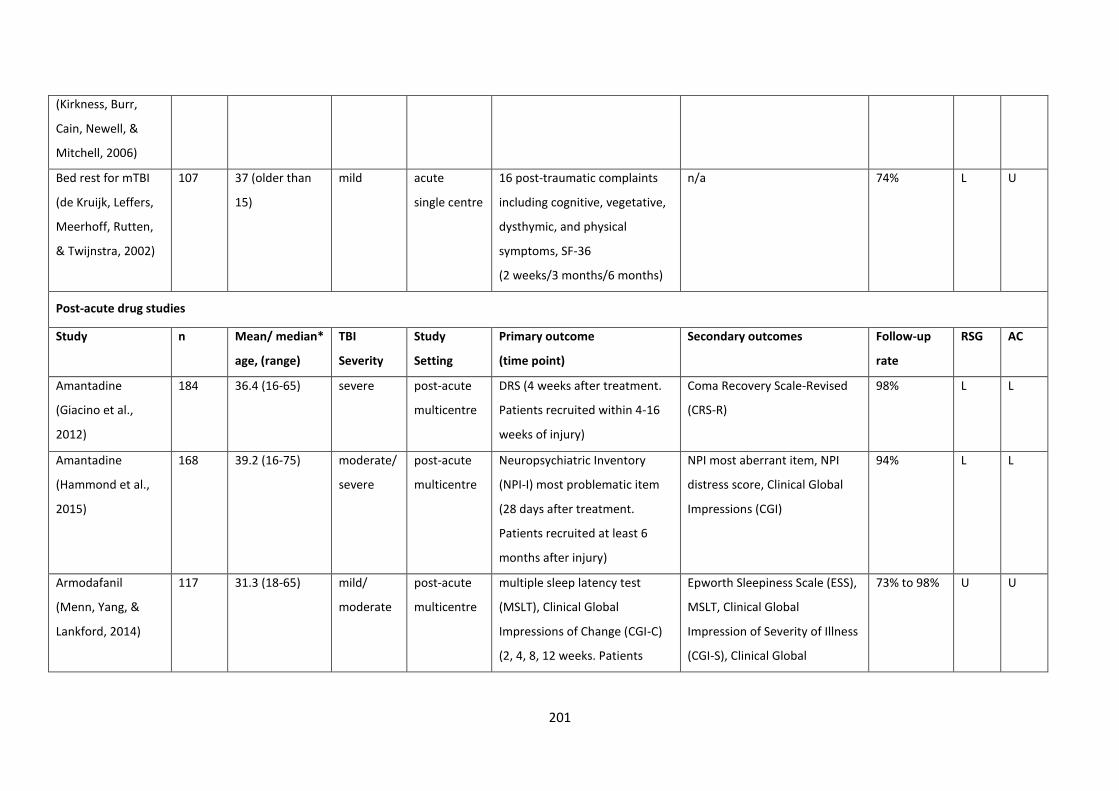
201
(Kirkness, Burr,
Cain, Newell, &
Mitchell, 2006)
Bed rest for mTBI
(de Kruijk, Leffers,
Meerhoff, Rutten,
& Twijnstra, 2002)
107 37 (older than
15)
mild acute
single centre
16 post-traumatic complaints
including cognitive, vegetative,
dysthymic, and physical
symptoms, SF-36
(2 weeks/3 months/6 months)
n/a 74% L U
Post-acute drug studies
Study n Mean/ median*
age, (range)
TBI
Severity
Study
Setting
Primary outcome
(time point)
Secondary outcomes
Follow-up
rate
RSG AC
Amantadine
(Giacino et al.,
2012)
184 36.4 (16-65) severe post-acute
multicentre
DRS (4 weeks after treatment.
Patients recruited within 4-16
weeks of injury)
Coma Recovery Scale-Revised
(CRS-R)
98% L L
Amantadine
(Hammond et al.,
2015)
168 39.2 (16-75) moderate/
severe
post-acute
multicentre
Neuropsychiatric Inventory
(NPI-I) most problematic item
(28 days after treatment.
Patients recruited at least 6
months after injury)
NPI most aberrant item, NPI
distress score, Clinical Global
Impressions (CGI)
94% L L
Armodafanil
(Menn, Yang, &
Lankford, 2014)
117 31.3 (18-65) mild/
moderate
post-acute
multicentre
multiple sleep latency test
(MSLT), Clinical Global
Impressions of Change (CGI-C)
(2, 4, 8, 12 weeks. Patients
Epworth Sleepiness Scale (ESS),
MSLT, Clinical Global
Impression of Severity of Illness
(CGI-S), Clinical Global
73% to 98% U U
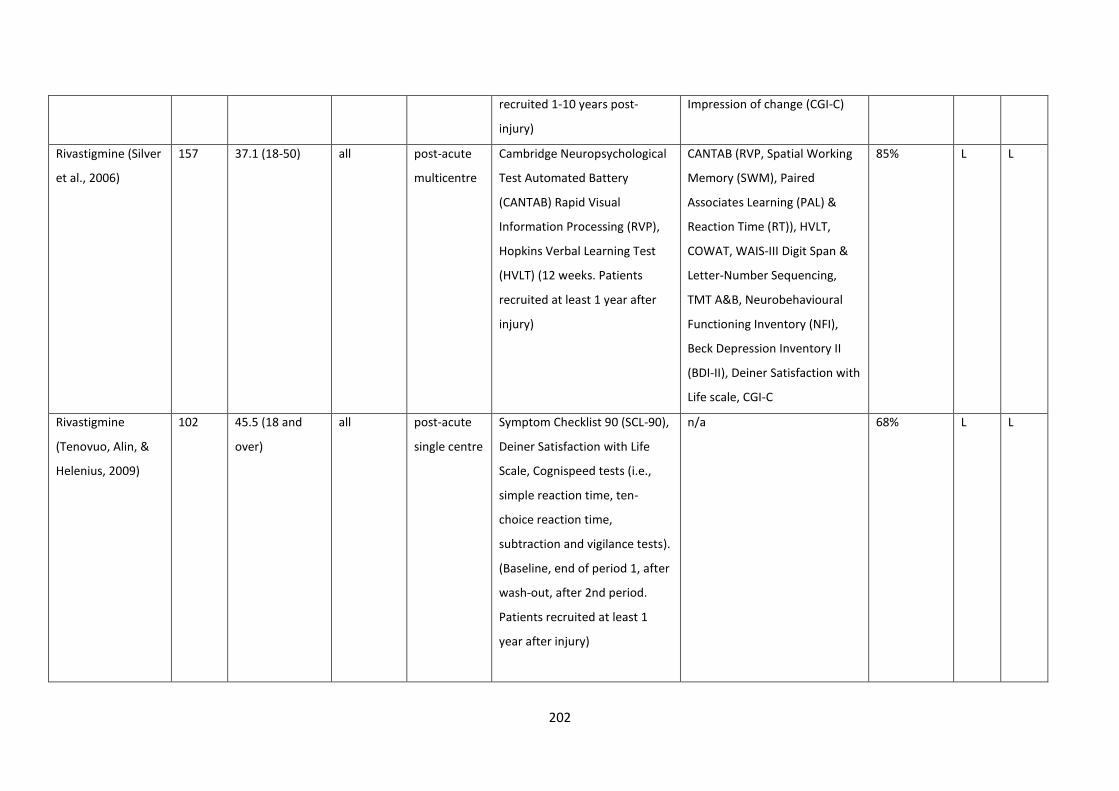
202
recruited 1-10 years post-
injury)
Impression of change (CGI-C)
Rivastigmine (Silver
et al., 2006)
157 37.1 (18-50) all post-acute
multicentre
Cambridge Neuropsychological
Test Automated Battery
(CANTAB) Rapid Visual
Information Processing (RVP),
Hopkins Verbal Learning Test
(HVLT) (12 weeks. Patients
recruited at least 1 year after
injury)
CANTAB (RVP, Spatial Working
Memory (SWM), Paired
Associates Learning (PAL) &
Reaction Time (RT)), HVLT,
COWAT, WAIS-III Digit Span &
Letter-Number Sequencing,
TMT A&B, Neurobehavioural
Functioning Inventory (NFI),
Beck Depression Inventory II
(BDI-II), Deiner Satisfaction with
Life scale, CGI-C
85% L L
Rivastigmine
(Tenovuo, Alin, &
Helenius, 2009)
102 45.5 (18 and
over)
all post-acute
single centre
Symptom Checklist 90 (SCL-90),
Deiner Satisfaction with Life
Scale, Cognispeed tests (i.e.,
simple reaction time, ten-
choice reaction time,
subtraction and vigilance tests).
(Baseline, end of period 1, after
wash-out, after 2nd period.
Patients recruited at least 1
year after injury)
n/a 68% L L
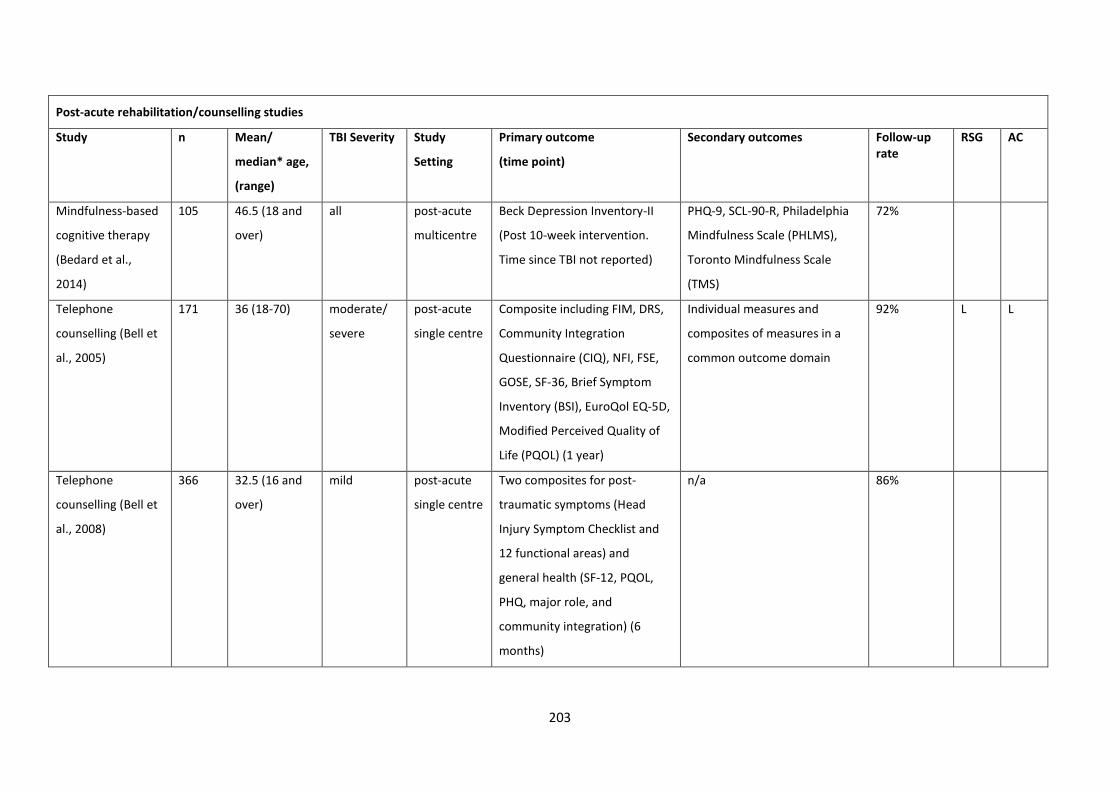
203
Post-acute rehabilitation/counselling studies
Study n Mean/
median* age,
(range)
TBI Severity Study
Setting
Primary outcome
(time point)
Secondary outcomes
Follow-up rate
RSG AC
Mindfulness-based
cognitive therapy
(Bedard et al.,
2014)
105 46.5 (18 and
over)
all post-acute
multicentre
Beck Depression Inventory-II
(Post 10-week intervention.
Time since TBI not reported)
PHQ-9, SCL-90-R, Philadelphia
Mindfulness Scale (PHLMS),
Toronto Mindfulness Scale
(TMS)
72%
Telephone
counselling (Bell et
al., 2005)
171 36 (18-70) moderate/
severe
post-acute
single centre
Composite including FIM, DRS,
Community Integration
Questionnaire (CIQ), NFI, FSE,
GOSE, SF-36, Brief Symptom
Inventory (BSI), EuroQol EQ-5D,
Modified Perceived Quality of
Life (PQOL) (1 year)
Individual measures and
composites of measures in a
common outcome domain
92% L L
Telephone
counselling (Bell et
al., 2008)
366 32.5 (16 and
over)
mild post-acute
single centre
Two composites for post-
traumatic symptoms (Head
Injury Symptom Checklist and
12 functional areas) and
general health (SF-12, PQOL,
PHQ, major role, and
community integration) (6
months)
n/a 86%

204
Telephone
counselling (Bell et
al., 2011)
433 39 (16 and
over)
moderate/
severe
post-acute
multicentre
Composite including FIM, DRS,
Participation with Recombined
Tools - Objective (PART-O),
GOSE, EuroQol EQ-5D, PQOL,
Sf-12, BSI-18 (1 year)
functional composite (FIM, DRS,
GOSE, PART-O, EuroQol EQ-5D),
community participation,
wellbeing, and vocational
measures
1 year: 82% 2 year: 81%
L L
Self-advocacy
intervention
(Brown et al., 2015)
257 47.9 (18 and
over)
moderate/
severe
post-acute
multicentre
Advocacy Behaviour Rating
Scale (ABRS) (at least 1 year
since injury)
n/a 84% U U
Early intervention
for mTBI
(Elgmark
Andersson,
Emanuelson,
Bjorklund, &
Stalhammar, 2007)
395 33 (16-60) mild post-acute
single centre
Post-Concussion Symptoms
Questionnaire (PCSQ), Life
Satisfaction Questionnaire
(LiSat-11), CIQ, SF-36 (1 year)
Interest Checklist, Role
Checklist, Job Satisfaction
Checklist
90% L L
CBT for depression
(Fann et al., 2015)
100 45.8 (18 and
over)
Complicated
mild to
severe
post-acute
multicentre
Hamilton Depression Rating
Scale (HAMD-17) & patient-
reported Symptom Checklist-20
(SCL-20) (16 weeks after
recruitment to study. Patients
recruited within 10 years of
injury)
PHQ-9, MINI International
Neuropsychiatric Interview,
Environmental Reward
Observation Scale (EROS),
Automatic Thoughts
Questionnaire (ATQ),
Dysfunctional Attitudes Scale
(DAS), Patient Global
Impression (PGI), Satisfaction
100% L L
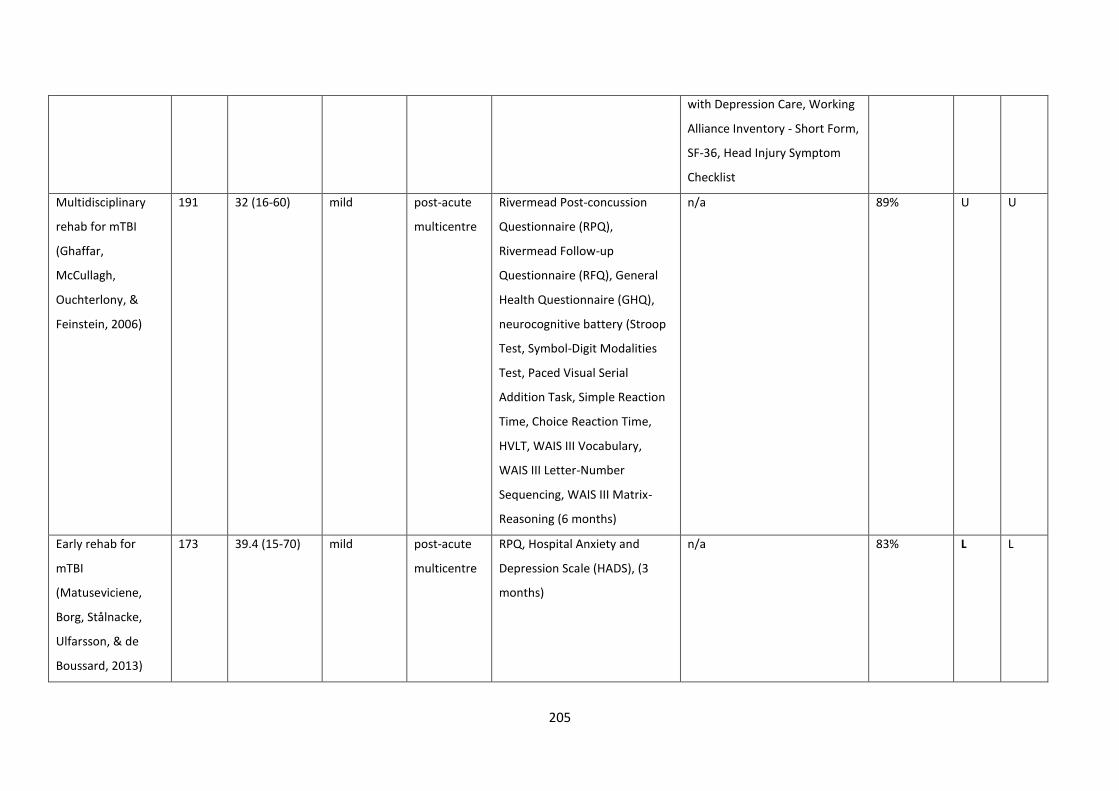
205
with Depression Care, Working
Alliance Inventory - Short Form,
SF-36, Head Injury Symptom
Checklist
Multidisciplinary
rehab for mTBI
(Ghaffar,
McCullagh,
Ouchterlony, &
Feinstein, 2006)
191 32 (16-60) mild post-acute
multicentre
Rivermead Post-concussion
Questionnaire (RPQ),
Rivermead Follow-up
Questionnaire (RFQ), General
Health Questionnaire (GHQ),
neurocognitive battery (Stroop
Test, Symbol-Digit Modalities
Test, Paced Visual Serial
Addition Task, Simple Reaction
Time, Choice Reaction Time,
HVLT, WAIS III Vocabulary,
WAIS III Letter-Number
Sequencing, WAIS III Matrix-
Reasoning (6 months)
n/a 89% U U
Early rehab for
mTBI
(Matuseviciene,
Borg, Stålnacke,
Ulfarsson, & de
Boussard, 2013)
173 39.4 (15-70) mild post-acute
multicentre
RPQ, Hospital Anxiety and
Depression Scale (HADS), (3
months)
n/a 83% L L
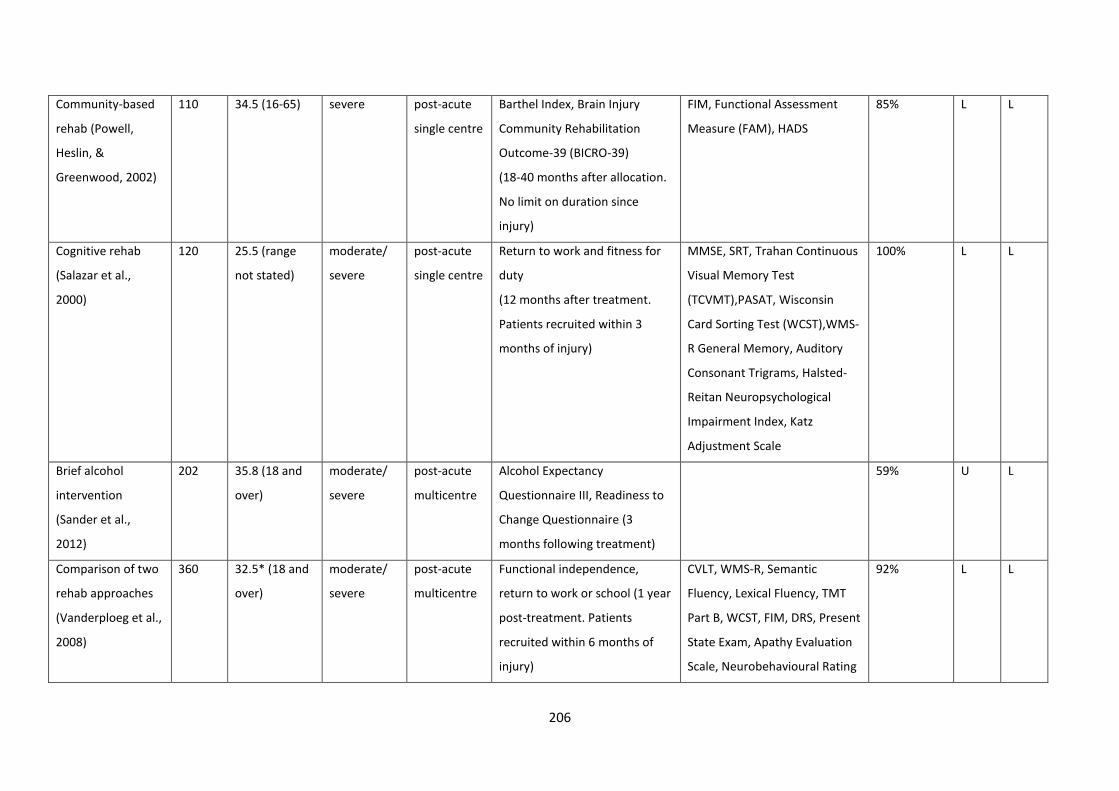
206
Community-based
rehab (Powell,
Heslin, &
Greenwood, 2002)
110 34.5 (16-65) severe post-acute
single centre
Barthel Index, Brain Injury
Community Rehabilitation
Outcome-39 (BICRO-39)
(18-40 months after allocation.
No limit on duration since
injury)
FIM, Functional Assessment
Measure (FAM), HADS
85% L L
Cognitive rehab
(Salazar et al.,
2000)
120 25.5 (range
not stated)
moderate/
severe
post-acute
single centre
Return to work and fitness for
duty
(12 months after treatment.
Patients recruited within 3
months of injury)
MMSE, SRT, Trahan Continuous
Visual Memory Test
(TCVMT),PASAT, Wisconsin
Card Sorting Test (WCST),WMS-
R General Memory, Auditory
Consonant Trigrams, Halsted-
Reitan Neuropsychological
Impairment Index, Katz
Adjustment Scale
100% L L
Brief alcohol
intervention
(Sander et al.,
2012)
202 35.8 (18 and
over)
moderate/
severe
post-acute
multicentre
Alcohol Expectancy
Questionnaire III, Readiness to
Change Questionnaire (3
months following treatment)
59% U L
Comparison of two
rehab approaches
(Vanderploeg et al.,
2008)
360 32.5* (18 and
over)
moderate/
severe
post-acute
multicentre
Functional independence,
return to work or school (1 year
post-treatment. Patients
recruited within 6 months of
injury)
CVLT, WMS-R, Semantic
Fluency, Lexical Fluency, TMT
Part B, WCST, FIM, DRS, Present
State Exam, Apathy Evaluation
Scale, Neurobehavioural Rating
92% L L
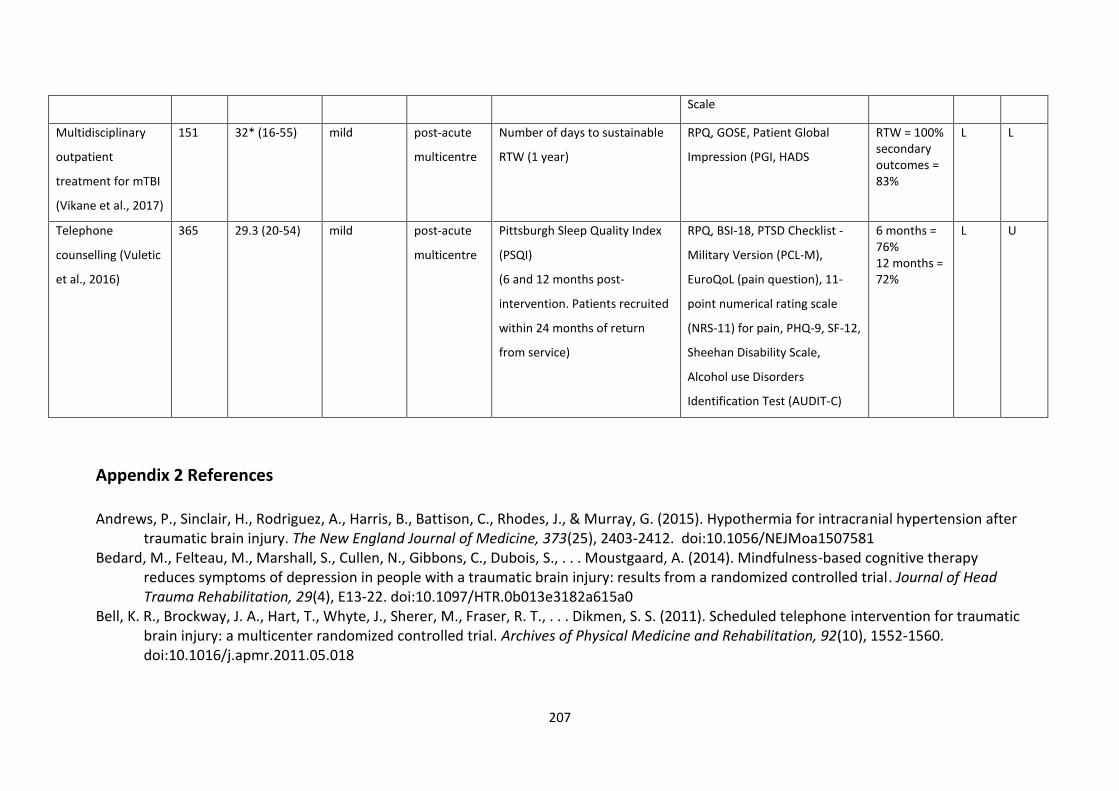
207
Scale
Multidisciplinary
outpatient
treatment for mTBI
(Vikane et al., 2017)
151 32* (16-55) mild post-acute
multicentre
Number of days to sustainable
RTW (1 year)
RPQ, GOSE, Patient Global
Impression (PGI, HADS
RTW = 100% secondary outcomes = 83%
L L
Telephone
counselling (Vuletic
et al., 2016)
365 29.3 (20-54) mild post-acute
multicentre
Pittsburgh Sleep Quality Index
(PSQI)
(6 and 12 months post-
intervention. Patients recruited
within 24 months of return
from service)
RPQ, BSI-18, PTSD Checklist -
Military Version (PCL-M),
EuroQoL (pain question), 11-
point numerical rating scale
(NRS-11) for pain, PHQ-9, SF-12,
Sheehan Disability Scale,
Alcohol use Disorders
Identification Test (AUDIT-C)
6 months = 76% 12 months = 72%
L U
Appendix 2 References
Andrews, P., Sinclair, H., Rodriguez, A., Harris, B., Battison, C., Rhodes, J., & Murray, G. (2015). Hypothermia for intracranial hypertension after traumatic brain injury. The New England Journal of Medicine, 373(25), 2403-2412. doi:10.1056/NEJMoa1507581
Bedard, M., Felteau, M., Marshall, S., Cullen, N., Gibbons, C., Dubois, S., . . . Moustgaard, A. (2014). Mindfulness-based cognitive therapy reduces symptoms of depression in people with a traumatic brain injury: results from a randomized controlled trial. Journal of Head Trauma Rehabilitation, 29(4), E13-22. doi:10.1097/HTR.0b013e3182a615a0
Bell, K. R., Brockway, J. A., Hart, T., Whyte, J., Sherer, M., Fraser, R. T., . . . Dikmen, S. S. (2011). Scheduled telephone intervention for traumatic brain injury: a multicenter randomized controlled trial. Archives of Physical Medicine and Rehabilitation, 92(10), 1552-1560. doi:10.1016/j.apmr.2011.05.018
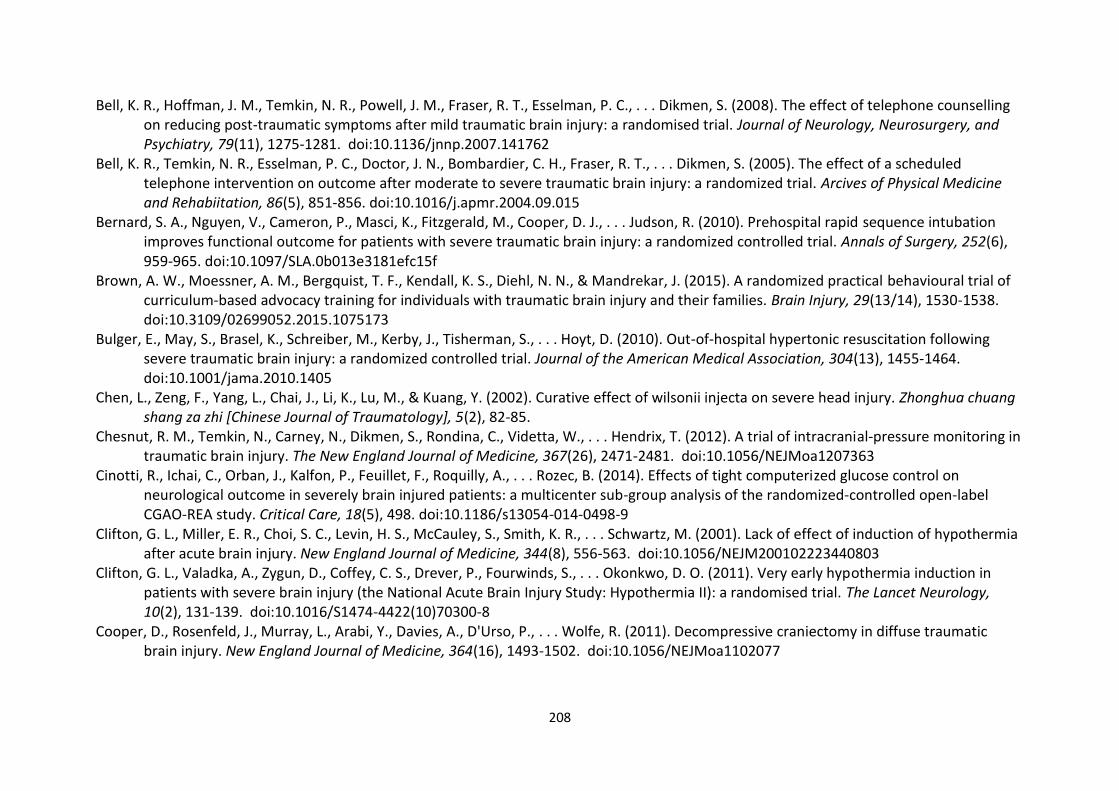
208
Bell, K. R., Hoffman, J. M., Temkin, N. R., Powell, J. M., Fraser, R. T., Esselman, P. C., . . . Dikmen, S. (2008). The effect of telephone counselling on reducing post-traumatic symptoms after mild traumatic brain injury: a randomised trial. Journal of Neurology, Neurosurgery, and Psychiatry, 79(11), 1275-1281. doi:10.1136/jnnp.2007.141762
Bell, K. R., Temkin, N. R., Esselman, P. C., Doctor, J. N., Bombardier, C. H., Fraser, R. T., . . . Dikmen, S. (2005). The effect of a scheduled telephone intervention on outcome after moderate to severe traumatic brain injury: a randomized trial. Arcives of Physical Medicine and Rehabiitation, 86(5), 851-856. doi:10.1016/j.apmr.2004.09.015
Bernard, S. A., Nguyen, V., Cameron, P., Masci, K., Fitzgerald, M., Cooper, D. J., . . . Judson, R. (2010). Prehospital rapid sequence intubation improves functional outcome for patients with severe traumatic brain injury: a randomized controlled trial. Annals of Surgery, 252(6), 959-965. doi:10.1097/SLA.0b013e3181efc15f
Brown, A. W., Moessner, A. M., Bergquist, T. F., Kendall, K. S., Diehl, N. N., & Mandrekar, J. (2015). A randomized practical behavioural trial of curriculum-based advocacy training for individuals with traumatic brain injury and their families. Brain Injury, 29(13/14), 1530-1538. doi:10.3109/02699052.2015.1075173
Bulger, E., May, S., Brasel, K., Schreiber, M., Kerby, J., Tisherman, S., . . . Hoyt, D. (2010). Out-of-hospital hypertonic resuscitation following severe traumatic brain injury: a randomized controlled trial. Journal of the American Medical Association, 304(13), 1455-1464. doi:10.1001/jama.2010.1405
Chen, L., Zeng, F., Yang, L., Chai, J., Li, K., Lu, M., & Kuang, Y. (2002). Curative effect of wilsonii injecta on severe head injury. Zhonghua chuang shang za zhi [Chinese Journal of Traumatology], 5(2), 82-85.
Chesnut, R. M., Temkin, N., Carney, N., Dikmen, S., Rondina, C., Videtta, W., . . . Hendrix, T. (2012). A trial of intracranial-pressure monitoring in traumatic brain injury. The New England Journal of Medicine, 367(26), 2471-2481. doi:10.1056/NEJMoa1207363
Cinotti, R., Ichai, C., Orban, J., Kalfon, P., Feuillet, F., Roquilly, A., . . . Rozec, B. (2014). Effects of tight computerized glucose control on neurological outcome in severely brain injured patients: a multicenter sub-group analysis of the randomized-controlled open-label CGAO-REA study. Critical Care, 18(5), 498. doi:10.1186/s13054-014-0498-9
Clifton, G. L., Miller, E. R., Choi, S. C., Levin, H. S., McCauley, S., Smith, K. R., . . . Schwartz, M. (2001). Lack of effect of induction of hypothermia after acute brain injury. New England Journal of Medicine, 344(8), 556-563. doi:10.1056/NEJM200102223440803
Clifton, G. L., Valadka, A., Zygun, D., Coffey, C. S., Drever, P., Fourwinds, S., . . . Okonkwo, D. O. (2011). Very early hypothermia induction in patients with severe brain injury (the National Acute Brain Injury Study: Hypothermia II): a randomised trial. The Lancet Neurology, 10(2), 131-139. doi:10.1016/S1474-4422(10)70300-8
Cooper, D., Rosenfeld, J., Murray, L., Arabi, Y., Davies, A., D'Urso, P., . . . Wolfe, R. (2011). Decompressive craniectomy in diffuse traumatic brain injury. New England Journal of Medicine, 364(16), 1493-1502. doi:10.1056/NEJMoa1102077
209
Cooper, D. J., Myles, P. S., McDermott, F. T., Murray, L. J., Laidlaw, J., Cooper, G., . . . Ponsford, J. (2004). Prehospital hypertonic saline resuscitation of patients with hypotension and severe traumatic brain injury: a randomized controlled trial. Journal of the American Medical Association, 291(11), 1350-1357. doi:10.1001/jama.291.11.1350
Cruz, J., Minoja, G., & Okuchi, K. (2001). Improving clinical outcomes from acute subdural hematomas with the emergency preoperative administration of high doses of mannitol: a randomized trial. Neurosurgery, 49(4), 864-871.
Cruz, J., Minoja, G., & Okuchi, K. (2002). Major clinical and physiological benefits of early high doses of mannitol for intraparenchymal temporal lobe hemorrhages with abnormal pupillary widening: a randomized trial. Neurosurgery, 51(3), 628-637; discussion 637-628.
de Kruijk, J. R., Leffers, P., Meerhoff, S., Rutten, J., & Twijnstra, A. (2002). Effectiveness of bed rest after mild traumatic brain injury: a randomised trial of no versus six days of bed rest. Journal of Neurology, Neurosurgery and Psychiatry, 73(2), 167-172.
Dikmen, S. S., Machamer, J. E., Winn, H. R., Anderson, G. D., & Temkin, N. R. (2000). Neuropsychological effects of valproate in traumatic brain injury: a randomized trial. Neurology, 54(4), 895-902.
Edwards, P., Arango, M., Balica, L., Cottingham, R., El-Sayed, H., Farrell, B., . . . CRASH Trial collaborators. (2005). Final results of MRC CRASH, a randomised placebo-controlled trial of intravenous corticosteroid in adults with head injury-outcomes at 6 months. Lancet, 365(9475), 1957-1959. doi:10.1016/S0140-6736(05)66552-X
Elgmark Andersson, E., Emanuelson, I., Bjorklund, R., & Stalhammar, D. A. (2007). Mild traumatic brain injuries: the impact of early intervention on late sequelae. A randomized controlled trial. Acta Neurochirurgica, 149(2), 151-159; discussion 160. doi:10.1007/s00701-006-1082-0
Fann, J. R., Bombardier, C. H., Vannoy, S., Dyer, J., Ludman, E., Dikmen, S., . . . Temkin, N. (2015). Telephone and in-person cognitive behavioral therapy for major depression after traumatic brain injury: A randomized controlled trial. Journal of Neurotrauma, 32(1), 45-57. doi:10.1089/neu.2014.3423
Ghaffar, O., McCullagh, S., Ouchterlony, D., & Feinstein, A. (2006). Randomized treatment trial in mild traumatic brain injury. Journal of Psychosomatic Research, 61(2), 153-160. doi:10.1016/j.jpsychores.2005.07.018
Giacino, J. T., Whyte, J., Bagiella, E., Kalmar, K., Childs, N., Khademi, A., . . . Sherer, M. (2012). Placebo-controlled trial of amantadine for severe traumatic brain injury. New England Journal of Medicine, 366(9), 819-826 818p.
Gregson, B., Rowan, E., Francis, R., McNamee, P., Boyers, D., Mitchell, P., . . . Mendelow, A. (2015). Surgical Trial In Traumatic intraCerebral Haemorrhage (STITCH): a randomised controlled trial of early surgery compared with initial conservative treatment. Health Technology Assessment (Winchester, England), 19(70), 1-138. doi:10.3310/hta19700
Hammond, F. M., Sherer, M., Malec, J. F., Zafonte, R. D., Whitney, M., Bell, K., . . . Pershad, R. (2015). Amantadine effect on perceptions of irritability after traumatic brain injury: results of the amantadine irritability multisite study. Journal of Neurotrauma, 32(16), 1230-1238. doi:10.1089/neu.2014.3803
210
Hutchinson, P., Kolias, A., Timofeev, I., Corteen, E., Czosnyka, M., Timothy, J., . . . Kirkpatrick, P. (2017). Trial of decompressive craniectomy for traumatic intracranial hypertension. New England Journal of Medicine, 375(12), 1119-1130. doi:10.1056/NEJMoa1605215
Jiang, J. Y., Xu, W., Li, W. P., Gao, G. Y., Bao, Y. H., Liang, Y. M., & Luo, Q. Z. (2006). Effect of long-term mild hypothermia or short-term mild hypothermia on outcome of patients with severe traumatic brain injury. Journal of cerebral blood flow and metabolism : official journal of the International Society of Cerebral Blood Flow and Metabolism, 26(6), 771-776. doi:10.1038/sj.jcbfm.9600253
Jiang, J. Y., Xu, W., Li, W. P., Xu, W. H., Zhang, J., Bao, Y. H., . . . Luo, Q. Z. (2005). Efficacy of standard trauma craniectomy for refractory intracranial hypertension with severe traumatic brain injury: a multicenter, prospective, randomized controlled study. Journal of Neurotrauma, 22(6), 623-628. doi:10.1089/neu.2005.22.623
Kirkness, C. J., Burr, R. L., Cain, K. C., Newell, D. W., & Mitchell, P. H. (2006). Effect of continuous display of cerebral perfusion pressure on outcomes in patients with traumatic brain injury. American Journal of Critical Care, 15(6), 600-609; quiz 610.
Li, Z. M., Wang, L. X., Jiang, L. C., Zhu, J. X., Geng, F. Y., & Qiang, F. (2012). Surgical Treatment of Transtentorial Herniation After Traumatic Brain Injury. Neurosurgery Quarterly, 22(1), 26-29.
Li, Z. M., Xiao, Y. L., Zhu, J. X., Geng, F. Y., Guo, C. J., Chong, Z. L., & Wang, L. X. (2016). Recombinant human erythropoietin improves functional recovery in patients with severe traumatic brain injury: a randomized, double blind and controlled clinical trial. Clinical Neurology and Neurosurgery, 150, 80-83. doi:10.1016/j.clineuro.2016.09.001
Lü, L. Q., Jiang, J. Y., Yu, M. K., Hou, L. J., Chen, Z. G., Zhang, G. J., & Zhu, C. (2003). Standard large trauma craniotomy for severe traumatic brain injury. Chinese Journal of Traumatology = Zhonghua chuang shang za zhi, 6(5), 302-304.
Maas, A. I., Murray, G., Henney, H., 3rd, Kassem, N., Legrand, V., Mangelus, M., . . . Pharmos, T. B. I. i. (2006). Efficacy and safety of dexanabinol in severe traumatic brain injury: results of a phase III randomised, placebo-controlled, clinical trial. Lancet Neurology, 5(1), 38-45. doi:10.1016/S1474-4422(05)70253-2
Maekawa, T., Yamashita, S., Nagao, S., Hayashi, N., & Ohashi, Y. (2015). Prolonged mild therapeutic hypothermia versus fever control with tight hemodynamic monitoring and slow rewarming in patients with severe traumatic brain injury: A randomized controlled trial. Journal of Neurotrauma, 32(7), 422-429. doi:10.1089/neu.2013.3197
Matuseviciene, G., Borg, J., Stålnacke, B.-M., Ulfarsson, T., & de Boussard, C. (2013). Early intervention for patients at risk for persisting disability after mild traumatic brain injury: A randomized, controlled study. Brain Injury, 27(3), 318-324. doi:10.3109/02699052.2012.750740
Mendelow, A., Gregson, B., Rowan, E., Francis, R., McColl, E., McNamee, P., . . . Mitchell, P. (2015). Early Surgery versus Initial Conservative Treatment in Patients with Traumatic Intracerebral Hemorrhage (STITCH[Trauma]): The First Randomized Trial. Journal of Neurotrauma, 32(17), 1312-1323. doi:10.1089/neu.2014.3644
211
Menn, S. J., Yang, R., & Lankford, A. (2014). Armodafinil for the treatment of excessive sleepiness associated with mild or moderate closed traumatic brain injury: a 12-week, randomized, double-blind study followed by a 12-month open-label extension. Journal of Clinical Sleep Medicine, 10(11), 1181-1191 1111p. doi:10.5664/jcsm.4196
Nichol, A., French, C., Little, L., Haddad, S., Presneill, J., Arabi, Y., . . . Bellomo, R. (2015). Erythropoietin in traumatic brain injury (EPO-TBI): a double-blind randomised controlled trial. Lancet, 386(10012), 2499-2506. doi:10.1016/s0140-6736(15)00386-4
Perel, P., Salman, R. A. S., Constain, A., Dewan, Y., Herrera, J., Kawahara, T., . . . Wardlaw, J. (2011). Effect of tranexamic acid in traumatic brain injury: a nested randomised, placebo controlled trial (CRASH-2 Intracranial Bleeding Study). BMJ: British Medical Journal (Overseas & Retired Doctors Edition), 343(7816), 192-192 191p. doi:10.1136/bmj.d3795
Powell, J., Heslin, J., & Greenwood, R. (2002). Community based rehabilitation after severe traumatic brain injury: A randomised controlled trial. Journal of Neurology, Neurosurgery & Psychiatry, 72(2), 193-202. doi:10.1136/jnnp.72.2.193
Roberts, I., Yates, D., Sandercock, P., Farrell, B., Wasserberg, J., Lomas, G., . . . Edwards, P. (2004). Effect of intravenous corticosteroids on death within 14 days in 10008 adults with clinically significant head injury (MRC CRASH trial): randomised placebo-controlled trial. Lancet, 364(9442), 1321-1328. doi:10.1016/s0140-6736(04)17188-2
Robertson, C., Hannay, H., Yamal, J., Gopinath, S., Goodman, J., Tilley, B., . . . Swank, P. (2014). Effect of erythropoietin and transfusion threshold on neurological recovery after traumatic brain injury: a randomized clinical trial. Journal of the American Medical Association, 312(1), 36-47. doi:10.1001/jama.2014.6490
Salazar, A. M., Warden, D. L., Schwab, K., Spector, J., Braverman, S., Walter, J., . . . Ellenbogen, R. G. (2000). Cognitive rehabilitation for traumatic brain injury: A randomized trial. Defense and Veterans Head Injury Program (DVHIP) Study Group. Journal of the American Medical Association, 283(23), 3075-3081.
Sander, A. M., Bogner, J., Nick, T. G., Clark, A. N., Corrigan, J. D., & Rozzell, M. (2012). A randomized controlled trial of brief intervention for problem alcohol use in persons with traumatic brain injury. The Journal of Head Trauma Rehabilitation, 27(5), 319-330. doi:10.1097/HTR.0b013e318269838c
Shakur, H., Andrews, P., Asser, T., Balica, L., Boeriu, C., Quintero, J. D., . . . Roberts, I. (2009). The BRAIN TRIAL: a randomised, placebo controlled trial of a Bradykinin B2 receptor antagonist (Anatibant) in patients with traumatic brain injury. Trials, 10, 109. doi:10.1186/1745-6215-10-109
Silver, J. M., Koumaras, B., Chen, M., Mirski, D., Potkin, S. G., Reyes, P., . . . Gunay, I. (2006). Effects of rivastigmine on cognitive function in patients with traumatic brain injury. Neurology, 67(5), 748-755. doi:10.1212/01.wnl.0000234062.98062.e9
Skolnick, B. E., Maas, A. I., Narayan, R. K., Hoop, R. G., MacAllister, T., Ward, J. D., . . . Stocchetti, N. (2014). A clinical trial of progesterone for severe traumatic brain injury. The New England Journal of Medicine, 371(26), 2467-2476. doi:10.1056/NEJMoa1411090
212
Temkin, N., Anderson, G., Winn, H., Ellenbogen, R., Britz, G., Schuster, J., . . . Dikmen, S. (2007). Magnesium sulfate for neuroprotection after traumatic brain injury: a randomised controlled trial. The Lancet Neurology, 6(1), 29-38. doi:10.1016/S1474-4422(06)70630-5
Tenovuo, O., Alin, J., & Helenius, H. (2009). A randomized controlled trial of rivastigmine for chronic sequels of traumatic brain injury-what it showed and taught? Brain Injury, 23(6), 548-558. doi:10.1080/02699050902926275
Vanderploeg, R. D., Schwab, K., Walker, W. C., Fraser, J. A., Sigford, B. J., Date, E. S., . . . Warden, D. L. (2008). Rehabilitation of traumatic brain injury in active duty military personnel and veterans: Defense and veterans brain injury center randomized controlled trial of two rehabilitation approaches. Archives of Physical Medicine & Rehabilitation, 89(12), 2227-2238 2212p.
Vikane, E., Hellstrøm, T., Røe, C., Bautz-Holter, E., Aßmus, J., & Skouen, J. S. (2017). Multidisciplinary outpatient treatment in patients with mild traumatic brain injury: A randomised controlled intervention study. Brain Injury, 31(4), 475-484. doi:10.1080/02699052.2017.1280852
Vuletic, S., Bell, K. R., Jain, S., Bush, N., Temkin, N., Fann, J. R., . . . Gahm, G. A. (2016). Telephone problem-solving treatment improves sleep quality in service members with combat-related mild traumatic brain injury: results from a randomized clinical trial. Journal of Head Trauma Rehabilitation, 31(2), 147-157. doi:10.1097/HTR.0000000000000221
Wright, D., Yeatts, S., Silbergleit, R., Palesch, Y., Hertzberg, V., Frankel, M., . . . Barsan, W. (2014). Very early administration of progesterone for acute traumatic brain injury. The New England Journal of Medicine, 371(26), 2457-2466. doi:10.1056/NEJMoa1404304
Yan, Y., Tang, W., Deng, Z., Zhong, D., & Yang, G. (2010). Cerebral oxygen metabolism and neuroelectrophysiology in a clinical study of severe brain injury and mild hypothermia. Journal of Clinical Neuroscience, 17(2), 196-200. doi:10.1016/j.jocn.2009.05.022
Yang, M., Guo, Q., Zhang, X., Sun, S., Wang, Y., Zhao, L., . . . Li, C. (2009). Intensive insulin therapy on infection rate, days in NICU, in-hospital mortality and neurological outcome in severe traumatic brain injury patients: a randomized controlled trial. International Journal of Nursing Studies, 46(6), 753-758. doi:10.1016/j.ijnurstu.2009.01.004
Yurkewicz, L., Weaver, J., Bullock, M. R., & Marshall, L. F. (2005). The effect of the selective NMDA receptor antagonist traxoprodil in the treatment of traumatic brain injury. Journal of Neurotrauma, 22(12), 1428-1443. doi:10.1089/neu.2005.22.1428
Yutthakasemsunt, S., Kittiwatanagul, W., Piyavechvirat, P., Thinkamrop, B., Phuenpathom, N., & Lumbiganon, P. (2013). Tranexamic acid for patients with traumatic brain injury: a randomized, double-blinded, placebo-controlled trial. BMC Emergency Medicine, 13, 20. doi:10.1186/1471-227X-13-20
Zafonte, R. D., Bagiella, E., Ansel, B. M., Novack, T. A., Friedewald, W. T., Hesdorffer, D. C., . . . Dikmen, S. S. (2012). Effect of citicoline on functional and cognitive status among patients with traumatic brain injury: Citicoline Brain Injury Treatment Trial (COBRIT). Journal of the American Medical Association, 308(19), 1993-2000. doi:10.1001/jama.2012.13256
Zhi, D., Zhang, S., & Lin, X. (2003). Study on therapeutic mechanism and clinical effect of mild hypothermia in patients with severe head injury. Surgical Neurology, 59(5), 381-385.
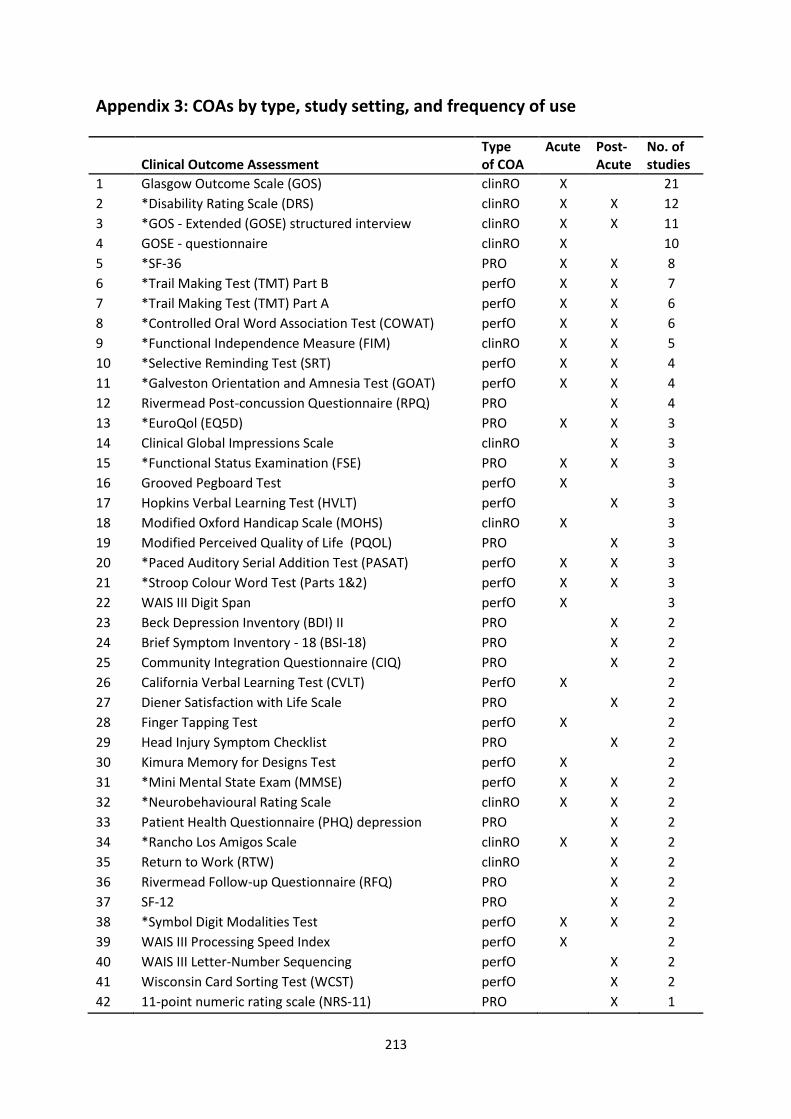
213
Appendix 3: COAs by type, study setting, and frequency of use
Clinical Outcome Assessment
Type of COA
Acute Post-Acute
No. of studies
1 Glasgow Outcome Scale (GOS) clinRO X 21
2 *Disability Rating Scale (DRS) clinRO X X 12
3 *GOS - Extended (GOSE) structured interview clinRO X X 11
4 GOSE - questionnaire clinRO X 10
5 *SF-36 PRO X X 8
6 *Trail Making Test (TMT) Part B perfO X X 7
7 *Trail Making Test (TMT) Part A perfO X X 6
8 *Controlled Oral Word Association Test (COWAT) perfO X X 6
9 *Functional Independence Measure (FIM) clinRO X X 5
10 *Selective Reminding Test (SRT) perfO X X 4
11 *Galveston Orientation and Amnesia Test (GOAT) perfO X X 4
12 Rivermead Post-concussion Questionnaire (RPQ) PRO X 4
13 *EuroQol (EQ5D) PRO X X 3
14 Clinical Global Impressions Scale clinRO X 3
15 *Functional Status Examination (FSE) PRO X X 3
16 Grooved Pegboard Test perfO X 3
17 Hopkins Verbal Learning Test (HVLT) perfO X 3
18 Modified Oxford Handicap Scale (MOHS) clinRO X 3
19 Modified Perceived Quality of Life (PQOL) PRO X 3
20 *Paced Auditory Serial Addition Test (PASAT) perfO X X 3
21 *Stroop Colour Word Test (Parts 1&2) perfO X X 3
22 WAIS III Digit Span perfO X 3
23 Beck Depression Inventory (BDI) II PRO X 2
24 Brief Symptom Inventory - 18 (BSI-18) PRO X 2
25 Community Integration Questionnaire (CIQ) PRO X 2
26 California Verbal Learning Test (CVLT) PerfO X 2
27 Diener Satisfaction with Life Scale PRO X 2
28 Finger Tapping Test perfO X 2
29 Head Injury Symptom Checklist PRO X 2
30 Kimura Memory for Designs Test perfO X 2
31 *Mini Mental State Exam (MMSE) perfO X X 2
32 *Neurobehavioural Rating Scale clinRO X X 2
33 Patient Health Questionnaire (PHQ) depression PRO X 2
34 *Rancho Los Amigos Scale clinRO X X 2
35 Return to Work (RTW) clinRO X 2
36 Rivermead Follow-up Questionnaire (RFQ) PRO X 2
37 SF-12 PRO X 2
38 *Symbol Digit Modalities Test perfO X X 2
39 WAIS III Processing Speed Index perfO X 2
40 WAIS III Letter-Number Sequencing perfO X 2
41 Wisconsin Card Sorting Test (WCST) perfO X 2
42 11-point numeric rating scale (NRS-11) PRO X 1
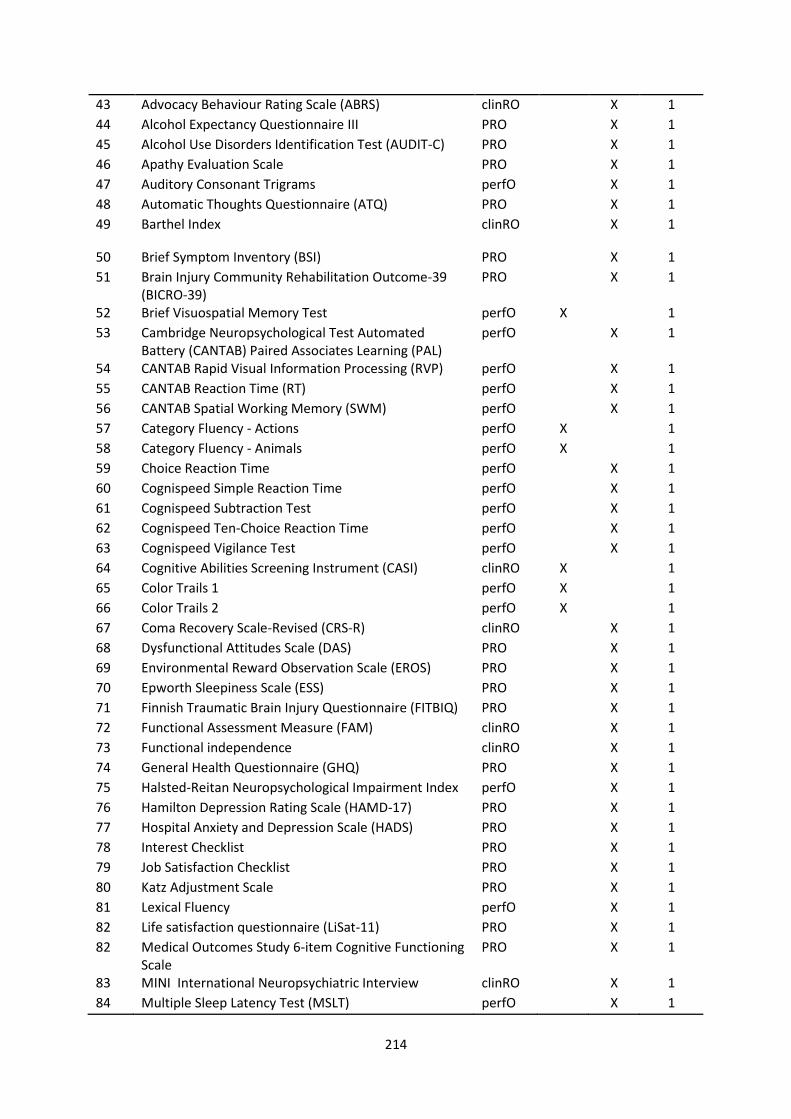
214
43 Advocacy Behaviour Rating Scale (ABRS) clinRO X 1
44 Alcohol Expectancy Questionnaire III PRO X 1
45 Alcohol Use Disorders Identification Test (AUDIT-C) PRO X 1
46 Apathy Evaluation Scale PRO X 1
47 Auditory Consonant Trigrams perfO X 1
48 Automatic Thoughts Questionnaire (ATQ) PRO X 1
49 Barthel Index clinRO X 1
50 Brief Symptom Inventory (BSI) PRO X 1
51 Brain Injury Community Rehabilitation Outcome-39 (BICRO-39)
PRO X 1
52 Brief Visuospatial Memory Test perfO X 1
53 Cambridge Neuropsychological Test Automated Battery (CANTAB) Paired Associates Learning (PAL)
perfO X 1
54 CANTAB Rapid Visual Information Processing (RVP) perfO X 1
55 CANTAB Reaction Time (RT) perfO X 1
56 CANTAB Spatial Working Memory (SWM) perfO X 1
57 Category Fluency - Actions perfO X 1
58 Category Fluency - Animals perfO X 1
59 Choice Reaction Time perfO X 1
60 Cognispeed Simple Reaction Time perfO X 1
61 Cognispeed Subtraction Test perfO X 1
62 Cognispeed Ten-Choice Reaction Time perfO X 1
63 Cognispeed Vigilance Test perfO X 1
64 Cognitive Abilities Screening Instrument (CASI) clinRO X 1
65 Color Trails 1 perfO X 1
66 Color Trails 2 perfO X 1
67 Coma Recovery Scale-Revised (CRS-R) clinRO X 1
68 Dysfunctional Attitudes Scale (DAS) PRO X 1
69 Environmental Reward Observation Scale (EROS) PRO X 1
70 Epworth Sleepiness Scale (ESS) PRO X 1
71 Finnish Traumatic Brain Injury Questionnaire (FITBIQ) PRO X 1
72 Functional Assessment Measure (FAM) clinRO X 1
73 Functional independence clinRO X 1
74 General Health Questionnaire (GHQ) PRO X 1
75 Halsted-Reitan Neuropsychological Impairment Index perfO X 1
76 Hamilton Depression Rating Scale (HAMD-17) PRO X 1
77 Hospital Anxiety and Depression Scale (HADS) PRO X 1
78 Interest Checklist PRO X 1
79 Job Satisfaction Checklist PRO X 1
80 Katz Adjustment Scale PRO X 1
81 Lexical Fluency perfO X 1
82 Life satisfaction questionnaire (LiSat-11) PRO X 1
82 Medical Outcomes Study 6-item Cognitive Functioning Scale
PRO X 1
83 MINI International Neuropsychiatric Interview clinRO X 1
84 Multiple Sleep Latency Test (MSLT) perfO X 1
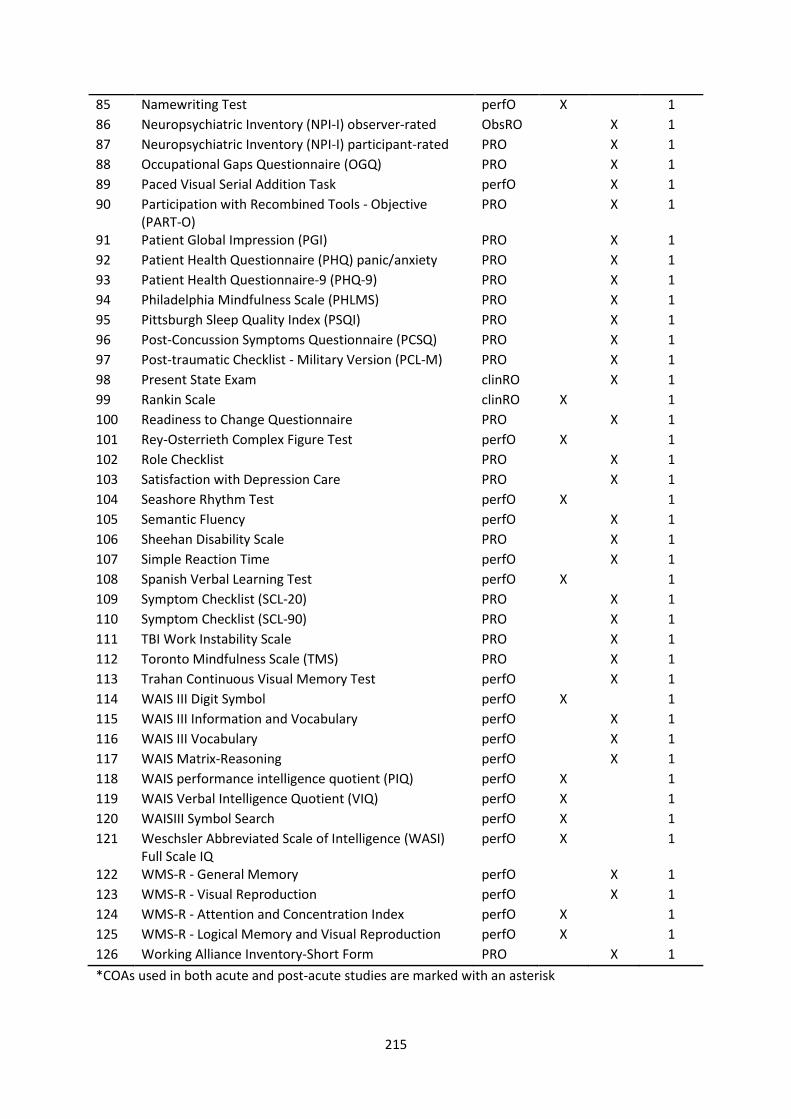
215
85 Namewriting Test perfO X 1
86 Neuropsychiatric Inventory (NPI-I) observer-rated ObsRO X 1
87 Neuropsychiatric Inventory (NPI-I) participant-rated PRO X 1
88 Occupational Gaps Questionnaire (OGQ) PRO X 1
89 Paced Visual Serial Addition Task perfO X 1
90 Participation with Recombined Tools - Objective (PART-O)
PRO X 1
91 Patient Global Impression (PGI) PRO X 1
92 Patient Health Questionnaire (PHQ) panic/anxiety PRO X 1
93 Patient Health Questionnaire-9 (PHQ-9) PRO X 1
94 Philadelphia Mindfulness Scale (PHLMS) PRO X 1
95 Pittsburgh Sleep Quality Index (PSQI) PRO X 1
96 Post-Concussion Symptoms Questionnaire (PCSQ) PRO X 1
97 Post-traumatic Checklist - Military Version (PCL-M) PRO X 1
98 Present State Exam clinRO X 1
99 Rankin Scale clinRO X 1
100 Readiness to Change Questionnaire PRO X 1
101 Rey-Osterrieth Complex Figure Test perfO X 1
102 Role Checklist PRO X 1
103 Satisfaction with Depression Care PRO X 1
104 Seashore Rhythm Test perfO X 1
105 Semantic Fluency perfO X 1
106 Sheehan Disability Scale PRO X 1
107 Simple Reaction Time perfO X 1
108 Spanish Verbal Learning Test perfO X 1
109 Symptom Checklist (SCL-20) PRO X 1
110 Symptom Checklist (SCL-90) PRO X 1
111 TBI Work Instability Scale PRO X 1
112 Toronto Mindfulness Scale (TMS) PRO X 1
113 Trahan Continuous Visual Memory Test perfO X 1
114 WAIS III Digit Symbol perfO X 1
115 WAIS III Information and Vocabulary perfO X 1
116 WAIS III Vocabulary perfO X 1
117 WAIS Matrix-Reasoning perfO X 1
118 WAIS performance intelligence quotient (PIQ) perfO X 1
119 WAIS Verbal Intelligence Quotient (VIQ) perfO X 1
120 WAISIII Symbol Search perfO X 1
121 Weschsler Abbreviated Scale of Intelligence (WASI) Full Scale IQ
perfO X 1
122 WMS-R - General Memory perfO X 1
123 WMS-R - Visual Reproduction perfO X 1
124 WMS-R - Attention and Concentration Index perfO X 1
125 WMS-R - Logical Memory and Visual Reproduction perfO X 1
126 Working Alliance Inventory-Short Form PRO X 1
*COAs used in both acute and post-acute studies are marked with an asterisk
Copyright © 2022 FDOKUMEN