Typical Severe Service Application Challenges & Engineered ...
Upload
independentCategory
view
0download
0
Pituitary Function and Functional Outcome in Adults afterSevere Traumatic Brain Injury: The Long-Term Perspective
Trandur Ulfarsson,1,2 Gudni Arnar Gudnason,3 Thord Rosen,3 Christian Blomstrand,1,2
Katharina Stibrant Sunnerhagen,2,4 Asa Lundgren-Nilsson,2,4 and Michael Nilsson1
Abstract
Post-traumatic hypopituitarism (PTHP) has been linked to disability and decreased quality of life. However, no studies
have addressed the long-term consequences of PTHP in adults with severe traumatic brain injury (TBI) only. In this study,
we evaluated the relationship between pituitary function, quality of life, and functioning in 51 patients (16–65 years of
age) with severe TBI who were admitted to Sahlgrenska University Hospital, Gothenburg from 1999 to 2002. The patients
were assessed once, 2–10 years after trauma. Data from the time of injury were collected retrospectively to adjust for
injury severity. Outcome measures included hormonal testing, the Short Form-36 Health Survey, the Glasgow Outcome
Scale–Extended, and a self-report questionnaire specifically designed for this study and based on the International
Classification of Functioning, Disability and Health. Of 51 patients, 14 (27.5%) presented with PTHP, and 11 (21.6%) had
isolated growth hormone deficiency. Patients with PTHP were more often overweight at follow-up ( p = 0.01); the higher
body mass index was partially explained by PTHP (R2 change = 0.07, p = 0.001). Otherwise no significant correlation was
found among PTHP, functioning, or patient-reported quality of life. This study—which is unique in the homogeneity of
the patients, the long follow-up time, and the use of injury severity as an outcome predictor—did not confirm results from
previous studies linking PTHP to a worse outcome. Therefore, screening for PTHP might be restricted to specific
subgroups such as overweight patients, indicating growth hormone deficiency.
Key words: functioning; hypopituitarism; long-term outcome; quality of life; TBI
Introduction
Traumatic brain injury (TBI) is associated with a high
morbidity, causing a broad spectrum of limitations in physical
and psychosocial functioning and participation in life activities.1–6
The initial severity of the TBI explains only a proportion of the
variation in late outcome, a relationship that may weaken over
time.3,4,6 Intensive neurorehabilitation can reduce or alleviate
symptoms.7 However, physiological and psychosocial dysfunc-
tions may lead to problems even years after injury.3,4,6 The rela-
tionships among physical, cognitive, emotional, and social
outcome measures are relevant, because factors might be identified
that are amenable to intervention to alleviate late disability.
Several studies from the last decade have shown that TBI puts
patients at substantial risk of subsequent post-traumatic hypopitu-
itarism (PTHP).8–15 Researchers have begun to investigate the ef-
fect of PTHP on outcome after TBI, with a particular focus on
neuropsychological sequelae.16 However, such studies have mea-
sured outcome in a heterogeneous group of patients with a wide
range of TBI severity.17–29 Few studies have considered the relative
contribution of injury severity to outcome.16
A worse functional outcome (e.g., greater functional depen-
dency and activity limitation) and worse cognitive functions (e.g.,
greater deficits in attention, executive functioning, memory, and
emotion) has been reported in TBI patients with PTHP, particularly
those with growth hormone deficiency (GHD), than in those
without PTHP.20,21,28 A few studies have also reported a worse
health-related quality of life (HRQL) in patients with PTHP, par-
ticularly those with GHD (e.g., poorer sleep and energy levels and
an increased sense of social isolation).18,23,25,29
All of the studies described evaluated patients up to 2 years after
the injury. However, in one study of TBI patients with long-lasting
cognitive disorders followed for a mean of 6.5 years after the initial
injury, late functional outcomes, activity performance, and cogni-
tive function after TBI were worse in patients with PTHP, espe-
cially those with GHD. However, the impact of PTHP on functional
outcome, cognitive disorders, and HRQL is controversial.22 Few
studies have shown results that have questioned the current opinion
1Center for Brain Repair and Rehabilitation (CBR), 4Department of Clinical Neuroscience and Rehabilitation, Institute of Neuroscience andPhysiology, University of Gothenburg, Gothenburg, Sweden.
2Rehabilitation Medicine and 3Department of Endocrinology, Sahlgrenska University Hospital, Gothenburg, Sweden.
JOURNAL OF NEUROTRAUMA 30:271–280 (February 15, 2013)ª Mary Ann Liebert, Inc.DOI: 10.1089/neu.2012.2494
271
on hypopituitarism after TBI. They reported no evidence for an
association between impaired cognitive function and GHD in adult
TBI patients, between neuropsychological impairments, HRQL
and PTHP, or between TBI, fatigue, and GHD.19,17,27
Given the discrepancies in the limited data on PTHP and out-
come, the clinical importance of PTHP needs to be examined fur-
ther in a well-defined group of patients with severe brain injury and
a long follow-up time. In this study, we retrospectively evaluated
the relationship between pituitary function and outcome in a series
of patients 2–10 years after severe TBI. The patients underwent
hormonal testing and clinical examination and completed self-
report questionnaires measuring functioning and HRQL.
Methods
Patient enrollment and retrospective evaluation
The catchment region of the Sahlgrenska University Hospitalincludes * 1,500,000 inhabitants in the Vastra Gotaland region inwestern Sweden, including roughly 500,000 in the city of Go-thenburg. Between January 1, 1999, and December 31, 2002, 419patients with TBI (International Statistical Classification of Dis-eases and Related Health Problems, 10th revision [ICD 10] diag-nostic codes S06.1–S06.9) were admitted to the neonatal intensivecare unit at Sahlgrenska University Hospital, Gothenburg, Sweden.We retrospectively reviewed the medical files of these patients tocollect data on the level of consciousness upon arrival at the hos-pital. Consciousness was evaluated with the Reaction Level Scale(RLS), a hierarchically ordered scale with eight categories (‘‘re-action levels’’), where higher scores denote worse responsiveness,and a score ‡ 4 denotes a nonresponsive patient.30 RLS scores wererecoded into Glasgow Coma Scale (GCS) scores, where RLS ‡ 4 isequivalent GCS £ 8.31,32
The inclusion criteria were: 1) age 16–65 years; 2) GCS score£ 8, indicating a severe TBI; (3) survival to discharge from theNICU; and (4) residence in the Vastra Gotaland region at the timeof follow-up. The exclusion criteria were a known pituitary insuf-ficiency or recent or ongoing glucocorticoid, growth hormone, orthyroxine replacement therapy at the time of follow-up.
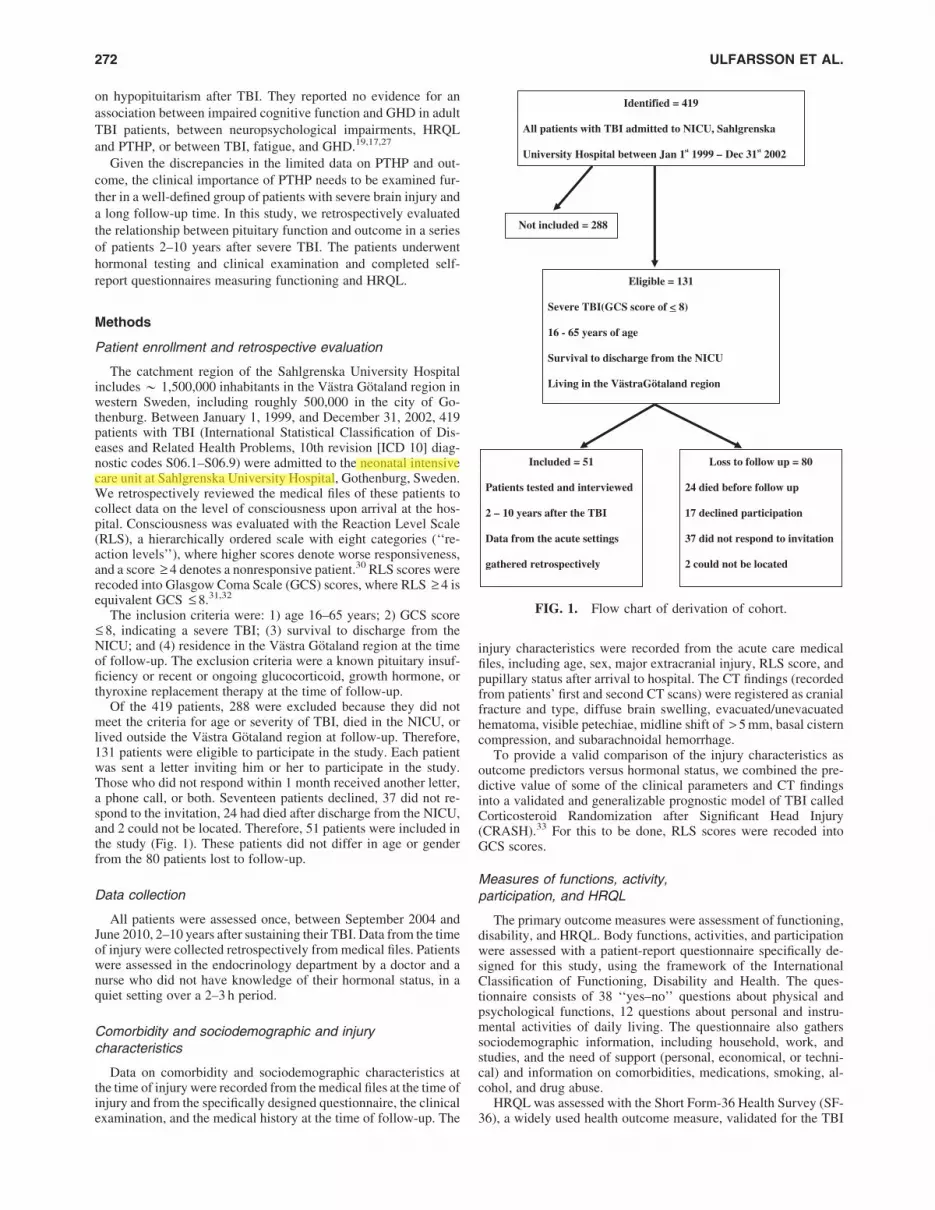
Of the 419 patients, 288 were excluded because they did notmeet the criteria for age or severity of TBI, died in the NICU, orlived outside the Vastra Gotaland region at follow-up. Therefore,131 patients were eligible to participate in the study. Each patientwas sent a letter inviting him or her to participate in the study.Those who did not respond within 1 month received another letter,a phone call, or both. Seventeen patients declined, 37 did not re-spond to the invitation, 24 had died after discharge from the NICU,and 2 could not be located. Therefore, 51 patients were included inthe study (Fig. 1). These patients did not differ in age or genderfrom the 80 patients lost to follow-up.
Data collection
All patients were assessed once, between September 2004 andJune 2010, 2–10 years after sustaining their TBI. Data from the timeof injury were collected retrospectively from medical files. Patientswere assessed in the endocrinology department by a doctor and anurse who did not have knowledge of their hormonal status, in aquiet setting over a 2–3 h period.
Comorbidity and sociodemographic and injurycharacteristics
Data on comorbidity and sociodemographic characteristics atthe time of injury were recorded from the medical files at the time ofinjury and from the specifically designed questionnaire, the clinicalexamination, and the medical history at the time of follow-up. The
injury characteristics were recorded from the acute care medicalfiles, including age, sex, major extracranial injury, RLS score, andpupillary status after arrival to hospital. The CT findings (recordedfrom patients’ first and second CT scans) were registered as cranialfracture and type, diffuse brain swelling, evacuated/unevacuatedhematoma, visible petechiae, midline shift of > 5 mm, basal cisterncompression, and subarachnoidal hemorrhage.
To provide a valid comparison of the injury characteristics asoutcome predictors versus hormonal status, we combined the pre-dictive value of some of the clinical parameters and CT findingsinto a validated and generalizable prognostic model of TBI calledCorticosteroid Randomization after Significant Head Injury(CRASH).33 For this to be done, RLS scores were recoded intoGCS scores.
Measures of functions, activity,participation, and HRQL
The primary outcome measures were assessment of functioning,disability, and HRQL. Body functions, activities, and participationwere assessed with a patient-report questionnaire specifically de-signed for this study, using the framework of the InternationalClassification of Functioning, Disability and Health. The ques-tionnaire consists of 38 ‘‘yes–no’’ questions about physical andpsychological functions, 12 questions about personal and instru-mental activities of daily living. The questionnaire also gatherssociodemographic information, including household, work, andstudies, and the need of support (personal, economical, or techni-cal) and information on comorbidities, medications, smoking, al-cohol, and drug abuse.
HRQL was assessed with the Short Form-36 Health Survey (SF-36), a widely used health outcome measure, validated for the TBI
Identified = 419
All patients with TBI admitted to NICU, Sahlgrenska
University Hospital between Jan 1st 1999 – Dec 31st 2002
Eligible = 131
Severe TBI(GCS score of < 8)
16 - 65 years of age
Survival to discharge from the NICU
Living in the VästraGötaland region
Not included = 288
Included = 51
Patients tested and interviewed
2 – 10 years after the TBI
Data from the acute settings
gathered retrospectively
Loss to follow up = 80
24 died before follow up
17 declined participation
37 did not respond to invitation
2 could not be located
FIG. 1. Flow chart of derivation of cohort.
272 ULFARSSON ET AL.

population.34 The 36 questions are designed to measure patient-reported health-related functioning and well-being along eightsubscales. The scales range is 0–100 (worst to best). Despite theordinal nature of the SF-36, it has been recommended that thesubscales of the SF-36 be aggregated into summary scores thatrepresent the two main dimensions of health: the physical com-ponent summary and the mental component summary, calculated asweighted sums of the subscales scores.34
Another outcome measure was the eight-point Glasgow Out-come Scale–Extended (GOS-E), in which the specifically designedquestionnaire was interpreted in light of the results of the physicalexamination and medical history, according to the study protocolobtained by a physician specialized in endocrinology or rehabili-tation medicine.35 The physician completed the questionnaires byinterviewing the patient, or if that was not possible, a relative orpersonal assistant of the patient.
Anterior and posterior pituitary hormonal testing
All patients arrived in the morning after fasting since midnight.Fasting blood samples were obtained between 8 and 9 a.m. for testsof anterior pituitary function, including free thyroxine (f-T4),thyroid stimulating hormone (TSH), cortisol, adrenocorticotrophichormone (ACTH), testosterone (males), estrogen (females), sexualhormone binding globulin (SHBG), luteinizing hormone (LH),follicle-stimulating hormone (FSH), prolactin, insulin-like growthfactor-1 (IGF-1) and GH in connection to an arginine-growthhormone-releasing hormone (arginine-GHRH) stimulation test.Urine osmolality and history of increased thirst and/or increasedurine volumes were obtained for all patients, and a history ofmenstrual status was obtained for all females.
Arginine-GHRH stimulation test. A bolus dose of GHRH1 lg/kg (maximum 100 lg) was given intravenously, followed byan infusion of arginine 0.5 g/kg (maximum dose 30 g). Samples forserum GH were taken at - 15, 0, + 15, 30, 45, 60, and 90 min. Themaximal GH-response was evaluated according to the patient’sbody mass index (BMI) level and was considered subnormal if theGH maximum level was < 11.5 lg /L (BMI < 25 kg/m2), < 8.5 lg /L(BMI 25–30) and < 4.2 lg /L (BMI > 30).
Co-syntropin stimulation test. If the initial serum cortisollevel was < 350 nmol/L, a follow-up co-syntrophin stimulation testwith ACTH (0.25 mg sc) was performed at a later occasion. Amaximal cortisol response < 500 nmol/L at + 30 min or + 60 minwas then considered subnormal.
BMI was calculated at follow-up. If available, BMI at the time ofinjury was obtained from the medical files.
Biochemical assays. Serum IGF1 concentration, until June2004, was determined using a hydrochloric acid–ethanol extractionradioimmunoassay (RIA) (Nichols Institute Diagnostics, San JuanCapistrano, CA). Inter- and intra-assay coefficients of variation(CVs) were 5.4 and 6.9% respectively, at a mean serum IGF1 levelof 126 lg/L, and 4.6 and 4.7% respectively, at a mean serum IGF1level of 327 lg/L. From June 2004 to August 2006, serum IGF1concentration was determined using a chemiluminescence immu-noassay (Nichols Advantage; Nichols Institute Diagnostics). FromSeptember 2006, serum IGF1 level was determined using an au-tomated chemiluminescent assay system (IMMULITE 2500, Di-agnostic Products Corp., Los Angeles, CA). The standard used forcalibration of the IGF1 assays was the World Health OrganizationNational Institute for Biological Standards and Control First In-ternational Reference Reagent (WHO NIBSC 1st IRR) 87/518throughout the study period.
Serum GH concentration, until January 2008, was determinedusing Wallac DELFIA human growth hormone (hGH) Perkin Elmer.
Inter- and intra-assay CVs were 14%, 7%, and 5%, respectively, at amean serum GH level of 0.5 mU/L, 10 mU/L, and 30 mU/L, re-spectively. From February 2008, serum GH concentration wasdetermined using Access2, Beckman Colulter. The inter-and intra-assay CVs were 10%, 7%, and 6%, respectively, at a mean serum GHlevel of 0.200 lg/lL, 3.0 lg/L, and 11 lg/L, respectively.
Serum SHBG concentration, until March 2006, was determinedusing IRMA, Orion Diagnostic. The inter- and intra-assay CVswere 7% and 5%, respectively, at a mean serum SHBG level of40 nmol/L, and 60 nmol/L, respectively. From April 2006, serumSHBG concentration was determined using Architect, AbbottScandinavia AB, with the inter-and intra assay CVs being 7%, 7%,and 9%, respectively, at a mean serum SHBG concentration of20 nmol/L, 40 nmol/L, and 100 nmol/L, respectively.
Serum LH concentration, until November 2004, was determinedusing IRMA, LH MAIA clone, Serono. The inter- and intra-assayCVs were 11%, 8%, and 7%, respectively, at a mean serum LHlevel of 2.6 IU/L, 8 IU/L, and 20 IU/L, respectively. FromDecember 2004, the serum LH concentration was determined usingArchitect, Abbott Scandinavia AB, with the inter-and intra assayCVs being 11%, 8%, and 7%, respectively, at a mean serum LHconcentration of 3 IU/L, 20 IU/L, and 60 IU/L, respectively.
Serum FSH concentration, until May 2004, was determinedusing RIA, DPC, Diagnostic Product Corporation. The inter- andintra-assay CVs were 9%, 6%, and 4%, respectively, at a meanserum FSH level of 9 IU/L, 20 IU/L/L, and 90 IU/L, respectively.From June 2004, the serum FSH concentration was determinedusing Architect, Abbott Scandinavia AB, with the inter-and intraassay CVs being 9%, 6%, and 6%, respectively, at a mean serumFSH concentration of 5 IU/L, 25 IU/L, and 75 IU/L, respectively.
From 2004, serum prolactin concentration was determined usingArchitect, Abbott Scandinavia AB. The inter- and intra-assay CVswere 6%, 6%, and 6%, respectively, at a mean serum prolactin levelof 200 mIU/L, 400 mIU/L, and 900 mIU/L, respectively. FromDecember 2009 the serum prolactin concentration was determinedin lg/L, still using Architect, Abbott Scandinavia AB, with theinter-and intra assay CVs being 6%, 6% and 6%, respectively, at amean serum prolactin concentration of 10 ug/L, 20 ug/L, and 45 ug/L,respectively.
Serum cortisol concentration from 2004 to August 2008 wasdetermined using Advia Centaur, Abbott Scandinavia AB. Theinter- and intra-assay CVs were 11%, 15%, and 13%, respectively,at a mean serum cortisol level of 100 nmol/L, 500 nmol/L, and800 nmol/L, respectively. From September 2008, the serum cortisolconcentration was determined using Molecular and Cobas 6000/8000, Roche Diagnostic Scandinavia, with the inter-and intra assayCVs being 11%, 15%, and 13%, respectively, at a mean serumcortisol concentration of 100 nmol/L, 500nmol/L, and 800 nmol/L,respectively.
From 2004, urine cortisol concentration was determined usingRIA, Orion Diagnostica. The inter- and intra-assay CVs were 14%,9%, and 11%, respectively, at a mean urine cortisol level of50 nmol/L, 100 nmol/L, and 400 nmol/L, respectively.
Plasma ACTH concentration was determined using ELSA-ACTH, a solid phase two site immunoradiometric assay (CisbioBioassays). The inter-assay CVs were 9.5% and 6.8%, respectively,at a mean plasma ACTH level of 2.4 pmol/L and 112 pmol/L, re-spectively, and the intra-assay CVs were 5.8 % and 3.7% at2.8 pmol/L and 95 pmol/l, respectively.
Serum free T4 concentration from 2004 to May 2005, was de-termined using Architect, Abbott Scandinavia AB. The inter- andintra-assay CVs were 10%, 10%, and 9%, respectively, at a meanserum free T4 level of 6 pmol/L, 12 pmol/L, and 28 pmol/L, re-spectively. From June 2005, the serum free T4 concentration wasdetermined using Molecular and Cobas 6000/8000, Roche Diag-nostic Scandinavia, with the inter-and intra assay CVs being 10%,10%, and 9%, respectively, at a mean serum free T4 concentrationof 6 pmol/L ug/L , 12 pmol/L, and 28 pmol/L, respectively.
POSTTRAUMATIC HYPOPITUITARISM: LONG-TERM OUTCOME 273

Serum TSH concentration from 2004 to May 2005, was deter-mined using Architect, Abbott Scandinavia AB. The inter- andintra-assay CVs were 7%, 6%, and 5%, respectively, at a meanserum TSH level of 0,4 mIU/L, 6 mIU/L, and 28 mIU/L, respec-tively. From June 2005, the serum TSH concentration was deter-mined using Molecular and Cobas 6000/8000, Roche DiagnosticScandinavia, with the inter-and intra assay CVs being 7%, 6%, and5%, respectively, at a mean serum TSH concentration of 0.4 mIU/L,6 mIU/L, and 28 mIU/L, respectively.
Serum testosterone concentration from 2004 to August 2008,was determined using Advia Centaur, Scandinavia AB. The inter-and intra-assay CVs were 10%, 10%, and 10%, respectively, at amean serum testosterone level of 3 nmol/L, 15 nmol/L, and25 nmol/L, respectively. From September 2008, the serum testos-terone concentration was determined using Access 2, BeckmanCoulter, with the inter-and intra assay CVs being 10%, 10%, and10%, respectively, at a mean serum testosterone concentration of5 nmol/L, 20 nmol/L, and 40 nmol/L, respectively.
Serum estrogen concentration from 2004 to 2008, was deter-mined using RIA, DiaSorin. The inter- and intra-assay CVs were16% and 10%, respectively, at a mean serum estrogen level of0.04 nmol/L and 0.4nmol/L, respectively. From 2009, the serumestrogen concentration was determined using Architect, AbbottScandinavia AB, with the inter-and intra assay CVs being 16% and10%, respectively, at a mean serum estrogen concentration of121 pmol/L and 2047 pmol/L, respectively.
Statistical analysis
Patients were categorized as being deficient or not in one or morehormonal axes, and functioning, disability, and health in the twogroups were compared. All statistical analysis was performed withPASW (Chicago, IL), version 18.0. Factor analysis was used toanalyze data from the specifically designed questionnaire on func-tional impairment and activity limitation. Principal componentsanalysis with Varimax rotation based on the correlation matrix wasused to make informed decisions on reducing the number of vari-ables, while retaining as many variables as needed to describe per-formance and dependency. Principal component analysis gives thenumber of variables (components) needed to capture most of thevariance in the original data set. The determination of the specificvariables to be extracted is both a statistical and a qualitative decisionof the researcher. The correlation matrix was used to determinewhich variables clustered together in a meaningful way, and maymeasure aspects of the same underlying dimension (factor). Com-ponents were extracted according to Kaiser’s criterion; therefore, thevariables with loading values > 0.6 were extracted from the rotatedcomponent matrix. Fisher’s exact test and independent samples t testwere used to compare groups with and without hormonal deficit. Todetermine whether hormonal status independently predicted out-come, multivariate analyses were performed; multiple linear re-gression was used to control for the outcome predictors of injuryseverity (e.g., clinical status, age, and CT characteristics) and forgender, BMI, epilepsy, alcoholism, and drug abuse
Ethics
The study was approved by the regional ethical review board ofthe University of Gothenburg. The aim of the study was carefullyexplained to the patients at the time of their inclusion, and again atthe time of the patient assessment. Informed consent was obtainedfrom each patient or the next of kin.
Results
Hormone deficiency
There were 51 patients in the study (13 females and 38 males). A
pituitary insufficiency was diagnosed in 14 (1 woman, 27.5%). All
hypopituitary patients had isolated deficiencies; 11 (21.6%) had
GH deficiency, 2 (both men, 3.9%) had gonadotrophic deficiency,
and 1 (a man, 2%) had a thyrotrophic deficiency.
Three patients (one with GH-deficiency and two with a normal
pituitary function) had subnormal IGF-1 levels. Two patients had a
mildly elevated serum prolactin concentration (491 and 541 mIU/L)
with otherwise normal hormone levels. Three patients with low
serum cortisol levels underwent a co-syntropin stimulation test with
a concomitant normal rise of serum cortisol in all cases.
Comorbidity and sociodemographic and injurycharacteristics
A pituitary insufficiency was found in one third of the men, but
in only 1 of 13 women (Table 1). Patients with GHD at follow-up
were older at the time of injury (Table 1). This correlation persisted
after we controlled for possible effect of gender, BMI, and injury
severity (R2 change = 0.12, p = 0.015). Patients with GHD were
more often overweight and had a higher BMI at the time of injury
than those without GHD (Table 1). The most common causes of
TBI were traffic accidents (53%), falls (29%), and assault (12%).
No differences were found in the causes of TBI between the groups.
Patients with hormonal deficiencies at follow-up had a more severe
TBI according to the CRASH prognostic model at the time of
injury; however, this difference was not significant (Table 1).
Functioning and quality of life
There were no statistical differences in patient-reported quality
of life measured by the SF-36 in patients with and those without
pituitary deficiency (Table 2). Interestingly, when multivariate
analyses were performed with multiple linear regression control-
ling for other outcome predictors, PTHP and GHD partly explained
a better global outcome measured by GOS-E even though the
fraction of variance explained was small (Table 3).
Patients with or without hypopituitarism showed no statistically
significant differences in perceived problems with cognitive,
emotional, or physical functions, dependence in activities, and
participation in work (Tables 4 and 5). PTHP and BMI were sig-
nificantly associated at follow-up but not at the time of injury
(Table 5). Patients with PTHP and within that group, patients with
GHD, were more often overweight at the time of follow-up. The
groups did not differ in weight gain after trauma. When multivar-
iate analyses were performed, PTHP partly explained a higher
BMI, although the fraction of variance explained is small (Table 3).
TBI patients with PTHP, and especially those with GHD, more
often had cardiovascular disease or diabetes mellitus (Table 5). No
association was found between PTHP and smoking, alcoholism,
drug abuse, epilepsy, or use of antiepileptic drugs (Table 5).
Discussion
In contrast to most previous studies of PTHP and outcome, our
findings in this study do not support the hypothesis that PTHP
causes disability and decreased quality of life in patients with se-
vere TBI.18,20–26,28,29 Our TBI patients with hypopituitarism did
not report worse psychological, cognitive, or motor functions, all of
which are important predictors of activity level and participation. In
our study approximately 25% of the patients had PTHP, most
commonly deficiencies of GH and gonadotrophins, which is in
accordance with the prevalence published in previous studies.14,16
All of our patients had a severe TBI and received similar acute
care in a modern NICU at a university hospital, where all severe
274 ULFARSSON ET AL.

TBI patients are admitted within the Vastra Gotaland region. For
this relatively homogenous group of patients, we were able to
provide a valid comparison of injury characteristics as outcome
predictors versus hormonal status by combining the predictive
value of some of the clinical parameters and CT findings into the
validated and generalizable CRASH prognostic model of TBI.
Predictors of patient injury severity, including age, were con-
trolled for, as were gender, substance abuse, epilepsy, and BMI,
allowing an estimation of hormonal status as an independent
outcome predictor.
Table 1. Demographic Data, BMI, and Injury Characteristics of the Patients at the Time of the Traumatic Brain Injury
All patients(n = 51)
PTHP(n = 14)
No PTHP(n = 37)
95% CI /p valuea
GHD(n = 11)
No GHD(n = 40)
95% CI /p valuea
Age (yr) 37.9 (16–64) 48.3 (29–63) 34.1 (16–64) 4.9–23.6 52.3 (34–63) 34.0 (16–64) 8.5 – 28.0b
Gender 13 F/38 M 1 F/13 M 12 F/25 M p = 0.08 1 F/10 M 12 F/28 M p = 0.25BMI (n = 40) 24.0 (18–29) 25.3 (21–28) 23.5 (18–29) - 4.1–0.46 25.8 (23–28) 23.5 (18–29) 0.7–4.0b
BMI > 25 16/40 (40%) 7/10 (70%) 9/30 (30%) p = 0.06 7/9 (78%) 9/31 (29%) p = 0.02b
RLS (1–8) 5.2 (4–8) 5.4 (4–8) 5.1 (4–8) - 1.1–0.54 5.4 (4–8) 5.2 (4–8) - 1.1–0.72Pathological pupil (n = 50) 14 (28%) 4 (29%) 10/36 (28%) p = 1.00 2 (18%) 12/39 (31%) p = 0.71Extracranial injury 24 (47%) 7 (50%) 17 (46%) p = 1.00 5 (46%) 19 (48%) p = 1.00
CT findingsSkull fracture 27 (53%) 9 (64%) 18 (49%) p = 0.36 8 (73%) 19 (48%) p = 0.18General edema 31 (61%) 9 (64%) 22 (60%) p = 1.00 6 (55%) 25 (63%) p = 0.73Petechiae 41 (80%) 10 (71%) 31 (84%) p = 0.43 8 (73%) 33 (83%) p = 0.67Obliterated cisterns 22 (43%) 7 (50%) 15 (41%) p = 0.75 5 (46%) 17 (43%) p = 1.00Midline shift (n = 50) 15 (30%) 6 (43%) 9/36 (25%) p = 0.31 5 (46%) 10/39 (26%) p = 0.27SAH 18 (35%) 6 (43%) 12 (32%) p = 0.53 6 (55%) 12 (30%) p = 0.67Unevacuated hematoma 32 (63%) 9 (64%) 23 (62%) p = 1.00 7 (64%) 25 (63%) p = 1.00Evacuated hematoma 17 (33%) 7 (50%) 10 (27%) p = 0.18 5 (46%) 12 (30%) p = 0.47
Unfavorable outcome riskc 63.1% 71.5% 60.0% - 26.3 - 3.2 74.0% 60.0% - 29.5–2.3Unfavorable outcome
risk > 75%c23 (45%) 9 (64%) 14 (38%) p = 0.12 7 (64%) 16 (40%) p = 0.19
The patients are categorized as pituitary deficient or not and GH deficient or not, at follow up, 2 – 10 years after the injury. Data are given as mean(range) or absolute number (%).
a95% confidence interval of the difference between the groups/p-value.bA significant difference between the groups.cRetrospectively analyzed, according to the CRASH prognostic model. Unfavorable outcome, Glasgow Outcome Scale–Extended score 1–4.PTHP, post-traumatic hypopituitarism; GHD, growth hormone deficiency; M, male; F, female; BMI, body mass index; RLS, Reaction Level Scale;
SAH, subarachnoidal hemorrhage; CRASH, Corticosteroid Randomization after Significant Head Injury.
Table 2. Outcome Measured by GOS-E and SF- 36 at the Time of Follow-up, 2–10 Years after TBI
All (n = 51)PTHP
(n = 14)No PTHP(n = 37)
95% CI/p valuea
GHD(n = 11)
No GHD(n = 40)
95% CI/p valuea
Months to follow- up 68.0 (30–131) 74.0 (41–124) 66.0 (30–131) - 24.6–8.4 74.2 (41–124) 66.6 (30–131) - 25.6–10.4Age at follow-up (yr) 43.7 (19–75) 54.7 (36–73) 49.6 (19–75) 5.2–24.9b 58.6 (42–73) 39.6 (19–75) 8.7–29.0b
GOS-E (1–8)c 5.3 (3–7) 5.3 (3–7) 5.3 (3–7) - 0.92–0.94 5.4 (3–7) 5.3 (3–7) - 1.1–0.9Unfavorable
outcome ( £ 4)13 (26%) 4 (29%) 9 (24%) p = 0.73 3 (27%) 10 (25%) p = 1.00
SF-36 (0–100)d (n = 51– 49)Physical health score 45.4 (17–61) 47.0 (30–61) 45.0 (17–60) - 8.7–5.3 48.6 (34–61) 44.5 (17–60) - 11.6–3.4Mental health score 42.7 (8–63) 44.8 (15–61) 42.0 (8–63) - 11.7–6.2 43.8 (15–61) 42.5 (8–63) - 11.0–8.3Physical functioning 74.8 (0–100) 75.9 (0–100) 74.3 (0–100) - 20.2–17.0 80.1 (28–100) 73.1 (0–100) - 27.7–12.5Role - physical 58 (0–100) 73.2 (0–100) 52.1 (0–100) - 49.3–7.0 72.8 (0–100) 53.8 (0–100) - 49.6–11.9Bodily pain 75.3 (12–100) 78.0 (31–100) 74.2 (12–100) - 21.8–14.1 81.7 (32–100) 73.4 (12–100) - 27.6–11.1General health 66.7 (15–100) 65.8 (25–100) 67.0 (15–100) - 13.5–15.9 68.4 (42–100) 66.2 (15–100) - 18.1–13.7Vitality 52.7 (0–100) 55.0 (20–100) 51.6 (0–95) - 18.7–11.9 58.2 (25–100) 51.0 (0–95) - 23.7–9.3Social functioning 71.5 (0–100) 76.8 (25–100) 79.4 (0–100) - 27.5–12.8 73.9 (25–100) 70.1 (0–100) - 25.0–18.9Role-emotional 68.7 (0–100) 80.1 (0–100) 63.9 (0–100) - 44.0–9.9 78.8 (0–100) 65.9 (0–100) - 42.4–16.5Mental health 71.5 (12–100) 68.9 (28–96) 71.1 (12–100) - 12.1–16.7 69.5 (28–100) 70.8 (12–100) - 14.2–17.0
Patients are categorized on as pituitary deficient or not, and GH deficient or not, at follow up. Data on follow-up time and age are given as median(range). Data measured by GOS-E and SF-36 are given as mean (range) or absolute number (%).
a95% confidence interval of the difference between the groups/p-value.bSignificant difference between the groups.c1 = dead, 2 = vegetative state, 3 = lower severe disability, 4 = upper severe disability, 5 = lower moderate disability, 6 = upper moderate disability,
7 = lower good recovery, 8 = upper good recovery.dHigher scores indicate a better health-related quality of life.PTHP, post-traumatic hypopituitarism; GHD, growth hormone deficiency; GOS-E, Glasgow Outcome Scale -Extended; SF-36; Short Form Health Survey-36.
POSTTRAUMATIC HYPOPITUITARISM: LONG-TERM OUTCOME 275

The results showed no significant correlation between hypopi-
tuitarism and patient-reported quality of life and functioning in the
severe TBI patients.
Changes in outcome can continue for many years after TBI, and
many factors, possibly including pituitary function, may influence
the global outcome in patients with TBI.3,4,6,36 The time from in-
jury to follow-up in this study is much longer than in most studies
linking PTHP to disability and decreased quality of life (2–10 years
versus 6 months to 2 years) and might partially explain the dif-
ference in outcome. However, in a recent study of TBI patients with
persistent cognitive and/or behavioral disorders who underwent
cognitive testing and were followed as long as our patients, cog-
nitive function and activity performance were worse in patients
with PTHP.22
There are discrepancies in the limited data on PTHP and out-
come. Several studies have described worse outcomes in patients
with hypopituitarism, but these findings were not confirmed in
others.17,19,27 Although associations are interesting, they do not
Table 3. Parameter Measurements of Pituitary Function and Somatotroph Axis Function and Their pValues
Explanatory variables at follow-up
Post-traumatic hypopituitarism Growth hormone deficiency
Unstandardizedcoefficients
Unstandardizedcoefficients
Outcome at follow-up B Standard error p-value
Fraction ofvariance explained
(R2 change) B Standard error p-value
Fraction ofvariance explained
(R2 change)
BMI 2.67 0.62 < 0.01a 0.066 1.03 0.91 0.27 0.008Physical functions 0.37 0.62 0.55 0.005 0.045 0.68 0.95 < 0.001Psychological functions - 0.17 0.60 0.77 0.002 0.237 0.65 0.72 0.003ADL - 1.68 1.32 0.21 0.031 - 1.88 1.44 0.20 0.033SF-36 Physical health score 5.09 4.08 0.22 0.032 7.24 4.39 0.11 0.054SF-36 Mental health score 2.76 5.39 0.61 0.006 0.28 5.91 0.96 < 0.001GOS-E 0.95 0.45 0.04 0.062 1.11 0.49 0.03 0.070
The results show how pituitary and somatotroph axis function explains the outcome measures when adjusted for gender, injury severity, age, epilepsy,,alcoholism and drug abuse. For BMI at follow-up we additionally adjusted for BMI at the time of injury.
aPituitary function partly explains a high BMI.BMI, body mass index; ADL, activities of daily living; SF-36, Short Form Health Survey-36; GOS-E, Glasgow Outcome Scale –Extended.
Table 4. Functioning, Disability, and Environmental Factors at the Time of Follow-up
MeasuresaAll
(n = 51)PTHP
(n = 14)No PTHP(n = 37)
95% CI /p valueb,c
GHD(n = 11)
No GHD(n = 40)
95% CI /p valueb,c
Functional impairmentGeneral 0–12 (n = 49) 4.3 (0–11) 4.9 (0–11) 4.0 (0–11) - 2.7–0.9 4.5 (0–11) 4.2 (0–11) - 2.2–1.8Physical 0–7 2.1 (0–7) 2.4 (0–7) 2.0 (0–6) - 1.7–0.9 1.8 (0–6) 2.1 (0–7) - 1.1–1.7
Psychological 0–5 2.3 (0–5) 2.6 (0–5) 2.2 (0–5) - 1.4–0.7 2.6 (0–5) 2.2 (0–5) - 1.6–0.7
Activity/particip limitatADL 0–12 (n = 48) 3.0 (0–12) 2.9 (0–10) 3.0 (0–12) - 2.2–2.5 2.5 (0–10) 3.1 (0–12) - 2.0–3.1P-ADL 0–7 (n = 50) 1.7 (0–7) 1.6 (0–6) 1.8 (0–7) - 1.3–1.7 1.5 (0–5) 1.8 (0–7) - 1.3–1.9I-ADL 0–5 (n = 49) 1.4 (0–5) 1.3 (0–5) 1.5 (0–5) - 0.9–1.3 1.1 (0–5) 1.5 (0–5) - 0.8–1.7Probl with ADL% 33 (69%) 12 (86%) 21/34 (62%) p = 0.17 10 (91%) 23/37 (62%) p = 0.14Not working% 30 (59%) 8 (57%) 22 (60%) p = 1.00 6 (55%) 24 (60%) p = 0.74Not working full time% 41 (80%) 12 (86%) 29 (78%) p = 0.71 9 (82%) 32 (80%) p = 1.00
Environmental factorsSingle (n = 50) 21 (42%) 6 (43%) 15/36 (42%) p = 1.00 3 (27%) 18/39 (46%) p = 0.31SupportPers/tech support% 22 (43%) 7 (50%) 15 (41%) p = 0.75 6 (55%) 16 (40%) p = 0.50
Major 18 (35%) 5 (36%) 13 (35%) p = 1.00 4 (34%) 14 (35%) p = 1.00Minor 7 (14%) 2 (14%) 5 (13%) p = 1.00 2 (18%) 5 (12%) p = 1.00
Economic supp syst% 39 (77%) 11 (79%) 28 (76%) p = 1.00 9 (82%) 31 (75%) p = 1.00
Data are given as mean (range) or absolute number (%). Patients are categorized as pituitary deficient or not, and GH deficient or not, at follow-up.aQuestionnaire specifically designed for the study, using the framework of International Classification of Functioning, Disability, and Health; clinical
examination. Higher scores denote more impairment or limitation.b95% confidence interval of the difference between the groups/p-value.cNot a significant difference between the groups.PTHP, post-traumatic hypopituitarism; GHD, growth hormone deficiency; P-ADL, personal activities of daily living; I-ADL, instrumental activities of
daily living.
276 ULFARSSON ET AL.

prove causality, and there may well be common risk factors for both
PTHP and impaired well-being.
Few studies used a similar approach to ours, examining the
relative contribution of the injury severity and PTHP to outcome.
One of them, relating neuropsychological complaints to pituitary
function and to CT scan findings at the time of injury, showed no
significant difference in neuropsychological complaints and HRQL
between the groups, measured with patient-reported question-
naires.17 The other studies described worse global and functional
outcome and HRQL in patients with PTHP than in those with
normal pituitary function.22,26,29
GHD is associated with a reduced HRQL37–39 However, it is
unclear whether pituitary dysfunction influences HRQL in TBI
patients. A few studies have reported a worse HRQL in patients
with PTHP, with poorer sleep and energy levels and an increased
sense of social isolation.18,23 Both prospective studies and cross-
sectional studies have described poorer HRQL in TBI patients with
GHD.18,23,25,29 All of these studies evaluated patients up to 1 year
after the injury.
Studies have now related PTHP to cognition and functional
outcome in TBI patients tested within 1 year or up to 2 years after
injury.20,21,28
TBI patients with GHD have been reported to experience greater
deficits in attention, executive functioning, memory, and emotion
than GH-sufficient TBI patients.21,22,28
Hypopituitarism is associated with an unfavorable body com-
position and lipid profile, features that tend to improve when rel-
evant insufficiencies are treated.40–43
Table 5. Disease, Symptoms and Signs at the Time of Follow-up
MeasuresaAll
(n = 51)PTHP
(n = 14)No PTHP(n = 37)
95%CI /p valueb
GHD(n = 11)
No GHD(n = 40)
95% CI /p valueb
Disease, sympt, signsFatigue 42 (82%) 12 (86%) 30 (81%) p = 1.00 10 (91%) 32 (80%) p = 0.67Irritability 23 (45%) 3 (21%) 20 (54%) p = 0.06 2 (18%) 21 (53%) p = 0.08Sleep disturbances 19 (37%) 6 (43%) 13 (35%) p = 0.75 4 (37%) 15 (38%) p = 1.00Concentration problems 37 (73%) 10 (71%) 27 (73%) p = 1.00 8 (73%) 29 (73%) p = 1.00Memory problem 36 (70%) 11 (79%) 25 (68%) p = 0.51 9 (82%) 27 (68%) p = 0.48Speech problem 23 (45%) 6 (43%) 17 (46%) p = 1.00 4 (36%) 19 (48%) p = 0.73Depression 25 (49%) 7 (50%) 18 (49%) p = 1.00 6 (54%) 19 (48%) p = 0.74Anxiety 17 (33%) 6 (43%) 11 (30%) p = 0.51 5 (46%) 12 (30%) p = 0.48Arm motor impairment 19 (37%) 5 (36%) 14 (38%) p = 1.00 3 (27%) 16 (40%) p = 0.51Leg motor impairment 18 (35%) 5 (36%) 13 (35%) p = 1.00 3 (27%) 15 (38%) p = 0.73Problem swallowing 6 (11%) 3 (21%) 3 (8%) p = 0.33 2 (18%) 4 (10%) p = 0.60Problem talking (n = 50) 17 (33%) 7 (50%) 10 (28%) p = 0.19 5 (46%) 12 (31%) p = 0.48Impaired touch sense 17 (33%) 5 (36%) 12 (32%) p = 1.00 3 (27%) 14 (35%) p = 0.73Dizziness 15 (29%) 6 (43%) 9 (24%) p = 0.30 5 (46%) 10 (25%) p = 0.26Visual impairment 17 (33%) 6 (43%) 11 (30%) p = 0.58 6 (55%) 11 (28%) p = 0.15Hearing impairment 18 (35%) 4 (29%) 14 (38%) p = 0.74 3 (27%) 15 (38%) p = 0.73Impaired smell sense 14 (28%) 4 (29%) 10 (27%) p = 1.00 4 (37%) 10 (25%) p = 0.47Headache (n = 50) 5 (10%) 2 (14%) 3 (8%) p = 0.61 0 (0%) 5 (13%) p = 0.58Other chronic pain 18 (35%) 5 (36%) 13 (35%) p = 1.00 3 (27%) 15 (38%) p = 0.73Diabetes/cardiovascular
disease11 (22%) 6 (43%) 5 (14%) p = 0.05c 6 (55%) 5 (13%) p = 0.01c
Epilepsy 10 (20%) 4 (29%) 6 (16%) p = 0.43 1 (9.1%) 9 (23%) p = 0.43Alcoholism 11 (22%) 5 (36%) 6 (16%) p = 0.15 3 (27%) 8 (20%) p = 0.69Substance abused 14 (28%) 6 (43%) 8 (22%) p = 0.17 3 (27%) 11 (28%) p = 1.00Smoking 16 (31%) 4 (29%) 12(32%) p = 1.00 3 (27%) 13 (33%) p = 1.00Symptoms of hormonedeficiencye
33 (65%) 11 (79%) 22 (60%) p = 0.33 9 (82%) 24 (60%) p = 0.29
Gain weight(self reported)
21 (41%) 7 (50%) 14 (38%) p = 0.53 5 (46%) 16 (40%) p = 0.74
Gain weight (kg; n = 39) 2.9 ( - 13–21) 2.6 ( - 8–14) 3.1 ( - 13–20) - 4.7–5.7 2.6 ( - 8–14) 3.1( - 13–20) - 4.7–5.7Reduced libido (n = 50) 18 (35%) 7 (50%) 11 (31%) p = 0.33 6 (55%) 12 (31%) p = 0.17Impotence (men)
(n = 38)14 (37%) 6 (46%) 8 (32%) p = 0.49 5 (46%) 9 (32%) p = 0.45
Irregular menses(women) (n = 12)
1 (8%) 0 (0%) 1 (9%) p = 1.00 0 (0%) 1 (9%) p = 1.00
BMI (n = 50) 25.4 (19–42) 27.8 (23–42) 24.5 (19–31) 0.9–5.6c 26.9 (23–32) 24.9 (19–42) - 4.5–6.1BMI > 25 (n = 50) 22 (43%) 10 (77%) 12 (32%) p = 0.01c 9 (82%) 13/39 (33%) p = 0.01c
Data are given as mean (range) or absolute number (%).The patients are categorized as pituitary deficient or not and GH deficient or not, at follow-up.aQuestionnaire specifically designed for the study, using the framework of ICF; clinical examination.b95% confidence interval of the difference between the groups/p-value.cA significant difference between the groups.dAlcoholism and drug abuse.eGaining weight, reduced libido, impotence, and irregular menstrual cycles.PTHP, post-traumatic hypopituitarism; GHD, growth hormone deficiency; BMI, body mass index; M, male; F, female.
POSTTRAUMATIC HYPOPITUITARISM: LONG-TERM OUTCOME 277

Our study confirms the findings of previous studies that the mean
BMI was greater for the hormonally deficient patients than for those
without hormonal deficiency at the time of follow-up. Studies of
body composition reported that BMI, total abdominal fat mass, and
LDL cholesterol and triglycerides were higher in TBI patients with
PTHP.20,23,29,44
Our findings suggest that pituitary function partially explains a
high BMI in this group of patients even though the fraction of
variance explained is small. Furthermore, the patients with PTHP in
our study were more often overweight at the time of follow-up.
Many factors may act as confounders and contribute to these
findings, including physical activity, appetite and food intake,
medications, and common comorbidities of TBI such as epilepsy,
alcoholism, and drug abuse, partly controlled for in the current
study. In addition, it has been established that spontaneous and
stimulated secretion of GH is lower in obese than in normal weight
individuals, and even though specific BMI-related cutoff limits
were assumed in our study, the patients with a high BMI might have
a higher risk of a false- positive test for PTHP caused by metabolic
changes.45–47
The fact that most of the patients with PTHP were overweight
suggests that BMI in TBI patients should be monitored more clo-
sely, and that greater effort should be made to help them lose
weight. GH replacement therapy could be an important supplement
to other interventions to reduce weight (e.g., lifestyle changes, a
healthier diet, and increased physical training).
The TBI patients with GHD in our study were older than those
with normal GH secretions. This is an interesting finding, which
indicates a possible predisposing factor for the development of
GHD after TBI. Discrepancies in published data on the association
between age and PTHP suggest that this issue needs to be studied
more extensively.23,29 Hypopituitarism increases the risk of pre-
mature death, mainly because of an increased prevalence of car-
diovascular disease.48,49 GHD is the most likely explanation for
this finding.50–52 An important finding in our study was that the TBI
patients with PTHP, and especially those with GHD, more often
had cardiovascular disease and/or diabetes mellitus. These findings
linking PTHP to important health issues that might cause functional
impairments and premature death suggest that even though the
study did not support its effects on functional outcome and quality
of life as measured here, a longer follow-up time would be needed
to measure the effects of these health issues.
Limitations
A limitation of the study was the relatively small sample size.
The patients who were excluded or lost to follow-up might have
differed from the study population in regard to injury severity,
comorbidity, psychosocial status, and, possibly, even hormonal
status. Therefore, our findings cannot be generalized to all patients
with severe TBI. However, multivariate analyses gave no indica-
tion of a worse functional outcome in our PTHP patients. Another
limitation of the study is that only a patient-report instrument was
used to measure functioning; therefore, the results are not as reli-
able as if both patient-reports and functional tests had been used.
Finally, the assessment of global outcome in our study included
functions, activities, participation, and HRQL. As hormonal status
was evaluated 2–10 years after the injury, we have not been able to
predict whether important determinants of global outcome, pre-
mature death, substance abuse, and serious illness that would hin-
der participation in our study, might be more common in patients
with PTHP.
Conclusion
Despite the homogeneous patient population, long follow-up
time, and consideration of injury severity as an outcome predictor,
this study did not confirm results from previous studies linking
PTHP to disability and decreased quality of life. Our study does
suggest that screening for PTHP might be restricted to specific
subgroups such as overweight patients. The finding that patients
with PTHP are often overweight needs to be studied more
extensively.
Acknowledgments
This study was based on data from the Sahlgrenska University
Hospital. The authors acknowledge research support from ALF
Goteborg, AFA Insurance, Sten A Olsson Foundation for Research
and Culture, the Swedish Cancer & Traffic Injury Society Fund,
and the Lansforsakringar Alliance. The authors gratefully ac-
knowledge the participants and their next of kin for their partici-
pation in the study. They also thank Ingrid Morberg at the
Rehabilitation Medicine, Olof Ehn and Olof Strandberg at the
Department of Endocrinology, and Helene Seeman-Lodding at the
NICU, the Sahlgrenska University Hospital, for their support and
practical assistance, as well as Anna Ekmans for statistical advice.
Author Disclosure Statement
Thord Rosen has received honoraria for lecturing for the phar-
maceutical companies Pfizer, Novo Nordisk, and Bayer Schering
Pharma. He has received a grant from Pfizer and the insurance
company Lansforsakringar Alliance. No competing financial in-
terests exist for Trandur Ulfarsson, Gudni Arnar Gudnason,
Christian Blomstrand, Katharina Stibrant Sunnerhagen, Asa
Lundgren-Nilsson, and Michael Nilsson.
References
1. Andelic, N., Sigurdardottir, S., Schanke, A.K., Sandvik, L., Sveen, U.,and Roe, C. (2010). Disability, physical health and mental health 1year after traumatic brain injury. Disabil. Rehabil. 32, 1122–31.
2. Ruttan, L., Martin, K., Liu, A., Colella, B., and Green, R.E. (2008).Long-term cognitive outcome in moderate to severe traumatic braininjury: a meta-analysis examining timed and untimed tests at 1 and 4.5or more years after injury. Arch. Phys. Med. Rehabil. 89, Suppl. 12,S69–76.
3. Whitnall, L., McMillan, T.M., Murray, G.D., and Teasdale, G.M.(2006). Disability in young people and adults after head injury: 5–7year follow up of a prospective cohort study. J. Neurol. Neurosurg.Psychiatry 77, 640–645.
4. Huang, S.J., Ho, H.L., and Yang, C.C. (2010). Longitudinal outcomesof patients with traumatic brain injury: a preliminary study. Brain Inj.24, 606–615.
5. Dikmen, S.S., Machamer, J.E., Powell, J.M., and Temkin, N.R.(2003). Outcome 3 to 5 years after moderate to severe traumatic braininjury. Arch. Phys. Med. Rehabil. 84, 1449–1457.
6. Sendroy–Terrill, M., Whiteneck, G.G., andBrooks, C.A. (2010).Aging with traumatic brain injury: cross-sectional follow-up of peoplereceiving inpatient rehabilitation over more than 3 decades. Arch.Phys. Med. Rehabil. 91, 489–497.
7. Turner–Stokes, L. (2008). Evidence for the effectiveness of multi-disciplinary rehabilitation following acquired brain injury: a synthesisof two systematic approaches. J. Rehabil. Med. 40, 691–701.
8. Agha, A., Rogers, B., Sherlock, M. S., O’Kelly, P., Tormey, W.,Phillips, J., and Thompson, C.J. (2004). Anterior pituitary dysfunctionin survivors of traumatic brain injury. J. Clin. Endocrinol. Metab. 89,4929–4936.
9. Agha, A., Sherlock, M., Phillips, J., Tormey, W., and Thompson, C.J.(2005). The natural history of post-traumatic neurohypophysial dys-function. Eur. J. Endocrinol. 152, 371–377.
278 ULFARSSON ET AL.

10. Klose, M., Juul, A., Poulsgaard, L., Kosteljanetz, M., Brennum, J., andFeldt–Rasmussen, U. (2007). Prevalence and predictive factors ofpost-traumatic hypopituitarism. Clin. Endocrinol. (Oxf.) 67, 193–201.
11. Leal–Cerro, A., Flores, J.M., Rincon, M., Murillo, F., Pujol, M.,Garcia–Pesquera, F., Dieguez, C., and Casanueva, F.F. (2005). Pre-valence of hypopituitarism and growth hormone deficiency in adultslong-term after severe traumatic brain injury. Clin. Endocrinol.(Oxf.),. 62, 525–532.
12. Lieberman, S.A., Oberoi, A.L., Gilkison, C.R., Masel, B.E., and Ur-ban, R.J. (2001). Prevalence of neuroendocrine dysfunction in patientsrecovering from traumatic brain injury. J. Clin. Endocrinol. Metab..86, 2752–2756.
13. Popovic, V., Pekic, S., Pavlovic, D., Maric, N., Jasovic–Gasic, M.,Djurovic, B., Medic Stojanoska, M., Zivkovic, V., Stojanovic, M.,Doknic, M., Milic, N. , Djurovic, M., Dieguez, C., and Casanueva,F.F. (2004). Hypopituitarism as a consequence of traumatic brain in-jury (TBI) and its possible relation with cognitive disabilities andmental distress. J. Endocrinol. Invest. 27, 1048–1054.
14. Schneider, H.J., Schneider, M., Kreitschmann–Andermahr, I., Tuschy,U., , Wallaschofski, H., Fleck, S. Faust, M., Renner, C.I., Kopczak, A.,Saller, B., Buchfelder, M., Jordan, M., and Stalla, G.K. (2011).Structured assessment of hypopituitarism after traumatic brain injuryand aneurysmal subarachnoid hemorrhage in 1242 patients: the Ger-man interdisciplinary database. J. Neurotrauma 28, 1693–1698.
15. Tanriverdi, F., Senyurek, H., Unluhizarci, K., Selcuklu, A., Casa-nueva, F.F., and Kelestimur, F. (2006). High risk of hypopituitarismafter traumatic brain injury: a prospective investigation of anteriorpituitary function in the acute phase and 12 months after trauma. J.Clin. Endocrinol. Metab.. 91, 2105–2111.
16. Blair, J.C. (2010). Prevalence, natural history and consequences ofposttraumatic hypopituitarism: a case for endocrine surveillance. Br. J.Neurosurg. 24, 10–17.
17. Wachter, D., Gundling, K., Oertel, M.F., Stracke, H., and Boker, D.K.(2009). Pituitary insufficiency after traumatic brain injury. J. Clin.Neurosci.. 16, 202–208.
18. Srinivasan, L., Roberts, B., Bushnik, T., Englander, J., Spain, D.A.,Steinberg, G.K., Ren, L., Sandel, M.E., Al-Lawati, Z., Teraoka, J.,Hoffman, A.R., and Katznelson, L. (2009). The impact of hypopitu-itarism on function and performance in subjects with recent history oftraumatic brain injury and aneurysmal subarachnoid haemorrhage.Brain Inj.. 23, 639–648.
19. Pavlovic, D., Pekic, S. , Stojanovic, M., Zivkovic, V. , Djurovic, B.,Jovanovic, V., Miljic, N., Medic–Stojanoska, M., Doknic, M.,Miljic, D., Djurovic, M., Casanueva, F., and Popovic, V. (2010).Chronic cognitive sequelae after traumatic brain injury are notrelated to growth hormone deficiency in adults. Eur. J. Neurol. 17,696–702.
20. Park, K.D., Kim, D.Y., Lee, J.K., Nam, H.S., and Park, Y.G. (2010).Anterior pituitary dysfunction in moderate-to-severe chronic traumaticbrain injury patients and the influence on functional outcome. BrainInj. 24, 1330–1335.
21. Leon–Carrion, J., Leal–Cerro, A., Cabezas, F.M., Atutxa, A.M., Go-mez, S.G., Cordero, J.M., Moreno, A.S. , Ferrari, M.D., and Dom-inguez–Morales, M.R. (2007). Cognitive deterioration due to GHdeficiency in patients with traumatic brain injury: a preliminary report.Brain Inj. 21, 871–875.
22. Kozlowski Moreau, O., Yollin, E., Merlen, E. , Daveluy, W., andRousseaux, M. (2012). Lasting pituitary hormone deficiency aftertraumatic brain injury. J. Neurotrauma 29, 81–89.
23. Klose, M., Watt, T., Brennum, J., and Feldt–Rasmussen, U. (2007).Posttraumatic hypopituitarism is associated with an unfavorable bodycomposition and lipid profile, and decreased quality of life 12 monthsafter injury. J. Clin. Endocrinol. Metab. 92, 3861–3868.
24. Klose, M., Juul, A., Struck, J., Morgenthaler, N.G., Kosteljanetz, M.,and Feldt–Rasmussen, U. (2007). Acute and long-term pituitary in-sufficiency in traumatic brain injury: a prospective single-centre study.Clin Endocrinol (Oxf.) 67, 598–606.
25. Kelly, D.F., McArthur, D.L., Levin, H., Swimmer, S., Dusick, J.R.,Cohan, P., Wang, C., and Swerdloff, R. (2006). Neurobehavioral andquality of life changes associated with growth hormone insufficiencyafter complicated mild, moderate, or severe traumatic brain injury. J.Neurotrauma 23, 928–942.
26. Jeong, J.H., Kim, Y.Z., Cho, Y.W., and Kim, J.S. (2010). Negativeeffect of hypopituitarism following brain trauma in patients withdiffuse axonal injury. J. Neurosurg. 113, 532–538.
27. Bushnik, T., Englander, J., andKatznelson, L. (2007). Fatigue afterTBI: association with neuroendocrine abnormalities. Brain Inj. 21,559–566.
28. Bondanelli, M., Ambrosio, M.R., Cavazzini, L., Bertocchi, A., Zatelli,M.C. Carli, A., Valle, D., Basaglia, N., and Uberti, E.C. (2007).Anterior pituitary function may predict functional and cognitive out-come in patients with traumatic brain injury undergoing rehabilitation.J. Neurotrauma 24, 1687–1697.
29. Bavisetty, S., McArthur, D.L., Dusick, J.R., Wang, C., Cohan, P.,Boscardin, W.J., Swerdloff, R., Levin, H., Chang, D.J., Muizelaar, J.P.,and Kelly, D.F. (2008). Chronic hypopituitarism after traumatic braininjury: risk assessment and relationship to outcome. Neurosurgery 62,1080–1094.
30. Starmark, J.E., Stalhammar, D., and Holmgren, E. (1988).The Reac-tion Level Scale (RLS85). Manual and guidelines. Acta Neurochir.(Wien), 91, 12–20.
31. Walther, S.M., Jonasson, U., and Gill, H. (2003). Comparison of theGlasgow Coma Scale and the Reaction Level Scale for assessment ofcerebral responsiveness in the critically ill. Intensive Care Med. 29,933–938.
32. Starmark, J.E., Stalhammar, D., Holmgren, E., and Rosander, B.(1988). A comparison of the Glasgow Coma Scale and the ReactionLevel Scale (RLS85). J Neurosurg. 69, 699–706.
33. Perel, P., Arango, M., Clayton, T., Edwards, P., Komolafe, E. , Poc-cock, S., Roberts, I., Shakur, H., Steyerberg, E., and Yutthakasemsunt,S. (2008). Predicting outcome after traumatic brain injury: practicalprognostic models based on large cohort of international patients. BMJ336, 425–429.
34. Sullivan, M., Karlsson, J., Taft, C., and Ware, J.E. (2002). Swedishmanual and interpretation guide [in Swedish]. Sahlgrenska sjukhuset,Sektionen for vardforskning: Goteborg.
35. Jennett, B., Snoek, J., Bond, M.R., and Brooks, N. (1981). Disabilityafter severe head injury: observations on the use of the GlasgowOutcome Scale. J. Neurol. Neurosurg. Psychiatry 44, 285–293.
36. McMillan, T.M., Teasdale, G.M., Weir, C.J., and Stewart, E. (2011).Death after head injury: the 13 year outcome of a case control study. J.Neurol. Neurosurg. Psychiatry 82, 931–935.
37. Moock, J., Albrecht, C., Friedrich, N., Volzke, H., Nauck, M.,Koltowska–Haggstrom, M., Kohlmann, T., and Wallaschofski, H.(2009). Health-related quality of life and IGF-1 in GH-deficient adultpatients on GH replacement therapy: analysis of the German KIMS dataand the Study of Health in Pomerania. Eur. J. Endocrinol. 160, 17–24.
38. Olczyk, J., Kokoszko, A. , Lewinski, A., and Karbownik–Lewinska,M. (2010). Quality of life and exercise capacity in obesity and growthhormone deficiency. Neuro Endocrinol. Lett. 31, 700–707.
39. Wallymahmed, M.E., Foy, P., and MacFarlane, I.A. (1999). The qualityof life of adults with growth hormone deficiency: comparison with dia-betic patients and control subjects. Clin Endocrinol (Oxf.) 51, 333–338.
40. Bengtsson, B.A., Eden, S., Lonn, L., Kvist, H., Stokland, A., Lindstedt,G., Bosaeus, I., Tolli, J., Sjostrom, L., and Isaksson, O.G. (1993).Treatment of adults with growth hormone (GH) deficiency with re-combinant human GH. J. Clin. Endocrinol. Metab. 76, 309–317.
41. Carroll, P.V., Christ, E.R., Bengtsson, B.A., Carlsson, L., Chris-tiansen, J.S., Clemmons, D., Hintz, R., Ho, K., Laron, Z., Sizonenko,P., Sonksen, P.H., Tanaka, T., and Thorne, M. (1998). Growth hor-mone deficiency in adulthood and the effects of growth hormone re-placement: a review. Growth Hormone Research Society ScientificCommittee. J. Clin. Endocrinol. Metab. 83, 382–395.
42. Feldt–Rasmussen, U., Wilton, P., and Jonsson, P. (2004). Aspects ofgrowth hormone deficiency and replacement in elderly hypopituitaryadults. Growth Horm. IGF Res. 14, Suppl. A, S51–8.
43. Rosen, T., Bosaeus, I., Tolli, J., Lindstedt, G., and Bengtsson, B.A.(1993). Increased body fat mass and decreased extracellular fluidvolume in adults with growth hormone deficiency. Clin. Endocrinol.(Oxf.). 38, 63–71.
44. Kokshoorn, N.E., Smit, J.W. , Nieuwlaat, W.A., Tiemensma, J., Bis-schop, P.H., Groote Veldman, R., Roelfsema, F. , Franken, A.A.,Wassenaar, M.J. , Biermasz, N.R., Romijn, J.A., and Pereira, A.M.(2011). Low prevalence of hypopituitarism after traumatic brain in-jury: a multicenter study. Eur. J. Endocrinol. 165, 225–231.
45. Corneli, G., Di Somma, C., Baldelli, R., Rovere, S., Gasco, V., Croce,C.G., Grottoli, S., Maccario, M., Colao, A., Lombardi, G., Ghigo, E.,Camanni, F., and Aimaretti, G. (2005).The cut-off limits of the GHresponse to GH-releasing hormone-arginine test related to body massindex. Eur. J. Endocrinol. 153, 257–264.
POSTTRAUMATIC HYPOPITUITARISM: LONG-TERM OUTCOME 279

46. Pijl, H., Langendonk, J.G., Burggraaf, J., Frolich, M., Cohen, A.F.,Veldhuis, J.D., and Meinders, A.E. (2001). Altered neuroregulation ofGH secretion in viscerally obese premenopausal women. J. Clin.Endocrinol. Metab. 86, 5509–5515.
47. Veldhuis, J.D., Liem, A.Y., South, S., Weltman, A., Weltman, J.,Clemmons, D.A., Abbott, R., Mulligan, T., Johnson, M.L., Pincus, S.,et al. (1995). Differential impact of age, sex steroid hormones, andobesity on basal versus pulsatile growth hormone secretion in men asassessed in an ultrasensitive chemiluminescence assay. J. Clin. En-docrinol. Metab. 80, 3209–3222.
48. Tomlinson, J.W., Holden, N., Hills, R.K., Wheatley, K., Clayton,R.N., Bates, A.S., Sheppard, M.C., and Stewart, P.M. (2001). Asso-ciation between premature mortality and hypopituitarism. West Mid-lands Prospective Hypopituitary Study Group. Lancet 357, 425–431.
49. Rosen, T., and Bengtsson, B.A. (1990). Premature mortality due tocardiovascular disease in hypopituitarism. Lancet 336, 285–288.
50. Verhelst, J., and Abs, R. (2009). Cardiovascular risk factors in hy-popituitary GH-deficient adults. Eur. J. Endocrinol. 161, Suppl. 1.S41–49.
51. Rosen, T., Eden, S., Larson, G., Wilhelmsen, L., and Bengtsson, B.A.(1993). Cardiovascular risk factors in adult patients with growthhormone deficiency. Acta Endocrinol. (Copenh.) 129, 195–200.
52. Bengtsson, B.A. (1998). Untreated growth hormone deficiency ex-plains premature mortality in patients with hypopituitarism. GrowthHorm. IGF Res. 8, Suppl. A, 77–80.
Address correspondence to:
Trandur Ulfarsson, MD
Department of Rehabilitation Medicine
Sahlgrenska University Hospital
Box 30110
SE- 40043 Goteborg
Sweden
E-mail: [email protected]
280 ULFARSSON ET AL.
Copyright © 2022 FDOKUMEN