FUEL BEHAVIOUR AND MODELLING UNDER SEVERE ...
398
FUEL BEHAVIOUR AND MODELLING UNDER SEVERE TRANSIENT AND LOSS OF COOLANT ACCIDENT (LOCA) CONDITIONS
-
Upload
khangminh22 -
Category
Documents
-
view
0 -
download
0
Transcript of FUEL BEHAVIOUR AND MODELLING UNDER SEVERE ...

FUEL BEHAVIOUR AND MODELLING UNDER SEVERE TRANSIENT AND LOSS OF COOLANT ACCIDENT (LOCA) CONDITIONS

AFGHANISTANALBANIAALGERIAANGOLAARGENTINAARMENIAAUSTRALIAAUSTRIAAZERBAIJANBAHRAINBANGLADESHBELARUSBELGIUMBELIZEBENINBOLIVIABOSNIA AND HERZEGOVINABOTSWANABRAZILBULGARIABURKINA FASOBURUNDICAMBODIACAMEROONCANADACENTRAL AFRICAN
REPUBLICCHADCHILECHINACOLOMBIACONGOCOSTA RICACÔTE D’IVOIRECROATIACUBACYPRUSCZECH REPUBLICDEMOCRATIC REPUBLIC
OF THE CONGODENMARKDOMINICADOMINICAN REPUBLICECUADOREGYPTEL SALVADORERITREAESTONIAETHIOPIAFIJIFINLANDFRANCEGABONGEORGIAGERMANYGHANAGREECE
GUATEMALAHAITIHOLY SEEHONDURASHUNGARYICELANDINDIAINDONESIAIRAN, ISLAMIC REPUBLIC OF IRAQIRELANDISRAELITALYJAMAICAJAPANJORDANKAZAKHSTANKENYAKOREA, REPUBLIC OFKUWAITKYRGYZSTANLAO PEOPLE’S DEMOCRATIC
REPUBLICLATVIALEBANONLESOTHOLIBERIALIBYALIECHTENSTEINLITHUANIALUXEMBOURGMADAGASCARMALAWIMALAYSIAMALIMALTAMARSHALL ISLANDSMAURITANIAMAURITIUSMEXICOMONACOMONGOLIAMONTENEGROMOROCCOMOZAMBIQUEMYANMARNAMIBIANEPALNETHERLANDSNEW ZEALANDNICARAGUANIGERNIGERIANORWAYOMANPAKISTANPALAU
PANAMAPAPUA NEW GUINEAPARAGUAYPERUPHILIPPINESPOLANDPORTUGALQATARREPUBLIC OF MOLDOVAROMANIARUSSIAN FEDERATIONRWANDASAUDI ARABIASENEGALSERBIASEYCHELLESSIERRA LEONESINGAPORESLOVAKIASLOVENIASOUTH AFRICASPAINSRI LANKASUDANSWAZILANDSWEDENSWITZERLANDSYRIAN ARAB REPUBLICTAJIKISTANTHAILANDTHE FORMER YUGOSLAV
REPUBLIC OF MACEDONIATOGOTRINIDAD AND TOBAGOTUNISIATURKEYUGANDAUKRAINEUNITED ARAB EMIRATESUNITED KINGDOM OF
GREAT BRITAIN AND NORTHERN IRELAND
UNITED REPUBLICOF TANZANIA
UNITED STATES OF AMERICAURUGUAYUZBEKISTANVENEZUELAVIETNAMYEMENZAMBIAZIMBABWE
The following States are Members of the International Atomic Energy Agency:
The Agency’s Statute was approved on 23 October 1956 by the Conference on the Statute of the IAEA held at United Nations Headquarters, New York; it entered into force on 29 July 1957. The Headquarters of the Agency are situated in Vienna. Its principal objective is “to accelerate and enlarge the contribution of atomic energy to peace, health and prosperity throughout the world’’.

IAEA-tEcdoc-cd-1709
FUEL BEHAVIoUR ANd ModELLING UNdER SEVERE tRANSIENt ANd LoSS oF cooLANt AccIdENt (LocA) coNdItIoNS
PRocEEdINGS oF A tEcHNIcAL MEEtING HELd IN MIto, jAPAN, 18–21 octoBER 2011
INtERNAtIoNAL AtoMIc ENERGy AGENcyVIENNA, 2013
COPYRIGHT NOTICE
All IAEA scientific and technical publications are protected by the terms of the Universal Copyright Convention as adopted in 1952 (Berne) and as revised in 1972 (Paris). The copyright has since been extended by the World Intellectual Property Organization (Geneva) to include electronic and virtual intellectual property. Permission to use whole or parts of texts contained in IAEA publications in printed or electronic form must be obtained and is usually subject to royalty agreements. Proposals for non-commercial reproductions and translations are welcomed and considered on a case-by-case basis. Enquiries should be addressed to the IAEA Publishing Section at:
Marketing and Sales Unit, Publishing SectionInternational Atomic Energy AgencyVienna International CentrePO Box 1001400 Vienna, Austriafax: +43 1 2600 29302tel.: +43 1 2600 22417email: [email protected] http://www.iaea.org/books
For further information on this publication, please contact:
Nuclear Fuel Cycle and Materials SectionInternational Atomic Energy Agency
Vienna International CentrePO Box 100
1400 Vienna, AustriaEmail: [email protected]
© IAEA, 2013Printed by the IAEA in Austria
JUNE 2013
IAEA Library Cataloguing in Publication Data
Fuel behaviour and modelling under severe transient and loss of coolant accident (LOCA) conditions : proceedings of a technical meeting held in Mito, Japan, 18-21 October 2011. – Vienna : International Atomic Energy Agency, 2013. CD-ROM. – (IAEA-TECDOC-CD series, ISSN 1684-2073 ; no. 1709) ISBN 978-92-0-192410-0 Includes bibliographical references.
1. Nuclear reactors – Research – Congresses. 2. Nuclear fuel elements – Mathematical models. 3. Nuclear fuels – Safety measures – Congresses. I. International Atomic Energy Agency. II. Series.
IAEAL 13-00812

For further information on this publication, please contact:
Nuclear Fuel Cycle and Materials SectionInternational Atomic Energy Agency
Vienna International CentrePO Box 100
1400 Vienna, AustriaEmail: [email protected]
© IAEA, 2013Printed by the IAEA in Austria
MAY 2013
foreword
In recent years the demands on ‘fuel duties’ have increased, including transient regimes, higher burnups and longer fuel cycles. To satisfy these demands, fuel vendors have developed and introduced new cladding and fuel material designs to provide sufficient margins for safe operation of the fuel components. National and international experimental programmes have been launched, and models have been developed or adapted to take into account the changed conditions. These developments enable water cooled reactors, which contribute about 95% of the nuclear power in the world today, to operate safely under all operating conditions; moreover, even under severe transient or accident conditions, such as reactivity initiated accidents (RIAs) or loss of coolant accidents (LOCAs), the behaviour of the fuel can be adequately predicted and the consequences of such events can be safely contained.
In 2010 the IAEA Technical Working Group on Fuel Performance and Technology (TWGFPT) recommended that a technical meeting on “Fuel Behaviour and Modelling under Severe Transient and LOCA Conditions” be held in Japan. The accident at the Fukushima Daiichi nuclear power plant in March 2011 highlighted the need to address this subject, and despite the difficult situation in Japan at the time, the recommended plan was confirmed, and the Japan Atomic Energy Agency (JAEA) hosted the technical meeting in Mito, Ibaraki Prefecture, Japan, from 18 to 21 October 2011.
This meeting was the eighth in a series of IAEA meetings, which reflects Member States’ continuing interest in the above issues. The previous meetings were held in 1980 (jointly with OECD Nuclear Energy Agency, Helsinki, Finland), 1983 (Risø, Denmark), 1986 (Vienna, Austria), 1988 (Preston, United Kingdom), 1992 (Pembroke, Canada), 1995 (Dimitrovgrad, Russian Federation) and 2001 (Halden, Norway).
The purpose of the technical meeting was to provide a forum for international experts to review the current situation and the state of the art of the performance of nuclear fuel for water cooled reactors under severe transients and LOCA conditions. The meeting was attended by 83 specialists representing fuel vendors, nuclear utilities, research and development institutions, and regulatory authorities from 19 Member States. The papers submitted to the meeting were organized into seven sessions covering analytical and experimental RIA and LOCA studies and international programmes, power ramp, and severe accident analysis. These proceedings contain all the papers that were presented and discussed during the meeting, and highlight key findings and recommendations based on the summaries of the session chairpersons. While the Fukushima Daiichi accident influenced the discussions, it was not directly considered because of the lack of fuel behaviour data available at the time of the technical meeting.
The IAEA wishes to thank the hosts and all participants for their contributions to the technical meeting, in particular K. Kamimura (JNES) and F. Nagase (JAEA). The IAEA officer responsible for this publication was V. Inozemtsev of the Division of Nuclear Fuel Cycle and Waste Technology.

EDITORIAL NOTE
This CD-ROM has been prepared from the original material as submitted by contributors. Neither the IAEA nor its Member States assume any responsibility for the information contained on this CD ROM.
This publication (including the figures, tables and references) has undergone only the minimum copy editing considered necessary for the reader’s assistance.
The use of particular designations of countries or territories does not imply any judgement by the publisher, the IAEA, as to the legal status of such countries or territories, of their authorities and institutions or of the delimitation of their boundaries.
The mention of names of specific companies or products (whether or not indicated as registered) does not imply any intention to infringe proprietary rights, nor should it be construed as an endorsement or recommendation on the part of the IAEA.
The authors are responsible for having obtained the necessary permission for the IAEA to reproduce, translate or use material from sources already protected by copyrights..

CONTENTS
SUMMARY ............................................................................................................................... 1
R&D PROGRAMME ON FUEL BEHAVIOUR UNDER TRANSIENTS (Session 1)
Fuel safety research at JAEA ................................................................................................................ 17 F. Nagase
IRSN R&D studies on fuel behaviour under RIA conditions ............................................................... 25 M. Petit, O. Marchand, F. Barré, P. Giordano
EXPERIMENTAL RIA STUDIES (Session 2)
Status of RIA related fuel safety research at JAEA .............................................................................. 45 T. Sugiyama, H. Sasajima, M. Amaya, F. Nagase
New techniques for the testing of cladding material under RIA conditions.......................................... 55 H.K. Yueh, R.J. Comstock, V. Grigoriev, J. Karlsson, W. Lees, Y.P. Lin, D. Lutz, D. Mitchell, D. Schrire
Current status of RIA study in the Republic of Korea .......................................................................... 67 S.-K. Kim, J.-G. Bang, D.-H. Kim, Y.-S. Yang, Y.-H. Koo
The cladding fracture behaviour under biaxial stress conditions .......................................................... 77 T. Fukuda, T. Mihara, M. Amaya, T. Sugiyama, F. Nagase
Fracture behaviour of hydrided cladding tubes with radial incipient crack in periphery ...................... 85 T. Mihara, T. Fukuda, Y. Udagawa, T. Sugiyama, F. Nagase
ANALYTICAL RIA STUDIES (Session 3)
Recent RIA and LOCA analyses performed at Technical Research Centre Finland (VTT) using fuel performance codes SCANAIR and FRAPTRAN-GENFLO ............................................ 97 A. Arffman
Assessment of steady state uncertainties impact on RIA modelling ................................................... 117 A. Huguet, L.E. Herranz
RCCA ejection fault studies: Application of a burnup threshold for the evaluation of the radiological releases ........................................................................................................................ 131 C. Bernaudat, J. Guion, N. Waeckela
Present status of the verifications and model development of FEMAXI and RANNS codes in JAEA ................................................................................................................................. 141 M. Suzuki, Y. Udagawa, T. Sugiyama, F. Nagase
RCCA ejection fault studies: Application of a burnup threshold for the evaluation of the radiological releases ........................................................................................................................ 153 Y. Udagawa, T. Sugiyama, M. Suzuki, F. Nagase
LOCA R&D (Session 4)
LOCA: An operator’s view on German licensing practice ................................................................. 163 A. Wensauer
IRSN R&D studies on fuel behaviour under LOCA conditions ......................................................... 179 M. Petit, C. Grandjean, N. Trégourès, F. Barré, P. Giordano
Investigation of the RU-43LV fuel behaviour under LOCA conditions in CANDU reactor .............. 191 G. Horhoianu

EXPERIMENTAL LOCA STUDIES (Session 5)
High burnup fuel behaviour under LOCA conditions as observed in Halden reactor experiments ..................................................................................................................................... 207 E. Kolstad, W. Wiesenack, B. Oberländer, T. Tverberg
Results of integral, high burnup, fuelled LOCA tests and companion testing with as-fabricated and pre-hydrided cladding ......................................................................................... 219 P. Askeljung, M. Billone, M. Flanagan
Behaviour of high burnup fuel during LOCA; key observations and test plan at JAEA .................... 229 F. Nagase, T. Chuto
UJP LOCA oxidation criteria “K” and “OΒ” ....................................................................................... 241 M. Négyesi, L. Novotný, J. Kabátová, S. Linhart, V. Klouček, J. Lorinčík, V. Vrtílkováb
Quantification of the chemical elements partitioning within pre-hydrided Zircaloy-4 after high temperature steam oxidation as a function of the final cooling scenario (LOCA conditions) and consequences on the (local) materials hardening ..................................... 253 J.C. Brachet, D. Hamon, J.L. Béchade, P. Forget, C. Toffolon-Masclet, C. Raepsaet, J.P. Mardon, B. Sebbari
ANALYTICAL LOCA STUDIES (Session 6)
Evaluation and analysis of high burnup fuel behaviour under LOCA conditions ............................... 269 Y. Yun, M.A. Zimmermann
The RAPTA-5.2: Code for modelling of VVER type fuel rod behavior under design basis accidents conditions ............................................................................................................... 279 P.V. Fedotov, A.A. Goncharov, A.V. Kumachev, O.A. Nechaeva, V.V. Novikov, A.V. Salatov, Y.V. Pimenov, Y.N. Dolgov
Assessment of fuel behaviour under large break LOCA condition for Indian pressurized heavy water reactor ......................................................................................................................... 289 A. Dixit, S.K. Yadav, N. Kumar, T.A. Khan, M. Singhal, N. Mohan, P.K. Malhotra, S.G. Ghadge, U. Chandra
Matare coupled codes package validation and assessment of potential clad ballooning behaviour for limiting ATWS and LBLOCA fault sequences in support of development of the SIZEWELL ‘B’ PWR safety case with an increased fuel internal pressure limit and M5TM clad fuel ................................................................................................................................. 301 R. Page, S. Jenkins
Radiological consequences for CHASHMA NPP Unit 2 due to large break LOCA without ECCS and CSS ................................................................................................................................ 327 S.A.A. Rizvi, M.A. Ahmed, Q. Hasnain, A. Minhaj
POWER RAMP AND SEVERE ACCIDENT (Session 7)
Status of power transient test program on LWR fuels using JMTR .................................................... 349 J. Ogiyanagi, S. Hanawa, F. Nagase
Fission gas release from high burnup fuel during normal and power ramp conditions ...................... 357 M. Amaya, J. Nakamura, F. Nagase
Investigation of VVER 1000 core degradation during SBO accident scenario in case of pressurizer SV stuck in open position ............................................................................................. 367 P. Groudev, A. Stefanova, R.Gencheva
List of Abbreviations ........................................................................................................................... 379 List of Participants .............................................................................................................................. 383

1
SUMMARY
SESSION 1: R&D PROGRAMME ON FUEL BEHAVIOUR UNDER TRANSIENTS
Chairpersons: T. Fuketa (JAEA) and M. Flanagan (NRC) 1. BACKGROUND The presentations of this session highlight research activities at two of the major nuclear test reactor facilities, CABRI reactor and the Nuclear Safety Research Reactor (NSRR), operating in the world today. 2. SUMMARIES AND COMMENTS F. Nagase of the Japan Atomic Energy Agency (JAEA) in Japan presented an overview of the fuel safety research activity at the JAEA. F. Nagase explained that JAEA’s research activities span reactivity initiated accidents (RIAs), loss of coolant accidents (LOCAs), fuel behaviour code development and verification, as well as fundamental studies of specific phenomena. The JAEA studies in the Nuclear Safety Research Reactor (NSRR), simulating RIA events, have produced a fundamental understanding of pellet cladding mechanical interaction (PCMI) failure for RIA events and semi-integral quench tests have confirmed the adequacy of the Japanese LOCA regulatory limits for the high burnup of fuel. Fundamental studies on oxidation behaviour and crack propagation in hydrided cladding have been critical for evaluating and interpreting the results of both the LOCA and RIA studies. The knowledge from the transient testing and the fundamental studies has been successfully integrated into fuel behaviour codes to produce improved modelling capabilities. In the future, JAEA research programs will continue to use these demonstrated experimental approaches to study advanced cladding and fuel materials. Recently, a new emphasis has emerged on fuel and cladding response in severe accidents and beyond design basis accidents. M. Petit of the Institut de Radioprotection et de Sûreté Nucléaire (IRSN) in France presented an overview of research being conducted at IRSN to study fuel behaviour under RIA conditions. M. Petit presented that the experiments in the sodium loop of the CABRI reactor led to a fundamental understanding of the PCMI failure mode of RIA transients and the findings indicated a need to revise RIA criteria. Now, a new program will be conducted in a water loop in the CABRI reactor which will illuminate both the PCMI and departure from nucleate boiling (DNB) phase of a postulated RIA transient. A test matrix was presented for the new program with a total of 10 tests. Two tests in sodium have already been completed. Many of these planned tests are specifically designed to complement the experimental databases of the CABRI sodium loop tests and the NSRR RIA tests. 3. PROBLEMS, CHALLENGES AND PERSPECTIVES Even with these 12 planned tests, it is clear some aspects of fuel behaviour under RIA conditions will still remain largely unaddressed. Despite many years of research and operating experience of light water reactors, research questions still remain in order to characterize the fuel and cladding behaviour in response to accident conditions in a detailed way. At the same time, there are fewer and fewer facilities capable of simulating RIA, LOCA and transient conditions. Combining test reactor studies with fundamental studies further increases the contribution of test reactor findings to the understanding of fuel and cladding response to

2
transient conditions. With many countries facing decreased financial resources, international collaboration is becoming increasingly necessary to run large scale test programs and fundamental understanding of the complex phenomena of nuclear fuel and cladding is necessary to direct the limited resources to generate the maximum benefit. The JAEA and IRSN research programs provide critical coordination of large scale test programs and fundamental research which has resolved, and will continue to resolve critical questions for safe operation of nuclear power plants. 4. RECOMMENDATIONS FOR FUTURE WORK
An extension in the test program is therefore proposed to address aspects such as the performance of fuel as intermediate burnups, where large uncertainty and disagreement between expert interpretation remains.
1. Encouragement of partnerships and synthesis of research program findings from various international programs.
2. Combining test reactor studies with fundamental studies further increases the contribution of test reactor findings to the understanding of fuel and cladding response to transient conditions and should be supported.
SESSION 2: EXPERIMENTAL RIA STUDIES
Chairpersons: M. Petit (IRSN) and T. Sugiyama (JAEA) 1. BACKGROUND The behaviour of nuclear reactor fuels during off-normal and postulated accident conditions such as RIA are a matter of investigations. In order to define adequate criteria for fuel design effects and for burnup related effects, the fuel response to RIA transients is being studied experimentally and analytically. Considerable experimental evidence has been gathered in recent years covering a variety of materials and conditions. 2. SUMMARIES AND COMMENTS In the session 2, entitled “Experimental RIA Studies”, 5 papers were presented. The first paper by T. Sugiyama, JAEA, Japan, showed an overview of the 14 RIA experiments performed in the NSRR reactor during the Advanced LWR Fuel Performance and Safety (ALPS) programme on high burnup light water reactor (LWR) fuel. Both low and high initial temperature tests were conducted. The paper discussed the outcome of the experiments in terms of PCMI failure criterion. Also addressed was the influence of the initial temperature on PCMI failure. In conclusion the fuels to be tested in the phase 2 of ALPS (that were received in January 2011) were presented. The second paper by K. Yueh, Electric Power Research Institute (EPRI), United States of America (USA), discussed the results of 2 new mechanical tests performed by Studsvik, Sweden on behalf of EPRI. The first type of tests on Zr-2 with radial hydrides — called rapid heating and load test — showed that even brief exposure at high temperature enhances the ductility of the hydrided cladding samples. There appears to be an abrupt recovery between 70–100°C, comparable to a brittle to ductile transition, followed by a more gradual ductility improvement when temperature increases. The second type of test, called modified burst test, consists of a loading of a cladding sample by the use of a tube

3
inserted in it with pressurization. First results show some similarities of the rupture pattern with that observed during RIA in-pile experiments. The third paper by S.K. Kim, Korea Atomic Energy Research Institute (KAERI), Republic of Korea, discusses the RIA studies conducted at KAERI. They consist in mechanical testing of claddings by ring tensile tests and rapid burst tests. The materials considered are Zr-4 and HANA. The brittle or ductile nature of the rupture is discussed. For the future, expansion due to compression tests will be performed. The fourth paper by T. Fukuda, JAEA, Japan, discussed the development of a new clad testing capability at JAEA. The most important feature is that the device permits the combination of an axial load and an internal pressurisation. Proportion between the two loading directions, hoop and axial, can be varied. Thus, loading conditions similar to those expected during RIA transient can be reproduced. The influence of the stress biaxiality on the fracture was exemplified. The future step in the development of this technique is to look for the possibility to use higher strain rates, more representative of RIA transients. The fifth paper by T. Mihara, JAEA, Japan, presented a new technique developed by JAEA in order to form a crack at the periphery of a cladding tube during its fabrication. The tube is then hydrided artificially. The technique presently used for hydriding leads to hydrides distributed radially around the crack tip. This results in very brittle mechanical behaviour due to the presence of radial hydrides ahead of the crack tip. The next step in the development is to modify the hydriding technique in order to produce circumferentially oriented hydrides, more representative of Zr-4 irradiated in pressurized water reactors (PWRs). 3. PROBLEMS, CHALLENGES AND PERSPECTIVES The content of the papers presented in this session is consistent with the outcomes of the Organisation for Economic Co-operation and Development (OECD) workshop on RIA held in 2009. It appears that the PCMI phase of RIA is now well understood thanks to the interpretation of the experiments performed in CABRI and NSRR. Overall, the papers presented in this session show that there is a great activity related to separate effect mechanical testing of claddings. These mechanical tests aim at reproducing the loading conditions and failure characteristics observed during the in-pile tests. Although still under development, new techniques appear promising for improving the mechanical tests representatively with respect to the conditions anticipated during RIA and to contribute to a better understanding of the in-pile RIA test results. 4. RECOMMENDATIONS FOR FUTURE WORK
In-pile tests should be continued with emphasis on studying the DNB occurrence, post-DNB
behaviour and fission gas dynamics (FGD) under prototypic RIA conditions.
The new separate effect mechanical tests should be carefully analysed with respect to their ability to reproduce the loading conditions of RIA.
The new separate effect mechanical tests should be compared to already established
methodologies in order to identify the advantages of each type of test.
4
It is also recommended that in the midterm a consensus be reached on whether or not the behaviour of new claddings with respect to PCMI under RIA conditions be assessed solely on the basis of separate effect mechanical tests.
SESSION 3: ANALYTICAL RIA STUDIES
Chairpersons: J. Zhang (Tractebel Engineering) and M. Suzuki (JAEA) 1. BACKGROUND Analytical RIA studies are needed
To establish the safety criteria based on experimental data;
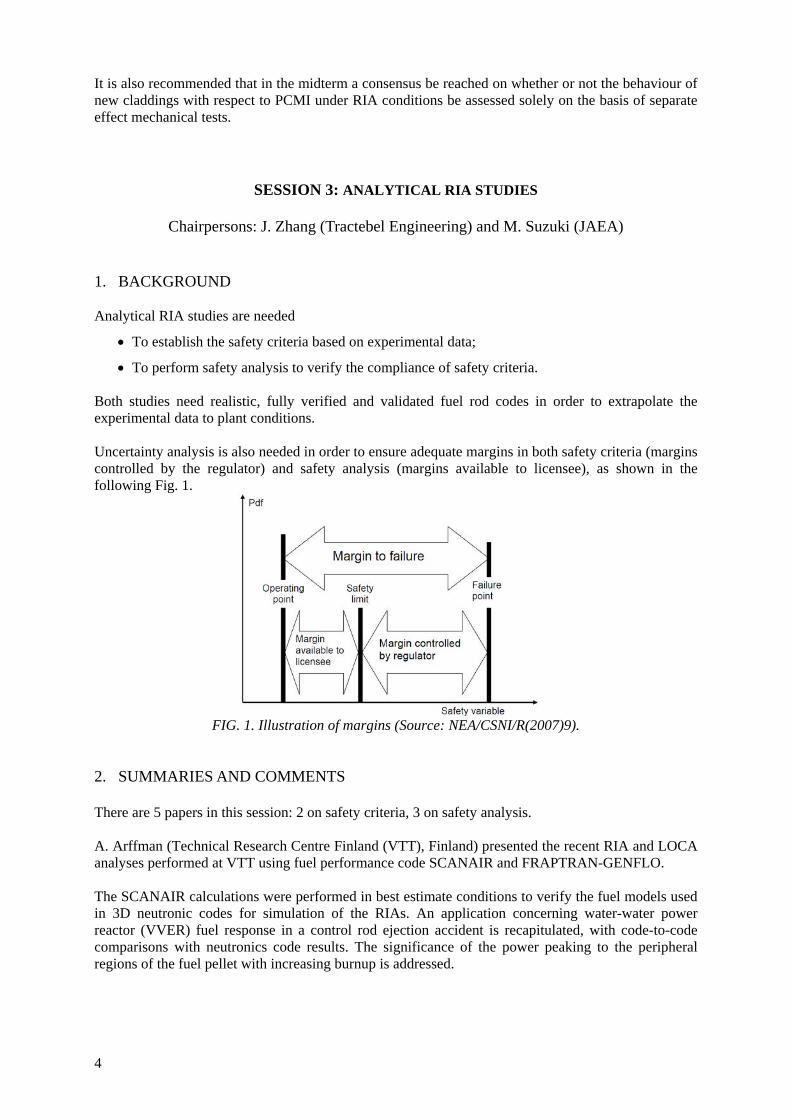
To perform safety analysis to verify the compliance of safety criteria. Both studies need realistic, fully verified and validated fuel rod codes in order to extrapolate the experimental data to plant conditions. Uncertainty analysis is also needed in order to ensure adequate margins in both safety criteria (margins controlled by the regulator) and safety analysis (margins available to licensee), as shown in the following Fig. 1.
FIG. 1. Illustration of margins (Source: NEA/CSNI/R(2007)9).
2. SUMMARIES AND COMMENTS There are 5 papers in this session: 2 on safety criteria, 3 on safety analysis. A. Arffman (Technical Research Centre Finland (VTT), Finland) presented the recent RIA and LOCA analyses performed at VTT using fuel performance code SCANAIR and FRAPTRAN-GENFLO. The SCANAIR calculations were performed in best estimate conditions to verify the fuel models used in 3D neutronic codes for simulation of the RIAs. An application concerning water-water power reactor (VVER) fuel response in a control rod ejection accident is recapitulated, with code-to-code comparisons with neutronics code results. The significance of the power peaking to the peripheral regions of the fuel pellet with increasing burnup is addressed.

5
The FRAPTRAN-GENFLO calculations were performed for estimation of failed rods during LOCA using statistical method (order statistics and neural network). The coupled FRAPTRAN-GENFLO code is introduced as the fuel rod model in a completely new statistical fuel failure analysis procedure under development. The safety regulations in Finland limit the number of rods that fail in any accident to 10% of all the rods. So far there has not been an independent tool dedicated to ascertain that. The statistical best estimate procedure now developed relies on what is known as Wilks’ formula, a result of nonparametric statistics. Also in the method, neural networks are introduced as a novel way to reduce the number of fuel code simulations. A neural network is first trained with results of stacked fuel performance code calculations, and then it is used as a substitute for the analysis code. Neural networks should provide superior flexibility over, e.g. the more conventional response surface method. The system has been successfully tested with a small scale analysis of a LOCA scenario, and it is now ready for full reactor scale applications. It appears from the discussion that:
More in-depth insights on the detailed models and assumptions of different codes, and further code verification and validation may be needed.
The statistical approach seems promising, but should be improved for efficiency and for licensing purposes.
F. Feria (Centro de Investigaciones Energéticas, Medioambientales y Tecnológicas (CIEMAT), Spain) presented the assessment of steady state uncertainties impact on RIA modelling with FRAPCON/ FRAPTRAN fuel rod codes. This study illustrates how uncertainties related to pre-transient rod characterization affect the estimates of nuclear fuel behaviour during the transient. To do so, the RIA scenario chosen as a basis for the study has been that of the CIP0-1 test of the CABRI program, and the codes involved in simulation have been FRAPCON-3 (steady state irradiation) and FRAPTRAN1.4 (transient). The rod characterization uncertainties have been estimated by analysing the propagation of uncertainties in modelling steady state irradiation. Single parametric sensitivity study helped in identifying the key rod characterization uncertainties specific to the used fuel rod codes and for a specific RIA test (CIP0-1): the high sensitivity in pellet and cladding roughness is attributed to the model used in FRAPCON. Then, those RIA initial uncertainties are fed into the transient analysis, uncertainties bands are determined on selected output parameters of interests, using the response surface method. The estimates bands are discussed and input variables are ranked according to their effect on the RIA modelling. In addition to be an example of uncertainties assessment, this study intends to set a methodology that allows getting more reliable insights when modelling RIA scenarios. It appears from the discussion that:
More in-depth insights on the detailed models and assumptions, and further verification and validation may be needed
The statistical approach may be improved by including the model uncertainties in both steady state and transient FRAPCON and FRAPTRAN codes.
C. Bernaudat (Électricité de France (EDF), France) presented an approach to reduce the over-conservatism in evaluation of the post-DNB fuel failure fraction for radiological release calculation during the RIA.

6
In France, one of the safety regulatory requirements in such situations is related to the limitation of the radiological releases in the environment. In order to quantify the radiological release, the number of failed rods during the transient is determined on the basis of a very conservative assumption: any rod that undergoes DNB onset is supposed to fail, whatever its burnup. The number of failed rods shall remain under 10% of the whole core. This assumption is not confirmed by full-scale tests such as NSRR tests (TK series), where all ballooned rodlets survived, or fast pulsed graphite reactor (BIGR) tests, where rod failure needed a very high energy deposition. Up to now, all RIA failure limits are based on some failure mechanisms such as fuel incipient melting, cladding oxidation/embrittlement or PCMI. Cladding failure by ballooning/burst is excluded. Rod failure by ballooning /burst needs two simultaneous conditions: DNB onset and rod inner overpressure. For UO2/Zircaloy-4, the maximum inner pressure calculated for rods under 25 GW·d·t-1M remains far below the reactor coolant system (RCS) pressure. All the rods under 25 GW·d·t-1M which undergo DNB onset during an RIA are not likely to fail by ballooning /burst, hence should be excluded from the counted DNB failed rods. Consequently, application of this burnup threshold will contribute to reduce the conservatism in the radiological release evaluation in RIA studies. It appears from the discussion that:
The failure by ballooning/burst has not been observed in RIA tests, but the possibility cannot be neglected;
A more realistic /straightforward estimate can only be made by improving the modelling of an axial gas flow blockage when the pellet–clad gap is closed.
M. Suzuki (JAEA, Japan) presented the status of the verifications and model development of FEMAXI and RANNS codes. Some new models are added for simulation of RIA, e.g., a rate law model of grain boundary fission gas bubbles, helium infusion and effusion in fuel pellets in FEMAXI 7, and cladding surface heat transfer change at the onset of and recovery from DNB, grain separation and burst release of fission gas, criteria of crack propagation in the PWR cladding in RANNS. Both codes are being verified and validated by participating in the IAEA FUMEX-III and OECD RIA fuel rod codes benchmarks. Difficulties still remain on the modelling of the basic phenomena such as axial elongation rates of pellet stack and cladding during RIA. A “dynamic model” is necessary to cover a presumable viscoelasticity of pellet stack and even inertial displacement of rod structure including sensor system, but the development requires a careful consideration. It appears from the discussion that:
The bonding model in FEMAXI uses an empirical function of contact pressure and duration of PCMI, which need further validation;
Effect of He in pellet on thermal conductivity has not been modelled yet.
Y. Udagawa (JAEA, Japan) presented a fracture parameter J-intergral based PCMI failure criterion for high burnup PWR fuels based on NSRR test results. PCMI failure is believed caused by inward penetration of a crack generated in the hydride rim. The fracture parameter J-integral was calculated by using a 2D FEM code based on the crack tip temperature and depth calculated from FEMAXI/RANNS. The evaluated critical J values were well correlated with both hydrogen content and crack tip temperature, which is taken as a tentative analytical PCMI failure criterion.

7
It appears from the discussion that:
The J-integral values are not so sensitive to the incipient crack tip curvature which is represented by the crack width as far as it is within 20–30 µm;
The approach seems rather complex, and relies on several ‘subjective’ assumptions that are difficult to validate by measured data;
Comparison with other simple alternatives (e.g., critical strain energy density (SED), etc.), or comparison of calculated J-integral values with fracture toughness measurements is recommended.
3. PROBLEMS, CHALLENGES AND PERSPECTIVES Significant differences exist in various RIA safety criteria due to:
different understanding of the failure mechanisms;
different approaches (decoupled or straightforward, empirical or mechanistic);
Different test data and codes used. Significant differences exist in various fuel rod codes and analysis applications due to:
Different modelling approaches and simplifications (realistic or conservative, empirical or first principle, micro or macro, 1.5D or 2D, etc.);
different validation databases, material properties models and application scopes;
user effects (assumptions);
Lack of appropriate uncertainty analysis. 4. RECOMMENDATIONS FOR FUTURE WORK Further well designed and instrumented RIA tests, including uncertainties estimation, are needed to better assess the fuel behaviour and safety criteria. Further fuel rod modelling benchmarks are needed:
FUMEX-4 (IAEA): >2012;
RIA fuel rod codes benchmark phase II (OECD/WGFS): >2013. It appears from the discussion that:
Activity coordination between the IAEA and the OECD should be improved, in order to avoid duplicated efforts.
Well specified benchmark cases are needed to really compare the performance of basic models (axial elongation, thermal expansion, FGR, etc.).
The benchmark participants and organisers should carefully examine the models and assumptions used in simulations.
Uncertainty analysis should be included by using a simple, transparent, robust and flexible statistical uncertainty analysis method (e.g., order statistics).

8
SESSION 4: LOCA R&D
Chairpersons: G. Horhoianu (INR) and H. Fujii (MNF) 1. BACKGROUND The present and future power reactors market requires an unprecedented level of fuel safety. Despite the fact that the rate of fuel failures has dramatically declined, fuel safety remains an important issue. 2. SUMMARIES AND COMMENTS In this session we had 3 presentations, focusing on LOCA analysis for new fuel boundary conditions and experimental and analytical R&D study. A. Wensauer (E.ON Kernkraft GmbH, Germany) presented the German licensing practice from an operator’s point of view. Currently, it is requested in Germany to fulfil Energy Coalition for Contractor Safety criteria, such as pellet cladding temperature (PCT) and cladding oxidation limit, as well as failure rate of 10% limit. LOCA analysis for German PWRs illustrates very well how modifications, such as high enrichment fuel and mixed oxide (MOX) fuels introduction, and fuel thermal conductivity degradation with burnup. In cooperation with the vendors the operator has to follow up current research, assess the result with respect to the technical safety of plant operation and with respect to the licensing documents. As for new challenge, post-quench ductility, beta-phase thinning and embrittlement and hydrogen enhanced embrittlement have been studied and taken into account. When the new criteria are officially implemented in the regulation the pertaining proofs will be available as well. A question was raised how often a hot rod analysis and a failure rate analysis are conducted. The answer is that hot rod analysis is performed in the timing of boundary condition changes, such as the power limit change, besides, failure rate analysis is conducted during every operation cycle. M. Petit (Institut de Radioprotection et de Sûreté Nucléaire (IRSN), France) presented IRSN’s study activities on fuel behaviour under LOCA conditions. In order to prepare an acceptance criteria reassessment, IRSN recently conducted an extensive state of the art review relative to fuel behaviour under LOCA conditions and summarized the main pending questions relative to fuel behaviour under LOCA in the following three topics:
(1) Loss of cladding integrity upon quench and post-quench loads;
(2) Relocation of fuel fragments;
(3) Flow blockage and core coolability. To address these issues, IRSN is conducting CYCLADES program that consists in:
MAGNO-R experimental programme and the development of the DIFFOX code for the cladding embrittlement.
Single rod experiments in the CABRI reactor for the fuel relocation and dispersal, taking benefit of the CABRI hodoscope to monitor fuel movements.
The ELFE creep test, the COCAGNE bundle mechanical tests and the COAL full length bundle reflooding tests for the flow blockage and core coolability.

9
The results produced will be used to validate the multi-rod LOCA transient fuel code DRACCAR whose development is in progress. Several questions were addressed at the modelling in DRACCAR in conjunction with DIFFOX, CABRI core experiment details for LOCA testing, etc. G. Horhoianu (Institute for Nuclear Research (INR), Romania) presented a new design of CANDU (acronym: Canada Deuterium Uranium) fuel, RU43 with recovered uranium and LOCA analysis. Compared with the current design of a 37-natural uranium element (NU 37) fuel bundle, RU 43 will have a higher power capability and higher burnup potential in CANDU reactors of the Cernavoda nuclear power plant (NPP) due to increased safety margins. Consequences of a possible LOCA were analysed as well as steady state behaviour. LOCA simulating tests on RU 43 fuel elements are planned to be performed in C2 LOCA test capsules and in loop A of the TRIGA Research Reactor of INR Pitesti. Several questions were addressed, such as LOCA break conditions and steady state behaviour as a result of design change. 3. PROBLEMS, CHALLENGES AND PERSPECTIVES Despite the efforts made to reduce the fuel failure, fuel failures and related problems have persisted. Sometimes they were due to the conjunction of new design and new operating conditions. With the evolution of fuel design and the possibilities for more stringent operational conditions it is of concern to determine if the present safety criteria are adequate as most of them were established more than 20 years ago most of the time on nonirradiated materials. 4. RECOMMENDATIONS FOR FUTURE WORK New issues regarding LOCA like fuel dispersal and flow blockage are experimentally investigated, modelled, and verified through simulating tests. From the technical point of view, when available, those new methodologies are necessary to be taken into account for future fuel design and licensing. IRSN is going to perform single rod LOCA simulation tests to address fuel fragmentation dispersal. That experiment will be complementally for Halden and NRC-Studsvik experiments. Such data is beneficial to understand the phenomena. INR is going to perform LOCA simulating experiments of CANDU fuel type in the INR research reactor. Such activities are essential for understanding significant fuel behaviour phenomena during LOCA transients, for providing a database for validation of transient fuel performances codes and should be addressed for various fuel types.
SESSION 5: EXPERIMENTAL LOCA STUDIES
Chairpersons: J.C. Brachet (CEA) and F. Nagase (JAEA) 1. BACKGROUND For the safety in a LOCA, various efforts have been made on the fuel behaviour and revision of the safety criteria.

10
2. SUMMARIES AND COMMENTS Five papers were presented in this session with different approaches from fundamental analyses to integral experiments. E. Kolstad of the OECD Halden project presented an overview of the « IFA-650 » LOCA tests performed at the Halden reactor in Norway. Six PWR, two boiling water reactor (BWR), and two water-water power reactor (VVER) fuels with different burnups (4292 MW·d·kg-1) have been tested. Clad failure mode/temperature likely depends on the cladding materials and hydrogen content as observed from other semi-integral tests and separate (out-of-pile) tests. Axial fuel relocation and partial dispersal for high burnup fuel pellets were observed with reproducibility. Affecting factors on the axial relocation and dispersal of the fuel pellet, such as axial gas flow, burnup and pellet geometry, should be further investigated. Information on secondary hydriding is also required. It may be recommended to discuss the definition, the main targets and the matrix of the future tests. M. Flanagan of the Nuclear Regulatory Commission (NRC), United States of America (USA) presented results from the four-point bending tests performed at Studsvik on high burnup ZIRLOTM (200 ppm H) fuels and performed at Argonne National Laboratory (ANL) on nonirradiated materials (pre-hydrided or not). Both the results showed a good agreement, and, to the NRC opinion, consistent with the proposed new LOCA criteria if the hydrogen contents are taken into account. Definition of future tests, with a higher nominal H contents and/or other clad materials and with a lower fuel burnup to avoid too fine fuel fragments dispersal, application to other LOCA transient types including small break LOCA, and additional post-irradiation examination (PIE) (fuel fragments sizes, local oxygen/hydrogen concentration measurements, tensile and/or impact and/or ring compression test (RCT)) should be of interest. F. Nagase of JAEA presented results from their extensive works on both nonirradiated (+ hydrogen pre-charged) and high burnup cladding. High burnup effects on oxidation behaviour and fracture were mainly indicated. Even in the quench tests under axial loading, high burnup cladding oxidized to 1827% equivalent cladding reacted (ECR) survived the quench. Most of the claddings which survived the quench display negligible post-quench ductility in ring compression tests, indicating different criteria from two typical test methodologies for the cladding embrittlement. Then, in next future, it could be interesting to get some insights into the origins of this apparent two test methodologies discrepancy. New criterion for cladding embrittlement was presented and proposed by M. Négyesi of the Faculty of Nuclear Sciences and Physical Engineering, Czech Technical University in Prague. The criterion O is based on the oxygen concentration in the metallic prior- phase. The criterion is currently applicable to E110 with the range of thinner corrosion and lower hydrogen. Investigations for the applicability to thicker corrosion layer, higher hydrogen concentration and other alloys are expected to consider the replacement with the current 17% ECR and the criterion K which are not valid to high burnup fuels and some conditions. Post-quench ductility of the cladding is strongly influenced by not only the extent of oxidation but also hydrogen concentration, metallurgical evolutions in the cladding which experienced phase transformations and cooling. J.C. Brachet of the Commissariat à l'énergie atomique et aux énergies alternatives (CEA), France presented results from the detailed microstructure observations, microchemical analyses and nano-hardness measurements and provided the information on the correlation between the microstructural phenomena and the post-quench residual ductility. Such data are very important on establishment of safety criteria from the scientific point of view, and more fundamental studies are required to clarify phenomena specific to the high burnup fuel.

11
3. PROBLEMS, CHALLENGES AND PERSPECTIVES Extensive studies have been performed on the fuel behaviour in a LOCA and similar amounts of data have been accumulated on oxidation kinetics, conditions of cladding embrittlement and fracture on the quench, and the other properties. Actually the US is going to revise the oxidation criteria for cladding embrittlement. However, investigations are continued to clarify the not clarified phenomena including cladding embrittlement in the ballooned region and influence of cooling scenario on cladding embrittlement. 4. RECOMMENDATIONS FOR FUTURE WORK As mentioned before investigations should be continued to clarify the remaining phenomena that need clarification. Considerations should be made also on test methodology to evaluate the integrity of the cladding oxidized at high temperatures. Fragmentation, axial relocation and dispersal of the high burnup fuel pellet on cladding burst, which were observed in the NRC/Studsvik and Halden tests, should be further investigated together with their impact on the peak clad temperature and core coolability in a LOCA.
SESSION 6: ANALYTICAL LOCA STUDIES
Chairpersons: J.M. Rey Gayo (CSN) and R. Page (EDF) 1. BACKGROUND Several countries through the world have developed many codes in order to analyse different LOCA aspects, dealing with a range of topics, such as thermomechanics and thermohydraulic items up to radiological consequences. 2. SUMMARIES AND COMMENTS There were 5 papers and presentations. Y. Yun from Paul Scherrer Institute (PSI), Switzerland presented FALCON calculations on 4 ALPS experiments (both PWR and BWR), as well as an application to a large break loss of coolant accident (LBLOCA) European power reactor (EPR) case. A discussion was held over the fact that the amount of H content should be correctly considered in the models in order to better calculate the time to rupture. The temperature dependence of the pre-oxide effect is necessary to be investigated in more detail. P.V. Fedotov from the Joint Stock Company "A.A. Bochvar High-technology Research Institute of Inorganic Materials" (JSC VNIINM), Russian Federation explained that RAPTA-5.2 has been developed for VVER E-110 cladding fuel for a wide range of transient and accident situations. Different validation examples, both of separate effects and reactor situations, have been carried out with reasonable results. The development of the code is ongoing, and it is planned to be applied also to PWR fuel. S.K. Yadav from Nuclear Power Corporation of India Ltd. (NPCIL), India presented a pressurized heavy water reactor (PHWR) LBLOCA analysis with ATMIKA code calculations, as well as the criteria that must be maintained in India (one aspect to take into account is that there is an oxygen

12
enbrittlement criteria, based on oxygen concentration in cladding, instead of one of cladding maximum temperature). The cases presented cover the whole spectrum of breach sizes and locations. The results show the fulfilment of all criteria. R. Page from EDF-Energy (United Kingdom) showed, that the validation of the MATARE codes package comprises the MABEL clad deformation analysis code coupled with the TALINK code and the RELAP5 thermohydraulics code for the use in the Sizewell B safety case, with a detailed review of recent MATARE analysis of the NRU MT-4 LOCA experiment. Investigations of the level of clad ballooning calculated in key limiting anticipated transient without scram (ATWS) fault sequences was undertaken to assess the impact of a higher rod internal pressure limit and to examine the effects on clad ballooning, changing from optimized Zircaloy to M5TM clad in the LBLOCA safety case assessments. Future assessments would benefit from further validation evidence concerning clad interactions in multiple rod subassemblies with information concerning rod pellet eccentricity variation and development. S.A.A Rizvi’s presentation from the Pakistan Atomic Energy Commission (PAEC), Pakistan dealt with a study of a sequence of LBLOCA without emergency core cooling system (ECCS) and without containment spray system (CSS) for Chashma NPP in Pakistan, using the codes MELCOR (for the progression of the accident) and MELCOR accident consequence code system (MACCS) (for the radiological consequences). MELCOR results show the melting and relocation of the core, and the failure of the vessel, but containment failure is avoided. Radiological consequences in terms of fatalities are limited. 3. PROBLEMS, CHALLENGES AND PERSPECTIVES The codes presented, as well as others that exist, some of which have been presented in their RIA applications as FRACTRAN or RANNS, try to simulate in the best estimate mode the behaviour of fuel in both experiments and nuclear plant of different designs. Some new model development work is still necessary. New effects, as fuel relocation and ejection during LOCA, are poorly modelled. 4. RECOMMENDATIONS FOR FUTURE WORK As mentioned before more work on model development has to be undertaken. Code validation comes from experimental facilities of different scopes and intercomparisons with other codes. Code application for commercial reactors should be thoughtfully carried out in a validation process.
SESSION 7: POWER RAMP AND SEVERE ACCIDENT
Chairpersons: K. Kamimura (JNES) and V. Garat (AREVA)
1. BACKGROUND This session consists of two different areas of fuel behaviour research. One is in normal/off-normal transient and the other is in severe accident.

13
2. SUMMARIES AND COMMENTS
In the former area M. Amaya and J. Ohgiyanagi of JAEA presented “Fission gas release from high burnup fuel during normal and power ramp conditions”, and “Status of power transient test program on LWR fuels using the Japanese Material Testing Reactor (JMTR)”, respectively. Fuel behaviour data in normal and off-normal conditions are necessary and important as the base for evaluation of fuel behaviour in accidents such as RIA and LOCA. The mechanism of fission gas release (FGR) in high burnup fuel rods has not been fully clarified. M. Amaya introduced the reirradiation test on high burnup UO2 and MOX in the Halden Boiling Water Reactor (HBWR), and concluded that the fission product (FP) gas release of MOX fuel in low temperature suggested different mechanism from that of low and middle burnup fuel. There has been a discussion about the mechanism which is still an open issue. A comment from E. Kolstad (Halden) underlined that the Vitanza threshold can be extrapolated for burnup above 40 GW·d·t-1, neither for UO2 fuels nor MOX ones. In the latter area, P. Groudev of INRNE-BAS/Bulgaria presented “Investigation of VVER 1000 core degradation during station blackout (SBO) accident scenario”. He investigated reactor core behaviour at late in-vessel phase in case of late reflooding by high pressure injection system (HPIS) and analysed the scenario by using ASTEC V2 code. It provided interesting information related to the Fukushima (Japan) severe accident. For VVER 1000, the key factor to avoid a severe core damage is to keep at least one primary pump and to start on time (if too late, the core is damaged). Other factors are important, such as the occurrence of a core catcher and to limit the hydrogen production. 3. PROBLEMS, CHALLENGES AND PERSPECTIVES The test program on high burnup fuel behaviour is planned after refurbishment of the JMTR. JMTR will be expected to carry out the power transient tests on high burnup fuel including the objective to evaluate and clarify the mechanism. 4. RECOMMENDATIONS FOR FUTURE WORK The comparison of FGR behaviour between MOX and UO2 is still a necessary topic to be discussed in another IAEA technical meeting. The core behaviour at the beginning (beyond DNB and prior-melting) of and during a severe accident will be a necessary topic to be discussed focusing on fuel and cladding behaviour in a future IAEA technical meeting. In that case, it is necessary to consider duplication in other meetings.


R&D PROGRAMME ON FUEL BEHAVIOUR UNDER TRANSIENTS (Session 1)
Chairpersons:
T. FUKETA (JAEA)
M. FLANAGAN
(NRC)


17
FUEL SAFETY RESEARCH AT JAEA
F. NAGASE Japan Atomic Energy Agency (JAEA)
Tokyo, Japan Email: [email protected]
Abstract
To provide a data base for the regulatory guide of light water reactors, behaviours of reactor fuels during off-normal and postulated accident conditions have been studied at the Japan Atomic Energy Agency (JAEA). The research program is currently comprised of reactivity initiated accident (RIA) study including NSRR experiments with high burnup UO2 and MOX fuels and RANNS code development, loss of coolant accident (LOCA) study including oxidation rate measurements and semi-integral quench tests, development and verification of high burnup fuel behaviour code FEMAXI, and basic studies on phenomena specific in high burnup fuels. In consideration of the accident at the Fukushima-Daiichi NPP, review of the research program is being required. Studies on the fuel behaviour in beyond design basis accidents and severe accidents are proposed and discussed at JAEA. The presentation gives an outline of the research activities which are conducted and proposed. 1. INTRODUCTION High burnup causes various changes in the light water reactor fuel. The main changes are growth of the corrosion layer, increase in hydrogen absorption and hydride precipitation, reduction in the cladding ductility, and fission gas accumulation in the fuel pellet, which may affect fuel behaviour under accident conditions as well as normal operation conditions. The Japan Atomic Energy Agency (JAEA) performs the extensive research program to better understand behaviour of high burnup fuels under accidental conditions and to provide database for regulatory judgment. Reactivity initiated accident (RIA) studies and loss of coolant accident (LOCA) studies are performed by using some unique facilities such as Nuclear Safety Research Reactor (NSRR) and Reactor Fuel Examination Facility (RFEF). Fundamental data have been obtained by mechanical property tests, microstructure observations and theoretical analyses to evaluate the results of the RIA and LOCA experiments. Computer codes are essential tools to interpret results of the experiments and predict the fuel behaviour. JAEA has been developing the FEMAXI for the normal operation and off-normal conditions and the RANNS for RIA conditions. Advanced cladding materials with high corrosion resistance and pellets with lower fission gas release are developed to improve the performance of the fuel. JAEA has started the special experimental program to obtain the database on behaviour of the advanced fuels under RIA/LOCA conditions. In consideration of the accident at the Fukushima-Daiichi NPP, review of the research program is required to some extent and studies on the fuel behaviour under beyond-DBA and severe accident conditions are being proposed and discussed. The presentation gives an outline of the research activities which are conducted and proposed at JAEA. 2. RIA STUDY The NSRR is a modified TRIGA-ACPR (Annular Core Pulse Reactor) of which salient features are the large pulsing power capability and large dry irradiation space located in the center of the reactor core which can accommodate a sizable experiment. The capsule used in the pulse irradiation experiment is a double container system, and the capsule contains an instrumented test fuel rod with stagnant coolant water. Details of the NSRR experiment are described in a number of documents [1]. Fuel enthalpy is one of the usual metrics for fuel behaviour in the analysis of this design basis accident, and the threshold of fuel failure in terms of the enthalpy is always a primary concern. Fuel pellet temperature increases promptly at the onset of the event, and fuel pellet expands rapidly. Then, expanded fuel pellets contact with cladding inner wall, and push on the surface. Failures from the
18
Pellet Cladding Mechanical Interaction (PCMI) are found to be more prevalent at high burnups, above ~40 MW·d·kg-1, because of lower cladding ductility. Enhanced corrosion of cladding at high burnup leads to significant hydrogen absorption. Zirconium-based alloys containing high concentrations of hydride precipitates are more brittle than unhydrided metal, especially for temperatures below 40C, and cracks initiate easily. As a consequence, the cladding cannot always deform sufficiently to accommodate the expansion of the fuel pellet and through-wall cracks develop. The Japanese PCMI failure threshold was defined up to 75 MW·d·kg-1 in 1998, on the basis of the data up to approximately 64 MW·d·kg-1 which were obtained by the time. It can be seen that the recent results from tests VA-1, -2 and LS-1 at high burnups are above the PCMI failure threshold with an adequate margin, although the burnup of fuel tested in the VA-2 exceeds the defined range [2]. The results suggest that the current criteria can be applied to higher burnup level, most probably ~80 MW·d·kg-1. A good correlation is seen between the fuel enthalpies at failure and the cladding oxide thickness, one of the indices for corrosion level, including oxidation and hydrogen absorption in the results from NSRR experiments with the PWR fuel. According to our previous study [3], this tendency reflects the relation between the stress intensity factor at the incipient crack tip and the hydride rim thickness. The crack is originated with brittle manner within the hydride rim and subsequent ductile shear is initiated at the tip. Then the crack propagates by repeating the localized ductile fracture at the tip. The above mentioned hydride assisted PCMI failure occurs only in the early stage of the transient when cladding surface temperature remains in a relatively low level. If the cladding survives this early phase, the behaviour proceeds to the late phase, post-DNB (departure from nucleate boiling) process; then, cladding temperature increases rapidly and the ductility of the cladding increases. It is accordingly expected that the threshold of the PCMI failure becomes higher with an elevated initial temperature condition, but a margin at the high temperature remains unknown. The coolant condition of the NSRR experiments with irradiated fuels had been limited for a room temperature and an ambient pressure, but we started tests at a high temperature by using the newly developed capsule. Some fuels have been subjected to both the high temperature and room temperature experiments and the effects of coolant temperature are being calcified [2–4]. Two pulse irradiations of the PWR MOX fuels, BZ-1 (48 MW·d·kg-1) and BZ-2 (59 MW·d·kg-1) were performed with a reactivity insertion of $4.6 and with coolant conditions at a room temperature and ambient pressure. The fuel enthalpies reached 688 J·g-1 and 644 J·g-1, respectively. The peak enthalpy in the BZ-1 was higher than in BZ-2, because of larger amount of residual fissile material in the fuel due to the lower burnup. Both tests resulted in cladding failure due to PCMI at fuel enthalpies of 318 J·g-1 and 545 J·g-1, respectively, which are above the PCMI failure threshold with an adequate margin. These facts confirmed the applicability of the current Japanese criteria to the high burnup MOX fuel. In the correlation between fuel enthalpy at failure and cladding oxide thickness, fuel enthalpies at failure in the two MOX tests BZ-1 and -2 are consistent with a tendency derived from number of tests on UO2 fuels, and in turn indicate that any MOX effects do not appear. The threshold of fuel failure due to PCMI only depends on the cladding state with the PCMI loading dependent only on the pellet thermal expansion [5].
3. LOCA STUDY In a safety analysis for a postulated loss of coolant accident (LOCA), the fuel cladding is exposed to steam at high temperatures for several minutes until the emergency core cooling water quenches the fuel bundle. The cladding, therefore, could be severely oxidized and embrittled. The Japanese LOCA criteria require that the oxidation of the cladding, calculated by using the Baker-Just oxidation rate equation, shall not exceed 15% of the cladding thickness (equivalent cladding reacted (ECR)). The limit is mainly based on thermal shock resistance (fracture/no-fracture boundary) of oxidized cladding which was experimentally determined under simulated LOCA conditions. As the fuel burnup is increased, corrosion, hydrogen absorption and neutron irradiation become pronounced, resulting in degradation of cladding mechanical property. The LOCA criterion is based mostly on the data

19
obtained with unirradiated cladding. Therefore, thermal shock resistance of the high burnup fuel rod has been a great concern for the safety of LWRs. Fuel cladding specimens, irradiated to 66 MW·d·kg-1 and 76 MW·d·kg-1, were tested in the semi-integral quench tests at JAEA [6]. The cladding materials are ZIRLOTM, MDA, M5TM, NDA and LK3/Zry-2. Thickness of oxide layer formed during the reactor operation ranged from 6–100 μm. Hydrogen concentration ranged from 70–840 ppm. The test fuel segment consisting of the high burnup fuel cladding and dummy pellets was isothermally oxidized after the rupture, namely from both the inner and outer surfaces, for a predetermined period. After the isothermal oxidation, the rod was cooled in the steam flow to about 970 K and finally quenched with water flooding from the bottom. To achieve the constrained condition during the quench, which is expected in the bundle geometry, both ends of the test rod was fixed just before the cooling stage initiates. The tensile load increases as the rod is cooled and quenched because cladding shrinkage is restrained. Since fully constraint condition is too severe, the restraint load was controlled not to exceed 540 N. The test rods were isothermally oxidized at temperatures from 1459–1480 K, for the time range from 122–719 s. One test rod with ZIRLOTM cladding that was oxidized to a higher ECR, 38%, fractured during the quench. Significant secondary hydriding, ~1570 ppm, occurred in the cladding and the fracture condition is consistent with the fracture criteria for unirradiated Zircaloy-4 specimens with similar hydrogen concentrations. The other specimens, which were oxidized to 18.227.2% ECR, survived the quench. The obtained fracture/no-fracture conditions of the tested cladding specimens indicate that the fracture threshold is not reduced so significantly by high burnup and use of new alloys in the examined burnup level. The results also show that the fracture boundary of the high burnup fuel cladding is sufficiently higher than the limit, 15% ECR, in the Japanese LOCA criteria. Isothermal oxidation test was performed with specimens prepared from high burnup fuel rods [2–7]. The oxidation rate constants of high burnup cladding were lower than those of the unirradiated cladding at relatively low temperatures. Growth of the high temperature oxide on the cladding OD was small, which was possibly caused by the retarding effect of the preformed corrosion layer. The results of oxidation test on unirradiated cladding specimens indicate that the influence of the composition changes may be small on the oxidation kinetics under the LOCA conditions. Ring compression tests were conducted with high burnup fuel cladding specimens which had been subjected to the semi-integral quench tests [8]. The plastic strain to failure and the maximum load measured in the ring compression tests decrease with increasing oxidation and hydrogen. Although the examined fuel cladding specimens did not fracture in the semi-integral quench tests, most of the specimens sampled from the segments exhibited brittle nature in the ring compression tests. This obvious discrepancy between the fracture/no-fracture criterion and the embrittlement criterion is likely caused by difference in the loading conditions in the two tests.
4. FUNDAMENTAL STUDIES
To evaluate and interpret results from the integral RIA/LOCA experiments and clarify the fuel behaviour under accidental conditions, fundamental studies are conducted at JAEA. Experimental and analytical studies have been conducted on mechanism of corrosion of Zr-Nb alloys and hydride embrittlement, fission gas release and thermal conductivity in the high burnup fuels [9–14]. Failure mechanism of the high burnup cladding under RIA conditions has been one of great concerns for the fuel safety and JAEA has conducted related studies [15–16]. Mechanical property tests are conducted as part of the fundamental studies at JAEA. A part of the hydrogen which is absorbed by the fuel cladding during the reactor operation precipitates as zirconium hydride. It has been pointed out for high burnup PWR fuel that most the hydrides are precipitated in the outer region of fuel cladding as so-called hydride rim and the hydrides strongly affects the failure behaviour during RIA. Due to the stresses generated by PCMI under RIA conditions, it is considered that many incipient cracks pass through the region of hydride rim and one

20
of the incipient cracks propagates and penetrates the cladding tube wall. It is possible that the crack propagation from the hydride rim region is influenced by the existence and distribution condition of hydrides around the tip of the incipient crack. In order to clarify the effect of the hydrides precipitated around the tip of the incipient crack on the failure behaviour of cladding tube, we prepared cladding tubes which had a radial incipient crack in the outer peripheral region of tube and carried out the expansion due to compression (EDC) test. In the cladding tube hydride in LiOH solution, it was observed that the hydrides precipitated in parallel to the radial direction of the cladding. The EDC test results showed that the incipient crack propagates along the radial hydrides. The stress intensity factor at cladding tube failure was evaluated by using the sum of incipient crack depth and precipitated hydride length instead of incipient crack depth. These evaluation results indicated that the hydrides connected to an incipient crack are very brittle and behaves like a pre-existing crack. It has been pointed out that the stress condition of the cladding tube of high burnup fuel is complicated under RIA conditions because fuel pellet and cladding bond significantly in high burnup fuel. It is considered that the stress condition is biaxial under such condition due to the isotropy of pellet thermal expansion. While it is well known that the fracture behaviour of cladding tube strongly depends on the stress condition of cladding tube, the effect of biaxiality on the fracture and deformation behaviour of cladding tube has not been fully investigated even for unirradiated material. Since such biaxial stress condition cannot be simulated by common uniaxial stress testing technique, a biaxial stress testing machine was developed to control the axial and circumferential stresses independently and evaluate the mechanical and fracture behaviours of cladding tube under biaxial stress conditions. 5. DEVELOPMENT OF COMPUTER CODES FEMAXI is for the fuel behaviour under normal operation and off-normal conditions [17], and RANNS is for the fuel behaviour under accident conditions [18]. FEMAXI-7 is the latest version, having incorporated such extensions as Re-start function, a rate law model of grain boundary fission gas bubbles, Helium infusion and effusion in fuel pellets, etc. A number of comments have been inserted in the source code to clarify the physical meanings of variables and calculation algorithm for an easy grasp by users. Code validations are under way by using the Halden irradiation test data and by participation in the FUMEX-III benchmark. The RANNS code succeeds the initial conditions of rod, if it is irradiated, from FEMAXI-7 calculation to perform the analysis of RIA experiments. In the current version of RANNS, major emphasis is placed on the development and evaluation of such models as cladding surface heat transfer change at the onset of and recovery from DNB, grain separation and burst release of fission gas, criteria of crack propagation in the PWR cladding, etc. In the NSRR experiments FK-1 and FK-2 (BWR rods), similarly to several other experiments with irradiated fuel rods, a marked difference has been observed between calculated and measured values of axial elongation rates of pellet stack and cladding following the pulse power generation. To analyse the cause of this difference, some calculations were attempted in which hypothetical buffer elements were introduced in the pellet stack geometry to simulate the effect of crack spaces in pellets against thermal expansion [19]. However, the measured elongation behaviour was not reproduced. This suggests that a “dynamic model” is necessary to cover a presumable visco-elasticity of pellet stack and even inertial displacement of rod structure including sensor system because of the very rapid phenomena. 6. NEW RIA/LOCA PROGRAM WITH ADVANCED FUELS
Advanced cladding materials with high corrosion resistance and pellets with lower fission gas release are developed to improve the performance of the fuel. In view to obtaining regulatory data for the advanced fuels, JAEA started the New RIA/LOCA program. High burnup UO2 and MOX fuels

21
irradiated to 4991 MW·d·kg-1U (local burnup) in six European commercial reactors and UO2 disk specimens irradiated to about 130 MW·d·kg-1U at the Halden reactor. The cladding materials are M-MDA, low-Sn ZIRLOTM, M5TM, Zircaloy-2/LK3. Doped fuel pellets are used in some BWR fuels. The fuels were shipped to JAEA-Tokai at the beginning of 2011 and will be subjected to the series of experiments including RIA tests, LOCA tests and post-test examinations.
7. FUTURE STUDY
Fuel behaviour in a severe accident has been extensively studied by post-accident examination of the TMI-2 reactor core, large scale bundle experiments [20–24] and laboratory-scale separate effect tests [25–27]. The results of the experiments were incorporated into the severe accident analysis codes such as MELCOR [28], SCDAP [29] and ICARE2 [30]. Greatest efforts are made to recover the damaged power plants at the Fukushima-Daiichi NPP. In addition, examinations and analyses are made to estimate the damage of the plants and the distribution of molten fuels. Although the melt progression has been preliminarily estimated, the status inside the power plant is still unclear and there are still uncertainties in terms of melt progression and release of radioactive materials. Research subjects on fuel behaviour under severe accident conditions, which have been postulated and newly came into view after the accident at the Fukushima-Daiichi NPP, are currently reviewed to improve the severe accident analysis and provide useful information for recovering the damaged power plants. In parallel, researches for further improvement of the existing reactors are considered for beyond-DBA conditions as well as DBA conditions, including long term cooling after LOCA.
8. CONCLUSIONS
An extensive program on fuel behaviours during postulated accident conditions has been performed in JAEA. The program promotes a better understanding of the behaviour and provides a database for regulatory criteria. Key observations from the RIA experiments include the hydride assisted PCMI failure, rod deformation due to PCMI loading and post-DNB gas loading, fission gas release, etc. The current PCMI failure criteria do not account for the potential of initial temperature effects. The results from scheduled RIA tests in the NSRR with the high temperature capsule will enable a scaling of the data points obtained in room temperature conditions. It is anticipated that these tests at a higher initial temperature will provide a benchmark to scale the initial temperature effects and provide a precise assessment of safety margin. The efforts keep concentrating on mechanisms of fuel failure, post-failure events, fission gas dynamics, and further development and verification of the RANNS code. The semi-integral quench tests are performed with high burnup fuel cladding in the ALPS program. Nine tests with high burnup PWR cladding, including ZIRLOTM, MDA, NDA, M5TM and Zircaloy-2/LK3, have been performed. As a consequence, data base was extended from 44 MW·d·kg-
1U to 77 MW·d·kg-1U. Fracture boundary is not reduced significantly by high burnup and use of new alloys in the examined burnup level, though it may be somewhat reduced with pre-hydriding as observed in unirradiated Zircaloy-4 cladding. Mechanical property tests, microstructure observations and theoretical analyses are conducted to obtain fundamental data necessary for the evaluation of the results of the RIA and LOCA experiments and clarify the fuel failure mechanism. The EDC tests with pre-cracked and/or hydride cladding and biaxial stress tests are conducted to evaluate the fuel behaviour under RIA conditions. FEMAXI is for the fuel behaviour in normal operation and off-normal conditions, and RANNS is for the fuel behaviour in accident conditions, i.e. RIA and LOCA. Development of the two codes has been

22
steadily progressed. FEMAXI-7 is the latest version, having incorporated such extensions as re-start function, a rate law model of grain boundary fission gas bubbles, helium infusion and effusion in fuel pellets, etc. In the current version of RANNS, major emphasis is placed on the development and evaluation of such models as cladding surface heat transfer change at the onset of and recovery from DNB, grain separation and burst release of fission gas, criteria of crack propagation in the PWR cladding, etc.. JAEA have started the new experimental program in order to obtain the database on the behaviour of the advanced fuels under accidental conditions. High burnup UO2 and MOX fuels irradiated to 4991 MW·d·kg-1U in European power plants are shipped to JAEA and subjected to the RIA and LOCA studies. In consideration of the accident at the Fukushima-Daiichi NPP, review of the research program is being required and studies on the fuel behaviour in design basis accidents, beyond design basis accidents and severe accidents are proposed and discussed at JAEA.
REFERENCES
[1] FUKEATA, T., SASAJIMA, H., SUGIYAMA, T., Behaviour of high burnup PWR fuels with low tin Zircaloy-4 cladding under reactivity initiated accident conditions, Nucl. Technol. 133 (2001) 50.
[2] FUKEATA, T., NAGASE, F., SUGIYAMA, T., AMAYA, M., Behaviour of high burnup LWR fuels during design basis accidents; key observations and an outline of the coming program, Proc. of 2010 LWR Fuel Performance Meeting/Top Fuel/WRFPM, Orlando (2010).
[3] TOMIYASU, K., SUGIYAMA, T., FUKETA, T., Influence of cladding-peripheral hydride on mechanical fuel failure under reactivity-initiated accident conditions, J. Nucl. Sci. Technol. 44 (2007) 1070.
[4] SUGIYAMA, T., UDAGAWA, Y., FUKETA, T., Evaluation Of initial temperature effect on transient fuel behaviour under simulated reactivity-initiated accident conditions, J. Nucl. Sci. Technol. 47 (5) (2010) 439.
[5] FUKEATA, T., SUGIYAMA, T., UMEDA, M., et al., Behaviour of LWR/MOX Fuels under reactivity-initiated accident conditions, Proc. of Top Fuel 2009, Paris (2009).
[6] NAGASE, F., CHUTO, T., FUKETA, T., Behaviour of high burnup fuel cladding under LOCA conditions, J. Nucl. Sci. Technol. 46 (7) (2009) 763.
[7] CHUTO, T., NAGASE, F., FUKETA, T., High temperature oxidation of Nb-containing Zr alloy cladding in LOCA conditions, Nuclear Engineering and Technology 41 (2) (2009) 163.
[8] NAGASE, F., CHUTO, T., FUKETA, T., Ring-compression ductility of high burnup fuel cladding after exposure to simulated LOCA conditions, J. Nucl. Sci. & Tech. 48 (11) (2011) 1369.
[9] UDAGAWA, Y., YAMAGUCHI, M., ABE, H., et al., Ab initio study on plane defects in zirconium- hydrogen solid solution and zirconium hydride, Acta Materialia 58 (2010) 3927.
[10] UDAGAWA, Y., YAMAGUCHI, M., TSURU, T., ABE, H., SEKIMURA, N., Effect of Sn and Nb on generalized stacking fault energy surfaces in zirconium and gamma hydride habit planes, Philosophical Magazine 91 (2011) 1665.
[11] NAKAMURA, J., AMAYA, M., NAGASE, F., FUKETA, T., Thermal conductivity change in high burnup MOX fuel pellet, J. Nucl. Sci. Technol. 46 (9) (2009) 944.
[12] AMAYA, M., NAKAMURA, J., NAGASE, F., FUKETA, T., Thermal conductivity evaluation of high burnup mixed-oxide (MOX) fuel pellet, J. Nucl. Mater. 414 (2011) 303.
[13] AMAYA, M, SUGIYAMA, T., NAGASE, F., et al., Fission gas release in BWR fuel with a burnup of 56 GW·d·t-1 during simulated reactivity initiated accident (RIA) condition, J. Nucl. Sci. Technol. 45 (5) (2008) 423.

23
[14] SASAJIMA, H., SUGIYAMA, T., CHUTO, T., et al., Identification of radial position of fission gas release in high burnup fuel pellets under RIA conditions, J. Nucl. Sci. Technol. 47 (2) (2010) 202.
[15] UDAGAWA, Y., SUZUKI, M., SUGIYAMA, T., FUKETA, T., Stress intensity factor at the tip of cladding incipient crack in RIA-simulating experiments for high burnup PWR fuels, J. Nucl. Sci. Technol. 46 (10) (2009) 1012.
[16] SUGIYAMA, T., UDAGAWA, Y., SUZUKI, M., NAGASE, F., Influence of coolant temperature and power pulse width on fuel failure limit under reactivity-initiated accident conditions, Proc. Water Reactor Fuel Performance Meeting, Chengdu (2011).
[17] UDAGAWA, Y., SUZUKI, M., FUKETA, T., Analysis of MOX fuel behaviour in Halden reactor by FEMAXI-6 code, J. Nucl. Sci. Technol. 44 (8) (2007) 1070.
[18] SUZUKI, M., SUGIYAMA, T., FUKETA, T., Thermal stress analysis of high burnup LWR fuel pellet pulse-irradiated in reactivity-initiated accident conditions, J. Nucl. Sci. Technol. 45 (11) (2008) 1155.
[19] SUZUKI, M., HANAWA, S., PCMI analysis on NSRR RIA experiments FK-1 and FK-2 by RANS code, IAEA CRP FUMEX-III 2nd Workshop, Pisa (2010).
[20] JENSEN, S.M., et al., OECD LOFT Project post irradiation examination data and analysis for OECD LOFT fission product experiment LP-FP-2, Volume 1, OECD LOFT-T-3810 (1989).
[21] PETTI, D.A., et al., Power burst facility (PBF) severe fuel damage test 1–4 test results, NUREG/CR-5163 (1988).
[22] GAUNTT, R.O., et al., Results and phenomena observed from the DF-4 BWR control blade-channel box test, Proceedings of the Int’l ENS/ANS Conference on Thermal Reactor Safety (1988) 1877.
[23] HOFMANN, P., Metallographic examination of the severe fuel damage scoping test, (SFD-ST) fuel rod bundle cross sections, NUREG/CR-5119 (1988).
[24] SCHANZ, G., et al., Information on the evolution of severe LWR fuel element damage obtained in the CORA program, J. Nucl. Mater. 188 (1992) 131.
[25] HERING, W., HOFMANN, P., Material interactions during severe LWR accidents, KfK 5125 (1994).
[26] HAYWARD, P.J., et al., Dissolution of UO2 in molten Zircaloy-4. Part 3: Solubility from 2000–2500C, J. Nucl. Mater. 232 (1996) 1–12.
[27] NAGASE, F., et al., B4C/Zircaloy reaction at temperatures from 1173–1953K, J. Nucl. Sci. Technol. 34 (4) (1997) 367–374.
[28] GAUNTT, R.O., et al., MELCOR Computer Code Manuals: Primer and User's Guide Version 1.8.5, NUREG/CR-6119, Vol. 2, Rev. 2 (2000).
[29] ALLISON, C.M., et al., SCDAP/RELAP5/MOD 3.3 code manual, NUREG/CR-6150, INEL 96/0422, Rev. 1 (1997).
[30] FICHOT, F., et al., A computer code for severe accidents in LWRs: Description of physical models, IPSN Technical Note SEMAR 00/03, Cadarache (2000).


25
IRSN R&D STUDIES ON FUEL BEHAVIOUR UNDER RIA CONDITIONS
M. PETIT, O. MARCHAND, F. BARRÉ, P. GIORDANO IRSN/DPAM
Saint Paul Lez Durance, France Email: [email protected]
Abstract
The RIA is a design basis accident (DBA). The safety requirements are defined in order to limit the fuel pellets melting and the number of fuel rods affected by boiling crisis and to avoid fuel dispersion in the primary coolant. CABRI International Programme: UO2 and MOX rod tests were carried out by IRSN between 1993 and 2000 in the sodium loop of the CABRI reactor within the CABRI REP-Na programme. This programme addressed the first part of the RIA transient (PCMI phase). These tests clearly showed the need to define new criteria for irradiated fuel and to generate new fuel behaviour data. The CABRI International Programme (CIP), under OECD auspices, with a broad international cooperation, is addressing questions concerning the transient fission gas behaviour and its impact on clad loading during the entire transient, the rod behaviour with high clad temperature and internal pressure and the post-failure phenomena (fuel ejection, fuel coolant interaction with finely fragmented solid fuel). Extension of CIP: Based on the state of the art and on the needs identified in particular during the recent OECD-NEA workshop on fuel behaviour under RIA, a proposal for the extension of the CIP addresses the following aspects: i) post dry-out phenomena; ii) fuel ejection and fuel coolant interaction; iii) initial power level; iv) late energy deposition; v) new fuel designs; vi) intermediate burnup range 35–55 GW·d·t-1. Modelling and code development: Data and modelling are derived for implementation in the SCANAIR code that has been developed for quantitative interpretation of the results and translation to reactor conditions. This tool, dedicated to the description of the global fuel rod behaviour in reactor conditions, has been intensively validated for the PCMI phase of the accident. Recent developments implemented in SCANAIR were devoted to the modelling of the post-DNB phase. In addition, more detailed models with a multiscale approach are developed, allowing the confirmation of the necessarily simplified models implemented in SCANAIR. The latest version of SCANAIR has been assessed by comparison to a large set of integral experiments from the CABRI, NSRR and BIGR programmes. 1. INTRODUCTION In the frame of its research programmes on fuel safety, the French “Institut de Radioprotection et de Sûreté Nucléaire” (IRSN) studies the fuel rod behaviour during an RIA. The RIA is a design basis accident (DBA) for light water reactors (LWRs). In pressurized water reactor (PWR), the postulated RIA scenario is initiated by the mechanical failure of a control rod mechanism housing followed by a possible control rod ejection (REA). In France, it is the reference event for all accident situations in which a reactivity insertion is involved. Considering the reactivity addition, the most severe REA should occur at normal operating coolant temperature and pressure, but nearly zero reactor power (HZP). However, studies in progress at IRSN suggest that intermediate initial powers must also be considered because HZP conditions are not necessarily conservative for the rod integrity. If the reactivity addition is sufficient, the reactor becomes prompt critical. The power rises rapidly but is limited by the negative fuel temperature feedback (Doppler effect). Energy injection lasts a few tens of milliseconds. In the vicinity of the ejected rod, fuel assemblies are subjected to a very fast and short power pulse. Several failure modes of the cladding can be postulated during the transient [1]. At an early stage, because of the rapid power surge, the heating of the fuel pellets is nearly adiabatic. The thermal expansion may cause deformation of the cladding by pellet–clad mechanical interaction (PCMI). At this stage, clad material temperatures are still relatively low. The cladding can fail following a brittle mode. This typical PCMI induced clad failure mode is considered to be the most restricting for high burnup fuel rods mainly because of the embrittlement of the cladding material and more severe PCMI

26
conditions. Then, at a later stage, heat is transferred from the pellets to the clad material. High temperatures are reached and the boiling crisis may occur. Clad temperatures may remain above 800°C for several seconds. The clad mechanical loading is then controlled by the inner gas pressure. In case of overpressurization, this long period at elevated temperature may cause ballooning and lead to clad creep failure. High temperature failure, with clad tube ballooning following the departure from nucleate boiling (DNB), is considered limiting for fresh and low burnup fuel. Then, when the rewetting of the overheated cladding occurs, the quenching may cause brittle fracture of the clad material. Finally, very large deposited energies may cause the melting of the fuel pellets. The production of gas induces the swelling of the molten fuel and the clad tube may fail by overheating or overstraining. After a possible clad failure, hot and fragmented fuel material may disperse into the coolant. The fuel–coolant interaction (FCI) may cause very fast steam generation. The pressure pulse could damage the core components leading to a possible loss of the vessel integrity. Since the early 1990s, several changes occurred in the basic management of nuclear reactor core: burnup increase, introduction of MOX fuel and use of new cladding materials. Such changes have significantly modified the behaviour of nuclear fuel and raise the question of the current safety criteria relevance and the assessment of safety margins involving the proper behaviour of the fuel cladding. In this context, IRSN has initiated an important experimental programme mainly consisting in integral tests on irradiated fuel rods in CABRI reactor in parallel to the development of the SCANAIR code devoted to describe the thermomechanical behaviour of irradiated fuel rod (including UO2 and MOX fuels) under fast power transients. 2. THE CIP PROGRAMME The CABRI International Programme (CIP) launched in 2000 under OECD auspices with a broad international cooperation and partnership of EDF aims at providing new experimental results concerning the behaviour of fuel in RIA under typical pressurized water conditions. The CIP is a follow-up of the CABRI REP-Na programme [2] (1992–2000) that was carried out in the sodium loop of the CABRI reactor (The CABRI reactor is operated by the French Commissariat à l’Energie Atomique et aux Energies Alternatives (CEA)) and that mainly showed the deleterious influence of a high clad corrosion level with hydride concentration (rim or blisters) on clad failure and the contribution of grain boundary gases on fission gas release (FGR) and potential gas loading, especially in MOX fuel, during the early phase of a fast power transient with limited clad heatup. Moreover, the failures of some UO2 and MOX fuel rods at enthalpy levels ranging from 125–472 J·g-1 (30–113 cal·g-1) demonstrated the need of evolution of the present safety criteria pertaining to fuel behaviour. Separate effect tests were also launched for the mechanical characterization of the cladding material (PROMETRA programme [3] for Zr-4, ZIRLOTM, M5TM and Zr-2) and for the study of clad–water heat transfer under fast transients [4–5] (including the PATRICIA programme) which underlined the influence of the clad heating rate on the boiling crisis conditions as compared to steady state conditions (increase of critical heat flux and critical temperature). Data and modelling are thus derived for implementation in the SCANAIR code [6] that has been developed for quantitative interpretation of the results and translation to reactor conditions. 3. MAIN OUTCOMES FROM THE CIP0 TESTS The first tests of the CIP were the two CIP0 reference tests [7], that have been performed in 2002 in the sodium loop in order to give a first answer on the behaviour of PWR UO2 rods irradiated at about

27
75 GW·d·t-1 with advanced claddings (CIP0-1 is ZIRLOTM ENUSA rod, CIP0-2 is M5TM EDF-AREVA rod). The main characteristics and results are gathered in Table 1 below. TABLE 1. MAIN CHARACTERISTICS AND RESULTS OF CIP0 RODS
Test Rod Burnup (rodlet)
[GW·d·t-1M]
Clad corrosion (mean) [µm]
Pulse width [ms]
Injected energy (max.)
[cal·g-1]
Results
CIP0-1 (11/29/2002)
A06-ENUSA,
Zirlo clad, span 5
75 75
(100 max.) 32 99
No failure, Hmax.*=93 cal·g-1 Max. strain: 0.5%
CIP0-2 (11/8/2002)
EDF-
AREVA, M5TM clad,
span 5
76 20 28 90 No failure Hmax.*=82 cal·g-1 Max. strain=0.3%
* Hmax.= maximal radially averaged fuel enthalpy (SCANAIR calculation). Both tests with maximum average fuel enthalpy close to 80–90 cal·g-1, did not lead to rod failure and exhibited a low clad deformation without significant evolution of the fuel micro-structure due to transient (except grain boundary separation near free surfaces, at inter-pellets and along cracks). In CIP0-1, the fission gas release appears consistent with the grain boundary gas inventory at such high burnup level. An important oxide layer spalling due to the transient is revealed in CIP0-1 as already evidenced in REP-Na tests with high corrosion level and related to clad straining [8]. In CIP0-2, in spite of the low corrosion thickness (20 µm) of the M5TM cladding, the propensity for spalling of the oxide build-up with M5TM material is confirmed as in REP-Na11. In both tests, a partial hydride re-orientation over 40% of the clad thickness is evidenced. Such phenomenon can be explained by the precipitation under constraint of the already dissolved hydrides: based on the available data in the literature and of the clad temperature and stress evolutions, it can be concluded that the hydride re-orientation occurred late in the test, after power transient and during cooling down at room temperature, due to slow H precipitation kinetics. In CIP0-2 with M5TM cladding and low H content (<100 ppm), all the hydrides are dissolved at 280°C: considering the hoop stress calculated profile (due to fission gas release and residual stresses due to the transient) and the hydride distribution over the clad thickness given by the metallography (Fig. 1), the hydride re-orientation threshold can be estimated in the range of 20–60 MPa. In CIP0-1 test, the clad examinations close to peak power node (PPN) showed in the external part, radial cracks of about 35–45 µm spreading into the metal through the hydride rim (rim depth: 25–50 µm); those cracks are often longer at inter-pellet location in relation with higher rim thickness (Fig. 2).

28
-60
-40
-20
0
20
40
60
80
100
0 20 40 60 80 100% thickness
(M
Pa
)
Inner clad Outer clad
100% radial100% circonferential Radial+circonferential
-60
-40
-20
0
20
40
60
80
100
0 20 40 60 80 100% thickness
(M
Pa
)
Inner clad Outer clad
100% radial100% circonferential Radial+circonferential
FIG. 1. CIP0-2: Clad metallography versus residual stresses at room temperature.
FIG. 2. CIP0-1 clad metallography close to peak power node: cracks inside the hydride rim zone (left), detail at inter-pellet location (right).
4. THE CIP TEST MATRIX The current CIP test matrix is presented in the Table 2 below. TABLE 2. CURRENT CIP TEST MATRIX
Test Rod Main objective 1 CIPQ MOX Zr4 47 GW·d·t-1 Loop qualification – boiling crisis 2 CIP3-1 UO2 Zirlo 75 GW·d·t-1 Post failure events 3 CIP1-2 UO2 M5 77 GW·d·t-1 Boiling crisis 4 CIP4-1 MOX-E M5 65 GW·d·t-1 Microstructure influence on clad loading5 CIP4-2 MOX-SBR Zr4 60 GW·d·t-1 Microstructure influence on clad loading6 CIP3-2 MOX Zr4 55 GW·d·t-1 Post failure events/boiling crisis 7 CIP3-3 UO2 Optimized Zirlo New cladding material 8 UO2 M-MDA SR New cladding material 9 Intermediate burnup or effect of a higher
initial pressure 10 PCI remedy fuel
The choice of the rods to be tested is discussed in the Technical Advisory Group of the CIP programme. When possible, pre-calculations of the foreseen tests are performed in order to check the consistency of the selected tests conditions to the main objective assigned to a particular test.

29
The CIPQ test main objective is the qualification of the experimental setup design. A MOX fuel with a moderate burnup was chosen in order to allow a high level of injected energy, thus maximizing the clad hoop strain during the transient. During this test, occurrence of the boiling crisis is very likely due to the energy level anticipated. Boiling crisis is also expected in the CIP1-2 test. This test is also a counterpart of the CIP0-2 test performed in the sodium loop; it is expected to be very helpful for quantifying the effect of coolant on the RIA phenomenology. The CIP3-1 and CIP3-2 test are intended to provide results related to the possibility of fuel dispersal and fuel interaction with water after clad failure. CIP3-1 is a rod similar to CIP0-1, but it will be tested in more severe conditions (shorter pulse, higher energy injection). Based on the CIP0-1 post-test examination and pre-calculations results, failure of CIP3-1 is considered very likely. The CIP3-2 is a rod similar to REP-Na7 that failed in the sodium loop. Again, the comparison between the two experiments will help in understanding the effect of the coolant on the behaviour under RIA conditions. The CIP4-1 and CIP4-2 experiments are related to MOX behaviour. They involve pellets with respectively heterogeneous and homogeneous microstructure. It is thought that they will bring new elements in order to address the issue of a possible “MOX effect” under fast transient conditions [9]. Other tests are devoted to investigate the behaviour of new cladding materials, such as optimized ZIRLOTM and stress relieved M-MDA, or new pellet types, such as chromia doped fuel that is intended to lower the PCI failure risk. 5. THE CIP PROGRAMME EXTENSION Based on the state of the art [1] and on the needs identified in particular during the recent OECD-NEA workshop on fuel behaviour under RIA [9], issues were identified for which more experimental results than already planned will be required. These issued are the followings:
post dry-out phenomena;
fuel ejection and fuel coolant interaction;
initial power level;
late energy deposition;
new fuel designs;
intermediate burnup. The question of fuel rod behaviour after boiling crisis is to be investigated further, because only very limited experimental data is available. It is particularly important for this topic to conduct experiments under prototypical system pressure; otherwise the pressure differential applied to the cladding would not be representative either initially or during the transient (or even for both). Although some tests of the present CIP test matrix will give insights on the phenomena, more results will be highly desirable because the physics involved is complex. Indeed, the final result will be a balance between energy deposition, thermal behaviour (effect of oxide layer), and fission gas release during the transient, clad creep behaviour and clad strain bearing capability. All those phenomena are burnup dependent. It might then be worth testing not only high burnup rods but also intermediate burnup ones. In case of cladding rupture, some amount of fuel may be dispersed into the coolant and thermally interact with it. Part of the thermal energy will be converted into mechanical energy when pressure builds up into the coolant channel due to water vaporization. In such a case, it is important to be able to evaluate the pressure peak and its possible effect on the surrounding structures. In particular, determining whether neighbouring unfailed rods could break due to the initial pressure pulse, thus

30
propagating the accident to an increasing number of rods, is of particular interest. Because the magnitude of the interaction depends much on the respective quantities of fuel and water, it is highly desirable to have representative geometric conditions (flow channel thickness) as in the CIP test devices in order to derive energy conversion ratios representative of reactor conditions. Reactivity initiated accidents may occur not only from zero power state, but also from operating conditions including a certain level of reactor power. The initial state of the fuel rods has an impact on the power pulse characteristics, but also obviously on the possibility of reaching boiling crisis, and possibly on the fission gas release. Whether this type of scenario is enveloped or not by zero power situation is an open issue because no test has been conducted yet with such initial conditions. A recent study [10] related to the PCMI failure risk suggests it may not be the case. The late energy deposition results from the dissymmetry of RIA pulses in power reactors. This is usually not reproduced by test reactors for which the power pulse shape is rather symmetrical. If a fuel rod experiences boiling crisis, then the decrease of the heat transfer to the coolant is such that the late energy deposition may result into largely increased dry out duration. In turn, the cladding strain due to cladding creep would also increase because it depends directly on the time the rod remains at high temperature. Fission gas release may also be enhanced. Finally, this late energy deposition, at relatively low power level, may have a large influence on the cladding strain and integrity. Because of the continuous efforts of fuel vendors to improve the behaviour of their fuel pellets, there is no doubt that new fuel pellet designs will be of interest in the future for possible industrial application. Indeed, such new designs, never tested under RIA conditions are already under irradiation in commercial and research reactors. This is for example the case of chromia and/or alumina doped fuel, low temperature fuel containing Be oxide. MOX fuel with additives is also considered in some countries. If such fuels prove to be valuable for normal operation, then their behaviour under accident conditions, in particular RIA, must be checked before their industrial use. Finally, the review of the database shows that experimental results are mainly available for zero to low (<33 GW·d·t-1) burnup and for high burnup (>45–50 GW·d·t-1). It corresponds respectively to experiments performed in the 60s and 70s to support the establishment of the initial RIA safety criteria, and to experiments performed since the 90s to address the specific issue of high burnup. However, a very limited number of experiments are available for the intermediate burnup range (~35–55 GW·d·t-1). This is most probably one of the reasons why failure limits proposed by different organisations worldwide differ much in that intermediate burnup range [11–12]. 6. MODELLING AND CODE DEVELOPMENT In conjunction to its experimental activities, IRSN develops the SCANAIR code that is used for pre-calculations to help in selecting the conditions of future tests and for transposing the experimental results to reactor conditions. During the course of the REP-Na programme, the SCANAIR development and assessment was oriented toward the description of the PCMI phase. More recently, new developments were implemented that deal with the fuel behaviour following the boiling crisis. 7. GENERAL DESCRIPTION OF SCANAIR SCANAIR is a so-called 1.5D code designed to model a single rod surrounded by a coolant channel and possibly limited by an external shroud. It is also possible to simulate a capsule geometry [13]. SCANAIR is a set of three main modules dealing with thermal dynamics (including thermal-hydraulics in the coolant channel), structural mechanics and gas behaviour. These modules communicate with each other through a database (Fig. 3).

31
The initial rod state is an input data of the SCANAIR calculation given by an irradiation code. Interfaces with several irradiation codes are currently available. Presently, IRSN uses FRAPCON-3 irradiation code, developed by the Pacific Northwest National Laboratory (PNNL) for the US National Regulatory Commission (NRC) [14]. The power transient is an input data computed by neutron kinetics codes or measured from experimental tests. In the present version, SCANAIR evaluates the risk of clad failure in the brittle mode with the specific CLARIS module validated for the PCMI stage [15].
FIG. 3. Schematic view of SCANAIR general processing.
8. RECENT DEVELOPMENTS IN SCANAIR Recent developments in SCANAIR were oriented towards the modelling of the post-DNB phase [16]. This includes the implementation of specific clad mechanical laws to address the behaviour of Zircaloy alloys at temperatures above 600°C, clad to coolant heat transfer correlations that take into account the transient nature of the RIA conditions and a more elaborated model for gas flow in the fuel pins. 8.1. Clad viscoplastic behaviour During the first stage of the RIA, when the strain rates can be greater than 1 s-1 and as long as the clad temperatures remain fairly low, the clad mechanical behaviour is accurately modelled with a perfect elasto-plastic law. When clad temperatures exceed 600°C, viscous phenomena are not negligible anymore. The clad ballooning becomes possible. The clad plastic behaviour is then modelled as an elasto-viscoplastic body. The non-elastic part of the mechanical deformation is separated in two contributions: a perfect plastic strain given by Prandtl Reuss law and a viscoplastic strain given by several available laws (Lemaitre or Norton formulations [17]). Zircaloy creeping velocities become significant after the transition to the phase. When the transient was not energetic enough for heating up the clad to the transition temperature or when the clad failure occurred by PCMI during the first milliseconds, the creeping effects can be neglected. If the DNB is reached, the clad temperatures increase, the clad creeping becomes significant. The code is able to compute clad ballooning with the limitation of no excessive strain location and negligible shear stresses.

32
Two formulations are available in SCANAIR v7. The anisotropic Lemaitre formulation aimed at modelling the plastic behaviour on the whole temperature domain and the Norton formulation aimed at modelling the high temperature secondary creeping mechanism. This second formulation is activated beyond a limit temperature. These two models exclude each other. 8.1.1. Anisotropic Lemaitre formulation The perfect plastic part of the deformation is assumed zero and the plastic deformation is entirely modelled thanks to the viscoplastic law. The partition of the mechanical deformation is the sum of elastic (
el ) and viscoplastic (vp ) contribution:
vpelmec .
The flow rule for the anisotropic formulation is:
Mvpvp
(1)
Where M is the Hill symmetric anisotropic tensor. Its components are assumed to be constant. The equivalent viscoplastic strain rate (
vp ) is function of equivalent stress ( ) and viscoplastic
cumulated strain (vp ) following the Lemaitre formalism:
m
nvp
vp K
1
(2)
The Hill’s equivalent stress is defined as: :: M The material parameters (K, m and n) are dependent on temperature and fast neutron fluence and were identified from mechanical tests. 8.1.2. Norton formulation The non-reversible mechanical deformation is assumed to be the superposition of an instantaneous plastic deformation (
pl ) and a viscoplastic (or creeping) deformation (vp ). The partition of the
mechanical deformation is: vpplelmec
This decomposition allows the modelling of fast deformation during the clad loading and, in the same time, slower deformation during the creeping phase. For high stresses, the creeping strain rate increases and the deformation mechanism is mainly caused by plasticity. The plastic contribution to the mechanical deformation is modelled with a perfect plastic model given by Prandtl-Reuss laws. The viscoplastic contribution is aimed at modelling the high temperature secondary creeping (“dislocation creeping”). The model is activated beyond a limit temperature. The formulation is based on a Norton power law. The equivalent strain rate depends on the Von Mises equivalent stress. Using the flow rule for Von Mises material, the viscoplastic strain rate is written as:
mvpvpvp K
s
with 2
3 (3)
Where s is the deviatoric part of the stress tensor.

33
The material properties K and exponent m depend on the material state and are functions of temperature. For Zircaloy cladding, phases and transition mixture follow distinctive laws. Kinetics of the phase transition is modelled. 8.2. Clad to coolant heat transfer Among the numerous physical parameters involved in a RIA, the clad temperature evolution plays a particular role because it strongly influences the clad mechanical strength. Clad-to-coolant heat transfers were studied upon PWR conditions (15 MPa, 280°C, 4 m·s-1) with the out-of-pile PATRICIA experimental programme [4] and NSRR [5] conditions (0.1 MPa, room temperature, stagnant water) thanks to the thermocouples welded on the clad outer surface. Figure 4 illustrates schematically the evolution of the clad-water heat flux versus the clad temperature. The red solid line represents the typical boiling curve in the case of the NSRR low temperature experiments and the blue dotted line is based on the typical correlations used for steady-state conditions.
Steady-state
Heat-flux
Clad surface temperatureTsat
1-3 MW/m²
Film boiling
Degradation of heat transferdue to vapor film thermal insulation
Transient conductionin liquid water
Intense transientvaporizationat the clad surface
7-13 MW/m²
Tsat+20°CNatural convection
Steady-state
Heat-flux
Clad surface temperatureTsat
1-3 MW/m²
Film boilingFilm boiling
Degradation of heat transferdue to vapor film thermal insulationDegradation of heat transferdue to vapor film thermal insulation
Transient conductionin liquid waterTransient conductionin liquid waterTransient conductionin liquid water
Intense transientvaporizationat the clad surface
7-13 MW/m²
Intense transientvaporizationat the clad surface
7-13 MW/m²
Tsat+20°CNatural convectionNatural convection
FIG. 4. Modeling of the clad-water heat flux. It can be seen from this figure that using steady-state correlations for the case of fast transients would lead to a large overestimation of the clad temperature in the case where the critical heat flux is reached. Thus, a specific set of correlations and adequate values of the parameters were introduced in the SCANAIR code for both NSRR and PWR conditions. 8.3. Gas flow In the previous SCANAIR versions, the filling gas (helium, argon and air) were only present in the free volumes (plena, gap and central hole). Their possible flows were not calculated because instantaneous pressure equilibrium was assumed. The fission gases alone were able to flow in the radial direction through the opened porosities toward the free volumes (and inversely). With the purpose to calculate non-instantaneous gas flow in the gap, a 2D multi-species gas flow model has been developed and integrated in the 7.0 version of SCANAIR. This new model aims at the simulation of clad ballooning caused by a local over-pressurization in the gap. From now, each

34
gaseous species can flow in radial and axial directions. Axial flow inside the fuel material is certainly negligible because of the lengthened shape of the cylindrical rod but its calculation improves the numerical conditioning of the resolution. The scheme presented in Fig. 5 illustrates the discretization of the pellet stack and the free volumes with the possible gas flow from one mesh to another. The inter-granular gases are released into the porosities and flow through the opened porosities network when the grain boundaries are saturated with inter-granular bubbles or when over-pressurization exceeds the mechanical resistance of the material. At the initial state before the beginning of the transient, porosities and free volumes are filled with gases coming from irradiation, from the rod gases filling or from the atmosphere. The porosities are assumed to be filled with fission gases and Helium. The gases flow across the opened porosities according to the pressure gradient induced by the temperature gradient and the possible release from grain boundaries. The flow rate depends on porous medium permeability and on the gas viscosity. It is characterized by the coefficient of permeability. The gas velocity is expressed with a Darcy’s law. Pressure in the free volumes obeys an ideal gas law. The high pressure inside the porosities is calculated with a Van der Waals correction on the volume available for the gas motion.
iiip
Bi
i
bnV
TknP (4)
Where
in is the gas quantity of the species i;
Bk is the Boltzmann constant;
ib is the atomic volume of the species i;
pV is the porosity volume;
T is the temperature. Thanks to the capability of calculating the flow of each gaseous species, the flow of the filling gases present in the free volumes toward the open porosities is computed. This situation can occur after the end of the power transient when the rod is cooling down. Pressure in porosities may become lower than pressure in the free volumes. Gases present in the free volumes are then transferred into the fuel pores. The mass balance equation is solved using a finite volume discretization. Each gaseous species quantity is computed at the centre of each mesh. At time t, for the gaseous species i, the discretized form of this equation for a flow between two radial successive meshes j and j+1 in the axial slice k is written as:
0,,,1,,1,,,,, t
kjit
kjjit
kjjittkji
tkji snnnn (5)
Where
tkjin ,, is the gas quantity;
tkjjin ,1, is the gas quantity flowing between two meshes;
tkjis ,, is the source term modelling the gases coming from inter-granular bubbles.

35
FIG. 5. Gas flow in the 2D multi-species model. Gas flux between two adjacent meshes depends on species concentration, flow velocity and flow section. An upwind scheme (donor cell scheme) is used (i.e. the flux is calculated using the concentration in the mesh with the higher pressure):
tkj
tkj
tkj
tkjt
kj
tkjit
kjji PPtSvV
nn ,1,,1,1
,
,,,1, if (6)
With the Darcy’s law:
t
kjt
kj
tkj
tkjt
kjt
kjt
kj
rr
PPKKv
,,2
,,1,1,,1
2
1,min
(7)
Where
tkjS ,1 is the flow section between the two meshes;
tkjV , is the mesh volume;
tkjv ,1 is the velocity;
tkjK , is the permeability coefficient;
tkjr , is the mesh radius;
tkjP , is the pressure.
When the criteria for gas release are not reached, the permeability coefficient is set to zero, forcing the flow velocity to zero.

36
The mechanical opening of the pellet-clad gap is based on the comparison of the contact pressure (deduced from the stresses computation) and the local pressure in the gap mesh. The validation of this new gas model will be based on the further tests of the CIP programme in the CABRI water loop facilities. The JAEA FGD (fission gas dynamics) experiments in the NSRR reactor will certainly provide better knowledge on kinetics of the fission gas release. 9. ASSESSMENT OF SCANAIR About 100 integral tests carried out in CABRI [2], BIGR [18] and NSRR [1] experimental reactors have been recalculated with the latest SCANAIR version. These tests cover the following rod characteristics:
UO2 and MOX fuel;
fresh fuel and irradiated fuel (up to 77 GW·d·t-1M);
base irradiation in PWR, boiling water reactor (BWR), Russian pressurized-water reactor (VVER) and Japanese Material Testing Reactor (JMTR);
Zircaloy-4, Zircaloy-2, ZIRLOTM, M5TM, MDA, NDA and E110 cladding; The tests have been performed in various conditions:
sodium coolant in CABRI, stagnant water in NSRR and BIGR (at 1 bar and 20°C in most of the cases, at ~70 bar and ~280°C in some of the recent NSRR tests);
pulse width from 2.5–76 ms;
injected energy from 47–233 cal·g-1 at peak power node location. The thermal-hydraulics validation has been performed on integral tests and also on the 20 separate effect tests performed in the PATRICIA facility in PWR and NSRR conditions [4]. 9.1. Assumptions for the SCANAIR calculations The SCANAIR input data decks are resulting from the end-of-life state of the rod calculated with METEOR, TOSUREP or FRAPCON codes. For CABRI tests the rod characteristics before irradiation and the irradiation histories were relatively exhaustive, a calculation has been performed in each case. For NSRR and BIGR tests, as the data were not detailed enough, the initial states have been deduced from the CABRI rods with the closest characteristics. The geometrical description and the clad outer oxide thickness have been corrected when some measurements before tests were available. In particular when oxide spalling has been observed (before or after the RIA transient in some CABRI tests), calculations have been done without oxide layer. The outer fuel rugosity is supposed to be very low (0.1 µm) to model a quasi-perfect fuel-clad heat exchange that is especially the case when the fuel is stuck to the cladding after the creation of an inner zirconia layer for an intermediate burnup. The fuel is assumed to be cracked, before the beginning of the transient (i.e. unresisting to tensile stresses). As a consequence, no tensile stress can exist in the fuel. Considering the high strain rates reached in RIA conditions, the clad and fuel mechanical behaviour has been modelled with a perfect elastoplastic law. The clad mechanical properties are mainly coming from PROMETRA programme; for E110 cladding, the M5TM properties have been chosen. The fuel yield stress has been calculated using a law derived from the ’CANON’ law [19] (for UO2 and MOX fuel).

37
Two different water boiling curves have been used: the first one is deduced from the interpretation of NSRR experiments for NSRR tests, BIGR tests and PATRICIA-NSRR tests, and the second one is deduced from PATRICIA-PWR experiments for PATRICIA-PWR tests. To predict the possible clad failure and the enthalpy at failure during the PCMI phase the CLARIS clad failure model, based on an elastic plastic fracture mechanics approach, has been used. This approach relies on the hypothesis that the PCMI failure is resulting from the propagation in the outer part of the cladding of an existing incipient crack (due to the presence of brittle area with dense hydride). This approach allows calculating, at each time during the PCMI phase, the incipient crack that would lead to the failure of the cladding. Knowing the size of the incipient crack (given in the input data deck), the module can evaluate the failure occurrence and enthalpy at failure. The determination of the incipient crack has been done on clad metallographic examinations performed before or after the tests. If no metallographic examinations were available the hypothesis has been made that the incipient crack, which usually correspond to the clad hydride rim depth, was equivalent to the outer clad zirconia thickness. 10. SELECTED RESULTS This section provides some examples of the global assessment of the SCANAIR code [20]. In some NSRR tests, outer clad temperatures measurements have been made through clad thermocouples welded on the sound clad after oxide removal. This tricky operation has been done in JAEA hot cell for rod with an oxide thickness lower than 35 µm. The comparisons between calculations and measurements on clad maximal temperature and boiling duration in NSRR tests are gathered in Figs 6–7.
FIG. 6. Clad maximal outer temperature - SCANAIR versus experiment for NSRR tests.
FIG. 7. Boiling duration - SCANAIR versus experiment for NSRR tests.
The departure from nucleate boiling (assumed when clad outer temperature exceeds significantly 100°C), which occurs in most cases for an enthalpy higher than ~70 cal·g-1, is globally correctly predicted. Nevertheless in some tests, boiling crisis is not reached for enthalpy equal to or higher than 100 cal·g-1 (for example RH-1 or MR-1). The boiling curve deduced from the results obtained on the fresh pre-oxidized tests [21] gives globally correct results on irradiated rods even if the clad temperature and the boiling time are overestimated in irradiated cases.

38
Clad elongation has been measured during the test with displacement sensor in CABRI tests and some NSRR tests. In NSRR tests, the fissile column was usually about 120 mm; the clad elongation was then relatively low. In CABRI tests the fissile column being higher, usually close to 560 mm; the clad elongation was more significant and in all cases higher than the clad thermal expansion. This result demonstrates the good mechanical sticking between fuel and cladding. The clad maximal elongation is correctly predicted especially in the case of tests with low or medium energy injection (see Fig. 8).
FIG. 8. Maximal elongation - SCANAIR versus experiments for CABRI and NSRR tests.
The failure prediction for CABRI tests and NSRR tests are respectively gathered in Table 3–4. TABLE 3. FAILURE PREDICTION FOR CABRI TESTS
Tests Failure SCANAIR prediction
Failure enthalpy (cal·g-1)
SCANAIR prediction (cal·g-1)
REP-Na2 No No - - REP-Na3 No No - - REP-Na4 No No - - REP-Na5 No No - - REP-Na6 No No - - REP-Na7 Yes Yes 113 131 REP-Na9 No No - -
REP-Na11 No No - - REP-Na12 No No - -
CIP0-1 No No - - CIP0-2 No No - -
The failure prediction has not been done for REP-Na1, REP-Na8 and REP-Na10 tests. In these three tests clad outer oxide spalling occurred during the base irradiation. This phenomenon led to a strongly non-uniform hydride distribution with large hydride blisters in the outer part of the cladding [2]. As

39
the blister depth is erratic, it is not possible to evaluate the size of the initial flaw depth and the CLARIS model has then not been used in these cases. The failure occurrence is correctly predicted in all the other CABRI tests. TABLE 4. FAILURE PREDICTION FOR NSRR TESTS
Tests Failure SCANAIR prediction
Failure enthalpy (cal·g-1)
SCANAIR prediction (cal·g-1)
BZ-1 Yes No 76 - BZ-2 Yes No 130 - BZ-3 No No - -
HBO-1 Yes No 73 - HBO-2 No No - - HBO-3 No No - - HBO-4 No No - - HBO-5 Yes Yes 75 56 HBO-6 No No - - HBO-7 No No - - OI-10 No Yes - 93 OI-11 Yes Yes 117 65 OI-12 No Yes - 88 TK-1 No No - - TK-2 Yes Yes 59 74 TK-3 No No - - TK-4 No No - - TK-5 No No - - TK-6 No No - - TK-7 Yes Yes 84 82 TK-8 No No - - TK-9 No No - -
TK-10 No No - - VA-1 Yes Yes 63 50 VA-2 Yes Yes 54 54 VA-3 Yes Yes 98 101 VA-4 No Yes - 97
The failure occurrence is correctly predicted for the majority of the NSRR-PWR rod tests: 21 good predictions out of 27 cases. Nevertheless, the prediction is worse than for CABRI tests. The difficulty in NSRR tests was to determine accurately the initial flaw depth in particular due to the lack of metallographic examination. When no data were available, the size of the incipient crack was supposed to be equal to the hydride rim depth (that we considered equal to the clad outer thickness). This assumption can be a rather good approximation in the case of test performed at 280°C with PWR rods. But due to the strong dependency of hydride solubility with temperature, the brittle zone may be deeper at room temperature conditions than at PWR conditions. The incipient crack depth to be considered in NSRR room temperature tests are then not only the depth of the hydride rim in the cladding but also an underlying zone containing a significant hydrogen concentration [15]. 11. ADVANCED MODELLING In parallel with experimental programmes (PROMETRA, CIP and FGD) and development of SCANAIR software, IRSN is conducting an advanced modelling research programme in close

40
collaboration with the academic world [22]. The objective of this programme is to develop tools and advanced methods in order to:
understand to influence of small scale processes on the fuel and cladding behaviour during a RIA;
be able to provide simplified models for the SCANAIR software. For example, one of the contributions of our advanced R&D programme concerns the interpretation of tests carried out in the Japanese NSRR reactor. Two RIA type tests (VA-1 and VA-3) on equivalent fuel samples, but under different thermo-hydraulic conditions (higher temperature in the test VA-3), led to different rupture conditions. The application of the advanced modelling and the associated numerical tools to the problems of rupture of tests VA-1 and VA-3 has enabled a detailed interpretation of these tests and an understanding of the mechanisms differentiating them. At equivalent characteristics, the brittle zone in the external part of the cladding is smaller in the case of a high temperature test VA-3, because the sub-layer of hydrides dissolves, leading to higher mechanical strength compared to the low temperature case VA-1 where the sub-layer of hydrides does not dissolve in the matrix.
FIG. 9. Crack pattern of numerical tests representing VA-1 (left) and VA-3 (right).
12. CONCLUSION In conjunction to its experimental activities, IRSN develops the SCANAIR code for the evaluation of the fuel rods behaviour under Reactivity Initiated Accident conditions. During the course of the REP-Na programme, the SCANAIR development and assessment was oriented toward the description of the PCMI phase. More recently, new developments were implemented that deal with the fuel behaviour following the boiling crisis. The global assessment of the code by comparison to experimental results from NSRR, BIGR, CABRI and PATICIA programmes show that the modelling of the PCMI phase is satisfactory. The methodology developed to predict PCMI failure appears to give reasonable results. However, the uncertainty on critical parameters, such as the hydride rim thickness, induces uncertainty on the failure level predictions that has to be carefully taken into account for reactor applications. The more recent developments on post-DNB behaviour clearly lack experimental data to be compared to for sufficient validation. It is the objective of the CABRI International Programme, currently under preparation, to produce such data in typical PWR conditions.

41
However, the outcome from recent activities, performed in the frame of the OECD/CSNI and devoted to establishing the state of the art in RIA, show that the current CIP programme can not cover all the remaining issues. An extension of the CIP programme is thus proposed to address these remaining topics.
REFERENCES [1] ORGANISATION FOR ECONOMIC CO-OPERATION AND DEVELOPMENT, Nuclear
Fuel Behaviour Under Reactivity-initiated Accident (RIA) Conditions, State-of-the-art Report, NEA/CSNI/R (2010)1, NEA n°6847, OECD, Paris (2010).
[2] PAPIN, J., CAZALIS, B., FRIZONNET, J.-M., DESQUINES, J., LEMOINE, F., GEORGENTHUM, V., LAMARE, F., PETIT, M., Summary and interpretation of the CABRI REP-Na program, Nuclear Technology, 157 (3) (2007) 230–250.
[3] CAZALIS, B., DESQUINES, J., POUSSARD, C., PETIT, M., MONERIE, Y., BERNAUDAT, C., YVON, P., AVERTY, X., The PROMETRA program: fuel cladding mechanical behaviour under high strain rate, Nuclear Technology 157 (3) (2007) 215–229.
[4] BESSIRON, V., Modelling of clad-to-coolant heat transfer for RIA applications, J. Nucl. Sci. and Tech. 44 (2) (2007) 211–221.
[5] BESSIRON, V., SUGIYAMA, T., FUKETA, T., Clad-to-coolant heat transfer in NSRR experiments, J. Nucl. Sci. and Tech 44 (5) (2007) 723–732.
[6] FEDERICI, E., LAMARE, F., BESSIRON, V., PAPIN, J., The SCANAIR code version 3.2: main features and status of qualification, IAEA Technical Committee Meeting on Fuel Behaviour under Transient and LOCA Conditions, Halden (2001).
[7] PAPIN, J., PETIT, M., GRANDJEAN, C., GEORGENTHUM, V., IRSN R&D studies on high burnup fuel behaviour under RIA and LOCA conditions, Top Fuel, Salamanca (2006).
[8] GEORGENTHUM, V., DESQUINES, J., ARNAUD, R., Study and modelling of Zirconia cracking and spalling in high burnup PWR fuel claddings submitted to RIA transients, Water Reactor Fuel Performance Meeting, Kyoto (2005).
[9] ORGANISATION FOR ECONOMIC CO-OPERATION AND DEVELOPMENT, Nuclear fuel behaviour during reactivity initiated accidents, Proceedings of the Workshop, NEA/CSNI/R(2010)7, OECD, Paris (2010).
[10] BERNAUDAT, C., et al, An analytical criterion to prevent PCMI fuel rod cladding failure during RIA transients, OECD Workshop on Nuclear Fuel Behaviour during Reactivity Initiated Accidents, Paris (2009).
[11] SARTORIS, C., et al., A consistent approach to assess safety criteria for reactivity initiated accidents, J. Nucl. Eng. Des. 240 (2010) 57–70.
[12] YUEH, K., Fuel reliability program: proposed RIA acceptance criteria, EPRI Technical Report 1021036 (2010).
[13] MOAL, A., LAMARE, F., LATCHE, J.-C., FEDERICI, E., BESSIRON, V., SCANAIR reference documentation, version V_6_7, IRSN, Fontenay-aux-Roses (2009).
[14] GEELHOOD, K.J., LUSCHER, W.G., BEYER, C.E., FRAPCON-3.4: A computer code for the calculation of steady-state thermal-mechanical behaviour of oxide fuel rods for high burnup, NUREG/CR-7022, Vol. 1, PNNL-19418 (2011).
[15] GEORGENTHUM, V., SUGIYAMA, T., UDAGAWA, Y., FUKETA, T., DESQUINES, J., Fracture mechanics approach for failure mode analysis in CABRI and NSRR RIA tests, Water Reactor Fuel Performance Meeting, Seoul (2008).
[16] MOAL, A., Advanced models for the simulation of post-DNB Phenomena during reactivity initiated accidents with SCANAIR”, LWR Fuel Performance/TopFuel/WRFPM, Orlando (2010).
[17] LEMAITRE, J., CHABOCHE, J.L., Mechanics of Solid Materials, Cambridge University Press, Cambridge (1994).

42
[18] YEGOROVA, L., et al., Experimental study of narrow pulse effects on the behaviour of high burnup fuel rods with Zr-1%Nb cladding and UO2 fuel (VVER type) under reactivity-initiated accident conditions: program approach and analysis of results, NUREG/IA-0213, Vol. 1–2 (2005).
[19] CANON, R.F., et al., Deformation of UO2 at high temperatures, J. Am. Cer. Soc. 54 (105) (1971).
[20] GEORGENTHUM, V., MOAL, A., MARCHAND, O., Validation status of the SCANAIR code for the modelling of reactivity initiated accident, Water Reactor Fuel Performance Meeting, Chengdu (2011).
[21] SUGIYAMA, T., et al., Effect of cladding surface pre-oxidation on rod coolability under reactivity initiated accident conditions, J. Nucl. Sci. and Tech. 41 (11) (2004) 1083–1090.
[22] MONERIE, Y., PERALES, F., MARCHAND, O., BARRÉ, F., Advanced modelling of complex material properties – a significant step towards predictive computation of cladding rupture, EUROSAFE-2010, Köln (2010).

EXPERIMENTAL RIA STUDIES (Session 2)
Chairpersons
M. PETIT (IRSN)
T. SUGIYAMA
(JAEA)


45
STATUS OF RIA RELATED FUEL SAFETY RESEARCH AT JAEA
T. SUGIYAMA, H. SASAJIMA, M. AMAYA, F. NAGASE Nuclear Safety Research Center, JAEA Tokyo, Japan Email: [email protected]
Abstract
The Japan Atomic Energy Agency (JAEA) has performed pulse irradiation tests using the Nuclear Safety Research Reactor (NSRR) to investigate fuel behaviour under reactivity-initiated accident (RIA) conditions. The NSRR tests have provided data of transient behaviour of high burnup fuels irradiated in Japanese commercial reactors. In order to promote better understanding of high burnup fuel behaviour and to extend the database in terms of burnup range, varieties of fuel and cladding materials and so on, JAEA launched an extensive research program on RIA and loss of coolant accident (LOCA) in 2002, which was called the Advanced LWR Fuel Performance and Safety (ALPS). High burnup UO2 and MOX fuels irradiated in European nuclear power plants were transported to JAEA and total 14 RIA tests were performed with them in the NSRR. This paper presents main outcome from the ALPS program, and gives plans of the second phase of the program (ALPS-II) which has just started with high burnup fuels additionally transported to Japan in the end of 2010. 1. INTRODUCTION The Japan Atomic Energy Agency (JAEA) has conducted an extensive research program to investigate nuclear fuel behaviour under reactivity-initiated accident (RIA) conditions. Approximately 1300 RIA-simulating tests have been performed in the Nuclear Safety Research Reactor (NSRR) since 1975, which includes 67 tests with light water reactor (LWR) fuels irradiated in Japanese commercial power reactors or in the Japan Materials Testing Reactor. The irradiated fuel tests have provided knowledge about transient behaviour of high burnup fuels and data of failure limit against the pellet-cladding mechanical interaction (PCMI) under RIA conditions [1–2]. On the basis of the NSRR experimental data as well as of the SPERT, PBF [3] and CABRI [4] data, the Nuclear Safety Commission of Japan established the PCMI failure criterion in 1998 [5]. In order to promote better understanding of higher burnup fuel behaviour under accident conditions and to provide extended database for regulatory judgment, JAEA started the ALPS program in 2002, which includes RIA and LOCA studies using some unique facilities in JAEA such as the NSRR and Reactor Fuel Examination Facility (RFEF). The high burnup UO2 and MOX fuels used in the program were shipped from European nuclear power plants. Fourteen pulse irradiation experiments in the NSRR have been successfully performed with the high burnup fuels up to 77 MW·d·kg-1U. This paper describes key observations in the RIA tests conducted in the ALPS program and gives an outlines and status of the second phase of the ALPS program (ALPS-II). Finally, other on-going RIA-related activities at JAEA are presented. 2. RIA TESTS IN ALPS PROGRAM 2.1. Test facilities for RIA-simulation test The NSRR is a modified TRIGA annular core pulse reactor which can produce a power burst simulating an RIA. At the maximum reactivity insertion of US $4.67, the peak power reaches approximately 21 GW and the corresponding power pulse width is about 4 ms. Figure 1 shows typical histories of NSRR power and integrated power during the pulse irradiation. The NSRR core has a large center cavity of 220 mm in diameter with loading tubes, which enables the fuel irradiation experiments with high neutron flux and easy loading/unloading of the test capsule containing a test fuel rod.

46
Figure 2 a) shows the schematic of the test capsule with double walls made of stainless steel. Due to the spatial limit in the test capsule, the test fuel rod must be short, approximately 300 mm in total length with a pellet stack of 100–120 mm. In case of tests with irradiated fuels from power reactors, a short segment is sampled from an original fuel rod and attached with end plugs in hot cells at the RFEF. Detailed fuel examinations, including gamma scanning, X-ray radiography, dimensional measurement, and so on, are performed also at the RFEF before and after the pulse irradiation test. The test fuel and capsule are equipped with sensors such as pressure sensors, thermocouples, etc. in the NSRR hot cell for transient measurements. Pulse irradiation tests with irradiated fuels had been performed with the stagnant coolant water at the room temperature (~20°C) and atmospheric pressure (~0.1 MPa). In order to evaluate possible influence of the initial temperature on the PCMI failure limit, the high temperature test capsule was developed. Figure 2 b) shows the schematic of the high temperature test capsule which consists of outer and inner capsules made of stainless steel. The inner capsule is equipped with an electric heater to raise the coolant temperature and pressure up to approximately 286°C and 7 MPa (saturation pressure at 286°C), respectively. As for instrumentation, four thermocouples of type K are installed in the inner capsule, one thermocouple of type R is welded on the cladding surface of the test fuel rod, and two pressure sensors are located at gas and liquid phases of the coolant. Some more thermocouples and pressure sensors are used for capsule temperature control and safety monitoring. Because of the spatial limit in the high temperature test capsule, the test fuel rod must be shorter than approximately 130 mm in total length with a pellet stack of ~50 mm [6].
2.2. Test fuels The fuels used for the RIA tests in the ALPS program are given in Table 1. The fuel rods irradiated in European power reactors were cut into segments of about 500 mm in length and transported to Japan in 2004. In the RFEF in JAEA, these fuel segments were subjected to detailed fuel examinations and refabrication into the test fuel rods for the NSRR tests. In case that a fuel segment was subjected to both of the room temperature (RT) and high temperature (HT) tests, two test fuel rods were sampled from adjacent elevations of the fuel segment. All test fuel rods were filled with helium gas of ~0.1 MPa at ~20°C.
Time
Rea
ctor
pow
erF
uel t
empe
ratu
re Fueltemperature
Reactorpower
10 ms
FIG. 1. NSRR pulse irradiation.
150
Inner capsule
Test fuel rod
Pressuresuppression tank
Rupture disk
Vacuuminsulation
Electric heater
200200
120120
Outer capsule
Water
120120
200200
Coolant water at
~286 ºC~7 MPaat max.
~20 ºC0.1 MPa
FIG. 2. NSRR test capsules.
(a) Room temperaturecapsule.
(b) High temperaturecapsule.

47
TABLE 1. RIA TESTS IN ALPS PROGRAM
Total 14 RIA tests, including 8 RT tests and 6 HT tests, were performed in the ALPS program. Test conditions and results regarding the PCMI failure are summarized also in Table 1. Detailed results of some tests are focused below to discuss key observations. 2.3. PCMI failure criterion of high burnup UO2 fuel The PCMI failure occurred in 6 tests in the Table 1. The test VA-1 and LS-1 are focused to discuss PCMI failure behaviour of PWR and BWR fuel rods with UO2 pellets, respectively. 2.3.1. PWR fuel rod The test VA-1 was the first RIA-simulation test in the ALPS program. The test fuel rod subjected to the test was sampled from a PWR fuel rod irradiated in the Vandellos-2 reactor, Spain. The fuel rod had ZIRLOTM cladding and had UO2 pellets with a conventional grain size. The fuel burnup was 71 MW·d·kg-1U in the average of the test segment. The cladding oxide thickness was from 69–77 µm and the average thickness in the pellet stack length was 73 µm. The cladding hydride content was evaluated as 660 ppm. The rod was subjected to the pulse irradiation at room temperature (18°C) in the NSRR with conditions of 556 J·g-1 for the maximum increase of fuel enthalpy. The test resulted in the PCMI failure when the increase of fuel enthalpy reached 268 J·g-1. Figure 3 shows post-test appearances of the failed rod. An axial crack propagated all over the pellet stack length, and all of pellets were fragmented and found at the bottom of the test capsule when the capsule was opened in the hot cell in RFEF.
Test ID
Assembly type
Fuel Burnup
[MW·d·kg-1] Cladding
Clad Oxide
thickness[µm]
Clad Hydrogen
content [ppm]
Initial coolant
temperature [°C]
Enthalpy increase at failure
[J·g-1 (cal·g-1)]
VA-1 PWR 17 × 17
UO2 71 ZIRLO 73 660 18 268 (64)
VA-3 82 670 285 344 (82)
VA-2 PWR 17 × 17
UO2 77 MDA 70 760 28 231 (55)
VA-4 80 760 249 no failure
MR-1 PWR 17 × 17 UO2 71 NDA 39 210 22 no failure
RH-1 PWR 17 × 17
UO2 67 M5 6 70 16 no failure
RH-2 6 70 278 no failure
LS-1
BWR 10 × 10
UO2 69 Zry-2 (LK3)
25 300 17 222 (53)
LS-2 25 290 283 no failure
LS-3 25 300 281 no failure
BZ-1
PWR 14 × 14
MOX
48
Zry-4
30 340 17 318 (76)
BZ-2 59
20 160 18 545 (130)
BZ-3 20 160 281 no failure
DW-1 BWR 8 × 8 MOX 45 Zry-2 10 50 17 no failure

48
Figure 4 shows a metallograph of the cladding round cross section at the fracture. In case that the cladding hydrogen content reaches high after long irradiation, the hydrides tend to precipitate in the cladding outer periphery because the temperature in the water side is relatively low. Thus, a radially-localized hydride layer, which is so-called hydride rim, is formed as observed in Fig. 4. The ductility at the hydride rim is lower than at the metal matrix without hydrides. On the other hand, temperature of the fuel pellet increases promptly at the reactivity insertion, which leads to rapid thermal expansion of pellet. The expanding fuel pellet contacts with the cladding inner surface and pushes it outward, in other words, PCMI occurs. The PCMI failure can occur as a result of the combination of the embrittlement due to hydride rim formation and the significant PCMI load. Thus, this mode of failure can be called the hydride-assisted PCMI failure. Since the cladding fracture is initiated in the brittle zone including the oxide layer and hydride rim, several incipient cracks are produced at the outer periphery as observed in Fig. 4. It is anticipated that one of these incipient cracks propagates to inner direction, resulting in the fracture. Observations, measurements and analysis in the NSRR experiments have suggested that the cladding deformation due to the PCMI is caused primarily due to solid thermal expansion of pellets and that fission-gas-induced pellet expansion is negligible [7]. The hydride-assisted PCMI failure can occur only in the early phase of the transient when cladding surface temperature remains low. Once the cladding survives the early phase, cladding temperature increases rapidly and the departure from nucleate boiling (DNB) may occur, leading to a further rise of cladding temperature and a consequent rise of the cladding ductility. Thus, the possible failure mode shifts from the hydride-assisted PCMI to the high temperature burst, severe oxidation or melting. In the late phase, thermal expansion of fission gas accumulated in fuel rod can be the driving force of the high temperature burst. 2.3.2. BWR fuel rod The test LS-1 was performed on a 10 × 10 BWR-UO2 fuel rod with LK3 cladding, which is an improved alloy within the Zircaloy-2 specification, irradiated in the Leibstadt reactor in Switzerland. A short test fuel rod with a pellet stack of 106 mm in length was fabricated. The local burnup was evaluated as 69 MW·d·kg-1U. The cladding oxide thickness of the fuel rod was approximately 25 µm and the hydrogen content was about 300 ppm.
FIG. 4. Round cross section of failed cladding in test VA-1.
Hydride rim
Oxide layer
FIG. 3. Visual appearance of failed cladding in test VA-1.

49
The pulse irradiation was performed with a condition of 469 J·g-1 for the maximum increase of fuel enthalpy. In reality, however, PCMI failure occurred before reaching the maximum, when the fuel enthalpy increase was 222 J·g-1. According to the transient measurement, the cladding surface temperature remained below 30°C at the time of failure. Figure 5 shows the appearance of the test fuel rod after the pulse irradiation. A long axial crack was generated in the cladding. The rod was empty and fragmented pellets were found in the coolant at the capsule bottom. Figure 6 shows a metallograph of the cladding round cross section at the fracture. The direction of crack propagation in the outer region was radial, which suggests a brittle fracture. On the other hand, the slanted fracture direction in the inner region indicates a ductile fracture. These fracture modes were confirmed by detailed observation of the cladding fracture surface with a scanning electron microscope [8]. 2.3.3. PCMI failure criterion The fuel enthalpy increase at failure is plotted as a function of fuel burnup in Fig. 7 with data from NSRR experiments and from CABRI, SPERT and PBF tests [4, 9]. The Japanese PCMI failure criterion was determined up to 75 MW·d·kg-1U as shown in the figure, on the basis of the data up to ~64 MW·d·kg-1U which were available in 1998 [5]. It can be seen that the recent results from the tests VA-1, -2 and LS-1 at high burnups are above the PCMI failure criterion with an adequate margin. In particular, the burnup of VA-2 exceeds the defined range (75 MW·d·kg-1U). The results suggest that the current criterion can be applied to higher burnup level, most probably about 80 MW·d·kg-1U.
Figure 8 shows the fuel enthalpy increase at failure as a function of the cladding oxide thickness which is one of the indices for corrosion level, including oxidation and hydrogen absorption. Note that this figure shows results only from NSRR experiments. The PWR fuel data indicate that the failure limit decreases with the increase of oxide thickness. According to our previous studies [10–11], this tendency reflects the relation between the stress intensity factor at the incipient crack tip and the hydride rim thickness. The crack is originated with brittle manner within the hydride rim and the subsequent ductile shear is initiated at the crack tip. The PCMI failure limit corresponds to the condition of ductile shear initiation.
FIG. 5. Visual appearance of failed cladding in test LS-1.
FIG. 6. Round cross section of failed cladding in test LS-1.
Hydride
Oxide

50
The fracture process described above is regarding the PWR fuel cladding in which the hydride rim is formed as observed in Fig. 4. As for the BWR fuel cladding, the hydride rim formation is not significant, but the orientation of hydride precipitates is relatively random in comparison with the PWR cladding. Thus, some hydrides are long in the radial direction as observed in Fig. 6. It is likely that the radial hydrides induce the radial crack propagation and lower the failure limit. The BWR fuel data in Fig. 8 are consistent with the above speculation. It should be noted that the difference in the hydride morphology arises from the difference in the cladding crystalline texture depending on the thermal treatment in the cladding manufacturing process, not from the reactor type. All the PWR fuel data in Fig. 8 are of the stress-relief annealed cladding, and the BWR fuel data are of the recrystallization annealed cladding. It must be also noted that the figure compares the influence of hydrogen morphology at a same corrosion level, but does not mean to compere the superiority between PWR and BWR.
No failure Failure Test ID No failure Failure
NSRR
Test IDPWR UO2
BWR UO2
SPERT, PBFCABRI UO2
CABRI MOX
JMTRATR MOX
PWR MOXBWR MOX
0 10 20 30 40 50 60 70 800
0.2
0.4
0.6
0.8
1.0
0
50
100
150
200
250
Fuel Burnup (MWd/kg)
Ent
halp
y In
crea
se (
kJ/g
. fuel
)
PCMI failure criterion in Japan Ent
halp
y In
crea
se (
cal/g
. fuel
)
DW-1
BZ-1
BZ-3
BZ-2
RH-2LS-2
RH-1
LS-3MR-1
VA-4
VA-3
LS-1VA-1
VA-2
High temperatureRoom temperature
FIG. 7. Fuel failure map: enthalpy increase at failure vs fuel burnup.
FIG. 8. Fuel failure map: enthalpy increase at failure vs cladding oxide thickness.
0 50 1000
0.2
0.4
0.6
0.8
0
100
200
Cladding oxide thickness (µm)
En
tha
lpy
incr
ea
se a
t fa
ilure
(kJ
/g)
En
tha
lpy
incr
ea
se a
t fa
ilure
(ca
l/g)Clad initial thickness (mm)
0.57 0.62 0.640.86 0.63
PWR-MOX
PWR (SR clad)BWR
(RX clad)

51
2.4. PCMI failure criterion of MOX fuel rod The tests BZ-1 and -2 were performed with MOX fuel rods under the room temperature and ambient pressure conditions. The maximum increase of fuel enthalpy was 688 J·g-1 and 644 J·g-1 in the BZ-1 and -2, respectively. The enthalpy increase in the BZ-1 was higher than in BZ-2, because a larger amount of fissile materials remained in the BZ-1 fuel due to the lower burnup. Both tests resulted in the PCMI failure at fuel enthalpy increases of 318 J·g-1 and 545 J·g-1, respectively. The fuel enthalpies at failure are plotted in Fig. 7. The test results of the test BZ-1 and -2 are above the PCMI failure criterion with an adequate margin. This confirmed the applicability of the current Japanese criteria to the high burnup MOX fuel. The test results are plotted also in Fig. 8 which shows fuel enthalpy increase at failure as a function of cladding oxide thickness. The fuel enthalpies at failure in the two MOX fuel tests BZ-1 and -2 are consistent with a tendency derived from a number of UO2 tests, and in turn indicate that any MOX effects do not appear. In the tested burnup range at least, the PCMI load depends only on the pellet thermal expansion which is similar between UO2 and MOX. Therefore, the PCMI failure limit depends only on the cladding state [8]. 2.5. Influence of Temperature on PCMI Failure In order to discuss the influence of initial coolant temperature, the high temperature (HT) tests VA-3, VA-4 and LS-2 are focused. The corresponding room temperature (RT) tests VA-1, VA-2 and LS-1 resulted in the PCMI failure. The test BZ-3 is not discussed here, because the maximum enthalpy increase did not reach the enthalpy increase at failure in the corresponding RT test BZ-2. All the HT tests were carried out after heating of the coolant and holding the target temperature for approximately one hour. The coolant temperature at the pulse-irradiation was 285°C and 283°C respectively in the test VA-3 and LS-2, while it was 249°C in the test VA-4. The VA-4 test fuel rod with a higher burnup had a smaller amount of fissile materials than the VA-3 rod. In order to achieve a similar fuel enthalpy increase as in the test VA-3, the coolant, which acts as the neutron moderator, in the test VA-4 was set at a lower temperature for a higher density and consequently for a higher thermal neutron flux to the test fuel rod. The coolant pressure was the saturation pressure at the achieved temperature, which was 6.8 MPa, 4.0 MPa and 6.6 MPa in the tests VA-3, VA-4 and LS-2, respectively. The power pulse width was 4.4 ms in all the tests. The maximum increase of fuel enthalpy was evaluated as 454 J·g-1, 457 J·g-1 and 371 J·g-1 in the tests VA-3, VA-4 and LS-2, respectively. Among the three HT tests, PCMI failure occurred only in the test VA-3. The fuel enthalpy increase at failure was 344 J·g-1. As shown in Fig.7, the fuel enthalpy increase at failure was 76 J·g-1 higher than in the test VA-1 performed at RT with a sibling fuel rod. Figure 9 shows the visual appearance of the failed fuel rod in the test VA-3. An axial crack was generated on the cladding, which is common to the failure in the RT tests. Metallographs of the failed cladding in the test VA-3 are shown in Fig. 10. A brittle fracture at the outer periphery and a ductile fracture in the inner region, which are respectively characterized by the radial and 45°-slanted fracture surfaces, are common to the RT test results shown in Fig. 4. Another common observation is the non-penetrating cracks produced in the hydride layer at the cladding periphery. However, the crack tip observed near the fracture in the test VA-3 became round, while the crack tip was sharp in the RT tests. It is anticipated that the crack generation within the hydride rim occurred in the early stage of the PCMI as in the RT, but the crack propagation into the inner region was delayed due to higher fracture toughness at the higher temperature in the test VA-3, resulting in the higher failure limit [12]. Therefore, the current PCMI failure criterion, which is based on the RT test results, could have conservativeness against RIAs under operation or hot-zero-power temperatures.

52
3. ALPS-II PROGRAM The second phase of the ALPS program (ALPS-II) has started and the second fuel transport from Europe to Japan was completed. Table 2 gives the list of transported fuels to be used for RIA tests in the ALPS-II program. The main objectives of the tests are to obtain safety data of advanced fuels which are foreseen to be introduced into Japanese LWRs in near future, and to investigate the influence of cladding crystalline texture on the PCMI failure limit, influence of pellet dopant on the fission gas release or on other fuel behaviours, dynamic process of fission gas release in power transient and so on. TABLE 2. FUELS FOR RIA TESTS IN ALPS-II PROGRAM
M-MDA (SR) 73
M-MDA (RX) 70
ZIRLO (low-Sn) 73
Gravelines-5 (France) M5 76
15x15 Ringhals-2 (Sweden) M5 63
Zry-2 91
Zry-2 49
Oskarshamn-3 (Sweden) Zry-2 68
PWR 17x17 Chinon-B3 (France) MOX M5 61
BHWR - HBWR (Norwary) Disk UO2 - 130
Cladding
PWR17x17
Vandellos-2 (Spain)
BWR
Burnup(MWd/kgU)
10x10
Fuel
Doped UO2
UO2
Reactortype
Assytype
Leibstadt (Switzerland)
Reactor (Country)
4. ON-GOING RIA-RELATED STUDIES In order to obtain complementary information to the NSRR tests with high burnup fuels, other experiments have been carried out, including cladding mechanical tests and NSRR pulse irradiation tests with fresh fuels as separate effect tests. As for the cladding mechanical test, continuous efforts have been made to reproduce the PCMI load anticipated in the in-reactor tests. At the present, a technique to provide biaxial stress with desirable hoop/axial ratios is under development. Techniques
FIG. 9. Visual appearance of failed cladding in test VA-3.
FIG. 10. Round cross section of failed cladding in test VA-3.

53
to prepare optimized specimens for the mechanical test are also improved, such as the roll-after-grooving (RAG) technique to produce an axially long radial crack with a sharp tip in the cladding outer periphery, which simulates the incipient crack generated in the hydride rim under the PCMI load [13]. Another important activity is development of fuel behaviour analysis codes. The FEMAXI-7 code for normal operation and anticipated operational occurrences, and the RANNS code for RIA [14] are powerful and effective tools to predict or understand the NSRR test results. These codes provide non-measurable parameters in experiments, including radial profiles of local temperature, stress, strain and so on in the pellet and cladding. The limits of test facilities can also be removed by computer analyses. For example, the power pulse produced by the NSRR is narrower than those supposed in power reactors, but the influence of power pulse width on the PCMI failure limit can be now evaluated with a combined use of the FEMAXI-7, RANNS and general FEM cods. The NSRR test results have been directly used to determine the safety criterion with sufficient safety margins. When the code reliability is fully established, safety margins to compensate low representativeness of simulation tests can be reduced by conversion of experimental data to anticipated results under power reactor conditions. 5. CONCLUSIONS An extensive research program has been conducted using the NSRR in the JAEA in order to provide a database for safety against the RIA. To extend the database and knowledge about fuel behaviour under accident conditions, the research program ‘Advanced LWR Fuel Performance and Safety’ (ALPS) was started with high burnup fuels shipped from European nuclear power plants. The NSRR experiments with high burnup fuels, up to 77 MW·d·kg-1U, showed that the PCMI failure criterion defined in the current safety evaluation guideline of Japan has adequate safety margin at those burnups. The test results showed a significant importance of hydride morphology in the cladding for the PCMI failure and suggested a necessity of different safety evaluations for the stress-relief annealed and recrystallization annealed cladding tubes. The fuel enthalpy increases at failure of the MOX fuels with burnups up to 59 MW·d·kg-1HM are consistent with a tendency derived from a number of UO2 fuel tests, which indicates that any MOX effects do not appear on the failure conditions. The PCMI failure limit depends only on the cladding corrosion states including oxidation and hydride precipitation, as far as the PCMI load is produced only by pellets thermal expansion. Accordingly, a common failure criterion is applicable to UO2 and MOX fuel rods. The influence of coolant temperature on the PCMI failure limit was demonstrated by a comparison between the room temperature and high temperature tests with sibling test fuel rods sampled from an identical PWR fuel segment with a burnup of 71 MW·d·kg-1U. The mechanism of temperature influence was understood as the higher fracture toughness at the tip of incipient cracks due to the higher initial temperature. The second phase of the ALPS program has started to obtain fuel safety data under RIA and LOCA conditions for advanced LWR fuels to be introduced in Japanese LWRs in near future. Ambitious tests are planned to investigate various kinds of phenomena with high burnup fuels, such as the influence of cladding crystalline texture on the PCMI failure limit, and so on. Development has been continuously made for the cladding mechanical test methods, fabrication techniques of test specimens and fuel behaviour analysis codes, in order to enhance the representativeness of out-of-pile RIA-simulation tests and to improve the reliability of fuel behaviour prediction. 6. ACKNOWLEDGMENT The ALPS program has been sponsored by the Nuclear and Industrial Safety Agency, the Ministry of Economy, Trade and Industry of Japan.

54
REFERENCES [1] SUGIYAMA, T., et al., Mechanical energy generation during high burnup fuel failure under
reactivity initiated accident conditions, J. Nucl. Sci. Technol. 37 (10) (2000) 877–886. [2] FUKETA, T., et al., Behaviour of high-burnup PWR fuels with low-tin Zircaloy-4 cladding
under reactivity-initiated-accident conditions, Nucl. Technol. 133 (1) (2001) 50–62. [3] MEYER, R.O., An assessment of fuel damage in postulated reactivity-initiated accidents
management, Nucl. Technol. 155 (3) (2006) 293–311. [4] PAPIN, J., et al., Summary and interpretation of the CABRI REP-Na program, Nucl. Technol. 157
(3) (2007) 230–250. [5] NUCLEAR SAFETY COMMISSION OF JAPAN, Evaluation of High-Burnup Fuels for
Reactivity Insertion Events in Light Water Power Reactors, The NSC Regulatory Guides (1998).
[6] SUGIYAMA, T., et al., Evaluation of initial temperature effect on transient fuel behaviour under simulated reactivity-initiated accident conditions, J. Nucl. Sci. Technol. 47 (5) (2010) 439–448.
[7] FUKETA, T., et al., Behaviour of 60–78 MW·d·kg-1U PWR fuels under reactivity-initiated accident conditions, J. Nucl. Sci. Technol. 43 (9) (2006) 1080–1088.
[8] SUGIYAMA, T., et al., Failure of high burnup fuels under reactivity-initiated accident conditions, Annals Nucl. Energy 36 (3) (2009) 380–385.
[9] COOK, B.A., et al., Reactivity Initiated Accident Test Series, Test RIA 1-2 Fuel Behaviour Report, NUREG/CR-1842, EGG-2073, U.S. DOE (1981)
[10] TOMIYASU, K., et al., Influence of cladding-peripheral hydride on mechanical fuel failure under reactivity-initiated accident conditions, J. Nucl. Sci. Technol. 44 (5) (2007) 733–742.
[11] UDAGAWA, U., et al., Stress intensity factor at the tip of cladding incipient crack in RIA-simulating experiments for high-burnup PWR fuels, J. Nucl. Sci. Technol. 46 (10) (2009) 1012–1021.
[12] SUGIYAMA, T., et al., Effect of initial coolant temperature on mechanical fuel failure under reactivity-initiated accident conditions, Top Fuel 2009, Paris (2009) Paper 2086 (CD-ROM).
[13] FUKUDA, T., Development of pre-cracked cladding specimen for PCMI failure study, Fuel Safety Research Meeting 2010, Tokai (2010)
[14] SUZUKI, M., et al., Thermal stress analysis of high-burnup LWR fuel pellet pulse-irradiated in reactivity initiated accident conditions, J. Nucl. Sci. Technol. 45 (11) (2008) 1155–1164.

55
NEW TECHNIQUES FOR THE TESTING OF CLADDING MATERIAL UNDER RIA CONDITIONS
*
**
***
****
*****
******
H.K. YUEH*, R.J. COMSTOCK**, V. GRIGORIEV***, J. KARLSSON***, W. LEES****, Y.P. LIN*****, D. LUTZ*****, D. MITCHELL**, D. SCHRIRE****** Electric Power Research Institute Charlotte, USA Email: [email protected] Westinghouse Electric Company Monroeville, USA Studsvik Nuclear AB Nyköping, Sweden Maxbar, Inc. Houston, USA Global Nuclear Fuel Wilmington, USA Vattenfall Nuclear Fuel Stockholm, Sweden
Abstract
Two new mechanical tests, rapid heating and loading (RHL) and modified burst, have been developed to evaluate cladding properties under RIA heating and loading conditions. The RHL test was designed to evaluate cladding ductility changes due to temperature increases during a RIA. A series of RHL tests were conducted using pre-hydrided and irradiated cladding. The test samples were heated to different target temperatures from ambient to 350°C and simultaneously loaded to failure within 70 ms. Both non-irradiated and irradiated material test results conclusively show ductility is immediately recovered as the temperature is increased. A brittle-to-ductile transition, between 75°C and 100°C, was observed for both non- and irradiated Zircaloy-2 materials. The instantaneous ductility recovery also suggests that rapid heating should not be required in the evaluation of ductility degradation due to hydrides under RIA loading conditions. A modified burst test was developed to mechanical simulate the loading conditions of a RIA. The test uses a driver tube with a gauge section and loading is provided via a piston/cylinder arrangement which allow for greater control of the sample deformation. The configuration allows for total control of the pressure pulse duration as well as desired diameter deformation. A number of tests have been conducted using cold-worked, cold-worked and hydrogen charged, and irradiated cladding material. The test results verify ductility recovery as observed in the RHL test and post-test measured plastic strain at failure is comparable and consistent with NSRR test results at ambient and elevated temperatures. 1. BACKGROUND The question of fuel behaviour during a reactivity injection accident (RIA) has been extensively investigated experimentally since the first CABRI REP Na-1 test in the early 1990s [1]. Although numerous simulation tests in multiple test reactors have been conducted [2–3], multiple issues remain as to how the test data can be applied to establish acceptance criteria for commercial light water reactors (LWRs). These issues arise because important test conditions, such as pulse width, coolant and temperature, were different from that of commercial reactors. The use of models as a tool to adjust for the different test conditions has been controversial due to significant uncertainties in assumptions made with respect to the initial fuel rod condition and cladding material properties. As a result of lack of prototypical data, interim acceptance criteria have been established based on simulated RIA tests at ambient temperature and short pulse duration conditions [4]. Acceptance criteria based on these conditions results in undue conservatism due to the following factors:

56
For pressurized water reactors (PWRs) the minimum temperature where RIA events can take place is around 280°C. In the case of boiling water reactors (BWRs) credible RIA events with significant energy deposition typically occur at higher than ambient temperatures. In both cases, the ductility of hydrided clad is expected to improve with increasing temperature.
The application of short pulse width results in faster clad loading that may lead to lower failure strain than for realistic BWR pulse widths. In the presence of hydrides, such as with irradiated cladding, it can directly influence the brittle-to-ductile transition temperature [5]. These factors can degrade the ability of the clad to accommodate pellet expansion during a RIA.
The short pulse width also results in nearly adiabatic heating as there is insufficient time for heat conduction into the clad. This point is particularly important to the BWR case where RIA events can occur at the start of a cycle, where the coolant temperature may be below the brittle-to-ductile transition temperature.
To reconcile some of the differences without additional prototypical in-reactor test data, extensive mechanical properties of the clad under RIA heating and loading conditions are needed. Such data, generated and used in connection with the existing in-reactor simulated test result can reduce uncertainties in data translation to LWR conditions. The evaluation and test results of two new tests are reported in this paper. One of the test, rapid heating and loading, was designed to simulate RIA heating and loading conditions and is used to determine if ductility, lost due to the presence of hydride, can be recovered from temperature increases during a RIA event. The test is also used to collect additional Zircaloy-2 ductility data as a function of temperature in support of alternative BWR PCMI acceptance criteria at intermediate temperatures. The second test, modified burst test, is designed to mechanical simulate the pellet expansion and therefore achieve partial displacement based type of deformation, as opposed to stress based type of deformation in a standard burst test. Development of this test initiated after US regulators signalled potential acceptance of using a suitable mechanical, go/no-go, type of simulation test to qualify new zirconium based alloys for RIA performance. With promising initial results (failure strains similar to test reactor results), extensive testing of irradiated cladding are planned to generate additional data to aid in the finalization of the RIA PCMI acceptance criteria. 2. EXPERIMENTAL DETAILS 2.1. Non-irradiated test materials To facilitate the RHL test development, standard production Zircaloy-2 BWR channel materials, in the as fabricated and hydrogen pre-charged conditions were used. The flat geometry of the channel material simplified test apparatus requirement. The channel material was pre-charged, via gaseous charging, to a uniform hydrogen concentration of around 500 ppm. Typical hydride morphology is illustrated in Fig. 1. A few non-irradiated cold worked Zircaloy-2 liner cladding samples, also charged to approximately 500 ppm of hydrogen were used to setup the final equipment configuration in preparation for the testing of irradiated samples. The cladding material was used in this condition to simulate irradiated clad properties. Cold worked and cold worked hydrogen charged ZIRLOTM was used in the development of the modified burst test. The material is used in the cold worked condition to simulate the strength of irradiated clad.

57
FIG. 1. Typical hydride morphology of Zircaloy-2 channel material.
2.2. Irradiated material Zircaloy-2 liner clad in the re-crystallized condition irradiated in a commercial reactor for 5 annual cycles to a cumulative burnup of 41.4 GW·d·Mt-1U was used in the RHL test. The clad has an average hydrogen concentration of around 180 ppm and with a large fraction of the hydrides oriented in the radial orientation. Typical hydride morphology is shown in Fig. 2.
FIG. 2. Typical hydride morphology of irradiated Zircaloy-2 cladding material used in the RHL test.
ZIRLOTM PWR material irradiated in a commercial reactor for 4 cycles and a burnup of 70 GW·d·Mt-1U was used in the modified burst test. The typical hydride morphology is shown in Fig. 3.
FIG. 3. Typical hydride morphology of irradiated ZIRLOTM cladding material used in the modified burst test.

58
2.3. Sample preparation Zircaloy-2 channel samples charged with hydrogen, in the form of a dog bone, were cut using an electrical discharge machine (EDM) for the RHL test. The gauge section was approximately 3 mm in length. The hydrides in a few channel samples were re-oriented to better illustrate the brittle-to-ductile transition. The hydrides were re-oriented by loading and maintaining the gauge section of the sample at a stress of 150 MPa while undergoing a thermal cycle, involving heating the sample to approximately 400°C, hold for approximately 2 hours and then slowly cooled to room temperature. An example of re-oriented hydride morphology is shown in Fig. 4.
FIG. 4. Transverse hydride morphology in the gauge section after hydride re-orientation procedure. Cladding samples of both fresh and irradiated cladding used in the RHL test, in the form of a C-clip were also machined using the electrical discharge method. Schematic illustrations of the samples are shown in Fig. 5.
FIG. 5. Test sample geometries, (1) flat channel material dog-bone, and (2) cladding C-clip geometry. Test samples used in the modified burst test were approximately 2.5 cm in length. Fuel removal was by mechanical drilling followed by chemical dissolution. No special preparation of the cladding was needed. 2.4. Experimental setup The RHL test was conducted using an Instron 1271 50 kN tensile test machine. The sample was directly heated using DC current, which was provided via a Delta Electronica SM power source model number 15-200D. A pulse generator, Agilent model 33220A, was used to activate the power source. In this test, samples were loaded and heated simultaneously within 50–80 ms and temperatures were measured with an optical pyrometer. Direct current was applied to the loading grips mounted in the testing machine. The infrared temperature sensor (IRTS) is located close to the specimen and is focused on the gauge length surface. Sample elongation was measured via a clip-gauge mounted on

59
the loading grips close to the specimen. All experiments were performed in open-air atmosphere. The load, specimen elongation (clip-gauge) and specimen temperature were recorded every millisecond (1 kHz frequency). The temperature at the point of maximum load is used as the test temperature in the later data analysis. The channel and clad loading apparatus are shown in Fig. 6.
FIG. 6. Sample loading configuration of (left) channel material and (right) cladding material.
The test begins with the rapid loading of the specimen with a cross-head movement of up to 13 mm·s-1. Heating is triggered once a pre-set load threshold is reached. Depending on the desired peak temperature, heating could be completed before or after the sample reaches the peak load. The heating rate is limited by the 200 amp power source. The modified burst test concept and 3-D depiction of the modified burst test apparatus are shown in Fig. 7.
Cladding
Alloy 718Driver Tube
PressureGauge
FIG. 7. Modified burst test concept (left), a 3D depiction of the assembled test apparatus (right).
A typical modified burst test would involve, (1) mounting of a driver tube, (2) mounting of a cladding test sample over the driver tube, (3) fill driver tube with working fluid and degas the system, (4) setting the piston dial to the desired volume change, (5) raise of the weight to the desired drop distance, (6) install heater, (7) start data acquisition system, and (8) release weight.

60
3. RESULTS AND DISCUSSIONS
3.1. Rapid heating and load test The load, temperature and strain of a typical test are shown in Fig. 8 as a function of time. In this test, a non-irradiated Zircaloy-2 channel material was loaded to failure in approximately 70 ms. The chart illustrates quite well the simultaneous heating and loading capability of the apparatus and indicates the sample was electrically heated to 215°C. Subsequent to the electrical heating, the sample temperature continued to increase, most likely due to energy released due to deformation, reaching a maximum of 295°C.
0
100
200
300
400
500
600
40 60 80 100 120 140 160 180
Time (ms)
Lo
ad (
N),
Tem
per
atu
re (
°C)
0
1
2
3
4
5
6
Str
ain
(m
m)
TemperatureLoadStrain
FIG. 8. Data recording from a typical RHL test.
A large number of non-irradiated hydrogen pre-charged Zircaloy-2 channel materials and irradiated cladding were tested under different conditions. These tests were designed to evaluate the impact of rapid heating and loading and hydrogen on ductility. The load versus displacement curves for a subset of non-irradiated samples, are plotted in Fig. 9.
0
100
200
300
400
500
600
700
800
900
0.0 0.2 0.4 0.6 0.8 1.0 1.2 1.4 1.6
Displacement (mm)
Lo
ad (
N)
RT SL (Slow Loading)
RT RL (Rapid Loading)
250°C Isothermal RL
250C RHL
350°C Isothermal RL
350°C RHL
FIG. 9. BWR Zircaloy-2 channel material test sample load versus displacement results.
Loading rates of approximately 1.5 mm·s-1 and 5 mm·s-1 were utilized in slow and rapid loading tests, respectively. The relative difference in the loading rates used in the room temperature tests are of the same order as the NSRR tests relative to realistic BWR RIA pulse duration and therefore the results shown in Fig. 9 give an indication of the reduction in the clad deformation capability as a result of higher loading rate. The data suggest the ductility is reduced by nearly 30% due to the higher loading rate.

61
Whether the ductility loss due to the presence of hydride can be improved from brief exposures to elevated temperatures is answered in the test. The rapidly heated samples were able to deform significantly more than room temperature test samples prior to failure. The mechanism for the ductility recovery is not well understood since the diffusion of hydrogen would be low under the time scale and significant hydride dissolution is no expected. However, recent atomistic modelling of the zirconium-hydrogen system indicates significant variations in the work needed to separate the zirconium-hydride interface from different hydride structures and cleavage planes. It may be possible that the temperature increase induces a small change of the hydride microstructure or condition that allows new deformation mechanisms to activate. The extent of ductility recovery from rapid heating is compared to the maximum recovery from isothermally heated samples. The ductility recovery of the rapidly heated samples is about 15–20% less compared to the isothermally heated samples. The difference may be the result of several factors. An obvious explanation may be that some of the hydride was dissolved since the isothermally heated samples had been at elevated temperature between 20–30 minutes. This explanation is supported by the higher ductility improvement of the sample heated to a higher isothermal temperature of 350°C relative to the 250°C test. At the temperature investigated, the amount of hydrogen expected to dissolve would be on the order of around 50–100 ppm relative to the total hydrogen concentration of around 500 ppm in the sample. To determine if the hydride dissolution mechanism can fully explain the difference would require further testing of hydrogen pre-charged samples at around 350–400 ppm of hydrogen under rapid heating and loading conditions, to account for the hydride that might have dissolved. A second mechanism that may account for some of the difference may be that the unknown mechanism that improves ductility under rapid heating conditions may not be fully completed; however, judging by the small difference in ductility between the 250°C and 350°C rapidly heated test, this scenario is unlikely. The measured test sample ductility were summarized and plotted in Fig. 10.
0
10
20
30
40
50
60
70
80
90
0 100 200 300 400 500Temperature (°C)
To
tal
Elo
ng
atio
n (
%)
Channel Material (CM)CM - H Re-OrientedIrradiated Zircaloy-2
FIG. 10. Zircaloy-2 ductility recovery as a function of temperature.
The test results indicate a steady ductility recovery for channel material charged with hydrides to about 300°C. The hydride morphology in these samples is analogous to circumferential hydrides which are oriented mostly parallel to the loading direction. Above 300°C, there appears to be an abrupt transition where the rate of ductility recovery is increased. An abrupt brittle-to-ductile transition between 70°C and 100°C is observed in both non-irradiated channel material with hydride re-orientation and the irradiated BWR cladding. Since samples of similar pedigree/condition without hydride re-orientation did not show this behaviour, the abrupt transition is attributed to transverse hydrides that are oriented perpendicular to the loading direction.

62
Similar transition observed in the irradiated clad with radial hydrides that further support the assessment that the abrupt transition between 70–100°C is linked to radial hydrides. Besides the similarity in the transition temperature, there are several differences, primarily the irradiated clad has better ductility below the transition temperature and the ductility recovery appears to saturate above the transition temperature. The differences may be attributed to the much higher concentration of hydride in the channel material and irradiation induced degradation in the cladding base material. Overall, the differences between the three different series of tests are consistent with the material conditions:
Hydride re-orientation significantly degraded the channel material ductility at lower temperatures, but most of it is abruptly recovered above 100°C and continues to recover at a rate similar to the as-charged condition (predominately axial hydrides) with a slightly lower absolute ductility. The slightly lower absolute ductility may be the residual effect of the transverse hydrides.
Although the hydrides in the irradiated clad is mostly radial, the concentration is only around 180 ppm, significantly less than the 500 ppm in the channel material. Therefore, even with irradiation induced damage, its low temperature ductility is still better than the channel material with hydride re-orientation.
The ductility recovery of the irradiated clad appears to saturate above the transition temperature, a behaviour consistent with the lower absolute hydrogen content and predominantly radial hydride population. In the as-charged channel material, the recovery is related to axial (equivalent to circumferential) hydrides. The lower recovered ductility of irradiated clad also suggests irradiation has further degraded the clad ductility, in a way compressing the ductility domain. Additional testing of irradiated material at higher hydrogen concentration would be useful.
3.2. Modified burst test With the degree of control offered by the modified burst test, initial non-irradiated material testing were focused on addressing the question if a state of instability exist between uniform and total elongation in a displacement based deformation mode, such as a pellet pushing against the clad. Traditional burst tests were viewed as not conclusive as it is suspected deformation may continue after sample failure. In this test series, standard burst tests were conducted to determine a reference uniform and total elongation. Modified burst tests were then conducted and samples were deformed above the reference uniform elongation of 4% but below the reference total elongation of around 10%. A specific example is shown in Fig. 11, where the sample survived a diameter change of 7.5%. All of the samples consistently survived to near the reference total elongation and thus indicating the absence of deformation instability above the uniform elongation that could lead to rapid failure. Additional tests were performed with hydrogen pre-charged cold worked cladding to demonstrate ductility recovery, lost due to the presence of hydride, as the temperature is increased. Several tests were conducted and significant increase in ductility was measured. Examples of post test samples, illustrating ductility improvement with increasing temperature, are also shown in Fig. 11. A few scoping tests were conducted with irradiated cladding to demonstrate viability of the test concept. The number of tests was limited due to difficulties with online diameter measurements using two linear variable differential transformers (LVDT). The shock induced by the weight and the outward momentum of the LVDT probes made it impossible to obtain reliable live diameter measurements. Consequently only two tests were conducted at room temperature and one test at 270°C. The failure of the LVDT sensors required post-test diameter strains measurement. Since the test has a gauge section, it was a simple matter of measuring the bulge, as shown in Fig. 12.

63
As-Pilgered7.5% strain
Uniform strain=4%25°C
As-Pilgered + 600 ppm hydrogen
3.5% target strain25°C
As-Pilgered + 600 ppm hydrogen5.6% strain
250°C FIG. 11. Post-test photographs of cold worked (12) and cold worked and hydrogen charged samples (15 and 23).
• Elevated Temperature 270°C
• Failed in ~4 ms
Diameter Change, ~1.4%
RT for comparison
FIG. 12. Post-test examination of irradiated cladding tested at 270°C and room temperature. The room temperature sample had a plastic diameter strain of around 0.8%. Of the two room temperature tests, one sample had an estimated diameter strain of 0.1–0.2% while the second sample, shown in Fig. 13, had an estimated diameter strain of around 0.8%. The single elevated temperature test samples failed with a plastic diameter strain of around 1.4%. A comparison of the modified burst test results was made to the VA-1 and VA-3 tests and the pertinent information is tabulated in Table 1. Taking into consideration of the differences in the hydride morphology, see Fig. 14, the results are in good agreement. Although the samples have similar hydride concentrations, the hydride rim in the

64
VA-1 and VA-3 samples are significantly thicker which would have contributed to the lower failure strains. TABLE 1. COMPARISON OF MODIFIED BURST TEST RESULTS TO NSRR VA-1 AND VA-3 TESTS
Property NSRR* Mod. burst RT plastic failure strain (%) 0.1–0.5 0.1–0.8 ET plastic failure strain (%) 0.4–0.8 1.4 Hydride rim thickness (%) ~30 ~20
* calculated by different methodologies.
FIG. 13. Comparison of the hydride morphology of the VA-3 and modified burst test sample. Since the initial scoping test, development of the modified burst test continued with the addition of a laser micrometre. Initial test runs indicates the sensor is working well, see Fig. 3.7.
0
5
10
15
20
25
30
35
40
0
5
10
15
20
25
30
35
40
45
50
0 5 10 15 20
Diam
eter
Cha
nge
(%)
Pres
sure
(ksi)
Time (ms)
Pressure [psi]Strain [%]
FIG. 14. Pressure and diameter readings from a cold worked sample tested at 284°C. Extensive testing is planned with irradiated PWR and BWR cladding. PWR cladding with ~200 ppm, ~400 ppm and ~650 ppm of hydrogen will be tested at room and 284°C temperatures. Testing of BWR cladding with ~200 ppm, ~300 ppm and >400 ppm of hydrogen at room, 100°C and 284°C temperatures is planned.
VA-3 Modified Burst Test

65
4. SUMMARY Two new mechanical tests that simulate the heating and/or loading rates of RIA events have been developed and applied to characterize hydrogen pre-charged and irradiated zirconium based alloy. The application of the techniques has revealed new information with regard to material behaviour under RIA transient conditions. Major findings are as follow:
The test results have conclusively shown that brief temperature exposures to elevated temperatures, such as those experienced in a RIA transient, can improve clad ductility lost due to the presence of hydrides.
An abrupt brittle-to-ductile transition was observed to start at 70°C and complete at 100°C. This transition is identified with radial hydrides. However, at this temperature the hydrogen solubility is negligible compared to the total amount of hydrogen in the hydrides, so the brittle-ductile transition is apparently not due to the dissolution or reduction in the amount of hydrides.
Recovery of ductility loss due to axial/circumferential hydride improves gradually with temperature and no sharp transition was observed.
A small difference in ductility recovery was observed between tests conducted under rapid heating and isothermal heating conditions. The difference is possibly due to the dissolution of some of the hydride under isothermal heating conditions.
Ductility is dependent on the test loading rate with lower ductility at higher loading rates.
The near instantaneous ductility recovery suggests rapid heating should not be required in the evaluation of ductility degradation due to hydrides under RIA loading conditions. However, isothermal test should take into consideration hydride resolution.
Preliminary results indicate the modified burst test can reasonably simulate RIA failure strains as observed in in-reactor tests. The ductility improvements as observed in the RHL were verified by the preliminary modified burst test results.
REFERENCES
[1] SCHMITZ, F.F., PAPIN, J., High burnup effects on fuel behaviour under accident conditions: the tests CABRI REP-Na, J. Nucl. Mater. 270 (1999) 55.
[2] SUGIYAMA, T., et al., Failure of high burnup fuels under reactivity-initiated accident conditions, Ann. Nucl. Energy 36 (2009) 380–385.
[3] BIBILASHVILI, Y., et al., Study of high burnup VVER fuel rods behaviour at the BIGR reactor under RIA conditions: experimental results, Proc. Topl. Mtg. RIA Fuel Safety Criteria, Organization for Economic Cooperation and Development, NEA/CSNI/R(2003)8/Vol. 2, Aix-en-Provence (2002) 115.
[4] UNITED STATES NUCLEAR REGULATORY COMMISSION, US NRC Standard Review Plan for the Review of Safety Analysis Reports for Nuclear Power Plants: LWR Edition, NUREG 0800, SRP 4.2.


67
CURRENT STATUS OF RIA STUDY IN THE REPUBLIC OF KOREA
S.-K. KIM, J.-G. BANG, D.-H. KIM, Y.-S. YANG, Y.-H. KOO Korea Atomic Energy Research Institute Daejon, Republic of Korea Email: [email protected]
Abstract
There is no systematic and long-term research project focused on RIA and LOCA supported by government. Only some separate effect research such as mechanical test during the transient has been carried out in KAERI. Some mechanical tests such as ring-type hoop tensile test and high-speed burst test for understanding of cladding response due to PCMI during RIA have been performed, and expansion due to compression (EDC) test developed by Studsvik is being considered in KAERI. The ring-type hoop tensile tests and high-speed burst test have been performed for several years, and some experimental data are available. The EDC tests are being planned in present, and the preliminary test will be performed with un-irradiated cladding in this year. In this study, the short-ring tensile tests were performed in order to the investigate ductility and toughness degradation of high burnup fuel cladding under a hoop loading condition in a hot cell in KAERI. Some experimental data regarding ring-type hoop tensile test and high-speed burst test are presented. In addition, EDC test plan with high burnup fuel cladding discharged from the Republic of Korea nuclear power plant will be briefly introduced. 1. INTRODUCTION A reactivity-initiated accident (RIA) is a nuclear reactor accident that involves an unwanted increase in reactor power. The abrupt power increase can lead to damage the reactor core as well as fuel cladding, and in severe cases, even lead to disruption of reactor. During a steady-state operation of light water reactors, the mechanical behaviour of the zirconium-based fuel cladding degrades due to a combination of oxidation, hydriding, and radiation damage. In an effort to increase the operating efficiency through the use of longer fuel cycles, and to reduce the volume of waste associated with the core reloads, utilities have a strong incentive to increase the average discharge burnup of the fuel assemblies. Further increases in the operating efficiency of power reactors can also be achieved by increasing the coolant outlet temperature. However, both of these changes in a reactor operation enhance the cladding degradation, which may increase the likelihood of a cladding failure during design-basis accidents. One such postulated design-basis accident scenario is the RIA in a pressurized water reactor (PWR) caused by the ejection of a control rod from the core, which would cause a rapid increase of the reactivity and the thermal energy in the fuel (Meyer et al., 1986). The increase in fuel temperature resulting from an RIA induces a rapid fuel expansion, causing a severe pellet-cladding mechanical interaction (PCMI). This PCMI forces the cladding to experience a multiaxial tension such that the maximum principal strain is in the hoop (i.e., transverse) direction of the cladding tube. The survivability of a fuel cladding irradiated to a high burnup under postulated RIA conditions is thus a response to a combination of the mechanics of a loading and the material degradation during a reactor operation. While such data is available for the axial deformation behaviour of cladding tubes, relatively little data has been reported in the open literature on the uniaxial tension behaviour in the hoop direction of nuclear fuel cladding. In the 1990s, experimental programs were also initiated in Japan, France, and the Russian Federation to investigate the behaviour of highly irradiated nuclear fuel under reactivity-initiated accident conditions. But, there is no systematic and long-term research project focused on RIA supported by government as well as LOCA. Only some separate effect research such as mechanical test during the transient has been carried out in KAERI. Some mechanical tests such as ring-type hoop tensile test and high-speed burst test for understanding of cladding response due to PCMI during RIA have been performed, and expansion due to compression (EDC) test developed by Studsvik is being considered in KAERI. The ring-type hoop tensile tests and high-speed burst test

68
have been performed for several years, and some experimental data are available. The EDC tests are being planned in present, and the preliminary test will be performed with un-irradiated cladding in this year. In this study, the short-ring tensile tests were performed in order to the investigate ductility and toughness degradation of high burnup fuel cladding under a hoop loading condition in a hot cell in KAERI. Some experimental data regarding ring-type hoop tensile test and high-speed burst test are presented. In addition, EDC test plan with high burnup fuel cladding discharged from the Korean nuclear power plant will be briefly introduced. 2. RESEARCH ON MECHANICAL PROPERTIES OF NUCLEAR CLADDING
DURING RIA CONDITION Mechanical tests such as ring tensile test and high-speed burst test, and expansion due-to compression test were applied in order to investigate the stress and strain in pellet-cladding mechanical interaction during RIA. In this paper, the results on the ring tensile test and the high-speed burst test performed by KAERI are briefly introduced. 2.1. Research on mechanical properties by ring tensile test To obtain the mechanical strengths such as the 0.2% offset yield strength and ultimate tensile strength were evaluated, and the uniform elongation and total elongation were also evaluated for the ductility. The hoop stress-strain curves at various temperatures are shown in Fig. 1.
0 30 60 90 120 150 180 2100
200
400
600
800
1000
1200
1400Strain rate=0.01/s
Ho
op s
tre
ss (
MP
a)
Hoop strain (%)
RT(Un-RT-01) RT(Un-RT-02)
135oC(Un-135-03)
135oC(Un-135-04)
200oC(Un-200-05)
200oC(Un-200-06)
300oC(Un-300-07)
300oC(Un-300-08)
300oC(Un-300-17)
350oC(Un-350-09)
350oC(Un-350-10)
350oC(Un-350-18)
400oC(Un-400-11)
400oC(Un-400-12)
600oC(Un-600-13)
600oC(Un-600-14)
800oC(Un-800-15)
800oC(Un-800-16) RT(Ir-RT-02)
135oC(Ir-135-03)
200oC(Ir-200-04)
300oC(Ir-300-07)
300oC(Ir-300-08)
350oC(Ir-350-09)
350oC(Ir-350-10)
400oC(Ir-400-01)
600oC(Ir-600-05)
800oC(Ir-800-06)
FIG. 1. Hoop stress-strain curves at various test temperatures.
The evaluation results of the yield strength and the ultimate tensile strength are shown in Figs 2–3. The results show that the 0.2% offset yield strength and the ultimate tensile strength abruptly decrease with an increasing temperature. The ultimate tensile strength was evaluated to be 942.70 MPa at RT, 678.83 MPa at 400C, but, it is abruptly diminished to 282.64 MPa at 600C, which is achievable in the RIA condition. Especially, it decreases to 58.30 MPa at 800C, an extreme condition, which corresponds to 6% of the ultimate tensile strength at room temperature. This means that the mechanical strength of the high burnup Zircaloy-4 nuclear fuel cladding sharply decreases in the RIA-relevant temperature ranges. The evaluation results of the uniform elongation and total elongation are shown in Figs 4–5.

69
0 100 200 300 400 500 600 700 800 9000
100
200
300
400
500
600
700
800
900Strain rate=0.01/s
0.2%
yie
ld s
tren
gth
(MP
a)
Temperature (oC)
Unirradiated Irradiated
FIG. 2. Yield strength of the un-irradiated and high burnup fuel cladding.
0 100 200 300 400 500 600 700 800 9000
100
200
300
400
500
600
700
800
900
1000
1100Strain rate=0.01/s
Ulti
ma
te t
ensi
le s
tren
gth
(M
Pa)
Temperature (oC)
Unirradiated Irradiated
FIG. 3. Ultimate tensile strength of the un-irradiated and high burnup fuel cladding.
0 100 200 300 400 500 600 700 800 9000.00
0.05
0.10
0.15
0.20
0.25Strain rate=0.01/s
Pla
stic
uni
form
elo
ngat
ion
(mm
/mm
)
Temperature (oC)
Unirradiated Irradiated
FIG. 4. Uniform elongation of the un-irradiated and high burnup fuel cladding.
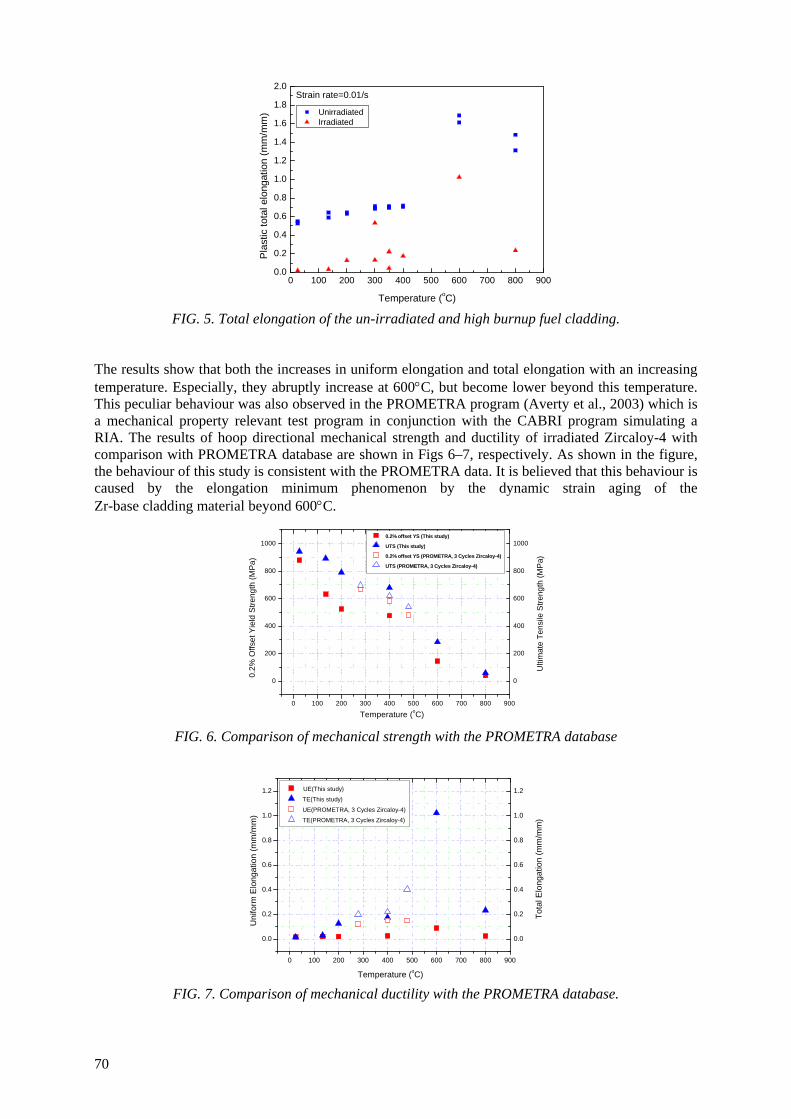
70
0 100 200 300 400 500 600 700 800 9000.0
0.2
0.4
0.6
0.8
1.0
1.2
1.4
1.6
1.8
2.0Strain rate=0.01/s
Pla
stic
to
tal e
long
atio
n (m
m/m
m)
Temperature (oC)
Unirradiated Irradiated
FIG. 5. Total elongation of the un-irradiated and high burnup fuel cladding.
The results show that both the increases in uniform elongation and total elongation with an increasing temperature. Especially, they abruptly increase at 600C, but become lower beyond this temperature. This peculiar behaviour was also observed in the PROMETRA program (Averty et al., 2003) which is a mechanical property relevant test program in conjunction with the CABRI program simulating a RIA. The results of hoop directional mechanical strength and ductility of irradiated Zircaloy-4 with comparison with PROMETRA database are shown in Figs 6–7, respectively. As shown in the figure, the behaviour of this study is consistent with the PROMETRA data. It is believed that this behaviour is caused by the elongation minimum phenomenon by the dynamic strain aging of the Zr-base cladding material beyond 600C.
0 100 200 300 400 500 600 700 800 900
0
200
400
600
800
1000
0
200
400
600
800
1000
Temperature (oC)
Ulti
ma
te T
en
sile
Str
eng
th (
MP
a)
0.2
% O
ffse
t Yie
ld S
tre
ng
th (
MP
a)
0.2% offset YS (This study)
UTS (This study)
0.2% offset YS (PROMETRA, 3 Cycles Zircaloy-4)
UTS (PROMETRA, 3 Cycles Zircaloy-4)
FIG. 6. Comparison of mechanical strength with the PROMETRA database
0 100 200 300 400 500 600 700 800 900
0.0
0.2
0.4
0.6
0.8
1.0
1.2
0.0
0.2
0.4
0.6
0.8
1.0
1.2
Temperature (oC)
Tot
al E
lon
gatio
n (m
m/m
m)
Un
iform
Elo
nga
tion
(m
m/m
m)
UE(This study)
TE(This study)
UE(PROMETRA, 3 Cycles Zircaloy-4)
TE(PROMETRA, 3 Cycles Zircaloy-4)
FIG. 7. Comparison of mechanical ductility with the PROMETRA database.

71
The stereoscope photographs of the specimens after the ring tensile test are shown in Fig. 8. It represents the fracture patterns of the non-irradiated and high burnup Zircaloy-4 cladding specimens. As shown in the figure, four fracture patterns such as 45 shear type fracture, cup and cone type fracture, cup and cup type fracture and chisel edge type fracture were observed in the non-irradiated cladding.
FIG. 8. Stereoscope photograph of the specimens after the ring tensile test. The fracture type was found to depend strongly on the deformation temperature. At room temperature non-irradiated Zircaloy-4 cladding tends to be fractured by 45 shear type fracture or cup and cone type fracture. Cup and cone type fracture was dominant at 135C and 200C. Both cup and cone type fracture and cup and cup type fracture was observed at 300C. Only cup and cup type fracture was observed at 350C and 400C. At 600C chisel edge type fracture was observed unlike at lower temperatures with few fracture surface area. At 800C the fracture type is unclear. These fracture types are summarized in Table 1.
High burn-up cladding Non-irradiated cladding
135C
200C
300C
350C
400C
600C
R.T.

72
TABLE 1. FRACTURE TYPES FOR THE RING TENSILE TESTS OF THE ZIRCALOY-4 FUEL CLADDING
TemperatureFracture type
Non-irradiated cladding High burnup cladding
25C 45 shear type fracture
Cup and cone type fracture
Brittle fracture
135C Cup and cone type fracture 200C Cup and cone type fracture
300C Cup and cone type fracture Cup and cup type fracture
350C Cup and cup type fracture 400C Cup and cup type fracture 600C Chisel edge type fracture 800C Unidentified
In conclusion, the fracture type of non-irradiated Zircaloy-4 cladding depends on the temperature, and the behaviour is governed by a ductile fracture with a necking. On the contrary, the fracture patterns of the high burnup Zircaloy-4 cladding showed completely different fracture patterns from the non-irradiated Zircaloy-4 cladding. The fracture type was observed to be vertical in the tensile direction without a necking at all of the test temperatures, which is convincing evidence of the brittle fracture behaviour of high burnup fuel cladding regardless of temperature. This means that even at a high temperature, 600C or 800C, the fracture pattern showed a brittle fracture behaviour. Accordingly, it was found that the high burnup Zircaloy-4 cladding becomes very brittle even at the high temperatures achievable during a design-basis accident (Daum et al., 2002). 2.2. Research on mechanical properties by high-speed burst test Figure 9 shows the time–pressure profile of the as-received Zircaloy-4 cladding under the rapid pressurization test. In the 350°C test, the pressure increased prior to the test which is due to a thermal expansion of the hydraulic oil. It showed that the pressurization rate (slope at the initial part of the
time–pressure curve) in this study was 5.4 GPa·s-1 at room temperature and 3.1 GPa·s-1 at 350°C, where the pressurization rate at room temperature is 24000 times higher than the conventional burst test. As the pressurization changes, the material properties also change. Ultimate hoop stress (UHS) at room temperature and 350°C in this study were, respectively 1067 MPa and 620 MPa, which are increased by 24.3% and 16.8% when compared to the conventional burst test. In the figure, theoretical burst behaviour can be expected when the line was drawn from the elastic region and extended to the baseline, namely the 0 MPa line. When we measure the interval between the intersection point and the point at a failure, the actual duration time of the fuel cladding during a rapid pressurization can be obtained. Duration time of the Zircaloy-4 cladding was 37.8 ms at room temperature and 32.5 ms at 350°C, which closely simulates the power pulse of an actual RIA situation which is known as around 30–40 ms (MacDonald et al., 1970).

73
FIG. 9. Rapid burst properties of Zircaloy-4 cladding with the test temperature.
Merging all burst tests into a single graph, the change in the material property as UHS with the pressurization is shown in Fig. 10. In the figure, there exists a linear relationship between the UHS and the pressurization rate. The slope between the UHS and pressurization rate was 0.03701 at room temperature and 0.02124 at 350°C. From the result, a higher pressurization rate induces a higher strain rate that results in an increase of the UHS. Since the evaluation of the actual strain rate under biaxial burst is extremely difficult, it was tried to indirectly evaluate the strain rate of the cladding and compare to the other data (Kim et al., 2006).
FIG. 10. Changes in the maximum hoop stress of Zircaloy-4 with the pressurization rate and the test temperature. The result was shown in Fig. 11. As shown in the figure, increase of the maximum stress (both UTS in ring tensile test and UHS in burst test) with the strain rate is clearly shown. Such a strain rate hardening is known as the hindrance of dislocation movement caused by the dislocation multiplication. When an external strain is exerted, dislocations are continuously generated and diffused through the crystal structure to the grain boundary. If the rate of the dislocation generation exceeds the rate of diffusion to the grain boundary, the dislocation density increases to cause an increase in the strength (Adams, 1965). However, it is not clear why the maximum stress as well as the strain rate sensitivity of the burst test is higher than that of the tensile test. Further works related to the strain rate dependency and stress state of the zirconium cladding is needed. During the waterside corrosion, the generated hydrogen is partly absorbed into the cladding. For hydrogen contents exceeding significantly the solubility limit, hydride precipitation is observed. These precipitated hydrides have a deleterious impact on the fuel cladding ductility (Kim, et al., 2006). To investigate the effect of hydrogen, hydrogen was charged into the Zircaloy-4 cladding at a value of 300 ppm and 600 ppm then a rapid pressurization test was carried out. Figure 12 shows the room

74
temperature rapid pressurization profile of the hydrogen-charged Zircaloy-4 cladding. UHS of the 300 ppm-charged specimen did not differ from the as-received condition except that the failure time was more or less shortened. In the case of the 600 ppm-charged specimen, it was so brittle that it failed at the elastic region. However, the effect of the hydrogen was soon eliminated when the test temperature was increased. Figure 13 shows the UHS of the as-received and 600 ppm-charged specimens with the test temperature.
FIG. 11. Changes in the maximum stress of Zircaloy-4 with the strain rate.
FIG. 12. Rapid pressurization properties of Zircaloy-4 cladding with the hydrogen content.
FIG. 13. Maximum hoop stress vs. test temperature.

75
As the test temperature increases, the expansion of the cladding as well as the decrease in the viscosity of the hydraulic oil makes the pressurization rate become lower, which is regarded it as unavoidable. At room temperature, UHS of the as-received condition was 23.2% larger than that of the 600 ppm-charged specimen. When the temperature increases above 200°C, their difference cannot be discriminated. At room temperature, the solubility limit of hydrogen is negligible and most of the hydrogen is located in the zirconium hydrides precipitates within the zirconium matrix. These hydrides are responsible for material embrittlement. When it strained at room temperature, separation between the hydride and the metal matrix as well as the failure of a brittle hydride itself will occur to reduce the strength of the zirconium cladding (Kim et al., 2006). When the test temperature increases, the property of the zirconium metal will be changed in that the ductility increases due to an increase in the test temperature. Thus it induces a similar mechanical behaviour between the hydrogen-charged cladding and the as-received one. This is also implied from the fracture appearance as shown in the Fig. 14.
FIG. 14. Fracture appearance of Zircaloy-4 after the high-speed pressurization test. In the case of as-received cladding, whatever the testing temperature was, it showed a ductile rupture, creating a circumferentially ballooned state. Crack initiates and propagates along the axial direction above the maximum hoop stress, soon this sharp crack became blunt during a plastic deformation and it ceased to propagate. As-received specimen at 350°C showed that the shape of the end part of the ballooned region was dull when compared to the room temperature and 200°C condition, which implies that the ductility was increased to suppress the propagation of the axial crack at an elevated temperature. For the 600 ppm-hydrogen-charged cladding pressurized at room temperature, the cladding showed a brittle failure along the axial direction, indicating no plastic deformation. The crack propagates along the axial direction first like the as-received condition, however, this sharp crack did not become blunt at the cladding material and it rapidly propagated to induce a catastrophic, brittle failure. A void will nucleate preferentially at an interface between a hydride and a zirconium matrix to develop a crack. Void will continuously generate ahead of the crack tip when the crack propagates so that it leads to a catastrophic failure along the axial direction. In the case of the hydrogen-charged specimen burst at 200°C, although the axial cracks developed at the side of the ballooned region, their size was not longer than that at the room temperature. In the case of the hydrogen charged specimen burst at 350°C, the fracture appearance was no more different than that of the as-received one. In the room temperature, axial split was well developed at the end part cladding which indicates that residual metal is too brittle to suppress the axial crack propagation once the crack initiates at the metal–hydride interface. At the high temperature, such a catastrophic axial crack diminished. This seems that

76
ductility of the metal matrix was so high that it can restrain the crack from propagating, leaving a fracture appearance similar to the as-received one. 2.3. Future research on RIA In KAERI, the ring tensile test with a strain rate, 1 s-1, which is higher than earlier ring tensile test studies for high burnup cladding as well as hydrided cladding for high burnup simulation in the temperature range of 25–800C. EDC test will be also prepared for the high burnup spent fuel claddings discharged in Republic of Korea nuclear power plants. 3. CONCLUSION
On the basis of the ring tensile tests for the high burnup Zircalay-4 cladding from Ulchin Unit 2 in the Republic of Korea and the as-received un-irradiated Zircalay-4 cladding, the following conclusions were drawn. The result shows that there is no significant tensile strength between high burnup and as-received un-irradiated Zircalay-4 cladding, whereas total elongation of high burnup cladding is much lower than that of un-irradiated cladding. It was also found that the un-irradiated fuel cladding showed ductile fracture behaviours such as 45° shear type fracture, cup and cone type fracture, cup and cup type fracture and chisel edge type fracture, while the high burnup Zircalay-4 cladding showed a brittle fracture behaviour even at the high temperatures (e.g. over 600C) which are achievable during a RIA. Rapid pressurization test was also carried out to evaluate the mechanical behaviour of a cladding under a fast strain rate as well as a biaxial stress state to simulate an out-of-pile RIA behaviour. The results shows that maximum hoop stress, pressurized at a rate of 5.4 GPa·s-1 at room temperature and 3.1 GPa·s-1 at 350°C, increased by 24.3% and 16.8% when compared to the conventional burst test results. It was also revealed that failure mode switched from a ductile ballooning to a brittle failure which leads to an axial split of the cladding when the hydrogen was added at a nominal value of 600 ppm when tested at room temperature. As the test temperature increased, its effect was diminished.
REFERENCES [1] GLASSTONE, S., SESONSKE, A., Nuclear Reactor Engineering, 3rd Ed., Krieger Publishing
Company, Malabar (1991). [2] CHUNG, H.M., KASSNER, T.F., Cladding metallurgy and fracture behaviour during
reactivity-initiated accidents at high burnup, Nuclear Engineering and Design 186 (1998) 411–427
[3] SCHMITZ, F., PAPIN, J., High burnup effects on fuel behaviour under accident conditions: the tests CABRI REP Na, Journal of Nuclear Materials 270 (1999) 55–64.
[4] MEYER, R.O., et al., A regulatory assessment of test data for reactivity initiated accidents, Nuclear Safety 37 (4) (1986) 271–288.
[5] AVERTY, X., et al., Tensile tests on ring specimens machined in M5 cladding irradiated 6 cycles, IRSN 2003/50 (2003).
[6] DAUM, R.S., et al., On the embrittlement of Zircaloy-4 under RIA-relevant conditions, Zirconium in the Nuclear Industry: Thirteenth International Symposium, ASTM STP 1423 (2002) 702–719.

77
THE CLADDING FRACTURE BEHAVIOUR UNDER BIAXIAL STRESS CONDITIONS
T. FUKUDA, T. MIHARA, M. AMAYA, T. SUGIYAMA, F. NAGASE Japan Atomic Energy Agency Fuel Safety Research Group Nuclear Safety Research Center Ibaraki, Japan Email: [email protected]
Abstract
It is considered that biaxial stress is generated in the cladding of high burnup fuels under reactivity initiated accident (RIA) conditions due to bonding between the fuel pellet and cladding and the isotropy of pellet thermal expansion. The effect of biaxiality on the fracture and deformation behaviour of the cladding has not been fully investigated even for unirradiated material, while it is well-known that the fracture behaviour strongly depends on the stress condition. Since such biaxial stress condition cannot be simulated by conventional mechanical testing techniques, a test apparatus was developed to control the axial and hoop stresses independently and evaluate the mechanical and fracture behaviour of the fuel cladding under biaxial stress conditions. This paper describes the outline of preliminary test results obtained under various biaxial stress conditions at room temperature using this apparatus. 1. INTRODUCTION In nuclear fuel assemblies, zirconium-based alloys including Zircaloy-2 and -4 have been widely used as materials for the fuel cladding. These materials have an anisotropic hexagonal crystal structure, and it is well-known that the mechanical properties and yield behaviour of these materials also exhibit anisotropy. Increases in surface corrosion and hydrogen absorption in cladding become concerns with the further burnup extension. Some simulated RIA test results showed that cladding failure occurs at smaller hoop strains [1–2], and it is considered that the decrease in fracture strain is caused by degradation of the cladding mechanical property due to the irradiation hardening, hydrogen absorption of the fuel cladding, and condition of the stress generated in the fuel cladding. The stress condition in the cladding under a RIA condition would become multiaxial state [3–4] due to the thermal expansion of the fuel pellet and the rod inner pressure increase by the fission gas release. In the case of the high burn up fuel, the bonding between fuel pellet and cladding often occurs. Therefore, the stress generated by the isotropic thermal expansion of pellet may be close to the equal biaxial state if the bonding is so tight. A biaxial stress testing apparatus was developed at the Japan Atomic Energy Agency (JAEA) to realize the biaxial stress conditions postulated under RIA conditions. The mechanical property and fracture behaviour of the anisotropic zirconium-based fuel cladding are investigated under biaxial stress conditions. This paper describes preliminary results of the tests with unirradiated cladding. 2. OVERVIEW OF CONVENTIONAL TEST METHODS The stress condition in the fuel cladding is dependent on the contact condition between the pellet and cladding, and the hoop/axial stress ratio varies from 1/1 (tight bonding) to 2/1 (internal pressure only). Many kinds of test method have been used in order to obtain the information on mechanical properties of the fuel cladding under such biaxial stress conditions. Figure 1 presents the overview of the typical material testing methods for the fuel cladding. The open-end burst test is used for evaluating the mechanical behaviour of cladding tube specimens under the uniaxial stress along the hoop direction [5]. No restraint force is applied into the upper and lower ends of the specimen in this test method. The uniaxial stress condition can be achieved by fixing

78
both ends axial free of the specimen when pressurized. The ring tensile method is also aimed at applying a simple hoop uniaxial stress into a ring-shaped specimen. There are, however, some difficulties in the evaluation of the test in general. Shape of the mandrel for loading and friction between mandrel and the ring-shaped specimen etc. should be taken into account for the evaluation. Sealing end plugs are attached to the upper and lower ends of specimen in the closed-end burst test. One end of the tube specimen is free for axial moving and the hoop/axial stress ratio is 2/1. The mechanical properties of fuel cladding tube along hoop direction have been characterized in the previous studies by this method for irradiated cladding tube. It may be sufficient to consider the effect of the increase of rod inner pressure in the case that the mechanical interaction can be ignore between fuel pellet and cladding: in this case, the stress condition generated in the cladding wall is treated as closed-end burst test condition. In the case of the high burnup fuel in which fuel pellet is strongly bonded with cladding, however, multiaxial stress condition should become taken into account.
Test method Open-end burst Ring tensile Closed-end burst Axial tensile Hoop/axial stress ratio
1/0 1/0> 2/1 0/1
Stress condition
FIG. 1. Comparison of the typical mechanical testing methods for fuel cladding tube. The axial tensile testing is generally performed using the holding devices (chucks) of the upper and lower ends of the tube specimen. The method is mainly used for checking whether the fabricated cladding satisfies the specification because data evaluation is quite easy. Figure 2 shows the biaxial stress condition in the small tube element schematically. Stresses in the axial and hoop directions are defined as ZZ and , respectively. Under this condition, the stress tensor of the element may be treated as biaxial because tube wall thickness is sufficiently small compared with the tube diameter and the stress in the radial direction, tt, is negligible. Figure 3 summarizes the stress conditions which can be achieved by the typical mechanical testing methods. In the figure, the vertical and horizontal axes show the axial and hoop stresses normalized by the yield stress obtained by the axial tensile test. The area coloured in the figure corresponds to the range of stress ratio which is expected under RIA conditions [6]. The figure shows that the typical mechanical test cannot fully reproduce the biaxial stress conditions which are expected under RIA
Hydraulic pressureLoading through mandrel
Hydraulic pressure Applying stress

79
conditions. Therefore, we developed a test apparatus which can control the axial and hoop stresses independently to evaluate the mechanical and fracture behaviour of the fuel cladding under a variety of biaxial stress conditions.
FIG. 2. Stress status of small element of cladding tube.
FIG. 3. Comparison between the stress conditions obtained by various testing methods and that occurred under RIA conditions, a: Fracture stress measured by axial tensile test.
3. EXPERIMENTAL
3.1. The outline of developed test apparatus A CNC-servo-type biaxial stress testing apparatus, which can generate various biaxial stress conditions in cladding tube specimens, was developed. Figure 4 shows the schematic diagram of this biaxial stress testing apparatus. The apparatus consists of two sections, one is the axial stress loading section, and the other is the pressurization section. The axial stress loading section has two oil actuators and a load cell. The pressurization region has a booster pump and an inner pressure gauge. Both sections are controlled monitoring the real and the differential values of the inner pressure and the specimen displacement in the axial and hoop directions during the test. The applied stress is controlled by a hydraulic pressuring
Normalized hoop stress (/a)
Nor
mal
ized
axi
al s
tres
s (
ZZ/
a)
Closed-end burst test
Open-end burst test
Axial tensile test
RIA condition
σzz
σθθ
σtt

80
system. Command signals and values of the axial load and inner pressure are recorded into a personal computer (PC).
FIG. 4. The Schematic diagram of biaxial stress testing apparatus. 3.2. Materials The materials tested in this study are unirradiated Zircaloy-4 tubes. The outer diameter and wall thickness are 9.5 mm and 0.70 mm, respectively. These tubes were prepared along a commercial fabrication process. The chemical compositions are shown in Table 1. Two types of the tubes were prepared by different final heat treatment; one is “re-crystallized (RX)”, and the other is “stress-relieved (SR)”. Table 2 shows the mechanical properties of the tubes measured by an axial tensile test. The tubes were cut into 170 mm long for the test. TABLE 1. CHEMICAL COMPOSITION OF THE SPECIMENS USED IN THIS STUDY
Chemical composition Sn Fe Cr Fe+Cr O H Material Zircaloy-4 (wt%) 1.3 0.11 0.22 0.33 0.13 3.3 (ppm)
TABLE 2. MECHANICAL PROPERTIES OF SPECIMEN MATERIALS (AT ROOM TEMPERATURE)
Stress-relieved (SR) Re-crystallized (RX) Ultimate tensile stress (MPa) 761 528 Elongation (%) 18 28
3.3. Biaxial stress testing Here, the axial and hoop stresses applied to specimen are controlled based on the nominal values of the inner and outer diameters of the tube specimen, assuming that the cross-sectional area does not
Booster
Hydraulic cylinder Hydraulic cylinder Specimen
Hydraulic source Differential control unit
Pressure gauge
Load cell
A/D_D/A converter
Servo valve
Signal line Oil line Control & data log PC

81
changed by plastic deformation during the biaxial stress testing. The test is carried out by using some simple linear-proportional parameters which correspond to the axial/hoop stress ratio. The specimen is fixed to the specimen holder using the Swagelok fittings to seal the inner pressure and the axial mechanical loading chucks. Five hoop/axial stress conditions, namely 1/0, 2/1, 1/1, 1/2 and 0/1, were selected for this study. The ratios correspond to the open-end burst, the closed-end burst, the isotropic and the axial tensile conditions, respectively. 4. RESULTS Figure 5 summarizes post-test appearances of the specimens fractured by the biaxial tensile tests. The figure shows that the stress ratio and the final heat treatment strongly affect the fracture morphology. In the RX material, a smaller deformation (~10%) in the hoop direction was observed under the hoop/axial stress ratio of 1/1 while a large deformation (~100%) was observed under the stress ratio of 1/0. The amount of deformation in the SR specimens appears to be smaller than that in the RX specimens.
Stress ratio Hoop/axial /ZZ
1/0 2/1 1/1 1/2 0/1
RX
SR
FIG. 5. Visual inspection results of the specimens fractured by the biaxial tensile test. Figure 6 shows the measured axial and hoop stress at fracture in comparison with the Mises yield surface (solid lines). These Mises yield surfaces are calculated based on the axial stress at fracture in each axial tensile test, assuming the specimen as an isotropic material. The figure shows that the measured values of the SR and RX materials are generally located outside the Mises yield surface. These discrepancies indicate that the anisotropy affects the fracture behaviour of the specimens and the effect remains in the re-crystallized material.

82
0
200
400
600
800
1000
0 200 400 600 800 1000
Hoop stress (MPa)
Axi
al s
tres
s (M
Pa)
RX
Mises isotropic RX
SR
Mises isotropic SR
FIG. 6. Measured axial and hoop stress at fracture in comparison with the Mises isotropic yield surface calculated based on the axial stress at fracture in the axial tensile test. 5. DISCUSSION As seen in Fig. 6, the fracture morphology of the specimen is strongly affected by the hoop/axial ratio of the stress generated in the specimen.
0
0.5
1
1.5
2
0 0.5 1 1.5 2
Normalised hoop stress
Norm
alis
ed
axia
l st
ress
RX
SR
Mises istropic surface
FIG. 7. Normalized stress conditions at fracture between the SR and RX specimen with Mises isotropic yield surface. At the test under hoop/axial stress condition of 1/0, the total length of specimen after the test became shorter than the initial length. This result indicates that compressive stress was generated in the axial direction with the radial expansion of the specimen during the test. In the case of the hoop/axial stress ratio of 1/1, it is likely that plastic strain in a specific direction is difficult due to the restraint by the axial and hoop stresses and the fracture strain is small as a consequence.

83
With decrease in the hoop/axial stress ratio from 1/1, outer diameter reduces in the middle part of the specimen though both SR and RX materials showed fracture strains over 10% under axial tensile testing condition. The effect of axial stress becomes dominant to the deformation behaviour of specimen with decreasing the hoop/axial stress ratio in the range of the hoop/axial stress ratio (<1/1). Figure 7 compares the normalized stress conditions at fracture between the SR and RX specimens. The normalized stress conditions of deformation of an isotropic material are also shown as the solid line in the figure for comparison. The normalized fracture stress conditions of the RX specimens are located outside those of the SR specimens. In addition, the measured values do not agree well with the solid line which corresponds to the Mises yield surface of an isotropic material. The same trend was reported in unirradiated RX specimen [7]. The SR specimens also show the same anisotropic behaviour in this study. It is considered that the final heat treatment and the anisotropy should be taken into account to determine the fracture stress condition of the zirconium-based fuel cladding under biaxial stress conditions. 6. CONCLUSIONS A biaxial stress testing apparatus for the fuel cladding was developed. The biaxial stress conditions under RIA conditions can be simulated in the out-of-pile test by using the apparatus and controlling the axial and hoop stresses independently. Mechanical properties and fracture behaviour of stress-relieved and re-crystallized Zircaloy-4 cladding tubes were investigated under various biaxial stress conditions. From these results, it was clarified that the final heat treatment and the anisotropy of the cladding tubes strongly affects the fracture stress condition of the cladding under biaxial stress conditions. 7. ACKNOWLEDGEMENTS
The present study was conducted as a part of the program sponsored and organized by the Nuclear and Industrial Safety Agency, Ministry of Economy, Trade and Industry.
REFERENCES
[1] NAKAMURA, T., KUSAGAYA, K., FUKETA, T., UETSUKA, H., High-burnup BWR fuel behaviour under simulated reactivity-initiated accident conditions, Nuclear Technology 138 (3) (2002) 246–259.
[2] SUGIYAMA, T., UMEDA, M., FUKETA, T., SASAJIMA, H., UDAGAWA, Y., NAGASE, F., Failure of high burnup fuels under reactivity-initiated accident conditions, Annals of Nuclear Energy 36 (2009) 380–385.
[3] UDAGAWA, Y., SUGIYAMA, T., SUZUKI, M., FUKETA, T., PWR fuel behaviour in RIA-simulating experiment at high temperature, Proceedings of the 2008 Water Reactor Fuel Performance Meeting, Seoul (2008).
[4] CAZALIS, B., DESQUINES, J., et al., The PROMETRA program: fuel cladding mechanical behaviour under high strain rate, Nuclear Technology 157 (2) (2007) 215–225.
[5] NAKATSUKA, M., YAGNIK, S., Effect of hydrides on mechanical properties and failure morphology of BWR fuel cladding at very high strain rate, Journal of ASTM International 8 (1) (2010).
[6] DESQUINES, J., KOSS, D.A., MOTTA, A.T., CAZALIS, B., PETIT, M., The issue of stress state during mechanical tests to assess cladding performance during a reactivity-initiated accident (RIA), Journal of Nuclear Materials 412 (2) (2011) 250–267.
[7] Y. MISHIMA, et al., Journal of the Atomic Energy Society of Japan 29 (2) (1987) 90.


85
FRACTURE BEHAVIOUR OF HYDRIDED CLADDING TUBES WITH RADIAL INCIPIENT CRACK IN PERIPHERY
T. MIHARA, T. FUKUDA, Y. UDAGAWA, T. SUGIYAMA, F. NAGASE Japan Atomic Energy Agency Ibaraki, Japan Email: [email protected]
Abstract
A part of hydrogen which is absorbed into the fuel cladding during the reactor operation precipitates as zirconium hydride. It has been pointed out for high burnup PWR fuels that the hydrides preferentially precipitate in the outer region of fuel cladding as so-called hydride rim and the hydrides strongly affects the failure behaviour during reactivity initiated accidents (RIA). Due to the stresses generated by pellet-cladding mechanical interaction (PCMI) under RIA conditions, many incipient cracks pass through the region of hydride rim and one of the incipient cracks propagates and penetrates the cladding tube wall. It is possible that the crack propagation from the hydride rim region is influenced by the existence and distribution condition of hydrides around the tip of the incipient crack. In order to clarify the effect of hydrides around the tip on the failure behaviour of the cladding, we prepared the hydrided cladding specimens which had a radial incipient crack in the outer peripheral region of tube and carried out the expansion due to compression (EDC) test. In the cladding specimens prepared, we observed that the hydrides precipitated and distributed in a radial pattern from the incipient crack. The EDC test results showed that the incipient crack propagates along the radial hydrides precipitated. The stress intensity factor at cladding tube failure was evaluated by using the sum of incipient crack depth and precipitated hydride length instead of incipient crack depth. These evaluation results indicated that the hydrides connected to an incipient crack have very low resistance to fracture and play a role of a preexisting crack. 1. INTRODUCTION The Japan Atomic Energy Agency (JAEA) has conducted many experimental studies on the light water reactor (LWR) fuel behaviour during an RIA using the Nuclear Safety Research Reactor (NSRR). In the NSRR program started in 1989, experiments were carried out on LWR fuel rods which were irradiated in commercial nuclear power plants or in the Japan Materials Testing Reactor (JMTR) [1–3]. These studies showed that high-burnup fuels fail due to pellet cladding mechanical interaction (PCMI) under RIA conditions. Observed failure strains in the fuel cladding were very low. The embrittlement of the fuel cladding is caused by precipitation of zirconium hydrides which have low fracture toughness. It is considered that this failure phenomenon is divided into initial crack formation in the periphery of the cladding and crack propagation through the cladding wall. The first process is associated with the hydride precipitation in the cladding periphery. In the high-burnup PWR fuel cladding, hydride clusters oriented circumferentially precipitate and they accumulate in the cladding periphery due to the temperature gradient during the commercial PWR operation. The hydride clusters accumulated in the periphery are called “hydride rim”. Many cracks are observed in the hydride rim in no failure cases and one of these cracks is considered to penetrate the wall of the cladding [4–5] as shown in Fig. 1 [6]. Tomiyasu et al. conducted the experiments which simulated RIA conditions at the NSRR with unirradiated prehydrided cladding and demonstrated that the hydride rim plays the most important role in PCMI failure during an RIA [7]. The results of the experiments suggest that cracks in the hydride rim have a role of initial crack. Udagawa et al. evaluated the stress intensity factor KI for the high burnup PWR experiments in the NSRR, regarding the hydride rim thickness as the incipient crack depth [8]. The second is a process of the crack propagation through the cladding wall. This process is affected by the stress distribution around the tip of a crack. The factors related to the decrease of fracture

86
toughness are the microstructure such as hydrides, radiation damage, crystal orientation, and so on. According to the reference [9], hydrides are a brittle material and the failure stress was evaluated to be about 18 MPa. The stress intensity factor KI is useful to determine a failure criterion. Some trial evaluations were made using the PIE results and the transient fuel behaviour analysis code RANNS developed by JAEA. They gave adequate results of KI as a failure threshold compared with the bibliographical values of Zircaloy-4 failure threshold [10]. However, the effect of hydrides on the fracture toughness of cladding tube is still unclear. The purpose of this study is to clarify the effect of hydrides around the tip of a crack on the fracture behaviour of Zircaloy-4 cladding tubes. In this study, stress intensity factors were determined in unirradiated tube specimens with a crack in the periphery. The results of stress intensity factors provide further insights into the fracture criterion on the effects of hydrides morphology around the tip of an incipient crack.
FIG. 1. Cross section of the irradiated fuel cladding failed during pulse irradiation [6].
2. EXPERIMENTAL PROCEDURE 2.1. Materials The specimens used in this study were prepared from Zircaloy-4 cladding tubes with a thickness of 0.7 mm, and each cladding tube has a shallow crack in the peripheral region. Here, this crack was introduced into the tubes using “rolling-after-grooving (RAG)” process [10] which was developed by JAEA. In the RAG process, a tube is firstly rolled as done in the normal tube fabrication process. After a groove with square cross section is axially introduced onto the rolled tube by using an electric discharge process, the tube is rolled again to finish the tube production. After the RAG process, the groove becomes a narrow and closed crack which is similar to the crack formed in the hydride rim region under RIA conditions [11]. The crack depths of the cladding tubes prepared by using the RAG process were in the range of 120–200 μm. In order to investigate the effect of hydride distribution on failure behaviour, some of the tubes prepared by the RAG process were finally heat-treated under stress-relieved (SR) and recrystallized (RX) conditions. The distribution of hydrides strongly depends on the specimen heat treatment. 2.2. Hydrogen charging Hydrogen was charged into specimens by an autoclave treatment in LiOH solution. The temperature for hydrogen charging was 600 K. The charged hydrogen concentrations were 300 ppm and 700 ppm. Cladding tubes which contained about 700 ppm of hydrogen were annealed at 773 K in a steam for the

87
homogenization of hydrogen because thick hydride layer was observed near the surface of cladding tube after the hydrogen charge. 2.3. Mechanical testing The expansion due to compression (EDC) test was used to investigate the fracture behaviour of the cladding tube specimens. The test process was developed at Studsvik Nuclear AB [13]. The test was performed by axially compressing a Teflon pellet inserted into the cladding tube specimens. The compressed pellet radially pushes out the inner wall of the cladding tube specimens. The axial load and the displacements of the plungers and the diameter of the cladding tube specimens were monitored and recorded. Laser displacement sensors were used for the measurement of the outer diameter. Using this loading process, the cladding tube specimens were subjected to the stress in the circumferential direction. Experiments were conducted at room temperature. The loading rate of a Teflon pellet (the displacement of the plunger) is 0.1 mm·s-1, and the deformation rate of the cladding tube specimen is about 0.05 mm·s-1 in the circumferential direction. 2.4. Morphology of precipitated hydrides Microstructures of the hydrogen-charged specimens were observed by an optical microscopy. The specimens for metallography were mechanically ground and polished in the grit range from 400–1200. The specimens were then etched for about 10 s with a solution of 70% H2O – 30% HNO3 – 5% HF to reveal the hydrides. As shown in Fig. 2, the hydrides tended to be distributed radially from the tip of incipient crack. Considering that the hydrides in the CW specimen distribute more uniformly compared with SR and RX specimens, this tendency may be due to the stress which was generated by the oxide-formed on crack surface. The fracture surface near the tip of incipient crack was also investigated by a scanning electron microscopy (SEM).
FIG. 2. Cross section of typical hydrided cladding tubes prepared by the RAG process.
2.5. Analysis of the fracture behaviour of tube specimen Figure 3 presents the schematic diagram of the experimental system of this study. Here, it is assumed that a tube specimen has a longitudinal surface crack near its outer surface. Fracture analysis is performed by using the stress intensity factor, KI. The factor KI is calculated based on the following formulae:

88
Where P is the internal pressure; ri is the inner radi of tube specimen; re is the outer radi of tube specimen; W is the wall thickness of tube specimen; a is the incipient crack depth; in is the influence coefficient which depends on the type of incipient crack.
P is expressed through the following formulae:
Where σr is the external stress; σz is the axial stress; εr is the radial strain εz is the axial strain; E is the Young's modulus; ν is the Poisson's ratio.
These equations are used to evaluate the internal pressure of the cladding specimen from the displacement of each plunger. It should be noted that this model assumes that elastic pellet keeps its cylindrical shape until the failure of the cladding specimen. In the case that the elastic fracture mechanics is applied into this experiment, specimen size, ligament size and crack length etc. should satisfy the conditions that the elastic component is sufficiently dominant. In this study, it was confirmed that these values satisfy the conditions necessary to analyse the experimental results based on the elastic fracture mechanics. 3. RESULTS AND DISCUSSION
3.1. Crack and hydride morphology Figure 4 compares the cross sections of cladding tubes of CW, SR and RX prepared by the RAG process. The cracks of all specimens were sharp, and their depths were evaluated as about 160 μm. Figure 4 also compares the morphologies of precipitated hydrides. The precipitated hydrides distribute radially from the tip of the incipient crack. It is considered that stress was generated around the tip of crack due to the formation of oxide on the surface of the incipient crack during hydrogen charging and hydride precipitated along this stress distribution. As seen in the figure, the lengths of hydride in the SR and RX materials tend to be longer than CW.

89
ri
W
a
re
FIG. 3. Experimental system of this study.
FIG. 4. Cross sections of hydride precipitated RAG processed claddings. 3.2. EDC experiments Figures 5–6 show the relationship between the load applied to the pellet and the outer diameter of the stress relieved, old worked and recrystallized cladding specimens. As seen in the figures, the outer diameters of the cladding specimens increase with the load applied to the pellet. It is also found that the RX specimens fractured in the region of plastic deformation while the SR and CW specimens fractured in the region of elastic deformation.

90
9.45 9.50 9.55 9.60 9.65 9.70 9.75 9.80 9.85 9.90 9.95-1
0
1
2
3
4
5
6
7
Cla
ddin
g L
oad
(kN
)
Outer diameter (mm)
SR SR300 SR600
9.45 9.50 9.55 9.60 9.65 9.70 9.75 9.80 9.85 9.90 9.95-1
0
1
2
3
4
5
6
7
Cla
ddin
g L
oad
(kN
)
Outer diameter (mm)
CW CW300 CW600
FIG. 5. Relation of load and outer diameter of the (a) stress relieved and (b) cold worked specimens.
3.3. Fracture cross-section and fracture surface The cross-sections of fractured specimens are shown in Fig. 7. It is observed that hydrided specimens were fractured along radial hydrides without large deformations. Figure 8 compares the micrographs of the cross-section and fracture surface of the hydrided CW specimens. From the figure, it is found that the crack propagated through the tube wall from the tip of incipient crack. It seems that the fracture surfaces of the non-hydrided specimens consist of two types of fracture modes, namely, the plane strain fracture and the share fracture. In terms of the hydrided specimens, it seems that the fracture surfaces consists of three fracture modes; that is, the brittle fracture in the hydride-precipitated region, the plane strain fracture and the share fracture. These results indicate that plane strain failure occurs from the crack introduced by the RAG process in non-hydrided specimens and from the tip of hydrides in hydrided specimens.
(a)
(b)

91
9.45 9.50 9.55 9.60 9.65 9.70 9.75 9.80 9.85 9.90 9.95-1
0
1
2
3
4
5
6
7
Cla
ddin
g L
oad
(kN
)
Outer diameter (mm)
RX RX300 RX600
FIG. 6. Relation of load and outer diameter of the (c) recrystallized specimens.
FIG. 7. Cross sections of fractured claddings after EDC testing.
(c)

92
FIG. 8. Cross sections and fracture surface of fractured claddings.
3.4. Fracture toughness Figure 9 (a) shows the stress intensity factor of each specimen as a function of its initial crack length. Data of the non-hydrided RX specimens are out of the scope of the present evaluation, because plastic regions around the tip of a crack is larger than the ligament region in the specimens and the evaluation of the internal pressure applied contains a large error due to the barrel-shaped deformation of pellet. In the figure, correlation is not clearly seen between stress intensity factor and initial crack length. The Kc of hydrided specimens is lower than non-hydride specimens. This indicates that hydrided specimens were more brittle than non-hydrided specimens.
0 100 200 300 400 500 600 7000
2
4
6
8
10
12
14
16
18
20
Str
ess
inte
nsit
y fa
ctor
Kc
(MP
a√m
)
Length of an initial crack (m)
CW SR RX
0 100 200 300 400 500 600 7000
2
4
6
8
10
12
14
16
18
20
Str
ess
inte
nsit
y fa
ctor
Kc
(MP
a√m
)
The sum of the lengths of an initial crack and precipitated hydride (m)
CW SR RX
FIG. 9. Relationship between the stress intensity factor KI and the length of (a) an initial crack and (b) the sum of the lengths of an initial crack and precipitated hydride near initial crack tip. The microstructure around the tip of an incipient crack is non-uniform and plane strain fracture occurred following the brittle fracture by hydrides in OM observation. In order to fairly evaluate the phenomena, the sum of lengths of an incipient crack and hydrides was regarded as the crack length
(a) (b) Non-hydrided RX
Hydrided
Non-hydrided
Hydrided
Non-hydrided

93
which is parameter of stress intensity factor. Figure 9 (b) shows the crack length dependence of stress intensity factor for non-hydrided specimens when the length of crack is assumed to be expressed as the sum of the lengths of the crack introduced by the RAG process and the hydride precipitated near the crack tip. The stress intensity factors show nearly constant values below 400 m. Slight increase in the stress intensity factor is seen above 400 m. This may be due to the effect of plastic deformation near crack tip which becomes significant with increasing crack length. These results indicate that the stress distribution near the tip of precipitated hydride is nearly the same as that near the crack introduced by the RAG process. 4. FUTURE PLAN EDC experiments will be applied to the RAG processed cladding tubes with circumferential hydrides to examine the effect of hydrides around the tip of a crack on the fracture behaviour of the high burnup PWR cladding. 5. CONCLUSIONS RAG-processed cladding tubes with precipitated hydrides were tested in EDC experiments. Failure behaviour was evaluated by OM, SEM, and fracture mechanical analysis.
1. When hydride precipitated radially from the tip of cracks, fracture propagates along the precipitated-hydrides.
2. The stress intensity factor at failure was hardly dependent on the sum of the lengths of an initial crack and precipitated hydride near initial crack tip in the specimens excluding non-hydrided RX specimens assuming that elastic pellet keeps its cylindrical shape. The hydrides connected to an incipient crack have very low resistance to fracture and play a role as a pre-existing crack.
REFERENCES
[1] FUKETA, T., et al., Behaviour of high burnup PWR fuel under a simulated RIA condition in
the NSRR, Proc. CSNI Specialist Mtg. on Transient Behaviour of High Burnup Fuel, NEA/CSNI/R(95)22, Cadarache, (1996) 59–85.
[2] FUKETA, T., et al., Behaviour of high-burnup PWR fuels with low-tin Zircaloy-4 cladding under reactivity-initiated-accident conditions, Nucl. Technol. 133 (2001) 50.
[3] FUKETA, T., MORI, Y., SASAJIMA, H., et al., Behaviour of pre-irradiated fuel under a simulated RIA condition [Results of NSRR test JM-4], JAERI-Research 95–013, Japan Atomic Energy Research Institute (1995).
[4] FUKETA, T., SUGIYAMA, T., NAGASE, F., Behaviour of 60–78 MW·d·kg-1U PWR fuels under reactivity-initiated accident conditions, J. Nucl. Sci. Technol. 43 (2006) 1080.
[5] SUGIYAMA, T., UMEDA, M., et al., Failure of high burnup fuels under reactivity-initiated accident conditions, Ann. Nucl. Energy, 36 (2009) 380–385.
[6] FUKETA, T., et al., Fuel failure and fission gas release in high burnup PWR fuels under RIA conditions, J. Nucl. Mater. 248 (1997) 249–256.
[7] TOMIYASU, K., SUGIYAMA, T., FUKETA, T., Influence of cladding peripheral hydride on mechanical fuel failure under reactivity initiated accident conditions, J. Nucl. Sci. Technol. 44 (2007) 733.
[8] UDAGAWA, Y., SUZUKI, M., SUGIYAMA, T., FUKETA, T., Stress intensity factor at the tip of cladding incipient crack in RIA-simulating experiments for high-burnup PWR fuels, J. Nucl. Sci. Technol. 46 (2009) 1012.

94
[9] KURODA, M., et al., Influence of precipitated hydride on the fracture behaviour of Zircaloy fuel cladding tube, J. Nucl. Sci. Technol. 37 (2000) 670.
[10] SUZUKI, M., Development of RANNS code: A trial for failure prediction, Fuel Saf. Res. Mtg. 2006, Tokai (2006).
[11] FUKUDA, T., et al., Development of pre-cracked cladding specimen for PCMI failure study, Fuel Safety Research Meeting 2010, Ibaraki (2010).
[12] FUKUDA, T., et al., Proceedings of 2011 Fall Meeting of the Atomic Energy Society of Japan, Fukuoka (2011) Subject number E42 [in Japanese].
[13] GRIGORIEV, V., et al., Experimental techniques developed at Studsvik for mechanical testing of irradiated cladding, FSRSM 2001, Ibaraki (2001).
ANALYTICAL RIA STUDIES (Session 3)
Chairpersons
J. ZHANG (Tractebel Engineering)
M. SUZUKI
(JAEA)


97
RECENT RIA AND LOCA ANALYSES PERFORMED AT VTT USING FUEL PERFORMANCE CODES SCANAIR AND FRAPTRAN-GENFLO
A. ARFFMAN VTT Technical Research Centre of Finland Espoo, Finland Email: [email protected]
Abstract
VTT acquires and maintains independent calculation tools to be applied to fuel performance analyses and safety evaluations under changing circumstances. For transients and accidents analyses, two fuel performance codes are used. Under a collaborative arrangement with the French IRSN, the SCANAIR code is being validated and applied to RIA studies. Amended versions of the US NRC originated FRAPTRAN codes are used in parallel for LOCA analyses. The latter may be used in active combination with the general fluid model GENFLO for advanced thermal hydraulic boundary conditions. This paper summarises the latest applications of SCANAIR and FRAPTRAN-GENFLO codes at VTT. The SCANAIR code is intended for fuel behaviour analyses during an RIA type transient in PWR. An application concerning VVER fuel response in a control rod ejection accident is analysed, with code-to-code comparisons with neutronics code results. The significance of power peaking to the peripheral regions of the fuel pellet with increasing burnup is addressed. Extending the code’s application field to BWR fuel is under way. Adequacy of the code to model a BWR rod drop accident starting from cold zero power with stagnant coolant is examined and reviewed. The coupled FRAPTRAN-GENFLO code is introduced as the fuel rod model in a completely new statistical fuel failure analysis procedure under development. The safety regulations in Finland limit the number of rods that fail in any accident to 10% of all the rods. So far there has not been an independent calculation tool dedicated to ascertain that. The statistical best-estimate procedure now developed relies on what is known as the Wilks’ formula, a result of nonparametric statistics. Also in the method, neural networks are introduced as a novel way to reduce the number of fuel code simulations. A neural network is first trained with the results of stacked fuel performance code calculations, and then it is used as a substitute for the analysis code. Neural networks should provide superior flexibility over, e.g. the more conventional response surface method. The system has been successfully tested with a small-scale analysis of a LOCA scenario, and it is now ready to be applied to full reactor scale testing and validation. 1. INTRODUCTION A single rod fuel performance code SCANAIR [1] developed by the French research organisation IRSN (Institut de Radioprotection et de Sûreté Nucléaire) has been in use and under development at VTT for several years. The major distinction between SCANAIR and other transient codes is that it is specifically designed for modelling fast transient conditions as required in reactivity initiated accident (RIA) analyses. SCANAIR models PWR fuel thermal-mechanical behaviour, fission gas release (FGR) and thermal hydraulics of the surrounding coolant. The simulations presented in this paper are performed with the code version V7.0. Two separate analyses of an RIA in power reactor are presented in detail: a rod ejection accident (REA) in VVER-440 type Loviisa NPP, and a rod drop accident (RDA) in the BWR type Olkiluoto NPP. These analyses are part of the code’s validation work for power reactor boundary conditions. The other part of the paper discusses a new kind of statistical fuel failure analysis procedure that has been developed at VTT for LOCA analyses. Statistical best-estimate methods have acquired an established position in this field worldwide during the past two decades. These methods are based on the selection and variation of code’s input and model parameters that are important in accident conditions. The accident scenario is simulated with a designated computer programme several times with different parameter values between simulations, and that way an estimation of the number of failed rods is obtained. An enormous number of simulation runs is needed in order to the results to be statistically reliable. Thus the analysis requires a lot of computer resources, and this has been a limiting factor for the breakthrough of these methods. Different approaches have been used to reduce the number of simulations. The challenge is to establish a calculation system which is both accurate

98
and at the same time efficient with computer resources. The system description of the developed method is given in this paper. 2. RIA ANALYSES WITH SCANAIR 2.1. The SCANAIR code Most of the models in SCANAIR date back to the CABRI REP-Na programme that was conducted in a sodium coolant loop. The new water loop of CABRI reactor sets higher demands for the modelling because of the potentially higher cladding temperatures compared to the sodium loop where the coolant will not boil and the heat transfer remains efficient. Therefore the SCANAIR code has been developed extensively to model the water cooling conditions and the related high cladding temperatures. SCANAIR modelling is based on the so-called 1.5-dimensional approach. Structure mechanics modelling is realized with the finite element method. The latest versions of SCANAIR have models for fuel and cladding viscoplastic behaviour, i.e. plasticity with creep. SCANAIR also models clad ballooning with the assumption of small deformations. The implemented thermal hydraulics model in SCANAIR is a 1D and single-phase model with mass and energy balance equations. The thermal hydraulics modelling is applicable for PWR conditions and for capsule devices containing stagnant water at room temperature and atmospheric pressure. The adjustment of the heat exchange coefficients for PWR conditions has been made based on a specific PATRICIA separate effects programme, whereas the latter model is validated against the test results from the Japanese NSRR facility. There are three options in the code for the prediction of cladding failure due to PCMI and cladding burst. The PCMI induced failure is predicted by a fracture mechanical module CLARIS. This tool evaluates the cladding critical incipient crack depth that could lead to crack propagation and consequent cladding failure. After the CLARIS calculation, the depth of the calculated incipient crack is compared to the observed depth of the cladding brittle zone. This depth is determined from the results of the fuel rod post-irradiation examinations. If the calculated critical crack at the moment of failure is deeper than the observed brittle zone, the clad should remain intact, and vice versa. The rod failure in ductile mode is calculated in SCANAIR based on the sum of cumulated plastic strains: the sum is compared to the rupture strain which must be given as an input to the code. SCANAIR also calculates strain energy density (SED) evolution during the transient but the criterion for the limiting value, the critical strain energy density (CSED), must be provided by the code user. SCANAIR does not model the steady-state irradiation history of the rod prior to the accident but that information is given via input data deck. At VTT, the modified ENIGMA V5.9b steady-state code is applied to the initialization of the SCANAIR calculation. An interface module for extracting data from the ENIGMA calculation has been previously developed at VTT. 2.2. Sensitivity studies of rod ejection accident in a VVER Rod ejection accident in Loviisa NPP has recently been analysed with the 3D full core coupled neutronics-thermal hydraulics code HEXTRAN-SMABRE and 1D neutronics code TRAB designated for isolated hot channel calculations. Each of the codes mentioned above is developed in-house. Based on these analyses and obtained boundary conditions, fuel performance code calculations are performed with SCANAIR. Among other things, fuel performance code calculations are important in verifying the fuel related results of the neutronics codes because those codes usually have only simple models for fuel behaviour. For example, the hot channel calculations with TRAB do not utilize burnup dependencies taken into account in the HEXTRAN calculations. Instead, the effects of irradiation have been

99
modelled in TRAB by placing a distinct value of burnup for example at the beginning or at the end of a cycle as an input, and also varying the gas gap thermal conductance. These two variation methods are quite simple and especially the gap conductance can vary much more than approximated in TRAB calculations. With TRAB analysis, a single burnup dependent nominal gap conductance value is multiplied by a factor of 0.7 or 1.5 to degrade or improve the conductance. A special goal in this study is to investigate the effects of the steady-state irradiation on the results, especially the influence of the radial power profile in the pellet. Usually a flat radial profile is used with the hot channel calculations even though the real profile in high burnup fuel is peaked to the peripheral region of the pellet. The effect of this unrealistic simplification needs to be made clear, for instance to find out if the realistic radial power profile is meaningful as regards reaching the DNB. 2.1.1. Selection of cases for the simulations The neutronics simulations included four cases: accident starting from full power (FP-102%) at the beginning of cycle (BOC) and at the end of cycle (EOC), from 50% power at EOC, and finally from 1% power (which basically corresponds to hot zero power (HZP) conditions) at EOC. Control rod ejection happens at 1 s from the beginning of the calculation, and scram initiates 1 s after the scram limit is reached. The studied fuel was fabricated by TVEL (4.4% enrichment, doped with gadolinia). The purpose is to analyse selected cases with SCANAIR, and the results are then compared with the results of the neutronics calculations. As mentioned, TRAB does not utilize any base irradiation history of the rod, and only a single value of burnup is given as an input. Therefore there is no actual base irradiation history related to the hot channel calculation. However, irradiation data is needed to initialize the SCANAIR calculation with the ENIGMA code. Accordingly, some irradiated rod that has a known irradiation history has to be used, and that rod should be “typical” for the analysis to be representative. For this purpose, a rod irradiated in Loviisa-1 for four cycles (average discharge burnup 49.1 MW·d·kg-1U) is chosen. The selection of the cases that are calculated with SCANAIR is made based on the results of TRAB calculations, especially regarding the minimum calculated DNB ratio. Even with the worst case in which the DNB ratio is the smallest, full power at EOC, boiling crisis does not occur. The HZP case was calculated to be even milder with regard to the DNB, but then again, fuel failure can occur during the PCMI phase of an RIA in high burnup fuel. As the cladding temperature does not have time to rise in a fast transient, cladding is less ductile than with higher temperatures, and that increases the risk of a PCMI type failure. However, VVER cladding has a good corrosion resistance and therefore the material remains ductile. Thus, PCMI failures at low temperatures are not expected [2]. Because the smallest DNB ratio is reached in TRAB calculations with the full power EOC case, this is the first choice for the SCANAIR calculation. But as explained above, a PCMI type failure with a lower enthalpy increase in high burnup fuel is also possible, and therefore also the HZP case is chosen for the SCANAIR calculations. Compared to the corresponding analysis made in 1997, the reactivity impact in the HZP case has been substantially diminished by the shift of the allowed lower limit of the control rods in Loviisa NPP from 50–100 cm. To have a more dramatic case to compare the present situation, this former case is now recalculated with the neutronics codes and also chosen for the SCANAIR analysis. Thus, three cases were selected to be calculated with SCANAIR: full power EOC, hot zero power EOC, and hot zero power EOC where the initial position of the ejected control rod is 50 cm deeper corresponding to the 1997 analysis. The rod to be analysed is located in such a position in the loading pattern that the DNB ratio has the smallest values with both full power and HZP initial states. Calculated cases are tabulated in Table 1. Several ENIGMA initializations are applied with the SCANAIR inputs in order to make sensitivity studies. Case ‘fresh fuel specifications’ means that even though the boundary conditions are calculated with the neutronics codes for EOC case, BOC1 initialization is used with the SCANAIR calculation (BOC1 initialization is also produced with

100
ENIGMA). Cases named “VARIATION 1–3” are constructed to increase the burnup of the rod and that way enhance the peaking of the radial power profile to the outer parts of the fuel. The related ENIGMA inputs are formed by adding two (“VARIATION 1–2”) and four (“VARIATION 3”) additional cycles similar to the fourth cycle in the end of the irradiation history of the analysed rod (linear heat rate of the rod is low during the fourth cycle, below 10 kW·m-1). TABLE 1. SCANAIR CALCULATIONS WERE PERFORMED WITH THREE DIFFERENT BOUNDARY CONDITIONS AND SEVERAL DIFFERENT ENIGMA INITIALIZATIONS
2.1.2. Results of the rod ejection analysis ENIGMA. In the base irradiation simulation, the gas gap of the rod closes at the end of the fourth cycle. Radial power profiles of EOC1, EOC4 and “VARIATION 1–2” calculated by ENIGMA are presented in Fig. 1. The power is slightly peaked to the outer region of the fuel even after the first cycle and continues to increase in that location as the burnup increases. The calculated axially maximum oxide layer thickness at the end of the fourth cycle is 6.71 μm. The default parameters in the oxidation rate model in ENIGMA are for Zircaloy-4, however. Fission gas release is slightly below 1%.
Boundary condition SCANAIR calculation case
Full power
HZP
HZP, initial position of control rod 50 cm deeper
Fresh fuel specifications (BOC1) X X X
EOC1 X X X
EOC2 X
EOC3 X
EOC4 X X X
EOC4, flat radial power profile (otherwise the same as EOC4 except radial power profiles have been replaced by flat profiles)
X X X
“VARIATION 1” radial power profile changed to the EOC4 case from a higher burnup (rod ave. bu. 62.1 MW·d·kg-1U) ENIGMA calculation
X
“VARIATION 2” compared to the “VARIATION 1”, all initialization data taken from 62.1 MW·d·kg-1U case
X
“VARIATION 3” initialization data from ENIGMA calculation with rod ave. bu. of 75.1 MW·d·kg-1U
X

101
FIG. 1. Radial power profile in fuel, calculated by ENIGMA.
FIG. 2. Rod average linear heat rate, extracted from TRAB output file. SCANAIR. With the full power and HZP cases, the rod linear heat rate does not rise substantially during the accident (Fig. 2). When the control rod ejects from a deeper position, the increase in power is more significant. Therefore it can be stated that elevating the allowed limit for a control rod has essentially suppressed the consequences of rod ejection starting from HZP conditions. Some of the TRAB results can be compared with the SCANAIR results. These include maximum fuel temperature and maximum cladding outer surface temperature, and axially maximum clad to coolant heat flux. In the SCANAIR calculations, convection is found to be the primary heat exchange mode, and also nucleate boiling occurs during the accident at the top of the rod where the power is axially peaked. Transition boiling or film boiling phases never occur during the calculated scenarios. With any of these initializations and boundary conditions, there is no transient fission gas release. 2.1.2.1. Full power initial state Cladding maximum outer surface temperature remains the same as before the accident (Fig. 3). The temperature is also the same as the TRAB temperature, with the exception of small ramp in SCANAIR calculation around 11–12 s. Fuel initial temperature prior to the accident naturally depends on the initialization of the calculation but the increase in fuel temperature caused by the accident is almost equal in all cases. Replacing a flat radial power profile to the EOC4 case increases the fuel temperature by 150°C. Cladding temperature remains the same. The fuel radially averaged maximum enthalpy increases by about 10 cal·g-1 compared to the initial enthalpy of the fuel (Fig. 4). The maximum clad to coolant heat fluxes (Fig. 5) in TRAB and SCANAIR have good congruence. SCANAIR heat flux momentarily increases at 9–12 s when the nucleate boiling at clad surface ends. The cladding hoop deformation presented in Fig. 6 is composed of thermal and mechanical deformation, which includes elastic, plastic and viscoplastic deformation. In the EOC1 case, the transient has a negligible effect on the cladding hoop strain. In the EOC4 case the increase in the total hoop strain is about 0.1% which consists of plastic deformation.

102
2.1.2.2. HZP initial state In this case, the cladding maximum outer surface temperature increases less than 20°C (Fig. 3). Replacing a flat profile to the EOC4 case increases the fuel temperature less than 10°C. Cladding temperature remains the same. Cladding hoop strain is negligible. The fuel radially averaged maximum enthalpy increases only by about 4–5 cal·g-1 compared to the initial enthalpy of the fuel (Fig. 4). The maximum clad to coolant heat flux (Fig. 5) in EOC1 case is almost the same as in TRAB, and in EOC4 case the heat flux is higher. 2.1.2.3. HZP initial state, control rod 50 cm deeper (corresponding to the 1997 analysis): The fuel temperature at EOC4 has two separate peaks because temperature first reaches a maximum at the rim zone and then the heat is dispersed in two directions, to the centre of the fuel and to the cladding (Fig. 3). From Fig. 7 one can see that the maximum value of deposited energy is radially situated in the rim zone. This behaviour is not present with the other boundary conditions because the enthalpy increment is too small. Fuel radially averaged maximum enthalpy is about 35 cal·g-1 higher than the initial enthalpy of the fuel (Fig. 4). The maximum clad to coolant heat flux (Fig. 5) in the EOC1 case is slightly lower than in TRAB, and in the EOC4 case the heat flux during the power pulse is much higher. Replacing a flat profile to the EOC4 case results in a fuel temperature rise of nearly 100°C. The cladding temperature decreases by 10°C. In Fig. 3, one can see that increasing the fuel burnup in VARIATION 1–3 has little effect on temperatures. Only in case EOC4 will the internal pressure rise notably in the transient, almost 2 MPa. The cladding hoop strain is small in the EOC1 case, whereas the increment in strain in the EOC4 case is about 0.3%, which is still quite small. Plastic deformation is 0.1%. 2.1.3. Conclusions of the rod ejection analysis The performed SCANAIR analyses confirmed the results of the neutronics calculations. Neither transition boiling phase nor boiling crisis was observed, and fuel and cladding temperatures remained relatively low during the transient. In all cases the fuel enthalpy remained well below the allowed limit of 140 cal·g-1 for the cladding failure set by the Finnish safety authority STUK. Using realistic fuel radial profiles did not have a significant effect on temperatures. The hoop strains were small, and considering that VVER fuel rods have good corrosion resistance, it is unlikely that the rod would fail because of PCMI. Thus, no failure mode of an RIA seems to come into question with these particular cases analysed. 2.3. Simulation of rod drop accident in a BWR A rod drop accident in Olkiluoto NPP has recently been analysed with Studsvik Scandpower’s SIMULATE 3K programme. The analysis case deals with 10 × 10 BWR fuel in equilibrium core. The boundary conditions from this calculation are used with a SCANAIR analysis. This analysis is the first attempt at VTT to calculate power reactor RIA application in a BWR with the SCANAIR code. Namely, SCANAIR is not designed to model BWR fuel and conditions. It lacks Zircaloy-2 cladding material properties, and the only Zircaloy-2 models implemented to the code are the two yield stress laws from a bibliographic study. The ultimate tensile stress (UTS) yield stress law for Zircaloy-2 cladding is applied for this calculation. As the injected energies are high, viscoplastic models for the fuel and cladding are used. Again, the viscoplastic model for the cladding is specified for Zircaloy-4 cladding.

103
FIG. 3. Cladding outer surface and fuel maximum temperatures according to SCANAIR and TRAB.
FIG. 4. Radially averaged fuel maximum enthalpy.

104
FIG. 5. Axially maximum clad to coolant heat flux. The suitability of the current cladding material properties in SCANAIR for BWR fuel is a subject of evaluation in the near future. The composition of the cladding alloy, i.e. the concentrations of different alloying elements, has an effect on the mechanical behaviour of the cladding [3]. Zircaloy-2 and Zircaloy-4 have slightly different compositions with regard to Fe and Cr concentrations, and Zircaloy-2 also contains Ni which is not an alloying element in Zircaloy-4. However, the differences in the compositions of these two alloys are suggested not to have a noteworthy effect on material properties [4]. Then again, composition and also the differences in the mechanical and heat treatment during cladding manufacturing are found to have significance for the corrosion rate and hydrogen pick-up of the cladding and consequently for the failure propensity. As the thermal hydraulics model in SCANAIR is capable of handling only single-phase coolant, bulk boiling in BWRs cannot be taken into account. However, because the coolant conditions with the current analysis (stagnant coolant water at nearly atmospheric pressure and at room temperature) are close to the conditions in NSRR, that model is used in SCANAIR to model the RDA. The accident scenario begins at cold state at the start-up of the reactor. The reactivity effect of the RDA is most profound in cold zero power (CZP) conditions, which means that the coolant is at room temperature and the power is nearly zero. 2.3.1. Simulation case At the outset, it should be noted that according to the SIMULATE 3K results; if one uses realistic boundary conditions, the fuel enthalpy increase is barely noticeable. There is no need to calculate such a case, and therefore the case that is now analysed with SCANAIR is a conservative one: based on the plant operation licence, a single control rod must not give more than 1000 pcm reactivity increment. This exaggerated case brings the fuel enthalpy in SIMULATE 3K calculation near the cladding failure limit of 140 cal·g-1 set by the safety authority. It should be emphasized that the calculated case with the 1000 pcm reactivity increment is highly conservative and not foreseen in reality.

105
FIG. 6. Axially maximum cladding hoop strains in the outer surface of the sound cladding. The transient simulation has been made with SIMULATE 3K from 0–15 s. With the SIMULATE 3K analysis, the fuel maximum enthalpy is under evaluation and acts as a criterion for fuel integrity. The possibility of a PCMI type failure on the other hand is not examined. There are different types of rods in the BWR fuel bundle in question: full length rods and part length rods, and rods that contain gadolinia. The fuel bundle that contains the rod which has the highest enthalpy is known based on the SIMULATE 3K calculations. To single out the rod with the highest power during the accident, a pin power reconstruction of the bundle is performed. As the average burnup of the bundle in SIMULATE 3K calculation is 26.2 MW·d·kg-1U at the time of the accident, the steady-state behaviour of the rod is simulated with ENIGMA to the end of the 2nd cycle with the calculated average rod burnup of 27.0 MW·d·kg-1U.

106
FIG. 7. Maximum values of radial deposited energy in fuel during the accident. 2.3.2. Results of the rod drop analysis ENIGMA: After the 2nd cycle of irradiation the gas gap is almost closed. ENIGMA calculates only a very small clad outer oxide layer thickness at the end of the 2nd cycle. The calculated axial oxidation profile is therefore scaled to match the oxidation rate of BWR cladding. SCANAIR: The power evolution and the thermal hydraulic boundary conditions are plotted in Fig. 8, and the results of the SCANAIR calculations in Fig.9. There are also some SIMULATE 3K results that can be compared with the SCANAIR results: the evolutions of the maximum fuel centreline temperature, the cladding outer surface temperature, and the fuel maximum enthalpy. These values are momentary maximum values over the whole bundle which means that the values can be from different rods; temperature and enthalpy evolutions of a distinct rod are not possible to obtain. The peak fuel temperature and enthalpy calculated by SCANAIR and SIMULATE 3K are quite close to each other. Still, the maximum cladding surface temperature is about 400°C higher with SCANAIR. The cool-down phase would last remarkably longer with SCANAIR. Film boiling phase first starts in

107
the 17th (out of 25) axial zone at 1.64 s. The film boiling phase finally ends at 39.68 s and the rod is fully rewetted at 42.65 s. Power is peaked to the peripheral fuel region during the power insertion. The rod internal pressure increases rapidly, and the transient fission gas release is 1.33%. Cladding plastic deformation consists of plastic and viscoplastic contributions, and the permanent hoop strain is calculated to be 8.2%. The deformation of the cladding around the 17th axial zone where the power is peaked is very strong, and it could cause a cladding rupture. After the base irradiation there is a small gas gap, and the gap closes in the upper section of the rod when the power insertion begins but remains open during the whole accident at the top and bottom sections of the rod.
FIG. 8. Power evolution and thermal hydraulic conditions during the accident.
2.3.3. Conclusions of the rod drop analysis As a result of the analysis, the peak fuel temperature and enthalpy calculated by SCANAIR and SIMULATE 3K are quite close to each other, whereas the maximum cladding surface temperature is about 400°C higher with SCANAIR. There is also a significant code-to-code deviation in the calculated duration of the cool-down phase of the rod. The cladding permanent hoop strain calculated by SCANAIR is 8.2%, and the strain is strongly peaked to the 17th axial zone. The maximum strain that the cladding can sustain without a rupture is not predetermined but depends on the temperature and pressure loading history [2]. Therefore the

108
calculation result should be compared with test results. The RIA test data of pre-irradiated BWR fuel comes from the NSRR facility [2]. For those rods that survived the tests, the highest cladding maximum hoop strain was 1.5% (the total number of reported tests is 17). Six tests resulted in cladding failure but strain data is available only from two of these tests, and with both cases the maximum hoop strain was below 0.1% (PCMI failure). The database is thus too scarce for the evaluation of the rupture strain. The localized strain might be high enough to result in a cladding failure in this conservative analysis but that result cannot be concluded definitely.
FIG. 9. SCANAIR calculation results.

109
3. STATISTICAL FUEL FAILURE ANALYSIS WITH FRAPTRAN-GENFLO Since 2006, a calculation system for statistical fuel failure analysis has been under development at VTT. Recently the system has been successfully tested with a small-scale analysis with a LOCA scenario. The calculation procedure is introduced below, as well as the results of the small-scale analysis. At first, background information about the available methods is summarized. 3.1. Methods for statistical analyses There are several different approaches for the statistical fuel failure analysis. The analysis methods do not exclude each other, and they can thus be used in parallel way to diminish the amount of required computer code simulations. The constant growth in computer resources has affected and will continue to affect the choice between different statistical methods. The established methods include the use of response surfaces, grouping of the rods, direct Monte Carlo sampling, and applying results of the tolerance interval theory. 3.1.1. Classification of the initial parameters and definition of their distributions The initial parameters of statistical analysis can be divided by their range to two groups: local and global. Global parameters have an effect on all the rods in the reactor, whereas local parameters bring local variation. For example, the model parameters of fuel performance code are global, and fuel manufacturing parameters are local. The division of parameters to global and local should be taken some way into account in the analysis because the fuel rods have some correlation with each other. The magnitude of the correlation is unknown because it is not precisely known which parameters have the biggest influence on the integrity of the rod in an accident. Before the actual analysis the varied parameters have to be chosen and their distributions defined. The selection can be conducted by means of a sensitivity analysis with fuel modelling codes and by searching specific variation ranges from open literature, but much of expert judgment is still needed here. Fuel manufacturing parameter ranges are usually provided by the fuel manufacturer. The choice between different statistical methods can also limit the number of parameters that can be included in the analysis. This is the case if one uses for instance response surfaces. Typically the parameter values are normally distributed, but also other distributions like uniform or triangular distributions are possible. 3.1.2. Response surfaces, direct Monte Carlo, grouping of the rods Response surfaces are low-order polynomial fits between initial and result parameters. With accident simulations, one initial parameter at a time is varied and a connection to one or more result parameters is created. These connections are again gathered as a polynomial fit. The polynomial fit can then be used to replace the actual fuel performance code calculations, as initial parameters are randomly sampled and the polynomial fit is used to predict the results. This method is useful when the relationship between initial and result parameters is simple enough, but it cannot predict for example the possible branching of the accident sequence to different directions when the safety systems are activated. With the analysis procedure developed at VTT, neural networks are used in the same way and for the same purpose as the response surfaces. The neural network approach is chosen because it is a more sophisticated tool for describing nonlinear phenomena. Another way is to sample the values of initial parameters from their distributions using direct Monte Carlo sampling. Here the division to global and local parameters is neglected and that means loss of statistical reliability to some extent. Further, the number of simulations that are needed to reach a certain confidence level remains unknown. It is also possible to group rods with characteristics like burnup, power level and thermal hydraulic conditions. One can then pick an arbitrary amount of rods from each group for the analysis. In any cases, the loss of statistical accuracy could be compensated by introducing some conservative assumptions.

110
3.1.3. Nonparametric statistics The tolerance interval theory (i.e. nonparametric statistics) gives a way to determine the number of simulations that are needed for the statistical analysis when the probability content and confidence level are predetermined. For instance, nuclear industry corporations Westinghouse [5] and Areva NP [6] both have developed their statistical methods based on the CSAUa procedure with the results of nonparametric statistics chosen to be the final step to combine the uncertainty distributions. In brief, the number of calculations can be solved using the following equation [7]:
jNjN
rsj
γ)(1γj
N1β
(1)
Where γ is the probability content inside the interval of the distribution; β is the confidence level for which this content is realized; N is the number of calculations. From Equation (1) one gets the relation known as the Wilks’ formula:
Nγ1β (2) This applies when the lower bound of the one sided interval is chosen to be -∞ and the upper bound is the highest value of the random sample that was picked from the unknown distribution in question. When this formula is applied to safety evaluations, the generally acceptable level is 95% probability with 95% confidence that the number of failed rods would not overstep the allowed limit. When the corresponding values are inserted to Eq. 2, thus γ = 0.95 and β = 0.9515, the number of cases comes out as 59. In practice when using the Wilks’ formula, one can state that when all the rods in the reactor are simulated 59 times with global variation between each of the 59 scenarios, and if the number of failed rods in the worst case is below the allowed limit, then the safety requirements are rightly met with the probability of 95% and with the confidence level of 95%. As that kind of number of simulations is out of reach with the computer resources of today, another method is needed alongside with this result. 3.2. Developed analysis procedure As in the CSAU methodology, the problem setting in the calculation system developed at VTT is split to distinct steps. Firstly, there are several ways to conduct the statistical analysis depending on the setup of the accident scenario, and which phenomena are included to the analysis. It is important to decide how to take into account the propagation of modelling uncertainties throughout the calculation system. Namely, as the boundary conditions of a fuel performance code come from a system code and/or from a neutronics code, their uncertainties have to be taken into consideration. The source and
___________________________________________________________________________ a Code scaling, applicability and uncertainty (CSAU) methodology has been widely used as a standpoint for statistical fuel failure analysis. With the contribution of U.S.NRC, a group of experts developed this three-step method in 1989 to meet the new regulations. In the first phase the accident scenario is divided to distinct segments by place and by the course of the accident, and then important phenomena are recognized for each place and time. The second phase consists of the evaluation of the fuel performance code and its ability to model the identified phenomena. Also the distributions of the related parameters are qualified. The third task is to combine the uncertainty distributions with a chosen method.

111
the form of the boundary conditions can thus vary, and therefore the calculation system cannot be fully solid but must be modified from analysis to analysis. Secondly, the distributions of the chosen parameters are defined. In the third phase, the uncertainties are combined with the result introduced by Wilks. There are several ways, however, to apply this result of “59 calculations” to practice, and this also depends on the setup of the analysis. For example, let us first have a look at a situation in which the course of the accident is predetermined but no boundary conditions are calculated or known beforehand. To perform the analysis rigorously, one should calculate the boundary conditions 59 times with a system code. Then there are 59 global variations of the accident and the fluctuations in boundary conditions are taken into consideration as a source of uncertainty. Naturally, also the global parameters in FRAPTRAN-GENFLO contribute to this group of 59 global variations. Next for each global case, a large number of cases with different local parameter values are calculated. The number of calculations could be for example 1000 for each global variation. On the other hand, if the boundary conditions are considered as fixed, then that source of error is left outside of the analysis and the problem setting greatly simplifies. After this, the analysis is divided to two different directions. This branching is depicted in Fig. 10 where the flow chart of the calculation system is presented. In the first option designated as “Phase 1”, on the grounds of the above mentioned calculations, the worst global case is determined based on the highest number of failed rods. The number of failed rods in the worst global case can now be directly scaled to find out the number of failed rods in the whole reactor. This approach should be on the conservative side because with a smaller number of cases, deviation of rod failure numbers grows, and thus, the biggest failure number is likely higher than what it would be if all the cases had been calculated instead of extrapolation. And in the analysis, only the highest number of failed rods counts. In this case, enough cases need to be calculated to limit the deviation coming from the extrapolation of the rod failure numbers. Alongside with the method presented above, the same calculation results are utilized for a neural network analysis. This is designated as “Phase 2” in the flow chart. If one has calculated for example 59 × 1000 cases in the previous stage, one can now use these cases to train a network. This network is then used for the full analysis with both global and local parameter values sampled anew. It means that the trained network is used instead of the real fuel performance code to simulate all the rods in the reactor for 59 times.
FIG. 10. Flow chart of the calculation system.

112
At this point, the neural networks are considered to be used for a complementary analysis, and the conservative analysis (Phase 1) is still the primary way. Before it can be stated that neural networks are suitable for performing these kinds of analyses, it is to be made sure that they work as expected in different kinds of accident scenarios. It is not at all obvious that neural networks can be utilized in all cases and therefore there has to be also an alternative way to perform the analysis. As the experience grows with further analyses, more can be said about how well the neural networks could be utilized to cover different scenarios extensively. 3.3. Applied codes and programmes In order to attain the time-dependent boundary conditions for the fuel performance code calculations, the overall progress of the accident is simulated with the system code APROS. The APROS code is developed and maintained jointly by VTT and Fortum. The relevant boundary conditions are coolant mass flow and enthalpy at the channel inlet, pressure at the top of the channel, and rod power including the axial power profiles. The steady-state initializations of the stacked calculations are performed with the US NRC/PNNL FRAPCON code (version 3.3). An advanced statistical version of FRAPCON developed at VTT in 2003 is being used that enables the variation of selected model and fuel manufacturing parameters. The primary calculation tool is the coupled fuel performance–thermal hydraulics code FRAPTRAN-GENFLO [8]. Here the FRAPTRAN code provides the criteria for fuel failure. FRAPTRAN (version 1.3) is designed to model the behaviour of a single fuel rod in accident conditions and it belongs to the same code family with FRAPCON. Most likely the new versions of FRAPCON (version 3.4) and FRAPTRAN (version 1.4) will be used with subsequent analyses. The general thermal hydraulics code GENFLO has been exclusively developed at VTT. The thermal hydraulics modelling in stand-alone FRAPTRAN has been found to be unsatisfying, and therefore the coupling with an external thermal hydraulics code has been introduced. For each time-step and axial segment, GENFLO calculates the coolant temperature and clad-to-coolant heat transfer coefficients. The actual calculation system consists of several small programmes that have been coded for data processing, writing inputs and steering the calculations. Some external programmes are also used, like the sampler programme SUSA (Software system for Uncertainty and Sensitivity Analysis) developed by the German research organisation GRS. SUSA is utilized for generating random parameter values from specified distributions. A Perl script has been written to steer the stacked FRAPTRAN-GENFLO calculations in a linux cluster. Major changes to the FRAPTRAN and GENFLO codes for the purpose of the statistical analysis were avoided at this stage. So far the model parameter values cannot be varied in FRAPTRAN because those values cannot be changed via the input file without changing the source code. If the development of a statistical version of FRAPTRAN is considered, it would require a careful analysis of the utilized models and their uncertainties in the code. The neural network analysis is conducted using a MATLAB built-in neural network software package, the Neural Network Toolbox™. It is a general-purpose tool for neural network analyses, and its basic use is quite simple. As always when operating with neural networks, one has to take extra care when interpreting the results. Attention should be paid to the possible network over fitting, and to assure that a sufficient amount of data is used to train the network in relation to the number of layers and neurons in it. Generally, one can use more complex network structures and get more complicated phenomena into view if a large data set for training is used. 3.4. Varied parameters and their distributions The discussion about which parameters to include to statistical analyses has continued from the start of the development of the CSAU methodology. It is hard to give any general rules for the selection as the sources of uncertainty and their relative importance vary from code to code. In some cases the lack of knowledge limits the precise definition of the corresponding uncertainty distribution. The uncertainties that are considered in statistical methods by other organizations are studied for example in the BEMUSE project [9]. Appliance of those parameters with the codes and analysis here is not

113
straightforward and needs adaptation. For example the uncertainties in thermal hydraulic parameters should be taken into consideration mainly in the system code APROS, and in addition to that, some parameter variations are possible in GENFLO. Meanwhile, fuel-related parameters are kept in their best-estimate values in the system code and varied only in the fuel performance codes. All in all, the discussion continues about how to take into account the inaccuracies in thermal hydraulic boundary conditions. The thermal hydraulic parameters chosen to be varied in GENFLO are at this point the three tuning factors for heat transfer and the two drift flux model parameters. In order to gain justifiable parameter ranges, previous validation reports of GENFLO were consulted. The parameter ranges were found in some cases too wide and GENFLO failed to calculate the transient through. Therefore, adequate variation ranges had to be searched by trial and error. The variations in fuel manufacturing parameters are expected to have little influence on the fuel failures as the tolerances are quite small. Still, at least the gas gap size has a notable effect on the cladding temperatures. Manufacturing parameters are included to the analysis to bring local variation between the rods. 3.5. Testing the neural network performance As an accident case for testing the calculation system, a large break LOCA in Loviisa NPP is used. However, preliminary calculations of a single representative rod showed that the cladding temperatures do not reach high enough values to result in a fuel rod failure. In order to have enough fuel failures with the stacked calculations to be used for training the neural network, the accident had to be artificially exaggerated by assuming an elevated power level during the accident and by decreasing the gas gap conductance in the source code. Because of the substantial volume of coolant in VVER-440 core during a LOCA, rod failures are generally estimated to be unlikely in this type of reactor. After “dramatizing” the accident scenario, enough fuel failures were gained for the system testing as some 20% of the 100 stacked example cases that were calculated with FRAPTRAN-GENFLO ended up with an indication of a rod failure. To test the neural networks in practice, a small-scale analysis consisting of a set of 900 stacked FRAPTRAN-GENFLO calculations was performed. Both global and local parameters were varied. When examining the calculation results, it can be stated that the time of failure is significantly scattered due to the variation in local and/or global parameters. Also the axial location of the failure somewhat varies. This may indicate that more than one of the varied parameters has an effect on the cause of the failure. For the neural network testing, it is good to have this kind of variation in the training data. A weakness in the current neural network analysis is that one cannot point out which parameter or combination of parameters caused the rod to fail. It requires additional analysis with the real fuel performance code to find out the reason(s) for rod failures. It is important to find out how accurately the network predicts the cases that were not used for training the network. Also the effect of changing the neural network configuration by adding neurons and layers is a subject of interest. To test the performance of a network, the fuel performance code calculations are divided to a training set and a test set. In this case, 33% of the cases were used as a test set. Thus the error in the test set predictions is under examination. One has to notice that the network may directly predict that the rod fails or remains intact, but the network result can as well be somewhere between these two extremes. Below, a following arbitrary criterion is used: if the neural network prediction deviates more than 40% from the correct result, it is considered as a missprediction. Of course the missprediction can equally be on the conservative side, thus the neural network would predict the rod to fail even though the fuel performance code shows otherwise. Because of the intrinsic characteristics of neural networks, the performance of a network varies between simulation runs even if the training data is the same. Different network configurations were tested and as an example in Table 1, the percentages of falsely predicted rods in the test set are presented for two networks. Both networks have two hidden layers with 5 and 3 or 3 and 3 neurons.

114
As one can see from the table, the error in predictions between simulation runs varies considerably. Still, it should be adequate that when the error is small, that particular network is recorded and used for the subsequent analysis. Thus, while a network structure with a low error fraction in its predictions is the aim, even the best structures have variation in their results. The smallest error in predictions in this case is 2.7%, a figure that already shows quite a good accuracy. Among the experimentations, a small network that consists of two hidden layers with three neurons in both layers is found to have the steadiest performance. However, the most suitable network configuration should be sought each time an analysis is performed. TABLE 1. EXAMPLES OF THE PERCENTAGES OF FALSELY PREDICTED RODS IN THE TEST SET WITH TWO NETWORK CONFIGURATIONS
5:3 network [%] 3:3 network [%]
1° 19.5 3.0 2° 4.7 4.7 3° 4.3 3.0 4° 19.2 2.7 5° 2.7 6.7 6° 4.0 3.7 7° 4.0 4.0 8° 8.1 5.1 9° 11.4 5.4 10° 2.7 11.1 11° 19.2 5.7 12° 31.6 3.7 13° 19.2 3.0 14° 6.7 5.1 15° 15.5 4.7
3.6. Duration of the analysis calculations Statistical analysis unavoidably takes a lot of time. Statistical version of FRAPCON is fast-running but the transient calculations are slower to conduct. The duration of a single FRAPTRAN-GENFLO calculation depends among other things on the time-step size and the starting and ending times of the calculation. During the critical moments of the accident, time-step size may have to be quite small in order to gain reliable results, or even for the calculation to converge. Time-step sizes between 0.001 s and 0.01 s may be required. If the rod does not fail and the calculation is continued for example up to 500 seconds, the calculation time of a single FRAPTRAN-GENFLO run would be about 5 minutes. If one now calculates 59 000 cases with ten calculation nodes in the cluster machine and assume that each calculation takes 5 minutes, it would take 21 days to finish the calculations. If the time per one calculation could be reduced for instance to 2 minutes by adjusting time-step sizes and reducing the ending time of the calculation, it would take 9 days to complete the calculations. This may be an acceptable duration for this kind of analysis. 3.7. Summary of statistical fuel failure analysis So far the proposed neural network approach is tested only in a small scale and therefore two parallel analyses are suggested. With this approach the fuel performance code results are used in two different ways: to directly scale the number of rod failures in the worst global scenario to the whole reactor scale, and to perform a neural network analysis. If the network performs as expected, that analysis would confirm the previous result. The neural network part would not require notable additional effort.

115
The test results of the system show quite good performance with the neural network approach. All the scripts for conducting statistical analyses are now ready to be used. Depending on the setup of the analysis, for instance on the boundary conditions and the accident scenario, the scripts will be modified accordingly. Feasibility of neural networks is examined as a part of the full analysis each time it is performed. It is easy to get bad results from the analysis if there is an insufficient amount of training cases, an unsuitable network configuration, or if one encounters problems with over fitting. The uncertainty related to neural network predictions is also an important issue to be taken into account when evaluating the final result. 4. FINAL CONCLUSIONS At VTT, the most recent activities on fuel performance modelling in accident conditions have been focusing on power reactor applications. RIA analyses have been made for VVER type Loviisa NPP and for BWR type Olkiluoto NPP. The newly developed statistical fuel failure analysis procedure has been applied to a LOCA analysis. An application concerning VVER fuel response in a control rod ejection accident was analysed, with comparisons with neutronics code results. Neutronics codes usually have only simple models for fuel behaviour, e.g. in TRAB, flat radial power profile in the pellets is most often used. It was found out that the SCANAIR results were in good agreement with the neutronics code results. Choosing a realistic fuel radial profile to replace a flat one did not have significant effect on temperatures. SCANAIR is designed to model PWR fuel and conditions, and the adequacy of the code to model reactivity accident in a BWR was preliminarily examined. As the analysed accident case initiated from cold zero power conditions with nearly zero coolant flow, the SCANAIR thermal hydraulic model developed for capsule devises was applied. As a result of the analysis, the peak fuel temperature and enthalpy calculated by SCANAIR were quite close to the results of SIMULATE 3K code that provided the boundary conditions, whereas there was a clear deviation in the modelled cladding surface temperatures. The assessment of the applicability of SCANAIR to model BWR fuel is planned to be continued in the near future. A calculation system for statistical fuel failure analysis has now been developed to a point that the application to full reactor scale testing and validation would be the next step. The results of a small-scale analysis with a LOCA scenario were encouraging. Despite the challenges with the neural network approach, it is an advancement compared to the traditionally used response surface method. The presented concept for analysing fuel failures in accident conditions is the first step in Finland towards systematic statistical procedure in this field.
REFERENCES [1] FÉDÉRICI, E., LAMARE, F., BESSIRON, V., PAPIN, J., Status of development of the
SCANAIR code for the description of fuel behaviour under reactivity initiated accidents, International Topical Meeting on Light Water Reactor Fuel Performance, Park City (2000).
[2] NUCLEAR ENERGY AGENCY, Nuclear Fuel Behaviour under Reactivity-initiated Accident (RIA) Conditions, State-of-the-art Report, NEA/CSNI/R(2010)1, ISBN 978-92-64-99113-2 (2010).
[3] INSTITUT NATIONAL DES SCIENCES ET TECHNIQUES NUCLÈAIRES– COMMISSARIAT À L'ÉNERGIE ATOMIQUE, Metallurgy and properties of Zr alloys for nuclear applications, postgraduate course, Saclay (2010).
[4] HAGRMAN, D.T. (Ed.), SCDAP/ RELAP5/MOD3.1 Code Manual Volume IV: MATPRO – A Library of Materials Properties for Light Water Reactor Accident Analysis, NUREG/CR-6150, EGG-2720, Volume IV (1993).

116
[5] FREPOLI, C., An overview of Westinghouse realistic large break LOCA evaluation model, Journal of Science and Technology of Nuclear Installations 2008, Article ID 498737 (2008) 15.
[6] MARTIN, R.P., O’DELL, L.D., Development considerations of AREVA NP Inc.’s realistic LBLOCA analysis methodology, Journal of Science and Technology of Nuclear Installations 2008, Article ID 239718 (2008) 13.
[7] WILKS, S.S., Determination of sample sizes for setting tolerance limits, The Annals of Mathematical Statistics 12 (1) (1941) 91–96.
[8] HÄMÄLÄINEN, A., et al., “Coupled code FRAPTRAN – GENFLO for analysing fuel behaviour during PWR and BWR transients and accidents”, Fuel Behvaiour Under Transient and LOCA Conditions: Proceeding of a Technical Committee Meeting Held in Halden, Norway, 10–14 September 2001, IAEA-TECDOC-1320, IAEA, Vienna (2001).
[9] ORGANISATION FOR ECONOMIC CO-OPERATION AND DEVELOPMENT/NUCLEAR ENERGY AGENCY, Bemuse phase III report, uncertainty and sensitivity analysis of the LOFT L2-5 test, NEA/CSNI/R(2007)4 (2007).

117
ASSESSMENT OF STEADY STATE UNCERTAINTIES IMPACT ON RIA MODELLING
A. HUGUET, L.E. HERRANZ Centro de Investigaciones Energeticas, Medioambientales y Tecnologicas (CIEMAT) Unit of Nuclear Safety Research Madrid, Spain Email: [email protected] Presented by F. Feria
Abstract
RIA scenarios, as design basis accidents, are studied to set reactor operational safety limits aimed to ensure the long-term core coolability. This is of particular interest nowadays, as nuclear fuel is driven to higher burnups under more demanding operation conditions. The present understanding of fuel behaviour under such events is encapsulated in computer codes, which predictability is extended and validated through separate effect and integral experiments data. These computational tools have become a key element to assess safety margins and, hence, their accuracy is of utmost interest in nuclear safety studies. Given the complexity of working phenomena under RIA conditions, neither existing thermo-mechanical models nor rod state characterization at the moment of power pulse reflect exactly reality. So, it is essential to know how these deviations from reality influence code accuracy. This study illustrates how uncertainties related to pre-transient rod characterization affect the estimates of nuclear fuel behaviour during the transient. To do so, the RIA scenario chosen as a basis for the study has been that of the CIP0-1 test of the CABRI program, and the codes involved in simulation have been FRAPCON-3 (steady state irradiation) and FRAPTRAN1.4 (transient). The rod characterization uncertainties have been estimated by analysing the propagation of uncertainties in modelling steady state irradiation. Then, those RIA initial uncertainties are fed into the transient analysis, estimates bands are discussed and input variables are ranked according to their effect on the RIA modelling. In addition to be an example of uncertainties assessment, this study intends to set a methodology that allows getting more reliable insights when modelling RIA scenarios. This work is framed within the CSN-CIEMAT agreement on “Thermo-Mechanical Behaviour of the Nuclear Fuel at High Burnup”. 1. INTRODUCTION The current nuclear industry trend to increase fuel burnup under more demanding operational conditions, has highlighted the importance of ensuring that, even under those conditions, a fuel rod would be capable of withstanding thermal and mechanical loads resulting from any design basis accident and, particularly reactivity initiated accidents (RIA). Computer codes were created and are being updated consistently. At the same time, they are validated against separate effect and integral tests. Given the huge complexity of RIA scenarios, models encapsulated in codes cannot capture reality with a perfect accuracy. They rely on hypotheses and approximations and they are fed with variable values that are uncertain to some extent. Estimating the impact of such uncertainties is of a high interest in best estimate (BE) safety analysis. Uncertainty analysis (UA) have been profusely used and developed in the area of thermo hydraulics, the OECD BEMUSE project being an example. Some applications have been conducted also in RIA related fields, such as the bundle response to a RIA (Diamond et al., 2000, Le Pallec and Tricot, 2002, Panka and Kereszturi, 2004, Avvakumov et al., 2007, and Anchel et al., 2010) or even when modelling experimental rodlet transients (Laats, 1981, Barrio and Lamare, 2005). However, very few applications are known in the RIA field itself, the most recent one being the work by Sartoris et al. (2010), where uncertainties are considered in the development of a methodology to set safety criteria for RIAs.

118
This work is aimed to assess the impact of uncertainties in the description of steady state irradiation on the results of a RIA accident. Hence, uncertainties affecting steady and transient models and uncertainties defining the transient scenario are out of the scope of this work. To do so, the CIP0-1 test of the CABRI program was chosen as a case study. Fuel rod thermo-mechanical behaviour was simulated by means of FRAPCON-3 (steady state irradiation) and FRAPTRAN (transient) performance codes. After a brief presentation of the computing strategy, a UA methodology is proposed and applied to the quantification of uncertainties when modelling CIP0-1 scenario, with the objective to 1) identify the critical steady state uncertain input parameters and 2) quantify the maximum accuracy that can be reached in a RIA modelling. 2. APPROACH AND TOOLS 2.1. Scenario The CIP0-1 integral test has been chosen as our RIA reference scenario. The CIP0-1 experiment was performed in 2002 in the framework of OECD CABRI International Program (CIP). Around 99 cal·g-1 UO2 were injected in 32.4 ms into a short rodlet previously irradiated up to an average burnup around 68.5 GW·d·t-1 U. Several reasons support this test selection: its initial and boundary conditions are prototypical of a rod ejection accident in PWR; it was thoroughly characterized experimentally both in its steady state irradiation (ENUSA, 2009) and transient (Papin et al., 2006) stages; there is available documentation; and it was previously modelled by other researchers (e.g. Romano et al., 2006). 2.2. Best estimate modelling 2.2.1. Analytical tools The “FRAP” codes family has been used in this study. FRAPCON-3 is the steady state fuel performance code maintained by PNNL on the behalf of US-NRC (Geelhood et al., 2011a). FRAPTRAN is the corresponding transient fuel performance code (Geelhood et al., 2011b). FRAPCON-3 predicts fuel thermo-mechanical performance by modelling the material responses of both fuel and cladding under normal operating conditions, whereas FRAPTRAN include models, correlations and properties for various phenomena of interest during fast transient and accidental conditions. Both codes are considered as BE codes, since they are capable of modelling all the relevant processes in a physically realistic way and were validated against integral test databases (Geelhood et al., 2011 c and d). 2.2.2. Global strategy The modelling of the full CIP0-1 test is the result of a 3-step calculation chain, as shown in Fig. 1. The characterization at base irradiation EOL is provided by the use of FRAPCON-3 code version 3.4a: a modelling of the complete mother rod behaviour is run first, before limiting it to the span which is submitted to the power pulse. The transient modelling is then carried out using FRAPTRAN code version 1.4. 2.2.3. Hypotheses and assumptions The CIP0-1 mother rod was irradiated during five cycles (eq. 2078 EFPD) in the Spanish reactor Vandellós-II at a core average power of 18 kW·m-1. The CIP0-1 rodlet was reconditioned from span 5 of the mother rod in Studsvik facilities. The CIP0-1 test was performed on November 2002 in the CABRI sodium loop facility (Cadarache). 99 cal·g-1 UO2 were injected at PPN without failure.

119
Concerning the transient phase, the input deck built can be considered as a BE since a major part of the information is adjusted to the available experimental data: power pulse and axial power profile, coolant temperatures, oxide layer thickness. For simplification sake, no transient FGR is considered (default option).
FIG. 1. CIP0-1 modelling scheme.
2.3. Uncertainty analysis setup 2.3.1. Sources of uncertainties Modeling an RIA involves a number of uncertainties. They may be classified as follows:
Transient uncertainties. They include both those involved in the scenario description (i.e., affecting variables, such as power pulse width, total injected energy, etc…) and those derived from the own simulation approach (i.e. specification of materials, modelling of specific phenomena, definition of boundary conditions, etc…)
Steady state uncertainties. These include all uncertainties coming from the steady state irradiation. Their significance lies on their effect on the characterization of the rod at the onset of the transient. As the former type, they entail both uncertainties from the irradiation description and uncertainties from its simulation, which affect input parameters and steady state models.
In the case of CIP0-1, one should add the uncertainties related to the rodlet refabrication to fit it to the experimental device.

120
2.3.2. Scope The UA conducted here entails assessing the impact of uncertainties in FRAPCON-3 input deck on FRAPTRAN predictions of the rodlet response to a power pulse. That is, uncertainties from any other sources discussed about are out of the scope of this study. As a consequence, the resulting band of FRAPTRAN estimates should be seen as a minimum, since addition of any other type of uncertainty introduced above would mean broader bands. It is noteworthy that in this case FRAPCON-3 and FRAPTRAN codes behave just as propagation tools. It is assumed that only FRAPCON-3 input data are subject to uncertainty and none propagation is sent back to FRAPTRAN input file. The final response behaviour is studied as a function of the perturbations made on FRAPCON-3 input deck file, while FRAPTRAN input file remains unchanged. In the case of CIP0-1 FRAPTRAN BE simulation, restart file has to be manually updated at each run, in order to account for refabrication gas and clad corrosion states. 2.3.3. Responses of interest Regarding the code response, our attention is focused on the following safety-related mechanical variables:
Maximum clad elongation Δlmax: data are experimentally available, and it reflects in a physical way the clad tube mechanical response to the power insertion.
Peak residual clad circumferential deformation εθp: experimental data are also available,
foremost εθp
is the critical parameter of the clad ductile failure model implemented in FRAPTRAN1.4.
The peak strain energy density (SEDmax) value is used to estimate the cladding failure damage through the SED-to-CSED ratio (e.g. (Huguet et al., 2010)); given the similar behaviour between both SED formulations calculated in FRAPTRAN codes (PNNL and EPRI), PNNLSED has been selected by default.
2.3.4. Selected methods Given that, on the one hand the analytical tools selected are not equipped with integrated UA package, and on the other hand PDF are difficult to assign to the selected uncertain parameters, it has been decided to explore deterministic propagation methods inspired of design of experiment (DOE) theory. The two methods used in the frame of this study are detailed hereafter: OAT and RSM.
One-at-a-time (OAT) method: The OAT approach is a sort of systematic parametric study. The OAT experimental design consists in perturbing only one input factor per computer run: each input is evaluated at its upper or lower value, meanwhile other stay at their nominal value; it implies a total of 2k+1 runs, if k is the factor number. The information from the OAT design can be used to screen the input variables, i.e. to make a preliminary identification of the most sensitive inputs, at a local scale (e.g. Kazeminejad, 2007). Such a simple method is convenient when the number of uncertain factors is high, but not enough robust to give quantitative insights.
Response surface method (RSM): The main idea of RSM is to approximate the original code response by an analytical “function” (called surrogate, proxy or metamodel) from a prescribed database of computations, and then use this replacement model for subsequent UA (e.g. Chun et al., 1996, or Zangeneh et al., 2002). Different types of response surface can be generated, according to response linearity degree: polynomial, thin plate splines, neural networks, generalized linear model, partial least square regression, MARS, boosting, etc. Depending on the response surface form, computer experimental sampling size and design should be carefully optimized: complete or fractional factorial plan, Hadamard matrix, Placket-Burman matrix, and even more elaborate sequential and adaptive plan.

121
2.3.5. UA sequences The UA follows a progressive application methodology, as illustrated by Kerrigan and Coleman (1979).
Screening analysis: The first step in UA involves identifying the “a priori” relevant FRAPCON-3 input parameters likely to influence the responses of interest defined above. This screening analysis is achieved on the basis of subjective expert judgment.
Importance assessment analysis: In a second step, after having assigned variation range to each factor identified in the previous section, an OAT computing method is applied to highlight the most relevant ones.
Sensitivity analysis: sensitivity analysis (SA) is the study of how the uncertainty in the output of a mathematical model can be allocated, qualitatively or quantitatively, to different sources of uncertainty in the model input data.
0
1
2
3
4
5
0 1 2 3 4 5
time (s)
cla
d e
lon
ga
tion
(m
m)
FRAPTRAN1.4 BE exp. raw data (a) Clad elongation evolution (normalized):
predicted vs experimental.
-0.2%
0.0%
0.2%
0.4%
0.6%
0.8%
0 100 200 300 400 500
rodlet elevation/BFC (mm)
cla
d r
esi
du
al h
oo
p s
tra
in
FRAPTRAN1.4 BE exp. data (b) Clad residual hoop strain along rodlet:
predicted vs experimental.
-5
0
5
10
15
20
25
30
0 0.5 1 1.5 2
time (s)
SE
D (
MJ/
m3
)
FRAPTRAN1.4 BE_PNNL FRAPTRAN1.4 BE_EPRI
CSED_EPRI CSED_EDF
CSED_CIEMAT (c) SED vs CSED evolutions.
FIG. 2. BE results for the 3 responses of interest defined in section 2.4.3. The RSM computing method is chosen as the basis of SA. Its application proceeds according to the following procedure:
Design of the experimental matrix: steady state input uncertain factors are perturbed in a prescribed way in order the numerical output response database gets the appropriate properties for subsequent model exploration.
Determination of the adequate surface response function: given that this study is an exploratory work of UA methods application, the priority would be given to a simple function.

122
Estimation of the response uncertainty by means of a second-order error propagation technique: the response “surface” developed replaces the original model in order to quantify response uncertainty.
3. RESULTS AND INTERPRETATION 3.1. Best estimate results A synthesis of the BE modelling results is encapsulated in Fig. 2 and Table 1. 3.2. Screening analysis A set of FRAPCON-3 input parameters has been selected. Two major criteria were adopted a priori: parameters likely to influence transient behaviour and uncertain data present in the input deck. Additionally, if the input value is needed, and no default value is available and/or the assigned value is arbitrary, the parameter is also considered. A systematic review of the restart file from FRAPCON-3 that feeds FRAPTRAN calculations, allowed identifying the information passed and then choosing 9 parameters considered uncertain (Table 2) in the FRAPCON-3 input deck (out of a total of 70). All these parameters are assumed to be independent. TABLE 1. BE NUMERICAL RESULTS OF INTEREST
Variables BE numerical result Experimental data Relative error (%)
Δlmax Maximum clad elongation [mm] 4.99
4.39 (normalized) -
4.59 4
εθp Permanent hoop strain at PPN [%] 0.209 0.694 232
SEDmax Peak PNNL-SED value [MJ·m-3] 4.09 - -
TABLE 2. FRAPCON-3 UNCERTAIN INPUT PARAMETERS
Code flag Definition BE nominal
value Unit
deng Open porosity fraction for pellets 0(1) %TD
flux Conversion factor between fuel specific power and fast neutron flux 2.21E+16(1) n·m-2s-1 per W·g-1
fgpav As-fabricated filling gas pressure (at room temperature) 2.35E+06(2) Pa
cldwks Clad cold-work (fractional reduction in cross-section area due to manufacturing processing)
0.5(3) ND
rsntr Expected increase in pellet density during in-reactor operation 52.656(4) kg·m-3
slim Swelling limit 0.05(1) Volume fraction
cpl Cold plenum length 0.047(5) m
roughf Surface fuel roughness 4 Microns
roughc Surface clad roughness 2 Microns (1) Code default value. (2) Experimental value. (3) Recommended value by code developers. (4) Determined from standard resintering test performed on fresh fuel (NUREG-0085). (5) Variable adjusted to fit with experimental free volume value.
3.3. Importance assessment analysis 3.3.1. Input parameter characterization For each input parameter defined in Table 2, large upper and lower limits have been defined according to available technical data and expert judgment (Table 3).

123
Some of the values set in Table 3 deserve further explanation:
(i) When deng is set to 0, an internal model takes over the calculations of open porosity; and for fuel density higher than 95.25% TD, the corresponding fraction is set to 0. Commercial fuel rods are not expected to show high open porosity values. However, according to Na et al. (2002), for a fuel density of 95.7% TD (as fabricated density of CIP0-1 fuel), the open porosity ε0 may reach 1.5% TD.
(ii) The study of the uncertainty related to rsntr and slim input variables involves exploring fuel densification and swelling steady state models. Upper limits were fixed arbitrarily to the double of their nominal values; in the case of rsntr, this criterion is consistent with the value of 1% (109.6 kg·m-3) recommended by the code developers.
(iii) Fuel and clad roughness are hardly reported in papers and reports. Based on data found (Lassmann and Blank, 1988) it has been decided to set large margins, realistic though.
TABLE 3. FRAPCON-3 UNCERTAIN INPUT PARAMETERS AND THEIR RANGE OF VARIATION
Code flag * required input
Unit Lower bound Upper bound Perturbation rationale
deng %TD 0 (=BE) 1.5 (i)
flux n·m-2s-1 per W·g-1 1.11E+16 4.42E+16 / and * by 2 [-50%+100%]
fgpav* Pa 2.28E+06 2.42E+06 +/-3% (Geelhood et al., 2009)
cldwks ND 0.1 0.8 Applicability range of FRAPCON-3 mechanical correlations (Geelhood et al., 2008)
rsntr* kg·m-3 0 105.31 (ii)
slim Volume fraction - 0.1
cpl* m 0.037 0.057 +/- 1 fuel pellet height (+/-27%) (Geelhood et al., 2009)
roughf* Microns 0.25 14.4 (iii)
roughc* Microns 0.17 4.5
3.3.2. Importance sampling Once the uncertainty ranges assigned, an OAT method was conducted and the results obtained are summarized in Fig. 3. The rationale adopted to choose relevant parameters is sketched in Fig. 4. As a result, a classification is here proposed:
Negligible: slim, deng and fgpav.
Moderate: cpl, cldwks, and rstnr.
Dominant: roughf, flux and roughc. It is worth reminding no quantitative information (such a ranking between roughf, flux and roughc) can be extracted from an OAT analysis.
Flux (F). The variable flux is called at the beginning of each time step to convert the linear heat generation as given in input to the corresponding fast flux, and by summing, to the fast fluence. This cumulative dose measures the material damage due to irradiation and is involved in the calculation of clad mechanical properties for instance. The information on the flux-to-heating conversion factor (also called kerma factor), which is requested as a function of the axial elevation, is rarely given by NPP operators. Its value which depends on neutron cross section data and reactor design can be calculated by means of 3D neutronic codes. The uncertainties associated to individual kerma factors quoted in the literature may reach up to
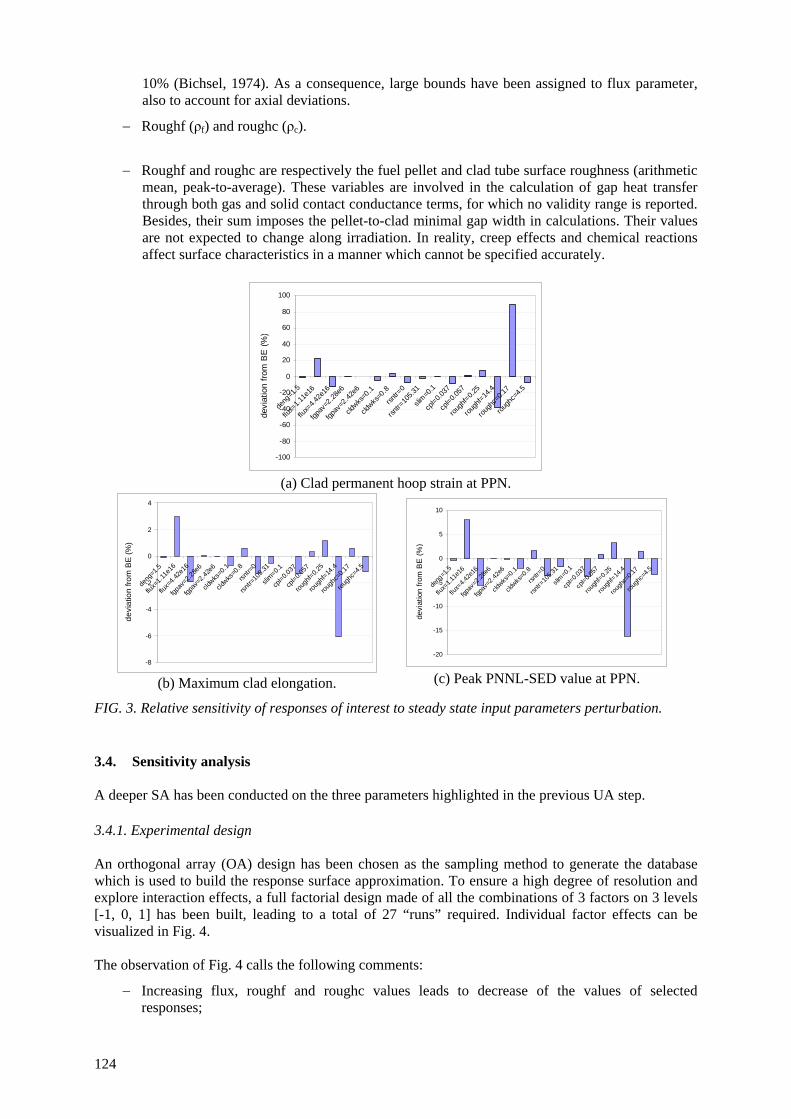
124
10% (Bichsel, 1974). As a consequence, large bounds have been assigned to flux parameter, also to account for axial deviations.
Roughf (ρf) and roughc (ρc).
Roughf and roughc are respectively the fuel pellet and clad tube surface roughness (arithmetic mean, peak-to-average). These variables are involved in the calculation of gap heat transfer through both gas and solid contact conductance terms, for which no validity range is reported. Besides, their sum imposes the pellet-to-clad minimal gap width in calculations. Their values are not expected to change along irradiation. In reality, creep effects and chemical reactions affect surface characteristics in a manner which cannot be specified accurately.
-100
-80
-60
-40
-20
0
20
40
60
80
100
deng
=1.5
flux=
1.11
e16
flux=
4.42
e16
fgpa
v=2.2
8e6
fgpa
v=2.4
2e6
cldwks
=0.1
cldwks
=0.8
rsnt
r=0
rsnt
r=10
5.31
slim
=0.1
cpl=
0.03
7
cpl=
0.05
7
roug
hf=0.
25
roug
hf=14
.4
roug
hc=0
.17
roug
hc=4
.5
devi
atio
n fr
om B
E (
%)
(a) Clad permanent hoop strain at PPN.
-8
-6
-4
-2
0
2
4
deng
=1.5
flux=
1.11
e16
flux=
4.42
e16
fgpa
v=2.
28e6
fgpa
v=2.
42e6
cldwks
=0.1
cldwks
=0.8
rsnt
r=0
rsnt
r=10
5.31
slim
=0.1
cpl=
0.03
7
cpl=
0.05
7
roug
hf=0.
25
roug
hf=14
.4
roug
hc=0
.17
roug
hc=4
.5
de
via
tion
fro
m B
E (
%)
(b) Maximum clad elongation.
-20
-15
-10
-5
0
5
10
deng
=1.5
flux=
1.11
e16
flux=
4.42
e16
fgpa
v=2.2
8e6
fgpa
v=2.4
2e6
cldwks
=0.1
cldwks
=0.8
rsnt
r=0
rsnt
r=10
5.31
slim
=0.1
cpl=
0.03
7
cpl=
0.05
7
roug
hf=0.
25
roug
hf=14
.4
roug
hc=0
.17
roug
hc=4
.5
devi
atio
n fr
om B
E (
%)
(c) Peak PNNL-SED value at PPN.
FIG. 3. Relative sensitivity of responses of interest to steady state input parameters perturbation. 3.4. Sensitivity analysis A deeper SA has been conducted on the three parameters highlighted in the previous UA step. 3.4.1. Experimental design An orthogonal array (OA) design has been chosen as the sampling method to generate the database which is used to build the response surface approximation. To ensure a high degree of resolution and explore interaction effects, a full factorial design made of all the combinations of 3 factors on 3 levels [-1, 0, 1] has been built, leading to a total of 27 “runs” required. Individual factor effects can be visualized in Fig. 4. The observation of Fig. 4 calls the following comments:
Increasing flux, roughf and roughc values leads to decrease of the values of selected responses;

125
sensitivity to roughc variations is symmetric while it is not for flux and roughf;
for a given input factor, the response to the changes (shape) is the same from one output variable to the other.
FIG. 4. Factor discrimination methodology.
3.4.2. Regression analysis Because FRAPCON-3 is a steady state code, it is reasonable to assume a continuous response on the range of variation of its input factors. As a consequence, simple second order polynomial surface responses have been explored. Three equations have been derived by a least-squares fitting of each output values:
Yi = a0 + a1·F + a2·ρf + a3·ρc + a12·F·ρf + a23·ρf·ρc + a13·F·ρc + a11·F2 + a22·ρf
2 + a33·ρc2 (3.1)
Where Yi is the estimated output value (Δlmax, εθ
p, SEDmax); a0, ai, aij are the response equation coefficients (1, effect term; 3, main effects; 6, quadratic terms;
all reported in Table 4); F, ρf, ρc are the input variables normalized to [-1,1] range. The accuracy of the regression equations was checked by examining residual plots. The ability of surface response equations to reproduce maximum clad elongation and peak PNNL-SED value at PPN looks suitable: high values of correlation coefficients obtained (0.9967 and 09956, respectively); and the biggest residuals are respectively, 0.7% and 3%. A not so good but acceptable result is the equation corresponding to the permanent clad hoop strain (R2=0.9234). A cubic-order polynomial would not increase accuracy notably. TABLE 4. REGRESSION COEFFICIENTS OF SURFACE RESPONSE EQUATIONS
Regression coefficients Δlmax εθp SEDmax
a0 4.87 0.132 3.81

126
a1 -0.145 -4.21E-02 -0.327 a2 -0.200 -4.94E-02 -0.427 a3 -6.01E-02 -1.50E-02 -0.134 a12 -3.57E-02 -8.58E-03 -8.51E-02 a23 -3.38E-02 -5.90E-03 -6.06E-02 a13 -8.41E-03 -1.34E-03 -1.84E-02 a11 6.86E-02 4.43E-02 0.171 a22 -5.99E-02 7.70E-03 -0.116 a33 -3.33E-03 1.86E-02 -1.31E-02
4.6
4.7
4.8
4.9
5.0
5.1
mm
average flux roughf roughc
-1 0 +1
-1 0 +1
-1 0 +1
(a) Maximum clad elongation.
1.0E-03
1.5E-03
2.0E-03
2.5E-03
N
D
average flux roughf roughc
-1 0 +1
-1 0 +1
-1 0 +1
(b) Clad permanent hoop strain at PPN.
3.2
3.4
3.6
3.8
4.0
4.2
4.4
MJ/
m3
average flux roughf roughc
-1 0 +1
-1 0 +1
-1 0 +1
(c) Peak PNNL-SED value.
FIG. 4. Main effects graphs.
3.4.3. Sensitivity indices The relative influence of each input variable on the computed outputs is obtained by examining the coefficients (in absolute value) in the response equations (Table 4). The conclusions of this analysis are the following:
Whatever is the response of interest, the order of sensitivity is: roughf > flux > roughc.
roughf and flux have the same sensitivity, while roughc is three times less significant.
Quadratic effect of flux has the same magnitude order than roughc linear one (interaction effect are known to be important in such studies).
As a main result of this exploratory UA, the most influential steady state parameter regarding transient modelling appears to be roughf, which value did not raise concerns up to now.

127
3.4.4. Responses uncertainty Once constructed, the response surfaces can be used as a surrogate in a Monte Carlo simulation to estimate responses uncertainty. 2000 random sampling have been calculated without emitting any hypothesis on uncertainty distribution of the three selected inputs (uniform PDF in the bounds as specified in Table 3). Results are presented in Table 5. TABLE 5. SENSITIVITY ANALYSIS FINAL RESULTS
Responses Maximum clad
elongation [mm] Permanent clad hoop
strain at PPN [%] Peak PNNL-SED
value [MJ·m-3] Standard deviation σd 0.15 0.040 0.33
95% confidence interval applied to BE response
[x0 +/- 2σd]
(4.68–5.30) (0.129–0.289) (3.43–4.75)
Precision on BE response
[%] 12 77 32
According to this SA, considering the propagation of large uncertainties related to roughf, roughc and flux steady state variables, clad elongation and SED peak values along subsequent transient are calculated with a (95% confidence) precision of respectively 12% and 32%. Assuming the response surface assigned to clad hoop strain response as valid, the “precision” on this nominal response reaches 77%. 4. CONCLUSIONS AND PROSPECTS This study is an exploratory work on uncertainty analysis application to RIA modelling. Despite its complexity, the interest of this work is outstanding: on one side, it can provide insights concerning how accurate one can become when analysing RIA; on the other side, key variables affecting calculation precision can be identified. Both aspects should assist in defining research priorities. In particular, this study investigates how much initial steady state uncertainties can affect accuracy in a RIA simulation. Based on the CIP0-1 test of the CABRI program, and by applying the “One-at-a-time” and Response Surface Methods (OAT and RSM, respectively), the accuracy in the peak value of key transient variables (i.e. clad elongation, clad residual hoop strain and strain energy density) has been assessed. From the analysis, it has been highlighted that fuel roughness, in-reactor heat-to-flux conversion factor, and clad roughness, are key characteristic values that should be specified as accurately as feasible. Among them, fuel surface roughness is the most important. The study has allowed noting that just when uncertainties affecting steady state irradiation are considered, the accuracy in RIA modelling is limited, particularly of variables like clad strain. Fortunately, others like SED of extreme relevance characterizing fuel rod integrity do not seem too drastically affected. In other words, their accuracy is acceptable. Given the intrinsic limitations of this study, it will be extended in the future. In the short term, it is planned to assess the impact of FRAPCON-3 models. In the long term both uncertainties should be combined in order to quantify steady state global inaccuracy.

128
REFERENCES
[1] ANCHEL, F., BARRACHINA, T., MIRO, R., MACIAN-JUAN, R., Uncertainty propagation and sensitivity analysis of coupled thermalhydraulic-neutronic nuclear power plant simulations: influence of uncertainty in neutronic data, Procedia Social and Behavioural Sciences 2 (2010) 7599–7600
[2] AVVAKUMOV, A., MALOFEEV, V., SIDOROV, V., Spatial Effects and uncertainty analysis for rod ejection accidents in a PWR, Office of Nuclear Regulatory Research U.S. Nuclear Regulatory Commission, NUREG/IA-0215, Washington, DC (2007).
[3] BARRIO, F., LAMARE, F., A study of SCANAIR sensitivity based on the simulation of REP-Na3 experiment using an experimental design methodology, CIEMAT technical report DFN/SN-01/OP-05 (2003).
[4] BICHSEL, H., Proc. 2nd Symp. on Neutron Dosimetry in Biology and Medicine, Neuherberg (1974) 191.
[5] CHUN, M-H., HAN, S-J., TAK, N-I., A combined procedure of RSM and LHS for uncertainty analyses in source term quantifications using MAAP3.0B Code, Ann. Nucl. Energy 23 (16) (1996) 1337–1349.
[6] DIAMOND, D.J., ARONSON, A.L., YANG, C.Y., A qualitative approach to uncertainty analysis for the PWR rod ejection accident, Trans. Amer. Nucl. Soc. 83 (2000).
[7] ENUSA, Ref: COM-002700 rev. 3, ENUSA (2009) (private communication). [8] GEELHOOD, K.J., LUSHER, W.G., BEYER, C.E., PNNL stress/strain correlation for Zircaloy,
PNNL-17700 (2008). [9] GEELHOOD, K.J., LUSHER, W.G., BEYER, C.E., FRAPCON-3.4: a computer code for the
calculation of steady-sate thermal- mechanical behaviour of oxide fuel rods for high burnup, NUREG/CR-7022, vol.1 (2011).
[10] GEELHOOD, K.J., LUSHER, W.G., BEYER, C.E., FRAPTRAN 1.4: a computer code for the transient analysis of oxide fuel rods, NUREG/CR-7023, vol.1 (2011).
[11] GEELHOOD, K.J., LUSHER, W.G., BEYER, C.E., FRAPCON-3.4: integral assessment, NUREG/CR-7022, vol. 2 (2011).
[12] GEELHOOD, K.J., LUSHER, W.G., BEYER, C.E., FRAPTRAN 1.4: integral assessment, NUREG/CR-7023, vol. 2 (2011).
[13] HUGUET A., VALLEJO I., HERRANZ L.E., Pretest modelling of CABRI water-loop CIP3-1 test: an application of FRAPTRAN code, CIEMAT technical report DFN/SN-05/OP-10, CIEMAT (2010).
[14] KAZEMINEJAD, H., Uncertainty and sensitivity analyses for steady state thermal hydraulics of research reactors, Progress in Nuclear Energy 49 (2007) 313–322.
[15] KERRIGAN, J.D., COLEMAN, D.R., Application of the response surface method of uncertainty analysis to establish distributions of FRAP-S3 calculated stored energy for PWR-type fuels, Nuclear Engineering and Design 54 (1974) 211–224.
[16] LASSMANN, K., BLANK, H., Modeling of fuel rod behaviour and recent advances of the TRANSURANUS code, Nuclear Engineering and Design 106 (1988) 291–313.
[17] LATTS, E.T., FRAP-T5 uncertainty study of five selected accidents and transients, INEL technical report, CONF-810803—5 (1981).
[18] LE PALLEC, J.C., TRICOT, N., Uncertainties analysis for best estimate PWR RIA modelling, Proc. Top. Meeting on RIA, Aix-en-Provence (2002).
[19] NA, S.H., KIM, S.H., LEE, Y.W, Relation between density and porosity in sintered UO2 pellets, Journal of the Korean Nuclear Society 34 (5) (2002) 433–435.
[20] PANKA, I., KERESZTURI, A., Sensitivity investigations – a case study by KIKO3D/TRABCO code system, Proc. of the International Conference on Nuclear Energy for New Europe (2004).
[21] PAPIN, J., PETIT, M., GRANDJEAN, C., GEORGENTHUM, V., IRSN R&D studies on high burnup fuel behaviour under RIA and LOCA conditions, Proceedings of the 2006 International Meeting on LWR Fuel Performance (2006) 274–278.
[22] ROMANO, A., WALLIN, H., ZIMMERMANN, A., CHAWLA, R., Modelling the CABRI high burnup RIA test CIP0-1 using an extended version of the FALCON code, Nuclear Engineering and Design 236 (2006) 284–294.

129
[23] SARTORIS, C., TAISNE, A., PETIT, M., BARRE, F., MARCHAND, O., A consistent approach to assess safety criteria for reactivity initiated accidents. Nuclear Engineering and Design 240 (2010) 57–70.
[24] ZANGENEH, N., AZIZIAN, A., LYE, L., POPESCU, R., Application of response surface methodology in numerical geotechnical analysis, Proc. 55th Canadian Society for Geotechnical Conference, Hamilton (2002).


131
RCCA EJECTION FAULT STUDIES: APPLICATION OF A BURNUP THRESHOLD FOR THE EVALUATION OF THE RADIOLOGICAL RELEASES
C. BERNAUDAT, J. GUION, N. WAECKELA EDF/DIN/SEPTEN Villeurbann, France Email: [email protected]
Abstract
In a PWR, the reactivity initiated accident, which is a PCC4 event, is represented by the RCCA ejection fault, during which a rod control cluster assembly (RCCA) is ejected from the core. Consequently, reactivity is rapidly inserted in the core. In France, one of the safety regulatory requirements in such situations is related to the limitation of the radiological releases in the environment. In order to quantify the radiological release, the number of failed rods during the transient is determined on the basis of a very conservative assumption: any rod that undergoes DNB onset is supposed to fail, whatever its burnup. The number of failed rods shall remain under 10% of the whole core. This assumption is not confirmed by full-scale tests such as NSRR tests (TK series), where all ballooned rodlets survived, or BIGR tests, where rod failure needed a very high energy deposition. Up to now, all RIA failure limits are based on some failure mechanisms such as fuel incipient melting, cladding oxidation/embrittlement or pellet–cladding mechanical interaction (PCMI). Cladding failure by ballooning/burst is excluded. All RIA simulation codes assume instantaneous gas equilibrium in the rod during the transient. This assumption is not valid at high burnup, as evidenced in the BIGR tests, where some rodlets failed with multiple cracks. The modelling of an axial gas flow blockage when the pellet–clad gap is closed is currently under development in the SCANAIR code. Moreover, full-scale tests induce non-prototypical PWR conditions; prototypical conditions will be achieved in the future CABRI Water Loop. In order to reduce the conservatism of the radiological release assessment, a better estimation of the rods likely to fail by ballooning/burst has to be made. Rod failure by ballooning /burst needs two simultaneous conditions: DNB onset and rod inner overpressure. With the current simulation tools, the rod inner pressure is correctly evaluated as long as the pellet–clad gap remains open. For UO2/zircaloy-4 rods, the pellet–clad closure appears for a rod burnup of 25 GW·d·t-1 M. This is based on the observation of many fuel ceramographies: the pellet–clad contact is indicated by the build-up of an interface layer on the cladding inner wall. During the assessment of the cladding failure limit proposed by EDF for UO2/zircaloy-4, the maximum inner pressure has been calculated for rods under 25 GW·d·t-1 M. In all cases, this pressure is much lower than the core pressure (155 bar). This results shows that all the rods under 25 GW·d·t-1 M which undergo DNB onset during an RIA are not likely to fail and will not contribute to any radiological release. Consequently, application of this burnup threshold will contribute to reduce the conservatism in the radiological release evaluation in RCCA ejection fault studies. 1. INTRODUCTION In France, the reactivity initiated accident (RIA) is a PCC4 event. In PWRs, the typical RIA transient is triggered by the ejection of a rod control cluster assembly (RCCA) from the core. After the failure of the RCCA holding device, the RCCA is violently ejected from the core (due to the core inner pressure), and reactivity is inserted in the upper part of the core, in the underlying fuel assembly and its immediate neighbours. The amount of reactivity inserted in the core depends on many parameters such as: the RCCA weight, position and insertion level, the initial core power level, some fuel rod design characteristics, the burnups of the underlying assembly and its neighbours. All these parameters depend on the fuel core management and the advancement in the current operating cycle. For PCC4 events, which present a low probability of occurrence, the safety requirements are the following:
To maintain the short term and long term core coolability. To preserve the integrity of the 2nd containment barrier (the core vessel and its internals). To limit the radiological releases in the environment.

132
Unfortunately, physical limits to meet these safety requirements are not easy to establish and apply in safety studies. In order to alleviate this problem, a conservative decoupling limit, which guarantees the non-failure of the fuel rod cladding, is often used as a surrogate. Such a limit is much easier to assess experimentally, and fulfils simultaneously the three safety requirements mentioned above, provided it takes into account all the failure mechanisms described hereunder. 2. CLADDING FAILURE LIMIT 2.1. Cladding failure mechanisms during an RIA During an RIA transient, four different cladding failure mechanisms have been identified:
1) Fuel oxide incipient melting: this mechanism needs a very high energy deposition in the fuel column, and so may be more likely to occur at low burnup, when the fuel is the most reactive.
2) Cladding oxidation/embrittlement: at a temperature over 1482°C (2700°F), the chemical oxidation reaction between zirconium and water becomes exothermic and can accelerate till clad failure (this failure mechanism requires a holding time larger than 30 seconds, which bounds typical RIA transient durations [1–2]). Such a mechanism also needs high energy deposition in the fuel and massive boiling crisis in the coolant. So, as above, it is more likely to occur at low burnup.
3) Cladding failure by pellet–cladding mechanical interaction (PCMI): PCMI is a strain driven loading mechanism, which is governed by the dimensional variations of the fuel pellet (mainly thermal expansion and gaseous swelling). The associated failure mechanism is related to clad material ductility exhaustion, i. e. when the total elongation at failure (TE) of the cladding material is exceeded [3]. This failure mechanism mainly occurs at intermediate or high burnup, when the pellet–clad gap is closed or/and bonded by a zirconia inner layer and when the fuel pellets are more likely to expand by gaseous swelling.
4) Cladding failure by ballooning/burst: due to important fission gas release in the fuel rod during the transient, the rod inner pressure can exceed the coolant pressure. If the clad-to-coolant heat flux is high enough to trigger the boiling crisis, the cladding can deform by ballooning. This can be conservatively considered as a stress driven mechanical loading which leads to cladding failure by plastic instability, when the cladding material uniform elongation (UE) is exceeded. In fact, due to the limited quantity of gas available in the rod, this mechanism is energy driven, rather than stress driven. As for PCMI, cladding failure by ballooning and burst is more likely to occur at medium or high burnup (when the quantity of available internal gas is sufficient to get overpressure) and needs an energy deposition sufficient to trigger DNB and clad rapid heat-up.
Table 1 below summarizes the main characteristics of the four potential mechanisms of cladding failure described above. 2.2. Existing cladding failure limits During the workshop on RIA, which was held in Paris in September 2009 under the auspices of the OECD/NEA, and in other meetings, various approaches to define Zircaloy-4 clad failure limits by PCMI were presented [4–7]. These approaches were based on the analysis of either RIA full-scale tests (US-NRC, JAEA) or mechanical tests on irradiated claddings (EPRI-Anatech, IRSN). Figure 1

133
gathers the cladding failure limits proposed by the different organizations, as a function of the waterside zirconia layer thickness or the fuel rod average burnup (Fig. 1).a TABLE 1. MAIN CHARACTERISTICS OF THE FOUR POTENTIAL CLADDING FAILURE MODES DURING AN RIA TRANSIENT
Failure mechanism
Fuel incipient melting
Clad oxidation/embrittlement
PCMI Ballooning/burst
Governing parameter(s)
Clad melting temperature
Clad temperature (and time-at-temperature)
Clad material TE
Clad material UE
Burnup range Low Low Intermediate or high
Intermediate or high
Energy deposition level
High High Any (decreasing with increasing burnup)
Sufficient for DNB onset
Other prerequisites
None None Gap reduction or closure
Rod inner overpressure
0
20
40
60
80
100
120
140
160
180
0 20 40 60 80 100 120 140
Fuel
ent
halp
y in
crea
se (c
al/g
)
zirconia layer thickness (µm)
Zy-4 cladding failure limits
US-NRC (interim limit)
EPRI-Anatech
JAEA
IRSN
0
20
40
60
80
100
120
140
160
180
0 10 20 30 40 50 60 70 80
Fuel
ent
halp
y in
crea
se (c
al/g
)
Rod average burnup (GWd/tM)
Zy-4 cladding failure limits
US-NRC (interim limit)
EPRI-Anatech
JAEA
IRSN
FIG. 1. Zircaloy-4 cladding RIA failure limits as a function of waterside cladding corrosion (left) and rod average burnup (right). Despite the various approaches, the cladding failure limits converge more or less towards the same value at high burnup (50–65 cal·g-1). The larger scatter between these limits at intermediate burnup or corrosion level is due to the relative lack of experimental data in these areas (i. e. between 30–50 GW·d·t-1 M). At low burnup, the limitation of the enthalpy rise, based on old full-scale tests (SPERT CDC, PBF) precludes the failure by both fuel incipient melting and clad oxidation/embrittlement. EDF’s approach [8] is quite similar to EPRI-Anatech’s one and has been already extensively described. Based on mechanical tests (hoop tensile and burst tests) on as-received and irradiated cladding samples, a failure limit expressed in critical strain energy density (CSED), as a function of the clad corrosion level, has been established. Then, by the means of SCANAIR calculations and conservative assumptions, it has been transposed in fuel enthalpy rise as a function of both rod average burnup and initial linear power. As for the other limits, a bounding value at low burnup (which corresponds to a maximum fuel enthalpy of 180 cal·g-1) precludes rod failure by fuel melting or cladding embrittlement. This failure limit is illustrated on Fig. 2 below for transients initiated in hot
___________________________________________________________________________ a For the sake of consistency, in Fig. 1 a), JAEA’s limit has been transposed on the basis of EDF’s inverse correlation. In Fig. 1 b), the transposition of NRC’s limit is based on EPRI-Anatech’s upper-bound eZrO2 vs. burnup correlation, and the transposition of IRSN’s limit is based on EDF’s upper bound correlation.

134
zero power (HZP) conditions. It is worth noticing that at high burnup, this limit is somewhat higher than the other ones.
0
20
40
60
80
100
120
140
160
0 10 20 30 40 50 60 70 80
en
tha
lpy
inc
rea
se
(c
al/g
)
rod average burnup (GWd/tM)
UO2/Zy-4 rods : cladding failure limit
FIG. 2. EDF’s cladding failure limit (fuel enthalpy rise) as a function of rod average burnup for transients initiated in HZP conditions. 2.3. Consequences for the safety studies None of these limits deals with cladding failure by ballooning and burst after DNB onset. As a consequence, the safety requirement regarding the limitation of the radiological releases has to be verified separately and, to this end, the number of “failed” rods during the transient has to be evaluated. Up to now, this evaluation is based on a very conservative assumption: any rod which undergoes DNB (i. e. whose minimum value of the ratio flux to critical (RFTC) is lower than a critical value) is assumed to be failed. This assumption is however not well supported by the available experimental results [9]:
In NSRR tests (RTAPa capsule), all the rod failures were reported to occur by PCMI, and all the rodlets which survived this phase and entered into DNB presented significant ballooning and did not fail (e.g. TK series).
In BIGR tests (conditions close to NSRR/RTAP tests), clad failures by ballooning were observed only for enthalpy rises greater than 155 cal·g-1.
Moreover, this evaluation is made in a way irrespective of the prerequisites of a cladding failure by ballooning, and namely the rod overpressure, which in a PWR, cannot be achieved in low burnup rods. The need to improve the study methodology in this domain is crucial since it is very difficult to meet the related safety criterion (in France, the number of “failed” rods shall be less than 10% of the whole core): in some cases, the RCCA pattern or insertion limits have to be adapted in order to make sure that this safety criterion will be met. 3. RIA SIMULATION 3.1. RIA simulation codes: state of the art Up to now, all the available codes dedicated to the simulation of the thermomechanical behaviour of a fuel rod submitted to a fast power transient (FRAPTRAN (US-NRC) [10], FALCON (EPRI-Anatech)
___________________________________________________________________________ a room temperature and atmospheric pressure (RTAP) (stagnant water at 20°C, 1 bar).

135
[11], RANNS (JAEA) [12], SCANAIR (IRSN) [13]) include the same assumption regarding the axial gas flow within the rod: at any instant of the transient, the pressure equilibrium is achieved in all parts of the rod free volume (plenums, pellet–clad gap, pellet dishes and chamfers, etc.). In other words, the axial gas flow kinetics is assumed to be much faster than the power transient kinetics. Such an assumption is not really a problem for the assessment or verification of the PCMI cladding failure limit described above. However, this assumption is probably not valid at high burnup, for several reasons:
With increasing burnup, the pellet–clad gap closes and finally gets bonded by a continuous interface layer (10 µm thick).
Cladding creepdown forces the pellet fragments to be closely packed together, so that all the cracks within the pellet are more or less closed.
These observations suggest that at high burnup, the axial gas flow is impaired and instantaneous pressure equilibrium cannot be achieved during a fast power transient. This is probably true even for short rodlets tested in full-scale experiments: e.g. in BIGR tests, despite the VVER design with hollow pellets, rod failures with multiple cracks (up to 4) have been observed. Such a situation can be achieved only with axial gas flow blockage (otherwise, only one crack would have been observed). 3.2. Experimental observations The validity of this assumption is strongly dependent on the evolution of the physico-chemical state of the pellet–clad gap with rod irradiation. To this end, many radial cuts performed on irradiated commercial UO2/Zy-4 fuel rods have been examined, for an average burnup range from 10–60 GW·g·t-1 M. More precisely, the following items have been carefully examined:
The interface layer azimutal extent (number of angular positions where the zirconia layer is present, on a total of 16 positions regularly distributed on the circumference);
The interface layer thickness, when present (min and max values);
The pellet–clad gap width, in cold state (min and max values). The results of these examinations are shown on Figs 1–3 below.
0
2
4
6
8
10
12
14
16
18
0 10000 20000 30000 40000 50000 60000 70000
Nu
mb
er o
f p
os
itio
ns
wh
ere
the
lay
er
is
pre
sen
t
Rod average burnup (MWd/tM)
Inner interface layer azimutal extent
FIG. 3. Evolution of the azimutal extent of the inner interface layer with rod average burnup.

136
0
2
4
6
8
10
12
14
16
18
0 10000 20000 30000 40000 50000 60000 70000
inte
rfa
ce
lay
er
thic
kn
es
s (
µm
)
Rod average burnup (MWd/tM)
interface layer thichness
min
max
FIG. 4. Evolution of the inner interface layer thickness with rod average burnup.
0
20
40
60
80
100
120
0 10000 20000 30000 40000 50000 60000 70000
Ga
p w
idth
(µ
m)
Rod average burnup (MWj/tM)
Evolution of pellet-clad gap
average
min
max
FIG. 5. Evolution of the pellet–clad gap width with rod average burnup. As a conclusion, with the current state of the art of the simulation codes, the rod inner pressure is quite correctly calculated up to a certain burnup limit. Beyond this limit, the assumption of perfect gas equilibrium becomes less and less valid with increasing burnup. At least, it is no longer valid at all at high burnup. When the axial gas flow is completely blocked, the local rod inner pressure can reach very high values due to a local fission gas release fraction higher than the rod average value and a very small free volume (reduced to the pellet dishes and chamfers). So, with the assumption of perfect gas equilibrium, the clad loading during the ballooning phase may be largely underestimated.
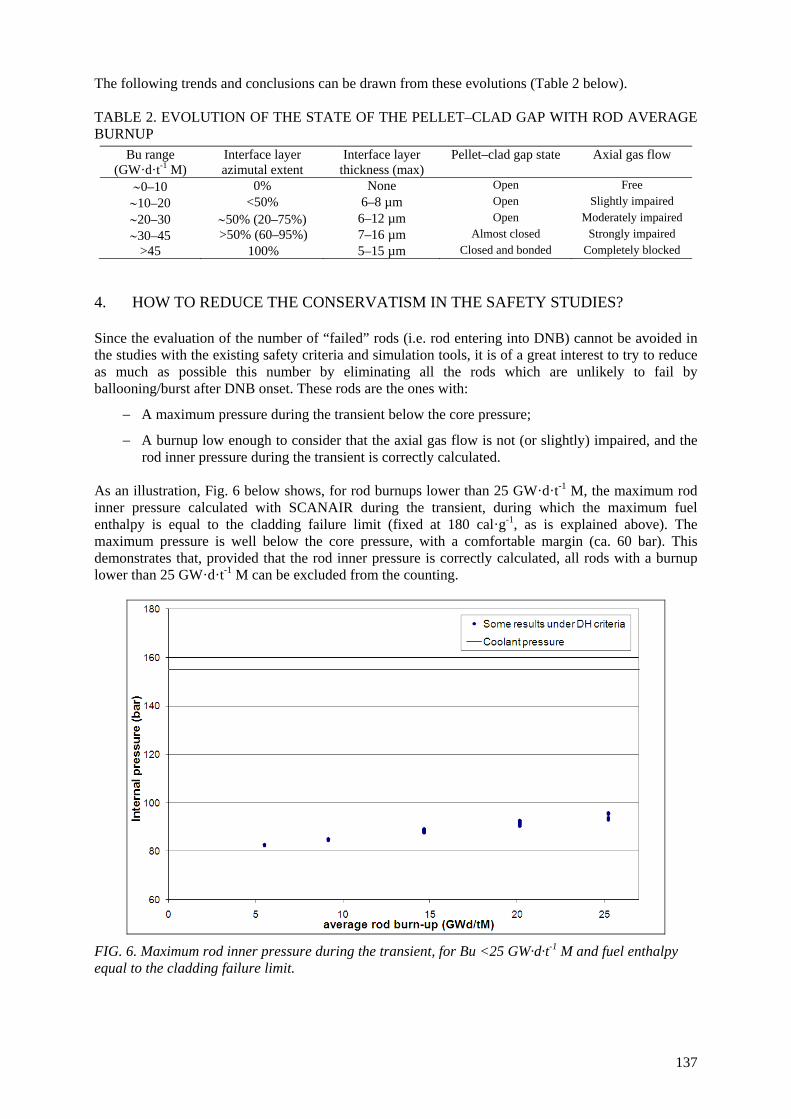
137
The following trends and conclusions can be drawn from these evolutions (Table 2 below). TABLE 2. EVOLUTION OF THE STATE OF THE PELLET–CLAD GAP WITH ROD AVERAGE BURNUP
Bu range (GW·d·t-1 M)
Interface layer azimutal extent
Interface layer thickness (max)
Pellet–clad gap state Axial gas flow
0–10 0% None Open Free
10–20 <50% 6–8 µm Open Slightly impaired
20–30 50% (20–75%) 6–12 µm Open Moderately impaired
30–45 >50% (60–95%) 7–16 µm Almost closed Strongly impaired
>45 100% 5–15 µm Closed and bonded Completely blocked
4. HOW TO REDUCE THE CONSERVATISM IN THE SAFETY STUDIES? Since the evaluation of the number of “failed” rods (i.e. rod entering into DNB) cannot be avoided in the studies with the existing safety criteria and simulation tools, it is of a great interest to try to reduce as much as possible this number by eliminating all the rods which are unlikely to fail by ballooning/burst after DNB onset. These rods are the ones with:
A maximum pressure during the transient below the core pressure;
A burnup low enough to consider that the axial gas flow is not (or slightly) impaired, and the rod inner pressure during the transient is correctly calculated.
As an illustration, Fig. 6 below shows, for rod burnups lower than 25 GW·d·t-1 M, the maximum rod inner pressure calculated with SCANAIR during the transient, during which the maximum fuel enthalpy is equal to the cladding failure limit (fixed at 180 cal·g-1, as is explained above). The maximum pressure is well below the core pressure, with a comfortable margin (ca. 60 bar). This demonstrates that, provided that the rod inner pressure is correctly calculated, all rods with a burnup lower than 25 GW·d·t-1 M can be excluded from the counting.
FIG. 6. Maximum rod inner pressure during the transient, for Bu <25 GW·d·t-1 M and fuel enthalpy equal to the cladding failure limit.

138
Figure 7 below illustrates, for a core management operated in the French 900 MW PWRs (UO2/Zy-4 fuel assemblies, four annual cycles, F/A discharge burnup <52 GW·d·t-1 M), the proportion of fuel rods with an average burnup below the value in abscissa, at different instants of the cycle: beginning of cycle (BOC), middle of cycle (MOC), natural end of cycle (NEOC) and after end of the stretch period (EOS). As can be seen, the proportion of fuel rods under 10 GW·d·t-1 M or 20 GW·d·t-1 M can be significant, especially at BOC: more than 30% of the rods have a burnup lower than 10 GW·d·t-1 M, and more than 50% have a burnup lower than 20 GW·d·t-1 M.
0
0.2
0.4
0.6
0.8
1
1.2
0 10 20 30 40 50 60 70
frac
tion
of r
ods w
ith B
u <
Burn
up
Burnup (GWd.tM)
UO2/Zy-4 core management (900 MW PWRs, 4 annual cycles)
BOC
MOC
NEOC
EOS
FIG. 7. Proportion of rods with Bu <given burnup, for a core management operated on French 900 MW reactors, at different instants of the cycle. Moreover, during an RCCA ejection accident, the low burnup rods are the most reactive, and thus the most likely to undergo DNB during the transient. As a consequence, by eliminating a certain proportion of fuel rods under a given burnup threshold (which depends on the rod design, its irradiation and the criteria chosen to fix its value), the number of “failed” rods will be reduced in a greater proportion and the maximum number of “failed” rods (10% in France) will be more easily met, without adapting the RCCA pattern or insertion limits in the core.
5. CONCLUSIONS AND PERSPECTIVES Within the framework of the safety studies regarding the RCCA ejection accident, a fuel rod cladding failure limit has been chosen as a conservative surrogate in order to verify the safety requirements imposed by the French regulator. The cladding failure limit has to deal with four failure mechanisms: fuel incipient melting, cladding oxidation/embrittlement, PCMI and ballooning/burst after DNB onset. Up to now, all the existing failure limits do not include failure by ballooning/burst. As a consequence, the limitation of the radiological releases has to be verified separately on the basis of a very conservative assumption: any fuel rod that enters into DNB is assumed to fail. This can lead to difficulties in safety studies, where, for a given core management, the RCCA pattern of insertion limits must be modified in order to meet the related safety criterion (less than 10% of the rods supposed to fail).

139
Moreover, all the RIA simulation codes assume perfect pressure equilibrium of the rod inner atmosphere, whatever the rod burnup. This assumption is not supported experimentally: the observation of pellet–clad gaps shows that with increasing burnup, the pellet–clad gap is gradually closed and bonded with a zirconia layer. So, at high burnup, the axial gas flow within the rod is completely impaired. Assuming instantaneous inner pressure equilibrium can lead to non-conservative hypotheses in the evaluation of the clad mechanical loading during the ballooning phase. With the existing clad failure limits and state of the art of the RIA simulation codes, it appears that it is still necessary to verify the number of “failed” rods entering into DNB. In order to reduce the conservatism in the counting of the rods, it is suggested to apply a burnup threshold under which the rods are unlikely to fail by ballooning. All the rods whose burnups are low enough to allow undisputed rod inner pressure calculations with current assumptions, and exhibiting maximum inner pressure lower than the core pressure can be eliminated from the counting. An illustration of a core management operated in the French 900 MW reactors shows that a significant proportion of the fuel rods can be excluded: at beginning of cycle, at least 30% (or 50%) of the fuel rods can be excluded, since they exhibit a burnup lower than 10 (or 20) GW·d·t-1 M. The modelling of an axial gas flow in RIA simulation codes, including the flow blockage due to the gap closure and bonding, appears to be a difficult task. In the SCANAIR code, the work is still in progress [13]. When the clad mechanical loading by overpressure is correctly evaluated, clad failure by ballooning/burst will be predicted in a more realistic way. The full-scale tests scheduled in the future CABRI Water Loop [14], which reproduces the conditions of an RIA transient initiated in HZP conditions in a PWR core (pressure, inlet temperature and coolant mass flow) will contribute to the accuracy of the modelling. In such a situation, the need for the verification of the safety criterion regarding the radiological release, based on the counting of the rods that enter into DNB, will have to be reconsidered.
REFERENCES [1] SHIOZAWA, S., ISHIKAWA, M., A study of fuel behaviour under reactivity initiated
accidents – review, Journal Nuclear Materials 95 (1980) 1. [2] VAN HOUTEN, R., Fuel rod failure as a consequence of departure from nucleate boiling or
dryout, NUREG-0562 (1979). [3] SALLES, B., et al., EDF proposed safety domain for rod ejection accidents in PWRs, ANS
Topical Meeting on Reactor Fuel Performance, Park City (2000). [4] FUKETA, T., SUGIYAMA, T., Current RIA related regulatory criteria in Japan and their
technical basis, Proceedings of OECD/NEA Workshop on Nuclear Fuel Behaviour during Reactivity Initiated Accidents, Paris (2009).
[5] SARTORIS, C., Example of application of the IRSN approach to assess safety criteria for reactivity initiated accidents, Proceedings of OECD/NEA Workshop on Nuclear Fuel Behaviour during Reactivity Initiated Accidents, Paris (2009).
[6] MONTGOMERY, R.O., et al., Development of acceptance criteria for safety analysis of control rod ejection and control rod drop accidents using a mechanistic approach, Proceedings of OECD/NEA Workshop on Nuclear Fuel Behaviour during Reactivity Initiated Accidents, Paris (2009).
[7] CLIFFORD, P., VOGLEWEDE, J., Current status of reactivity initiated accident criteria a in the United States, U.S. Nuclear Regulatory Commission, Fuel Safety Research Meeting 2009, Tokai-Mura (2009).
[8] BERNAUDAT, C., et al., An analytical criterion to prevent PCMI fuel rod cladding failure during RIA transients, Proceedings of OECD/NEA Workshop on Nuclear Fuel Behaviour during Reactivity Initiated Accidents, Paris (2009).
[9] MEYER, R.O., An assessment of fuel damage in postulated reactivity initiated accidents, Nuclear Technology 155 (2006) 293.

140
[10] GEELHOOD, K., et al., New release of fuel performance codes, FRAPCON 3.4 and FRAPTRAN 1.4, Topfuel, Paris (2009).
[11] LYON, W., et al., PCI analysis and fuel rod failure prediction using FALCON, Proceedings of TOPFUEL 2009, Paris (2009).
[12] SUZUKI, M., et al., Numerical analysis and simulation of high burnup PWR fuel pulse irradiated in reactivity initiated conditions, Proceedings of OECD/NEA Workshop on Nuclear Fuel Behaviour during Reactivity Initiated Accidents, Paris (2009).
[13] MOAL, A., Advanced models for the simulation of post-DNB phenomena during RIAs with SCANAIR, Topfuel, Orlando (2010).
[14] FRIZONNET, J.M., et al., Thermal-hydraulic representativity of the CABRI water loop test section, Water Reactor Fuel Performance Meeting 2005, Kyoto (2005).

141
PRESENT STATUS OF THE VERIFICATIONS AND MODEL DEVELOPMENT OF FEMAXI AND RANNS CODES IN JAEA
M. SUZUKI, Y. UDAGAWA, T. SUGIYAMA, F. NAGASE Fuel Safety Research Group Nuclear Safety Research Center, JAEA Ibaraki, Japan Email: [email protected]
Abstract
The FEMAXI code is for the fuel behaviour in normal operation and anticipated transient conditions, and the RANNS code is for the fuel behaviour in accident conditions, i.e. RIA and LOCA. FEMAXI-7 has incorporated such extensions as Restart function, a rate law model of grain boundary fission gas bubble growth, helium in fuel pellets, etc. Code validations are under way by using the Halden irradiation test data and by participation in the FUMEX-III benchmark. In the RANNS code, major emphasis is placed on the development and evaluation of such models as cladding surface heat transfer change, grain separation and burst release of fission gas, criteria of crack propagation in the PWR cladding, etc. In the NSRR experiments FK-1 and FK-2, a marked difference has been observed between calculated and measured values of axial elongation rates of pellet stack and cladding following the pulse power generation. To analyse the cause of this difference, some calculations were attempted in which hypothetical buffer element was introduced in the pellet stack geometry. 1. INTRODUCTION In JAEA, the FEMAXI-7 code [1–2] and the RANNS code [3] have been developed. The former is for the analysis of fuel behaviour in normal and anticipated transient conditions, and the latter is for the fuel behaviour in accident conditions. These two codes are used to experimental and exploratory analyses, and are in the process of validation and improvement of models with irradiation test data. In the present report, major features of models and functions of the latest versions are described, and the difference is discussed between calculated results by RANNS and observations in the NSRR experiments. 2. CURRENT STAGE OF THE CODE DEVELOPMENT 2.1. FEMAXI-7 The latest version is FEMAXI-7. Its code package will be released to domestic users shortly. The English version package will be released to the NEA Databank in 2012. 2.1.1. Major features of FEMAXI-7 in comparison with the former version FEMAXI-6
(i) Number of digitized ring elements of pellet stack and cladding has increased as shown in Fig. 1, which allows a precise calculation of high burnup fuel taking into account of the radial power density profile change with burnup.
(ii) New options have been incorporated with regard to the mechanical properties models of pellet and cladding, pellet swelling model, and model of FGR from high burnup structure, etc.
(iii) A restart function has been added. In base irradiation calculation, a full length (or long) rod is divided into several axial segments, and an offline file of calculated results with this rod can be taken over to the test irradiation calculation performed with short refabricated geometry, as shown in Fig. 2. Thus, restart calculation is performed [2].

142
(iv) A rate law model of grain boundary fission gas bubble growth has been implemented. This model is being assessed by the data such as those of high burnup rods tested at NSRR. This model allows us to evaluate the grain boundary inventory of fission gas, which leads to the prediction of burst gas release in RIA experiments.
(v) Model of helium infusion/effusion in fuel pellet has been added. In this model, prediction of amount of He generation is conducted by other independent burning analysis code, and the result is input to FEMAXI-7 to perform diffusion calculation.
(vi) A number of comments have been inserted in the source code to clarify the physical meanings of variables and calculation algorithm flows for an easy grasp, modification and improvement by users.
FIG. 2. Axial segmentation of the full-length rod and re-fabricated short test-rod.
Rod 1
Bottomm Plenum re-fabricated zone
115mm 115mm 116mm
Top:35mm Seg.#4 Seg.#3 Seg.#2
Seg.#4 Seg.#3 Seg.#2 Top:35mm
Rod 2
Bottom Plenum re-fabricated zone
138mm 139mm 139mm
0.0 0.2 0.4 0.6 0.8 1.0
ZrO2
1 2 3 4 5 6 7 8
Cladding
ring element
number:
Pellet stack: 36 equal-volume ring elements
Relative radius of pellet
Gap or Bonding layerCenterline
Relative power density
FIG. 1. Calculated cladding stress in bonding condition.

143
2.1.2. Helium model He production in high Pu content MOX fuel is not negligible at high burnup. Figure 3 shows an example calculation by ORIGEN2 of the amount of He generated by α-decay, tri-fission, and O(n, α) reaction of fuel which has initial Pu content of 5.9% and is irradiated to ~57 GW·d·t-1 HM. In UO2 fuel also, He infusion/effusion in pellet can change the content and pressure of internal gas significantly. In the He model, amount of He is given by input as a function of burnup, and diffusion inside the fuel pellet is calculated. Here, evaluation of the He infusion/effusion requires the assumption of boundary condition at solid–gas interface. That is, the equilibrium concentration of He atoms per unit volume of gas and solid at the solid–gas interface is indispensable. This condition would be a function of temperature and pressure etc., though a specific form of the function is unknown.
FIG. 4. Boundary condition at gas–solid interface.
Consequently at present, a tentative boundary condition is implemented as shown in Fig. 4 in which the concentrations at the boundary have no gap between gas phase and solid phase. He diffusion rate in fuel has been evaluated by several studies as shown in Fig. 5. In the model, Nakajima equation [4] is adopted as a representative one. Further quantification of the boundary condition will be done on the basis of the measured data of internal pressure change or on the gas contents data obtained by puncture tests.
0 500 1000 1500 2000 2500 30000.0
0.5
1.0
1.5
2.0
Storage
Irradiation
Total He generation
O(n, )reaction
-decay
He
(x
101
9 ato
ms/
cm3)
Time (days)
Tri-Fission
FIG. 3. Calculated amount of helium generation in MOX fuel.

144
2.1.3. Verification Verification of FEMAXI-7 is under way by using the Halden test irradiation data and by participating in the FUMEX-III benchmark [5], etc. In this process, we are seeking an optimum combination of parameters regulating model performances. The test cases for the verification are as follows:
Halden IFA-535:BWR type rod 809 and 810 [6]. Purpose of this experiment is to study He-pressure effect on FGR during power ramp. In the FEMAXI analysis, FGR during base irradiation and power ramp, and cladding elongation during the power ramp have been evaluated.
GE7 and II5 test rods [7]. GE7: BWR rod irradiated for 4 cycles in Quad Cities-1. II5: BWR rod irradiated in the Halden reactor. These rods were tested in Risø 3 power ramp experiments. PCMI, FGR and cladding diameter change have been evaluated during a stepwise power ramp test after base irradiation.
Halden IFA-629.1, Rod 1 Rod 2 (PWR-MOX) [2]. FGR and cladding elongation by PCMI during power ramp have been evaluated. Presented at Water Reactor Fuel Performance Meeting, Sept. 2011 in China. For Halden IFA-629.1, some details using the restart function are described below.
2.1.4. PCMI analysis of Halden IFA-629.1, Rod 1 In the analysis, the test rod has four axial segments as illustrated in Fig. 2 by “Rod 1”.
Fuel center temperatures in Rod 1. Calculated fuel center temperatures at the top segment having the thermocouple and at the other segments of Rod 1, together with the measured temperature are compared in Fig. 6. The difference between the calculation and measurement at the top segment is within a few tens of degrees, while in the latter period of irradiation the calculation tends to become higher than the other to some extent. This would be mainly due to the prediction uncertainty of gap thermal conductance.
Cladding elongation induced by PCMI. Calculated and measured cladding elongations are shown in Fig. 7. The elongation is generated by PCMI transmission of thermal expansion of pellet stack; though the cladding elongation will not be simply follow the elongation of pellet stack which is shown in Fig. 9.
Comparison of the two curves in Fig. 6 indicates that the calculated curve does not give a sufficiently large value of elongation in the initial power rise period around 23.5 GW·d·t-1
500 1000 1500 2000 25001E-22
1E-20
1E-18
1E-16
1E-14
1E-12
1E-10
Nakajima
Sung
Roudilthermal diffusion
He
diffu
sio
n co
nsta
nt (
m2 /s
)Temperature (K)
Xe by Turnbull in UO2
Ronchi
Guillert6x10-17
Rufeh
FIG. 5. Comparison of He diffusion constants in UO2 fuel.

145
MOX. After this transient, the calculated curve is approaching the measured value, but does not predict a fast fall of the measured trend around 24.3 GW·d·t-1 MOX and 24.5 GW·d·t-1 MOX. The difference at this fast fall remains throughout the rest of test irradiation period, i.e. the calculation holds a higher value by this difference, while the overall trend is predicted in a satisfactory manner.
These results indicate the followings: first, the initial power increase made the pellet stack thermal expansion, and as shown in Fig. 8, PCMI contact pressure increased at each segment, thus pulling up the cladding in the axial direction and simultaneously expanding the cladding outward in the radial direction. However, soon after this fast transient, creep straining of pellet mitigated axial elongation. This mitigation and resulted decrease in frictional force is considered to account for the fall of the measured data in the initial period in Fig. 7. On the other hand, the calculation predicts the mitigation of PCMI contact pressure (see Fig. 8) but underevaluates the resulted decrease in the cladding elongation (Fig. 7). The present PCMI model needs to be improved to properly express this “relaxation” effect which would be due to high temperature creep of pellet.
2.2. RANNS: Extensions and verification The main purpose of the RANNS code is to perform analysis of RIA experiments, while it has a capability of conducting the analysis of fuel behaviour in LOCA conditions. Currently, this code is under the following development and verification:
24 26 28 30 32 340
500
1000
1500
2000
MeasuredSeg.#2
Seg.#4 Seg.#3Top at TC
Fu
el c
en
ter
tem
pe
ratu
re (
C)
Average burnup (GWd/tMOX)
FIG. 6. Fuel center temperatures at four axial segments of rod 1 (test-irradiation).
24 26 28 30 32 340
10
20
30
Seg.#2
Seg.#3Top at TC
Seg.#4
PC
MI c
onta
ct p
ress
ure
(M
Pa)
Average burnup (GWd/tMOX)
FIG. 8. Calculated PCMI contact pressure of rod 1 (test-irradiation).
24 26 28 30 32 34-0.1
0.0
0.1
0.2
0.3
0.4
0.5
0.6
Measured
Cla
ddin
g a
xial
elo
ng
atio
n (
mm
)
Average burnup (GWd/tMOX)
Calculated
FIG. 7. Comparison of cladding elongationsof rod 1 (test-irradiation).
24 26 28 30 32 34-3
-2
-1
0
1
Pel
let s
tack
leng
th c
hang
e (
mm
)
Average burnup (GWd/tMOX)
FIG. 9. Calculated pellet stack axial elongation of rod 1 (test-irradiation).

146
1) During PCMI in which cladding is in a tensile stress state, a failure criterion is considered to be linked to the possibility of growth of incipient crack existing in the outer region of cladding. The J-integral evaluation in the crack tip region is ongoing to specify this criterion as an empirical correlation between the initial depth of crack and tensile stress.
2) A semi-empirical model is being developed for the cladding surface heat transfer to predict the onset of DNB and recovery to nucleate boiling.
3) Verification is ongoing as for the burst release of fission gas from grain boundary inventory as a result of grain separation during pulse power generation. Fission gas inventory is calculated by FEMAXI-7 and will be verified by using EPMA data. This inventory information is taken over to RANNS calculation as one of the initial conditions.
4) For LOCA within and beyond the framework of DBA conditions, an extension and enhancement of the RANNS models will start on the basis of the present capabilities. The analytical geometry is a single pin of both BWR-type and PWR-type. Parameters represented by materials properties required for the model design will be obtained from literatures available, and if not available, new experiments will be conducted to implement complementary data. In these processes, it is important to evaluate the priorities of parameters in terms of dominance in the phenomena.
5) Participating in the international benchmark of RIA analysis code [8], and performing the RIA experiments with PWR test rods.
6) Significant difference of axial elongations of pellet stack and cladding between calculation and measurement is discussed using the data of the NSRR experiments FK-1 in Section 3. This test and FK-2 test belong to the priority cases of the FUMEX-III benchmark [5].
0.20 0.25 0.30 0.35 0.400
200
400
600
800
TF2TF3
TF1
108
5
31
Surface
FK-1
Cla
ddin
g te
mpera
ture
(C
)
Time (s)
FIG. 11. Measured and calculated cladding temperatures of FK-1.
0.19 0.20 0.21 0.22 0.23 0.24 0.25
0
20
40
60
80
100
FK-2
Lin
ear
heat
rat
e (
MW
/m)
Time (s)
FK-1
FIG. 10. Pulse power in FK-1 and -2 at NSRR.
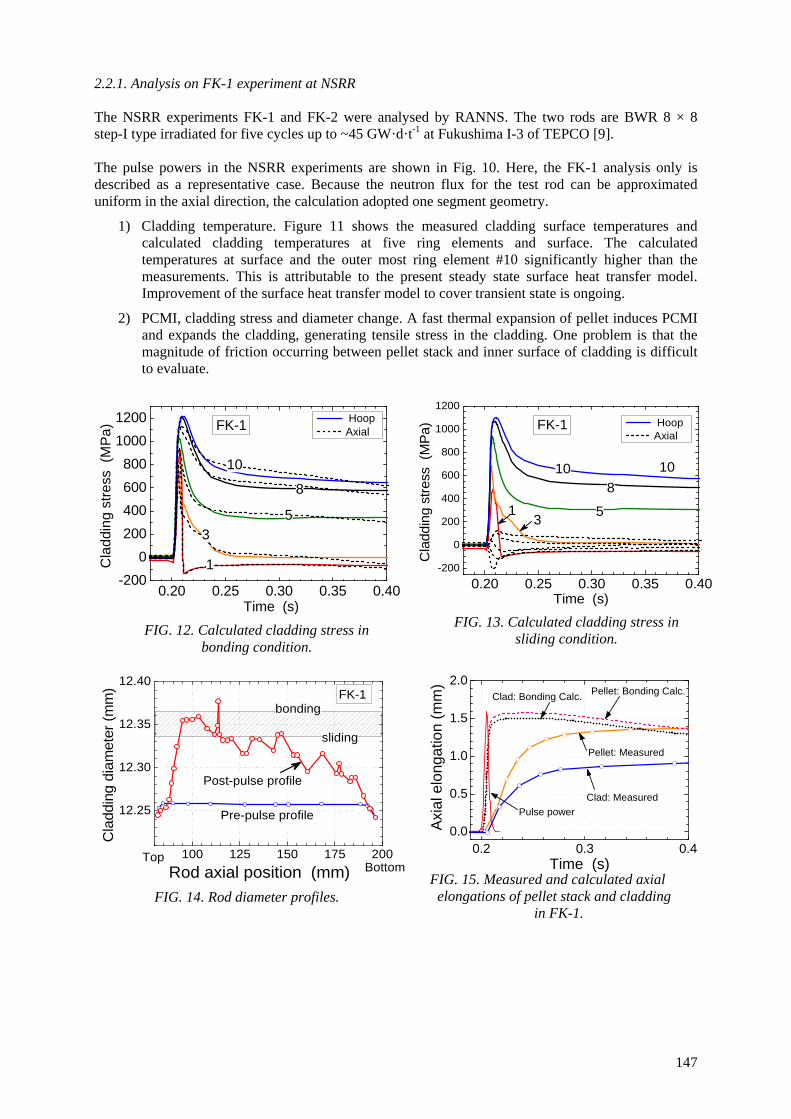
147
2.2.1. Analysis on FK-1 experiment at NSRR The NSRR experiments FK-1 and FK-2 were analysed by RANNS. The two rods are BWR 8 × 8 step-I type irradiated for five cycles up to ~45 GW·d·t-1 at Fukushima I-3 of TEPCO [9]. The pulse powers in the NSRR experiments are shown in Fig. 10. Here, the FK-1 analysis only is described as a representative case. Because the neutron flux for the test rod can be approximated uniform in the axial direction, the calculation adopted one segment geometry.
1) Cladding temperature. Figure 11 shows the measured cladding surface temperatures and calculated cladding temperatures at five ring elements and surface. The calculated temperatures at surface and the outer most ring element #10 significantly higher than the measurements. This is attributable to the present steady state surface heat transfer model. Improvement of the surface heat transfer model to cover transient state is ongoing.
2) PCMI, cladding stress and diameter change. A fast thermal expansion of pellet induces PCMI and expands the cladding, generating tensile stress in the cladding. One problem is that the magnitude of friction occurring between pellet stack and inner surface of cladding is difficult to evaluate.
100 125 150 175 200
12.25
12.30
12.35
12.40
Post-pulse profile
Cla
ddin
g d
iam
eter
(m
m)
Rod axial position (mm)
FK-1
TopBottom
Pre-pulse profile
bonding
sliding
FIG. 14. Rod diameter profiles. FIG. 15. Measured and calculated axial elongations of pellet stack and cladding
in FK-1.
0.2 0.3 0.40.0
0.5
1.0
1.5
2.0
Pulse power
Clad: Bonding Calc.
Clad: Measured
Pellet: Bonding Calc.
Axi
al e
long
atio
n (m
m)
Pellet: Measured
Time (s)
FIG. 13. Calculated cladding stress in sliding condition.
0.20 0.25 0.30 0.35 0.40-200
0
200
400
600
800
1000
1200
31 5
10
8
10
FK-1C
laddin
g s
tress
(M
Pa)
Time (s)
Hoop Axial
0.20 0.25 0.30 0.35 0.40-200
0
200
400
600
800
1000
1200 Hoop Axial
1
53
8
10
FK-1
Cla
ddin
g st
ress
(M
Pa
)
Time (s)
FIG. 12. Calculated cladding stress in bonding condition.

148
Consequently in the analysis, two extreme cases were conducted. One assumes almost bonding state, and the other sliding state with no friction. In the bonding state, the cladding hoop stress is almost identical to the axial stress, as shown in Fig. 12, while in the sliding state the axial stress is very low and even negative in the inner elements. Nevertheless, the hoop stresses are not largely different between the two cases. The hoop stress generates elastic and plastic strains at the stress peaking period of very early phase of the transient. However, only plastic strain remains in the post-test rod and thus diameter change can be measured by PIE. Figure 14 shows a comparison of rod diameters of pre-pulse and post-pulse states with calculated diameters. The calculated diameter is shown by two horizontal lines because of the one segment geometry. The calculated values are overestimated for about three fourths part of the rod length. This is mainly attributed to the cladding temperature overestimation, but partly to the stress–strain relationship model of cladding. In other words, cladding temperature prediction which is most associated with surface heat transfer model has a dominating role in calculating the plastic strain of cladding by PCMI. 3. RANNS MODEL FOR AXIAL ELONGATIONS OF ROD One of the findings which have been obtained in comparing the measured data and calculated results of axial elongation in FK-1 is that the measured elongation rate is markedly lower than that of the calculation. Considering that this implies one of the essential aspects of rod behaviour in the NSRR experiments, some analysis were conducted. 3.1. Comparison with RANNS calculation The measured and calculated axial elongations of pellet stack and cladding in the FK-1 experiment are shown in Fig. 15. The measured elongations increased gradually in a considerable retard of the calculated results. In other words, the calculation results in the instantaneous axial expansion of pellet stack on pulse power generation. This difference would be associated with the prediction of cladding stress state in PCMI. Accordingly, some calculations were attempted to reproduce the observed gradual increase. 3.2. Assumption of buffer effect of crack space
Irradiated pellets have a number of radial, circumferential, and transverse cracks. They are usually open when fuel pellets are cooled down to room temperature and shrunk. On pulse power generation, this crack space is anticipated to accommodate thermal expansion and be closed. In other words, this crack space would play a buffer effect to mitigate the elongation in the axial direction. 3.2.1. Buffer space model Model: To simulate the crack space in a pellet stack, a buffer element is added in the FEM geometry of pellet stack, as illustrated in Figs 16–17. This buffer element represents the summed space of cracks in the pellet stack. In calculation, this buffer space accommodates the pellet expansion, thus allowing the calculated elongation to be mitigated. The depth of this buffer element is set 1% (or a few percent at most) of the total stack length in one segment. Result: The results are shown in Fig. 18 which indicates comparison between the measured and calculated axial elongations of cladding, and in Fig. 19 which indicates a comparison as for the pellet stack. These calculated results are obtained with 1% buffer space element in both bonding condition and frictional condition.
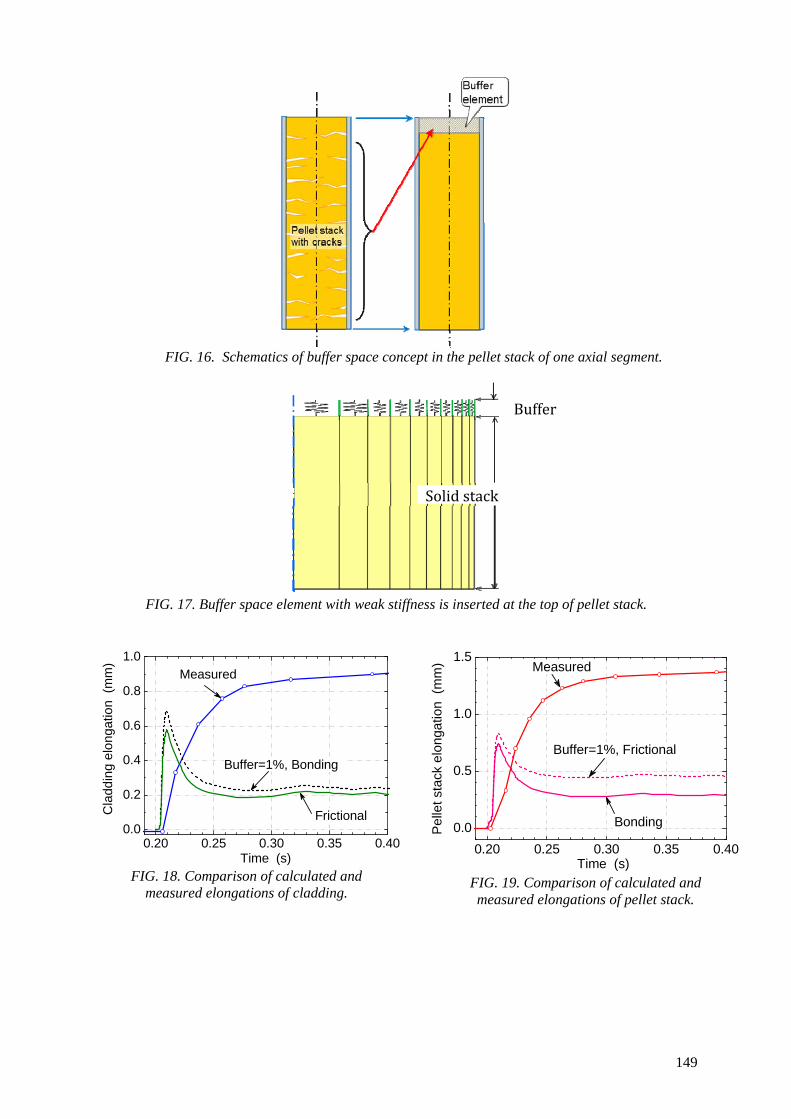
149
FIG. 16. Schematics of buffer space concept in the pellet stack of one axial segment.
FIG. 17. Buffer space element with weak stiffness is inserted at the top of pellet stack.
0.20 0.25 0.30 0.35 0.40
0.0
0.5
1.0
1.5
Buffer=1%, Frictional
Bonding
Buffer model 1
Measured
Pel
let s
tack
elo
ngat
ion
(m
m)
Time (s)
FIG. 19. Comparison of calculated and measured elongations of pellet stack.
0.20 0.25 0.30 0.35 0.400.0
0.2
0.4
0.6
0.8
1.0
Frictional
Buffer=1%, Bonding
Cla
ddin
g el
ong
atio
n (
mm
)
Time (s)
Measured
FIG. 18. Comparison of calculated and measured elongations of cladding.
BufferSolid stack

150
It is clear that this buffer model decreases the peak value of the calculated axial elongation. Nevertheless, the rate of elongation which starts to rise at the instant of pulse power generation does not significantly become lower, and the model reproduces neither the measured rate nor peak value. Also, it was found that a thicker buffer element (a few percent) can increase the mitigation effect on the elongation to some extent, though at the same time the elongation magnitude itself becomes much lower than the measured value, which is unreasonable. The above results suggest that it is necessary to address the study to another point of view. 3.2.2. Characteristics of the displacement sensing system Structures of the FK test rod and elongation sensing system are shown in Fig. 20 [9]. Here, consideration is oriented to the measurement delay which is induced by mechanical and/or electric characteristics of sensor and signal processing system. However, neither investigation nor quantification of these factors has been conducted. They are the tasks remaining.
FIG. 20. Internal structure of elongation sensing system of the FK rod.
3.3. Discussion 3.3.1. Elongation rate The above calculations reveal that a simple assumption that crack space accommodates thermal expansion of pellet stack cannot reproduce the measured elongation rate. Differently, because the rod deformation occurs in a very short period, a “dynamic model” is required to extend the predictability to cover such effects as visco-elasticity of high temperature pellet and inertial effects of rod structures. RANNS has creep models for pellet and cladding, though they are only applicable to deformation with much longer duration than the PCMI in RIA experiments. They are not a “dynamic model” which takes into account the inertial effect. Also development of the “dynamic model” would need a careful consideration.
FIG. 21. Comparison of ratio of maximum cladding elongation to maximum pellet stack elongation between measurement and calculation.

151
3.3.2. Tensile stress state of cladding in PCMI The retarded rate of the measured trend implies the followings: the tensile stress in the cladding during PCMI is not the nearly isotropic bi-axial stress that is often predicted by RANNS in bonding condition, but the stress state in which axial stress is significantly lower than the hoop stress. This consideration is consistent with the observations of longitudinal rupture of cladding in many PCMI failures in the NSRR experiments. The measured ratios of elongation of cladding to that of pellet stack, as an index of the tensile stress state in the cladding, are scattered but centred at ~0.9 in the high burnup PWR fuel in Fig. 21 [2], which suggests that in many cases the pellet stack and cladding are displaced differently in the axial direction. In the BWR fuel experiments, this ratio would be less than that of PWR fuel because some P-C gap is likely to remain at pre-test state, which would allow frictional sliding to occur to some extent between pellet stack and cladding during PCMI. However, the RANNS model gives either a strong friction between the high burnup pellet stack and cladding or generation of clogging state if the bonding layer formation is assumed. A natural consequent of this is that the ratio of axial elongation becomes always nearly 1.0, as typically seen in high burnup PWR rods in Fig. 21. In the model, tensile stresses generated in the cladding in both the radial and axial directions are identical on pulse power, i.e. the cladding is subjected to a nearly isotropic bi-axial stress state. However, this type of bi-axial stress state should have brought about not only the “longitudinal fracture” but also “transverse fracture” from one rod to another in PCMI failure cases. Contrarily in the NSRR experiments, no such “transverse type” of failure has been observed. In more detail, the “longitudinal fracture” dominates in the cladding with only partially transverse fracture, if any. This implies that the elongation reacts at a sluggish pace in retard of the instantaneous radial expansion of pellet. As a result, the cladding axial stress becomes significantly lower than the hoop stress. Therefore, in the PCMI analysis by RANNS hereafter, rather than the nearly isotopic bi-axial stress state, the actual stress state would be more appropriately set by assuming the frictional slide between pellet stack and cladding to reduce the axial stress. An evaluation of a realistic ratio of axial stress to hoop stress is an issue to be challenged in the future. 4. CONCLUDING SUMMARY Current development stage and features of models of fuel analysis codes FEMAXI-7 and RANNS are described. Further, concerning the axial elongation of fuel rod in the NSRR experiments, a comparative analysis was performed with respect to the difference of calculated and measured axial elongations. The results imply that in the actual rod a “dynamic phenomena” is caused by time dependent mechanical behaviour, and could account for the longitudinal fracture of cladding in PCMI.
REFERENCES
[1] SUZUKI, M., JAEA-Data/Code 2010–035, Japan Atomic Energy Agency (2011) [in Japanese]. [2] SUZUKI, M., NAGASE, F., Code analysis on transient behaviour of LWR MOX fuel during
the test irradiation in Halden reactor, Proceedings of 2011 Water Reactor Fuel Performance Meeting, Chengdu (2011).
[3] UDAGAWA, Y., SUGIYAMA, T., SUZUKI, M., FUKETA, T., Cladding stress biaxiality in reactivity initiated accident conditions, Proc. of the 2008 Water Reactor Fuel Performance Meeting, Seoul (2008).
[4] NAKAJIMA, K., SERIZAWA, H., SHIRASU, N., et al., Mass spectrometric study on helium release behaviours from UO2 and MOX, Proceedings of GLOBAL 2011 Meeting, Makuhari (2011).

152
[5] KILLEEN, J., http://www.iaea.org/NuclearPower/Downloads/Technology/meetings/2010 -July-TWG-LWR-HWR/05.Fuel.Killeen.pdf, IAEA, Vienna (2010).
[6] HANAWA, S., OHGIYANAGI, J., SUZUKI, M., Verification of FEMAXI-7 code by using irradiation test in Halden reactor for He-pressurization effect on FGR of BWR fuels under power transient, Nucl. Sci. and Technol 49 (5) (2012) 516–525.
[7] OHGIYANAGI, J., HANAWA, S., SUZUKI, M., NAGASE, F., FEMAXI-7 Analysis on Behaviour of Medium and High Burnup BWR Fuels during Base-Irradiation and Power Ramp, Nucl. Eng. Design 253 (2012) 77–85.
[8] UDAGAWA, Y., WGFS RIA fuel code benchmark results from RANNS code calculation, Working Group on Fuel Safety, OECD, Paris (2011).
[9] SUGIYAMA, T., NAKAMURA, T., KUSAGAYA, K., et al., Behaviour of irradiated BWR fuel under reactivity initiated accident conditions — results of test FK-1, -2 and -3, JAERI-Research 2003-033, Seoul (2004).

153
RCCA EJECTION FAULT STUDIES: APPLICATION OF A BURNUP THRESHOLD FOR THE EVALUATION OF THE RADIOLOGICAL RELEASES
Y. UDAGAWA, T. SUGIYAMA, M. SUZUKI, F. NAGASE Fuel Safety Research Group Nuclear Safety Research Center, JAEA Ibaraki, Japan Email: [email protected]
Abstract
In PCMI failure of high burnup PWR fuel claddings under RIA conditions, small cracks are generated in the accumulated hydride clusters, called “hydride rim,” one of these cracks penetrates inward, and it finally causes the through-wall crack. On the basis of such understanding, we performed an extensive evaluation of the fracture parameter J-integral for as many high burnup PWR fuel tests in the NSRR experiment database as possible in order to treat all the PCMI failure cases comprehensively and discuss effects of temperature and hydrogen content on PCMI failure limit. The evaluated critical J values were well correlated with both hydrogen content and crack tip temperature and thus we have designed a tentative PCMI failure criterion with critical J values as an analytical function of cladding average hydrogen content and crack tip temperature. 1. INTRODUCTION The Japan Atomic Energy Agency (JAEA) has conducted experimental and analytical studies of light water reactor (LWR) fuel behaviour under a reactivity initiated accident (RIA) using the Nuclear Safety Research Reactor (NSRR). Previous studies showed that failure of high burnup fuels in RIA can occur even at low fuel enthalpies due to pellet cladding mechanical interaction (PCMI) loading on embrittled cladding [1–6]. Cladding embrittlement is attributed to hydride precipitation in the cladding periphery. In claddings of high burnup pressurized water reactor (PWR) fuel, circumferentially oriented hydride clusters precipitate and they tend to accumulate in the cladding periphery. We have understood that small cracks are generated in the accumulated hydride clusters, called “hydride rim,” in the initial stage of an RIA under rather low stress and strain conditions, one of these cracks penetrates inward, and it finally cause the through-wall crack. Such understanding is supported by the PIE results of the high burnup PWR fuel tests and some separate effect tests in the NSRR [7–8]. Recently we performed an extensive evaluation of the stress intensity factor KI for the high burnup PWR fuel tests in the NSRR as the first step of fracture mechanics approach [9]. KI was considered to be a valid parameter to quantify PCMI failure threshold for elastic fracture cases in which fuels had failure with negligible plastic deformation. Because KI is a linear-elastic fracture mechanics parameter, it cannot be applied to several important test cases in which fuels had failure after certain plastic deformation. It is considered worth extending the fracture mechanics approach to those plastic fracture cases because the failure limit in those cases could be well correlated with the crack depth represented by the hydride rim thickness. In the present work, instead of KI, we try to evaluate J-integral for as many high burnup PWR fuel tests as possible in order to treat all the available failure cases in the NSRR experiment database comprehensively. J-integral is a fracture parameter applicable to crack tip stress-strain fields under even fully plastic conditions. With such a general failure index, we discuss effects of other important parameters as temperature and hydrogen content on PCMI failure limit and propose a tentative PCMI failure criterion under RIA conditions for high burnup PWR fuels based on the NSRR experiment database.

154
2. J-INTEGRAL EVALUATION 2.1. Fuel behaviour analysis with RANNS code 2.2.1. Analysed test cases At present, the NSRR experiment database covers a variety of specifications and conditions of irradiated PWR fuels. The burnup ranges from 39–77 GW·d·t-1, the assembly types include 14×14 and 17×17, and the cladding materials include Zircaloy-4, low-tin Zircaloy-4, ZIRLOTM, MDA, NDA, and M5TM. The present work does not cover all the high burnup PWR fuel experiments conducted in the NSRR for some reasons, which are explained below. Table 1 show the main specifications of the NSRR experiments discussed in this paper [1–6]. TABLE 1. TEST CONDITIONS AND ANALYSIS RESULTS
Test ID
HBO-1 TK-2 OI-10 OI-11 BZ-1 BZ-2 BZ-3
Rod burnup [GW·d·t-1] 50 48 60 58 48 59 48
Cladding material low-tin Zry-4
low-tin Zry-4
MDA ZIRLO low-tin Zry-4
low-tin Zry-4
low-tin Zry-4
Test type [RT/HT] a) RT RT RT RT RT RT HT
Incipient crack depth [μm] 72 91 54 54 70 50 ←
Max. fuel enthalpy [J·g-1] 518 683 425 645 677 582 593
J-max b) [MPa m1/2] failure failure 7.1 failure failure failure 8.5
J-failure b) [MPa m1/2] 7.0 7.8 no
failure 7.4 5.5 6.9
no failure
Test ID
RH-1 RH-2 VA-1 VA-2 VA-3 VA-4
Rod burnup [GW·d·t-1] 67 67 71 77 71 77
Cladding material M5 M5 ZIRLO MDA ZIRLO MDA
Test type [RT/HT] a) RT HT RT RT HT HT
Incipient crack depth [μm] 15 ← 104 83 120 69
Max. fuel enthalpy [J·g-1] 452 434 545 535 515 512
J-max b) [MPa m1/2] 3.1 1.2 failure failure failure 9.9
J-failure b) [MPa m1/2] no
failure no
failure 4.1 1.7 11.7
no failure
a) RT: room temperature test, HT: high temperature test b) J-max and J-failure are the evaluated J-integral values at the maximum fuel enthalpy during
the pulse irradiation and at the fuel failure instant, respectively.
The incipient crack depth values in Table 1 were evaluated by observation of cladding metallographs in the same manner as that explained in the previous study [9]. Since the solubility limit of hydride exponentially increases with temperature, hydride clusters in the claddings dissolve and hydrogen disperses rapidly when the test fuel rod experiences high temperature. In such claddings, it is no longer possible to know the distribution of the hydride clusters, which is necessary to decide incipient crack depth. Hence, the cases in which departure from nucleate boiling (DNB) occurred were basically excluded from the present analysis. The tests RH-2 and BZ-3, which are both DNB cases, were

155
exceptionally included by using the incipient crack depth values of RH-1 and BZ-2, respectively, because high temperature (HT) test data is so far not sufficient. Mass analysis data is necessary for precisely evaluating energy deposition in high burnup test fuel rods during pulse irradiation [9]. Because energy deposition is one of the decisive factors in evaluating J-integral as well as incipient crack depth, the cases without heavy metal isotope compositions data by mass analysis were basically excluded from the present analysis, too. For the test TK-2, the result of recently conducted mass analysis was used because it agrees much better with prediction by our burnup analysis with ORLIBJ32 library [10] than the previous evaluation. Although mass analysis data is not available in the test HBO-1, it is an important failure case because the lower limit KI value was obtained in the previous study [9] and the above mentioned ORLIBJ32 library seems reliable in this burnup range. Hence the test HBO-1 was included tentatively with energy deposition evaluated by the burnup analysis with ORLIBJ32. 2.2.2. RANNS calculation The RANNS code was used for analysis of the behaviours of a single fuel rod under pulse irradiation conditions [11]. The code gives a coupled solution of one dimensional FEM mechanical analysis and thermal analysis in the radial direction. The pellet stack of the analysed rods were treated only as one axial segment since the axial length is small and the axial power profile during the pulse irradiation experiments is nearly uniform. In the radial direction, the fuel pellet and cladding were divided into 36 and 11 concentric ring elements, respectively, both in mechanical and thermal analysis. The two outermost ring elements, one innermost ring element, and the remaining eight ring elements correspond to the outer surface oxide layer, the inner surface oxide layer, and the metallic wall, respectively. The pre-pulse fuel rod geometry as pellet–cladding gap was determined based on the measured cladding diameter profile and oxide layer thickness [1–6] using the FEMAXI-7 code, which analyses the high burnup fuel behaviours under normal operation conditions [12]. Calculation by FEMAXI-7 for irradiation in the PWR plant was performed along approximate power histories for each test fuel rod. In the calculation, the length of the pellet stack was set to be identical to that of the test fuel rod for the pulse irradiation test. Cladding oxidation rate was adjusted so that the oxide layer thickness at EOL agrees with the PIE data. Also, fuel pellet swelling rate was adjusted so that the cladding diameter at EOL agrees with the PIE data. Consequently, the FEMAXI-7 calculation result reproduced the PIE result in each test case. The EOL fuel state determined by these adjusted calculation was employed as the initial condition for the RANNS calculation. The linear heat rate history during pulse irradiation was evaluated for each experiment based on the NSRR power history measured with neutron detectors and coupling factor, the ratio of the energy generated in unit mass of a test fuel to the total reactor power of the NSRR. As described in Section 2.2.1, the coupling factor was evaluated by using the mass analysis data except the test HBO-1. The MATPRO-11 [13] and MATPRO-A [14] model were adopted for pellet specific heat and pellet thermal expansion rate, respectively. The MATPRO-09 [15] model was adopted for cladding specific heat and thermal conductivity. Pellet mechanical behaviour was assumed rigid. Perfect thermal contact was assumed between pellet and cladding when gap is closed under PCMI loading. Because the output items which RANNS provides for the subsequent J-integral evaluation, described below, were only temperature evolution at the crack tip and increase of cladding inner radius during pulse irradiation, selection of other fundamental models as cladding plasticity model and pellet–cladding mechanical bonding was not significant in the present RANNS calculation. Table 1 shows the maximum fuel enthalpy values calculated by RANNS, in which heat removal from the pellet to the coolant through the cladding wall was taken into account. The values of the test HBO-1 and TK-2 show significant increase from the previous evaluations [9]. Figure 1 shows relation between cladding inner radius increase and crack tip temperature during pulse irradiation in each test
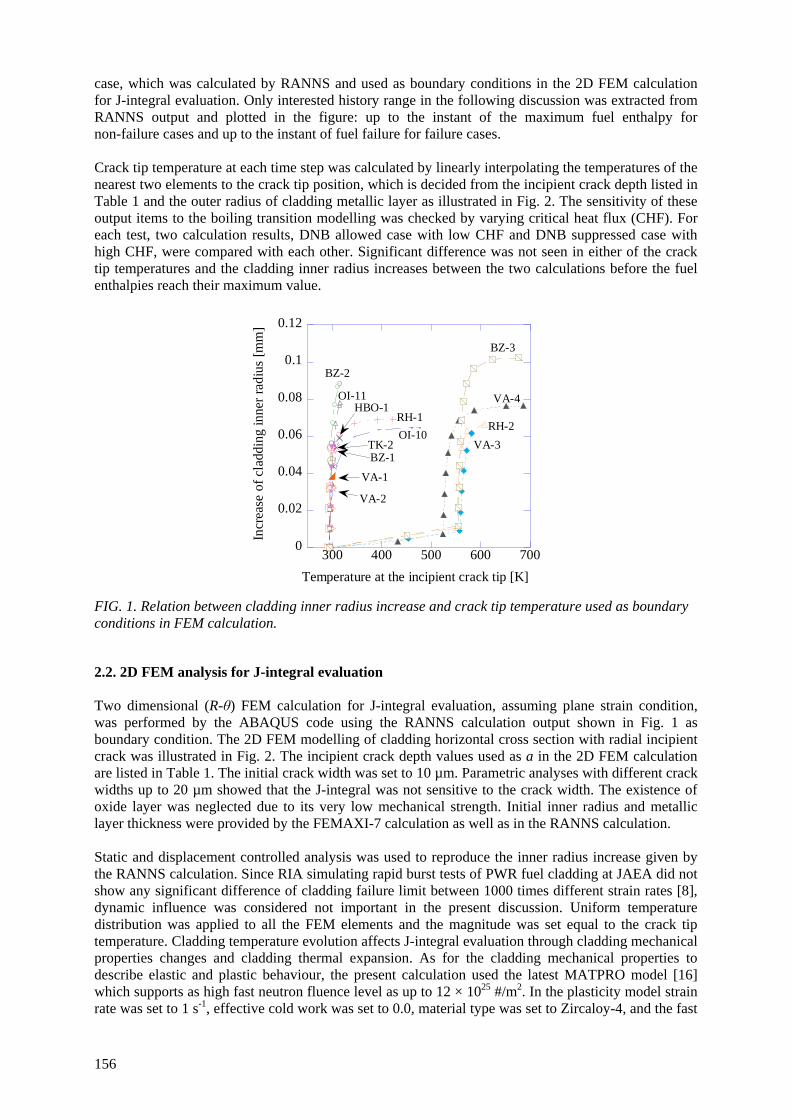
156
case, which was calculated by RANNS and used as boundary conditions in the 2D FEM calculation for J-integral evaluation. Only interested history range in the following discussion was extracted from RANNS output and plotted in the figure: up to the instant of the maximum fuel enthalpy for non-failure cases and up to the instant of fuel failure for failure cases. Crack tip temperature at each time step was calculated by linearly interpolating the temperatures of the nearest two elements to the crack tip position, which is decided from the incipient crack depth listed in Table 1 and the outer radius of cladding metallic layer as illustrated in Fig. 2. The sensitivity of these output items to the boiling transition modelling was checked by varying critical heat flux (CHF). For each test, two calculation results, DNB allowed case with low CHF and DNB suppressed case with high CHF, were compared with each other. Significant difference was not seen in either of the crack tip temperatures and the cladding inner radius increases between the two calculations before the fuel enthalpies reach their maximum value.
FIG. 1. Relation between cladding inner radius increase and crack tip temperature used as boundary conditions in FEM calculation. 2.2. 2D FEM analysis for J-integral evaluation Two dimensional (R-θ) FEM calculation for J-integral evaluation, assuming plane strain condition, was performed by the ABAQUS code using the RANNS calculation output shown in Fig. 1 as boundary condition. The 2D FEM modelling of cladding horizontal cross section with radial incipient crack was illustrated in Fig. 2. The incipient crack depth values used as a in the 2D FEM calculation are listed in Table 1. The initial crack width was set to 10 µm. Parametric analyses with different crack widths up to 20 µm showed that the J-integral was not sensitive to the crack width. The existence of oxide layer was neglected due to its very low mechanical strength. Initial inner radius and metallic layer thickness were provided by the FEMAXI-7 calculation as well as in the RANNS calculation. Static and displacement controlled analysis was used to reproduce the inner radius increase given by the RANNS calculation. Since RIA simulating rapid burst tests of PWR fuel cladding at JAEA did not show any significant difference of cladding failure limit between 1000 times different strain rates [8], dynamic influence was considered not important in the present discussion. Uniform temperature distribution was applied to all the FEM elements and the magnitude was set equal to the crack tip temperature. Cladding temperature evolution affects J-integral evaluation through cladding mechanical properties changes and cladding thermal expansion. As for the cladding mechanical properties to describe elastic and plastic behaviour, the present calculation used the latest MATPRO model [16] which supports as high fast neutron fluence level as up to 12 × 1025 #/m2. In the plasticity model strain rate was set to 1 s-1, effective cold work was set to 0.0, material type was set to Zircaloy-4, and the fast
0
0.02
0.04
0.06
0.08
0.1
0.12
300 400 500 600 700
Incr
ease
of
clad
ding
inne
r ra
dius
[m
m]
TK-2
Temperature at the incipient crack tip [K]
OI-10
HBO-1RH-1
RH-2
VA-1
VA-2
VA-3
VA-4
BZ-3
BZ-2
BZ-1
OI-11

157
neutron fluence was set according to the FEMAXI-7 calculation result. Cladding thermal expansion was taken into account with the MATPRO-A model only in horizontal direction; axial thermal expansion was neglected to keep plane strain condition.
FIG. 2. 2D FEM modelling of cladding horizontal cross section with incipient crack for J-integral evaluation.
FIG. 3. Calculated J-integral as a function of crack tip temperature.
Figure 3 shows traces of the calculated J-integral with the crack tip temperature evolution. The J-integral values at the maximum fuel enthalpy and at the fuel failure instant are summarized in Table 1 as J-max and J-failure, respectively. Due to the rapid transient of the NSRR test, all the failure cases have failure before the crack tip temperature rises significantly from the initial condition. So the obtained J values are divided into two groups by temperature: seven critical J-integral values for room temperature (RT) condition and one for HT condition. For RT condition, there is large scatter in the critical J values. In addition J value of the non-failure case OI-10 significantly exceeds the critical J value of the failure case VA-2. For HT condition, the critical J value of the failure case VA-3 exceeds all the other J values of non-failure cases.
Incipient crack depth a
Semicircle crack
Crack width Crack tip
Outer surface of metallic layer
Finite element mesh around crack tip
Metallic layer thickness
Initial inner
Cladding
Inner radius increase dR

158
3. DISCUSSON The large scatter in the critical J values and the overlap of J values between failure cases and non-failure cases, seen in RH condition, have implied that the intrinsic error involved in the present J-integral evaluation, especially in the process of the incipient crack depth evaluation, might be so large, as pointed in previous studies [9, 17], that it’s not suitable for quantifying PCMI failure limit. The other possible interpretation is that critical J value is not only the function of temperature. Relation between the critical J value and average hydrogen content in cladding, plotted in Fig. 3, clearly supports the latter interpretation. In the figure, there seems significant negative correlation between the critical J and average hydrogen content. The average hydrogen content is, of course, not considered a parameter essentially linked to the critical J values. In all the test cases analysed here, hydride rim is formed in cladding periphery and so hydrogen is highly concentrated in cladding periphery. In addition the onset of ductile shear fracture, leading to through-wall crack, should be governed by the resistance of the crack tip region to crack propagation. Hence, the tendency shown in Fig. 3 should be interpreted that it reflects dependency of critical J value on local hydrogen concentration around the crack tip. Cladding with large hydrogen content tends to have large local hydrogen content at the incipient crack tip [8] and, as a result, the test case with large hydrogen content resulted in relatively small critical J value. The present analysis result indicates that hydride rim thickness is not enough to fully take into account hydrogen influence on PCMI failure limit for high burnup PWR fuels, and suggests that the effect of the local hydrogen content around the crack tip should be considered.
FIG. 3. Calculated J-integral as a function of crack tip temperature evolution.
The J-integral evaluation results and the discussion above allow us to design a tentative PCMI failure criterion under RIA conditions for high burnup PWR fuels. The critical J values were fitted to an analytical function of cladding average hydrogen content and crack tip temperature as shown in Fig. 4 In the figure, Jc, H, and T represent critical J value, average hydrogen content, and crack tip temperature, respectively. As discussed above, the average hydrogen content is a parameter to represent the magnitude of local hydrogen content at the incipient crack tip. Positive correlation between them was assumed.
0
2
4
6
8
10
200 400 600 800
J-in
tegr
al [
kN/m
]
TK-2
Hydrogen content [wtppm]
OI-11
VA-1
VA-2
BZ-2
BZ-1
HBO-1

159
FIG. 4. PCMI failure criterion based on the fracture mechanics analysis of the NSRR high burnup PWR fuel tests. So far only the test VA-3, which is categorized into a large hydrogen content case, provides the basis of such failure limit for HT condition. Although the critical J value for HT condition with low hydrogen content is expected to be higher than that of the test VA-3, such failure limit data has not been obtained in the previous NSRR tests for high burnup PWR fuels. At present, the results of RIA simulating rapid burst tests of PWR fuel cladding with artificial hydride rim [8] were also taken into consideration. The lower limit of critical J-integral value preliminarily evaluated for the burst test was about 20 kN·m-1 for HT condition. Hence, a data point (H, T, Jc) = (0, 600, 20) was fitted together with the high burnup fuel test results. The J-integral evolutions in the non-failure cases OI-10 and VA-4 also helped to define the analytical function for the data scarce (H, T) range. For failure prediction by fuel performance code as RANNS, hydride rim thickness needs to be estimated from known parameters. A function which correlates hydride rim thickness and cladding average hydrogen content will be designed and implemented in RANNS code. Besides a subroutine which calculates J-integral for a given cladding geometry and incipient crack depth is currently under development on the basis of ABAQUS calculation results. They complete the PCMI failure prediction by the FEMAXI/RANNS code system, which enables quantitative discussion of the sensitivity of failure limit to initial temperature and power pulse width. 4. CONCLUSIONS In the present work we have evaluated J-integral for as many high burnup PWR fuel tests as possible in order to treat all the PCMI failure cases in the NSRR experiment database comprehensively. The evaluated critical J values increased with increasing temperature and decreased with increasing cladding average hydrogen content. The latter tendency indicates that hydride rim thickness is not enough to fully take into account hydrogen influence on PCMI failure limit, and the effect of the local hydrogen content around the crack tip should be considered. On the assumption that there is a positive correlation between average and crack tip hydrogen content, we have designed a tentative PCMI failure criterion based on the NSRR experiment database, with critical J values for high burnup PWR fuels as an analytical function of cladding average hydrogen content and crack tip temperature.
ACKNOWLEDGEMENTS
The tests HBO-1, OI-10, OI-11, BZ-1, BZ-2, BZ-3, VA-1, VA-2, VA-3, and VA-4 have been performed as collaboration programs with Mitsubishi Heavy Industries, Ltd. and the tests TK-2 with Nuclear Fuel Industries, Ltd. The tests BZ-1, BZ-2, BZ-3, RH-1, RH-2, VA-1, VA-2, VA-3, and VA-4 and their analyses have been conducted as part of a contract program sponsored and organized by the
300600
600400
200
30
20
10
Jc [kN/m]
H [wtppm]: Hydrogen content
T [K]:Temperature
VA-4
VA-3
Lower limit of separate-effect test results
OI-10

160
Nuclear and Industrial Safety Agency, Ministry of Economy, Trade and Industry. The authors are indebted to the engineers, technicians, and researchers in JAEA working on the NSRR experiments.
REFERENCES
[1] FUKETA, T., et al., Behaviour of high burnup PWR fuel under a simulated RIA conditions in the NSRR, Proc. CSNI Specialist Mtg. on Transient Behaviour of High burnup Fuel, Cadarache, NEA/CSNI/R(95)22, (1996) 59–85.
[2] FUKETA, T., et al., Behaviour of high burnup PWR fuels with low-tin Zircaloy-4 cladding under reactivity initiated accident conditions, Nuclear Technology 133 (1) (2001) 50–62.
[3] FUKETA, T., et al., Behaviour of 60–78 MW·d·kg-1U PWR fuels under reactivity initiated accident conditions, J. Nucl. Sci. Technol. 43 (2006) 1080.
[4] SUGIYAMA, T., et al., Failure of high burnup fuels under reactivity initiated accident conditions, Ann. Nucl. Energy 36 (2009) 380–385.
[5] SUGIYAMA, T., et al., Evaluation of initial temperature effect on transient fuel behaviour under simulated reactivity initiated accident conditions, J. Nucl. Sci. Technol. 47 (2010) 439–448.
[6] FUKETA, T., et al., Behaviour of high burnup LWR fuels during design basis accidents; key observations and an outline of the coming program, Proc. 2010 LWR Fuel Performance Meeting, Orlando (2010) 244.
[7] TOMIYASU, K., et al., Influence of cladding-peripheral hydride on mechanical fuel failure under reactivity initiated accident conditions, J. Nucl. Sci. Technol. 44 (2007) 733.
[8] NAGASE, F., et al., Investigation of hydride rim effect on failure of Zircaloy-4 cladding with tube burst test, J. Nucl. Sci. Technol. 42 (2005) 58–65.
[9] UDAGAWA, Y., et al., stress intensity factor at the tip of cladding incipient crack in RIA simulating experiments for high burnup PWR fuels, J. Nucl. Sci. Technol. 46 (2009) 1012–1021.
[10] SUYAMA, K., et al., Libraries based on JENDL-3.2 for ORIGEN2 code: ORLIBJ32, JAERI-Data/Code 99-003 (1999).
[11] SUZUKI, M., et al., Analysis of pellet–clad mechanical interaction process of high burnup PWR fuel rods by RANNS code in reactivity initiated accident conditions, Nucl. Technol. 155 (2006) 282–292.
[12] SUZUKI, M., et al., Light Water Reactor Fuel Analysis Code FEMAXI-7; Model and Structure, JAEA-Data/Code 2010–035 (2010).
[13] Hargman, D., L., et al., MATPRO-VERSION 11: A Handbook of Materials Properties for Use in the Analysis of Light Water Reactor Fuel Rod Behaviour, NUREG/CR-0497 (1981).
[14] SIEFKEN, L.J., et al., SCDAP/RELAP5/MOD3. 3 Code Manual: MATPRO--A Library of Material Properties for LightWater Reactor Accident Analysis, NUREG/CR-6150 (2001).
[15] MACDONALD, P., E., et al., MATPRO: Version 09. A handbook of Materials Properties for Use in the Analysis of Light Water Reactor Fuel Rod Behaviour, TREE-NUREG-1005 (1976).
[16] GEELHOOD, K., J., et al., FRAPTRAN 1.4: A Computer Code for the Transient Analysis of Oxide Fuel Rods, NUREG/CR-7023 (2011).
[17] GEORGENTHUM, V., et al., Fracture mechanics approach for failure mode analysis in Cabri and NSRR RIA tests, Proc. 2008 LWR Fuel Performance Meeting, Seoul (2008).

LOCA R&D (Session 4)
Chairpersons
G. HORHOIANU (INR)
H. FUJII
(MNF)

163
LOCA: AN OPERATOR’S VIEW ON GERMAN LICENSING PRACTICE
A. WENSAUER EON Hannover, Germany Email: [email protected]
Abstract
E.ON Kernkraft GmbH (EKK) operates five PWRs and one BWR in Germany and three BWRs in Sweden and is a subsidiary of the E.ON AG, Germany’s largest supplier for electricity and gas. The present paper focuses on the analysis of a hypothetical loss of coolant accident (LOCA) in a PWR which plays an important role in the licensing process of German PWRs. The LOCA safety criteria which are defined in the guidelines of the German Reactor Safety Commission (RSC) are comparable to those of many other countries. According to RSC it must be guaranteed by the emergency core cooling system (ECCS) that: (1) The calculated peak cladding temperature (PCT) is less or equal 1200°C; (2) The calculated oxidation of the cladding is less or equal 17% of the actual cladding wall thickness at any position; (3) Less or equal 1% of the total amount of zirconium contained in the cladding reacts in the zirconium–water reaction; (4) The release of fission products due to fuel rod failure is limited, i.e. the fraction of failed rods in the core is less or equal 10% (explicitly treated in Germany and Finland only); (5) There are no changes in the geometry of the reactor core which prevent a sufficient cooling of the core. Based on the above list the licensing documents for LOCA are characterized as: Hot rod analysis proofing compliance with the embrittlement criteria 1 and 2 (which are supposed to contribute to coolability of the core) and criterion 3; Failure rate analysis limiting the release of fission products due to radiological considerations (criterion 4). According to the German licensing practice the treatment of the LOCA has been continuously adapted to the state-of-the art of science and technology. In particular it is remarkable that new developments in the fields of nuclear core design and fuel rod design were the drivers for most of the latest improvements in LOCA licensing process. The first part of this paper reviews how the following changes of the last years, i.e. effect of high enrichments and MOX fuel on the pre-LOCA power distribution and effect of burnup degradation of fuel thermal conductivity, were successfully and consistently incorporated into the existing licensing approach and, thus, justify the current methodology. However, burnup effects will not be limited to fuel properties but also affect the cladding condition. Hydrogen pick-up from cladding corrosion under normal operating conditions increases the oxygen embrittlement of the cladding due to high temperature oxidation during the LOCA transient. This is one of the aspects which gained a lot of attention in the context of the ongoing international discussion on new LOCA criteria. Beyond the impact of hydrogen on the cladding embrittlement during the high temperature oxidation phase there is an additional effect on the creep burst behaviour of rods during the heat-up phase of the LOCA transient. Hydrogen can decrease the hold times until rod failures occur and, thus, may have impact on the number of burst rods. Moreover, it is expected that all these effects strongly depend on material specific cladding properties. The last part of this paper points out how EKK is going to treat these new aspects in future licensing and what requirements have to be fulfilled by the vendors 1. INTRODUCTION E.ON Kernkraft GmbH (EKK) operates five 1300 MW-Siemens-PWRs:
Unterweser (KKU);
Grafenrheinfeld (KKG);
Grohnde (KWG);
Brokdorf (KBR);
Isar-2 (KKI-2).
Also they operate one 900 MW-Siemens-BWR:
Isar -1 (KKI-1).

164
All before mentioned are located in Germany, furthermore three BWRs (Oskarshamn-1/2/3) are operated in Sweden. E.ON is a subsidiary of the E.ON AG, Germany’s largest supplier for electricity and gas. The safe, reliable and successful operation of E.ON’s nuclear power plant (NPP) fleet is demonstrated by a high availability and an impressing amount of produced energy: In October 2010 the PWR Unterweser was the first NPP in the world to exceed the amount of 300 billion kWh produced electricity thus saving emissions of 300 million tons of carbon dioxide. Unterweser’s success was followed by PWR Grohnde in July 2011 reaching the same number of 300 billion kWh. Moreover E.ON’s NPPs (among other German Siemens built NPPs) have always been in the top ten list considering electricity production per year (Table 1). TABLE 1. WORLDWIDE RANKING CONSIDERING THE ELECTRICITY PRODUCTION: DARK FIELDS SYMBOLIZE GERMAN NPPS, E.ON NPPS ARE EXPLICITLY MENTIONED [1]
Rank 1. 2. 3. 4. 5. 6. 7. 8. 9. 10. 2010 KKI-2 KBR KWG KKU 2009 KKI-2 KBR KWG 2008 KKI-2 KBR 2007 KBR KKI-2 KWG 2006 KKI-2 KBR KWG 2005 KBR KKI-2 KWG 2004 KKI-2 KBR KWG 2003 KKI-2 KWG KBR 2002 KKI-2 KBR KWG 2001 KKI-2 KBR KWG KKU 2000 KKI-2 KBR KWG
In November 2010 the operation time of German NPPs was extended to at least 40 years by a new energy act to alleviate the transition from the hitherto energy mix to a renewable energy based supply. In particular, the existing NPPs were supposed to switch their role from baseload production to a demand driven supply, thus, balancing the fluctuating electricity supply from wind and solar power. However, as a consequence of the March 2011 incident in a foreign NPP the German government issued a moratorium which required the seven oldest German NPPs (800 MW-PWR Neckarwestheim-I, 1300 MW-PWRs Biblis-A, Biblis-B, Unterweser, 900 MW-BWRs Brunsbüttel, Philippsburg-1, Isar-1) and 1200 MW-BWR Krümmel to stop operation immediately and to be off-grid for three months to enable a thorough safety analysis. The NPPs which started operation in 1980 or later, i.e. 1300 MW-PWRs Grafenrheinfeld, Philippsburg-2, Brokdorf, Isar-2, Neckarwestheim-II, Emsland and 1300 MW-BWRs Gundremmingen-B, Gundremmingen-C, were allowed to continue operation. Although the safety analysis issued by the German Reactor Safety Commission [2] did not reveal any safety concerns for any German NPP a new energy act was adopted demanding that the eight NPPs which had to stop operation in the context of the above mentioned moratorium had to be finally shut down. The changes in the nuclear capacity of supply in Germany are summarized in Table 2. According to the German licensing practice and independently from the remaining operation times of the NPPs, it is the operator’s responsibility to ensure that the licensing is continuously adapted to the state-of-the art of science and technology.

165
This paper deals how this is achieved for the treatment of loss of coolant accidents (LOCA) in German Siemens PWRs. It is organized as follows: The second and third Section deal with the current demands required by German authorities for the analysis of LOCA and how to comply with them. The fourth Section summarizes the new questions and challenges in the field of LOCA and points out E.ON’s approach how to cope with the new demands. The paper ends with a brief summary.
TABLE 2. NUCLEAR CAPACITY OF ELECTRICITY SUPPLY IN GERMANY: OPERATORS' SITUATION BEFORE AND AFTER MARCH 2011
Operator NPP Type Electrical
power
Before After
March 2011
E.ON
Isar-1 BWR 900 MW Operation until 2019 Shut-down
Isar-2
PWR 1300 MW
Operation until 2034 Operation until 2022
Unterweser Operation until 2020 Shut-down
Grafenrheinfeld Operation until 2028 Operation until 2015
Grohnde Operation until 2032 Operation until 2021
Brokdorf Operation until 2033 Operation until 2021
RWE
Biblis-A
PWR
1300 MW
Operation until 2020 Shut-down
Biblis-B Operation until 2020 Shut-down
Emsland Operation until 2034 Operation until 2022
Gundremmingen-B
BWR
Operation until 2030 Operation until 2017
Gundremmingen-C Operation until 2030 Operation until 2021
EnBW
Philippsburg-1 BWR 900 MW Operation until 2020 Shut-down
Philippsburg-2
PWR
1300 MW Operation until 2032 Operation until 2019
Neckarwestheim-I 800 MW Operation until 2019 Shut-down
Neckarwestheim-II 1300 MW Operation until 2036 Operation until 2022
Vattenfall Brunsbüttel
BWR 900 MW Operation until 2020 Shut-down
Krümmel 1200 MW Operation until 2033 Shut-down
2. DEMANDS IN GERMAN LICENSING PRACTICE The present paper focuses on the analysis of a hypothetical LOCA in a Siemens PWR. While the LOCA analysis plays an important role in the licensing process of German PWRs the situation is different for BWRs in Germany. As all of them are equipped with internal pumps all leaks assumed in the LOCA analysis can be sufficiently compensated by the ECCS so that the core is always covered with water.

166
The LOCA safety criteria which are defined in the guidelines of the German Reactor Safety Commission (RSC) [3] are comparable to those of many other countries (e.g. USA [4]). According to RSC it must be guaranteed by the ECCS that:
1. The calculated peak cladding temperature (PCT) is less or equal 1200°C.
2. The calculated oxidation of the cladding is less or equal 17% of the actual cladding wall thickness at any position.
3. Less or equal 1% of the total amount of zirconium contained in the cladding reacts in the zirconium–water reaction.
4. The release of fission products due to fuel rod failure is limited, i.e. the fraction of failed rods in the core is less or equal 10% (explicitly treated in Germany and Finland only).
5. There are no changes in the geometry of the reactor core which prevent a sufficient cooling of the core.
Criteria 1 and 2 are the so called embrittlement criteria to guarantee a sufficient post quench ductility of the cladding material after the LOCA. In particular, the PCT limit of 1200°C is supposed to preclude a self-maintaining zirconium–water reaction and an uncontrolled embrittlement by accelerated diffusion of oxygen into the beta-phase of the cladding material. The equivalent clad reacted (ECR) criterion of 17% (calculated by applying the Baker-Just correlation [6]) is supposed to ensure a sufficient ductility by limiting the total amount of oxidation for oxidation temperatures below 1200°C. Both criteria were derived in the 1970s by Hobson et al. [7–8] based on ring compression tests of high temperature oxidized specimens of unirradiated cladding material. Regarding the current discussion on the effectiveness of the ECR limit we refer to Section 4. Criterion 3 aims at a limitation of the amount of hydrogen produced by the zirconium–water reaction. In current analysis this limit does not turn out to be restrictive. Criterion 4 is specific for German (and Finish) regulation and limits the number of failed fuel rods during a LOCA to less than 10% of all fuel rods in the core. Thus, the release of fission products is restricted to the maximum assumed in the radiological analysis. Criterion 5 is a general and superior requirement regarding core coolability. In particular the embrittlement criteria 1 and 2 are supposed to contribute to maintain coolable core geometry. Supplementary to the above regulation mainly aiming at the fuel rod condition, Ref. [3] also defines assumptions to be respected in the analysis regarding:
Plant condition (e.g. unavailability of devices due to repair or single failure); core and plant thermohydraulics (TH) (e.g. TH correlations for fluid dynamics, etc.); core condition and kinetics and instrumentation and control (I&C) (e.g. power distribution).
3. EXISTING APPROACHES Based on the above list of criteria the licensing documents for LOCA are characterized as:
Hot rod analysis proofing compliance with the embrittlement criteria 1 and 2 and criterion 3.

167
Failure rate analysis limiting the release of fission products due to radiological considerations (criterion 4).
According to the German licensing practice the treatment of the LOCA has been continuously adapted to the state-of-the art of science and technology. In particular it is remarkable that new developments in the fields of nuclear core design and fuel rod design were the drivers for most of the latest improvements in LOCA licensing process. This Section of this paper reviews how the following changes of the last years, i.e.
the effect of high enrichments and MOX fuel on the pre-LOCA power distribution and,
the effect of burnup degradation of fuel thermal conductivity, were successfully and consistently incorporated into the existing licensing approach for hot rod analysis and, thus, justify the current methodology. An economically optimized plant and fuel utilization of existing nuclear power plants can be achieved by one or the combination of several measures:
Power uprates of plants (up to 20% in thermal power) what is associated to a corresponding increase of core average linear heat generation rate (LHGR).
Increased enrichment approaching and reaching the limit of 5 without U235 for commercial LWRs.
These improvements are not only restricted to the economic aspects of an advanced fuel utilization with reduced reload and discharge batches but also encompass ecological aspects as well: the reduced amount of spent fuel can be directly related to the average fuel assembly burnup of discharge batches as depicted in Fig. 1. Introducing UO2 fuel with enrichment up to 5 without U235 and/or MOX fuel leads to significantly increased rod burnups up to 70 MW·d·kg-1(HM) and beyond. Simultaneously the higher reactivity leads to high LHGRs even in the medium and high burnup range. In the LOCA analysis the effects from reload management have to be considered together with burnup dependent material properties. Figure 2 shows the dependency of fuel temperature on LHGR and burnup: the LHGR has to decrease with burnup to compensate the effect of degradation of fuel thermal conductivity with burnup (e.g. [10]) and keep the temperature constant with increasing irradiation. Figure 3 illustrates for a real MOX/UO2 core that the combined effects of reactivity and fuel degradation lead to a constellation when the highest stored energies in the fuel (resp. highest fuel temperatures) emerge for burnups of ca. 40 MW·d·kg-1(HM). As the stored energy in the fuel is one of the key parameters for the LOCA hot rod analysis the whole burnup range has to be accounted for. Thus, these observations triggered the extension of the original LOCA hot rod analysis focussing on low burnups ( 25 MW·d·kg-1(HM)) for the hot rod. In contrast, current LOCA analysis covers the whole burnup range.

168
FIG. 1. Increase in average and maximum discharge burnup over the last decades for PWR [9].
0 10 20 30 40 50 60 700
100
200
300
400
500
LH
GR
[W/c
m]
Burnup [MWd/kg(HM)]
Constant temperature: 1000 °C 900 °C 800 °C 700 °C 600 °C 500 °C
FIG. 2. Necessary decrease of LHGR which has to be assumed to keep the radially averaged fuel temperature constant with increasing burnup (example for UO2) [9].

169
0 10 20 30 40 50 60 70
Burnup [MWd/kg(HM)]
Sto
red
ener
gy(r
el. s
cale
)
Red symbols:Top 5%Red and black symbols: all rods in the core
0 10 20 30 40 50 60 70
Burnup [MWd/kg(HM)]
0 10 20 30 40 50 60 70
Burnup [MWd/kg(HM)]
Sto
red
ener
gy(r
el. s
cale
)
Red symbols:Top 5%Red and black symbols: all rods in the core
FIG. 3. Exemplary results for the stored energy in the rods of a MOX/UO2 core at BOC.
TABLE 3. EXEMPLARY RESULTS FOR PCT IN THE CONSERVATIVE DETERMINISTIC LOCA ANALYSIS FOR A SIEMENS-1300 MW-PWR WITH MOX/UO2 CORE COVERING THE WHOLE BURNUP RANGE
Burnup interval [MW·d·kg-
1(HM)]
Hot bundle factor
[-]
Hot rod max. LHGR [W/cm]
PCT first maximum
[°C]
PCT second maximum
[°C] 0 - 25 1.6 533 962 979 25 -50 1.45 533 1021 1022
>50 1.35 475 943 951 In Table 3 the PCT results of a conservative deterministic LOCA hot rod analysis for a Siemens-1300 MW-PWR with a MOX/UO2 core are summarized while Fig. 4 depicts the pertaining PCT versus time curves. The LOCA analysis covers the whole burnup range by dividing it into three separate calculations (complete system analysis) for the burnup intervals for the hot rod: 0–25 MW·d·kg-1(HM), 25–50 MW·d·kg-1(HM), and >50 MW·d·kg-1(HM). The maximum relative factor of the hot bundle hosting the hot rod drops from 1.6 in the first burnup interval over 1.45 in the second to 1.35 in the high burnup range. This reflects a certain decrease in the bundle’s reactivity. In parallel the maximum LHGR assumed for the hot rod is constant for the first two burnup intervals to additionally account for radial power gradients in the hot bundle. The absolute values with respect to the LHGR in the hot rod do not reflect normal operation but are a consequence of the axial power distribution with a top skew peak to be considered in the analysis as initial conditions while keeping the radial bundle factors constant (see Fig. 5). The maximum LHGR after the axial power distribution is related to the I&C LOCA threshold incl. uncertainty which is 533 W·cm-1 for 1300 MW-Siemens-PWR with 16 × 16 fuel assemblies and 500 W·cm-1 for Siemens-PWR with 18 × 18 fuel assemblies.

170
Time [s]
PC
T [
°C]
Burnup 0-25MWd/kg(HM), LHGR 533 W/cmBurnup 25-50MWd/kg(HM), LHGR 533 W/cmBurnup > 50MWd/kg(HM), LHGR 475 W/cm
Time [s]
PC
T [
°C]
Burnup 0-25MWd/kg(HM), LHGR 533 W/cmBurnup 25-50MWd/kg(HM), LHGR 533 W/cmBurnup > 50MWd/kg(HM), LHGR 475 W/cm
Burnup 0-25MWd/kg(HM), LHGR 533 W/cmBurnup 25-50MWd/kg(HM), LHGR 533 W/cmBurnup > 50MWd/kg(HM), LHGR 475 W/cm
FIG. 4. Exemplary results for the PCT vs. time in the conservative deterministic LOCA analysis for a Siemens-1300 MW-PWR covering the whole burnup range.
Axial core height (nodes)
No
rma
lized
axi
al p
ow
er
Original profileProfile after axial power redistribution
Axial core height (nodes)
No
rma
lized
axi
al p
ow
er
Original profileProfile after axial power redistribution
FIG. 5. Exemplary axial power redistribution with top skew peak to be assumed in the LOCA analysis before the start of the LOCA transient. Regarding the results of PCT it turns out that the medium burnup interval yields the limiting case underlining that a LOCA hot rod analysis limited to the low burnup as it was done in the past is not any longer justified in view of today’s boundary conditions in core management and knowledge of fuel properties.

171
The PCT versus time curves in Fig. 4 also show some other interesting features which are characteristic of Siemens PWR. The LOCA transient is limited to a rather short time and ends after ca. 120–150s due to the ECCS of Siemens PWRs equipped with cold and hot leg injection. The hold times at PCT 900°C are limited to ca. 40s and the maximum PCTs show a comfortable margin to the PCT limit of 1200°C. As a consequence of this PCT-time curve the effect of the high temperature oxidation with respect to the ECR value is less than ca. 2% applying the Baker-Just correlation. This value is far below the current ECR limit of 17%. This discussion will be continued in Section 4–5 in view of possible new demands. The LOCA hot rod analysis is of a generic type based on the given set of fuel rod designs and, thus, valid for certain boundary conditions which have to be checked cycle specifically and for different cycle statepoints, e.g. begin-of-cycle, mid-of-cycle, end-of-cycle. The comparison between the LHGR of all rods in the core after the axial power redistribution and the burnup dependent LHGR assumed for the hot rods in the LOCA analysis is illustrated in Fig. 6 for the state point end-of-cycle. The bundle factors of the cores are checked against the values applied in the analysis, too. When a new fuel rod design is introduced a comparison is performed whether the existing fuel rod designs considered in the LOCA analysis cover the new fuel rod design as well, in particular with respect to the important parameter as the stored energy in the fuel. If this cannot be accomplished the LOCA analysis itself is to be repeated.
Fuel rod burnup [MWd/kg(HM)]
Ma
x. lo
calL
HG
R [
W/c
m]
max. LHGR of all rods in the coremax. LHGR in LOCA hot rod analysis
Fuel rod burnup [MWd/kg(HM)]
Ma
x. lo
calL
HG
R [
W/c
m]
max. LHGR of all rods in the coremax. LHGR in LOCA hot rod analysis
FIG. 6. Exemplary comparison of maximum LHGR of all rods in the core after the axial power redistribution with the burnup dependent LHGR of hot rods applied in the LOCA analysis. One rod’s LHGR is equal to the I&C threshold (incl. uncertainty) of 533 W·cm-1. In Germany the LOCA hot rod analysis is supplemented by a LOCA failure rate analysis. The basic approach is very similar to the LOCA hot rod analysis discussed above. However, the LOCA failure rate analysis is performed cycle-by-cycle with a slightly reduced degree of conservatism with respect

172
to axial power redistribution and fuel rod data. In particular, for each individual rod a heat-up calculation is performed based on the actual fuel rod condition and a conservative deterministic TH file to determine whether the rod would fail or not. The results of this analysis are documented as depicted in Fig. 7.
Ma
x. lo
calL
HG
R [
W/c
m]
Fuel rod burnup [MWd/kg(HM)]
non-failed rodfailed rod
Ma
x. lo
calL
HG
R [
W/c
m]
Fuel rod burnup [MWd/kg(HM)]
non-failed rodfailed rod
FIG. 7. Example of a LOCA failure rate analysis (3.2% of all rods in the core fail).
Applying the presented approach the effect of high enrichments and MOX fuel on the pre-LOCA power distribution and the effect of burnup degradation of fuel thermal conductivity were technically sound and consistently incorporated into the LOCA licensing. The LOCA analysis as presented in this Section is performed by the plant manufacturer Siemens resp. its successor AREVA NP. An important aspect is that the calculation can be divided into two parts:
The TH system analysis describing the plant and core response during the LOCA transient (e.g. system pressure, fluid temperature, heat transfer coefficients, etc.).
The heat-up calculation focussing on the performance of the hot rod during the LOCA transient based on the TH boundary conditions as supplied by the TH system analysis.
Fuel supplied by a second vendor can be consistently integrated into the existing LOCA analysis as long as the following constraints are fulfilled:
The stored energies of the reference fuel rods used in the TH system analysis exceed the stored energies of the second vendor’s fuel rods. (If this should not be the case the TH system analysis is to be repeated with sufficiently high stored energy of the reference fuel rods.)
173
The second vendor performs an explicit heat-up calculation for its fuel rods applying the TH boundary conditions from the TH system analysis. The results of the heat-up calculation encompass the cladding-alloy specific (and, thus, vendor specific) creep and burst performance of the rods and have to respect the pertaining limits.
4. NEW CHALLENGES AND NEW APPROACHES Burnup effects will not be limited to fuel properties but also affect the cladding condition. In the context of the definition and adaptation of embrittlement criteria for new cladding alloys the necessity was seen to review the basis of the existing limits (1200°C for PCT and 17% for ECR) and how they were derived from unirradiated cladding material [7–8]: a sufficient post-quench ductility is demanded for today’s boundary conditions, i.e. all types of used cladding alloys and today’s burnups. To achieve this objective a number of ring-compression tests of high temperature oxidized cladding material were performed using unirradiated and irradiated specimens of different alloys. These experiments were supplemented by tests on unirradiated, but hydrogen loaded cladding to simulate the irradiation effect without having to use hot cells. Moreover, integral tests were performed on unirradiated and irradiated rodlets to gain knowledge on the realistic overall performance of fuel rods under LOCA conditions. The aspects which gained the most attention in the context of the ongoing international discussion on new LOCA criteria (e.g. [11]) are summarized and commented from a German operator’s point of view. 4.1. Beta-layer embrittlement by oxygen and beta-layer thinning The embrittlement inducing process under high temperature oxidation conditions is a well known phenomenon. The crystal structure of Zr alloy is hexagonal at room temperature (alpha phase). With increasing temperature, i.e. between 650–800°C, it undergoes a phase transformation to a face-centred cubic structure, the so-called beta-phase. At ca. 980°C and above the pure beta-phase prevails. The exact phase transformation temperatures depend on the exact alloy composition, but on the hydrogen and oxygen concentration as well. In general hydrogen stabilizes the beta phase while oxygen stabilizes the alpha-phase. With increasing cladding temperature during the LOCA transient the diffusion of oxygen into the beta-layer increases as well as the solubility of oxygen in the beta-layer. After the quench of the cladding the oxygen in the ex-beta-layer causes a loss of ductility (embrittlement) of the Zr alloy (beta-layer embrittlement by oxygen). For temperatures above 1200°C the solubility of oxygen in the beta-phase is so high that the ex-beta-phase is brittle after the quench ( 1200°C limit for PCT). With increasing hold time oxygen can also convert the beta-phase into an oxygen-stabilized alpha-phase which is completely brittle. To preclude this beta-layer thinning the total degree of oxidation has to be limited ( 17% limit for ECR based on the Baker-Just correlation). These above mentioned criteria for PCT and ECR are well known and, of course, respected in the current LOCA analysis for German PWRs. 4.2. Hydrogen-enhanced beta-layer embrittlement by oxygen However, the process of beta-layer embrittlement is modified if irradiated cladding is considered [11]. Hydrogen pick-up from cladding corrosion under normal operating conditions increases the diffusion rate and oxygen solubility in the beta-phase and, thus, the embrittlement of the cladding. As a consequence, embrittlement can occur without exceeding the ECR threshold of 17%. Figure 8 (taken from Ref. [11]) summarizes the results of hydrogen enhanced beta-layer embrittlement by oxygen.

174
FIG. 8. Embrittlement threshold [brittle above, ductile below] expressed as an oxidation level (CP-ECR) vs. pre-test hydrogen content for as-fabricated cladding alloys and high burnup Zry-4, ZIRLOTM, and M5TM cladding, which were oxidized at ≤1200°C and either quenched at 800°C or cooled without quench [11]. The technical assessment of hydrogen enhanced beta-layer embrittlement by oxygen relies on the typical PCT versus time curves for German PWRs as depicted in Fig. 4. Due to moderate maximum PCT values and short hold times above 900°C the calculated ECR value originating from high temperature oxidation based on Baker-Just is ca. 1–2%. Thus, comparing this result with Fig. 8 there are no technical concerns even for irradiated rods of all designs which are currently inserted in the core of German Siemens-PWRs. 4.3. General hydrogen induced embrittlement from breakaway oxidation The crystallographic form of ZrO2 developing under high temperature oxidation is tetragonal, dense, and adherent. However, under certain conditions (temperatures of ca. 900°C or 1000°C) local instabilities at the metal-oxide interface can occur and result in a phase transformation to a monoclinic oxide. This transformation is accompanied by an increased oxidation rate and significant hydrogen pickup with the consequence of enhanced embrittlement. This effect has been known and was reconfirmed in [11]. For today’s cladding materials breakaway oxidation is found for oxidation times in the order of magnitude of at least 1000 seconds. Therefore breakaway oxidation is not considered to be an issue in the LOCA analysis of German Siemens PWRs because of the short hold time in the relevant temperature regime (compare Fig. 4). 4.4. Oxygen pickup from the cladding inner surface With increasing burnup an oxygen source may be available at the inside of the cladding, e.g. from a bonding layer between fuel and cladding after the gap closure. Thus, it might be necessary to consider

175
a double-sided high temperature oxidation in the calculations independent from the occurrence of a burst. This effect is still under investigation. It is expected that the contribution from the oxygen source at the inner side of the cladding wall is less effective for the high temperature oxidation than the steam/water environment at the cladding outside. According to typical PCTs and hold times in LOCA analysis for German Siemens PWRs oxygen pickup from the inside of the cladding is not expected to play a significant role. 4.5. Localized hydrogen induced embrittlement in the balloon region In case of rupture of a ballooned fuel rod steam can enter through the opening in the ballooned region and cause high temperature oxidation on the inside of the cladding as well. The hydrogen produced by the metal–water reaction inside the burst opening is not swept away by but is picked up by the cladding in the balloon region or its vicinity leading to secondary hydriding. This effect is found to be independent from alloy type or burnup and leads to an enhanced embrittlement of the cladding around the burst region. It has been known was reconfirmed in [11]. In the context of rod failure by rupture the questions related to fuel relocation and release are also of relevance (e.g. [12] for a discussion of the Halden LOCA test IFA-650). Due to the high hydrogen pickup in the ballooned region it is difficult to guarantee a sufficient ductility by an ECR threshold. However, resistance against fracture during quenching and results of bending tests indicate that there is a sufficient residual material strength in the ballooned region [11]. To assess this phenomenon with respect to the typical cladding temperature–time curve in the LOCA analysis of German Siemens PWR (i.e. rate of temperature increase, maximum temperature, hold time, quench) a test program was initiated at the Karlsruhe Institute for Technology [13] supported by German NPP operators, fuel vendors, and the Gesellschaft für Anlagen- und Reaktorsicherheit. The test program comprises integral tests on bundles of (unirradiated) fuel rods. Thus, it has the potential to help clarify the following aspects:
Integral bundle tests allow for the consideration of neighboured rods and their effect on the azimuthal temperature distribution in the cladding. An azimuthal temperature gradient will map the creep burst behaviour more realistically compared to single rod tests.
Long rods are used which are realistically supported by spacers.
All currently relevant cladding types (Zry-4, Duplex, M5TM, ZIRLOTM) are investigated without and with hydrogen loading whereby the hydrogen loading is supposed to simulate the relevant irradiation effect.
First tests were performed at Zry-4 fuel rods to test the performance of the experimental setup. Results of the test matrix as defined above are expected during the next years. 4.6. Impact of hydrogen on failure rate analysis Beyond the impact of hydrogen on the cladding embrittlement during the high temperature oxidation phase there is an additional effect on the creep-burst behaviour of rods during the heat-up phase of the LOCA transient (e.g. [14]). As pointed out above, hydrogen stabilizes the beta-phase and, thus, influences the transformation from the alpha- to the beta-phase during the increase of the cladding temperature and the mechanical properties of the alloy in the range of the phase transformation. Although the details of the microscopic kinetics of this process are complex the overall effect results in a decreased hold time until rod failures occur. As a consequence the calculated failure rate in the core will increase. As this effect strongly depends on alloy composition and temperature dependent material properties, a set of rod burst experiments is required for each cladding type to investigate the impact of hydrogen
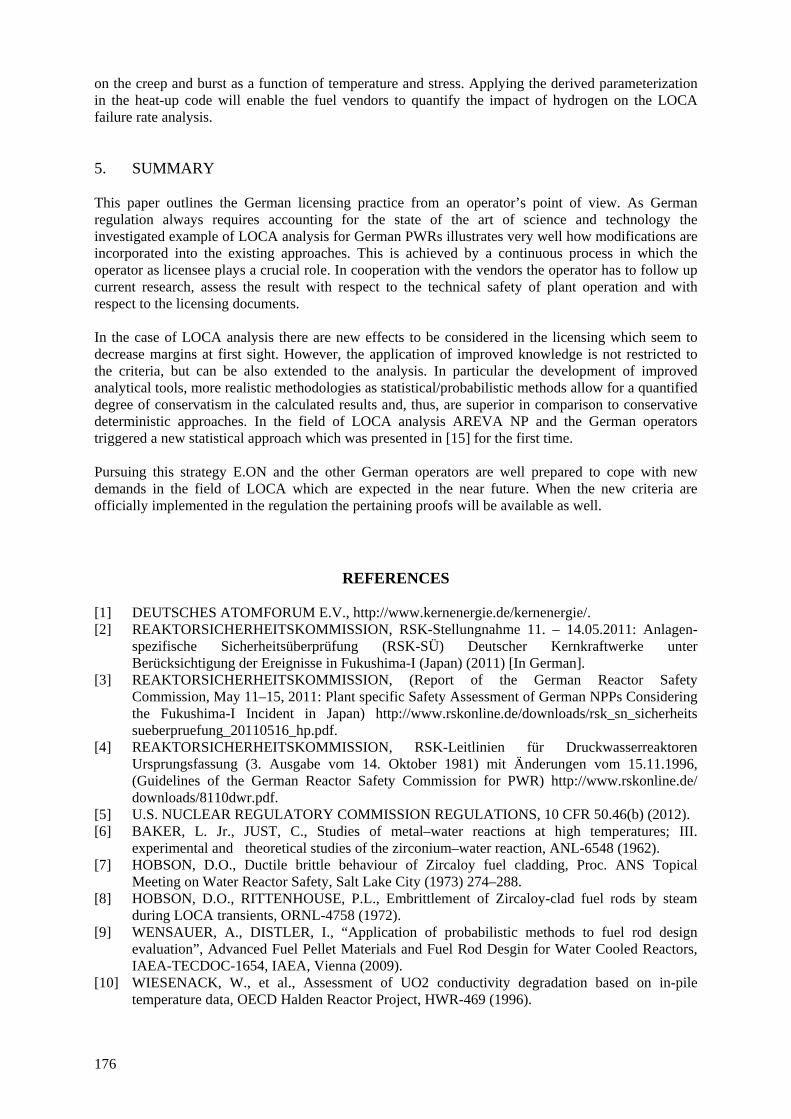
176
on the creep and burst as a function of temperature and stress. Applying the derived parameterization in the heat-up code will enable the fuel vendors to quantify the impact of hydrogen on the LOCA failure rate analysis. 5. SUMMARY This paper outlines the German licensing practice from an operator’s point of view. As German regulation always requires accounting for the state of the art of science and technology the investigated example of LOCA analysis for German PWRs illustrates very well how modifications are incorporated into the existing approaches. This is achieved by a continuous process in which the operator as licensee plays a crucial role. In cooperation with the vendors the operator has to follow up current research, assess the result with respect to the technical safety of plant operation and with respect to the licensing documents. In the case of LOCA analysis there are new effects to be considered in the licensing which seem to decrease margins at first sight. However, the application of improved knowledge is not restricted to the criteria, but can be also extended to the analysis. In particular the development of improved analytical tools, more realistic methodologies as statistical/probabilistic methods allow for a quantified degree of conservatism in the calculated results and, thus, are superior in comparison to conservative deterministic approaches. In the field of LOCA analysis AREVA NP and the German operators triggered a new statistical approach which was presented in [15] for the first time. Pursuing this strategy E.ON and the other German operators are well prepared to cope with new demands in the field of LOCA which are expected in the near future. When the new criteria are officially implemented in the regulation the pertaining proofs will be available as well.
REFERENCES
[1] DEUTSCHES ATOMFORUM E.V., http://www.kernenergie.de/kernenergie/. [2] REAKTORSICHERHEITSKOMMISSION, RSK-Stellungnahme 11. – 14.05.2011: Anlagen-
spezifische Sicherheitsüberprüfung (RSK-SÜ) Deutscher Kernkraftwerke unter Berücksichtigung der Ereignisse in Fukushima-I (Japan) (2011) [In German].
[3] REAKTORSICHERHEITSKOMMISSION, (Report of the German Reactor Safety Commission, May 11–15, 2011: Plant specific Safety Assessment of German NPPs Considering the Fukushima-I Incident in Japan) http://www.rskonline.de/downloads/rsk_sn_sicherheits sueberpruefung_20110516_hp.pdf.
[4] REAKTORSICHERHEITSKOMMISSION, RSK-Leitlinien für Druckwasserreaktoren Ursprungsfassung (3. Ausgabe vom 14. Oktober 1981) mit Änderungen vom 15.11.1996, (Guidelines of the German Reactor Safety Commission for PWR) http://www.rskonline.de/ downloads/8110dwr.pdf.
[5] U.S. NUCLEAR REGULATORY COMMISSION REGULATIONS, 10 CFR 50.46(b) (2012). [6] BAKER, L. Jr., JUST, C., Studies of metal–water reactions at high temperatures; III.
experimental and theoretical studies of the zirconium–water reaction, ANL-6548 (1962). [7] HOBSON, D.O., Ductile brittle behaviour of Zircaloy fuel cladding, Proc. ANS Topical
Meeting on Water Reactor Safety, Salt Lake City (1973) 274–288. [8] HOBSON, D.O., RITTENHOUSE, P.L., Embrittlement of Zircaloy-clad fuel rods by steam
during LOCA transients, ORNL-4758 (1972). [9] WENSAUER, A., DISTLER, I., “Application of probabilistic methods to fuel rod design
evaluation”, Advanced Fuel Pellet Materials and Fuel Rod Desgin for Water Cooled Reactors, IAEA-TECDOC-1654, IAEA, Vienna (2009).
[10] WIESENACK, W., et al., Assessment of UO2 conductivity degradation based on in-pile temperature data, OECD Halden Reactor Project, HWR-469 (1996).

177
[11] U. S. NUCLEAR REGULATORY COMMISSION, Cladding Embrittlement During Postulated Loss-of-Coolant Accidents, NUREG/CR-6967 ANL-07/04 (2008).
[12] NUCLEAR ENERGY AGENCY, Safety Significance of the Halden IFA-650 LOCA Test Results, Committee on the Safety of Nuclear Installations, NEA/CSNI/R(2010)5 (2010).
[13] KARLSRUHE INSTITUTE OF TECHNOLOGY, QUENCH Programme at KIT, http://quench.forschung.kit.edu/index.php (2012).
[14] BRACHET, J.C., et al., Influence of hydrogen on the / phase transformation temperatures and on the thermal-mechanical behaviour of Zy-4, M4 (ZrSnFeV) and M5TM (ZrNbO) alloys during the first phase of LOCA transient, Zirconium in the Nuclear Industry: 13th International Symposium (2001), ASTM STP 1423, (MOAN, G.D., RUDLING, P., Eds), American Society for Testing and Materials, West, Conshohocken, PA (2002).
[15] SEEBERGER, G.J., TREWIN, R.R., ZEISLER, L.P., from phenoma to acceptance criteria: a statistical LBLOCA analysis, Proceedings of the Annual Meeting on Nuclear technology (Jahrestagung Kerntechnik), Berlin (2011).


179
IRSN R&D STUDIES ON FUEL BEHAVIOUR UNDER LOCA CONDITIONS
M. PETIT, C. GRANDJEAN, N. TRÉGOURÈS, F. BARRÉ, P. GIORDANO
DPAM/SEMCA, Bat. 702 Saint-Paul-lez-Durance France Email: [email protected]
Abstract
The most important safety principle in case of a loss of coolant accident (LOCA) is to preserve the long term coolability of the core. The associated safety requirements are to ensure the resistance of the fuel rods upon quench and post-quench loads and to maintain a coolable geometry in the core. These requirements are formalised in safety criteria, associated with limiting values, mainly expressed through a maximum cladding temperature (PCT) and an equivalent cladding reacted ratio (ECR) with the aim of ensuring a residual ductility of the cladding. In order to prepare acceptance criteria reassessment, IRSN recently conducted an extensive State-of-the-art review relative to fuel behaviour under LOCA conditions. The main pending questions can be summarised under three topics: i) loss of cladding integrity upon quench and post-quench loads, ii) relocation of fuel fragments, iii) flow blockage and core coolability. To address these issues, IRSN is conducting a R&D programme that consists in experiments and code developments. 1. INTRODUCTION In the frame of its research programs on fuel safety, the French “Institut de Radioprotection et de Sûreté Nucléaire” (IRSN) studies the fuel rod behaviour during a loss of coolant accident (LOCA). The LOCA results from a break in the primary circuit that leads to the depressurisation of the primary system with power decrease to its residual level. As a consequence, the fuel rods undergo the following evolution: clad temperature increase and dry-out, transfer of the stored energy from the fuel to the clad, clad ballooning with possible contact with the neighbouring rods, burst failure around 800°C and fuel fragments relocation either inside the ballooned zone or outside of the rod through the burst opening; beyond this phase, oxidation of the cladding at high temperature occurs leading to a significant clad embrittlement. Finally, quenching due to reflooding water of the safety injection systems happens. The LOCA is a design basis accident (DBA) used in particular for the design of the safety injection systems and the limitation of the power at the hottest point in the core during normal operation. The safety principle is that the coolability of the core has to be preserved in the short and long term. The associated safety requirements are to ensure the resistance of the fuel rods upon quench and post-quench loads and to maintain a coolable geometry in the core. These requirements are developed in safety criteria, associated with limit values, mainly expressed in terms of a maximum cladding temperature (PCT) and an equivalent cladding reacted ratio (ECR) with the aim of ensuring a residual ductility to prevent fragmentation of the fuel rods that would impair the core coolability. In France as in the US, the current limits are 1204°C on PCT and 17% on ECR. These LOCA acceptance criteria are issued from a long process in the United States (Ergen Task Force in 1967, Interim Acceptance Criteria for ECCS in 1971, then ECCS Rule-making Hearing in 1972–1973). Since they were established, the evolution of fuel operating conditions and fuel technologies leads the international community to review the technical basis to reassess these criteria and their limit values. Within the frame of a joint program with EDF and in order to develop the technical basis to support the reassessment acceptance criteria, IRSN conducted an extensive state of the art review relative to fuel behaviour under LOCA conditions, covering the aspects of clad ballooning and flow blockage, coolability of partially blocked assemblies, clad oxidation and clad resistance to quench and post

180
quench loads [1–3]. Additionally, a review of existing computation tools devoted to the calculation of fuel behaviour under LOCA was performed. Together with the outcomes from the recent results from experimental program, this leads to summarising the main pending questions relative to fuel behaviour under LOCA in the three following topics:
The cladding embrittlement, to address the loss of cladding integrity upon quench and post quench loads;
The relocation of fuel fragments;
The flow blockage by ballooning rods and its coolability. To address these issues, IRSN has launched an R&D programme named CYCLADES. 2. THE CYCLADES PROGRAMME 2.1. Cladding embrittlement The effects on cladding embrittlement of both alloy composition and burnup were extensively studied [4–5] but questions still remain to properly understand physical phenomena and to ensure a correct prediction of the behaviour of future cladding alloys. Some of the hydrogen that is liberated in the corrosion process enters the cladding during normal operation. The hydrogen was found to produce a strong effect on the embrittlement of the cladding, but the effect is indirect. Hydrogen acts as a catalyst while oxygen, which diffuses into the cladding metal during a LOCA transient, is the direct cause of embrittlement. Oxygen from the oxide fuel pellets was found to enter the cladding from the inside in high burnup fuel in addition to the oxygen that enters from the oxide layer on the outside of the cladding. Under conditions that might occur during a small break LOCA, the accumulating oxide on the surface of the cladding can break up and was found to let large amounts of hydrogen into the cladding during the LOCA transient, thus exacerbating the embrittlement process. The current work also confirmed an older finding that, if rupture occurs during a LOCA transient, large amounts of hydrogen can enter the cladding from the inside near the rupture location. Post quench ductility, a commonly used parameter in the past as the basis of safety criteria, appears as an inappropriate parameter to define an embrittlement threshold, since no practical limit can be derived to ensure ductility retention in the cladding balloon. However, the results from ANL 4-point bending tests [6] at room temperature on irradiated samples after integral testing suggest that, below some oxidation limit, the rod cladding would resist fragmentation when subjected to quench and post quench loads. A strength based approach addressing the structural response of the whole cladding, instead of a ductility approach, might provide an acceptable alternative. In terms of R&D, two steps are required to follow this approach. The first step is to quantify a relevant embrittlement threshold. The first important item is to identify and quantify mechanical loads that should be supported by fuel rods during quench and post-quench phases of LOCA transients from numerical simulations in bundle geometry. It is a necessary challenge. Afterwards, appropriate embrittlement tests, taking into account bounding mechanical loads (quench under controlled loading, impact tests, etc.) to determine embrittlement threshold, should be defined. Finally, it is necessary to carry out finite element calculations with typical cladding geometry and properties to verify that the experimental domain covered by this type of tests is adequate. This step may require appropriate analytical experimental tests to characterize the evolution of clad properties, in particular at the location of the balloons. The second step is to select the most appropriate parameter characterising the oxidation and hydriding amount on which to correlate embrittlement, so as to find out an alternative to the ECR. It is based on previous work from early investigators [7–10]. At that time, research programs and calculation tools

181
were not ready to make successful these attempts. Based on the one hand on these previous work and on the other hand on recent important research results obtained at ANL [10], CEA [11] or JAEA [12], IRSN considers that an embrittlement threshold based on residual thickness of prior b-Zr layer with low oxygen content as function of H content should be more appropriate. In order to complement the experimental database relative to oxidized cladding behaviour under LOCA conditions, IRSN is performing the MARGO-R [13] experiments. Three specific topics were selected for this programme which are:
the study of oxidation and oxide reduction kinetics at high temperatures;
the study of hydrogen influence on oxygen distribution;
the study of oxygen distribution under non-stationary cooling conditions. The results from the MARGO-R experiments are used as a support for the development of models to address the oxygen and hydrogen behaviour in the cladding. Those models are then implemented in the DIFFOX [14] code. The DIFFOX code considers a one dimensional (1-D) system of reaction layers in finite cylindrical geometry among the physically possible combinations of the following layers.
ZrO2, α-Zr(low T or stabilized by O), (α + β)-Zr, β-Zr The oxygen concentration profile is calculated in each reaction layer by solving the 1-D diffusion equation (Second Fick’s law). The oxygen diffusion coefficients D are taken from literature for the single phase. For the two-phase layer (α+β)-Zr, an “equivalent” weighted D is deduced from a combination of values for the α and β phases. The oxygen boundary concentrations were initially taken as the equilibrium values from the Zr-O and Zy-O phase diagrams found in the literature. However, instantaneous equilibrium at boundaries appeared to be not applicable to transient conditions, particularly under cooling. A corrective approach has been introduced based on provisional assumptions on the limited increase or decrease of the oxygen boundary concentration during the temperature transient. This key question was addressed by specific MARGO-R experiments with controlled cooling prior to a final quench to freeze the oxygen concentration profile, which will be later determined by EPMA. To predict the oxidation of hydrided specimens, oxygen boundary concentrations must also be known as a function of the hydrogen content. Only sparse data exist today for the oxygen solubility in β-Zr at 1200°C. Specific experiments have also been planned at the IRSN to provide the necessary data required to allow a correct simulation of oxygen diffusion in hydrided material. The diffusion equations are numerically solved using the implicit finite-difference method. A reaction layer is divided into N meshes with a variable width increasing from the boundaries towards the middle of the layer. The derivation of the finite-difference formulas leads to a system of linear equations with a tri-diagonal matrix. The numerical solution of the system of equations is obtained by Gauss elimination method. As an example, Fig. 1 shows a typical comparison of O profile measured by EPMA and computed by DIFFOX for a cladding tube submitted to low temperature air oxidation followed by a high temperature steam oxidation.

182
FIG. 1. Comparison of o profile measured by epma and computed by diffox.
3. FUEL RELOCATION During normal operation, oxide fuel pellets develop many cracks because of thermal stresses. After clad ballooning and burst, some fragmented fuel particles located above the ballooned region of a fuel rod will thus relocate into the enlarged volume of the balloon under the influence of gravity and pressure differences. This effect was first noticed, even at relatively low burnup, in reactor tests in the United States in PBF/LOC [15] (35–50 GW·d·t-1), Germany FR-2 [16] (45–60 GW·d·t-1) and France [17], and recent integral tests at Argonne National Laboratory (ANL) and the Halden Reactor Project in Norway (IFA-650 test series) [18] have confirmed it. The consequence of fuel relocation is an increase in heat generation in the ballooned region together with a reduction of the thermal resistance between fuel and cladding, which may increase the cladding temperature and oxidation compared with an undeformed length of the fuel rod. A typical large break LOCA sequence was computed with three different assumptions on fuel relocation in the balloon: no relocation, relocation with a filling ratio of 61.5% and relocation with a filling ration of 70% [19]. Figures 2–3 show the results of the calculations in terms of PCT, ECR and remaining β-layer respectively. All three values are significantly affected by the fuel relocation. Furthermore, it has also been shown recently in the OECD HALDEN IFA-650 series [17] of experiments and in an NRC sponsored programme at Studsvik [19] that fuel fragments may even escape from the fuel rods in significant amounts. An experimental programme is currently under preparation for performing single rod LOCA tests in the CABRIa reactor. This programme is aimed at being a complement to the already existing experiments. The main features of the experiments will be:
The use of irradiated fuel submitted to nuclear heating.
___________________________________________________________________________ a The CABRI reactor is operated by the French Commissariat a l’Energie Atomique et aux Energies
Alternatives (CEA).

183
Boundary conditions that simulate the effect of neighbouring rods associated with precisely controlled external heating, in order to allow for the study of the azimuthal temperature gradient effect.
The use of the CABRI hodoscope that makes possible the online and post-mortem analysis of fuel motion without moving the rod.
CLAD BURSTFUEL RELOCATIONCLAD BURSTFUEL RELOCATIONCLAD BURSTFUEL RELOCATION
FIG. 2. Effect of fuel relocation on clad temperature.
17.3%
19.5%
12.3%
+ 5% to 7%on ECR
17.3%
19.5%
12.3%
+ 5% to 7%on ECR
FIG. 3. Effect of fuel relocation on ECR.

184
259m242m
309m
- 50m to 67mon residual -layer thickness
259m242m
309m
- 50m to 67mon residual -layer thickness
FIG. 4. Effect of fuel relocation on residual β-layer thickness.
Dummy rods
Tested rod
Dummy rods
Tested rod
FIG. 5. Schematic view of the test device for single rod tests in CABRI.
Figure 5 shows a schematic cross section of the test device currently under design.
4. FLOW BLOCKAGE AND ITS COOLABILITY The question of the cumulative effects of irradiation, which homogenize the azimuthal temperature distribution in the fuel rod cladding, on the main characteristics of the blockage (maximum flow restriction ratio, axial extent) has been under investigation for a long time and several programmes have been devoted to it [1]. Based on a comparison of the burst strains obtained in ORNL single rod/ multirod tests and in PBF-LOC tests with fresh rods/irradiated rods, one of the major conclusions of the past R&D programmes was provided by INEL, which recommended to perform in-pile bundle tests of sufficient bundle size with irradiated rods [14].

185
However, such a strategy might lead to significant costs; if feasible, only a very limited number of in-pile integral bundle tests would be performed. Thus, in order to investigate the effect of the different parameters of interest, the practicable way is to use a detailed and well assessed computer code. For this purpose, with the support of EDF, IRSN is developing the DRACCAR code [20] which is a multi-rod 3-D thermomechanics code, with mechanical and thermal interactions between rods, coupled with sub-channel type two-phase flow codes. The flexibility of DRACCAR allows to model from one rod to a fuel assembly. The reasonable target for fuel assembly calculations is to model a 1/8 fuel assembly (Fig. 6) including fuel rods (stack of fuel pellets, cladding), control rods, guide tubes, instrumentation tubes, spacer grids. Each structure is in mechanical and thermal interaction with others, including contacts between fuel rods and eventually with guide tubes. Each rod has a 3D description and is coupled with a sub-channel thermal hydraulics (Fig. 7). The code uses 3D non structured meshing to describe the fuel assembly. The use of symmetries is available to reduce the size of the system to compute and thus the “CPU” time. Parallel calculations are as well possible. The main models of the DRACCAR code are listed in the Table 4.1 below. TABLE 4.1. MAIN MODELS OF THE DRACCAR CODE
Thermodynamical state
- Thermal conduction in the whole structures; - Convective exchanges between the fluid and the structures; - Radiative exchanges between structures; - Heat exchange (conduction + radiation) through a gap; - Structures oxidation by the vapour; - 3D temperature distribution (hoop temperature gradient in each cladding).
Material properties - Intrinsic laws from the IRSN Material Data Bank for Power Plant applications, which is called MDB;
- Creep laws, anisotropy coefficients, integrity criteria; - Description of the material behaviour under imposed constraints; - Temperature, pressure, burnup, oxidation, hydriding; - Used in a 2.5D mechanical model.
Local creep velocity: 2.5D model
- 3D creep model (EDGAR laws) at each axial level; - Boundary conditions (constraints) only due to the pressure (no retroaction of the neighbour level constraints);
- Four different rupture modes: total elongation, strain, stress, temperature (for each one, several models are available).
Global strain - Internal pressure calculation; - Contact between rods and hot side straight effect.
Fragmented fuel relocation in the balloons
- Parametrical model (filling ratio, starting time, filling velocity which can be instantaneous).
Although DRACCAR is validated against a large set of experimental results, there is a specific point that deserves a special attention. During the review of the main experimental programmes, the question of the coolability of blocked regions in a rod bundle after ballooning in a LOCA was addressed through experimental programmes such as the FEBA, SEFLEX, THETIS, ACHILLES, CEGB and FLECHT-SEASET, as well as of several analytical developments performed in association with these experimental programmes. It was noted that these results were obtained in out-of-pile experiments performed with electrically heated fuel rod simulators with a large gap between the simulator and the cladding tube. These experiments promote the cladding coolability because it is separated from the heat source by a wide gap, which is

186
not representative of the situation with fragmented fuel accumulated in the cladding balloons (fuel relocation), as was observed during all in-pile tests with irradiated fuel rods. The impact of fuel relocation upon blockage coolability therefore remains to be investigated.
FIG. 6. Example of geometrical modelling (1/8 PWR assembly).
FIG. 7. Example of geometrical modelling (1/8 PBF bundle).

187
Thus, it is necessary to perform out-of-pile experiments with a partially blocked full length bundle, with realistic simulation of fuel relocation in the balloons, in view of updating the upper bound value of maximum blockage remaining coolable. This is the purpose of the COAL experiments that are under preparation. The first task of this programme was to design the electrically heated rod, with pre-deformed geometry. This task is currently near to completion. Another topic that requires an experimental support is the validation of the mechanical models in case of contact between adjacent rods. Preliminary studies were conducted with different tools as exemplified in Fig. 8. It showed that for the same situation, the different tools gave different results and with the current knowledge, it is not possible to decide which solution is realistic. In fact, as in the past the emphasis was put on the single rod approach, there is no specific experimental support to address these issues.
FIG. 8. Equivalent stress contours after contact between rods. IRSN is thus preparing a series of experiments named COCAGNE to study, in a multi rod situation:
The formation of balloons, particularly after contact between rods: does the balloon grow preferentially in the plane perpendicular to the rods or in the axial direction? Do the balloons tend to grow in the same plane or at different elevations, allowing for an easier flow of the water during reflooding?
The conditions that lead to rod burst after contact: do the failure criteria that were established for the single rod remain applicable?
A crucial point for the interpretation of the COCAGNE experiments and the qualification of the DRACCAR code is to have a precise knowledge of the behaviour of the materials that will be used in the experiments. To achieve that, IRSN has recently started experiments, named ELFE, that aim at characterizing the mechanical behaviour of the materials to be tested later in COCAGNE. More specifically, creep tests are performed on specimens with a simple geometry fabricated from cladding tubes, as shown in Fig. 9. It is planned to perform experiments in the 500–1100°C range.
188
FIG. 9. ELFE creep tests specimen.
5. CONCLUSION In order to prepare acceptance criteria reassessment, IRSN recently conducted an extensive state of the art review relative to fuel behaviour under LOCA conditions. The main pending questions can be summarised under three topics:
loss of cladding integrity upon quench and post-quench loads;
relocation of fuel fragments;
flow blockage and core coolability. To address these issues, IRSN has elaborated and is conducting the CYCLADES programme that consists in:
The MARGO-R experimental programme and the development of the DIFFOX code for the cladding embrittlement.
Single rod experiments in the CABRI reactor for the for the fuel relocation and dispersal, taking benefit of the CABRI hodoscope to monitor fuel movements.
The ELFE creep tests, the COCAGNE bundle mechanical tests and the COAL full length bundle reflooding tests for the flow blockage and core coolability.
The results produced will be used to validate the multi-rod LOCA transient fuel code DRACCAR whose development is in progress.
REFERENCES [1] GRANDJEAN, C., A state of the art review of past programs devoted to fuel behaviour under
LOCA conditions; part 1; clad swelling and rupture; assembly flow blockage, IRSN/DPAM/SEMCA 2005–313 (2005) available at http://net-science.irsn.org.
189
[2] GRANDJEAN, C., A state of the art review of past programs devoted to fuel behaviour under LOCA conditions; part 2; impact of clad swelling upon assembly cooling, IRSN/DPAM/SEMCA 2006–183 (2006) available at in http://net-science.irsn.org.
[3] GRANDJEAN, C., HACHE, G., A state of the art review of past programs devoted to fuel behaviour under LOCA conditions; part 3; cladding oxidation, resistance to quench and post quench loads, IRSN/DPAM/SEMCA 2008-093 (2008) available at http://net-science.irsn.org.
[4] BILLONE, M., YAN, Y., BURTSEVA, T., DAUM, R., Cladding embrittlement during postulated loss of coolant accidents, Argonne National Lab, NUREG/CR-6967, ANL-07/04 (2008).
[5] HOBSON, D.O., Ductile-brittle behaviour of Zry fuel cladding, Topical Meeting on Water Reactor Safety, Salt Lake City (1973).
[6] BILLONE, M.C., YAN, Y., BURTSEVA, T., Overview of ANL LOCA programs, ANL LOCA Program Review Meeting, Argonne National Laboratory, Salt Lake City (2007).
[7] PAWEL, R.E., Oxygen diffusion in beta Zircaloy during steam oxidation, J. of Nucl. Mat. 50 (1974) 247–258.
[8] SAWATZKY, A, Proposed criterion for the oxygen embrittlement of Zircaloy 4 fuel cladding, Zirconium in the Nuclear Industry, ASTM STP 681 (1979) 479–496.
[9] CHUNG, H.M., KASSNER, T.F., Embritttlement Criteria for Zircaloy Fuel Cladding Applicable to Accident Situations in Light Water Reactors; Summary Report, NUREG/CR-1344, ANL-7948 (1980).
[10] BRACHET, J.C., et al., Hydrogen content, preoxidation, and cooling scenario effects on post-quench microstructure and mechanical properties of Zircaloy-4 and M5TM alloys in LOCA conditions, J. ASTM International 5 (2008) 91–118.
[11] NAGASE, F., TANIMOTO, M., UETSUKA, H., “Study on high burnup fuel behaviour under a LOCA condition at JAERI”, Fuel Behvaiour Under Transient and LOCA Conditions: Proceeding of a Technical Committee Meeting Held in Halden, Norway, 10–14 September 2001, IAEA-TECDOC-1320, IAEA, Vienna (2001).
[12] GUILBERT, S., DURIEZ, C., GRANDJEAN, C., Influence of a pre-oxide layer on oxygen diffusion and on post-quench mechanical properties of Zircaloy-4 after steam oxidation at 900°C, LWR Fuel Performance/Top Fuel/WRFPM, Orlando, Florida (2010).
[13] DURIEZ, C., et al., Characterization of oxygen distribution in LOCA situations, J. ASTM International 8 (2) (2011).
[14] BROUGHTON, J.M., et al., PBF LOCA tests — Fuel behaviour report NUREG/CR-3184, EGG-2244 (1983).
[15] KARB, E.H., et al., LWR fuel rod behaviour in the FR2 in pile test simulating the heat up phase of a LOCA, Karlsruhe Institute for Technology, KfK 3346 (1983).
[16] BRUET, M., et al., High burn up fuel behaviour during a LOCA type accident: the Flash 5 Experiment, IAEA Technical Committee Meeting on Behaviour of Core Materials and Fission Product Release in Accident Conditions in LWRs, Cadarache (1992).
[17] NUCLEAR ENERGY AGENCY, Safety Significance of the Halden IFA-650 LOCA Test Results, OECD NEA/CSNI/R(2010)5 (2010).
[18] GUILLARD, V., GRANDJEAN, C., BOURDON, S., CHATELARD, P., Use of CATHARE2 Reactor Calculations to Anticipate Research Needs, NURETH-11, Avignon (2005).
[19] ASKELJUNG, P., FLYGARE, J., MARTINSSON, J., NRC LOCA testing program at Studsvik, results on high burnup fuel, Water Reactor Fuel Performance Meeting, Chengdu (2011).
[20] REPETTO, G., JACQ, F., BARRÉ, F., LAMARE, F., RICAUD, J.M. DRACCAR, A new 3D thermal mechanical computer code to simulate LOCA transients on nuclear power plants, ICAPP 2009, Tokyo (2009).


191
INVESTIGATION OF THE RU-43LV FUEL BEHAVIOUR UNDER LOCA CONDITIONS IN CANDU REACTOR
G. HORHOIANU
Institute for Nuclear Research Mioveni, Romania Email: [email protected]
Abstract
The study of fuel behaviour under accident conditions is a major concern in the safety analysis of the pressurized heavy water reactors (PHWRs). In particular, the consequences of reference accidents (or design basis accidents, DBA) such as loss of coolant accident (LOCA) and reactivity initiated accident (RIA) have to be investigated and quantified in comparison to the related safety criteria already defined, in order to prevent from severe core damage that could result from fuel rods failure, fuel ejection into coolant, loss of core coolability and fission products release into primary circuit. Presently, INR Pitesti is developing an advanced fuel design RU-43LV (recovered uranium fuel bundle with 43 elements and low void reactivity feature) based on recovered uranium from LWR. Compared with the current design of 37 — natural uranium element (NU-37) fuel bundle, RU-43LV will have in CANDU reactors of Cernavodă-Romania nuclear power plant (NPP) higher power capability and higher burnup potential. Fuel burnup of RU-43LV fuel will be about two times the burnup usually achieved in CANDU reactors fuelled with natural uranium fuel. The RU43-LV fuel bundle design could compensate also for some of the ageing effects in CANDU type reactors. Cernavodă NPP must consider in the near future changing fuel types from the current NU-37 fuel design to the RU43-LV fuel bundle design as part of Cernavodă NPP strategy to combat the effect of plant ageing. The effect of the design changes of RU-43LV bundle on the reactor safety has been analysed and the results are presented in this paper. Because of the lower outer element linear power ratings of RU-43LV fuel, as compared with those of NU-37 fuel, there is a potential for an increase in reactor power without a decrease in safety margins. As part of conceptual design study, the performance of the RU-43LV fuelled core during a large loss of coolant accident (LLOCA) was assessed with the use of several computer codes. LOCA simulating tests on RU-43LV fuel elements fabricated at INR Pitesti are planned to be performed in C2-LOCA tests capsule and in Loop A of TRIGA research reactor of INR Pitesti. The LOCA tests in capsule C2-LOCA will be instrumented to measure fuel, sheath and coolant temperature, internal element pressure and coolant pressure during the entire irradiation period. The most relevant calculations performed regarding RU43 RV fuel safety are presented in this paper. Also, the stages of an experimental program aiming to study RU-43LV fuel behaviour in high temperature transients are briefly described. 1. INTRODUCTION
The economic context is increasingly demanding for the utilities who, in order to keep competitive, have to produce the cheapest possible kWh while retaining sufficient flexibility to adjust the energy produced to the demand. The response of nuclear reactor operators is to increase reactor power, the cycle length (and thus discharge burnup) and the fuel enrichment. Applying flexible operating modes involve power variations imposing high stresses on the fuel which must be taken into account when considering changes in safety assessment. Furthermore, fuel elements are complex objects, the design of which requires an in-depth knowledge of coupled phenomena (neutronics, thermo hydraulic, thermomechanical, chemical) that are very difficult to separate out. To ensure the reliability and robustness of a new fuel element, to predict its performance (in particular, from a safety point of view, its behaviour in accidental conditions), it is therefore necessary to make use of simulation duly validated by experiment, including integral tests which may reveal previously unknown phenomena. A unique feature of the CANDU reactor design is its ability to use alternative fuel cycles other than natural uranium (NU), without requiring major modifications to the basic reactor design. These alternative fuel cycles, which are known as advanced fuel cycles, utilize a variety of fissile materials, including slightly enriched uranium (SEU) from enrichment facilities, and recovered uranium (RU) obtained from the reprocessing of the spent fuel of light water reactors (LWR).

192
RU is a by-product of many light water reactor (LWR) fuel recycling programs. After fission products and plutonium (Pu) have been removed from spent LWR fuel, RU is left. A fissile content in the RU of 0.9–1.1% makes it impossible for reuse in an LWR without re-enrichment, but CANDU reactors have a sufficiently high neutron economy to use RU as fuel. RU from spent LWR fuel can be considered as a lower cost source of enrichment at the optimal enrichment level for CANDU fuel pellets. In Europe the feedstock of RU is approaching thousands tones and would provide sufficient fuel for hundreds CANDU reactors years of operation. The use of RU fuel offers significant benefits to CANDU reactor operators. RU fuels improves fuel cycle economics by increasing the fuel burnup, which enables large cost reductions in fuel consumption and in spent fuel disposal. RU fuel offers enhanced operating margins that can be applied to increase reactor power. These benefits can be realized using existing fuel production technologies and practices, and with almost negligible changes to fuel receipt and handling procedures at the reactor. On the other side the Cernavodă NPP must consider in the near future changing fuel types from the current, 37-natural uranium element design (NU-37) to the 43-enriched element design fuel bundle (RU-43LV) as part of Cernavodă NPP strategy to combat the effect of plant ageing. “Plant ageing” is used to denote a variety of phenomena, such as pressure creep and boiler tube fouling, which have the effect of reducing operating margins, particularly on the regional overpower trip (ROPT) system. Pressure tubes ageing (creep) allows some coolant to by-pass the fuel bundles along the top of the channel. When the by-pass flow becomes significant, it reduces the critical channel power (CCP). This reduction in heat removal efficiency from the bundles erodes operating margin, thus leading to a loss of operating flexibility. The RU43-LV fuel bundle design could compensate for some of the ageing effects. Its 43-element fuel bundle assembly and critical-heat-flux enhancement buttons offer high operating and safety margins, while maintaining full compatibility with operating CANDU reactors. The greater element subdivision and the use of two element sizes lower the peak linear element rating of a RU43-LV bundle compared to the NU-37 standard CANDU bundle at the same bundle power. The higher operating and safety margins also offer potential of reactor power up rating, which would further increase the economic competitiveness of the CANDU reactor. The application of RU-43LV fuel could be an important element in Cernavodă NPP. For this reason the Institute for Nuclear Research (INR), Pitesti has started a research programmer aiming to develop a new fuel bundle RU-43LV for extended burnup operation in Cernavodă NPP [1–2]. The changes in fuel element and fuel bundle design contribute to the many advantages offered by the RU-43LV bundle. Verification of the design of the RU-43LV fuel bundle was performed in a way that shows that design criteria are met, and are mostly covered by proof tests such as flow and irradiation tests. However, some design parameters was verified by analyses rather than by experiments because appropriate experimental simulations are unavailable in INR Pitesti or because they take a long time to provide results [3–5]. The study of fuel behaviour under accident conditions is a major concern in the safety analysis of the pressurized heavy water reactors (PHWRs). In particular, the consequences of reference accidents (or design basis accidents, DBA) such as loss of coolant accident (LOCA) have to be investigated and quantified in comparison to the related safety criteria already defined, in order to prevent from severe core damage that could result from fuel rods failure, fuel ejection into coolant, loss of core coolability and fission products release into primary circuit. As part of conceptual design study, the performance of the RU-43LV fuelled core during a large loss of coolant accident (LLOCA) was assessed with the use of several computer codes. The conceptual feasibility of RU-43LV core was evaluated against safety criteria.

193
The effect of the design changes of RU-43LV bundle on the reactor safety has been analysed and the results are presented in this paper. An analysis of the consequences of a LOCA will provide a limit on the reactor power increase from the current nominal power. Because of the lower outer element linear power ratings of RU-43LV fuel, as compared with those of NU-37 fuel, there is a potential for an increase in reactor power without a decrease in safety margins. To determine the approximate magnitude of the power increase, thermal hydraulic analyses were performed for a LLOCA scenarios with shut down systems and emergency core cooling (ECC) available; these scenarios was a 35% reactor inlet header (RIH) break. The 35% RIH break was chosen because it leads to a great amount of pressure tube ballooning contacts with the calandria tube in a NU-37 fuelled core. In order to provide an experimental data base for the future regulation of the advanced CANDU fuel, the LOCA in-pile tests are planned to be performed, using RU-43LV fuel, in C2-LOCA capsule of TRIGA research reactor of INR Pitesti. The most relevant calculations performed regarding RU43 RV fuel safety are presented here. Also, the stages of an experimental program aiming to study RU-43LV fuel behaviour in high temperature transients are briefly described in this paper. 2. FUEL BUNDLE DESIGN
The RU-43LV bundle consist of 2 fuel element sizes: small diameter elements in outer and intermediate rings, and larger diameters elements in the inner and centre rings. The small diameter elements (thirty five elements) in the two outer rings allow the peak element ratings in the bundle to be reduced by 20% in comparison to the standard NU-37 bundle. The larger diameter elements (eight elements) in the inner rings of the bundle compensate for the fuel volume lost due to the smaller diameter outer ring elements. The isotopic specification of RU fuel is very similar to slightly enriched uranium fuel, but with higher concentrations of 234U and 236U than the concentration found in enriched fuel derived directly from natural uranium. The RU-43LV design includes a neutron absorber in the central element to reduce the positive reactivity effect associated with a postulated LOCA. During a LOCA, the reduction in coolant pressure results in streaming and the formation of voids in the fuel channels. The presence of voids increases neutron reactivity until the shutdown systems terminate the rise in reactor power. During voiding, the neutron flux peaks at the centre of the bundle and results in the more absorption here, resulting in a negative component to void reactivity. Thus, the presence of an absorber in the centre of the bundle reduces the positive void reactivity effect. Since the neutron absorber is also present during normal operation, all remaining fuel elements in the fuel bundle must contain slightly enriched uranium to offset the reduction in bundle burnup that would result during normal operation if slightly enriched uranium is not used. Dysprosium the neutron absorber selected for use, is a non-radioactive rare earth metal. A form of dysprosium oxide will be mixed with natural uranium oxide powder and formed into ceramic pellets for use in the central element of RU-43LV fuel bundle. The fuel composition (i.e. the amount of dysprosium and slightly enriched uranium) is determined primarily by the magnitude of void reactivity reduction (VRR) and burnup required. As mentioned above, the low void reactivity fuel feature specifically addresses to rector physics issues associated with a postulated LOCA. To maintain compatibility of the new bundle with the existing CANDU reactor systems, the basic overall dimensions of RU-43LV fuel bundle were designed to the same as those of the NU-37 bundle (Fig. 1). The detailed design features of the bundle have continued to evolve as a result of ongoing design analysis and thermohydraulics testing.

194
a) b)
FIG. 1. Comparison of standard NU-37 fuel bundle design and RU-43LV fuel bundle design; a) Standard NU-37 fuel bundle (cross section and the end plate); b) RU-43LV fuel bundle (cross section and the end plate). The pellet shape (dish depth, chamfer angle and width, land width), CANLUB thickness, and other features are based on both analysis, and irradiation experience in the TRIGA Material Testing Reactor of the INR Pitesti. The internal element design provides internal volume to accommodate fission gas pressure, and also minimizes inter-pellet sheath strains. The end cap-to-sheath weld has been designed to avoid any sharp notches and associated stresses at the internal weld-upset region. The sheath thickness is thin to reduce neutron absorption and designed to prevent longitudinal ridge formation and axial collapse due to the coolant pressure and temperature in the reactor. The sheath collapse onto the pellets under coolant pressure and with pellet thermal expansion to promote good heat transfer, who lowers pellet centreline temperatures and decreases fission gas release compared to sheath that does not contact the pellet stack. At the same time, excessive sheath collapse (either axially or circumferentially) that could lead to higher strains and cracking is avoided. The fuel bundle, in all other respects, is designed to be equivalent to the NU-37 bundle to all reactor systems. 3. LARGE BREAK LOCA IN CANDU The LOCA is a design basis accident (DBA) used for the design of the safety emergency cooling systems and the limitation of the power at the hottest point in the core during normal operation. The safety principle is that the coolability of the core has to be preserved. The associated safety requirements are to ensure the resistance of the fuel rods upon quench and post-quench loads and to maintain a coolable geometry in the core. These requirements are formalized in safety criteria, associated with limit values. A large break LOCA in CANDU reactors involves a break in the heat transport system pressure boundary of sufficient magnitude that the reactor regulating system (RRS) is incapable of maintaining reactivity balance. As the pressure tubes and feeder pipes are of relatively small diameter this type of LOCA can only be due to a break in the larger headers above the reactor core. As a consequence, the core fuel rods undergo the following evolution: clad temperature increase and dry-out, transfer of the stored energy from the fuel to the clad, clad ballooning with possible contact with the neighbouring rods, burst failure around 800°C and fuel relocation inside the ballooned zone; beyond this phase, oxidation of the cladding will occur at high temperature leading to a significant clad embitterment before quenching due to reflooding water. The initial phase of the accident (0–5 s) is characterized by a short power transient, which is terminated by either a neutron or process trip. The main safety concern for this short period prior to
12
3
4
5
6
7
8
91011
12
13
14
15
16
17
18
19
2021
23
25
2729
31
33
35
36
37
38
3940
41
42
43
30
32
34 22
24
26
28
1
2
4
6
7
8910
11
12
13
14
15
16
1718
19
20
21
22
23
2425
26
27
28
29
30
31
32
33
34
35
36
37

195
reactor trip is that the fuel temperature might rise sufficiently for the formation of molten UO2, which could potentially cause pressure tube rupture. In turn the resulting hot spots in the pressure tube could result in localized straining and possible failure of the pressure tube. In practice, this safety concern is not realized as the fuel is cooled by the flow of coolant resulting from the blowdown. The second phase of the accident (5–30 s) is characterized by the blowdown and depressurization of the fuel channel prior to emergency core cooling system (ECC) injection. Despite the reactor shutdown, fuel temperatures may remain high due to the degradation in cooling, decay heat and oxidation of the fuel sheath. The fuel sheath may undergo significant deformation and may fail releasing fission products to the fuel channel and subsequently to containment. During this phase, the temperature of the pressure tube also rises and the pressure tube deforms into contact with calandria. Once the pressure tube is in contact with the calandria tube, the moderator acts a heat sink, cooling the pressure tube and preventing failure of the fuel channel. The third phase of the accident (30–200 s) is characterized by the initiation of ECC. During this period, ECC is being into the primary heat transport system, but has not yet reached sufficient levels to effectively cool the fuel. Depressurization of the heat transport system continues and stored heat and decay heat from the fuel is radically removed to the moderator through the pressure tube and calandria tube. Fuel failures are likely during this stage of the accident. During the fourth and final phase of the accident (>200 s) the injection of ECC has reached a level where it can effectively cool the fuel. The heat transport system pumps have tripped, refill of the channels in the core proceeds and a quasi-steady state is attained. 4. THERMAL HYDRAULIC ANALYSES FOR STEADY STATE CONDITIONS
The thermal hydraulic design characteristics of RU-43LV fuel bundles in a CANDU reactor have been studied by investigating the influence of channel-axial heat-flux distribution (AFD) and bundle radial heat flux distribution (RFD) on the critical heat flux (CHF) and the critical channel power (CCP) using ASSERT a thermal hydraulic sub channel two-phase turbulent code [6]. A hypothetical limiting fuel channel is made and assumed to have a channel power of 7.3 MW and a maximum bundle power of 935 KW at the peak power locations. The axial power distribution is dependent on fuel composition and refuelling scheme. The RU-43LV fuel uses a 2-bundle refuelling scheme to meet the current CANDU fuel performance criteria instead of the 8-bundle refuelling scheme of the natural uranium fuel bundle. The axial flux peak location in the channel with RU-43LV fuel bundles tend to move upstream, while NU-37 fuel bundle maintains a cosine shape. The axial heat flux distribution of the RU-43LV fuel bundle is optimized to increase the CCP of the CANDU reactor (6–8% higher that the NU-37 fuel bundle), because the local heat flux is lowered to downstream where dry out preferentially occurs [3–6]. The reduction of maximum linear power and flattened radial power profile of the RU-43LV fuel improve safety as well as operating flexibility. Implementing RU-43LV fuel in existing CANDU reactors will increase the CCPs by 6–8%. The increase in CCP margin can be used by station operation to offset the margin reductions due to reactor ageing, such as the effect of the heat transport system fouling and of diametral creep of the pressure tubes. Alternatively, the increase in margin could be utilized to increase the core power output, particularly in a new reactor.

196
5. THERMAL HYDRAULIC ANALYSES FOR TRANSIENT CONDITIONS (LLOCA 35%RIH)
The thermal hydraulic analyses in the power pulse conditions was performed using CATHENA a thermal hydraulic transient code for simulation of the fuel channel response after break initiation [7]. The thermal hydraulic circuit model used in the power pulse calculations is a full circuit two loops representation of a typical CANDU primary heat transport system (PHTS). The model is identical to the standard model used in the assessment of NU-37 fuel bundles, except that the fuel string thermal hydraulic parameters correspond to those of the RU-43LV bundles. Effects of the bundle ring power flattening and axial channel power are assessed from the code simulations. Figures 2–3 show the temperature transients for PT and CT corresponding to the bundles 1–12 from the fuel channel. The PT temperature monotonously increases up to the time of PT/CT contact and then rapidly cools down due to the heat lost to the surrounding moderator. The PT heat up rate for the RU-43LV bundle is about the same compared to the standard NU-37 bundle. The analysis results presented in Fig. 2 shows that the portion of the PT corresponding to bundles 2–8 is predicted to be ballooned and to contact the CT during 11–16 sec into the accident. Figure 3 shows the variation of calandria tube temperature and Fig. 4 the corresponding variation of calandria tube deformation at different axial positions. The PT contacts its CT at 11 and 16 sec with the average contact temperatures of 762°C for the RU-43LV bundles.
200
300
400
500
600
700
800
0 10 20 30 40 50Time(sec)
Pres
sure
Tub
e T
empe
ratu
re(C
)
FBundle1 FBundle2 Fbundle3
FBundle4 FBundle5 FBundle6
FBundle7 FBundle8 FBundle9
FBundle10 FBundle11 FBundle12
FIG. 2. Pressure tube temperature at different positions (corresponding to bundles 1 to 12) during 35%RIH.

197
50
100
150
200
250
300
350
0 10 20 30 40 50Time(sec)
Cal
andr
ia T
ube
Tem
pera
ture
(C)
FBundle1 FBundle2Fbundle3 FBundle4FBundle5 FBundle6FBundle7 FBundle8FBundle9 FBundle10FBundle11 FBundle12
FIG. 3. Calandria tube temperature at different axial positions during 35%RIH.
0
2
4
6
8
10
12
14
16
18
0 10 20 30 40 50Time (sec)
Pre
ssur
e T
ube
Str
ain(
%)
FBundle1 FBundle2 Fbundle3
FBundle4 FBundle5 FBundle6
FBundle7 FBundle8 FBundle9
FBundle10 FBundle11 FBundle12
FIG. 4. Pressure tube total strains at different axial positions during 35%RIH.
6. THERMAL MECHANICAL ANALYSES 6.1. Analysis methodology
In order to assess the fuel behaviour during the transient, the dynamic response of the fuel element must be considered. That is, phenomena such as sheath deformation, fuel-to-sheath heat transfer

198
coefficient and internal gas pressure should be recognized in the analysis. The steady state thermal mechanical code ROFEM and transient thermal mechanical code CAREB [8] were used to simulate the fuel behaviour for the 35% RIH break case. The steady state fuel element behaviour results were used as initial conditions at the onset of the accident. The RU-43LV fuel elements as well as the NU-37 fuel elements are assumed to follow the CANDU reactor reference high power curve scaled accordingly to each ring of fuel elements. The reference high power curve is a hypothetical power/burnup history that is higher than any power history experienced by fuel bundle in the core. As such, no fuel bundle will follow the entire reference over power curve to discharge. Then, after the onset of the accident, the fuel and fuel-sheath behaviour of the outer fuel elements residing in the core pass downstream of the break (i.e. critical core pass) are evaluated by the transient code. The transient code requires information regarding the fuel-element state during normal operating conditions, which is obtained from steady state code. It also requires the power transient, coolant temperature, coolant pressure and sheath-to-coolant heat transfer coefficients (obtained from the thermohydraulic transient code as transient boundary conditions [8]. 6.2. RU-43LV fuel behaviour in steady state In CANDU reactor each bundle will operates during its life at different power levels according to the radial and axial position in the core. Moreover at each axial and radial position in the core the bundle power level will change during the fuel bundle residence time according to the following conditions:-235U depletion and Pu buildup in the bundle; refuelling of the neighbouring channels and action of the reactivity regulating systems. The typical power history of each bundle in the core can be found by computer code simulation of the core operation and related refuelling. This is currently being done with particular emphasis on the period of operation from startup of the reactor to equilibrium. The power history of individual bundles varies considerably from bundle to bundle. Fuel management simulations create many different sample bundle power histories. In design we use hypothetical bundle power histories that are envelopes of the simulated bundle power histories. For the NU-37 fuel the nominal design bundle power envelope peaks at 800 kW and encompasses all average steady state bundle powers predicted by time averaged physics simulations. The reference overpower bundle envelope peaks at 935 kW and takes fuelling effects into account as predicted by fuel management simulations. It includes about 99% of the fuel bundle power histories. A few bundles will exceed this envelope temporarily due to an unusual or an abnormal fuelling operation, or a short term control transient such as during xenon override. The reference overpower envelope for outer element ring has been considered in our calculations. Figure 5 shows reference high power envelopes for RU-43LV fuel element (outer ring) and for natural uranium fuel NU-37 (outer ring). The high power envelope for RU-43LV fuel element is considerably lower than for natural uranium fuel, and is well below known failure thresholds. The confirmation of fuel performance was provided by modelling the fuel behaviour for the high power envelope, for both the reference NU-37 fuel and RU-43LV fuel design. Analyses of thermal behaviour in steady state conditions included evaluation of the fuel temperature, fission gas generation, release, and fuel element inner pressure. Thermal analysis of the fuel element revealed that for the given linear power histories, the centreline temperature of RU-43LV fuel element is far below the centreline temperature of NU-37 fuel element. Figure 5 shows power histories and fuel centreline temperatures for both fuel elements analysed. Xenon and krypton are the primary fission gases generated in both NU-37 and RU-43LV fuels. The predicted fraction of the fission gas released into free volume of the fuel element was consistently lower for the RU-43LV fuel comparatively with NU-37 fuel and the difference between the two

199
elements tend decrease with burnup. Figure 6 proves that for the RU-43LV case analysed in the present study, the hot fuel element inner pressure remained significantly lower than the NU-37 inner pressure.
0
200
400
600
800
1000
1200
1400
1600
1800
2000
0 100 200 300 400
Burnup(MWh/kgU)
Fuel C
ente
rlin
e T
em
pera
ture
(C
0
10
20
30
40
50
60
70
Lin
ear P
ow
er (k
W/m
)
RU43LV TemperatureNU37 TemperatureRU43LV PowerNU37 Power
Temperature
Linear Power
FIG. 5. Power history and fuel centreline temperature evolution.
0
2
4
6
8
10
12
14
16
0 50 100 150 200 250 300 350 400
Burnup (MWh/kgU)
Inte
rnal
Gas
Pre
ssur
e (M
Pa)
0
0.2
0.4
0.6
0.8
1
1.2
She
ath
Hoo
p S
trai
n (%
)
NU37 Pressure
RU43LV PressureNU37 Strain
RU43LV Strain
Hoop Strain
Gas Pressure
FIG. 6. Steady state fuel behaviour (temperatures and gas pressure evolution).
Dimensional changes of the fuel pellets induce stresses and strains in the cladding. Dynamics of the hoop strain are illustrated in Fig. 6. As pointed out earlier, the pellet radial deformation is lower for the

200
RU-43LV fuel than for NU-37 fuel, therefore, lower hoop strain in the fuel element loaded with fuel pellets. The total hoop strain of the clad is within reasonable range in terms of sheath plastic strain.
6.3. RU-43LV fuel behaviour in transient conditions
The LOCA is assumed to occur at the time of highest fuel element internal pressure during steady state operation. Therefore, the fuel element steady state conditions associated with this time are applied in the transient code for transient simulations. The input boundary conditions (coolant temperature and pressure, sheath to coolant heat transfer coefficient and power in transient) are predicted by transient thermhydraulic code and are shown in Fig. 7 Typical fuel behaviour following a 35%RIH is shown in Figs 7–8 for a fuel element situated in the outer ring of fuel bundle. The fuel element burnup at time of accident is assumed to be 260 MW·h·kg-1. Figure 7 presents the fuel temperatures and internal gas pressure in transient used to analyse comparatively the performance the NU-37 and RU-43LV fuelled channel. The maximum fuel centreline temperatures for the RU-43LV fuel (1522 gr.C) and NU-37 fuel (1810 gr.C) are well below melting and occur both at 2.1 s. The maximum sheath temperature for the RU-43LV fuel and NU-37 fuel are 1190 gr.C and for both and occur both at about 7 s. Therefore the 1200 gr.C peak-sheath temperature criterion has been satisfied.
0
2
4
6
8
10
12
0 5 10 15 20 25 30 35 40Time (s)
Coo
lant P
ress
ure
(M
Pa)
0
1
2
3
4
5
6
7
Rela
tive P
owerCoolant Pressure
Relative Power
FIG. 7. LOCA 35%RIH: Power peak an coolant pressure evolution.
0
200
400
600
800
1000
1200
1400
1600
1800
2000
0 10 20 30 40
Time (s)
Fue
l Tem
pera
ture
(gr
.C)
0
2
4
6
8
10
12
14
16
18
Inte
rnal
Pre
ssur
e (M
Pa)
NU 37NU 37RU 43LVRU 43LVNU 37RU 43LV
Centerline Temperature
Sheath Temperature
Internal Pressure
FIG. 8. Fuel behaviour during LOCA 35%RIH (temperatures, gas pressure evolution).

201
Figure 9 presents calculated sheath strains and stress in the sheath. From these figures it can be seen than the calculated values for RU-43LV fuel are lower than those of NU-37 fuel.
-40
-20
0
20
40
60
80
100
120
0 5 10 15 20 25 30 35 40Time (s)
Sh
eath
Str
ess
(MP
a)
0
0.5
1
1.5
2
2.5
3
3.5
4
Sh
ea
th S
tra
in (
%)NU 37
RU 43LVNU 37RU 43LV
Sheath Strain
Sheath Stress
FIG. 9. Fuel behaviour during LOCA 35%RIH (sheath hoop stress and strains).
Early in the transient, the flow in the channel approaches stagnation and the sheath-to-coolant heat transfer is significantly reduced resulting in an increase in the net heat flow into the sheath. The heat content within the fuel rapidly redistributed (i.e. a decrease in the fuel centreline temperature with an increase in the surface temperature) and therefore the sheath experience a significant temperature rise. The increase in sheath temperature reduces the net influx, since temperature gradient between the fuel surface and the sheath is reduced. The coolant flow moves away from the stagnation point and a reverse flow rate is established. The reverse flow result in an increase in heat removal from the sheath and sheath temperature decreases. Later in the transient (~20 s) the sheath experiences a second heat-up period resulting from near stagnation conditions. However at this time the heat content within fuel has been significantly reduced by heat removal associated with the previous off-stagnation period. Sheath failures are assumed to occur if the transient code results indicate that any of the following criteria are satisfied:
a) 2% sheath hoop strain and sheath temperature greater than 1000°C;
b) 5% sheath hoop strain at any sheath temperature;
c) fuel centreline melting (greater than 2840°C);
d) oxygen concentration in the sheath greater than 0.7 wt% over at least half of the cladding tube thickness;
e) probability of beryllium-braze assisted cracking greater than 1%. Failure mechanisms (a), (b) and (c) are the most relevant sheath failure mechanisms for a large break LOCA analyses. Failure criteria (d) and (e) are more applicable when the sheath remains at high temperature for prolonged periods of time which are not expected in CANDU reactor during a LLOCA having ECC available. The RU-43LV fuelled high power channel was increased in power until the first acceptance criterion was met. The code results show that even at the elevated power (15% higher) the centreline temperature and the internal gas pressure are lower for RU-43LV fuel than those of NU-37 fuel. In terms of the available fission product gap inventory for release after sheath failure, RU-43LV fuel has a lower inventory. This lower gap inventory, combined with greater margin to fuel failure, will result in lower fission product release at failure. The sheath strains failure due to internal gas pressure is one of the mechanisms, which is of concern with respect to fuel integrity during the postulated accident. The sheath strains predicted by transient

202
code are significantly below the 5% failure criterion for RU-43LV fuel elements; therefore, sheath failure caused by excessive straining is precluded. The total sheath strain is composed of three components: elastic straining, thermal expansion straining, and plastic/creep straining. The stresses and temperatures occurring during a LOCA transient may result in significant changes in the Zircaloy microstructure (grain size, dislocation density and phase changes alpha-to-beta). The creep behaviour of the Zircaloy sheath during a LOCA is dependent on these micro structural changes. The pre-transient analysis predicts that the sheath is in contact with the fuel pellet at the onset of the accident; however, a radial gap develops during the LOCA transient. The hoop stress in the sheath becomes tensile (as the coolant pressure falls below the element internal gas pressure). The ~20% reduction in the linear element rating of the RU-43LV bundle (compared to the NU-37 bundle) results in a substantial reduction of the fission product inventory in the fuel-to-sheath gap. For example, at the same maximum bundle power, the iodine gap inventory in the maximum — rated element in a RU-43LV bundle is estimated to be 3 times lower than the maximum — rated element in a NU-37 bundle. This reduction provides several benefits. For accident in which a number of fuel elements are predicted to fail and their fission product gap inventory released the radiological consequences will be reduced with the use of the RU-43LV bundle. This further enhances the safety performance of the reactor. The lower gap inventory and lower power will also to lower activity burden in the heat transport circuit in the event of fuel failure during normal operation. The lower gap inventory will also reduce the radiological contamination on the heat transport circuit that arises from activity release from failed fuel. Consequently, the man-rem exposure during reactor maintenance is expected to be less, resulting in occupational health and cost benefits. 7. LOCA IN-PILE TESTS NECESITY The LOCA in-pile test necessity results from three reasons. Neutron flux provides the unique way to produce the correct heat generation in the fuel fragments, corresponding to the residual power, whatever are the relocations induced by the ballooning and/or the burst of the rod. Both the exact amount of heat generation in the balloon and the heat exchange with the rod channel depend on the characteristics of the relocated fuel fragments, their size, shapes, compaction ratio. This heat generation correctness is one of the main conditions for having realistic estimates of the relocation consequences in terms of equivalent clad reacted, peak clad temperature and hydrogen uptake inside the balloon. All these aspects impact the strength of the rod during the quenching phase and the residual ductility of the rod after the LOCA transient. During the blowdown phase of the LOCA transient, there is much less heat generation in the fuel and the clad coolant heat transfer is drastically reduced. Therefore, the fuel stored energy is distributed in the pellet and the cladding. Simultaneously, within a few seconds, this redistribution produces a decrease of the pellet centerline temperature and an increase of both the pellet rim and clad temperatures. Due to these temperature transients, the central part of the pellet will experience a contraction while the rim and the clad will undergo an expansion. Fuel mechanical stresses and fragmentation could be induced by these adverse effects. It has to be kept in mind that during usual experiments, for which a blowdown phase is not produced, clad and fuel temperatures are simultaneously increased or decreased without producing any comparable thermo mechanical transient. In-pile tests including a blowdown phase provide the way to get a definitive answer regarding the additional fuel fragmentation prior to the relocation and how much this refragmentation process affects the amount and the characteristics of the relocated fuel. Finally, during reflooding and quench process studies, in-pile tests allow to maintain the heat generation in the fuel corresponding to the residual power. By this way, more representative conditions of the thermo mechanical loads of the rods are provided. Without such a power during the reflooding phase, steam production and cladding oxidation are reduced; the temperature transients

203
experienced by the rods are less severe. Consequently, under estimates of core embrittling during reflooding could be obtained. 8. LOCA IN-PILE TESTS ON RU-43LV EXPERIMENTAL FUEL ELEMENTS IN
TRIGA RESEARCH REACTOR The objective of the LOCA experimental programme of INR Pitesti is to obtain fuel behaviour data from in-reactor tests under representative Loss of Coolant Accident scenario [1–2]. The experimental results obtained will be used to analyse the effect of design changes of RU-43RV fuel bundle on reactor safety and for benchmarking computer codes used in CANDU safety and licensing. The C2-LOCA test in TRIGA research reactor of INR Pitesti will be conducted under conditions representative of a LOCA. The capsule C2 will be instrumented to measure fuel, sheath and coolant temperatures, internal gas pressure and coolant pressure. Experimental fuel element design for LOCA tests is presented in Fig. 10. The high temperature transient will be produced by isolating the test section from the loop coolant supply while the reactor is at power, and allowing the coolant to blow down from the top and bottom of the test section simultaneously through a preset orifice valve into the disposal tank. The rate of depressurization and the magnitude of temperature rise in the fuel and sheath will be controlled by the amount of fission heat produced between blow down initiation and reactor shutdown. Complete sheath dry out will occurred after initiation of blow down. Voiding of the test section will result in a fuel power increase. The blow down transient will be terminated automatically by cold water injection (rewet) at a preset test pressure and return to initial pressure loop cooling.
322,4
APROX. 346,4
306 ± 0,21,4
TIGTIG
WELDWELD
PELLET STACK
SPACER
BEARINGPAD
TUBE
T/C : CLADDINGTEMPERATURE
END CAP
T/C : CENTRALTEMPERATURE
PRESSURESENSOR
FIG. 10. Experimental fuel element design (B37, B38) for LOCA type tests in C2-LOCA capsule.
9. CONCLUSIONS
The advanced CANDU fuel bundle design RU-43LV, has three major design improvements over the NU-37 standard bundle: bundle ring power flattening, CHF enhancement and reduced positive void reactivity effect.
The effect of each of the three design changes of RU-43LV bundle on CANDU reactor safety margins improvement has been assessed for the representative accident scenario, LOCA 35%RIH break using several computer codes simulations.

204
From the thermal hydraulic analyses resulted that the pressure tube temperatures at PT/CT contact during LOCA 35%RIH are lower for RU-43LV fuelled core than for NU-37 fuelled core case.
Localized hot spots on the pressure tube due to bearing-pad/pressure tube contact during LOCA 35%RIH results in localized deformation of pressure tube.
No channel failures during a 35%RIH has been assessed for both RU-43LV and NU-37 fuelled core cases.
No fuel element failures were predicted to occur for the RU-43LV fuelled channel even at the 11% more elevated power.
RU-43LV fuel element centreline and sheath temperature during the 35%RIH accident are either less than or comparable to those of the NU-37 fuelled channel.
The low linear powers and the better void reactivity associated with RU-43 LV design has increased the safety margins. The reactor conditions (reactor power transient and flow conditions) during the transient do not lead to any significant increase in fuel volumetric average temperature relative to the steady state conditions.
The amount of fission product release is significantly reduced for RU-43LV compared to NU-37 fuel, and so the dose to the public are reduced significantly due to the reduction of initial gap inventory and the number of failed fuel elements.
There is up rating potential available with RU-43LV fuelled core of CANDU reactor and the design improvements increases the safety margins.
The C2-LOCA capsule is under reconstruction in TRIGA Research Reactor of INR Pitesti. A number of instrumented LOCA tests on RU-43LV experimental fuel elements are planned to be performed in C2 -LOCA capsule.
REFERENCES
[1] HORHOIANU, G., Nuclear Fuel R&D Program of INR Piteşti for the Period 2005–2010, Internal Report No. 7212 / 2005, INR Piteşti, Piteşti (2005).
[2] HORHOIANU, G., Nuclear Fuel R&D Program of INR Piteşti for the period 2010–2015, Internal Report No. 8779, INR Piteşti, Piteşti (2010).
[3] HORHOIANU, G., Pătrulescu I., Technical feasibility of using RU-43 fuel in the CANDU -6 reactors of the Cernavodă NPP, Kerntechnik 73 (2008)
[4] HORHOIANU, G., Nuclear Fuel R&D Program Activities in 2011, Internal Report No. 9070 / 2012, INR Piteşti, Piteşti (2011).
[5] CATANA, A., HORHOIANU, G., Advanced thermal-hydraulic analysis for 43-element fuel bundles versus standard CANDU fuel bundles, SIEN 2011 Conference, Bucharest (2011).
[6] RIZOIU, A., HORHOIANU, G., Preliminary reactor physics studies on using advanced fuel bundles in CANDU, NUCLEAR 2011 International Conference, INR Piteşti, Piteşti (2011).
[7] SERBĂNEL, M., HORHOIANU, G., RIH 35% large break LOCA analyses for the RU43 fuel core of CANDU reactor, NUCLEAR 2011 International Conference, INR Piteşti, Piteşti (2011).
[8] HORHOIANU, G., RU43 fuel element behaviour in CANDU reactor LOCA conditions, Internal Report No. 7902 / 2007, INR Piteşti, Piteşti (2007).

EXPERIMENTAL LOCA STUDIES (Session 5)
Chairpersons
J.C. BRACHET (CEA)
F. NAGASE
(JAEA)


207
HIGH BURNUP FUEL BEHAVIOUR UNDER LOCA CONDITIONS AS OBSERVED IN HALDEN REACTOR EXPERIMENTS
E. KOLSTAD, W. WIESENACK, B. OBERLÄNDER, T. TVERBERG Institutt for Energiteknikk OECD Halden Reactor Project Halden, Norway Email: [email protected]
Abstract
In the context of assessing the validity of safety criteria for loss of coolant accidents with high burnup fuel, the OECD Halden Reactor Project has implemented an integral in-pile LOCA test series. In this series, fuel fragmentation and relocation, axial gas communication in high burnup rods as affected by gap closure and fuel–clad bonding, and secondary cladding oxidation and hydriding are of major interest. In addition, the data are being used for code validation as well as model development and verification. So far, nine tests with irradiated fuel segments (burnup 40–92 MW·d·kg-1) from PWR, BWR and VVER commercial nuclear power plants have been carried out. The in-pile measurements and the PIE results show a good repeatability of the experiments. The paper describes the experimental setup as well as the principal features and main results of these tests. Fuel fragmentation and relocation have occurred to varying degrees in these tests. The paper compares the conditions leading to the presence or absence of fuel fragmentation, e.g., burnup and loss of constraint. Axial gas flow is an important driving force for clad ballooning, fuel relocation and fuel expulsion. The experiments have provided evidence that such gas flow can be impeded in high burnup fuel with a potential impact on the ballooning and fuel dispersal. Although the results of the Halden LOCA tests are, to some extent, amplified by conditions and features deliberately introduced into the test series, the fuel behaviour identified in the Halden tests has an impact on the safety assessment of high burnup fuel and should give rise to improvements of the predictive capabilities of LOCA modelling codes. 1. INTRODUCTION In the context of assessing the validity of safety criteria for loss of coolant accidents with high burnup fuel, the OECD Halden Reactor Project has implemented an integral in-pile LOCA test series. In this series, fuel fragmentation and relocation, axial gas communication in high burnup rods as affected by gap closure and fuel–clad bonding, and secondary cladding oxidation and hydriding are of major interest. In addition, the data are being used for code validation as well as model development and verification. The Halden reactor test series focuses on in-reactor effects that are different from those obtained in out-of-reactor tests. In particular, the heating from within the fuel rod, in contrast to the external heating of out-of-pile setups, may affect a number of phenomena. The primary objectives are to:
Measure the extent of fuel (fragment) relocation into the ballooned region and evaluate its possible effect on cladding temperature and oxidation.
Investigate the extent of ”secondary transient hydriding” of the cladding above and below the burst region.
A third objective was added in 2009 and applied to the most recent tests: Measure the release of iodine and caesium from failed fuel in LOCAs. So far, nine tests with irradiated fuel segments (burnup 40–92 MW·d·kg-1) from PWR, BWR and VVER commercial nuclear power plants have been carried out. The in-pile measurements and the PIE results show a good repeatability of the experiments. The paper describes the experimental setup as well as the principal features and main results of these tests.

208
2. DESIGN FEATURES OF THE HRP LOCA TEST FACILITY The Halden reactor LOCA tests are integral in-pile experiments where the decay heat is simulated by a low level of nuclear heating, in contrast to heating from outside in hot laboratory setups. The thermal expansion of fuel and clad relative to each other is therefore more similar to the real event. The cross-section of the test rig is shown in Fig. 1.
FIG. 1. Cross section of Halden Reactor LOCA test device.
The test rig with the fuel rod is inserted into a flask connected to a high pressure loop with a blowdown system. The cladding temperature transient is mainly controlled by the rod power level. An annular flow separator surrounding the rod contains electrical heating cables to support the heating up and to obtain a lower temperature gradient in the innermost section. The available space allows for a ballooning strain of more than 100% for typical LWR fuel rod diameters. The rod length can be up to 50 cm which is essential for assessing the axial gas communication between the plenum and the ballooning spot. The rod is positioned axially such that the maximum neutron flux and power will occur at about half height of the fuel stack. Figure 2 shows a typical as measured neutron flux distribution (three axially spaced neutron detectors) which will cause a power distribution with a similar shape. The rig instrumentation (Fig. 3) enables power calibration, neutron flux monitoring, and the measurement of the heater temperature with several thermocouples. The rod instrumentation includes two to three cladding thermocouples, a rod pressure sensor, and a cladding extensometer. The latter two will give clear indications of failure which will also be detected by a gamma detector on the blowdown line. If fuel relocation occurs, the cladding and heater thermocouples will usually show temperatures changes which deviate from the expected development due to a change of local power at their axial position. After blowdown, the pressure flask is filled with insulating steam, while HBWR coolant fills the space between the flask and the outer shroud.

209
FIG. 3. Layout of rig with instrumentation.
3. OVERVIEW OF HALDEN REACTOR LOCA TESTS The nine tests with pre-irradiated commercial fuels and the three commissioning tests encompass fuel with varying characteristics and test execution parameters. Among these are the plenum volume, fill gas pressure, peak cladding temperature (PCT), duration of temperature transient, and the application of spray at high temperatures. An overview of fuels and cladding applied in these tests is given in Table 1.
TCHs (Heater TCs)TCs
2,3
3
2
11
FIG. 2. Typical neutron flux distribution.

210
TABLE 1. OVERVIEW OF HALDEN REACTOR LOCA TEST
Where similar parameters and characteristics were present, the tests showed a good repeatability, e.g., test 4 and test 9 with considerable fuel fragmentation and relocation. The burst temperatures are in good agreement with those found in other test series as shown in Fig. 4.
FIG. 4. Burst temperature observed in Halden LOCA tests (red bullets) and as reported by D.L. Chapin et al. (Top Fuel 2009, Paris). 4. FUEL FRAGMENTATION AND RELOCATION Studying fuel fragmentation and relocation and the consequences on the local cladding heat-up and oxidation is one of the main objectives of the OECD Halden Reactor Project experimental program on LOCA. The phenomena have manifested themselves in various ways in the different experiments, e.g., as temperature development deviating from the expected course, accumulation of fuel fragments in ballooned areas and at the bottom of the pressure flask (in both cases visible through gamma

211
scanning), and as seen in neutron radiography and other PIE. Some findings are summarised in the following sections. 4.1. LOCA test IFA-650.4 In this test, a PWR fuel segment with 92 MW·d·kg-1U burnup was used. The liner cladding contained a relatively low amount of hydrogen (50 ppm). The test execution aimed at a peak clad temperature (PCT) of about 850°C. Failure occurred at about 790°C. Gamma scanning revealed large deformations, significant fuel fragmentation & relocation, and fuel dispersal into the test channel. PIE is completed, and selected results are summarized in Figs 5–6.
FIG. 5. Fuel relocation (gamma scan, upper part of figure) and cladding deformation (lower part). Fuel fallen to the Bottom of the pressure flask (spot on right hand side). The cladding widened along the entire length and ballooned at about half height as expected from the power and thus cladding temperature distribution. The balloon touched the wall of the surrounding heater wall. The upper part of the cladding tube is void of fuel. A considerable amount of fuel has fallen to the bottom of the pressure flask (right side of gamma scan, upper part of Fig. 5). The majority of the fragments have a size of 100 μm or less (Fig. 7, upper graph). Each fragment size class covers about the same area fraction (slightly more for the smaller fragments, Fig. 7, lower graph). The filling ratios for the five cross sections shown in Fig. 6 were determined as follows:
Pos 305 35.70%
Pos 275 38.00%
Pos 255 41.40%
Pos 235 36.80%
Pos 232 42.60%
Average 38.90% ± 2.2%

212
FIG. 6. Fragmented and relocated fuel in balloon area (fixed with epoxy prior to handling).
FIG. 7. Size distribution of fragments (upper graph, logarithmic scale) and their area coverage (lower graph, linear scale).
4.2. LOCA TEST IFA-650.5 A PWR segment with 83 MW·d·kg-1U burnup was employed in this test. The cladding had considerably more hydrogen (650 ppm) compared to IFA-650.4. The target PCT was 1100°C, and failure occurred at about 750°C. While the internal fuel fragmentation was considerable, small cladding deformations gave fewer rises to fuel relocation. PIE is completed. The cladding deformation and fuel fragmentation is shown in Fig. 8.
FIG. 8. Cladding deformation and fuel fragmentation in LOCA test IFA-650.5
10,5
11
11,5
12
12,5
13
1 3 5 7 9 11 13 15 17 19 21 23 25 27 29 31 33 35 37 39 41 43 45 47 49 51 53 55 57 59 61
M6n 232mm
M6 235mm
M4 275mm
M3/4r 305mm

213
It appears that the upper half of the fuel rod was less affected by the transient, as indicated by the smaller distension over a length of about 25 cm. Pellet cracking is influenced by the constraint exerted by the cladding at the moment of failure. At the upper half (strong contact), the cracking from normal operation prevails. Where the cladding distended (lower half), the sudden drop of pressure caused additional pellet cracking. The distribution of fragment sizes in the more cracked lower part resembles that of IFA-650.4. 4.3. LOCA TEST IFA-650.6 The segment used in this test was from a VVER reactor and had accumulated a burnup of 56 MW·d·kg-1. The cladding had a thin oxide layer of <10 μm. The target peak clad temperature during the test was 850°C. While the previous two rods were backfilled with 40 bar helium (r.t), test 6 had a fill pressure 30 bar (r.t.). Failure occurred between 820°C and 830°C. Moderate clad deformation and fuel relocation was observed. PIE is completed. Figure 4.5 shows the fragmentation of the fuel.
FIG. 9. Fuel fragmentation in IFA-650.6. The fragmentation is characterised by large fragments which most likely were already generated during the pretest irradiation. The hollow fuel exhibits more radially oriented cracks than solid fuel (compare Fig. 9, cross section to the right). 4.4. LOCA TEST IFA-650.7
FIG. 10. Neutron radiography of IFA-650.7 segment. A BWR segment with 40 MW·d·kg-1 burnup was used in this test. The target PCT, 1150°C, was higher than in the previous tests. The aim was to delay failure to a cladding temperature exceeding

214
1000°C, i.e., when the material had developed a β-phase. This objective was supported by using a low fill pressure of 6 bar (r.t.), and the cladding failed indeed as expected between 1050°C and 1100°C. A quite uniform cladding deformation was observed. PIE is completed. Figure 10 shows the appearance of the fuel stack as seen with neutron radiography. The combination of uniform clad diameter increase of 15–25% along the rod and high PCT (1150°C) produced significant fuel cracking and fragmentation along the entire rod length although the fuel burnup was moderate (40 MW·d·kg-1U). The low gas pressure may have contributed to this outcome as well. Most of the fuel stack has a granular appearance without discernible pellet structure. Only the lower part shows pellets in their original shape and position. 5. AXIAL GAS COMMUNICATION In principle, a LOCA burst opening is large enough to cause an instantaneous and complete loss of rod pressure on cladding failure. However, some of the Halden reactor LOCA tests exhibited a remarkably slow pressure drop as measured in the plenum of the refabricated segments. Where this happened, the rods showed some remaining restriction in the line of axial gas communication, e.g. little cladding distension and thus pellet — cladding contact, or plugs of intact fuel at the upper end close to the plenum. The as measured pressure drop of four tests is summarised in Fig. 11.
FIG. 11. Pressure drop in some HBWR LOCA tests.
Of the experiments depicted in the graph, only IFA-650.4 showed the expected instantaneous pressure drop, while the other three experienced a considerably slower development. IFA-650.3 is not further treated in this paper (it failed due to reasons not relevant for LOCA testing). IFA-650.9 had the following characteristics:
The fuel, sibling of IFA-650.4, was a PWR segment with 90 MW·d·kg-1 burnup and low hydrogen content in the cladding. The target PCT was 1100°C. Fuel failure occurred at about 810°C. Very similar to IFA-650.4, large deformations, significant fuel fragmentation and relocation, and fuel dispersal into test channel was observed. This is clearly shown by the

215
gamma scan, Fig. 12. A salient feature is the empty upper third of the rod and a plug of two pellets between the fuel stack and the plenum at the upper end. (Note that the horizontal and vertical scales of the graph in Fig. 12 are different. The original stack length is about 50 cm.)
FIG. 12. Gamma scan of IFA-650.9.
6. HYDRAULIC DIAMETER MEASUREMENTS The Halden project is routinely applying the technique of “hydraulic diameter measurement” (HD to assess the gas permeability of high burnup fuel. The technique employs a reservoir that is emptied through the fuel rod, at the same time measuring the pressure in the reservoir.
FIG. 13. Hydraulic diameter changes in high burnup fuel.
Hydraulic diameter measurements are a fine instrument for detecting typical changes that fuel is undergoing during irradiation: initial pellet cracking and fragment relocation, solid fission product fuel

216
swelling and the development of a minimal hydraulic diameter as fuel and cladding accommodate to each other. An example of application to high burnup fuel is taken from the OECD Halden Reactor Project rod overpressure test series. Figure 13 shows sensitivity of the method and that it is able to detect the response to extended periods of overpressure and changing rod power. The hot standby gap of about 30 μm is typical of high burnup fuel where cladding and fuel have accommodated to each other during operation. 7. APPLICATION TO LOCA TESTS The LOCA setup resembles the hydraulic diameter measurement technique in that the rod plenum (reservoir) is emptied through the fuel stack and the balloon opening. The slow loss of pressure in tests 5 and 9 was therefore analysed with this technique. The outcome is shown in Fig. 14 (IFA-650.5) and Fig. 15 (IFA-650.9).
FIG. 14. Gas flow and hydraulic diameter derived from pressure drop, IFA-650.5.
FIG. 15. Gas flow and hydraulic diameter derived from pressure drop, IFA-650.9.

217
The general gap size derived from the analysis of the pressure drop in the upper rod plenum is typical of high burnup fuel at hot standby conditions, compare Fig. 15. Most of today’s LOCA codes seem to lack models to consider the effect of axial gas communication. Since the Halden pressure drop (or gas flow) data can be successfully interpreted within the analytical framework of hydraulic diameter measurements, the capability to take gas flow into account can be added to codes accordingly. In this context, it is important to have evidence that the free space in the fuel column (usually calculated as gap) under LOCA conditions is closely linked to the corresponding values derived for normal operation conditions as shown in Fig. 15. 8. SUMMARY
The results can be summarized as:
The Halden LOCA test program has investigated the behaviour of high burnup PWR, BWR and VVER fuel segments (40–92 MW·d·kg-1). The results show excellent repeatability; similar type of rods subjected to similar temperature transients exhibit very similar behaviour. Examples are IFA-650.4 vs. 650.9, IFA-650.5 vs. 650.10 and IFA-650.6 vs. 650.11.
Cladding failure temperature and mode depend on rod gas pressure, cladding state (ductility/hydrogen content) and fuel burnup. Zry-4 claddings with hydrogen content 250–650 ppm failed below 800°C with moderate deformations and little relocation.
Axial fuel relocation and dispersal into test channel were seen in two tests with high burnup fuel (90–92 MW·d·kg-1) and ductile cladding. The extent of fuel fragmentation/relocation occurring in a LOCA will depend on burnup, cladding deformation, PCT, failure/non-failure. A fuel filling ratio in the balloon area of around 40% was found in IFA-650.4.
The evaluation of the pressure drop (hydraulic diameter) after burst indicated impeded axial gas flow in some tests. The derived hydraulic diameters compare well to those found for high burnup fuel in normal operation conditions.
Although the results of the Halden LOCA tests are, to some extent, amplified by conditions and features deliberately introduced into the test series, the fuel behaviour identified in the Halden tests has an impact on the safety assessment of high burnup fuel and should give rise to improvements of the predictive capabilities of LOCA modelling codes.
BIBLIOGRAPHY
[1] KOLSTAD, E., LOCA testing at Halden, status and plans, LOCA Workshop Meeting at Argonne (2006).
[2] LOCA–experiment med høgutbränt bränsle i Haldenprogrammet, Forskningssemin-arium Reaktorsäkerhet, Aronsborg, Stockholm (2010).
[3] KOLSTAD, E., WIESENACK, W., KEKKONEN, L., OBERLÄNDER, B., LOCA testing at Halden; recent tests and plans, LOCA Workshop Meeting at Argonne, Argonne (2007).
[4] KOLSTAD, E., WIESENACK, W., OBERLÄNDER, B., A comparison of fuel fragmentation and relocation behaviour in Halden reactor LOCA experiments, Fuel Safety Research Meeting, Tokyo (2009).
[5] KOLSTAD, E., WIESENACK, W., Overview of LOCA testing program, IAEA Regional Workshop on Nuclear Fuel Issues During Steady State and Transient Conditions, Halden (2010).

218
[6] WIESENACK, W., KEKKONEN, L., OBERLÄNDER, B., Axial gas transport and loss of pressure after ballooning rupture of high burnup fuel rods subjected to LOCA conditions, Physor 2008 Conference, Interlaken (2008).
[7] WIESENACK, W., KEKKONEN, L., Overview of recent and planned Halden Reactor Project LOCA experiments, Fuel Safety Research Meeting, Tokyo (2007).
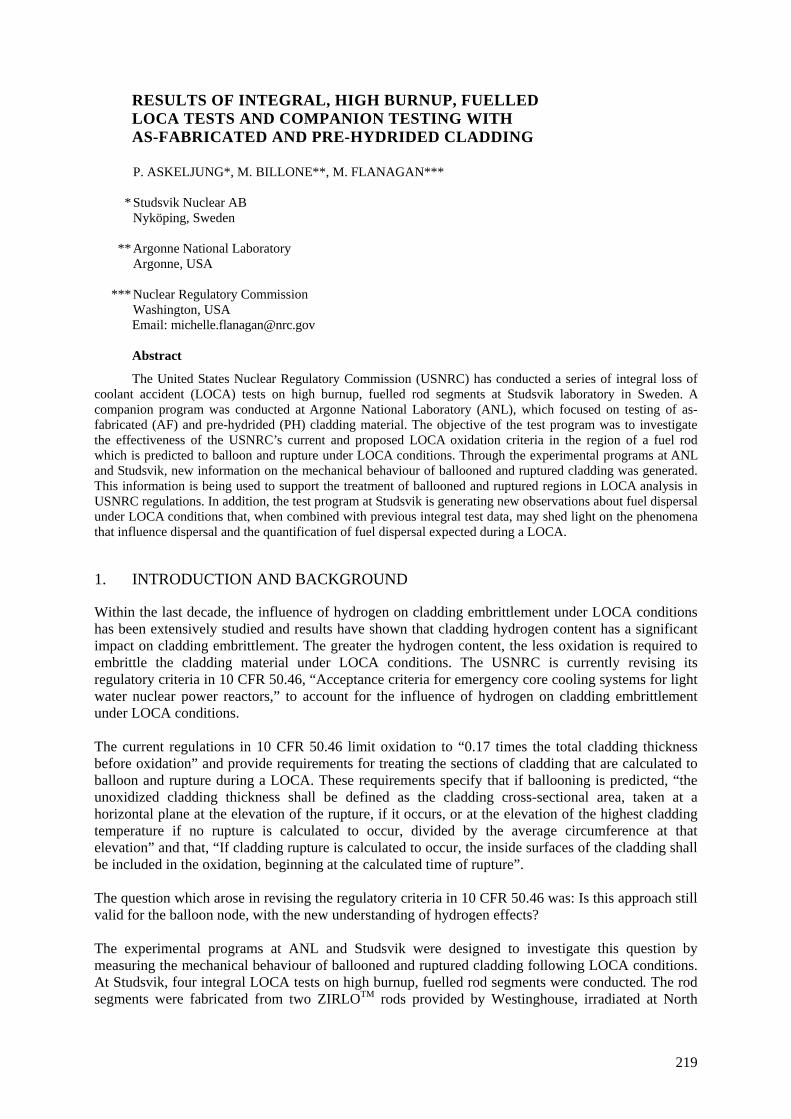
219
RESULTS OF INTEGRAL, HIGH BURNUP, FUELLED LOCA TESTS AND COMPANION TESTING WITH AS-FABRICATED AND PRE-HYDRIDED CLADDING
*
**
***
P. ASKELJUNG*, M. BILLONE**, M. FLANAGAN*** Studsvik Nuclear AB Nyköping, Sweden Argonne National Laboratory Argonne, USA Nuclear Regulatory Commission Washington, USA
Email: [email protected]
Abstract
The United States Nuclear Regulatory Commission (USNRC) has conducted a series of integral loss of coolant accident (LOCA) tests on high burnup, fuelled rod segments at Studsvik laboratory in Sweden. A companion program was conducted at Argonne National Laboratory (ANL), which focused on testing of as-fabricated (AF) and pre-hydrided (PH) cladding material. The objective of the test program was to investigate the effectiveness of the USNRC’s current and proposed LOCA oxidation criteria in the region of a fuel rod which is predicted to balloon and rupture under LOCA conditions. Through the experimental programs at ANL and Studsvik, new information on the mechanical behaviour of ballooned and ruptured cladding was generated. This information is being used to support the treatment of ballooned and ruptured regions in LOCA analysis in USNRC regulations. In addition, the test program at Studsvik is generating new observations about fuel dispersal under LOCA conditions that, when combined with previous integral test data, may shed light on the phenomena that influence dispersal and the quantification of fuel dispersal expected during a LOCA. 1. INTRODUCTION AND BACKGROUND Within the last decade, the influence of hydrogen on cladding embrittlement under LOCA conditions has been extensively studied and results have shown that cladding hydrogen content has a significant impact on cladding embrittlement. The greater the hydrogen content, the less oxidation is required to embrittle the cladding material under LOCA conditions. The USNRC is currently revising its regulatory criteria in 10 CFR 50.46, “Acceptance criteria for emergency core cooling systems for light water nuclear power reactors,” to account for the influence of hydrogen on cladding embrittlement under LOCA conditions. The current regulations in 10 CFR 50.46 limit oxidation to “0.17 times the total cladding thickness before oxidation” and provide requirements for treating the sections of cladding that are calculated to balloon and rupture during a LOCA. These requirements specify that if ballooning is predicted, “the unoxidized cladding thickness shall be defined as the cladding cross-sectional area, taken at a horizontal plane at the elevation of the rupture, if it occurs, or at the elevation of the highest cladding temperature if no rupture is calculated to occur, divided by the average circumference at that elevation” and that, “If cladding rupture is calculated to occur, the inside surfaces of the cladding shall be included in the oxidation, beginning at the calculated time of rupture”. The question which arose in revising the regulatory criteria in 10 CFR 50.46 was: Is this approach still valid for the balloon node, with the new understanding of hydrogen effects? The experimental programs at ANL and Studsvik were designed to investigate this question by measuring the mechanical behaviour of ballooned and ruptured cladding following LOCA conditions. At Studsvik, four integral LOCA tests on high burnup, fuelled rod segments were conducted. The rod segments were fabricated from two ZIRLOTM rods provided by Westinghouse, irradiated at North

220
Anna Power Plant. The father rods had a rod average burnup of ~70 GW·d·Mt-1U and a measured hydrogen content of about 200 wppm. A companion program was conducted at Argonne National Laboratory (ANL), which focused on testing of as-fabricated and pre-hydrided ZIRLOTM. In both of these experimental programs, segments of pressurized, as-received, prehydrided and irradiated cladding, approximately 300 mm in length, were ramped in steam from 300°C to a target hold temperature of about 1200°C at a rate of 5°C·s-1. Internal pressures were chosen to induce ballooning and rupture, with rupture strains in the range of 20–70%. Hold times were selected to achieve various oxidation levels (ECR), with consideration of the strain and hydrogen content. The test train and furnace used to conduct these experiments are shown in Fig. 1 (a).
(a) (b)
FIG. 1. The single rod, integral test train used at Studsvik (a); and the four point bend device used at Studsvik (b). Both pieces of equipment were designed based on equipment at ANL. Benchmark and calibration activities confirmed equipment comparability. In the balloon region, two phenomena exist which are particularly unique as compared to the remainder of the fuel rod length. First, in the ballooned region, the wall thickness is reduced and non-uniform. In addition, multiple research programs have revealed that regions of high hydrogen concentration form just above and below the rupture location, as a consequence of oxidation of the inside cladding surface by stagnant steam. Considering these two phenomena, four-point bend tests (4PBTs) were used to evaluate the residual mechanical behaviour in the balloon region following the LOCA simulation. The four point bend test was used to induce a uniform bending moment in the balloon region by ensuring the loading points were beyond the local regions of interest (the region of non-uniform cladding thickness and the regions of high hydrogen content), as shown in Fig. 1 (b). Doing so does not bias the failure location to the center of the rupture, and if in fact a region of high hydrogen content above or below the rupture region were weaker, failure might occur at that location. Following the test, the axial location and nature of fracture were recorded. The maximum bending moment (measure of strength), failure energy (measure of toughness), and offset displacement (measure of plastic displacement) were determined by examining the load displacement curves. The observations of bend tests on irradiated material were compared to bend test results on as-received and pre-hydrided ballooned and ruptured samples run at ANL. By comparing the parameters determined from load displacement curves, the influence of oxidation, irradiation, balloon size, bend test temperature and hydrogen content could be investigated. 2. FINDINGS RELATED TO MECHANICAL BEHAVIOUR OF BALLOONED AND RUPTURED REGIONS In this test program, 13 four-point bend tests were conducted at ANL on as-fabricated ZIRLOTM cladding rods which had been subjected to simulated LOCA conditions. In this set of tests, a wide
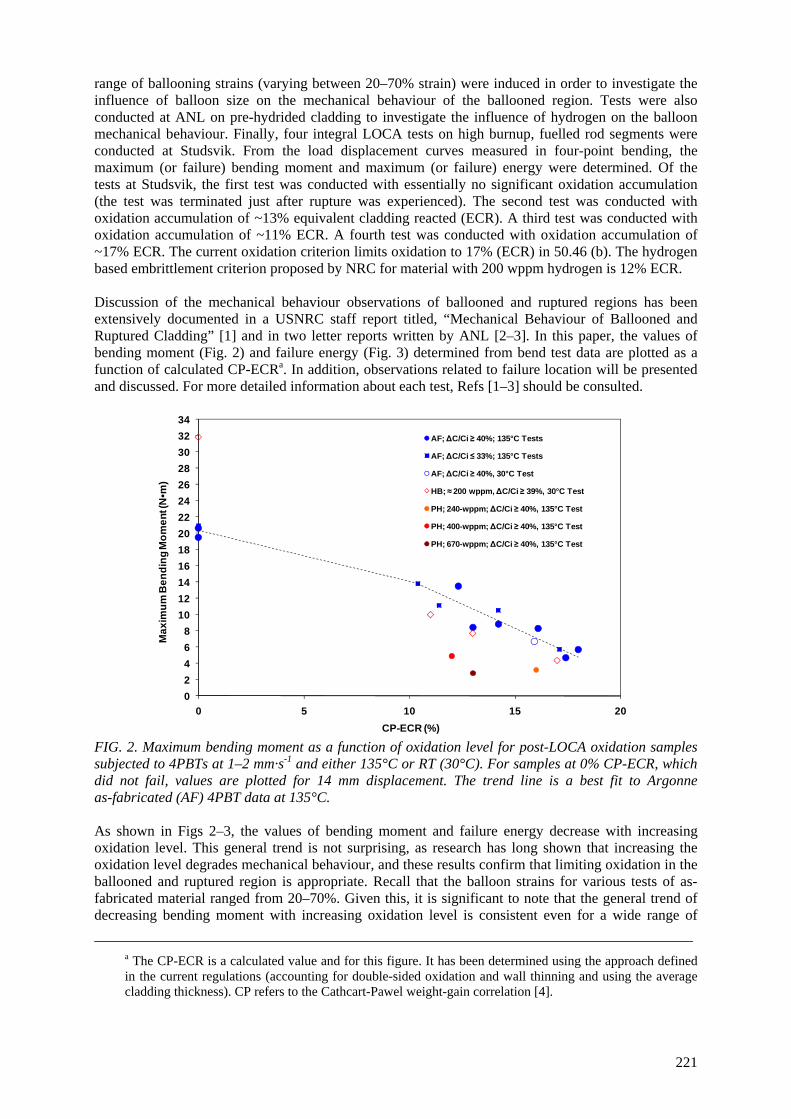
221
range of ballooning strains (varying between 20–70% strain) were induced in order to investigate the influence of balloon size on the mechanical behaviour of the ballooned region. Tests were also conducted at ANL on pre-hydrided cladding to investigate the influence of hydrogen on the balloon mechanical behaviour. Finally, four integral LOCA tests on high burnup, fuelled rod segments were conducted at Studsvik. From the load displacement curves measured in four-point bending, the maximum (or failure) bending moment and maximum (or failure) energy were determined. Of the tests at Studsvik, the first test was conducted with essentially no significant oxidation accumulation (the test was terminated just after rupture was experienced). The second test was conducted with oxidation accumulation of ~13% equivalent cladding reacted (ECR). A third test was conducted with oxidation accumulation of ~11% ECR. A fourth test was conducted with oxidation accumulation of ~17% ECR. The current oxidation criterion limits oxidation to 17% (ECR) in 50.46 (b). The hydrogen based embrittlement criterion proposed by NRC for material with 200 wppm hydrogen is 12% ECR. Discussion of the mechanical behaviour observations of ballooned and ruptured regions has been extensively documented in a USNRC staff report titled, “Mechanical Behaviour of Ballooned and Ruptured Cladding” [1] and in two letter reports written by ANL [2–3]. In this paper, the values of bending moment (Fig. 2) and failure energy (Fig. 3) determined from bend test data are plotted as a function of calculated CP-ECRa. In addition, observations related to failure location will be presented and discussed. For more detailed information about each test, Refs [1–3] should be consulted.
0
2
4
6
8
10
12
14
16
18
20
22
24
26
28
30
32
34
0 5 10 15 20
Ma
xim
um
Be
nd
ing
Mo
me
nt (
N•m
)
CP-ECR (%)
AF; ∆C/Ci ≥ 40%; 135°C Tests
AF; ∆C/Ci ≤ 33%; 135°C Tests
AF; ∆C/Ci ≥ 40%, 30°C Test
HB; ≈ 200 wppm, ∆C/Ci ≥ 39%, 30°C Test
PH; 240-wppm; ∆C/Ci ≥ 40%, 135°C Test
PH; 400-wppm; ∆C/Ci ≥ 40%, 135°C Test
PH; 670-wppm; ∆C/Ci ≥ 40%, 135°C Test
FIG. 2. Maximum bending moment as a function of oxidation level for post-LOCA oxidation samples subjected to 4PBTs at 1–2 mm·s-1 and either 135°C or RT (30°C). For samples at 0% CP-ECR, which did not fail, values are plotted for 14 mm displacement. The trend line is a best fit to Argonne as-fabricated (AF) 4PBT data at 135°C. As shown in Figs 2–3, the values of bending moment and failure energy decrease with increasing oxidation level. This general trend is not surprising, as research has long shown that increasing the oxidation level degrades mechanical behaviour, and these results confirm that limiting oxidation in the ballooned and ruptured region is appropriate. Recall that the balloon strains for various tests of as-fabricated material ranged from 20–70%. Given this, it is significant to note that the general trend of decreasing bending moment with increasing oxidation level is consistent even for a wide range of ___________________________________________________________________________
a The CP-ECR is a calculated value and for this figure. It has been determined using the approach defined in the current regulations (accounting for double-sided oxidation and wall thinning and using the average cladding thickness). CP refers to the Cathcart-Pawel weight-gain correlation [4].

222
values for balloon strain (defined as the percent change in cladding mid-wall circumference, excluding the rupture opening [∆C/Ci]). Comparing the results from as-fabricated cladding to those of irradiated fuel rods tested at Studsvik, the values of bending moment and failure energy for irradiated fuel rods can be seen to be reduced relative to as-fabricated cladding with the same oxidation level. In addition, data for pre-hydrided cladding indicate that the bending moment also decreases with increasing hydrogen content. Taken together, the data suggests that there is a hydrogen effect on the mechanical behaviour of the balloon region that should be accounted for. If the hydrogen based embrittlement limit developed in previous work at ANL [5] were to be applied in the balloon region of the irradiated fuel rods tested at Studsvik, the oxidation level would be limited to 12% CP-ECR. High burnup segments tested at 11% CP-ECR and 13% CP-ECR exhibited maximum bending moments of 10 N·m and 7 N·m, respectively while as-fabricated cladding oxidized at 17% CP-ECR exhibited a maximum bending moment around 6 N·m. Therefore, it can be said that applying the hydrogen based embrittlement limit preserves the mechanical behaviour of this high burnup rod to that measured for as-fabricated cladding oxidized to 17% CP-ECR.
0
2
4
6
8
10
0 5 10 15 20
Ma
xim
um
En
erg
y (J
)
CP-ECR (%)
AF; ∆C/Ci ≥ 40%; 135°C Tests
AF; ∆C/Ci ≤ 33%; 135°C Tests
AF; ∆C/Ci ≥ 40%, 30°C Test
Fit to 135°C Data
HB; ≈ 200 wppm, ∆C/Ci ≥ 39%, 30°C Test
PH; 240-wppm; ∆C/Ci ≥ 40%, 135°C Test
PH; 400-wppm; ∆C/Ci ≥ 40%, 135°C Test
PH; 670-wppm; ∆C/Ci ≥ 40%, 135°C Test
FIG. 3. Maximum energy as a function of oxidation level for post-LOCA oxidation samples subjected to 4PBTs at 1–2 mm·s-1 and either 135°C or RT (30°C). For samples at 0% CP-ECR, which did not fail, maximum energies through 14 mm displacement are plotted. For samples with >10% CP-ECR, data points represent failure energy. The trend line is a best fit to Argonne 4PBT data at 135°C. All the samples which accumulated greater than 10% ECR failed during four-point bending. Two failure locations were observed. Failure either occurred in the center of the rupture, where local oxidation was greatest, or at locations of high hydrogen content above and below the rupture region. Figure 4 provides images and measurements of a sample which failed in locations of high hydrogen content, just above and below the rupture opening. Figure 5 provides images and measurements of a sample which failed in the center of the rupture opening.

223
(a) Hydrogen content profile.
(b) Measured values at failure locations.
(c) Low magnification image of severed
cross section at -24 mm.
FIG. 4. Post-bend characterization of the OCZL#19 sample that was subjected to bending at 135°C with the rupture region under maximum tensile stress: (a) hydrogen content profile, (b) measured values at failure locations, and (c) low magnification image of severed cross section at 24 mm below rupture midspan.
(a) Hydrogen content profile.
(b) Failure location.
(c) Low magnification image of severed
cross section.
FIG. 5. Post-bend characterization of the OCZL#18 sample oxidized to 12% CP-ECR, quenched, and subjected to bending at 135°C with the rupture region under maximum tensile stress: (a) hydrogen content profile, (b) failure location, and (c) low magnification image of the severed cross section.

224
In either case, when fracture occurred in the center of the rupture or away from the center of the rupture region, in locations of high hydrogen content, the bending moment and failure energy were still shown to decrease with increasing oxidation consistent with samples that failed in the center of the rupture region. This can be seen in Figs 2–3, where the maximum bending moments and failure energies of samples that failed in the rupture node or outside of the rupture node are plotted together. For the most part, tests conducted on segments with greater than or equal to 40% balloon strain failed in the rupture node, while tests conducted on segments with less than or equal to 33% balloon strain failed outside of the rupture node. However, no obvious trend is observed to differentiate these two data sets. This suggests that limiting oxidation preserves mechanical behaviour in the ballooned and ruptured region of a fuel rod, even when additional degradation mechanisms beyond localized oxidation are present. 3. FINDINGS RELATED TO FUEL DISPERSAL As mentioned above, the objective of the USNRC’s test program was to investigate the effectiveness of the USNRC’s current and proposed LOCA oxidation criteria in the region of a fuel rod which is predicted to balloon and rupture under LOCA conditions. However, extensive fuel dispersal was observed during the tests on high burnup fuel rods tested at Studsvik and, when combined with previous integral test data, these observations may shed light on the phenomena that influence dispersal and the quantification of fuel dispersal expected during a LOCA. The findings of fuel dispersal in the Studsvik tests are documented and discussed in a USNRC staff report titled, “Fuel Fragmentation, Relocation and Dispersal during the Loss of Coolant Accident” [ 6]. Prompted by Studsvik findings, Ref. [6] reviews historical and more recent data related to fuel dispersal. In this paper, the findings related to fuel dispersal at Studsvik will be summarized briefly and the reader is referred to Ref. [6] for more information and discussion of how the findings relate to other observations in the area of fuel dispersal. Figure 6 shows the rupture opening after LOCA testing for all 4 specimens tested at Studsvik. It can be seen that the rupture region is completely void of fuel, indicating large relocation and dispersal of fuel.
FIG. 6. Rupture opening in Studsvik LOCA tests 1, 2, 3, 4 (left to right), showing the absence of fuel in the rupture plane due to extensive relocation and dispersal.
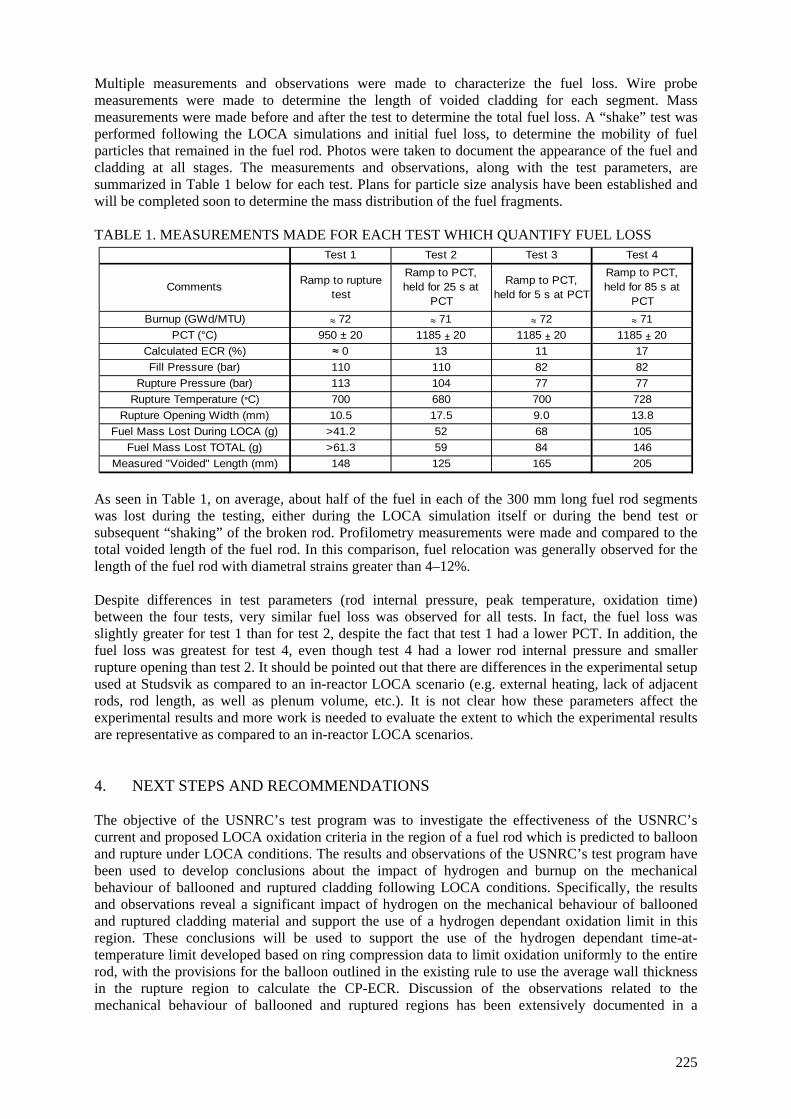
225
Multiple measurements and observations were made to characterize the fuel loss. Wire probe measurements were made to determine the length of voided cladding for each segment. Mass measurements were made before and after the test to determine the total fuel loss. A “shake” test was performed following the LOCA simulations and initial fuel loss, to determine the mobility of fuel particles that remained in the fuel rod. Photos were taken to document the appearance of the fuel and cladding at all stages. The measurements and observations, along with the test parameters, are summarized in Table 1 below for each test. Plans for particle size analysis have been established and will be completed soon to determine the mass distribution of the fuel fragments.
TABLE 1. MEASUREMENTS MADE FOR EACH TEST WHICH QUANTIFY FUEL LOSS
Test 1 Test 2 Test 3 Test 4
CommentsRamp to rupture
test
Ramp to PCT, held for 25 s at
PCT
Ramp to PCT, held for 5 s at PCT
Ramp to PCT, held for 85 s at
PCT
Burnup (GWd/MTU) ≈ 72 ≈ 71 ≈ 72 ≈ 71
PCT (°C) 950 ± 20 1185 ± 20 1185 ± 20 1185 ± 20
Calculated ECR (%) ≈ 0 13 11 17
Fill Pressure (bar) 110 110 82 82
Rupture Pressure (bar) 113 104 77 77
Rupture Temperature (°C) 700 680 700 728
Rupture Opening Width (mm) 10.5 17.5 9.0 13.8
Fuel Mass Lost During LOCA (g) >41.2 52 68 105
Fuel Mass Lost TOTAL (g) >61.3 59 84 146
Measured "Voided" Length (mm) 148 125 165 205
As seen in Table 1, on average, about half of the fuel in each of the 300 mm long fuel rod segments was lost during the testing, either during the LOCA simulation itself or during the bend test or subsequent “shaking” of the broken rod. Profilometry measurements were made and compared to the total voided length of the fuel rod. In this comparison, fuel relocation was generally observed for the length of the fuel rod with diametral strains greater than 4–12%. Despite differences in test parameters (rod internal pressure, peak temperature, oxidation time) between the four tests, very similar fuel loss was observed for all tests. In fact, the fuel loss was slightly greater for test 1 than for test 2, despite the fact that test 1 had a lower PCT. In addition, the fuel loss was greatest for test 4, even though test 4 had a lower rod internal pressure and smaller rupture opening than test 2. It should be pointed out that there are differences in the experimental setup used at Studsvik as compared to an in-reactor LOCA scenario (e.g. external heating, lack of adjacent rods, rod length, as well as plenum volume, etc.). It is not clear how these parameters affect the experimental results and more work is needed to evaluate the extent to which the experimental results are representative as compared to an in-reactor LOCA scenarios. 4. NEXT STEPS AND RECOMMENDATIONS The objective of the USNRC’s test program was to investigate the effectiveness of the USNRC’s current and proposed LOCA oxidation criteria in the region of a fuel rod which is predicted to balloon and rupture under LOCA conditions. The results and observations of the USNRC’s test program have been used to develop conclusions about the impact of hydrogen and burnup on the mechanical behaviour of ballooned and ruptured cladding following LOCA conditions. Specifically, the results and observations reveal a significant impact of hydrogen on the mechanical behaviour of ballooned and ruptured cladding material and support the use of a hydrogen dependant oxidation limit in this region. These conclusions will be used to support the use of the hydrogen dependant time-at-temperature limit developed based on ring compression data to limit oxidation uniformly to the entire rod, with the provisions for the balloon outlined in the existing rule to use the average wall thickness in the rupture region to calculate the CP-ECR. Discussion of the observations related to the mechanical behaviour of ballooned and ruptured regions has been extensively documented in a

226
USNRC staff report titled, “Mechanical Behaviour of Ballooned and Ruptured Cladding” [1]. Reference [1] serves as the technical basis in the proposed revisions to 10 CFR 50.46 requirements for the treatment of the ballooned and ruptured regions of a fuel rod in LOCA analysis. A number of integral LOCA experimental programs have been conducted which used other test methods to investigate the behaviour of the regions of a fuel rod predicted to balloon and rupture under LOCA conditions. These programs have evaluated the safety margin of regulatory criteria from different perspectives, either determining mechanical behaviour at the regulatory criteria and describing safety margin in terms of the residual mechanical behaviour post-quench, or determining the oxidation level that results in quench failure and describing margin in terms of oxidation level. Comparing and resolving the findings of the various experimental programs conducted to investigate the behaviour of ballooned and ruptured cladding would be a valuable next step to better predict the state of the fuel and core geometry during and following a LOCA. Regarding the findings related to fuel dispersal, the first step taken was to complete Ref. [ 6], which reviews historical and more recent data related to fuel dispersal. In addition, the USNRC has completed plans to run two addition integral tests at Studsvik on high burnup fuel rods with a burnup around 50 GW·d·(MT-1 U). The fuel fragments from these tests, as well as the fragments from the previous tests on fuel rods with 70 GW·d·(MT-1 U), will be examined to characterize the size distribution. This may reveal valuable information on the effect of burnup on fuel fragment size. Other integral LOCA experimental programs have been conducted previously which exhibited fuel dispersal under LOCA conditions. Comparing and resolving the findings of the various experimental programs in which fuel dispersal was observed would also be a valuable next step to better predict the state of the fuel and core geometry during and following a LOCA. As mentioned earlier, there are differences in the experimental setup used in this program, and in fact in all integral experimental programs, compared to an in-reactor LOCA scenario. It is not clear how these experimental differences affect the experimental results related to the mechanical behaviour of ballooned and ruptured regions, or the observations of fuel loss. More work could be performed to evaluate the extent to which the experimental results are representative as compared to an in-reactor LOCA situation. 5. CONCLUSIONS The USNRC has completed an integral LOCA test program through experimental work at ANL and Studsvik which generated new data and understanding of the mechanical behaviour of ballooned and ruptured fuel rods. The results of this program indicate that limiting oxidation in the balloon region is appropriate. The results also indicate that applying the USNRC proposed hydrogen based embrittlement limit in the balloon region of high burnup fuel preserves mechanical behaviour relative to that measured for as-fabricated cladding oxidized to 17% CP-ECR. A technical basis document has been written to support the treatment of the balloon within the proposed revisions to 10 CFR 50.46 requirements [1]. Findings related to fuel dispersal in the Studsvik tests have been documented and examined. A literature review has been completed which pulls together an extensive database from integral tests in an effort to further understand the trends and parameters which control fuel dispersal [6]. Additional tests at Halden and Studsvik are planned to continue to examine this phenomenon. Comparing and resolving the findings of various experimental programs related to the mechanical behaviour of ballooned and ruptured cladding, as well as findings related to fuel dispersal, has been recommended to better predict the state of fuel and core geometry during and following a LOCA.

227
REFERENCES [1] UNITED STATES NUCLEAR REGULATORY COMMISSION, Mechanical Behaviour of
Ballooned and Ruptured Cladding, Draft available as ADAMS Public Accession Number ML111370032 (2011).
[2] BILLONE, M.C., Assessment of Current Test Methods for Post-LOCA Cladding Behaviour, Argonne National Laboratory, http://pbadupws.nrc.gov/docs/ML1136/ML113640254.pdf (2011).
[3] BILLONE, M.C., Analysis of Data from Studsvik LOCA with High-Burnup ZIRLO, Argonne National Laboratory, http://pbadupws.nrc.gov/docs/ML1136/ML113640255.pdf (2011).
[4] UNITED STATES NUCLEAR REGULATORY COMMISSION, Zirconium Metal-Water Oxidation Kinetics IV. Reaction Rate Studies, ORNL/NUREG 17, U.S. Nuclear Regulatory Commission, Washington (1977).
[5] YAN, Y., BURTSEVA, T.A., BILLONE, M.C., Post-Quench Ductility Results for North Anna High-Burnup 17×17 ZIRLOTM Cladding with Intermediate Hydrogen Content, ANL letter Report to NRC, ADAMS Public Accession No. ML091200702 (2009).
[6] UNITED STATES NUCLEAR REGULATORY COMMISSION, Fuel Fragmentation, Relocation and Dispersal during the Loss-of-Coolant Accident, NUREG-2121, Washington, DC (2012).


229
BEHAVIOUR OF HIGH BURNUP FUEL DURING LOCA; KEY OBSERVATIONS AND TEST PLAN AT JAEA
F. NAGASE, T. CHUTO Nuclear Safety Research Center Tokyo, Japan Email: [email protected] Abstract
In order to evaluate adequacy of present safety criteria and safety margins and to provide a database for future regulation on higher burnup fuels, an experimental program on the fuel behaviour under loss of coolant accident (LOCA) conditions was launched in 2002 at the Japan Atomic Energy Agency (JAEA). Oxidation test, mechanical tests and semi-integral quench tests have been performed with high burnup cladding specimens. This paper summarizes key observations obtained in the program and also presents the future plan. 1. INTRODUCTION The Japan Atomic Energy Agency (JAEA) performs the Advance Light Water Reactor Performance and Safety Research (ALPS) program to better understand behaviour of high burnup fuels under accidental conditions and to provide database for regulatory judgment. The program was launched in 2002 and extensive examinations including reactivity initiated accident (RIA) studies and loss of coolant accident (LOCA) studies have been performed by using some unique facilities such as Nuclear Safety Research Reactor (NSRR) and Reactor Fuel Examination Facility (RFEF). The high burnup UO2 and MOX fuels used in the ALPS program were shipped from European nuclear power plants. Fourteen pulse irradiation experiments in the NSRR and nine LOCA simulated tests in the RFEF have been successfully performed in the first phase of the program (ALPS-I) with the high burnup (about 45–79 MW·d·kg-1U) fuels. In a safety analysis for a postulated LOCA in a LWR, the fuel cladding is exposed to steam at high temperatures for several minutes until the emergency core cooling water quenches the fuel bundle. The cladding, therefore, might be severely oxidized and embrittled. The Japanese LOCA criteria require that the oxidation of the cladding shall not exceed 15% of the cladding thickness (equivalent cladding reacted (ECR)). The limit is mainly based on thermal shock resistance (fracture/no fracture boundary) of oxidized cladding which was experimentally determined under simulated LOCA conditions. They considered that coolable geometry of the reactor core is ensured if fuel rods survive the quench without split fracture or fragmentation after a high temperature oxidation phase. Accordingly, it is one of the most important issues in Japan to clarify the fracture boundary of oxidized fuel cladding in order to confirm the safety in LOCAs and, therefore, JAEA has been performing the Semi-integral quench tests with unirradiated (hydrided) and irradiated cladding specimens. In addition, oxidation rate measurement and mechanical property test have been performing to obtain the basic information on cladding oxidation and embrittlement which are very important for the safety. Advanced cladding materials with high corrosion resistance and pellets with lower fission gas release are developed to improve the performance of the fuel. JAEA have started the second phase of the ALPS program (ALPS-II) to obtain the database on the behaviour of the advanced fuels under accidental conditions. The present paper describes key observations in the ALPS-I and an outline of the ALPS-II.

230
2. TEST FUEL FOR ALPS-1 In the ALPS-I, high burnup UO2 and MOX fuels irradiated to 4579 MW·d·kg-1U (local burnup) at seven commercial reactors, as listed in Table 1, have been shipped to JAEA-Tokai and subjected to the series of experiments. The cladding materials are MDA, NDA, ZIRLOTM, M5TM, Zircaloy-4 and Zircaloy-2/LK3. Maximum thickness of oxide layer formed during the reactor operation is about 80 μm. Maximum hydrogen concentration is about 840 ppm. Specimens from the high burnup fuel cladding, MDA, NDA, ZIRLOTM, M5TM, Zircaloy-4 and Zircaloy-2/LK3, were used for the LOCA-related experiments. TABLE 1. HIGH BURNUP FUELS TESTED IN ALPS-I
PWR /BWR
Fuel type
NPP Cladding material
Burnup MWd/kgU
PWR
1717 UO2
Vandellos ZIRLOTM 71–79
MDA 76–77 McGuire/R2 NDA 69–71
Ringhals M5TM 66–67 1414 MOX
Beznau Zry-4 59 48
BWR
1010 UO2
Leibstadt Zry-2 /LK3
66–73
88 MOX
Dodewaard Zry-2 45
3. OXIDATION RATE The fuel cladding loses ductility when severely oxidized, and thus the LOCA criteria require that the oxidation temperature and the oxidation amount shall not exceed a certain limits (1200C and 15% of cladding thickness, in Japan). Therefore, it is necessary to evaluate the oxidation kinetics of the high burnup cladding precisely for the safety analysis. The oxidation kinetics data is also used to evaluate heat generation and hydrogen production during the accidents. In the present study, isothermal oxidation test was performed with specimens prepared from high burnup fuel rods with M5TM, ZIRLOTM and Zircaoy-2/LK3 fuel cladding in order to investigate effect of high burnup on the high temperature oxidation of the cladding. The weight gains due to high temperature oxidation in the irradiated ZIRLOTM cladding specimens are plotted as a function of oxidation time in Fig. 1. Those in unirradiated Zry-4 cladding are also shown in the figure. Since oxidation rate of the unirradiated Zircaloy-4 cladding is equivalent to that of the unirradiated ZIRLOTM cladding, the weight gain of the irradiated specimens is smaller compared with that of the unirradiated specimens in all the tested conditions. Figure 2 shows micro-photographs of the irradiated ZIRLOTM specimens after the oxidation tests at 1323 K and 1473 K for 600 s. In all the examined specimens, the pre-formed corrosion layer remained on the cladding OD and many cracks were observed in the layer after the oxidation. The figures show that the high temperature oxidation initiated at cracking positions of the corrosion layer on the cladding OD and the oxide layer uniformly grows beneath the corrosion layer after longer oxidation times. On the cladding ID, oxide layer uniformly grows in all the tested conditions. Thickness of the high temperature oxide measured on the micro-photographs is plotted as a function of oxidation time in Fig. 3. The figure shows that growth of the high temperature oxide on the cladding OD is small, which is possibly caused by the retarding effect of the preformed corrosion layer as observed in Fig. 2. The suppression of oxide growth is remarkable in the ZIRLOTM cladding compared to the M5TM because of thicker corrosion layer. On the other hand, growth of the ID oxide in the irradiated ZIRLOTM cladding is similar to that in the unirradiated Zircaloy-4.

231
unirradiated Zry-4irradiated ZIRLO
Wei
ght g
ain
(g
/m2 )
Oxidation time (s)
1173 K
1323 K
1473 K
0
50
100
150
200
0 200 400 600 800 1000
0
50
100
150
0
10
20
30
40
0 500 1000 1500 2000
50
0 1000 2000 3000 4000
FIG. 1. Weight gains of irradiated ZIRLOTM and unirradiated Zry-4 cladding as a function of oxidation time. It is generally accepted that the mechanism which governs the high temperature oxidation of Zircaloy cladding is diffusion of oxygen anions through the ZrO2 lattice. Hence, the oxidation rate is described by a parabolic expression of the form, W2 = Kw · t, where W is the weight gain per unit surface area, t is the oxidation time, and Kw is the parabolic rate constant for weight gain. The temperature dependence of the obtained parabolic rate constants is shown in Fig. 4 together with the data for the unirradiated Zircaloy-4 cladding [1]. The figure indicates that the rate constants of the unirradiated M5TM and Zircaloy-4 alloys are equivalent at 1373 K and 1473 K, and that of the M5TM is lower at 1273 K. The rate constants of the unirradiated MDA are equivalent to that of the unirradiated Zircaloy-4 for the examined range. If the parabolic rate constants of ZIRLOTM are also equivalent to that of Zircaloy-4 in unirradiated condition [2], the influence of the composition changes including Nb addition is small on the oxidation kinetics under the LOCA conditions. The rate constants of high burnup ZIRLOTM and Zircaloy-2/LK3 cladding are obviously lower than those of the unirradiated cladding at 1373 K and below, while difference is small at 1473 K. As described, the corrosion layer has the retarding effect on the high temperature oxidation and the effect is small at the cracking position of the corrosion layer. It is observed that many fine axial cracks are formed in the corrosion layer when the cladding balloons during the heat-up in a LOCA [3]. Accordingly, the protective effect of the corrosion layer may be small in the ballooned cladding. The temperature dependence of the rate constant calculated by the Baker-Just equation [4] which is used in the safety analysis is also shown in the figure. The figure indicates that the Baker-Just equation is still applicable to the high burnup fuel cladding with sufficient margin.

232
4. THERMAL SHOCK RESISTANCE
The 15% limit in the Japanese LOCA criteria is mainly based on thermal shock resistance (fracture/no fracture boundary) of oxidized cladding which was experimentally determined under simulated LOCA conditions. Therefore, it is one of the most important issues in Japan to clarify the fracture boundary of oxidized fuel cladding in order to confirm the safety in LOCAs. Nine fuel cladding specimens, irradiated to 66 MW·d·kg-1U and 76 MW·d·kg-1U, were used in the present experiments. The cladding materials are ZIRLOTM, MDA, M5TM, NDA and Zircaloy-2/LK3. Thickness of oxide layer formed during the base irradiations ranged from 6–80 µm. Hydrogen concentration ranged from 70–840 ppm. Segments of 190 mm long were cut from the mother rods and fuel pellets were mechanically removed by drilling. Instead, alumina pellets were inserted into the fuel
FIG. 2. Radial cross sections of irradiated ZIRLOTM after oxidation tests at 1323 K and 1473 K.
Oxidation time (s)
1173 K
1323 K
1473 K
0 200 400 600 800 1000
00 500 1000 1500 2000
0 1000 2000 3000 4000
unirradiated Zry-4OD and ID
irradiated ZIRLOOD oxideID oxide
unirradiated Zry-4OD and ID
irradiated ZIRLOOD oxideID oxide
Oxi
de
laye
r th
ickn
ess
(m
)
0
20
40
60
80
100
20
40
60
80
100
0
10
20
30
1323 K, 600 s 1473 K, 600 s
FIG. 3. Oxide layer growth in irradiated ZIRLOTM and unirradiated Zry-4 cladding, as a function of oxidation time.

233
cladding specimen to simulate cooling condition of the cladding in rod geometry. After welding of Zircaloy end caps to the cladding specimen, the rod was pressurized to about 5 MPa with argon gas at a room temperature. Four Pt-Pt/13%Rh thermocouples were spot welded on the outer surface of the cladding specimen at different elevations to control and measure the cladding temperature. The rod was heated up at a rate of 3–10 K·s-1 to the predetermined isothermal oxidation temperature in the apparatus shown in Fig. 5. Steam introduction was started prior to the heat-up, and the steam flow was maintained during the oxidation. The cladding specimen ballooned and ruptured during the heat-up. The rod was isothermally oxidized after the rupture, namely from both the inner and outer surfaces, for a predetermined period. After the isothermal oxidation, the rod was cooled in the steam flow to about 970 K and finally quenched with water flooding from the bottom. An example of the cladding temperature history during the processes is shown in Fig. 6. To achieve the restrained condition during the quench, which is expected in the bundle geometry, both ends of the test rod was fixed just before the cooling stage initiates. The tensile load increases as the rod is cooled and quenched because cladding shrinkage is restrained. Since fully constraint condition is too severe, the restraint load was controlled not to exceed 540 N. The restraint load was determined taking account of the previous related studies [5–6].
Baker-Just eq.
6.5 7 7.5 8 8.5Reciprocal temperature (x10-4/K)
Para
bolic
rate
const
ant, K
w(g
2/m
4/s
)
100
101
102
10-1
1173127313731473
Temperature (K)
unirradiated M5MDAZry-4
irradiatedZIRLOZry-2
FIG. 4. Temperature dependence of the parabolic rate constants for weight gain.
Table 2 summarizes test conditions and results. The test rods were isothermally oxidized at temperatures from 1463–1480 K, for the time range from 122–719 s. One test rod with ZIRLOTM cladding that was oxidized to a higher ECR, 38%, fractured during the quench. The fracture/no fracture conditions of the tested cladding specimens relevant to ECR value and oxidation temperature are shown in Fig. 7. The cladding fracture during quenching is primarily dependent on the amount of oxidation and is nearly independent of oxidation temperature for the range from 1273–1473 K [7]. Hence, in the present study, all the cladding specimens were oxidized at temperatures just below 1473 K, the safety limit for temperature in the ECCS acceptance criteria. The Figure shows that the fracture boundary, the lowest fracture condition of the high burnup fuel cladding, lies between 27–38% ECR. This result shows that the fracture boundary of the examined high burnup cladding is sufficiently higher than the 15% limit in the Japanese ECCS acceptance criteria. Figure 8 shows

234
fracture/no fracture conditions relevant to the ECR value and the initial hydrogen concentration. The fracture boundary which was obtained with the unirradiated Zircaloy-4 cladding under the restrained load of 540 N [8], is also shown in the figure for comparison. Fracture of the cladding specimen during the quench generally occurs at the rupture position. Since the secondary hydriding during the high temperature oxidation is insignificant at the rupture position, a higher initial hydrogen concentration enhances cladding embrittlement after oxidation, and the fracture boundary of the unirradiated cladding is reduced (for the hydrogen concentration range of 700–800 ppm) [7]. The results for the high burnup fuel cladding specimens that were oxidized to 18.2–27.2% ECR indicate that the fracture boundary is not reduced so significantly by high burnup and use of the advanced alloys in the examined burnup level, although it may be somewhat reduced with pre-hydriding during the reactor operation, as observed in the unirradiated Zircaloy-4 cladding. The fracture of the MDA-2 specimen is consistent with the fracture criteria of the unirradiated cladding at similar hydrogen concentrations.
0
400
800
1200
1600
2000
0
200
400
600
800
1000
0 400 800 1200
Te
mpe
ratu
re (
K)
Axi
al lo
ad (
N)
Time (s)
TC No.4
TC No.3
TC No.2
Load Rupture
Temperature
FIG. 5. Schematic of test apparatus and test procedure.
Test sequence and rod behavior
1. Steam introduction
2. Heat-up
(Rod-rupture)
3. Isothermal oxidation
(Double-sided oxidation,
Secondary hydriding)
4. Restraint of rod
5. Slow cooling
6. Quenching by flooding water
(Survive or fracture)
ID OD
Test sequence and rod behavior
1. Steam introduction
2. Heat-up
(Rod-rupture)
3. Isothermal oxidation
(Double-sided oxidation,
Secondary hydriding)
4. Restraint of rod
5. Slow cooling
6. Quenching by flooding water
(Survive or fracture)
ID ODQuartz tube
Grabbing device
Steam outlet
Steam inlet Flooding water inlet
Infrared furnace
Test rod
Restraint load control system
Equipped on tensile testing machine
Load cell
TC
Wel
ded
Wel
ded
TC
Wel
ded
Wel
ded
Quartz tube
Grabbing device
Steam outlet
Steam inlet Flooding water inlet
Infrared furnace
Test rod
Restraint load control system
Equipped on tensile testing machine
Load cell
TC
Wel
ded
Wel
ded
TC
Wel
ded
Wel
ded
Rupture
Fracture
FIG. 6. Example of temperature and axial load histories.

235
1400 1450 15000
10
20
30
40
50
Oxidation temperature (K)
Cal
cula
ted
EC
R (
%)
Japanese safety criteria:<1473 K<15% ECR
Fracture during quenchNo-Fracture
18.3 to 27.3%
38.0%
FIG. 7. Fracture map, relevant to ECR and oxidation temperature.
MFI-1(<400N)
MDA-1R(<350N)
ZIR-3R
MDA-2R
ZIR-2RNDA-1
ZRT-1ZRT-2(0N)
Safety limit(15%ECR)
Fracture boundary ofunirradiated Zry-4
Fracture No-fracture66-76 GWd/t
MFI-2(0N)
0
10
20
30
40
50
0 200 400 600 800 1000
Oxi
dat
ion
(%E
CR
)
Initial hydrogen concentration (ppm)
FIG. 8. Fracture map, relevant to ECR and initial hydrogen concentration.
TABLE 2. SUMMARY OF SEMI-INTEGRAL QUENCH TESTS
Sample ID
Rupture temp. (K)
Circ. increase
(%)
Oxidation temp. (K) a
Oxidation time (s)
Ox. amount ECR (%) c
Restraint load (N)
Fracture /no fract.
MDA-1 988 9.9 1480 131 18.3 (16.4) <350 N.F. MDA-2 - 6.0 1463 b 719 38.0 (35.6) 530 F.
ZIRLO-2 945 28.0 1473 228 27.3 (20.8) 518 N.F. ZIRLO-3 949 20.6 1459 153 20.2 (16.4) 519 N.F. M5-1 1053 20.1 1470 151 19.5 (15.9) <400 N.F. M5-2 1035 19.2 1469 229 23.6 (19.5) 0 d N.F. NDA-1 988 8.9 1467 280 22.5 (20.4) 518 N.F. Zry2-1 786 17.7 1468 222 21.2 (17.7) 519 N.F. Zry2-2 801 20.6 1467 232 22.0 (17.9) 0 N.F.
(a) Oxidation temperature at rupture position except for MDA-2R. (b) Oxidation temperature at fracture position. (c)
Calculated with the Baker-Just equation with oxidation temperature and time, for reduced metallic thickness after ballooning. The value in parenthesis is ECR for the initial metallic thickness before ballooning. (d) Accidentally not restrained due to failure of specimen fixing.
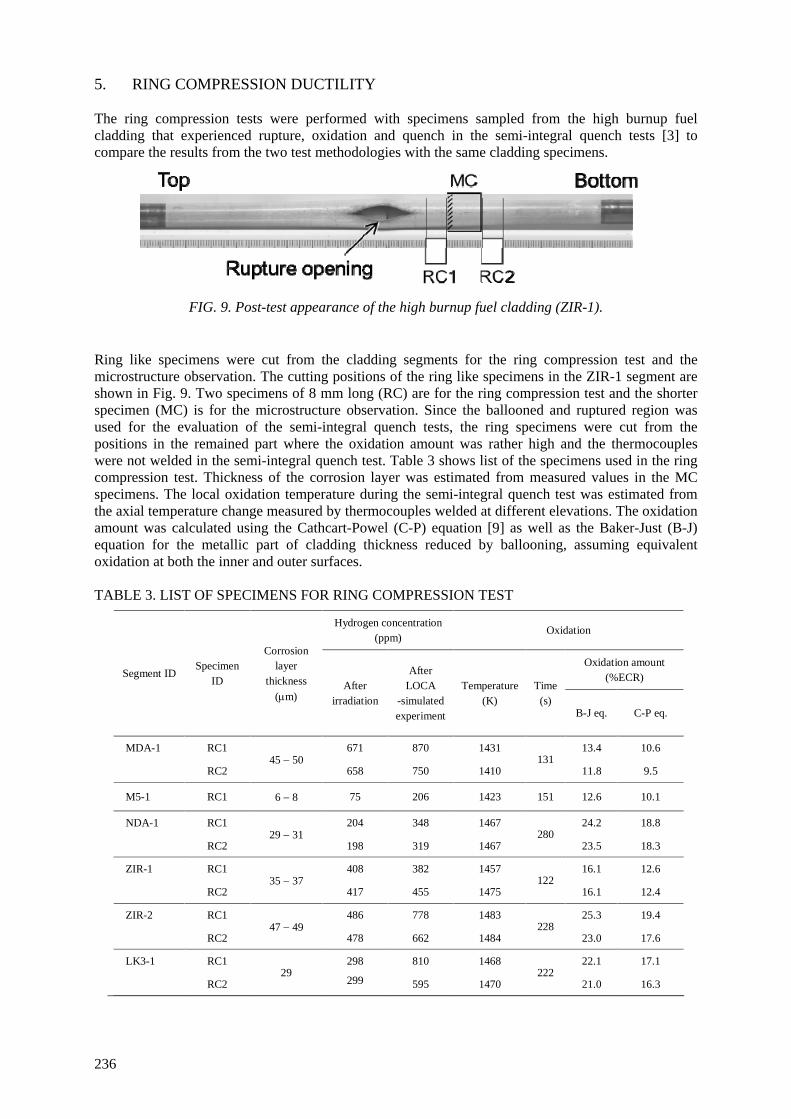
236
5. RING COMPRESSION DUCTILITY The ring compression tests were performed with specimens sampled from the high burnup fuel cladding that experienced rupture, oxidation and quench in the semi-integral quench tests [3] to compare the results from the two test methodologies with the same cladding specimens.
FIG. 9. Post-test appearance of the high burnup fuel cladding (ZIR-1).
Ring like specimens were cut from the cladding segments for the ring compression test and the microstructure observation. The cutting positions of the ring like specimens in the ZIR-1 segment are shown in Fig. 9. Two specimens of 8 mm long (RC) are for the ring compression test and the shorter specimen (MC) is for the microstructure observation. Since the ballooned and ruptured region was used for the evaluation of the semi-integral quench tests, the ring specimens were cut from the positions in the remained part where the oxidation amount was rather high and the thermocouples were not welded in the semi-integral quench test. Table 3 shows list of the specimens used in the ring compression test. Thickness of the corrosion layer was estimated from measured values in the MC specimens. The local oxidation temperature during the semi-integral quench test was estimated from the axial temperature change measured by thermocouples welded at different elevations. The oxidation amount was calculated using the Cathcart-Powel (C-P) equation [9] as well as the Baker-Just (B-J) equation for the metallic part of cladding thickness reduced by ballooning, assuming equivalent oxidation at both the inner and outer surfaces. TABLE 3. LIST OF SPECIMENS FOR RING COMPRESSION TEST
Segment ID Specimen
ID
Corrosion layer
thickness
(m)
Hydrogen concentration (ppm)
Oxidation
After irradiation
After LOCA
-simulated experiment
Temperature (K)
Time(s)
Oxidation amount (%ECR)
B-J eq. C-P eq.
MDA-1 RC1 45 50
671 870 1431 131
13.4 10.6
RC2 658 750 1410 11.8 9.5
M5-1 RC1 6 8 75 206 1423 151 12.6 10.1
NDA-1 RC1 29 31
204 348 1467 280
24.2 18.8
RC2 198 319 1467 23.5 18.3
ZIR-1 RC1 35 37
408 382 1457 122
16.1 12.6
RC2 417 455 1475 16.1 12.4
ZIR-2 RC1 47 49
486 778 1483 228
25.3 19.4
RC2 478 662 1484 23.0 17.6
LK3-1 RC1 29
298 810 1468 222
22.1 17.1
RC2 299 595 1470 21.0 16.3

237
The cladding does not absorb hydrogen during the oxidation at the outer surface under a flowing steam condition. However, it is known that hydrogen is absorbed from the inner surface of the cladding if the cladding ruptures [8, 10]. The hydrogen absorption is not axially uniform and the peak hydrogen concentration is generally observed at positions about 30–50 mm away from the rupture position. The increase in hydrogen concentration during the semi-integral quench tests and the variation of the increase (Table 3) are caused by the localized secondary hydriding shown above. Details of the ring compression test method is described elsewhere [11]. The specimen temperature was 408 K, the typical saturation temperature during reflood in a LOCA, and maintained within 1 K during the test. The crosshead displacement rate was 3.0 × 10⁻⁸ m·s-1. The load drop of more than 30% is regarded as formation of a wall-through crack, namely failure of the specimen, in the present study. Plastic deformation to failure was evaluated from the offset displacement.
0
50
100
150
200
-0.5 0 0.5 1
Load
(N
)
Displacement (mm)
RC1
RC2Side view
Outer surface
FIG. 10. Load displacement curves obtained from ring compression tests of specimens sampled from MDA-1 segment and post-test appearance of the specimen. Many of the tested specimens failed with small plastic deformations or without plastic deformation. Figure 10 shows examples of the load displacement curves obtained from the ring compression tests of the low ductile specimens (RC1 and RC2 from the MDA-1 segment). The post-test appearance of the RC2 specimen is shown in the figure. Load was decreased by about 90% and 50% on the first load drop in the RC1 and RC2 tests, respectively. It can be considered that a wall-through crack was generated on the first load drops. In the RC1 specimen, a crack was observed at 0 degree after the test and the second crack was generated during the post-test handling. Two cracks are seen at 0° and 180° in the RC2 specimen. The number of the observed wall-through cracks coincides with that of the load drops in the load displacement curves. The ring specimens sampled from the ZIR-1, ZIR-2, NDA-1 and LK3-1 segments similarly showed sudden load drops and fractured in the elastic region or in the early stage of plastic deformation. Figures 11–12 show the plastic strain (crosshead displacement/average outer diameter) as functions of ECR (calculated using the B-J equation) and hydrogen concentration. The figures show that cladding ductility is relatively high at lower ECR values and lower hydrogen concentrations. As suggested by the load displacement curves and the post-test appearances, most the specimens, containing hydrogen concentrations higher than 300400 ppm, failed without plastic deformation. The failure strain and the maximum load appear to have better correlations with the hydrogen concentration than the ECR. Therefore, hydrogen concentration may be the dominant parameter for the embrittlement of the oxidized cladding in the examined oxidation range. The higher ductility of the M5-1 specimens is attributed to the lower hydrogen concentrations and the alloy effect would be small. Uetsuka et al. conducted similar experiments with non-irradiated Zircaloy-4 cladding [12]. The data obtained from their study is shown in Fig. 12. The cladding oxidized above 1273 K was severely

238
embrittled when the hydrogen concentration was above about 500 ppm. They performed the ring compression tests with a large number of oxidized and quenched specimens. If the data scatter seen in their tests is taken into account, the present result agrees with their result. Therefore, it is considered that the embrittlement at the higher hydrogen concentrations as seen in Fig. 12 is not the specific result of the high burnup fuel cladding. In other words, effects of high burnup factors except for hydrogen absorption are considered to be small on the cladding embrittlement under LOCA conditions. If hydrogen concentration is sufficiently higher than 300 ppm due to corrosion during the reactor operation, the cladding ductility decrease, evaluated by the ring compression test, becomes significant with the temperature increase to over 1273 K and less oxidation than the safety criterion (15% ECR).
Pla
stic
str
ain
at f
ailu
re (
%)
Oxidation amount (% ECR-BJ)
0
2
4
6
8
10
12
14
0 5 10 15 20 25 30
MDAM5NDAZIRLK3
32.3%
0 200 400 600 800 1000Hydrogen concentration (ppm)
32.3%MDAM5NDAZIRLK3
Unirradiated Zircaloy-4 16)
2
4
6
8
FIG. 11. Plastic strain in ring compression as a function of oxidation amount calculated by the Baker-Just equation.
FIG. 12. Plastic strain in ring compression as a function of hydrogen concentration.
Both the semi-integral quench test and the ring compression test are used to confirm the safety of the fuel in a LOCA. However, the present result shows that oxidized and quenched cladding which shows ‘zero-ductility’ in the ring compression test may survive the thermal shock and mechanical loading in the semi integral quench test. Namely, the two test methods show different criteria. Properties of the small specimens for the ring compression tests do not always represent those of the whole segment which has gradients of the oxidation and hydriding. In addition, mechanical properties evaluated by different test methods generally differ due to different loading conditions such as stress and strain levels, stress distribution, multi-axiality. Loading conditions in the two methods were analysed as shown below to clarify causes of the different results. Computer code analysis showed equivalent tensile stress of about 40 MPa is generated in both the axial and circumferential directions and that equivalent compressive stress is generated near the cladding inner surface during the quenching in the semi-integral quench test [11]. On the other hand, the stress is localized and the level is much higher in the ring compression test than that during quenching [11]. The calculations are very preliminary since the formation of oxide layers is not fully considered. However, the calculations apparently show that the stress conditions are quite different between the two test methodologies and it is reasonable to have the different results on the cladding embrittlement. Both the test methodologies are used in the safety evaluation to examine integrity of the oxidized and quenched cladding during a LOCA. However, it is recommended that the advantages and drawbacks of the test methodologies should be well considered on application of the test results to the regulatory judgment. 6. SECOND PHASE PROGRAM
In view to obtaining regulatory data for the newly developed fuels, JAEA started the ALPS-II under the contract with the Nuclear and Industry Safety Agency.

239
Table 4 shows the list of the fuels that are subjected to the ALPS-II. High burnup UO2 and MOX fuels irradiated to 4991 MW·d·kg-1U (local burnup) in six European commercial reactors and UO2 disk specimens irradiated to about 130 MW·d·kg-1U at the Halden reactor. The cladding materials are M-MDA, low Sn ZIRLOTM, M5TM, Zircaloy-2/LK3. Doped fuel pellets are used in some BWR fuels. The fuels will be shipped to JAEA-Tokai and subjected to the series of experiments including RIA tests, LOCA tests and post-test examinations. LOCA experiments including oxidation rate measurement and fracture resistance evaluation are planned with the MDA, M5TM and ZIRLOTM cladding. Test conditions and test methods are basically the same as those adopted in the ALPS-I. However, test conditions and additional tests, for example mechanical tests after oxidation, are optional and would be determined depending on the future discussion and time schedule.
TABLE 4. HIGH BURNUP FUELS TESTED IN ALPS-II
PWR /BWR
Fuel type
NPP Cladding material
Burnup MW·d·kg-1U
PWR
1717 UO2
Vandellos ZIRLOTM 73
MDA 70–73
Gravelines M5TM 76
1515 UO2
Ringhals M5TM 63
1717 MOX
Chinon M5TM 61
BWR
1010 UO2 Leibstadt
Zry-2/LK3 91
1010 Doped UO2
Zry-2 49
Oskarshamn Zry-2 68
HBWR Disk UO2
Halden 130
7. CONCLUSIONS
An extensive program has been performed in the Japan Atomic Energy Agency (JAEA) in order to provide a database for future regulation on higher burnup UO2 and MOX fuels. The research program ‘Advanced LWR Fuel Performance and Safety’ (ALPS) is comprised primarily of tests simulating a reactivity initiated accident (RIA) and a loss of coolant accident (LOCA) on high burnup fuels shipped from European nuclear power plants. The rate constants of high burnup cladding are obviously lower than those of the unirradiated cladding at 1373 K and below, while difference is small at 1473 K. Growth of the high temperature oxide on the cladding OD is small, which is possibly caused by the retarding effect of the preformed corrosion layer. The high temperature oxidation initiated at cracking positions of the corrosion layer on the cladding OD and the oxide layer grows after longer oxidation times. The semi-integral quench tests are performed with high burnup fuel cladding in the ALPS program. Nine tests with high burnup PWR cladding, including ZIRLOTM, MDA, NDA, M5TM and Zircaloy-2/LK3, have been performed. As a consequence, data base was extended from 44–77 MW·d·kg-1U. Fracture boundary is not reduced significantly by high burnup and use of new alloys in the examined burnup level, though it may be somewhat reduced with pre-hydriding as observed in unirradiated Zry-4 cladding.

240
Ring compression tests were conducted with specimens sampled from the high burnup PWR and BWR fuel cladding segments which were ruptured, oxidized and quenched in the semi-integral quench tests. The plastic strain to failure and the maximum load in the ring compression tests decreases with increasing oxidation and hydrogen. Better correlations are seen in the hydrogen dependence and embrittlement of the cladding is seen when the hydrogen concentration is above 300400 ppm. The similar result was found for the unirradiated Zircaloy cladding. Therefore, effects of high burnup factors except for hydrogen absorption are considered to be small on the cladding embrittlement under LOCA conditions. Although the examined fuel cladding segments did not facture in the semi-integral quench tests, most of the specimens sampled from the segments exhibited brittle nature in the ring compression tests. The obvious discrepancy between the fracture/no fracture criterion and the embrittlement criterion is likely caused by difference in the loading conditions in the two tests. The advantages and drawbacks of the test methodologies should be well considered on application of the test results to the regulatory judgment. In order to obtain the database on the behaviour of the advanced fuels under accidental conditions, JAEA have started the second phase of the ALPS program (ALPS-II). High burnup UO2 and MOX fuels irradiated to 4991 MW·d·kg-1U in European power plants are shipped to JAEA and subjected to the RIA and LOCA studies.
REFERENCES [1] NAGASE, F., OTOMO, T., UETSUKA, H., Oxidation kinetics of low-Sn Zircaloy-4 at the
temperature range from 773–1573 K, J. Nucl. Sci. Technol. 40 (4) (2003) 213–219. [2] YAN, Y., BURTSEVA, T., BILLONE, M., LOCA related research at ANL, Proc. Of Fuel
Safety Research Meeting 2004, Tokyo (2004). [3] NAGASE, F., CHUTO, T., FUKETA, T., Behaviour of high burnup fuel cladding under LOCA
conditions, J. Nucl. Sci. Technol. 46 (7) (2009) 763769. [4] BAKER, L., JUST, L.C., Studies of metal–water reaction at high temperatures III. Experimental
and theoretical studies of the zirconium–water reaction, ANL-6548, Argonne National Laboratory (1962).
[5] HONMMA, K., DOI, S., OZAWA, M., et al., Thermal shock behaviour of PWR high burnup fuel cladding under simulated LOCA conditions, Proc. ANS Annual Meeting, Milwaukee, Wisconsin (2001).
[6] MURATA, T., TANIGUCHI, Y., URATA, S., et al., LOCA simulation test of the cladding for high burnup fuel, Proc. ANS Annual Meeting, Milwaukee, Wisconsin (2001).
[7] NAGASE, F., FUKETA, T., Effect of Pre-hydriding on thermal shock resistance of Zircaloy-4 cladding under simulated loss of coolant accident conditions, J. Nucl. Sci. Technol. 41 (7) (2004) 723–730.
[8] NAGASE, F., FUKETA, T., Behaviour of pre-hydrided Zircaloy-4 cladding under simulated LOCA conditions, J. Nucl. Sci. Technol. 42 (2) (2005) 209–218.
[9] CATHCART, J.V., PAWEL, R.E., MCKEE, R.A., DRUSCEL, R.E., YUREK, G.J., CAMBELL, J.J., JURY, S.H., Zirconium metal–water oxidation kinetics IV. reaction rate studies, ORNL/NUREG-17, Oak Ridge National Laboratory (1977).
[10] FURUTA, T., KAWASAKI, S., Ductility loss of Zircaloy cladding by inner surface oxidation during high temperature transient, J. Nucl. Sci. Technol. 18 (10|) (1981) 802810.
[11] NAGASE, F., CHUTO, T., FUKEATA, T., Ring compression ductility of high burnup fuel cladding after exposure to simulated LOCA conditions, J. Nucl. Sci. & Tech. 48 (11) (2011) 1369–1376.
[12] UETSUKA, H., FURUTA, T., KAWASAKI, S., Zircaloy-4 cladding embrittlement due to Inner surface oxidation under simulated loss of coolant condition, J. Nucl. Sci. Technol. 18 (9) (1981) 705717.

241
UJP LOCA OXIDATION CRITERIA “K” AND “OΒ”
M. NÉGYESI*, L. NOVOTNÝ**, J. KABÁTOVÁ**, S. LINHART**, V. KLOUČEK***,J. LORINČÍK****, V. VRTÍLKOVÁB**
*
**
***
****
Faculty of Nuclear Sciences and Physical Engineering Czech Technical University Praha, Czech Republic Email: [email protected] UJP PRAHA a.s. Praha, Czech Republic UNIPETROL RPA, s.r.o. Praha, Czech Republic Institute of Photonics and Electronics Academy of Sciences of the Czech Republic Praha, Czech Republic
Abstract
The presented study deals with analyses of recently proposed oxidation criterion Oβ. This criterion was based on the results of oxygen concentration measurements in the prior β-phase region (using SIMS and TEA techniques) and ring compression testing of unirradiated Zr1Nb nuclear fuel cladding tubes exposed to low and high temperature steam environment (without inner pressure). The criterion is valid for all samples considered containing up to 200 wppm of hydrogen. The criterion was compared to the empirical criterion K having been proposed in UJP, and the conventional 17% ECR criterion. The criterion K is more conservative compared to Oβ. The 17% ECR criterion, on the other hand, is not valid for higher temperatures and higher hydrogen contents. Oβ was also experimentally verified on real LOCA temperature courses with positive result. It was concluded that it might be used instead of the current ECR criterion in LOCA safety analyses for the modified E110 alloy rods. 1. INTRODUCTION The oxidation criteria are used in LOCA safety analyses to prevent embrittlement of fuel claddings after the transient. The fuel claddings must withstand various types of loading upon the accident (internal overpressure, mutual interaction, axial constraint, thermal shock), and also after the accident upon transport from the reactor core (handling, transport forces). Residual ductility is considered to be the best guarantee against potential fragmentation of the fuel rods [1]. The residual ductility depends mainly on the mechanical properties of the prior β-phase. The oxide layer together with the oxygen stabilized α-Zr(O) layer can be considered as brittle [2]. The state of the prior β-phase depends mainly on the oxygen distribution [2–4]. The amount of oxygen dissolved within the β-phase is primarily a consequence of the oxygen diffusion upon the transient. Thus the temperature and time, as well as the hydrogen content and material of the fuel clad (solubility limits) are the major factors influencing the oxygen pick-up. Hydrogen can be absorbed by the tubes upon both in-service corrosion and the transient high temperature oxidation [5–6]. Another issue is the effect of hydrides which depends mainly on the cooling rate [7–8]. The influence of irradiation is negligible after re-crystallization (annealing of the defects) at the beginning of the transient [9]. The current 17% ECR oxidation criterion (connected with the 1204°C limit), originally being tied with the Baker-Just correlation [10], was based on the retention of ductility of as-received Zry-4 alloy at the temperature during reflooding (135°C). The overall weight gain kinetics correlations were used to determine this criterion. The influence of hydrogen is not involved because was not known at that time. Additionally, the calculated ECR varies with cladding wall thickness and the degree of ballooning. Consequently, it is not valid in many cases (e. g.: for tubes with higher hydrogen content after extended fuel burnup [2, 9, 11]). Due to the fact that only the prior β-Zr is load bearing, an
242
embrittlement criterion based on the oxygen distribution in this phase is an attractive alternative to the ECR criterion. The oxygen concentration threshold (0.7 wt% for Zircaloys) in the prior β-Zr together with the prior β-Zr thickness limit (0.3 mm) have been considered as the base of embrittlement criteria proposed by many investigators [5, 12–14]. Another possibility is using a purely empirical oxidation criterion such as the criterion K based on the results of ring compression testing, which was proposed in UJP [15]:
tT
K
14170exp3800 (1)
Where T is the temperature (in K); t is time (in s). If K<1 (or 1.2): residual ductility is preserved; K=1 (or 1.2): residual ductility >0, but does not exceed 1%; K>1 (or 1.2): specimens may be brittle. Preliminary range of applicability can be specified for cladding thickness from 0.53–0.70 mm, different materials (Zry-4, Zr1Nb, and Zr1Nb1Sn0.1Fe), operational pre-oxidation and hydrogen uptake up to 600 wppm. K was also experimentally verified on the “special test” of conservative ALOCA temperature course on unpreoxidized and peroxidised samples, including samples peroxidised in VVER water, with positive result. It is used as a complementary oxidation criterion in Czech nuclear power plants. The research of the LOCA has been carried out in UJP since 1985. The database OXIDATION now contains thermomechanical properties of 6 Zr-alloys for the temperature range 600–1300°C of both isothermal and transient conditions. More than 1400 ring compression tests have been carried out so far. This database enables to verify validity of new LOCA safety criteria such as Oβ which has been recently proposed in UJP. The presented study deals with analyses of the new criterion. 2. EXPERIMENTAL 2.1. Experimental material All samples used in this study were fabricated of modified E110 alloys (with improved corrosion properties). 30 mm long tubes (outside diameter: 9.1 mm, wall thickness: ~0.7 mm) were tested. The samples were either as-received or corroded in steam at 425°C and 10.7 MPa to form 2 (6 days), 10 (63 days) or 20 µm (189 days) thick oxide layer. The corrosion tests were performed in static conditions in autoclaves of 4.5 dm3 volume. The large number of specimens was exposed in a statistic way. After given period the autoclave was switched off, opened, and cooled down. The specimens were withdrawn, rinsed by distilled water, and dried out at 80°C, and then weighted. Afterwards all specimens were exposed to steam (0.1 MPa) at high temperatures (600–1300°C) for variable time intervals ((3, 6, 9, 15, 21, 30, 45, 60, 90, 120, 180, 300, and 480) min) depending on the temperature) in a resistance furnace. Tests were conducted with average steam flow rates of 0.61 g·cm-2min-1 (deduced from water consumption). A single sample was exposed at a time. The oxidation was double-sided. The sample temperature was measured by a thermocouple placed inside the tube. After the high temperature oxidation, the samples were quenched in ice water. No inner tube pressure was applied upon both low and high temperature oxidation.

243
2.2. Experimental methods After the thermal processing, the 30 mm long tubes were weighted (to determine overall weight gain), and then cut into several millimetres long segments for further analyses. The hydrogen content was measured using a vacuum extraction on Exhalograph EA–1. NEOPHOT 21 light microscope and JSM 5510LV scanning electron microscope were used for the microstructure observation. To determine the mechanical properties (the residual ductility) ring compression testing (RCT) followed. The RCT was carried out on the Instron 1185 tensile testing machine with the Instron SFL temperature chamber at a temperature of 135°C. The output force was recorded versus time. The rate of the cross beam was equalled to 1 mm·min-1.
The oxygen concentration was measured using SIMS and TEA technique. An Atomika 3000 SIMS was used with the following parameter settings: a Cs+ primary beam, kinetic energy 15 keV, spot size 100–200 µm, impact angle 45°, ion current 750–950 nA, raster area 500 × 500 µm2, acceleration voltage 200 V, vacuum pressure during the measurement 2 × 10⁻⁹ torr. The samples surface was coated with a ~10 nm gold thin film. The oxygen concentration was calibrated using a set of 9 implanted calibration standards of O18 in Zr-alloys of a variable degree of oxidation, which allowed for the construction of a working curve. Tangential sections were used for SIMS analyses. For the TEA analyses LECO TC500C — the nitrogen/oxygen TEA analyser with thermal conductivity cell/solid state IR detectors — was used. For TEA analyses the oxide and α-Zr(O) layers had to be removed mechanically. After the machining the samples for TEA were leached in a 4% HF solution, rinsed with water, degreased in acetone, and dried with warm air. The sample weights were ~0.1 g. Detailed description of both methods is presented in previous work [16]. 3. RESULTS AND DISCUSSIONS 3.1. Oxygen distribution and hydrogen effect Figure 1 shows BSE image with a typical microstructure inside the wall of as-received Zr1Nb fuel cladding after the high temperature oxidation (1100°C/15 min) and a schematic drawing of the oxygen concentration profile. The microstructure, and consequently the mechanical properties, is strongly influenced by the oxygen distribution. The oxygen distribution results mainly from the oxygen diffusion (as already mentioned in the introduction) and the phase transformation in metal (α-Zr → β-Zr upon heating up process). After the transient (high temperature oxidation) the wall microstructure consists of several layers: the oxide layer, oxygen stabilized α-Zr(O) layer, two-phase (α+β)-Zr layer, and prior β-Zr region. In addition, the prior β-Zr region can contain precipitated α-Zr(O) grains due to exceeding of the oxygen solubility limit [2, 17–18]. A detailed examination of the microstructure was presented in previous work [19]. As already discussed in the introduction the residual ductility of fuel claddings depends mainly on the properties (thickness and amount of oxygen dissolved) of the prior β-phase [5, 12–14]. The oxygen concentration in the prior β-phase can be determined experimentally or, on the other hand, calculated via numerical or analytical diffusion models based on the solution of moving boundary problem involving all phases. Several such models have been proposed up to now [5, 20]. However, the experimental input such as the oxygen diffusivities or the oxygen concentrations at phase boundaries (oxygen solubility limits) is still required (especially for the Zr1Nb alloy) for the construction of the models. Several attempts to study the Zr1Nb-O system have been made so far [3–4, 21–23].

244
FIG. 1. A typical microstructure (bottom) with the schematic drawing of the oxygen distribution (top) inside the wall of Zr1Nb fuel cladding exposed to steam 1100°C/15 min (double-sided oxidation). The little mismatch between the schematic drawing and the image is due to the sample curvature (it is an image of cross section). The oxygen distribution is strongly influenced by the hydrogen pick-up. Hydrogen influences the solubility limits in both metal phases α-Zr and β-Zr. It increases the ceiling of the oxygen concentration in the β-phase and thus accelerates the kinetics of the oxygen pick-up in the β-phase [2]. The modified E110 alloys absorb significantly lower amount of hydrogen compared to older E110. It is a consequence of better corrosion properties (for both low and high temperature steam oxidations). The oxide spallation occurs only after the oxidation at high temperatures (>1100°C) and longer times [6]. The Zr1Nb tubes can also absorb significant amount of hydrogen upon the low temperature oxidation — samples corroded in steam at 425°C/10.7 MPa within 189 days (~20 µm thick oxide layer) contain approximately 600 wppm of hydrogen independently of conditions of the high temperature oxidation (up to 1150°C). However, maximal hydrogen pick-up during the in-service reactor corrosion can reach around 100 wppm for M5TM alloy which is supposed to have similar corrosion properties as the modified E110 [9]. 3.2. Oβ criterion This section summarizes the origin of the criterion Oβ originally proposed in [24]. The results of the oxygen concentration measurements (SIMS and TEA) were plotted for constant temperature and constant hydrogen content versus the exposure time. Figure 2 shows an example for the temperature 1100°C. The graph includes only specimens containing low hydrogen content (up to 50 wppm).

245
0 4 8 12 160
0.2
0.4
0.6
t (min)
O c
once
ntra
tion
(wt.
%)
1,100 °C (< 50 wppm H)
y = 0.18x0.37
FIG. 2. Oxygen concentration in the prior β-phase vs. the exposure time for the samples exposed at 1100°C. Using the power regression kinetic parameters K and n were determined for the generally valid equation:
wn = K × t and K = A × exp (-B/T) (2) Where t is the time (in s); T is the temperature (in K); A, B are constants. Only values of specimens before the oxygen saturation time (before reaching the oxygen solubility limits [18]) were considered and the nominal oxygen content (~0.1 wt%) was taken into account as well. The resulting kinetics is depicted in Fig. 3. Figure 3a presents the exponent n depending on temperature. The exponent is independent of the temperature, approximately equalled to 3, i. e. the kinetics is cubic. That is quite interesting since the whole process should be governed by oxygen diffusion, and thus the exponent should be rather equalled to 2. It is probably consequence of adding the nominal oxygen content. Figure 3b shows lnK values (for n = 3) versus inverse temperature. Using the linear regression fitting the kinetics of the oxygen uptake in the β-phase has been determined. For the temperature range of 950–1200°C the following expression has been achieved:
Cβ =170 × exp(-11225/T) × t1/3 (3)
Where Cβ is the oxygen concentration in β-phase (wt%); T is the temperature (K); T is the time (s). Equation 3 was derived using only samples with low hydrogen content (<100 ppm). The kinetics was refined thanks to new experimental data since the work [24]. Then the results of RCT (the residual ductility) were plotted versus the oxygen concentration measured in the prior β-phase. Figure 4 shows the results. A steep decrease in the residual ductility to 0 close to the oxygen concentration equaled to 0.38 wt% was detected. This value may be considered as a threshold of the oxygen concentration by which the tubes may become brittle. This values is approx. twice lower compared to the value (0.7 wt%) proposed for the Zry-4 alloy [5, 12–14]. However, that value was tied with at least 0.3 mm thick prior β-layer. On the other hand, the authors in their work [3] deduced the oxygen concentration threshold in the prior β-phase, by which the fracture of this phase is cleavage, using the X ray

246
microanalysis and fractographic analyses. They concluded that the prior β-phase had to contain at least 0.3–0.4 wt% oxygen concentration to be cleavage (for both Zry-4 and M5TM alloy). Stern et al. [4] estimated (using tensile testing) that the RT macroscopic ductile-to-brittle transient occurs for a critical oxygen concentration close to ~0.5 wt% (again for both alloys).
900 1000 1100 1200 13000
1
2
3
4
5
T (°C)
n
a)
6.5 7 7.5 8 8.5
x 10-4
-1.2
-1
-0.8
-0.6
-0.4
-0.2
1/T (1/K)
lnK
(w
t.%
3/m
in)
y = - 3742*x + 2.165
b)
FIG. 3. The kinetics of the oxygen uptake in the prior β-phase for low hydrogen content (up to 100 wppm). There are still many samples containing more than 0.38 wt% of oxygen in the prior β-phase which are not brittle. That means that decrease in the residual ductility is not only caused by the oxygen content in the prior β-phase but one must, additionally, consider the effect of hydrides and the fraction of the β-phase. It is quite tricky in case of the Zr1Nb alloy since there exists the two-phase (α+β)-Zr region. So not only the prior β-layer shall be taken into account but also the fraction of the β-phase in the two-phase region. The fraction of the prior β-phase depends on the conditions of the high temperature oxidation and the hydrogen content for the alloy. The influence of hydrides and the fraction of the prior β-phase was not considered and investigated further in this study. Substituting the oxygen threshold 0.38 wt% into Equation 3 a new oxidation criterion can be expressed as:
T = 1.12 × 10⁻⁸ × exp(33675/T) (4) and for thermal transients the precedent expression can be rewritten into:

247
31
13
13 33675exp447
nnnn T
OO (5)
Where t, τ is the time (s); T is the temperature (K); Oβ is the value of Oβ.
0 0.5 1 1.5 2 2.5 30
10
20
30
40
50
60
O concentration (wt. %)
resi
dual
duc
tility
(%
)
FIG. 4. The results of RCT depending on the oxygen concentration in the prior β-phase. The solid line indicates the 0.38 wt% oxygen concentration threshold. 3.3. Analysis of Oβ
Figure 5 presents the residual ductility versus the oxidation criteria values. The values of all criteria are calculated using the real temperature history of each sample. Oβ is valid nearly for all samples treated in this study (modified E110 alloy – 384 specimens). Only several exceptions are samples containing more than 200 wppm of hydrogen. That is why the applicability region of this criterion is restricted up to 200 wppm for this alloy (for specimens pre-corroded up to ~10 µm in steam). To extend the validity for higher hydrogen content more experimental data are needed — it has been already extended from 150 wppm [24] thanks to new experimental data. The empirical criterion K is valid for all samples tested in this study because it is more conservative compared to the criterion Oβ. It involves more alloys (older E110 alloy, Zry-4, etc.) and is valid up to 600 wppm of hydrogen. The 17% ECRC.-P. criterion is not valid for more samples compared to Oβ involving also samples with lower hydrogen content, in spite of the improved corrosion properties of the Zr1Nb alloy. The revised 17% ECRC-P oxidation criterion (rev ECRC-P) has been proposed by NRC [25]. Criterion revision consisted in reduction of tube thickness, calculated according to Cathcart-Pawell correlation for LOCA temperature course, by tube thickness which oxidized during corrosion in reactor. However, such proposed criterion does not contain restriction on hydrogen content in alloy absorbed during reactor operation. ECR criterion construction (including revised) takes into account only wall thickness loss by oxidation. Thus revised 17% ECRC-P criterion is valid only for rare circumstances (thin corrosion layer and low hydrogen content in alloy) [8]. ECR oxidation criteria do not take into account dissolution of oxide, formed during reactor operation, in dependence on hydrogen content, nor dissolution and redistribution of hydrides during high temperature transient and of course neither higher solubility of oxygen in Zr-alloys caused by higher hydrogen content.

248
10-2
10-1
100
101
0
10
20
30
40
50
60
O
resi
dual
duc
tility
(%
)
600 - 1,300 °C, 0 - 20 m
< 200 w ppm
~600 w ppm
O=1
a)
10-2
10-1
100
101
102
0
10
20
30
40
50
60
K
resi
dual
duc
tility
(%
)
600 - 1,300 °C, 0 - 20 m
< 200 w ppm
~600 w ppm
K=1
b)
10-1
100
101
102
103
0
10
20
30
40
50
60
ECR 17 %
resi
dual
duc
tility
(%
)
600 - 1,300 °C, 0 - 20 m
< 200 w ppm
~600 w ppm
ECR=1
c)
FIG. 5. Residual ductility vs. the oxidation criteria. Figure 6 compares margins of the oxidation criteria. It is quite visible that the K criterion is the most conservative. The criterion Oβ is, compared to the ECR, more conservative for higher temperatures, and, on the other hand, less restrictive for lower temperatures. The applicability region of Oβ is now for tubes containing up to 200 wppm of hydrogen. The hydrogen pick-up coming from the in-service corrosion does not exceed 100 wppm for the Zr1Nb alloy (M5TM which is considered to have similar corrosion properties) after 66 GW·d·t-1 fuel burnup [9]. So it can be concluded that Oβ can be used for LOCA safety analyses for the modified E110 alloy instead of the 17% ECR criterion. Big disadvantage of Oβ is dependence on the wall thickness as well as in case of the ECR. It must be verified for claddings with different dimensions as well as claddings fabricated of different materials.

249
It is quite possible that the maximal hydrogen content will differ for other materials. Contrary, the criterion K is versatile in cladding geometry (0.53–0.70 mm wall thickness). It can be also used for cladding made of different materials containing hydrogen up to 600 wppm. Big advantage of the criterion Oβ is that it was derived based on the oxygen uptake in the prior β-phase, and hence it has physical meaning opposite to K which is purely empirical.
6 7 8 9 10
x 10-4
10-2
100
102
104
1/T (1/K)
t (m
in)
17 % ECR
K
O
FIG. 6. Comparison between the oxidation criteria. One must also take into account that the K criterion is based on RCT at RT in contrast to Oβ which is based on RCT performed at 135°C. However, samples brittle at RT cannot become ductile at 135°C. There is only slight augmentation in the residual ductility when the test temperature elevates from 20–135°C [26]. Oβ was also experimentally verified on the “special test” of conservative ALOCA and BLOCA temperature histories on unpreoxidized and peroxidised samples, including samples peroxidised in VVER water (using claddings fabricated of various types of alloys, not including the modified E110), with positive result. However, more such results will be necessary to confirm this conclusion, especially of brittle samples exceeding this criterion. Oβ may be used with advantage instead of K for BLOCA courses where K is too conservative. 4. CONCLUSIONS The new oxidation criterion Oβ was analysed and compared to other oxidation criteria in this study. The following conclusions can be drawn:
Oβ criterion based on the oxygen concentration in the prior β-phase has been proposed. The range of applicability is up to 200 wppm of hydrogen (~10 µm thick corrosion layer in steam environment) for the modified E110 alloy.
The criterion can be used for the modified E110 alloy in LOCA safety analyses instead of the 17% ECR which is not valid in many cases.
It is less restrictive compared to the criterion K. It depends on the cladding material and dimensions. It was also experimentally verified on real LOCA temperature histories.
The criterion Oβ may be extended using further experiments with pre-corroded high hydrogen containing samples and other alloys. Acknowledgments. Authors wish to thank A. Přibyl and J. Šustr for preparation and special evaluation of samples.

250
REFERENCES [1] ATOMIC ENERGY COMMISSION RULE MAKING HEARING, Opinion of the
Commission, Docket RM-50-1, December 28 (1973). [2] CHUNG, H.M., Fuel behaviour under loss/of/coolant accident situations, Nucl. Eng. Tech. 37
(2005) 327–362. [3] BRACHET, J.-C., et al., Hydrogen Content, pre-oxidation and cooling scenario influences on
post-quench mechanical properties of Zy-4 and M5(TM) alloys in LOCA conditions — relationship with the post-quench microstructure, J. ASTM Int. 5 (5) (2008) Paper ID JAI101116.
[4] STERN, A., et al., Investigations of the microstructure and mechanical properties of prior beta structure as function of the oxygen content (0.9 wt%) in two zirconium alloys, J. ASTM Int. 5 (4) (2008) Paper ID JAI101119.
[5] CHUNG, H.M., et al., Embrittlement criteria for Zircaloy fuel cladding applicable to accident situations in light water reactors, NUREG/CR-1344, ANL-79-48, Argonne National Laboratory (1980).
[6] VRTÍLKOVÁ, V., et al., Termomechanické vlastnosti povlakové trubky ze Zr-slitin po vysokoteplotních přechodech, UJP PRAHA a.s. Research Report December 15 2008 (2008) [in Czech].
[7] HSU, H.H., An evaluation of hydrided Zircaloy-4 cladding fracture behaviour by X-specimen test, J. Alloys Compd. 426 (2006) 256.
[8] VRTÍLKOVÁ, V., et al., Analysis of revised 17% ECRC-P criterion using oxidation database UJP, Proc. of the 7th Plenary Meeting of SEGFSM and Ad hoc Meeting on Status of LOCA Tests For Burnup Dependent LOCA Criteria, Paris (2006).
[9] PORTIER, L., et al., Influence of long service exposures on the thermal-mechanical behaviour of Zry-4 and M5TM alloys in LOCA conditions, J. ASTM Int. 2 (2005) 103–126.
[10] BAKER, L., et al., Research report ANL-6548, Argonne National Lab, Argonne (1962). [11] VRTÍLKOVÁ, V., et al., An approach to the alternative LOCA embrittlement criterion, Proc. of
the Meeting of OECD Nuclear Energy Agency Committee on the Safety of Nuclear Installations Special Expert Group on Fuel Safety Margins (SEGFSM), OECD, Argonne (2004).
[12] HOBSON, D.O., Ductile-brittle behaviour of Zircaloy fuel cladding, Proc. ANS Topical Mtg. on Water Reactor Safety, Salt Lake City (1973) 274–288.
[13] PAWEL, R.E., Oxygen diffusion in beta Zircaloy during steam oxidation, J. Nucl. Mater. 50 (1974) 247–258.
[14] SAWATZKY, A., Proposed criterion for the oxygen embrittlement of Zircaloy-4 fuel cladding, Proc. 4th Symp. on Zirconium in the Nuclear Industry, Stratford-on-Avon (1978).
[15] VRTILKOVA, V., et al., Practical illustration of the traditional vs. alternative LOCA embrittlement criteria, Proc. Int. Conf. Nuclear Energy for New Europe 2005, Bled (2005).
[16] LORINCIK, J., et al., SIMS and thermal evolution analysis of oxygen in Zr-1%Nb alloy after high temperature transitions, Surf. Interface Anal. 43 (2011) 618–620.
[17] BRACHET, J.C., et al., Influence of hydrogen content on the α–β phase transformation temperatures and on the thermal-mechanical behaviour of Zry-4, M4 and M5™ alloys during the first phase of LOCA Transient, Proc. Zirconium in the Nuclear Industry: Thirteenth International Symposium, STP 1423, Annecy (2001) 673–701.
[18] NÉGYESI, M., The kinetics of the α-Zr(O) layer in the Zr1Nb alloy, CTU in Prague FNSPE DP, Master Thesis (2009) [in Czech].
[19] NÉGYESI, M., et al., Microstructure evolution in Zr1Nb fuel cladding during high temperature oxidation, J. Nucl. Mater. 416 (3) (2011) 298–302.
[20] CORVALÁN-MOYA, C., et al., Numerical modelling of oxygen diffusion in the wall thickness of low-tin Zircaloy-4 fuel cladding tube during high temperature (1100–1250°C) steam oxidation, J. Nucl. Mater. 400 (2010) 196–204.
[21] HUNT, C.E.L., et al., The continuous cooling transformation behaviour of zirconium-niobium-oxygen alloys, J. Nucl. Mater. 38 (1971) 17–25.

251
[22] TOFFOLON, C., et al., Experimental study and preliminary thermodynamic calculations of the pseudo-ternary Zr-Nb-Fe-(O) system in: G. Moan and P. Rudling (Eds), Zirconium in Nuclear Industry: 13th Int. Symposium, ASTM STP 1423, American Society for Testing and Materials, West Conshohocken (2002) 361.
[23] JERLERUD PEREZ, R., et al., Thermodynamic evaluation of the Nb-O-Zr system, J. Nucl. Mater. 360 (2007) 242–254.
[24] NÉGYESI, M., et al., Proposal of new Oβ oxidation criterion for new types of Zr1Nb alloys of fuel claddings, 20th International Conference – Nuclear Energy for New Europe 2011, NENE, Bovec (2011).
[25] MEYER, R., Technical basis for revision of embrittlement criteria in 10 CFR 50.46, ACRS (2005).
[26] DOUCHA, R., Master thesis, CTU-FNSPE-DM, Prague (2009) [in Czech].


253
QUANTIFICATION OF THE CHEMICAL ELEMENTS PARTITIONING WITHIN PRE- HYDRIDED ZIRCALOY-4 AFTER HIGH TEMPERATURE STEAM OXIDATION AS A FUNCTION OF THE FINAL COOLING SCENARIO (LOCA CONDITIONS) AND CONSEQUENCES ON THE (LOCAL) MATERIALS HARDENING
J.C. BRACHET*, D. HAMON*, J.L. BÉCHADE*, P. FORGET*, C. TOFFOLON-MASCLET*,
C. RAEPSAET**, J.P. MARDON***, B. SEBBARI****
*
**
***
****
CEA-Saclay DEN Nuclear Materials Department, SRMA Gif-Sur-Yvette, France Email: [email protected] CEA-Saclay DSM/IRAMIS, LEELS Gif-Sur-Yvette, France AREVA NP Fuel Sector Lyon, France EDF-SEPTEN Paris, France Abstract
During hypothetical high temperature loss of coolant accident (LOCA) transients, the nuclear fuel cladding materials experience some deep metallurgical evolutions due to the oxygen (and potentially hydrogen) ingress and the phase transformations that occur within the residual sub-oxide metallic part of the cladding tubes. Those micro-structural/micro-chemical evolutions are known to strongly affect the post-quenching (PQ) resistance of the clad. Moreover, to anticipate the LOCA behaviour of high burnup (BU) cladding tubes, pre-hydrided materials are generally used as a surrogate for high BU irradiated materials. On such materials, it has been shown quite recently that the PQ residual ductility of the cladding tubes strongly depends on the final “cooling scenario” at the end of the LOCA transient. Then, to get some insights into the underlying micro-structural phenomena, the present paper deals with in depth metallurgical study of the micro-chemical evolutions that occur in pre-hydrided cladding tube segments, as a function of the final LOCA transient cooling scenario after high temperature (HT) steam oxidation. For that, pre-hydrided (~600 wt.-ppm) low tin Zircaloy-4 has been subjected to the following HT oxidation sequences: (a) one side steam oxidation for 1 min at 1200°C (equivalent cladding reacted ~3%); (b) precooling at different cooling rates ranging from ~0.2 up to 10°C·s-1; (c) final water quenching from different temperatures below or equal to 800°C. Then, thanks to the use of both electro probe micro-analysis (EPMA) and elastic recoil detection analysis (µ-ERDA), the micro-chemical elements partitioning inside the resultant prior-β phase internal layer has been systematically quantified, at a micrometre scale. Finally, it could be possible to correlate the chemical elements partitioning — including oxygen and hydrogen — with the local hardening, using especially nano-hardness measurements, and to derive some relationships with the macroscopic residual ductility parameters. 1. INTRODUCTION At the end of a LOCA transient, the high temperature oxidized nuclear fuel cladding tubes experience different “cooling scenario”, depending on many factors such as: the LOCA transient type (i.e., small, intermediate or large break), the axial position of the rod considered, the burnup (BU) achieved, the alloy type, the emergency core cooling system (ECCS) efficiency, etc. Thus, during the final reflooding of the core, different final quenching temperatures ranging typically between ~400°C and ~1000°C and different prequenching cooling rates ranging typically between less than 1°C·s-1 up to ~10°C·s-1 have to be considered. As shown in some previous studies [1–6], these two

254
cooling/quenching parameters may have a significant impact on the residual post-quenching (PQ) clad ductility/toughness. 1.1. As-received materials Previous works [4–6] performed on as-received Zircaloy-4 have shown some quite contradictory results. On the one hand, Komatsu et al. [4] have observed that, high temperature oxidized specimens which were cooled slowly before quench were fractured at lower loads during ring compression tests (RCTs) compared those directly quenched from their oxidation temperature. On the other hand, a few years later, Chung and Kassner [5] have obtained quite opposite results, indicating a better PQ ductility and impact properties after cooling at 5°C·s-1 through the → temperature range (before the final water quenching), compared to direct quenching (at ~100°C·s-1) from the oxidation temperature. A more recent study performed by Udagawa et al. [6] led to the conclusion that there was no clear effect of the prequenching cooling rate (for final quenching from temperatures ranging from 800–1000°C) on the residual ductility of high temperature (HT) oxidized Zircaloy-4 cladding. However, all these authors came to the conclusion that the influence — if any — of the final (LOCA transient) cooling scenario on the residual clad ductility was linked to the existence or not of so called “-incursions” (in the prior- layer) due to the oxygen enrichment of the first platelets to form during cooling. Thus, it seems from these early studies that the oxygen partitioning associated with the on cooling → phase transformation should have a major influence on the residual HT oxidized clad properties. Because chemical partitioning is a diffusion controlled mechanism, it is likely that its amplitude should be influenced by the (prequenching) cooling rate through the → temperature range. 1.2. Pre-hydrided materials Pre-hydrided materials can be used to simulate the LOCA behaviour of high BU claddings, to be able to take into account the hydrogen pick-up due to the nominal in-service corrosion. Thus, on Zircaloy-4 pre-hydrided at ~600 wt.ppm, recent studies performed at CEA [1–2] have shown a quite surprising PQ ductility restoration after slow cooling through the → temperature range and for final water quenching from 600°C or 700°C (Fig. 1). These results indicate that, on pre-hydrided materials (as a surrogate for high BU materials), both the prequenching cooling rate and the final temperature from which the final water quenching is performed play a major influence on the residual PQ clad ductility, as measured from RCTs or from 3 point bending tests (3-PBT). Then, to get some insights into the underlying micro-structural phenomena, the present paper deals with in depth metallurgical study of the micro-chemical evolutions that occur in pre-hydrided Zircaloy-4 as function of the final LOCA transient cooling scenario after high temperature (HT) steam oxidation. More details about the materials studied, the experimental HT oxidation conditions, the PQ mechanical tests and the experimental analysis facilities and procedures can be found in some previous CEA papers [1–3] and [7]. Pre-hydrided (~600 wt.ppm) low-tin Zircaloy-4 (from Areva-NP) has been subjected to the following HT oxidation sequences:
(a) one side steam oxidation for 1 min at 1200°C (equivalent cladding reacted (ECR) ~3%);
(b) precooling at different cooling rates ranging from ~0.2 up to 10°C·s-1;
(c) final water quenching from different temperatures below or equal to 800°C.
Then, in a first step, thanks to the use of both electro probe micro-analysis (EPMA) and elastic recoil detection analysis (µ-ERDA, [3]), the micro-chemical elements partitioning inside the resultant prior- phase internal layer has been systematically quantified, at a micrometre scale.
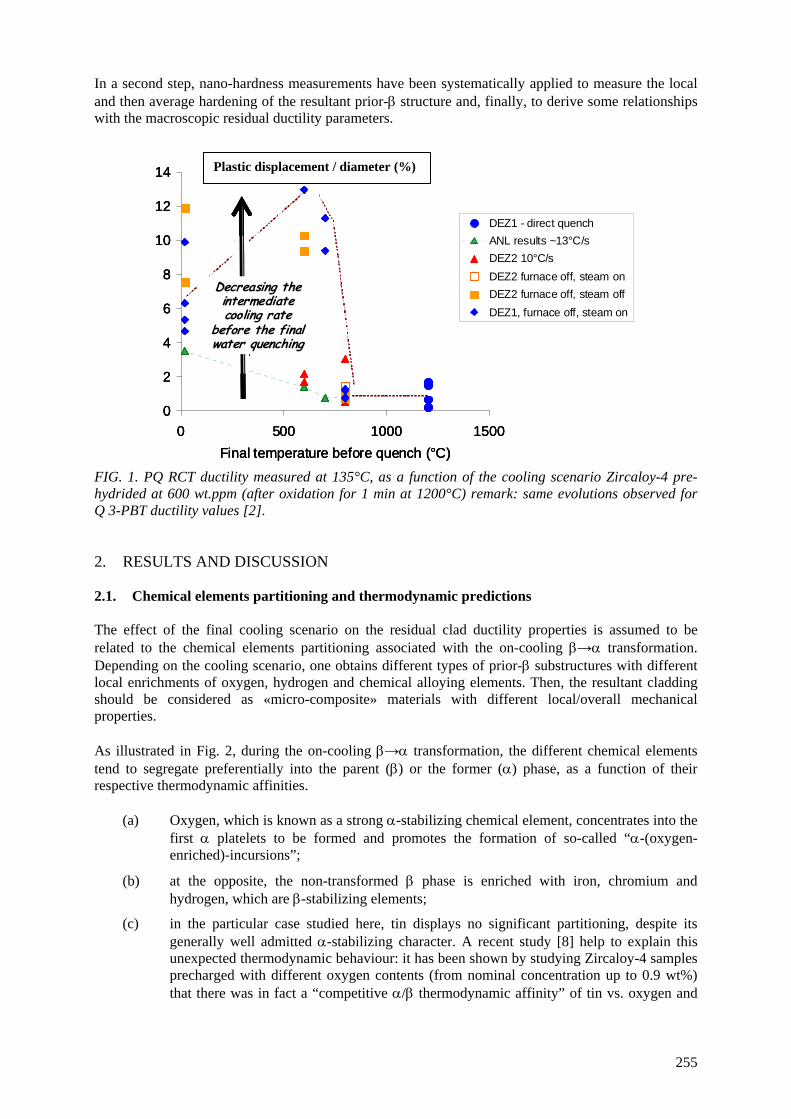
255
In a second step, nano-hardness measurements have been systematically applied to measure the local and then average hardening of the resultant prior- structure and, finally, to derive some relationships with the macroscopic residual ductility parameters.
0
2
4
6
8
10
12
14
0 500 1000 1500
Final temperature before quench (°C)
DEZ1 - direct quench
ANL results ~13°C/s
DEZ2 10°C/s
DEZ2 furnace off, steam on
DEZ2 furnace off, steam off
DEZ1, furnace off, steam on
?
?
Decreasing the intermediatecooling rate
before the final water quenching
0
2
4
6
8
10
12
14
0 500 1000 1500
Final temperature before quench (°C)
DEZ1 - direct quench
ANL results ~13°C/s
DEZ2 10°C/s
DEZ2 furnace off, steam on
DEZ2 furnace off, steam off
DEZ1, furnace off, steam on
?
?
0
2
4
6
8
10
12
14
0 500 1000 1500
Final temperature before quench (°C)
DEZ1 - direct quench
ANL results ~13°C/s
DEZ2 10°C/s
DEZ2 furnace off, steam on
DEZ2 furnace off, steam off
DEZ1, furnace off, steam on
?
?
Decreasing the intermediatecooling rate
before the final water quenching
FIG. 1. PQ RCT ductility measured at 135°C, as a function of the cooling scenario Zircaloy-4 pre-hydrided at 600 wt.ppm (after oxidation for 1 min at 1200°C) remark: same evolutions observed for Q 3-PBT ductility values [2]. 2. RESULTS AND DISCUSSION 2.1. Chemical elements partitioning and thermodynamic predictions The effect of the final cooling scenario on the residual clad ductility properties is assumed to be related to the chemical elements partitioning associated with the on-cooling → transformation. Depending on the cooling scenario, one obtains different types of prior- substructures with different local enrichments of oxygen, hydrogen and chemical alloying elements. Then, the resultant cladding should be considered as «micro-composite» materials with different local/overall mechanical properties. As illustrated in Fig. 2, during the on-cooling → transformation, the different chemical elements tend to segregate preferentially into the parent () or the former () phase, as a function of their respective thermodynamic affinities.
(a) Oxygen, which is known as a strong -stabilizing chemical element, concentrates into the first platelets to be formed and promotes the formation of so-called “-(oxygen-enriched)-incursions”;
(b) at the opposite, the non-transformed phase is enriched with iron, chromium and hydrogen, which are -stabilizing elements;
(c) in the particular case studied here, tin displays no significant partitioning, despite its generally well admitted -stabilizing character. A recent study [8] help to explain this unexpected thermodynamic behaviour: it has been shown by studying Zircaloy-4 samples precharged with different oxygen contents (from nominal concentration up to 0.9 wt%) that there was in fact a “competitive / thermodynamic affinity” of tin vs. oxygen and
Plastic displacement / diameter (%)

256
that, around a “critical” oxygen value (close to 0.5 wt%), there was no more tin preferential enrichment in the phase, as it is observed for the nominal oxygen content (~0.13 wt%). Due to the HT oxidation (1200°C, 1 min, ECR~3%), the mean oxygen concentration in the prior- layer has been evaluated to be close to 0.35 wt%. For such an oxygen concentration and taking into account the results obtained in [8], it is unlikely that there is a sufficient thermodynamic driving force to promote tin partitioning upon the on-cooling → phase transformation.
Fe
Sn Cr
O
(a) EPMA
(b) µ-ERDA
FIG. 2. Oxygen, hydrogen and main alloying elements partitioning upon on-cooling → transformation: (a) EPMA X ray maps and (b) hydrogen quantitative mapping (µ-ERDA) of Zircaloy-4 + H=600 ppm, one-side oxidized for 1 min at 1200°C, cooled down to 800°C at ~10°C·s-1 and then water quenched down to room temperature (RT). To have a better view of the phase transformations that should occur during (slow) cooling within the prior- layer of the HT oxidized Zircaloy-4 (with 600 wt.ppm of hydrogen and ~0.35 wt% of oxygen), one can make some thermodynamic calculations thanks to the development of a multi-alloyed thermodynamic database devoted to compute the complex phase equilibrium that are representative of industrial alloys, by taking into account the respective concentrations of the main alloying elements (Sn, Fe and Cr), including both oxygen and hydrogen [9–10]. Figure 3, illustrates the phase transformations sequences occurring upon cooling within the prior- layer. It can be observed from the thermodynamic calculations performed that, in equilibrium conditions (which should be more or less representative of slow cooling rate):
(a) the allotropic Zr→Zr phase transformation occurs between ~930°C and ~700°C;
(b) until this last temperature (700°C), the precipitation of intermetallic Zr(Fe,Cr)2 Laves phases (secondary precipitated phases (SPPs)) occurs through an eutectoid type reaction from the parent residual iron and chromium enriched Zr phase;
Fe, Cr, H
O
O
Oxygenenriched zones
Hydrogen (+ Fe, Cr) enriched zones
200µm

257
(c) the precipitation of hydrides begins at ~550°C (~Zr-H eutectoid temperature) and the hydrides precipitated fraction increases progressively as the temperature decreases down to RT, according to the hydrogen equilibrium solubility evolution within the Zr matrix.
FIG. 3. Thermocalc and Zircobase; thermodynamic calculations taking into account the main alloying elements, O and H typical concentrations, that is, [Sn]=1.3 wt%, [Fe]=0.2 wt%, [Cr]=0.1 wt%, [0]=0.35 wt% and [H]=600 wt.ppm. Now, keeping in mind these metallurgical on-cooling evolutions, one has to focus more in depth on the different applied cooling scenario. 2.3. Direct quenching from the oxidizing temperature (i.e., 1200°C) When the water quenching is performed directly from the high oxidizing temperature and due to the fact that the chemical elements partitioning is a diffusion controlled mechanism, the solutes partitioning is very small and the resultant prior- structure can be considered as chemically homogeneous (at least at the micrometre scale). Then, for such cooling conditions and from the previous “direct quenching” CEA data obtained on the cladding resultant PQ ductility at RT [1], it has been shown that the macroscopic ductile-to-brittle transition occurs for “critical” prior- layer concentrations of oxygen and hydrogen of 0.4±0.1 wt% and ~600 wt.ppm respectively. This explains why the 600 ppm hydrogen charging low tin Zircaloy-4 alloy studied here displays a negligible residual PQ ductility after direct quenching from 1200°C, even for the small ECR achieved (~3%), as recalled on Fig. 1. 2.4. Quenching from 800°C From the thermodynamic calculations (Fig. 4), this temperature corresponds more or less to 50% of transformed into . These thermodynamic predictions are in good agreement with the microstructural observations performed after quenching from 800°C, showing volumic fraction of 50±10% of oxygen enriched zones (i.e., corresponding to the fraction of transformed into during the prequenching cooling from 1200°C down to 800°C) together with 50±10% of iron, chromium and hydrogen enriched zones (i.e., corresponding to the “frozen” non transformed prior- phase at 800°C), as illustrated on Fig. 4. In this figure, we have indicated the average concentrations of oxygen, iron and hydrogen of the two respective substructures.
00,10,20,30,40,5
0,60,70,80,9
1
200 300 400 500 600 700 800 900 1000T(°C )
Ph
as
es
vo
lum
ic f
rac
tio
ns
("
Th
erm
oc
alc
+Z
irc
ob
as
e"
ca
lcu
lati
on
s)
A lpha-Zr
B eta-Zr
Intermeta llic S P P
P recip itated hydrides
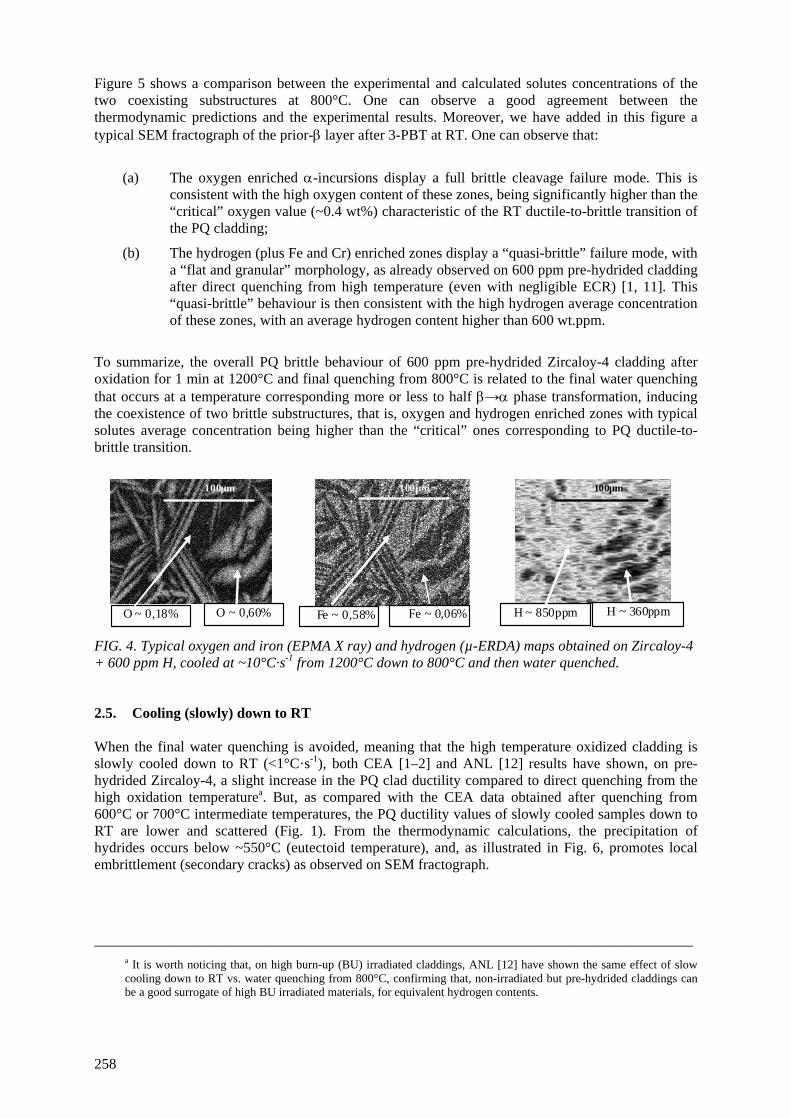
258
Figure 5 shows a comparison between the experimental and calculated solutes concentrations of the two coexisting substructures at 800°C. One can observe a good agreement between the thermodynamic predictions and the experimental results. Moreover, we have added in this figure a typical SEM fractograph of the prior- layer after 3-PBT at RT. One can observe that:
(a) The oxygen enriched -incursions display a full brittle cleavage failure mode. This is consistent with the high oxygen content of these zones, being significantly higher than the “critical” oxygen value (~0.4 wt%) characteristic of the RT ductile-to-brittle transition of the PQ cladding;
(b) The hydrogen (plus Fe and Cr) enriched zones display a “quasi-brittle” failure mode, with a “flat and granular” morphology, as already observed on 600 ppm pre-hydrided cladding after direct quenching from high temperature (even with negligible ECR) [1, 11]. This “quasi-brittle” behaviour is then consistent with the high hydrogen average concentration of these zones, with an average hydrogen content higher than 600 wt.ppm.
To summarize, the overall PQ brittle behaviour of 600 ppm pre-hydrided Zircaloy-4 cladding after oxidation for 1 min at 1200°C and final quenching from 800°C is related to the final water quenching that occurs at a temperature corresponding more or less to half → phase transformation, inducing the coexistence of two brittle substructures, that is, oxygen and hydrogen enriched zones with typical solutes average concentration being higher than the “critical” ones corresponding to PQ ductile-to-brittle transition.
100µm
Fe ~ 0,06% Fe ~ 0,58% O ~ 0,60% O ~ 0,18%
100µm
H ~ 360ppm H ~ 850ppm
100µm
FIG. 4. Typical oxygen and iron (EPMA X ray) and hydrogen (µ-ERDA) maps obtained on Zircaloy-4 + 600 ppm H, cooled at ~10°C·s-1 from 1200°C down to 800°C and then water quenched. 2.5. Cooling (slowly) down to RT When the final water quenching is avoided, meaning that the high temperature oxidized cladding is slowly cooled down to RT (<1°C·s-1), both CEA [1–2] and ANL [12] results have shown, on pre-hydrided Zircaloy-4, a slight increase in the PQ clad ductility compared to direct quenching from the high oxidation temperaturea. But, as compared with the CEA data obtained after quenching from 600°C or 700°C intermediate temperatures, the PQ ductility values of slowly cooled samples down to RT are lower and scattered (Fig. 1). From the thermodynamic calculations, the precipitation of hydrides occurs below ~550°C (eutectoid temperature), and, as illustrated in Fig. 6, promotes local embrittlement (secondary cracks) as observed on SEM fractograph.
___________________________________________________________________________ a It is worth noticing that, on high burn-up (BU) irradiated claddings, ANL [12] have shown the same effect of slow cooling down to RT vs. water quenching from 800°C, confirming that, non-irradiated but pre-hydrided claddings can be a good surrogate of high BU irradiated materials, for equivalent hydrogen contents.

259
2.6. Quenching from 600°C (or from 700°C) This cooling scenario is likely the most interesting case because a significant progressive increase in the PQ clad ductility is observed when the prequenching cooling rate decreases (Fig. 1). From the thermodynamic predictions and according to experimental observations, the obtained microstructure can be divided into three substructures (Fig. 7), that is:
(a) oxygen enriched (and H, Fe, Cr depleted) -incursions, as already observed after quenching from 800°C, these zones coming from the early beginning of the on-cooling allotropic → transformation, above 800°C;
(b) both oxygen and hydrogen (+ Fe, Cr) depleted zones corresponding to the residual fraction of phase that has been transformed into from 800°C to approx. 700°C. It is likely that, due to their low content of both oxygen and hydrogen, these zones should display some significant (local) PQ ductility;
(c) some localized zones where precipitation of SPPs (intermetallic Laves phase) has occurred. It is worth noticing that, even if hydrogen is detected by µ-ERDA in these zones, no clear precipitated hydrides can be observed in these last zones that has been transformed into +SPPs (~eutectoid reaction), consistently with the thermodynamic calculations which predict that precipitation of hydrides occurs below 600°C.
2.7. Evaluation of the local hardening In past LOCA studies, micro-hardness Vickers measurements have been often used as an indicator of the local oxygen content within the prior- structure and some attempts have been done to derive some relationship with the macroscopic PQ residual mechanical clad properties. For such measurements, the conventional loads applied (50–100 g) induce indentations of tenths micrometers in diameter. Then, due to the “micro-composite” nature of the prior- typical microstructures studied here, the conventional Vickers micro-hardness measurements are not fully adapted to measure accurately the local hardening, taking into account that the typical substructures sizes range from a few micrometres up to tenths micrometres. Then, as already done by some authors [13–16], we have decided to apply nano-hardness measurements instead of classical Vickers micro-hardness measurements to be able to characterize our samples at the micrometre scale, which is thus comparable to the EPMA and µ-ERDA spatial resolution. The nano-hardness measurements were carried out using a Nano Indenter XP (Nano Instruments, Inc.). Berkovich type diamond indenter was used with a load of 2 mN. Such a load corresponds to typical indentation depth of 100–200 nm. To obtain statistically representative results, nearly one thousand nano-indentations have been obtained on each studied sample, which is thus comparable to the EPMA measurements statistics. As already observed using Vickers micro-hardness measurements, but on direct quenched samples which were thus much more homogeneous [1], Fig. 8 shows a strong correlation between the (nano-) hardness and the local oxygen concentration values. Then, we tried to interpret the data through a statistical approach by making associations between each class of the frequency diagrams representative of the oxygen EPMA measurements and of the nano-hardness ones, as shown in Fig. 9 (a). Moreover, because most of the solutes partitioning occurs upon the on cooling → phase transformation and taking into account that its kinetics is a diffusion controlled one, one can make the assumption that, for a given (local) oxygen content, the resultant materials hardening should be related to the logarithm of the cooling time through the → temperature range. This last parameter can be approximated by the “instantaneous” cooling rate at mid → transformation, that is, ~800°C (Fig. 9 (b)). Thus, an empirical model has been derived from all the data obtained (Fig. 9 (c)):

260
Nano-hardness (GPa) = A + B·Log10{dq/dt|T(50%b→a)} + C(wt% oxygen) (1) Validity range:
- [O]~0.1→0.9 wt%;
- pre-quenching cooling rate ranging from ~0.2 up to 10°C·s-1;
- final water quenching from 600–700°C temperature range.
FIG. 5. Comparison between experimental and calculated solutes concentrations of the two coexisting substructures at 800°C, of pre-hydrided Zircaloy-4 oxidized for 1 min at 1200°C, slow cooled at ~0.2°C·s-1 down to 800°C and then water quenched from this temperature, vs. corresponding SEM fractograph of the prior- layer after 3-PBT at RT.
0,0
0,2
0,4
0,6
0,8
1,0
1,2
1,4
1,6
O Sn Fe Cr H O Sn Fe Cr H
wei
gh
t %
Experimental
Calculations
Hydrogen (+Fe, Cr) enriched zones
Oxygen enriched zones

261
ZrO2
(O)ZrO2
(O)ZrO2
(O)
SEM micrograph (in electron backscattered mode) of the wall clad thickness showing precipitation of coarse
hydrides SEM fractograph showing secondary cracks associated with coarse
precipitated hydrides
FIG. 6. SEM observations on pre-hydrided 600 ppm Zircaloy-4 after oxidation for 1 min at 1200°C and slow cooling down to RT.
IntermetallicSPP
Less oxygenenriched zones
SPP (Fe,Cr,Zr)
SPP (Fe,Cr,Zr)
SEM micrograph (Backscattered electron mode)
FIG. 7. Typical microstructure obtained on pre-hydrided 600 ppm Zircaloy-4 after oxidation for 1 min at 1200°C, cooling down to 600°C and water quenching from this last temperature.
Hydrides
Oxygen enriched -incursions

262
FIG. 8. Backscattered electron micrograph, Fe, Cr, O EPMA maps + oxygen and nano-hardness measurements performed on the same line, obtained on pre-hydrided Zircaloy-4 after oxidation for 1 min at 1200°C, slow cooling down to 600°C and water quenching.
0.0
0.1
0.2
0.3
0.4
0.5
0.6
0.7
0.8
0.9
1.0
0 100 200 300 400 500 600
0
1
2
3
4
5
6
7
8
9
10
O cor4 H Gpa
D en µm
Wt% Ocor4 H Gpa
BSE
Fe
Cr
O

263
Finally, Fig. 10 illustrates the good agreement obtained between calculated (using Eq. 1) and experimental nano-hardness values.
0
5
10
15
0.05
0.25
0.45
0.65
0.85
1.05
Wt% O
Fre
qu
en
cy (
%)
5,10,25, 50, 75, 90,95%
0
5
10
15
0.05
0.25
0.45
0.65
0.85
1.05
Wt% O
Fre
qu
en
cy (
%)
5,10,25, 50, 75, 90,95%5,10,25, 50, 75, 90,95%5,10,25, 50, 75, 90,95%
0
2
4
6
8
10
2 3 4 5 6 7 8 9 10 11H(F) Gpa
fré
qu
en
ce 5,10,25, 50, 75, 90,95%
0
2
4
6
8
10
2 3 4 5 6 7 8 9 10 11H(F) Gpa
fré
qu
en
ce 5,10,25, 50, 75, 90,95%5,10,25, 50, 75, 90,95%5,10,25, 50, 75, 90,95%
Fre
que
ncy
(%)
0
5
10
15
0.05
0.25
0.45
0.65
0.85
1.05
Wt% O
Fre
qu
en
cy (
%)
5,10,25, 50, 75, 90,95%
0
5
10
15
0.05
0.25
0.45
0.65
0.85
1.05
Wt% O
Fre
qu
en
cy (
%)
5,10,25, 50, 75, 90,95%5,10,25, 50, 75, 90,95%5,10,25, 50, 75, 90,95%
0
2
4
6
8
10
2 3 4 5 6 7 8 9 10 11H(F) Gpa
fré
qu
en
ce 5,10,25, 50, 75, 90,95%
0
2
4
6
8
10
2 3 4 5 6 7 8 9 10 11H(F) Gpa
fré
qu
en
ce 5,10,25, 50, 75, 90,95%5,10,25, 50, 75, 90,95%5,10,25, 50, 75, 90,95%
Fre
que
ncy
(%)
0
2
4
6
8
10
2 3 4 5 6 7 8 9 10 11H(F) Gpa
fré
qu
en
ce 5,10,25, 50, 75, 90,95%
0
2
4
6
8
10
2 3 4 5 6 7 8 9 10 11H(F) Gpa
fré
qu
en
ce 5,10,25, 50, 75, 90,95%5,10,25, 50, 75, 90,95%5,10,25, 50, 75, 90,95%
Fre
que
ncy
(%)
(a) Association between each class of the respective frequency diagrams of oxygen (EPMA measurements) and nano-hardness values (pre-hydrided 600ppm Zircaloy-4, oxidized for 1 min at 1200°C, cooled at ~0.8°C·s-1 down to 600°C and finally water quenched).
Zr
Zr
T/+
T50%+50% ~800°C
T+/
[d/dt]800°C
Time(s)
(°C)
Zr
Zr
T/+
T50%+50% ~800°C
T+/
[d/dt]800°C
Time(s)
(°C)
(b)
2
3
4
5
6
7
8
9
10
11
-1 0 1 2 3Log10 [pre-quenching cooling rate (°C/s) measured at
800°C (~50% Beta=>Alpha) ]
Nan
oh
ard
nes
s (G
Pa)
%O~0,82
Mean oxygen value
%O~0,34
%O 0,02
%O~0,53
%O~0,12
%O~0,77
%O 0,04
10°C/sDirect water
quenching (~103 °C/s)1°C/s0,1°C/s
2
3
4
5
6
7
8
9
10
11
-1 0 1 2 3Log10 [pre-quenching cooling rate (°C/s) measured at
800°C (~50% Beta=>Alpha) ]
Nan
oh
ard
nes
s (G
Pa)
%O~0,82
Mean oxygen value
%O~0,34
%O 0,02
%O~0,53
%O~0,12
%O~0,77
%O 0,04
10°C/sDirect water
quenching (~103 °C/s)1°C/s0,1°C/s
(c)
FIG. 9. Relationships between (local) oxygen concentrations — nano-hardness values and the prequenching cooling rate through the → temperature range (d/dt|800°C).
FIG. 10. Calculated (using Eq. 1) vs. experimental nano-hardness values.
2,00
3,00
4,00
5,00
6,00
7,00
8,00
9,00
10,00
2,00 3,00 4,00 5,00 6,00 7,00 8,00 9,00 10,00
Experimental Nano-hardness (Gpa)
Cal
cula
ted
Nan
o-h
ard
nes
s va
lues
(G
pa)
fr
om
Lo
g10
(co
olin
g r
ate(
800°
C))
& %
O
Y = X

264
2.7. Consequences of the PQ hardening on the cladding PQ ductility Figure 11 shows the relationships that have been finally obtained between the mean nano-hardness values (corresponding to the averaging of ~1000 indentations per sample performed at ~mid wall clad thickness) and the PQ macroscopic clad ductility values derived from RCT and 3-PBT measurements [2]. The data obtained after final water quenching from both 600°C and 800°C have been considered here. As it has been already observed on HT oxidized samples directly quenched from the oxidation temperature [1], these relationship show that there is a ”critical” hardening value which corresponds to macroscopic PQ ductile-to-brittle transition.
(a) Ring compression tests (at 135°C)
(b) 3 Points bending tests (at 135°C)
FIG. 11. Relationship between the prior- layer average nano-hardness values and the PQ clad ductility ones (measured at 135°C) for final water quenching from both 600°C and 800°C. 3. CONCLUSION This study deals with the post LOCA behaviour of pre-hydrided 600 ppm low tin Zircaloy-4 as a surrogate for high BU materials. All the samples have been subjected to one side steam oxidation for 1 min at 1200°C, corresponding to a measured ECR of ~3%. Then, different cooling scenarios have been applied and both micro-chemical analysis and quantification of the local hardening have been performed thanks to the use of systematic EPMA, µ-ERDA and nano-hardness measurements. It has been shown that the PQ hardening and macroscopic clad ductility strongly depend on the oxygen and hydrogen partitioning occurring upon the on-cooling → allotropic phase transformation. It was thus possible to derive some empirical model between the local hardening, the local oxygen content, and the (prequenching) cooling rate through the → temperature range. This study confirms and gives some insights into the potential effect of the LOCA final cooling scenario on the PQ cladding mechanical properties, especially on the respective influences of (1) the prequenching cooling rate from the oxidation temperature and (2) the temperature from which the final water cooling (“clad rewetting”) is performed.
REFERENCES [1] BRACHET, J.C., MAILLOT, V., et al., Hydrogen content, pre oxidation and cooling scenario
influences on post quench mechanical properties of Zy-4 and M5 alloys in LOCA conditions — relationship with the post quench microstructure, Journal of ASTM International 5 (5) (2008) Paper ID JAI101116 (Available online at www.astm.org).
0,0
5,0
10,0
15,0
20,0
25,0
30,0
4 4,5 5 5,5 6 6,5 7
Mean nano-hardness value (Gpa)
Res
idu
al d
uct
ility
(%
) / 3
PB
T, 1
35°C Quenching from 600°C
Quenching from 800°C
Ductile Brittle
0,0
2,0
4,0
6,0
8,0
10,0
12,0
14,0
4 4,5 5 5,5 6 6,5 7
Mean nano-hardness value (Gpa)
Res
idu
al d
uct
ility
(%
) / R
CT
, 135
°C Quenching from 600°C
Quenching from 800°C
Ductile Brittle
Pla
sti
c d
isp
l. / d
iam
ete
r(%
), 3
PB
T-1
35
°C
Pla
sti
c d
isp
l. /
dia
me
ter
(%),
RC
T-1
35
°C

265
[2] VANDENBERGHE, V. ,BRACHET, J.C., LE SAUX, M., GILBON, D., MARDON, J.P., HAFIDI, B., Influence of the cooling scenario on the post quench mechanical properties of pre-hydrided Zircaloy-4 fuel claddings after high temperature oxidation (LOCA conditions), Proceedings of 2010 LWR Fuel Performance/TopFuel/WRFPM, Orlando (2010) Paper 096.
[3] RAEPSAET, C., et al., Quantification and local distribution of hydrogen within Zircaloy-4 PWR nuclear fuel cladding tubes at the nuclear microprobe of the Pierre Süe laboratory from µ-ERDA, Journal of Nuclear Inst. and Methods in Physics Research B NIMB55555 (2008).
[4] KOMATSU, K., TAKADA, Y., MIZUTA, M., TAKAHASHI, S., The effects of oxidation temperature and slow cooldown on ductile-brittle behaviour of Zircaloy fuel cladding, MAPI-TM-525, 4, (1977).
[5] CHUNG, H.M., KASSNER, T.F., Embrittlement criteria for Zircaloy fuel cladding applicable to accident situations in light water reactors, Summary Report, NUREG/CR-1344, ANL-7948 (1980).
[6] UDAGAWA, Y., NAGASE, F., FUKETA, T., Effect of cooling history on cladding ductility under LOCA conditions, Journ. of Nucl. Sci. and Tech. 43 (8) (2006) 844–850.
[7] BRACHET, J.C., PELCHAT, J., HAMON, D., MAURY, R., JACQUES, P., MARDON, J.P., Mechanical behaviour at room temperature and metallurgical study of low-tin Zy-4 and M5TM (Zr-NbO) alloys after oxidation at 1100°C and quenching, Proceeding of TCM on Fuel behaviour under transient and LOCA conditions, IAEA, Halden (2001).
[8] BRACHET, J.C., et al., Oxygen, hydrogen and main alloying chemical elements partitioning upon alpha↔beta phase transformation in zirconium alloys, Solid State Phenomena Vols. 172–174 (2011) 753–759; (www.scientific.net) Trans Tech Publications, Switzerland, doi:10.4028/www.scientific.net/SSP.172–174.753.
[9] DUPIN, N., et al., A thermodynamic database for Zr alloys, Journal of Nuclear Materials 275 (1999) 287–295.
[10] TOFFOLON-MASCLET, C., et al., Contribution of thermodynamic calculations to metallurgical studies of multi-component zirconium based alloys, Journ. of ASTM International 5 (2008) Paper JAI101122, (www.astm.org).
[11] PORTIER, L., BREDEL, T., BRACHET, J.C., MAILLOT, V., MARDON, J.P., LESBROS, A., Influence of long service exposures on the thermal-mechanical behaviour of Zy-4 and M5™ alloys in LOCA conditions, Journal of ASTM International 2 (2) (2005) Paper ID JAI12468 (www.astm.org).
[12] BILLONE, M., YAN, Y., BURTSEVA, T., Cladding embrittlement during postulated loss-of-coolant accidents, Report: NUREG/CR–6967/ANL–07/04 (2008).
[13] OKUI, M., UNO, M., KUROSAKI, K., YAMANAKA, S., Nanoindentation of zirconium oxide films prepared near the / transformation temperature, Journ. of Alloys and Compounds 363 (2004) 253–256.
[14] ITO, M., MUTA, H., SETOYAMA, D., UNO, M., YAMANAKA, S., Nanoindentation studies of high temperature oxidized Zircaloy-4 with and without hydrogen, Journ. of Alloys and Compounds 446–447 (2007) 639–642.
[15] NÉGYESI, M., BLÁHOVÁ, O., ADÁMEK, J., SIEGL, J., PŘIBYL, A., VRTÍLKOVÁ, V., Microstructure evolution in Zr1Nb fuel cladding during high temperature oxidation, Journal of Nuclear Materials 416 (3) (2011) 298–302.
[16] NÉGYESI, M., BURDA, J., BLÁHOVÁ, O., LINHART, S., VRTÍLKOVÁ, V., The Influence of hydrogen on oxygen distribution inside Zry-4 fuel cladding, Journal of Nuclear Materials 416 (3) (2011) 288–292.


ANALYTICAL LOCA STUDIES (Session 6)
Chairpersons
J.M. REY GAYO (CSN)
R. PAGE
(EDF)


269
EVALUATION AND ANALYSIS OF HIGH BURNUP FUEL BEHAVIOUR UNDER LOCA CONDITIONS
Y. YUN, M.A. ZIMMERMANN Laboratory for Reactor Physics and Systems Behaviour
Paul Scherrer Institut Villigen, Switzerland Email: [email protected]
Abstract
The LOCA tests within the ALPS program have been conducted to evaluate the influence of burnup extension on fuel behaviour under accidental conditions. The high burnup segments cut from the fuel rods irradiated in the BWR Leibstadt (Switzerland), as well as the PWR ones from Vandellos (Spain) and Ringhals (Sweden), were used in the LOCA tests. In the present study, the test results have been evaluated using the FALCON fuel performance code. First, the rupture behaviour and oxidation kinetics of the test fuel segments with 66–73 MW·d·kg-1U have been calculated and compared with the measurement. It has been found that the temperature and maximum hoop strain of the cladding at rupture are strongly influenced by the heating rate and internal rod pressure. For the high temperature oxidation, temperature has been observed the most significant parameter to control the calculated equivalent cladding reacted (ECR), as expected from the equations of the parabolic kinetics (e.g. the realistic Cathcart-Pawel correlation) that was used in the calculation. Pre-oxide layer has contributed to retard the calculated oxidation rate, thus simulating a protective effect of the oxide layer against further oxidation. Without pre-oxide layer, the predicted initial increase rate of oxidation thickness is steep. However, the oxidation rate is decreasing as the total oxide thickness increases, in agreement with the parabolic law. In contrast, the effect of burnup, assumed in calculation, has not been prominent for the predicted kinetics of high temperature oxidation. 1. INTRODUCTION The current LOCA acceptance criteria (10CFR50.46) are mainly based on experiments conducted with fresh or low burnup Zircaloy cladding. However, as the fuel burnup increases, corrosion, hydrogen absorption, as well as irradiation becomes pronounced, resulting in degradation of cladding mechanical and thermal properties. As a consequence, the influence of burnup extension on rupture behaviour, mechanical properties of cladding, and oxidation kinetics are subjects of great concern [1–2]. Under this circumstance, the research program, so-called ALPS project, was conducted at the JAEA as a comprehensive study to promote a better understanding of high burnup fuel behaviour under LOCA condition and also to provide database for regulatory judgment [2]. The two primary objectives of the LOCA tests were to investigate the thermal shock resistance of oxidized cladding and the oxidation kinetics under the simulated LOCA conditions. Besides, the tests have provided information on temperature and permanent circumferential strain at burst for the pre-irradiated cladding tubes, which is very valuable for verification of the respective fuel behaviour codes. In order to evaluate the rupture behaviour and thermal shock resistance of oxidized cladding, short test rods were heated up, ruptured, oxidized in steam and quenched by flooding water. Isothermal oxidation test was carried out at around 1200°C, which is the current LOCA criteria, during certain amount of time [1]. The effect of pre-oxide layer accumulated during normal water corrosion was investigated to understand the irradiation effect on the oxidation kinetics. BWR fuel rods (from Leibstadt-Switzerland) and PWR fuel rods (from Vandellos-Spain and Ringhals-Sweden) have been used in the ALPS LOCA tests considered here. The fuel rods used in the tests just mentioned were pre-irradiated to burnup of 66–73 MW·d·kg-1U. The test segments were cut from the fuel rods and installed in the test apparatus. Finally, the integral thermal shock test and the high temperature oxidation test were conducted in the hot cell. FALCON analysis has been performed aiming at evaluation of the ALPS LOCA tests. This report presents the simulation results for the LOCA tests in question. First, the test procedure and main outcomes are briefly described. In the following chapter, the details of the computational method are

270
summarized. Subsequently, the FALCON results are presented and compared with the measurement data along with a detailed discussion.
2. OUTLINE OF LOCA TEST Figure 1 shows the schematic drawing of the experimental apparatus set up in hot cell for the LOCA testing [3]. In order to prevent excessive contamination of hot cell from radioactivity release when the fuel pellets are heated up at high temperatures, the fuel pellets were removed from the test rod, and the defueled cladding tubes were installed in the test apparatus, as shown in Fig. 1.
FIG. 1. Test apparatus used in the LOCA test [3–4]. The LOCA conditions, which include oxidation at high temperature and quench by flooding water, are simulated inside the quartz reaction tube. The test rod of defueled cladding is mounted vertically in the center of the quartz reaction tube and is prepressurized to 5 MPa at room temperature in order to cause rod-burst during the heat-up. Figure 2 shows temperature history arranged in the integral thermal shock test [2]. The test rod was heated at a rate of ~3°C·s-1 in the flowing steam. When the cladding rupture occurred, the furnace is immediately switched off after the rupture to observe the rupture position. The test rod was again heated at a rate of 10°C·s-1 up to the target oxidation temperature. During a LOCA, the cladding may heat up to high temperature. Therefore, the oxidation temperature was maintained close to 1200°C in the ALPS LOCA test, which is allowable maximum cladding temperature in the ECCS acceptance criteria. The cladding was isothermally oxidized for about 200 s, and the oxidation time was determined to achieve the target ECR values. After isothermal oxidation, the test rod is cooled in the steam flow to about 970 K and is finally quenched with water flooding from the bottom. During the cooling and quenching, the test rod is axially restrained with a load level ranging from 0–500 N [4].

271
FIG. 2. Temperature history set up for the integral thermal shock test [3–4].
3. MAIN TEST RESULTS The specification on the fuel segments subjected to the LOCA testing and analysed here is summarized in Table 1. For the BWR Leibstadt, the ALP14 and ALP16 segments were cut from AEB072-E4 and AEB072-J9 rods, respectively. The cladding material of ALP14 and ALP16 is Zry-2 liner of 0.63 mm thickness with the 70 µm of Zr layer, and the test segments were 350 mm and 495 mm long, respectively [3]. Two analysed PWR test rods were irradiated in Vandellos and Ringhals, and the cladding materials are ZIRLOTM and M5TM, respectively. All the fuel rods are irradiated with the burnup of 66–73 MW·d·kg-1U and the U235 enrichment are 4.5% except for ALP9, where the enrichment is of 3.7%. Table 2 summarizes the initial conditions and main outcomes of the LOCA test [3–5]. The initial oxide layer thickness and hydrogen concentration were determined from the results of microstructure observation and hydrogen analysis. The initial oxide thicknesses and hydrogen concentration of the ALP4 was measured to be higher compared to the other samples discussed in this report. The large oxide thickness suggests the reduction in the load bearing metallic layer thickness and modification of the hoop stress in the cladding, which is known as a crucial parameter for cladding burst conditions. On the other hand, the large hydrogen concentration could result in more brittle behaviour of the ALP4. Hence, it is expected that the larger pre-oxide thickness and hydrogen concentration resulted in the lower rupture temperature of the ALP4 compared with those of the other segments. For the high temperature oxidation test, the isothermal oxidation temperature and time were determined to reach the target ECR value of about 20% at around 1200°C, which is higher than the Japanese safety criteria of 15%, using the conservative Baker-Just equation. After isothermal oxidation and quench, post quench analysis was also carried out using the ring compression method to examine the cladding embrittlement [3–4].
TABLE 1. FUEL SPECIFICATIONS OF BWR AND PWR FUEL RODS USED IN THE LOCA TEST
BWR (UO2) PWR (UO2)
Leibstadt Leibstadt Vandellos Ringhals Fuel segment no. ALP14 ALP16 ALP4 ALP9
Fuel segment length (mm) 350 495 300 490
Burnup (MW·d·kg-1U) 66 73 72 66
Cladding material Zry-2 with liner (70 µm) ZIRLOTM M5TM
Cladding type LK3
Cladding thickness (mm) 0.63 0.57 0.57
U235 enrichment (%) 4.5 4.5 4.5 3.7
Initial oxide layer thickness (µm) 30 24 79 6
Initial hydrogen concentr. (ppm) 297 182 764 73

272
TABLE 2. MAIN TEST RESULTS
BWR PWR
Leibstadt (ALP14)
Leibstadt (ALP16)
Vandellos (ALP4)
Ringhals (ALP9)
Rupture temperature (°C) 763 778 676 780
Circumferential increase (%) 17.7 20.6 20.6 20.1 Oxidation temperature (°C) 1195 1194 1186 1197
Oxidation time (s) 222 232 153 151
Oxidation amount (% ECR*) 21.2 22.0 20.2 19.5
* Estimated using Baker-Just model.
4. ANALYSIS OF LOCA TEST USING FALCON 4.1. Rupture behaviour In the LOCA test, the rupture temperature ranged 670–780°C and the corresponding permanent hoop strain was measured 6.0–28.0%. The FALCON results for the rupture behaviour are summarized in Table 3 and compared with the measurement. In FALCON, the cladding rupture was calculated using cumulative damage index (CDI) model. The concept of CDI assumes that the cladding undergoes cumulative damage due to sustained stress and the rupture occurs when the total cumulative damage reaches a threshold value, which is unity [6] for single rod burst tests. The FALCON results are in reasonable agreement with the measurement data, despite overall slightly underestimated rupture temperatures and hoop strains. Except for the ALP4, the rupture temperatures of the test segments have ranged narrow in the measurement, which are from 763–780 within about 20°C differences, and are in good agreement with the calculated results. For the maximum hoop strain, no significant difference has also been observed between the test segments, except for ALP4. TABLE 3. CALCULATED RUPTURE TEMPERATURE AND MAXIMUM HOOP STRAIN (CDI=1)
Temperature [°C] Strain [%]
Measurement FALCON Measurement FALCON
Leibstadt (ALP14) 763 755 17.7 14.5
Leibstadt (ALP16) 778 757 20.6 15.1
Vandellos (ALP4) 676 734 22.6 18.1
Ringhals (ALP9) 780 750 20.1 16.5
As seen in Table 3, a notable difference was observed at the Vandellos fuel segment, labelled as the ALP4, namely: The rupture temperature of the ALP4 was measured at 676°C and is nearly 100°C lower than the others. Moreover, the calculated burst temperature is overestimated about 60°C the measurement, while all the other calculated temperature are slightly underestimated. This result for the rupture temperature is considered to be associated with extremely high hydrogen concentration which is accumulated during the base irradiation. The initial hydrogen concentration was found exceptionally higher at ALP4 than at the other test rods, even almost 10 times larger than that of ALP9 (See Table 1). It is expected that a substantial amount of hydrogen — evidently above 300 ppm — may decrease the cladding ductility and cause an earlier failure of the cladding, i.e. at lower temperature. In the current FALCON version being used at PSI, the effect of hydrogen is not accounted, which may cause the overestimation of the rupture temperature in ALP4. On the other hand, beside the hydrogen effect, the rupture behaviour of Zircaloy cladding under transient heating conditions is of a complex

273
nature influenced by various parameters, such as heating rate, internal pressure, vacuum or steam environment, pre-transient oxide layer thickness distribution, and irradiation effects (e.g. the fast neutron fluence). Consequently, the experimental data of maximum hoop strains at failure are scattered in a wide range [6]. In order to understand in more detail the predicted rupture behaviour, using the FALCON code, the effects of the selected parameters have been investigated and main results are summarized below in this section. In particular, the rupture behaviour of the ALP14, i.e. the Leibstadt fuel segment, has been investigated as the parameters are varied The variation of temperature with time leads to the formation of thermal stresses on fuel cladding, and specifically the heating rate is known to affect the stress–strain relation. For the conditions of ALP14, the rupture behaviour has been calculated as function of heating rate, and it has been found that the predicted rupture temperature and hoop strain are sensitive to the heating rate, as summarized in Table IV. The rupture temperature is increased as the heating rate increases. On the contrary, the maximum hoop strain is decreased with increasing the heating rate: the relative decrease is nearly 35%, from 14.5–9.9%. At low heating rate, the tangential stress added by the oxidation may contribute to increase in the stress biaxiality, resulting in greater maximum hoop strain at rupture [6]. However, at high heating rate, the axial contraction of the cladding become significant and the oxidation effect can be ignored. In addition, the cladding has less time for the oxidation at higher heating rate.
TABLE IV. CALCULATED RUPTURE TEMPERATURE AND MAXIMUM HOOP STRAIN OF THE ALP14.
Heating rate
ALP14 (Leibstadt)
Rupture temp. (°C) Max. hoop strain (%)
3.0°C·s-1 755 14.5
10.0°C·s-1 831 14.1
25.0°C·s-1 860 9.9 In order to examine the effect of heating rate with different cladding type in more detail, the rupture temperatures of the ALP14 at the heating rate of 10°C·s-1 and 25°C·s-1 have been compared with the data of Zry-4 reported in NUREG-0344 [6], as shown in Fig. 3. The black lines are the measurement data of the rupture temperature of Zry-4 with the heating rate and the internal pressure. The red dots indicate the present results of Zry-2 liner (LK3) of Leibstadt fuel sample, at the internal pressure of 2 MPa and 6 MPa, respectively. The present results are in good agreement with the measurement data of Zry-4. These results may implicitly suggest that the rupture behaviour is not significantly influenced by cladding alloy types. During LOCA, the differential pressure across the cladding wall increased due to the increased internal gas pressure as well as the decreased coolant pressure. Eventually, the cladding undergoes deformation and then bursts. Hence, the initial internal rod pressure at the onset of LOCA is a crucial parameter to influence the rupture behaviour of the cladding under LOCA condition. The rupture temperature and maximum hoop strain for the ALP14 have been calculated as function of internal rod pressure, as depicted in Fig. 4. With increased internal pressure from 3–6 MPa at room temperature, the hoop strain at rupture is decreased: almost by a factor of 2, from 25.7% (0.257 m/m) to 14.0% (0.140 m/m). In particular, the variation of hoop strain is significant at lower pressure between 3 MPa and 4 MPa and is diminished as the internal pressure increase. Finally, the maximum hoop strain changed between 5 MPa and 6 MPa is barely about 0.5%. The rupture temperature and strain at each pressure are listed in Table 5.

274
FIG. 3. Black lines are the measurement data of the rupture (burst) temperature of Zry-4 as function of the heating rate and initial pressure (NUREG-0344 [6]). Red dots indicate the present results of Zry-2 liner.
125 150 175 200 2250.00
0.05
0.10
0.15
0.20
0.25
Time, sec.
Hoo
p st
rain
, m
/m
ALP14 (KKL) 6 MPa 5 MPa 4 MPa 3 MPa
FIG. 4. Calculated maximum hoop strain at rupture as function of internal pressure (CDI=1).

275
TABLE 5. CALCULATED RUPTURE TEMPERATURE AND STRAIN OF ALP14 WITH INTERNAL ROD PRESSURE
Internal rod pressure (MPa) 3 4 5 6 Rupture strain (%) 25.7 17.5 14.5 14.0
Rupture temperature (°C) 806 778 755 736 The calculation of the internal pressure in the fuel rod under irradiation is closely related to modelling of the integral fuel rod behaviour, including the evolution of the internal free volume due to swelling/densification of the fuel and cladding deformations, gas temperature distribution over the free volume, and, particularly, FGR. Therefore, the adequate modelling of fuel rod behaviour during the base irradiation will contribute to better prediction of the rupture behaviour under LOCA conditions. To investigate the effect of burnup, the rupture behaviour has been calculated as function of fast neutron fluence. The fast neutron fluence was assumed to be proportional to burnup. The fast neutron fluence corresponding to the burnup of 66.0 MW·d·kg-1U is 8.5×1025 n·m-2, and varied to 2.1×1025 n·m-2 to simulate the corresponding burnup of 16.5 MW·d·kg-1U, as shown in Table 6. It has been obtained that the effect of fast neutron fluence is not considerable and that the rupture temperature and hoop strain are almost same as the burnup level increase, as shown in Table 6. In addition, the effect of the pre-oxide has also been investigated, which is built up during the base irradiation. For the four test segments used in the test, the maximum hoop strains have been calculated as function of initial oxide thickness. However, the variation of hoop strain has been observed very small, indicating that the effect of pre-oxide layer on the rupture behaviour can be regarded as negligible in the range of 0–80 µm. On the other hand, the influence of oxide layer cracking on the oxidation kinetics has been investigated, assuming that the cracked oxide layer does not protect the metal from the steam. The rupture temperature and strain were calculated using the reduced cladding thickness as much as the cracked oxide layer: Assuming that the cracked layer is hoop stress free, the rupture behaviour has been calculated using the reduced cladding thickness by the pre-oxide layer. The results provide the information how the oxide layer cracking affects the cladding behaviour at burst.
TABLE 6. CALCULATED RUPTURE TEMPERATURE AND MAXIMUM HOOP STRAIN OF THE ALP14
Rupture behaviour ALP14 (KKL)
66.0 MW·d·kg-1U 49.5 MW·d·kg-1U 33.0 MW·d·kg-1U 16.5 MW·d·kg-1U
Temperature 755 755 755 753
Hoop strain 14.5 15.0 15.1 15.1
TABLE 7. CALCULATED RUPTURE TEMPERATURE AND MAXIMUM HOOP STRAIN OF THE ALP14
ALP14 (KKL) ALP4 (Vandellos)
Pre-accident oxide layer
Oxide cracking thickness
Pre-accident oxide layer
Oxide cracking thickness
30 µm 30 µm 80 µm 80 µm Cladding thickness (µm) 630 600 570 490 Rupture temperature (°C) 755 753 734 731
Maximum hoop strain (%) 14.5 14.8 18.1 21.4

276
Furthermore, in order to investigate the effect of different crack thickness, the calculated rupture behaviour has been compared between the ALP14 and the ALP4, which have relatively large different pre-oxide layers. The calculated rupture temperature and strain of the ALP14 and ALP4 are summarized in Table 7. For the ALP14 with 30 µm of crack thickness, the rupture temperature is decreased by 2°C and hoop strain is increased by 0.3%. Meanwhile, the variation of rupture behaviour has been observed lager for the ALP4. Especially, the rupture strain is increased by 3.3% from 18.1–21.4. 4.2. Isothermal oxidation and quench Fuel cladding embrittled due to severe oxidation under LOCA conditions may be fractured due to thermal shock imposed on an axially loaded sample during the quench. In order for the fuel cladding to remain intact through the thermal shock condition, the total cladding thickness converted into ZrO2 must not exceed 0.17 times the total initial thickness of cladding metal. In other words, the maximum equivalent cladding reacted (ECR), which indicates the ratio of the converted metal thickness by the oxidation to the initial cladding thickness, is limited to 17%, when using the conservative Baker-Just equation, in agreements with the current LOCA criteria regulated by NRC (10 CFR50.46). In the ALPS LOCA testing, the test rods were heated up to the target oxidation temperature and then isothermally oxidized for about 200 seconds to reach the calculated target ECR. Table VIII summarizes the ECR calculated using the two well known correlations: Cathcart-Pawel [7] and Baker-Just [8] ones. It is generally known that the Cathcart-Pawel equation provides a better approximation of the experimental data on oxidation in the safety relevant range of temperature, from 1000–1200°C, while the Baker-Just one is more conservative and used for licensing calculations [9]. In the FALCON analysis, the ECR has been calculated considering the deformed cladding thickness and diameter, after rupture, and compared with the results using undeformed cladding geometry. It should be noted that the oxidation gain was not directly measured after isothermal oxidation, but was calculated using the factual temperature histories for the tests under consideration.
TABLE 8. ESTIMATION OF ECR USING CATHCART-PAWEL AND BAKER-JUST EQUATIONS
Specimens
Cathcart (%ECR) Baker-Just (%ECR)
JAEA FALCON
JAEA FALCON
Undeform. cladding
Deformed cladding
Undeform. cladding
Deformed cladding
KKL (ALP14) 16.3 17.2 18.6 21.2 21.7 23.6 KKL (ALP16) ― 17.0 18.5 22.0 21.6 23.4 Vandellos (ALP4) ― 22.8 24.9 20.2 25.7 28.1 Ringhals (ALP9) ― 14.7 16.1 19.5 18.9 20.6
As shown in Table 8, for both FALCON and JAEA data, the Baker-Just equation estimates almost 20% higher ECR than the Cathcart equation. Comparing the FALCON results with the JAEA results, it has been found that the ECR using the undeformed cladding thickness are in good agreement with the JAEA calculation. However, considering the deformation of cladding at rupture, the ECRs have been increased due to the thinner cladding after ballooning, and the difference between FALCON and JAEA data is notably increased. These results suggest that the JAEA data seemed to be calculated using the undeformed cladding thickness. Another notable result is that a relatively big difference has been observed for the ALP4 between FALCON and JAEA calculations. In the FALCON calculation, the ECR for the ALP4 is large overestimated to the JAEA data. The extraordinary thickness of pre-oxide layer of the ALP4 is certainly considered to contribute to calculated values for ECR, as shown in Table 9.

277
TABLE 9. CALCULATED PARAMETERS OF OXIDATION AS FUNCTION OF INITIAL OXIDE THICKNESS
Oxidation Temperature
(°C) Time
(s) Initial
thickness (µm) Increased thickness
Total thickness*
Leibstadt (ALP14) 1195 222 30 41.7 71.7
Leibstadt (ALP16) 1194 232 24 46.3 70.3
Vandellos (ALP4) 1186 153 80 15.7 95.7
Ringhals (ALP9) 1197 151 6 49.1 55.1
* Baker-Just equation. The pre-oxide layer is generally known to act a protective role against oxidation, and this has been seemingly observed in the results of calculation for the ALP4. The increased oxidation thickness is smallest on the ALP4 compared to the other rods. Despite the retardation effect of the initial oxide thickness, the total oxidation thickness is larger for the ALP4 than the others due to the excessively large initial thickness. After the isothermal oxidation, the test tubes are cooled and finally quenched at about 970 K by water flooding. No fracture was observed for all the four test rods during the quenching [1], although the calculated BJ-ECR (i.e., the licensing related value) have been estimated at 19–22% and at 20–24% using undeformed and deformed cladding thickness, respectively, as listed in Table VIII (except ALP4, which is standing apart). These results suggest that the fracture boundary of the examined high burnup cladding, which is between 66–73 MW·d·kg-1, is higher than the safety limit in the current LOCA acceptance criteria. 5. SUMMARY The FALCON simulation has been performed to evaluate the selected ALPS LOCA tests using the four high burnup fuel rods. The two fuel rods, which were indexed with the ALP14 and ALP16, were cut from BWR fuel rods in Leibstadt. For PWR, the two fuel rods in Vandellos and Ringhals have been evaluated. In this study, a simple FEM model for the defueled cladding tubes using the FALCON has been applied to describe the rupture behaviour and calculate the equivalent cladding reacted during the simulated LOCA. All in all, the FALCON results are in good agreement with the measurements for the pre-transient oxide layer thickness and hydrogen content in the cladding, below 30 microns and 300 ppm, respectively. Especially, the measured thickness of ID oxide layer has been accurately estimated by the Cathcart-Pawel equation in the temperature ranged from 1273–1473 K. For the oxidation kinetics, the effect of temperature and preformed corrosion layer thickness have been found as predominant, when using Cathcart-Pawel and Baker-Just equations under the assumption of no cracks in the oxide layer. For the isothermal oxidation kinetics, the increase of oxide thickness has been indicated in a parabolic growth as temperature increases. In this study, the hydrogen effect was not considered on the rupture behaviour and the oxidation kinetics. Hydrogen induced cladding failure is one of most concern for high burnup fuel behaviour. Hence, it is essential to establish the mechanism of hydrogen pickup and reorientation during reactor operation and the hydrogen induced cladding failure during thermal shock under LOCA condition. However, the FALCON results of the rupture temperature and strain are good agreement with those obtained in the ALPS LOCA test, suggesting that the hydrogen concentration up to about 300 ppm, which was observed in the tests, was not significant to the rupture behaviour. Furthermore, it has been found that the cladding rupture is not notably influenced by the alloy type. As discussed in this report, the rupture behaviour and the oxidation kinetics of fuel cladding are extremely complex phenomena influenced by such various parameters. Therefore, it is required to more clarify the correlation of the parameters to better understand high burnup fuel behaviour under LOCA condition. For example, it is still controversial for the retardation effect of pre-oxide layer on the oxidation kinetics. In open literature, it is reported that the effect of pre-oxide layer is apparently decreased with increased temperature and finally can be ignored at very high temperature [2]. Hence the temperature dependence of the pre-oxide effect is necessary to be investigated in more detail.

278
6. ACKNOWLEDGEMENT The activity was partly funded by the Swiss Group for Fuel Safety in the framework of the STARS project. Khvostov from Paul Scherrer Institut is acknowledged with thanks, for useful comments relating to this work, and the content of the paper.
REFERENCES [1] OECD/NEA, Review of High Burnup RIA and LOCA Database and Criteria, NEA/CSNI/R
(2006) 5. [2] PARSONS, P.D., HINDLE, E.D., MANN, C.A., The deformation, oxidation and embrittlement
of PWR cladding in a loss of coolant accident, OECD/NEA (1986). [3] NAGASE, F., CHUTO, T., FUKETA, T., Behaviour of 66–77 MW·d·kg-1 fuel cladding under
LOCA conditions, International Conference on the Physics of Reactor, Interlaken 2008, JAEA LOCA Test, Technical Report (2006).
[4] FUKETA, T., NAGASE, F., SUGIYAMA, T, AMAYA, M., Behaviour of high burnup LWR fuels during design basis accidents; key observations and an outline of the coming program, Proceedings of 2010 LWR Fuel Performance/TopFuel/WRFPM, Orlando (2010) Paper 0033; JAEA, “LOCA Test”. JAEA Technical Report (2009).
[5] LEDERGERBER, G., et al., Characterization of high burnup fuel for safety related fuel testing, Journal of Nuclear Science and Technology 43 (2006) 1006–1014.
[6] BAKER, L., JUST, L.C., ANL-6548, Argonne National Laboratory (1962). [7] CHUNG, H.M., KASSNER, T.F., Embrittlement criteria for Zircaloy fuel cladding applicable
to accident situation in light water reactors: Summary report, NUREG/CR-0344, ANL-79-48 (1979).
[8] PAWEL, P.E., CATHCART, J.V., MCKEE, R.A., The kinetics of oxidation of Zircaloy-4 in. steam at high temperatures, Electrochem. Sci. Technol. 126 (7) (1979) 1105.
[9] EPRI, Fuel analysis and licensing code: FALCON MOD01: Volume 1: theoretical and numerical bases, EPRI Report 1011307, Palo Alto (2004).
[10] OECD/NEA, Nuclear fuel behaviour in loss of coolant accident (LOCA) conditions, No.6846, (2009).
Initial of Khvostov

279
THE RAPTA-5.2: CODE FOR MODELING OF VVER TYPE FUEL ROD BEHAVIOUR UNDER DESIGN BASIS ACCIDENTS CONDITIONS
P.V. FEDOTOV*, A.A. GONCHAROV*, A.V. KUMACHEV*, O.A. NECHAEVA*, V.V. NOVIKOV*, A.V. SALATOV*, Y.V. PIMENOV**, Y.N. DOLGOV**
*
**
JSC A.A. Bochvar High Technology Research Institute of Inorganic Materials (JSC VNIINM) Moscow, Russian Federation Email: [email protected]; [email protected] JSC “TVEL” Moscow, Russian Federation Abstract
Computer code RAPTA-5.2 is the new version of code RAPTA-5. RAPTA-5.2 has been developed for the calculation modelling of the thermomechanical and corrosion behaviour of fuel rods of light water power reactors under design basis accidents conditions. RAPTA-5.2 code is used in the Russian Federation as a part of techniques of safety substantiation of VVER fuel under postulated accident conditions such as LOCA and non LOCA. RAPTA-5.2 program determines the values of criterion parameters that characterize the state of fuel elements during accidents viz.: the maximal cladding temperature, the peak fuel temperature, the equivalent cladding reacted, the fraction of reacted zirconium in the core, the peak fuel enthalpy. RAPTA-5.2 forecasts the fact of cladding depressurization. The program simulates the following processes: Heat distribution from sources in the fuel to the clad outer surface; Thermoelastic deformation of fuel, additional swelling and gas release depending on temperature rise; Thermoelastic-plastic deformation of the cladding under external coolant pressure, inner gas pressure and mechanical interaction with fuel pellet (PCMI); Cladding oxidation taking heat release into account; Inner gas pressure; Cladding failure during ballooning. The initial state (the state at the accident beginning) is simulated using the calculation results of the fuel rod behaviour during stationary irradiation. Temperature distribution is determined by the solution of a two dimensional non-stationary heat conduction equation with heat sources and boundary conditions of the 1st or 3rd kind. The results of calculations with thermo hydraulic codes are used for boundary conditions presetting. 1. THE CALCULATION SCHEME OF RAPTA-5.2 CODE A flowchart of RAPTA-5.2 code is shown in Fig. 1. At each time moment of the accident process a system of two dimensional non-stationary heat balance equations is settled for each height cross-section of the fuel rod. The decision is found with accounting of heat generation rate in the fuel and heat effect of oxidation. Properties of simulated materials (fuel, cladding, gas mixture) are determined taking into consideration the impacts of temperature, irradiation damages, oxidation and burnup achieved during stationary irradiation. At each calculation step the changes of geometry due to deformation of fuel pellets and cladding, oxide layers growth are computed. The heat conductivity of gap is determined by taking into account heat conductivity of gases mixture, temperature ramps on the solid–gas interfaces, radiation and contact components of heat conductivity, changes of gases composition as result of additional FGR caused by fuel overheating. The free volume changes and his temperature changes as well as additional FGR have an influence on inner gas pressure according to Boltzmann equation. Fuel heat conductivity depends on porosity, radiation damages and other effects of burnup. The fuel enthalpy is determined during solving of heat problem. The coolant pressure is an initial condition. The outer coolant pressure, the inner gas pressure and the contact pressure produced by mechanical interaction between fuel and cladding are taken into account at the stress–strain state calculations. The following assumptions are used: cladding is thin walled and single layered, cladding material is orthotropic and have isotropic strain and strain rate hardening, volume changes are elastic, and deviator of stress is proportional to deviator of plastic strain. Hooke's law is used for elastic

280
deformation calculations. The Prandtl–Reiss relation, combined with the Hill function of flow ability for orthotropic material, is used for the calculation of plastic deformations. The universal model of plastic deformation of zirconium alloys are used to calculate the flow stress of cladding under unsteady temperature force loading. Calculation of stress–strain state of cladding is attended an analysis of depressurization. The cladding burst is postulated in accordance with deformation criterion using the principle of linear summation of damage. Thermo mechanical state of the design section is determined independently of the others. The steam–zirconium reaction is calculated using the kinetic time dependence of oxygen specific weight gain under isothermal conditions. The integral weight gain of oxygen is determined taking into consideration the cladding deformation. ECR value and fraction of the reacted zirconium are determined assuming that all the locally absorbed oxygen serves to generate stoichiometric zirconium dioxide. In case of loss of tightness the oxidation of the cladding inner surface is taken into account. The calculation is accompanied by the determination of the mass of hydrogen released.
2. THE VERIFICATION OF RAPTA-5.2 CODE The calculated values of basic design characteristics are compared with experimental data. Characteristics of oxidation, deformation and burst of cladding, temperature of fuel and additional FGR are considered for example of next tests:
1) Isothermal oxidation of irradiated cladding from E110 alloy;
2) Burst tests of irradiated and unirradiated E110 cladding;
3) Integral LOCA experiments on PARAMETER facility with unirradiated VVER and PWR — type fuel rod simulators;
4) Integral LOCA experiment in the steam–water loop of MIR reactor with refabricated WWER fuel rods;
5) IFA-650.6 and IFA-650.11 experiments in Halden reactor with a refabricated WWER-440 fuel rod;
6) Series of RIA-type experiments in BIGR reactor with refabricated WWER-1000 and WWER-440 fuel rods;
2.1. High temperature oxidation Investigations of high temperature oxidation of samples refabricated from VVER fuel rod were realized in RIAR. The fuel rod with cladding from E110 sponge based alloy irradiated at MIR reactor up to burnup 38 MWt·d·kg-1U and the fuel rod with cladding from E110 alloy irradiated at Balakovo NPP up to burnup 65 MWt·d·kg-1U were used for samples fabrication. Before manufacturing of samples visual survey, gamma spectrometry, vortex current defectoscopy, profilometry of spent fuel rod have been lead. Carried out researches have not revealed fuel rod defects. The corrosion tests were carried out with use the facility escalated in hot cell at temperature from 800–1200°C in steam–argon mixture flow. The lengths of samples were 20 mm. The sample temperature during tests was kept at a given level with accuracy about ±2°C. The change of a sample mass was determined as a difference between initial sample mass and its mass after test. The typical temperature scripts of experiments were shown on Fig. 2. The calculations by RAPTA-5.2 code were carried out with thermocouple readings as boundary conditions on outer cladding surface and the initial state of claddings was present with PIE results using. The results of specific weight gain (mg/sm2) calculations are in good agreement with experimental data (Fig. 3).

281
FIG. 1. Flowchart of RAPTA-5.2 code.

282
0 400 800 1200Time, s
200
400
600
800
1000
1200
Tem
pera
ture
, C
0
10
20
30
0 10 20 30
RA
PT
A-5
.2
Experiment
calculation = experiment
FIG. 2. Experiment scenario. FIG. 3. Specific weight gain.
2.2. Burst tests The burst tests of irradiated VVER-1000 fuel rod cladding from E110 alloy were investigated in RIAR. The samples were pieces of VVER-1000 fuel rod cladding irradiated at Novovoronezh NPP up to burnup 48 MW·d·kg-1U with 150 mm length without fuel. The PIE has shown a good state of cladding after irradiation (low hydride content, thin oxide layers etc.). The test procedure include: sample heat up to the test temperature from 800–1200°С, isothermal exposure, loading by inner pressure at rate 0.01 MPa·s-1 and registration of the pressure at burst (MPa). Comparative tests of non-irradiated samples were performed under the same conditions. The thermomechanical behaviour of samples tested under different isothermal conditions was calculated with RAPTA-5.2 code used. The analysis of the calculated results (Fig. 4) permits to note good agreement between the calculated and experimental values of pressure at burst.
0
1
2
3
4
5
6
0 2 4 6
RA
PTA
-5.2
Experiment
эксперимент=расчет
FIG. 4. Pressure at burst.
2.3. Integral LOCA tests For investigations of fresh fuel rod behaviour consisting of fuel rods assembly under LOCA conditions PARAMETR (JSK “LUCH”) facility was used. Experimental fuel rod (imitators) was a shorted VVER and PWR type fuel rod (1275 mm active part length, diameter: 9.1 × 7.73 mm; 9.1 × 7.93 mm; 9.5 × 8.33 mm) with UO2 fuel pellets and tungsten heater in the fuel central hole. All imitators were instrumented by pressure sensors. The number of fuel rods in assembly was 19 and 21 for VVER and PWR type assembly. Four experiments simulated LOCA conditions were carried out (Fig. 5). The coolant pressure was constant and equal 0.1 МPa.

283
PARAMETR – FRA №1 (VVER type)
4500 4600 4700 4800 4900 50Time, s
0
200
400
600
800
1000
1200T
empe
ratu
re, C
4500 4600 4700 4800 4900 5000Time, s
0
1
2
3
4
Pre
ssur
e, M
Pa
FIG. 5. Temperature. FIG. 6. Pressure.
PARAMETR – FRA №2 (VVER type)
5400 5500 5600 5700 5800 5Time,s
0
200
400
600
800
1000
1200
Tem
pera
ture
, C
5400 5500 5600 5700 5800 5900Time, s
0
1
2
3
4
Pre
ssur
e, M
Pa
FIG. 7. Temperature. FIG. 8. Pressure.
PARAMETR – FRA №3 (PWR type)
0
200
400
600
800
1000
1200
3350 3450 3550 3650 3750 3850 3950 4050
Tem
pe
ratu
re, C
Time, s
0
0,5
1
1,5
2
2,5
3
3,5
4
3350 3450 3550 3650 3750 3850 3950 4050
Pre
ssur
e, M
Pa
Time, s
FIG. 9. Temperature. FIG. 10. Pressure.
PARAMETR – FRA №4 (PWR type)
0
200
400
600
800
1000
1200
1400
3500 3600 3700 3800 3900 4000
Tem
pe
ratu
re, C
Time, s
0
0,5
1
1,5
2
2,5
3
3,5
4
3500 3600 3700 3800 3900 400
Pre
ssur
e, M
Pa
Time, s
FIG. 11. Temperature. FIG. 12. Pressure.

284
Experiment LOCA (BT-2) was carried out in steam–water loop of research reactor MIR (RIAR). Experimental fuel assembly has contained 19 fuel rods (sixteen shortened VVER-1000 fresh fuel rods and three refabricated fuel rods irradiated at Zaporozhskaya NPP up to burnup of 46–49 MWt·d·kg-1U). The purpose of experiment is studying of deformation and corrosion behaviour of fuel rods consisting of FRA under LOCA conditions. The coolant pressure during experiment was constant and equal 1.7 МPa. Figures 13–14 show regime of experiment.
BT-2
0
100
200
300
400
500
600
700
800
900
1000
2000 2200 2400 2600 2800 3000 320
Tem
pe
ratu
re, °С
Time, s
0
1
2
3
4
5
6
7
8
2000 2200 2400 2600 2800 3000 320
Pre
ssur
e, M
Pa
Time, s
FIG. 13. Temperature. FIG. 14. Pressure. Two LOCA experiment with VVER-440 fuel rod (IFA-650.6 and IFA-650.11) which was operated during 4 fuel cycles at NPP «Loviisa» and achieved the average burnup of 55.5 MWt·d·kg-1U was carried out in Halden reactor (Figs 15–18). The basic purpose of the experiments VVER LOCA was the study of the thermomechanical and corrosion behaviour of high burnup VVER-440 fuel rod under LOCA conditions.
IFA-650.6
FIG. 15. Temperature. FIG. 16. Pressure.
All of enumerated experiments have calculated by RAPTA-5.2 code. The thermocouple readings were used for setting the cladding outer surface temperature (boundary condition of the first kind). The readings of neutron detectors recalculated into linear power and systems of electric power measurements were used for setting the rod linear heat generation rate. Coolant and fuel rod inner pressures are set by the pressure gage readings. The calculated values of main parameters which characterize the deformed state of fuel rod cladding (viz: time to rupture (s), temperature (°C) and pressure (MPa) at burst and deformation (%) in ruptured section) are in good agreement with experimental data (Figs 19–22).

285
IFA-650.11
0 200 400 600 800 1000 120
Time, s
200
300
400
500
600
700
800
900
1000T
em
pe
ratu
re,
o C100 mm
400 mm
000 mm480 mm
0 200 400 600 800 1000 120
Time, s
0
2
4
6
Pre
ssu
re,
MP
a
Fuel rod
Rig
FIG. 17. Temperature. FIG. 18. Pressure.
0
100
200
300
400
500
600
0 100 200 300 400 500
RA
PT
A-5
.2
Experiment
experiment = calculation700
750
800
850
900
950
1000
1050
700 750 800 850 900 950 1000
RA
PT
A-5
.2
Experiment
experiment = calculation
FIG. 19. Time to rupture. FIG. 20. Temperature at burst.
2
3
4
5
6
7
8
2 3 4 5 6 7
RA
PT
A-5
.2
Experiment
experiment = calculation
0
10
20
30
40
50
60
0 10 20 30 40 50 6
RA
PT
A-5
.2
Experiment
experiment = calculation
FIG. 21. Pressure at burst. FIG. 22. Deformation in ruptured section.
2.4. RIA experiments The experiments simulating RIA in WWER were performed in a fast pulsed graphite reactor (BIGR). Standard fuel rods of WWER-440 and WWER-1000 irradiated at Novovoronezh and Kola NPPs up to burnup 50–60 MW·d·kg-1U were used for the refabrication of the experimental fuel rods. The fuel rod imitators with length of active part 150 mm was loaded by power pulses of 0.2 ms half-width (Fig. 23). During the BIGR experiments the output of any detectors from the ampoule was impossible due to safety requirements. The power rate and temperature changes in refabricated fuel rods were determined only by calculation using RAPTA-5.2 and FRAP-T6/VVER codes. The objective data for verification are only the PIE data: inner pressure, gas composition — obtained by puncture of tight refabricated fuel rods; residual clad deformation determined by profilometry.

286
Analyse of quality of calculations with RAPTA-5.2 code used were performed by cross verification with FRAP-T6/VVER code. The RAPTA-5.2 estimations of maximal fuel and cladding temperatures and fuel peak enthalpy (cal·g-1) are in good agreement with the same obtained by FRAP-T6/VVER calculations. The calculated values of circumferential deformation of cladding (%), xenon and krypton volume fractions (%) correlate with experimental data (Figs 24–28).
#RT 6
0.00 0.05 0.10 0.15
Time, s
0
200000
400000
600000
LHG
R, W
/cm
0
1
2
3
4
5
6
7
8
9
10
0 2 4 6 8
RA
PT
A-5
.2
Experiment
experiment = calculation
FIG. 23. Linear heat generation rate. FIG. 24. Height average deformation.
0
10
20
30
40
50
60
70
80
0 20 40 60
RA
PTA
-5.2
Experiment
experiment = calculation1500
1700
1900
2100
2300
2500
2700
1500 1700 1900 2100 2300 2500 2
RA
PT
A-5
.2
FRAP-T6/VVER
experiment = calculation
FIG. 25. Xenon and krypton volume fraction. FIG. 26. Fuel peak temperature.
800
850
900
950
1000
1050
1100
800 850 900 950 1000 1050
RA
PT
A-5
.2
FRAP-T6/VVER
experiment = calculation100
110
120
130
140
150
160
170
180
190
200
100 120 140 160 180
RA
PT
A-5
.2
FRAP-T6/VVER
experiment = calculation
FIG. 27. Cladding peak temperature. FIG. 28. Fuel peak enthalpy.
3. SUMMARY The results of RAPTA-5.2 models verification based on data of LOCA and RIA tests with fresh and irradiated fuel rods were shown. The predictive ability of the RAPTA-5.2 code regarding criterion parameters characterizing state of fuel elements under accident conditions has been examined. The verification results show that the code RAPTA-5.2 is a best estimate code.

287
The main directions of further development are:
1. The transition from deterministic calculations to probabilistic analysis. We are going to develop probabilistic analysis of models describing the fuel rod materials properties and to analyse the sensitivity of RAPTA-5.2 to uncertainties of input data.
2. Evolution of RAPTA-5.2 code for calculation of thermomechanical and corrosion behaviour of PWR fuel. It is mean in the first place the development of models describing the properties of PWR fuel materials and verification / validation of RAPTA-5.2 basing on PWR experimental data.
3. Development of new and perfection of existent models of the processes occurring in the fuel rods. For example, development a model of fuel relocation and model describing the behaviour of non-equilibrium mixture of gases under the cladding are very important for calculations of behaviour of high burnup fuel rods under accident conditions.
REFERENCES
[1] FEDOTOV, P.V., et al., Estimation of water–water energy reactor fuel rod failure in design
basis accidents, Proceedings of the Water Reactor Fuel Performance Meeting, Kyoto (2005) 835–837.
[2] NOVIKOV, V.V., et al., Substantiation of WWER fuel safety in design basis accidents, Experimental support, Top Fuel 2006, Salamanca (2006).
[3] FEDOTOV, P.V., et al., Studies of VVER fuel rods behaviour under LOCA condition, current status, Ad hoc LOCA meeting, NEA Headquarters, Issy-les-Moulineaux (2006).
[4] FEDOTOV, P.V., et.al, The substantiation of embrittlement criterion of E110 alloy under LOCA conditions, 8th International Conference on WWER Fuel Performance, Modelling and Experimental Support, Burgas (2009).
[5] SMIRNOV, V.P., et al., Performance of highly irradiated fuel of pressurized water reactors in accidents with the core dryout, International conference «Nuclear engineering at the threshold of century XXI», Electrostal (2000).
[6] FEDOTOV, P.V., et al., The post test calculations with RAPTA-5.2 using of the VVER LOCA experiment IFA-650.6, Enlarged Halden Programme Group Meeting, Storefjell (2010).
[7] FEDOTOV, P.V., et.al, The post-test calculations of the VVER LOCA experiments IFA-650.6 and IFA-650.11 using RAPTA-5.2 code, Workshop on VVER Fuel Behaviour, Budapest (2011).
[8] SMIRNOV, V.P., et al., Results of post-irradiation examination of WWER fuel assembly structural components made of E110 and E635 alloys, 6th International Conference on WWER Fuel Performance, Modelling and Experimental Support, Albena (2005) 231–243.
[9] Shestopalov, K., et al., Modification of USNRC’s FRAP-T6 fuel rod transient code for high burnup VVER fuel, NUREG/IA-0164, RRC KI 2180, IPSN 99/10 (1999).
[10] Yegorova, L., et al., Experimental study of narrow pulse effects on the behaviour of high burnup fuel rods with Zr-1%Nb cladding and UO2 fuel (VVER Type) under reactivity-initiated accident conditions, NUREG/IA-0213, Vol.1&2 (2006)


289
ASSESSMENT OF FUEL BEHAVIOUR UNDER LARGE BREAK LOCA CONDITION FOR INDIAN PRESSURIZED HEAVY WATER REACTOR
A. DIXIT, S.K. YADAV, N. KUMAR, T.A. KHAN, M. SINGHAL, N. MOHAN, P.K. MALHOTRA, S.G. GHADGE, U. CHANDRA
Directorate of Reactor Safety and Analysis Nuclear Power Corporation of India Limited Mumbai, India
Email: [email protected]
Abstract
Pressurized heavy water reactor (PHWR) consists of a large number of coolant channel assemblies. Each channel assembly is loaded with number of short length fuel bundles. A fuel element consists of sintered cylindrical UO2 pellets contained in a thin collapsible Zircaloy-4 cladding. Large break loss of coolant accident (LBLOCA) in PHWR results in insertion of positive reactivity due to core voiding leading to increase in reactor power. For large breaks, there is an early increase in neutron power and the event leads to reactor trip occurring from neutronic signals besides various other process trips. PHT system depressurizes rapidly and heat transfer from fuel rods decreases sharply which results in rapid rise in clad temperature. With this rise in clad temperature, the exothermic zirconium–metal water reaction would also start contributing toward energy generation and hence results in rapid rise in fuel clad temperature. The fuel clad temperature in the core is estimated during large break LOCA accident and fuel failures in this case are calculated. Under the postulated accident conditions, fuel shall remain in position and not suffer distortion to an extent that would render post-accident core cooling ineffective. The criteria for accident conditions for predicting fuel failure are: (1) The maximum oxygen concentration in the least affected half thickness of clad shall not exceed 0.7 per cent by weight. (2) Stress in the cladding shall not exceed burst stress. (3) The total energy in fuel element including radial average enthalpy shall be less than 200 cal·g-1 in the over power transient. In an accident transient fuel clad will be subjected to high temperature and high pressure difference across the clad. The coolant pressure goes down in case of large break LOCA. The fission gas pressure is estimated in transient considering fuel temperature and deformation of clad. The fuel element failure is considered if the fuel clad local stress equal or exceeds the burst stresses. The burst stress is calculated considering, clad temperature, differential pressure between clad and coolant and oxidation of the Zircaloy-4 during the transient. In the over power transient initiated by reactivity initiated accident or LOCA, cumulative energy deposition in the fuel is estimated. In this paper, assessment of fuel damage under LBLOCA condition for Indian PHWRs is performed for identified limiting governing break sizes. Analysis demonstrates that under governing LOCA condition with high pressure ECCS available, adequate coolant pressure at the time of peak clad temperature on collapsible clad prevents the gross fuel failure and fuel clad failure is limited to low value of full core in the entire spectrum of break sizes and locations. 1. INTRODUCTION With the stringent design and operating practices adopted in nuclear reactor technology, the occurrence of a major accident is an unlikely event. However, as part of the defence-in-depth philosophy, such events are still postulated to occur. One such event is loss of coolant accident (LOCA). LOCA in pressurized heavy water reactor (PHWR) results in insertion of positive reactivity due to core voiding. The positive reactivity insertion leads to increase in reactor power. Timely automatic actuation of fast acting shutdown systems control the increase in reactor power and terminate power excursion transient quickly by inserting large negative reactivity into the reactor core. Rise in reactor power due to core voiding coupled with low flow/flow stagnation in the core results rapid rise in fuel and clad temperature. Clad temperature further rises due to exothermic metal water reaction. In LOCA, fuel clad will be subjected to high temperature and high pressure difference across the clad. The coolant pressure goes down whereas fission gas pressure increases due to high temperature in LOCA condition.
Accident analysis for PHWR considers a wide range of postulated break sizes and locations in the primary heat transport (PHT) system. As the location of the break in PHT system affects the system

290
response, breaks in three different locations namely reactor inlet header (RIH), reactor outlet header (ROH) and pump suction (PS) line having different thermodynamic conditions are considered. The entire spectrum of possible break sizes has been analysed to assess the system performance/behaviour. This paper concentrates on fuel damage under large break LOCA, in particular, assessment of fuel failure and its compliance with respect to acceptance criteria for various LOCA condition. 2. OVERVIEW OF INDIAN PHWRS
In India, there are 17 ((15 of 220) MW(e) and (2 of 540) MW(e) capacity) reactors of PHWRs design are operating and 4 reactors of 700 MW(e) capacity are under construction. Indian PHWRs use natural uranium dioxide as fuel and heavy water as moderator and coolant. The heat generated in the core is removed by PHT system. Heavy water coolant is circulated through the core by primary circulating pumps. A simplified flow diagram of PHWR is shown in Fig. 1. The coolant passes around the fuel elements and temperature is raised to about 44°C from inlet header to outlet header. The hot coolant carried from the outlet headers to a set of two steam generators in a loop two in each of the north and south banks.
FIG. 1. Schematic of primary heat transport (PHT) system.
FIG. 2. 37-element fuel bundle; 540 MW(e) reactor.
PHT circuit in 540 MW(e) reactor is arranged in two independent identical loops with 392 channels. Each loop, arranged in figure-of-eight loop, consists of two ROHs, two steam generators, two primary coolant pumps and two RIHs. Both PHT loops are connected through pressuriser for maintaining system pressure. Whereas in 220 MW(e) reactor consist of single loop with 306 coolant channels arranged in a figure-of-eight loop. Emergency core cooling system (ECCS) is provided as an important safety system to cool the core and thereby limit the release of fission products from the fuel in the event of postulated LOCA. Reactor crash cool down is accomplished by pilot operated safety relief valves (SRVs) along with atmospheric steam discharge valves (ASDVs).

291
FIG. 3. Cut away view of 540 MW(e) reactor. FIG. 4. Modelling of reactor core of 40 MW(e).
In PHWRs, fuel and coolant are confined to coolant channel surrounded by a large mass of relatively cold moderator. Each coolant channel assembly consists of a horizontal Zr-Nb pressure tube attached by an expanded joint to stainless steel end fitting at both ends. Fuel bundles for the reactor is about half a meter long and consists of a number of cylindrical fuel elements arranged in concentric rings. In 540 MW(e) reactor, fuel bundles consist of 37 fuel elements whereas in 220 MW(e), fuel bundles are 19 fuel element configurations. A fuel element consists of sintered cylindrical UO2 pellets contained in a thin Zircaloy cladding, which is collapsible under operating coolant pressure. The element is filled with helium gas at atmospheric pressure and the sheath is sealed at both ends by welded end plugs. The inside surface of the cladding is coated with graphite. The graphite layer acts as a barrier and lubricant. The graphite coating reduces the chemical and mechanical interaction between the UO2 fuel pellet and Zircaloy clad. Figures 2–3 shows the typical 37 element fuel bundle assembly and cut view of coolant channel arrangement in the core [1–2].
3. COMPUTER CODE USED AND MODELLING METHODOLOGY
The analysis of postulated accident scenario is done using system thermal hydraulic neutronic computer code ATMIKA [3–6] developed in NPCIL for the analysis of LOCA scenarios. The computer code ATMIKA is based on unequal velocity equal temperature (UVET) model using three conservation equations and slip correlations. To deal with space–time effects of large size reactor which behave in loosely coupled manner, the 3-D reactor kinetics model based on improved quasi-static scheme [7] is adopted. ENDF/B.VI 69 group neutron cross-section library supplied by International Atomic Energy Agency (IAEA) is used [8].
Thermal hydraulics of a system is simulated by nodalising the entire system into a number of lumped control volumes (nodes). Nodes are connected by means of flow paths. A flow path can be defined along with a valve or pump or both. Mass and energy equations are applied on lumped control volume. Momentum equation is applied on flow path.
A typical nodalisation diagram of ATMIKA simulation for PHT system, Pressuriser, ECCS and secondary system for LOCA analysis of 540 MW(e) reactor is shown in Fig. 5. In this nodalisation diagram, core is modelled by eight representative channels. For large break LOCA, power variation is

292
large in the broken (affected pass) loop. So, this loop has been simulated by 3 channels in each pass in which one channel represents 31 inner high power channels (between 5–5.5 MW), second channel represents 36 middle medium power channels (between 4–5 MW) and third channel represents 31 outer low power channels (below 4 MW) Fig. 4. Power variation is less in intact loop, therefore this loop has been simulated by one channel in each pass. Each channel is modelled using three axial control volumes [9–10].
The maximum rated fuel pin at each node of the core is taken as a representative fuel element. The fuel pin is divided radially into N number of zones with two fixed on clad as shown in Fig. 6. Applying energy conservation at node i
.11
121)(
111
21)(
1
)( QiVn
iTn
iTr
ikA
niT
niT
r
ikA
t
niT
niT
ipCV
(1)
Where V is the volume; ρ is the density; Cp is the specific heat; K is the conductivity; A is the heat transfer area; Q is the volumetric heat generation. Tn+1 and Tn denotes the temperature at new and old time step. In stratified flow condition, code has capability to calculate fuel temperature for top pin and bottom pin separately. Under these conditions, the top pins in a bundle are exposed to steam, while the bottom pins are exposed to liquid. The radiative heat transfer and exothermic zirconium steam reaction are also modelled.
FIG. 5. Nodalisation for large break LOCA analysis.

293
4. FUEL FAILURE CRITERIA IN ACCIDENT CONDITION AND ITS COMPLIANCE Under the postulated accident conditions, fuel shall remain in position and not suffer distortion to an extent that would render post-accident core cooling ineffective. In an accident transient, fuel failure may be assumed to have occurred if any of the following three criteria as laid out in Sections 4.1–4.3 is not satisfied [11]. 4.1. Oxygen embrittlement The maximum oxygen concentration in the least affected half thickness of clad shall not exceed 0.7 wt%. This condition is also intrinsically require that for the fuel clad to remain intact, the alpha phase penetration of the cladding shall be lower than the half thickness of the cladding.
For compliance of this criteria, the thickness of zirconium oxide layer, oxygen stabilized alpha zirconium layer, beta zirconium layer as a function of time and oxygen concentration along the thickness of the cladding are required to be calculated. For the calculation of different layer formed during the isothermal oxidation of fuel clad and oxygen distribution profile along the thickness of the cladding is calculated by following governing differential equation for simultaneous oxygen diffusion and reaction in each layer is given as:
AkC
y
AC
DtA
C
2
2 (2)
Where C is the oxygen concentration; D is the diffusion coefficient for oxygen in the given layer; t is the time; y is the special coordinate. In the oxide layer, reaction of Zircaloy with the steam dominates the diffusion of oxygen. Hence, for the oxide layer the diffusion term in the governing equation is omitted [12]. In the beta layer, there is
FIG. 6. Modelling of fuel element.
FIG. 7. Oxygen embrittlement criteria.

294
no formation of zirconium oxide. Thus, reaction term is omitted in beta layer as diffusion dominates for this layer.
FIG. 8. Time of clad failure by oxidation. FIG. 9. Failure time for fuel of 10000 MW·d·Te-1U.
FIG. 10. Variation of reactor power and fuel enthalpy.
FIG. 11. Variation of clad temperature.
FIG. 12. Variation of clad temperature and fuel centre line temperature.
FIG. 13. Fuel damage effect with time.
The thickness of oxide and oxygen stabilized alpha layers are calculated using parabolic rate constants. The total oxygen uptake is calculated using isothermal parabolic rate constant as there is a general agreement in the literature that oxidation, in the higher temperature range say more than 1000°C, follows a parabolic rate law. Hence, the rate of weight gain during oxidation is taken inversely proportional to the instantaneous magnitude of weight gain i.e.
pKWdt
dW 1 ;
RT
QAK p exp (3)
ATMIKA : LOCA ANALYSIS FOR 540MWe REACTORCRITICAL BREAK (30%) AT PSL WITH CLASS-IV POWER SUPPLY FAILURE
0.0 5.0 10.0 15.0 20.0 25.0 30.0TIME (Sec.)
0.0
0.5
1.0
1.5
2.0
2.5
FU
EL
DA
MA
GE
EF
FE
CT
(%
)
-10.0 20.0 50.0 80.0 110.0TIME (sec.)
0.0
500.0
1000.0
1500.0
2000.0
2500.0
FU
EL
TE
MP
ER
AT
UR
E (
Deg
.C)
ATMIKA : LOCA ANALYSIS FOR 540MWeCRITICAL BREAK (30%) AT PSL WITH CLASS IV POWER SUPPLY FAILURE
-10.0 20.0 50.0 80.0 110.0TIME (sec.)
0.0
300.0
600.0
900.0
1200.0
1500.0
CL
AD
TE
MP
ER
AT
UR
E (
Deg
.C)
ATMIKA : LOCA ANALYSIS FOR 540MWeCRITICAL BREAK (30%) AT PSL WITH CLASS IV POWER SUPPLY FAILURE
FIG 9 FAILURE TIME FOR FUEL OF 10 000 MWD/T U
0.0 5.0 10.0 15.0 20.0 25.0 30.0
COOLANT PRESSURE (bar)
0.0
10.0
20.0
30.0
40.0
50.0
60.0
FA
ILU
RE
TIM
E (
Min
ute
)
Legend
BURST AT 800 OC
BURST AT 1000 OC
BURST AT 1200 OC
BURST AT 1400 OC
ATMIKA : LOCA ANALYSIS FOR 540MWeCRITICAL BREAK (40%) AT PSL WITH CLASS IV POWER SUPPLY AVAILABLE
0.0 1.0 2.0 3.0 4.0 5.0TIME (sec.)
0.0
1.0
2.0
3.0
4.0
5.0
PO
WE
R (
F.P
. ) LEGENDREACTOR POWERFUEL ENTHALPY
200
250
300
350
400
450F
UE
L E
NT
HA
LP
Y (
KJ/
KG
)

295
Where A is the constant; R is the gas constant; Q is the activation energy; T is the clad temperature. The build-up of oxygen in fuel clad and its distribution across the clad thickness has been analysed in the temperature range of 1000–1600°C (Fig. 7). It is found that 0.7% oxygen concentration by weight at about 1220°C in least affected clad thickness is equivalent to 17% of equivalent cladding reacted (Fig. 8). Thus both 17% clad oxidation thickness as suggested by USNRC [13] and 0.7% oxygen concentration in half thickness predicts oxygen embrittlement in close range [14]. 4.2. Burst stress Stress in the cladding (true stress, σL) shall not exceed burst stress. Burst stress (σB) is calculated using the following correlation
σB = a exp(-bT) exp[-((Ox-0.12)/0.095)2] (4) Where a, b are constants; T is the clad temperature; Ox is the percent oxygen concentration. For calculation of true stress, it is required to estimate deformation (strain, ε) in the clad and the differential pressure across the clad. Differential pressure is the difference between the internal fission gas pressure (PF) and outside coolant pressure (PC). In order to calculate fission gas pressure, initial inventory of fission gas is assumed to be equal to the fission gas inventory existing in the gap under steady state for a particular burn up. In addition, if for any particular case, the fuel temperature at a radius under accident condition had been above that of normal condition then the higher temperature is used for calculating fission gas release fraction. The variation of fission gas pressure with respect to temperature and deformation of clad is calculated, assuming ideal gas equation. Coolant pressure can be estimated based on thermal hydraulic model. Hence, when coolant pressure is less than the fission gas pressure of fuel element, clad starts experiencing the local tensile (hoop) stress, which can be estimated as follows: (5) Where D is the diameter of clad; S is the thickness of clad. Deformation of internally pressurized Zircaloy cladding can be calculated from the steady state (secondary) creep equation of the material. The steady state creep rate of a material at constant temperature and constant stress can be represented by a power law — Arrhenius equation of the form (6) Where A is the stress exponent constant; n is the stress exponent constant; Q is the activation energy; t is the time.
nLRT
QA
dt
d
exp
S
DPP CFL 2
)(

296
Change in fuel clad diameter and thickness can be estimated based on above equation for clad strain and considering constant volume of clad during deformation. With new clad diameter and thickness, local stress is estimated in each time step and compared with estimated burst stress for assessing the fuel failure due to clad bursting. 4.3. Fuel integrated power
The fuel pellet radial average enthalpy of the hottest fuel element shall not exceed 200 cal·g-1 (840 kJ·kg-1) to ensure integrity of fuel. This adiabatic deposition of energy in the maximum rated fuel pin is estimated for either 15 s. or till reactor power reduces to 15% FP (and remains below this power subsequently). Whichever time is greater between the two cases is used in the calculation. The adiabatic fuel enthalpy (E) is calculated as follows:
dttPFEE o )( (7)
Where Eo is the initial fuel enthalpy; P(t) is the fuel element power at time t; F is the factor which relates the fuel enthalpy to integrated power. A simplified model which could be derived from above criteria or which can be shown to be conservative with regard to the reference mode could be used [15]. In one of the simplified model, various combinations of coolant pressure and clad temperatures are used to predict the time at which the fuel fails by bursting of sheath or oxygen embrittlement. Time at which fuel fails following the initiation of accident with regard to coolant pressure for various clad temperatures are represented in Fig. 9. It is observed that if coolant pressure is more than 15 bar than fuel would not fail due to clad bursting unless sustained clad temperature exceeding 1200°C for more than 10 minutes. On the other hand, if clad temperature is less than 800°C, no fuel failure is predicted even in case of no coolant pressure for at least 40 minutes. However, in case of accident transient both clad temperature and coolant pressure varies with time. In such cases fractional damage caused by each combination of coolant pressure and clad temperature at various time steps are summed up to assess fuel failure. The cumulative damage effect at time t can be represented mathematically as
(8)
Thus one could say that the fuel does not fail before time t, if fuel damage fraction is less than unity.
5. RESULTS AND DISCUSSION 5.1. Assessment for a 540 MW(e) reactor To assess the performance of fuel and overall reactor safety system under large break LOCA condition, a wide range of break sizes is considered starting from transition break 5% (boundary between small break and large break) up to 100% (guillotine break) at RIH, ROH and PS line. Analysis has been done considering equilibrium core with Class-IV power supply available as well as failed. In the analysis first reactor trip generates on neutronic signal which is ignored in the analysis and reactor trip is credited on 2nd trip signal. With regards to assess fuel behaviour under LBLOCA, PS line gives the most limiting results in both cases with class-IV power supply available and failure. It is observed that 40% break at PS line with class-IV power available is the critical break as it results in early flow stagnation in reactor core, and represents the most limiting case as far as fuel clad overheating and clad oxidation is concerned. Similarly, around 30% break at pump suction line with class-IV power failure is critical break. Table 1
t
CCF BTPPt
dtFractionFuelDamage
0 , ),,(

297
provides the relevant key information of over power transient and clad behaviour in most governing cases of LBLOCA (Critical break at PS line). In LBLOCA, core experiencing early flow stagnation at a time when reactor power together with fuel stored heat is high shows sharp rise in clad temperature (Figs 10–11). Maximum clad temperature and oxygen concentration are 1237°C and 0.11% wt observed in most governing cases. The stresses and strain are calculated based on the severe temperature transient encountered by the fuel clad during the accident. True stress encountered during the transient is compared with the burst stress. It is found that true stress always remains below burst stress. Maximum fuel centreline temperature is less than 2050°C (Fig. 12). Adiabatic deposition of energy that is generated during the transient, the enthalpy of the maximum rated fuel increases to about 417 kJ·kg-1 for 40% PS line break (Fig. 10). This is within the acceptable fuel enthalpy limit of 840 kJ·kg-1. Thus, it can be concluded that clad integrity is maintained. For these governing cases, degree of fuel damage is determined with regard to time for these governing cases. Maximum fraction of fuel damage effect in the inner channel does not exceed 2.4% (Fig. 13). Hence, this analysis predicts no fuel failures under LBLOCA. Fuel and fuel channel behaviour under LOCA along with ECCS unavailable is also assessed. Following voiding in the channels, heat generated in fuel bundles is transferred by radiation to the pressure tube and calandria tube and then by convective heat transfer to the moderator. Fuel temperature is calculated for fuel elements in top and bottom sector separately. Fuel failure is assessed based on the data corresponding to a burnup of 15000 MW·d·Te-1 U and a coolant pressure of 1 bar. The chosen data is thus very conservative. It is estimated that half core experiences around 69.7% fuel failure. No melting of fuel and clad is seen during the transient. Analysis demonstrated that moderator system is an effective heat sink in the worst scenario of LBLOCA with failure of ECCS even under class IV power failure condition. TABLE 1. KEY RESULTS FOR LBLOCA
Main parameter Unit
540 MW(e) 220 MW(e)
40% PS line break with class-IV power supply available
30% PS line break with class-IV power supply failure
30% break at RIH with class-IV power supply failure
2nd trip signal Type Low pressure trip Low pressure trip High rate log N
Time (s.) 0.494 0.497 0.63 Max. fuel center line temperature
°C 2050 2031 2350
Max. reactor power F.P. 4.16 3.99 2.46
Time (s.) 1.5 1.5 1.5 Peak net reactivity mk 4.17 4.15 3.03 Fuel enthalpy kJ/kg 417.3 412.1 522.7 Maximum clad temp. °C 1176 1237 1240 Clad oxid. thickness % 2.0 2.3 2.75 Oxygen concentration wt% 0.10 0.11 0.12 Fuel damage effect % 1.5 2.4 3.2 5.2. Assessment for 220 MW(e) reactor LBLOCA analysis is performed for wide range of break sizes at RIH and ROH. It is observed that break range of 20–40% at RIH and 75–100% at ROH result in relatively prolonged flow stagnation condition. It is found that critical break in RIH (30%) with class-IV power failure is governing. In this

298
case, the adiabatic deposition of energy (fuel enthalpy) of the maximum rated fuel, increases to about 522.7 kJ·kg-1 from an initial enthalpy of 353.4 kJ·kg-1. Predicted peak clad temperature and oxygen concentration corresponding to the maximum rated pencil of the fuel bundle exposed to the steam taking into the stratification effects are 1240°C and 0.12% wt respectively. Maximum fraction of fuel damage effect in the hot channel does not exceed 3.2%. Maximum fuel centreline temperature is less than 2350°C. Analysis demonstrated that there is no fuel failure in LBOCA even with:
(i) no credit for first trip parameter; (ii) no credit for negative reactivity provided by reactor regulating system; (iii) minimum allowed isotopic purity of PHT coolant [16]; (iv) actuation of only one shut down system.
6. CONCLUSION In PHWR, even with large positive reactivity due to coolant voiding, over power transient due to LOCA is controlled by automatic fast acting shutdown systems. The entire spectrum of possible break sizes and locations have been analysed with several conservative assumptions to assess the fuel/system performance. It is found that from assessment of fuel behaviour point of view, critical break is most limiting among the all possible break sizes.
In LBLOCA analysis, fuel failure criteria have assessed and no fuel failure is seen during the transient. In the most governing case of LBLOCA, cumulative fuel damage effect in maximum rated fuel element is around 2.4% for 540 MW(e) reactor (3.2% for 220 MW(e) reactor). Analysis demonstrated that even in case of LBLOCA with unavailability of ECCS, core cooling would be maintained through heat transfer to moderator. It is observed that if coolant pressure is more than 15 bar than fuel would not fail due to clad bursting unless sustained clad temperature exceeding 1200°C for more than 10 minutes. On the other hand, if clad temperature is less than 800°C, no fuel failure is predicted even in case of no coolant pressure for at least 40 minutes.
REFERENCES
[1] TARAPUR ATOMIC POWER STATION 3 & 4, Safety Report Volume – I (Design Description), Revision 1 (2004).
[2] Design Manual on “Nineteen Element Fuel Bundle” KAIGA-3,4/DM/37000/Rev.-0, Issued in February 2006 (2006).
[3] BAJAJ S.S., et al., “Computer codes for safety analysis of Indian PHWRs”, Advances in Heavy Water Reactor Technology proceeding of TCM held in Mumbai, India, 29 January–1 February 1996, IAEA-TECDOC-984, IAEA, Vienna (1996).
[4] SINGHAL, M, et al., LBLOCA analysis for retrofitted ECCS at MAPS using modified computer code ATMIKA. First National NRT Conference on Nuclear Reactor Safety Mumbai (2002).
[5] SINGHAL, M., et al., Assessment of severe accident in Indian PHWRs, IAEA-TCM on modelling in-vessel phenomena under severe accident condition including the effect of MOX fuel held, Vienna (2000).
[6] DIXIT, A., et al., Design calculations on benchmarking ATMIKA against open experimental results of Canadian RD-14M test facility under auspices of IAEA-ICSP exercise, Doc No. NPCIL/DC/01500/2018/R0 (2010).
[7] FERNANDO, M.P.S., Development of Space-time Kinetics Technique to Analyse Localized Perturbations in Pressurized Heavy Water Reactors, Ph.D thesis, IIT, Bombay (2002).

299
[8] RAY, S., et al., Reactivity coefficients and reactor kinetics parameters for 220 MWe PHWR using ENDF/B-VI 69 group library, PHWR 220/2004/20, (2004).
[9] TARAPUR ATOMIC POWER STATION 3&4, Safety Report Vol. II (Accident Analysis) part A&B, Tarapur Atomic Power Station-3&4, Rev 1, January (2007).
[10] RAJASTHAN ATOMIC POWER STATION 5&6, Safety Report Vol. II (Accident Analysis) part A&B, Rajasthan Atomic Power Station 5&6, Rev 1, January (2011).
[11] AERB SAFETY GUIDE NO. AERB/SG/NPP-PHWR/D-6 on Fuel Design For Pressurised Heavy Water Reactors (2003).
[12] SAH, D. N., et al., OXYCON model and oxygen embrittlement criteria for PHWR fuel cladding during LOCA condition, Bhabha Atomic Research Centre Report, BARC/2002/I/03, Mumbay (2002).
[13] UNITED STATES NUCLEAR REGULATORY COMMISSION, USNRC Standard Review Plan, Fuel System Design, NUREG-800, Rev. 2 (1981).
[14] BAJAJ, S.S., PRASAD, P.N., ECCS acceptance criteria and fuel failure criteria comparison of PHWR and LWR approaches, First National NRT Conference on Nuclear Reactor Safety, Mumbai (2002).
[15] ERABACHER, F.I., et al., Burst criterion of Zircaloy fuel cladding in loss of coolant accident, STP754 Proceedings ASTM, 5th International Conference on Zirconium in Nuclear Industry (1980).
[16] KAIGA ATOMIC POWER STATION, Technical Specification for KAIGA-3&4 Operation PART-A January (2007).

301
MATARE COUPLED CODES PACKAGE VALIDATION AND ASSESSMENT OF POTENTIAL CLAD BALLOONING BEHAVIOUR FOR LIMITING ATWS AND LBLOCA FAULT SEQUENCES IN SUPPORT OF DEVELOPMENT OF THE SIZEWELL ‘B’ PWR SAFETY CASE WITH AN INCREASED FUEL INTERNAL PRESSURE LIMIT AND M5TM CLAD FUEL
R. PAGE, S. JENKINS EDF-Energy
Gloucester, UK Email: [email protected]
Abstract
A Sizewell ‘B’ PWR safety case revision is planned to allow operation to increased burnup levels utilising M5TM clad fuel. This brings the need for a raised internal fuel pressure limit. Review of the transient analysis safety case identified requirements for further assessments of clad ballooning behaviour for some potential fault sequences. The MATARE codes package comprises the MABEL clad deformation analysis code coupled using the TALINK code to the RELAP5 thermohydraulics code. The MATARE codes package validation basis is summarized with a detailed review of recent MATARE analysis of the NRU MT-4 LOCA experiment. Earlier evidence has shown that the key uncertainties include the assumed fuel pellet eccentricity distribution but suggested evidence that the appropriate distribution may have similarities for different facilities and plant. The MT-4 analysis has successfully applied the quasi normal distribution derived in previous validation analysis of the NRU MT-3 experiment. Comparison of clad temperature calculation results with test data around the blockage elevation shows good agreement. The analysis results show excellent agreement in the ballooned clad calculated failure times with deviations of less than 3 seconds with test data. The test average flow area blockage estimated as ~60% from available data compares well with the MATARE value of ~65%. Supported by this additional validation evidence MATARE has been applied formally for the first time in two sets of analysis. (i) Investigations of the level of clad ballooning calculated in key limiting anticipated transient without scram (ATWS) fault sequences with the original (155 bar) and revised (184 bar) limiting fuel internal pressure. (ii) Examination of the effects on clad ballooning of changing from Zircaloy to M5TM clad in the LBLOCA safety case assessments. The key results from these MATARE assessments, which support the planned move to the increased fuel burnup limit, are described. 1. INTRODUCTION The main Sizewell B LBLOCA safety case assessment calculations were performed using the WCOBRA/TRAC thermohydraulic system code and the BART-A1 clad ballooning code [1]. The BART-A1 code uses a conservative co-planar sub-channel blockage model. To support more recent Sizewell ‘B’ safety analysis requirements linked to core fuel design changes the MATARE coupled codes package has been introduced for aspects of the safety case where more detailed and flexible modelling is significant. The MATARE safety case application has primarily been for LBLOCA fault assessment. However the package has also been applied in assessments concerning the potential for clad ballooning for a bounding ATWS intact circuit fault. This analysis is part of the support for the increase of Sizewell ‘B’ fuel rod internal pressure limit introduced as part of the move to an increased burnup fuel cycle. 1.1. MATARE background The EDF-Energy MATARE dynamically coupled codes package comprises the MABEL clad deformation and ballooning code [2], the TALINK coupling code [3–4] and the RELAP5 thermohydraulics code [5]. The original development of MATARE was initiated by Imperial College and EDF-Energy based on the three existing codes and is discussed in [6]. This work has been

302
followed up by later analysis work for EDF-Energy by AMEC, in particular, in relation to the Sizewell ‘B’ LBLOCA model. 1.2. MATARE basis The MABEL code was created by the UKAEA to calculate the degree of clad deformation in PWR fuel rods in thermal hydraulic conditions that facilitate clad strain and ballooning. It carries out a radial and azimuthal solution of the temperature and strain field equations, for all axial nodes, in a single fuel rod, centred in a 3 × 3 array of rods. The behaviour of the surrounding rods is controlled via input parameters if the code is run stand-alone. In a MATARE model the data from the surrounding pins are supplied by data transfer from one or more separate MABEL executable run processes, one per rod. These separate rod executable processes or ‘instances’ are coupled via the TALINK code. The pellet stack is assumed to remain intact and the eccentricity of the pellet and the cladding are prescribed by input. The centre fuel pin of each MABEL instance is coupled with the heat structure arrangement modelled with the RELAP5 code. RELAP5 is a widely used thermohydraulic code developed for the analysis of water reactor transients. It is based on a non-homogeneous and non-equilibrium model for a two-phase system. For the MATARE model the RELAP5 is used to represent the entire calculation domain. This also replicates the rod and sub-channel geometry defined by the individual MABEL rod instances. The thermal hydraulic boundary conditions for the MABEL model are also defined by the RELAP5 model. TALINK was created to control the data transfers required for the execution of a set of coupled transient analysis codes performing their calculations in separate operating system processes. The code methodology is generic and is not limited to use for MATARE. 2. MATARE VALIDATION 2.1. Introduction The validation of MATARE is primarily reliant on the validation of the MABEL code with respect to the clad strain rate, clad interaction and rupture models. MABEL has been used over an extended period and compared against the results of dynamic ballooning experiments for most of the major test facilities namely:
Halden in Norway;
PHEBUS in France;
REBEKA in Germany.
Validation of the complete coupled code package has been limited to examination of nuclear heated bundles with significant numbers of rods. This experimental data are readily available and the conditions are prototypic of PWRs. In addition it is notable that the accuracy of the calculated ballooning behaviour is markedly dependent on the thermal hydraulic conditions calculated by the plant system code and in this case by RELAP5 for MATARE. Some of the MABEL validation evidence is based upon the earlier MABEL-2D code version. This could be viewed as potentially less valuable than that for MABEL-2E as the thermohydraulic models have been upgraded in MABEL-2E to allow thermal disequilibrium. However, these new thermohydraulic models in MABEL-2E are validated by the separate MABEL-2E code results included here and so the MABEL-2D validation evidence remains useful in respect of the other MABEL code models.

303
2.2. RELAP5 validation The separate models and correlations in RELAP5 have undergone extensive testing [5] and also integral testing of the code has been made against all major PWR NSSS simulators. 2.3. Flecht Seaset — bottom up reflood This facility comprises 161 electrically heated rods in a configuration typical of a full length Westinghouse 17 × 17 bundle. The RELAP5/Mod3.3 validation matrix [5] models two forced reflood tests, 31504 and 31701 which simulate low and high reflood conditions. An accurate prediction of the thermal hydraulic phenomena was achieved for both tests with good agreement in quench progression and fuel clad temperatures. 2.4. LOFT LP-LB-1 RELAP5 has been used to simulate the LOFT LP-LB-1 large break LOCA integral test [8] which investigated the blowdown, refill and reflood phases of a postulated large break LOCA in a commercial four loop Westinghouse PWR. The initial conditions were representative of the UK licensing limits and ECCS safeguards. The LOFT facility has a power to volume scaling factor of 0.25. The results show that the code is capable of qualitatively predicting the overall trends of the reflood mechanisms. The predicted cladding temperature in the majority of the axial elevations is in acceptable agreement with the experimental data except for the uppermost level. This agreement is improved in the centre part of the core. Good agreement is also achieved in the quench front progression with the total core quench correctly predicted. 2.5. PKL-IIB.5 Further integral test validation has been performed against the experimental data of the PKL-IIB.5 test [9]. This test performed by Siemens/KWU studied the thermal hydraulic behaviour of the primary coolant system following a large break LOCA in the cold leg. The test covers the end of blowdown, refill and reflood phases. The PKL facility is scaled 1:1 in height, 1.12 in diameter and 1:145 in volume. It can be concluded from the comparison of the calculated results and the experimental data, that the code provides a good overall prediction of the test as a whole in terms of the system pressure response, steam temperatures and reflood progression. In addition, the calculated clad temperatures at nearly all elevations were in reasonable agreement with the data, the prediction being poorer at the uppermost levels. In the dispersed boiling regime where the highest fuel clad temperatures occur, very good agreement between the calculation and the measurement was achieved. 2.6. KS test — dual direction reflood A validation study [10] has been performed which simulates a main circulation pump pressure header break simulated by KS RBMK-1500 test 5. This investigates the rod temperature response of a high power fuel assembly to total loss of coolant flow from a pressure header break and the later behaviour after the resumption of coolant flow from ECCS injection to both upper and lower plena. In the initial phase of the transient, effectively representing a boil-off condition, an accurate code prediction was achieved. For the reflood phase good agreement with the fuel rod temperatures in the

304
top half of the bundle was achieved, but a calculated delay in quench front propagation resulted in an overprediction of the rod temperatures at lower elevations. 2.7. IPPE test — top down reflood Analysis of the IPPE facility Second Russian Standard Reflooding Problem test, representing a top down reflood test of a 37 rod bundle similar to the VVER design providing validation evidence of top/down reflood behaviour is supplied in [6]. The code results showed satisfactory agreement for most of the significant parameters. The main discrepancy is an overprediction of the clad temperature at the 2.7 m elevation (75 K). Significantly better agreement was calculated at other elevations. 2.8. Achilles test — bottom up reflood Analysis of the ACHILLES fixed blocked cluster test, A2R038 in [6] was performed to determine the ability of the code to simulate reflood thermal hydraulic conditions. This calculation uses a model of the ACHILLES test section analogous to that adopted for the MATARE NRU MT-3 test comparison described below. The overall agreement of the RELAP5 results with experiment was good. Liquid entrainment during the earlier period of the transient was slightly over predicted and underpredicted later. The calculated rewet occurred too early with the rewet front being predicted approximately 0.5 m higher by the end of the calculation. Steam and clad temperatures were in reasonable agreement with the experiment apart from near the quench front where the calculated temperatures were too low. At the fixed blockage the clad temperatures were higher by approximately 100°C. The calculation was better at predicting the magnitude of the peak clad temperature than the exact details of the final quench. The reason for this is that in LBLOCA reflood conditions RELAP5 effectively assumes a fixed droplet size. It was not possible therefore to represent both the peak clad temperature and the immediate vicinity of the quench front precisely. (This limitation does not apply to ATWS conditions, where the critical Weber number model applies). 2.9. CHF tests Code comparisons of the Bennett, Studsvik RIT and ORNL CHF tests are available in [5] and provide information on the code’s ability to calculate dryout location and the post dryout heat transfer. Reasonable agreement was achieved with a tendency to under predict clad temperatures in some cases. For the more prototypic ORNL bundle tests the agreement was good in terms of the calculated dryout location and the clad temperatures in the post dryout region. Reference [12] documents further RELAP5 calculations to assess the complete range of conditions represented by the Studsvik RIT CHF tests [13]. These tests represent a broad spectrum of conditions in terms of pressure, mass flux, inlet sub cooling and rod heat flux. Adequate agreement with the experimental data was obtained with the standard version of the code. Reference [12] also includes calculations using a modified RELAP5 code version. This RELAP5 code development has included: The inclusion of new capabilities to allow the specification of a DNBR cut-off in the determination of whether heat structures should apply post DNB heat transfer correlation calculations. A number of extra model options have been included to facilitate sensitivity assessments. The two options relevant to ATWS sensitivity calculations described in this paper are summarized in the table below.

305
These options are only applied when explicitly activated in the code input. TABLE 1. OPTIONS NUMBER 21 AND 24
Option no. Description 21 Activates use of a film temperature for the vapour convective
heat transfer correlation properties. 24 Activates use of the vapour flux only for the calculation of the
vapour heat transfer correlation Reynolds number for post CHF convective heat transfer.
Various new capability option combinations were assessed in the validation work and a recommended set of new input data were obtained. Using these model options achieved a bounding calculation of the post CHF clad temperatures for all of the experimental tests reported in the reference material. These RELAP5 model options are incorporated in the current MATARE package RELAP5 code version. 3. MABEL VALIDATION 3.1. REBEKA 6 ISP German PWR LBLOCA prototypic tests on this facility give conditions where clad temperatures fall steadily after the start of reflood. However some pins are maintained at sufficiently high temperatures to fail at the start of initial entrainment. Blind and open calculations of the test have been performed using MABEL-2D [14–15] and with MABEL 2E as part of the BASIL code [16–17]. Axial strain magnitude and shape predictions show good agreement with the experiment although inconsistencies in the experimental data gave problems which required the analysis to use experimental data for quench front progression and initial fuel temperature. 3.2. Halden experiments IFA-543 and IFA-544 MABEL-2D has been used in conjunction with RELAP-4 MOD6 to simulate these tests in [18]. The bundles were too small to be directly applicable to reactor conditions, but allowed comparison between the performance for electrically heated rods and nuclear fuel. Given RELAP-4 Mod 6 boundary conditions data MABEL was able to achieve good agreement with the measured burst strains. The burst strains were lower than those from other bundle experiments, in particular NRU MT-3 with average strains of 30% (IFA-543), 24% (IFA-544) and 44% (MT-3). 3.3. PHEBUS-218 (open ISP 19) [19–20] The MABEL-2D asymmetric ballooning calculations for the inner pins correctly predicted the cladding rupture during the period when the internal pressure and clad temperature were falling. This demonstrates the importance of including a Zircaloy phase change time delay model when analysing ballooning in fast transients. For these mixed phase conditions the base MABEL rupture criteria over predicted the balloon size. The later introduction of the Raff strain fraction rupture criterion [19] reduced this over conservatism.

306
4. DIRECT MATARE ANALYSIS VALIDATION EVIDENCE 4.1. NRU MT-3 [6, 21] Materials Test no. 3 (MT-3) was specified to investigate the phenomena of clad ballooning under the conditions of two phase reflood flow and to achieve a clad temperature transient similar to that predicted by an Evaluation Model large break LOCA calculation. The boundary conditions were set to achieve significant ballooning and interaction between neighbouring ballooned fuel pins. A schematic of the rod test section for MT-3 (and MT-4) is shown in Fig. 1.
FIG. 1. MT-3 and MT-4 test core cross section schematic.
0.00
100.00
200.00
300.00
400.00
500.00
600.00
700.00
800.00
0 500 1000 1500 2000 2500 3000 3500 4000 4500
Temperature [K]
Axial Height [mm]
Initial Coolant Temperature Profile
MT-4
MATARE
FIG. 2. Comparison of MT-4 and MATARE initial axial coolant temperature profile.

307
The MT-3 experiment is important for validation purposes as it records the clad ballooning response for a prototypic UO2 fuel pellet heat source and two phase reflood flow conditions. An added benefit is that the test section contained sufficient pins to provide representative data on clad interaction and mechanical restraint of neighbouring pins. In the absence of experimental data the pellet eccentricities, which to a large extent define the peak local strain rate (though not the axial strain profile or pressure response) and burst strains of the fuel pins were tuned by sensitivity calculations. The experimental reflood conditions were adjusted by a 5 second delay to the initiation of the reflood flow and with an increased flow by a factor of 1.5 towards the end of the transient at 130 seconds to provide better agreement between the calculated clad temperatures and the experimental data. Again this demonstrates the effect of the relatively simplistic droplet modelling that RELAP5 uses under LBLOCA reflood conditions. Clad failure occurred at 170–200 seconds. Although the pellet eccentricities were tuned for the magnitude of the peak strain, the code results and the experimental test data comparison showed very good agreement in the axial extent of clad strains at rupture, the rupture site locations, the pin pressure response and in the timing of the ruptures. This confirms that pellet eccentricity is a dominant parameter affecting the clad straining response and provides good validation evidence for the MATARE code clad interaction and burst models. This supports the prediction of the degree of interaction between individual pins and the estimation of the magnitude and axial extent of the flow blockage. The prototypic nature of the experimental data means the range of eccentricities determined from the MATARE NRU MT-3 comparison study can be used to provide a realistic prediction of the clad strain and blockage formation for a range of reflood conditions and pin power distributions. 5. NRU MT-4 EXPERIMENT ANALYSIS [22] 5.1. MT-4 objectives It was recognized that a test performed under adiabatic heating conditions would provide valuable comparison data on rod diametral strains. PIE of the MT-3 rods confirmed the existence of a wide range of rupture ductilities when deformation occurred in the high alpha phase temperature range under reflood conditions. It was anticipated that higher rupture strains would be generated if pressurized rods burst during adiabatic heating near the alpha to alpha plus beta transition. In order to examine this possibility, the MT-4 experiment was performed in May 1982 under near adiabatic heating conditions with rod internal pressures specified to produce rupture between 1033–1200 K. The objective of the MT-4 test was to rupture all rods during the "adiabatic" heat up phase prior to introduction of reflood phase in LOCA. The aim was to evaluate heat transfer conditions in a deformed bundle during boil down and reflood with very low reflood rates. 5.2. MT-4 experiment procedure The materials test section consisted of the centre 12 fuel rods pressurized by helium. The assembly heat up rate was equivalent to an increase in temperature at 8.3°C·s-1 when the steam cooling was interrupted. The temperature rise terminated at 57 seconds with the admission of reflooding water. The pressure transducers indicated clad ruptures at times between 52–58 seconds into the ramp. The aim was to stabilise the temperature in the upper part of the assembly at about 1143 K.

308
TABLE 2. MT-4 TEST CONDITIONS
Parameter MT-4 Test Condition Initial rod temperature Superheated steam was injected into the assembly to
obtain the desired temperature profile. The temperature varies between 400–700 K with the highest value at the 2500 mm level, Fig. 2.
Internal rod pressure The rods were pressurized with helium at a nominal value of 4.62 MPa at 296 K.
Circuit pressure The pressure was held at 0.28 MPa.
Cluster power The test was done with reduced reactor power to 5% of its nominal value. This generated an average linear rod power of 1.2 kW·m-1.
Test section inlet water temperature When reflood started, the temperature was maintained constant at 311 K.
Pumped inlet water flow rate The reflood was in operation with rates from 0.203–0.0254 m·s-1 followed by a variable rate to control boil off test stage clad temperatures.
TABLE 3. MATARE ROD PELLET ECCENTRICITY VALUES
Rod identifier.
Eccentricity Mechanical restraint model Value Angle
[deg]
11 (5D) 0.35 100 Box
12 (5C) 0.05 45 Unrestrained
13 (4E) 0.55 250 Box
14 (4D) 0.65 300 Box
15 (4C) 0.75 135 Box
16 (4B) 0.95 120 Box
17 (3E) 0.55 90 Box
18 (3D) 0.35 315 Box
19 (3C) 0.5 280 Box
20 (3B) 0.35 200 Box
21 (2D) 0.45 170 Box
22 (2C) 1.0 45 Box
5.3. MATARE model The MATARE model for the MT-4 analysis was developed from the earlier MT3 model. The MT-4 test initial and boundary conditions were used as the basis of the required revisions. 5.4. Rod pellet eccentricity Pellet eccentricity is an empirical parameter characterising the degree of thermal asymmetry within a fuel rod and is specified separately for each separate MABEL rod calculation.

309
The eccentricity values used for the MT-4 analysis were taken from the MATARE analysis of the earlier MT-3 experiment and are shown in the table below together with the related orientation (angle) data. These data were applied in the absence of any related experimental information. These data may not be comparable to actual experimental eccentricity of the corresponding MT-4 fuel rods. However, the distribution of the eccentricities modelled is judged likely to be representative of the experiment. 6. MT-4 RESULTS 6.1. MATARE pin temperatures The MT-4 and MATARE rod temperature transients are compared as a function of time at the 2.26 m height in Fig. 3. The rod temperature calculation agrees closely with temperature profile from MT-4 experiment, as the heating is adiabatic. 6.2. Pin internal pressure The rod 2C internal pressure is compared for MT-4 and MATARE as an example of the rod pressure behaviour in Fig. 4. Pin pressure rises during the adiabatic heat-up period to a maximum value of 9.21 MPa (MT-4) and 9.33 MPa (MATARE). After that ballooning begins and pressure starts to fall slowly with approximately the same slope until clad failure. The calculated pressures in the other rods follow similar trends but reaching slightly different peak values. TABLE 4. MEASURED VALUES COMPARED TO CALCULATIONS
Rod identifier
MT-4 [sec]
MATARE [sec]
11 (5D) 54 n/a 12 (5C) 54 n/a 13 (4E) 55 55 14 (4D) 58 n/a 15 (4C) 56 55 16 (4B) 52 54 17 (3E) 55 n/a 18 (3D) 57 n/a 19 (3C) 56 n/a 20 (3B) 53 n/a 21 (2D) 56 n/a 22 (2C) 57 55.6
6.3. Clad burst time The rods are calculated to burst at various times between 54–56 seconds into the transient, at which time the calculation failed with 8 pins yet to burst. These calculations all lie within the experimentally observed rupture times, which span from 52–58 seconds. The mean of these calculated rupture times is 55 seconds which is equal to the experimental value.

310
600
700
800
900
1000
1100
1200
0 10 20 30 40 50 60
Temperature [K]
Time [sec]
MT-4 and MATARE Pin Temperature Comparison at mid point of node 23 (2.26m)
MT-4
MATARE
FIG. 3. MT4 and MATARE pin temperature comparison at 2.26 m elevation.
0
2
4
6
8
10
12
0 10 20 30 40 50 60 70
Pressure [MPa]
Time [sec]
Rod 2C Internal Pressure (Mabel instance 22, Eccentricity value 1.0)
MT-4
MATARE
FIG. 4. MT4 and MATARE rod 2C internal pressure transient comparison.
The maximum difference in rupture time is 3 seconds although only four pins failed during the MATARE calculations. However the others are near to failure at the termination of the calculation as a result of an algorithm convergence problem. The measured values of rupture time from MT-4 experiment are compared with the respective calculated values (Table 4).

311
7. MT-4 RUPTURE TIME COMPARISON 7.1. Axial rod strain
The axial rod strain profiles for MT-4 and MATARE are presented in Figs 5–6. The average rupture strain is given as 72.1% and the main rupture zone appeared around 2413 mm elevation. There are three typical peaks in the ballooning in the MT-4 test that are visible in all of the profiles. The first peak is seen at about 2000 mm rod height and then the double peak is observable at around 2500 mm.
0
10
20
30
40
50
60
70
80
90
100
0 500 1000 1500 2000 2500 3000 3500 4000
Strain [%]
Axial Height [mm]
MT-4 AXIAL STRAIN
Pin 2C
Pin 2D
Pin 3B
Pin 3C
Pin 3D
Pin 3E
Pin 4B
Pin 4C
Pin 4D
Pin 4E
Pin 5C
Pin 5D
FIG. 5. MT-4 axial strain profiles comparison.
0
10
20
30
40
50
60
70
80
90
100
0 500 1000 1500 2000 2500 3000 3500 4000
Strain [%]
Axial Height [mm]
MATARE Axial Strain
Pin 2C
Pin 2D
Pin 3B
Pin 3C
Pin 3D
Pin 3E
Pin 4B
Pin 4C
Pin 4D
Pin 4E
Pin 5C
Pin 5D
FIG. 6. MATARE MT-4 axial strain profiles.

312
The MATARE model predicts a similar behaviour in axial rod strain but does not represent the double peak at 2500 mm. The double peak in MT-4 has been judged to be a specific feature of the experiment, which is explained below on the basis of Ref. [23], which discusses the reasons for the differences in the axial power profile for the MT-4 and the later MT-6A experiments. The modification of the existing shroud for MT-6A included removing some material from the inside surface of the outer stainless steel shroud (shown shaded in Fig. 1). As stainless steel is a mild neutron absorber the reduced mass of metal at interspersed axial ‘flat’ location points resulted in an increased neutron flux at these locations. There is an apparent correspondence between the axial location of these flats on the shroud and the localized strain effects in the cladding linked to the localized power and temperature effects. The large decrease in strain in the middle of the middle span corresponds to a non-flat region in the shroud. The flux wire data for MT-6A show a minimum–maximum difference in local power of about 8%. Reference [23] adjusted this to allow for the difference in the fraction of metal removed from the MT-4 shroud and suggests a local power variation of about 6%. For MT-4 the cladding strains occurred during the adiabatic heat up, where the cladding temperature ramp rates were mainly controlled by the local power. Reference [23] infers that the local temperature variations in the region of maximum strain would be about 6% of the temperature increase from the start of the transient to the time of rupture or about 20°C. Based on this effect the difference in calculated axial strain pattern could potentially be attributable to the absence of these localized power shape effects from the present MATARE model. Further analysis could help test the viability of this explanation. 7.2. Initial coolant temperature sensitivity study A notable sensitivity of cladding strain to temperature conditions has been demonstrated by MATARE in a separate sensitivity study to the impact of approximately 20°C higher initial coolant temperature. The example of the strain for rod 2C calculated in the sensitivity study is compared with the base case and MT-4 data in Fig. 7. The relatively small increase of coolant temperature from the basic case changes the strain profile from the peak from being around 2000 mm height to 2500 mm.
0
10
20
30
40
50
60
70
80
90
100
0 500 1000 1500 2000 2500 3000 3500 4000
Strain [%]
Axial Height [mm]
Axial Strain Sensitivity Case (Pin 2C)
MT-4
MATARE
MATARE_1
FIG. 7. MT-4 and MATARE base and sensitivity case axial strain comparison.

313
FIG. 8. MATARE ATWS analysis rods and sub-channel structure two channel model.
Based on this it is possible to conclude that the MATARE calculations should be able to capture the main details of the axial strain profile with the exception of the effect of unintentional power depressions that were not included in the modelling. In this particular case, there are two competing potential failure sites and the actual location of the failure is sensitive to boundary conditions. 7.3. Flow area blockage The level of flow channel blockage in the experiment can be compared against prediction by comparing the fractional area reduction in the centre region of the bundle with the area reduction predicted for the various sub-channels in the RELAP model. From flow cross section data from PIE the average flow area reduction in MT-4 has been assessed as approximately 60%. This value is a fraction of the original area occupied by 12 pins that is finally blocked by fuel, based on a transverse section derived by post-irradiation examination at level 2410 mm. The flow area blockages calculated by MATARE range from 31–65% with an average of 51%. This level of the blockage agrees quite well with the experiment and noting that the calculation terminated a little before all rods were calculated to burst. Based on these results it can be concluded that the MATARE code can provide a reasonable assessment of the level of blockage. 8. SIZEWELL ‘B’ ROD INTERNAL PRESSURE LIMIT INCREASE MATARE
SAFETY ASSESSMENTS 8.1. Introduction The increase in the rod internal pressure limit from 15.5–18.4 MPa means that the rod internal pressure can now exceed the normal operation coolant pressure. Such a pressure differential means that irradiation clad creep could give rise to clad lift-off if the pressure differential is sufficiently large for faults involving high clad temperatures and DNB. Significant levels of clad lift-off could influence the safety analysis behaviour and some faults transients could potentially give rise to more severe levels of clad ballooning.

314
The effect of this is likely to be most significant for ATWS and LBLOCA faults. In particular, if significant periods of the fault sequence transient have fuel in DNB there is now extra scope for clad ballooning due to the ductility of the clad and the larger initial pressure differential across the clad. The effect of the rod internal pressure limits increase has been examined for both ATWS and LBLOCA faults. In particular a multi-strand defence in depth approach has been applied for the assessment of the ATWS safety case to the change in rod internal pressure limit. The discussion here focuses on the use of MATARE analysis to provide supporting evidence for the acceptability of the rod internal pressure limit increase for Sizewell B ATWS fault sequences. For Sizewell ‘B’ ATWS fault sequences are normally analysed using the LOFT-5 code [24] but this does not include clad ballooning models. Thus the particular Sizewell B ATWS safety case fault sequence judged to be most onerous with respect to potential clad ballooning has been analysed using the MATARE linked codes package. This fault sequence comprises the initiating fault and a range of additional failures creating one of the bounding cases assessed for the safety case. The bounding sequence considered here is a very severe postulated fault sequence and includes: A small LOCA due to a RCP seal failure:
a number of SG relief valve failures giving an SG overpressure transient;
failure of the RCCAs to insert on reactor trip;
loss of offsite power.
Core power reduction occurs as a result of the actuation of the Sizewell ‘B’ Emergency Boration System to provide a diverse shutdown after the failure of the RCCAs to insert. However the reactor coolant pumps coast down arising from the assumed loss of offsite power gives rise to a power cooling mismatch for a period during which DNB could potentially occur. 8.2. MATARE ATWS fault sequence analysis The MATARE calculations to assess the clad temperature and degree of clad ballooning uses a simpler two channel model shown in Fig. 8. This model had originally been developed for MATARE LBLOCA clad ballooning assessment comparison with the extant co-planar blockage Sizewell ‘B’ safety case analysis code BART-A1. The related ATWS calculation results from the existing safety analysis have been used as boundary conditions for the MATARE calculation for the following parameters:
core exit pressure;
core mass flow;
fuel rod power.
The fuel temperature and power data are from a LOFT-5 hot rod model which incorporates a transient variation in peaking factor to represent the effect of the asymmetric core boron tilt arising in the fault sequence. 8.3. Retained pessimisms, allowances and principal assumptions The fuel rod internal pressure is tuned to 18.4 MPa for the start of the fault transient.

315
Rod peaking factor 1.65 (SABL).
Calorimetric uncertainty allowance 2%.
DNBR limit of 1.39.
Direct moderator heating fraction is set to zero to pessimistically raise the calculated fuel and clad temperatures.
8.4. ATWS calculation cases Case 1
Basic case, pumps coast down as given by LOFT5 data.
Represents the likely consequences for a lead pin with the safety case bounding limit for the FH.
Case 2
Sensitivity case.
Radial form factor applied to channels 5–8 increased from 1.0 to an assembly mean value of 1.49.
Pessimized post dryout heat transfer model options were activated in the RELAP5 calculation.
Application of new heat transfer model options 21 and 24 (RELAP5).
Case 3
Sensitivity case.
As case 2 but an extra pessimism is added to reduce the core mass flow by 20%.
8.5. ATWS results summary TABLE 5. ATWS RESULTS
Case Peak clad temperature Approximate DNB time and maximum strain 1 Approximately 364°C No DNB
0% 2 Approximately 850°C 10 s
1.5%.
3 Approximately 950°C 10 s 1.6%
8.6. ATWS calculation results summary Figures 9–10 show the rapid increase in primary system pressure following the reduction in cooling after turbine trip and the coast down of the reactor coolant pumps on loss of offsite power. The core power shown in Fig. 11 reduces relatively slowly as the pump coast down degrades the performance of the boron injection by the Emergency Boration System. An example of the calculated rod temperature variation is shown for case 3 in Fig. 12 for a range of axial locations. This shows a sharp rise at DNB around 12 seconds for this rod followed by a peak and gradual reduction with the

316
reduction in power. Figure 13 compares the peak levels of clad strain between the three cases (for a limited data point selection) showing that even with the severe pessimized conditions in case 3 there is still only very limited clad strain.
FIG. 9. MATARE ATWS core fluid pressure transient.
FIG. 10. MATARE ATWS fault core mass flow transient.

317
FIG. 11. MATARE ATWS fault core relative power.
FIG. 12. MATARE ATWS fault case 3 pin temperatures.

318
FIG. 13. MATARE ATWS fault maximum strain data comparison.
8.7. Conclusions These three cases provide evidence to support the view that there is no likelihood of significant loss of coolable geometry under the Sizewell ‘B’ ATWS fault conditions with the increased fuel internal pressure considered. This provides part of the support to safety case for the introduction of the increased rod internal pressure limit. 9. SIZEWELL ‘B’ PCA-2A AND M5TM LBLOCA CLAD BALLOONING
ASSESSMENT COMPARISON 9.1. Introduction The move to recent more advanced fuel clad materials can provide a number of benefits and has also been judged to be a prerequisite for the move higher burnup fuel cycles for Sizewell ‘B’ where the safety case for AREVA PCA-2a clad fuel was extended to allow the introduction of AREVA M5TM clad fuel. Overall the Sizewell ‘B’ LBLOCA safety case has examined a range of effects in relation to the move from PCA-2a to M5TM clad fuel including:
Changes in the M5TM assembly geometry.
Increase internal pressure limit.
Through life burnup effects.
Validity of the existing fuel integrity limits for the M5TM clad fuel design.
The discussion here centres on the results of MATARE benchmark calculations to compare the clad ballooning behaviours of PCA-2a and M5TM clad fuel to underwrite the application of existing LBLOCA safety case assessments for M5TM fuel.

319
9 10 8 7 6
6
5
1 2
102
3 4 5
D
2
101
4
3
11 12
16 17
F F
1
21 22
E
13 14
18 19
103 15
20
B
23 24
C
104
25
A
12 11
13 14 15 16
17 18 19 20
21 22
GT
GT
GT
GT
FIG. 14. SZB assembly standard model, rod numbering. ABEL instances representing rods 11–22, highlighted by shading. ‘GT’ indicates the location of guide thimbles.
B15 B15 B15 B15
B15 GT 1.61 15.4
1.6 15.4
GT B15
B15 1.61 15.5
1.59 15.4
1.61 15.4
1.59 15.4
B15
B15 1.62 15.5
1.621 15.5
1.52 15.1
1.57 15.3
B15
B15 GT 1.61 15.4
1.59 15.4
GT B15
B15 B15 B15 B15
FIG. 15. SZB assembly, standard model — pin radial form factors and internal pressures (MPa). ‘Bnn’ represents a region with ballooning characteristics linked to rod nn but with local fluid conditions. ‘GT’ represents a guide thimble.
B18 B18 B18 B18
B18 GT 1.6 12.1
1.61 12.1
GT B18
B18 1.6 12.1
1.57 12.0
1.58 12.0
1.61 12.1
B18
B18 1.6 12.1
1.58 12.0
1.27 12.2
1.621 12.2
B18
B18 GT 1.6 12.1
1.62 12.2
GT B18
B18 B18 B18 B18
FIG. 16. SZB assembly model with burnable poison. rod radial form factors and internal pressures (MPa).
B18 B17 B13 B13
B18 B17 1.57 12.8
1.3 15.4
B13 B11
B17 1.57 12.8
1.59 12.9
1.32 15.5
1.32 15.4
B19
B13 1.29 15.3
1.31 15.4
1.621 13.0
1.6 13.0
B18
B13 B13 1.31 15.4
1.6 13.0
B18 B17
B22 B19 B18 B17
FIG. 17. SZB four assembly corner model — pin radial form factors and internal pressures (MPa).

320
The assessment comparisons examine:
Clad stress and strain behaviours.
Burst characteristics.
Clad interaction and blockage formation.
9.2. Modelling approach The model basis for the assessments here uses methodologies derived from the models developed for the NRU MT-3 and MT4 MATARE validation analysis. However a range of changes have been introduced.
The ballooning calculations now apply AREVA creep correlations and burst criteria rather than the original Zircaloy-4 models in MABEL used in the NRU MT3 and MT4 validation calculations. The AREVA burst criteria are based on local stress rather than the combined checks of azimuthal strain and strain rate applied in the original MABEL model. These AREVA correlations and criteria are clad material and material phase dependent.
Use of an analogous basis local stress rupture limit in the M5TM and PCA-2a assessments permits a direct comparison of the results.
Separate calculations (not described here) provide comparisons of calculated behaviours for the MABEL Zircaloy-4 models and the AREVA PCA-2a creep and burst model pairing to provide additional linkage back to the MT3 and MT4 validation analysis.
Core thermohydraulic and rod conditions are setup to be analogous to those of the extant conservative minimum safeguards LBLOCA fault safety assessments.
9.3. Model changes The methodology basis is the NRU model with one RELAP5 thermohydraulic model and twelve MABEL rod instances (Figs 14–15) but the details are substantially revised:
Two basic model variants for PCA-2a and M5TM related calculations with respective rod geometry and material properties. (For example the M5TM fuel being modelled has a higher flow area).
Geometry adjusted to be consistent with the extant SZB LBLOCA model e.g. rod pitch, grid locations. The axial nodalization was adjusted to facilitate comparison with the extant Sizewell ‘B’ model.
Guide thimbles were now included (as unheated structures) in the model.
The MABEL model data were revised for the rods next to the thimbles to allow for their disparate diameter.
Boundary and initial conditions adjusted to match the extant Sizewell ‘B’ model conditions including axial power profile, radial power factor, reflood rate, decay heat, initial fluid temperature and pressure. This required some of the parameters to be tuned to include conservative pessimisms in the calculation as in the extant model analysis.
The reflood model adjustments avoid the effects of disparities between the calculated RELAP5 quench front behaviour and the analogous original pessimistic safety case calculation results on the mid height clad temperatures evaluation. This approach achieves strain rates analogous to those of the conservative safety case methodology.

321
MT3 shroud representation replaced by a bypass region analogous to the bypass region represented in the existing Sizewell ‘B’ clad ballooning model. (In the existing SZB ballooning model these rods are assumed not to balloon).
A surrogate ballooning behaviour was introduced in the MATARE model rod region outside the main ‘cruciform’ rods region to improve the match with expected plant conditions using a ballooning rod with similar power level and pin internal pressure characteristics.
MATARE eccentricity data are as described for the NRU MT-3 and MT-4 MATARE models.
9.4. Model variants
Sizewell ‘B’ assembly standard model.
Sizewell ‘B’ assembly model with burnable poison fuel, Fig. 16.
Four corners of adjacent assemblies model for Sizewell ‘B’, Fig. 17.
9.5. Calculations These calculations model a bounding postulated double ended cold leg guillotine break for the Sizewell ‘B’ plant with minimum safeguards at hot full power. 9.6. Results The calculated rod burst times, maximum strain time and axial node are compared for the different model variants in Table 6. It should be noted that the model calculations for PCA-2a, particularly the standard assembly model, terminated early due to a code algorithm convergence problem). The transient variation of the local clad strain, local equivalent stress are shown in Figs 18–19 for the PCA-2a and M5TM standard assembly model showing the lower M5TM peak strain and stress results. The corresponding axial strain profiles are shown in Fig. 20. 9.7. Eccentricity effect results There is typically a strong correlation between rod pellet eccentricity and clad burst time unless clad interaction occurs with an adjacent rod. The clad burst time and burst strain typically both reduce with increasing eccentricity. This is attributable to the higher azimuthal temperature gradients around the clad. 9.8. Trapped rods A ‘trapped’ rod can occur when four neighbouring rods touch a central rod. This causes the equivalent stress to fall rapidly. The maximum equivalent stress then moves to a different axial level. A PCA-2a related example is shown in Fig. 21 with the corresponding M5TM results. The balloon may then lengthen axially provided the equivalent stress does not reach the burst criterion level. The rod trapped location clad strain also continues to rise giving high engineering strain levels. This occurs more readily for PCA-2a in which the calculated strains are already higher. The AREVA burst criteria were developed from rupture data from rod data rather than bundle data. Consequently the correlations do not represent the effects of clad interaction between rods and the precise level of the axial extension strain arising from such trapped rods cannot be taken to be fully validated at present.

322
FIG. 18. SZB assembly standard model – local strain comparison for MABEL instances 16 and 22. Instance 16 (PCA-2a axial node 23, M5TM axial node 24). Instance 22 (PCA-2a axial node 23, M5TM axial node 24).
FIG. 19. SZB Assembly standard model – local equivalent stress comparison for MABEL instances 16 and 22. Instance 16 (PCA-2a axial node 23, M5TM axial node 24). Instance 22 (PCA-2a axial node 23, M5TM axial node 24).

323
FIG. 20. SZB assembly standard model – average pin diameter comparison for MABEL instances 16 and 22.
FIG. 21. SZB assembly standard model – local equivalent clad stress comparison for MABEL instances 14 and 17. Instance 14 (PCA-2a axial node 27, M5TM axial node 26). Instance 17 (PCA-2a axial node 28, M5TM axial node 26).

324
TABLE 6. MATARE LBLOCA SIZEWELL B ASSEMBLY LBLOCA MODEL CALCULATIONS
Standard model Burnable poison rod related model
Four assembly corners model
Cal. end time [s] 34.8 50.0 45.6 65 57.8 70 Rod identifier PCA-2a M5TM PCA-2a M5TM PCA-2a M5TM 011 (5D) Burst time (s) Max. strain (%) Max strain axial node
No burst
30.6 26
38.0
35.1 27
No burst
47.1 30
59.9
38.6 31
No burst
46.4 29
56.0
34.2 30
012 (5C) No burst 28.8
26
No burst 40.2
28
No burst 48.6
31
60.4 36.4
29
54.0 68.7
29
59.2 35.1
29013 (4E) No burst
39.4 28
35.8 34.3
26
38.5 38.2
28
57.7 34.1
25
No burst 49.7
28
58.0 34.1
31014 (4D) No burst
44.0 26
34.1 29.6
26
38.8 32.5
29
48.1 31.6
29
No burst 56.8
29
49.5 35.1 28
015 (4C) 34.8 33.4
29
36.5 29.1
26
No burst 29.7
28
57.8 30.4
29
38.6 30.3
28
45.6 28.6
28016 (4B) 23.8
30.3 23
29.5 26.7
24
34.4 25.8
26
39.9 23.3
26
35.5 25.4
27
40.6 22.9
26017 (3E) No burst
41.2 28
35.6 34.4
26
38.4 39.4
29
57.7 35.1
25
42.3 34.2
29
57.2 31.5
31018 (3D) No burst
34.7 27
37.7 34.0
28
41.8 40.0
31
57.1 34.5
31
46.6 33.8
31
57.7 30.7
31019 (3C) No burst
36.3 26
38.0 35.4
26
No burst 54.8
30
55.4 37.3
30
No burst 61.2
31
56.1 37.4
26020 (3B) No burst
38.8 28
39.5 35.2
28
No burst 73.8
28
57.3 40.1
30
No burst 65.6
31
53.2 39.6
29021 (2D) No burst
34.3 26
37.4 33.0
27
No burst 55.5
30
58.9 36.5
25
49.9 38.8
31
58.9 31.4
31022 (2C) 21.1
31.2 23
26.3 24.7
24
34.4 27.8
26
40.0 23.4
26
42.7 33.7
27
46.5 28.1
27Burst time average of rods bursting in both calculations
26.6 30.8 37.7 50.1 42.6* 51.1*
Burst strain average
31.6 26.8 34.0 30.3 32.7* 28.9*
* This average excludes burst rod 12 which uses the different MABEL ‘unrestrained’ clad model.

325
9.9. Results of SZB assembly with a burnable poison fuel pin model calculations The rod results for this model show later burst times compared to the standard model. This is attributed to the lower rod ratings and internal pressures applied in this model. These also reduce the differences in calculated burst strain levels between the PCA-2a and M5TM models. 9.10. Results of SZB four corners of adjacent assemblies model calculations Burst here is typically calculated to occur in rods at higher ratings and with low pressure. These can also be considered prototypic of limiting conditions for first dwell fuel yielding an intermediate behaviour for the average burst strain level and later average burst time due to the lower initial pressure. 9.11. Summary of results
Model Difference in average burst
strain. M5TM versus PCA-2a.
Delay in burst strain in M5TM cf.
PCA-2a [s].
Standard model -4.8% 4.2 Burnable poison rod assembly -3.6% 12.4 Four assembly corners model -3.8% 8.5
10. CONCLUSIONS
The analysis of the clad ballooning behaviour has shown a consistent pattern of differences between M5TM and PCA-2a for the set of conditions considered.
Typically the M5TM clad rods burst at lower strains than analogous PCA-2a clad rods yielding lower levels of blockage.
For equivalent initial temperatures M5TM clad typically bursts later than PCA-2a.
Difference in calculated burst strain increases with more severe conditions which is attributed to the creation of the larger clad azimuthal temperature gradients.
Difference in burst time decreases with more severe conditions as these tend to offset the differences in the fuel designs.
These results together with the findings of a range of other EDF-Energy assessment work outside the scope of this paper have supported the introduction of AREVA M5TM clad fuel at Sizewell ‘B’. Acknowledgements: The work of AMEC staff, in particular M. Trow, in support of the analysis described in this paper is hereby acknowledged.
REFERENCES [1] LIGHTFOOT, P., TROW, M., Development and application of an uncertainty methodology for
the Sizewell B large LOCA safety case, Report of a CSNI Workshop on Uncertainty Analysis Methods, NEA/CSNI/R(94)20, Part.2, Volume 2, London (1994).
[2] BRYCE, W.M., MABEL-2E, A Code to analyse cladding deformation in a loss of coolant accident, Part 1, Basic Thermal-Hydraulic Modelling, AEEW-R 2160 (1987).

326
[3] PAGE, R., JONES, J.R., Development of an integrated thermal-hydraulics capability incorporating RELAP5 and PANTHER neutronics code, Proceedings of the OECD/CSNI Workshop on Transient Thermal-Hydraulic and Neutronic Codes Requirements, OCDE/GD(97)146, NEA/CSNI/R(97)4 (1996).
[4] PAGE, R., Description of the TALINK code for linkage of codes executing in parallel, AMEC report C5166/TR/050.
[5] US NUCLEAR REGULATORY COMMISSION, RELAP5/MOD3 Code Manual NUREG CR-5335 Rev 1.
[6] AMMIRABLE, L., Coupled mechanical-thermalhydraulic multi-pin deformation analysis of a PWR loss-of-coolant accident, PhD Thesis, Imperial College, London (2003).
[7] SANCHEZ-ESPINOZA, V.H., Validation of the reflood model of the RELAP5/MOD3.2.2 gamma using experimental data from the integral facility LOFT LP-LB-1, FZKA 6426, Forschungszentrum Karlsruhe (2002).
[8] SANCHEZ-ESPINOZA, V.H., Validation of the reflood model of the RELAP5/MOD3.2.2 gamma using experimental data from the integral facility PKL-IIB.5, FZKA 6676, Forschungszentrum Karlsruhe (2002).
[9] VINOGRADOV, V.A., BALYKIN, A.Y., Analyses of KS test data on the heated rod bundle temperature behaviour in RBMK-1500 core model under stop and recovery flow using RELAP5/MOD3.2 and RELAP5/MOD3.2.2 GAMMA, NUREG/IA-0202 (2001).
[10] DEVKIN, A.S., RELAP5/MOD3.2.2 gamma assessment for down to top reflooding process at VVER like 37-rod bundle, NUREG/IA-0207 (2002).
[11] PAGE, R., RELAP5 post-CHF heat transfer revision and Studsvik test sensitivity calculations, AMEC report C6743/TR/001 Issue 02.
[12] NILSSON, L., Assessment of RELAP5/MOD3 against twenty-five post dryout experiments performed at the Royal Institute of Technology, NUREG/IA-0094 (1993).
[13] SWEET, D.W., HASTE, T.J., UKAEA calculations for the German national problem 7 – blind predictions of the REBEKA-6 clad ballooning experiment, AEEW-M 2038 (1983).
[14] SWEET, D.W., HASTE, T.J., UKAEA calculations for the International Standard problem 14 – open calculation of the REBEKA-6 clad ballooning experiment, AEEW – M 2095 (1985).
[15] SCRIVEN, A.H., BASIL calculation of the REBEKA 6 test, CEGB Report TEC/L/0550/R91. [16] US NUCLEAR REGULATORY COMMISSION, BASIL: Code Description and Programme
Guide, CEGB report TEC/L/0425/R91. [17] HASTE, T.J., Analysis of the Halden-IFA 54 × clad ballooning experiments using MABEL-2D:
Status January 1985, ND-R-1222(S) (1985). [18] HASTE, T.J., International Standard Problem 19: summary of UKAEA submission using
MABEL 2-D, ND-M-3257(S). [19] HASTE, T.J., UKAEA calculations for International Standard Problem 19 – open prediction of
the PHEBUS-218 clad ballooning experiment using MABEL-2D, ND-R-1361(S). [20] MOHR, C.L., et al., LOCA simulation in NRU program, data report for the third materials
experiment (MT-3), Battelle Pacific Northwest Laboratory, NUREG/CR-2528, PNL-4166 (1983).
[21] WILSON, C.L., et al., LOCA simulation in NRU program, data report for MT-4, NUREG/CR-3272 (1983).
[22] WILSON, C.L., HESSON, G.M., PILGER, J.P., KING, L.L., PANISKO, F.E., Large break LOCA, in-reactor fuel bundle materials test MT-6A, PNL-8829 (1993).
[23] PAGE, R., LOFT-5 models, structure and verification source document, EDF-energy report SXB-IP-0951327.

327
RADIOLOGICAL CONSEQUENCES FOR CHASHMA NPP UNIT 2 DUE TO LARGE BREAK LOCA WITHOUT ECCS AND CSS
S.A.A. RIZVI, M.A. AHMED, Q. HASNAIN, A. MINHAJ Karachi Nuclear Power Complex
Pakistan Atomic Energy Commission Karachi, Pakistan
Email: [email protected]
Abstract
For a PWR, a large break loss of coolant accident (LBLOCA) is a transient that can progress into a severe accident if adequate measures are not taken for the heat removal from the reactor core. Especially in the absence of emergency core cooling system (ECCS), it is difficult to maintain core integrity resulting in reactor pressure vessel failure and release of radionuclide to containment and consequently to environment. In this paper, a two stage methodology is presented through application of MELCOR and MACCS to model stated phenomena. A thermal hydraulic model developed for the 2-loop PWR CHASHMA NPP UNIT 2 has been analysed for the LBLOCA without ECCS and containment spray system (CSS) using MELCOR to calculate fission products released to the environment as source term coupled with MACCS to calculate the radiological consequences including atmospheric transport and dose projections. This paper presents details of an analysis carried out and their results for the CHASHMA NPP UNIT 2. 1. INTRODUCTION This paper presents an analysis for the modelling approach that has been used to calculate the postulated radiological consequences and validate the analytical work done by the designer for a 300 MW 2-loop PWR reactor, CHASHMA NPP UNIT 2 on occurrence of double ended guillotine large break LOCA in the cold leg with the provision of Passive accumulators injection but the absence of engineered safety features including safety injection system (SIS) and containment spray system (CSS). Large break LOCA can cause sustained core voiding that significantly affects core cooling, together with the exothermic Zr-water reaction and decay heat leads to the permanent core damage. This will further cause release of fission products stored in fuel and fuel–clad gap into the primary system and consequently into containment through the break. Core degradation causes relocation of the core to the lower plenum of reactor pressure vessel which may lead to the vessel failure if external vessel cooling is not applied. Once corium containing unreleased fission products is transported to the containment on vessel failure, the MCCI begins which leads to containment pressurization in absence of a CSS and may lead to containment failure causing fission products to be released into environment and consequently affecting population. Albeit natural recirculation is the part of inherent design but the incapability to remove long term core decay heat propagates an unrecoverable situation and leads to permanent core damage and as credit for cavity flooding system is not taken then reactor pressure vessel is likely to be ruptured and ultimately challenges the population nearby. The analysis has been carried out in two phases. In the first stage a model for the primary and secondary systems with containment is used for the analysis of thermal hydraulic phenomena occurring during the scenario with MELCOR 1.8.4, providing the sequence of events and the necessary environmental radionuclide release fraction to be used in the second phase. MACCS code is used in the next stage using meteorological and population data together with the output from MELCOR is to calculate radionuclide atmospheric transport and dose projection.

328
2. DESCRIPTION OF MODEL Computation of radiological consequences for CHASHMA NPP UNIT 2 is achieved using two computer codes including MELCOR1.8.4 and MACCS. Description of modelling details for each is following. 2.1. MELCOR 1.8.4 MELCOR is a fully integrated, engineering level computer code that models the progression of severe accidents in light water nuclear power plants. MELCOR models various in-vessel phenomena including meltdown of core and molten metal–water reaction; ex-vessel phenomena including the core concrete interaction and behaviour of radio nuclides in the primary and containment system. In addition to this MELCOR treats core heat up, degradation, and relocation; core concrete attack; hydrogen production, transport, and combustion; fission product release and transport; and the impact of engineered safety features on thermohydraulic and radionuclide behaviour. Current uses of MELCOR include estimation of severe accident source terms and their sensitivities in a variety of applications. 2.2. CHASHMA NPP Unit 2 MELCOR model CHSNUPP 2 is a two loop PWR with thermal power of 998.6 MW. MELCOR model is based on control volumes, flow paths, heat structure and control function packages to model basic thermal hydraulics of the plant. Core internals and heat generation is modelled using core package and decay heat package, while radionuclide package is used to model the fission product initial inventory as a function of core power profile, release of fission products from fuel degradation to the primary circuit, then to the containment from break and eventually to the environment. The nodalization of C-2 core, Primary system, secondary system and containment are represented in Figs 1–4 respectively. 2.2.1. Core nodalization Lower plenum and core regions are divided into 16 axial levels and 4 radial rings. Axial levels are numbered from the bottom up. And radial rings are numbered from the centre out with 5, 36, 48 and 32 fuel assemblies respectively. The axial and radial rings are shown in Fig. 1. The first four axial levels lie in the lower plenum region; remaining 12 axial levels are in the core region of which ten levels (6–15) define the active core. Axial levels 5 and 16 are lower and upper unheated part of the fuel assemblies respectively. 16 heat structures have been modelled for the core package. The ‘dT/dz model’ has been kept ‘on’ to account for the temperature variation of a single core control volume containing many individual core cells. Relative power is calculated at the scale of 4, using following relation given in Nuclear Design Report for CHASHMA NPP UNIT 2 [1].
Relative power of the radial ring = (∑Pi / NFA) × 4 (1) Where Pi Power of ring i; i ranges from 1–4; ∑Pi Sum of power of fuel assemblies in the radial ring; NFA Total number of fuel assemblies equals 121. Axial power is calculated by integrating the curve for axial power profile at EOL, given in Nuclear Design Report of C-2 [1].

329
2.2.2. Primary system nodalization Control volume hydrodynamics (CVH) nodalization of reactor coolant system with its subsystems and components marked as different control volumes CV-xyz is shown in Fig. 2. Following are the main components of reactor coolant system.
i. Reactor pressure vessel (RPV): CVH nodalization of RPV is shown in Fig. 2. There are seven control volumes in the RPV: down comer, lower plenum-1, lower plenum-2, core bypass, core, upper plenum and upper head.
ii. Reactor coolant piping: It includes seven control volumes in each loop: hot leg, SG u-tube rising section, SG u-tube down section, cross over leg, pump and cold leg split into two equal length to model double ended guillotine large break LOCA.
iii. Pressurizer and associated volumes: There are four volumes: pressurizer surge line, pressurizer lower, pressurizer upper and pressurizer relief tank. Currently credit of PRT has not been taken instead flow from pressurizer relief and safety valves are directly expelled to the containment.
iv. Safety injection system control volumes: safety injection system comprises of two accumulators and one RWST. Two accumulator control volumes (one for each loop) are modelled and are connected to the cold legs. The free volume of the accumulators has been increased beyond the designed volume by keeping the water volume intact. This is done to avoid gas temperature falling below freezing under adiabatic expansion during high pressure discharge of accumulator.
FIG. 1. Core nodalization.

330
FIG. 2. Primary nodalization.
2.2.3. Secondary side nodalization The secondary side nodalization of loops A and B is shown in Fig. 3.
i. Main feed water tank: main feed water tank is modelled as a time independent volume and supplies water to down comer upper portion of the steam generator. The main feed water flow is controlled through the open fraction of the valve which is controlled by a control function. The valve open fraction is a linear feedback function of the liquid level in the steam generator. Thus opening and closing of valve is controlled by the current water level in the steam generator.
ii. Steam generator: four control volumes have been used to define the secondary side hydrodynamic volume. Down comer has been divided into two volumes i.e. lower and upper portions. Shell side separator and Steam dryer and dome are the remaining control volumes. Feed water from MFW enters SG at down comer upper portion. Recirculation ratio of 3.4 has been adjusted through appropriate tuning of loss coefficients. By allowing the void fraction inside pool to raise high as 73% of the pool volume, the steady state mass of liquid in each of the two steam generators is set at 20700 kg.
iii. Main steam line and turbine: main steam line for each loop is divided into two volumes: from SG outlet to MSIV and from MSIV to the common steam header.
Turbine is modelled as a time independent volume and is connected to the common steam header of the two loops. SG pressure is maintained at 5.64 MPa by setting the turbine pressure at 5.54 MPa and by adjusting the loss coefficients of flow paths between steam lines. 2.2.3.1. Containment and environment nodalization Containment is divided into seven control volumes with total free volume of 49000 m3 as shown in Fig. 4. Free volume of RCP rooms and SG rooms is included in main equipment compartment control volume. All volume occupied by the circle aisle along with valves’ rooms and pressurizer room is included in annular region control volume. Upper compartment and dome control volume comprises of refuelling water pool, upper compartment and the hemispherical part of the containment. Environment is modelled as a single time independent control volume with atmospheric temperature and pressure.

331
FIG. 3. Secondary nodalization.
FIG. 4. Containment nodalization.
2.3. MACCS The second phase of calculation was performed with MELCOR accident consequence code system (MACCS), which is the same state of the art computer code that NRC uses to assess accident consequences. It is designed to estimate the health, environmental and economic consequences of radiation dispersal accidents. It utilizes a standard straight line Gaussian plume model to estimate the atmospheric dispersion of a point release of radionuclide, consisting of up to four distinct plumes, and well established models to predict the deposition of radioactive particles on the ground from both gravitational settling (“dry deposition”) and precipitation (“wet deposition”). From the dispersion and deposition patterns, the code can then estimate the radiation doses to individuals as a result of

332
external and inhalation exposures to the radioactive plume and to external radiation from radionuclide deposited on the ground (“ground shine”). The code also has the capability to model longterm exposures resulting from ground shine, food contamination, water contamination and inhalation of resuspended radioactive dust. The code allows the user to define the dose response models for early fatalities (EFs) and latent cancer fatalities (LCFs); For EFs, MACCS uses a 2-parameter hazard function, with a default LD50 dose (the dose associated with a 50% chance of death) of 380 rem. LCFs, MACCS uses the standard linear, no threshold model, with a dose response coefficient of 0.1 LCF/person-Sievert and a dose dependent reduction factor of 2, as per the 1991 recommendations of the International Committee on Radiological Protection (ICRP) in ICRP 60. 2.4. CHASHMA NPP Unit 2 MACCS model MACCS requires a large number of user specified input parameters. A given release is characterized by a “source term,” which is defined by its radionuclide content, duration and heat content, among other factors. This source term is extracted from MELCOR output MACCS requires the user to supply population and meteorological data, which can range from a uniform population density to a site specific population distribution on a high resolution polar grid. The shape of the Gaussian plume is determined by the wind speed, the release duration, the atmospheric stability (Pasquill) class and the height of the mixing layer at the time of the release [2]. The CHASHMA NPP Unit 2 meteorological data has been used as input to MACCS. It can range from constant weather conditions to a 120 hour weather sequence. The code can process up to 8760 weather sequences, a year’s worth and generates a frequency distribution of the results. The CHRONC model of MACCS can also be used to estime the economic damages due to the long term relocation of individuals from contaminated areas, and the cost of cleanup or condemnation of those areas. 2.4.1. Population distribution In order to accurately calculate the consequences, it is necessary to have the correct spatial distribution of population in the vicinity of the site. MACCS has the option to use a site population data file, in which the site specific population is provided on a grid divided into sixteen angular sectors. The user can specify the lengths of sectors in the radial direction. Figure 5 shows the projected population distribution for the year 2011 for 80 km radius around CHASHMA NPP Unit 2 site. From the Fig. 5 it is evident that the peak population lies in the north sector. 3. RESULT AND DISCUSSION The transient is analysed for 24 hours with MELCOR and its results are benchmarked with CHASHMA NPP UNIT 2 FSAR. During MELCOR analysis it was found that after occurrence of double ended large break LOCA, reactor trip occurred due to high containment pressure signal. In the absence of safety injection system the primary pressure dropped quickly (Fig. 8) and accumulator began injection at around 5.0 s (Fig. 10). It took 510.0 s for the beginning of core degradation as the water level in RPV fell below the bottom of active core (Fig. 12); consequently the noble gases are released to primary loop after clad failure which in turn passes through containment to the environment. Temperature of fuel rings rose continuously till it reached the failure temperature of 2500 K as shown in Figures 14, 16, 18 and 20.
333
At 2020.0 s, core support plate failed in ring-2 and by 2090.0 s it failed in the remaining rings causing debris to accumulate in the bottom head. Since the credit for cavity flooding system was not taken so debris remains in lower head and continued to heat up, till RPV lower head failed due to penetration failure at 4602.0 s causes beginning of debris mass ejection to cavity (Fig. 22). Subsequently, core concrete interaction began and caused containment pressure to rose as gases released. A deflagration spike in containment pressure (Fig. 24) is also observed due to burning of hydrogen as credit for passive autocatalytic recombiners is also not taken. The radionuclides are released to environment at the height of 10.0 m as design leakage for which source term are calculated and presented in Table 1. Figures 5–24 present the comparison of analytical work done with CHASHMA NPP Unit 2 FSAR and shows that designer’s results are in agreement with the analysis presented here. In the second phase of calculation the scenario is modelled in MACCS as a three plume release model. Source terms are taken from MELCOR output for the most significant eight classes as shown in Table 1. The first plume release begins at the time 0.155 hours after occurrence of large break LOCA and continues for almost 10 hours. Second plume is considered to begin at the end of first plume with duration of again 10 hours but the final plume is modelled for 4 hours which starts at the end of second plume. MACCS has been used to analyse six cases altogether, which includes population estimated dose equivalents for whole body (for peak population zone up to 80 km radius, i.e. North), population thyroid dose (for peak population zone up to 80 km radius), estimated dose equivalents for whole body (sector wise in peak population zone), population thyroid dose (sector wise in peak population zone), individual estimated dose equivalents for whole body (sector wise in peak population zone) and Individual thyroid dose (sector wise in peak population zone). MACCS also calculates Health effect cases results for the peak population zone. From health effect cases (Table 2), we see that there are no early injuries (Prodromal Vomit, Diarrhea, Pneumonitis, Thyroiditis, Hypothyroidism, Skin Erythema, Transepidermal) or early fatality cases within 80 km in the peak cone (North) having a total population of 323985. The total cancer fatality cases within 80 km in the peak cone are 3.3 that include lung, thyroid, breast, gi, leukemia, bone and other. The total cancer fatality cases within 10 km are 0.172 and within 4 km is 0.156 (Table 2). The estimated whole body population dose in the peak cone within 80 km is 1.82E+02 Sv (Table 3). The population thyroid dose within 80 km is 5.27E+02 Sv (Table 4). The maximum population EDEWBODY total lifetime dose (Sv) is 58.3 in the peak cone which occurs at a distance of 40–60 km, having population 128261 inclusive (Table 5). The maximum population thyroid total lifetime dose (Sv) is 89.8 in the peak cone which occurs at a distance of 40–60 km, having population 128261 inclusive (Table 6). The maximum individual EDEWBODY total lifetime dose (Sv) is 2.65E-03 in the peak cone which occurs at a distance of 20 km (Table 7). The maximum individual thyroid total lifetime dose (Sv) is 1.21E-02 in the peak cone which occurs at a distance of 2 km (Table 8).

334
FIG. 5. Double ended large break flow (C-2 FSAR [2]).
FIG. 6. Double ended large break LOCA.
0
4
8
12
16
0 20 40 60 80 100
Time(s)
Pres
sure(MPa)
FIG. 7. Primary pressure (C-2 FSAR [2]).
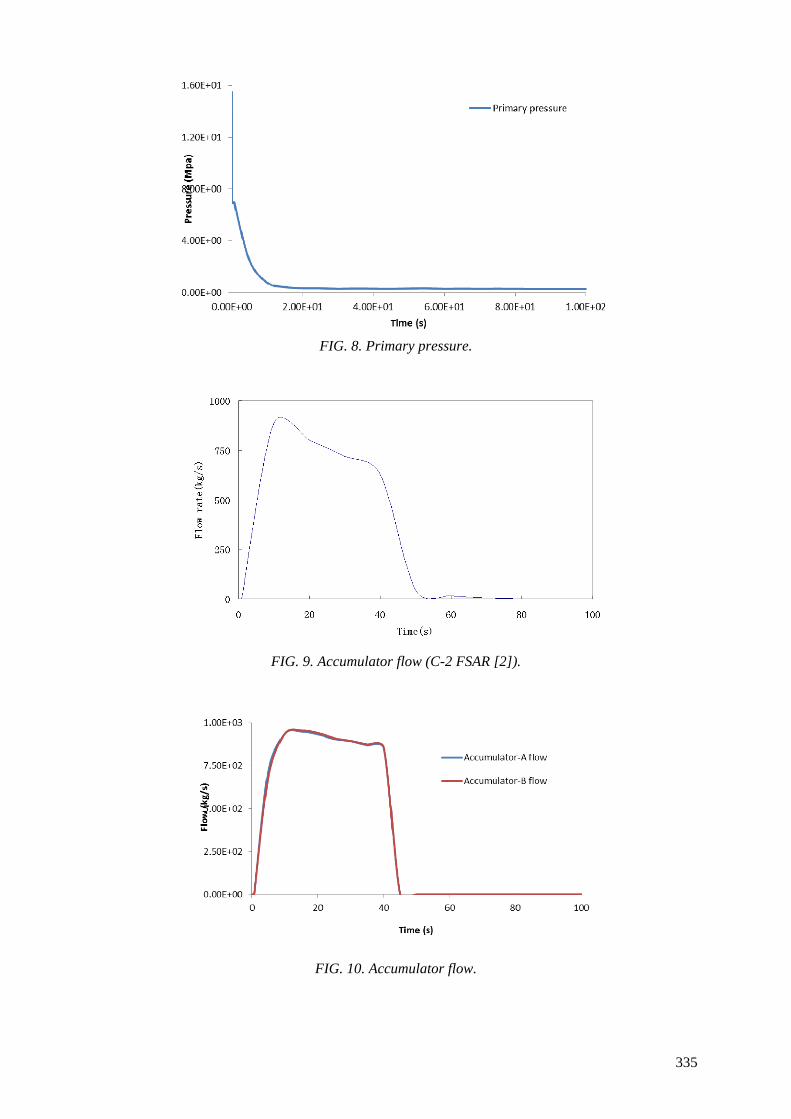
335
FIG. 8. Primary pressure.
FIG. 9. Accumulator flow (C-2 FSAR [2]).
FIG. 10. Accumulator flow.

336
FIG. 11. Reactor pressure vessel water level (C-2 FSAR [2]).
FIG. 12. Reactor pressure vessel water level.
FIG. 13. Temperature of Fuel Ring-1 (C-2 FSAR [2]).

337
FIG. 14. Temperature of Fuel Ring-1.
FIG. 15. Temperature of Fuel Ring-2 (C-2 FSAR [2]).
FIG. 16. Temperature of Fuel Ring-2.

338
FIG. 17. Temperature of Fuel Ring-3 (C-2 FSAR [2]).
FIG. 18. Temperature of Fuel Ring-3.
FIG. 19. Temperature of Fuel Ring-4 (C-2 FSAR [2]).

339
FIG. 20. Temperature of Fuel Ring-4.
FIG. 21. Debris mass ejected from RPV (C-2 FSAR [2]).
FIG. 22. Debris mass ejected from RPV.

340
FIG. 2. Containment pressure (C-2 FSAR [2]).
FIG. 24. Containment pressure.

341
FIG. 25. Projected population distribution of the year 2011 (Up to 80 KMS) of CHASHMA NPP UNIT 2. TABLE 1. SOURCE TERM CALCULATED FROM MELCOR Plume Rel.
time (hrs)
Duration (hrs)
En. release
(W)
Release fraction (-)
Xe/Kr Cs Sr/Ba I Te La Ce Ru
1 0.155 9.98 1.73 E+03
3.74 E-03
7.44 E-04
6.97 E-05
4.91 E-10
6.53E-04
2.20 E-07
4.75 E-06
6.71E-10
2 10.139 10 1.47 E+03
4.50 E-03
1.01 E-04
3.42 E-05
1.89 E-09
1.80E-04
2.26 E-08
2.95 E-07
7.36E-08
3 20.139 3.99 1.55 E+03
1.82 E-03
2.63 E-05
3.00 E-06
5.90 E-10
2.69E-05
6.99 E-09
7.51 E-08
6.09E-09

342
TABLE 2. HEALTH EFFECT CASES
Health effects Distance Mean Peak cone cases (north) ERL FAT/TOTAL 0–80.0 km 0.00E+00 0.00E+00
ERL INJ/PRODROMAL VOMIT 0–80.0 km 0.00E+00 0.00E+00
ERL INJ/DIARRHEA 0–80.0 km 0.00E+00 0.00E+00
ERL INJ/PNEUMONITIS 0–80.0 km 0.00E+00 0.00E+00
ERL INJ/THYROIDITIS 0–80.0 km 0.00E+00 0.00E+00
ERL INJ/HYPOTHYROIDISM 0–80.0 km 0.00E+00 0.00E+00
ERL INJ/SKIN ERYTHEMA 0–80.0 km 0.00E+00 0.00E+00
ERL INJ/TRANSEPIDERMAL 0–80.0 km 0.00E+00 0.00E+00
CAN FAT/TOTAL 0–80.0 km 1.28E+00 3.30E+00
CAN FAT/LUNG 0–80.0 km 1.30E-01 3.37E-01
CAN FAT/THYROID 0–80.0 km 1.39E-01 3.79E-01
CAN FAT/BREAST 0–80.0 km 3.99E-01 1.01E+00
CAN FAT/GI 0–80.0 km 3.44E-01 8.90E-01
CAN FAT/LEUKEMIA 0–80.0 km 8.94E-02 2.30E-01
CAN FAT/BONE 0–80.0 km 4.43E-03 1.15E-02
CAN FAT/OTHER 0–80.0 km 1.72E-01 4.45E-01
CAN INJ/TOTAL 0–80.0 km 3.63E+00 9.52E+00
CAN FAT/TOTAL 0–4.00 km 3.74E-02 1.56E-01
ERL FAT/TOTAL 0–10.0 km 0.00E+00 0.00E+00
ERL INJ/PRODROMAL VOMIT 0–10.0 km 0.00E+00 0.00E+00
ERL INJ/DIARRHEA 0–10.0 km 0.00E+00 0.00E+00
ERL INJ/PNEUMONITIS 0–10.0 km 0.00E+00 0.00E+00
ERL INJ/THYROIDITIS 0–10.0 km 0.00E+00 0.00E+00
ERL INJ/HYPOTHYROIDISM 0–10.0 km 0.00E+00 0.00E+00
ERL INJ/SKIN ERYTHEMA 0–10.0 km 0.00E+00 0.00E+00
ERL INJ/TRANSEPIDERMAL 0–10.0 km 0.00E+00 0.00E+00
CAN FAT/TOTAL 0–10.0 km 4.06E-02 1.72E-01 Population estimated dose equivalent whole body (radial): The following are the whole body population doses in Sievert cone wise.
TABLE 3. POPULATION ESTIMATED DOSE EQUIVALENT WHOLE BODY (RADIAL)
Population dose Distance Mean Peak cone dose (Sv)
EDEWBODY TOT LIF 0–1.0 km 0.00E+00 0.00E+00
EDEWBODY TOT LIF 0–2.0 km 6.55E-01 3.91E+00
EDEWBODY TOT LIF 0–3.0 km 1.50E+00 6.32E+00
EDEWBODY TOT LIF 0–4.0 km 1.68E+00 6.91E+00
EDEWBODY TOT LIF 0–5.0 km 1.82E+00 7.62E+00
EDEWBODY TOT LIF 0–10.0 km 1.82E+00 7.62E+00
EDEWBODY TOT LIF 0–20.0 km 2.50E+01 1.65E+02
EDEWBODY TOT LIF 0–40.0 km 5.20E+01 1.79E+02
EDEWBODY TOT LIF 0–60.0 km 6.77E+01 1.82E+02
EDEWBODY TOT LIF 0–80.0 km 7.10E+01 1.82E+02

343
Population thyroid dose (radial): The following are the whole body population thyroid doses in Sievert cone wise. TABLE 4. POPULATION THYROID DOSE (RADIAL)
Population dose Distance Mean Peak cone dose (Sv) THYROIDH TOT LIF 0–1.0 km 0.00E+00 0.00E+00
THYROIDH TOT LIF 0–2.0 km 3.98E+00 2.72E+01
THYROIDH TOT LIF 0–3.0 km 9.72E+00 4.75E+01
THYROIDH TOT LIF 0–4.0 km 1.10E+01 5.24E+01
THYROIDH TOT LIF 0–5.0 km 1.21E+01 5.83E+01
THYROIDH TOT LIF 0–10.0 km 1.21E+01 5.83E+01
THYROIDH TOT LIF 0–20.0 km 7.91E+01 4.87E+02
THYROIDH TOT LIF 0–40.0 km 1.59E+02 5.21E+02
THYROIDH TOT LIF 0–60.0 km 1.88E+02 5.25E+02
THYROIDH TOT LIF 0–80.0 km 1.93E+02 5.27E+02
Population estimated dose equivalent whole body (sector wise): The following are the whole body population doses in Sievert sector wise. TABLE 5. POPULATION ESTIMATED DOSE EQUIVALENT WHOLE BODY (SECTOR WISE)
Population dose Distance Mean Peak cone dose (Sv) EDEWBODY TOT LIF 0–1.0 km 0.00E+00 0.00E+00
EDEWBODY TOT LIF 1.0–2.0 km 6.55E-01 3.91E+00
EDEWBODY TOT LIF 2.0–3.0 km 8.48E-01 3.99E+00
EDEWBODY TOT LIF 3.0–4.0 km 1.76E-01 1.90E+00
EDEWBODY TOT LIF 4.0–5.0 km 1.45E-01 1.48E+00
EDEWBODY TOT LIF 5.0–10.0 km 0.00E+00 0.00E+00
EDEWBODY TOT LIF 10.0–20.0 km 2.32E+01 1.65E+02
EDEWBODY TOT LIF 20.0–40.0 km 2.70E+01 1.12E+02
EDEWBODY TOT LIF 40.0–60.0 km 1.57E+01 5.83E+01
EDEWBODY TOT LIF 60.0–80.0 km 3.32E+00 1.81E+01
Population thyroid dose (sector wise): The following are the population thyroid doses in Sievert sector wise. TABLE 6. POPULATION THYROID DOSE (SECTOR WISE)
Population dose Distance Mean Peak cone dose (Sv) THYROIDH TOT LIF 0–1.0 km 0.00E+00 0.00E+00
THYROIDH TOT LIF 1.0–2.0 km 3.98E+00 2.72E+01
THYROIDH TOT LIF 2.0–3.0 km 5.75E+00 3.13E+01
THYROIDH TOT LIF 3.0–4.0 km 1.26E+00 1.49E+01
THYROIDH TOT LIF 4.0–5.0 km 1.09E+00 1.07E+01
THYROIDH TOT LIF 5.0–10.0 km 0.00E+00 0.00E+00
THYROIDH TOT LIF 10.0–20.0 km 6.70E+01 4.87E+02
THYROIDH TOT LIF 20.0–40.0 km 7.97E+01 3.36E+02
THYROIDH TOT LIF 40.0–60.0 km 2.88E+01 8.98E+01
THYROIDH TOT LIF 60.0–80.0 km 5.06E+00 2.69E+01

344
Individual estimated dose equivalent whole body (sector wise). The following are the whole body individual doses in Sievert sector wise.
TABLE 7. INDIVIDUAL ESTIMATED DOSE EQUIVALENT WHOLE BODY (SECTOR WISE)
Individual dose Distance Mean Peak cone dose (Sv) EDEWBODY TOT LIF 0–1.0 km 0.00E+00 0.00E+00
EDEWBODY TOT LIF 1.0–2.0 km 3.84E-04 1.73E-03
EDEWBODY TOT LIF 2.0–3.0 km 4.17E-04 1.01E-03
EDEWBODY TOT LIF 3.0–4.0 km 1.98E-04 5.83E-04
EDEWBODY TOT LIF 4.0–5.0 km 5.95E-05 4.31E-04
EDEWBODY TOT LIF 5.0–10.0 km 0.00E+00 0.00E+00
EDEWBODY TOT LIF 10.0–20.0 km 1.22E-03 2.65E-03
EDEWBODY TOT LIF 20.0–40.0 km 6.85E-04 1.10E-03
EDEWBODY TOT LIF 40.0–60.0 km 5.54E-04 1.16E-03
EDEWBODY TOT LIF 60.0–80.0 km 1.01E-04 2.78E-04
Individual thyroid dose (sector wise). The following are the individual thyroid doses in Sievert sector wise. TABLE 8. INDIVIDUAL THYROID DOSE (SECTOR WISE)
4. CONCLUSION As a result of coupling MACCS with MELCOR for this analysis, following conclusion are drawn:
1. The radiological exposure of the population and corresponding long term health consequences due to large break LOCA without SIS and CSS are not much severe, even for individuals well outside of the 10 km. At 10 km, no early fatality cases would occur in the peak cone out of a total population of 44041 at this distance.
2. It is calculated that a total of 0.172 latent cancer fatalities (LCF) would occur in a distance from 0–10 km in a population of 4102 people living in the peak population direction of north i.e. cone#1. LCF increases to 3.3 as the distance is increased to 80 km in the peak population zone with the total population of 323985.
3. A well developed emergency plan for these individuals, including comprehensive distribution of potassium iodide throughout the entire area at risk, could be sufficient to significantly mitigate some of the health impacts if promptly and effectively carried out.
Individual dose Distance Mean Peak cone dose (Sv) THYROIDH TOT LIF 0–1.0 km 0.00E+00 0.00E+00
THYROIDH TOT LIF 1.0–2.0 km 2.31E-03 1.21E-02
THYROIDH TOT LIF 2.0–3.0 km 2.80E-03 8.02E-03
THYROIDH TOT LIF 3.0–4.0 km 1.42E-03 4.73E-03
THYROIDH TOT LIF 4.0–5.0 km 4.45E-04 3.15E-03
THYROIDH TOT LIF 5.0–10.0 km 0.00E+00 0.00E+00
THYROIDH TOT LIF 10.0–20.0 km 3.52E-03 8.02E-03
THYROIDH TOT LIF 20.0–40.0 km 2.04E-03 3.31E-03
THYROIDH TOT LIF 40.0–60.0 km 1.04E-03 1.80E-03
THYROIDH TOT LIF 60.0–80.0 km 1.54E-04 4.13E-04

345
REFERENCES [1] SHANGHAI NUCLEAR ENGINEERING RESEARCH AND DESIGN INSTITUTE, Nuclear
Design Report for CHASHMA NPP UNIT 2, Shanghai Nuclear Engineering Research and Design Institute (SNERDI), Shanghai (2005).
[2] PAKISTAN ATOMIC ENERGY COMMISSION, CHASHMA NPP UNIT 2 Final Safety Analysis Report, Pakistan Atomic Energy Commission (PAEC), Islamabad (2011).


POWER RAMP AND SEVERE ACCIDENT (Session 7)
Chairpersons
K. KAMIMURA (JNES)
V. GARAT (AREVA)


349
STATUS OF POWER TRANSIENT TEST PROGRAM ON LWR FUELS USING JMTR
J. OGIYANAGI, S. HANAWA, F. NAGASE Nuclear Safety Research Center
JAEA Ibaraki, Japan Email: [email protected]
Abstract
A power transient test program on high burnup LWR fuels which will be performed in the Japan Materials Testing Reactor (JMTR) is in progress. In the program, integrity evaluation data such as a failure threshold and irradiation behaviours (e.g. fission gas release, cladding deformation) of the fuels will be obtained under abnormal power transient condition of LWRs, and the power transient tests are planned after refurbishment of the JMTR. The tests are carried out using a special capsule type test rig, which has its own power control system under simulated LWR cooling conditions. In addition to the natural convection capsule which has been successfully used in the JMTR for BWR tests, a forced convection capsule is being developed for future tests. The program will contribute to maintain and enhance safety of light water reactors (LWRs) in long term and upgraded operations. This paper presents the outlines and status of the program. 1. INTRODUCTION Thermal and mechanical properties of fuel pellets and cladding change with burnup accumulation, and such irradiation induced change of the fuels properties depends on the fuel design, materials and irradiation conditions. Development of new cladding alloy with higher corrosion resistance and modified fuel pellets to minimize fission gas release during the operation is progressing step by step. In order to make credible safety assessment and to assure the safety operation, safety evaluation models and criteria need to be modified basing on the reliable irradiation data. A power transient test program has been launched utilizing the Japan Materials Testing Reactor (JMTR). Japan Atomic Energy Agency (JAEA) has a long experience of power transient tests of BWR fuels at the JMTR using a capsule type test facility [1–3]. Based on this experience, the capsule type new power transient test facility [4] has been prepared in the JMTR and irradiation tests will be performed to obtain fuel integrity data such as a failure threshold and irradiation behaviours (e.g. fission gas release, cladding deformation) under simulated abnormal transient conditions. In this paper, overview of the transient test facility and the status of the power transient test program of high burnup LWR fuels are described. 2. POWER TRANSIENT TEST FACILITY A schematic diagram of the power transient test facility is shown in Fig. 1. A capsule which accommodates an instrumented test fuel rod is inserted in the JMTR reactor core through the in-pile tube. The capsule is cooled by the water flowing in the in-pile tube, and the tube accommodates the He-3 gas screen to control the power of the test fuel rod. A small amount of coolant is fed to the capsule water control unit to detect fuel failure. The main features of the facility are:
- maximum of four tests can be conducted during a JMTR operating cycle by on-power capsule handling;
- the linear heat rate (LHR) can be increased from 20–100% in a minute by using the He-3 gas screen;

350
- high LHR of 57 kW·m-1 at the axial peak can be obtained for a 10 × 10 type BWR fuel rod of 70 GW·d·t-1;
- fuel failures can be detected about 15 seconds after fuel failures by the gamma-ray monitoring of capsule water.
Capsule handling device
Capsule water control unit Capsule cooling unit
Power control unit
In-pile tube
Heatexchanger
Pump
Reactorvessel
JMTRcore
Capsule storage rack
He-3Gas screen
Test fuelrod
Pump
Radiation monitorFor fuel failure
Purifier
Ion exchanger
Waste
Extra capsules
Purifier
Irradiation capsule
FIG. 1. Schematic diagram of the power transient test facility.
For power transient tests, the natural convection capsule which has enough experience in the JMTR will be used. In parallel, a forced convection capsule is being developed to improve thermal hydraulic performance to simulate the actual LWR more representatively [5]. The detailed structure of each capsule is described in the following section. 3. FUEL IRRADIATION CAPSULES 3.1. Natural convection capsule 3.1.1. Outline of the capsule A schematic diagram of the natural convection capsule is shown in Fig. 2. The instrumented test fuel rod is accommodated at the lower part of the capsule, surrounded by coolant. As online fuel instrumentations, a cladding elongation detector or a composite sensor which measures fuel internal pressure and fuel centreline temperature can be selected. The fuel rod is cooled by natural convection of the coolant, and the cladding temperature is controlled close to the saturation temperature of the coolant. Once fuel failure occurs, shutoff valves are closed to trap the fission products inside of the capsule to limit spreading of contamination. 3.1.2. Cooling capability The natural convection capsule has been used to test 8 × 8 type BWR fuel rods in the JMTR [1–3]. However, since the diameter of the candidate test fuel rod is less than that of 8 × 8 type fuel, the heat flux of the test fuel rod becomes higher than before under the same LHR. Therefore, the cooling

351
capability of the capsule was tested using a mock-up equipped with a heater rod instead of a test fuel rod under the LWR primary circuit pressure conditions; 7 MPa for BWR and 15 MPa for PWR. LHR of the heater rod was increased stepwise and the corresponding heater rod surface temperature was measured. Figure 3 shows the mock-up test result together with the critical heat flux data under pool boiling condition measured by Chichelli et al. [6]. Open circle symbols mean that the heater surface was kept under saturated boiling condition. As can be seen from the figure, the target LHR of 60 kW·m-1 of 10 × 10 type fuel, at which the surface heat flux of the fuel is around 2010 kW·m-2, was achieved preventing DNB. It is also conjectured from the literature data that a maximum LHR of about 75 kW·m-1 under PWR condition is achievable.
Fuel failuredetection line
T/C
Pressure sensor
Fuel rod
Coolant
Shutoff valve
0
500
1000
1500
2000
2500
3000
3500
4000
4500
4 6 8 10 12 14 16 18
Hea
t flu
x (
kW
/m2 )
Pressure (MPa)
Experimental-saturated boiling condition-CHF measured by
Chichelli & Bonilla6
Under saturated boiling condition
FIG. 2. Schematic diagram of the natural convection capsule.
FIG. 3. Achievable heat flux by the natural convection capsule.
3.2. Forced convection capsule 3.2.1. Outline of the capsule In order to simulate LWR fuel cooling conditions more representatively, the forced convection capsule is being developed [5]. The structure of the forced convection capsule is shown in Fig. 4. The basic structure is similar to the natural convection capsule, but this capsule is equipped with a small pump to circulate the coolant and a controllable thermal shield to control the coolant temperature in the capsule. The most important point of this structure is the magnet coupling located at the middle part in the figure, which allows us to place a driving motor away from the high temperature and high pressure water environment, avoiding a penetration of the driving shaft into the high temperature and high pressure boundary. Since the inner magnet is used under high temperature conditions, a Samarium-cobalt magnet which has excellent thermal properties is applied. The torque property of the magnet coupling at high temperature was examined by mock-up tests. Although decrements on the transmission torque appeared at high temperature, the torque was sufficient for the system. The thermal shield consists of a vacuum insulation layer located in the capsule outer tube, and the thermal performance of the shield is controlled by controlling the degree of vacuum in the layer.

352
The combination of the forced circulation system and the controllable thermal shield can realize more flexible cooling conditions.
Thermal shield
Test fuel rod
Flow shroud
Magnet coupling(inner magnet)
Impeller
Capsule outertube
Circulation pump(Magnet coupling type)
Motor
Magnet coupling(outer magnet)
FIG. 4. Structure of the forced convection capsule. 3.2.2. Cooling capability During operation of the forced convection capsule, flow rate and temperature of the coolant must be controlled appropriately to keep the fuel rod surface under sub cooled boiling condition, not only during power ramping but also before power ramping. In order to qualify the correlation between flow rate and coolant temperature to keep the fuel rod surface under sub cooled boiling condition, a mock-up test was performed. A schematic of the mock-up is shown in Fig. 5. Coolant circulation was simulated by the forced circulation system, and a heater rod was used instead of a fuel rod. The test was performed under PWR pressure of 15 MPa, and temperature at coolant inlet/outlet as well as the heater surface was measured. In the test, coolant inlet temperature and flow rate were changed parametrically under constant LHR to find the condition which gives the heater surface temperature above 342°C, i.e. saturation temperature of the coolant.
Pressure controlsystem
Capsule coolingsystem
Forced circulation system
Simulant fuel rod(Heater rod)
Heater
Flow shroud
Capsule outertube
Pump
Cooler
Coolant inlet temperaturemeasurement point
100
120
140
160
180
200
220
240
260
280
300
0 0.5 1 1.5
Min
imum
coo
lan
t tem
per
atu
re
to k
eep
the
surf
ace
tem
pera
ture
ab
ove
satu
ratio
n te
mpe
ratu
re (℃
)
Flow rate (m/s)
■:25kW/m◆:20kW/m▲:15kW/m
Dittus-Boelter (25kW/m)Dittus-Boelter(20kW/m)
Dittus-Boelter(15kW/m)
Pressure : 15MPa
FIG. 5. Schematic diagram of the thermal hydraulic test mock-up.
FIG. 6. Flow rate and coolant inlet temperature to keep the cladding temperature above 342°C.

353
The test result is shown in Fig. 6. Temperatures were also calculated based on the Dittus-Boelter equation [7] and the calculation result is plotted in the figure. As can be seen in the figure, experimental result gives lower coolant inlet temperature or higher flow rate to keep the heater surface temperature above 342°C compared to the calculation. Namely, the fuel surface temperature certainly keeps above the saturation temperature of the coolant if the experimental condition satisfies the condition given by the Dittus-Boelter equation. Based on the data obtained in this study, the forced convection capsule which can keep the fuel surface under sub cooled boiling condition is now being designed. 4. TEST PLAN The power transient tests are going to start after refurbishment of the JMTR using high burnup (up to about 75 GW·d·t-1) 10 × 10 type BWR fuel rods with new cladding alloys and pellets [8]. Performance of the rods at high power condition will be examined in the transient test facility in the JMTR using the natural convection capsule. Fuel failure thresholds, the modes and the mechanism will be investigated through the irradiation tests and related post-test examinations. Two typical examples of the expected power histories in the tests are illustrated in Fig. 7. Multi step ramp will be used for the scoping tests, before determining the thresholds by the single step ramp tests. Preconditioning irradiation for about some hours to a day would be conducted prior to the ramp tests. Rod internal pressure, fuel centreline temperature and fuel elongation would be on-line monitored in some tests to obtain transient performance data. Preparations for the reference tests are in progress. Test parameters for the ramp test are summarized in Table 1. Preconditioning power level and duration could be adjusted depending on the end of life in-reactor power of the rod and the test objectives. On-line measurements on the rod elongation, internal pressure and pellet temperature are expected to suggest the rod conditions, if it is stabilized at the power levels. TABLE 1. POWER TRANSIENT TEST PARAMETERS IN THE JMTR WITH 10 × 10 BWR FUEL
~75GWd/t
Burnup
Test powerFuel type
Cladding Pellet
Zry-2
High-Fe Zr alloy
With liner
Without liner
Standard
additive
Power level
Duration at high powers
Multi and single step power ramp~75GWd/t
Burnup
Test powerFuel type
Cladding Pellet
Zry-2
High-Fe Zr alloy
With liner
Without liner
Standard
additive
Power level
Duration at high powers
Multi and single step power ramp
Irradiated 8x8 BWR fuel test etc. are under preparation to confirm the performance of LHR evaluation and consistencyfor earlier tests.
Pre-conditioning6-24 h at 15 - 20kW/m
Pow
er
Time
Holding for 4 h at peak LHR (~60 kW/m)(in the case of no failure)
Step duration:1 hΔP= 5kW/m
Multiple step ramp
Pre-conditioning6-24 h at 15 – 20kW/m
Ramp rate25 kW/m/min
Holding a few min to 4 hat about failure level
Pow
er
Time
Single step ramp FIG. 7. Examples of expected power histories in the power transient test in the JMTR.

354
○: ~44 GWd/t△: ~56 GWd/t□: ~61 GWd/t
: Maximum cladding plastic strain calculated byFEMAXI for 70 GWd/t of 10x10 BWR fuel rod
Results in the JMTR ramp tests for8x8 BWR fuels*(*H. Hayashi et. al., J. Nucl. Sci. Technol.,
Vol. 43, No. 9, 1128-1135 (2006))
0.0
0.5
1.0
1.5
2.0
20 30 40 50 60
LHR at axial peak (kW/m)
Cla
ddin
g pl
asti
c st
rain
(%
)
FailedClosed
Not failedOpen
FailedClosed
Not failedOpen
FIG. 8. Relationship between cladding plastic strain evaluated by FEMAXI-7 and LHR of 10 × 10 BWR fuel.
FIG. 9. Relationship between peak LHR evaluated by MCNP and burnup for 10 × 10 BWR fuel rod.
In the power transient test, the cladding plastic strain would be yielded by a PCMI during a high power condition. The cladding plastic strain increases with an increase of a LHR. Experimental results obtained in the earlier JMTR ramp tests for 8 × 8 BWR fuels of burnup level of 44–61 GW·d·t-1 [9–10] are shown in Fig. 8. From the results, it is found that fuel failures occurred regardless of the burnup in the earlier ramp tests if the cladding plastic strain of about 1% was loaded during power transients. Maximum cladding plastic strain of 10 × 10 BWR fuel rod of 70 GW·d·t-1, which is a candidate in the proposed JMTR test, is calculated by the LWR fuel analysis code “FEMAXI-7” [11], and results are also shown in the figure. The cladding plastic strain in the irradiation of this fuel rod at 50 kW·m-1 is estimated at about 1%. Maximum LHR which can be obtained for 10 × 10 BWR fuel rods at various burnups in the transient test facility is calculated using MCNP-4B code. Estimated test range of the JMTR test is shown in Fig. 9 together with results in the earlier ramp tests [9–10]. It is found that the achievable LHR for these fuels is higher than the fuel failure levels obtained in the earlier ramp tests. 5. CONCLUSIONS The Japan Materials Testing Reactor (JMTR) is being refurbished and new power transient test facility has been installed. The project is intended to actively contribute solving irradiation related issues for maintaining and enhancing safety of LWRs in long term uses. The power transient tests of various fuel rods, including those with new design cladding and pellets for high duty uses, are going to start after refurbishment of the JMTR. Acknowledgement: The authors wish to thank colleagues in the Nuclear Safety Research Center and the Neutron Irradiation and Testing Reactor Center for supporting the project and for the facility preparation. A part of the program is being conducted under a contract with the Nuclear and Industrial Safety Agency of the METI.
0 10 20 30 40 50 60 700
20
40
60
80
100
Segment average burnup (GWd/t)
LH
R a
t ax
ial p
eak
(kW
/m)
FailedClosed
Not failedOpen
FailedClosed
Not failedOpen
◇:
: Maximum LHR calculated by MCNP for10x10 BWR fuel rod
8x8 BWR fuel*(*H. Hayashi et. al., J. Nucl. Sci. Technol.,
Vol. 43, No. 9, 1128-1135 (2006))

355
REFERENCES [1] UCHIDA, M., NAKAMURA, J., ICHIKAWA, M., KASHIMA, Y., SEZAKI, K., ISHII T.,
IWAI, T., Power ramp experiment of fuel rods in JMTR boiling capsules, JAERI-M 88–202 (1988).
[2] SHIMADA, S., ETOH, E., HAYASHI, H., TUKUTA, Y., A metallographic and fractographic study of outside-in cracking caused by power ramp tests, Journal of Nuclear Materials 327 (2–3) (2004) 97–113.
[3] NAKAYAMA, F., ISHII, T., NAKAZAKI, C., SEZAKI, K., ICHIHASHI Y., TANAKA T., The present situation of power ramping test at the JMTR, Proceedings of Second Asian Seminar on Research Reactors (ASRR-II), IAEA, Jakarta (1989).
[4] OGIYANAGI, J., HANAWA, S., SASAJIMA, H., NAKAMURA, J., NAKAMURA, T., KAWAMURA, H., Development of transient test facility in the Japan Materials Testing Reactor, Proceedings of 2008 Water Reactor Fuel Performance Meeting, Paper No. 8121, Seoul (2008).
[5] HANAWA, S., OGIYANAGI, J., INABA, Y., SASAJIMA, H., NAKAMURA, J., NAKAMURA, T., Newly designed capsules for fuel ramp tests in the JMTR, Proceedings of Top Fuel 2009, Paper No. 2147, Paris (2009).
[6] CHICHELLI, M.T., BONILLA, C.F., Transactions of American Institute of chemical engineer, 41 (1945) 755.
[7] DITTUS, F.W., BOELTER, L.M.K., Heat transfer in turbulent pipe and channel flow, Publications on Engineering Univ. Calif. Pubs, Vol. 2 (1930) 443.
[8] NAKAMURA, T., HANAWA, S., OGIYANAGI, J., SASAJIMA, H., NAKAMURA, J., KAWAMURA, H., Fuel irradiation test plan at the Japan Materials Testing Reactor, Proceedings of 2008 Water Reactor Fuel Performance Meeting, Paper No. 8107, Seoul (2008).
[9] TSUKUDA, Y., KAMIMURA, K., KOUNO, N., HATTORI, T., ITO, K., MOZUMI, Y., Journal of the Atomic Energy Society of Japan 45 (11) (2003) 682–710.
[10] HAYASHI, H., OGATA, K., BABA, T., KAMIMURA, K., J. Nucl. Sci. Technol. 43 (9) (2006) 1128–1135.
[11] SUZUKI, M., SAITOU, H., UDAGAWA, Y., Light water reactor fuel analysis code FEMAXI-7; model and structure, JAEA-Data/Code 2010-035 (2011) [in Japanese].


357
FISSION GAS RELEASE FROM HIGH BURNUP FUEL DURING NORMAL AND POWER RAMP CONDITIONS
M. AMAYA, J. NAKAMURA, F. NAGASE Nuclear Safety Research Center
JAEA Ibaraki, Japan Email: [email protected]
Abstract
Fission gas releases from high burnup fuel pellets were investigated by monitoring rod internal pressure changes during a re-irradiation in the Halden reactor in Norway. At the first power ramp in the re-irradiation test, while the increase of internal pressure was not clearly observed in the UO2 test rod, the internal pressures of the MOX test rods abruptly increased when the fuel centre temperatures exceeded around 800°C, which was about 200°C lower than the 1% fission gas release threshold temperature expected from its burnup dependence in the low burnup region. The size of the pellet fragments which controls fission gas release in the test rod was evaluated based on the measured fractional fission gas release, and the results indicated that grain boundary tunnels and/or micro-cracks did not significantly form even after the increase of rod inner pressures were detected in the test rods. This suggests that the abrupt fission gas release observed in the test rods was not due to the formation of grain boundary tunnels and/or micro-cracks, and the mechanism of fission gas release differed from that in the low and middle burnup region. 1. INTRODUCTION From the viewpoint of effective use of resources, burnup extension of light water reactor fuel and the use of reprocessed plutonium as mixed oxide fuel (MOX) are being promoted step by step. It is well known that a part of the fission gas generated during irradiation releases from pellet to free volume in the fuel rod. Since the released fission gas mainly consists of Kr and Xe which have quite low thermal conductivity, the fuel temperature during irradiation is affected by the amount of released fission gas. In the case that the amount of released fission gas becomes large, the fuel temperature rises and this temperature increase causes additional fission gas release from the pellet. This phenomenon is so-called positive thermal feedback, and once this phenomenon occurs, it is probable that the soundness and integrity of fuel rod are lost. In order to estimate whether or not fuel rod failure due to this phenomenon occurs, it is necessary to know fission gas release behaviour, especially in connection with the fuel temperature during irradiation. Recently, the probability has been pointed out of the increase of the amount of released fission gas and the decrease of threshold temperature at which fission gas release starts in high burnup fuel rods [1]. However, the mechanism of fission gas release in high burnup fuel rods has not been fully clarified. In this study, fission gas release behaviour of high burnup fuel pellets is investigated by performing a re-irradiation test of the high burnup fuel rods which had been base irradiated in a commercial reactor. Based on the results, fission gas release mechanism in the high burnup pellets is discussed. 2. RE-IRRADIATION TEST OF HIGH BURNUP FUEL RODS 2.1. Test fuel rods The test fuels consist of two high burnup UO2 fuel rods (10 × 10 type) irradiated in a boiling water reactor (BWR) in Switzerland and four high burnup MOX fuel rods (MIMAS, 9 × 9 type) irradiated in a BWR in Germany.

358
TABLE 1. MAIN SPECIFICATION OF THE FUEL RODS FOR THE RE-IRRADIATION TEST
Rig No. IFA-687 IFA-688 Rod No. 2 2 4 Fuel type UO2 MOX Enrichment (wt%) 4.46 – Fissile Pu content (wt%) – 5.5 Stack length (mm) 300 300 Fuel weight (g) 166 200 Burnup (GW·d·t-1) 65.5 77.5 79.2 Filler gas composition and pressure at refabrication
Ar(64%)-He(36%), 1.44 MPa Ar(95%)-He(5%), 0.5 MPa
Cladding outer diameter (mm) 9.62 10.75 Upper instrumentation Fuel thermocouple (TF) Fuel thermocouple (TF) Lower instrumentation Rod inner pressure (PF) Rod inner pressure (PF)
The test rods for the re-irradiation tests were refabricated from the full length rods. Both ends of the test rod were cut, and the pellets near these ends were removed in order to weld the upper and lower end plugs. A central hole was drilled in the fuel pellets in the test rods, and each test rod was instrumented with a fuel centreline thermocouple and also equipped with an inner pressure gauge or a cladding elongation detector. The main specifications of the test fuel rods for the re-irradiation test are summarized in Table 1. The fuel stack length was 300 mm. Each test fuel rod was equipped with a fuel centre thermocouple, and also fitted with a cladding elongation detector or a rod inner pressure gauge. Post-irradiation examinations (PIEs) were carried out after the re-irradiation test. The PIE results showed that the gap between cladding and pellet closed and the layer which bonded both materials was formed along the circumference direction for all fuel rods. It is considered that the bonding layer between cladding and pellet formed already at the start point of the re-irradiation tests in consideration of the shortness of re-irradiation test period. 2.2. Outline of the irradiation rig The re-irradiation test of the test fuels was conducted by using irradiation rigs and pressure flasks depicted in Fig. 1. UO2 and MOX fuel rods were installed in the irradiation rig called IFAs-687 and 688. Details about the irradiation rig and pressure flask etc. are described in [2]. The irradiation rigs that included the test fuel rods were irradiated in the Halden Boiling Water Reactor (HBWR) in Norway under the coolant condition shown in Table 2. Coolant temperatures and pressures during the re-irradiation test were monitored continuously and confirmed that the coolant condition well simulated that in a typical BWR throughout the irradiation test. TABLE 2. COOLANT CONDITION FOR THE IRRADIATION TEST AT THE HALDEN REACTOR
Coolant temperature (C) 280
Coolant pressure (MPa) 7.2
Coolant chemistry
Dissolved oxygen concentration (ppm) 0.2 Dissolved hydrogen concentration (ppm) 0.05
Electric conductivity (μS/cm) <0.3

359
(a) IFA-687 (for UO2 test rods). (b) IFA-688 (for MOX test rods).
FIG. 1. Layouts of the test rigs. 2.3. Irradiation conditions during base irradiation
The UO2 and MOX rods for this re-irradiation test were irradiated in commercial BWRs for 7 and 6 cycles, respectively. The detailed power histories of the fuel rods are described in [2]. 3. RESULTS The re-irradiation test was conducted for two irradiation cycles in the HBWR. At the beginning of an irradiation test, power calibration was carried out for the irradiation rig in order to determine the relationship between the thermal power of the rig and the outputs from the neutron detectors in the rig. After the power ramp test at the startup of the re-irradiation test, the HBWR was operated under steady state condition at about 18 MW during the irradiation cycles. The maximum burnups of the UO2 and MOX fuel rods reached about 72 GW·d·t-1 and 84 GW·d·t-1 at the end of the second irradiation cycle. 3.1. Rod average linear heat rate and burnup histories The histories of the average linear heat rate and burnup of the test fuel rods during the re-irradiation cycles are shown in Fig. 2. The rod linear heat rates of UO2 and MOX test rods were kept at 11–17 kW·m-1 and 15–21 kW·m-1 during the steady state operation in the re-irradiation test, respectively. 3.2. Measured temperature history Measured temperature histories of the test fuel rods during the re-irradiation test are shown in Fig. 3.

360
The measured fuel temperatures peaked at the startup of the first cycle due to the highest rod power in the whole irradiation period and gradually decreased with time. The measured fuel temperatures of UO2 and MOX test fuel rods were 600–700°C and 750–800°C during the re-irradiation test.
0
5
10
15
20
25
30
0 50 100 150 200 250 300 350
Rod 2
Ave
rag
e L
inea
r H
eat R
ate
(kW
/m)
Irradiation Time (day)
54
56
58
60
62
64
66
0 50 100 150 200 250 300 350
Rod 2
Ro
d A
vera
ge
Bu
rnup
(M
Wd
/kg
-Ox)
Irradiation Time (day)
0
5
10
15
20
25
30
0 50 100 150 200 250 300 350
Rod 2Rod 4
Ave
rag
e L
ine
r H
ea
t R
ate
(kW
/m)
Irradiation Time (day)
66
68
70
72
74
76
0 50 100 150 200 250 300 350
Rod 2Rod 4
Ro
d A
vera
ge
Bu
rnu
p (
MW
d/k
g-O
x)
Irradiation Time (day)
(a) (b)
FIG. 2. Histories of average linear heat rate (a) and burnup (b) during the re-irradiation test.
200
400
600
800
1000
1200
0 50 100 150 200 250 300 350
Rod 2
Me
asu
red
Fu
el T
em
pe
ratu
re (
o C)
Irradiation Time (day)
200
400
600
800
1000
1200
0 50 100 150 200 250 300 350
Rod 2Rod 4
Me
asu
red
Fu
el T
em
per
atu
re (
oC
)
Irradiation Time (day)
FIG. 3. Measured fuel temperature histories during the re-irradiation test. 3.3. Rod inner pressure history Rod inner pressure histories of the test fuel rods during the re-irradiation test are shown in Fig. 4. In the second re-irradiation cycle, sudden increase of the inner pressure of UO2 test fuel rod 2 was
MOX MOX
UO2 UO2
MOX UO2
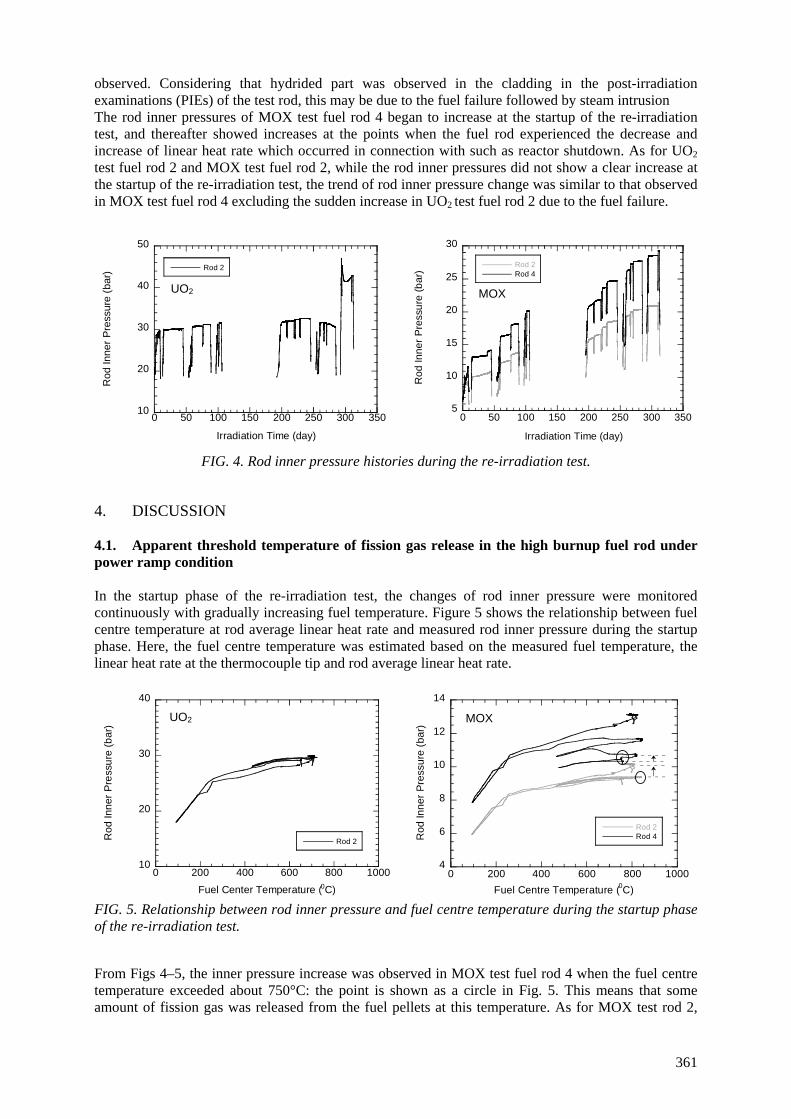
361
observed. Considering that hydrided part was observed in the cladding in the post-irradiation examinations (PIEs) of the test rod, this may be due to the fuel failure followed by steam intrusion The rod inner pressures of MOX test fuel rod 4 began to increase at the startup of the re-irradiation test, and thereafter showed increases at the points when the fuel rod experienced the decrease and increase of linear heat rate which occurred in connection with such as reactor shutdown. As for UO2 test fuel rod 2 and MOX test fuel rod 2, while the rod inner pressures did not show a clear increase at the startup of the re-irradiation test, the trend of rod inner pressure change was similar to that observed in MOX test fuel rod 4 excluding the sudden increase in UO2 test fuel rod 2 due to the fuel failure.
10
20
30
40
50
0 50 100 150 200 250 300 350
Rod 2
Ro
d In
ne
r P
ress
ure
(b
ar)
Irradiation Time (day)
5
10
15
20
25
30
0 50 100 150 200 250 300 350
Rod 2Rod 4
Ro
d In
ne
r P
ress
ure
(b
ar)
Irradiation Time (day) FIG. 4. Rod inner pressure histories during the re-irradiation test.
4. DISCUSSION 4.1. Apparent threshold temperature of fission gas release in the high burnup fuel rod under power ramp condition In the startup phase of the re-irradiation test, the changes of rod inner pressure were monitored continuously with gradually increasing fuel temperature. Figure 5 shows the relationship between fuel centre temperature at rod average linear heat rate and measured rod inner pressure during the startup phase. Here, the fuel centre temperature was estimated based on the measured fuel temperature, the linear heat rate at the thermocouple tip and rod average linear heat rate.
10
20
30
40
0 200 400 600 800 1000
Rod 2Ro
d In
ne
r P
ress
ure
(b
ar)
Fuel Center Temperature (0C)
4
6
8
10
12
14
0 200 400 600 800 1000
Rod 2Rod 4R
od In
ne
r P
ress
ure
(b
ar)
Fuel Centre Temperature (0C)
FIG. 5. Relationship between rod inner pressure and fuel centre temperature during the startup phase of the re-irradiation test. From Figs 4–5, the inner pressure increase was observed in MOX test fuel rod 4 when the fuel centre temperature exceeded about 750°C: the point is shown as a circle in Fig. 5. This means that some amount of fission gas was released from the fuel pellets at this temperature. As for MOX test rod 2,
MOX UO2
MOX UO2

362
while inner pressure increase could not be clearly observed in the same period, the inner pressure increase was detected when the reactor restarted after the first shutdown after startup: the point is shown as a circle in Fig. 5. This indicates that fission gas release occurred in the last temperature excursion. Since it is estimated the fuel centre temperature reached the highest value of about 850°C in this period, it is likely that fission gas release occurred near this temperature in MOX test rod 2. Based on these results, it is considered that apparent threshold temperature for fission gas release lies in the range 750–850°C for high burnup MOX rods. On the other hand, fission gas release could not be clearly observed in the UO2 test fuel throughout the re-irradiation test. The threshold temperature for fission gas release during fuel irradiation has been investigated in the low and middle burnup region, and a formula which expresses a burnup dependence of the threshold temperature of 1% fission gas release was obtained [3]. The formula is expressed as follows:
)0.5ln(
9800
BT
(1)
Where T is the threshold temperature of 1% fission gas release in °C; B is the burnup in MW·d·t-1 oxide. According to this formula, the threshold temperature for fission gas release is estimated to be about 1030°C around a burnup of 77 GW·d·t-1. It is found that the apparent temperature threshold obtained from the re-irradiation test is about 200°C lower than this estimated temperature. This difference suggests that it is not appropriate to express the threshold temperature of fission gas release by using Equation (1) in the case of the high burnup fuel rods. 4.2. Fission gas release mechanism in the high burnup fuel pellet under normal and power ramp conditions As seen in Fig. 4, the inner pressures of both MOX test rods 2 and 4 increased when their linear heat rates fell and rose. Slight increase of the inner pressure of UO2 test rod 2 was also observed following reactor shutdown before fuel failure occurred. These indicate that the fission gas released from the pellets could not pass through the gap in the fuel rod under on power conditions, and could reach the PF instrument only when the gap opened following fuel rod power decrease. Consequently, it is considered that the difference between the rod inner pressure just before rod linear heat rate decreased and that just after returning to the same level of rod linear heat rate corresponds to the amount of the fission gas released during the corresponding on-power period. Fractional fission gas release (FGR) was evaluated as a ratio of the amount of fission gas released during the re-irradiation against that generated during irradiation. Here, the amount of released fission gas was estimated from the rod inner pressure change which was observed when rod linear heat rate fell following for example reactor shutdown and return to nearly the same linear heat rate. Regarding the amount of fission gas generated in the test fuel rod during irradiation, the amount of generated fission gas including helium was estimated by using a burnup calculation code, ORIGEN2 [4–5], at the point when the rod linear heat rate began to fall because the release effect of the helium gas generated by the alpha decay of plutonium cannot be ignored on the rod inner pressure increase particularly in the MOX fuel rod. Figure 6 shows the relationship between on-power duration and fractional fission gas release for each period. It can be seen in the figure that the fractional fission gas releases tend to increase with increasing on-power duration. This suggests that fission gas release occurred without the formation of release path such as grain boundary tunnels and micro-cracks. Since the diffusion of fission gas atoms occurs in crystal grains before being released from the pellet, it is quite reasonable to investigate the effect of fission gas atom diffusion on the fission gas release in

363
the high burnup fuel pellets. In addition, the recoil effect on fission gas release should be taken into account because a part of fission gas releases directly from the pellet surface by fission. Assuming that a crystal grain (or a pellet fragment) is a sphere with a radius of r, and fission gas released from the region near the surface of the grain (or pellet fragment) with a thickness of Δr, the fractional fission gas release by diffusion, Fd, can be simply estimated as:
34
3Δ4343
33
r
rrrπFd
. (2)
If the radius r is sufficiently larger than the thickness Δr, the Fd can be approximated as follows:
r
rFd
Δ3 . (3)
Since the thickness Δr corresponds to the diffusion distance of fission gas which is expressed as a function of the diffusion coefficient of fission gas, D, and the square root of diffusion time, t, that is the on-power duration; Equation (3) can be expressed as:
tDr
F 43
d. (4)
On the other hand, the fractional fission gas release by the recoil effect, Fr, may be expressed as [6]:
RtfFr Δ , (5) Where f is the fission density in the fuel pellet; Δt is the on-power duration; R is the coefficient related to the effective range of fission gas release by recoil and the surface–
volume ratio of crystal grains and/or pellet fragments. In the case of steady state fuel power conditions such as this re-irradiation test, since the term ΔB can be expressed as a form proportional to the on-power duration, Equation (5) is rewritten as: RBFr Δ~ . (6) Consequently, the measured fractional fission gas release, Fmeas, can be expressed as:
drmeas FFF tAtA 21 , (7)
Where A1, A2 are coefficients. The regression results by Equation (7) are presented in Fig. 6 as the broken lines, and are summarized in Table 3. The size of the crystal grain and/or pellet fragments from which fission gas releases may be estimated from the regression results because a value of the coefficient A2 in Equation (7) corresponds to the value of 6 D1/2 × r-1. The diffusion coefficients of fission gas in the high burnup fuels during irradiation were evaluated by using a gas flow measurement [7]. The reported diffusion coefficients lie in the range between 10-21–10-19 m2·s-1 in the burnup range around 70 MW·d·kg-1 oxide, namely ~80 GW·d·t-1. The values of the coefficient A2 are (4–5) × 10-4 day1/2, and using these values, the

364
radius of the sphere corresponding to the crystal grain and/or pellet fragments is evaluated as 0.1–1 mm. This size is close to that of pellet fragments in the test fuel rods observed in their PIEs. Although it is possible that plutonium agglomerates have some effects on the fission gas release from the high burnup MOX pellets used in this study, it is considered that the effects are quite small based on the following: plutonium agglomerates with a diameter above 0.1 mm are hardly seen in the MOX pellets in the test rods for this study; since the size of the pellet fragments is sufficiently larger than that of plutonium agglomerates, the pellet fragments can be treated as homogeneous material. TABLE 3. REGRESSION RESULTS BY USING EQUATION (6)
Rig no. Rod no. Coefficient (× 10-4)
A1 (day-1) A2 (day-1/2) UO2 Rod 2 -0.2 ± 0.5 4 ± 2
MOX Rod 2 0.4 ± 0.5 4 ± 2 Rod 4 0.8 ± 0.7 5 ± 3
0.0
0.2
0.4
0.6
0.8
1.0
0 5 10 15 20 25 30 35
UO2 (rod 2)MOX (rod 2)MOX (rod 4)
Me
asu
red
FG
R (
%)
On-power duration (day) FIG. 6. Relationship between FGR and on-power duration during the re-irradiation test.
In the low and middle burnup region, it is well known that sudden fission gas release occurs following the formation of grain boundary tunnels at high temperature, and the threshold temperature at which a large amount of fission gas begins to release is determined. In this case, the surface area of fuel pellet should increase due to grain boundary tunnel formation, and according to the reference [7], the radius of the pellet fragment (or grain) decreases to less than 30 μm after grain boundary tunnels formed. Since the size of pellet fragments estimated in this study is 0.1–1 mm, it is probable that a sufficient amount of grain boundary tunnel had not formed in the pellets of this study during the re-irradiation test. Consequently, the mechanism of fission gas release in the test rods differs from that in the low and middle burnup region, and it should be cautioned that a temperature at which apparent fission gas release was detected in this re-irradiation test does probably not correspond to the threshold temperature of fission gas release in the low and middle burnup region. In other words, it may not be appropriate that the threshold temperature formula of fission gas release which has been proposed in the low and middle burnup region is applied to and compared with the threshold temperature data obtained in this re-irradiation test. The reason why the threshold temperature of fission gas release was observed in this re-irradiation test may be explained by the amount of fission gas accumulated in the cracks and/or gap in the fuel pellets: there may be a gas pressure threshold at a gap above which the released fission gas can pass through narrow cracks and/or gap and flow into the plenum region of the fuel rod.

365
5. CONCLUSIONS Fission gas release from high burnup fuel pellets was investigated by monitoring rod internal pressure changes during the re-irradiation in the Halden boiling water reactor. The test rods used were prepared from the fuel rods irradiated in commercial reactors, and the maximum burnup of the test fuels was about 80 GW·d·t-1. In the startup phase in this re-irradiation test, the internal pressures of the test rods, particularly MOX test rods, began to show abrupt increases when the fuel centre temperatures exceeded around 800°C. This temperature level was about 200°C lower than the threshold temperature of 1% fission gas release which is extrapolated from its burnup dependence in the low and middle burnup region. Fractional fission gas releases were evaluated from the amount of fission gas generated during irradiation and the rod inner pressure change just before rod linear heat rate decreased and that just after returning to nearly the same level of rod linear heat rate. Based on the measured fractional fission gas releases and the diffusion coefficient of fission gas in the pellet, the pellet fragment size which controls fission gas release in the test rod was evaluated. Since the evaluated pellet fragment size was close to the size of the pellet fragment observed in the ceramographs of the test rods, it seemed that grain boundary tunnels and/or micro-cracks did not form significantly even after fission gas release was detected in the test fuel rods. These tendencies are different from those observed in the low and middle burnup region because grain boundary tunnels form considerably when fission gas releases from the pellets in the latter case. Accordingly, the mechanism of fission gas release in the test rods differs from that in the low and middle burnup region, and it is probably not adequate to compare both threshold temperatures of fission gas release directly. Considering that the gap between pellet and cladding closed under on-power conditions in the case of high burnup fuel, there may be a gas pressure threshold at a gap above which the released fission gas can pass through narrow cracks and/or gap and flow into the plenum region of fuel rod. Acknowledgments: The present study was conducted as a part of the program sponsored and organized by the Nuclear and Industrial Safety Agency, Ministry of Economy, Trade and Industry. The authors would like to acknowledge and express their appreciation for the efforts devoted by members of the OECD Halden Reactor Project.
REFERENCES [1] VOLKOV, B., TVERBERG, T., Study of fission gas release from BWR fuel in IFA-700.4,
HWR-923, Halden Reactor Project (2010). [2] NAKAMURA, J. et al., Thermal conductivity change in high burnup MOX fuel pellet, J. Nucl.
Sci. Technol. 46 (2009) 944. [3] VITANZA, C., et al., Fission gas release from UO2 pellet fuel at high burnup, Proc. Am. Nucl.
Soc. Topical Mtg on Light Water Reactor Fuel Performance, Portland, OR (1979) 361–366. [4] CROFF, A.G., ORIGEN2 – A revised and updated version of the Oak Ridge isotope generation
and depletion code, ORNL-5621 (1980). [5] LUDWIG, S., B., CROFF, A., G., Revision to ORIGEN2 – Version 2.2, Transmittal memo of
CCC-0371/17, Oak Ridge National Laboratory (2002). [6] OLANDER, D., R., Fundamental aspects of nuclear fuel elements, TID-26711-P1 (1976). [7] AMAYA, M., et al., Changes of the surface-to-volume ratio and diffusion coefficient of fission
gas in fuel pellets during irradiation, J. Nucl. Mater. 402 (2010) 108.


367
INVESTIGATION OF VVER 1000 CORE DEGRADATION DURING SBO ACCIDENT SCENARIO IN CASE OF PRESSURIZER SV STUCK IN OPEN POSITION
P. GROUDEV, A. STEFANOVA, R.GENCHEVA EDF-Energy
Gloucester, UK Email: [email protected] Presented by Robert Page
Abstract
This paper presents the work performed at the Institute for Nuclear Research and Nuclear Energy (INRNE) in the frame of the SARNET2 project. The performed work continues the effort in modelling reactor core behaviour during severe accidents such as station blackout (SBO) sequence for VVER 1000 reactors based on parametric study. The work is oriented on investigation of overheated reactor core behaviour in case of reflooding by high pressure injection system (HPIS) at different stages and gives the preliminary results for the ASTEC V2 validation as well as analytical validation of severe accident management guidance (SAMG) for VVER 1000 reactors. An SBO scenario for investigation of VVER 1000 reactor core behaviour has been used with the assumption of opening the pressurizer safety valve and staying in open position, which induces additionally small break LOCA. Based on the previously performed work at the INRNE for the same scenarios a proper time for initiation has been chosen a proper time for initiation of HPP injection. For selected scenario consequently has been performed calculations vary the value of selected parameters. It has been selected the following parameters: porosity (PORO), velocity of molten mixture when crossing a grid (VGRI), etc. It has been investigated the influence of spherical and elliptical “bottom head and lower plenum” modelling on core degradation progression. 1. PURPOSE OF THE PRESENTATION This presentation is focused on the work performed in INRNE in the frame of the Joint Program Activity 2 (JPA2) in the Severe Accident Research European Network of Excellence 2 (SARNET2). The performed work continues the effort of modelling accident scenarios for VVER 1000 reactors such as station blackout (SBO) with opening the pressurizer safety valve and staying in open position which involves additional loss of coolant (LOCA). The presented analyses are performed by an integral code ASTEC V2 (accident source term evaluation code) jointly developed by IRSN and GRS. The calculations are carried out on a PC with a Windows XP operating system. The work is oriented on investigation of a reactor core behaviour at late in-vessel phase in case of late reflooding by HPIS and gives preliminary results for the ASTEC V2 validation based on parametric study. An SBO scenario has been chosen, for the investigation of VVER 1000 overheated reactor core behaviour in case of reflooding by HPP at late in-vessel phase. Based on previously performed work for the same scenarios a time has been determined for HPP injection, performing parametric study. For the selected scenario calculations have been performed, varying the value of selected parameters to observe the influence of those parameters on core degradation progression. The selected parameters that have been investigated are: porosity (PORO), velocity of molten mixture when crossing a grid (VGRI) etc. The influence of spherical and elliptical “bottom head and lower plenum” modelling on core degradation progression, has been investigated too.

368
2. BRIEF DESCRIPTION OF VVER 1000 NUCLEAR POWER PLANT The reference power plant design for this analysis is the unit 6 at Kozloduy NPP site. This plant is a VVER 1000 Model V320 pressurized water reactor. The basic design of a VVER 1000 plant comprises a pressurized water reactor that produces 3000 MW thermal power with four primary loops; and one turbine generator that produces 1000 MW electric power. The reactor vessel has 4 inlet nozzles (Ø 850 mm) and 4 outlet nozzles (Ø 850 mm) to connect to the four primary loops. There are also 4 inlets (Ø 280 mm) for safety injection of boron solution to the upper and lower plenum in case of primary loss of coolant. Each loop includes one main circulation pump and a horizontal u-tube steam generator. Under normal operating conditions the primary coolant system function consists of forced circulation using the full or partial set of MCPs. The behaviour of the horizontal SG is very different compared to the Western style vertical SG. Steam generators play very important roles in the safe and reliable operation of VVER power plants. They determine the thermohydraulic response of the primary coolant systems during operational and accident transients. The transients’ response of horizontal SGs can be very different than that of Western type vertical SGs due to the larger water mass in horizontal SGs. Configuration schemes with geometric dimensions and elevations are shown in Figs 1–2.
FIG. 1. Containment main equipment layout YA1.

369
FIG. 2. Containment ECCS pipelines (active part).
3. SHORT DESCRIPTION OF THE VVER 1000 PLANT ASTEC V2 MODEL The ASTEC input file includes the modules CESAR, ICARE, SOPHAEROS and CPA. All ASTEC modules have been used in a “coupled mode”. No other modules are involved as the study is specific to the in-vessel phase of the accident. The CESAR module simulates the thermohydraulics in the primary and secondary sides and in the reactor vessel up to the start of core uncovering. The developed ASTEC model describes the main components of VVER 1000. The reactor coolant system (RCS) model presented in Fig. 3 includes the major components of the primary and partially secondary sides. Each one of primary four loops has been modelled independently by 7 volumes and 8 junctions representing hot leg, SG’s hot collector, SG’s tubes, SG’s cold collector, cold leg (presented by three parts) and a main coolant pump (MCP). The pressuriser with his three safety valves and surge line has been modelled, too. The reactor vessel structures are modelled with the ICARE module which includes reactor core, baffle, the cylindrical part of the barrel, vessel and fuel assembly supports. The core is divided in axial and radial direction (ten nodes in axial direction and five rings in radial direction, including baffle and barrel). The Upper plenum has been modelled by two volumes. Downcomer and lower plenum have been modelled also. The bypass coolant path is organized with the thermohydraulic components of the ICARE module. The structural material of the baffle and barrel are modelled with the shroud macro component.

370
Two accumulators have been represented by accu1&2 and connected to upper plenum. The other two accumulators have been connected to downcomer and they are represented by accu3&4. The ICARE module is assumed to start when either the void fraction in the core vessel or the fuel temperature reach a threshold value (xalfa ≥ 0.99 or Tsteam ≥ 620.0 K).
FIG. 3. Nodalization scheme of ASTEC input model — reactor vessel and primary circuit. The 1st ASTEC V2 version has been released in July 2009 by IRSN and GRS. Two important evolutions in physical modelling are done in V2 compare to V1 which are the implementation of the ICARE module (directly issued from the mechanistic ICARE2 IRSN code) for in-vessel core degradation and, the new capabilities of the MCCI (Molten-Core-Concrete-Interaction) module MEDICIS. The ICARE module describes the in-vessel degradation phenomena for both earlier and late degradation phases. ICARE allows for the simulation of the early phase of core degradation with fuel rod heat-up, ballooning and burst, clad oxidation, fuel rod embrittlement or melting, molten mixture candling and relocation, etc. and then the late phase of core degradation with corium accumulation within the core channels and formation of blockages, corium slump into the lower head and corium behaviour in the lower head until vessel failure. The reactor coolant system modelled by ASTEC code includes the major components of the primary and secondary sides, as well as the necessary safety injection systems.
4. INITIAL AND BOUNDARY CONDITIONS
In the tables below (Table 1 and Table 2) the main initial plant parameters compared to steady state parameters of ASTEC model are given.
The following assumptions have been made:
In the presented analyses hydro accumulators are assumed to fail.
After opening the SV (Sempell) pressurizer is stuck in open position at his set point.

371
Failure of BRU-As.
Failure of all LPPs and two of HPPs after DG is available.
Dry out of SGs at natural circulation by SG SVs.
Failure of emergency feed water (EFWP) pumps after DG is available.
MCPs seal leakages have not been taken into account.
One HPP is available at 16000 sec and starts to inject in cold leg at that time.
TABLE 1. MAIN INITIAL PARAMETERS
Parameters Design value ASTEC value
Core power, MW 3000 3000
Primary pressure, MPa 15.7 15.7
Average coolant temperature at reactor outlet,°C 320.15 320.55
Maximum coolant temperature at reactor inlet,°C 290.0 290.35
Mass flow rate through one loop, kg/s 4400.0 4363.1
Pressure in SG, MPa 6.27 6.418
Pressure in MSH, MPa 6.08 6.38
Steam mass flow rate through SG, kg/s 408 409.6
TABLE 2. SEMPELL CHARACTERISTIC
SEMPELL characteristic Design value ASTEC value
SEMPELL1 opening pressure, MPa 18.11 18.11
SEMPELL1 closing pressure, MPa 16.67 –
SEMPELL2,3 opening pressure, MPa 18.6 18.6
SEMPELL2,3 closing pressure, MPa 17.07 –
5. RESULTS FOR STATION BLACKOUT CALCULATIONS The ASTEC V2 computer code has been applied for the station blackout (SBO) scenario. The analysis focuses only on the “in-vessel phase” of the accident (up to the lower head vessel failure). It is assumed opening and stuck open of pressurizer safety valve — it failed in open position after reaching his pressure set points for opening. The set point for opening and closing of pressurizer safety valves are listed above. After the initiating of station blackout the main coolant pumps stop and it is initiated reactor SCRAM. Decay heat is removed from the core by natural circulation. Heat is transferred to the secondary side and removed via ”steam dump” to the atmosphere. The secondary pressure oscillates between the opening and closing pressure thresholds of the steam dump to atmosphere (SDA). As a consequence, primary pressure is also oscillating according to the secondary pressure. The primary pressure essentially increases after SGs are not effective and pressurizer safety valve open at it set point and stuck in fully open position. The primary pressure starts to decrease rapidly due to loss of coolant through the safety valve.

372
As the main goal in this analyses is the investigation of overheated fuel behaviour during water injection by a high pressure pump at late in-vessel phase of core degradation, calculations have been used done in JPA1 for the selection of time for initiating the injection. Based on performed work for the same SBO scenario a time for initiation of HPP injection has been chosen significantly far from the time of vessel failure observed in the case without injection; not able to cool down successfully the damaged reactor core. The results from previously performed calculations are presented in the Table 3. As it is seen from the results (selected injection time 16000 s), earlier injection of water is effective in preserving reactor pressure vessel to fail. TABLE 3. RESULTS FROM JPA1 — COMPARISON OF MAIN EVENTS DURING SBO IN VVER 1000
No Events
SBO HPIS starts
at 14000 s time, s
SBO HPIS starts
at 16000 s time, s
SBO HPIS starts
at 17000 s time, s
SBO without HPIS
time, s
1 Initiating event – SBO 0.0 0.0 0.0 0.0 2 MCPs are switched off 1.6 1.6 1.6 1.6 3 Reactor scram 2.1 2.1 2.1 2.1 4 Turbine stop valves (TSVs) are closed 6.25 6.25 6.25 6.25 5 Start of ICARE – automatic start 7776.2 7776.6 7776.6 7776.6 6 Start of structural material release 7815.1 7815.1 7815.1 7815.1 7 Beginning of oxidation 7953.6 7953.6 7953.6 7953.6 8 First cladding creep rupture 9022.6 9022.6 9022.6 9022.6 9 Start of FPs release from fuel pallets 9023.6 9023.6 9023.6 9023.6 10 First material slump in lower plenum 10152.9 10152.9 10152.9 10152.9 11 First total core uncovery 10980.9 10980.9 10980.9 10980.9 12 Melting pool formation in the core 11839.8 11839.8 11839.8 11839.8
13 First slump of corium with FPs in lower plenum
– 15563.6 15563.6 15563.6
14 Start of one HPP to inject in primary side 14000.0 16000.0 17000.0 – 15 Lower head vessel failure – 18852.5 18203.2 18206.4
After selecting time for HPP injection, consequently calculations with a varied value of parameters were done, to observe the influence of those parameters on core degradation progression. The study includes estimation of influence of porosity on progression of core degradation. The following value of porosity have been investigated:
PORO = 0.01; 0.03; 0.06; 0.08; 0.12; 0.24. As a base for further investigation has been taken value for porosity: PORO = 0.06 As it is seen from Table 4 the progression of core damage and relocation depend of PORO value:
For small value it is observe “first slump” of corium with FPs in lower plenum to happen before formation of melting pool in the core, while for bigger values it is opposite.
With increasing of the value it is observe earlier failure of reactor vessel.
Total corium of mass at bottom is increased with increasing of value of PORO. The progresion of relocation of corium mass to the lower bottom head of reactor vessel are shown on Figs 4–9.
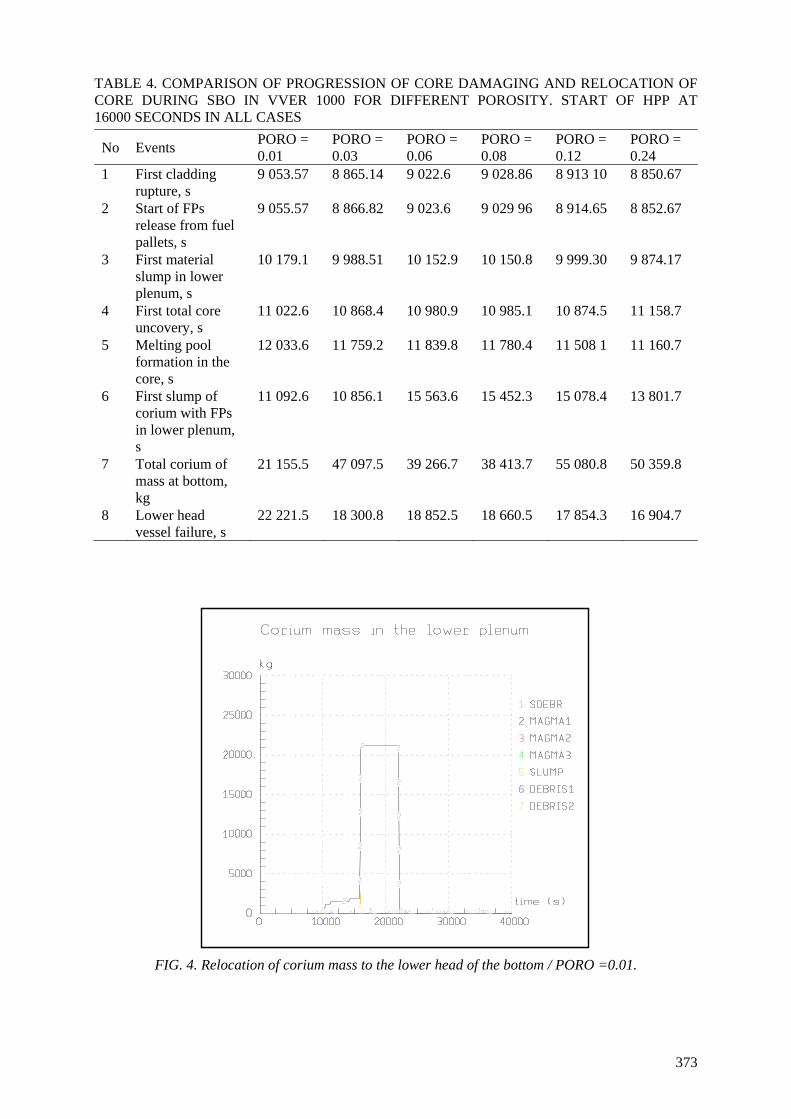
373
TABLE 4. COMPARISON OF PROGRESSION OF CORE DAMAGING AND RELOCATION OF CORE DURING SBO IN VVER 1000 FOR DIFFERENT POROSITY. START OF HPP AT 16000 SECONDS IN ALL CASES
No Events PORO = 0.01
PORO = 0.03
PORO = 0.06
PORO = 0.08
PORO = 0.12
PORO = 0.24
1 First cladding rupture, s
9 053.57 8 865.14 9 022.6 9 028.86 8 913 10 8 850.67
2 Start of FPs release from fuel pallets, s
9 055.57 8 866.82 9 023.6 9 029 96 8 914.65 8 852.67
3 First material slump in lower plenum, s
10 179.1 9 988.51 10 152.9 10 150.8 9 999.30 9 874.17
4 First total core uncovery, s
11 022.6 10 868.4 10 980.9 10 985.1 10 874.5 11 158.7
5 Melting pool formation in the core, s
12 033.6 11 759.2 11 839.8 11 780.4 11 508 1 11 160.7
6 First slump of corium with FPs in lower plenum, s
11 092.6 10 856.1 15 563.6 15 452.3 15 078.4 13 801.7
7 Total corium of mass at bottom, kg
21 155.5 47 097.5 39 266.7 38 413.7 55 080.8 50 359.8
8 Lower head vessel failure, s
22 221.5 18 300.8 18 852.5 18 660.5 17 854.3 16 904.7
FIG. 4. Relocation of corium mass to the lower head of the bottom / PORO =0.01.

374
FIG. 5. Relocation of corium mass to the lower head of the bottom / PORO =0.03.
FIG. 6. Relocation of corium mass to the lower head of the bottom / PORO =0.06.
FIG. 7. Relocation of corium mass to the lower head of the bottom / PORO =0.08.

375
FIG. 8. Relocation of corium mass to the lower head of the bottom / PORO =0.12.
FIG. 9. Relocation of corium mass to the lower head of the bottom / PORO =0.24. The progression of core damaging and relocation of the core during SBO in VVER 1000 for different velocities of molten mixture when crossing a grid (parameter VGRI) is presented below in Table 5. TABLE 5. INVESTIGATION OF INFLUENCE OF PARAMETER IN CANDLING BLOCK
No Events VGRI = 0.01 VGRI = 0.1
1 First cladding rupture, s 9 022.6 9 022.6
2 Start of FPs release from fuel pallets, s 9 023.6 9 023.6
3 First material slump in lower plenum, s 10 152.9 10 152.9
4 First total core uncovery, s 10 980.9 11 060.7
5 Melting pool formation in the core, s 11 839.8 11 364.6
6 First slump of corium with FPs in lower plenum, s 15 563.6 15 403.2
7 Total corium of mass at bottom, kg 39 266.7 39 732.1
8 Lower head vessel failure, s 18 852.5 18 441.7

376
The influence of lower plenum and bottom head on core degradetion using spherical and elliptical models was modelled. Melting pool formation in the core in both cases with spherical and elliptical bottom is appearin at around 11800 s. First slump of corium with FPs in lower plenum in the vessel with elliptical bottom appeares with small delay compared to the vessel with spherical bottom. Lower head vessel failure in the vessel with elliptical appears at 19763.9 s due to creep failure based on the Combescure model, while in other calculations bottom lower head failure happens 1000 seconds earlier, due to plastic failure again based on the Combescure model. Because of that, corium mass in the lower head of the elliptical bottom is some 10% higher compared to the spherical. TABLE 6. COMPARISON OF PROGRESSION OF CORE DAMAGING AND RELOCATION OF CORE DURING SBO IN VVER 1000 FOR SPHERICAL AND ELLIPTICAL “BOTTOM HEAD AND LOWER PLENUM”
No Events Spherical bottom
Elliptical bottom
1 First cladding rupture, s 9 022.6 9 065.24
2 Start of FPs release from fuel pallets, s 9 023.6 9 066.85
3 First material slump in lower plenum, s 10 152.9 10 090.5
4 First total core uncovery, s 10 980.9 11 126.0
5 Melting pool formation in the core, s 11 839.8 11 852.5
6 First slump of corium with FPs in lower plenum, s 15 563.6 15 630.2
7 Total corium of mass at bottom, kg 39 266.7 43 010.3
8 Lower head vessel failure, s 18 852.5 19 763.9
6. CONCLUSIONS The main deviations in progression of core damaging and relocation have been observed for different values of porosity. Any deviations in progression of core damaging for different maximum porosities in CONVEXDB have not been observed. Investigations for a different velocity “VGRI” of the molten mixture when crossing a grid shows that the influence of this parameter is not significant. Lower head vessel failure with elliptical bottom appeared at 19763 s due to creep failure, while in the spherical bottom lower head failure happened 1000 seconds earlier due to plastic failure. Because of that, corium mass in the lower head of the elliptical bottom is 10% higher than that of the spherical.
REFERENCES [1] VAN DORSSELAERE, J.P., SEROPIAN, C., CHATELARD, P., JACQ, F., FLEUROT, J.,
GIORDANO, P., REINKE, N., SCHWINGES, B., ALLELEIN, H.J., LUTHER, W., The ASTEC integral code for severe accident simulation, Nuclear Technology, NT-3-0846, vol. 165 (2009).
[2] VAN DORSSELAERE, J.P., MICAELLI, J.C., ALLELEIN, H.J., ASTEC and SARNET — integrating severe accident research in Europe, ICAPP ’05, Seoul (2005).

377
[3] VAN DORSSELAERE, J.P., AUVINEN, A., BERAHA, D., CHATELARD, P., JOURNEAU, C., KLJENAK, I., SEHGAL, B.R., TROMM, W., ZEYEN, R., Status of the SARNET network on severe accidents, ICAPP'10 conference, San Diego (2010).
[4] CHATELARD, P., FLEUROT, J., MARCHAND, O., DRAI, P., Assessment of ICARE/CATHARE V1 severe accident code, ICONE-14, Miami, FL (2006).
[5] REPETTO, G., CLEMENT, B., et al., Analysis of the FPT0, FPT1 and FPT2 experiments of the PHEBUS FP program investigating in vessel phenomena during a LWR accident, Proceedings of the NURETH-10, Seoul (2003).
[6] CHATTERJEE, B., MUKHOPADHYAY, D., LELE, H.G., GHOSH, A.K., KUSHWAHA, H.S., GROUDEV, P., ATANASOVA, B., Analyses for VVER-1000/320 reactor for spectrum of break sizes along with SBO, Annals of Nuclear Energy 37 (2010) 359–370.
[7] CHATTERJEE, B., MUKHOPADHYAY, D., LELE, H.G., GHOSH, A.K., KUSHWAHA, H.S., GROUDEV, P., ATANASOVA, B., Effect of steam environment on severe core damage behaviour for VVER-1000 with the ASTEC V1 code, Nuclear Engineering and Design 239 (2009) 559–565.
[8] CHATTERJEE, B., MUKHOPADHYAY, D., LELE, H. G., GHOSH, A. K., GROUDEV, P., ATANASOVA, B., Influence of steam generator inventory on severe core damage behaviour during SBO for VVER 1000 reactor, Nuclear Power for the People Conference, Veliko Tarnovo (2009).
[9] STEFANOVA, A.E., GROUDEV, P.P., ATANASOVA, B.P., Assessment of passive autocatalytic recombiners capabilities in case of Zr oxidation during station blackout scenario for TVSA and TVSM fuel assemblies of WWER 1000, Progress in Nuclear Energy 51 (2009) 582–588.
[10] ANDREEVA, M., GROUDEV, P., PAVLOVA, M., Overview of plant specific severe accident management strategies for Kozloduy NPP, WWER-1000/320, Annals of Nuclear Energy, Volume 35 (4) (2008) 555–564.
[11] STEFANOVA, A.E., GROUDEV, P.P., ATANASOVA, B.P., Comparison of hydrogen generation for TVSM and TVSA fuel assemblies for water water energy reactor (VVER)-1000, Nuclear Engineering and Design 239 (1) (2009) 180–186.
[12] PAVLOVA, M.P., GROUDEV, P.P., HADJIEV, V., Systematic approach for the analytical validation of Kozloduy NPP, VVER-1000/V320 symptom based emergency operating procedures, Progress in Nuclear Energy 50 (1) (2008) 27–32.
[13] PAVLOVA, M.P., ANDREEVA, M., GROUDEV, P.P., RELAP5/MOD3.2 blackout investigation for validation of EOPs for KNPP VVER-1000/V320, Progress in Nuclear Energy (PNE) 49 (5) (2007) 409–427.
[14] GROUDEV, P., STEFANOVA, A., ATANASOVA, B., MELCOR 1.8.5 sensitivity calculation for hydrogen generation at Quench 11 test, Science and Technology Journal of the Bulgarian Nuclear Society 12 (1) (2008) 48–53.


379
LIST OF ABBREVIATIONS
AF as-fabricated AFD axial heat-flux distribution ALPS Advanced LWR Fuel Performance and Safety ANL Argonne National Laboratory ASDV atmospheric steam discharge valve ATWS anticipated transient without scram BE best estimate BIGR fast pulsed graphite reactor BOC beginning of cycle BU burnup BWR boiling water reactor CBI CABRI International Programme CCP critical channel power CDI cumulative damage index CEA Commissariat à l'énergie atomique et aux énergies alternatives CHF critical heat flux CIEMAT Centro de Investigaciones Energéticas, Medioambientales y Tecnológicas CRIEPI Central Research Institute of Electric Power Industry CSED critical strain energy density CSS containment spray system CVH control volume hydrodynamic CZP cold zero power DBA Design basis accident DNB departure from nucleate boiling DOE design of experiment ECC emergency core cooling ECCS emergency core cooling system ECR equivalent cladding reacted EDC expansion due to compression EDF Électricité de France EDM electrical discharge machine EF early fatality EFWP emergency feed water EOC end of cycle EOS end of the stretch period EPMA electro probe micro analysis EPR European power reactor EPRI Electric Power Research Institute FCI Fuel coolant interaction FGD fission gas dynamics FGR fission gas release FP fission product HBWR Halden Boiling Water Reactor HPIS high pressure injection system HT high temperature HZP hot zero power I&C instrumentation and control IAEA International Atomic Energy Agency ICRP International Committee on Radiological Protection INR Institute for Nuclear Research INRNE Institute for Nuclear Research and Nuclear Energy IRSN Institut de Radioprotection et de Sûreté Nucléaire

380
IRTS infrared temperature sensor JAEA Japan Atomic Energy Agency JMTR Japanese Material Testing Reactor JNES Japan Nuclear Energy Safety Organization JSC VNIINM Joint Stock Company "A.A. Bochvar High-technology Research Institute of
Inorganic Materials" KAERI Korea Atomic Energy Research Institute LBLOCA large break loss of coolant accident LCF latent cancer fatality LHGR linear heat generation rate LLOCA large loss of coolant accident LOCA loss of coolant accident LVDT linear variable differential transformers LWR light water reactor MACCS MELCOR accident consequence code system MCP main coolant pump MNEC MHI Nuclear Engineering Company, Limited MOC middle of cycle MOX mixed oxide NEOC natural end of cycle NPCIL Nuclear Power Corporation of India Limited NPP nuclear power plant NRC Nuclear Regulatory Commission NSRR Nuclear Safety Research Reactor NU natural uranium OA orthogonal array OAT one at a time OECD Organisation for Economic Co-operation and Development PAEC Pakistan Atomic Energy Commission PC personal computer PCMI pellet cladding mechanical interaction PCT pellet cladding temperature PCT peak cladding temperature PH pre-hydrided PHWR pressurized heavy water reactor PIE post-irradiation examination PNNL Pacific Northwest National Laboratory PPN peak power node PQ post quenching PS pump suction PSI Paul Scherrer Institute PWR pressurized water reactor RAG roll after grooving RCCA rod control cluster assembly RCS reactor coolant system RCT ring compression test REA control rod ejection REA rod ejection accident RFD radial heat flux distribution RFEF Reactor Fuel Examination Facility RFTC ratio flux to critical RHL rapid heating and loading RIA reactivity initiated accident RIH reactor inlet header ROH reactor outlet header ROPT regional overpower trip

381
RPV reactor pressure vessel RRS reactor regulating system RSC Reactor Safety Commission RSM response surface method RT room temperature RTAP room temperature and atmospheric pressure RU recovered uranium RX recrystallized SA sensitivity analysis SAMG severe accident management guidance SBO station blackout SDA steam dump to atmosphere SED strain energy density SEM scanning electron microscopy SEU slightly enriched uranium SIS safety injection system SPP secondary precipitated phases SR stress relieved SRV safety relief valve TH thermohydraulics TM technical meeting TSV Turbine stop valve UA uncertainty analysis UHS Ultimate hoop stress USA United States of America USNRC United States Nuclear Regulatory Commission UTS ultimate tensile stress UVET unequal velocity equal temperature VGRI velocity of molten mixture when crossing a grid VRR void reactivity reduction VTT Technical Research Centre Finland VVER water-water power reactor


383
LIST OF PARTICIPANTS
Abeta, S.
Mitsubishi Corporation 2-6-1 MarunouchiM Chiyoda-Ku, 100-8086 Tokyo, Japan Email: [email protected]
Ali Rizvi, S.A.
Karachi Nuclear Power Complex (KANUPP-2) Paradise Point Karachi, Pakistan Email: [email protected]
Amaya, M.
Japan Atomic Energy Agency 2–4 Shirakata-shirane Tokai-mura, Naka-gun 319-1195 Ibaraki, Japan Email: [email protected]
Aqrawi, A. International Atomic Energy Agency Nuclear Fuel Cycle and Materials Section PO Box 100 1400 Vienna Austria Email: [email protected]
Arffman, A.
VTT Technical Research Centre of Finland Tietotie 3 PO Box 1000 Espoo 02044, Finland Email: [email protected]
Bernaudat, C. 12–14 Avenue Antone Dutrievoz F-69628 Villeurbanne France Email: [email protected]
Brachet, J.-C.
CEA-Saclay, DEN, Serv. Rech. Met. Appl. F-91191 Gif-Sur-Yvette France Email: [email protected]
Carassou, S.
DEN/DMN/SEMI/LCMI Centre de Saclay F-91191 Gif Sur Yvette France Email: [email protected]
Chuto, T.
Japan Atomic Energy Agency 2–4 Shirakata-shirane Tokai-mura, Naka-gun Ibaraki 319-1195 Japan Email: [email protected]

384
El-Jaby, A. Physics and Fuel Division Directorate of Assessment and Analysis Canadian Nuclear Safety Commission Ottawa, Canada Email: [email protected]
Eto, Y.
Nippon Nuclear Fuel Development Co., Ltd. 2163 Narita-cho, Oarai-machi, Higashi-Ibaraki-gun Ibaraki-Ken 311-1313 Japan Email: [email protected]
Fedotov, P.
JSC A.A. Bochvar High-Technology Research Institute of Inorganic Materials (JSC VNIINM) 5a Rogova 123098 Moscow Russian Federation Email: [email protected]; [email protected]; [email protected]
Flanagan, M.
US Nuclear Regulatory Commission 20555-0001 Washington DC United States of America Email: [email protected]
Francisco, F.
Centro de Investigaciones Energeticas, Medioambientales y Tecnologicas (CIEMAT) Avda. Complutense 22 28040 Madrid Spain Email: [email protected]
Franklin, K.
British Embassy – Tokyo 1 Ichiban-cho Chiyoda-ku Tokyo 102-8381 Japan Email: [email protected]
Fujii, H.
Mitsubishi Nucler Fuel Co., Ltd. 12-1, Yurakucho 1-chome, Chiyoda-ku Tokyo 100-0006 Japan Email: [email protected]
Fujishoro, T.
Research Organization for Information Science and Technology 2–4 Shirakata-shirane Tokai-mura, Naka-gun Ibaraki 319-1195 Japan Email: [email protected]
Fuketa, T.
Japan Atomic Energy Agency 2–4 Shirakata-shirane Tokai-mura, Naka-gun Ibaraki 319-1195 Japan Email: [email protected]

385
Fukuda, T.
Japan Atomic Energy Agency 2–4 Shirakata-shirane Tokai-mura, Naka-gun Ibaraki 319-1195 Japan Email: [email protected]
Garat, V.
AREVA NP 10 rue Juliette Recamier 69456 Lyon Cedex 06 France Email: [email protected]
Grudev, P.P. INRNE-BAS Tzarigradsko chaussee, 72 1784 Sofia Bulgaria Email: [email protected]
Hanawa, S.
Japan Atomic Energy Agency 2–4 Shirakata-shirane Tokai-mura, Naka-gun Ibaraki 319-1195 Japan Email: [email protected]
Harada, A.
Japan Atomic Energy Agency 2–4 Shirakata-shirane Tokai-mura, Naka-gun Ibaraki 319-1195 Japan Email: [email protected]
Homma, K.
MHI Nuclear Engineering Company, Limited (MNEC) 3–1,Minatomirai 3-chome, Nishi-ku Yokohama 200-8401 Japan Email: [email protected]
Homma, T.
Japan Atomic Energy Agency (JAEA); Nuclear Safety Research Center 2–4 Shirakata-shirane Tokai-mura, Naka-gun Ibaraki 319-1195 Japan Email: [email protected]
Horhoianu, G.
Institute for Nuclear Research Campului Street No. 1 PO Box 78 115400 Mioveni, Arges Romania Email: [email protected]
Inozemtsev, V. International Atomic Energy Agency Nuclear Fuel Cycle and Materials Section PO Box 100 1400 Vienna Austria Email: [email protected]

386
Ishijima, K.
Research Organization for Information Science and Technology 2–4 Shirakata-shirane Tokai-mura, Naka-gun Ibaraki 319-1195 Japan Email: [email protected]
Iwata, S.
QUEST School of Engineering The University of Tokyo Tokyo Japan Email: [email protected]
Kamimura, K.
Tokyu Reit Toranomon Bldg, 3-17-1, Toranomon, Minato-ku Tokyo 105-0001 Japan Email: [email protected]
Kim, S.K.
Korea Atomic Energy Research Institute (KAERI) 1045 Daedeok-daero, Yuseong-gu 305-353 Daejon Republic of Korea Email: [email protected]
Kinoshita, M.
Global Nuclear Fuel-Japan Co., Ltd. 3–1, Uchikawa 2-chome, Yokosuka-shi Kanagawa-Ken 239-0836 Japan Email: [email protected]
Kitajima, S.
Central Research Institute of Electric Power Industry (CRIEPI) 2-11-1, Iwado Kita, Komae-shi Tokyo 201-8511 Japan Email: [email protected]
Kolstad, E
OECD Halden Reactor Project PO BOX 173 1751 Halden Norway Email: [email protected]
Kudo, T.
Japan Atomic Energy Agency 2–4 Shirakata-shirane Tokai-mura, Naka-gun Ibaraki 319-1195 Japan Email: [email protected]
Kusagaya, K.
Global Nuclear Fuel-Japan Co., Ltd. 3–1, Uchikawa 2-chome, Yokosuka-shi Kanagawa-Ken 239-0836 Japan Email: [email protected]
Mardon, J.-P.
10, Rue Juliette Récamier 69456 Lyon Cedex 06 France Email: [email protected]

387
Matsumoto, K.
Global Nuclear Fuel-Japan Co., Ltd. 3–1 Uchikawa 2-chome, Yokosuka-shi KANAGAWA-KEN 239-0836 Japan Email: [email protected]
Matsuura, K.
Nuclear Fuel Industries, Ltd. 950 Asashiro-Nishi 1 - chome Kumatori-cho, Sennan-gun Osaka 590-0481 Japan Email: [email protected]
Mihara, T.
Japan Atomic Energy Agency 2–4 Shirakata-shirane Tokai-mura, Naka-gun Ibaraki 319-1195 Japan Email: [email protected]
Miller, J.A.
Embassy of the United States of America 1-10-5 Akasaka Minato-Ko Tokyo 107-8420 Japan Email: [email protected]
Montgomery, R.O.
Pacific Northwest National Laboratory 902 Battel Blvd. PO Box 999, MSIN K8-34 Richland, WA 99352 United States of America Email: [email protected]
Motome, Y.
Japan Atomic Energy Agency 2–4 Shirakata-shirane Tokai-mura, Naka-gun Ibaraki 319-1195 Japan Email: [email protected]
Nagase, F.
Japan Atomic Energy Agency 2–4 Shirakata-shirane Tokai-mura, Naka-gun Ibaraki 319-1195 Japan Email: [email protected]
Nakajima, T.
Japan Nuclear Energy Safety Organization (JNES); Tokyu Reit Toranomon Bldg, 3-17-1 Toranomon, Minato-ku Tokyo 105-0001 Japan Email: [email protected]
Nakamura, K.
Central Research Institute of Electric Power Industry (CRIEPI) 2-11-1, Iwado Kita, Komae-shi Tokyo 201-8511 Japan Email: [email protected]

388
Nakamura, T.
Japan Atomic Energy Agency 2–4 Shirakata-shirane Tokai-mura, Naka-gun Ibaraki 319-1195 Japan Email: [email protected]
Nakata, M.
Japan Atomic Energy Agency 2–4 Shirakata-shirane Tokai-mura, Naka-gun Ibaraki 319-1195 Japan Email: [email protected]
Nakatsuka, M.
Nippon Nuclear Fuel Development Co., Ltd. 2163 Narita-cho, Oarai-machi, Higashi-Ibaraki-gun Ibaraki-ken 311-1313 Japan Email: [email protected]
Negyesi, M.
Czech Technical University Faculty of Nuclear Sciences and Physical Engineering Department of Materials Nad Kaminkou 1345 156 10 PRAHA- Zbraslav Czech Republic Email: [email protected]
Nemoto, T.
Japan Atomic Energy Agency 2–4 Shirakata-shirane Tokai-mura, Naka-gun Ibaraki 319-1195 Japan Email: [email protected]
Obata, H.
Japan Atomic Energy Agency 2–4 Shirakata-shirane Tokai-mura, Naka-gun Ibaraki 319-1195 Japan Email: [email protected]
Ohgiyanagi, J.
Japan Atomic Energy Agency 2–4 Shirakata-shirane Tokai-mura, Naka-gun Ibaraki 319-1195 Japan Email: [email protected]
Page, R.
EDF-Energy Barnett Way, Barnwood Gloucester, GL4 3RS United Kingdom Email: [email protected]
Petit, M.
DPAM/SEMCA, Bat. 702 BP3, 13115 Saint-Paul-lez-Durance France Email: [email protected]

389
Pimenov, Y.
JSC TVEL 49 Kashirskoe shosse Moscow 115409 Russian Federation Email: [email protected]; [email protected]
Rey Gayo, J.M.
Consejo de Seguridad Nuclear C/Justo Dorado 11 28040 Madrid Spain Email: [email protected]
Sasahara, A.
Central Research Institute of Electric Power Industry (CRIEPI) 2-11-1, Iwado Kita, Komae-shi Tokyo 201-8511 Japan Email: [email protected]
Sasajima, H.
Japan Atomic Energy Agency 4–49 Muramatsu, Tokai-mura, Naka-gun, Ibaraki 319-1195 Japan Email: [email protected]
Sebbari, B. 12–14 Avenue Antoine Dutrievoz 69628 Villeurbanne France Email: [email protected]
Shiina, H.
Japan Atomic Energy Agency 2–4 Shirakata-shirane Tokai-mura, Naka-gun Ibaraki 319-1195 Japan Email: [email protected]
Shirai, H.
TEPCO Systems Corporation Shibusawa City Place Eitai 2-37-28, Eitai, Koto-ku Tokyo 135-0034 Japan Email: [email protected]
Sonoda, T.
Central Research Institute of Electric Power Industry (CRIEPI) 2-11-1, Iwado Kita Komae-shi Tokyo 201-8511 Japan Email: [email protected]
Sugiyama, T.
Japan Atomic Energy Agency 2–4 Shirakata-shirane Tokai-mura, Naka-gun Ibaraki 319-1195 Japan Email: [email protected]

390
Suzuki, M.
Japan Atomic Energy Agency 2–4 Shirakata-shirane Tokai-mura, Naka-gun Ibaraki 319-1195 Japan Email: [email protected]
Suzuki, Y.
Mitsubishi Nucler Fuel Co., Ltd. 12–1, Yurakucho 1-chome, Chiyoda-ku Tokyo 100-0006 Japan Email: [email protected]
Takahashi, H.
Ibaraki Atomic Energy Consultaion (IAEC) 225–2Muramatu,Tokai Naka-gun Ibaraki 319-1112 Japan Email: [email protected]
Takeda, S.
TEPCO Systems Corporation Shibusawa City Place Eitai 2-37-28, Eitai, Koto-ku Tokyo 135-0034 Japan Email: [email protected]
Takeda, T.
Research Institute of Nuclear Engineering, University of Fukui Bunkyo 3-9-1 Fukui-shi Fukui 910-8507 Japan Email: [email protected]
Tamitani, M.
Global Nuclear Fuel-Japan Co., Ltd. 3–1, Uchikawa 2-chome, Yokosuka-shi Kanagawa-ken 239-0836 Japan Email: [email protected]
Tanabe, S.
Hitachi GE Nuclear Energy, Ltd. 3–1 Uchikawa 2-chome,Yokosuka-shi Kanagawa-ken 239-0836 Japan Email: [email protected]
Teshima, H.
Mitsubishi Nuclear Fuel Co., LTD. 622-1 Funaishikawa, Tokai-mura, Naka gun Ibaraki 319 1197 Japan Email: [email protected]
Toyokawa, T.
Japan Atomic Energy Agency 2–4 Shirakata-shirane, Tokai-mura, Naka-gun Ibaraki 319-1195 Japan Email: [email protected]