Global Corn Oil Trade Falls with Increased Competition and ...
39
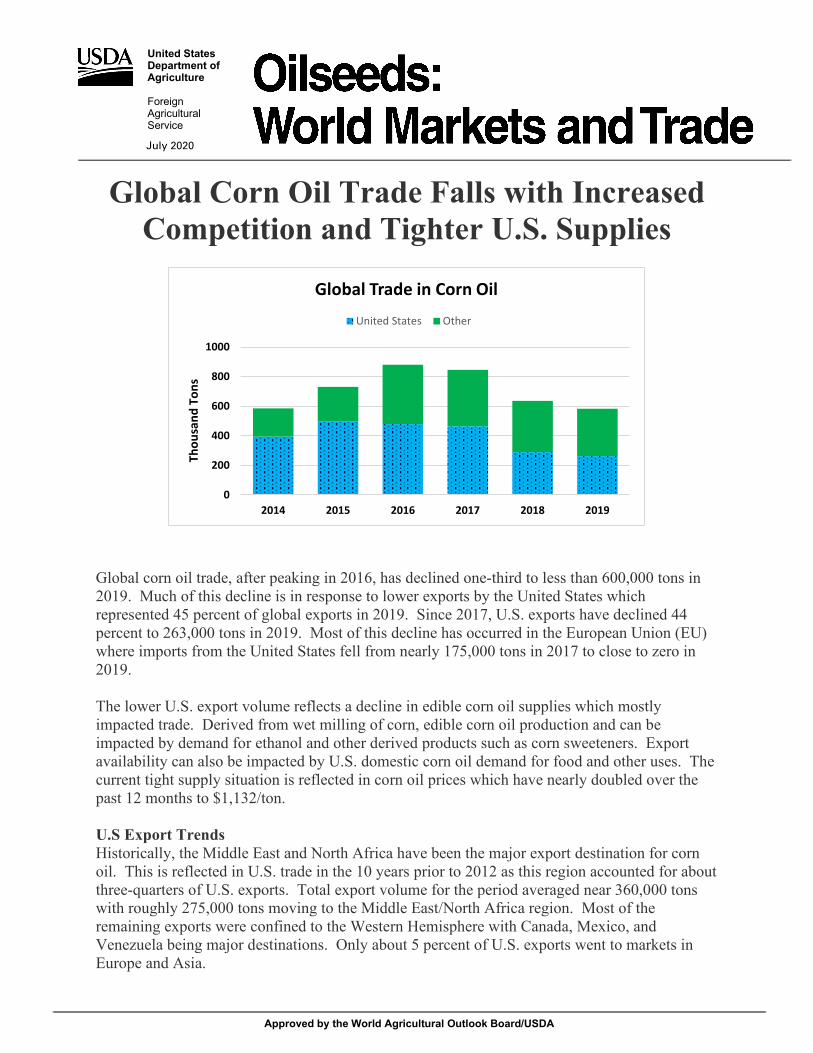
United States Department of Agriculture Foreign Agricultural Service Approved by the World Agricultural Outlook Board/USDA July 2020 Global Corn Oil Trade Falls with Increased Competition and Tighter U.S. Supplies Global corn oil trade, after peaking in 2016, has declined one-third to less than 600,000 tons in 2019. Much of this decline is in response to lower exports by the United States which represented 45 percent of global exports in 2019. Since 2017, U.S. exports have declined 44 percent to 263,000 tons in 2019. Most of this decline has occurred in the European Union (EU) where imports from the United States fell from nearly 175,000 tons in 2017 to close to zero in 2019. The lower U.S. export volume reflects a decline in edible corn oil supplies which mostly impacted trade. Derived from wet milling of corn, edible corn oil production and can be impacted by demand for ethanol and other derived products such as corn sweeteners. Export availability can also be impacted by U.S. domestic corn oil demand for food and other uses. The current tight supply situation is reflected in corn oil prices which have nearly doubled over the past 12 months to $1,132/ton. U.S Export Trends Historically, the Middle East and North Africa have been the major export destination for corn oil. This is reflected in U.S. trade in the 10 years prior to 2012 as this region accounted for about three-quarters of U.S. exports. Total export volume for the period averaged near 360,000 tons with roughly 275,000 tons moving to the Middle East/North Africa region. Most of the remaining exports were confined to the Western Hemisphere with Canada, Mexico, and Venezuela being major destinations. Only about 5 percent of U.S. exports went to markets in Europe and Asia. 0 200 400 600 800 1000 2014 2015 2016 2017 2018 2019 Thousand Tons Global Trade in Corn Oil United States Other
-
Upload
khangminh22 -
Category
Documents
-
view
1 -
download
0
Transcript of Global Corn Oil Trade Falls with Increased Competition and ...
United States Department of Agriculture Foreign Agricultural Service
Approved by the World Agricultural Outlook Board/USDA
July 2020
Global Corn Oil Trade Falls with Increased Competition and Tighter U.S. Supplies
Global corn oil trade, after peaking in 2016, has declined one-third to less than 600,000 tons in 2019. Much of this decline is in response to lower exports by the United States which represented 45 percent of global exports in 2019. Since 2017, U.S. exports have declined 44 percent to 263,000 tons in 2019. Most of this decline has occurred in the European Union (EU) where imports from the United States fell from nearly 175,000 tons in 2017 to close to zero in 2019. The lower U.S. export volume reflects a decline in edible corn oil supplies which mostly impacted trade. Derived from wet milling of corn, edible corn oil production and can be impacted by demand for ethanol and other derived products such as corn sweeteners. Export availability can also be impacted by U.S. domestic corn oil demand for food and other uses. The current tight supply situation is reflected in corn oil prices which have nearly doubled over the past 12 months to $1,132/ton. U.S Export Trends Historically, the Middle East and North Africa have been the major export destination for corn oil. This is reflected in U.S. trade in the 10 years prior to 2012 as this region accounted for about three-quarters of U.S. exports. Total export volume for the period averaged near 360,000 tons with roughly 275,000 tons moving to the Middle East/North Africa region. Most of the remaining exports were confined to the Western Hemisphere with Canada, Mexico, and Venezuela being major destinations. Only about 5 percent of U.S. exports went to markets in Europe and Asia.
0
200
400
600
800
1000
2014 2015 2016 2017 2018 2019
Thou
sand
Ton
s
Global Trade in Corn Oil
United States Other
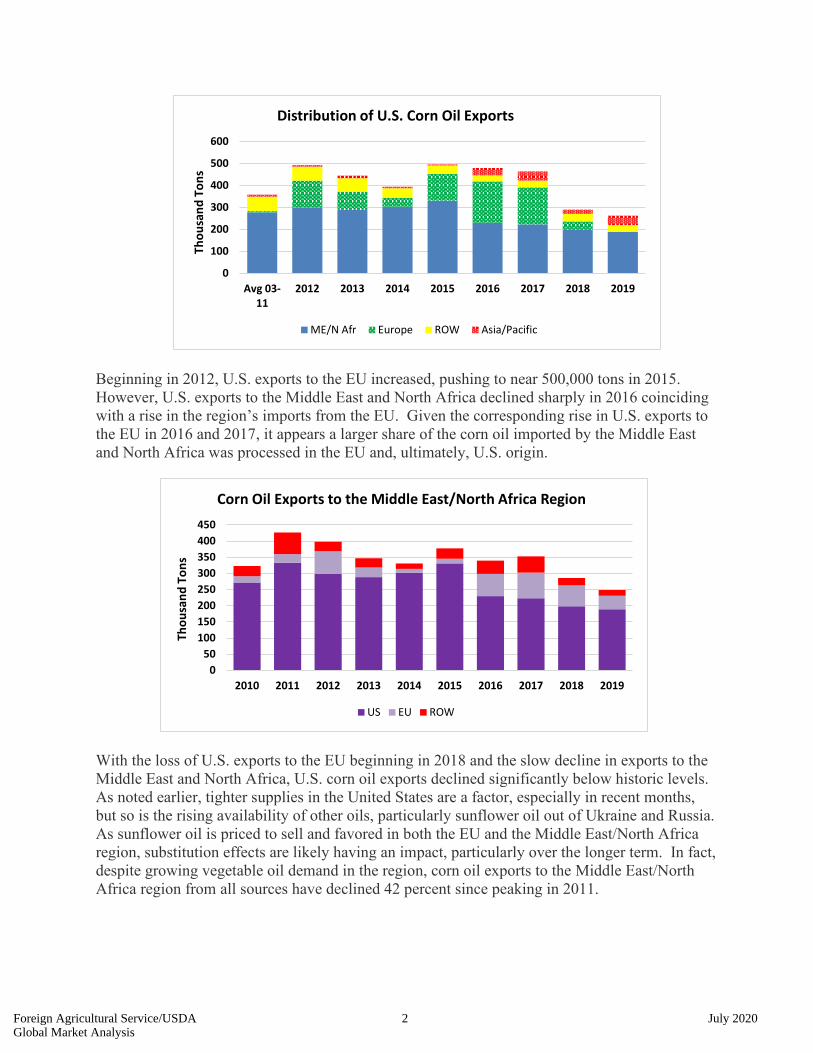
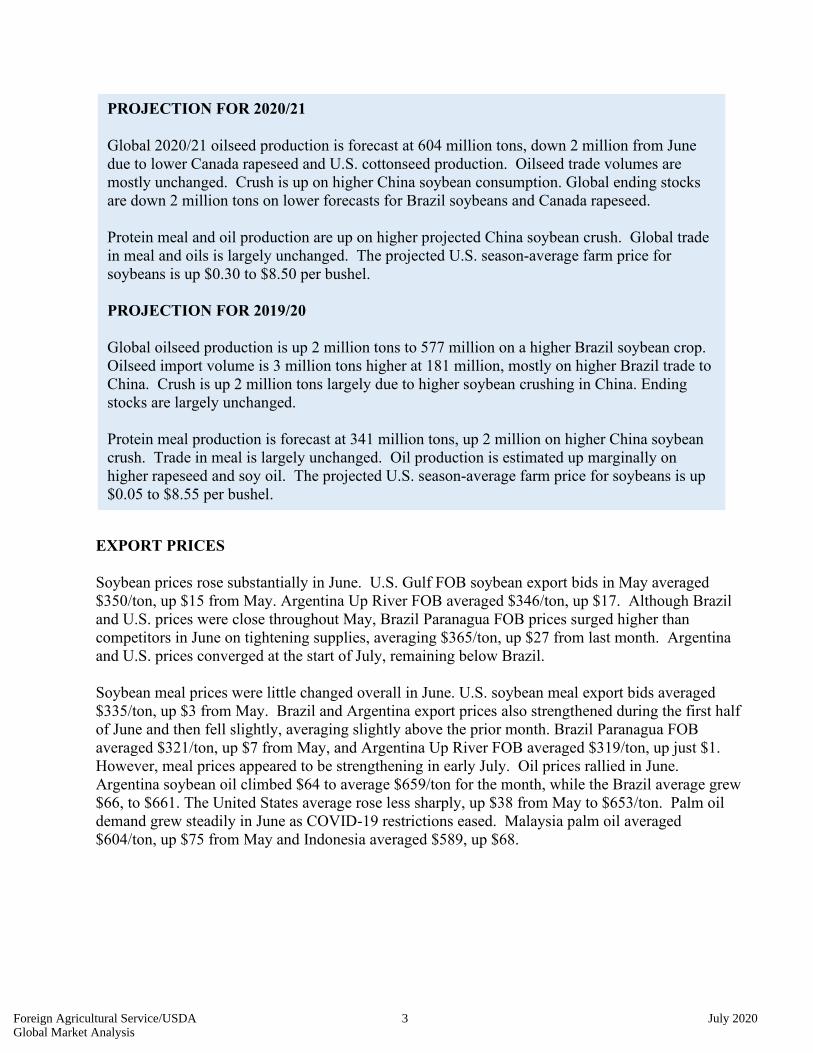
Beginning in 2012, U.S. exports to the EU increased, pushing to near 500,000 tons in 2015. However, U.S. exports to the Middle East and North Africa declined sharply in 2016 coinciding with a rise in the region’s imports from the EU. Given the corresponding rise in U.S. exports to the EU in 2016 and 2017, it appears a larger share of the corn oil imported by the Middle East and North Africa was processed in the EU and, ultimately, U.S. origin.
With the loss of U.S. exports to the EU beginning in 2018 and the slow decline in exports to the Middle East and North Africa, U.S. corn oil exports declined significantly below historic levels. As noted earlier, tighter supplies in the United States are a factor, especially in recent months, but so is the rising availability of other oils, particularly sunflower oil out of Ukraine and Russia. As sunflower oil is priced to sell and favored in both the EU and the Middle East/North Africa region, substitution effects are likely having an impact, particularly over the longer term. In fact, despite growing vegetable oil demand in the region, corn oil exports to the Middle East/North Africa region from all sources have declined 42 percent since peaking in 2011.
0
100
200
300
400
500
600
Avg 03-11
2012 2013 2014 2015 2016 2017 2018 2019
Thou
sand
Ton
s
Distribution of U.S. Corn Oil Exports
ME/N Afr Europe ROW Asia/Pacific
050
100150200250300350400450
2010 2011 2012 2013 2014 2015 2016 2017 2018 2019
Thou
sand
Ton
s
Corn Oil Exports to the Middle East/North Africa Region
US EU ROW
Foreign Agricultural Service/USDA 2 July 2020Global Market Analysis
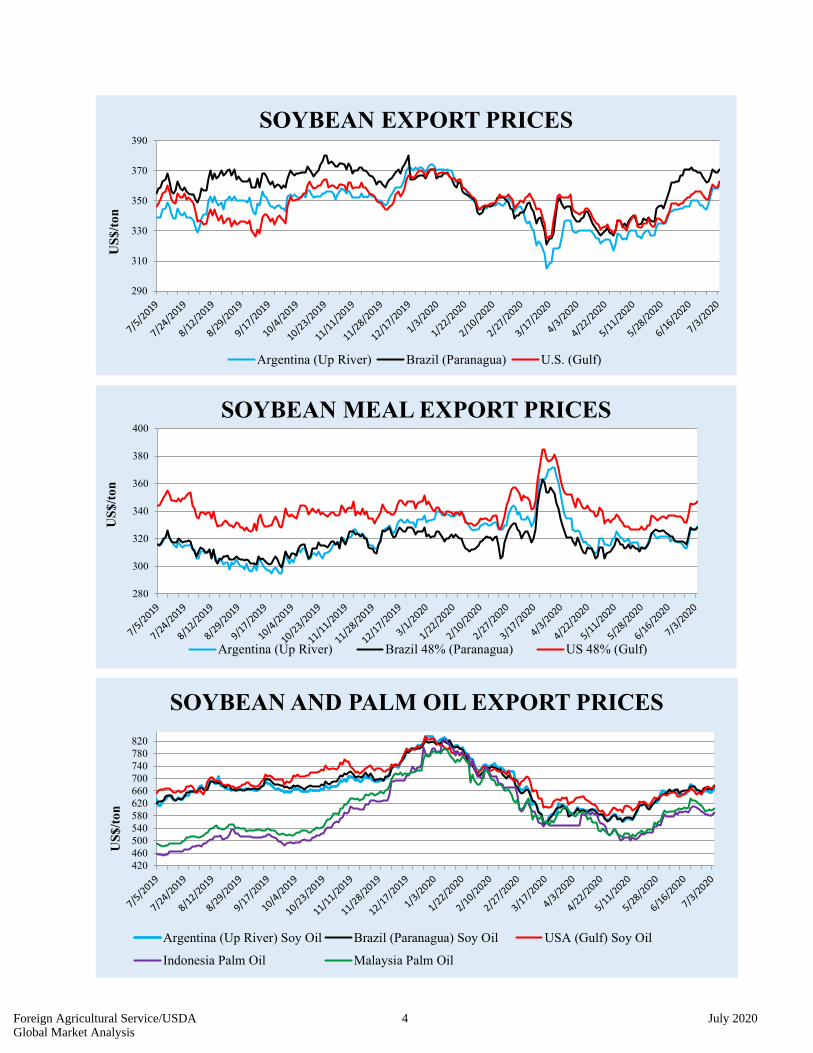
EXPORT PRICES Soybean prices rose substantially in June. U.S. Gulf FOB soybean export bids in May averaged $350/ton, up $15 from May. Argentina Up River FOB averaged $346/ton, up $17. Although Brazil and U.S. prices were close throughout May, Brazil Paranagua FOB prices surged higher than competitors in June on tightening supplies, averaging $365/ton, up $27 from last month. Argentina and U.S. prices converged at the start of July, remaining below Brazil. Soybean meal prices were little changed overall in June. U.S. soybean meal export bids averaged $335/ton, up $3 from May. Brazil and Argentina export prices also strengthened during the first half of June and then fell slightly, averaging slightly above the prior month. Brazil Paranagua FOB averaged $321/ton, up $7 from May, and Argentina Up River FOB averaged $319/ton, up just $1. However, meal prices appeared to be strengthening in early July. Oil prices rallied in June. Argentina soybean oil climbed $64 to average $659/ton for the month, while the Brazil average grew $66, to $661. The United States average rose less sharply, up $38 from May to $653/ton. Palm oil demand grew steadily in June as COVID-19 restrictions eased. Malaysia palm oil averaged $604/ton, up $75 from May and Indonesia averaged $589, up $68.
PROJECTION FOR 2020/21 Global 2020/21 oilseed production is forecast at 604 million tons, down 2 million from June due to lower Canada rapeseed and U.S. cottonseed production. Oilseed trade volumes are mostly unchanged. Crush is up on higher China soybean consumption. Global ending stocks are down 2 million tons on lower forecasts for Brazil soybeans and Canada rapeseed. Protein meal and oil production are up on higher projected China soybean crush. Global trade in meal and oils is largely unchanged. The projected U.S. season-average farm price for soybeans is up $0.30 to $8.50 per bushel. PROJECTION FOR 2019/20 Global oilseed production is up 2 million tons to 577 million on a higher Brazil soybean crop. Oilseed import volume is 3 million tons higher at 181 million, mostly on higher Brazil trade to China. Crush is up 2 million tons largely due to higher soybean crushing in China. Ending stocks are largely unchanged. Protein meal production is forecast at 341 million tons, up 2 million on higher China soybean crush. Trade in meal is largely unchanged. Oil production is estimated up marginally on higher rapeseed and soy oil. The projected U.S. season-average farm price for soybeans is up $0.05 to $8.55 per bushel.
Foreign Agricultural Service/USDA 3 July 2020Global Market Analysis
290
310
330
350
370
390
US$
/ton
SOYBEAN EXPORT PRICES
Argentina (Up River) Brazil (Paranagua) U.S. (Gulf)
280
300
320
340
360
380
400
US$
/ton
SOYBEAN MEAL EXPORT PRICES
Argentina (Up River) Brazil 48% (Paranagua) US 48% (Gulf)
420460500540580620660700740780820
US$
/ton
SOYBEAN AND PALM OIL EXPORT PRICES
Argentina (Up River) Soy Oil Brazil (Paranagua) Soy Oil USA (Gulf) Soy Oil
Indonesia Palm Oil Malaysia Palm Oil
Foreign Agricultural Service/USDA 4 July 2020Global Market Analysis
EXPORT SALES
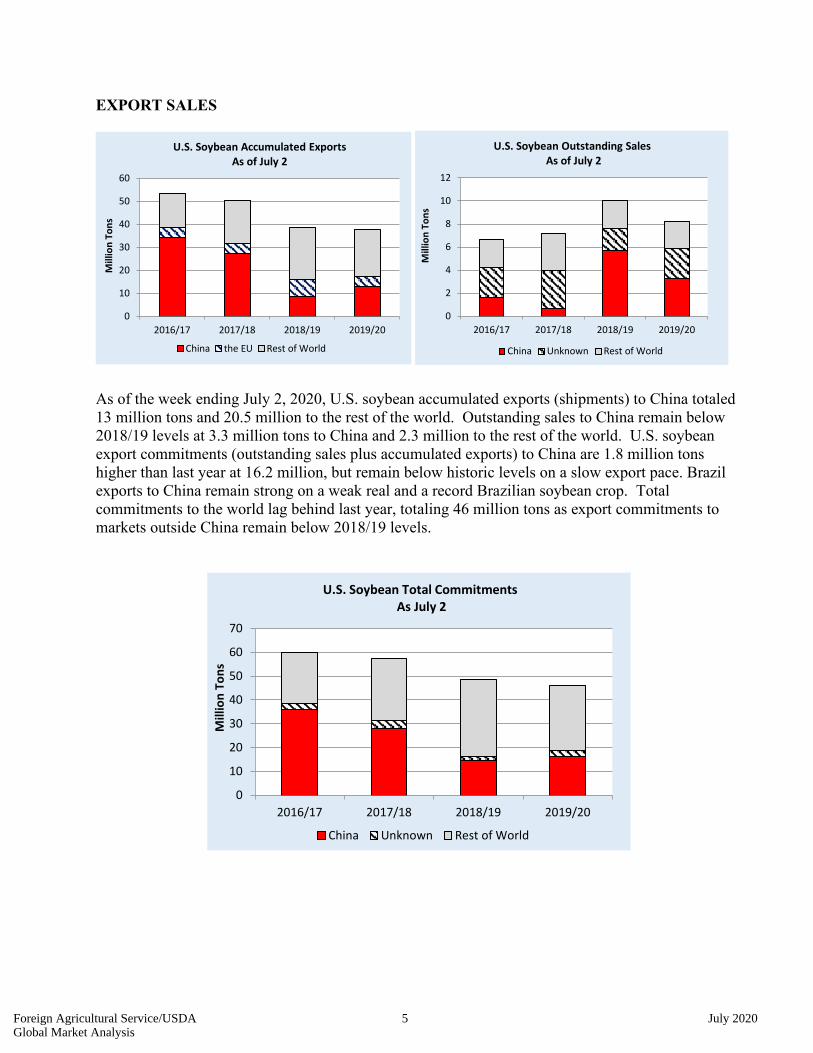
As of the week ending July 2, 2020, U.S. soybean accumulated exports (shipments) to China totaled 13 million tons and 20.5 million to the rest of the world. Outstanding sales to China remain below 2018/19 levels at 3.3 million tons to China and 2.3 million to the rest of the world. U.S. soybean export commitments (outstanding sales plus accumulated exports) to China are 1.8 million tons higher than last year at 16.2 million, but remain below historic levels on a slow export pace. Brazil exports to China remain strong on a weak real and a record Brazilian soybean crop. Total commitments to the world lag behind last year, totaling 46 million tons as export commitments to markets outside China remain below 2018/19 levels.
0
10
20
30
40
50
60
70
2016/17 2017/18 2018/19 2019/20
Mill
ion
Tons
China Unknown Rest of World
U.S. Soybean Total Commitments As July 2
0
2
4
6
8
10
12
2016/17 2017/18 2018/19 2019/20
Mill
ion
Tons
China Unknown Rest of World
U.S. Soybean Outstanding Sales As of July 2
0
10
20
30
40
50
60
2016/17 2017/18 2018/19 2019/20
Mill
ion
Tons
U.S. Soybean Accumulated Exports As of July 2
China the EU Rest of World
Foreign Agricultural Service/USDA 5 July 2020Global Market Analysis
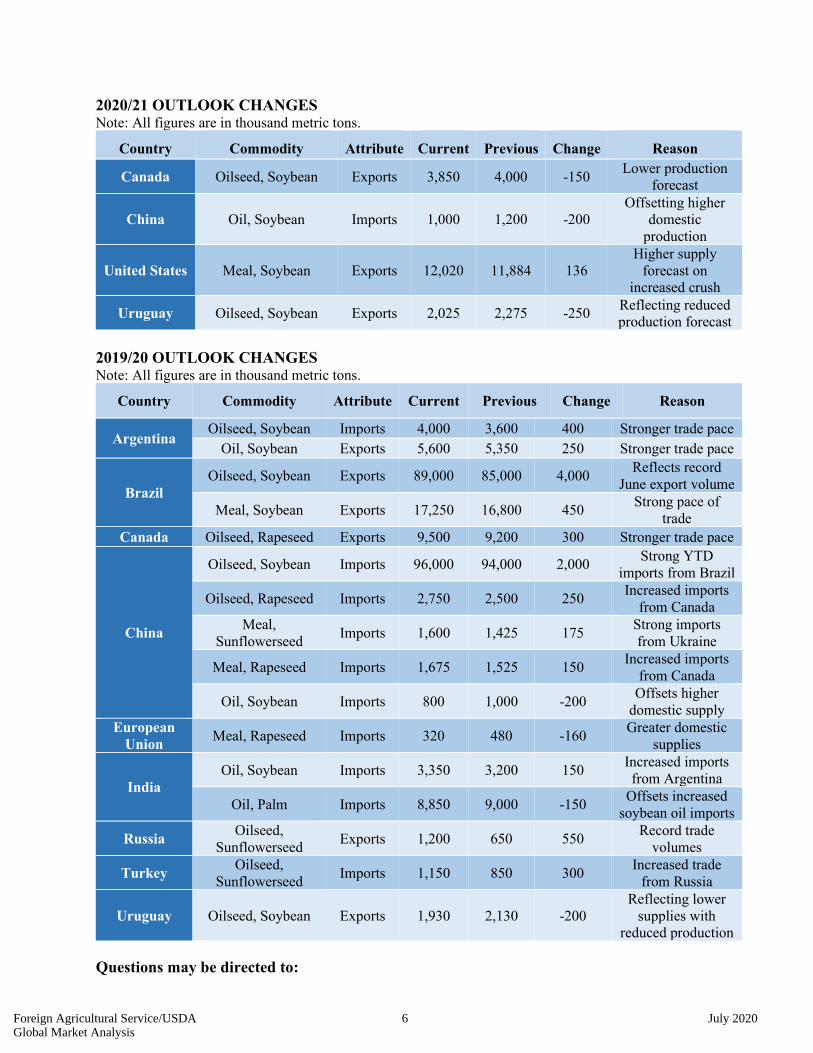
2020/21 OUTLOOK CHANGES Note: All figures are in thousand metric tons.
Country Commodity Attribute Current Previous Change Reason
Canada Oilseed, Soybean Exports 3,850 4,000 -150 Lower production forecast
China Oil, Soybean Imports 1,000 1,200 -200 Offsetting higher
domestic production
United States Meal, Soybean Exports 12,020 11,884 136 Higher supply
forecast on increased crush
Uruguay Oilseed, Soybean Exports 2,025 2,275 -250 Reflecting reduced production forecast
2019/20 OUTLOOK CHANGES Note: All figures are in thousand metric tons.
Country Commodity Attribute Current Previous Change Reason
Argentina Oilseed, Soybean Imports 4,000 3,600 400 Stronger trade pace
Oil, Soybean Exports 5,600 5,350 250 Stronger trade pace
Brazil Oilseed, Soybean Exports 89,000 85,000 4,000 Reflects record
June export volume
Meal, Soybean Exports 17,250 16,800 450 Strong pace of trade
Canada Oilseed, Rapeseed Exports 9,500 9,200 300 Stronger trade pace
China
Oilseed, Soybean Imports 96,000 94,000 2,000 Strong YTD imports from Brazil
Oilseed, Rapeseed Imports 2,750 2,500 250 Increased imports from Canada
Meal, Sunflowerseed Imports 1,600 1,425 175 Strong imports
from Ukraine
Meal, Rapeseed Imports 1,675 1,525 150 Increased imports from Canada
Oil, Soybean Imports 800 1,000 -200 Offsets higher domestic supply
European Union Meal, Rapeseed Imports 320 480 -160 Greater domestic
supplies
India Oil, Soybean Imports 3,350 3,200 150 Increased imports
from Argentina
Oil, Palm Imports 8,850 9,000 -150 Offsets increased soybean oil imports
Russia Oilseed, Sunflowerseed Exports 1,200 650 550 Record trade
volumes
Turkey Oilseed, Sunflowerseed Imports 1,150 850 300 Increased trade
from Russia
Uruguay Oilseed, Soybean Exports 1,930 2,130 -200 Reflecting lower
supplies with reduced production
Questions may be directed to:
Foreign Agricultural Service/USDA 6 July 2020Global Market Analysis
Bill George (202) 720-6234 [email protected] Amy Caldwell (202) 378-2560 [email protected] Tani Lee (202) 720-9180 [email protected] Matt Snyder (202) 378-1068 [email protected] To download the tables in the publication, go to the Production, Supply and Distribution Database (PSD Online): (http://apps.fas.usda.gov/psdonline/psdHome.aspx), scroll down to Reports, and click the plus sign [+] next to Oilseeds. The Foreign Agricultural Service (FAS) updates its production, supply and distribution (PSD) database for cotton, oilseeds, and grains at 12:00 p.m. on the day the World Agricultural Supply and Demand Estimates (WASDE) report is released. This circular is released by 12:15 p.m. FAS Reports and Databases: Current World Markets and Trade and World Agricultural Production Reports:
http://apps.fas.usda.gov/psdonline/psdDataPublications.aspx Archives World Markets and Trade and World Agricultural Production Reports:
http://usda.mannlib.cornell.edu/MannUsda/viewTaxonomy.do?taxonomyID=7 Production, Supply and Distribution Database (PSD Online):
http://apps.fas.usda.gov/psdonline/psdHome.aspx Global Agricultural Trade System (U.S. Exports and Imports):
http://apps.fas.usda.gov/gats/default.aspx Export Sales Report:
http://apps.fas.usda.gov/esrquery/ Global Agricultural Information Network (Agricultural Attaché Reports):
http://gain.fas.usda.gov/Pages/Default.aspx
Other USDA Reports: World Agricultural Supply and Demand Estimates (WASDE):
http://www.usda.gov/oce/commodity/wasde/ Economic Research Service:
http://www.ers.usda.gov/topics/crops National Agricultural Statistics Service:
http://www.nass.usda.gov/Publications/
List of Tables
Foreign Agricultural Service/USDA 7 July 2020Global Market Analysis
SUMMARY TABLES Table 01 Major Oilseeds: World Supply and Distribution (Commodity View) Table 02 Major Protein Meals: World Supply and Distribution (Commodity View) Table 03 Major Vegetable Oils: World Supply and Distribution (Commodity View) Table 04 Major Oilseeds: World Supply and Distribution (Country View) Table 05 Major Protein Meals: World Supply and Distribution (Country View) Table 06 Major Vegetable Oils: World Supply and Distribution (Country View) COMMODITY TABLES Table 07 Soybeans: World Supply and Distribution Table 08 Soybean Meal: World Supply and Distribution Table 09 Soybean Oil: World Supply and Distribution Table 10 Soybeans and Products: World Trade Table 11 Palm Oil: World Supply and Distribution Table 12 Rapeseed and Products: World Supply and Distribution Table 13 Sunflowerseed and Products: World Supply and Distribution Table 14 Minor Vegetable Oils: World Supply and Distribution HISTORICAL TABLES Table 15 World Oilseeds and Products Supply and Distribution Table 16 World Soybeans and Products Supply and Distribution Table 17 World Rapeseed and Products Supply and Distribution Table 18 World Sunflowerseed and Products Supply and Distribution Table 19 World Palm Oil, Coconut Oil, and Fish Meal Supply and Distribution COUNTRY TABLES Table 20 United States Oilseeds and Products Supply and Distribution Local Marketing Years Table 21 United States Soybeans and Products Supply and Distribution Local Marketing Years Table 22 Brazil Soybeans and Products Supply and Distribution Local Marketing Years Table 23 Argentina Soybeans and Products Supply and Distribution Local Marketing Years Table 24 South East Asia Oilseeds and Products Supply and Distribution Table 25 Middle East Oilseeds and Products Supply and Distribution Table 26 European Union Oilseeds and Products Supply and Distribution Table 27 China Oilseeds and Products Supply and Distribution Table 28 India Oilseeds and Products Supply and Distribution PRICES Table 29 Oilseed Prices Table 30 Protein Meal Prices Table 31 Vegetable Oil Prices
Foreign Agricultural Service/USDA 8 July 2020Global Market Analysis
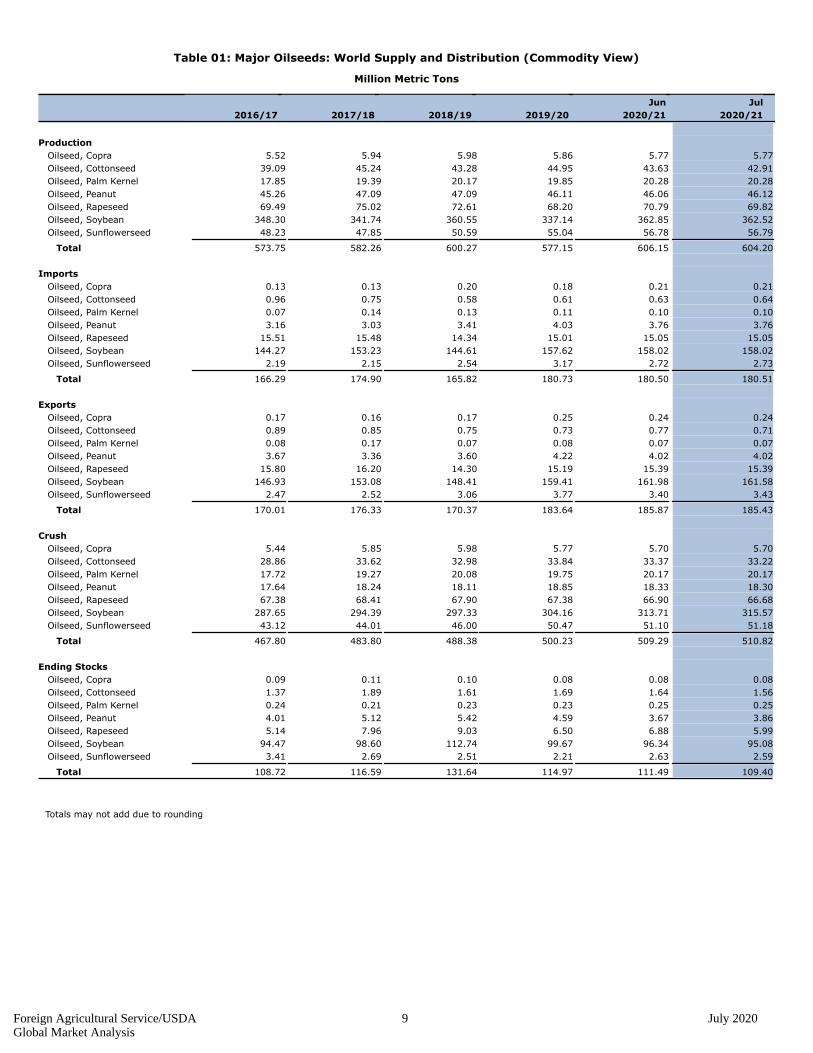
Table 01: Major Oilseeds: World Supply and Distribution (Commodity View)
Million Metric Tons
2016/17 2017/18 2018/19 2019/20
Jun
2020/21
Jul
2020/21
none
Production none
5.52 Oilseed, Copra 5.94 5.98 5.86 5.77 5.77
39.09 Oilseed, Cottonseed 45.24 43.28 44.95 43.63 42.91
17.85 Oilseed, Palm Kernel 19.39 20.17 19.85 20.28 20.28
45.26 Oilseed, Peanut 47.09 47.09 46.11 46.06 46.12
69.49 Oilseed, Rapeseed 75.02 72.61 68.20 70.79 69.82
348.30 Oilseed, Soybean 341.74 360.55 337.14 362.85 362.52
48.23 Oilseed, Sunflowerseed 47.85 50.59 55.04 56.78 56.79
573.75 Total 582.26 600.27 577.15 606.15 604.20
none
Imports none
0.13 Oilseed, Copra 0.13 0.20 0.18 0.21 0.21
0.96 Oilseed, Cottonseed 0.75 0.58 0.61 0.63 0.64
0.07 Oilseed, Palm Kernel 0.14 0.13 0.11 0.10 0.10
3.16 Oilseed, Peanut 3.03 3.41 4.03 3.76 3.76
15.51 Oilseed, Rapeseed 15.48 14.34 15.01 15.05 15.05
144.27 Oilseed, Soybean 153.23 144.61 157.62 158.02 158.02
2.19 Oilseed, Sunflowerseed 2.15 2.54 3.17 2.72 2.73
166.29 Total 174.90 165.82 180.73 180.50 180.51
none
Exports none
0.17 Oilseed, Copra 0.16 0.17 0.25 0.24 0.24
0.89 Oilseed, Cottonseed 0.85 0.75 0.73 0.77 0.71
0.08 Oilseed, Palm Kernel 0.17 0.07 0.08 0.07 0.07
3.67 Oilseed, Peanut 3.36 3.60 4.22 4.02 4.02
15.80 Oilseed, Rapeseed 16.20 14.30 15.19 15.39 15.39
146.93 Oilseed, Soybean 153.08 148.41 159.41 161.98 161.58
2.47 Oilseed, Sunflowerseed 2.52 3.06 3.77 3.40 3.43
170.01 Total 176.33 170.37 183.64 185.87 185.43
none
Crush none
5.44 Oilseed, Copra 5.85 5.98 5.77 5.70 5.70
28.86 Oilseed, Cottonseed 33.62 32.98 33.84 33.37 33.22
17.72 Oilseed, Palm Kernel 19.27 20.08 19.75 20.17 20.17
17.64 Oilseed, Peanut 18.24 18.11 18.85 18.33 18.30
67.38 Oilseed, Rapeseed 68.41 67.90 67.38 66.90 66.68
287.65 Oilseed, Soybean 294.39 297.33 304.16 313.71 315.57
43.12 Oilseed, Sunflowerseed 44.01 46.00 50.47 51.10 51.18
467.80 Total 483.80 488.38 500.23 509.29 510.82
none
Ending Stocks none
0.09 Oilseed, Copra 0.11 0.10 0.08 0.08 0.08
1.37 Oilseed, Cottonseed 1.89 1.61 1.69 1.64 1.56
0.24 Oilseed, Palm Kernel 0.21 0.23 0.23 0.25 0.25
4.01 Oilseed, Peanut 5.12 5.42 4.59 3.67 3.86
5.14 Oilseed, Rapeseed 7.96 9.03 6.50 6.88 5.99
94.47 Oilseed, Soybean 98.60 112.74 99.67 96.34 95.08
3.41 Oilseed, Sunflowerseed 2.69 2.51 2.21 2.63 2.59
108.72 Total 116.59 131.64 114.97 111.49 109.40
Totals may not add due to rounding
Foreign Agricultural Service/USDA 9 July 2020Global Market Analysis

Table 02: Major Protein Meals: World Supply and Distribution (Commodity View)
Million Metric Tons
2016/17 2017/18 2018/19 2019/20
Jun
2020/21
Jul
2020/21
none
Production none
1.81 Meal, Copra 1.94 2.00 1.93 1.91 1.91
13.27 Meal, Cottonseed 15.46 15.11 15.57 15.32 15.24
4.87 Meal, Fish 4.76 4.76 4.85 4.87 4.87
9.14 Meal, Palm Kernel 10.04 10.41 10.24 10.45 10.45
7.02 Meal, Peanut 7.26 7.19 7.49 7.27 7.27
38.81 Meal, Rapeseed 39.48 39.12 38.87 38.62 38.47
225.83 Meal, Soybean 232.29 233.33 239.07 246.72 248.28
19.40 Meal, Sunflowerseed 19.95 20.71 22.65 22.93 22.95
320.15 Total 331.19 332.63 340.67 348.07 349.43
none
Imports none
0.48 Meal, Copra 0.69 0.57 0.55 0.54 0.54
0.24 Meal, Cottonseed 0.31 0.34 0.37 0.37 0.37
3.02 Meal, Fish 2.98 3.02 2.98 3.05 3.05
6.58 Meal, Palm Kernel 6.82 7.16 7.17 7.13 7.18
0.14 Meal, Peanut 0.05 0.10 0.14 0.11 0.11
5.90 Meal, Rapeseed 6.24 6.85 7.20 7.02 6.97
60.18 Meal, Soybean 61.13 62.05 63.42 64.43 64.45
6.97 Meal, Sunflowerseed 6.56 7.82 8.06 7.76 7.86
83.50 Total 84.79 87.91 89.89 90.40 90.53
none
Exports none
0.53 Meal, Copra 0.71 0.68 0.61 0.57 0.57
0.38 Meal, Cottonseed 0.45 0.41 0.41 0.41 0.40
2.53 Meal, Fish 2.58 2.56 2.65 2.67 2.67
6.67 Meal, Palm Kernel 7.10 7.81 7.42 7.55 7.55
0.16 Meal, Peanut 0.10 0.12 0.14 0.14 0.14
5.99 Meal, Rapeseed 6.39 6.92 7.29 7.11 7.03
64.60 Meal, Soybean 64.90 67.28 67.04 67.39 67.50
7.43 Meal, Sunflowerseed 6.98 8.02 8.38 8.35 8.38
88.29 Total 89.21 93.80 93.93 94.19 94.24
none
Domestic Consumption none
1.75 Meal, Copra 1.91 1.89 1.87 1.88 1.88
13.10 Meal, Cottonseed 15.28 15.11 15.53 15.28 15.22
5.38 Meal, Fish 5.17 5.22 5.20 5.27 5.27
8.99 Meal, Palm Kernel 9.63 9.95 9.98 9.97 10.03
7.02 Meal, Peanut 7.22 7.17 7.49 7.24 7.24
38.80 Meal, Rapeseed 39.29 39.05 38.91 38.59 38.53
221.30 Meal, Soybean 228.76 229.79 237.44 244.20 245.63
19.10 Meal, Sunflowerseed 19.41 20.72 22.10 22.35 22.43
315.45 Total 326.65 328.89 338.50 344.79 346.23
none
Ending Stocks none
0.12 Meal, Copra 0.13 0.14 0.14 0.13 0.13
0.10 Meal, Cottonseed 0.14 0.07 0.07 0.06 0.06
0.26 Meal, Fish 0.26 0.26 0.25 0.22 0.22
0.44 Meal, Palm Kernel 0.58 0.40 0.42 0.47 0.47
0.03 Meal, Peanut 0.03 0.04 0.04 0.04 0.04
1.03 Meal, Rapeseed 1.08 1.08 0.96 0.89 0.84
13.71 Meal, Soybean 13.47 11.79 9.79 9.74 9.38
1.23 Meal, Sunflowerseed 1.35 1.14 1.38 1.49 1.38
16.93 Total 17.05 14.91 13.04 13.03 12.52
Totals may not add due to rounding
Foreign Agricultural Service/USDA 10 July 2020Global Market Analysis
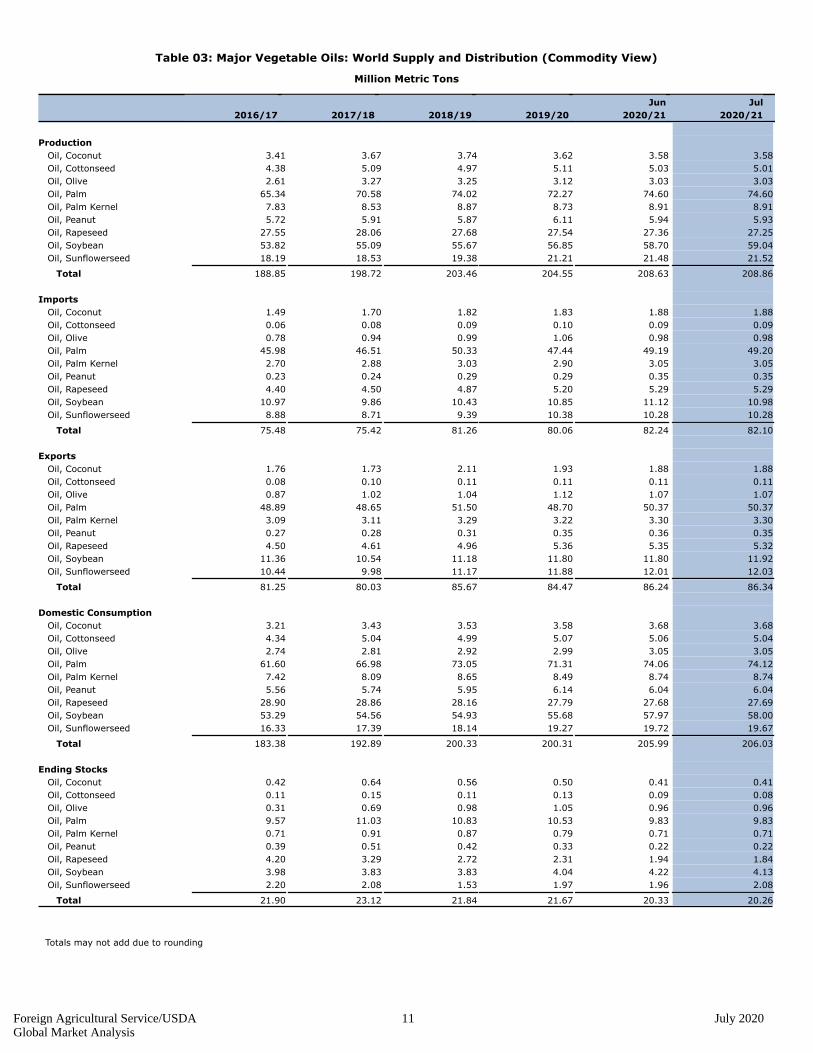
Table 03: Major Vegetable Oils: World Supply and Distribution (Commodity View)
Million Metric Tons
2016/17 2017/18 2018/19 2019/20
Jun
2020/21
Jul
2020/21
none
Production none
3.41 Oil, Coconut 3.67 3.74 3.62 3.58 3.58
4.38 Oil, Cottonseed 5.09 4.97 5.11 5.03 5.01
2.61 Oil, Olive 3.27 3.25 3.12 3.03 3.03
65.34 Oil, Palm 70.58 74.02 72.27 74.60 74.60
7.83 Oil, Palm Kernel 8.53 8.87 8.73 8.91 8.91
5.72 Oil, Peanut 5.91 5.87 6.11 5.94 5.93
27.55 Oil, Rapeseed 28.06 27.68 27.54 27.36 27.25
53.82 Oil, Soybean 55.09 55.67 56.85 58.70 59.04
18.19 Oil, Sunflowerseed 18.53 19.38 21.21 21.48 21.52
188.85 Total 198.72 203.46 204.55 208.63 208.86
none
Imports none
1.49 Oil, Coconut 1.70 1.82 1.83 1.88 1.88
0.06 Oil, Cottonseed 0.08 0.09 0.10 0.09 0.09
0.78 Oil, Olive 0.94 0.99 1.06 0.98 0.98
45.98 Oil, Palm 46.51 50.33 47.44 49.19 49.20
2.70 Oil, Palm Kernel 2.88 3.03 2.90 3.05 3.05
0.23 Oil, Peanut 0.24 0.29 0.29 0.35 0.35
4.40 Oil, Rapeseed 4.50 4.87 5.20 5.29 5.29
10.97 Oil, Soybean 9.86 10.43 10.85 11.12 10.98
8.88 Oil, Sunflowerseed 8.71 9.39 10.38 10.28 10.28
75.48 Total 75.42 81.26 80.06 82.24 82.10
none
Exports none
1.76 Oil, Coconut 1.73 2.11 1.93 1.88 1.88
0.08 Oil, Cottonseed 0.10 0.11 0.11 0.11 0.11
0.87 Oil, Olive 1.02 1.04 1.12 1.07 1.07
48.89 Oil, Palm 48.65 51.50 48.70 50.37 50.37
3.09 Oil, Palm Kernel 3.11 3.29 3.22 3.30 3.30
0.27 Oil, Peanut 0.28 0.31 0.35 0.36 0.35
4.50 Oil, Rapeseed 4.61 4.96 5.36 5.35 5.32
11.36 Oil, Soybean 10.54 11.18 11.80 11.80 11.92
10.44 Oil, Sunflowerseed 9.98 11.17 11.88 12.01 12.03
81.25 Total 80.03 85.67 84.47 86.24 86.34
none
Domestic Consumption none
3.21 Oil, Coconut 3.43 3.53 3.58 3.68 3.68
4.34 Oil, Cottonseed 5.04 4.99 5.07 5.06 5.04
2.74 Oil, Olive 2.81 2.92 2.99 3.05 3.05
61.60 Oil, Palm 66.98 73.05 71.31 74.06 74.12
7.42 Oil, Palm Kernel 8.09 8.65 8.49 8.74 8.74
5.56 Oil, Peanut 5.74 5.95 6.14 6.04 6.04
28.90 Oil, Rapeseed 28.86 28.16 27.79 27.68 27.69
53.29 Oil, Soybean 54.56 54.93 55.68 57.97 58.00
16.33 Oil, Sunflowerseed 17.39 18.14 19.27 19.72 19.67
183.38 Total 192.89 200.33 200.31 205.99 206.03
none
Ending Stocks none
0.42 Oil, Coconut 0.64 0.56 0.50 0.41 0.41
0.11 Oil, Cottonseed 0.15 0.11 0.13 0.09 0.08
0.31 Oil, Olive 0.69 0.98 1.05 0.96 0.96
9.57 Oil, Palm 11.03 10.83 10.53 9.83 9.83
0.71 Oil, Palm Kernel 0.91 0.87 0.79 0.71 0.71
0.39 Oil, Peanut 0.51 0.42 0.33 0.22 0.22
4.20 Oil, Rapeseed 3.29 2.72 2.31 1.94 1.84
3.98 Oil, Soybean 3.83 3.83 4.04 4.22 4.13
2.20 Oil, Sunflowerseed 2.08 1.53 1.97 1.96 2.08
21.90 Total 23.12 21.84 21.67 20.33 20.26
Totals may not add due to rounding
Foreign Agricultural Service/USDA 11 July 2020Global Market Analysis
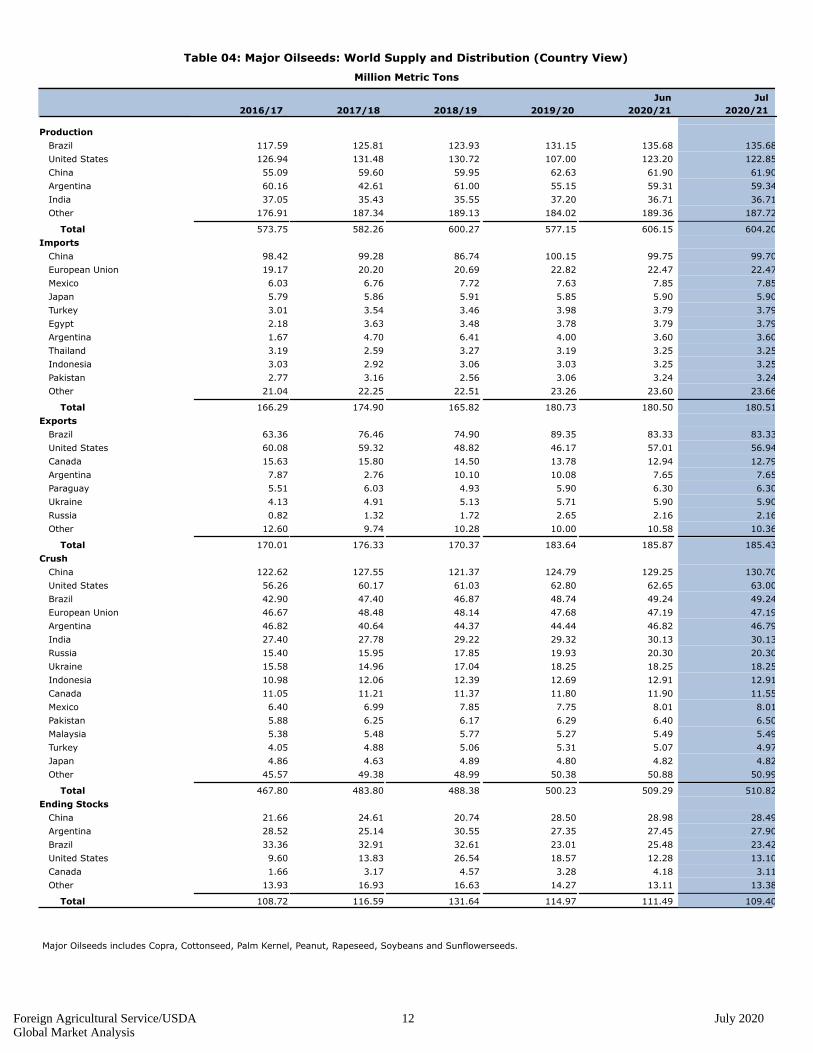
Table 04: Major Oilseeds: World Supply and Distribution (Country View)
Million Metric Tons
2016/17 2017/18 2018/19 2019/20
Jun
2020/21
Jul
2020/21
Production none
117.59 Brazil 125.81 123.93 131.15 135.68 135.68
126.94 United States 131.48 130.72 107.00 123.20 122.85
55.09 China 59.60 59.95 62.63 61.90 61.90
60.16 Argentina 42.61 61.00 55.15 59.31 59.34
37.05 India 35.43 35.55 37.20 36.71 36.71
176.91 Other 187.34 189.13 184.02 189.36 187.72
573.75 Total 582.26 600.27 577.15 606.15 604.20
Imports none
98.42 China 99.28 86.74 100.15 99.75 99.70
19.17 European Union 20.20 20.69 22.82 22.47 22.47
6.03 Mexico 6.76 7.72 7.63 7.85 7.85
5.79 Japan 5.86 5.91 5.85 5.90 5.90
3.01 Turkey 3.54 3.46 3.98 3.79 3.79
2.18 Egypt 3.63 3.48 3.78 3.79 3.79
1.67 Argentina 4.70 6.41 4.00 3.60 3.60
3.19 Thailand 2.59 3.27 3.19 3.25 3.25
3.03 Indonesia 2.92 3.06 3.03 3.25 3.25
2.77 Pakistan 3.16 2.56 3.06 3.24 3.24
21.04 Other 22.25 22.51 23.26 23.60 23.66
166.29 Total 174.90 165.82 180.73 180.50 180.51
Exports none
63.36 Brazil 76.46 74.90 89.35 83.33 83.33
60.08 United States 59.32 48.82 46.17 57.01 56.94
15.63 Canada 15.80 14.50 13.78 12.94 12.79
7.87 Argentina 2.76 10.10 10.08 7.65 7.65
5.51 Paraguay 6.03 4.93 5.90 6.30 6.30
4.13 Ukraine 4.91 5.13 5.71 5.90 5.90
0.82 Russia 1.32 1.72 2.65 2.16 2.16
12.60 Other 9.74 10.28 10.00 10.58 10.36
170.01 Total 176.33 170.37 183.64 185.87 185.43
Crush none
122.62 China 127.55 121.37 124.79 129.25 130.70
56.26 United States 60.17 61.03 62.80 62.65 63.00
42.90 Brazil 47.40 46.87 48.74 49.24 49.24
46.67 European Union 48.48 48.14 47.68 47.19 47.19
46.82 Argentina 40.64 44.37 44.44 46.82 46.79
27.40 India 27.78 29.22 29.32 30.13 30.13
15.40 Russia 15.95 17.85 19.93 20.30 20.30
15.58 Ukraine 14.96 17.04 18.25 18.25 18.25
10.98 Indonesia 12.06 12.39 12.69 12.91 12.91
11.05 Canada 11.21 11.37 11.80 11.90 11.55
6.40 Mexico 6.99 7.85 7.75 8.01 8.01
5.88 Pakistan 6.25 6.17 6.29 6.40 6.50
5.38 Malaysia 5.48 5.77 5.27 5.49 5.49
4.05 Turkey 4.88 5.06 5.31 5.07 4.97
4.86 Japan 4.63 4.89 4.80 4.82 4.82
45.57 Other 49.38 48.99 50.38 50.88 50.99
467.80 Total 483.80 488.38 500.23 509.29 510.82
Ending Stocks none
21.66 China 24.61 20.74 28.50 28.98 28.49
28.52 Argentina 25.14 30.55 27.35 27.45 27.90
33.36 Brazil 32.91 32.61 23.01 25.48 23.42
9.60 United States 13.83 26.54 18.57 12.28 13.10
1.66 Canada 3.17 4.57 3.28 4.18 3.11
13.93 Other 16.93 16.63 14.27 13.11 13.38
108.72 Total 116.59 131.64 114.97 111.49 109.40
Major Oilseeds includes Copra, Cottonseed, Palm Kernel, Peanut, Rapeseed, Soybeans and Sunflowerseeds.
Foreign Agricultural Service/USDA 12 July 2020Global Market Analysis
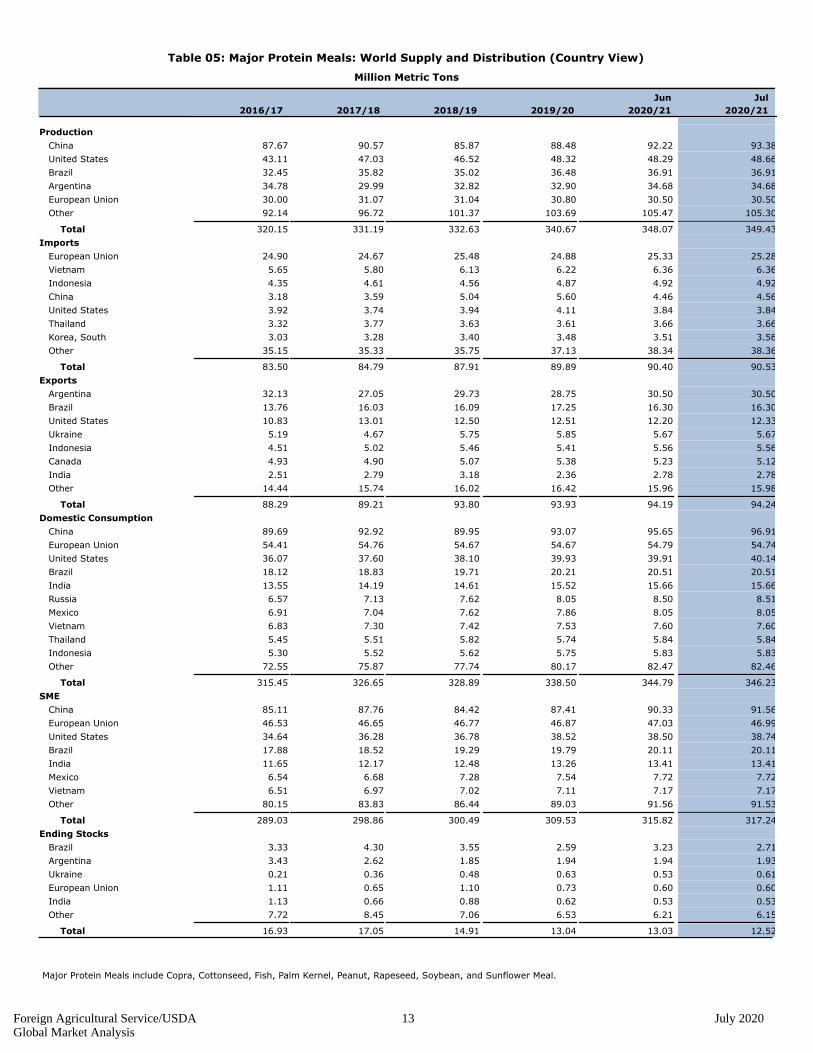
Table 05: Major Protein Meals: World Supply and Distribution (Country View)
Million Metric Tons
2016/17 2017/18 2018/19 2019/20
Jun
2020/21
Jul
2020/21
Production none
87.67 China 90.57 85.87 88.48 92.22 93.38
43.11 United States 47.03 46.52 48.32 48.29 48.66
32.45 Brazil 35.82 35.02 36.48 36.91 36.91
34.78 Argentina 29.99 32.82 32.90 34.68 34.68
30.00 European Union 31.07 31.04 30.80 30.50 30.50
92.14 Other 96.72 101.37 103.69 105.47 105.30
320.15 Total 331.19 332.63 340.67 348.07 349.43
Imports none
24.90 European Union 24.67 25.48 24.88 25.33 25.28
5.65 Vietnam 5.80 6.13 6.22 6.36 6.36
4.35 Indonesia 4.61 4.56 4.87 4.92 4.92
3.18 China 3.59 5.04 5.60 4.46 4.56
3.92 United States 3.74 3.94 4.11 3.84 3.84
3.32 Thailand 3.77 3.63 3.61 3.66 3.66
3.03 Korea, South 3.28 3.40 3.48 3.51 3.56
35.15 Other 35.33 35.75 37.13 38.34 38.36
83.50 Total 84.79 87.91 89.89 90.40 90.53
Exports none
32.13 Argentina 27.05 29.73 28.75 30.50 30.50
13.76 Brazil 16.03 16.09 17.25 16.30 16.30
10.83 United States 13.01 12.50 12.51 12.20 12.33
5.19 Ukraine 4.67 5.75 5.85 5.67 5.67
4.51 Indonesia 5.02 5.46 5.41 5.56 5.56
4.93 Canada 4.90 5.07 5.38 5.23 5.12
2.51 India 2.79 3.18 2.36 2.78 2.78
14.44 Other 15.74 16.02 16.42 15.96 15.98
88.29 Total 89.21 93.80 93.93 94.19 94.24
Domestic Consumption none
89.69 China 92.92 89.95 93.07 95.65 96.91
54.41 European Union 54.76 54.67 54.67 54.79 54.74
36.07 United States 37.60 38.10 39.93 39.91 40.14
18.12 Brazil 18.83 19.71 20.21 20.51 20.51
13.55 India 14.19 14.61 15.52 15.66 15.66
6.57 Russia 7.13 7.62 8.05 8.50 8.51
6.91 Mexico 7.04 7.62 7.86 8.05 8.05
6.83 Vietnam 7.30 7.42 7.53 7.60 7.60
5.45 Thailand 5.51 5.82 5.74 5.84 5.84
5.30 Indonesia 5.52 5.62 5.75 5.83 5.83
72.55 Other 75.87 77.74 80.17 82.47 82.46
315.45 Total 326.65 328.89 338.50 344.79 346.23
SME none
85.11 China 87.76 84.42 87.41 90.33 91.56
46.53 European Union 46.65 46.77 46.87 47.03 46.99
34.64 United States 36.28 36.78 38.52 38.50 38.74
17.88 Brazil 18.52 19.29 19.79 20.11 20.11
11.65 India 12.17 12.48 13.26 13.41 13.41
6.54 Mexico 6.68 7.28 7.54 7.72 7.72
6.51 Vietnam 6.97 7.02 7.11 7.17 7.17
80.15 Other 83.83 86.44 89.03 91.56 91.53
289.03 Total 298.86 300.49 309.53 315.82 317.24
Ending Stocks none
3.33 Brazil 4.30 3.55 2.59 3.23 2.71
3.43 Argentina 2.62 1.85 1.94 1.94 1.93
0.21 Ukraine 0.36 0.48 0.63 0.53 0.61
1.11 European Union 0.65 1.10 0.73 0.60 0.60
1.13 India 0.66 0.88 0.62 0.53 0.53
7.72 Other 8.45 7.06 6.53 6.21 6.15
16.93 Total 17.05 14.91 13.04 13.03 12.52
Major Protein Meals include Copra, Cottonseed, Fish, Palm Kernel, Peanut, Rapeseed, Soybean, and Sunflower Meal.
Foreign Agricultural Service/USDA 13 July 2020Global Market Analysis
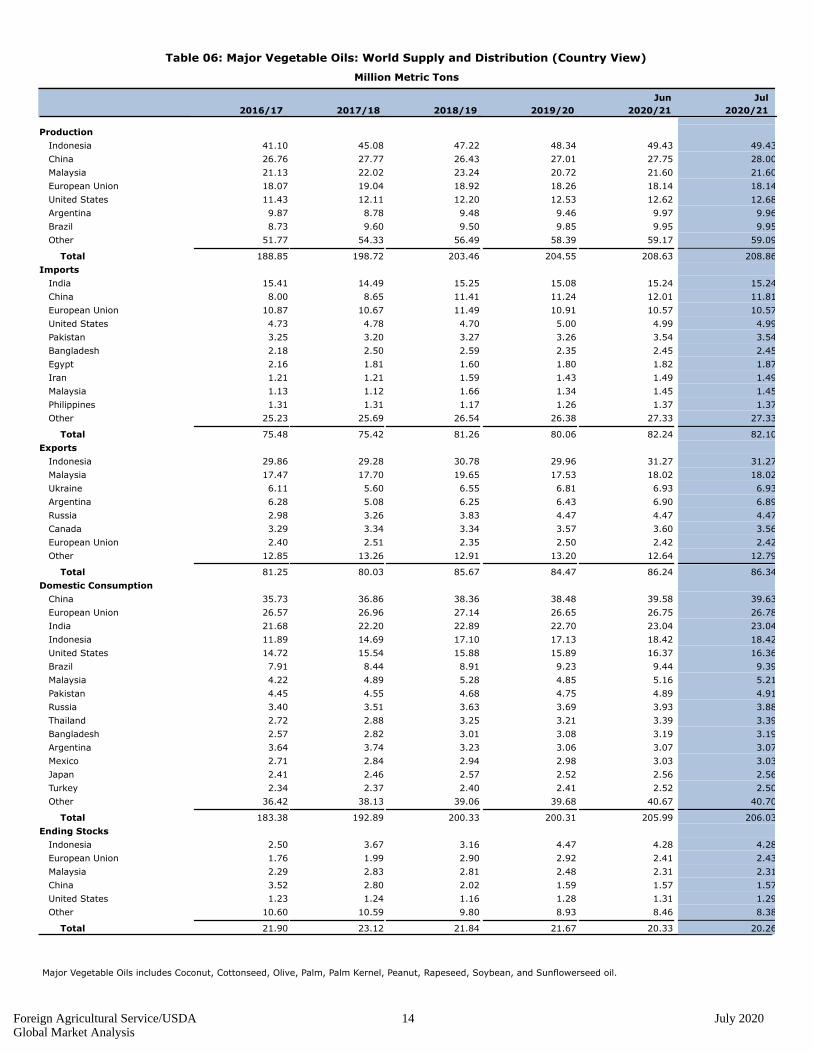
Table 06: Major Vegetable Oils: World Supply and Distribution (Country View)
Million Metric Tons
2016/17 2017/18 2018/19 2019/20
Jun
2020/21
Jul
2020/21
Production none
41.10 Indonesia 45.08 47.22 48.34 49.43 49.43
26.76 China 27.77 26.43 27.01 27.75 28.00
21.13 Malaysia 22.02 23.24 20.72 21.60 21.60
18.07 European Union 19.04 18.92 18.26 18.14 18.14
11.43 United States 12.11 12.20 12.53 12.62 12.68
9.87 Argentina 8.78 9.48 9.46 9.97 9.96
8.73 Brazil 9.60 9.50 9.85 9.95 9.95
51.77 Other 54.33 56.49 58.39 59.17 59.09
188.85 Total 198.72 203.46 204.55 208.63 208.86
Imports none
15.41 India 14.49 15.25 15.08 15.24 15.24
8.00 China 8.65 11.41 11.24 12.01 11.81
10.87 European Union 10.67 11.49 10.91 10.57 10.57
4.73 United States 4.78 4.70 5.00 4.99 4.99
3.25 Pakistan 3.20 3.27 3.26 3.54 3.54
2.18 Bangladesh 2.50 2.59 2.35 2.45 2.45
2.16 Egypt 1.81 1.60 1.80 1.82 1.87
1.21 Iran 1.21 1.59 1.43 1.49 1.49
1.13 Malaysia 1.12 1.66 1.34 1.45 1.45
1.31 Philippines 1.31 1.17 1.26 1.37 1.37
25.23 Other 25.69 26.54 26.38 27.33 27.33
75.48 Total 75.42 81.26 80.06 82.24 82.10
Exports none
29.86 Indonesia 29.28 30.78 29.96 31.27 31.27
17.47 Malaysia 17.70 19.65 17.53 18.02 18.02
6.11 Ukraine 5.60 6.55 6.81 6.93 6.93
6.28 Argentina 5.08 6.25 6.43 6.90 6.89
2.98 Russia 3.26 3.83 4.47 4.47 4.47
3.29 Canada 3.34 3.34 3.57 3.60 3.56
2.40 European Union 2.51 2.35 2.50 2.42 2.42
12.85 Other 13.26 12.91 13.20 12.64 12.79
81.25 Total 80.03 85.67 84.47 86.24 86.34
Domestic Consumption none
35.73 China 36.86 38.36 38.48 39.58 39.63
26.57 European Union 26.96 27.14 26.65 26.75 26.78
21.68 India 22.20 22.89 22.70 23.04 23.04
11.89 Indonesia 14.69 17.10 17.13 18.42 18.42
14.72 United States 15.54 15.88 15.89 16.37 16.36
7.91 Brazil 8.44 8.91 9.23 9.44 9.39
4.22 Malaysia 4.89 5.28 4.85 5.16 5.21
4.45 Pakistan 4.55 4.68 4.75 4.89 4.91
3.40 Russia 3.51 3.63 3.69 3.93 3.88
2.72 Thailand 2.88 3.25 3.21 3.39 3.39
2.57 Bangladesh 2.82 3.01 3.08 3.19 3.19
3.64 Argentina 3.74 3.23 3.06 3.07 3.07
2.71 Mexico 2.84 2.94 2.98 3.03 3.03
2.41 Japan 2.46 2.57 2.52 2.56 2.56
2.34 Turkey 2.37 2.40 2.41 2.52 2.50
36.42 Other 38.13 39.06 39.68 40.67 40.70
183.38 Total 192.89 200.33 200.31 205.99 206.03
Ending Stocks none
2.50 Indonesia 3.67 3.16 4.47 4.28 4.28
1.76 European Union 1.99 2.90 2.92 2.41 2.43
2.29 Malaysia 2.83 2.81 2.48 2.31 2.31
3.52 China 2.80 2.02 1.59 1.57 1.57
1.23 United States 1.24 1.16 1.28 1.31 1.29
10.60 Other 10.59 9.80 8.93 8.46 8.38
21.90 Total 23.12 21.84 21.67 20.33 20.26
Major Vegetable Oils includes Coconut, Cottonseed, Olive, Palm, Palm Kernel, Peanut, Rapeseed, Soybean, and Sunflowerseed oil.
Foreign Agricultural Service/USDA 14 July 2020Global Market Analysis
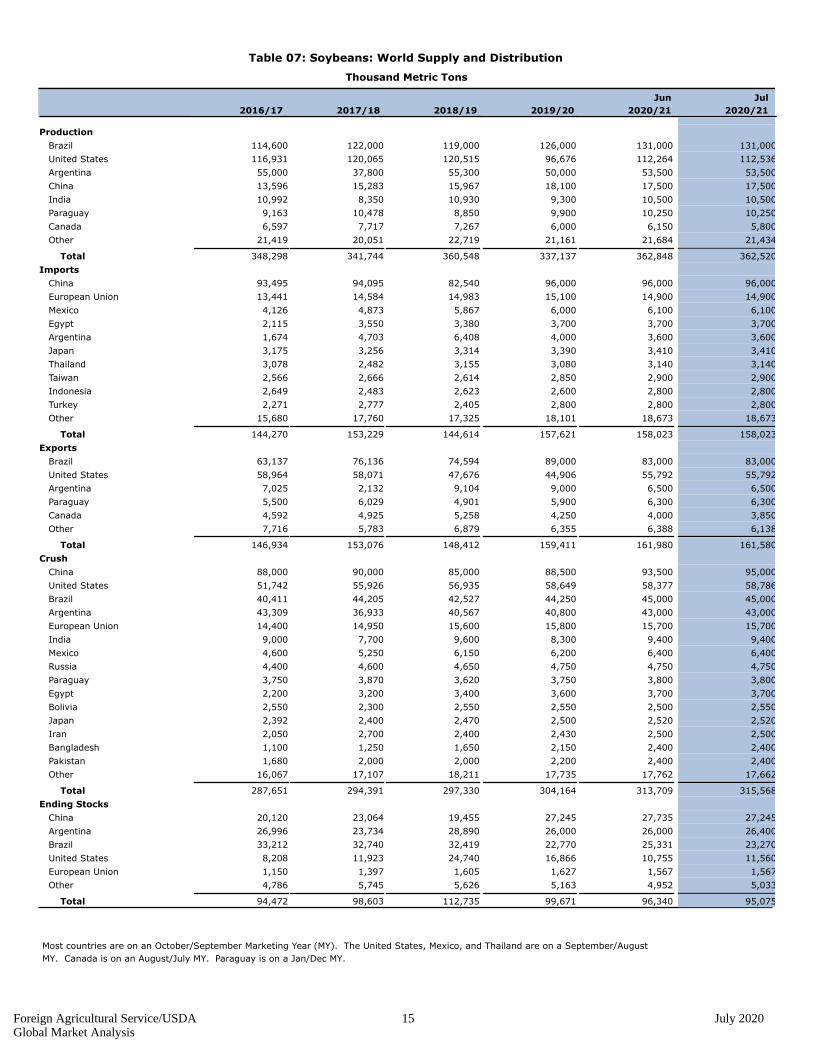
Table 07: Soybeans: World Supply and Distribution
Thousand Metric Tons
2016/17 2017/18 2018/19 2019/20
Jun
2020/21
Jul
2020/21
Production none
114,600 Brazil 122,000 119,000 126,000 131,000 131,000
116,931 United States 120,065 120,515 96,676 112,264 112,536
55,000 Argentina 37,800 55,300 50,000 53,500 53,500
13,596 China 15,283 15,967 18,100 17,500 17,500
10,992 India 8,350 10,930 9,300 10,500 10,500
9,163 Paraguay 10,478 8,850 9,900 10,250 10,250
6,597 Canada 7,717 7,267 6,000 6,150 5,800
21,419 Other 20,051 22,719 21,161 21,684 21,434
348,298 Total 341,744 360,548 337,137 362,848 362,520
Imports none
93,495 China 94,095 82,540 96,000 96,000 96,000
13,441 European Union 14,584 14,983 15,100 14,900 14,900
4,126 Mexico 4,873 5,867 6,000 6,100 6,100
2,115 Egypt 3,550 3,380 3,700 3,700 3,700
1,674 Argentina 4,703 6,408 4,000 3,600 3,600
3,175 Japan 3,256 3,314 3,390 3,410 3,410
3,078 Thailand 2,482 3,155 3,080 3,140 3,140
2,566 Taiwan 2,666 2,614 2,850 2,900 2,900
2,649 Indonesia 2,483 2,623 2,600 2,800 2,800
2,271 Turkey 2,777 2,405 2,800 2,800 2,800
15,680 Other 17,760 17,325 18,101 18,673 18,673
144,270 Total 153,229 144,614 157,621 158,023 158,023
Exports none
63,137 Brazil 76,136 74,594 89,000 83,000 83,000
58,964 United States 58,071 47,676 44,906 55,792 55,792
7,025 Argentina 2,132 9,104 9,000 6,500 6,500
5,500 Paraguay 6,029 4,901 5,900 6,300 6,300
4,592 Canada 4,925 5,258 4,250 4,000 3,850
7,716 Other 5,783 6,879 6,355 6,388 6,138
146,934 Total 153,076 148,412 159,411 161,980 161,580
Crush none
88,000 China 90,000 85,000 88,500 93,500 95,000
51,742 United States 55,926 56,935 58,649 58,377 58,786
40,411 Brazil 44,205 42,527 44,250 45,000 45,000
43,309 Argentina 36,933 40,567 40,800 43,000 43,000
14,400 European Union 14,950 15,600 15,800 15,700 15,700
9,000 India 7,700 9,600 8,300 9,400 9,400
4,600 Mexico 5,250 6,150 6,200 6,400 6,400
4,400 Russia 4,600 4,650 4,750 4,750 4,750
3,750 Paraguay 3,870 3,620 3,750 3,800 3,800
2,200 Egypt 3,200 3,400 3,600 3,700 3,700
2,550 Bolivia 2,300 2,550 2,550 2,500 2,550
2,392 Japan 2,400 2,470 2,500 2,520 2,520
2,050 Iran 2,700 2,400 2,430 2,500 2,500
1,100 Bangladesh 1,250 1,650 2,150 2,400 2,400
1,680 Pakistan 2,000 2,000 2,200 2,400 2,400
16,067 Other 17,107 18,211 17,735 17,762 17,662
287,651 Total 294,391 297,330 304,164 313,709 315,568
Ending Stocks none
20,120 China 23,064 19,455 27,245 27,735 27,245
26,996 Argentina 23,734 28,890 26,000 26,000 26,400
33,212 Brazil 32,740 32,419 22,770 25,331 23,270
8,208 United States 11,923 24,740 16,866 10,755 11,560
1,150 European Union 1,397 1,605 1,627 1,567 1,567
4,786 Other 5,745 5,626 5,163 4,952 5,033
94,472 Total 98,603 112,735 99,671 96,340 95,075
Most countries are on an October/September Marketing Year (MY). The United States, Mexico, and Thailand are on a September/August
MY. Canada is on an August/July MY. Paraguay is on a Jan/Dec MY.
Foreign Agricultural Service/USDA 15 July 2020Global Market Analysis
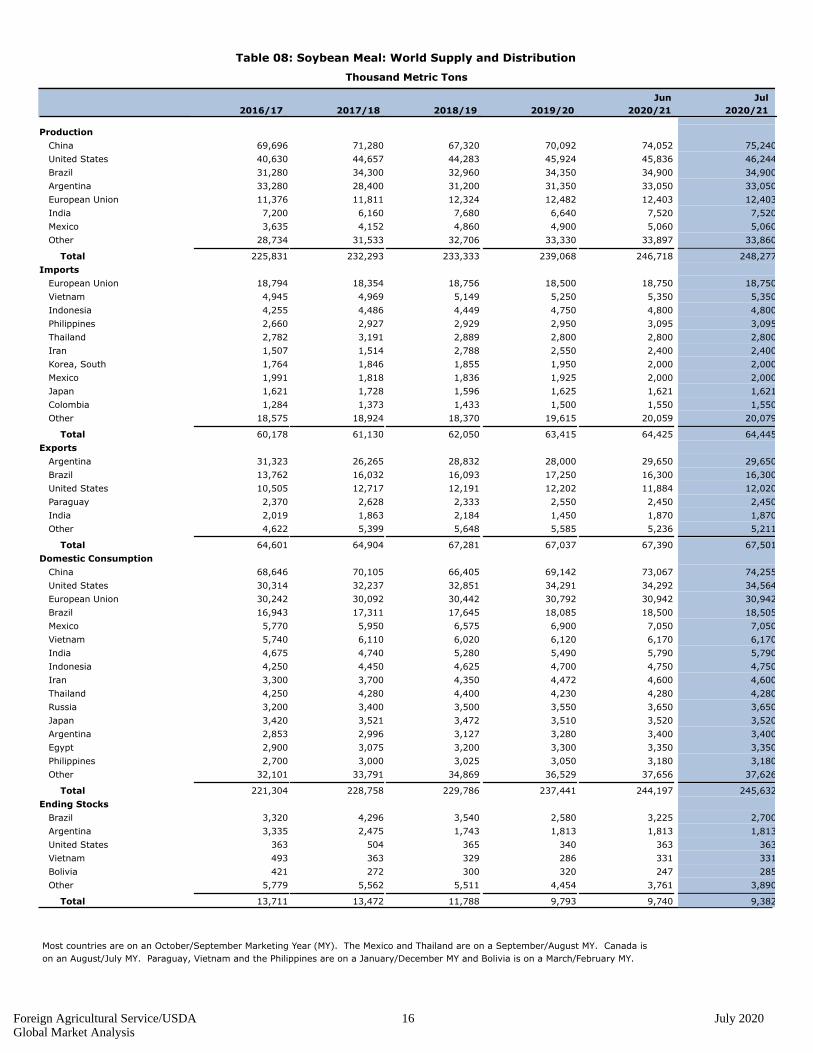
Table 08: Soybean Meal: World Supply and Distribution
Thousand Metric Tons
2016/17 2017/18 2018/19 2019/20
Jun
2020/21
Jul
2020/21
Production none
69,696 China 71,280 67,320 70,092 74,052 75,240
40,630 United States 44,657 44,283 45,924 45,836 46,244
31,280 Brazil 34,300 32,960 34,350 34,900 34,900
33,280 Argentina 28,400 31,200 31,350 33,050 33,050
11,376 European Union 11,811 12,324 12,482 12,403 12,403
7,200 India 6,160 7,680 6,640 7,520 7,520
3,635 Mexico 4,152 4,860 4,900 5,060 5,060
28,734 Other 31,533 32,706 33,330 33,897 33,860
225,831 Total 232,293 233,333 239,068 246,718 248,277
Imports none
18,794 European Union 18,354 18,756 18,500 18,750 18,750
4,945 Vietnam 4,969 5,149 5,250 5,350 5,350
4,255 Indonesia 4,486 4,449 4,750 4,800 4,800
2,660 Philippines 2,927 2,929 2,950 3,095 3,095
2,782 Thailand 3,191 2,889 2,800 2,800 2,800
1,507 Iran 1,514 2,788 2,550 2,400 2,400
1,764 Korea, South 1,846 1,855 1,950 2,000 2,000
1,991 Mexico 1,818 1,836 1,925 2,000 2,000
1,621 Japan 1,728 1,596 1,625 1,621 1,621
1,284 Colombia 1,373 1,433 1,500 1,550 1,550
18,575 Other 18,924 18,370 19,615 20,059 20,079
60,178 Total 61,130 62,050 63,415 64,425 64,445
Exports none
31,323 Argentina 26,265 28,832 28,000 29,650 29,650
13,762 Brazil 16,032 16,093 17,250 16,300 16,300
10,505 United States 12,717 12,191 12,202 11,884 12,020
2,370 Paraguay 2,628 2,333 2,550 2,450 2,450
2,019 India 1,863 2,184 1,450 1,870 1,870
4,622 Other 5,399 5,648 5,585 5,236 5,211
64,601 Total 64,904 67,281 67,037 67,390 67,501
Domestic Consumption none
68,646 China 70,105 66,405 69,142 73,067 74,255
30,314 United States 32,237 32,851 34,291 34,292 34,564
30,242 European Union 30,092 30,442 30,792 30,942 30,942
16,943 Brazil 17,311 17,645 18,085 18,500 18,505
5,770 Mexico 5,950 6,575 6,900 7,050 7,050
5,740 Vietnam 6,110 6,020 6,120 6,170 6,170
4,675 India 4,740 5,280 5,490 5,790 5,790
4,250 Indonesia 4,450 4,625 4,700 4,750 4,750
3,300 Iran 3,700 4,350 4,472 4,600 4,600
4,250 Thailand 4,280 4,400 4,230 4,280 4,280
3,200 Russia 3,400 3,500 3,550 3,650 3,650
3,420 Japan 3,521 3,472 3,510 3,520 3,520
2,853 Argentina 2,996 3,127 3,280 3,400 3,400
2,900 Egypt 3,075 3,200 3,300 3,350 3,350
2,700 Philippines 3,000 3,025 3,050 3,180 3,180
32,101 Other 33,791 34,869 36,529 37,656 37,626
221,304 Total 228,758 229,786 237,441 244,197 245,632
Ending Stocks none
3,320 Brazil 4,296 3,540 2,580 3,225 2,700
3,335 Argentina 2,475 1,743 1,813 1,813 1,813
363 United States 504 365 340 363 363
493 Vietnam 363 329 286 331 331
421 Bolivia 272 300 320 247 285
5,779 Other 5,562 5,511 4,454 3,761 3,890
13,711 Total 13,472 11,788 9,793 9,740 9,382
Most countries are on an October/September Marketing Year (MY). The Mexico and Thailand are on a September/August MY. Canada is
on an August/July MY. Paraguay, Vietnam and the Philippines are on a January/December MY and Bolivia is on a March/February MY.
Foreign Agricultural Service/USDA 16 July 2020Global Market Analysis
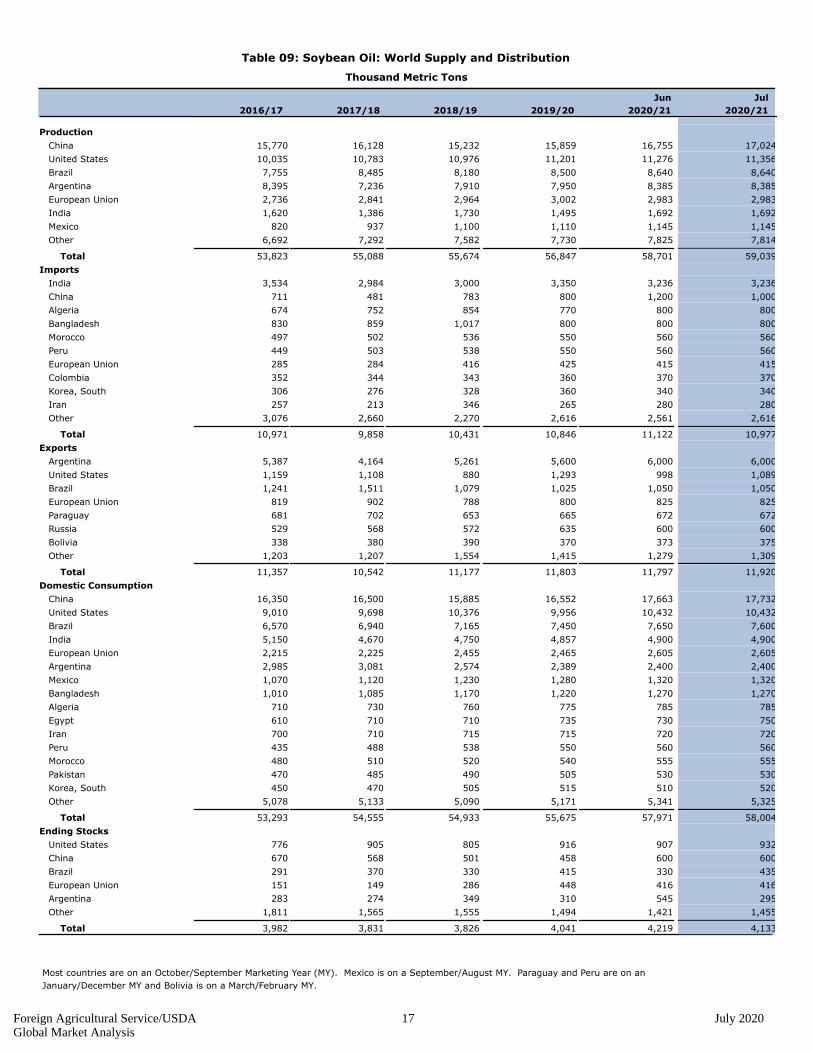
Table 09: Soybean Oil: World Supply and Distribution
Thousand Metric Tons
2016/17 2017/18 2018/19 2019/20
Jun
2020/21
Jul
2020/21
Production none
15,770 China 16,128 15,232 15,859 16,755 17,024
10,035 United States 10,783 10,976 11,201 11,276 11,356
7,755 Brazil 8,485 8,180 8,500 8,640 8,640
8,395 Argentina 7,236 7,910 7,950 8,385 8,385
2,736 European Union 2,841 2,964 3,002 2,983 2,983
1,620 India 1,386 1,730 1,495 1,692 1,692
820 Mexico 937 1,100 1,110 1,145 1,145
6,692 Other 7,292 7,582 7,730 7,825 7,814
53,823 Total 55,088 55,674 56,847 58,701 59,039
Imports none
3,534 India 2,984 3,000 3,350 3,236 3,236
711 China 481 783 800 1,200 1,000
674 Algeria 752 854 770 800 800
830 Bangladesh 859 1,017 800 800 800
497 Morocco 502 536 550 560 560
449 Peru 503 538 550 560 560
285 European Union 284 416 425 415 415
352 Colombia 344 343 360 370 370
306 Korea, South 276 328 360 340 340
257 Iran 213 346 265 280 280
3,076 Other 2,660 2,270 2,616 2,561 2,616
10,971 Total 9,858 10,431 10,846 11,122 10,977
Exports none
5,387 Argentina 4,164 5,261 5,600 6,000 6,000
1,159 United States 1,108 880 1,293 998 1,089
1,241 Brazil 1,511 1,079 1,025 1,050 1,050
819 European Union 902 788 800 825 825
681 Paraguay 702 653 665 672 672
529 Russia 568 572 635 600 600
338 Bolivia 380 390 370 373 375
1,203 Other 1,207 1,554 1,415 1,279 1,309
11,357 Total 10,542 11,177 11,803 11,797 11,920
Domestic Consumption none
16,350 China 16,500 15,885 16,552 17,663 17,732
9,010 United States 9,698 10,376 9,956 10,432 10,432
6,570 Brazil 6,940 7,165 7,450 7,650 7,600
5,150 India 4,670 4,750 4,857 4,900 4,900
2,215 European Union 2,225 2,455 2,465 2,605 2,605
2,985 Argentina 3,081 2,574 2,389 2,400 2,400
1,070 Mexico 1,120 1,230 1,280 1,320 1,320
1,010 Bangladesh 1,085 1,170 1,220 1,270 1,270
710 Algeria 730 760 775 785 785
610 Egypt 710 710 735 730 750
700 Iran 710 715 715 720 720
435 Peru 488 538 550 560 560
480 Morocco 510 520 540 555 555
470 Pakistan 485 490 505 530 530
450 Korea, South 470 505 515 510 520
5,078 Other 5,133 5,090 5,171 5,341 5,325
53,293 Total 54,555 54,933 55,675 57,971 58,004
Ending Stocks none
776 United States 905 805 916 907 932
670 China 568 501 458 600 600
291 Brazil 370 330 415 330 435
151 European Union 149 286 448 416 416
283 Argentina 274 349 310 545 295
1,811 Other 1,565 1,555 1,494 1,421 1,455
3,982 Total 3,831 3,826 4,041 4,219 4,133
Most countries are on an October/September Marketing Year (MY). Mexico is on a September/August MY. Paraguay and Peru are on an
January/December MY and Bolivia is on a March/February MY.
Foreign Agricultural Service/USDA 17 July 2020Global Market Analysis
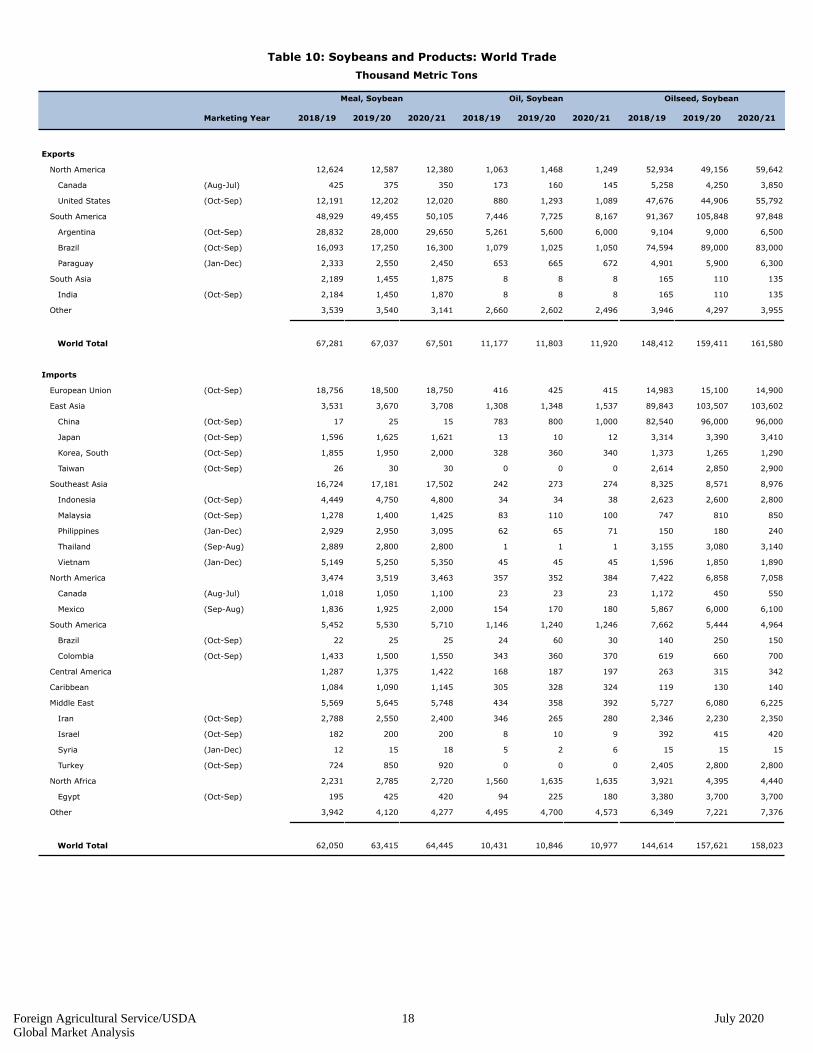
Table 10: Soybeans and Products: World Trade
Thousand Metric Tons
Marketing Year
Meal, Soybean Oil, Soybean Oilseed, Soybean
2020/212019/202018/192020/212019/202018/192020/212019/202018/19
Exports
North America 12,624 12,587 12,380 1,063 1,468 1,249 52,934 49,156 59,642
Canada (Aug-Jul) 425 375 350 173 160 145 5,258 4,250 3,850
United States (Oct-Sep) 12,191 12,202 12,020 880 1,293 1,089 47,676 44,906 55,792
South America 48,929 49,455 50,105 7,446 7,725 8,167 91,367 105,848 97,848
Argentina (Oct-Sep) 28,832 28,000 29,650 5,261 5,600 6,000 9,104 9,000 6,500
Brazil (Oct-Sep) 16,093 17,250 16,300 1,079 1,025 1,050 74,594 89,000 83,000
Paraguay (Jan-Dec) 2,333 2,550 2,450 653 665 672 4,901 5,900 6,300
South Asia 2,189 1,455 1,875 8 8 8 165 110 135
India (Oct-Sep) 2,184 1,450 1,870 8 8 8 165 110 135
Other 3,539 3,540 3,141 2,660 2,602 2,496 3,946 4,297 3,955
World Total 67,281 67,037 67,501 11,177 11,803 11,920 148,412 159,411 161,580
Imports
European Union (Oct-Sep) 18,756 18,500 18,750 416 425 415 14,983 15,100 14,900
East Asia 3,531 3,670 3,708 1,308 1,348 1,537 89,843 103,507 103,602
China (Oct-Sep) 17 25 15 783 800 1,000 82,540 96,000 96,000
Japan (Oct-Sep) 1,596 1,625 1,621 13 10 12 3,314 3,390 3,410
Korea, South (Oct-Sep) 1,855 1,950 2,000 328 360 340 1,373 1,265 1,290
Taiwan (Oct-Sep) 26 30 30 0 0 0 2,614 2,850 2,900
Southeast Asia 16,724 17,181 17,502 242 273 274 8,325 8,571 8,976
Indonesia (Oct-Sep) 4,449 4,750 4,800 34 34 38 2,623 2,600 2,800
Malaysia (Oct-Sep) 1,278 1,400 1,425 83 110 100 747 810 850
Philippines (Jan-Dec) 2,929 2,950 3,095 62 65 71 150 180 240
Thailand (Sep-Aug) 2,889 2,800 2,800 1 1 1 3,155 3,080 3,140
Vietnam (Jan-Dec) 5,149 5,250 5,350 45 45 45 1,596 1,850 1,890
North America 3,474 3,519 3,463 357 352 384 7,422 6,858 7,058
Canada (Aug-Jul) 1,018 1,050 1,100 23 23 23 1,172 450 550
Mexico (Sep-Aug) 1,836 1,925 2,000 154 170 180 5,867 6,000 6,100
South America 5,452 5,530 5,710 1,146 1,240 1,246 7,662 5,444 4,964
Brazil (Oct-Sep) 22 25 25 24 60 30 140 250 150
Colombia (Oct-Sep) 1,433 1,500 1,550 343 360 370 619 660 700
Central America 1,287 1,375 1,422 168 187 197 263 315 342
Caribbean 1,084 1,090 1,145 305 328 324 119 130 140
Middle East 5,569 5,645 5,748 434 358 392 5,727 6,080 6,225
Iran (Oct-Sep) 2,788 2,550 2,400 346 265 280 2,346 2,230 2,350
Israel (Oct-Sep) 182 200 200 8 10 9 392 415 420
Syria (Jan-Dec) 12 15 18 5 2 6 15 15 15
Turkey (Oct-Sep) 724 850 920 0 0 0 2,405 2,800 2,800
North Africa 2,231 2,785 2,720 1,560 1,635 1,635 3,921 4,395 4,440
Egypt (Oct-Sep) 195 425 420 94 225 180 3,380 3,700 3,700
Other 3,942 4,120 4,277 4,495 4,700 4,573 6,349 7,221 7,376
World Total 62,050 63,415 64,445 10,431 10,846 10,977 144,614 157,621 158,023
Foreign Agricultural Service/USDA 18 July 2020Global Market Analysis
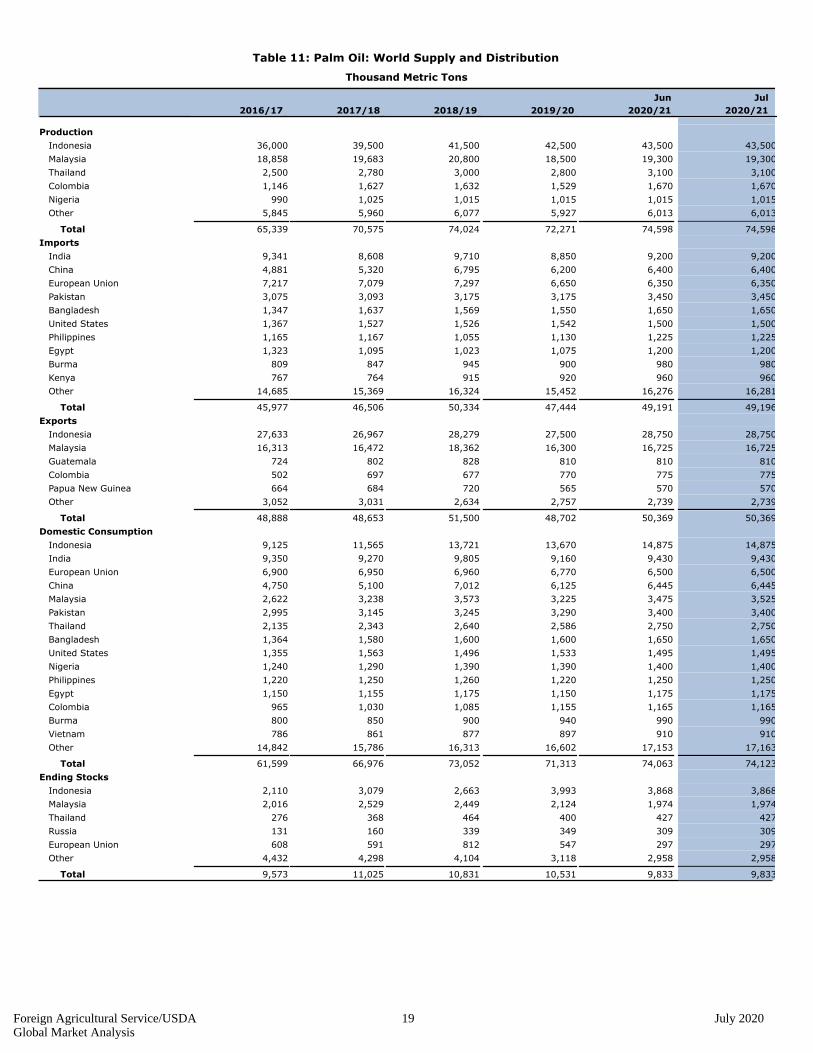
Table 11: Palm Oil: World Supply and Distribution
Thousand Metric Tons
2016/17 2017/18 2018/19 2019/20
Jun
2020/21
Jul
2020/21
Production none
36,000 Indonesia 39,500 41,500 42,500 43,500 43,500
18,858 Malaysia 19,683 20,800 18,500 19,300 19,300
2,500 Thailand 2,780 3,000 2,800 3,100 3,100
1,146 Colombia 1,627 1,632 1,529 1,670 1,670
990 Nigeria 1,025 1,015 1,015 1,015 1,015
5,845 Other 5,960 6,077 5,927 6,013 6,013
65,339 Total 70,575 74,024 72,271 74,598 74,598
Imports none
9,341 India 8,608 9,710 8,850 9,200 9,200
4,881 China 5,320 6,795 6,200 6,400 6,400
7,217 European Union 7,079 7,297 6,650 6,350 6,350
3,075 Pakistan 3,093 3,175 3,175 3,450 3,450
1,347 Bangladesh 1,637 1,569 1,550 1,650 1,650
1,367 United States 1,527 1,526 1,542 1,500 1,500
1,165 Philippines 1,167 1,055 1,130 1,225 1,225
1,323 Egypt 1,095 1,023 1,075 1,200 1,200
809 Burma 847 945 900 980 980
767 Kenya 764 915 920 960 960
14,685 Other 15,369 16,324 15,452 16,276 16,281
45,977 Total 46,506 50,334 47,444 49,191 49,196
Exports none
27,633 Indonesia 26,967 28,279 27,500 28,750 28,750
16,313 Malaysia 16,472 18,362 16,300 16,725 16,725
724 Guatemala 802 828 810 810 810
502 Colombia 697 677 770 775 775
664 Papua New Guinea 684 720 565 570 570
3,052 Other 3,031 2,634 2,757 2,739 2,739
48,888 Total 48,653 51,500 48,702 50,369 50,369
Domestic Consumption none
9,125 Indonesia 11,565 13,721 13,670 14,875 14,875
9,350 India 9,270 9,805 9,160 9,430 9,430
6,900 European Union 6,950 6,960 6,770 6,500 6,500
4,750 China 5,100 7,012 6,125 6,445 6,445
2,622 Malaysia 3,238 3,573 3,225 3,475 3,525
2,995 Pakistan 3,145 3,245 3,290 3,400 3,400
2,135 Thailand 2,343 2,640 2,586 2,750 2,750
1,364 Bangladesh 1,580 1,600 1,600 1,650 1,650
1,355 United States 1,563 1,496 1,533 1,495 1,495
1,240 Nigeria 1,290 1,390 1,390 1,400 1,400
1,220 Philippines 1,250 1,260 1,220 1,250 1,250
1,150 Egypt 1,155 1,175 1,150 1,175 1,175
965 Colombia 1,030 1,085 1,155 1,165 1,165
800 Burma 850 900 940 990 990
786 Vietnam 861 877 897 910 910
14,842 Other 15,786 16,313 16,602 17,153 17,163
61,599 Total 66,976 73,052 71,313 74,063 74,123
Ending Stocks none
2,110 Indonesia 3,079 2,663 3,993 3,868 3,868
2,016 Malaysia 2,529 2,449 2,124 1,974 1,974
276 Thailand 368 464 400 427 427
131 Russia 160 339 349 309 309
608 European Union 591 812 547 297 297
4,432 Other 4,298 4,104 3,118 2,958 2,958
9,573 Total 11,025 10,831 10,531 9,833 9,833
Foreign Agricultural Service/USDA 19 July 2020Global Market Analysis
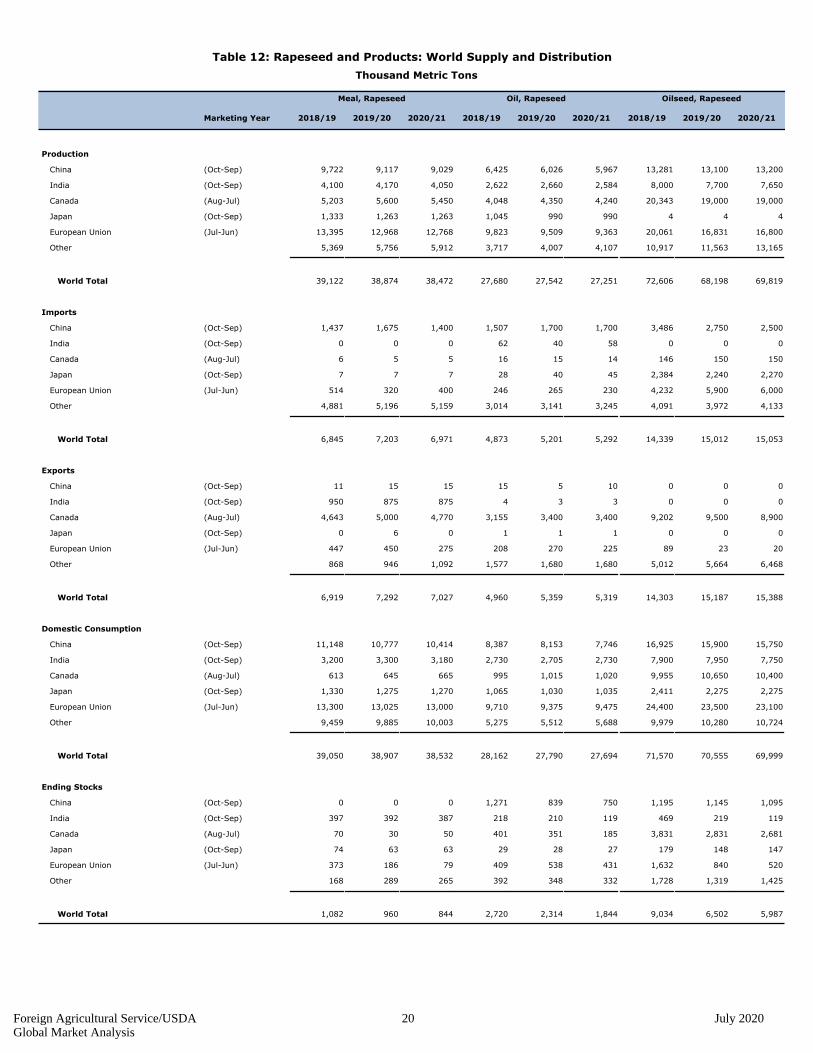
Table 12: Rapeseed and Products: World Supply and Distribution
Thousand Metric Tons
Marketing Year
Meal, Rapeseed Oil, Rapeseed Oilseed, Rapeseed
2020/212019/202018/192020/212019/202018/192020/212019/202018/19
Production
China (Oct-Sep) 9,722 9,117 9,029 6,425 6,026 5,967 13,281 13,100 13,200
India (Oct-Sep) 4,100 4,170 4,050 2,622 2,660 2,584 8,000 7,700 7,650
Canada (Aug-Jul) 5,203 5,600 5,450 4,048 4,350 4,240 20,343 19,000 19,000
Japan (Oct-Sep) 1,333 1,263 1,263 1,045 990 990 4 4 4
European Union (Jul-Jun) 13,395 12,968 12,768 9,823 9,509 9,363 20,061 16,831 16,800
Other 5,369 5,756 5,912 3,717 4,007 4,107 10,917 11,563 13,165
World Total 39,122 38,874 38,472 27,680 27,542 27,251 72,606 68,198 69,819
Imports
China (Oct-Sep) 1,437 1,675 1,400 1,507 1,700 1,700 3,486 2,750 2,500
India (Oct-Sep) 0 0 0 62 40 58 0 0 0
Canada (Aug-Jul) 6 5 5 16 15 14 146 150 150
Japan (Oct-Sep) 7 7 7 28 40 45 2,384 2,240 2,270
European Union (Jul-Jun) 514 320 400 246 265 230 4,232 5,900 6,000
Other 4,881 5,196 5,159 3,014 3,141 3,245 4,091 3,972 4,133
World Total 6,845 7,203 6,971 4,873 5,201 5,292 14,339 15,012 15,053
Exports
China (Oct-Sep) 11 15 15 15 5 10 0 0 0
India (Oct-Sep) 950 875 875 4 3 3 0 0 0
Canada (Aug-Jul) 4,643 5,000 4,770 3,155 3,400 3,400 9,202 9,500 8,900
Japan (Oct-Sep) 0 6 0 1 1 1 0 0 0
European Union (Jul-Jun) 447 450 275 208 270 225 89 23 20
Other 868 946 1,092 1,577 1,680 1,680 5,012 5,664 6,468
World Total 6,919 7,292 7,027 4,960 5,359 5,319 14,303 15,187 15,388
Domestic Consumption
China (Oct-Sep) 11,148 10,777 10,414 8,387 8,153 7,746 16,925 15,900 15,750
India (Oct-Sep) 3,200 3,300 3,180 2,730 2,705 2,730 7,900 7,950 7,750
Canada (Aug-Jul) 613 645 665 995 1,015 1,020 9,955 10,650 10,400
Japan (Oct-Sep) 1,330 1,275 1,270 1,065 1,030 1,035 2,411 2,275 2,275
European Union (Jul-Jun) 13,300 13,025 13,000 9,710 9,375 9,475 24,400 23,500 23,100
Other 9,459 9,885 10,003 5,275 5,512 5,688 9,979 10,280 10,724
World Total 39,050 38,907 38,532 28,162 27,790 27,694 71,570 70,555 69,999
Ending Stocks
China (Oct-Sep) 0 0 0 1,271 839 750 1,195 1,145 1,095
India (Oct-Sep) 397 392 387 218 210 119 469 219 119
Canada (Aug-Jul) 70 30 50 401 351 185 3,831 2,831 2,681
Japan (Oct-Sep) 74 63 63 29 28 27 179 148 147
European Union (Jul-Jun) 373 186 79 409 538 431 1,632 840 520
Other 168 289 265 392 348 332 1,728 1,319 1,425
World Total 1,082 960 844 2,720 2,314 1,844 9,034 6,502 5,987
Foreign Agricultural Service/USDA 20 July 2020Global Market Analysis
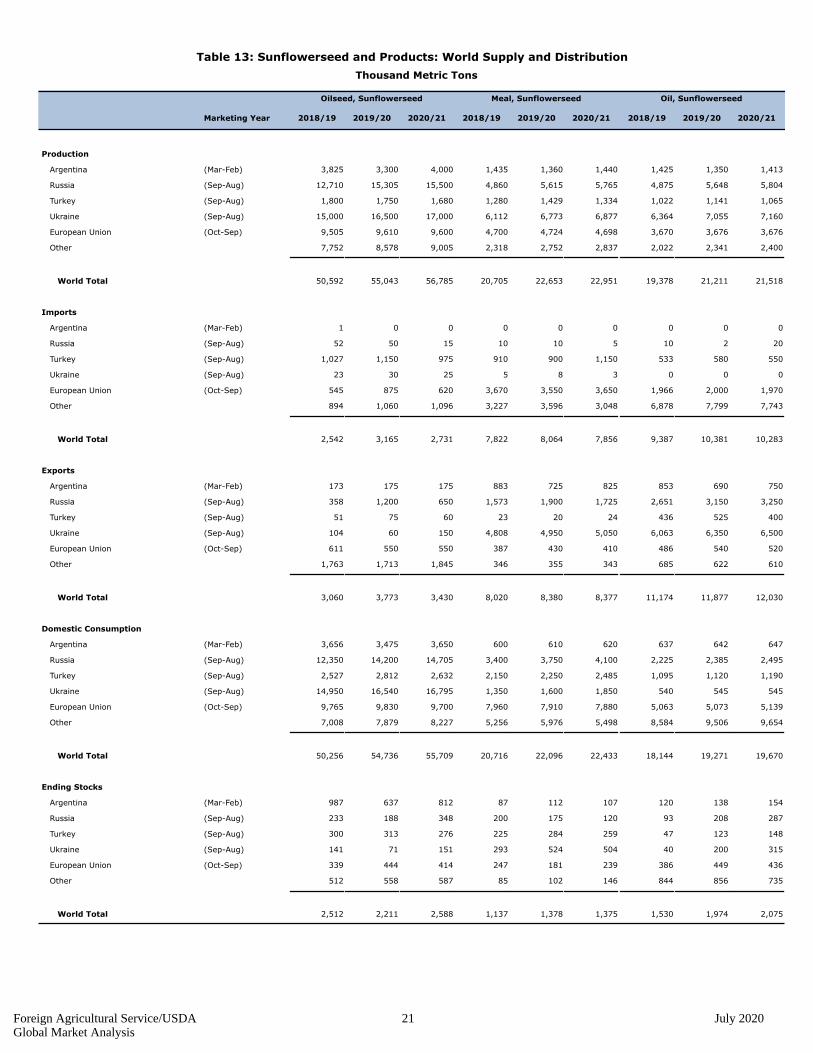
Table 13: Sunflowerseed and Products: World Supply and Distribution
Thousand Metric Tons
Marketing Year
Oilseed, Sunflowerseed Meal, Sunflowerseed Oil, Sunflowerseed
2020/212019/202018/192020/212019/202018/192020/212019/202018/19
Production
Argentina (Mar-Feb) 3,825 3,300 4,000 1,435 1,360 1,440 1,425 1,350 1,413
Russia (Sep-Aug) 12,710 15,305 15,500 4,860 5,615 5,765 4,875 5,648 5,804
Turkey (Sep-Aug) 1,800 1,750 1,680 1,280 1,429 1,334 1,022 1,141 1,065
Ukraine (Sep-Aug) 15,000 16,500 17,000 6,112 6,773 6,877 6,364 7,055 7,160
European Union (Oct-Sep) 9,505 9,610 9,600 4,700 4,724 4,698 3,670 3,676 3,676
Other 7,752 8,578 9,005 2,318 2,752 2,837 2,022 2,341 2,400
World Total 50,592 55,043 56,785 20,705 22,653 22,951 19,378 21,211 21,518
Imports
Argentina (Mar-Feb) 1 0 0 0 0 0 0 0 0
Russia (Sep-Aug) 52 50 15 10 10 5 10 2 20
Turkey (Sep-Aug) 1,027 1,150 975 910 900 1,150 533 580 550
Ukraine (Sep-Aug) 23 30 25 5 8 3 0 0 0
European Union (Oct-Sep) 545 875 620 3,670 3,550 3,650 1,966 2,000 1,970
Other 894 1,060 1,096 3,227 3,596 3,048 6,878 7,799 7,743
World Total 2,542 3,165 2,731 7,822 8,064 7,856 9,387 10,381 10,283
Exports
Argentina (Mar-Feb) 173 175 175 883 725 825 853 690 750
Russia (Sep-Aug) 358 1,200 650 1,573 1,900 1,725 2,651 3,150 3,250
Turkey (Sep-Aug) 51 75 60 23 20 24 436 525 400
Ukraine (Sep-Aug) 104 60 150 4,808 4,950 5,050 6,063 6,350 6,500
European Union (Oct-Sep) 611 550 550 387 430 410 486 540 520
Other 1,763 1,713 1,845 346 355 343 685 622 610
World Total 3,060 3,773 3,430 8,020 8,380 8,377 11,174 11,877 12,030
Domestic Consumption
Argentina (Mar-Feb) 3,656 3,475 3,650 600 610 620 637 642 647
Russia (Sep-Aug) 12,350 14,200 14,705 3,400 3,750 4,100 2,225 2,385 2,495
Turkey (Sep-Aug) 2,527 2,812 2,632 2,150 2,250 2,485 1,095 1,120 1,190
Ukraine (Sep-Aug) 14,950 16,540 16,795 1,350 1,600 1,850 540 545 545
European Union (Oct-Sep) 9,765 9,830 9,700 7,960 7,910 7,880 5,063 5,073 5,139
Other 7,008 7,879 8,227 5,256 5,976 5,498 8,584 9,506 9,654
World Total 50,256 54,736 55,709 20,716 22,096 22,433 18,144 19,271 19,670
Ending Stocks
Argentina (Mar-Feb) 987 637 812 87 112 107 120 138 154
Russia (Sep-Aug) 233 188 348 200 175 120 93 208 287
Turkey (Sep-Aug) 300 313 276 225 284 259 47 123 148
Ukraine (Sep-Aug) 141 71 151 293 524 504 40 200 315
European Union (Oct-Sep) 339 444 414 247 181 239 386 449 436
Other 512 558 587 85 102 146 844 856 735
World Total 2,512 2,211 2,588 1,137 1,378 1,375 1,530 1,974 2,075
Foreign Agricultural Service/USDA 21 July 2020Global Market Analysis
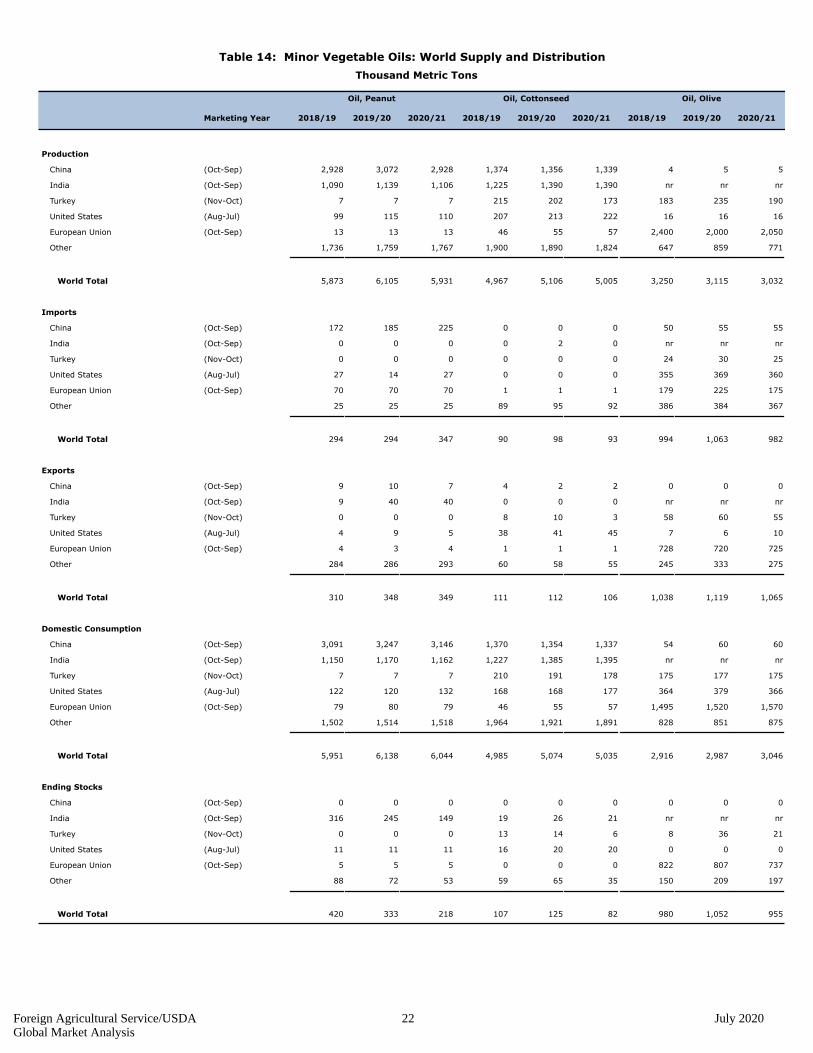
Table 14: Minor Vegetable Oils: World Supply and Distribution
Thousand Metric Tons
Marketing Year
Oil, Peanut Oil, Cottonseed Oil, Olive
2020/212019/202018/192020/212019/202018/192020/212019/202018/19
Production
China (Oct-Sep) 2,928 3,072 2,928 1,374 1,356 1,339 4 5 5
India (Oct-Sep) 1,090 1,139 1,106 1,225 1,390 1,390 nr nr nr
Turkey (Nov-Oct) 7 7 7 215 202 173 183 235 190
United States (Aug-Jul) 99 115 110 207 213 222 16 16 16
European Union (Oct-Sep) 13 13 13 46 55 57 2,400 2,000 2,050
Other 1,736 1,759 1,767 1,900 1,890 1,824 647 859 771
World Total 5,873 6,105 5,931 4,967 5,106 5,005 3,250 3,115 3,032
Imports
China (Oct-Sep) 172 185 225 0 0 0 50 55 55
India (Oct-Sep) 0 0 0 0 2 0 nr nr nr
Turkey (Nov-Oct) 0 0 0 0 0 0 24 30 25
United States (Aug-Jul) 27 14 27 0 0 0 355 369 360
European Union (Oct-Sep) 70 70 70 1 1 1 179 225 175
Other 25 25 25 89 95 92 386 384 367
World Total 294 294 347 90 98 93 994 1,063 982
Exports
China (Oct-Sep) 9 10 7 4 2 2 0 0 0
India (Oct-Sep) 9 40 40 0 0 0 nr nr nr
Turkey (Nov-Oct) 0 0 0 8 10 3 58 60 55
United States (Aug-Jul) 4 9 5 38 41 45 7 6 10
European Union (Oct-Sep) 4 3 4 1 1 1 728 720 725
Other 284 286 293 60 58 55 245 333 275
World Total 310 348 349 111 112 106 1,038 1,119 1,065
Domestic Consumption
China (Oct-Sep) 3,091 3,247 3,146 1,370 1,354 1,337 54 60 60
India (Oct-Sep) 1,150 1,170 1,162 1,227 1,385 1,395 nr nr nr
Turkey (Nov-Oct) 7 7 7 210 191 178 175 177 175
United States (Aug-Jul) 122 120 132 168 168 177 364 379 366
European Union (Oct-Sep) 79 80 79 46 55 57 1,495 1,520 1,570
Other 1,502 1,514 1,518 1,964 1,921 1,891 828 851 875
World Total 5,951 6,138 6,044 4,985 5,074 5,035 2,916 2,987 3,046
Ending Stocks
China (Oct-Sep) 0 0 0 0 0 0 0 0 0
India (Oct-Sep) 316 245 149 19 26 21 nr nr nr
Turkey (Nov-Oct) 0 0 0 13 14 6 8 36 21
United States (Aug-Jul) 11 11 11 16 20 20 0 0 0
European Union (Oct-Sep) 5 5 5 0 0 0 822 807 737
Other 88 72 53 59 65 35 150 209 197
World Total 420 333 218 107 125 82 980 1,052 955
Foreign Agricultural Service/USDA 22 July 2020Global Market Analysis
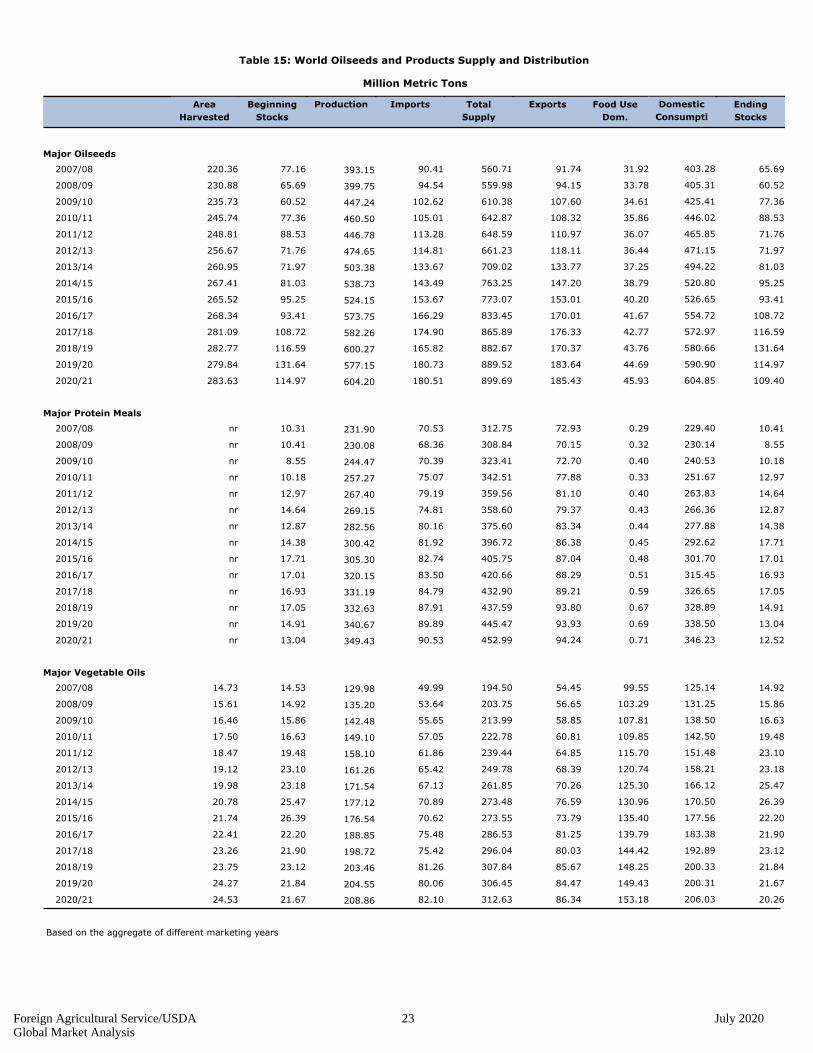
Table 15: World Oilseeds and Products Supply and Distribution
Million Metric Tons
Area
Harvested
Beginning
Stocks
Production Imports Total
Supply
Exports Food Use
Dom.
Domestic
Consumpti
Ending
Stocks
Major Oilseeds
393.15 31.9291.74560.7190.4177.16220.36 2007/08 403.28 65.69
399.75 33.7894.15559.9894.5465.69230.88 2008/09 405.31 60.52
447.24 34.61107.60610.38102.6260.52235.73 2009/10 425.41 77.36
460.50 35.86108.32642.87105.0177.36245.74 2010/11 446.02 88.53
446.78 36.07110.97648.59113.2888.53248.81 2011/12 465.85 71.76
474.65 36.44118.11661.23114.8171.76256.67 2012/13 471.15 71.97
503.38 37.25133.77709.02133.6771.97260.95 2013/14 494.22 81.03
538.73 38.79147.20763.25143.4981.03267.41 2014/15 520.80 95.25
524.15 40.20153.01773.07153.6795.25265.52 2015/16 526.65 93.41
573.75 41.67170.01833.45166.2993.41268.34 2016/17 554.72 108.72
582.26 42.77176.33865.89174.90108.72281.09 2017/18 572.97 116.59
600.27 43.76170.37882.67165.82116.59282.77 2018/19 580.66 131.64
577.15 44.69183.64889.52180.73131.64279.84 2019/20 590.90 114.97
604.20 45.93185.43899.69180.51114.97283.63 2020/21 604.85 109.40
Major Protein Meals
231.90 0.2972.93312.7570.5310.31nr 2007/08 229.40 10.41
230.08 0.3270.15308.8468.3610.41nr 2008/09 230.14 8.55
244.47 0.4072.70323.4170.398.55nr 2009/10 240.53 10.18
257.27 0.3377.88342.5175.0710.18nr 2010/11 251.67 12.97
267.40 0.4081.10359.5679.1912.97nr 2011/12 263.83 14.64
269.15 0.4379.37358.6074.8114.64nr 2012/13 266.36 12.87
282.56 0.4483.34375.6080.1612.87nr 2013/14 277.88 14.38
300.42 0.4586.38396.7281.9214.38nr 2014/15 292.62 17.71
305.30 0.4887.04405.7582.7417.71nr 2015/16 301.70 17.01
320.15 0.5188.29420.6683.5017.01nr 2016/17 315.45 16.93
331.19 0.5989.21432.9084.7916.93nr 2017/18 326.65 17.05
332.63 0.6793.80437.5987.9117.05nr 2018/19 328.89 14.91
340.67 0.6993.93445.4789.8914.91nr 2019/20 338.50 13.04
349.43 0.7194.24452.9990.5313.04nr 2020/21 346.23 12.52
Major Vegetable Oils
129.98 99.5554.45194.5049.9914.5314.73 2007/08 125.14 14.92
135.20 103.2956.65203.7553.6414.9215.61 2008/09 131.25 15.86
142.48 107.8158.85213.9955.6515.8616.46 2009/10 138.50 16.63
149.10 109.8560.81222.7857.0516.6317.50 2010/11 142.50 19.48
158.10 115.7064.85239.4461.8619.4818.47 2011/12 151.48 23.10
161.26 120.7468.39249.7865.4223.1019.12 2012/13 158.21 23.18
171.54 125.3070.26261.8567.1323.1819.98 2013/14 166.12 25.47
177.12 130.9676.59273.4870.8925.4720.78 2014/15 170.50 26.39
176.54 135.4073.79273.5570.6226.3921.74 2015/16 177.56 22.20
188.85 139.7981.25286.5375.4822.2022.41 2016/17 183.38 21.90
198.72 144.4280.03296.0475.4221.9023.26 2017/18 192.89 23.12
203.46 148.2585.67307.8481.2623.1223.75 2018/19 200.33 21.84
204.55 149.4384.47306.4580.0621.8424.27 2019/20 200.31 21.67
208.86 153.1886.34312.6382.1021.6724.53 2020/21 206.03 20.26
Based on the aggregate of different marketing years
Foreign Agricultural Service/USDA 23 July 2020Global Market Analysis
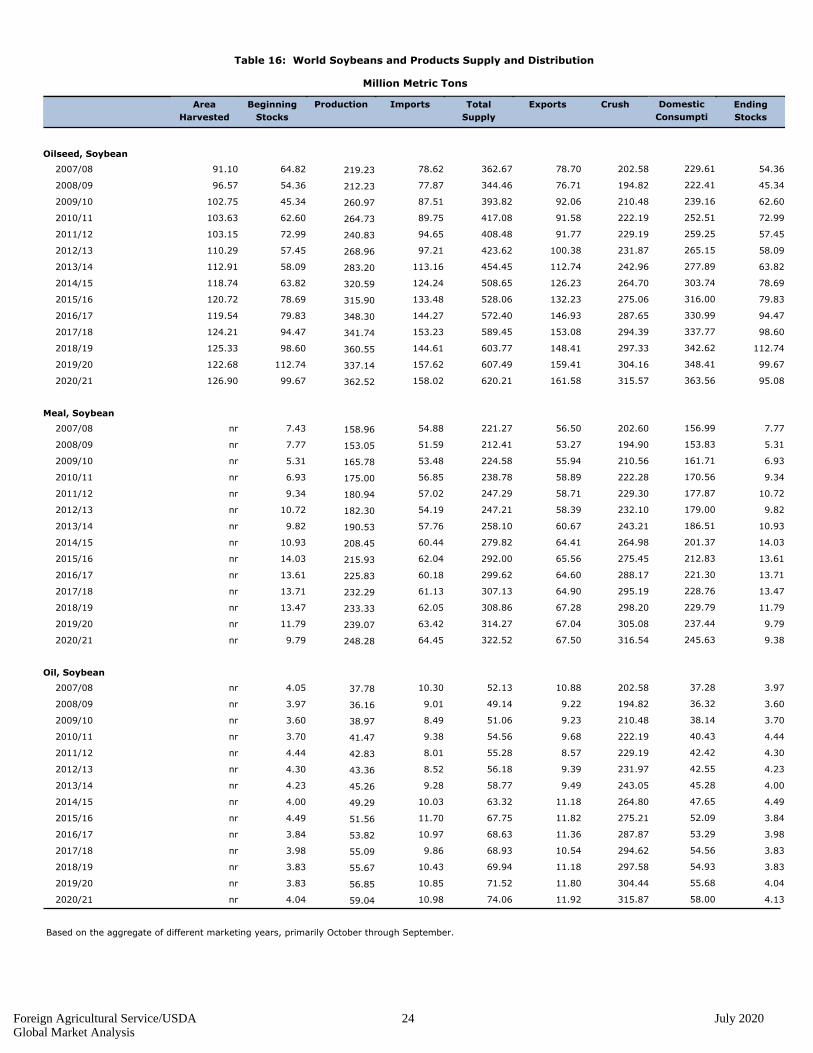
Table 16: World Soybeans and Products Supply and Distribution
Million Metric Tons
Area
Harvested
Beginning
Stocks
Production Imports Total
Supply
Exports Crush Domestic
Consumpti
Ending
Stocks
Oilseed, Soybean
219.23 202.5878.70362.6778.6264.8291.10 2007/08 229.61 54.36
212.23 194.8276.71344.4677.8754.3696.57 2008/09 222.41 45.34
260.97 210.4892.06393.8287.5145.34102.75 2009/10 239.16 62.60
264.73 222.1991.58417.0889.7562.60103.63 2010/11 252.51 72.99
240.83 229.1991.77408.4894.6572.99103.15 2011/12 259.25 57.45
268.96 231.87100.38423.6297.2157.45110.29 2012/13 265.15 58.09
283.20 242.96112.74454.45113.1658.09112.91 2013/14 277.89 63.82
320.59 264.70126.23508.65124.2463.82118.74 2014/15 303.74 78.69
315.90 275.06132.23528.06133.4878.69120.72 2015/16 316.00 79.83
348.30 287.65146.93572.40144.2779.83119.54 2016/17 330.99 94.47
341.74 294.39153.08589.45153.2394.47124.21 2017/18 337.77 98.60
360.55 297.33148.41603.77144.6198.60125.33 2018/19 342.62 112.74
337.14 304.16159.41607.49157.62112.74122.68 2019/20 348.41 99.67
362.52 315.57161.58620.21158.0299.67126.90 2020/21 363.56 95.08
Meal, Soybean
158.96 202.6056.50221.2754.887.43nr 2007/08 156.99 7.77
153.05 194.9053.27212.4151.597.77nr 2008/09 153.83 5.31
165.78 210.5655.94224.5853.485.31nr 2009/10 161.71 6.93
175.00 222.2858.89238.7856.856.93nr 2010/11 170.56 9.34
180.94 229.3058.71247.2957.029.34nr 2011/12 177.87 10.72
182.30 232.1058.39247.2154.1910.72nr 2012/13 179.00 9.82
190.53 243.2160.67258.1057.769.82nr 2013/14 186.51 10.93
208.45 264.9864.41279.8260.4410.93nr 2014/15 201.37 14.03
215.93 275.4565.56292.0062.0414.03nr 2015/16 212.83 13.61
225.83 288.1764.60299.6260.1813.61nr 2016/17 221.30 13.71
232.29 295.1964.90307.1361.1313.71nr 2017/18 228.76 13.47
233.33 298.2067.28308.8662.0513.47nr 2018/19 229.79 11.79
239.07 305.0867.04314.2763.4211.79nr 2019/20 237.44 9.79
248.28 316.5467.50322.5264.459.79nr 2020/21 245.63 9.38
Oil, Soybean
37.78 202.5810.8852.1310.304.05nr 2007/08 37.28 3.97
36.16 194.829.2249.149.013.97nr 2008/09 36.32 3.60
38.97 210.489.2351.068.493.60nr 2009/10 38.14 3.70
41.47 222.199.6854.569.383.70nr 2010/11 40.43 4.44
42.83 229.198.5755.288.014.44nr 2011/12 42.42 4.30
43.36 231.979.3956.188.524.30nr 2012/13 42.55 4.23
45.26 243.059.4958.779.284.23nr 2013/14 45.28 4.00
49.29 264.8011.1863.3210.034.00nr 2014/15 47.65 4.49
51.56 275.2111.8267.7511.704.49nr 2015/16 52.09 3.84
53.82 287.8711.3668.6310.973.84nr 2016/17 53.29 3.98
55.09 294.6210.5468.939.863.98nr 2017/18 54.56 3.83
55.67 297.5811.1869.9410.433.83nr 2018/19 54.93 3.83
56.85 304.4411.8071.5210.853.83nr 2019/20 55.68 4.04
59.04 315.8711.9274.0610.984.04nr 2020/21 58.00 4.13
Based on the aggregate of different marketing years, primarily October through September.
Foreign Agricultural Service/USDA 24 July 2020Global Market Analysis
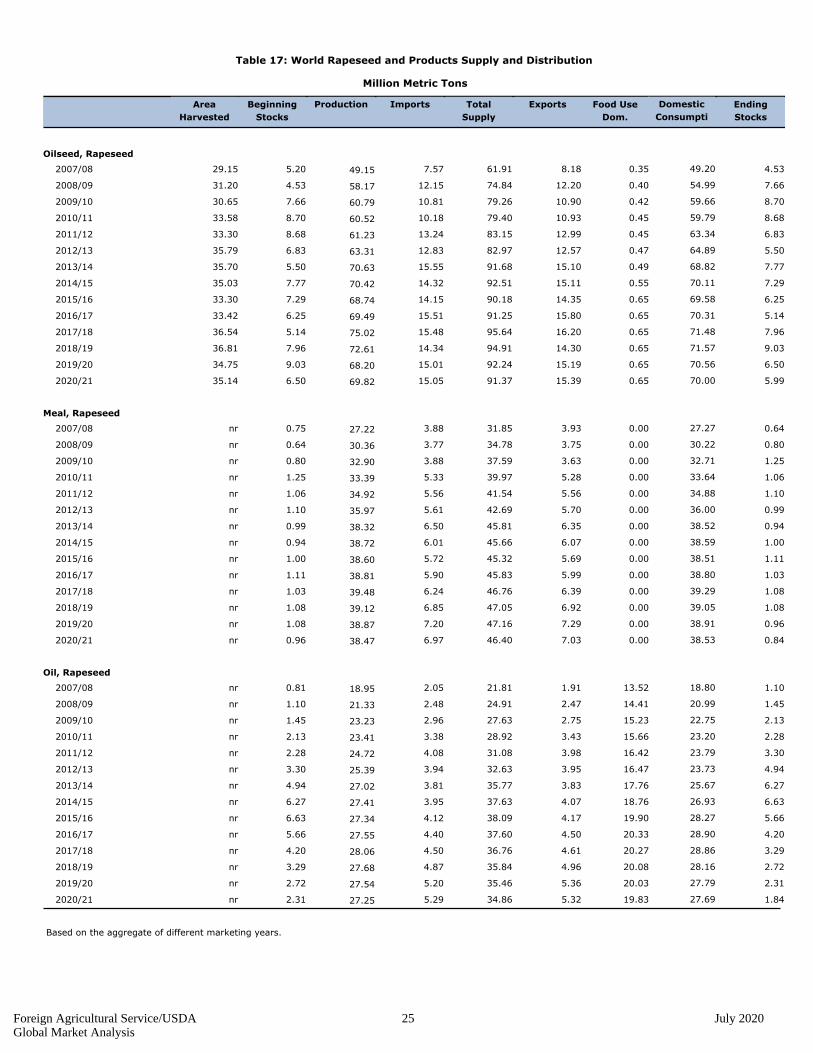
Table 17: World Rapeseed and Products Supply and Distribution
Million Metric Tons
Area
Harvested
Beginning
Stocks
Production Imports Total
Supply
Exports Food Use
Dom.
Domestic
Consumpti
Ending
Stocks
Oilseed, Rapeseed
49.15 0.358.1861.917.575.2029.15 2007/08 49.20 4.53
58.17 0.4012.2074.8412.154.5331.20 2008/09 54.99 7.66
60.79 0.4210.9079.2610.817.6630.65 2009/10 59.66 8.70
60.52 0.4510.9379.4010.188.7033.58 2010/11 59.79 8.68
61.23 0.4512.9983.1513.248.6833.30 2011/12 63.34 6.83
63.31 0.4712.5782.9712.836.8335.79 2012/13 64.89 5.50
70.63 0.4915.1091.6815.555.5035.70 2013/14 68.82 7.77
70.42 0.5515.1192.5114.327.7735.03 2014/15 70.11 7.29
68.74 0.6514.3590.1814.157.2933.30 2015/16 69.58 6.25
69.49 0.6515.8091.2515.516.2533.42 2016/17 70.31 5.14
75.02 0.6516.2095.6415.485.1436.54 2017/18 71.48 7.96
72.61 0.6514.3094.9114.347.9636.81 2018/19 71.57 9.03
68.20 0.6515.1992.2415.019.0334.75 2019/20 70.56 6.50
69.82 0.6515.3991.3715.056.5035.14 2020/21 70.00 5.99
Meal, Rapeseed
27.22 0.003.9331.853.880.75nr 2007/08 27.27 0.64
30.36 0.003.7534.783.770.64nr 2008/09 30.22 0.80
32.90 0.003.6337.593.880.80nr 2009/10 32.71 1.25
33.39 0.005.2839.975.331.25nr 2010/11 33.64 1.06
34.92 0.005.5641.545.561.06nr 2011/12 34.88 1.10
35.97 0.005.7042.695.611.10nr 2012/13 36.00 0.99
38.32 0.006.3545.816.500.99nr 2013/14 38.52 0.94
38.72 0.006.0745.666.010.94nr 2014/15 38.59 1.00
38.60 0.005.6945.325.721.00nr 2015/16 38.51 1.11
38.81 0.005.9945.835.901.11nr 2016/17 38.80 1.03
39.48 0.006.3946.766.241.03nr 2017/18 39.29 1.08
39.12 0.006.9247.056.851.08nr 2018/19 39.05 1.08
38.87 0.007.2947.167.201.08nr 2019/20 38.91 0.96
38.47 0.007.0346.406.970.96nr 2020/21 38.53 0.84
Oil, Rapeseed
18.95 13.521.9121.812.050.81nr 2007/08 18.80 1.10
21.33 14.412.4724.912.481.10nr 2008/09 20.99 1.45
23.23 15.232.7527.632.961.45nr 2009/10 22.75 2.13
23.41 15.663.4328.923.382.13nr 2010/11 23.20 2.28
24.72 16.423.9831.084.082.28nr 2011/12 23.79 3.30
25.39 16.473.9532.633.943.30nr 2012/13 23.73 4.94
27.02 17.763.8335.773.814.94nr 2013/14 25.67 6.27
27.41 18.764.0737.633.956.27nr 2014/15 26.93 6.63
27.34 19.904.1738.094.126.63nr 2015/16 28.27 5.66
27.55 20.334.5037.604.405.66nr 2016/17 28.90 4.20
28.06 20.274.6136.764.504.20nr 2017/18 28.86 3.29
27.68 20.084.9635.844.873.29nr 2018/19 28.16 2.72
27.54 20.035.3635.465.202.72nr 2019/20 27.79 2.31
27.25 19.835.3234.865.292.31nr 2020/21 27.69 1.84
Based on the aggregate of different marketing years.
Foreign Agricultural Service/USDA 25 July 2020Global Market Analysis
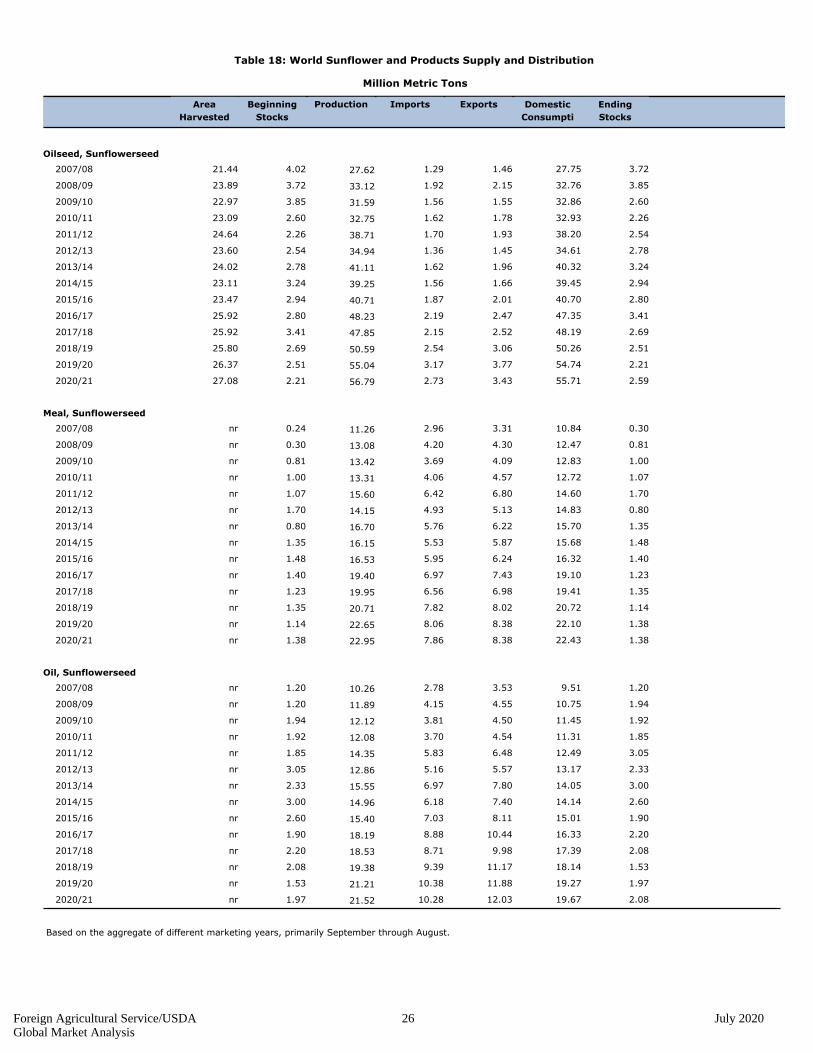
Table 18: World Sunflower and Products Supply and Distribution
Million Metric Tons
Area
Harvested
Beginning
Stocks
Production Imports Exports Domestic
Consumpti
Ending
Stocks
Oilseed, Sunflowerseed
27.62 3.7227.751.461.294.0221.44 2007/08
33.12 3.8532.762.151.923.7223.89 2008/09
31.59 2.6032.861.551.563.8522.97 2009/10
32.75 2.2632.931.781.622.6023.09 2010/11
38.71 2.5438.201.931.702.2624.64 2011/12
34.94 2.7834.611.451.362.5423.60 2012/13
41.11 3.2440.321.961.622.7824.02 2013/14
39.25 2.9439.451.661.563.2423.11 2014/15
40.71 2.8040.702.011.872.9423.47 2015/16
48.23 3.4147.352.472.192.8025.92 2016/17
47.85 2.6948.192.522.153.4125.92 2017/18
50.59 2.5150.263.062.542.6925.80 2018/19
55.04 2.2154.743.773.172.5126.37 2019/20
56.79 2.5955.713.432.732.2127.08 2020/21
Meal, Sunflowerseed
11.26 0.3010.843.312.960.24nr 2007/08
13.08 0.8112.474.304.200.30nr 2008/09
13.42 1.0012.834.093.690.81nr 2009/10
13.31 1.0712.724.574.061.00nr 2010/11
15.60 1.7014.606.806.421.07nr 2011/12
14.15 0.8014.835.134.931.70nr 2012/13
16.70 1.3515.706.225.760.80nr 2013/14
16.15 1.4815.685.875.531.35nr 2014/15
16.53 1.4016.326.245.951.48nr 2015/16
19.40 1.2319.107.436.971.40nr 2016/17
19.95 1.3519.416.986.561.23nr 2017/18
20.71 1.1420.728.027.821.35nr 2018/19
22.65 1.3822.108.388.061.14nr 2019/20
22.95 1.3822.438.387.861.38nr 2020/21
Oil, Sunflowerseed
10.26 1.209.513.532.781.20nr 2007/08
11.89 1.9410.754.554.151.20nr 2008/09
12.12 1.9211.454.503.811.94nr 2009/10
12.08 1.8511.314.543.701.92nr 2010/11
14.35 3.0512.496.485.831.85nr 2011/12
12.86 2.3313.175.575.163.05nr 2012/13
15.55 3.0014.057.806.972.33nr 2013/14
14.96 2.6014.147.406.183.00nr 2014/15
15.40 1.9015.018.117.032.60nr 2015/16
18.19 2.2016.3310.448.881.90nr 2016/17
18.53 2.0817.399.988.712.20nr 2017/18
19.38 1.5318.1411.179.392.08nr 2018/19
21.21 1.9719.2711.8810.381.53nr 2019/20
21.52 2.0819.6712.0310.281.97nr 2020/21
Based on the aggregate of different marketing years, primarily September through August.
Foreign Agricultural Service/USDA 26 July 2020Global Market Analysis

Table 19: World Palm Oil, Coconut Oil, and Fish Meal Supply and Distribution
Million Metric Tons
Beginning
Stocks
Production Imports Total
Supply
Exports Industrial
Dom.
Food Use
Dom.
Domestic
Consumpti
Ending
Stocks
Oil, Palm
29.83 29.408.8532.4977.2641.455.99 2007/08 38.82 5.95
33.02 32.019.6335.0083.4744.495.95 2008/09 42.29 6.18
34.56 33.8310.0636.3387.1246.386.18 2009/10 44.49 6.30
35.35 34.1810.7337.3490.8649.216.30 2010/11 45.48 8.04
38.46 36.6712.4739.8599.0552.558.04 2011/12 49.78 9.42
41.97 40.0314.6543.05107.7556.379.42 2012/13 55.33 9.37
41.82 40.8616.2143.14110.4759.289.37 2013/14 57.71 9.63
44.61 43.0414.3347.37116.0261.789.63 2014/15 58.00 10.65
42.42 42.6016.1443.87111.9958.9210.65 2015/16 59.38 8.74
45.98 44.5716.3748.89120.0665.348.74 2016/17 61.60 9.57
46.51 46.6919.6048.65126.6570.589.57 2017/18 66.98 11.03
50.33 49.5922.7751.50135.3874.0211.03 2018/19 73.05 10.83
47.44 48.3822.2048.70130.5572.2710.83 2019/20 71.31 10.53
49.20 50.1823.3350.37134.3374.6010.53 2020/21 74.12 9.83
Oil, Coconut
1.91 1.781.521.935.813.410.49 2007/08 3.33 0.55
1.67 1.661.571.485.603.370.55 2008/09 3.26 0.86
2.30 2.081.712.076.653.490.86 2009/10 3.83 0.75
1.78 1.861.671.806.143.610.75 2010/11 3.57 0.77
1.83 1.921.551.866.013.410.77 2011/12 3.51 0.64
1.89 1.991.701.936.163.630.64 2012/13 3.72 0.52
1.74 1.741.551.915.653.400.52 2013/14 3.33 0.40
1.82 1.741.511.945.603.380.40 2014/15 3.29 0.38
1.60 1.671.541.595.323.340.38 2015/16 3.24 0.49
1.49 1.571.611.765.393.410.49 2016/17 3.21 0.42
1.70 1.691.701.735.793.670.42 2017/18 3.43 0.64
1.82 1.741.752.116.203.740.64 2018/19 3.53 0.56
1.83 1.841.711.936.003.620.56 2019/20 3.58 0.50
1.88 1.861.791.885.963.580.50 2020/21 3.68 0.41
Meal, Fish
3.17 0.000.052.949.275.140.97 2007/08 5.50 0.83
3.26 0.000.053.089.295.200.83 2008/09 5.51 0.71
2.76 0.000.052.417.714.240.71 2009/10 5.03 0.28
2.77 0.000.052.698.605.550.28 2010/11 5.22 0.69
3.05 0.000.052.808.444.710.69 2011/12 5.36 0.28
2.47 0.000.052.327.594.840.28 2012/13 4.81 0.45
2.74 0.000.052.477.644.450.45 2013/14 4.94 0.23
2.50 0.000.052.287.414.690.23 2014/15 4.87 0.26
2.44 0.000.052.217.224.510.26 2015/16 4.73 0.27
3.02 0.000.052.538.164.870.27 2016/17 5.38 0.26
2.98 0.000.052.588.004.760.26 2017/18 5.17 0.26
3.02 0.000.052.568.044.760.26 2018/19 5.22 0.26
2.98 0.000.052.658.094.850.26 2019/20 5.20 0.25
3.05 0.000.052.678.164.870.25 2020/21 5.27 0.22
Based on the aggregate of different marketing years.
Foreign Agricultural Service/USDA 27 July 2020Global Market Analysis
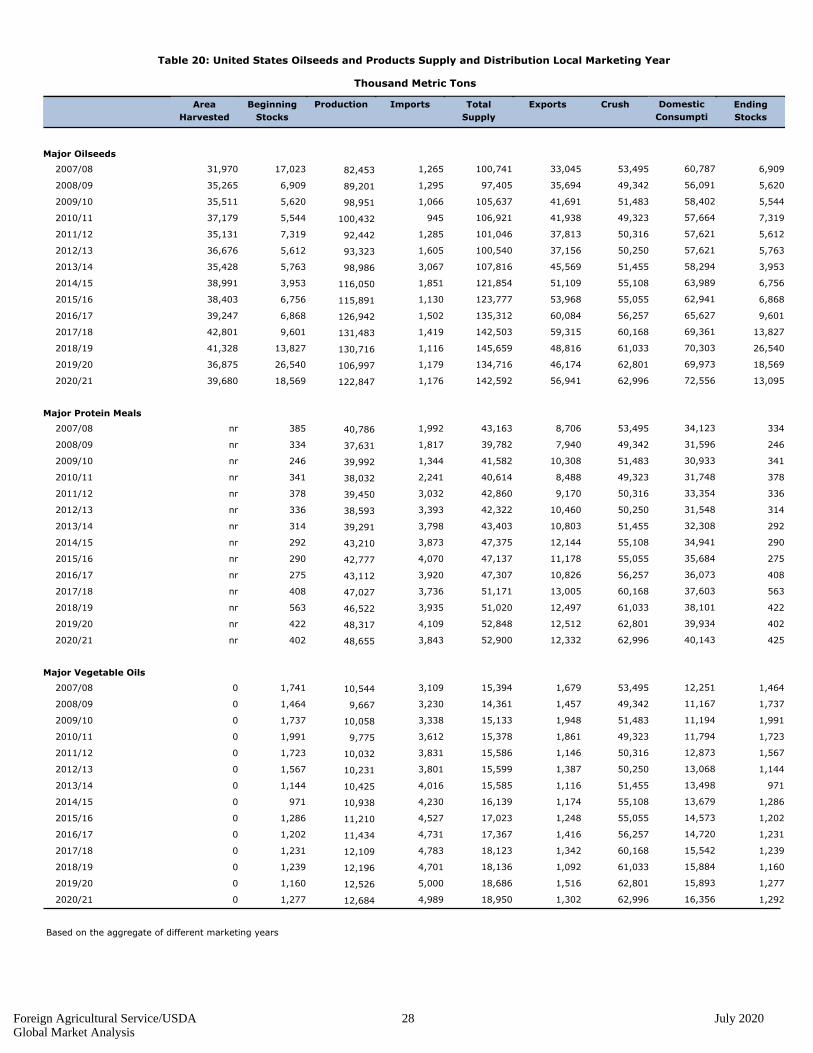
Table 20: United States Oilseeds and Products Supply and Distribution Local Marketing Year
Thousand Metric Tons
Area
Harvested
Beginning
Stocks
Production Imports Total
Supply
Exports Crush Domestic
Consumpti
Ending
Stocks
Major Oilseeds
82,453 53,49533,045100,7411,26517,02331,970 2007/08 60,787 6,909
89,201 49,34235,69497,4051,2956,90935,265 2008/09 56,091 5,620
98,951 51,48341,691105,6371,0665,62035,511 2009/10 58,402 5,544
100,432 49,32341,938106,9219455,54437,179 2010/11 57,664 7,319
92,442 50,31637,813101,0461,2857,31935,131 2011/12 57,621 5,612
93,323 50,25037,156100,5401,6055,61236,676 2012/13 57,621 5,763
98,986 51,45545,569107,8163,0675,76335,428 2013/14 58,294 3,953
116,050 55,10851,109121,8541,8513,95338,991 2014/15 63,989 6,756
115,891 55,05553,968123,7771,1306,75638,403 2015/16 62,941 6,868
126,942 56,25760,084135,3121,5026,86839,247 2016/17 65,627 9,601
131,483 60,16859,315142,5031,4199,60142,801 2017/18 69,361 13,827
130,716 61,03348,816145,6591,11613,82741,328 2018/19 70,303 26,540
106,997 62,80146,174134,7161,17926,54036,875 2019/20 69,973 18,569
122,847 62,99656,941142,5921,17618,56939,680 2020/21 72,556 13,095
Major Protein Meals
40,786 53,4958,70643,1631,992385nr 2007/08 34,123 334
37,631 49,3427,94039,7821,817334nr 2008/09 31,596 246
39,992 51,48310,30841,5821,344246nr 2009/10 30,933 341
38,032 49,3238,48840,6142,241341nr 2010/11 31,748 378
39,450 50,3169,17042,8603,032378nr 2011/12 33,354 336
38,593 50,25010,46042,3223,393336nr 2012/13 31,548 314
39,291 51,45510,80343,4033,798314nr 2013/14 32,308 292
43,210 55,10812,14447,3753,873292nr 2014/15 34,941 290
42,777 55,05511,17847,1374,070290nr 2015/16 35,684 275
43,112 56,25710,82647,3073,920275nr 2016/17 36,073 408
47,027 60,16813,00551,1713,736408nr 2017/18 37,603 563
46,522 61,03312,49751,0203,935563nr 2018/19 38,101 422
48,317 62,80112,51252,8484,109422nr 2019/20 39,934 402
48,655 62,99612,33252,9003,843402nr 2020/21 40,143 425
Major Vegetable Oils
10,544 53,4951,67915,3943,1091,7410 2007/08 12,251 1,464
9,667 49,3421,45714,3613,2301,4640 2008/09 11,167 1,737
10,058 51,4831,94815,1333,3381,7370 2009/10 11,194 1,991
9,775 49,3231,86115,3783,6121,9910 2010/11 11,794 1,723
10,032 50,3161,14615,5863,8311,7230 2011/12 12,873 1,567
10,231 50,2501,38715,5993,8011,5670 2012/13 13,068 1,144
10,425 51,4551,11615,5854,0161,1440 2013/14 13,498 971
10,938 55,1081,17416,1394,2309710 2014/15 13,679 1,286
11,210 55,0551,24817,0234,5271,2860 2015/16 14,573 1,202
11,434 56,2571,41617,3674,7311,2020 2016/17 14,720 1,231
12,109 60,1681,34218,1234,7831,2310 2017/18 15,542 1,239
12,196 61,0331,09218,1364,7011,2390 2018/19 15,884 1,160
12,526 62,8011,51618,6865,0001,1600 2019/20 15,893 1,277
12,684 62,9961,30218,9504,9891,2770 2020/21 16,356 1,292
Based on the aggregate of different marketing years
Foreign Agricultural Service/USDA 28 July 2020Global Market Analysis
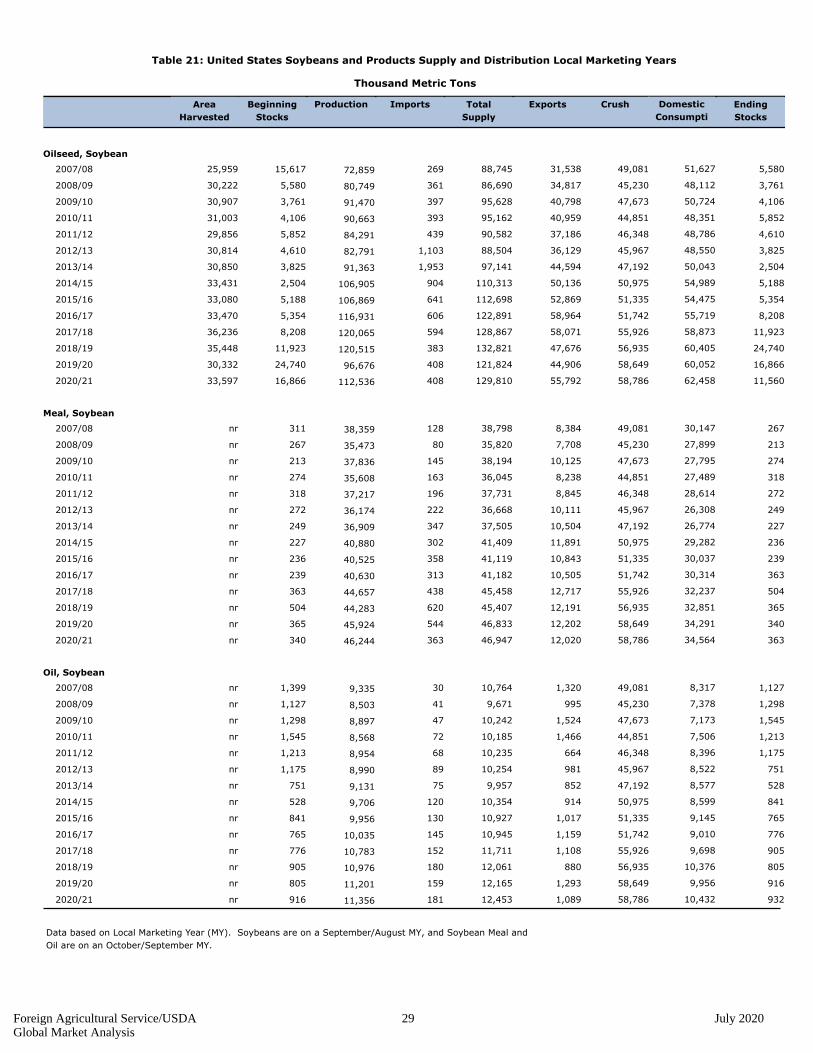
Table 21: United States Soybeans and Products Supply and Distribution Local Marketing Years
Thousand Metric Tons
Area
Harvested
Beginning
Stocks
Production Imports Total
Supply
Exports Crush Domestic
Consumpti
Ending
Stocks
Oilseed, Soybean
72,859 49,08131,53888,74526915,61725,959 2007/08 51,627 5,580
80,749 45,23034,81786,6903615,58030,222 2008/09 48,112 3,761
91,470 47,67340,79895,6283973,76130,907 2009/10 50,724 4,106
90,663 44,85140,95995,1623934,10631,003 2010/11 48,351 5,852
84,291 46,34837,18690,5824395,85229,856 2011/12 48,786 4,610
82,791 45,96736,12988,5041,1034,61030,814 2012/13 48,550 3,825
91,363 47,19244,59497,1411,9533,82530,850 2013/14 50,043 2,504
106,905 50,97550,136110,3139042,50433,431 2014/15 54,989 5,188
106,869 51,33552,869112,6986415,18833,080 2015/16 54,475 5,354
116,931 51,74258,964122,8916065,35433,470 2016/17 55,719 8,208
120,065 55,92658,071128,8675948,20836,236 2017/18 58,873 11,923
120,515 56,93547,676132,82138311,92335,448 2018/19 60,405 24,740
96,676 58,64944,906121,82440824,74030,332 2019/20 60,052 16,866
112,536 58,78655,792129,81040816,86633,597 2020/21 62,458 11,560
Meal, Soybean
38,359 49,0818,38438,798128311nr 2007/08 30,147 267
35,473 45,2307,70835,82080267nr 2008/09 27,899 213
37,836 47,67310,12538,194145213nr 2009/10 27,795 274
35,608 44,8518,23836,045163274nr 2010/11 27,489 318
37,217 46,3488,84537,731196318nr 2011/12 28,614 272
36,174 45,96710,11136,668222272nr 2012/13 26,308 249
36,909 47,19210,50437,505347249nr 2013/14 26,774 227
40,880 50,97511,89141,409302227nr 2014/15 29,282 236
40,525 51,33510,84341,119358236nr 2015/16 30,037 239
40,630 51,74210,50541,182313239nr 2016/17 30,314 363
44,657 55,92612,71745,458438363nr 2017/18 32,237 504
44,283 56,93512,19145,407620504nr 2018/19 32,851 365
45,924 58,64912,20246,833544365nr 2019/20 34,291 340
46,244 58,78612,02046,947363340nr 2020/21 34,564 363
Oil, Soybean
9,335 49,0811,32010,764301,399nr 2007/08 8,317 1,127
8,503 45,2309959,671411,127nr 2008/09 7,378 1,298
8,897 47,6731,52410,242471,298nr 2009/10 7,173 1,545
8,568 44,8511,46610,185721,545nr 2010/11 7,506 1,213
8,954 46,34866410,235681,213nr 2011/12 8,396 1,175
8,990 45,96798110,254891,175nr 2012/13 8,522 751
9,131 47,1928529,95775751nr 2013/14 8,577 528
9,706 50,97591410,354120528nr 2014/15 8,599 841
9,956 51,3351,01710,927130841nr 2015/16 9,145 765
10,035 51,7421,15910,945145765nr 2016/17 9,010 776
10,783 55,9261,10811,711152776nr 2017/18 9,698 905
10,976 56,93588012,061180905nr 2018/19 10,376 805
11,201 58,6491,29312,165159805nr 2019/20 9,956 916
11,356 58,7861,08912,453181916nr 2020/21 10,432 932
Data based on Local Marketing Year (MY). Soybeans are on a September/August MY, and Soybean Meal and
Oil are on an October/September MY.
Foreign Agricultural Service/USDA 29 July 2020Global Market Analysis

Table 22: Brazil Soybeans and Products Supply and Distribution Local Marketing Years
Thousand Metric Tons
Area
Harvested
Beginning
Stocks
Production Imports Total
Supply
Exports Crush Domestic
Consumpti
Ending
Stocks
Oilseed, Soybean (Local)
61,000 31,89524,51567,708836,62521,300 2007/08 34,365 8,828
57,800 30,77928,04166,7521248,82821,700 2008/09 33,129 5,582
69,000 35,70029,18874,7321505,58223,500 2009/10 38,100 7,444
75,300 37,26433,78982,784407,44424,200 2010/11 39,714 9,281
66,500 36,23031,90576,0792989,28125,000 2011/12 38,730 5,444
82,000 36,43242,82687,6842405,44427,700 2012/13 38,982 5,876
86,700 38,19545,74793,1555795,87630,100 2013/14 40,795 6,613
97,200 40,33954,635104,1423296,61332,100 2014/15 42,989 6,518
96,500 39,96752,100103,3803626,51833,300 2015/16 42,617 8,663
114,600 42,16168,807123,5302678,66333,900 2016/17 44,811 9,912
122,000 43,38983,729132,0971859,91235,150 2017/18 45,716 2,652
119,000 43,51073,445121,7971452,65235,900 2018/19 45,710 2,642
126,000 44,00079,500128,8872452,64236,900 2019/20 46,637 2,750
131,000 45,00083,000133,9001502,75038,300 2020/21 47,650 3,250
Meal, Soybean (Local)
24,720 31,89512,70927,1461432,283nr 2007/08 12,300 2,137
23,850 30,77912,15326,073862,137nr 2008/09 12,800 1,120
27,670 35,70014,14728,862721,120nr 2009/10 13,187 1,528
28,880 37,26414,45230,459511,528nr 2010/11 13,400 2,607
28,080 36,23013,85430,702152,607nr 2011/12 14,000 2,848
28,230 36,43213,61931,108302,848nr 2012/13 14,800 2,689
29,560 38,19513,72132,276272,689nr 2013/14 15,300 3,255
31,220 40,33915,10634,491163,255nr 2014/15 15,900 3,485
30,930 39,96714,65134,442273,485nr 2015/16 16,700 3,091
32,680 42,16113,91535,809383,091nr 2016/17 17,100 4,794
33,620 43,38916,78038,426124,794nr 2017/18 17,500 4,146
33,640 43,51016,46237,808224,146nr 2018/19 17,864 3,482
34,100 44,00016,87537,608263,482nr 2019/20 18,097 2,636
34,900 45,00016,30037,561252,636nr 2020/21 18,600 2,661
Oil, Soybean (Local)
6,120 31,8952,1986,4879358nr 2007/08 4,005 284
5,910 30,7791,4966,23541284nr 2008/09 4,395 344
6,850 35,7001,6327,1962344nr 2009/10 5,060 504
7,150 37,2641,7587,6540504nr 2010/11 5,305 591
6,950 36,2301,6887,5432591nr 2011/12 5,395 460
6,990 36,4321,4107,4544460nr 2012/13 5,528 516
7,330 38,1951,3267,8460516nr 2013/14 5,955 565
7,740 40,3391,6508,33732565nr 2014/15 6,220 467
7,670 39,9671,2508,21174467nr 2015/16 6,490 471
8,090 42,1611,3238,61251471nr 2016/17 6,887 402
8,325 43,3891,4098,76841402nr 2017/18 6,990 369
8,330 43,5101,0148,73435369nr 2018/19 7,220 500
8,450 44,0001,0709,00050500nr 2019/20 7,510 420
8,640 45,0001,0509,09030420nr 2020/21 7,600 440
Data based on Brazil's local February/January Marketing Year (MY).
Where February 2012 - January 2013 is the 2011/12 MY.
Foreign Agricultural Service/USDA 30 July 2020Global Market Analysis
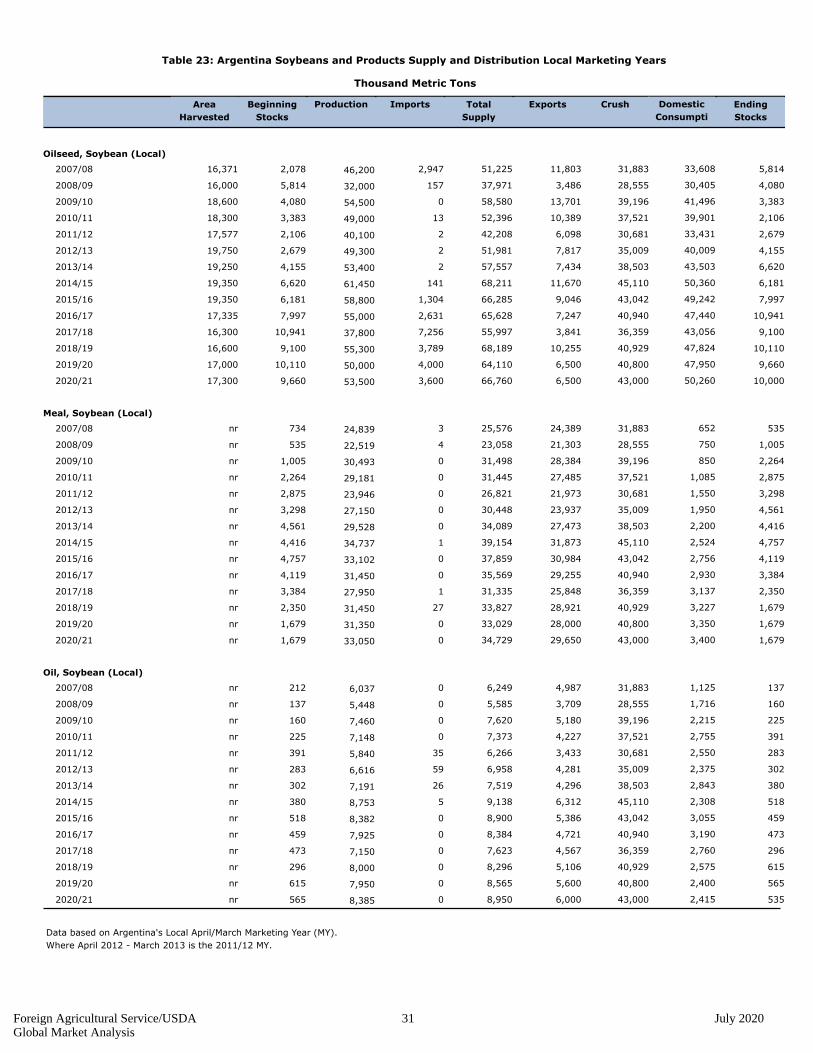
Table 23: Argentina Soybeans and Products Supply and Distribution Local Marketing Years
Thousand Metric Tons
Area
Harvested
Beginning
Stocks
Production Imports Total
Supply
Exports Crush Domestic
Consumpti
Ending
Stocks
Oilseed, Soybean (Local)
46,200 31,88311,80351,2252,9472,07816,371 2007/08 33,608 5,814
32,000 28,5553,48637,9711575,81416,000 2008/09 30,405 4,080
54,500 39,19613,70158,58004,08018,600 2009/10 41,496 3,383
49,000 37,52110,38952,396133,38318,300 2010/11 39,901 2,106
40,100 30,6816,09842,20822,10617,577 2011/12 33,431 2,679
49,300 35,0097,81751,98122,67919,750 2012/13 40,009 4,155
53,400 38,5037,43457,55724,15519,250 2013/14 43,503 6,620
61,450 45,11011,67068,2111416,62019,350 2014/15 50,360 6,181
58,800 43,0429,04666,2851,3046,18119,350 2015/16 49,242 7,997
55,000 40,9407,24765,6282,6317,99717,335 2016/17 47,440 10,941
37,800 36,3593,84155,9977,25610,94116,300 2017/18 43,056 9,100
55,300 40,92910,25568,1893,7899,10016,600 2018/19 47,824 10,110
50,000 40,8006,50064,1104,00010,11017,000 2019/20 47,950 9,660
53,500 43,0006,50066,7603,6009,66017,300 2020/21 50,260 10,000
Meal, Soybean (Local)
24,839 31,88324,38925,5763734nr 2007/08 652 535
22,519 28,55521,30323,0584535nr 2008/09 750 1,005
30,493 39,19628,38431,49801,005nr 2009/10 850 2,264
29,181 37,52127,48531,44502,264nr 2010/11 1,085 2,875
23,946 30,68121,97326,82102,875nr 2011/12 1,550 3,298
27,150 35,00923,93730,44803,298nr 2012/13 1,950 4,561
29,528 38,50327,47334,08904,561nr 2013/14 2,200 4,416
34,737 45,11031,87339,15414,416nr 2014/15 2,524 4,757
33,102 43,04230,98437,85904,757nr 2015/16 2,756 4,119
31,450 40,94029,25535,56904,119nr 2016/17 2,930 3,384
27,950 36,35925,84831,33513,384nr 2017/18 3,137 2,350
31,450 40,92928,92133,827272,350nr 2018/19 3,227 1,679
31,350 40,80028,00033,02901,679nr 2019/20 3,350 1,679
33,050 43,00029,65034,72901,679nr 2020/21 3,400 1,679
Oil, Soybean (Local)
6,037 31,8834,9876,2490212nr 2007/08 1,125 137
5,448 28,5553,7095,5850137nr 2008/09 1,716 160
7,460 39,1965,1807,6200160nr 2009/10 2,215 225
7,148 37,5214,2277,3730225nr 2010/11 2,755 391
5,840 30,6813,4336,26635391nr 2011/12 2,550 283
6,616 35,0094,2816,95859283nr 2012/13 2,375 302
7,191 38,5034,2967,51926302nr 2013/14 2,843 380
8,753 45,1106,3129,1385380nr 2014/15 2,308 518
8,382 43,0425,3868,9000518nr 2015/16 3,055 459
7,925 40,9404,7218,3840459nr 2016/17 3,190 473
7,150 36,3594,5677,6230473nr 2017/18 2,760 296
8,000 40,9295,1068,2960296nr 2018/19 2,575 615
7,950 40,8005,6008,5650615nr 2019/20 2,400 565
8,385 43,0006,0008,9500565nr 2020/21 2,415 535
Data based on Argentina's Local April/March Marketing Year (MY).
Where April 2012 - March 2013 is the 2011/12 MY.
Foreign Agricultural Service/USDA 31 July 2020Global Market Analysis
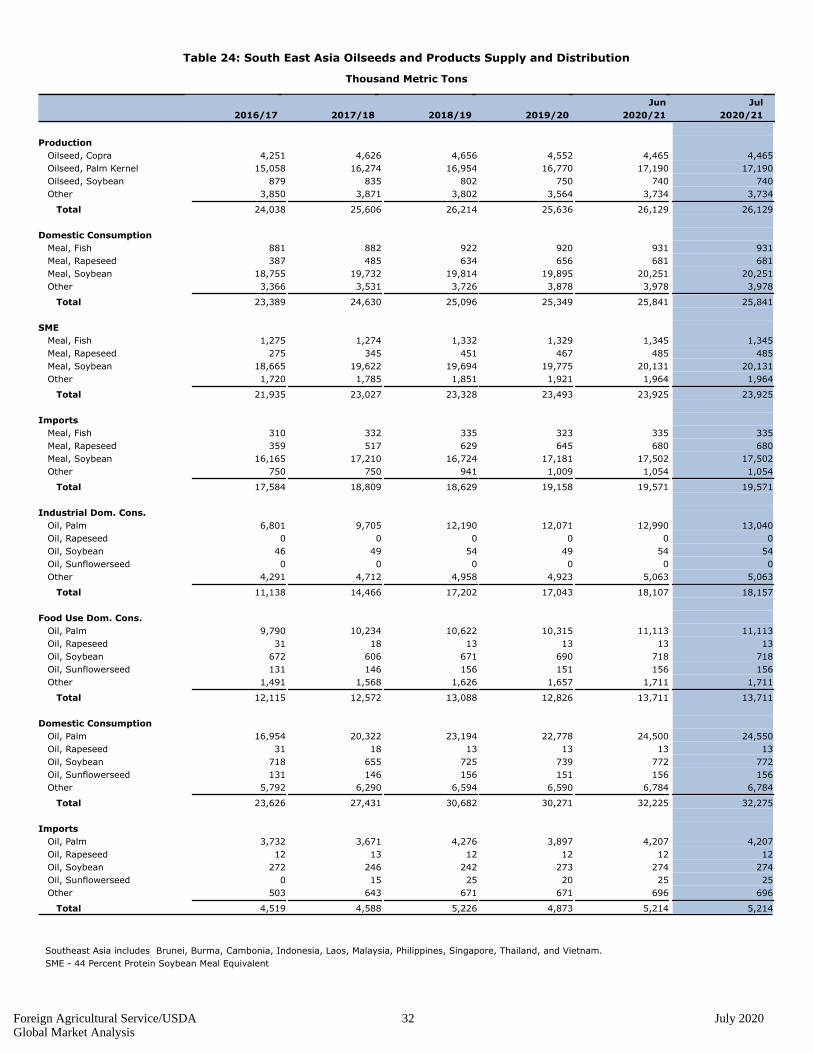
Table 24: South East Asia Oilseeds and Products Supply and Distribution
Thousand Metric Tons
2016/17 2017/18 2018/19 2019/20
Jun
2020/21
Jul
2020/21
none
Production none
4,251 Oilseed, Copra 4,626 4,656 4,552 4,465 4,465
15,058 Oilseed, Palm Kernel 16,274 16,954 16,770 17,190 17,190
879 Oilseed, Soybean 835 802 750 740 740
3,850 Other 3,871 3,802 3,564 3,734 3,734
24,038 Total 25,606 26,214 25,636 26,129 26,129
none
Domestic Consumption none
881 Meal, Fish 882 922 920 931 931
387 Meal, Rapeseed 485 634 656 681 681
18,755 Meal, Soybean 19,732 19,814 19,895 20,251 20,251
3,366 Other 3,531 3,726 3,878 3,978 3,978
23,389 Total 24,630 25,096 25,349 25,841 25,841
none
SME none
1,275 Meal, Fish 1,274 1,332 1,329 1,345 1,345
275 Meal, Rapeseed 345 451 467 485 485
18,665 Meal, Soybean 19,622 19,694 19,775 20,131 20,131
1,720 Other 1,785 1,851 1,921 1,964 1,964
21,935 Total 23,027 23,328 23,493 23,925 23,925
none
Imports none
310 Meal, Fish 332 335 323 335 335
359 Meal, Rapeseed 517 629 645 680 680
16,165 Meal, Soybean 17,210 16,724 17,181 17,502 17,502
750 Other 750 941 1,009 1,054 1,054
17,584 Total 18,809 18,629 19,158 19,571 19,571
none
Industrial Dom. Cons. none
6,801 Oil, Palm 9,705 12,190 12,071 12,990 13,040
0 Oil, Rapeseed 0 0 0 0 0
46 Oil, Soybean 49 54 49 54 54
0 Oil, Sunflowerseed 0 0 0 0 0
4,291 Other 4,712 4,958 4,923 5,063 5,063
11,138 Total 14,466 17,202 17,043 18,107 18,157
none
Food Use Dom. Cons. none
9,790 Oil, Palm 10,234 10,622 10,315 11,113 11,113
31 Oil, Rapeseed 18 13 13 13 13
672 Oil, Soybean 606 671 690 718 718
131 Oil, Sunflowerseed 146 156 151 156 156
1,491 Other 1,568 1,626 1,657 1,711 1,711
12,115 Total 12,572 13,088 12,826 13,711 13,711
none
Domestic Consumption none
16,954 Oil, Palm 20,322 23,194 22,778 24,500 24,550
31 Oil, Rapeseed 18 13 13 13 13
718 Oil, Soybean 655 725 739 772 772
131 Oil, Sunflowerseed 146 156 151 156 156
5,792 Other 6,290 6,594 6,590 6,784 6,784
23,626 Total 27,431 30,682 30,271 32,225 32,275
none
Imports none
3,732 Oil, Palm 3,671 4,276 3,897 4,207 4,207
12 Oil, Rapeseed 13 12 12 12 12
272 Oil, Soybean 246 242 273 274 274
0 Oil, Sunflowerseed 15 25 20 25 25
503 Other 643 671 671 696 696
4,519 Total 4,588 5,226 4,873 5,214 5,214
Southeast Asia includes Brunei, Burma, Cambonia, Indonesia, Laos, Malaysia, Philippines, Singapore, Thailand, and Vietnam.
SME - 44 Percent Protein Soybean Meal Equivalent
Foreign Agricultural Service/USDA 32 July 2020Global Market Analysis
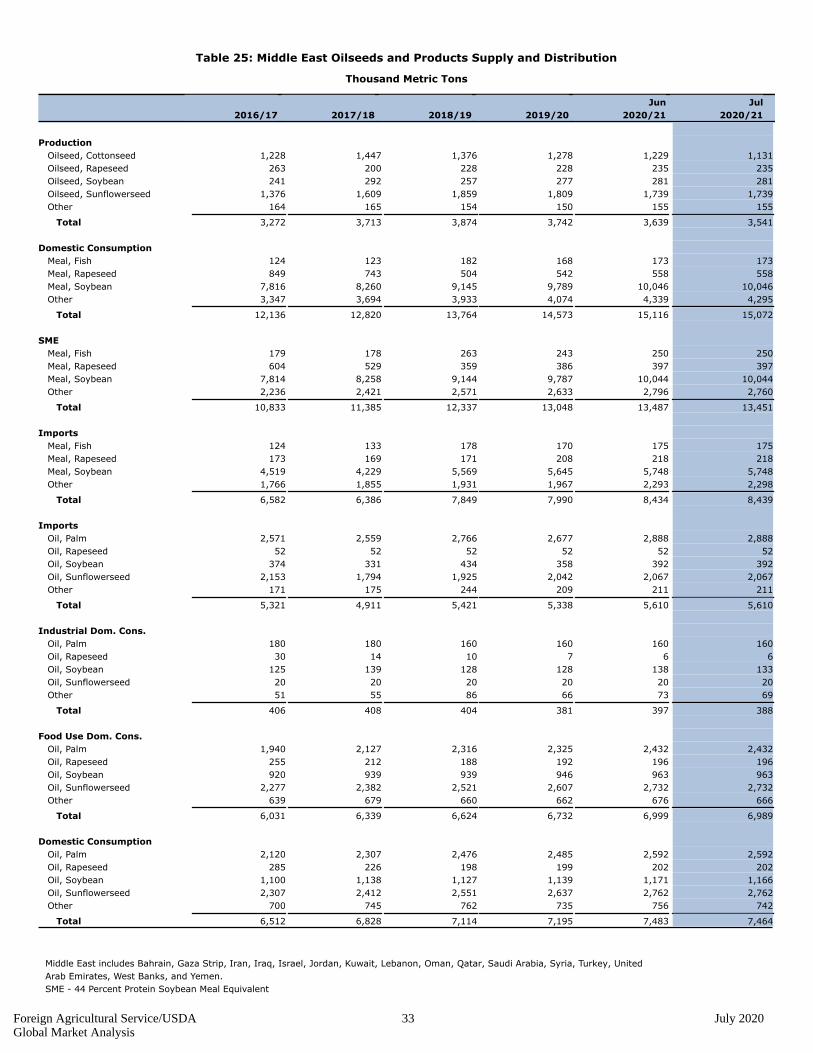
Table 25: Middle East Oilseeds and Products Supply and Distribution
Thousand Metric Tons
2016/17 2017/18 2018/19 2019/20
Jun
2020/21
Jul
2020/21
none
Production none
1,228 Oilseed, Cottonseed 1,447 1,376 1,278 1,229 1,131
263 Oilseed, Rapeseed 200 228 228 235 235
241 Oilseed, Soybean 292 257 277 281 281
1,376 Oilseed, Sunflowerseed 1,609 1,859 1,809 1,739 1,739
164 Other 165 154 150 155 155
3,272 Total 3,713 3,874 3,742 3,639 3,541
none
Domestic Consumption none
124 Meal, Fish 123 182 168 173 173
849 Meal, Rapeseed 743 504 542 558 558
7,816 Meal, Soybean 8,260 9,145 9,789 10,046 10,046
3,347 Other 3,694 3,933 4,074 4,339 4,295
12,136 Total 12,820 13,764 14,573 15,116 15,072
none
SME none
179 Meal, Fish 178 263 243 250 250
604 Meal, Rapeseed 529 359 386 397 397
7,814 Meal, Soybean 8,258 9,144 9,787 10,044 10,044
2,236 Other 2,421 2,571 2,633 2,796 2,760
10,833 Total 11,385 12,337 13,048 13,487 13,451
none
Imports none
124 Meal, Fish 133 178 170 175 175
173 Meal, Rapeseed 169 171 208 218 218
4,519 Meal, Soybean 4,229 5,569 5,645 5,748 5,748
1,766 Other 1,855 1,931 1,967 2,293 2,298
6,582 Total 6,386 7,849 7,990 8,434 8,439
none
Imports none
2,571 Oil, Palm 2,559 2,766 2,677 2,888 2,888
52 Oil, Rapeseed 52 52 52 52 52
374 Oil, Soybean 331 434 358 392 392
2,153 Oil, Sunflowerseed 1,794 1,925 2,042 2,067 2,067
171 Other 175 244 209 211 211
5,321 Total 4,911 5,421 5,338 5,610 5,610
none
Industrial Dom. Cons. none
180 Oil, Palm 180 160 160 160 160
30 Oil, Rapeseed 14 10 7 6 6
125 Oil, Soybean 139 128 128 138 133
20 Oil, Sunflowerseed 20 20 20 20 20
51 Other 55 86 66 73 69
406 Total 408 404 381 397 388
none
Food Use Dom. Cons. none
1,940 Oil, Palm 2,127 2,316 2,325 2,432 2,432
255 Oil, Rapeseed 212 188 192 196 196
920 Oil, Soybean 939 939 946 963 963
2,277 Oil, Sunflowerseed 2,382 2,521 2,607 2,732 2,732
639 Other 679 660 662 676 666
6,031 Total 6,339 6,624 6,732 6,999 6,989
none
Domestic Consumption none
2,120 Oil, Palm 2,307 2,476 2,485 2,592 2,592
285 Oil, Rapeseed 226 198 199 202 202
1,100 Oil, Soybean 1,138 1,127 1,139 1,171 1,166
2,307 Oil, Sunflowerseed 2,412 2,551 2,637 2,762 2,762
700 Other 745 762 735 756 742
6,512 Total 6,828 7,114 7,195 7,483 7,464
Middle East includes Bahrain, Gaza Strip, Iran, Iraq, Israel, Jordan, Kuwait, Lebanon, Oman, Qatar, Saudi Arabia, Syria, Turkey, United
Arab Emirates, West Banks, and Yemen.
SME - 44 Percent Protein Soybean Meal Equivalent
Foreign Agricultural Service/USDA 33 July 2020Global Market Analysis
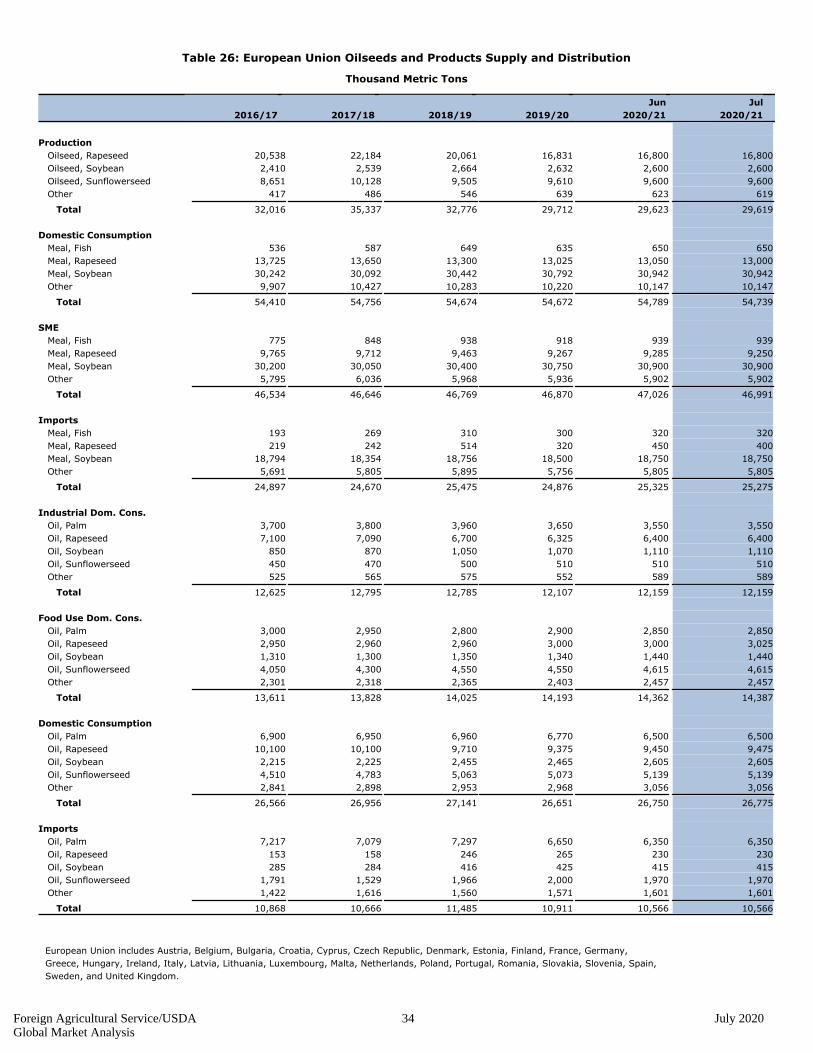
Table 26: European Union Oilseeds and Products Supply and Distribution
Thousand Metric Tons
2016/17 2017/18 2018/19 2019/20
Jun
2020/21
Jul
2020/21
none
Production none
20,538 Oilseed, Rapeseed 22,184 20,061 16,831 16,800 16,800
2,410 Oilseed, Soybean 2,539 2,664 2,632 2,600 2,600
8,651 Oilseed, Sunflowerseed 10,128 9,505 9,610 9,600 9,600
417 Other 486 546 639 623 619
32,016 Total 35,337 32,776 29,712 29,623 29,619
none
Domestic Consumption none
536 Meal, Fish 587 649 635 650 650
13,725 Meal, Rapeseed 13,650 13,300 13,025 13,050 13,000
30,242 Meal, Soybean 30,092 30,442 30,792 30,942 30,942
9,907 Other 10,427 10,283 10,220 10,147 10,147
54,410 Total 54,756 54,674 54,672 54,789 54,739
none
SME none
775 Meal, Fish 848 938 918 939 939
9,765 Meal, Rapeseed 9,712 9,463 9,267 9,285 9,250
30,200 Meal, Soybean 30,050 30,400 30,750 30,900 30,900
5,795 Other 6,036 5,968 5,936 5,902 5,902
46,534 Total 46,646 46,769 46,870 47,026 46,991
none
Imports none
193 Meal, Fish 269 310 300 320 320
219 Meal, Rapeseed 242 514 320 450 400
18,794 Meal, Soybean 18,354 18,756 18,500 18,750 18,750
5,691 Other 5,805 5,895 5,756 5,805 5,805
24,897 Total 24,670 25,475 24,876 25,325 25,275
none
Industrial Dom. Cons. none
3,700 Oil, Palm 3,800 3,960 3,650 3,550 3,550
7,100 Oil, Rapeseed 7,090 6,700 6,325 6,400 6,400
850 Oil, Soybean 870 1,050 1,070 1,110 1,110
450 Oil, Sunflowerseed 470 500 510 510 510
525 Other 565 575 552 589 589
12,625 Total 12,795 12,785 12,107 12,159 12,159
none
Food Use Dom. Cons. none
3,000 Oil, Palm 2,950 2,800 2,900 2,850 2,850
2,950 Oil, Rapeseed 2,960 2,960 3,000 3,000 3,025
1,310 Oil, Soybean 1,300 1,350 1,340 1,440 1,440
4,050 Oil, Sunflowerseed 4,300 4,550 4,550 4,615 4,615
2,301 Other 2,318 2,365 2,403 2,457 2,457
13,611 Total 13,828 14,025 14,193 14,362 14,387
none
Domestic Consumption none
6,900 Oil, Palm 6,950 6,960 6,770 6,500 6,500
10,100 Oil, Rapeseed 10,100 9,710 9,375 9,450 9,475
2,215 Oil, Soybean 2,225 2,455 2,465 2,605 2,605
4,510 Oil, Sunflowerseed 4,783 5,063 5,073 5,139 5,139
2,841 Other 2,898 2,953 2,968 3,056 3,056
26,566 Total 26,956 27,141 26,651 26,750 26,775
none
Imports none
7,217 Oil, Palm 7,079 7,297 6,650 6,350 6,350
153 Oil, Rapeseed 158 246 265 230 230
285 Oil, Soybean 284 416 425 415 415
1,791 Oil, Sunflowerseed 1,529 1,966 2,000 1,970 1,970
1,422 Other 1,616 1,560 1,571 1,601 1,601
10,868 Total 10,666 11,485 10,911 10,566 10,566
European Union includes Austria, Belgium, Bulgaria, Croatia, Cyprus, Czech Republic, Denmark, Estonia, Finland, France, Germany,
Greece, Hungary, Ireland, Italy, Latvia, Lithuania, Luxembourg, Malta, Netherlands, Poland, Portugal, Romania, Slovakia, Slovenia, Spain,
Sweden, and United Kingdom.
Foreign Agricultural Service/USDA 34 July 2020Global Market Analysis

Table 27: China Oilseeds and Products Supply and Distribution
Thousand Metric Tons
2016/17 2017/18 2018/19 2019/20
Jun
2020/21
Jul
2020/21
none
Production none
16,361 Oilseed, Peanut 17,092 17,333 17,500 17,500 17,500
13,128 Oilseed, Rapeseed 13,274 13,281 13,100 13,200 13,200
13,596 Oilseed, Soybean 15,283 15,967 18,100 17,500 17,500
3,201 Oilseed, Sunflowerseed 3,149 2,494 3,250 3,300 3,300
8,800 Other 10,800 10,875 10,679 10,400 10,400
55,086 Total 59,598 59,950 62,629 61,900 61,900
none
Domestic Consumption none
2,019 Meal, Fish 1,867 1,788 1,775 1,800 1,800
10,777 Meal, Rapeseed 11,453 11,148 10,777 10,414 10,414
68,646 Meal, Soybean 70,105 66,405 69,142 73,067 74,255
8,252 Other 9,495 10,609 11,379 10,366 10,438
89,694 Total 92,920 89,950 93,073 95,647 96,907
none
SME none
2,917 Meal, Fish 2,698 2,584 2,565 2,601 2,601
7,339 Meal, Rapeseed 7,816 7,595 7,331 7,072 7,072
67,596 Meal, Soybean 69,005 65,255 67,902 71,817 73,005
7,260 Other 8,244 8,987 9,609 8,839 8,887
85,113 Total 87,763 84,421 87,407 90,328 91,564
none
Imports none
1,583 Meal, Fish 1,467 1,424 1,425 1,450 1,450
875 Meal, Rapeseed 1,258 1,437 1,675 1,400 1,400
61 Meal, Soybean 23 17 25 15 15
657 Other 842 2,161 2,475 1,590 1,690
3,176 Total 3,590 5,039 5,600 4,455 4,555
none
Food Use Dom. Cons. none
2,650 Oil, Palm 2,900 4,512 3,875 4,045 4,045
2,807 Oil, Peanut 2,966 3,091 3,247 3,146 3,146
8,600 Oil, Rapeseed 8,600 8,387 8,153 7,746 7,746
16,350 Oil, Soybean 16,500 15,885 16,552 17,663 17,732
1,332 Oil, Sunflowerseed 1,428 1,496 2,086 2,151 2,133
1,296 Other 1,569 1,601 1,564 1,577 1,577
33,035 Total 33,963 34,972 35,477 36,328 36,379
none
Domestic Consumption none
4,750 Oil, Palm 5,100 7,012 6,125 6,445 6,445
2,807 Oil, Peanut 2,966 3,091 3,247 3,146 3,146
8,600 Oil, Rapeseed 8,600 8,387 8,153 7,746 7,746
16,350 Oil, Soybean 16,500 15,885 16,552 17,663 17,732
1,332 Oil, Sunflowerseed 1,428 1,496 2,086 2,151 2,133
1,891 Other 2,270 2,491 2,314 2,427 2,427
35,730 Total 36,864 38,362 38,477 39,578 39,629
none
Imports none
4,881 Oil, Palm 5,320 6,795 6,200 6,400 6,400
111 Oil, Peanut 112 172 185 225 225
802 Oil, Rapeseed 1,067 1,507 1,700 1,700 1,700
711 Oil, Soybean 481 783 800 1,200 1,000
725 Oil, Sunflowerseed 785 1,032 1,400 1,400 1,400
773 Other 883 1,117 955 1,085 1,085
8,003 Total 8,648 11,406 11,240 12,010 11,810
SME - 44 Percent Protein Soybean Meal Equivalent
Foreign Agricultural Service/USDA 35 July 2020Global Market Analysis
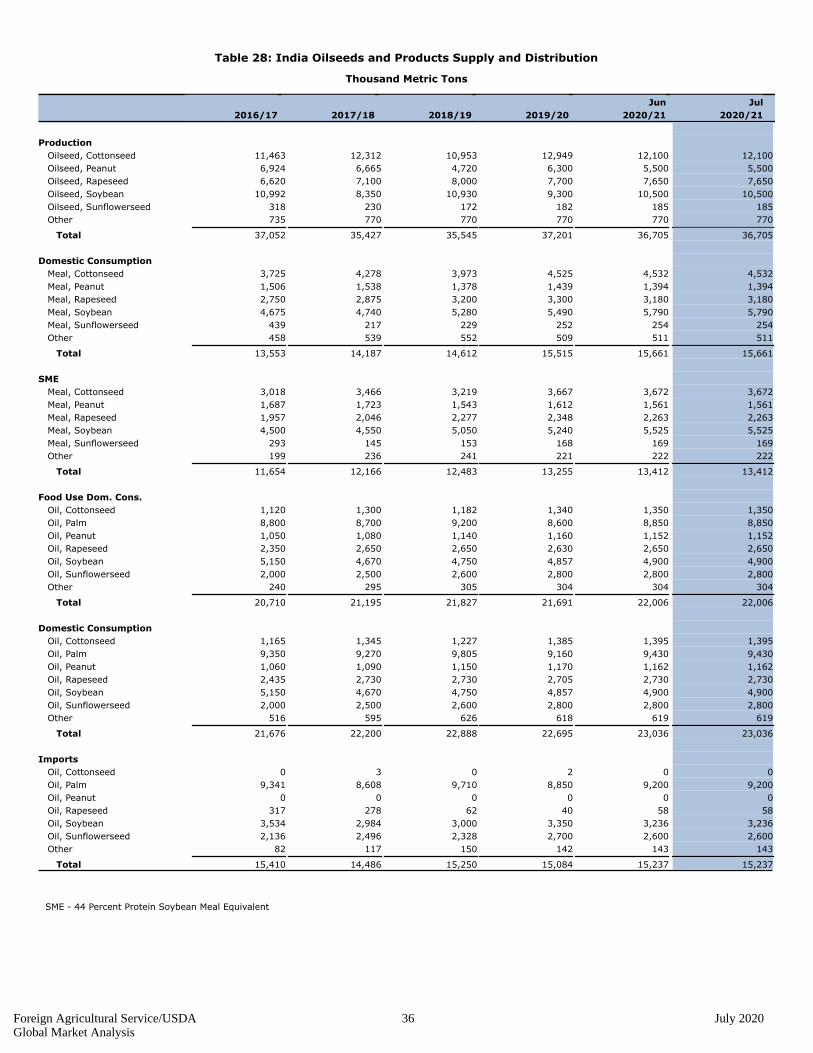
Table 28: India Oilseeds and Products Supply and Distribution
Thousand Metric Tons
2016/17 2017/18 2018/19 2019/20
Jun
2020/21
Jul
2020/21
none
Production none
11,463 Oilseed, Cottonseed 12,312 10,953 12,949 12,100 12,100
6,924 Oilseed, Peanut 6,665 4,720 6,300 5,500 5,500
6,620 Oilseed, Rapeseed 7,100 8,000 7,700 7,650 7,650
10,992 Oilseed, Soybean 8,350 10,930 9,300 10,500 10,500
318 Oilseed, Sunflowerseed 230 172 182 185 185
735 Other 770 770 770 770 770
37,052 Total 35,427 35,545 37,201 36,705 36,705
none
Domestic Consumption none
3,725 Meal, Cottonseed 4,278 3,973 4,525 4,532 4,532
1,506 Meal, Peanut 1,538 1,378 1,439 1,394 1,394
2,750 Meal, Rapeseed 2,875 3,200 3,300 3,180 3,180
4,675 Meal, Soybean 4,740 5,280 5,490 5,790 5,790
439 Meal, Sunflowerseed 217 229 252 254 254
458 Other 539 552 509 511 511
13,553 Total 14,187 14,612 15,515 15,661 15,661
none
SME none
3,018 Meal, Cottonseed 3,466 3,219 3,667 3,672 3,672
1,687 Meal, Peanut 1,723 1,543 1,612 1,561 1,561
1,957 Meal, Rapeseed 2,046 2,277 2,348 2,263 2,263
4,500 Meal, Soybean 4,550 5,050 5,240 5,525 5,525
293 Meal, Sunflowerseed 145 153 168 169 169
199 Other 236 241 221 222 222
11,654 Total 12,166 12,483 13,255 13,412 13,412
none
Food Use Dom. Cons. none
1,120 Oil, Cottonseed 1,300 1,182 1,340 1,350 1,350
8,800 Oil, Palm 8,700 9,200 8,600 8,850 8,850
1,050 Oil, Peanut 1,080 1,140 1,160 1,152 1,152
2,350 Oil, Rapeseed 2,650 2,650 2,630 2,650 2,650
5,150 Oil, Soybean 4,670 4,750 4,857 4,900 4,900
2,000 Oil, Sunflowerseed 2,500 2,600 2,800 2,800 2,800
240 Other 295 305 304 304 304
20,710 Total 21,195 21,827 21,691 22,006 22,006
none
Domestic Consumption none
1,165 Oil, Cottonseed 1,345 1,227 1,385 1,395 1,395
9,350 Oil, Palm 9,270 9,805 9,160 9,430 9,430
1,060 Oil, Peanut 1,090 1,150 1,170 1,162 1,162
2,435 Oil, Rapeseed 2,730 2,730 2,705 2,730 2,730
5,150 Oil, Soybean 4,670 4,750 4,857 4,900 4,900
2,000 Oil, Sunflowerseed 2,500 2,600 2,800 2,800 2,800
516 Other 595 626 618 619 619
21,676 Total 22,200 22,888 22,695 23,036 23,036
none
Imports none
0 Oil, Cottonseed 3 0 2 0 0
9,341 Oil, Palm 8,608 9,710 8,850 9,200 9,200
0 Oil, Peanut 0 0 0 0 0
317 Oil, Rapeseed 278 62 40 58 58
3,534 Oil, Soybean 2,984 3,000 3,350 3,236 3,236
2,136 Oil, Sunflowerseed 2,496 2,328 2,700 2,600 2,600
82 Other 117 150 142 143 143
15,410 Total 14,486 15,250 15,084 15,237 15,237
SME - 44 Percent Protein Soybean Meal Equivalent
Foreign Agricultural Service/USDA 36 July 2020Global Market Analysis
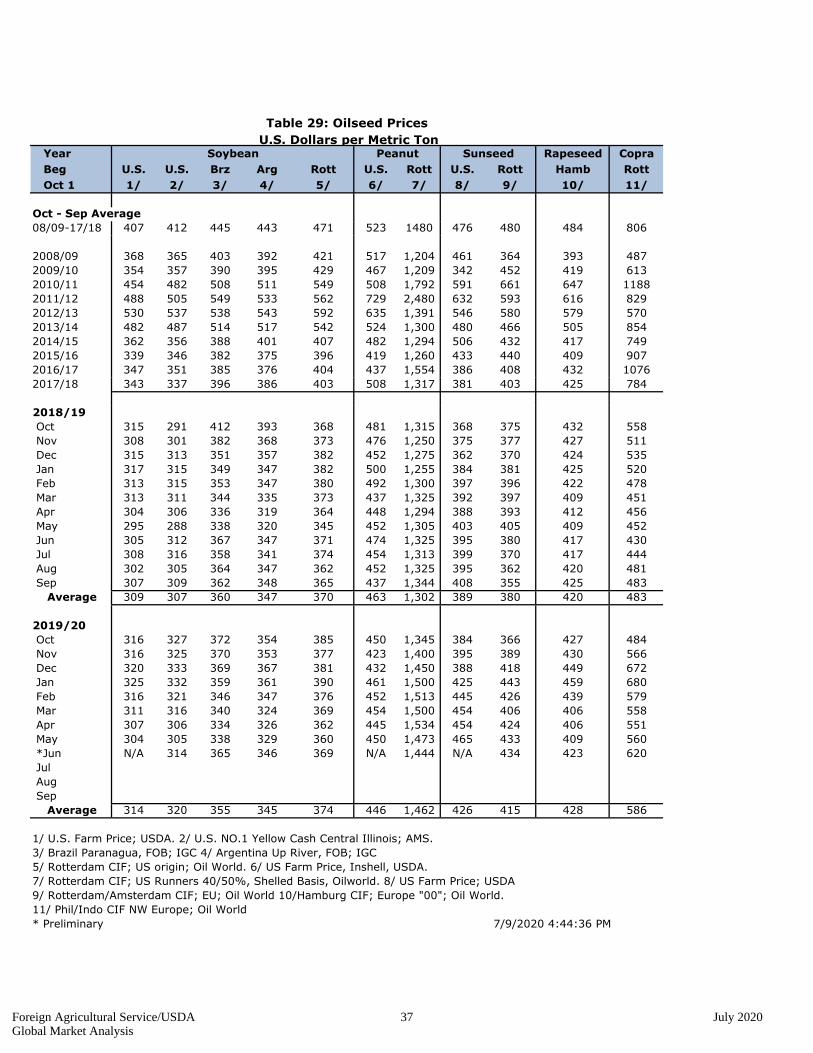
Year Rapeseed CopraBeg U.S. U.S. Brz Arg Rott U.S. Rott U.S. Rott Hamb RottOct 1 1/ 2/ 3/ 4/ 5/ 6/ 7/ 8/ 9/ 10/ 11/
Oct - Sep Average08/09-17/18 407 412 445 443 471 523 1480 476 480 484 806
2008/09 368 365 403 392 421 517 1,204 461 364 393 4872009/10 354 357 390 395 429 467 1,209 342 452 419 6132010/11 454 482 508 511 549 508 1,792 591 661 647 11882011/12 488 505 549 533 562 729 2,480 632 593 616 8292012/13 530 537 538 543 592 635 1,391 546 580 579 5702013/14 482 487 514 517 542 524 1,300 480 466 505 8542014/15 362 356 388 401 407 482 1,294 506 432 417 7492015/16 339 346 382 375 396 419 1,260 433 440 409 9072016/17 347 351 385 376 404 437 1,554 386 408 432 10762017/18 343 337 396 386 403 508 1,317 381 403 425 784
2018/19 Oct 315 291 412 393 368 481 1,315 368 375 432 558 Nov 308 301 382 368 373 476 1,250 375 377 427 511 Dec 315 313 351 357 382 452 1,275 362 370 424 535 Jan 317 315 349 347 382 500 1,255 384 381 425 520 Feb 313 315 353 347 380 492 1,300 397 396 422 478 Mar 313 311 344 335 373 437 1,325 392 397 409 451 Apr 304 306 336 319 364 448 1,294 388 393 412 456 May 295 288 338 320 345 452 1,305 403 405 409 452 Jun 305 312 367 347 371 474 1,325 395 380 417 430 Jul 308 316 358 341 374 454 1,313 399 370 417 444 Aug 302 305 364 347 362 452 1,325 395 362 420 481 Sep 307 309 362 348 365 437 1,344 408 355 425 483 Average 309 307 360 347 370 463 1,302 389 380 420 483
2019/20 Oct 316 327 372 354 385 450 1,345 384 366 427 484 Nov 316 325 370 353 377 423 1,400 395 389 430 566 Dec 320 333 369 367 381 432 1,450 388 418 449 672 Jan 325 332 359 361 390 461 1,500 425 443 459 680 Feb 316 321 346 347 376 452 1,513 445 426 439 579 Mar 311 316 340 324 369 454 1,500 454 406 406 558 Apr 307 306 334 326 362 445 1,534 454 424 406 551 May 304 305 338 329 360 450 1,473 465 433 409 560 *Jun N/A 314 365 346 369 N/A 1,444 N/A 434 423 620 Jul Aug Sep Average 314 320 355 345 374 446 1,462 426 415 428 586
7/ Rotterdam CIF; US Runners 40/50%, Shelled Basis, Oilworld. 8/ US Farm Price; USDA9/ Rotterdam/Amsterdam CIF; EU; Oil World 10/Hamburg CIF; Europe "00"; Oil World.
* Preliminary 7/9/2020 4:44:36 PM
3/ Brazil Paranagua, FOB; IGC 4/ Argentina Up River, FOB; IGC5/ Rotterdam CIF; US origin; Oil World. 6/ US Farm Price, Inshell, USDA.
11/ Phil/Indo CIF NW Europe; Oil World
Table 29: Oilseed Prices U.S. Dollars per Metric Ton
Soybean Peanut Sunseed
1/ U.S. Farm Price; USDA. 2/ U.S. NO.1 Yellow Cash Central Illinois; AMS.
Foreign Agricultural Service/USDA 37 July 2020Global Market Analysis
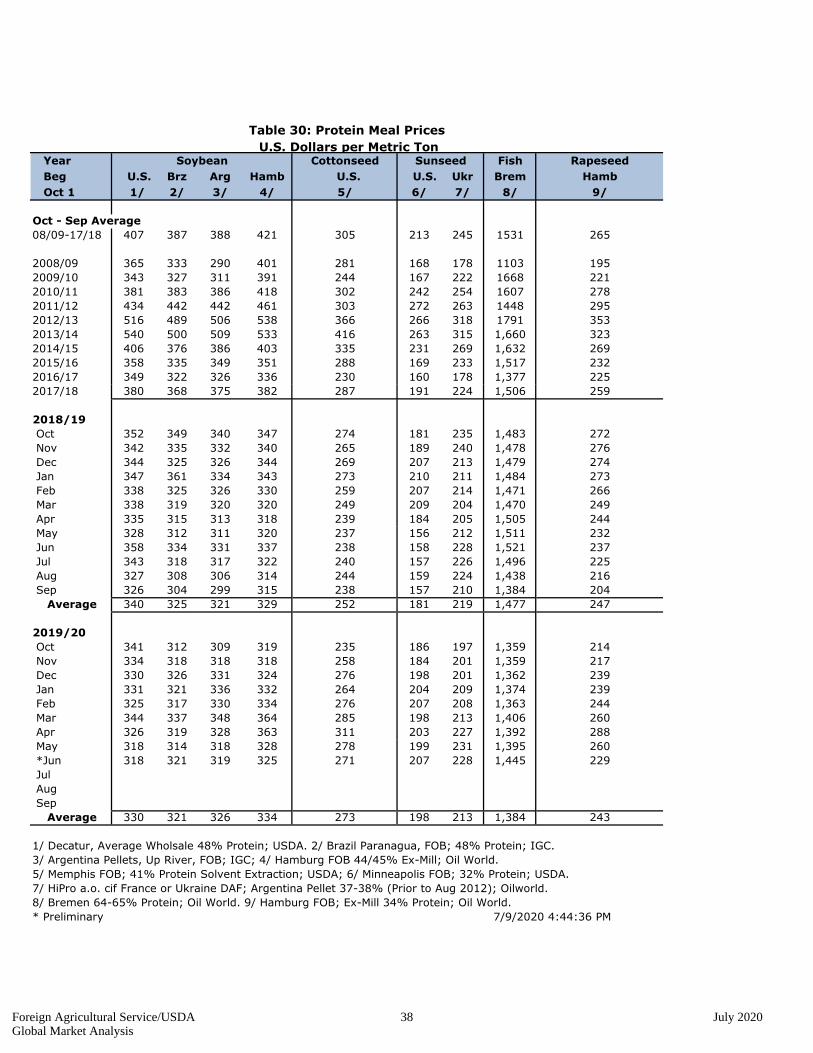
Year FishBeg U.S. Brz Arg Hamb U.S. Ukr BremOct 1 1/ 2/ 3/ 4/ 6/ 7/ 8/
Oct - Sep Average08/09-17/18 407 387 388 421 213 245 1531
2008/09 365 333 290 401 168 178 11032009/10 343 327 311 391 167 222 16682010/11 381 383 386 418 242 254 16072011/12 434 442 442 461 272 263 14482012/13 516 489 506 538 266 318 17912013/14 540 500 509 533 263 315 1,6602014/15 406 376 386 403 231 269 1,6322015/16 358 335 349 351 169 233 1,5172016/17 349 322 326 336 160 178 1,3772017/18 380 368 375 382 191 224 1,506
2018/19 Oct 352 349 340 347 181 235 1,483 Nov 342 335 332 340 189 240 1,478 Dec 344 325 326 344 207 213 1,479 Jan 347 361 334 343 210 211 1,484 Feb 338 325 326 330 207 214 1,471 Mar 338 319 320 320 209 204 1,470 Apr 335 315 313 318 184 205 1,505 May 328 312 311 320 156 212 1,511 Jun 358 334 331 337 158 228 1,521 Jul 343 318 317 322 157 226 1,496 Aug 327 308 306 314 159 224 1,438 Sep 326 304 299 315 157 210 1,384 Average 340 325 321 329 181 219 1,477
2019/20 Oct 341 312 309 319 186 197 1,359 Nov 334 318 318 318 184 201 1,359 Dec 330 326 331 324 198 201 1,362 Jan 331 321 336 332 204 209 1,374 Feb 325 317 330 334 207 208 1,363 Mar 344 337 348 364 198 213 1,406 Apr 326 319 328 363 203 227 1,392 May 318 314 318 328 199 231 1,395 *Jun 318 321 319 325 207 228 1,445 Jul Aug Sep Average 330 321 326 334 198 213 1,384
1/ Decatur, Average Wholsale 48% Protein; USDA. 2/ Brazil Paranagua, FOB; 48% Protein; IGC.3/ Argentina Pellets, Up River, FOB; IGC; 4/ Hamburg FOB 44/45% Ex-Mill; Oil World.5/ Memphis FOB; 41% Protein Solvent Extraction; USDA; 6/ Minneapolis FOB; 32% Protein; USDA.7/ HiPro a.o. cif France or Ukraine DAF; Argentina Pellet 37-38% (Prior to Aug 2012); Oilworld.8/ Bremen 64-65% Protein; Oil World. 9/ Hamburg FOB; Ex-Mill 34% Protein; Oil World.* Preliminary 7/9/2020 4:44:36 PM
214217239239
273 243
229
244260288260
311278
323269
271
276264276285
265269
416335288
287
225216204247
249244232237
276
273259249239
230
274
232225
272
259
274273266
238252
235258
237238240244
244302303366
U.S.5/
305
281
Table 30: Protein Meal Prices U.S. Dollars per Metric Ton
Soybean SunseedCottonseed RapeseedHamb
9/
265
195221278295353
Foreign Agricultural Service/USDA 38 July 2020Global Market Analysis
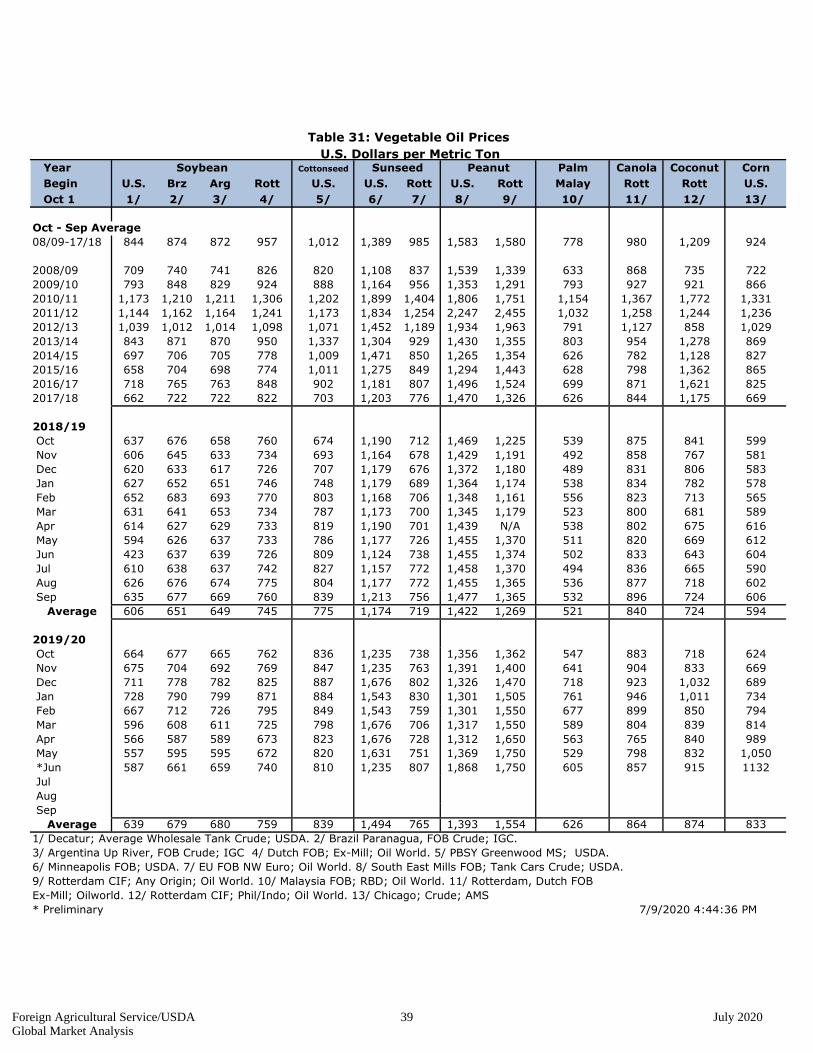
Year Cottonseed Palm Canola Coconut CornBegin U.S. Brz Arg Rott U.S. U.S. Rott U.S. Rott Malay Rott Rott U.S.Oct 1 1/ 2/ 3/ 4/ 5/ 6/ 7/ 8/ 9/ 10/ 11/ 12/ 13/
Oct - Sep Average08/09-17/18 844 874 872 957 1,012 1,389 985 1,583 1,580 778 980 1,209 924
2008/09 709 740 741 826 820 1,108 837 1,539 1,339 633 868 735 7222009/10 793 848 829 924 888 1,164 956 1,353 1,291 793 927 921 8662010/11 1,173 1,210 1,211 1,306 1,202 1,899 1,404 1,806 1,751 1,154 1,367 1,772 1,3312011/12 1,144 1,162 1,164 1,241 1,173 1,834 1,254 2,247 2,455 1,032 1,258 1,244 1,2362012/13 1,039 1,012 1,014 1,098 1,071 1,452 1,189 1,934 1,963 791 1,127 858 1,0292013/14 843 871 870 950 1,337 1,304 929 1,430 1,355 803 954 1,278 8692014/15 697 706 705 778 1,009 1,471 850 1,265 1,354 626 782 1,128 8272015/16 658 704 698 774 1,011 1,275 849 1,294 1,443 628 798 1,362 8652016/17 718 765 763 848 902 1,181 807 1,496 1,524 699 871 1,621 8252017/18 662 722 722 822 703 1,203 776 1,470 1,326 626 844 1,175 669
2018/19 Oct 637 676 658 760 674 1,190 712 1,469 1,225 539 875 841 599 Nov 606 645 633 734 693 1,164 678 1,429 1,191 492 858 767 581 Dec 620 633 617 726 707 1,179 676 1,372 1,180 489 831 806 583 Jan 627 652 651 746 748 1,179 689 1,364 1,174 538 834 782 578 Feb 652 683 693 770 803 1,168 706 1,348 1,161 556 823 713 565 Mar 631 641 653 734 787 1,173 700 1,345 1,179 523 800 681 589 Apr 614 627 629 733 819 1,190 701 1,439 N/A 538 802 675 616 May 594 626 637 733 786 1,177 726 1,455 1,370 511 820 669 612 Jun 423 637 639 726 809 1,124 738 1,455 1,374 502 833 643 604 Jul 610 638 637 742 827 1,157 772 1,458 1,370 494 836 665 590 Aug 626 676 674 775 804 1,177 772 1,455 1,365 536 877 718 602 Sep 635 677 669 760 839 1,213 756 1,477 1,365 532 896 724 606 Average 606 651 649 745 775 1,174 719 1,422 1,269 521 840 724 594
2019/20 Oct 664 677 665 762 836 1,235 738 1,356 1,362 547 883 718 624 Nov 675 704 692 769 847 1,235 763 1,391 1,400 641 904 833 669 Dec 711 778 782 825 887 1,676 802 1,326 1,470 718 923 1,032 689 Jan 728 790 799 871 884 1,543 830 1,301 1,505 761 946 1,011 734 Feb 667 712 726 795 849 1,543 759 1,301 1,550 677 899 850 794 Mar 596 608 611 725 798 1,676 706 1,317 1,550 589 804 839 814 Apr 566 587 589 673 823 1,676 728 1,312 1,650 563 765 840 989 May 557 595 595 672 820 1,631 751 1,369 1,750 529 798 832 1,050 *Jun 587 661 659 740 810 1,235 807 1,868 1,750 605 857 915 1132 Jul Aug Sep Average 639 679 680 759 839 1,494 765 1,393 1,554 626 864 874 8331/ Decatur; Average Wholesale Tank Crude; USDA. 2/ Brazil Paranagua, FOB Crude; IGC.3/ Argentina Up River, FOB Crude; IGC 4/ Dutch FOB; Ex-Mill; Oil World. 5/ PBSY Greenwood MS; USDA. 6/ Minneapolis FOB; USDA. 7/ EU FOB NW Euro; Oil World. 8/ South East Mills FOB; Tank Cars Crude; USDA. 9/ Rotterdam CIF; Any Origin; Oil World. 10/ Malaysia FOB; RBD; Oil World. 11/ Rotterdam, Dutch FOBEx-Mill; Oilworld. 12/ Rotterdam CIF; Phil/Indo; Oil World. 13/ Chicago; Crude; AMS * Preliminary
Table 31: Vegetable Oil Prices U.S. Dollars per Metric Ton
7/9/2020 4:44:36 PM
Soybean Sunseed Peanut
Foreign Agricultural Service/USDA 39 July 2020Global Market Analysis