Niagara Falls Regional Groundwater Assessment, Volume I
166
NIAGARA FALLS REGIONAL GROUNDWATER ASSESSMENT VOLUME I-TEXT Du Font Chemicals Occidental Chemical Corporation Olin Chemicals JUNE 1992 REF. NO. 4639 (1) This report printed on recycled paper WOODWARD-CLYDE CONSULTANTS CONESTOGA-ROVERS & ASSOCIATES 303375
-
Upload
khangminh22 -
Category
Documents
-
view
1 -
download
0
Transcript of Niagara Falls Regional Groundwater Assessment, Volume I

NIAGARA FALLS REGIONALGROUNDWATER ASSESSMENT
VOLUME I-TEXT
Du Font ChemicalsOccidental Chemical CorporationOlin Chemicals
JUNE 1992REF. NO. 4639 (1)This report printed on recycled paper
WOODWARD-CLYDE CONSULTANTS
CONESTOGA-ROVERS & ASSOCIATES
303375
EXECUTIVE SUMMARY
Du Pont Chemicals (Du Pont), Occidental Chemical Corporation
(OxyChem), and Olin Chemicals (Olin) have joined in a cooperative effort to
assess groundwater quality in Niagara Falls, New York from a regional
perspective. The companies retained Woodward-Clyde Consultants (WCC)
and Conestoga-Rovers & Associates (CRA) to prepare this Regional
Groundwater Assessment (RGA). The objectives of the RGA were as follows:
1. To evaluate the presence of chemicals of industrial origin in
groundwater throughout the regional study area based on existing data;
and
2.- To identify gaps in the regional groundwater database.
Available groundwater data were compiled for sites identified by
regulatory authorities as potential sources of groundwater contamination.
These data and brief Site Summary Reports are presented in Appendix A.
From a regional perspective, horizontal migration of chemicals in
groundwater is confined primarily to the bedrock groundwater flow regime.
Groundwater flow in the overburden is extremely limited due to low
transmissivity and interception by the many sewers and tunnels traversing
the city. Therefore, the assessment of regional groundwater conditions is
focused on bedrock groundwater conditions, specifically the Lockport
Dolomite water-bearing fracture zones. The RGA presents both
potentiometric data and chemical concentration data for groundwater in the
Lockport Dolomite.
ES-1 303376

The primary factors affecting groundwater flow in the Lockport
Dolomite are the Niagara River and Gorge, the New York Power Authority
(NYPA) Power Conduits and Forebay Canal, the Falls Street Tunnel (FST) and
NYPA Reservoir. The NYPA Power Conduits and Falls Street Tunnel are the
major collectors of bedrock groundwater discharge within the RGA study area
and groundwater flow is generally toward these structures.
The isoconcentration contour maps prepared for the RGA show
that chemicals in groundwater are concentrated close to the probable source
areas and much less concentrated with increased distance from the sources.
Where migration has apparently occurred, the directions of transport were
generally found to be consistent with the known patterns of groundwater
flow. Based on these findings, additional data are not required for
investigation of regional transport.
Based on the isoconcentration maps, investigations of the
following 11 sites have identified substantially elevated concentrations of
chemicals in groundwater:
i) BFI/CECOS Landfill;
ii) Du Pont Necco Park Landfill;
iii) Du Pont Niagara Plant;
iv) Frontier Chemical;
v) OxyChem Buffalo Avenue Plant;
vi) OxyChem Durez Niagara Plant;
303377ES-2

vii) OxyChem Hyde Park Landfill;
viii) OxyChem S-Area Landfill;
ix) Olin Buffalo Avenue Plant;
x) Olin Industrial Welding; and
xi) 3163 Buffalo Avenue Site (Solvent Chemicals).
Eight of these sites either have groundwater remediation
programs in place, under construction or are in the latter stages of planning
and design:
i) BFI/CECOS Landfill;
ii) Du Pont Necco Park Landfill;
iii) Du Pont Niagara Plant;
iv) Frontier Chemical;
v) OxyChem Buffalo Avenue Plant;
vi) OxyChem Durez Niagara Plant;
vii) OxyChem Hyde Park Landfill; and
viii) OxyChem S-Area Landfill.
Migration of "the chemicals within the plumes associated with
the sites is expected to be controlled by the remedial programs at each site.
This will minimize further chemical migration into and through the bedrock
groundwater. The comparatively small mass of chemicals present in the
bedrock groundwater beyond the influence of these remediation programs is
expected to eventually reach the Niagara River primarily via the NYPA
Power Conduits and the FST. Currently, 70 percent of water flowing in the
Es-3 303378

FST during dry weather is treated at the Niagara Falls Wastewater Treatment
Plant (NFWWTP) prior to discharge to the Niagara River.
Three sites are still in the process of being investigated to
determine remedial requirements:
i) Olin Buffalo Avenue Plant;
ii) Olin Industrial Welding; and
iii) 3163 Buffalo Avenue Site (Solvent Chemicals).
303379ES-4

TABLE OF CONTENTS
EXECUTIVE SUMMARY.................................................................................................ES-1
1.0 INTRODUCTION..................................................................................................1-1
2.0 AREADESCRIPTION...........................................................................................2-12.1 STUDY AREA............................................................................................ -12.2 AREA USAGE............................................................................................2-223 SITE SUMMARIES..............................................-....................................2-3
3.0 REGIONAL SETTING..........................................................................................3-13.1 PHYSIOGRAPHY AND CLIMATE ........................................................3-13.2 REGIONAL GEOLOGY .............................................................................3-23.2.1 Surficial Geology........................................................................................3-23.2.2 Bedrock Geology........................................................................................3-43.2.2.1 Lithology...................................................................................................3-43.2.2.2 Structure ...................................................................................................3-733 REGIONAL HYDROGEOLOGY ..............................................................3-103.4 STUDY AREA HYDROGEOLOGY .........................................................3-17
4.0 FACTORS AFFECTING GROUNDWATER FLOW......................................4-14.1 NIAGARA RIVER.....................................................................................4-24.2 NYPA POWER CONDUITS AND FOREBAY.....................................4-44.2.1 NYPA Power Conduits.............................................................................4-44.2.2 Forebay.........................................................................................................4-74.3 FALLS STREET TUNNEL........................................................................4-94.4 NYPA RESERVOIR...................................................................................4-124.5 UNDERGROUND TUNNELS AND SEWERS...................................4-144.5.1 New Road Tunnel .....................................................................................4-154.5.2 Gorge Interceptor Tunnel ........................................................................4-154.5.3 Adams Tailrace Tunnel............................................................................4-164.5.4 Schoellkopf Tunnel...................................................................................4-174.5.5 South Side Interceptor Sewer..................................................................4-184.5.6 Diversion Sewer.........................................................................................4-184.6 GROUNDWATER PRODUCTION/EXTRACTION WELLS...........4-194.7 BEDROCK GROUTING............................................................................4-254.7.1 NYPA Reservoir Grout Curtain.............................................................4-254.7.2 NYPA Forebay Grout Curtain.................................................................4-264.7.3 NYPA Conduit and Intake Grout Curtain Wall.................................4-264.7.4 Necco Park Landfill Grout Curtain Wall..............................................4-274.8 NYPA INTAKE WALL FOR POWER CONDUITS............................4-274.9 HYDRAULIC CANAL..............................................................................4-28
30338C

TABLE OF CONTENTS
Pa
4.104.11 BUILDING AND STRUCTURE FOUNDATIONS.............................4-30
5.0 RGA BEDROCK GROUNDWATER CHEMISTRY DATABASE ................5-15.1 DATABASE DEVELOPMENT ................................................................5-25.2 SUMMARY OF BEDROCK GROUNDWATER
ANALYTICAL DATA...............................................................................5-35.2.1 Data Availability ...................................................................................... ..5-35.2.1.1 BH/CECOS...............................................................................................5-55.2.1.2 Chisholm-Ryder.....................................................................................5-55.2.13 City of Niagara Falls Buffalo Avenue Site .................................. ......5-65.2.1.4 Du Pont Necco Park Landfill .............................................................. ..5-65.2.1.5 Du Pont Niagara Plant...........................................................................5-65.2.1.6 Frontier Chemical...................................................................................5-75.2.1.7 Niagara Co-Generation Site (Goodyear Tire and Rubber Co.) ......5-75.2.1.8 Hydraulic Canal.......................................................................................5-75.2.1.9 64th Street South Site............................................................................5-85.2.1.10 New Road Site.........................................................................................5-85.2.1.11 Occidental Chemical Corporation - Buffalo Avenue Plant...........5-85.2.1.12 Occidental Chemical Corporation - Durez Niagara Plant..............5-95.2.1.13 Occidental Chemical Corporation - Hyde Park Landfill. ............ ....5-105.2.1.14 Occidental Chemical Corporation - S-Area Landfill .......................5-105.2.1.15 Olin Buffalo Avenue Plant..................................................................5-105.2.1.16 Olin Industrial Welding Site................................................................5-ll5.2.1.17 Silbergeld Junkyard Site ........................................................................5-115.2.1.18 Solvent Chemical (3163 Buffalo Avenue Site)................................5-ll5.2.1.19 Union Carbide - Carbon Products Division Republic Plant ........ ..5-125.2.1.20 USGS Monitoring Wells.......................................................................5-125.2.2 Statistical Summary Of Analytical Data................................................5-1253 CHEMICAL GROUPS FOR DETAILED MAPPING .......................... ..5-1353.1 Group 1 - Chlorinated Volatile Aliphatic Compounds.....................5-145.3.2 Group 2 - Benzene, Toluene, Ethylbenzene and Xylene.... ............. ..5-15533 Group 3 - Acetone and 2-Butanone ..................................................... ..5-1553.4 Group 4 - Phenol and Methylphenols....... ................................ ............5-165.3.5 Group 5 - Chlorophenols .........................................................................5-1653.6 Group 6 - Chlorobenzenes and Chlorotoluenes .................................5-1753.7 Group 7 - Polyaromatic Hydrocarbons ..................................................5-1853.8 Group 8 - Hexachloroethane, Hexachlorobutadiene,.. ................... ....5-19
Hexachlorocyclopentadiene and Octachlorocyclopentene................5-1953.9 Group 9 - Phthalates..................................................................................5-1953.10 Group 10 - Pesticides/PCBs .................................................................. ....5-20
30338J

TABLE OF CONTENTS
Page
5.3.11 Chemicals Considered Individually......................................................5-205.3.12 Other Detected Organic Chemicals.........................................................5-215.4 DATABASE LIMITATIONS....................................................................5-22
6.0 PRESENCE OF CHEMICALS IN BEDROCK GROUNDWATER................6-16.1 GROUP 1CHEMICALS.............................................................................6-26.2 GROUP2CHEMICALS.............................................................................6-463 GROUP 3 CHEMICALS............................................,................................6-66.4 GROUP4CHEMICALS.............................................................................6-76.5 GROUP5CHEMICALS.............................................................................6-86.6 GROUP6 CHEMICALS............................................................................6.7 GROUP 7CHEMICALS.............................................................................6-116.8 GROUP8CHEMICALS.............................................................................6-116.9 GROUP9CHEMICALS.............................................................................6-126.10 GROUP 10 CHEMICALS...........................................................................6-136.11 CHEMICALS CONSIDERED INDIVIDUALLY....................................6-146.11.1 Benzoic Acid...............................................................................................6-146.11.2 N-Nitrosodiphenylamine........................................................................6-146.11.3 Lead...............................................................................................................6-156.11.4 Mercury........................................................................................................6-156.11.5 Barium.........................................................................................................6-166.12 FALLS STREET TUNNEL AND NYPA CONDUITS.........................6-166.13 REGIONAL DATA GAPS ........................................................................6-19
7.0 GROUNDWATER REMEDIATION PROGRAMS.........................................7-17.1 BFI/CECOSLANDFILL.............................................................................7-27.2 DU PONT NECCO PARK LANDFILL...................................................7-37.3 DU PONT NIAGARA PLANT...............................................................7-47.4 FRONTIER CHEMICALS.........................................................................7-57.5 OXYCHEM BUFFALO AVENUE PLANT............................................7-57.6 OXYCHEM DUREZ NIAGARA PLANT ..............................................7-67.7 OXYCHEM HYDE PARK LANDFILL ....................................................7-77.8 OXYCHEM S-AREA LANDFILL.............................................................7-87.9 OLIN BUFFALO AVENUE PLANT......................................................7-97.10 OUN INDUSTRIAL WELDING.............................................................7-107.11 SUMMARY.................................................................................................7-10
8.0 SUMMARY OF FINDINGS.................................................................................8-1
REFERENCES ...............................................'......................................................................R-l
303382

LIST OF FIGURES
FollowingReport
FIGURE 3.1
FIGURE 3.2
FIGURE 3.3
FIGURE 3.4
FIGURE 3.5
SURFICIAL GEOLOGY
BEDROCK GEOLOGY
GENERALIZED STRATIGRAPHIC SECTIONNIAGARA FALLS
LOCKPORT DOLOMITE PRODUCTION WELLSYIELDING MORE THAN 50 GPM
POTENTIOMETRIC SURFACE CONTOURS OFGROUNDWATER IN THE UPPER LOCKPORTDOLOMITE MEASURED ON MARCH 24-25,1985,
FIGURE 3.6
FIGURE 3.7
FIGURE 3.8
FIGURE 4.1
FIGURE 4.2
FIGURE 4.3
FIGURE 4.4
POTENTIOMETRIC SURFACE CONTOURS OFGROUNDWATER IN THE UPPER LOCKPORTDOLOMITE MEASURED ON OCTOBER 30 -NOVEMBER 3,1989
POTENTIOMETRIC SURFACE CONTOURS OFGROUNDWATER IN THE UPPER LOCKPORTDOLOMITE MEASURED ON MARCH 27-29,1990
POTENTIOMETRIC SURFACE CONTOURS OFGROUNDWATER IN THE UPPER LOCKPORTDOLOMITE MEASURED ON JUNE 26-27,1990
FACTORS AFFECTING NIAGARA RIVER WATERLEVELS
PROFILE OF NYPA POWER CONDUITS AND FOREBAYCANAL
CROSS SECTION 1 - NYPA CONDUITS ATBUFFALO AVENUE
CROSS SECTION 2 - NYPA CONDUITS ATFALLS STREET TUNNEL

LIST OF FIGURES
FIGURE 4.5
FIGURE 4.6
FIGURE 4.7
FIGURE 7.1
FollowingReport
CROSS SECTION 3 - NYPA CONDUITS ATPORTER AVENUE
PLAN, PROFILE AND TYPICAL SECTION -NYPA INTAKE STRUCTURES
RIVER BED CHANNELIZATION ANDTRAINING DYKE
C-ZONE POTENTIOMETRIC SURFACE DURINGEXTRACTION WELL OPERATION -DU PONT NECCO PARK
303384

LIST OF TABLES
FollowingReport
TABLE 2.1 IDENTIFIED SITES
TABLE 2.2 SITES WITH BEDROCK GROUNDWATER DATA
TABLE 3.1 CLIMATE DATA FOR BUFFALO, NEW YORK
TABLE 4.1 FACTORS AFFECTING GROUNDWATER FLOW
TABLE 4.2 CHIPPAWA - GRASS ISLAND POOLWATER ELEVATION RESTRICTIONS
TABLE 4.3 PRODUCTION AND EXTRACTION WELLSUMMARY
TABLE 5.1 STATISTICAL SUMMARY OF VOLATILE ORGANICCOMPOUNDS ANALYZED
TABLE 5.2 STATISTICAL SUMMARY OF SEMIVOLATILE ORGANICCOMPOUNDS ANALYZED
TABLE 5.3 STATISTICAL SUMMARY OFPESTICIDE/PCB COMPOUNDS ANALYZED
TABLE 5.4 STATISTICAL SUMMARY OF METALS ANALYZED
TABLE 5.5 NUMBER OF CHEMICALS ANALYZED IN EACHGROUP FOR INDIVIDUAL SITES
303386

LIST OF PLANS
PLAN 1 SITE LOCATIONS
PLAN 2 HYDRAULIC INFLUENCES
PLAN 3 UPPER LOCKPORT BEDROCK WELL LOCATIONS
PLAN 4 MIDDLE LOCKPORT BEDROCK WELL LOCATIONS
PLAN 5 LOWER LOCKPORT BEDROCK WELL LOCATIONS
PLAN 6 UPPER LOCKPORT BEDROCK GROUNDWATER CONTOURS
PLAN 7 MIDDLE LOCKPORT BEDROCK GROUNDWATER CONTOURS
PLAN 8 UPPER LOCKPORT CHLORINATED VOLATILE ALIPHATICCOMPOUND CONCENTRATIONS
PLAN 9 MIDDLE LOCKPORT CHLORINATED VOLATILE ALIPHATICCOMPOUND CONCENTRATIONS
PLAN 10 UPPER LOCKPORT BENZENE, TOLUENE, ETHYLBENZENE ANDXYLENE CONCENTRATIONS
PLAN 11 MIDDLE LOCKPORT BENZENE, TOLUENE, ETHYLBENZENEAND XYLENE CONCENTRATIONS
PLAN 12 UPPER LOCKPORT ACETONE AND 2-BUTANONECONCENTRATIONS
PLAN 13 MIDDLE LOCKPORT ACETONE AND 2-BUTANONECONCENTRATIONS
PLAN 14 UPPER LOCKPORT PHENOL AND METHYLPHENOLCONCENTRATIONS
PLAN 15 MIDDLE LOCKPORT PHENOL AND METHYLPHENOLCONCENTRATIONS
PLAN 16 UPPER LOCKPORT CHLOROPHENOL CONCENTRATIONS
PLAN 17 MIDDLE LOCKPORT CHLOROPHENOL CONCENTRATIONS
30330S

LIST OF PLANS
PLAN 18 UPPER LOCKPORT CHLOROBENZENE AND CHLOROTOLUENECONCENTRATIONS
PLAN 19 MIDDLE LOCKPORT CHLOROBENZENE AND CHLOROTOLUENECONCENTRATIONS
PLAN 20 UPPER LOCKPORT HEXACHLOROETHANE,HEXACHLOROBUTADIENE, HEXACHLOROCYCLOPENTADIENEAND OCTACHLOROCYCLOPENTENE CONCENTRATIONS
PLAN 21 MIDDLE LOCKPORT HEXACHLOROETHANE,HEXACHLOROBUTADIENE, HEXACHLOROCYCLOPENTADIENEAND OCTACHLOROCYCLOPENTENE CONCENTRATIONS
PLAN 22 UPPER LOCKPORT PESTICIDE AND PCB CONCENTRATIONS
PLAN 23 MIDDLE LOCKPORT PESTICIDE AND PCB CONCENTRATIONS
PLAN 24 UPPER LOCKPORT LEAD CONCENTRATIONS
PLAN 25 MIDDLE LOCKPORT LEAD CONCENTRATIONS
PLAN 26 UPPER LOCKPORT MERCURY CONCENTRATIONS
PLAN 27 MIDDLE LOCKPORT MERCURY CONCENTRATIONS
PLAN 28 UPPER LOCKPORT BARIUM CONCENTRATIONS
PLAN 29 MIDDLE LOCKPORT BARIUM CONCENTRATIONS
PLAN 30 UPPER LOCKPORT BEDROCK GROUNDWATER REMEDIATIONWELL LOCATIONS
PLAN 31 MIDDLE LOCKPORT BEDROCK GROUNDWATERREMEDIATION WELL LOCATIONS
LIST OF APPENDICES
APPENDIX A SITE SUMMARY ATTACHMENTS
303387

1.0 INTRODUCTION
Due to its history as a major industrial center, and its proximity
to the Great Lakes, the quality of groundwater in some areas of the City of
Niagara Falls, New York is of concern to environmental regulators. Since
about 1980, several Niagara Falls companies have conducted subsurface
investigations at or near their properties. These studies have generally
focused on groundwater quality near a potential chemical source area. More
recently, companies have been conducting groundwater sampling off their
properties, more distant from source areas.
In industrial sections of Niagara Falls, as a groundwater study is
extended from a chemical source property, there is a substantial possibility of
overlapping other source study areas (or chemical plumes). To minimize the
potential for duplication of effort and to identify data needs from a regional
perspective, Du Pont has been asked by the U.S. Environmental Protection
Agency (EPA) to initiate a study to compile and interpret relevant
groundwater data available from sites throughout a regional study area.
Du Pont presented a proposal for conducting the RGA and
invited all major industrial companies located in the study area (defined in
Section 2.0) to participate by contributing funding and/or groundwater
analytical data. Of the 18 invited companies, only two, Occidental Chemical
Corporation (OxyChem) and Olin Chemicals (Olin), agreed to participate with
Du Pont in conducting the RGA.
303388

Du Pont, OxyChem and Olin have shared the funding of the
project. Woodward-Clyde Consultants (WCC) and Cones toga-Rovers &
Associates (CRA) were retained to jointly prepare the RGA.
The objectives of the RGA were as follows:
1. To evaluate the presence of chemicals of industrial origin in
groundwater throughout the regional study area based on existing data;
and
2. To identify gaps in the regional groundwater database.
The RGA is presented in eight sections. Section 2.0 presents a
description of the RGA study area. Sections 3.0 and 4.0 discuss the study area
geology and groundwater hydrology, with a focus on factors affecting
groundwater flow. Section 5.0 describes the groundwater chemistry database
compiled for the project and Section 6.0 presents an interpretation of these
data. Ongoing and planned groundwater remediation programs are discussed
in Section 7.0. Section 8.0 summarizes the findings of the RGA.
3033891-2

2.0 AREA DESCRIPTION
2.1 STUDY AREA
In order to assess the regional bedrock groundwater
characteristics of the Niagara Falls area, a study area was established. The
RGA Study Area was defined as the area bounded by the New York Power
Authority (NYPA) Forebay Canal to the north, the Niagara River to the
south, the upper Lockport bedrock groundwater divide to the west and
Interstate 1-190 to the east (Study Area). The study area boundary is shown on
Plan 1. It encompasses portions of the Town of Niagara and the City of
Niagara Falls. The Forebay Canal and Niagara River are known
recharge/discharge areas for groundwater in the Lockport bedrock and thus
were selected as the north and south study area boundaries. The groundwater
divide was selected as the west study area boundary because it represents a
regional groundwater high from which groundwater either flows west
towards the Niagara Gorge or east towards the NYPA Power Conduits which
run south to north through the center of the Study Area. The eastern
boundary (Interstate 1-190) was selected because it is approximately the eastern
limit of the main industrialized area of the City of Niagara Falls and Town of
Niagara and that no migration is known to exist east of this boundary.
Previous studies in the Niagara Falls area have identified the
Lockport Group bedrock unit (uppermost bedrock group) as the major
waterbearing formation in the area. The overlying overburden materials and
underlying bedrock groups exhibit low transmissivity in comparison to the
2-1 303300

Lockport Group bedrock and do not have the potential for significant regional
groundwater migration. Thus, the vertical extent of the Study Area for the
RGA was established as the entire Lockport Group bedrock which is on the
order of 80 to 160 feet thick through the Study Area. The underlying bedrock
unit, the Rochester Formation, has been shown to be an aquitard which
severely restricts vertical and horizontal groundwater movement.
Consequently it provides an appropriate lower boundary for the Study Area.
2.2 AREA USAGE
The portions of the Town of Niagara and the City of Niagara
Falls within the Study Area are generally industrialized. The industrialized
areas within the Study Area, as indicated by area usage designations, are
shown on Plan 1. The industrialization is a result of the establishment of
industries in the area during the last 100 years that were brought to the area by
the abundant and convenient source of water and hydroelectric energy for
various industrial processes. The area usage patterns shown on Plan 1 w.ere
determined from zoning maps obtained from the Town of Niagara and City
of Niagara Falls. For ease of presentation, Town and City zone designations
have been combined into two major groups: industrial/commercial and
residential/parkland.
Within the City of Niagara Falls, the industrial and commercial
areas are generally located to the south along the Niagara River and east
along Interstate 1-190. Within the Town of Niagara the industrial and
2-2 303391

commercial areas are generally located in the south and the residential and
parkland areas in the north. In general, the Sites discussed in the RGA are
located within the industrial areas.
23 SITE SUMMARIES
A review of NYSDEC records showed that a total of 39 sites
located within or immediately surrounding the Study Area had been
investigated to some extent. The sites are listed in Table 2.1 and are located
on Plan 1. Available information for each site was obtained from the
individual site owners, the NYSDEC and the USEPA concerning overburden
and groundwater conditions. This information was reviewed and a
summary of the data for each site was produced. Each site summary contains
an introduction describing the history of the site including past
investigations, a description of the site's geology/hydrogeology, chemical
presence at the site and recommendations for future investigations or work
to be conducted at the site. The site summaries are presented in Appendix A
followed by a list of documents upon which they are based.
9033922-3

The 39 sites consisted of the following types:
Site Identification Number of Sites
• Operating Landfills 1
• Closed Landfills 6
• Former Disposal or Fill Areas 12
• Closed Industrial Facilities 3
• Operating Industrial Facilities 1739
Specific information was not available for the following sites:
• Apollo Steel Corporation;
• Cascades - Niagara Falls Inc.;
• Union Carbide Corporation - Linde Division; and
• Whirlpool site - City of Niagara Falls.
As shown on Plan 1, the sites are primarily located within
industrial and commercial areas.
Bedrock ground water data were available for the 18 sites listed in
Table 2.2. The data from these sites was used in the RGA evaluations. The
USGS installed and sampled 13 bedrock wells within the Niagara Falls area as
part of the 1985 study entitled "Preliminary Evaluation of Chemical
Migration to Groundwater and the Niagara River from Selected
303393

Waste-Disposal sites/' Hydrogeologic and chemical data from these wells has
been incorporated into the RGA.
3033942-5

3.0 REGIONAL SETTING
3.1 PHYSIOGRAPHY AND CLIMATE
Niagara Falls lies within the Niagara Escarpment Physiographic
Region. The dominant landform in the area is the exposed crest of the
escarpment. At Niagara Falls, the escarpment is characterized by steep sided
cliff faces with typical relief on the order of 250 feet. The Niagara River flows
over the Niagara Escarpment and through the Niagara Gorge to discharge
into Lake Ontario. The surface topography within the City of Niagara Falls
slopes gently toward the Niagara River. This topography is typical of glacial
ground moraines.
The climate of the Niagara Falls area is classified as humid
continental, consisting of cool, wet winters and hot, wet summers. Mean
monthly temperatures and precipitation data for the Buffalo meteorological
station, which is located at Buffalo International Airport, are presented in
Table 3.1. The mean annual temperature is 47°F, with the coldest average
monthly temperature occurring in January (25°F) and the warmest in July
(70°F). The mean annual precipitation is 36 inches, which is evenly
distributed throughout the year.
303385

3.2 REGIONAL GEOLOGY
3.2.1 Surficial Geology
The natural surficial geology of the Niagara Falls area has been
described by Muller (1977). The natural surficial materials can be divided into
three units based upon depositional environments as shown on Figure 3.1.
These units include: Recent Alluvium, Lacustrine Sediments and Glacial
Deposits.
Recent Alluvium
The Recent Alluvium consists of sand, silt and gravel deposited
along modern river and stream courses. These deposits are generally thin
and of limited lateral extent. These sediments normally lie unconformably
above the Lacustrine Sediments or Glacial Deposits.
Lacustrine Sediments
The Lacustrine Sediments are comprised of silt, clay and sand
deposits laid down by glacial lakes. The ancestral lakes include, from
youngest to oldest, Lake Tonawanda, Lake Iroquois, Lake Warren and Lake
Whittlesey. At Niagara Falls, the surficial sediments are associated with
glacial Lake Tonawanda. These deposits are relatively thin and consist of
laminated silt, sand and clay extending eastward into Orleans and Genesee
Counties. In many areas within the study area, the Lacustrine Sediments are
32 303396

primarily silty clays. Although these deposits are relatively thin in nature,
the Lacustrine Sediments in the Niagara Falls are thicker than the other two
deposits (Recent Alluvium and Glacial Till). Because of their thickness and
fine-grained nature, these deposits act as aquitards, restricting vertical
groundwater movement. Remnant beach strands are commonly associated
with these deposits.
The sediments of former Lake Tonawanda are underlain by
sediments of similar texture associated with glacial Lake Iroquois to the north
and Lakes Warren and Whittlesey to the south. The Lacustrine sediments
normally lie on top of Glacial Deposits or bedrock.
Glacial Deposits
Sediments of glacial origin overlie bedrock in much of the
Niagara Falls area. An extensive ground moraine comprised of a thin silty
clay to sandy till occurs over much of the area. The ground moraine is
normally marked by end moraines composed of materials of similar texture
as well as sand and gravel deposits formed in ice-marginal positions or as
outwash. In general, the Glacial Deposits are thin and lie unconformably atop
the Paleozoic bedrock. These deposits in conjunction with the Lacustrine
Sediments also act as an aquitard restricting vertical groundwater movement.
3033973-3

Fill Materials
In addition to the above natural geologic deposits, a man-made
deposit has affected the surficial geology of the Niagara Falls area in the form
of fill materials placed on top of the natural deposits. Also, as a result of the
construction of buildings, roads and utilities, natural deposits have been
excavated, changing the surface of the natural deposits. In general, fill
materials are primarily composed of the natural deposits found in the area
but also contain vegetation, wood and man-made materials such as building
debris, crushed rock and slag.
3.2.2 Bedrock Geology
3.2.2.1 Lithology
The Niagara Falls area is underlain by a thick succession of
Paleozoic sedimentary rocks which form the northern flank of the Alleghany
basin. The Paleozoic strata dip toward the south at a slope of approximately
30 feet per mile (Yager and Kappel, 1987). Bedrock exposure is controlled by
glacial erosion as expressed by broad west trending bands subparallel to the
south shore of Lake Ontario as shown on Figure 3.2. This pattern is
interrupted by the Niagara Escarpment where much of the succession is
exposed.
303398

The stratigraphic succession beneath Niagara Falls consists of
rock ranging in age from Middle Silurian to Late Ordovician. A schematic
stratigraphic section illustrating the characteristics of these rock units and
their stratigraphic relationships is presented on Figure 3.3. Stratigraphic
nomenclature has been based upon the recommendations of Rickard (1975).
Within the study area, the upper bedrock units belong to the
Lockport Group. Underlying the Lockport Group, the principal bedrock units
belong to the Clinton and Medina Groups, and the Queenston Formation.
The characteristics of the individual formations are discussed in the
following sections.
Lockport Group
At Niagara Falls, the Lockport Group is comprised of four
distinct dolostone formations. In descending order, the formations are Oak
Orchard, Eramosa, Goat Island and Gasport Formations. The stratigraphic
characteristics of these formations are summarized on Figure 3.3.
The Oak Orchard Formation is considered to be time equivalent
with the Guelph Formation in southern Ontario, but is distinguished due to
minor textural variations (Zenger, 1965). The Oak Orchard Formation is
exposed at the surface beneath the study area, except in the vicinity of the
Niagara River Gorge. The hard resistant Oak Orchard Formation forms the
cap rock of the Niagara Escarpment and underlies most of the Niagara Falls
area.
3-5 303399

Clinton Group
The Clinton Group consists of an alternating succession of
dolostone, shale and limestone. Six formations are recognized within the
Clinton Group. These are the Decew, Rochester, Irondequoit, Reynales,
Neagha and Thorold Formations. The thickness and characteristics of these
units are summarized on Figure 3.3. In general, rocks of the Clinton Group
tend to occur in thinner units and contain a higher limestone content in
contrast to the dolostone content in the Lockport Group and the underlying
clastic Medina Group. The upper and lower contacts of the Clinton Group are
marked by erosional unconformities as are several contacts between
individual formations within the Group. Several formations within the
Clinton Group are not present in the Niagara Falls area.
Clinton Group rocks are exposed at the Niagara River Gorge and
along the face of the Niagara escarpment, but do not outcrop at the surface in
the Niagara Falls area.
Medina Group
The rocks of the Lower Silurian Medina Group underlie the
Clinton Group at Niagara Falls. The Medina Group is comprised of the
Grimsby, Power Glen and Whirlpool Formations. Rocks within this Group
are clastic in nature with sandstone and shale being the dominant lithologies.
Erosional unconformities occur at the upper and lower contacts of the
303400

Medina Group. The characteristics of the Medina Group rocks are
summarized on Figure 3.3.
Oueenston Formation
The Ordovician Queenston Formation is the oldest formation
observed in the Niagara Falls area. The actual thickness of this unit is
approximately 900 feet. The Queenston Formation is a laterally extensive,
uniform, soft red-brown mudstone with minor sandstone interbeds.
3.2.2.2 Structure
The stratigraphic units in the area are generally flat lying
between the Niagara Escarpment and Niagara Falls, New York. The regional
dip is to the southeast at approximately 30 feet /mile between Niagara Falls
and Lake Erie.
Successive periods of tectonic activity during the Paleozoic,
particularly the Appalachian Orogens (Acadian, Alleghenian), were
responsible for the changes in the stress fields that have resulted in the
fracturing of the bedrock underlying the Niagara Region. Glacial rebound is
also a factor in the development of bedrock fractures. The fracture system
may also be affected by the contemporary regional stress field in the Michigan
and Allegheny Basins. The fractures in the Silurian and Devonian bedrock
consist of joints and faults. Two types of joints have been mapped in the
303401

region: bedding joints, which are parallel to the bedding of the rock, and
vertical joints which cut across the bedding at approximately right angles
(Johnston, 1964). These fractures are responsible for the waterbearing capacity
of the bedrock. The waterbearing capacity of the bedrock is also enhanced by
the glacial rebound and solutioning.
In the Lockport Group, Johnston (1964) mapped up to seven
separate horizontal fracture zones during the construction of the New York
Power Authority (NYPA) Power Conduits, which were excavated using open
cut methodology. The bedding fractures are planar structures that are
laterally extensive and were found to extend over distances of one to four
miles. The bedding fractures consist of single joints or areas of rock up to
one-foot thick which contain several individual joints. The effect of these
bedding fractures on groundwater beneath the study area has been illustrated
by the results of several studies conducted by government agencies and local
companies. These studies generally investigated the geology/hydrogeology of
the Lockport bedrock beneath several sites within the Study Area and also
evaluated hydraulic conditions of several man-made features. The studies
showed that groundwater in the bedrock beneath the Study Area, because of
bedding plane fractures, is influenced by several man-made features. The two
major features are the Power Conduits and the Falls Street Tunnel, both of
which are described in more detail in Section 3.3.
Vertical joints in the bedrock are most common where fractures
have been enlarged or created through stress relief. Previous studies of
vertical joint sets in the Niagara Falls area have consisted of limited outcrop
3-8 303402

mappings. Johnston (1964) reported two prominent vertical joint sets in the
Niagara Falls area, one oriented N 65°E and the other N 30°W. A more
detailed study by the USGS (Yager and Kappel, 1987) indicated that the
predominant fracture directions in the Lockport are to the northeast and
northwest. Recent studies discussing fractures in the Lockport have been
conducted by Tepper etal. (1990) and Gross and Engelder (1991).
At outcrops, the vertical joints along the face of the outcrop, are
spaced 10 to 80 feet apart and range up to 0.3 feet in width. A zone of tensile
stress exists along the Niagara Escarpment and adjacent to the Niagara Gorge,
which has enhanced vertical fracturing (International Joint Commission,
1974).
The vertical jointing in the Lockport Group and other bedrock
formations was formed parallel to a horizontal compressive stress field. The
stress field was possibly due to pateotectonic events. However, a
contemporary stress field exists in the Niagara Falls area and is oriented
between N 50°E and N 60°E (International Joint Commission, 1974). Gross
and Engelder (1991) suggest that the northeast orientation of joint sets in the
Niagara Falls area are directly related and parallel to the N60°E contemporary
stress field and concluded that the joints set were caused by neotectonic
events.
A structural map of the base of the Rochester Formation in
southwestern Ontario has been prepared by Sanford et al (1985). This map
shows evidence of a vertical displacement fault trending in a northeast
3-9303403

direction near Chippewa, Ontario. According to the USGS (Yager and Kappel,
1987), this feature may be related to a northeast trending band of high yield
wells in the Niagara Falls area identified by Johns ton (1964).
3.3 REGIONAL HYDROGEOLOGY
Most of the early work on groundwater migration in the Niagara
Falls area focused on groundwater resource studies (e.g. Johnston, 1964).
More recently, studies have been conducted by the USGS (Yager and Kappel,
1987) on the regional hydraulic parameters of the Lockport Group.
Environment Canada (Novakowski and Lapcevic, 1989) also has conducted
studies on the Canadian side of Niagara Falls to determine the regional flow
in the underlying Silurian and Ordovician bedrock. The following section of
this report presents regional data pertaining to the hydraulic properties and
groundwater flow in the various geologic units.
The overburden materials in the Niagara Falls area are not
important sources of domestic or industrial water. For the most part, the
overburden materials consist of fine-grained lacustrine and glacial deposits.
Given the low hydraulic conductivities of these materials, they are considered
regional aquitards and groundwater flow within these units is restricted. The
fine grained lacustrine and glacial deposits typically exhibit hydraulic
conductivities on the order of 1 x 10' cm/sec or less and consequently
severely retard groundwater movement. Thin seams of silty or sandy
materials within these units allow minor horizontal groundwater
303404

movement, although the seams are infrequent and typically not laterally
extensive. The recent alluvium material overlying the fine-grained
lacustrine deposits is sometimes a perched waterbearing zone. Due to the
thin and shallow nature of the recent alluvium, it is primarily dependent
upon surface water infiltration for its water source. The horizontal migration
of groundwater through the recent alluvium does occur but is greatly reduced
by the flat slope of the land surface and the groundwater preference to remain
isolated in the depressed areas formed by the surface of the fine grained
lacustrine deposits. Horizontal migration has also been impeded by the
networks of underground utilities which disrupt the continuity of the
horizontal layers. Consequently, overburden groundwater flow remains
localized. In some instances, however, the bedding of underground utilities
may act as a preferential pathway for overburden groundwater flow.
Although vertical flow of groundwater from the overburden to the bedrock
occurs, particularly where the natural soil has been disturbed, vertical flow
rates are generally not sufficient to significantly impact regional flow
conditions in the bedrock.
Groundwater sources are not extensively utilized in the Niagara
Falls area due to the naturally poor water quality and the proximity of the
Niagara River. Transmissive fracture zones in the Lockport Group are
capable of relatively high yields. However, groundwater obtained from the
Lockport often contains elevated sulfur and other mineral content and is not
used as a potable water supply. Groundwater from the Lockport is used for
industrial purposes (i.e. cooling) within the Study Area. Groundwater occurs
within the Lockport Group in the following types of openings:
3-11 3034°5

i) weathered surface fractures;
ii) bedding joints;
iii) vertical joints; and
iv) small cavities and vugs.
There are essentially two ways in which groundwater can flow
through bedrock, horizontally and vertically. Horizontally, groundwater
moves primarily through bedding plane fractures but also to some extent
through small cavities and vugs. Johnston (1964) identified bedding joints as
the primary conduits of groundwater flow through this unit. The bedding
plane fractures have been found to be areally extensive over several miles
and these fractures are known to affect groundwater flow several miles away.
Several waterbearing bedding planes have been identified in the Niagara Falls
area.
In the vertical direction, groundwater flows through vertical
fractures or faults generally created through stress relief caused by tectonic
events and glacial rebound. Vertical movement of groundwater within the
Lockport bedrock is quite prevalent. Hydraulic monitoring of well clusters at
various sites within the Study Area have shown both upward and downward
vertical gradients throughout the Lockport. Some wells show gradient
reversal due to the effect of the Power Conduits and Niagara River.
Downward migration of groundwater from the Lockport Group to underlying
bedrock formations, however, is minimal because of the immediately
3-12 303406

underlying Rochester Shale (Clinton Group). The Rochester Shale acts as a
confining layer or aquitard, restricting downward groundwater migration.
When horizontal and vertical fractures occur in the same area,
the waterbearing capacity of the bedrock is substantially increased. Such a
zone (as identified by a zone of high yielding wells) was identified by
Johnston (1964) within the Lockport Group. The zone is located
approximately two miles from the Falls, is approximately one-half mile wide
and trends north-eastward. Johnston attributed the high yields to induced
infiltration. Recent geophysical investigations have shown that the high
transmissivity in this zone is also related to more extensive vertical
fracturing (Yager and Kappel, 1987). The vertical fractures interconnect the
horizontal bedding fractures, resulting in a higher transmissivity. To further
study this zone, the USGS conducted a Cross-Hole Hydraulic Testing Program
at a site within the high transmissivity zone (Tepper et.al., 1990). The results
of the program confirmed the presence of vertical connections between
horizontal fractures and a correspondence between the directions of highest
transmissivity and the orientations of observed high angle fractures. The
location of the zone of high yielding wells is shown on Figure 3.4.
In general, regional groundwater flow in the Lockport Group is
toward the Niagara Gorge and Niagara River. Recharge occurs at the Niagara
Escarpment and groundwater flows towards the Niagara River. In the City of
Niagara Falls, groundwater flow in the Lockport bedrock is influenced by
several natural and man-made features.
3034073-13

The primary natural influences are the Niagara River and
Gorge. Upstream of the Falls, the upper Niagara River acts as a source of
bedrock groundwater recharge within the Study Area. Recharge from the
River to the bedrock is most prevalent immediately upstream of the Falls
where swift currents have eroded sediments from the river bed exposing the
bedrock surface. A secondary source of groundwater recharge may be other
surface water courses within the Study Area such as Gill Creek. The
headwaters of Gill Creek are located in the vicinity of the NYPA Reservoir
northeast of the Study Area. Gill Creek generally flows in a north to south
pattern through the City of Niagara Falls and discharges to the upper Niagara
River. Flow in Gill Creek is supplemented by a 1.6 mgd discharge from the
NYPA Reservoir, generally between the months of May and October. The
amount of recharge from Gill Creek to the bedrock groundwater is unknown
as recharge to the bedrock is dependent upon the thickness and type (clay as
opposed to gravel) of overburden material separating the surface water from
the bedrock. Downstream of the Falls, the lower Niagara River acts as a line
sink for discharge of the bedrock groundwater due to the exposed bedrock face
of the Niagara Gorge. Another secondary natural influence on bedrock
groundwater flow is the zone of highly transmissive bedrock identified by
Johnston (1964). This zone may be related to extensive vertical fracturing
(Yager and Kappel, 1987) and lineaments/faults along the alignment of the
zone. The highly transmissive zone may provide a preferential pathway for
bedrock groundwater flow.
There are also man-made features that affect groundwater flow
in the Lockport bedrock. The major regional influences are the NYPA
314 303408

reservoir, the NYPA Power Conduits and the Falls Street Tunnel (FST). The
locations of these features are shown on Plan 2. These features have
significantly altered the natural pattern of bedrock groundwater flow. The
NYPA reservoir is a source of recharge to the Lockport bedrock, while the
Power Conduit and FST are areas of bedrock groundwater discharge (Miller
and Kappel, 1987). Figure 3.5 shows the pattern of groundwater flow for the
upper bedrock as described above.
A study conducted by the City of Niagara Falls in 1987
determined that the location where the NYPA power conduits and the FST
crossed was the major discharge point for upper bedrock groundwater within
an eleven square mile area. In an effort to reduce the amount of bedrock
groundwater entering the FST at the crossing, repairs were performed on the
FST in September 1989. The repairs to the FST have affected the regional
shallow bedrock by raising the groundwater level approximately five feet in
the vicinity of the intersection of the FST and the NYPA conduits.
Figures 3.6, 3.7 and 3.8 show the upper bedrock groundwater levels measured
on October 29 through November 3, 1989, March 27 to 29, 1990, and from
June 26 to 27, 1990, respectively. These figures indicate that the FST and
NYPA conduits continue to act as line sinks for the regional upper bedrock
groundwater flow. A detailed discussion on all factors affecting regional and
local hydraulic conditions relevant to the Study Area are presented in
Section 4.0.
Investigations into the hydraulic characteristics of the Clinton
and Medina Groups are limited. Environment Canada determined that
303409

groundwater flow in the over pressured Clinton-Upper Medina Group is
minimal by comparison to the Lockport Group. The flow directions were
found to be vertically upwards except near the Gorge where stress relief
fracturing has enhanced horizontal and vertical hydraulic conductivities.
Several studies of the Rochester Formation of the Clinton Group have been
conducted within the Study Area; however, the lack of well data on a regional
scale makes it difficult to study this unit. These studies have been conducted
at the following RGA sites:
Du Pont Chemicals
- Niagara Plant
- Necco Park Landfill
Occidental Chemical Corporation
Buffalo Avenue Plant
- Hyde Park Landfill
The Rochester Formation underlies the Lockport Group bedrock.
Permeability testing of wells installed into the Rochester Formation has
indicated that the Rochester Formation is of extremely low permeability and
is considered to be an aquitard restricting further vertical groundwater
migration.
A zone of low hydraulic conductivity was identified at the Lower
Medina/Upper Queenston contact. Groundwater flow in this zone is in a
lateral direction, likely westward toward the Niagara Gorge.
i3-16 303410

3.4 STUDY AREA HYDROGEOLOGY
The Study Area for the Regional Groundwater Assessment
(RGA) has been established to include the area encompassed by the Forebay to
the north, the Niagara River to the south, the groundwater divide as defined
in the upper Lockport Bedrock to the west and Interstate 1-190 to the east. The
study area boundary is shown on Plan 1. The vertical study area for the RGA
has been established as the entire Lockport Group bedrock which has been
identified as the major aquifer in the area. The study area does not extend
deeper than the Lockport because of the underlying Rochester Formation
which is considered an aquitard.
For the purpose of assessing the groundwater flow in the
Lockport bedrock for the Study Area, the Lockport bedrock has been divided
into the following three units:
Upper Lockport (0 to 45± ft Below Top of Rock (BTOR))
Middle Lockport (45 to 100± ft BTOR)
Lower Lockport (100 to 160± ft BTOR)
The upper unit was established as the upper 45 feet of Lockport
bedrock because, in general, the upper 45 feet is highly fractured and vertically
interconnected with depth. The middle and lower units are much less
3-17 303411

fractured and were arbitrarily established as the 45 to 100 foot and 100 to
160 foot intervals of the Lockport bedrock, respectively.
A comprehensive database of wells that monitor the Lockport
bedrock which are relevant to the Study Area has been compiled. The
locations of these wells are presented on Plans 3, 4 and 5 for the upper, middle
and lower Lockport, respectively. Groundwater potentiometric surface
contours have been generated for the upper and middle Lockport bedrock
units and are presented on Plans 6 and 7, respectively. Insufficient
information was available to generate potentiometric surface contours for the
lower Lockport. The contours were constructed using water level
information collected in June 1990 as part of a USGS study. This data set is
the most comprehensive collected to date; however, the data set does not
cover the entire Study Area. As a result, the June 1990 data set shown on
Figure 3.8 was supplemented with water level data collected at various sites
between 1982 and 1991 to produce the potentiometric surface contours shown
on Plans 6 and 7. While combining data from a nine year period may not
yield a precise representation of groundwater conditions, it is sufficient to
present generalized groundwater patterns within the Study Area and to fill
key voids in the June 1990 data set.
3-18 303412

4.0 FACTORS AFFECTING GROUNDWATER FLOW
The Niagara River, Niagara Gorge and a number of man-made
structures have been identified as factors which influence the groundwater
flow in the bedrock beneath the Study Area. The man-made structures
include:
i) NYPA Power Conduits and Forebay;
ii) Falls Street Tunnel;
iii) NYPA reservoir;
iv) underground tunnels/sewers;
v) groundwater production/extraction wells;
vi) bedrock grouting;
vii) NYPA intake wall for power conduits;
viii) hydraulic canal;
ix) landfills; and
x) building and structure foundations.
The following discusses the effects that the Niagara River and
man-made structures listed above have on groundwater flow and the
piezometric surface in the bedrock. Plan 2 shows the locations of the major
hydraulic influences throughout the Study Area. Each of the hydraulic
influences presented above have varying potential to affect regional
groundwater flow. Table 4.1 ranks each item in descending order as to the
degree to which it affects regional groundwater flow.
3034)34-1

4.1 NIAGARA RIVER
The flow in the Niagara River is determined by the elevation of
Lake Erie at the head (inlet) of the Niagara River. When the elevation of the
eastern end of the Lake rises due to wind or to a general rise in lake level, the
discharge to the Niagara River increases. The discharge of river water over
Niagara Falls, however, is regulated by joint Canadian-American power
authorities who divert water from the River to hydroelectric stations located
in Canada and the United States. The flow in the Niagara River above the
falls is approximately 200,000 to 300,000 CFS, of which 100,000 to 150,000 CFS is
diverted to Canadian and American hydroelectric stations. Approximately
50,000 to 75,000 CFS is diverted to the NYPA Power Conduits. During the
tourist season (April 1 through October 31), a minimum flow over the Falls of
not less than 100,000 CFS is maintained during the daylight hours. In the
evening and throughout the winter, the flow of water over the Falls can be
decreased to a minimum of 50,000 CFS. In addition to maintaining a
minimum flow over the Falls, regulations also control the maximum rate of
change in river stage that can be induced by flow regulation over a 24-hour
period. The regulation states that in no case is the variance between the
maximum and minimum water elevation, as measured on the hour, allowed
to exceed one and one-half feet over any given 24-hour period. Control is
based on river elevations as measured at the International Control Structure
in the Grass Island Pool (see Table 4.2) which is located approximately one
mile upstream from the Falls.
303414

Figure 4.1 depicts the features which influence water levels in
the upper Niagara River. The opening and dosing of the sluice gates controls
the flow of water over the Falls. When the gates are closed, water backs up in
both channels of the River in an area known as the Grass Island Pool and the
River level behind the gates rises. When the water rises, the volume of water
in the Grass Island Pool increases and the flow over the Falls decreases. The
volume of water used by the power projects is determined by the number of
penstocks used by the power projects. Conversely, when the gates are opened,
flow over the Falls increases and the volume of the water in the Grass Island
Pool decreases.
Changes in the Niagara River water level due to these regulatory
practices are observable along the southern portion of the Study Area.
The Niagara River has a considerable impact on the movement
of bedrock groundwater. The upper Niagara River (upstream of the Falls
within the Study Area) acts as a groundwater recharge source while the lower
Niagara River (downstream of the Falls), because of the Niagara Gorge, acts as
an area of discharge for the bedrock groundwater regime. Groundwater
recharge from the upper Niagara River is enhanced by the NYPA Power
Conduits which transport water to the Robert Moses Generating Station.
These Power Conduits dewater the upper bedrock along their length. This
lowering of the upper bedrock groundwater level increases the hydraulic
gradient which induces more recharge from the River to the upper bedrock.
This is discussed further in the following section.
3034154-3

The River itself and the manipulation of the river level by the
power authorities are not the only factors influencing the groundwater flow
regime. A study conducted by OxyChem at its Buffalo Avenue Plant
determined, through continuous measurement of the river level in
conjunction with water levels in various bedrock monitoring wells, that the
groundwater level in the bedrock fluctuated not only due to the diurnal
variation of the River but also due to water fluctuations observed in the
NYPA Power Conduit exterior drain system and Forebay. The influence of
the NYPA Power Conduits and and Forebay is discussed in Section 4.2.
4.2 NYPA POWER CONDUITS AND FOREBAY
4.2.1 NYPA Power Conduits
The twin Power Conduits which divert river water from the
upper Niagara River to the Robert Moses Generating Stations affect the
overburden and bedrock groundwater regimes. These conduits were
constructed of poured concrete in two separate parallel open cut trenches each
52 feet wide and penetrate into the bedrock to a depth of between 100 feet
(Niagara River) and 160 feet (Forebay) below ground surface. The location of
the power conduits and key invert elevations are provided on Plan 2. A
profile of the power conduits is presented on Figure 4.2. Cross-sections of the
conduits at Buffalo Avenue, the Falls Street Tunnel and Porter Avenue are
presented on Figures 4.3, 4.4 and 4.5, respectively. The deepest section of the
Power Conduits is at the intersection with the Falls Street Tunnel.
4-4303416

Surrounding each conduit is a drain system which is designed to
reduce the hydrostatic pressure on the outside walls of the conduit. This
drain system is comprised of six-inch vertical drains placed every ten feet
along both sides of each conduit which drain into two corner drains. These
corner drains are connected to semi-circular floor drains located beneath the
full length of the conduit. The drains were formed into the concrete-conduit
structure and are open to the excavation face. The drains, however, are not
directly connected to the River or the Forebay.
This drain system is hydraulically connected to the Power
Conduits at two pumping stations: one immediately south of the Robert
Moses Generating Station' Forebay (Pump Station B), and the other
immediately south of Royal Avenue (Pump Station A). Each pumping
station is equipped with a set of balancing weirs which allows water to flow
into the Conduit drain system if the hydraulic head in the Power Conduits
exceeds the elevation of the weir. The elevation of the balancing weir at
Pump Station A is 560 feet, while the elevation of the balancing weir at Pump
Station B is 550 feet.
The Power Conduit drain system, because it is exposed directly to
the bedrock, significantly influences the bedrock groundwater flow regime.
The construction of the Power Conduits has altered natural groundwater flow
in such a way that the Power Conduits drain system acts as an area of
groundwater discharge for the Upper Lockport bedrock along the entire
length of the Power Conduits (Miller and Kappel, 1987). Blasting during
4-5 3034 J 7

construction of the Power Conduits may have enhanced dewatering of the
bedrock by generating additional vertical and horizontal fracturing of the
bedrock in localized areas along the length of the Power Conduits.
Groundwater collected in the drain system is believed to discharge to the Falls
Street Tunnel or to the Forebay via fractures. A study conducted by OxyChem
at its Buffalo Avenue Plant determined that the Power Conduits (in the area
adjacent to the Plant) also may act as a source of recharge to the lower
Lockport bedrock by providing a hydraulic link from the upper to lower
bedrock. The study indicated that the Lockport bedrock was dewatered by the
Power Conduits to the elevation of the conduit drain system. However,
because the Power Conduit drain system is also connected to the underlying
bedrock, it was postulated that the groundwater collected in the drain system
from the overlying bedrock (above the conduit drain invert) may be
recharging the underlying bedrock (below the conduit drain invert). This
postulation was supported by the observation of gradient reversals in well
clusters at the Buffalo Avenue Plant. The gradient reversals are believed to
occur due to the more rapid and larger extent of groundwater level responses
in the lower bedrock wells, to fluctuations in the Power Conduit drain system
water levels compared to the slower and smaller responses of the upper
bedrock wells.
A study to determine flow patterns within the Power Conduit
drain system was conducted by the USGS in August 1990. The study consisted
of simultaneously monitoring water levels in seven conduit wells, the
Niagara River, Forebay Canal and the Reservoir over a nine day period. The
study determined that the average gradient along the drain system is from the
4-6 3034J8

River towards the Forebay. However, when the water level in the Forebay is
rising (0800 to 1200 hours), the drain system gradient reverses between the
Forebay and approximately Porter Road. Following the peak water level in
the Forebay, the drain system's gradient returns to the original south to north
pattern. The end point of the gradient reversal may be related to the fact that
a high point in the bedrock surface is located in this area.
4.2.2 Forebay
The Forebay is located between the Robert Moses Generating
Station and the NYPA Reservoir as shown on Plan 2. The Forebay is
approximately 4,000 feet long, 500 feet wide and 110 feet deep and is generallysituated within the Lockport bedrock except in the east end in the vicinity of
the Power Conduits where it penetrates into the Rochester Shale. The walls
and floors of the Forebay are unlined. Water enters the Forebay via the
Power Conduits and is either diverted to the Robert Moses Generating Station
or to the Reservoir depending upon the power generation schedule.
The water level in the Forebay is regulated on a daily schedule
and is generally dependent upon the seasonal diversion schedule, power
demand and the Niagara River. During peak power demand periods(8:00 AM to 4:00 PM), water is released from the reservoir, increasing the
water level in the Forebay. During periods of low power demand, water ispumped from the Forebay into the Reservoir lowering water levels in the
Forebay. In the summer and fall during low flow conditions in the Niagara
3034 J 9

River, the water level in the Forebay has been observed to fluctuate as much
as 25 feet (Miller and Kappel, 1987). In the spring during high flow conditions
in the Niagara River, when more water can be diverted from the River, the
water level fluctuation in the Forebay is significantly less than the summer
and fall periods, ranging from five to ten feet (Miller and Kappel, 1987).
As stated previously, the walls and floor of the Forebay are
unlined. Based on observed seepage into the Forebay and water level
monitoring of wells in the vicinity of the Forebay, the Forebay receives
groundwater discharge from the Lockport bedrock. Water level fluctuations
in the Forebay have been observed to cause near-instantaneous water level
fluctuations in wells along the Power Conduits up to 3.4 miles away (Miller
and Kappel, 1987). It is also expected that the water level fluctuation in the
Forebay affects bedrock groundwater conditions in the vicinity of the Forebay.
The effect of water level fluctuations on the conduits can be
summarized as follows. Rising water levels in the Forebay raises the
hydraulic head in the Power Conduit drains which reduces groundwater
infiltration into the Power Conduit drains. Falling water levels in the
Forebay lowers the hydraulic head in the Power Conduit drains which
increases groundwater infiltration into the Power Conduit drains.
4-8 303420

4.3 FALLS STREET TUNNEL
The Falls Street Tunnel (FST) is a gravity sewer that was
constructed in the early 1900s. It extends from 56th Street and John Avenue
to its outfall on the lower Niagara River near the Rainbow Bridge. It consists
for the most part of a 16,000-foot long unlined rock tunnel except for a
500-foot section crossing over the NYPA Power Conduits. In that section, the
FST consists of 84-inch diameter concrete pipe, of which 300 feet is encased in
a concrete vault. The tunnel was constructed using a drill and blast method
and is located almost entirely within the Lockport Dolomite. The tunnel
functioned as a combined sewer until 1985 when it was converted to a storm
sewer to discharge stormwater runoff and groundwater to the Niagara River.
The location of the FST and key invert elevations are provided on Plan 2.
In March 1987, the City of Niagara Falls began Phase I of a FST
Study. Phase I of the FST Study provided a review of background
information previously collected on the tunnel and a physical examination of
the tunnel itself. The objectives of the Phase I study were to define the FST in
terms of hydraulics and loadings of specified chemicals, under dry and wet
weather conditions. The scope of work included:
1) Parshall flume evaluation,
2) Flow and Pollutant data collection and evaluation,
3) Point source identification,
4) Regular inspection,
5) NYPA conduit sampling,
4-9 303481

6) Drop shaft inspection, and
7) Wet weather sampling.
The study identified the FST as the major groundwater discharge
point for an eleven square mile area, the north/south axis of which is the
NYPA Power Conduits. The major infiltration point into the FST was
identified as the 300-foot section which crosses over the NYPA Power
Conduits. Approximately 8.8 mgd of infiltration was estimated to occur in
this section (pre-September 1989). This represented approximately 75 percent
of the normal dry weather end-of-pipe flow. The groundwater infiltrated into
the FST through faulty bulkheads in the vault and seals in the pipe joints.
The quantity of infiltration into the FST was a direct result of the methods
used to construct the FST where it crosses the Power Conduits.
This infiltration to the FST at the NYPA Power Conduit crossing
results in a lower hydraulic head in the drain system which in turn causes
water in the Power Conduit drain system to flow south from the area near the
Forebay (dependent upon the hydraulic head in the Forebay), and north from
the Niagara River to the FST. The amount of water that flows along the
Power Conduit drain system to the FST is unknown. It should be noted that
the average hydraulic head in the Power Conduit drain system is from south
to north. In addition, the lower hydraulic head in the drain system causes
water in the overburden and in the Lockport Dolomite on both the east and
west sides of the Power Conduits to flow toward the drain system.
4-10 303422

Chemical testing for volatile organics in the FST showed that the
bulk of the chemical loading comes from infiltration at the Power
Conduits/FST crossing and the area east of the Power Conduits. The
infiltration rate in the western portion of the FST was found to be relatively
low and therefore no significant addition to total chemical loading was
expected. The portion upstream of the Power Conduits was estimated to
contribute 5 Ibs/day of volatile organics and the infiltrate at the Power
Conduits/FST crossing was estimated to contribute 28 Ib/day of volatile
organics.
A preliminary investigation to be performed following FST
repairs was outlined in a letter dated August 10, 1988 as part of the
remediation program. The objectives of this investigation were:
1) Simulate, observe, and monitor subsurface hydrologic conditions
which will exist following repairs.
2) Isolate the section of the FST at the NYPA Power Conduit crossing to
further identify the groundwater infiltration within this area.
3) Monitor the effects repairs may have on groundwater infiltration into
the south side interceptor sanitary sewer.
4) Obtain information of low flow conditions which will assist in design
of repairs.
FST repairs were completed in September 1989. Subsequent to
the repairs, groundwater level measurements were performed to evaluate the
effectiveness of the FST repairs from October 29 through November 3, 1989,
4-11303423

from March 27 to 29, 1990, and from June 26 to 27, 1990 in cooperation with
the USGS.
Various companies and government agencies were involved in
the collection of groundwater level data. This data was collated by the USGS.
The three rounds of groundwater levels indicated an approximate 5-foot rise
in the groundwater level in the intersection area of the FST and the NYPA
Power Conduits and along the FST east of 27th Street. As discussed in
Section 3.3, this rise in the groundwater level has not eliminated the FST and
NYPA Power Conduits as line sinks for regional shallow bedrock
groundwater flow. Currently it is estimated that four to five mgd of
infiltration enters the FST in the vicinity of the FST/Power Conduit
crossover according to City of Niagara Falls personnel (Roll, 1992).
4.4 NYPA RESERVOIR
The NYPA Reservoir is located just northeast of the regional
study area as shown on Plan 2. The reservoir covers an approximate area of
three square miles and can store up to 60,000 acre-feet of water. The reservoir
containment dike is approximately 55 feet high and constructed of a
compacted clay core capped by crushed rock and topsoil. During the
construction of the reservoir, the existing overburden material was stripped
down to the top of the bedrock. The exposed bedrock forms the floor of the
Reservoir. No floor liner was ever installed. Beneath the dike is a bedrock
4-12303424

grout curtain which surrounds the reservoir. Details of the grout curtain are
presented in Section 4.7.1.
Water levels in the reservoir fluctuate daily and range between
620 feet AMSL and 650 feet AMSL. The average water level is approximately
640 feet AMSL.
As stated previously, the reservoir is a regional source of
groundwater recharge to the Lockport bedrock. Within three weeks following
the first filling of the reservoir in October 1961, bedrock groundwater levels
increased by approximately 1.6 to 17.0 feet in the surrounding area. It was also
observed that several bedrock wells southwest of the reservoir began
exhibiting artesian conditions (Johnston, 1964). These conditions were
attributed to seepage through exposed joints in the unlined reservoir floor
and the grout curtain wall.
Subsequent to the initial filling, the fluctuating water level in
the reservoir was observed to have a minor effect on the surrounding
bedrock groundwater elevation. South and southwest of the reservoir, a
fluctuation of 0.1 to 1.0 feet was observed in surrounding wells (Miller and
Kappel, 1987). The degree of fluctuation observed in these wells was most
likely dependent upon the location of the well, the effectiveness of the grout
curtain in that area and whether the well intersects bedding planes or
fractures that extend to the unlined reservoir floor.
303425

4.5 UNDERGROUND TUNNELS AND SEWERS
In addition to the Falls Street Tunnel, there are several tunnels
and sewers throughout the Niagara Falls area that affect bedrock groundwater
flow. These tunnels and sewers were installed into the bedrock at the various
locations shown on Plan 2. In general, these tunnels and sewers act as line
sinks for bedrock groundwater, however, their influence is generally localized
to the immediate area along the length of the sewer. A brief description of
each of these tunnels and sewers is provided below. Key invert elevations of
the sewers and tunnels discussed below are provided on Plan 2. The key
invert elevations and other miscellaneous information on the sewers and
runnels was obtained from a written communication from Kappel, 1991.
In addition to the sewers and tunnels discussed below, because of
the relatively thin overburden layer found within the study area, it is likely
that minor sewers may also penetrate into the bedrock. Past and current
studies have indicated that upper weathered bedrock groundwater levels in
the area outside of the City of Niagara Falls are generally above the bedrock
surface while within the Niagara Falls area, groundwater levels are generally
below the bedrock surface, possibly indicating the effect of natural and
man-made drains throughout the area.
Several tunnels and sewers discussed in this section are outside
the Study Area such as the Gorge Interceptor Tunnel, the Adams Tailrace
Tunnel and the Schoellkopf Tunnel. These tunnels are discussed in this
4-14 303426

section because of their effect on regional groundwater flow conditions
within the Study Area.
4.5.1 New Road Tunnel
The New Road Tunnel extends from a location slightly north of
Porter Avenue to the Falls Street Tunnel at 47th Street as shown on Plan 2.
The section north of Porter Avenue is constructed of 42-inch concrete pipe,
backfilled with shot rock and fill (Kappel, 1991). From Porter Avenue to the
FST, the tunnel is rock-cut into the Lockport bedrock as a five-foot by six-foot
unlined tunnel. Air shafts are located along the length of the tunnel.
A study conducted by Frontier Chemicals of their site at the
intersection of Royal Avenue and 47th Street indicated that the New Road
Tunnel in conjunction with the FST dewaters the upper bedrock in the
southeast portion of their Site.
4.5.2 Gorge Interceptor Tunnel
The Gorge Interceptor is a rock cut tunnel in the Rochester Shale
that extends along the Niagara Gorge as shown on Plan 2. The tunnel varies
in size from five feet by six feet to nine feet by seven feet. Air shafts extending
to the ground surface are located along the length of the tunnel. The tunnel•
is divided into two sections; one with a southerly gradient and one with a
4-15 303427

northerly gradient to a low point located at the Gorge Pumping Station. Flow
from the tunnel is collected at the pumping station and pumped via the
Gorge Forcemain (See Plan 2) to the Niagara Falls Wastewater Treatment
Plant (NFWWTP). The combined average flow rate through both sections of
the tunnel prior to March 1989 was estimated to be 6 mgd (Kappel, 1991). In
March 1989, additional flows from the FST were diverted to the south branch
of the Tunnel. At present, approximately 6 mgd is diverted from the FST to
the Tunnel for a combined average flow rate of 12 mgd.
The effect of the tunnel on groundwater flow in the Lockport
bedrock is unknown but is probably limited due to the tunnel's proximity to
the Niagara Gorge.
4.5.3 Adams Tailrace Tunnel
The Adams Tailrace Tunnel begins at an ice shaft located at the
NFWWTP. The shaft drops 180 feet into the Rochester Formation. From the
NFWWTP, the tunnel continues in a northwest direction toward the Niagara
Gorge. The tunnel drains to the Gorge (in the vicinity of the Rainbow Bridge)
from the Irondequoit/Reynales Formations. Flow in this tunnel is composed
primarily of discharge flow from the NFWWTP (35 mgd) and discharge from
the Diversion Sewer (20 mgd). Other flows to the tunnel include discharge of
approximately 6 to 7 mgd from the Schoellkopf Tunnel and groundwater
infiltration. The amount of groundwater infiltration into the tunnel is
4-16 303428

unknown, however, it is expected that the majority of infiltration into the
tunnel will occur in the ice shaft as it penetrates the Lockport Dolomite.
The effect of the tunnel on groundwater flow in the Lockport
bedrock is unknown.
4.5.4 Schoellkopf Tunnel
The Schoellkopf Tunnel extends from the upper Niagara River
to the location of the former Schoellkopf Power plant as shown on Plan 2.
The tunnel is rock cut (brick lined) and is located entirely within the Lockport
bedrock. The tunnel is approximately 32 feet in diameter.
In the early 1960s, the tunnel ends were sealed with reinforced
concrete plugs. The tunnel is now used to collect stormwater runoff via
several newly installed dropshafts. Water collected in the runnel is diverted
to the Adams Tailrace Tunnel through two 30-inch diameter gate valves and
a six-foot unlined tunnel. Groundwater flow in the tunnel is estimated to be
approximately 6 to 7 mgd (Kappel, 1991).
The effect of the tunnel on groundwater flow within the
Lockport bedrock is unknown, however, it is expected that the tunnel acts as a
line sink for Lockport bedrock groundwater because of the way in which, the
Tunnel was constructed.
3034294-17

4.5.5 South Side Interceptor Sewer
The South Side Interceptor Sewer was constructed
approximately parallel to the FST to divert sanitary flows from the FST to the
NFWWTP. The sewer extends from approximately 47th Street to the
NFVVWTP as shown on Plan 2. All dry-weather flow in the FST east of the
Power Conduits is diverted to the South Side Interceptor Sewer. The sewer
was constructed using five-foot diameter concrete pipe placed in a
bored/rock-cut tunnel and then grouted in place. The estimated total flow in
the sewer is approximately 20 to 25 mgd (Kappel, 1991).
The effect on bedrock groundwater flow caused by the sewer is•
expected to be minimal due to the sealing of the bedrock tunnel with grout,
however, there may be a potential for localized groundwater infiltration
where the sewer crosses the power conduits. This is based on the fact that the
sewer has the same construction as the FST at the crossover and that the FST
is a known source of groundwater infiltration at the crossover. Studies have
not been conducted to determine if groundwater is infiltrating into the sewer
at the crossover.
4.5.6 Diversion Sewer
The Diversion Sewer is a 36-inch to 60-inch diameter concrete
sewer that runs westwards toward the NFWWTP from the intersection of
4-is 303430

A Street and 47th Street as shown on Plan 2. The sewer was constructed using
cut and cover methods and backfilled with excavated materials. East of Gill
Creek, the sewer is situated within the overburden. West of Gill Creek, the
sewer gradually cuts into the Lockport bedrock (Kappel, 1991).
Flows to the sewer generally consist of non-contact cooling
waters and discharge from on-site treatment plants from various industrial
sites in the area. The flow in this sewer is estimated to be approximately
20 mgd. The capacity of the sewer has been estimated to be 35 mgd. The
sewer discharges to the Adams Tailrace Tunnel via an ice shaft located at the
NFWWTP.
Because of its method of construction and the fact that the sewer
extends into the bedrock west of Gill Creek, it is expected that the Diversion
Sewer may act as a localized groundwater line sink west of Gill Creek.
4.6 GROUNDWATER PRODUCTION/EXTRACTION WELLS
Throughout the regional study area, there are several industries
that extract large quantities of water from the Lockport bedrock for various
purposes including as a source of cooling water. Several industries also
remove or plan to remove substantial volumes of groundwater from the
Lockport bedrock as part of groundwater remediation programs which are
being conducted at their sites. Table 4.3 presents a summary of production
4-19 303431

and extraction wells located within the study area. Their locations are shown
on Plan 2.
The operation of production and extraction wells serves to
dewater the bedrock, however, the extent of the capture zones are usually
very localized by comparison to the regional bedrock groundwater flow.
It is often difficult to estimate the exact areal and vertical extent
of the bedrock groundwater influenced by pumping at a bedrock well. This is
attributable to the random nature of:
i) fracture apertures;
ii) fracture orientation;
iii) fracture occurrence; andi
iv) fracture interconnection.
Groundwater generally flows into a well via the fracture
network that the well intersects. The fracture network in the Lockport is
predominantly horizontal although the upper 30 feet of bedrock does contain
numerous vertical fractures due to the effect of weathering. The pumping
capacity of the well is related to the amount of horizontal fractures the well
intersects, the interconnection of the horizontal fractures by vertical fractures,
the extent of the fractures, the aperture size of the fractures and the
availability of groundwater contained within the bedrock. Wells installed in
fractures which are poorly interconnected or not connected to a substantial
water source will be low producing wells. Wells installed in heavily fractured
4-20 303492

bedrock segments which are connected to substantial water sources via open
fractures will be high producing wells.
A brief description of the ground water production/ extraction
systems existing at the various sites presented in Table 4.3 is presented in the
following.
Olin Buffalo Avenue Plant
Olin currently uses two production wells located within the
western portion of its Buffalo Avenue Plant. Operation of these two wells is
the major factor influencing bedrock groundwater flow beneath the Site.
Pumping these wells creates a cone of depression extending beneath most of
the plant. The two Olin production wells are located approximately 10 feet
apart. The wells are 24-inch diameter, cased from 25 to 28 feet below grade
(536 feet AMSL), and open in the bedrock down to 110 feet total depth. Only
one well is pumped at a time. Pumping rates are approximately 600 gpm.
The production wells and associated treatment system are currently an
integral part of the Du Pont Groundwater Remediation Program as described
in Section 7.0.
Du Pont Niagara Plant
A groundwater recovery and treatment system has been
installed at the Du Pont Niagara Plant. The system consists of 22 recovery
wells, 17 of which penetrate 3 to 5 feet into bedrock. Five of the wells pump
4-21 30CT433

only the overburden. The system became operational in the fourth quarter of
1991. The system was designed to control off-site chemical migration from
the Du Pont Niagara Plant in the overburden and weathered top-of-bedrock
zones and to reduce the source of chemicals migrating vertically to deeper
zones.
Du Pont Necco Park Landfill
Groundwater remediation at Necco Park currently consists of a
groundwater recovery and treatment system located downgradient of a
three-sided bedrock grout curtain barrier wall, which surrounds the
upgradient sides of the site. Currently, two recovery wells, located along the
south perimeter of the site, pump a total of approximately 30 gpm from the
upper Lockport. A third recovery well, which will pump from the middle
Lockport, is currently in the start-up phase. Plan 6 shows the typical
potentiometric surface during recovery well operation. The current recovery
wells create a hydraulic barrier to off-site groundwater flow in the upper
Lockport.
Frontier Chemicals
Frontier Chemicals is in the process of initiating the installation
and operation of one groundwater extraction well. The extraction well will be
located on the south boundary of the Plant and will pump water from the
upper Lockport bedrock. The extraction well is scheduled to begin operation
in 1992.
4-22 303434

OxyChem Buffalo Avenue Plant
OxyChem is in the process of conducting a feasibility study for a
Phase I groundwater extraction system at its Buffalo Avenue Plant. The
Phase I system will involve pumping groundwater from water bearing zones
within the upper, middle and lower Lockport bedrock. Operation of the
Phase I system is planned to begin in 1996 or 1997. Additional phases that
may be added to the system are discussed in Section 7.0.
OxyChem Durez Niagara Plant
Groundwater remediation at the Durez Niagara Plant currently
consists of three purge wells installed into the upper Lockport in the
southeast corner of the plant. One well pumps water from the upper 15 feet
of bedrock, the second from the upper 30 feet and the third from the 30 to
45 feet interval of bedrock. These wells are pumped at a combined rate of 5 to
15 gpm. These wells have created a cone of depression extending beneath
most of the plant.
OxyChem Hyde Park Landfill
OxyChem is currently testing a Phase I groundwater extraction
system at its Hyde Park Landfill. The Phase I system consists of two clusters .of '
three wells. Each duster has a well in the upper, middle and lower Lockport
bedrock units straddling all observed waterbearing zones at each depth. The
303435

system has been designed to operate at a pumping rate up to 40 gpm. The
system is scheduled to begin operation in the summer of 1992. Additional
phases that will be added to the system are discussed in Section 7.0.
OxyChem S-Area Landfill
OxyChem is constructing a Phase I groundwater extraction
system at the Buffalo Avenue Plant's S-Area Landfill. The Phase I system
consists of 16 wells in the upper 30 feet of the Lockport bedrock. Eight of the
wells will recover NAPL and will operate at a maximum pumping rate of
5 gpm each. The other eight wells will recover APL and will operate at a
maximum pumping rate of 150 gpm each. The system is scheduled to be
completed in the fall of 1992. Additional phases that may be added to the
system are described in Section 7.0.
BFI/CECOS Landfill
A groundwater recovery and treatment system is currently in
operation at the BFI/CECOS Landfill. The system consists of twenty wells
which pump water from both the overburden and bedrock. There are
currently eight bedrock extraction wells in the system. Seven of these wells
are installed into the upper three to five feet of bedrock and the eighth is
installed slightly deeper. The system is described in more detail in Section 7.0.
3034M4-24

4.7 BEDROCK GROUTING
In several locations within the study area, various portions of
the Lockport bedrock have been grouted to form a groundwater flow barrier.
These grout curtain walls reduce groundwater flow but do not provide a
completely impermeable barrier to groundwater flow. Grout curtains within
the study area, shown on Plan 2, generally have a localized effect on bedrock
groundwater. Specifics of the grout curtains within the study area are
discussed below.
4.7.1 NYPA Reservoir Grout Curtain
The NYPA reservoir is surrounded with a grout curtain wall.
The wall was installed by drilling 100-foot deep holes into the upper 10 feet of
the Rochester Shale at 15-foot spacings and filling the holes with grout under
pressure. As discussed in Section 4.4, the reservoir acts as a regional source of
groundwater recharge. The intent of the grout curtain was to prevent water
stored in the reservoir from infiltrating into the bedrock. Studies have
shown (Johnston, 1964; Miller and Kappel, 1987) that water does infiltrate into
the bedrock beneath the reservoir and flows outward through the grout
curtain. The overall effect of the grout curtain on surrounding groundwater
is to limit the hydraulic impact of recharge from the reservoir.
3034*7

4.7.2 NYPA Forebay Grout Curtain
The NYPA Forebay Grout Curtain is located along the west edge
of the Forebay and extends southerly as shown on Plan 2. The grout curtain
was designed to reduce hydrostatic pressure against the Robert Moses
Generating Station. The curtain was installed by drilling 300-foot deep holes
into the upper 10 feet of Queenston Shale and filling the holes with grout
under pressure. Primary spacing of grout holes was at 80 feet with
intermediate spacings of 40, 20 and 10 feet. The grout curtain is believed to
have a pronounced impact on the local groundwater flow in the Lockport
bedrock, however, specifics are unknown.
4.7.3 NYPA Conduit and Intake Grout Curtain Wall
The NYPA Conduit and Intake Grout Curtain wall completely
surrounds the NYPA water intake structure on the upper Niagara River as
shown on Plan 2. The grout curtain was constructed to reduce groundwater
infiltration during construction of the Power Conduits and the Intake
Structure. The curtain wall was installed by grouting the upper 100 feet of
bedrock along the alignment of the walls. It should be noted that the Power
Conduits extend through the northern portion of the wall. The grout curtain
wall is believed to have a pronounced impact on the local groundwater flow
in the Lockport bedrock, however, specifics of the impact are unknown.
3034364-26

4.7.4 Necco Park Landfill Grout Curtain Wall
In 1989, Du Pont completed construction of an upgradient grout
curtain barrier designed to improve groundwater containment in the
bedrock. The Necco Park grout curtain consists of a single line of grout holes
installed around .the western, northern, and a portion of the eastern
perimeters of the landfill site. The line of grout holes was installed to form a
vertical grout (barrier) wall approximately 2,400 lineal feet in length. The
wall extends from approximately top of bedrock to a depth of 80 feet below•
ground surface.
Based on hydraulic head data collected after construction, the
grout curtain appears to be performing as designed. The cones-of-depression
associated with the groundwater recovery wells have been substantially
enhanced, effecting a hydraulic barrier to off-site groundwater flow in the
upper Lockport. The cones-of-depression have also been extended several
hundred feet off site. This is expected to induce some recovery of chemical
presence in the groundwater that has migrated off site.
4.8 NYPA INTAKE WALL FOR POWER CONDUITS
The water intake structure for the NYPA power project
significantly alters groundwater flow characteristics along the southwestern
portion of OxyChem's Buffalo Avenue Plant. The Intake Structure consists of
a reinforced concrete wall which is keyed into bedrock. Plan 2 shows the
4-27303439

location of the Intake Structure, while Figure 4.6 presents a plan, profile and
typical section of the structure.
The bedrock underlying the headwall was grouted to a depth of
approximately 100 feet below top of bedrock. Therefore, the potential for
bedrock groundwater migration through the grouted bedrock is expected to be
impaired. This forces bedrock groundwater to flow around the west and east
ends of the grouted bedrock to recharge the volume of bedrock groundwater
lost to the Power Conduit drain system. It should be noted that the integrity
of the grout curtain in the area of the Power Conduits could have been
affected by blasting during construction of the Power Conduits.
At the time the Intake Structure was constructed, the river bed
in the vicinity of the Intake Structure was reshaped and a training dyke was
constructed in the River in order to increase the effectiveness of the Intake
Structure. The training dyke is located adjacent to the industrial wharf
approximately 800 feet offshore. The reshaping of the river bed included the
excavation of some bedrock resulting in a direct connection between the
Niagara River and the Lockport bedrock fracture network. Figure 4.7 shows
the training dyke as well as the details of the River bed channelization.
4.9 HYDRAULIC CANAL
Prior to 1956, the Hydraulic Canal was used to convey water
from the Niagara River to the Schoellkopf Power Plant for hydroelectric
4-28 303440

power production. The former location of the Hydraulic Canal is shown on
Plan 2. In 1956, use of the Hydraulic Canal was discontinued and the Canal
was used by the City of Niagara Falls as a disposal site for municipal refuse
and demolition debris. The Hydraulic Canal was completely backfilled and is
currently covered with pavement, buildings and soil cover. The Hydraulic
Canal was approximately 4,600 feet long by 100 feet wide with a depth of
35 feet. A drain connection existed between the Hydraulic Canal and the
Schoellkopf Tunnel. The Hydraulic Canal extended into the bedrock
approximately 16 to 29 feet.
No assessment has been made regarding groundwater migration
through the Hydraulic Canal fill to the bedrock. However, since sections of
the Hydraulic Canal are below the top of rock, it is expected that groundwater
migration pathways to the bedrock exist.
4.10 LANDFILLS
There are several landfills located within the regional study area.
Throughout the study area, the shallow coarse grained overburden materials
are generally separated from the underlying bedrock by a fine-grained
confining layer of clay and/or glacial till. The confining layer acts as an
aquitard limiting overburden groundwater infiltration into the bedrock.
However, during landfilling operations at the various landfills, it is possible
that the confining layer may have been disturbed or removed altogether
providing a groundwater migration pathway from the overburden to the
4-29 303441

bedrock. It is believed that any migration pathways caused by landfill
operations would result in localized recharge of the bedrock groundwater
flow regime.
As stated in Section 4.6, there are several landfills within the
study area that have remedial groundwater pumping systems currently in
operation or planned to be in operation in the near future. These systems
extract groundwater from the bedrock for treatment. Since it is possible that
landfilling operations have disturbed or removed the confining layer of soil
above the bedrock, it is possible that the operation of these pumping systems
will also affect overburden groundwater flow. However, since the
overburden materials throughout the study area are generally of a tight
nature, the effect on overburden groundwater flow will be limited to the
immediate area of each pumping system and the proximity to confining layer
discontinuities.
4.11 BUILDING AND STRUCTURE FOUNDATIONS
A factor which may influence localized bedrock groundwater
flow is the presence of building and structure foundations. Since the
overburden thickness in many portions of the study area is not substantial, it
is possible that the construction of building and structure foundations may
have disturbed or removed the confining overburden layer that overlies the
bedrock, creating a vertical groundwater migration pathway from the
overburden to the bedrock.
4-30 303442

Often dewatering systems are installed around buildings to
remove water from around the foundations. Because of the limited
overburden thickness in the area, it is possible that some dewatering systems
may be situated in the upper segments of the bedrock. Two known such
situations are found at the Great Lakes Carbon Site where groundwater
sumps have been installed, and at OxyChem's Energy From Waste Facility,
where a foundation dewatering system was installed on top of the bedrock.
3034434-31

5.0 RGA BEDROCK GROUNDWATER CHEMISTRY DATABASE
An objective of the RGA is to assess the distribution of chemicals
in bedrock groundwater within the RGA study area. Available records for
each of the 39 sites identified in Section 2.0 were reviewed and all available
bedrock groundwater data were compiled. The compiled data were entered
into a database using the dBASE IV management system for IBM compatible
computers. Bedrock groundwater sampling and analyses were found to have
been performed for eighteen of the sites. For sites where more than one
round of sampling and chemical analyses had been performed, the event
with the most extensive analyses (in terms of number of analytes) was
selected for use in the RGA, regardless of the date of sampling. Thus, one
listing of analytical results was compiled for each bedrock monitoring well
used in the RGA. The most extensive chemical analyses were conducted in
the early stages of many of the on-going groundwater studies. Therefore, the
dates of the chemical analyses compiled in the RGA span approximately the
last 10 years.
Based on review of the compiled data, it was determined that
different analytical parameters were analyzed at different sites. A total of 218
different parameters have been analyzed at one or more sites. In order to
prepare maps showing chemical distributions and also maintain continuity
among the individual sites, chemicals with similar chemical characteristics,
or associated with similar types of sources, were grouped together. For
example, volatile aromatic hydrocarbons (benzene, toluene, ethylbenzene and
xylene) were grouped together. Each of these chemicals is potentially
303444

associated with petroleum-based products such as gasoline. The totaled
concentrations of chemicals in each group were plotted on a map of the study
area to assess the chemical distribution (see Section 6.0). The following
subsections describe the database structure and use, summarize the available
bedrock groundwater data, and present the chemical groups which were used
for the assessment of chemical presence in bedrock groundwater. The
limitations of the database are also discussed.
5.1 DATABASE DEVELOPMENT
The bedrock groundwater analytical data, compiled as described
above, was entered into dBASE IV, a database management software package
distributed by Ashton-Tate Corporation. A coordinate system was developed
for the RGA and each monitoring well was assigned an east and north
coordinate in accordance with its location: The database was structured such
that each groundwater sample and its associated data make up one record.
Analytical results for a total of 850 bedrock groundwater samples are included
in the RGA database. For each sample, the following information is included
in the record:
Well identification number;
Site name;
East coordinate;
North coordinate;
3034455-2

Strata of Lockport Dolomite monitored (upper, middle or lower: see
Section 4.0);
Date sampled; and
Chemical concentrations for all chemical analyses performed.
An application program was written to calculate statistical
parameters for each of the chemicals included in the database. The results of
the statistical analyses are presented in Subsection 5.3.
Application programs were also developed to write selected data
from the RGA database into x,y,z format, with x and y being the east and
north coordinates, respectively, and z being the concentration of a particular
chemical or group of chemicals. These files were used to prepare the
chemical distribution maps presented in Section 6.0.
5.2 SUMMARY OF BEDROCK GROUNDWATERANALYTICAL DATA
5.2.1 Data Availability
Analytical results for bedrock groundwater samples were
available for the following sites:
BFI/CECOS;
Chisholm Ryder;
City of Niagara Falls Buffalo Avenue Site;
5-3 303446

Du Pont Necco Park Landfill;
Du Pont Niagara Plant;
Frontier Chemical Plant;
Niagara Co-Generation Site (Goodyear Tire and Rubber Co.);
Hydraulic Canal;
64th Street South Site (La Salle Area Monitoring Wells);
New Road Site;
OxyChem - Buffalo Avenue Plant;
OxyChem - Durez Niagara Plant;
OxyChem - Hyde Park Landfill;
OxyChem - S-Area Landfill;
Olin - Buffalo Avenue Plant;
Olin - Industrial Welding;
Silbergeld Junkyard;
Solvent Chemical (3163 Buffalo Avenue Site); and
Union Carbide - Carbon Products Division Republic Plant.
In addition, analytical results for bedrock groundwater samples
collected from 13 USGS wells within the City of Niagara Falls were included
in the RGA database.
The data available and used in the RGA database are briefly
summarized below for each site. A more detailed presentation of the site
investigations and results is presented in the Site Summary Reports included
in Appendix A.
303447

Many samples were analyzed for standard lists of analytical
parameters. These included the Priority Pollutant List (PPL), the Hazardous
Substance List (HSL) and the Target Compound List/Target Analyte List
(TCL/TAL). Other samples were analyzed for site-specific lists of indicator
chemicals.
5.2.1.1 BFI/CECOS
A records search of the publicly available BFI/CECOS documents
at NYSDEC Region 9 was conducted in October 1991. The most
comprehensive analytical results for organic chemicals in the available files
were generated from a series of investigations conducted in 1989-1990 to•
characterize volatile organic compounds and phenolics in groundwater at the
site. These data were available for 43 bedrock wells, all monitoring the upper
Lockport zone. Parameters analyzed and analytical results are tabulated in the
Site Summary Report presented in Appendix A. No pesticide data were
found to be available for these monitoring wells.
5.2.1.2 Chisholm-Ryder
Three bedrock groundwater monitoring wells, all monitoring
the upper Lockport zone, are located at the Chisholm-Ryder Site. The wells
were sampled in January 1988 and analyzed for HSL organic chemicals and
HSL metals.
5-5 303448

5.2.1.3 City of Niagara Falls Buffalo Avenue Site
Seventeen bedrock monitoring wells have been installed and
sampled at the City of Niagara Falls Buffalo Avenue Site. All monitor the
upper zone of the Lockport Dolomite. Samples were analyzed for the
TCL/TAL.
5.2.1.4 Du Pont Necco Park Landfill
Analytical results for groundwater samples obtained from a total
of 116 bedrock monitoring wells were compiled for the Du Pont Necco Park
Landfill. Sixty-one of these monitor the upper zone of the Lockport
Dolomite, 42 monitor the middle Lockport, and 13 monitor the Lower
Lockport. The wells were sampled between 1984 and 1987, depending on
when the wells were installed. Samples were analyzed for either PPL organics
and metals or HSL organics and metals.
5.2.1.5 Du Pont Niagara Plant
Analytical results for groundwater samples obtained from a total
of 49 bedrock monitoring wells were compiled for the Du Pont Niagara Plant.
Twenty-nine of these monitor the upper Lockport, 19 monitor the middle
303449

Lockport and one monitors the Lower Lockport. In 1983 through 1986,
depending on the date of installation, the wells were sampled for either PPL
organics and metals or HSL organics and metals.
5.2.1.6 Frontier Chemical
Groundwater samples from 51 bedrock monitoring wells have
been analyzed for the Frontier Chemical Site investigations. All wells
monitor the upper Lockport zone. The analytical data compiled for use in the
RGA are the results of volatile organic and phenolic compound analyses
performed on bedrock groundwater samples obtained in 1986 and 1988.
5.2.1.7 Niagara Co-Generation Site (Goodyear Tire and Rubber Co.)
Four bedrock groundwater monitoring wells all monitoring the
upper Lockport zone, have been sampled for chemical analyses at the Niagara
Co-Generation Site. Results of TCL and TAL analyses conducted in 1991 were
entered into the RGA database.
5.2.1.8 Hydraulic Canal
Four bedrock groundwater monitoring wells (installed by the
USGS) have been sampled at the Hydraulic Canal Site. One well monitors
5-7 303450
the upper Lockport zone, one monitors the middle zone and two monitor all
three Lockport zones. Samples were analyzed for selected volatiles, semi-
volatiles, pesticides and metals.
5.2.1.9 64th Street South Site
In the La Salle Section of Niagara Falls (west of 1-190), located in
the eastern part of the RGA study area, 18 bedrock monitoring wells (15 upper
Lockport zone and 3 middle Lockport zone) were installed and sampled by the
USEPA. The ground water samples, collected in 1986, were analyzed for the
HSL organics and metals.
5.2.1.10 New Road Site
Two bedrock monitoring wells (upper Lockport zone) have been
installed at the New Road Site. Samples were collected and analyzed for the
TCLandTALinl991.
5.2.1.11 Occidental Chemical Corporation - Buffalo Avenue Plant
Analytical data from 107 bedrock ground water monitoring wells
installed by OxyChem for the Buffalo Avenue Plant investigations were
incorporated into the RGA database. Sixty-eight of these monitor the upper
303451
Lockport zone, 20 monitor the middle Lockport zone, and 19 monitor the
lower Lockport zone. Depending on the date and purpose of the well
installation, samples were obtained from 1979 through 1991. The most recent
samples (1991) were obtained from wells installed as part of an investigation
of off-site groundwater. Samples were analyzed for site-specific indicator
chemicals including selected volatile and semi-volatile organic compounds,
pesticides, and metals.
5.2.1.12 Occidental Chemical Corporation - Durez Niagara Plant
The OxyChem Durez Niagara Site investigations have included
installation and sampling of 14 bedrock groundwater monitoring wells. Ten
of these monitor the upper Lockport zone, three monitor the middle
Lockport zone, and one monitors the lower Lockport zone. Some of these
wells were sampled from several isolated 15-foot intervals, after which the
wells were converted to monitor a specific interval.
Analytical results used in the RGA were generated from samples
collected from 1984 through 1991. Samples were analyzed for site-specific
indicator chemicals including several volatile organic compounds,
chlorinated benzenes, phenols, barium and chromium.
5-9 303452

5.2.1.13 Occidental Chemical Corporation - Hyde Park Landfill
Data from 49 bedrock survey wells sampled from 1982 through
1984 were used in the RGA database. Individual wells were sampled from
several isolated 15-foot intervals, after which the wells were
decommissioned. Samples were analyzed for site-specific indicator chemicals
including selected volatile and semi-volatile organic compounds and
gamma-hexachlorocyclohexane (g-BHC).
5.2.1.14 Occidental Chemical Corporation - S-Area Landfill
A total of 20 bedrock survey wells were sampled for the
OxyChem S-Area investigations during 1987 and 1988. These wells were each
sampled from several isolated 15-foot intervals, after which the wells were
converted to monitor the lower Lockport zone. Samples were analyzed for
site-specific indicator chemicals, primarily chlorobenzene compounds. In
addition, twelve historical monitoring wells (upper Lockport) were sampled
and analyzed for the Priority Pollutant List during 1979 and 1980.
5.2.1.15 Olin Buffalo Avenue Plant
A total of 18 bedrock ground water monitoring wells at the Olin
Buffalo Avenue Plant were sampled in 1991 and analyzed for the TCL,
510 3034^3

additional chlorinated phenols and mercury. All of these wells monitor the
upper Lockport zone.
5.2.1.16 Olin Industrial Welding Site
Ten bedrock monitoring wells have been installed and sampled
at the Industrial Welding Site, all in the upper Lockport zone. Samples from
four wells were analyzed for all TCL organics and mercury. Samples from six
wells were analyzed for TCL volatiles, TCL pesticides and mercury. The wells
were sampled in 1989 and 1991.
5.2.1.17 Silbergeld Tunkyard Site
Five bedrock monitoring wells have been installed and sampled
at the Silbergeld Junkyard Site. All of these wells monitor the upper Lockport
zone. Samples were obtained from all five wells in 1991 and analyzed for the
TCL and TAL.
5.2.1.18 Solvent Chemical (3163 Buffalo Avenue Site)
Nine bedrock (upper Lockport zone) monitoring wells have
been sampled at the Solvent Chemical Site, also referred to as the 3163 Buffalo
3034545-11

Avenue Site. The sampling was performed in 1990 and samples were
analyzed for the TCL and TAL.
5.2.1.19 Union Carbide - Carbon Products Division Republic Plant
Six bedrock monitoring wells have been installed and sampled
at the Union Carbide Carbon Products Division Republic Plant. Samples were
collected in 1988 and analyzed for HSL organics and selected inorganics.
5.2.1.20 USGS Monitoring Wells
In addition to the USGS wells identified in Section 5.2.1.8, nine
other USGS wells located in the study area have been sampled for chemical
analysis. The samples were collected and analyzed for the PPL in 1982-1983.
5.2.2 Statistical Summary Of Analytical Data
Analytical data from a total of 854 bedrock groundwater samples
were entered into the RGA database. Tables 5.1, 5.2, 5.3 and 5.4 present a
statistical summary of the presence of each volatile, semi-volatile,
pesticide/PCB and metal parameter analyzed in at least one well.
3034555-12

These tables include the number of wells in which the chemical
was detected, the mean of measured concentrations above detection limits,
the median of measured concentrations above detection limits, and the range
of measured concentrations above detection limits. Results reported below
detection limits were not used in the calculations. Therefore, the statistics are
not representative of the entire dataset, but only of the subset containing
results above detection limits.
5.3 CHEMICAL GROUPS FOR DETAILED MAPPING
Chemicals detected in bedrock groundwater samples were
categorized into groups of similar chemicals. Chemicals with similar
properties, or derived from similar types of sources, were grouped together
for detailed mapping (Section 6.0). Since most individual chemicals were
sporadically distributed (or analyzed for), the approach of mapping chemical
groups provided a presentation of regional groundwater quality with better
continuity between the individual site study areas.
Ten chemical groups were developed for detailed mapping. In
addition, five chemicals were selected for mapping individually because they
were not appropriate for inclusion in a chemical grouping due to distinctive
chemical or source characteristics. In some samples, chemical concentrations
were reported for both individual isomers and as the total of all isomers.
Where this occurred, the value for the total of all isomers was used to
calculate the group total. A summary of the number of chemicals analyzed in
5-13 303456

each chemical group for individual sites is presented in Table 5.5. The
chemical groupings are presented in detail below.
5.3.1 Group 1 - Chlorinated Volatile Aliphatic Compounds
All chlorinated volatile aliphatic compounds detected in any
well were grouped together for detailed mapping of totalled concentrations.
Group 1 chemicals were:
Chemical Number Analyzed
Trichloroethene 442Tetrachloroethene 432Chloroform 341trans-l,2-Dichloroethene 277Methylene Chloride 351Vinyl Chloride 3511,1-Dichloroethene 3511,1,2-Trichloroethane 3511,1,2,2-Tetrachloroethane 354Carbon Tetrachloride 3601,2-Dichloroethane 3511,1,1-Trichloroethane 3511.1-Dichloroethane 4041.2-Dichloroethene (total) 120Bromodichloromethane 351Trichlorofluoromethane 168Chloromethane 351cis-l,2-Dichloroethene 16Chloroethane 351
Number Detected
274205171161155979167625756413627162221
3034575-14

5.3.2 Group 2 - Benzene. Toluene. Ethylbenzene and Xylene
Benzene, toluene/ ethylbenzene and xylene (BTEX) were
grouped together for detailed mapping due to chemical similarity and
association with petroleum-based products such as gasoline. The number of
analyses and number of detections were as follows:
Chemical Number of Analyses Number of Detections
Benzene 485 174Toluene 478 132Xylene 269 . 59Ethylbenzene 404 44
5.3.3 Group 3 - Acetone and 2-Butanone
Acetone and 2-butanone, two non-chlorinated volatile solvents,
were grouped together. Both chemicals are also common laboratory
contaminants. The number of analyses and number of detections were as
follows:
Chemical Number of Analyses Number of Detections
Acetone 264 872-Butanone 263 42
9034585-15

5.3.4 Group 4 - Phenol and Methylphenols
Phenol and methylphenols were grouped together. Group 4
chemicals were:
Chemical Number of Analyses Number of Detections
Phenol 558 1862,4-Dimethylphenol 297 214-Methylphenol 162 142-Methylphenol 163 9
5.3.5 Group 5 - Chlorophenols
All chlorinated phenolic compounds (Chlorophenols) detected
were grouped together for detailed mapping. Chlorophenols detected in one
or more bedrock groundwater monitoring wells were:*
Chemical Number of Analyses Number of Detections
2,4,6-Trichlorophenol 305 32Trichlorophenols, total 213 24Pentachlorophenol 306 202,4-Dichlorophenol 297 172,4,5-Trichlorophenol 223 112-Chlorophenol 297 73,4-Dichlorophenol 18 32,3,6-Trichlorophenol 18 22,3,4,5-Tetrachlorophenol 18 13-Chlorophenol 18 1
303459

5.3.6 Group 6 - Chlorobenzenes and Chlorotoluenes
Chlorobenzene and chlorotoluene compounds were grouped
together for detailed mapping. These chemicals included:
Chemical Number of Analyses Number of Detections
Chlorobenzene 7831,2,4-Trichlorobenzene 437Chlorotoluenes, total 2681.2-Dichlorobenzene 4221.3-Djchlorobenzene 403Trichlorobenzenes, total 3041.4-Dichlorobenzene 422Tetrachlorobenzenes, total 3022-Chlorotoluene 784-Chlorobenzotrifluoride 78Monochlorobenzotrifluoride 2204-Chlorotoluene 78Hexachlorobenzene 4782,4/2,5-Dichloro toluene 78Dichlorobenzenes, total 772,4-Dichlorobenzotrifluoride 781,2,3-Trichlorotoluene 782,3/3,4-Dichlorotoluene 782,6-Dichlorotoluene 781,2,3,4-Tetrachlorobenzene 781,2,4,5-Tetrachlorobenzene 782-Chlorobenzotrifluoride 782,4,5-Trichlorotoluene 78
211106988885858485534940373633302827272322201716
3034605-17

Chemical Number of Analyses Number of Detections
Chlorobenzoic Acids, total 1692,3,6-Trichlorotoluene 783,4-Dichlorobenzotrifluoride 78Dichlorotoluenes, total 114-Chlorobertzoic acid 782-Chlorobenzoic acid 78
141312554
5.3.7 Group 7 - Polyaromatic Hydrocarbons
Polyaromatic hydrocarbon (PAH) compounds were grouped
together for detailed mapping. PAH compounds detected were:
Chemical Number of Analyses Number of Detected
NaphthaleneFluorantheneFluorene _ChrysenePhenanthreneAcenaphthenePyreneBenzo(a)anthraceneAnthraceneBenzo(b)fluorantheneBenzo(a)pyreneIndenod ,2,3-cd)pyreneBenzo(g,h,i)peryleneDibenz(a,h)anthracene
297297297292297297297297297281281281296281
145332221111111
3034615-18

5.3.8 Group 8 - Hexachloroethane, Hexachlorobutadiene,Hexachlorocvclopentadiene and Octachlorocyclopentene
Four highly chlorinated non-aromatic semi-volatile compounds
were grouped together for detailed mapping. Group 8 chemicals were:
Chemical Number of Analyses Number of Detected
Hexachlorobutadiene 469 107Hexachloroethane 282 59Hexachlorocyclopentadiene 573 28Octachlorocyclopentene 178 12
5.3.9 Group 9 - Phthalates
Phthalate compounds were grouped together for detailed
mapping. Phthalate compounds detected in at least one well were:
Chemical Number of Analyses Number of Detected
bis(2-Ethylhexyl) Phthalate 301 56Di-n-Butyl Phthalate 293 5Butylbenzyl Phthalate 297 4Di-n-Octyl Phthalate 301 2
5-19303462

5.3.10 Group 10 - Pesticides/PCBs
Chemical Group 10 includes all pesticide and PCB compounds
detected in at least one bedrock groundwater monitoring well. These
chemicals included:
Chemical Number Analyzed Number Detected
gamma-BHC 545 112alpha-BHC 347 85beta-BHC 343 78delta-BHC 343 78Heptachlor 260 16Aldrin 256 11Total BHC 103 114,4'-DDT 256 10Heptachlor Epoxide 256 3Endosulfan I 262 3Arochlor-1254 255 3Mirex 232 34,4'-DDE 242 2Endosulfan Sulfate 256 2
5.3.11 Chemicals Considered Individually
Five chemicals were considered individually because they have
distinct chemical properties or source characteristics. These included:
3034635-20

Chemical Number Analyzed Number Detected
Lead 323 154Barium 271 112Mercury 338 46N-Nitrosodiphenylamine 297 13Benzoic Acid 226 11
Lead, barium, and mercury were the metals selected for detailed
mapping. Other metals detected were considered to be naturally occurring,
had limited distributions, or did not exceed New York State Water Quality
Standards.
5.3.12 Other Detected Organic Chemicals
Several organic chemicals were not placed into a group or
mapped individually. These chemicals were either infrequently detected or
were not appropriate for inclusion in any of the 10 chemical groups based on
chemical similarity.
Three volatile organic chemicals fell into this category:
Chemical Number Analyzed Number Detected
4-Methyl-2-pentanone 212 21Carbon Bisulfide 151 16Vinyl Acetate 151 1
3034645-21

Nine semi-volatile organic chemicals were not placed into a
group or mapped individually. These included:
Chemical Number Analyzed Number Detected
Aniline 61 54-Chloroaniline 152 5Benzyl Alcohol 161 4Chlorendic Acid 78 3Benzeneacetic Acid 9 2Nitrobenzene 306 2Pyridine 22 22-Chloronaphthalene 297 14,6-Dinitro-o-cresol 187 1
Although these chemicals were not included in the chemical
groups and were not mapped individually, their concentrations were
included in total organic chemical distribution maps presented in Section 6.0.
5.4 DATABASE LIMITATIONS
In the following Section, chemical distribution maps are
presented and interpreted. The interpretation of these data with respect to
regional groundwater quality is limited by the monitoring well network.
Most wells are located at or in the immediate vicinity of a small number of
sites where extensive investigations have been conducted. There is
comparatively little data available for other potential source areas and for
non-industrial areas. Furthermore, most of the available groundwater
5-22 303465

analytical data is from samples obtained from the upper Lockport zone. Of
the 854 groundwater samples compiled for the RGA, 576 (18 sites) were from
upper Lockport zone samples, 196 (nine sites) were from middle Lockport
zone samples and 80 (six sites) were from lower Lockport zone samples. For
the middle Lockport zone, the distribution of chemical presence can only be
presented based on data from the nine sites with monitoring wells
penetrating this zone. In the chemical distribution maps for the middle
Lockport (presented in the following Section), areas where no chemical
distribution is shown generally reflect lack of data rather than the results of
chemical analyses. Assessment of the lower Lockport is further limited due
to the fewer number of wells sampled and very little interpretation from a
regional perspective is possible.
Several sites analyzed only for site-specific lists of indicator
parameters rather than the more general lists of parameters. For some site
investigations, this may have prevented identification of low levels of
chemicals which could have been present due to off-site sources. However,
the impacts of the different analytical lists on the comparisons between sites
are probably not a major consideration because site-specific indicator chemical
lists are generally developed to account for most known contaminants at the
site.
5-23 303466

6.0 PRESENCE OF CHEMICALS IN BEDROCK GROUNDWATER
To assess the distribution of chemicals in bedrock groundwater,
chemical concentrations were totaled for each Chemical Group identified in
Section 5.0. These group totals (and concentrations of the five chemicals
considered individually) were plotted on maps of the RGA study area and
isoconcentration contour lines were drawn. When totaling chemical
concentrations, results reported as not detected were assumed to be zero. The
individual maps show only those wells from which samples were analyzed
for the parameters plotted. If no wells are plotted in an area, it indicates there
is no data for this area. In cases where two or more wells at the same location
monitor different intervals of the same zone, the well with the highest
analytical result was plotted.
At some sites, analytical results may have been influenced by the
presence of non-aqueous phase liquid (NAPL) in the groundwater flow
regime. In general, NAPL observations were limited to monitoring wells in
the vicinity of major source areas. Off-Site NAPL migration in the bedrock
has been documented in only a few isolated locations. In these cases, the
NAPL remained in close proximity to the Site boundaries. NAPL presence is
discussed on a Site-by-Site basis in the Site Summary Attachments
(Appendix A).
Maps were prepared for the upper and middle Lockport zones.
Since only a few wells in the study area monitor the lower Lockport, there
was insufficient data for preparation of regional isoconcentration contour
303467
maps for this zone. In the following subsections, the word plume is used to
refer to a volume of groundwater which contains detectable concentrations of
the chemicals identified in Section 5.0. Plumes, as defined in this report, are
not necessarily a result of a single source area, but rather represent volumes
where groundwater quality has been impacted. The association of a specific
site with a plume does not necessarily mean that the site contributed
significantly to that plume.
6.1 GROUP 1 CHEMICALS
The distribution of Group 1 chemicals (chlorinated volatile
aliphatics) in the upper Lockport zone is presented on Plan 8. This map
shows four major Group 1 chemical plumes in the upper Lockport. One
plume is located in the southwest section of the study area based on samples
from wells at the Du Pont Niagara Plant, Olin Buffalo Avenue Plant, Solvent
Chemical Site and the Industrial Welding Site. The highest concentrations of
Group 1 chemicals occur west of Gill Creek at the Du Pont Niagara Plant and
Olin Buffalo Avenue Plant. Lower concentrations occur north of Buffalo
Avenue and east of Gill Creek suggesting some migration toward the Falls
Street Tunnel and NYPA Conduits has occurred.
A second Group 1 chemical plume in the upper Lockport is
located in the southeast section of the study area based on samples from wells
at the OxyChem Buffalo Avenue Plant. Higher concentrations of Group 1
chemicals are limited primarily to the immediate vicinity of the Plant.
6-2 303468

Migration from this site could be contributing to the lower levels of Group 1
chemicals detected in the vicinity of the Falls Street Tunnel and NYPA
Conduits.
A third Group 1 chemical plume in the upper Lockport is
indicated by the results of analyses of groundwater samples from the Frontier
Chemical Site. Higher levels of Group 1 chemicals occur on-site. Migration
from this site could be contributing to the lower levels of Group 1 chemicals
detected in the vicinity of the Falls Street Tunnel and NYPA Conduits.
A fourth Group 1 chemical plume in the upper Lockport is
indicated by the results of groundwater samples obtained from the Du Pont
Necco Park investigations. The higher concentrations of Group 1 chemicals
occur in the immediate vicinity of the site. Lower levels to the south and
southwest suggest some migration toward the John Avenue Tunnel and
NYPA/FST has occurred.
Groundwater analytical data suggest that less extensive isolated
Group 1 chemical plumes may also be present in the upper Lockport at the
BFI/CECOS and OxyChem S-Area Sites.
In the middle Lockport zone, the assessment of chemical plumes
(Plan 9) is limited because fewer monitoring wells penetrated this zone (see
Section 5.4).
6-3 303469

Group 1 chemicals were analyzed in the lower Lockport zone
wells during three site investigations. Concentrations were reported for
lower Lockport groundwater samples from the Du Pont Niagara Plant, Du
Pont Necco Park and OxyChem Buffalo Avenue Plant investigations.
Reported concentrations were generally lower in the lower Lockport zone
than in the upper and middle zones.
Plans 8 and 9 indicate that, for each of the identified plumes, the
highest concentrations of Group 1 chemicals occur at or near the probable
source areas. Lower levels of Group 1 chemicals occur more distant from the
probable source areas, primarily in the direction of the NYPA Conduits and
Falls Street Tunnel. These structures were identified in Section 4.0 as major
collectors of groundwater seepage. Some chemical migration in groundwater
toward these structures has likely occurred.
6.2 GROUP 2 CHEMICALS
The distribution of Group 2 chemicals (benzene, toluene,
ethylbenzene and xylene) within the upper Lockport zone is shown on Plan
10. Five Group 2 chemical plumes were indicated. In the southwest portion
of the study area, a Group 2 chemical plume was indicated by the results of
analyses from monitoring wells located at the Du Pont Niagara Plant, Olin
Buffalo Avenue Plant, Solvent Chemical Site and Industrial Welding Site. A
second plume was indicated by analytical results from sampling of the
OxyChem Buffalo Avenue Plant monitoring wells. The inferred extent of
303470

chemical presence of Group 2 chemicals extends further to the east than that
for Group 1 chemicals. The third plume was identified based on results from
sampling monitoring wells at the Frontier Chemical Site. The fourth
Group 2 chemical plume in the upper Lockport was identified based on
analytical results from the Du Pont Necco Park monitoring wells. The
Group 2 chemical plume based on these data is less areally extensive than the
Group 1 plume. The fifth upper Lockport Group 2 chemical plume was
identified based on analytical results from the OxyChem Durez Plant
monitoring wells. Another, lower concentration plume within the upper
Lockport zone is potentially present based on data from groundwater
monitoring at the OxyChem S-Area Landfill.
For each of these identified plumes, the highest concentrations
occur in the immediate vicinity of the probable source areas. Some lower
concentrations were reported more distant from the probable sources.
Plan 11 presents the Group 2 chemical distribution for the
middle Lockport monitoring wells. As for the Group 1 chemicals, this map
indicates that some downward migration of Group 2 chemicals has occurred.
For the lower Lockport zone, Group 2 chemicals were analyzed
during four site investigations. Group 2 chemicals were reported above
detection limits in one or more wells during the Du Pont Necco Park,
Du Pont Niagara Plant, OxyChem Buffalo Avenue Plant and OxyChem Durez
Investigations. Reported concentrations were generally lower than for the
middle and upper zones.
6-5 303471

6.3 GROUP 3 CHEMICALS
The distribution Group 3 chemicals (acetone and 2-butanone) in
the upper Lockport zone is shown on Plan 12. The distributions of these two
commonly used chemicals (and also common laboratory contaminants) is
heavily skewed by the limited number of analyses for these parameters. Plan
12 shows the presence of five Group 3 chemical plumes based on data from
monitoring wells installed for the Goodyear Co-Generation Site, Frontier
Chemical Site, BFI/CECOS, City of Niagara Falls Buffalo Avenue Site and Du
Pont Necco Park Off-Site investigations.
Plan 13 presents the distribution of Group 3 chemicals in the
middle Lockport zone based on limited data. The documented presence of
elevated Group 3 chemicals in the middle Lockport zone is limited to wells
north of Niagara Falls Boulevard and one well north of Packard Road.
Group 3 chemicals were analyzed for lower Lockport zone
samples only for the Du Pont Necco Park Off-Site and OxyChem Durez
investigations. Concentrations were reported in both investigations.
6-6 303472

6.4 GROUP 4 CHEMICALS
The distribution of Group 4 chemicals (phenol and
methylphenols) in the upper Lockport zone is shown on Plan 14. Five
plumes were discernible based on the available data. In the southwest
portion of the study area, sporadic detections of Group 4 chemicals were
reported for Solvent Chemical, Olin Buffalo Avenue Plant and Du Pont
Niagara Plant upper Lockport monitoring wells. A second plume of Group 4
chemicals in the upper Lockport was indicated based on the results from the
BFI/CECOS and Du Pont Necco Park investigations.
The third Group 4 chemical plume was identified based on data
from the OxyChem Durez Site investigations. In this case, results for the total
phenolic compound analyses were used rather than individual chemical
analyses, because the latter were not performed. These results indicate
Group 4 chemicals in the immediate vicinity of the Durez Site. A fifth Group
4 chemical plume is indicated by the OxyChem Hyde Park Landfill
groundwater sampling and analyses. For each of these plumes, the higher
concentrations were limited primarily to the immediate vicinity of the sites.
Plan 15 presents the distribution of Group 4 chemicals in the
middle Lockport zone based on a limited monitoring well network.
Chemical concentrations were reported for the Du Pont Necco Park,
BFI/CECOS, OxyChem Durez, and OxyChem Hyde Park Landfill
investigations.
303473o-/

Group 4 chemicals were analyzed for lower Lockport
groundwater samples during four site investigations. Concentrations were
reported above detection limits for Du Pont Necco Park and OxyChem Durez
investigations.
6.5 GROUP 5
The distribution of Group 5 chemicals (chlorophenols) in the
upper Lockport zone is shown on Plan 16. Three plumes were indicated
based on the available data. One was identified based on data from the Du
Pont Niagara Plant, Olin Buffalo Avenue Plant and Solvent Chemicals
investigations. The presence of detectable concentrations was primarily in
samples from wells located at the Solvent Chemical Site and at the eastern
portion of the Olin Buffalo Avenue Plant.
A second plume is indicated based on Necco Park groundwater
analytical data. Elevated levels of Group 5 chemicals were detected in wells
along the western border of the landfill.
A third plume is indicated based on groundwater analytical
results from the OxyChem Hyde Park investigations. Elevated levels are
limited primarily to the immediate vicinity of the landfill.
Isolated low level detections of Group 5 chemicals were also
reported in the western portion of the OxyChem Buffalo Avenue Plant.
6-8 303474

Plan 17 presents the distribution of Group 5 chemicals in the
middle Lockport zone. Concentrations were reported for OxyChem Hyde
Park middle Lockport monitoring wells and for middle Lockport monitoring
wells located west and south of Necco Park.
Group 5 chemicals were analyzed for lower Lockport
groundwater samples during four site investigations. Concentrations were
reported for 2 of 13 Du Pont Necco Park monitoring wells and 1 of 32
OxyChem Buffalo Avenue Plant monitoring wells.
6.6 GROUP 6 CHEMICALS
Plan 18 presents the distribution of Group 6 chemicals
(chlorobenzenes and chlorotoluenes) in the upper Lockport zone. Five major
Group 6 chemical plumes were identified based on the available data. In the
southwest portion of the study area, data from the Du Pont Niagara Plant,
Olin Buffalo Avenue Plant and Solvent Chemical Site investigations indicate
the presence of a Group 6 chemical plume.
A second plume was identified based on data from the OxyChem
Buffalo Avenue Plant investigations, primarily in the western portion of the
plant, north of Buffalo Avenue. A third plume was identified based on data
from the OxyChem S-Area landfill investigations. A fourth plume was
6-9303475
identified based on data from the Frontier Chemicals Site. A fifth plume was
identified based on data generated from the Hyde Park Landfill investigations.
Three lower concentration plumes of Group 6 chemicals were
suggested to occur based on data from the Du Pont Necco Park, BFI/CECOS
and OxyChem Durez investigations.
Plan 19 presents the distribution of Group 6 chemicals in the
middle Lockport zone. Some downward migration of Group 6 chemicals
from the upper Lockport to the middle Lockport zone has occurred based on
data from sites with middle Lockport monitoring wells.
As with the other chemical groups discussed, higher
concentrations of Group 6 chemicals were reported to occur in wells at or in
the immediate vicinity of probable source areas. Concentrations were much
lower with increased distance from the sources.
Group 6 chemicals were analyzed for lower Lockport zone
groundwater samples during six site investigations. Concentrations were
reported for the Du Pont Niagara Plant, OxyChem Buffalo Avenue Plant,
OxyChem S-Area Landfill, OxyChem Durez, and OxyChem Hyde Park
Landfill Sites.
3034766-10

6.7 GROUP 7 CHEMICALS
No substantial plumes of Group 7 chemicals (PAHs) were
indicated based on the mapped concentration data. Isolated low level
detections were reported for a few wells at the sites for which these chemicals
were analyzed. PAH compounds were not detected in lower Lockport zone
ground water samples.
6.8 GROUP 8 CHEMICALS
The distribution of Group 8 chemicals (hexachloroethane,
h e x a c h l o r o b u t a d i e n e , hexach lo rocyc lopen tad iene , and
octachlorocyclopentene) is presented on Plan 20. Plan 20 indicates the
occurrence of five Group 8 chemical plumes.
In the southwest portion of the study area, data from the Du
Pont Niagara Plant, Olin Buffalo Avenue Plant and Solvent Chemical Site
investigations indicate the presence of a Group 8 chemical plume. A second
plume was identified based on data from the OxyChem Buffalo Avenue Plant
investigations, primarily in the western portion of the site, north of Buffalo
Avenue. A third plume is indicated based on data from the OxyChem S-Area
Landfill investigations. A fourth Group 8 chemical plume was identified
based on data from the Necco Park investigations. A fifth plume was
indicated based on data from the OxyChem Hyde Park Landfill investigations.
6-n 303477

Within each Group 8 chemical plume, higher concentrations were limited
primarily to the immediate vicinity of the sites.
Plan 21 presents the distribution of Group 8 chemicals based on
the limited middle Lockport data. Downward migration from the upper
Lockport zone has occurred, based on data from the Du Pont Niagara Plant,
OxyChem S-Area Landfill, Du Pont Necco Park Landfill and OxyChem Hyde
Park Landfill investigations.
Group 8 chemicals were analyzed for lower Lockport zone
groundwater samples during three site investigations. Concentrations were
reported for the Du Pont Necco Park Landfill, Du Pont Niagara Plant and
OxyChem Buffalo Avenue Plant.
6.9 GROUP 9 CHEMICALS
No substantial plumes of Group 9 chemicals (phthalates) were
indicated based on the mapped concentration data. Phthalate compounds are
common sampling and laboratory contaminants. Sporadic low level
detections were reported in several wells at sites for which these analyses
were performed.
6-12 303478

6.10 GROUP 10 CHEMICALS
Plan 22 presents the distribution of Group 10 chemicals
(pesticides/PCBs) in the upper Lockport zone. Three Group 10 chemical
plumes were identified. Based on data from the Du Pont Niagara Plant and
Olin Buffalo Avenue Plant investigations, a Group 10 chemical plume exists
in the vicinity of Gill Creek between the Robert Moses Parkway and Buffalo
Avenue. A second plume was identified based on data from the OxyChem
Buffalo Avenue Plant, primarily limited to the western portion of the Plant.
A third plume was indicated based on data from the OxyChem Hyde Park
Landfill investigations.
Lower concentration plumes are also indicated based on data
from the OxyChem S-Area Landfill and Du Pont Necco Park Landfill
investigations.
Plan 23 presents the distribution of Group 10 chemicals in the
middle Lockport zone. This figure indicates that limited downward
migration from the upper Lockport zone has occurred.
Group 10 chemicals were analyzed for lower Lockport
groundwater samples during six site investigations. Concentrations were
reported for the Du Pont Niagara Plant (near Gill Creek), OxyChem Buffalo
Avenue Plant, and OxyChem S-Area Landfill investigations.
6-13 303479

6.11 CHEMICALS CONSIDERED INDIVIDUALLY
As described in Section 5.0, five chemicals are not appropriate for
inclusion in any of the chemical groups and were therefore considered
separately.
6.11.1 Benzoic Acid
No substantial plumes of benzoic acid were indicated based on
the mapped concentration data. Reported detections of benzoic acid were
generally isolated. There were 11 reported concentrations above detection
limits: eight were from monitoring wells located south of the Du Pont Necco
Park Landfill, two were from Olin Buffalo Avenue Plant monitoring wells,
and one was from an OxyChem Buffalo Avenue Plant monitoring well.
Benzoic acid was detected in one lower Lockport monitoring well.
6.11.2 N-Nitrosodiphenylamine
No substantial plumes of N-nitrosodiphenylamine were
identified based on the mapped concentration data. There were 13 detections
of N-nitrosodiphenylamine: 11 detections in Necco Park off-site monitoring
wells and two detections in Du Pont Niagara Plant monitoring wells.
M4 303480

6.11.3 Lead
Plan 24 presents the lead distribution map for the upper
Lockport zone. Lead is naturally occurring in this formation. Reported
concentrations exceeded 0.01 mg/L in monitoring wells installed for the
Solvent Chemical Site, City of Niagara Falls Buffalo Avenue Site, 64th Street
South Site, BFI/CECOS, Du Pont Necco Park Landfill, and USGS
investigations.
Plan 25 presents the lead distribution map for the middle
Lockport zone. This map indicates that downward migration of lead may be
occurring. The degree to which naturally occurring lead is influencing these
results has not been determined.
No lead concentrations above 0.01 mg/L were reported for the
lower Lockport zone.
6.11.4 Mercury
Plans 26 and 27 present the upper Lockport and middle Lockport
concentration distribution maps for mercury. Mercury was reported at
concentrations greater than 0.01 mg/L for monitoring wells located at the
Olin Buffalo Avenue Plant, Industrial Welding Site, and OxyChem Buffalo
Avenue Plant.
303481

No mercury concentrations above 0.01 mg/L were reported for
the lower Lockport zone.
6.11.5 Barium
Figures 28 and 29 present the barium distribution maps for the
upper and middle Lockport zones, respectively. Concentrations reported
above 10 ppm (mg/L) were limited primarily to Necco Park monitoring wells
in the upper Lockport zone in the immediate vicinity of the site.
Barium was analyzed for lower Lockport groundwater samples
during three site investigations. Concentrations were reported for two lower
Lockport zone monitoring wells at the Du Pont Necco Park Landfill and for
one well at the Du Pont Niagara Plant.
6.12 FALLS STREET TUNNEL AND NYPA CONDUITS
Chemicals in groundwater have reached the NYPA Conduits
and Falls Street Tunnel. In a study by O'Brien and Gere (1987), during which
the Falls Street Tunnel was sampled and analyzed 20 times (during dry
weather), 12 organic chemicals were identified as having significant
concentrations in outfall samples. Chemical loading rates were calculated by
O'Brien and Gere based on an average dry weather flow in the Falls Street
6-16 303482

Tunnel of 11.5 mgd. These twelve chemicals, the mean concentrations, and
calculated loading rates were as follows:
Mean Concentration EstimatedChemical at FST Outfall (ug/L) Loading Rate (Ibs/day)
Group 1 Chemicals:
Chloroform 55.9 5.4
trans-l,2-Dichloroethene 83.8 8.0
1,1,2,2-Tetrachloroethane 16.6 1.6
Tetrachloroethylene 58.6 5.6
Trichloroethene 168.2 16.1
Vinyl chloride 7.2 0.7
Group 2 Chemicals:
Benzene 3.4 0.3
Toluene 3.5 0.3
Group 6 Chemicals:
Chlorobenzene 12.3 1.2
Chlorotoluenes 7.7 0.7
Monochlorobenzotrifluorides 5.8 0.6
Dichlorobenzene 28.3 2.7
The highest chemical concentrations at the Falls Street Tunnel
outfall were for Group 1 chemicals. Two Group 2 chemicals and four Group 6
chemicals were also detected.
303483

Two wells installed by NYPA in 1958 adjacent to the east exterior
drain of the east conduit were sampled in 1992 as part of the Du Pont Neccoi
Park off-site investigations. These water samples are expected to be
representative of groundwater discharging to the drain system from the east.
The following chemicals were detected:
NYPA-139NYPA-162 (Near Falls
Chemical (Near Witmer Road) Street Tunnel)
Group 1 Chemicals:
Trichloroethene 920 420
Tetrachloroethene 290 81
1,1,2,2-Tetrachloroethane 380 ND
cis-l,2-Dichloroethene 1,000 27
Methylene Chloride 70 ND
Chloroform 1,100 ND
Group 8 Chemicals:
Hexachloroethane 43 ND
Hexachlorobutadiene 180 ND
Group 10 Chemicals:
gamma-BHC 0.13 ND
The highest reported concentrations observed along the NYPA
conduits were for the Group 1 chemicals. Hydraulic data concerning the
6-18303484

drain system and adjacent fractured rock are not available and, therefore,
loading rates to the system cannot be reliably estimated.
6.13 REGIONAL DATA GAPS
In this report, regional data gaps refer to additional information
which is necessary for understanding the regional transport patterns of
chemicals in groundwater within the RGA study area. The isoconcentration
contour maps presented in this section show that chemical concentrations in
groundwater are highest at or in the immediate vicinity of the probable
source areas. Concentrations are generally lower by 90 percent or more
within approximately 1000 feet of source areas. Where migration has
apparently occurred, the directions of transport have generally been
consistent with the known patterns of groundwater flow presented in Section
4.0. Based on these findings, additional data are not required for investigation
of regional transport.
One limitation of the database is that several sites analyzed only
for site-specific lists of indicator parameters rather than the more general lists
of parameters. However, the impacts of the different analytical lists on the
comparisons between sites are probably not a major consideration because
site-specific indicator chemical lists are generally developed to account for
most known contaminants at the Site.
3034856-19

7.0 GROUNDWATER REMEDIATION PROGRAMS
Groundwater remediation programs have been initiated at
several sites in the RGA Study Area. This Section describes the current status
of remediation in the Study Area. This section also describes the potential
impact of the remediation programs on groundwater quality within the Study
Area. The other sites within the Study Area have not been required to
perform bedrock investigations, have not had bedrock remedial
investigations completed or are not ready to proceed with remediation. Since
these sites represent a large number of the sites included in the RGA, there
are many areas where bedrock groundwater data are limited or do not exist.
Therefore, a complete determination cannot be made on groundwater quality
impacts on a regional scale. Groundwater conditions presented in Section 6.0
are based for the most part on unremediated groundwater data. In the near
future, several groundwater remediation projects will begin operation or will
have been in operation long enough to alter groundwater conditions in most
of the identified source areas.
Groundwater remediation programs are in place, under
construction or are being evaluated at the following Sites:
i) BFI/CECOS Landfill;
ii) Du Pont Necco Park Landfill;
iii) Du Pont Niagara Plant;
iv) Frontier Chemical;
v) OxyChem Buffalo Avenue Plant;
3034867-1

vi) OxyChem Durez Niagara Division;
vii) OxyChem Hyde Park Landfill;
viii) OxyChem S-Area Landfill;
ix) Olin Buffalo Avenue Plant; and
x) Olin Industrial Welding.
7.1 BFI/CECOS LANDFILL
A groundwater recovery and treatment system has been in
operation at the BFI/CECOS site since 1990. The program was implemented
as an Interim Corrective Measure to remediate a release from a wastewater
storage lagoon located in the central portion of the site. The system utilizes
20 wells for recovery. Ten are pumped during the winter months (November
to March). Of these, four pump from the overburden (rates average
approximately 0.5 gpm per well), five pump from the top-of-rock zone (rates
average approximately 1.3 gpm per well), and one pumps from the upper
Lockport bedrock (average rate of 0.3 gpm). All twenty wells are pumped
during the summer months (April to October). Of these, 11 pump from the
overburden (rates average approximately 1.2 gpm per well), eight pump from
the top-of-rock zone (rates average approximately 1.2 gpm per well), and one
pumps from the upper Lockport bedrock (average rate of 0.4 gpm). Recovered
groundwater is treated on-site.
3034877-2

7.2 DU PONT NECCO PARK LANDFILL
A groundwater remediation program is in place at the Du Pont
Necco Park Landfill. The program consists of bedrock groundwater pumping
from recovery wells located downgradient of a three-sided vertical grout
curtain barrier wall. In 1988-1989, a vertical grout curtain barrier wall was
constructed within the upper and middle Lockport zones. The purpose of the
grout curtain is to divert upgradient groundwater around the area and
increase the hydraulic impact of the recovery wells on the downgradient
groundwater flow regime. Two upper Lockport zone groundwater recovery
wells have operated continuously since mid-1982. A third recovery well,
designed to pump from the middle Lockport zone, was completed in 1991 and
began operation in early in 1992. Plan 3 shows the location of the recovery
wells and grout curtain.
Groundwater hydraulic head measurements indicate that the
system is performing as designed. Figure 7.1 shows the upper bedrock
potentiometric surface during the recovery well operation. The capture zone
extends throughout the site, and approximately 500-1,000 feet off-site. This is
expected to induce recovery of chemicals in groundwater that has previously
migrated off-site.
A NAPL recovery program has been in place since 1989. NAPL
is removed monthly from wells where it accumulates. In 1991, two pilot
NAPL recovery wells were installed to further investigate NAPL recovery
techniques.
7.3 303488

7.3 DU PONT NIAGARA PLANT
A groundwater remediation program is ongoing at the Du Pont
Niagara Plant. There are two components to the program:
1) Overburden/top-of-bedrock groundwater recovery; and
2) Bedrock groundwater recovery.
The overburden/top-of-bedrock groundwater recovery system
consists of 22 recovery wells, 17 of which penetrate three to five feet into
bedrock. Five of the wells pump only the overburden. The system was
designed to control off-site chemical migration in the overburden and
weathered top-of-bedrock zones and to reduce the source of chemicals which
could migrate vertically to deeper zones. The locations of the recovery wells
are shown on Plan 3.
The bedrock groundwater recovery program utilizes the two
Olin Buffalo Avenue Plant groundwater production wells. One well is
pumped at a time and the pumping rate is approximately 600 gpm. The wells
maintain a cone-of-depression in the upper and middle Lockport zones
extending throughout most of the western portion of the Du Pont Niagara
Plant. The eastern extent of the cone-of-depression is in the vicinity of Gill
Creek.
303-1897-4

7.4 FRONTIER CHEMICALS
Frontier Chemicals is in the process of initiating an interim
corrective measure (ICM). The ICM consists of installing and operating one
groundwater extraction well. The extraction well will be located on the south
boundary of the Plant and will pump water from the upper Lockport bedrock.
The intent of the extraction well is to create a 300-foot cone of depression
beneath the southern portion of the Plant.
The NYSDEC has indicated that the extraction system is
scheduled to come on-line in 1992.
7.5 OXYCHEM BUFFALO AVENUE PLANT
A groundwater remediation program is in the feasibility study
phase for the OxyChem Buffalo Avenue Plant. There are three components
to the program:
1) Overburden groundwater recovery;
2) Bedrock A-Well NAPL recovery; and
3) Bedrock groundwater recovery.
The overburden system is expected to consist of several draintile collection
systems installed at various locations throughout the Plant.
3034907-5

Bedrock A-Well NAPL recovery will involve pumping NAPL
from three existing wells installed in the lower Lockport bedrock. NAPL will
be recovered from these wells on a monthly basis. Operation of the NAPL
recovery system is planned to begin in 1992.
The bedrock groundwater system will consist of several
extraction wells installed to pump groundwater from the upper and middle
segments of the Lockport bedrock and from the upper portion of the lower
Lockport bedrock. Completion of the bedrock system will occur in phases.
The first phase will be a pilot system which will be developed into a final
system. Phase I is planned to begin operation in 1996 or 1997. The second
phase will be initiated following a performance evaluation of the Phase I»
system.
7.6 OXYCHEM DUREZ NIAGARA PLANT
A groundwater remediation program is in place at the OxyChem
Durez Niagara Plant. The program consists of three purge wells installed into
the upper Lockport bedrock in the southeast corner of the plant. One well
pumps water from the upper 15 feet of bedrock, the second from the upper
30 feet and the third from the 30 to 45-foot interval of bedrock.
The system has been in operation since February 1989 and the
three wells are pumped at a combined rate of 5 to 15 gpm. Semi-annual
7-6 303491

monitoring of the system has shown that the system has created a
cone-of-depression extending beneath most of the plant and that significant
reductions in site chemical concentrations in the bedrock groundwater have
occurred.
7.7 OXYCHEM HYDE PARK LANDFILL
OxyChem is currently operating and/or constructing the Hyde
Park Landfill's groundwater remediation program. There are three
components to the program:
1) On-Site Source Control Wells;
2) Overburden Draintile Collection System; and
3) Bedrock Purge Wells/Recirculation Wells.
The overburden is addressed by both source control wells which
have been installed into the landfill and two perforated draintile systems.
The source control wells are in operation. In 1978, a draintile which encircles
all four sides of the landfill was constructed on the landfill perimeter. A new
Overburden Draintile Collection System was constructed in 1989/90 and has
been in operation since the fall of 1990. The new draintile encircles three
sides of the landfill outside and deeper than the 1978 draintile system.
The main bedrock system will consist of purge and recirculation
wells installed in phases. Phase I (currently being tested) consists of two
7-7 303492

clusters of three extraction wells. Each duster has a well in the upper, middle
and lower Lockport bedrock units straddling all observed waterbearing zones
at each depth. The system has been designed to operate at a pumping rate up
to 40 gpm. The Phase I system is scheduled to begin operation in the summer
of 1992. The second phase will consist of two additional clusters of three
extraction wells. These wells will be installed following an evaluation of the
performance of the Phase I system. The Phase II system is scheduled to be
installed in the fall of 1992 and begin operations in the summer of 1993. The
third phase will consist of two clusters of three injection wells to flush Hyde
Park chemicals towards the extraction wells. Construction of the Phase III
system is scheduled to begin after the completion of a Phase II performance
evaluation.
7.8 OXYCHEM S-AREA LANDFILL
OxyChem is constructing the groundwater remediation program
for the S-Area landfill. The S-Area is located in the southeast corner of the
Buffalo Avenue Plant. There are four components to the program:
1) Overburden draintile collection system;
2) Overburden NAPL recovery wells; and
3) Bedrock purge wells for APL and NAPL recovery; and
4) Bedrock NAPL recovery wells.
7.8 303493

The overburden will be addressed by a draintile collection
system which will be installed in the landfill and a network of 23 NAPL
recovery wells within and south of the landfill. The well system is scheduled
to be completed in the summer and fall of 1993. The draintile installation
will commence during the following winter.
The bedrock system will consist .of NAPL recovery and APL
purge wells installed in three phases. Phase I (currently being installed)
consists of 16 wells in the upper 30 feet of the Lockport bedrock. Eight of the
wells will recover NAPL and will operate at a maximum pumping rate of
5 gpm. The remaining eight wells will recover APL and will operate at a
maximum pumping rate of up to 150 gpm. The Phase I system is scheduled
to be completed in the fall of 1992. The second phase will consist of additional
extraction wells based on the results of a performance evaluation of the
Phase I system. Phase II construction is scheduled for 1993. A third phase will
involve additional extraction wells in the middle and lower bedrock units,
based on the results of a supplemental investigation. Phase III is planned to
be installed concurrent with Phase II.
7.9 OLIN BUFFALO AVENUE PLANT
Olin is currently conducting a RCRA Facility Investigation (RFI)
at its Buffalo Avenue Plant. The RFI includes a groundwater investigation
and will assess the need for corrective action. The RFI is expected to be
completed in 1993.
30349*

As noted in Section 7.3, Olin currently operates cooling water
supply wells which also serve as a bedrock groundwater pumping and
treatment system under contract to the adjacent Du Pont Niagara Plant. The
cone-of-depression effected by the pumping well in the upper and middle
Lockport zones extends throughout most of the Olin Plant.
7.10 OLIN INDUSTRIAL WELDING
A remediation program to address the groundwater conditions
at the site is currently in the Feasibility Study phase.
7.11 SUMMARY
Groundwater remediation programs have been initiated at ten
sites within the RGA Study Area. The programs are either ongoing, under
construction or in the latter stages of planning/design. Nine of the ten sites
currently have or will have bedrock groundwater remedial systems in full or
partial operation by 1996. These remedial systems are located in all the areas
of major chemical presence as identified in Section 6.0.
The majority of identified chemical presence areas within the
Study Area are contained in the Upper Lockport bedrock. Migration of the
chemical plumes associated with these areas is expected to be controlled by the
7-10 303495

remedial programs at individual sites. This will minimize further chemical
migration into and through the bedrock groundwater. The comparatively
small mass of chemicals present in the bedrock groundwater beyond the
influence of these remediation programs is expected to eventually reach the
Niagara River primarily via the Falls Street Tunnel or discharge via the
NYPA Power Conduit drain system.
3034967-11

8.0 SUMMARY OF FINDINGS
This report was prepared and completed in accordance with the
Scope of Work document dated October 1990. The objectives of the RGA were
to evaluate groundwater chemistry within the Study Area based on existing
data and to identify gaps in the regional groundwater database. These
objectives were achieved by the compilation and assessment of available
existing data. The following is a summary of the major RGA observations.
A review of NYSDEC records showed that a total of 39 sites
suspected of having chemical presence are located within or immediately
adjacent to the RGA Study Area. Available information for each site was
obtained from the individual site owners, the NYSDEC and the USEPA. A•
total of 18 sites have bedrock groundwater data available. In addition, bedrock
groundwater data were available for thirteen USGS wells installed in the
study area in 1985.
Within the Niagara Falls area, groundwater occurs in two units,
the overburden and bedrock. Overburden groundwater flow, due to the
fine-grained nature of the overburden materials, the flat slope of the land
surface and the presence of underground utility networks, remains localized
and is not a regional network. The uppermost bedrock unit, the Lockport
Group, has been identified as the major aquifer in the Study Area. The
bedrock groups below the Lockport exhibit low transmissivity in comparison
to the Lockport Group bedrock and do not have the potential for significant
regional groundwater migration.
30349?8-1

The primary structures affecting groundwater flow in the
Lockport bedrock are the Niagara River and Gorge, the NYPA Power
Conduits and Forebay, the Falls Street Tunnel and NYPA Reservoir. The
Falls Street Tunnel and NYPA Power Conduits are the main collectors of
Lockport bedrock groundwater within the RGA Study Area. These collectors
have a significant influence on Lockport bedrock groundwater flow and, in
combination with the fractured nature of the Lockport bedrock, create
complex groundwater migration pathways.
Bedrock groundwater sampling and analyses had been
performed at 18 of the 39 Study Area sites. The data were reviewed and
compiled into a database that contained a listing of analytical parameters for
each bedrock monitoring well.
From the list of analytical parameters, chemicals with similar
chemical characteristics or associated with similar types of sources were
combined together to form 15 groups. These groups provide the means to
compare chemical presence from one site to another. The chemical groups
used in the RGA include: Total Chlorinated Volatile Aliphatic Compounds;
Benzene, Toluene, Ethylbenzene and Xylene; Acetone and 2-Butanone;
Phenol and Methylphenols; Chlorophenols; Chlorobenzenes and
Chlorotoluenes; Polyaromatic Hydrocarbons; Hexachloroethane,
H e x a c h l o r o b u t a d i e n e , H e x a c h l o r o c y c l o p e n t a d i e n e and
Octachlorocyclopentene; Phthalates; Pesticides and PCBs; Benzoic Acid;
N-Nitrosodiphenylamine; Lead; Mercury; and Barium.
3034988-2

The concentrations of chemicals in each of the groups were
plotted as isopleth concentration contours on a map of the Study Area to
assess the chemical distribution within the RGA Study Area.
The assessment of the data presented on the isopleth
concentration plans showed eleven areas of elevated bedrock groundwater
chemical presence within the Study Area. The eleven areas are associated
with the eleven sites presented below:
i) BFI/CECOS Landfill;
ii) Du Pont Necco Park Landfill;
iii) Du Pont Niagara Plant;
iv) Frontier Chemical;
v) OxyChem Buffalo Avenue Plant;
vi) OxyChem Durez Niagara Plant;
vii) OxyChem Hyde Park Landfill;
viii) OxyChem S-Area Landfill;
ix) Olin Buffalo Avenue Plant;
x) Olin Industrial Welding; and
xi) 3163 Buffalo Avenue Site (Solvent Chemical).
These eleven sites have had remedial investigations completed
and at eight of the eleven sites, remediation is in progress. There are an
additional seven sites that have bedrock groundwater quality data. These
sites either have lower chemical presence than the eleven sites or remedial
8-3 303499

investigations that are incomplete. The remaining sites have not conducted
bedrock remedial investigations and therefore bedrock groundwater chemical
presence at these sites could not be evaluated.
The plotted isoconcentration contour maps show that chemical
concentrations in groundwater are highest at or in the immediate vicinity of
the probable source areas. Concentrations are generally lower by 90 percent or
more within approximately 1000 feet of source areas. Where migration has
apparently occurred, the directions of transport have generally been
consistent with the known patterns of groundwater flow. Based on these
findings, additional data are not required for investigation of regional
transport.
Groundwater remediation programs have been initiated at eight
of the eleven sites exhibiting elevated chemical presence:
i) BFI/CECOS Landfill;
ii) Du Pont Necco Park Landfill;
iii) Du Pont Niagara Plant;
iv) Frontier Chemical;
v) OxyChem Buffalo Avenue Plant;
vi) OxyChem Durez Niagara Plant;
vii) OxyChem Hyde Park Landfill;
viii) OxyChem S-Area Landfill;
303500

These programs are either in operation, under construction or in
the latter stages of planning/design. Of the eight sites, all have or will have
Lockport bedrock groundwater remedial systems. The remaining three sites
are still in the process of being investigated to determine remedial
requirements.
The majority of the chemicals within the plumes associated with
the sites will be controlled by the on-site remedial programs at each site,
respectively. This will prevent further chemical migration into and through•
the regional groundwater formation in the Lockport. The remaining
chemical presence in the bedrock groundwater beyond the influence of these
remediation programs would eventually reach the Niagara River. The
NYPA Power Conduits and the FST are the main collectors of Lockport
groundwater and provide a pathway for chemicals in the groundwater to
reach the Niagara River. Most of the groundwater entering the FST is treated
at the NFWWTP prior to discharge to the Niagara River. Collection and
treatment of the groundwater entering the FST in combination with the
on-site remedial programs will substantially reduce the amount of chemicals
with potential to enter the Niagara River.
General Summary
Within the RGA Study Area, chemical presence has both a
localized and a regional component. The majority of chemical presence
within the Study area is a localized presence. Localized chemical presence is
generally attributable to a specific site and as such is being or will be
s-s 303501

remediated on an individual basis. The identified sites with elevated
chemical presence have currently initiated or will soon initiate groundwater
remediation programs and therefore the major areas of localized chemical
presence are being addressed.
The relatively smaller amount of regional chemical presence can
be attributed to off-site chemical migration from the localized areas. Within
the RGA Study Area, groundwater flow and the associated chemical
migration in the Lockport bedrock is intercepted by the FST and NYPA Power
Conduits, except for areas where groundwater remediation systems are in
operation. The FST captures groundwater from the upper Lockport bedrock
while the NYPA Power Conduits captures groundwater from the upper,
middle and lower Lockport bedrock. Some chemicals in the upper Lockport
bedrock are captured by the FST. Approximately 70% of the total dry weather
flow in the FST (which is primarily groundwater) is diverted to the
NFWWTP and treated. According to City personnel, all dry weather FST flow
will be diverted to the NFWWTP in 1993. Currently, all the dry weather FST
flow east of the NYPA Power Conduits is diverted to the NFWWTP and
treated. Therefore, the FST is operating as an effective upper Lockport
groundwater collector. The amount of groundwater and associated chemical
presence that is intercepted by the NYPA Power Conduits is unknown.
Groundwater intercepted by the Power Conduits is discharged to the Niagara
River via the Forebay Canal.
303502

REFERENCES
Fisher, D., W., and others, Geologic Map of New York State, Niagara Sheet,New York State Museum and Science Service, Map and Chart SeriesNumber 15, Albany, New York, 1970.
Fisher, D. W., Correlation of the Hadrynian, Cambrian and Ordovician Rocksin New York State, New York State Museum and Science Service, Mapand Chart Series Number 25, Albany, New York, 1977.
Gross, M. R., Engelder, T., "A Case for Neotectonic Joints Along the NiagaraEscarpment", Tectonics, Vol. 10, No. 3, Pages 631-641, June, 1991.
International Joint Commission, "Preservation and Enhancement of theAmerican Falls at Niagara, Apperidix C, Geology and Rock Mechanics",Niagara Falls, New York, American Falls International Board, 79 p.,1974.
Johnston, R.H., "Groundwater in Niagara Falls Area, New York withEmphasis on the Water-bearing Characteristics of the Bedrock", NewYork State Conservation Department Bulletin GW-53, 93 p., 1964.
Kappel, W.M., "Niagara Falls Area Anthropogenic Features - Sewers,Conduits and Other Bedrock Intrusions", Written Communication,November 1991.
Kilgour, W.J., Middle Silurian Clinton Relationships of Western New Yorkand Ontario, New York State Geological Association Guidebook, 38thAnnual Meeting, Buffalo, New York, 1966.
Koszalka, E.J., Paschal, J.E., Miller, T.S., and Duran, P.B., "PreliminaryEvaluation of Chemical Migration to Ground Water and the NiagaraRiver from Selected Waste-Disposal Sites", U.S. EnvironmentalProtection Agency, EPA-905/4-85-001, March 1985.
Liberty, B.A., Paleozoic Geology of the Bruce Peninsula Area, Ontario, Canada,Geological Survey Memoirs, Number 360, 1971.
Liberty, B.A., "Structural Geology". In Colossal Cataract; The Geologic Historyof Niagara Falls University of New York Press, Albany, New York,1981.
303503

Miller, T.S. and Kappel, W.M., "Effect of Niagara Power Plant Project onGroundwater Flow in the Upper Part of the Lockport Dolomite,Niagara Falls Area, New York", U.S. Geological Survey WaterResources Investigations, Report 86-4130, 31 p., 1987.
Muller, E.H., Quaternary Geology of New York, Niagara Street, New YorkState Museum and Science Service, Map and Chart Series Number 28,Albany, New York, 1977.
Novakowski, K.S. and Lapcevic P.A., "Regional Hydrogeology of the Silurianand Ordovician Sedimentary Rock Underlying Niagara Falls, Ontario,Canada", Journal of Hydrology, 1989.
O'Brian and Gere Engineers, Gradient Corporation, GeoTrans Inc., "Phase IFalls Street Tunnel Study", City of Niagara Falls, New York,October 1987.
Rickard, L.V., Correlation Chart of the Devonian Rock in New York State,New York State Geological Survey, Map and Chart Series Number 4,1964.
Rickard, L.V., Correlation Chart of the Silurian and Devonian Rock in NewYork State, New York State Geological Survey, Map and Chart SeriesNumber 24, Albany, New York, 1975.
Roll, R.R., City of Niagara Falls Wastewater Treatment Plant, PersonalCommunication, February 1992.
Sandford, B.V., Thompson, F.J., and McFall, G.H., "Plate Tectonics - a possiblecontrolling mechanism in the development of hydrocarbon traps insouthwest Ontario", Bulletin of Canadian Petroleum Geology,Volume 33, No. 1, 1985.
Tepper, D. H., Goodman, W. M., Gross, M. R., Kappel, W. M., and Yager, R.M.,"Stratigraphy, Structural Geology, and Hydrogeology of the LockportGroup: Niagara Falls Area, New York", in Lash, G. G., ed., New YorkState Geological Association 62nd annual meeting September 1990Field trip guidebook: Western New York and Ontario: New York,Fredonia State University College, p.Sun. B1-B25, 1990.
Yager, R.M. and Kappel, W.M. "Characterization of Fractures in the LockportDolomite, Niagara County, New York", In Proc. Third GroundwaterTechnology Conference, September 1987, City University of New York,New York, 1987.
R-2 303504

Zenger, D.H., "Stratigraphy of the Lockport Formation (Middle Silurian) inNew York State", New York State Museum and Science Service,Bulletin Number 404, 1965.
303505R-3

••9] MCEMT AUUVUU -^ ' M.T,Mm,aiuvciEgjSggj ueunniNe __....""" sitT.s»w.«» curt;XvXj auciw. DBwrra -
GmiMD MOMINtS, CNO MORAMCS,KC-CONTJKT DCMSm. OUTWASH U.T,CUT, UNO. MMEL, OUCI»L TILL
^^^ KOMCX
AOAPTEO FMM HULUM (WTT)
figure 3.1SURFICIAL GEOLOGY
Niagara Falls Regional Groundwatw Assessment
COOCOenoO)
4e390)-IMIt.1B/»2-KCV.O

;»rn ONGNDACA' UHESTONE
SAUNA OMWPfigure 3.2
BEDROCK GEOLOGYNiagara falls Regional Groundwater Assessment
^3 OUBWS1WE LAKE • ERIE
COow01CRA/WCC46310 )-MAR.18/»2-f*CV.O
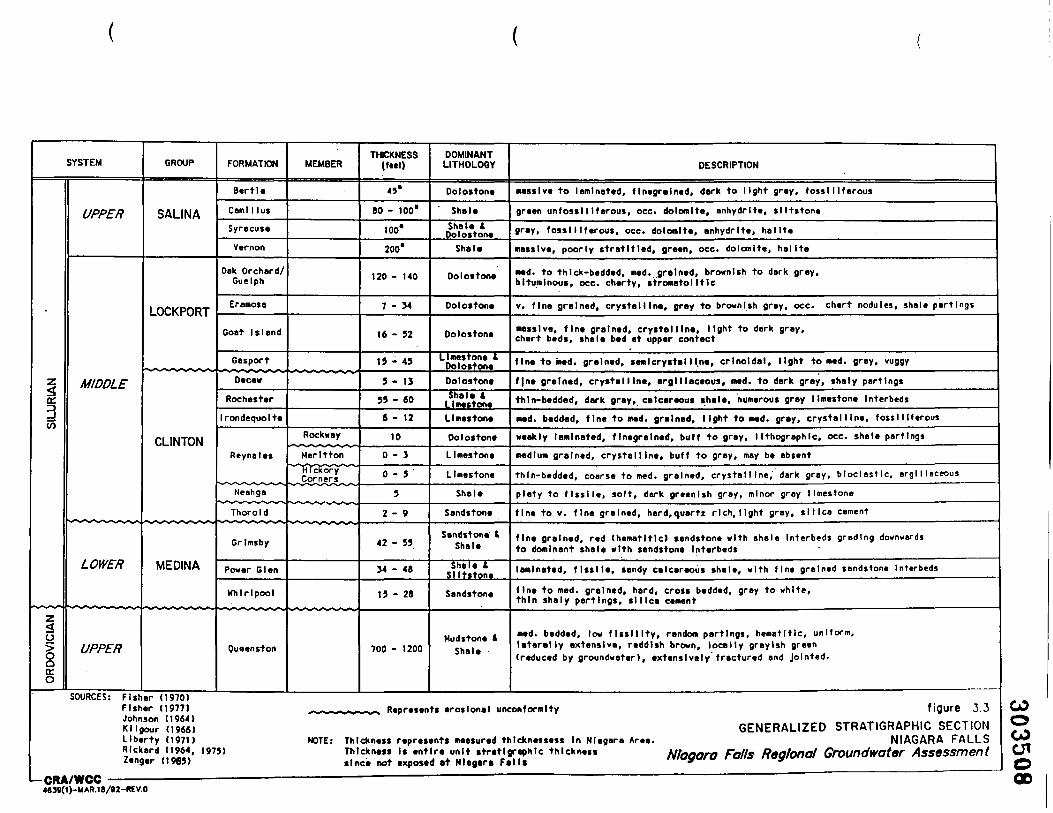
101
0 *> r^ |! i s b
IM» r-
^c.
Sn
5:r
£<S
S'^
?S-'o.^
Ii
s *«
« «-*
rSi
«o *«J VJI
1 ]
^•
-1 -
4
'=•
2:2:
n o
o '
• T
J •
888
J
SOURCES:
-n -n
w
wy y
1*
*o «
o•«J
*J
-^ o
™*
**
i* "jo
* --
. -S
x « a
T>
-oo
a T
1 » •%
a^
S
S°-
-S
3""1
S
Szi
J
0
1:1
§•3?
i -
_ ^
c
•?,,
? 3
i« 5
7 3 08 w
-*• a
3*
*—
W
?3
8 z
" i7 IO a T a ? a a
^ 8
a««
m
5>
m4
>1^
-Q
N
5.
m o§ i
s§
3)
* 3
Q
0-»
•_ 3
J^
->
^ >
-o
IkO
T I
K) >
o(A 3
) °
JJ ^
W
"IA
-r, rn
55
i o
3 >
H
3r
—(-
O•
.M
"Z.
s ? a -4- < 5" c e» LA OJ
OR
DO
VIC
IAN
j
SILU
RIA
N
1 -O C A A J£ i § 1 Kl
O O sf
3*
M
.-i f
l» s=
?*^
i"*
8 *
« i-
?3
23 i *
rs =
~ • »
^ 2
=-llty, random partings
tddlsh brown, locally), extensively fractu n.i a
s*•5
-^?
» :•
« =• =
tt
3_
? 3 *
r* ^ J H>
! % m o
] z >
Whirlpool \j» i M OB I/I a 3 Ok $ g a •+
-»*
— 3
3 a £? h(
X•o
•S
o±3 nw Ck i» —
a— i
n c
ka • 2S IS -? I ^
•o 2 T Cl a 3 Z 1 J> O>
i!« — 3
"-*
a5i"
§».
1 1 ami net a Ok -* M W a w a 3idy calcareous shale. •t -+• 3" 3 a •o T a 3 A GX M a 3 o. M 0 3 a 3 ? V s. M
0 IT 3- x * M 1 \M _\M
Sandstone' tShat* s? i; 3 a 5
3 •»a W "
13 a Q
k
i? -f a'!
itltlc) sandstone withsandstone Interbeds
«
I h i r-
P
'' S
. 1 z
Thorold |
if £ (0 a
1 < (
Kl t O Sandstone .* 3 a -* o < 3 a IO T a 3 a Ok
3- a -> Ok i N T n 3"
*O 3"
-+•
ID n a -< w o a o a 3 A 3 -»•
m trt 3- a a T
» a -»• «< *4> O IA IA •T (A O -+• , dark greenish gray, 3 1 to T 9 -< I M O 3 a
Reynates
DxC
Zo
— /
a"* Q
J n
3 X
T
— •
<• o)
•*
i n
\ •*
<•*
</
O(
0 i Ul Limestone -> 3
-
3 Or a Ck_ a. a Ok
* o o a -i VI a -+• o i Ok •S a 3 a Ok o T *< M -+•
a 3 a Q.
0 T 7C ID -l a •< ^ o* o 0 VI -»• n o i (O B r> 8 C wt
O 1 W Limestone medium U T a 3 a Ok
0 T •< W -f a 3* a V c -*• O ID T a -< | tr 1 absent
3j o X a X o Doloston* c 1 ^ a £ 3" a -+• a Ok •* 3 a • a s * o* c •+ 0 ID T a •< -+ ftographlc • 8 n w 3" a a* T» O n •+• 3 to w
Irondequolta o* i ^ Limestone 0.
V a | Ok
« I -t o I a. •3 5" it a. f •*> O I ex 1 5 q -< a a £ 3 « g (A ™ a -i
Rochester | U»
Ul 1 OX o f! thin- be Ok s- Ok
Ok a n yr ID T a << calcareous shale, nu 3 a I w ID 1 a •< i" a M -+ 0 3 -f A -» W a B*
j?
i /^
: S
> 3) H
Gasport
Ul 1 _• w Dolostone 3 a ID T a 3* a Ok
* o n * a ~ ne, argillaceous, med P» s- ye ID 1 a -< .
* w 3* a •T TO a -» -* 3 IO w
W i A Ul Llmeston* t 1
Doloston* 1 •* 3 • ? J a •? « S * w•wlcrystel ll.ne. crlno Ok a f -+. O i Ob ID 1 a •< < e to 5
o o a •+• w a 3 a » 1 vn N Dolostone S-3 u r^ O
k w -
*
?s i • a ?3* •
cxo.
a
crystalline, light toit upper contact
Ok a T 3T •S a -<
Eramosa •u i x Dolostone < 3 a m T a | (1 T *< W -+ a J ID T ? O* i 'w 3* S a -< 8 O n 3- a i -* 1 c A M " M IT 0 a •w o
•-i 3 IO V
I
Oak Orchard/Guelph KJ o i * o Dolostone s:
i-*
• O
k.c
•
3*
O
J*
gS
- h ji a o. n • 2*ted. grained, brownish
-. stromatolltlc
-f o a. a -i 3T ID n 5 *
I -t) o> *» Z f
Vernon M §•
(/> 3"
0 a" 3 M M <" a T3 | •< n -f •n l ™ i" Qk
V ID 9 R n o. o I -»• a 3" a_ •+ a
Syracuse o o • Shale & 1Dolostone 1 «o T a c s M ? i M 8 n fr [ -f ^a a 3 3
*-< ^ -f a 3- a -*• a
0 a 3 C w 0* o 1 o 0 * l/» 3*
V a" «O ~\ a c 3 o* M W -*. 3 C W 8 9 i -f _a a 3 3*
•< OkI -f 9 Slltstoni •
(9 •* a* A m * Dolostone 1 massive •+ o 1 3 a -* a Ok ^^ 3 | 3 a Ok
0.
JT -».
O IO 3*
H-
•o T a -< 0 w w E a n §
SYSTEM a 3) i FORMATION X CD S •
"sH
? X
••* n
i u> DOMINANTLITHOLOOY DESCRIPTI o
80SC
OC

78* 58' 30'
FALLS STREETTUNNEL
4000 8000ft
110 • SCALE: T - 8000*
LEGEND/ ZONE OF HIGH TRANSMISSMTY
// IDENTIFIED BY JOHNSON (1964) -
, DASHED WHERE EXTRAPOLATED IN/ THIS STUDY
100 PRODUCTION WELL - NUMBER IS• WELL YIELD. IN GALLONS PER
MINUTE
NIAGARA EXCARPMENT
NIAGARA GORGE
___ CONTACT BETWEEN GEOLOGICFORMATION OR GROUP
S» SILURIAN SAUNA GROUPSI SILURIAN LOCKPORT GROUPSmc SILURIAN MEDINA AND CLINTON GROUPSOq ORDOVldAN QUEENSTON FORMATION
SOURCE: R.M. YAGER AND W.M. KAPPEL, "DETECTIONAND CHARACTERIZATION OF FRACTURES ANDTHEIR RELATION TO GROUNDWATER MOVEMENT IN THELOCKPORT DOLOMITE. NIAGARA COUNTY. NEW YORK"
figure 3.4LOCKPORT DOLOMITE PRODUCTION
WELLS YIELDING MORE THAN 50 G.P.M.Niagara Falls Regional Groundwater Assessment
- CRA/WCC4639(1 )-M AR.18/92-REV.O

303510
550 — — POTBJTIOMETRIC CONTOUR-- shows measuredwater level m wells m ujipcr part of LockoortDolomite. March 26-27. 1985. Contour interval
\ 10 feet. Datum in NGVD of 1929. Arrows snow. direction of ground-uatcr flow
.* ( o53"58 WSX AND V.ELL NUMBER--m which water-levelVc measured duruuj March 26-27. 1985
\\ • . • • GHOUND-WATER DIVIDE
CONDUITINTAKES
SOURCE: MODIFIED FROM PLATE 1A.MILLER AND KAPPEL, 1987
I— CRA/WCC
figure 3.5POTENT1OMETRIC SURFACE CONTOURS
OF GROUNDWATER IN THE UPPER LOCKPORTDOLOMITE MEASURED ON MARCH 24-25, 1985
Niagara Falls Regional Groundwater Assessment
46390)-MAR.18/92--REV.O

303511
Explanation
_T___Potentiometric Contour - ibow*niMMtdwitertevclmuppeipmofLocfcponDolomitt.Oa30-Nov2.1989. Contourinterval is 10 feet (solid line), mdSfoot(dotAtasb). Datum in NOVD of 1929. Arrowssnow direction of ground-wiier flow.
• Well - in which water-level was measuredduring October 30-November 3,1989.
57 580590
SOURCE: USGS LETTER. W. KAPPELfigure 3.6
POTENTIOMETRIC SURFACE CONTOURSOF GROUNDWATER IN THE UPPER LOCKPORT
DOLOMITE MEASURED ON OCT. 30-NOV. 3, 1989Niagara Falls Regional Groundwater Assessment
— CRA/WCC4639(1 )-M AR.18/92-REV.O

303512
Explanation
___ T __ _ PotaniomeuicCotUour-«faowimeasured waw t«v«l in upp*r put of Lockport Dotormtt.March 27-29. 1990. Contour inufval i* 10 tot (*oMUna), mapi 555 foot contour (dotfdasn). Datum inNGVOof1929. AnowctnowdraOionofgreund-wUBrflow.
• Wal- in which waMr-tovd wu measured duringMuch 27-29. 1990.
690
SOURCE: USGS LETTER. W. KAPPEL
«—CRA/WCC
figure 3.7POTENTIOMETRIC SURFACE CONTOURS
OF GROUNDWATER IN THE UPPER LOCKPORTDOLOMITE MEASURED ON MARCH 27-29. 1990
Niagara Falls Regional Groundwater Assessment
4639(1 )-MAR.18/92-REV.O

303513
Explanation
___ T____ Potentiofnetric Contour - ffaowtnwasurad wsttr tov«l in uppw put of Lockport Momta,Jun« 26-27.1080. Contour intwval to 10 teM (soWbw).MMptS55 loot contour (dotfdatft). OaluminNGVOof1929. Arrows show dnction of greund-wiiirflow.
Wel • in which «MMr-toM< «MM nwawrad duringJUIM 26-27.1990.
SOURCE: USGS LETTER. W. KAPPEL figure 3.8POTENT10METRIC SURFACE CONTOURS
OF GROUNDWATER IN THE UPPER LOCKPORTDOLOMITE MEASURED ON JUNE 26-27, 1990
Niagara Falls Regional Groundwater Assessment— CRA/WCC
4639(1)-MAR.18/92-REV.O

\ NIAGARA FALLS/NEW YORK\
NYPA WATERINTAKES
HORSESHOE FALLS\
INTERNATIONALCONTROL STRUCTURE
ONTARIO HYDROWATER INTAKES
figure 4.1FACTORS AFFECTING NIAGARA RIVER WATER LEVELS
Niagara Falls Regional Groundwater AssessmentCRA/WCC4639(1 )-MAR.18/92-REV.O

RO
SS S
ECTI
ON
AVEL
CR
OS
S S
ECTI
ON
2
BUA
VEL° C
RO
SS
SE
CTI
ON
1
ALT
ITU
DE
IN
F
EE
T A
BO
VE
SE
A L
EV
EL

600
575
Ill
ifcUl
52S
gsoo
475
4SO
425 L-
6 TOPSOIL.3 OVERBURDEN UNCLASSIFIED FILL
VERTICAL WEEP HOLESAT Id CENTRES ALONG ROCK FACE _——§DRAIN TO MAIN COLLECTOR DRAINS »
SUP JOINT
MAIN COLLECTORDRAINS CONDUIT CROSS SECTION
N.T.S.
NOTE.-CONDUIT IS TWINNED-STRUCTURE DEWATERING PROTECTION CONSISTS OF
VERTICAL WEEP HOLES ALONG LENGTH OF CONDUIT AT K> CENTERS.
ILLUSTRATION SOURCE'. COPIED FROM N.Y.P.A. DRAWINGS.
CRA/WCC
4.3CROSS-SECTION 1
N.Y.P.A. CONDUITS AT BUFFALO AVENUENiagara Falls Regional Groundwater Assessment
COoCOenO)4639(1)-MAR.18/92-REV.O

600
575
JJJSSO
oCO
fcin
525
500
475
450
425ROCHESTER FORMATION
CONDUIT CROSS SECTIONN.T.S.
NOTE:-CONDUIT is TWINNED-STRUCTURE OEWATERtNO PROTECTION CONSISTS OF
VERTICAL WEEP HOLES ALONG LENGTH OF CONDUITILLUSTRATION SOURCE: COPIED FROM N.Y.P.A. DRAWINGS.
CRA/WCC
figure 4.4CROSS-SECTION 2
N.Y.P.A. CONDUITS AT FALLS STREET TUNNNELNiagara Falls Regional Groundwater Assessment
4639(1)-MAR.18/92-REV.O

600
575
550UJ
ItUl
525
O 500
475
450
425 L-
WELL 84-9WELL OW-152
VERTICAL WEEP HOLESAT Id CENTRES ALONO ROCK FACEDRAIN TO MAIN COLLECTOR DRAINS
LOCKPORT DOLOMITE
SUP JOWT
MAIN COLLECTORDRAINS CONDUIT CROSS SECTION
N.T.S.
NOTE:-CONDUIT is TWINNED-STRUCTURE DEWATERIN6 PROTECTION CONSISTS OF
VERTICAL WEEP HOLES ALONG LENGTH OF CONDUIT AT K>' CENTERS
ILLUSTRATION SOURCE! COPIED FROM N.Y.P.A. DRAWINGS.
CRA/WCC
figure 4.5CROSS-SECTION 3
N.Y.P.A. CONDUITS AT PORTER AVE.Niagara Falls Regional Groundwater Assessment
COoCO
GO4639(1 )-M AR.18/92-REV.O

48"00xyChem SEWEROUTFALL 001
48 00xyChem SEWEROUTFALL 005
84 * UNION CARBIDECORPORATION OUTFALL10"* SEWER—H
INTAKE N»2 INTAKE N« I
PROFILETOP OF WALL - 570.5WtST RIVER WALL
INTAKE Nft I (700)INTAKE N«2 (700 )
OUTFALLSTRUCTURE I -?-
TOP OF WALL ELEV. 570.SO
NORMAL WATER SURFACE ELEV. 563.00"
ALUM. RAILINGFINISH GRADE ELEV. 570.0'
TYPICAL SECTIONEXISTINOJBRAOE
ROCK SURFACE
CRA/WCC
XELEV. VARIES FROM/ 512.84' TO 488.0
figure 4.6PLAN, PROFILE S TYPICAL SECTION
N.Y.P.A. INTAKE STRUCTURESNiagara Falls Regional Groundwater Assessment
4639(1)-MAR.18/92-REV. 1
CO

IQQ-.I SLOPE ^
E X C A V A T E DTO 543.0
'"e
0' 100' 200'
CRA/WCC
figure 4.7RIVER BED CHANNELIZATION AND
TRAINING DYKENiagara Falls Regional Groundwater Assessment
COoCO0110
4639(1 )-MAR.18/92-REV.O

800ft
CRA/WCC
figure 7.1C ZONE POTENT10METRIC SURFACE
DURING EXTRACTION WELL OPERAT10N-DUPONT NECCO PARK
Niagara Falls Regional Groundwater Assessment4639(1 )-MAY20/92-REV.O

TABLE 2.1
IDENTIFIED SITESNIAGARA FALLS REGIONAL GROUNDWATER ASSESSMENT
Site Name
Adams Generating PlantApollo Steel CorporationBasic CarbonBFI/CECOS International IncorporatedCarbon/Graphite Group IncorporatedCarborundum Building 82Carborundum Globar PlantCascades - Niagara Falls IncorporatedChisholm RyderCity of Niagara Falls Buffalo Avenue SiteDibacco Site #2Du Pont Necco Park LandfillDu Pont Niagara PlantForest Glenn SubdivisionFrontier Chemical Waste ProcessFrontier FoundriesGoodyear Tire and Rubber CompanyGreat Lakes CarbonHydraulic CanalNational Fuel Gas DistributionNew Road Landfill SiteNiagara Co-Generation SiteOccidental Chemical Corporation - Buffalo Avenue PlantOccidental Chemical Corporation - Durez Niagara PlantOccidental Chemical Corporation - Hyde Park LandfillOlin - Buffalo Avenue PlantOlin - Industrial Welding SitePyron Metal CorporationRobert Moses ParkwaySilbergeld Junkyard SiteSKW Alloys and Airco Carbon LandfillsSolvent Chemical (3163 Buffalo Avenue Site)TAM CeramicsTown of Niagara LandfillUnion Carbide - Carbon Products Division Republic PlantUnion Carbide - Linde DivisionWhirlpool Site - City of Niagara FallsWitmer Road Site64th Street South Site
Site Identification
Former Disposal or Fill AreaOperating Industrial FacilityFormer Disposal or Fill AreaOperating LandfillOperative Industrial FacilityFormer Industrial FacilityOperating Industrial FacilityFormer Industrial FacilityClosed LandfillFormer Disposal or Fill AreaFormer Disposal or Fill AreaClosed LandfillOperating Industrial FacilityFormer Disposal or Fill AreaOperating Industrial FacilityOperating Industrial FacilityOperating Industrial FacilityOperating Industrial FacilityFormer Disposal or Fill AreaOperating Industrial FacilityClosed LandfillFormer Disposal or Fill AreaOperating Industrial FacilityOperating Industrial FacilityCosed LandfillOperational Industrial FacilityFormer Disposal or Fill AreaOperational Industrial FacilityFormer Disposal or Fill AreaFormer Disposal or Fill AreaCosed LandfillFormer Industrial FacilityOperating Industrial FacilityClosed LandfillOperational Industrial FacilityOperational Industrial FacilityFormer Disposal or Fill AreaFormer Disposal or Rll AreaFormer Disposal or Fill Area
30352!

TABLE 2.2
SITES WITH BEDROCK GROUNDWATER DATANIAGARA FALLS REGIONAL GROUNDWATER ASSESSMENT
BFI/CECOS InternationalChisholm RyderCity of Niagara Falls Buffalo Avenue SiteDu Pont Necco Park LandfillDu Pont Niagara PlantFrontier Chemical Waste ProcessHydraulic CanalNew Road Landfill SiteNiagara Co-Generation SiteOccidental Chemical Corporation - Buffalo Avenue PlantOccidental Chemical Corporation - Durez Niagara PlantOccidental Chemical Corporation - Hyde Park LandfillOlin - Buffalo Avenue PlantOlin - Industrial Welding SiteSolvent Chemical (3163 Buffalo Avenue Site)Union Carbide - Carbon Products Division Republic Plant64th Street South Site
303523

TABLE 3.1
CLIMATE DATA FORBUFFALO, NEW YORK
(1936-1988)
Month
JanuaryFebruaryMarchAprilMayJuneJulyAugustSeptemberOctoberNovemberDecember
MeanDaily MaxTemp (°F)
31 .431.439.651.663.272.478.176.870.559.146.235.3
MeanDaily MinTemp (°F)
18.517.625.235.346.257.062.661.054.544.233.823.7
MeanMonthlyTemp (°F)
25.024.532.443.454.864.770.468.962.651.740.029.5
MeanMonthly
Precipitation(inches)
3.072.702.752.692.882.812.913.172.993.053.273.21
Annual 54.61 40.01 47.31 35.502
Notes:1 Mean Annual2 Total Annual
903524

TABLE 4.1
FACTORS AFFECTING GROUNDWATER FLOWNIAGARA FALLS REGIONAL GROUNDWATER ASSESSMENT
Niagara River and GorgeNYPA Conduits and Forebay
Falls Street TunnelNYPA Reservoir
Underground Tunnels and SewersGroundwater Production and Extraction Wells
Bedrock GroutingNYPA Intake Wall
Hydraulic CanalLandails
Building and Structure Foundations
Note:
Each item is placed in descending order, based on the degree to which each itemaffects regional groundwater flow (i.e. the Niagara River and Gorge affect regionalground water flow the most).
303S2S

TABLE 4^
CHIPPAWA-GRASS ISLAND POOLWATER ELEVATION RESTRICTIONS
Minimum Pool Elevation
Maximum Pool Elevation
Maximum Pool Elevation* Special Conditions
Minimum Pool Elevations•* Special Conditions
InternationalGreat Lakes
Datum
5595
5625
563.0
559.0
United StatesGeodetic Survey
Datum
557.7
560.7
561.2
557.2
Notes:
* Water levels in the range of 5625 to 563.0 (IGLD) are allowable only after four consecutivehours of flow off Lake Erie in excess of 270,000 cfs. Water must be restored to a level below562.5 within twelve hours.
** Water levels in the range of 559.0 to 5595 (IGLD) are allowable only after four consecutivehours of flow off Lake Erie less than 150,000 cfs.
The maximum allowable daily change in the river stage is 15 feet as measured on the hour.
303526

TABLE 4.3
GROUNDWATER PRODUCTION/EXTRACTION WELL SUMMARYNIAGARA FALLS REGIONAL GROUNDWATER ASSESSMENT
Location Well Type Number of Wells Bedrock Monitored
Olin Chemicals Production Lockport
Du Pont Chemicals
Niagara Plant
- Necco Park Landfill
Extraction
Extraction
175
LockportOverburden
Lockport
Occidental Chemical Corporation
Durez Niagara Plant
- Hyde Park Landfill *
- S-Area Landfill •
BFI/CECOS Landfill"
Extraction
Extraction
Extraction
Extraction
3
6
16
812
Lockport
Lockport
Lockport
LockportOverburden
Note:
These wells are currently being installed or tested.Only ten of these wells are pumped during winter months.
303527
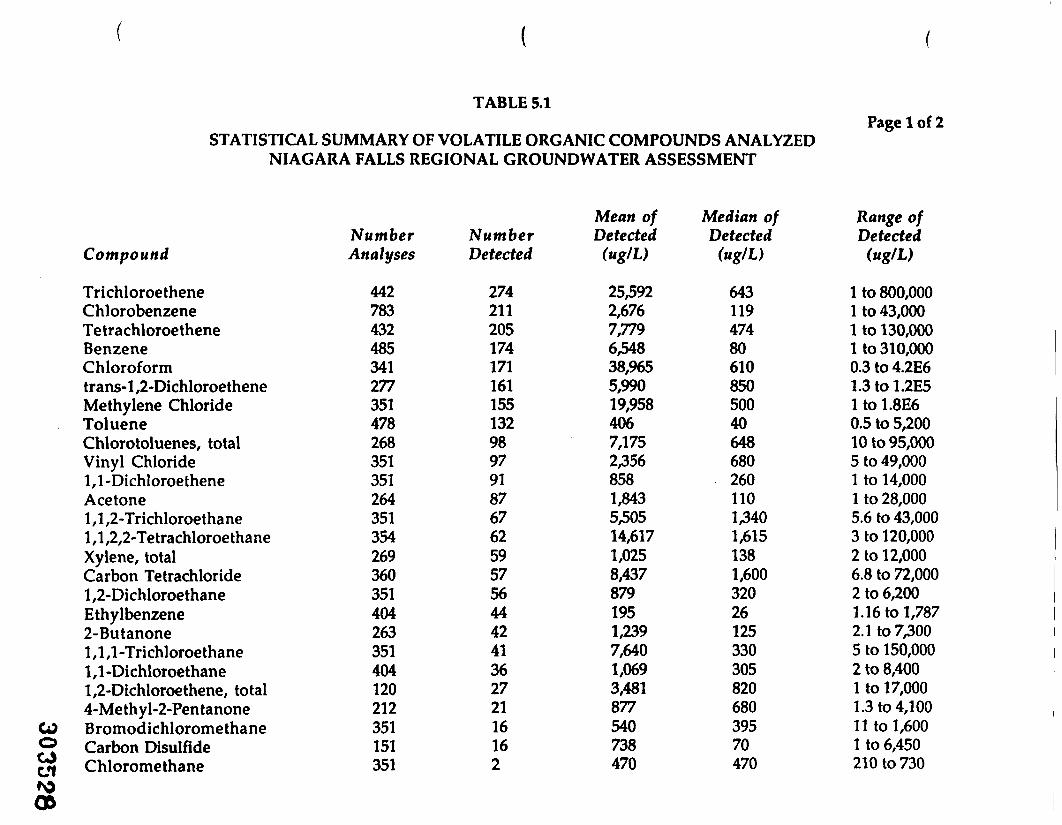
TABLE 5.1
STATISTICAL SUMMARY OF VOLATILE ORGANIC COMPOUNDS ANALYZEDNIAGARA FALLS REGIONAL GROUNDWATER ASSESSMENT
Page 1 of 2
COoCJ
Compound
TrichloroetheneChlorobenzeneTetrachloroetheneBenzeneChloroformtrans-l,2-DichloroetheneMethylene ChlorideTolueneChlorotoluenes, totalVinyl Chloride1,1-DichloroetheneAcetone1,1,2-Trichloroethane1,1,2,2-TetrachloroethaneXylene, totalCarbon Tetrachloride1,2-DichloroethaneEthylbenzene2-Butanone1,1,1 -Trichloroethane1,1 -Dichloroethane1,2-Dichloroethene, total4-Methyl-2-PentanoneBromodichloromethaneCarbon DisulfideChloromethane
NumberAnalyses
442783432485341277351478268351351264351354269360351404263351404120212351151351
NumberDetected
27421120517417116115513298979187676259575644424136272116162
Mean ofDetected
(ug/L)
Median ofDetected
(ug/L)
25,5922,6767,7796,54838,9655,99019,9584067,1752,3568581,8435,50514,6171,0258,4378791951,2397,6401,0693,481877540738470
64311947480610850500406486802601101,3401,6151381,6003202612533030582068039570470
Range ofDetected
(ug/L)
1 to 800,0001 to 43,0001 to 130,0001 to 310,0000.3 to 4.2E61.3 to 1.2E51 to 1.8E60.5 to 5,20010 to 95,0005 to 49,0001 to 14,0001 to 28,0005.6 to 43,0003 to 120,0002 to 12,0006.8 to 72,0002 to 6,2001.16 to 1,7872.1 to 7,3005 to 150,0002 to 8,4001 to 17,0001.3 to 4,10011 to 1,6001 to 6,450210 to 730

oCJen
TABLE 5.1
STATISTICAL SUMMARY OF VOLATILE ORGANIC COMPOUNDS ANALYZEDNIAGARA FALLS REGIONAL GROUNDWATER ASSESSMENT
Page 2 of 2
Compound
Trichlorofluoromethanecis-1,2-DichloroetheneVinyl AcetateChloroethaneBromomethane1,2-Dichloropropanecis-l,3-DichloropropeneDibromochloromethanetrans-l,3-DichloropropeneBromoform2-HexanoneStyreneAcroleinAcrylonitrile2-Chloroethyl Vinyl Ether1,3-Dichloropropene, totalBis(Chloromethyl)EtherDichlorodifluoromethane
NumberAnalyses
168161513513363512343362833361691491991992781224848
NumberDetected
221100000000000000
Mean ofDetected
(ug/L)
9.051488865
Median ofDetected
(ug/L)
9.0514
Range ofDetected
(ug/L)
4 to 13.927 to 1,000
65
CO

TABLE 5.2
STATISTICAL SUMMARY OF SEMIVOLATILE COMPOUNDS ANALYZEDNIAGARA FALLS REGIONAL GROUNDWATER ASSESSMENT
Page 1 of 5
CJOCJC/lc*
Number NumberCompound Analyses Detected
Phenol 558 186Hexachlorobutadiene 469 1071,2,4-Trichlorobenzene 437 1061.2-Dichlorobenzene 422 88Trichlorobenzenes, total 304 851.3-Dichlorobenzene 403 851.4-Dichlorobenzene 422 84Tetrachlorobenzenes, total 302 85Hexachloroethane 282 59Bis(2-Ethylhexyl)Phthalate 301 562-Chlorotoluene 78 534-Chlorobenzotrifluoride 78 49Monochlorobenzotrifluoride 220 404-Chlorotoluene 78 37Hexachlorobenzene 478 362,4/2,5-Dichlorotoluene 78 332,4,6-Trichlorophenol 305 32Dichlorobenzenes, total 77 302,4-Dichlorobenzotrifluoride 78 28Hexachlorocyclopentadiene 573 282,3/3,4-Dichlorotoluene 78 271,2,3-Trichlorotoluene 78 27Trichlorophenols, total 213 242,6-Dichlorotoluene 78 231,2,3,4-Tetrachlorobenzene 78 22
Mean ofDetected
(ug/L)
Median ofDetected
(ug/L)
Range ofDetected
(ug/L)
44,5066161,5032,2181,0944971,6523341731153,321170381559779043210,54356933726432511145
4602336328818404026.518100983.59515301023,60052192697413
3 to 4.2E60.9 to 33,0000.2 to 47,0001 to 120,0004 to 61,0001 to 20,0001 to 75,0001 to 6,9202 to 1,7003.2 to 1,9001 to 42,0001 to 4,60011 to 3,7001 to 3,9000.1 to 8301 to 1,1003.1 to 3,4004 to 41, 0001 to 3701 to 1,1001 to 3601 to 2,00015 to 1,5001 to 661 to 1,900

TABLE 5.2
STATISTICAL SUMMARY OF SEMIVOLATILE COMPOUNDS ANALYZEDNIAGARA FALLS REGIONAL GROUNDWATER ASSESSMENT
Page 2 of 5
COOCOenCO
Number NumberCompound Analyses Detected
2,4-Dimethylphenol 297 21Pentachlorophenol 306 201,2,4,5-Tetrachlorobenzene 78 202,4-Dichlorophenol 297 172-Chlorobenzotrifluoride 78 172,4,5-Trichlorotoluene 78 164-Methylphenol 162 14Chlorobenzoic Acids, total 169 14Naphthalene 297 14N-Nitrosodiphenylamine 297 132,3,6-Trichlorotoluene 78 133,4-Dichlorobenzotrifluoride 78 12Octachlorocyclopentene 178 122,4,5-Trichlorophenol 223 11Benzoic Acid 226 112-Methylphenol 163 92-Chlorophenol 297 74-Chloroaniline 152 5Aniline 61 5Dichlorotoluenes, total 11 5Di-n-Butylphthalate 293 5Fluoranthene 297 54-Chlorobenzoic Acid 78 5Benzyl Alcohol 161 4Butylbenzylphthalate 297 4
Mean ofDetected
(ug/L)
Median ofDetected
(ug/L)
Range ofDetected
(ug/L)
353,44547359111152738.616.3735168302423715022.438.8638229.24987138
134007.51436.543.53.35.05.42415.511825028.61522.85.882182.92004541
3.6 to 1603 to 25,0001 to 5203.7 to 1501 to 731 to 3611 to 6100.5 to 1,5001.6 to 312.1 to 1301 to 341 to 2001 to 81013 to 134013.5 to 2,20010.9 to 4003.7 to 27016.4 to 264.2 to 15022 to 2,6908.6 to 432.3 to 35110 to 1,50013 to 1807.8 to 61

TABLE 5.2
STATISTICAL SUMMARY OF SEMIVOLATILE COMPOUNDS ANALYZEDNIAGARA FALLS REGIONAL GROUNDWATER ASSESSMENT
Page 3 of 5
COOCOenCO
Compound
2-Chlorobenzoic AcidFluoreneChrysene3,4-DichlorophenolChlorendic Acid2,3,6-TrichlorophenolDi-n-Octyl PhthalatePyreneNitrobenzenePyridineAcenaphthenePhenanthreneBenzeneacetic AcidBenzo(a) AnthraceneAnthracene2-Chloronaphthalene2,3,4,5-Tetrachlorophenol3-Chloropheriol4,6-Dinitro-o-CresolBenzo(b)FluorantheneBenzo(a)PyreneIndenod ,2,3-cd)PyreneDibenz(a,h) AnthraceneBenzo(g,h,i)PeryleneBis(2-Chloroethyl)Ether
NumberAnalyses
782972921878183012973062229729792972972971818187281281281281296297
NumberDetected
4333322222222111111111110
Mean ofDetected
(ug/L)
3302.9461236201371013.16.5367.59.355.5302.936222441198.7107.76
Median ofDetected
(ug/L)
2352.643263501371013.16.5367.59.355.5302.936222441198.7107.76
Range ofDetected
(ug/L)
200 to 6502.3 to 3.737 to 5813 to 330310 to 1,20013 to 2607.3 to 132.2 to 244.4 to 8.514 to 583 to 126.6 to 1211 to 100

TABLE 5.2
STATISTICAL SUMMARY OF SEMIVOLATILE COMPOUNDS ANALYZEDNIAGARA FALLS REGIONAL GROUNDWATER ASSESSMENT
Page 4 of 5
COOCOtn
Number NumberCompound Analyses Detected
Bis(2-Chloroisopropyl)Ether 282 0Isophorone 297 02-Nitrophenol 297 0Bis(2-Chloroethoxy)Methane 297 0Acenaphthylene 297 04-Chloro-3-Methylphenol 106 02-Methylnaphthalene 146 02-Nitroaniline 146 03-Nitroaniline 146 0Dimethyl Phthalate 297 02,6-Dinitrotoluene 282 02,4-Dinitrophenol 282 04-Nitrophenol 297 0Dibenzofuran 146 02,4-Dinitrotoluene 282 0Diethylphthalate 297 04-Chlorophenyl-Phenylether 282 04-Nitroaniline 146 04,6-Dinitro-2-Methylphenol 100 04-Bromophenyl-Phenylether 297 03,3-Dichlorobenzidine 297 0Benzo(k)Fluoranthene 278 0Benzidine 228 0N-Nitroso-Dimethylamine 190 04-Chlorophenol 23 0
Mean ofDetected
(ug/L)
Median ofDetected
(ug/L)
Range ofDetected
(ug/L)
CO
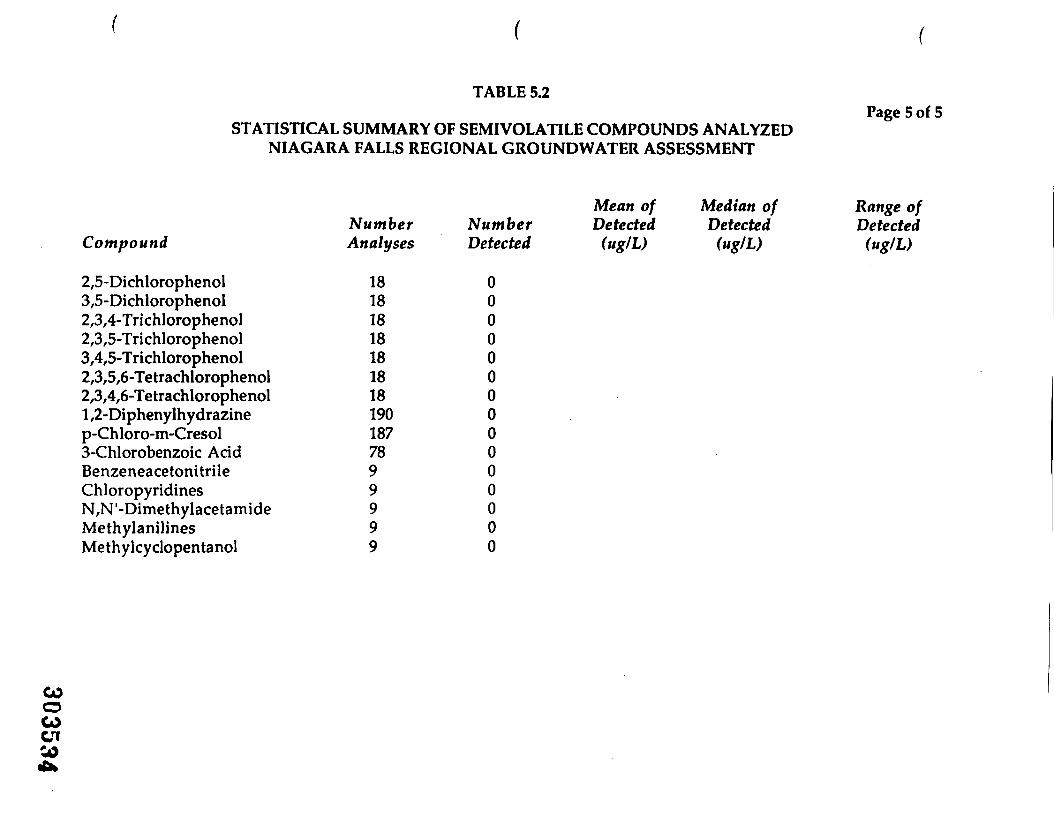
COoCO
TABLE 5.2
STATISTICAL SUMMARY OF SEMIVOLATILE COMPOUNDS ANALYZEDNIAGARA FALLS REGIONAL GROUNDWATER ASSESSMENT
Page 5 of 5
Compound
2,5-Dichlorophenol3,5-Dichlorophenol2,3,4-Trichlorophenol2,3/5-Trichlorophenol3,4,5-Trichlorophenol2,3,5,6-Tetrachlorophenol2,3,4,6-Tetrachlorophenol1,2-Diphenylhydrazinep-Chloro-m-Cresol3-Chlorobenzoic AcidBenzeneacetonitrileChloropyridinesN,N'-DimethylacetamideMethylanilinesMethylcyclopentanol
NumberAnalyses
181818181818181901877899999
NumberDetected
000000000000000
Mean ofDetected
(ug/L)
Median ofDetected
(ug/L)
Range ofDetected
(ug/L)
CO•u

TABLE 5.3
STATISTICAL SUMMARY OF PESTICIDE/PCB COMPOUNDS ANALYZEDNIAGARA FALLS REGIONAL GROUNDWATER ASSESSMENT
Page 1 of 2
CompoundNumberAnalyses
NumberDetected
Mean ofDetected
(ug/L)
Median ofDetected
(ug/L)
Range ofDetected
(ug/L)
GOoCO
gamma-BHC (Lindane)alpha-BHCbeta-BHCdelta-BHCHeptachlorAldrinTotal BHCs4,4'-DDTHeptachlor EpoxideEndosulfan IAroclor-1254Mirex4,4'-DDEEndosulfan sulfateDieldrinEndrinEndrin AldehydeEndosulfan II4,4'DDDMethoxychlorEndrin Ketonealpha-Chlordanegamma-ChlordaneToxaphene
5453473433432602561032562562622552322422562562562212562561851349292240
112857878161111103333220000000000
82471019181.11051.10.40.04148120.030.73
111.91.22.10.350.29320.20.080.046050.030.73
0.01 to 14000.01 to 7700.03 to 1500.01 to 4400.01 to 1600.02 to 712 to 4900.05 to 5.420.04 to 10.03 to 0.0424 to 3603 to 280.01 to 0.050.15 to 1.3
en

TABLE 5.3
STATISTICAL SUMMARY OF PESTICIDE/PCB COMPOUNDS ANALYZEDNIAGARA FALLS REGIONAL GROUNDWATER ASSESSMENT
Page 2 of 2
CompoundNumberAnalyses
NumberDetected
Mean ofDetected
(ug/L)
Median ofDetected
(ug/L)
Range ofDetected
(ug/L)
Arochlor-1016Arochlor-1221Arochlor-1232Arochlor-1242Arochlor-1248Arochlor-1260Chlordane
240240240255240255205
0000000
COOCOC/lCOO

TABLE 5.4
STATISTICAL SUMMARY OF METALS ANALYZEDNIAGARA FALLS REGIONAL GROUNDWATER ASSESSMENT
Compound
MagnesiumCalciumSodiumZincLeadChlorideCopperSulfatePotassiumBariumChromiumCyanideNickelArsenicIronSilverManganeseAluminumMercuryCadmiumAntimonySeleniumBerylliumThallium
CO VanadiumO CobaltSi, Thiocyanate
NumberAnalyses
178172207194323186217175130271298267279352102217926233824421421718117868663
NumberDetected
173172172167154151144138118112109969390595650484631181664430
Mean ofDetected(mg/L)
1078919571.00.152,9040.08566072440.0425.20.0470.0310.90.020.489.30.0860.030.040.110.0070.0260.150.18
Median ofDetected(mg/L)
53.94732140.180.0366750.025425240.380.0210.130.020.0132.70.0130.212.00.00090.0110.020.00350.0080.0230.1040.037
Range ofDetected(mg/L)
0.05 to 3,1704.3 to 11,2000.43 to 15,5000.017 to 300.0006 to 3.613 to 54,0000.004 to 2.54.6 to 3,5806.0 to 9100.014 to 2,0700.005 to 0.4030.01 to 2900.005 to 0.460.001 to 0.380.02 to 1350.001 to 0.1280.012 to 4.460.059 to 1390.0001 to 2.50.003 to 0.3190.001 to 0.2980.001 to 0.90.0006 to 0.010.011 to 0.0450.036 to 0.3670.013 to 0.48

TABLE 5.5
NUMBER OF CHEMICALS ANALYZED IN EACH GROUP FOR INDIVIDUAL SrTES(1)
NIAGARA FALLS REGIONAL GROUNDWATER ASSESSMENT
Page 2 of 3
Group?Group Total: 14
(PAHs)Site
CECOS/BFI 14Chisolm Ryder 14Niagara Falls Buffalo Avenue 14Du Pont Necco Park 14Du Pont Niagara Plant 14Frontier Chemical 0Niagara Co-Generation 14Hydraulic Canal 14La Salle Area (64th Street) 14New Road 14OxyChem Buffalo Avenue 0OxyChem Durez 0OxyChem Hyde Park 0OxyChem S-Area(2) 0Olin Buffalo Avenue 14Olin Industrial Welding 14Silbergeld Junkyard 14Solvent Chemical 14Union Carbide 14USGS Wells 14
Number of Chemicals Analyzed in Each Chemical GroupGroupS GroupS Group 10
Group Total: 4 Group Total: 4 Group Total: 13(HCE, HCBD, (Phthalates) (Pesticides/ N-Nitrosodi-HCCP, OCCP) PCBs) phenylamine
COOCOen
Notes:
(1)(2)(3)
33333033333012333233
44444044440000444444
0121212120121212124012121212121212
At some Sites not all wells were analyzed for the indicated number of parametersTwelve wells from S-Area were analyzed for the Priority Pollutant ListTotal phenolic compounds analyses were used
11111011110000111111
Barium
11111011110100001101
GO

TABLE 5.5Page 3 of 3
NUMBER OF CHEMICALS ANALYZED IN EACH GROUP FOR INDIVIDUAL SITES(1)
NIAGARA FALLS REGIONAL GROUNDWATER ASSESSMENT
Number of Chemicals Analyzed in Each Chemical GroupSite Lead Mercury Benzole Acid
CECOS/BFI 1 0 0Chisolm Ryder 1 1 1Niagara Falls Buffalo Avenue 1 1 1D u Pont Necco Park 1 1 1D u Pont Niagara Plant 1 1 0Frontier Chemical 0 0 0Goodyear Tire 1 1 1Hydraulic Canal 1 1 0La Salle Area (64th Street) 1 1 1New Road 1 1 1OxyChem Buffalo Avenue 1 1 1OxyChem Durez 0 0 0OxyChem Hyde Park 0 0 0OxyChem S-Area(2) 0 0 0Olin Buffalo Avenue O i lOlin Industrial Welding O i lSilbergeld Junkyard 1 1 1Solvent Chemical 1 1 1Union Carbide 1 1 1USGS Wells 1 1 0
Notes:
(1) At some Sites not all wells were analyzed for the indicated number of parameters(2) Twelve wells from S-Area were analyzed for the Priority Pollutant List(3) Total phenolic compounds analyses were used
c/i3

TABLE 5.5
NUMBER OF CHEMICALS ANALYZED IN EACH GROUP FOR INDIVIDUAL SITES(1)
NIAGARA FALLS REGIONAL GROUNDWATER ASSESSMENT
Page 1 of 3
Sif<?
CECOS/BFIChisolm RyderNiagara Falls Buffalo Avenue.Du Pont Necco ParkDu Pont Niagara PlantFrontier ChemicalNiagara Co-GenerationHydraulic CanalLa Salle Area (64th Street)New RoadOxyChem Buffalo AvenueOxyChem DurezOxyChem Hyde ParkOxyChem S-Area^Olin Buffalo AvenueOlin Industrial WeldingSilbergeld JunkyardSolvent ChemicalUnion Carbide .USGS Wells
Group 1Group Total: 18(Chlorinated
Volatiles)
161614171717171616162000161416211616
Number of Chemicals Analyzed in Each Chemical GroupGroup! Group 3 Group 4 Group 5
Group Total: 4 Group Total: 2 Group Total: 4 Group Total: 10(BTEX) (Acetone/ (Phenols) (Chlorophenols)
2-Butanone)
44443444442400444444
22220220220200222222
24422044440
10444444
455440555510201055555
Group 6Group Total: 29
(Chlorobenzenes/Chlorotoluenes)
666663666622434666666
Notes:
(1)(2)(3)
At some Sites not all wells were analyzed for the indicated number of parametersTwelve wells from S-Area were analyzed for the Priority Pollutant ListTotal phenolic compounds analyses were used