Chapter 4 - Air Traffic Forecasts - Niagara Falls International ...
42
4-1 Air Traffic Forecasts Chapter 4 Air Traffic Forecasts 4.1 EXECUTIVE SUMMARY Forecasts of aviation demand are a key element of an airport’s future planning, as they are used as the basis for the demand/capacity and facility requirements analyses which identify airport development needs. Such forecasts include consideration of key factors and trends, including historical traffic development, demographic and economic context of the market, and aviation and airline industry trends and events that may impact traffic demand and the ability to service that demand. These factors, among others, provide the basis for baseline and alternative scenario forecasts around which the master planning effort is focused. The limited air traffic activity at Niagara Falls International Airport (“ NFIA”) in recent history, and the very recent air service and physical development, require a forecast approach that focuses less of the historic levels of activity at NFIA, and more on the growth outlook for and competitive position of NFIA in the context of the large air travel market that is within a 65 mile radius. The analysis of NFIA’s position in this regional market, which generated 34.7 million origination/destination (“O/D”) passengers in 2012 at the region’s seven airports, indicates a strong potential for traffic growth. The forecast defines this potential in the context of a Baseline Case and several potential scenarios. The Baseline Case forecast, combined with the “Introduction of Transatlantic Service Scenario”, is considered the most likely forecast for NFIA. This forecasts NFIA annual passenger levels to increase 4.0% in fiscal year 2013 to 180,137 annual passengers, and then increase to 685,707 annual passengers in 2040. Over the forecast period from 2012 through 2040, passenger traffic is forecast to grow by a compound annual growth rate (“CAGR”) of 4.9%. The forecast also addresses aircraft movements (takeoffs and landings) at NFIA. The Baseline Case forecasts total aircraft movements at NFIA are forecast to reach 30,081 in 2040, representing a CAGR of 0.4% over the forecast period. This growth by type of activity is: Commercial aircraft movements are forecast to grow by CAGR of 3.6% over the forecast period, reaching 3,751 movements in 2040, compared to 1,328 in 2012. Military operations are expected to grow 5% between 2012 and the end of the forecast period in 2040, and reach 8,238 movements in 2040, compared to 7,846 in 2012, equivalent to 0.2% CAGR over the forecast period. General Aviation operations are expected to grow 1.0% over the forecast period, and reach 18,090 movements in 2040, compared to 17,911 in 2012, equivalent to 0.04% CAGR over the forecast period.
-
Upload
khangminh22 -
Category
Documents
-
view
1 -
download
0
Transcript of Chapter 4 - Air Traffic Forecasts - Niagara Falls International ...

4-1 Air Traffic Forecasts
Chapter 4 Air Traffic Forecasts
4.1 EXECUTIVE SUMMARY
Forecasts of aviation demand are a key element of an airport’s future planning, as they are used as the basis for the demand/capacity and facility requirements analyses which identify airport development needs. Such forecasts include consideration of key factors and trends, including historical traffic development, demographic and economic context of the market, and aviation and airline industry trends and events that may impact traffic demand and the ability to service that demand. These factors, among others, provide the basis for baseline and alternative scenario forecasts around which the master planning effort is focused. The limited air traffic activity at Niagara Falls International Airport (“NFIA”) in recent history, and the very recent air service and physical development, require a forecast approach that focuses less of the historic levels of activity at NFIA, and more on the growth outlook for and competitive position of NFIA in the context of the large air travel market that is within a 65 mile radius. The analysis of NFIA’s position in this regional market, which generated 34.7 million origination/destination (“O/D”) passengers in 2012 at the region’s seven airports, indicates a strong potential for traffic growth. The forecast defines this potential in the context of a Baseline Case and several potential scenarios. The Baseline Case forecast, combined with the “Introduction of Transatlantic Service Scenario”, is considered the most likely forecast for NFIA. This forecasts NFIA annual passenger levels to increase 4.0% in fiscal year 2013 to 180,137 annual passengers, and then increase to 685,707 annual passengers in 2040. Over the forecast period from 2012 through 2040, passenger traffic is forecast to grow by a compound annual growth rate (“CAGR”) of 4.9%. The forecast also addresses aircraft movements (takeoffs and landings) at NFIA. The Baseline Case forecasts total aircraft movements at NFIA are forecast to reach 30,081 in 2040, representing a CAGR of 0.4% over the forecast period. This growth by type of activity is:
Commercial aircraft movements are forecast to grow by CAGR of 3.6% over the forecast period, reaching 3,751 movements in 2040, compared to 1,328 in 2012.
Military operations are expected to grow 5% between 2012 and the end of the forecast period in 2040, and reach 8,238 movements in 2040, compared to 7,846 in 2012, equivalent to 0.2% CAGR over the forecast period.
General Aviation operations are expected to grow 1.0% over the forecast period, and reach 18,090 movements in 2040, compared to 17,911 in 2012, equivalent to 0.04% CAGR over the forecast period.

4-2 Air Traffic Forecasts
4.2 BACKGROUND
InterVISTAS Consulting LLC (“InterVISTAS”) has developed air traffic forecasts for Niagara Falls International Airport in support of the Master Plan Update being performed by McFarland Johnson. The following core outputs result from this traffic forecast:
Forecasts of annual (calendar year) passenger volumes for the period 2013 to 2040
Forecasts of annual (calendar year) aircraft movements for the period 2013 to 2040. Note: Much of the discussion contained in this Chapter pertains to Total Passengers – which includes both Enplaned and Deplaned Passengers. It is understood that Facility Requirements and other airport development needs are driven by the Enplaned Passenger component. As such, the latter part of this Chapter focuses more specific attention on the Enplaned Passenger estimates at NFIA.
4.2.1 Report Structure
This report presents the air traffic forecasts produced by InterVISTAS and McFarland Johnson, as well as documentation of the methodology and assumptions underlying the forecasts. The report is structured as follows:
Section 4.3 describes the current and historical aviation activity in the Buffalo Niagara Region and at NFIA;
Section 4.4 provides background on the market’s economy and demography;
Section 4.5 describes the air traffic forecast methodology and assumptions;
Section 4.6 presents the forecasts of total passengers and aircraft movements;
Section 4.7 outlines the fleet mix projections;
Section 4.8 presents the General Aviation projections; and
Section 4.9 provides the peak analysis.

4-3 Air Traffic Forecasts
4.3 HISTORICAL TRAFFIC DEVELOPMENT
4.3.1 Regional O&D Traffic Development
Due to the limited air traffic activity at the Niagara Falls International Airport (“IAG”) in recent history, and it’s very recent development and service with scheduled airline operations, the analysis of the historical traffic trend focuses not only on NFIA’s current market but also on the total potential passenger pool available to the airport. For the purpose of this analysis, the defined potential region includes an area with an approximate radius of 65 miles and contains seven airports: Niagara Falls International Airport (“IAG”), Buffalo Niagara International Airport (“BUF”), Rochester International Airport (“ROC”), Toronto Pearson International Airport (“YYZ”), London Metropolitan Airport (“YXU”), Hamilton International Airport (“YHM”), and Toronto City International Airport (“YTZ”). This region is referred to as the Buffalo Niagara Region (“the Region”). Analysis of the regional origin and destination (“O&D”) passenger traffic in the region shows an increase at a compounded annual growth rate of 2.3%, from approximately 24.6 million total annual passengers in 1997 to 34.7 million total annual passengers in 2012, as depicted graphically on Figure 4-1. During the period 1997-2012 the passenger traffic generation has been impacted by global and regional economic activity trends, airline industry development and competition in the United States and Canada, and government policy regarding air travel and aviation infrastructure development.
Figure 4-1 Total Annual O&D Passengers
Source: Diio & U.S. Department of Transportation.
-10.0%
-5.0%
0.0%
5.0%
10.0%
15.0%
20.0%
0
5
10
15
20
25
30
35
40
1997 2002 2007 2012
Mill
ion
s
Total O&D Passengers Growth Rate
TOTAL ANNUAL O&D PASSENGERS (MILLIONS)Buffalo Niagara Region
4-4 Air Traffic Forecasts
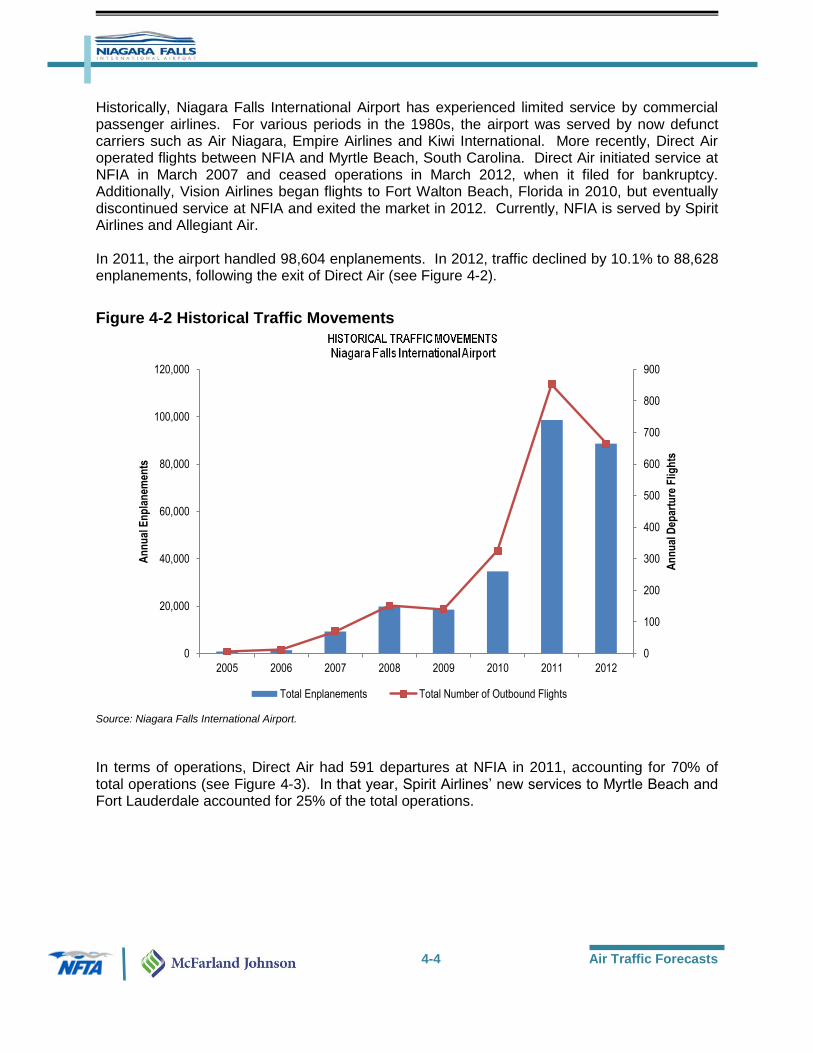
Historically, Niagara Falls International Airport has experienced limited service by commercial passenger airlines. For various periods in the 1980s, the airport was served by now defunct carriers such as Air Niagara, Empire Airlines and Kiwi International. More recently, Direct Air operated flights between NFIA and Myrtle Beach, South Carolina. Direct Air initiated service at NFIA in March 2007 and ceased operations in March 2012, when it filed for bankruptcy. Additionally, Vision Airlines began flights to Fort Walton Beach, Florida in 2010, but eventually discontinued service at NFIA and exited the market in 2012. Currently, NFIA is served by Spirit Airlines and Allegiant Air. In 2011, the airport handled 98,604 enplanements. In 2012, traffic declined by 10.1% to 88,628 enplanements, following the exit of Direct Air (see Figure 4-2).
Figure 4-2 Historical Traffic Movements
Source: Niagara Falls International Airport.
In terms of operations, Direct Air had 591 departures at NFIA in 2011, accounting for 70% of total operations (see Figure 4-3). In that year, Spirit Airlines’ new services to Myrtle Beach and Fort Lauderdale accounted for 25% of the total operations.
0
100
200
300
400
500
600
700
800
900
0
20,000
40,000
60,000
80,000
100,000
120,000
2005 2006 2007 2008 2009 2010 2011 2012A
nn
ual
Dep
artu
re F
ligh
ts
An
nu
al E
np
lan
emen
ts
Total Enplanements Total Number of Outbound Flights

4-5 Air Traffic Forecasts
Figure 4-3 Historical Traffic Movements by Airlines - 2011
Source: Niagara Falls International Airport.
By 2012, Allegiant operated 48% of the total flights at NFIA, followed by Direct Air which operated 27% of flights at the airport (see Figure 4-4).
Figure 4-4 Historical Traffic Movements by Airlines - 2012
Source: Niagara Falls International Airport.
1%
70%
25%
4%
Allegiant
Direct Air
Spirit
Vision Airlines
HISTORICAL TRAFFIC MOVEMENTS BY AIRLINES- 2011
Niagara Falls International Airport
48%
27%
25%
Allegiant Direct Air
Spirit
HISTORICAL TRAFFIC MOVEMENTS BY AIRLINES - 2012
Niagara Falls International Airport
4-6 Air Traffic Forecasts
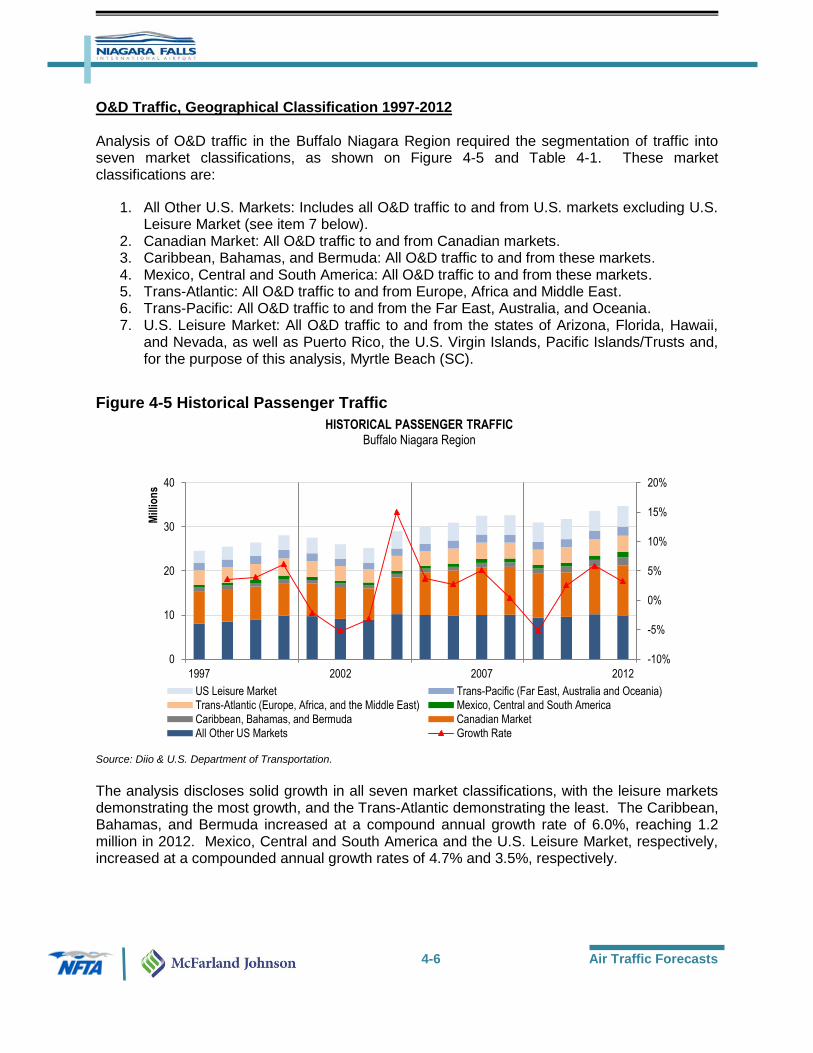
O&D Traffic, Geographical Classification 1997-2012 Analysis of O&D traffic in the Buffalo Niagara Region required the segmentation of traffic into seven market classifications, as shown on Figure 4-5 and Table 4-1. These market classifications are:
1. All Other U.S. Markets: Includes all O&D traffic to and from U.S. markets excluding U.S. Leisure Market (see item 7 below).
2. Canadian Market: All O&D traffic to and from Canadian markets. 3. Caribbean, Bahamas, and Bermuda: All O&D traffic to and from these markets. 4. Mexico, Central and South America: All O&D traffic to and from these markets. 5. Trans-Atlantic: All O&D traffic to and from Europe, Africa and Middle East. 6. Trans-Pacific: All O&D traffic to and from the Far East, Australia, and Oceania. 7. U.S. Leisure Market: All O&D traffic to and from the states of Arizona, Florida, Hawaii,
and Nevada, as well as Puerto Rico, the U.S. Virgin Islands, Pacific Islands/Trusts and, for the purpose of this analysis, Myrtle Beach (SC).
Figure 4-5 Historical Passenger Traffic
Source: Diio & U.S. Department of Transportation.
The analysis discloses solid growth in all seven market classifications, with the leisure markets demonstrating the most growth, and the Trans-Atlantic demonstrating the least. The Caribbean, Bahamas, and Bermuda increased at a compound annual growth rate of 6.0%, reaching 1.2 million in 2012. Mexico, Central and South America and the U.S. Leisure Market, respectively, increased at a compounded annual growth rates of 4.7% and 3.5%, respectively.
-10%
-5%
0%
5%
10%
15%
20%
0
10
20
30
40
1997 2002 2007 2012
Mill
ion
s
US Leisure Market Trans-Pacific (Far East, Australia and Oceania)Trans-Atlantic (Europe, Africa, and the Middle East) Mexico, Central and South America
Caribbean, Bahamas, and Bermuda Canadian Market
All Other US Markets Growth Rate
HISTORICAL PASSENGER TRAFFICBuffalo Niagara Region

4-7 Air Traffic Forecasts
Table 4-1 Estimated International O&D Passenger Traffic by Market Region ESTIMATED INTERNATIONAL O&D PASSENGER BY MARKET REGION
Avg. Annual Growth Rate
1997 2001 2005 2008 2012 1997-2012
All Other US Markets 8,071,526 9,738,575 9,999,663 10,080,778 9,915,099 1.40%
Canadian Market 7,348,720 7,381,931 9,694,471 10,843,127 11,304,147 2.90%
Caribbean, Bahamas, and Bermuda 778,828 849,188 816,991 1,006,885 1,862,587 6.00%
Mexico, Central and South America 598,697 657,653 647,800 857,252 1,199,010 4.70%
Trans-Atlantic (Europe, Africa, and the Middle East)
3,349,281 3,607,062 3,340,196 3,633,770 3,705,118 0.70%
Trans-Pacific (Far East, Australia and Oceania) 1,647,553 1,760,843 1,639,902 1,823,953 2,039,561 1.40%
US Leisure Market 2,793,105 3,502,326 3,950,495 4,409,852 4,697,060 3.50%
Total 24,587,710 27,497,578 30,089,518 32,655,617 34,722,583 2.30%
Sources: United States Department of Transportation Origin & Destination Survey and T-100 Database; Diio; GTAA Master Plan Chapter 3; InterVISTAS Consulting.
Airport Choice Factors
With multiple airports available within the Buffalo Niagara Region, there are several factors that have been identified that will impact a passenger’s choice when choosing an airport to utilize. These factors are discussed below.
Airport Costs: One of the fundamental drivers of Canadian demand discussed throughout these forecasts is the cost difference between Toronto Pearson and the U.S. counterparts, particularly NFIA. The air fare differences will be discussed as part of the forecast methodology in Section 4.5, however one of the key underlying factors in the air fare differences is the cost of doing business at the respective airports. Unlike the $4.50 USD Passenger Facility Charge (PFC) cap in the U.S., Canada does not have a cap on their equivalent Airport Improvement Fee which is currently $25 CAD at Toronto Pearson and Hamilton, and $20 CAD at Toronto City and London, all before applicable taxes, The fee at Toronto Pearson is up from it’s previous level of $20 CAD in 2012. As of July 2015, NFIA does not charge a PFC to passengers. According to a report from the Conference Board of Canada, the Airport Improvement Fee combined with other taxes and fees amount of over $80 CAD compared to only $32 USD in taxes on a similar base fare from a U.S. airport.1
The combination of lower fares and lower taxes and fees often yield savings of over $100 per person to leisure destinations. When considering family or group travel, which is consistent with that of a family-friendly leisure destination, the savings of using a lower cost U.S. airport becomes substantial.
Low Cost Carrier (LCC) Market Share: The Toronto Pearson airport operates as a hub for Air Canada, which operates an extensive network of domestic and international flights from the airport. The combination of extensive flight offerings brought on by a hub airline along with higher airport costs, create a difficult opportunity for low cost airlines to effectively compete. Westjet, the largest LCC in Canada, operates between 80 and 100
1 Gill, Vijay, “Driven Away: Why More Canadians are Choosing Cross Border Airports”, The Conference Board of
Canada, October 2012, 35.

4-8 Air Traffic Forecasts
flights from Toronto Pearson depending on the day and season. While this may appear significant, for a large market and large airport, LCC are estimated to represent less than 10% of the market share at Toronto Pearson. Toronto City Airport has low fares offered by Porter Airlines, however due to limited infrastructure; flights are operated on turboprop aircraft and limited primarily to destinations within the region. The remaining airports within the Region, London and Hamilton, offer weekly flights on a seasonal basis to leisure destinations on airlines including Air Transat, Sunwing, and WestJet, as well as daily service to regional destinations on WestJet and United Airlines. Celebrity Cruises also offers frequent charter flights from these airports to Miami for passengers preparing to board cruises. With the exception of seasonal service to Orlando, much of the seasonal service provided at London and Hamilton are to destinations within the Caribbean and not presently served by airlines at Niagara Falls or Buffalo.
The concentration of LCC flights, all to leisure destinations, is one of the key drivers for NFIA’s share in the greater regions leisure traffic. The greater regional passenger dynamics are discussed in detail in Section 4.5.2. Details of the average fares are also covered throughout Section 4.5.
Parking/Ground Transportation: One often overlooked cost comparison is airport parking. Parking within the most deeply discounted lot at Toronto-Pearson, the Value Park Lot, the difference in cost is approximately $22 USD per week when compared to the fees charged for parking at NFIA. When comparing to a parking lot with similar proximity to the terminal as those provided at NFIA, the difference when parking into the Daily Park Lot increases to approximately $58 per week. Aside from airport parking, even ground transportations options for Toronto-Pearson may result in a higher user costs. On average, round trip transit fares on the Union Pearson Express train are priced at approximately $53 CAD round trip per person between the airport and downtown ($38 CAD round trip per person for transit card holders). A family of up to 5 will pay a reduced with, with a total round trip priced at approximately $110 CAD.
These airport choice factors provide a number of considerations for passengers within the Toronto region. As noted in Table 4-2 below, a review of considerations for flights in late November, 2015, a peak travel period within the United States, flights for a family of four to the Orlando, Florida region from Niagara Falls would save the family over $400 when compared to flights from Toronto Pearson.
Table 4-2 Example of Trip Costs from Toronto, ON Region to Orlando, FL Region (November 2015) From Downtown Toronto To YYZ To YHM To YXU To BUF To NFIA
Fare (USD) $376 $369 $356 $351 $244 Distance (km) 26 99 191 174 139 Train (USD) $42 $0 $0 $0 $0 Gas (USD) $0 $86 $165 $150 $120 Toll (USD) $0 $0 $0 $6 $4
Parking (USD/week) $0 $46 $39 $45 $60 Total (USD) $418 $501 $560 $552 $428
Total (family of four) (USD) $1,590 $1,608 $1,628 $1,605 $1,160 Source: Westjet.com, Allegiantair.com,Kayak.com as of July 8, 2015 for travel to occur November 22 – November 29, or date of closest available flight. Gas costs determined based on Canada Revenue Agency rate of 55 cents/km. All values provided in Canadian Dollars converted to U.S. Dollars at a rate of $1.27 CAD to $1.00 USD.
4-9 Air Traffic Forecasts
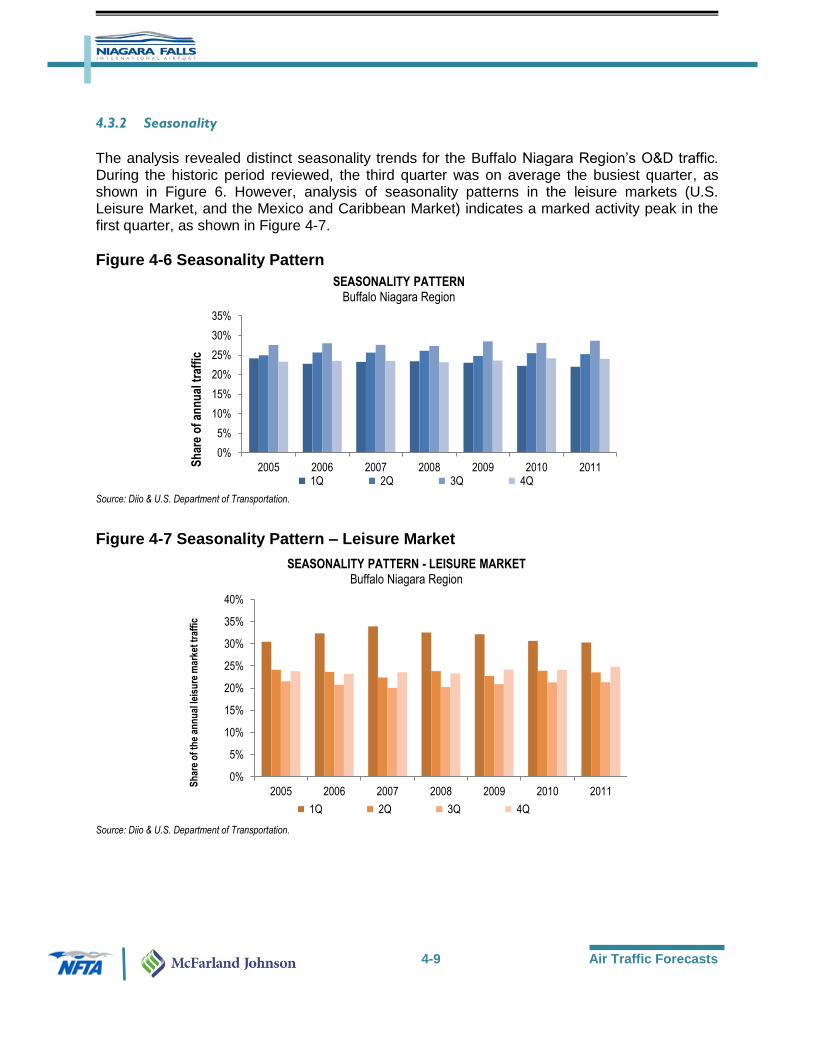
4.3.2 Seasonality
The analysis revealed distinct seasonality trends for the Buffalo Niagara Region’s O&D traffic. During the historic period reviewed, the third quarter was on average the busiest quarter, as shown in Figure 6. However, analysis of seasonality patterns in the leisure markets (U.S. Leisure Market, and the Mexico and Caribbean Market) indicates a marked activity peak in the first quarter, as shown in Figure 4-7.
Figure 4-6 Seasonality Pattern
Source: Diio & U.S. Department of Transportation.
Figure 4-7 Seasonality Pattern – Leisure Market
Source: Diio & U.S. Department of Transportation.
0%
5%
10%
15%
20%
25%
30%
35%
2005 2006 2007 2008 2009 2010 2011Sh
are
of
ann
ual
tra
ffic
1Q 2Q 3Q 4Q
SEASONALITY PATTERNBuffalo Niagara Region
0%
5%
10%
15%
20%
25%
30%
35%
40%
2005 2006 2007 2008 2009 2010 2011
Sh
are
of
the
ann
ual
leis
ure
mar
ket
traf
fic
1Q 2Q 3Q 4Q
SEASONALITY PATTERN - LEISURE MARKETBuffalo Niagara Region

4-10 Air Traffic Forecasts
4.3.3 Air Cargo, Military & General Aviation Operations
Unlike passenger traffic operations, cargo, military and general aviation operations are typically airport specific, and based on each airport’s strategic planning and operational focus. These three types of operations at NFIA are discussed below. Air Cargo Operations
In order to provide guidance for the NFIA cargo forecast, InterVISTAS reviewed the airport’s historic air cargo data and reviewed past air cargo studies related to NFIA, including an Air Cargo Assessment report completed in May 2012. This Assessment concluded that NFIA faced many challenges in developing air cargo business and that demand in the region was a potential issue. The challenges confronting NFIA were categorized in four major areas:
1) A small and slow growing local market for air cargo shipments;
2) Stiff competition from established cargo gateways; 3) Restrictive air cargo industry dynamics; and 4) Operations-oriented issues at Niagara Falls International Airport.
Further, due to the relatively low commercial air services levels at NFIA historically, there is very little air cargo experience from which to draw reliable conclusions. For a brief period, between 2003 and 2007, Kitty Hawk Airlines operated all-cargo flights at NFIA. At its peak in 2004 and 2005, it averaged close to 500 annual departures and carried approximately 13,000 metric tons of air cargo per year. By 2007, Kitty Hawk was experiencing financial difficulties brought on by a changing business environment for air cargo and a weakening economy. The airline discontinued service at NFIA and, eventually, went out of business completely. Since Kitty Hawk’s exit from NFIA, air volumes dropped significantly and, in 2010, only 21 metric tons of air cargo was handled at NFIA. While NFIA may be capable of handling air cargo operations in terms of a long runway to accommodate large cargo aircraft, a precision instrument approach, and developable land for cargo facilities, the airport is largely limited with respect to air cargo growth by the types of air services available at the airport and competition from nearby airports. Currently, the infrequent weekly services of low-fare carriers like Allegiant Air and Spirit Airlines do not meet the needs of air cargo shippers. In fact, Allegiant has a corporate policy to not carry air cargo on its flights and Spirit traditionally carries very little cargo. Other types of operations that may operate at NFIA such as charter flights and turboprop aircraft typically do not carry much cargo as their aircraft and/or frequencies are not suited for the air cargo market. Given the current situation at NFIA, it was concluded that the air cargo potential of the airport, for forecast purposes, is driven less by market demand and much more influenced by the air services expected at NFIA over time. In such an environment, cargo forecasts are best developed based on possible air service scenarios. These scenarios for air cargo at NFIA will be discussed further in the methodology section of this report.

4-11 Air Traffic Forecasts
Military Operations
In addition to the commercial aviation activities at NFIA, the airport is occupied by the Niagara Falls Air Reserve Station. The station is home to the U.S. Air Force Reserve Command's 914th Airlift Wing and the New York Air National Guard's 107th Airlift Wing. These units operate Lockheed C-130 Hercules aircraft at NFIA. During the forecast effort, InterVISTAS reviewed historical military operations data and spoke with representatives familiar with military operations at NFIA. The secondary research allowed for analysis of recent operational trends while the primary research sought to gain insights on the future levels of military operations at NFIA for forecast purposes.
Between 1997 and 2012, military aircraft operations declined by 36% at NFIA. In 1997, military flights totaled 12,328 and by 2012, the flights totaled 7,846. However, since 2010, military operations have been relatively stable, suggesting that the major fluctuations have ceased. In terms of forward-looking guidance for military operations at NFIA, InterVISTAS obtained qualitative comments on the station’s future activities. It was understood that quantifying the activities was extremely difficult due to the ever-changing environment related to Federal budgets and military operations. Based on analysis of the information gathered and InterVISTAS’ own assumptions, for forecasts purposes, it was determined that the outlook for U.S. military operations in the NFIA forecast would show overall flat growth. General Aviation and Charter Operations
General aviation activity tends to follow trends in underlying economic conditions and growth in the region served by the airport. This is especially the case where there are multiple airports that can serve general aviation activity conveniently and efficiently. In the absence of the expansion of (or major concentration of) corporate general aviation based aircraft at an airport, the historical trends can be expected to continue, subject to variation resulting from underlying economic trends. Interviews with NFIA operational management indicated the likelihood of continuation of general aviation demand at levels consistent with historical activity, adjusted to reflect underlying economic demand. As a result, General Aviation operations are expected to grow 1% by the end of the forecast period, and reach 18,092 movements (two-way) in 2040 compare to 17,911 in 2012. This corresponds to a Compound Annual Growth Rate (CAGR) of 0.04% between 2012 and 2040. CAGR relates to the average annual growth rate over a period of several years. Charter activity, like general aviation, is on-demand, and does not follow a set schedule. However, by reviewing the number of historic charter flights for passengers and cargo at NFIA and elsewhere in the Buffalo Niagara Region, the forecast can be informed of the trends, and estimate the demand for charter activity. Historic levels and trends have been incorporated into the aircraft operations and passenger traffic forecast through the overall operational and traffic level base. While the General Aviation forecasts are centered on aircraft movements, it is sometimes necessary for the airport to consider the number of total passengers that will be associated with those movements. Unfortunately, no historical record of total General Aviation passengers at NFIA was located during the forecast process.

4-12 Air Traffic Forecasts
Figure 4-8 illustrates the historical development of both military and general aviation in Niagara Falls International Airport.
Figure 4-8 Historical Aircraft Movements
Source: Niagara Falls International Airport.
Between 1997 and 2012, both military and general aviation operations declined at NFIA by, an annual average of, -2.0% and -3.0%, respectively. 4.4 DEMOGRAPHIC AND ECONOMIC BACKGROUND
Among the main drivers of air traffic demand, the socio-economic characteristics of the markets involved are the most dominant factors. Accordingly, social and economic development in the Buffalo Niagara Region was analyzed to understand the basis for air travel demand.
The primary service area of NFIA is composed of the Province of Ontario (Canada) and Western New York State (United States). Consequently, the population trends and economic activity of this service area were analyzed. Population growth provides an increasing source of demand for air travel, and rising economic activity, as measured by Gross Domestic Product (“GDP”) also drives increased air travel in the Buffalo Niagara Region.
4.4.1 Gross Domestic Product
As will be discussed in further detail as part of the development of air traffic forecasts within this chapter, GDP of both the Province of Ontario and Western New York State correlates positively to the growth in passenger and cargo traffic at NFIA over the same period. Ontario experienced real GDP annual growth of 1.8% in 2011, 3.1% in 2012, and is forecasted to experience 3.1%
-
2,000
4,000
6,000
8,000
10,000
12,000
14,000
16,000
18,000
1997 2002 2007 2012
An
nu
al A
ircr
aft
Mo
vem
ents
Military Operations General Aviation Operations
HISTORICAL AIRCRAFT MOVEMENTSNiagara Falls International Airport

4-13 Air Traffic Forecasts
growth in 2013.2 According to the Ontario Ministry of Finance, GDP in the province is forecast to grow by an average of 2.8% per year over the next five years (2013-2017). Further, the Ontario Ministry of Finance forecasts the provincial GDP growth rate over the longer term to be slightly lower, with a compound annual growth rate of 2.4% from 2013 to 2040, as shown in Figure 4-9.
Figure 4-9 Ontario Historical GDP Developments & Future Outlook
Sources: Woods & Poole Economics, Ontario Ministry of Finance.
For the U.S. side of the Buffalo Niagara Region, the Buffalo-Niagara Falls (Western New York State) metropolitan area is the second-largest metropolitan area in New York, centered on the urbanized area of Buffalo. In 2013, this area is estimated to have a GDP of USD42.3 billion, which is 4.1% of the New York State GDP.3 The GDP for the Western New York Region is projected to grow by an average 1.6% per year over the next 5 years (2013-2017), as shown in Figure 4-10. This is in line with the growth in the O&D traffic over the period. Further Woods & Poole Economics forecasts the area’s GDP to continue at the same rate for the next 27 years (2013-2040).
2 Ontario Ministry of Finance. 3 InterVISTAS Consulting Group Analysis, Woods & Poole Economics.
-3.0%
-2.0%
-1.0%
0.0%
1.0%
2.0%
3.0%
4.0%
0
200,000
400,000
600,000
800,000
1,000,000
1,200,000
1997 2002 2007 2012 2017 2022 2027 2032 2037
Bill
ion
US
D
Ontario GDP Growth Rate
ONTARIO HISTORICAL GDP DEVELOPMENTS & FUTURE OUTLOOK

4-14 Air Traffic Forecasts
Figure 4-10 Buffalo-Niagara Falls, NY Historical GDP Developments & Future Outlook
Source: Woods & Poole Economics.
Overall growth in GDP has been consistent over a lengthy period, which indicates that continued growth in the economy is likely to be sustainable over the forecast period. The consistent historic growth has occurred during a period of numerous exogenous shocks that have affected regional and global economies.
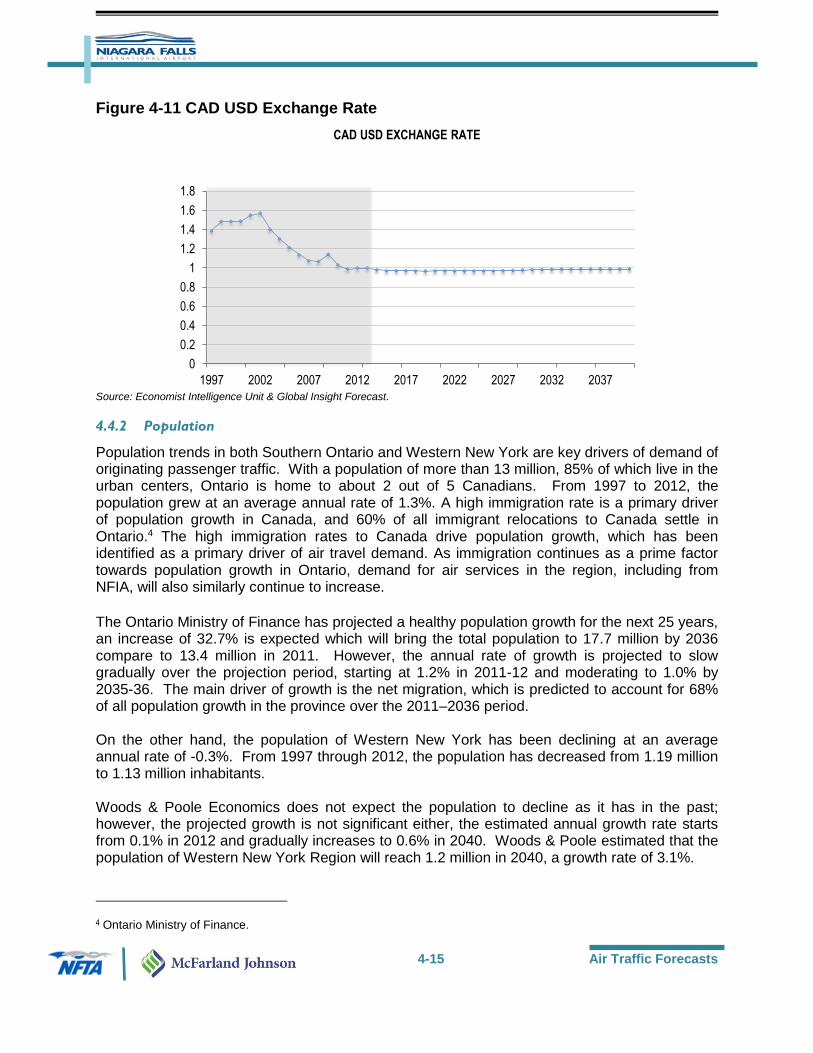
In recent years, the strong Canadian dollar has placed Canadian travelers in a favorable position to purchase goods and services in the United States, including air travel. Other factors have also proved effective in attracting additional Canadian travelers, including the availability of multiple low cost carriers, lower airport fees (including parking fees), reduced border crossing wait times, non-stop service to multiple leisure destinations. As Figure 4-11 illustrates both the Economist Intelligence Unit and Global Insight forecasts project a stable Canadian dollar at or close to par versus the U.S. dollar.
-3.0%
-2.0%
-1.0%
0.0%
1.0%
2.0%
3.0%
4.0%
5.0%
0
10,000
20,000
30,000
40,000
50,000
60,000
1997 2002 2007 2012 2017 2022 2027 2032 2037
Bill
ion
US
D
Buffalo-Niagara Falls, NY Real GDP Buffalo-Niafara Falls, NY Real GDP Growth
BUFFALO-NIAGARA FALLS, NY HISTORICAL GDP DEVELOPMENTS & FUTURE OUTLOOK
Buffalo-Niagara Falls, NY Real GDP Growth
4-15 Air Traffic Forecasts
Figure 4-11 CAD USD Exchange Rate
Source: Economist Intelligence Unit & Global Insight Forecast.
4.4.2 Population
Population trends in both Southern Ontario and Western New York are key drivers of demand of originating passenger traffic. With a population of more than 13 million, 85% of which live in the urban centers, Ontario is home to about 2 out of 5 Canadians. From 1997 to 2012, the population grew at an average annual rate of 1.3%. A high immigration rate is a primary driver of population growth in Canada, and 60% of all immigrant relocations to Canada settle in Ontario.4 The high immigration rates to Canada drive population growth, which has been identified as a primary driver of air travel demand. As immigration continues as a prime factor towards population growth in Ontario, demand for air services in the region, including from NFIA, will also similarly continue to increase.
The Ontario Ministry of Finance has projected a healthy population growth for the next 25 years, an increase of 32.7% is expected which will bring the total population to 17.7 million by 2036 compare to 13.4 million in 2011. However, the annual rate of growth is projected to slow gradually over the projection period, starting at 1.2% in 2011-12 and moderating to 1.0% by 2035-36. The main driver of growth is the net migration, which is predicted to account for 68% of all population growth in the province over the 2011–2036 period. On the other hand, the population of Western New York has been declining at an average annual rate of -0.3%. From 1997 through 2012, the population has decreased from 1.19 million to 1.13 million inhabitants. Woods & Poole Economics does not expect the population to decline as it has in the past; however, the projected growth is not significant either, the estimated annual growth rate starts from 0.1% in 2012 and gradually increases to 0.6% in 2040. Woods & Poole estimated that the population of Western New York Region will reach 1.2 million in 2040, a growth rate of 3.1%.
4 Ontario Ministry of Finance.
0
0.2
0.4
0.6
0.8
1
1.2
1.4
1.6
1.8
1997 2002 2007 2012 2017 2022 2027 2032 2037
CAD USD EXCHANGE RATE
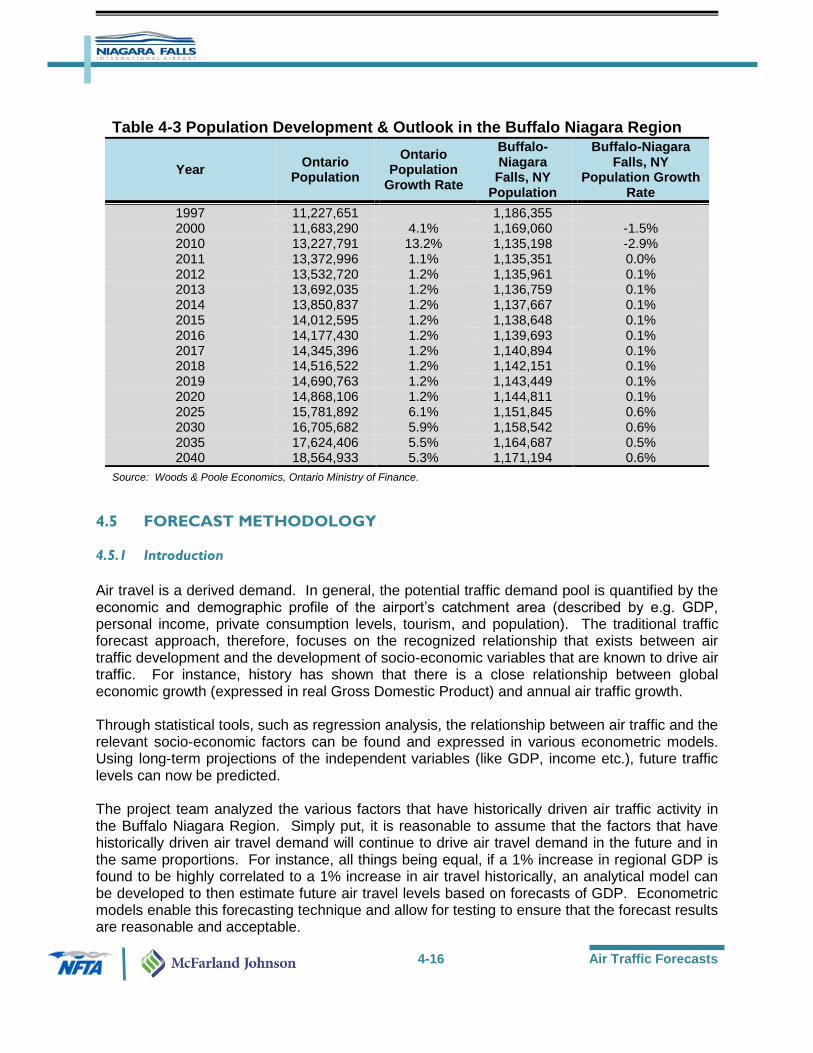
4-16 Air Traffic Forecasts
Table 4-3 Population Development & Outlook in the Buffalo Niagara Region
Year Ontario
Population
Ontario Population
Growth Rate
Buffalo-Niagara Falls, NY
Population
Buffalo-Niagara Falls, NY
Population Growth Rate
1997 11,227,651
1,186,355
2000 11,683,290 4.1% 1,169,060 -1.5% 2010 13,227,791 13.2% 1,135,198 -2.9% 2011 13,372,996 1.1% 1,135,351 0.0% 2012 13,532,720 1.2% 1,135,961 0.1% 2013 13,692,035 1.2% 1,136,759 0.1% 2014 13,850,837 1.2% 1,137,667 0.1% 2015 14,012,595 1.2% 1,138,648 0.1% 2016 14,177,430 1.2% 1,139,693 0.1% 2017 14,345,396 1.2% 1,140,894 0.1% 2018 14,516,522 1.2% 1,142,151 0.1% 2019 14,690,763 1.2% 1,143,449 0.1% 2020 14,868,106 1.2% 1,144,811 0.1% 2025 15,781,892 6.1% 1,151,845 0.6% 2030 16,705,682 5.9% 1,158,542 0.6% 2035 17,624,406 5.5% 1,164,687 0.5% 2040 18,564,933 5.3% 1,171,194 0.6%
Source: Woods & Poole Economics, Ontario Ministry of Finance.
4.5 FORECAST METHODOLOGY
4.5.1 Introduction
Air travel is a derived demand. In general, the potential traffic demand pool is quantified by the economic and demographic profile of the airport’s catchment area (described by e.g. GDP, personal income, private consumption levels, tourism, and population). The traditional traffic forecast approach, therefore, focuses on the recognized relationship that exists between air traffic development and the development of socio-economic variables that are known to drive air traffic. For instance, history has shown that there is a close relationship between global economic growth (expressed in real Gross Domestic Product) and annual air traffic growth. Through statistical tools, such as regression analysis, the relationship between air traffic and the relevant socio-economic factors can be found and expressed in various econometric models. Using long-term projections of the independent variables (like GDP, income etc.), future traffic levels can now be predicted. The project team analyzed the various factors that have historically driven air traffic activity in the Buffalo Niagara Region. Simply put, it is reasonable to assume that the factors that have historically driven air travel demand will continue to drive air travel demand in the future and in the same proportions. For instance, all things being equal, if a 1% increase in regional GDP is found to be highly correlated to a 1% increase in air travel historically, an analytical model can be developed to then estimate future air travel levels based on forecasts of GDP. Econometric models enable this forecasting technique and allow for testing to ensure that the forecast results are reasonable and acceptable.

4-17 Air Traffic Forecasts
As with any forecast methodology, there are uncertainties regarding these factors, such as the outlook for regional and world economies, and the structure and growth of the airline industry. Dependable forecasting requires awareness of the uncertainties surrounding each forecast. A pragmatic, yet systematic, approach has been used to produce a set of unbiased aviation activity forecasts for the Buffalo Niagara Region. As described in the rest of this chapter, forecasts have been produced for the following:
Passenger traffic;
Aircraft movements;
Cargo volume.
The following sections describe the methodology used to forecast each separate segment; the results are presented in the next section.
4.5.2 Total Air Passengers
Total O&D Traffic
The total air transport market in the Buffalo Niagara Region, involving both the Canadian domestic market and the U.S.-Canada market, is mainly served by airline services at Toronto Pearson International Airport (YYZ), with the remainder of the market served by other airports within the United States and Canada. InterVISTAS used the following approach to prepare the Passenger Forecast:
1. Through an econometric model developed by InterVISTAS, historic annual O&D passenger traffic development between 1997 and 2012 in Niagara Falls region has been related to the historic development of various socio-economic variables, such as the economic growth in Ontario and Western New York, population growth in both of these areas, U.S. - Canada currency exchange rate developments, airline fare levels, and other relevant factors. Using a regression analysis, the Gross Domestic Product of Ontario (expressed in real terms) was identified as the variable with the strongest correlations with historic O&D traffic development. The regression analysis produced a high adjusted R2 value of 0.847, indicating that this variable is expected to serve as a reliable predictor fur future total O&D traffic development. See Figure 4-12 for the Goodness-of-Fit Econometric Model output, where Goodness-of-Fit refers to how well a set of variables explains another set of variables.

4-18 Air Traffic Forecasts
Figure 4-12 Goodness-of-Fit Econometric Model - Total O&D Traffic
Source: InterVISTAS Consulting Group.
The model for determining total O&D traffic can be described by the following equation:
Ln(Total O&D Traffic)
= c1 + c2 * Ln(Real Ontario GDP) where:
Ln is the natural log of the variable
Total O&D traffic is total annual O&D traffic
Real Ontario GDP is the Ontario Gross Domestic Product adjusted for inflation
c1, and c2, are the estimated model parameters capturing the impact of various factors on the Buffalo Niagara Region’s total O&D traffic growth
The econometric model describing total O&D traffic resulted in the following values for the dominant parameters, or elasticities:
GDP elasticity of 1.74 Considerable research has established a positive relationship between economic growth (or income growth) and air travel (For example, see: Air Travel Demand Elasticities: Concepts, Issues and Measurement, D. Gillen, W.G. Morrison and C. Stewart, 2002). In many cases, demand for air travel grows at a rate higher than that of the economy, so that each 1% increase in GDP results in air traffic growth of 1.0% to 2.0%. However, as markets mature, the GDP elasticity tends to decline – further GDP growth has a smaller impact on air travel growth. The
0
5
10
15
20
25
30
35
40
1996 2001 2006 2011
To
tal A
nn
ual
O&
D P
asse
ng
ers
(mill
ion
s)
Predicted by model Historic
GOODNESS-OF-FIT ECONOMETRIC MODEL TOTAL O&D TRAFFIC
R-square: 0.847
4-19 Air Traffic Forecasts
regression results indicate a very high GDP parameter: each 1% increase in GDP results in a 1.74% increase in total O&D traffic. While there is potential for air traffic development in the Buffalo Niagara Region, the market will ultimately reach maturity and consequently, the elasticity value requires adjustment in order to reflect the most probable trend. Consequently, the elasticity for this forecast is modeled to decrease to 1.2 by the end of the forecast period. Research on income elasticity for U.S. air travel has produced values of between 1.6 and 2.25
2. Using forecasts of the Ontario Gross Domestic Product (expressed in real terms)6, future total O&D forecast levels were generated.
Total U.S. Market O&D Traffic- Including U.S. Leisure Market
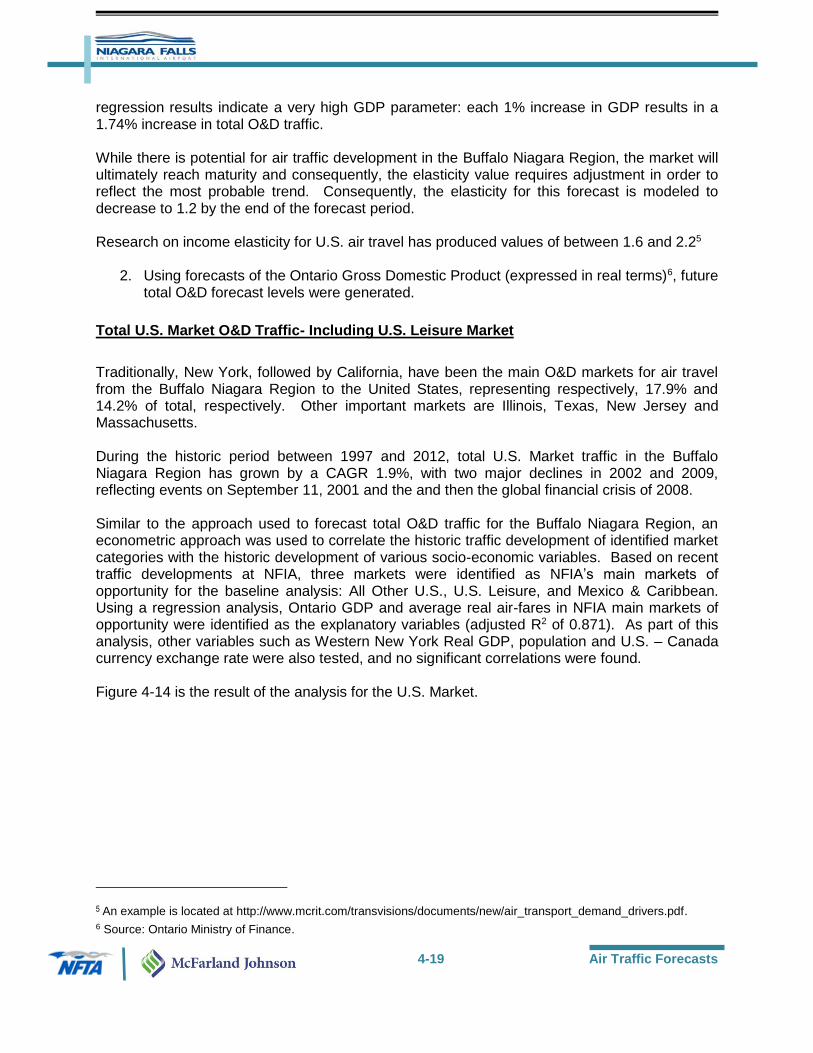
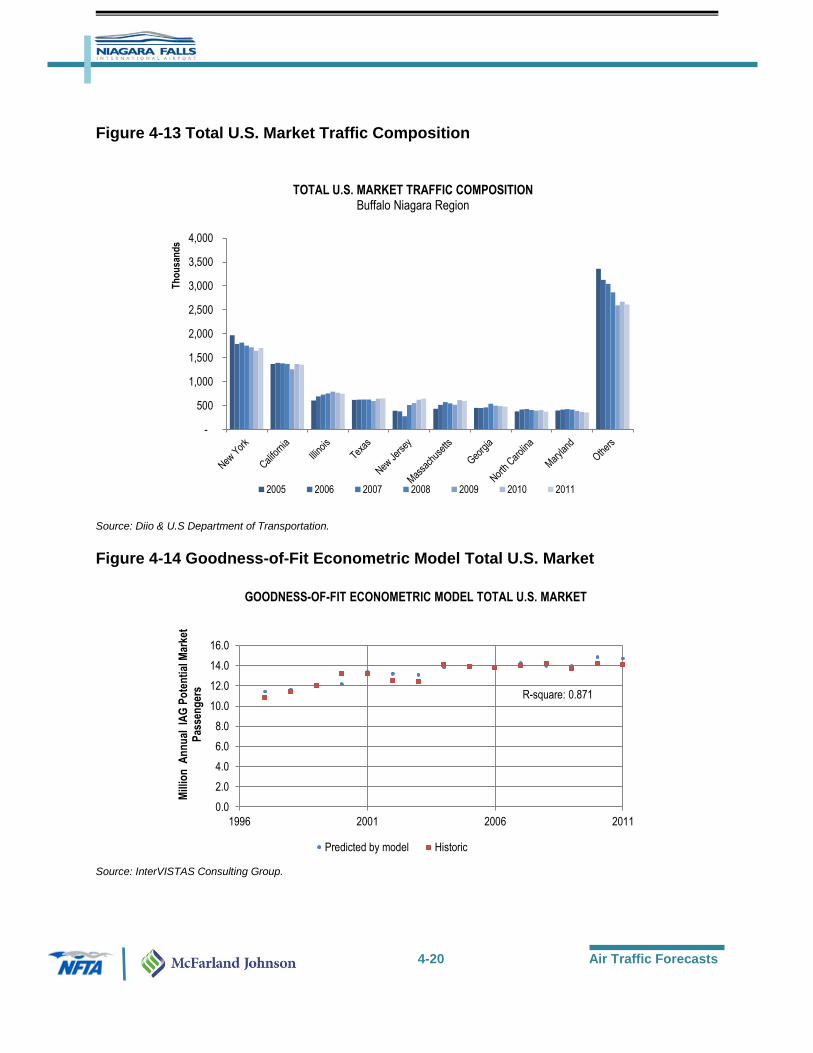
Traditionally, New York, followed by California, have been the main O&D markets for air travel from the Buffalo Niagara Region to the United States, representing respectively, 17.9% and 14.2% of total, respectively. Other important markets are Illinois, Texas, New Jersey and Massachusetts. During the historic period between 1997 and 2012, total U.S. Market traffic in the Buffalo Niagara Region has grown by a CAGR 1.9%, with two major declines in 2002 and 2009, reflecting events on September 11, 2001 and the and then the global financial crisis of 2008. Similar to the approach used to forecast total O&D traffic for the Buffalo Niagara Region, an econometric approach was used to correlate the historic traffic development of identified market categories with the historic development of various socio-economic variables. Based on recent traffic developments at NFIA, three markets were identified as NFIA’s main markets of opportunity for the baseline analysis: All Other U.S., U.S. Leisure, and Mexico & Caribbean. Using a regression analysis, Ontario GDP and average real air-fares in NFIA main markets of opportunity were identified as the explanatory variables (adjusted R2 of 0.871). As part of this analysis, other variables such as Western New York Real GDP, population and U.S. – Canada currency exchange rate were also tested, and no significant correlations were found. Figure 4-14 is the result of the analysis for the U.S. Market.
5 An example is located at http://www.mcrit.com/transvisions/documents/new/air_transport_demand_drivers.pdf. 6 Source: Ontario Ministry of Finance.
4-20 Air Traffic Forecasts
Figure 4-13 Total U.S. Market Traffic Composition
Source: Diio & U.S Department of Transportation.
Figure 4-14 Goodness-of-Fit Econometric Model Total U.S. Market
Source: InterVISTAS Consulting Group.
-
500
1,000
1,500
2,000
2,500
3,000
3,500
4,000
Th
ou
san
ds
2005 2006 2007 2008 2009 2010 2011
TOTAL U.S. MARKET TRAFFIC COMPOSITIONBuffalo Niagara Region
0.0
2.0
4.0
6.0
8.0
10.0
12.0
14.0
16.0
1996 2001 2006 2011
Mill
ion
An
nu
al I
AG
Po
ten
tial
Mar
ket
Pas
sen
ger
s
Predicted by model Historic
GOODNESS-OF-FIT ECONOMETRIC MODEL TOTAL U.S. MARKET
R-square: 0.871

4-21 Air Traffic Forecasts
The corresponding model can be described by the following equation:
Ln(Total U.S. Traffic)2003-2010
= c1 + c2 * Ln(Real Ontario GDP) + c3 * Ln(Real Average Airfare)) +c4 * dummy9/11 + c5 * Dummy economic crisis
where:
Ln is the natural log of the variable
Total U.S. traffic is Total U.S. Market O&D traffic including the U.S. Leisure Market
Real Ontario GDP is the Ontario Gross Domestic Product adjusted for inflation
Real Average Airfare is the air fare on NFIA markets of opportunity, adjusted for inflation
Dummy9/11 is a 0,1 dummy, picking up the value 1 in 2001 to reflect the impact of the September 11th events on traffic;
Dummy economic crisis is a 0,1 dummy, picking up the value 1 in 2009 to reflect the impact of the financial crisis on traffic;
c1, c2, c3, c4 and c5 are the estimated model parameters capturing the impact of various factors on traffic growth
The regression analysis produced the following values for the model parameters:
GDP elasticity of 1.2
Air fare coefficient of -0.32
In comparison to the GDP elasticity for the total O&D market, the results from the total U.S. market traffic suggest a more mature market where GDP growth will stimulate traffic growth at a slower pace. The fare elasticity falls within a range that can be expected for this market. As mentioned previously, research on income elasticity for U.S. air travel has produced values of between 1.6 and 2.2. For the fare elasticities, research has estimated values of between -0.2 and -2.0.7 The fare elasticity estimates produced by the model fall within that range. Using forecasts of the respective model variables and the relationship derived from the regression analysis, future Total U.S. traffic levels were forecast. Ontario Ministry of Finance’s forecast of the Ontario GDP was used, while the fares are projected to remain constant over the forecast period.
U.S. Leisure Market O&D Traffic
As presented in Figure 4-15, Florida has been the main O&D market for leisure travel for the Buffalo Niagara Region, representing 70% of the U.S. Leisure Market and growing by a CAGR
7 http://www.iata.org/whatwedo/Documents/economics/InterVISTAS_Elasticity_Study_2007.pdf

4-22 Air Traffic Forecasts
Figure 4-15 U.S. Leisure Market Traffic Composition
Source: Diio & U.S. Department of Transportation.
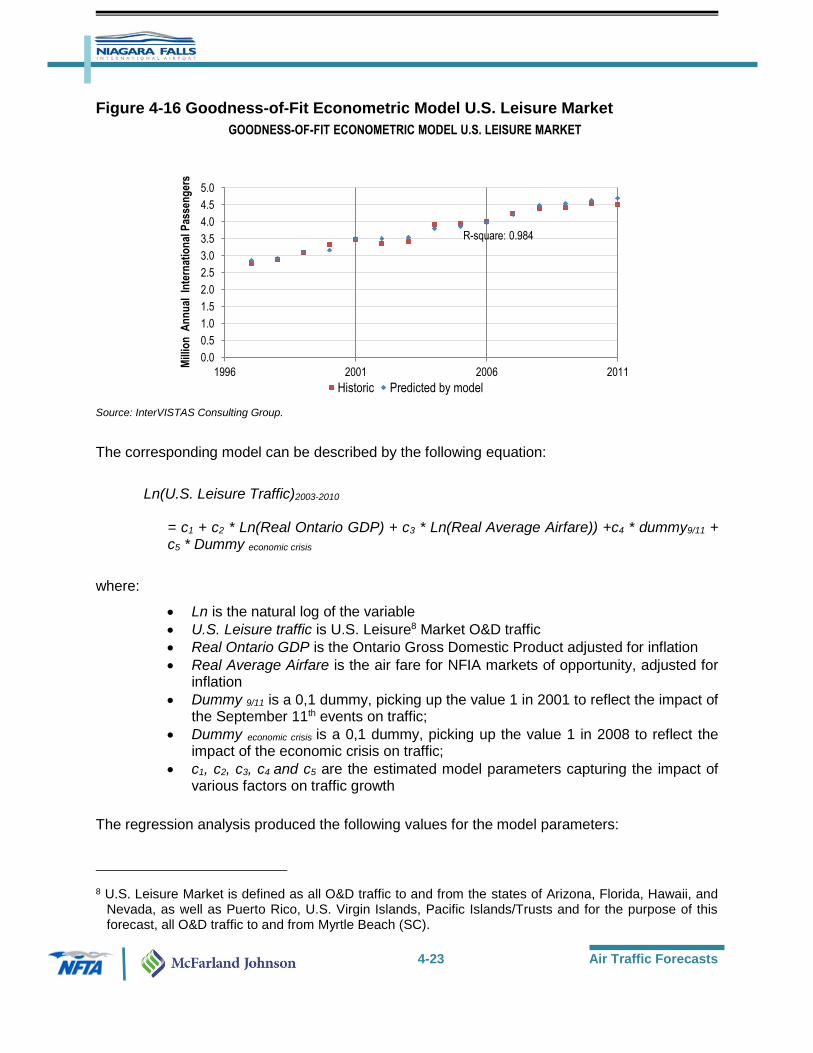
of 2.1%. Nevada is the second biggest market, with 17% market share and increasing by a CAGR of 4.7%. During the historic period between 1997 and 2012, U.S. Leisure Market traffic in the Buffalo Niagara Region grew by a CAGR 3.5%. Similar to the approach to forecast total O&D traffic and Total U.S. Market traffic, an econometric approach was used to correlate the historic traffic development with the historic development of various socio-economic variables. Using a regression analysis, Ontario GDP and average real air fares on NFIA’s markets of opportunity, defined as All Other U.S., U.S. Leisure, Mexico, and Caribbean markets were identified as the explanatory variables (adjusted R2 of 0.984). As part of this analysis other variables such as Western New York Real GDP, population and exchange rate were also tested, and no significant correlations were found. Figure 4-16 compares historical trend with the results of the econometric model.
-
500
1,000
1,500
2,000
2,500
3,000
3,500
Th
ou
san
ds
2005 2006 2007 2008 2009 2010 2011
U.S. LEISURE MARKET TRAFFIC COMPOSITIONBuffalo Niagara Region
4-23 Air Traffic Forecasts
Figure 4-16 Goodness-of-Fit Econometric Model U.S. Leisure Market
Source: InterVISTAS Consulting Group.
The corresponding model can be described by the following equation:
Ln(U.S. Leisure Traffic)2003-2010
= c1 + c2 * Ln(Real Ontario GDP) + c3 * Ln(Real Average Airfare)) +c4 * dummy9/11 + c5 * Dummy economic crisis
where:
Ln is the natural log of the variable
U.S. Leisure traffic is U.S. Leisure8 Market O&D traffic
Real Ontario GDP is the Ontario Gross Domestic Product adjusted for inflation
Real Average Airfare is the air fare for NFIA markets of opportunity, adjusted for inflation
Dummy 9/11 is a 0,1 dummy, picking up the value 1 in 2001 to reflect the impact of the September 11th events on traffic;
Dummy economic crisis is a 0,1 dummy, picking up the value 1 in 2008 to reflect the impact of the economic crisis on traffic;
c1, c2, c3, c4 and c5 are the estimated model parameters capturing the impact of various factors on traffic growth
The regression analysis produced the following values for the model parameters:
8 U.S. Leisure Market is defined as all O&D traffic to and from the states of Arizona, Florida, Hawaii, and Nevada, as well as Puerto Rico, U.S. Virgin Islands, Pacific Islands/Trusts and for the purpose of this forecast, all O&D traffic to and from Myrtle Beach (SC).
0.0
0.5
1.0
1.5
2.0
2.5
3.0
3.5
4.0
4.5
5.0
1996 2001 2006 2011
Mill
ion
An
nu
al I
nte
rnat
ion
al P
asse
ng
ers
Historic Predicted by model
GOODNESS-OF-FIT ECONOMETRIC MODEL U.S. LEISURE MARKET
R-square: 0.984

4-24 Air Traffic Forecasts
GDP elasticity of 2.7
Air fare coefficient of -0.35
In comparison to the GDP elasticity on the total O&D market and the Total U.S. Market, the results from the Total U.S. Leisure market traffic suggest a less mature market where GDP growth will stimulate significant traffic growth. The fare elasticity falls within a range that can be expected for leisure markets. While there is opportunity for air traffic development in the region, the market will ultimately reach maturity and consequently, the elasticity was adjusted to reflect the most probable trend. Consequently, the elasticity is modeled to decrease to 1.5 by the end of the forecast period, which is a common multiplier for leisure markets. Using forecasts of the respective model variables and the relationship derived from the regression analysis, future Total U.S. Leisure traffic levels could be forecast. Ontario Ministry of Finance’s forecast of the Ontario GDP was used, while fare levels are projected to remain constant over the forecast period.
Mexico and Caribbean Market O&D Traffic
As presented in Figure 4-17, Mexico is the largest O&D market for Buffalo Niagara Region air travel to and from Latin America and the Caribbean. Mexico represents 20.9% of the total traffic and a CAGR of 9.4%. Jamaica and Cuba are the other two significant markets, with respectively 13.6% and 8.7% market share and CAGR of 6.9% and 13.0%. The Dominican Republic is the fastest growing market with CAGR of 33.8% its market share has increased from 2.6% in 2005 to 8.8% in 2011.

4-25 Air Traffic Forecasts
Figure 4-17 Mexico and Caribbean Market Traffic Composition
Source: Diio & U.S. Department of Transportation.
During the historic period between 1997 and 2012, traffic to and from Mexico & Caribbean Market in the Buffalo Niagara Region grew by a CAGR 5.5%. Similar to the approach used to forecast the other three market categories, an econometric approach was used to correlate the historic traffic development with the historic development of various socio-economic variables. Using a regression analysis, Ontario GDP was identified as the explanatory variable (adjusted R2 of 0.815). As part of this analysis other variables such as Western New York Real GDP, population and exchange rate were also tested, and no significant correlations were found.
0
100
200
300
400
500
600
Th
ou
san
ds
2005 2006 2007 2008 2009 2010 2011
MEXICO AND CARIBBEAN MARKET TRAFFIC COMPOSITIONBuffalo Niagara Region

4-26 Air Traffic Forecasts
Figure 4-18 Goodness-of-Fit Econometric Model Mexico & Caribbean Market
Source: InterVISTAS Consulting Group.
The corresponding model can be described by the following equation:
Ln(Mexico and Caribbean Traffic)2003-2010
= c1 + c2 * Ln(Real Ontario GDP) + c3 * Dummy9/11
where:
Ln is the natural log of the variable
Mexico and Caribbean traffic is total O&D traffic to and from Central, South and Latin American Market
Real Ontario GDP is the Ontario Gross Domestic Product adjusted for inflation
Dummy 9/11 is a 0,1 dummy, picking up the value 1 in 2002 and 2003 to reflect the impact of the September 11th events on traffic;
c1, c2, and c3, are the estimated model parameters capturing the impact of various factors on traffic growth
The regression analysis produced the following values for the model parameters:
GDP elasticity of 3.4
In comparison to the GDP elasticity on the other three markets, the results from the Mexico & Caribbean Market traffic suggest a developing market where GDP growth will stimulate extremely high traffic growth.
0.0
0.5
1.0
1.5
2.0
2.5
3.0
1996 2001 2006 2011
To
tal A
nn
ual
In
tern
atio
nal
Pas
sen
ger
s (m
illio
ns)
Historic Predicted by model
GOODNESS-OF-FIT ECONOMETRIC MODEL MEXICO & CARIBBEAN MARKET
R-square: 0.815
4-27 Air Traffic Forecasts
While there is substantial scope for air traffic development in the Buffalo Niagara Region, the market will ultimately reach maturity and consequently, the elasticity was adjusted in order to reflect the most probable trend. Consequently, the elasticity is modeled to decrease to 1.5 by the end of the planning period, which is a common multiplier for leisure markets such as those found in the Mexico and Caribbean regions. Using forecasts of the respective model variables and the relationship derived from the regression analysis, future Total Mexico and Caribbean traffic levels could be forecast. Ontario Ministry of Finance’s forecast of the Ontario GDP has been used.
Seat Capacity Analysis
The forecast resulting from the top-down econometric approach has been blended with a bottom-up analysis of the available airline seat capacity. Short-term capacity levels in the region, as well as the available year-to-date data, were examined in order to calibrate the traffic forecast for the initial years. By analyzing current capacity as published in the Official Airline Guide, and Diio, (Data In, Intelligence Out, an Amadeus Database), forecast periods were adjusted to reflect what capacity level is expected to enter the market. InterVISTAS has also interviewed representatives of NFIA to inform forecast results. Based on these conversations, as well as observation of airline industry trends, InterVISTAS has used an assumption of 4% annual growth rate between years 2013-2015. Beginning in 2016, the projected growth rate estimated through the econometric-models for each market is applied.
Introduction of Trans-Atlantic Services
In addition to the projected O&D traffic through the analysis of the historical trend and the developed econometric model as mentioned above, a Trans-Atlantic service at NFIA with Boeing 757 or similar type aircraft, is also introduced. It is expected that these services would be for Western Europe markets – such as the United Kingdom and Ireland. The incorporation of Trans-Atlantic services to the forecast is based on detailed information obtained regarding NFIA’s marketing efforts to attract airlines serving European markets and the potential of those airlines initiating operations at NFIA in the future. It is anticipated that this service could begin as early as 2020 with up to two (2) weekly departures in the first year. Key assumptions developing this scenario are:
Average load factor of approx. 85%
Flights will be seasonal in nature and, throughout the forecast period, the season
is assumed to be 13 weeks long.
The first 9-10 years the equipment on this route is assumed to be Boeing 757 or
a similar type aircraft, gradually replaced with Boeing 767 or similar type aircraft,
Weekly round-trips will increase over time during the forecast period as follows:
o Year 1: 2 weekly departure o Years 2-3: 4 weekly departures

4-28 Air Traffic Forecasts
o Years 4-5: 6 weekly departures o Years 6-8: 10 weekly departures o Years 9-10: 14 weekly departures o Years 11-13: 16 weekly departures o Years 14-17: 18 weekly departures o Years 18-21: 20 weekly departures
4.5.3 Aircraft Movements
Commercial airline aircraft movements are generally a function of passenger traffic demand and air service development, shaped by carrier networks and average aircraft size. Forecasts of future aircraft movements are derived taking into consideration passenger traffic demand, potential service improvement/expansion, change of average aircraft size, and load factor. Passenger aircraft movements depend on the average aircraft size and average load factor (i.e. average passengers per flight), as represented by the formula below:
Aircraft movements = Passenger movements
Average aircraft size x average load factor

4-29 Air Traffic Forecasts
4.6 AIR TRAFFIC FORECAST
4.6.1 Total O&D Passenger Forecast
The Baseline Case, or most likely forecast, of passenger traffic at NFIA combined with the introduction of a Trans-Atlantic service is provided in Table 4-4.
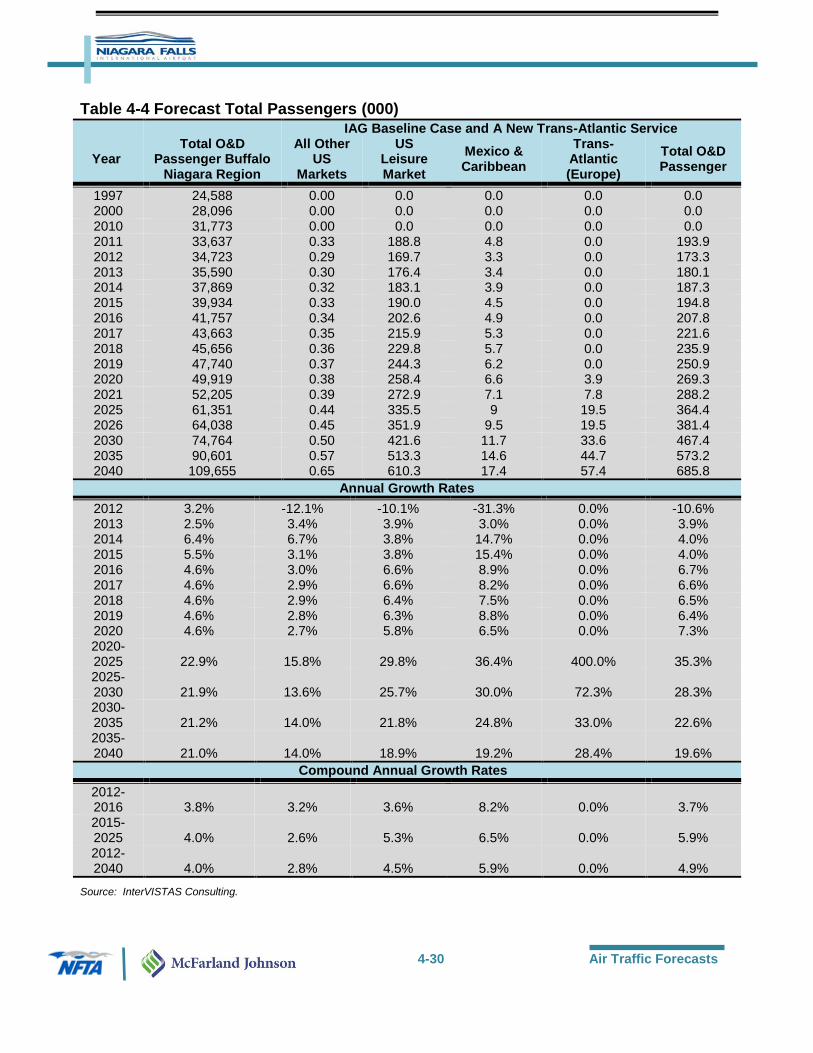
Total O&D passenger traffic is expected to increase 4.0% in fiscal year 2013 to 180,137 total annual passengers. Under the influence of the strong and continuing growth of the Ontario economy, total traffic at NFIA is predicted to increase to 710,789 total annual passengers in 2040. Over the forecast period from 2012 through 2040, traffic is forecast to grow by a CAGR of 5.0%. Table 4-4 also shows breakdowns into All Other U.S. Market, U.S. Leisure Market, Mexico & Caribbean, and Transatlantic (Europe) traffic. U.S. Leisure Market continues to be the largest traffic segment over the planning period. Although this segment is projected to increase by 260% over the period between 2012 and 2040, its share of total traffic is projected to decline slightly from approximately 97.1% in 2012 to 89.0% in 2040 as the growth in other markets outpaces US Leisure traffic growth.
4-30 Air Traffic Forecasts
Table 4-4 Forecast Total Passengers (000)
Total O&D
Passenger Buffalo Niagara Region
IAG Baseline Case and A New Trans-Atlantic Service
Year All Other
US Markets
US Leisure Market
Mexico & Caribbean
Trans-Atlantic (Europe)
Total O&D Passenger
1997 24,588 0.00 0.0 0.0 0.0 0.0 2000 28,096 0.00 0.0 0.0 0.0 0.0 2010 31,773 0.00 0.0 0.0 0.0 0.0 2011 33,637 0.33 188.8 4.8 0.0 193.9 2012 34,723 0.29 169.7 3.3 0.0 173.3 2013 35,590 0.30 176.4 3.4 0.0 180.1 2014 37,869 0.32 183.1 3.9 0.0 187.3 2015 39,934 0.33 190.0 4.5 0.0 194.8 2016 41,757 0.34 202.6 4.9 0.0 207.8 2017 43,663 0.35 215.9 5.3 0.0 221.6 2018 45,656 0.36 229.8 5.7 0.0 235.9 2019 47,740 0.37 244.3 6.2 0.0 250.9 2020 49,919 0.38 258.4 6.6 3.9 269.3 2021 52,205 0.39 272.9 7.1 7.8 288.2 2025 61,351 0.44 335.5 9 19.5 364.4 2026 64,038 0.45 351.9 9.5 19.5 381.4 2030 74,764 0.50 421.6 11.7 33.6 467.4 2035 90,601 0.57 513.3 14.6 44.7 573.2 2040 109,655 0.65 610.3 17.4 57.4 685.8
Annual Growth Rates
2012 3.2% -12.1% -10.1% -31.3% 0.0% -10.6% 2013 2.5% 3.4% 3.9% 3.0% 0.0% 3.9% 2014 6.4% 6.7% 3.8% 14.7% 0.0% 4.0% 2015 5.5% 3.1% 3.8% 15.4% 0.0% 4.0% 2016 4.6% 3.0% 6.6% 8.9% 0.0% 6.7% 2017 4.6% 2.9% 6.6% 8.2% 0.0% 6.6% 2018 4.6% 2.9% 6.4% 7.5% 0.0% 6.5% 2019 4.6% 2.8% 6.3% 8.8% 0.0% 6.4% 2020 4.6% 2.7% 5.8% 6.5% 0.0% 7.3% 2020-2025 22.9% 15.8% 29.8% 36.4% 400.0% 35.3% 2025-2030 21.9% 13.6% 25.7% 30.0% 72.3% 28.3% 2030-2035 21.2% 14.0% 21.8% 24.8% 33.0% 22.6% 2035-2040 21.0% 14.0% 18.9% 19.2% 28.4% 19.6%
Compound Annual Growth Rates
2012-2016 3.8% 3.2% 3.6% 8.2% 0.0% 3.7% 2015-2025 4.0% 2.6% 5.3% 6.5% 0.0% 5.9% 2012-2040 4.0% 2.8% 4.5% 5.9% 0.0% 4.9%
Source: InterVISTAS Consulting.

4-31 Air Traffic Forecasts
The forecast anticipates the addition of new routes to Europe, as well as additional frequencies on existing international routes. As a result, Trans-Atlantic traffic is forecast to grow by a compound annual growth rate of 13.7% from 2020-2040. By 2040, the Trans-Atlantic segment accounts for 8.4% of total passenger traffic, compared to no traffic until 2020. The fluctuating growths throughout the planning period are derived by the anticipated increases in the weekly scheduled frequencies.
4.6.2 Aircraft Movements Forecast
The Baseline Case, or most likely forecast of aircraft movements (two-way), is provided in Table 4-5. In the Baseline Case forecast, total commercial aircraft movements (two-way) are projected to grow by CAGR of 3.6% over the forecast period, reaching 3,751 movements (two-way) in 2040 compare to 1,328 in 2012. Military operations are expected to grow 5% by the end of the forecast period, and reach 8,238 movements in 2040 compared to 7,846 in 2012, equivalent to 0.2% CAGR over the forecast period. Additionally, the General Aviation operations are expected to remain flat through the forecast period, reaching 18,090 movements (two-way) in 2040 compare to 17,911 in 2012. Over the forecast period this corresponds to a 0.04% CAGR. In line with the historical trend, no increase in air cargo operations is forecasted in the Baseline Case. Total aircraft movements at NFIA reach 30,081 (two-way) in 2040, representing a CAGR of 0.4% over the forecast period. The fluctuating growths throughout the planning period are derived by the anticipated increases in the weekly scheduled frequencies.
4.7 FLEET MIX
4.7.1 Commercial Aviation
During the forecast period, it is expected that the commercial fleet mix at NFIA will remain fairly consistent and maintain similarities to present day operations. Currently, both Spirit and Allegiant operate aircraft in FAA Airplane Design Group III at NFIA. Spirit utilizes A320s and Allegiant utilizes MD80s. For the Baseline Case traffic categories - All Other US, US Leisure, and Mexico & Caribbean – InterVISTAS expects that Design Group III airplanes will remain the aircraft of choice for airlines carrying passengers in these NFIA markets. Given the geographic locations of the expected NFIA markets, the predicted sizes of those markets and the vast number of airlines operating these aircraft, InterVISTAS is confident in this assumption. Aircraft such as the B737, A320 and MD80 have been the workhorses of many US airlines for decades and it is highly likely that their positive attributes and their continued refinement will make them ubiquitous at airports like NFIA for several more decades.
Accordingly, InterVISTAS’ forecast model for NFIA incorporated aircraft of a size (in number of seats) that is consistent with Design Group III aircraft. The number of seats onboard these aircraft are expected to range from 130-180 over the forecast period. As discussed previously,

4-32 Air Traffic Forecasts
Table 4-5 Forecast Total Aircraft Movements (Operations)
Year Commercial Cargo Military GA
Itinerant GA Local Total
1997 0 - 12,328 14,906 19,883 47,117 2000 0 - 13,052 13,365 14,697 41,114 2010 0 - 9,130 14,112 11,150 34,392 2011 1,706 - 6,873 12,170 7,724 28,473 2012 1,328 - 7,846 10,957 6,954 27,085 2013 1,380 - 7,860 10,961 6,957 27,158 2014 1,415 - 7,874 10,965 6,959 27,213 2015 1,452 - 7,888 10,969 6,961 27,270 2016 1,528 - 7,902 10,973 6,964 27,367 2017 1,607 - 7,916 10,977 6,966 27,466 2018 1,689 - 7,930 10,980 6,969 27,568 2019 1,773 - 7,944 10,984 6,972 27,673 2020 1,877 - 7,958 10,988 6,974 27,797 2021 1,953 - 7,972 10,992 6,976 27,893 2025 2,392 - 8,028 11,008 6,986 28,414 2026 2,475 8,042 11,012 6,989 28,518 2030 2,891 - 8,098 11,027 7,000 29,016 2035 3,327 - 8,168 11,047 7,012 29,554 2040 3,751 - 8,238 11,067 7,025 30,081
Annual Growth Rates
2012 -22.2% - 14.2% -10.0% -10.0% -4.9% 2013 3.9% - 0.2% 0.0% 0.0% 0.3% 2014 2.5% - 0.2% 0.0% 0.0% 0.2% 2015 2.6% - 0.2% 0.0% 0.0% 0.2% 2016 5.2% - 0.2% 0.0% 0.0% 0.4% 2017 5.2% - 0.2% 0.0% 0.0% 0.4% 2018 5.1% - 0.2% 0.0% 0.0% 0.4% 2019 5.0% - 0.2% 0.0% 0.0% 0.4% 2020 5.9% - 0.2% 0.0% 0.0% 0.4%
2020-2025 27.4% - 0.9% 0.2% 0.2% 2.2% 2025-2030 20.9% - 0.9% 0.2% 0.2% 2.1% 2030-2035 15.1% - 0.9% 0.2% 0.2% 1.9% 2035-2040 12.7% - 0.9% 0.2% 0.2% 1.8%
Compound Annual Growth Rates
2012-2016 2.8% - 0.1% 0.0% 0.0% 0.2% 2015-2025 4.6% - 0.2% 0.0% 0.0% 0.4% 2012-2040 3.6% - 0.2% 0.0% 0.0% 0.4%
Source: InterVISTAS Consulting, McFarland Johnson, Inc.
average load factor assumptions are applied to aircraft with these seat counts to determine the estimated aircraft operations at NFIA. The projection of the fleet mix is also greatly influenced by Spirit and Allegiant fleet plan. Table 4-6 below illustrates the expected mix at NFIA. Based on the Allegiant’s projected fleet plan, by 2015 the airline will be utilizing 19 A319 compare to 0 in 2012. The published fleet plan of Spirit also reports an increase of 30%, growing from 54 to 71 Airbus narrow-bodies. This graduate shift towards the next generation narrow-body aircraft has been assumed in the NFIA fleet mix projection.

4-33 Air Traffic Forecasts
For the Baseline Case traffic category - Trans-Atlantic Europe Service Introduction – InterVISTAS expects that Design Group IV airplanes will be the most likely types of aircraft flying between NFIA and European destinations. The aircraft in Design Group IV such as the B757 and the B767 are very commonly used by airlines operating between points in the eastern US and Europe. The aircraft size (in seats), range capabilities and economics are well-suited for many US-Europe markets, including NFIA. During the forecast period in the Trans-Atlantic Europe Service Introduction category, InterVISTAS expects the aircraft size (in seats) to increase as passenger demand levels increase. For approximately the first 15 years of service, InterVISTAS assumes B757 will carry this traffic. After Year 15, the aircraft utilized will begin migrating to the B767. As a result, InterVISTAS sees average seats per operation increasing from about 180 to almost 300 seats during the forecast period. In addition to the commercial fleet mix projections, InterVISTAS has also analyzed the historical weekly General Aviation movements in NFIA. Single-Engine Piston has been determined as the main aircraft with almost 40% share. The General Aviation operation in NFIA is expected to remain quite stable and a limited growth is assumed throughout the planning period, which is also reflected in the expected fleet mix, maintaining the same distribution. With respect to the Military operations, currently C-130 Hercules is the dominant aircraft at NFIA, and is expected to remain the main aircraft to be operated in the Niagara Falls Air Reserve Station. The expected fleet mix distribution at NFIA is illustrated in Table 4-6 below.
Table 4-6 Niagara Falls International Airport Fleet Mix Forecast
Aircraft Seats
FAA Design Code
2012 2018 2023 2033
Departures Share Departures Share Departures Share Departures Share
COMMERCIAL
A 320 175 III 208 31.3% 268 31.7% 333 30.6% 467 29.5% MD - 80 160 III 456 68.7% 548 64.9% 286 26.3% 150 9.5% B - 757 200 IV - 0.0% - 0.0% 39 3.6% 117 7.4% B - 767 250 IV - 0.0% - 0.0% - 0.0% - 0.0% A-319 150 III - 0.0% 29 3.4% 429 39.5% 849 53.6%
GENERAL AVIATION
Single-Engine Piston
3,565 39.8% 3,572 39.8% 3,578 39.8% 3,591 39.8%
Single-Engine Turboprop
1,541 17.2% 1,543 17.2% 1,546 17.2% 1,552 17.2%
Twin-Engine Jet
1,442 16.1% 1,445 16.1% 1, 448 16.1% 1,453 16.1% Twin-Engine Piston
1,156 12.9% 1,158 12.9% 1,160 12.9% 1,164 12.9%
Twin-Engine Turboprop
1,253 14.0% 1,256 14.0% 1,259 14.0% 1,263 14.0%
MILITARY
C-130 Hercules
3,923 100.0% 3,965 100.0% 4,000 100.0% 4,070 100.0%
Source: InterVISTAS Consulting.
4-34 Air Traffic Forecasts
4.8 GENERAL AVIATION FORECASTS
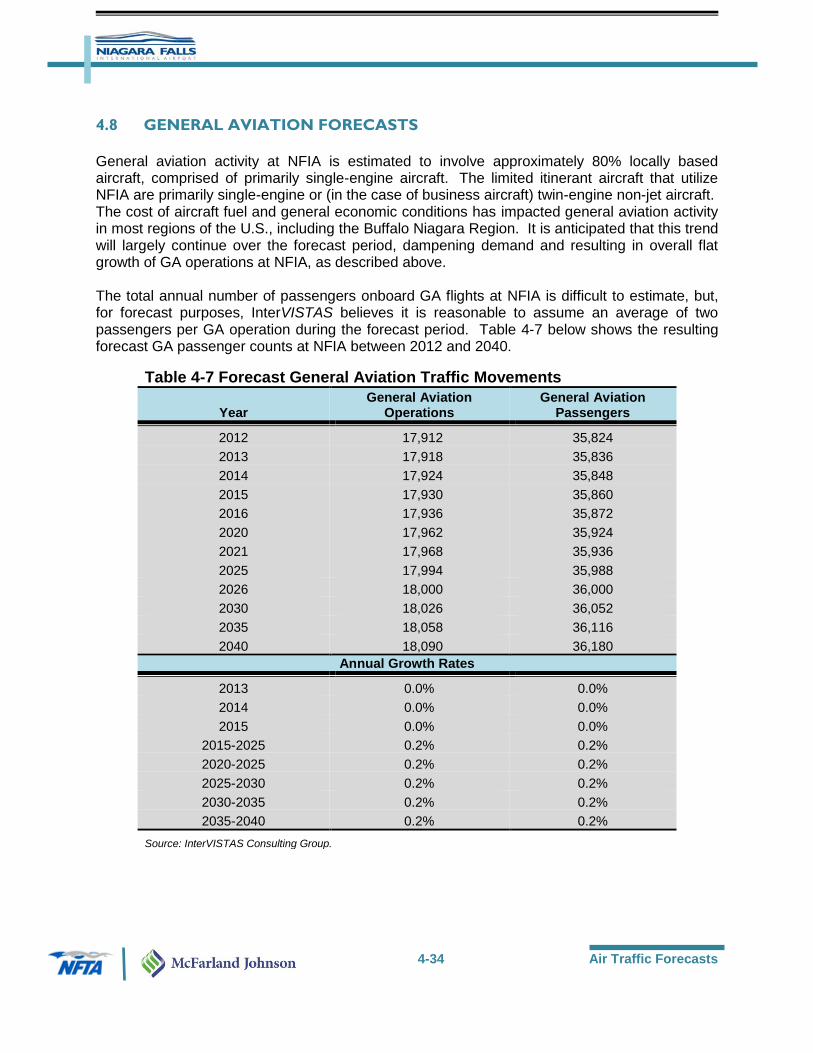
General aviation activity at NFIA is estimated to involve approximately 80% locally based aircraft, comprised of primarily single-engine aircraft. The limited itinerant aircraft that utilize NFIA are primarily single-engine or (in the case of business aircraft) twin-engine non-jet aircraft. The cost of aircraft fuel and general economic conditions has impacted general aviation activity in most regions of the U.S., including the Buffalo Niagara Region. It is anticipated that this trend will largely continue over the forecast period, dampening demand and resulting in overall flat growth of GA operations at NFIA, as described above. The total annual number of passengers onboard GA flights at NFIA is difficult to estimate, but, for forecast purposes, InterVISTAS believes it is reasonable to assume an average of two passengers per GA operation during the forecast period. Table 4-7 below shows the resulting forecast GA passenger counts at NFIA between 2012 and 2040.
Table 4-7 Forecast General Aviation Traffic Movements
Year General Aviation
Operations General Aviation
Passengers
2012 17,912 35,824
2013 17,918 35,836
2014 17,924 35,848
2015 17,930 35,860
2016 17,936 35,872
2020 17,962 35,924
2021 17,968 35,936
2025 17,994 35,988
2026 18,000 36,000
2030 18,026 36,052
2035 18,058 36,116
2040 18,090 36,180
Annual Growth Rates
2013 0.0% 0.0%
2014 0.0% 0.0%
2015 0.0% 0.0%
2015-2025 0.2% 0.2%
2020-2025 0.2% 0.2%
2025-2030 0.2% 0.2%
2030-2035 0.2% 0.2%
2035-2040 0.2% 0.2%
Source: InterVISTAS Consulting Group.

4-35 Air Traffic Forecasts
4.8.1 Air Cargo Forecasts
Based on the findings of past cargo studies reviewed by InterVISTAS, it is apparent that air cargo levels at Niagara Falls International Airport are highly influenced by competition from other airports in the region, appropriate airline services to transport cargo, and cargo-related infrastructure at NFIA. From a regional perspective, it is anticipated that the vast majority of commercial air services in the Buffalo Niagara Region will remain located at Buffalo Niagara International Airport - including both passenger services and air express cargo services. In addition to BNIA’s air express carriers (FedEx and UPS), the airport’s passenger airlines will likely remain traditional network and low-cost carriers that are known to carry belly cargo. Due to the presence of these air services, BNIA will continue to attract the majority of air cargo moving in the region. Meanwhile, the passenger airlines expected to operate at NFIA are ultra low cost carriers (such as Allegiant and Spirit) that are known to forgo carrying belly cargo. The operational profiles of these types of carriers - where destinations are served on an infrequent, less-than-daily basis - makes them less attractive options to the air cargo community. Further, carriers offering international services between Europe and NFIA will also operate relatively infrequently where destinations may not be served on a daily basis from NFIA and only on a seasonal basis. Therefore, it is unlikely that the airlines at NFIA will carry meaningful amounts of cargo during the forecast period. Due to the small amounts of cargo that may be carried over the course of each year, Baseline Case forecasts show annual cargo volumes at a level equal to the average tonnage reported at NFIA between the years 2010 and 2012. The annual 31 metric tons of air cargo estimated represents the amount of cargo that will be carried by the types of airlines expected to operate at NFIA during the forecast period.
4.8.2 Based Aircraft Forecasts
The forecasts of based aircraft serve a prime role in the future planning of facilities at Niagara Falls International Airport. While many of the airside facilities will be planned based on the larger air carrier and military aircraft utilizing NFIA, the number of based general aviation aircraft is pivotal when planning for the development of future facilities such as aircraft hangars and apron space to accommodate based aircraft. The Federal Aviation Administration publishes an annual forecast that identifies national trends and growth/decline of general aviation aircraft by type, including single engine, multi-engine (piston), multi-engine (turbofan), jet, and rotorcraft. The FAA Aerospace Forecasts for Fiscal Years 2012-2032 indicate relatively flat conditions for all aircraft types, particularly for single engine and multi-engine aircraft, with a slightly higher rate of growth for jets and rotorcraft. However, as local socioeconomic conditions have been relatively flat in recent history, the growth rate for based single and multi-engine aircraft has been reduced by 50%, while the growth rate for jets and rotorcraft follow the rates identified in FAA’s Aerospace Forecasts for Fiscal Years 2012-2032. The number of based military aircraft is anticipated to remain unchanged throughout the forecast period. Table 4-8 indicates the forecast of based aircraft at NFIA compared with the projected numbers indicated in the FAA’s Terminal Area forecasts.

4-36 Air Traffic Forecasts
Table 4-8 Based Aircraft Forecasts
Year Single Multi Jet Rotor Military Total TAF
2012 53 4 3 1 12 73 47 2013 53 4 3 1 12 73 48 2014 53 4 3 1 12 73 48 2015 53 4 3 1 12 73 48 2016 53 4 3 1 12 73 49 2020 52 4 4 1 12 73 50 2021 52 4 4 1 12 73 51 2025 52 4 5 1 12 74 52 2026 52 4 5 1 12 74 52 2030 53 4 6 2 12 77 52 2035 53 4 7 2 12 78 52 2040 53 5 9 2 12 81 52
Source: McFarland-Johnson, Inc.
4.9 PEAK PERIOD FORECASTS
To support the airport facilities planning process, peak period forecasts were derived from the annual forecast numbers. Peak period forecasts present the air traffic activity levels that can be expected during peak hours, and typically drive airport facility requirements. Key indicators are the number of aircraft operations in the peak, driving the layout of the airfield, and peak hour passenger enplanements, driving the requirements for filters such as check-in, security and immigration.
4.9.1 Peak Hour Forecast of Aircraft Operations
Table 4-9 presents the historical peak period activity levels for Commercial, Military and General Aviation operations. The peak month and peak day activity levels for Commercial, Military and General Aviation operations are determined using the available data from the FAA Air Traffic Activity Systems Database. With historic peak hour data unavailable, commercial activity level in the peak hour has been estimated using commercial air carrier schedule data for 2011 and 2012. The historic schedule data indicates NFIA handled two aircraft operations in the peak hour. In addition, it is estimated the airport handled one additional charter aircraft in the peak hour. The number of Military and General Aviation operations in the peak hour is estimated assuming a certain distribution of traffic throughout the day. Traffic is not evenly distributed over the day, but typically has a distinct profile with peaks (where traffic activity is concentrated) and troughs (with no or limited activity). It is assumed activity in the peak hour is 150% times the theoretical average hourly activity if traffic were to be distributed evenly throughout the day.

4-37 Air Traffic Forecasts
Table 4-9 Peak Profile at Niagara Falls International Airport
2008 2009 2010 2011 2012
Commercial Operations Peak Month
143 166
Peak Day
14 20
Peak Hour
4 4
Military Operations Peak Month 902 1,043 1,045 809 877
Peak Day 115 118 117 102 126
Peak Hour 7 7 7 6 8
General Aviation Operations Peak Month 1,656 1,709 1,849 1,636 1,395
Peak Day 114 109 167 125 178
Peak Hour 7 7 10 8 11
Source: FAA ATAD; McFarland Johnson.
To forecast future peak month, peak day and peak hour operations for the Commercial, Military and General Aviation segments, the following ratio approach is used (a standard approach used in airport forecasting): Peak Month / Annual Aircraft Movements The ratio of peak month aircraft operations to annual aircraft movements. During the historic period reviewed, the average ratio was 14.97% for Commercial operations, 10.97% for Military operations and 12.85% for General Aviation operations. The ratio of peak month aircraft movements to annual aircraft movements is expected to remain constant during the forecast period for all segments.
Peak Day / Annual Aircraft Movements The ratio of peak day aircraft movements to annual aircraft movements. During the historic period reviewed, the average ratio was for 1.88% for Commercial operations, 1.37% for Military operations and 1.10% for General Aviation operations. The ratio of peak month aircraft movements to annual aircraft movements is expected to remain constant during the forecast period for all segments. As mentioned, the activity in the peak hour is determined by assuming a certain distribution of traffic throughout the day. By applying these average ratios to the projected Commercial, Military and General Aviation annual movements, the future peak profile can be forecasted and is presented in Table 4-10.
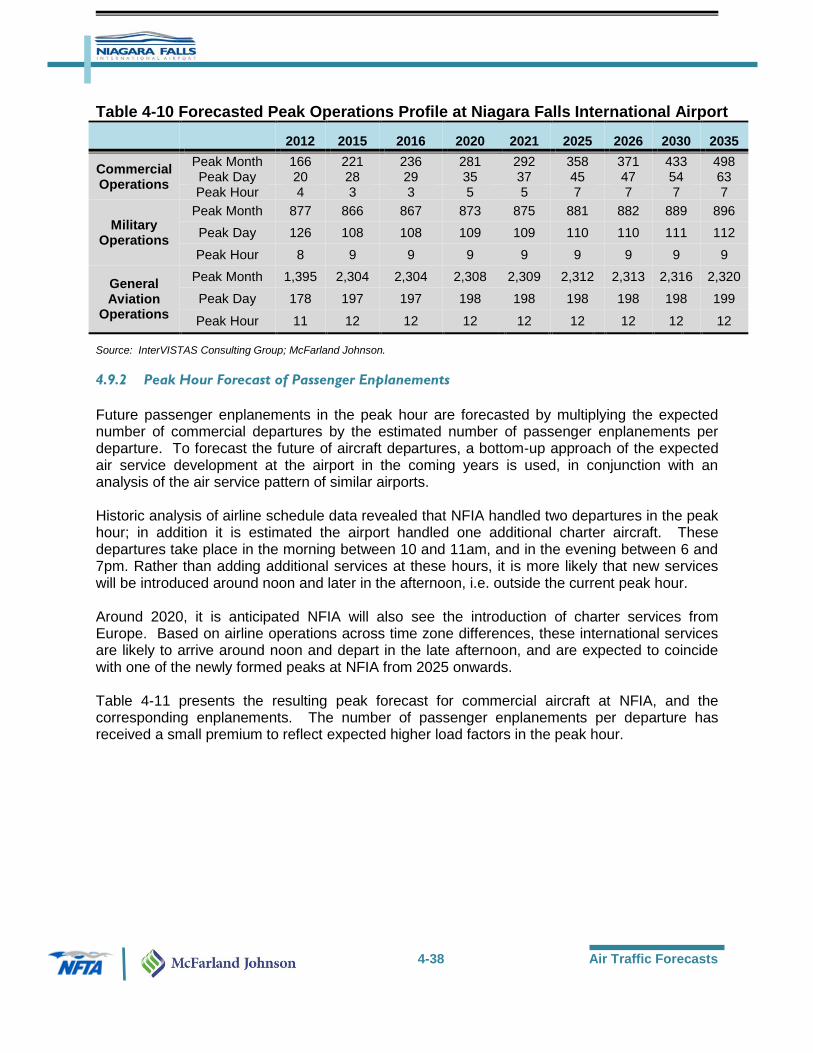
4-38 Air Traffic Forecasts
Table 4-10 Forecasted Peak Operations Profile at Niagara Falls International Airport
2012 2015 2016 2020 2021 2025 2026 2030 2035
Commercial Operations
Peak Month 166 221 236 281 292 358 371 433 498 Peak Day 20 28 29 35 37 45 47 54 63 Peak Hour 4 3 3 5 5 7 7 7 7
Military Operations
Peak Month 877 866 867 873 875 881 882 889 896
Peak Day 126 108 108 109 109 110 110 111 112
Peak Hour 8 9 9 9 9 9 9 9 9
General Aviation
Operations
Peak Month 1,395 2,304 2,304 2,308 2,309 2,312 2,313 2,316 2,320
Peak Day 178 197 197 198 198 198 198 198 199
Peak Hour 11 12 12 12 12 12 12 12 12
Source: InterVISTAS Consulting Group; McFarland Johnson.
4.9.2 Peak Hour Forecast of Passenger Enplanements
Future passenger enplanements in the peak hour are forecasted by multiplying the expected number of commercial departures by the estimated number of passenger enplanements per departure. To forecast the future of aircraft departures, a bottom-up approach of the expected air service development at the airport in the coming years is used, in conjunction with an analysis of the air service pattern of similar airports. Historic analysis of airline schedule data revealed that NFIA handled two departures in the peak hour; in addition it is estimated the airport handled one additional charter aircraft. These departures take place in the morning between 10 and 11am, and in the evening between 6 and 7pm. Rather than adding additional services at these hours, it is more likely that new services will be introduced around noon and later in the afternoon, i.e. outside the current peak hour. Around 2020, it is anticipated NFIA will also see the introduction of charter services from Europe. Based on airline operations across time zone differences, these international services are likely to arrive around noon and depart in the late afternoon, and are expected to coincide with one of the newly formed peaks at NFIA from 2025 onwards. Table 4-11 presents the resulting peak forecast for commercial aircraft at NFIA, and the corresponding enplanements. The number of passenger enplanements per departure has received a small premium to reflect expected higher load factors in the peak hour.

4-39 Air Traffic Forecasts
Table 4-11 Forecast Peak Enplanement Profile at Niagara Falls International Airport
Peak Hour Departures
Enplanements per Departure
Peak Hour Enplanements
Year Baseline European Service
Baseline European Service
Baseline European Service
2013 3 0 134 - 403 -
2014 3 0 134 - 403
2015 3 0 134 - 403 -
2020 4 0 143 - 573 -
2025 4 1 153 178 610 178
2030 4 1 162 210 647 210
2035 4 1 171 243 683 243
2040 4 1 180 275 720 275
Source: InterVISTAS Consulting.
The forecast projects that the peak hour enplanements will grow to 573 enplanements by 2020, 857 by 2030, and ultimately 995 by 2040, out of which 0, 210, and 275 enplanements respectively are associated with the introduction of the European Services. The key driver is the expected European services; these international services are likely to arrive around noon and depart in the late afternoon and coincide with one of the peaks at NFIA.
4.10 COMPARISON WITH FAA TERMINAL AREA FORECASTS
In comparing the NFIA forecasts with the FAA’s most recent Terminal Area Forecasts (“TAF”), it can be shown that the Master Plan Update is reasonably close in terms of Aircraft Operations levels (especially in the earlier years of the forecasts), but there are substantial differences in the Passenger Enplanements estimates (see Table 4-12). Additionally, Tables 4-13 and 4-14 below show alternative formats of the TAF comparisons to the Master Plan Update forecast results.
One reason for the variances in Passenger Enplanements relates to the large discrepancy between the figures reported for 2012. The FAA reports 94,912 enplanements, while InterVISTAS relied upon enplanements data reported by the U.S. Department of Transportation that shows 86,605 enplanements at NFIA. With the historic NFIA data varying between sources by 8.8%, the respective Enplanement forecasts are clearly starting at vastly different traffic levels which carry through to the out-years.
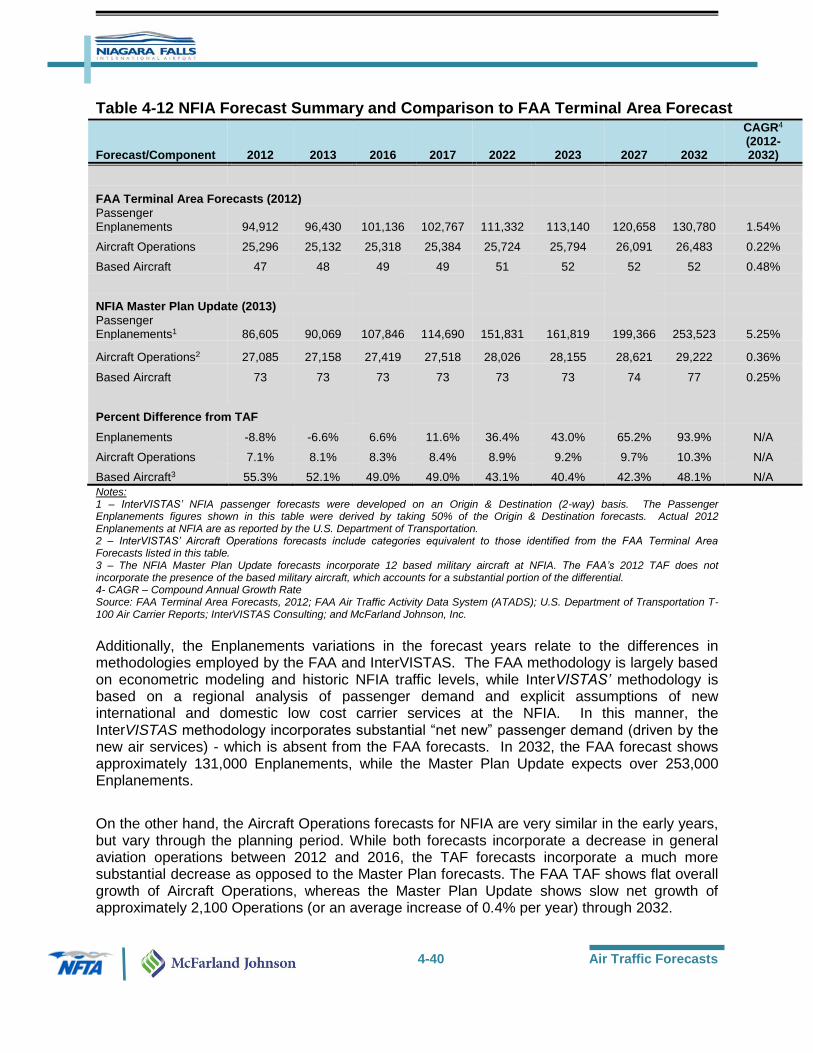
4-40 Air Traffic Forecasts
Table 4-12 NFIA Forecast Summary and Comparison to FAA Terminal Area Forecast
Forecast/Component 2012 2013 2016 2017 2022 2023 2027 2032
CAGR4 (2012-2032)
FAA Terminal Area Forecasts (2012)
Passenger Enplanements 94,912 96,430 101,136 102,767 111,332 113,140 120,658 130,780 1.54%
Aircraft Operations 25,296 25,132 25,318 25,384 25,724 25,794 26,091 26,483 0.22%
Based Aircraft 47 48 49 49 51 52 52 52 0.48%
NFIA Master Plan Update (2013)
Passenger Enplanements1 86,605 90,069 107,846 114,690 151,831 161,819 199,366 253,523 5.25%
Aircraft Operations2 27,085 27,158 27,419 27,518 28,026 28,155 28,621 29,222 0.36%
Based Aircraft 73 73 73 73 73 73 74 77 0.25%
Percent Difference from TAF
Enplanements -8.8% -6.6% 6.6% 11.6% 36.4% 43.0% 65.2% 93.9% N/A
Aircraft Operations 7.1% 8.1% 8.3% 8.4% 8.9% 9.2% 9.7% 10.3% N/A
Based Aircraft3 55.3% 52.1% 49.0% 49.0% 43.1% 40.4% 42.3% 48.1% N/A
Notes: 1 – InterVISTAS’ NFIA passenger forecasts were developed on an Origin & Destination (2-way) basis. The Passenger Enplanements figures shown in this table were derived by taking 50% of the Origin & Destination forecasts. Actual 2012 Enplanements at NFIA are as reported by the U.S. Department of Transportation. 2 – InterVISTAS’ Aircraft Operations forecasts include categories equivalent to those identified from the FAA Terminal Area Forecasts listed in this table. 3 – The NFIA Master Plan Update forecasts incorporate 12 based military aircraft at NFIA. The FAA’s 2012 TAF does not incorporate the presence of the based military aircraft, which accounts for a substantial portion of the differential. 4- CAGR – Compound Annual Growth Rate Source: FAA Terminal Area Forecasts, 2012; FAA Air Traffic Activity Data System (ATADS); U.S. Department of Transportation T-100 Air Carrier Reports; InterVISTAS Consulting; and McFarland Johnson, Inc.
Additionally, the Enplanements variations in the forecast years relate to the differences in methodologies employed by the FAA and InterVISTAS. The FAA methodology is largely based on econometric modeling and historic NFIA traffic levels, while InterVISTAS’ methodology is based on a regional analysis of passenger demand and explicit assumptions of new international and domestic low cost carrier services at the NFIA. In this manner, the InterVISTAS methodology incorporates substantial “net new” passenger demand (driven by the new air services) - which is absent from the FAA forecasts. In 2032, the FAA forecast shows approximately 131,000 Enplanements, while the Master Plan Update expects over 253,000 Enplanements.
On the other hand, the Aircraft Operations forecasts for NFIA are very similar in the early years, but vary through the planning period. While both forecasts incorporate a decrease in general aviation operations between 2012 and 2016, the TAF forecasts incorporate a much more substantial decrease as opposed to the Master Plan forecasts. The FAA TAF shows flat overall growth of Aircraft Operations, whereas the Master Plan Update shows slow net growth of approximately 2,100 Operations (or an average increase of 0.4% per year) through 2032.

4-41 Air Traffic Forecasts
Table 4-13 NFIA Forecast Summary and Comparison to FAA Terminal Area Forecast for Aircraft Operations (Using TAF Formatting)
Year
Itinerant Air
Carrier Itinerant Air Taxi
Itinerant GA
Itinerant Military
Local Civil
Local Military
Total Airport Ops
Source: FAA TAF (2012)
2012 1,242 1,194 9,976 4,611 5,262 3,011 25,296
2013 1,260 1,194 10,259 4,611 4,797 3,011 25,132
2016 1,314 1,194 10,238 4,611 4,950 3,011 25,318
2017 1,336 1,194 10,231 4,611 5,001 3,011 25,384
2022 1,444 1,194 10,196 4,611 5,268 3,011 25,724
2023 1,466 1,194 10,189 4,611 5,323 3,011 25,794
2027 1,562 1,194 10,161 4,611 5,552 3,011 26,091
2032 1,692 1,194 10,126 4,611 5,849 3,011 26,483
Source: NFIA Master Plan Update Forecasts (2013)1
2012 1,328 N/A 10,957 N/A 6,954 7,846 27,085
2013 1,380 N/A 10,961 N/A 6,957 7,860 27,158
2016 1,548 N/A 10,973 N/A 6,964 7,902 27,387
2017 1,627 N/A 10,977 N/A 6,967 7,916 27,487
2022 2,064 N/A 10,996 N/A 6,979 7,986 28,025
2023 2,174 N/A 11,000 N/A 6,981 8,000 28,155
2027 2,558 N/A 11,016 N/A 6,991 8,056 28,621
2032 3,056 N/A 11,035 N/A 7,004 8,126 29,221
Notes: 1 – Due to lack of available information, the NFIA Master Plan forecasts do not distinguish between Itinerant Military and Local Military operations. With the presence of the U.S. Air Force Reserve Command's 914th Airlift Wing and the New York Air National Guard's 107th Airlift Wing at NFIA, the forecasts assume that the majority of the military operations will be Local operations. Therefore, for purposes of this table, all military operations listed under the NFIA Master Plan Update are designated as Local Military.

4-42 Air Traffic Forecasts
Table 4-14 NFIA Forecast Summary and Comparison to FAA Terminal Area Forecast for Passenger Enplanements (Using TAF Formatting)
Year Air Carrier Air
Taxi Commuter US Flag Foreign
Flag
Total International
Enplanements Total
Enplanements
Source: FAA TAF - 2012
2012 89,443 N/A 5,459 N/A N/A N/A 94,912
2013 90,961 N/A 5,459 N/A N/A N/A 96,430
2016 95,667 N/A 5,459 N/A N/A N/A 101,136
2017 97,298 N/A 5,459 N/A N/A N/A 102,767
2022 105,863 N/A 5,459 N/A N/A N/A 111,332
2023 107,671 N/A 5,459 N/A N/A N/A 113,140
2027 115,189 N/A 5,459 N/A N/A N/A 120,658
2032 125,311 N/A 5,459 N/A N/A N/A 130,780
Source: NFIA Master Plan Update Forecasts (2013)12
2012 86,605 N/A N/A 86,605 N/A 1,631 86,605
2013 90,069 N/A N/A 90,069 N/A 1,696 90,069
2016 103,946 N/A N/A 103,946 N/A 2,458 107,846
2017 110,790 N/A N/A 110,790 N/A 2,657 114,960
2022 151,831 N/A N/A 147,931 3,900 7,663 151,831
2023 161,819 N/A N/A 155,969 5,850 9,857 161,819
2027 199,365 N/A N/A 189,615 9,750 14,781 199,365
2032 253,523 N/A N/A 235,476 18,047 24,469 253,523
Notes: 1 – The Air Carrier category under the NFIA Master Plan Update Forecasts is assumed to be comprised of commercial operations by US Flag and Foreign Flag airlines. 2 – The Total International Enplanements category under the NFIA Master Plan Update Forecasts is assumed to be comprised of passengers traveling on: 1) US Flag airlines - serving Mexico and the Caribbean markets and 2) Foreign Flag airlines.