
Glacial climate sensitivity to different states of the Atlantic Meridional Overturning Circulation:...
20
Clim. Past, 5, 551–570, 2009 www.clim-past.net/5/551/2009/ © Author(s) 2009. This work is distributed under the Creative Commons Attribution 3.0 License. Climate of the Past Glacial climate sensitivity to different states of the Atlantic Meridional Overturning Circulation: results from the IPSL model M. Kageyama 1 , J. Mignot 2 , D. Swingedouw 3 , C. Marzin 1 , R. Alkama 1,4 , and O. Marti 1 1 LSCE/IPSL, UMR CEA-CNRS-UVSQ 1572, CE Saclay, L’Orme des Merisiers, Bˆ at. 701, 91191 Gif-sur-Yvette Cedex, France 2 LOCEAN, Universite Pierre et Marie Curie, Case courrier 100, 4 place Jussieu, 75252 Paris Cedex 05, France 3 CERFACS, 42 Avenue Gaspard Coriolis 31057 Toulouse, France 4 CNRM, 42 av Coriolis, 31057 Toulouse cedex 1, France Received: 22 December 2008 – Published in Clim. Past Discuss.: 18 March 2009 Revised: 6 August 2009 – Accepted: 6 August 2009 – Published: 30 September 2009 Abstract. Paleorecords from distant locations on the globe show rapid and large amplitude climate variations during the last glacial period. Here we study the global cli- matic response to different states of the Atlantic Meridional Overturning Circulation (AMOC) as a potential explana- tion for these climate variations and their possible connec- tions. We analyse three glacial simulations obtained with an atmosphere-ocean coupled general circulation model and characterised by different AMOC strengths (18, 15 and 2 Sv) resulting from successive ∼0.1 Sv freshwater perturbations in the North Atlantic. These AMOC states suggest the ex- istence of a freshwater threshold for which the AMOC col- lapses. A weak (18 to 15 Sv) AMOC decrease results in a North Atlantic and European cooling. This cooling is not ho- mogeneous, with even a slight warming over the Norwegian Sea. Convection in this area is active in both experiments, but surprisingly stronger in the 15 Sv simulation, which appears to be related to interactions with the atmospheric circulation and sea-ice cover. Far from the North Atlantic, the climatic response is not significant. The climate differences for an AMOC collapse (15 to 2 Sv) are much larger and of global extent. The timing of the climate response to this AMOC collapse suggests teleconnection mechanisms. Our analy- ses focus on the North Atlantic and surrounding regions, the tropical Atlantic and the Indian monsoon region. The North Atlantic cooling associated with the AMOC collapse induces a cyclonic atmospheric circulation anomaly centred over this Correspondence to: M. Kageyama ([email protected]) region, which modulates the eastward advection of cold air over the Eurasian continent. This can explain why the cool- ing is not as strong over western Europe as over the North Atlantic. In the Tropics, the southward shift of the Inter- Tropical Convergence Zone appears to be strongest over the Atlantic and Eastern Pacific and results from an adjustment of the atmospheric and oceanic heat transports. Finally, the Indian monsoon weakening appears to be connected to the North Atlantic cooling via that of the troposphere over Eura- sia. Such an understanding of these teleconnections and their timing could be useful for paleodata interpretation. 1 Introduction Since the discovery of abrupt oceanic and climate changes in marine records from the North Atlantic (Heinrich, 1988) and glaciological records from Greenland (Dansgaard et al., 1993), numerous studies have contributed to better describe this large amplitude millennial scale variability during glacial periods. In a first step, Bond et al. (1993) suggested the si- multaneity between the abrupt changes in the North Atlantic surface conditions and the Greenland ice core records. These authors showed that glacial millennial variability is organised as follows in this area: after a cold period associated with a massive iceberg discharge from the Laurentide ice-sheet to the mid-latitude North Atlantic Ocean (a “Heinrich event”), an abrupt and large amplitude warming event (a “Dansgaard- Oeschger event”) occurs, followed by a progressive slow cooling (a “Greenland interstadial”) ended by an abrupt cool- ing leading to a cold period (a “Greenland stadial”). Several Published by Copernicus Publications on behalf of the European Geosciences Union.
Transcript of Glacial climate sensitivity to different states of the Atlantic Meridional Overturning Circulation:...

Clim. Past, 5, 551–570, 2009www.clim-past.net/5/551/2009/© Author(s) 2009. This work is distributed underthe Creative Commons Attribution 3.0 License.
Climateof the Past
Glacial climate sensitivity to different states of the AtlanticMeridional Overturning Circulation: results from the IPSL model
M. Kageyama1, J. Mignot2, D. Swingedouw3, C. Marzin1, R. Alkama1,4, and O. Marti 1
1LSCE/IPSL, UMR CEA-CNRS-UVSQ 1572, CE Saclay, L’Orme des Merisiers, Bat. 701, 91191Gif-sur-Yvette Cedex, France2LOCEAN, Universite Pierre et Marie Curie, Case courrier 100, 4 place Jussieu, 75252 Paris Cedex 05, France3CERFACS, 42 Avenue Gaspard Coriolis 31057 Toulouse, France4CNRM, 42 av Coriolis, 31057 Toulouse cedex 1, France
Received: 22 December 2008 – Published in Clim. Past Discuss.: 18 March 2009Revised: 6 August 2009 – Accepted: 6 August 2009 – Published: 30 September 2009
Abstract. Paleorecords from distant locations on the globeshow rapid and large amplitude climate variations duringthe last glacial period. Here we study the global cli-matic response to different states of the Atlantic MeridionalOverturning Circulation (AMOC) as a potential explana-tion for these climate variations and their possible connec-tions. We analyse three glacial simulations obtained withan atmosphere-ocean coupled general circulation model andcharacterised by different AMOC strengths (18, 15 and 2 Sv)resulting from successive∼0.1 Sv freshwater perturbationsin the North Atlantic. These AMOC states suggest the ex-istence of a freshwater threshold for which the AMOC col-lapses. A weak (18 to 15 Sv) AMOC decrease results in aNorth Atlantic and European cooling. This cooling is not ho-mogeneous, with even a slight warming over the NorwegianSea. Convection in this area is active in both experiments, butsurprisingly stronger in the 15 Sv simulation, which appearsto be related to interactions with the atmospheric circulationand sea-ice cover. Far from the North Atlantic, the climaticresponse is not significant. The climate differences for anAMOC collapse (15 to 2 Sv) are much larger and of globalextent. The timing of the climate response to this AMOCcollapse suggests teleconnection mechanisms. Our analy-ses focus on the North Atlantic and surrounding regions, thetropical Atlantic and the Indian monsoon region. The NorthAtlantic cooling associated with the AMOC collapse inducesa cyclonic atmospheric circulation anomaly centred over this
Correspondence to:M. Kageyama([email protected])
region, which modulates the eastward advection of cold airover the Eurasian continent. This can explain why the cool-ing is not as strong over western Europe as over the NorthAtlantic. In the Tropics, the southward shift of the Inter-Tropical Convergence Zone appears to be strongest over theAtlantic and Eastern Pacific and results from an adjustmentof the atmospheric and oceanic heat transports. Finally, theIndian monsoon weakening appears to be connected to theNorth Atlantic cooling via that of the troposphere over Eura-sia. Such an understanding of these teleconnections and theirtiming could be useful for paleodata interpretation.
1 Introduction
Since the discovery of abrupt oceanic and climate changesin marine records from the North Atlantic (Heinrich, 1988)and glaciological records from Greenland (Dansgaard et al.,1993), numerous studies have contributed to better describethis large amplitude millennial scale variability during glacialperiods. In a first step,Bond et al.(1993) suggested the si-multaneity between the abrupt changes in the North Atlanticsurface conditions and the Greenland ice core records. Theseauthors showed that glacial millennial variability is organisedas follows in this area: after a cold period associated with amassive iceberg discharge from the Laurentide ice-sheet tothe mid-latitude North Atlantic Ocean (a “Heinrich event”),an abrupt and large amplitude warming event (a “Dansgaard-Oeschger event”) occurs, followed by a progressive slowcooling (a “Greenland interstadial”) ended by an abrupt cool-ing leading to a cold period (a “Greenland stadial”). Several
Published by Copernicus Publications on behalf of the European Geosciences Union.

552 M. Kageyama et al.: Glacial climate sensitivity to AMOC strength
of these Dansgaard-Oeschger cycles occur, with Greenlandinterstadial peaks decreasing each time, until, during a sta-dial, a Heinrich event occurs again. Further studies of ma-rine proxies sensitive to the ocean ventilation (e.g.13C, El-liot et al., 2002) or circulation (e.g. paleomagnetic proper-ties of the marine sediments, seeKissel, 2005, for a recentreview) show that the North Atlantic water ventilation andcirculation strongly decreased during Heinrich events, butnot so much during stadials. The Atlantic Meridional Over-turning Circulation (AMOC) has then been proposed to playa key role in rapid climatic changes both around and farfrom the North Atlantic, and in particular in the SouthernHemisphere and Antarctica (e.g.Blunier et al., 1998; EPICAcommunity members, 2006). Other invoked mechanisms forglacial millennial climate variability include those related tosea-ice cover, especially in the Northern Hemisphere, and tochanges in the characteristics of tropical interannual variabil-ity, which, at present, do have significant impacts on the ex-tratropical climate (for a complete review, seeClement andPeterson, 2008).
Our objective here is to investigate the most commonlyinvoked mechanism for this millennial glacial variability,namely the climate differences related to different states ofthe AMOC. We use a global coupled ocean-atmosphere gen-eral circulation model run under glacial boundary conditionsto study the sensitivity of the AMOC to the fresh water bal-ance (or imbalance) imposed at the atmosphere-ocean in-terface and to study the climate differences related to threedifferent states of the AMOC, which we briefly compare toavailable proxy records. Our main objective is to analysethe mechanisms for climate changes related to AMOC dif-ferences over 3 regions where the model compares qualita-tively well with data: the northern extra-tropics, the tropicalAtlantic and Indian monsoon region.
1.1 Palaeorecords of of millennial-scale climate changes
Pollen records retrieved in marine sediment cores off theEuropean coast, and in particular around the Iberian Penin-sula, show that simultaneous to abrupt changes in sea surfaceconditions, the composition of the vegetation on the nearbyland changed significantly (Combourieu Nebout et al., 2002;Sanchez-Goni et al., 2002; Sanchez-Goni et al., 2008), withmore forests during interstadials, characterized by relativelywarm sea surface temperatures and more semi-desert or step-pic vegetation during stadials, characterized by relativelycold ocean surface conditions. Other types of continentalrecords, such as the speleothem record from Villars Cavein Southwestern France (Genty et al., 2003), confirm theabrupt and large amplitude climatic and vegetation changesduring the last glacial period. Schematically, these recordssuggest cold and dry stadials, and warmer and wetter inter-stadials over Southwest Europe. Additional information onthe atmospheric circulation of this region has been obtainedfrom a clay mineral record from the Alboran Sea (Bout-
Roumazeilles et al., 2007) which shows more export of dustfrom Morocco to the Mediterranean Sea during stadials andeven more prominently during Heinrich events, which can berelated to a more southerly circulation during these periodsin this region. This signature associated with cold conditionsover the North Atlantic constrasts with the warm, wet con-ditions found during Heinrich events on the other side of theAtlantic, in Florida (Grimm et al., 2006). This shows thateven around the North Atlantic, the continental climate re-sponse to cold oceanic conditions which could be due to aweakening of the AMOC is far from being spatially homoge-neous. Furthermore, studying an apparent mismatch betweenreconstructions of the Greenland temperatures based on icecore and on snowline changes,Denton et al.(2005) showthat abrupt climate variations are likely to be dependent onthe season, with the strongest cooling occuring in winter.
Abrupt climatic variations have also been recorded, on thesame type of time-scales as for the events occuring aroundthe North Atlantic, away from from this region. Recordsfrom the tropical Atlantic (e.g. Cariaco Basin,Peterson et al.,2000; Gonzalez et al., 2008) show dry events during Green-land stadials, while to the South of these sites, in NorthEast Brazil, wet events are recorded (Wang et al., 2004).Taken together, these records can be interpreted as show-ing a southward migration of the Intertropical convergencezone (ITCZ) during stadials over the Atlantic Basin. Thisis confirmed for the other side of the tropical Atlantic bydusty events recorded off the northwestern African marginduring Heinrich events (Jullien et al., 2007), which suggestsouthward shifts of the ITCZ during those events.Leducet al. (2007) further suggest this southward migration to beassociated with a decrease in moisture transport from the At-lantic to the Pacific, due to the topographic barrier of the An-des. The southward migration of the ITCZ during stadialsis therefore supported by many records. Such a migration isalso suggested for the Western Pacific during Heinrich eventsfrom records from North East Australia (Turney et al., 2004;Muller et al., 2008).
Speleothem and loess records from China show that theEast Asian monsoon also shows strong millennial scale vari-ations, with decreases in the summer monsoons during Hein-rich events and stadials (Porter and An, 1995; Wang et al.,2001). Ruth et al.(2007), analysing the dust content fromthe ice cores retrieved by the North Greenland Ice CoreProject, suggest a very tight temporal correspondence be-tween the climatic changes recorded in Greenland and theEast Asian monsoon activity, which modulates the dustarchived in Greenland. Several records show that the Indianmonsoon intensity also changes in glacial times, simultane-ous with Greenland stadials and interstadials (Schulz et al.,1998; Leuschner and Sirocko, 2000; Altabet et al., 2002;Rashid et al., 2007). In addition,Sanchez-Goni et al.(2008)show a correspondence between the impacts of Dansgaard-Oeschger events in western Europe and in Asia. Variations inAsian monsoon strength could be responsible for the abrupt
Clim. Past, 5, 551–570, 2009 www.clim-past.net/5/551/2009/

M. Kageyama et al.: Glacial climate sensitivity to AMOC strength 553
changes in atmospheric methane concentration recorded inice cores both from Greenland and Antarctica (Blunier et al.,1998; EPICA community members, 2006).
In summary, millennial-scale variability, first revealed inrecords of North Atlantic surface conditions and in Green-land ice core records, is traced in many paleo-records aroundthe world. Here we will examine if different states of theAMOC can be responsible for these teleconnections and ifso, the mechanisms underlying these teleconnections.
1.2 Insights from numerical models: fresh water hosingunder present boundary conditions
Nearly from the time it was discovered, glacial abrupt cli-mate variability has been related to model results show-ing that the thermohaline circulation (here assimilated tothe AMOC) is characterised by several equilibria (Stommel,1961) and that transitions between these equilibria, i.e. be-tween situations in which the AMOC is slow or shut-downand situations with strong AMOC, can be rapid (Rahm-storf, 1994). Using an atmospheric-ocean coupled GeneralCirculation Model (AOGCM) and, thanks to an anomalousfreshwater input into the northern North Atlantic, forcing itsAMOC from an “on” state, similar to the present one, to an“off” state, and back to an “on” state,Manabe and Stouffer(1995) show that it is possible to simulate an abrupt climatechange in the North Atlantic, which they relate to be similarto the Younger Dryas (∼12 000 years ago). They show thata strong temperature anomaly develops over and around theNorth Atlantic in response to a weakening of the thermoha-line circulation but that no strong temperature anomaly de-velops elsewhere. This type of experiments, termed “water-hosing experiments”, have been run by many groups sincethen, with models of different complexities.Stouffer et al.(2006) compile the results from 14 models in which freshwater fluxes of 0.1 and 1 Sv are applied in the North Atlanticbetween 50 and 70◦ N. All models simulate, to various de-grees, a weakening of the AMOC and a cooling of the NorthAtlantic in response to the 0.1 Sv fresh water flux, but somemodels also simulate a warming in the Nordic and/or BarentsSea. The response to the 1.0 Sv fresh water flux in the NorthAtlantic, Nordic Seas and Arctic Ocean is a general cooling,which is maximum over the North Atlantic and Nordic Seasbetween 50 and 80◦ N. The cooling propagates over Eura-sia, but it is not as strong over North America. This showsthe sensitivity of the climate response to different fresh waterforcings and different states of the thermohaline circulation.
In terms of atmospheric circulation, the response to the0.1 Sv anomaly shows that the North Atlantic sea surfacetemperature (SST) anomaly is associated with a cyclonic sea-level pressure anomaly, which constitutes a modulation of themid-latitude westerlies. A weakening in the AMOC there-fore has an impact on the Northern Hemisphere stationarywave pattern.Vellinga and Wood(2002) show that this re-sponse appears within decades of their initial (very strong)
perturbation. They also obtain a cyclonic anomaly over thenorthern North Atlantic, with southwesterly surface windanomalies over western Europe. This could explain why thetemperature anomalies over this region are not as strong asover the North Atlantic: relatively warmer air is advected bythe anomalous circulation forced by the North Atlantic cool-ing.
The SST response in areas remote from the North Atlanticis dominated by a warming of the South Atlantic and ofthe Southern Ocean. This follows the classical interhemi-spheric (bipolar) see-saw effect (Crowley, 1992; Stocker,1998), which appears more prominently in the Atlantic. Itcreates, around the Equator, a temperature anomaly dipole,with colder waters to the North and warmer waters to theSouth when the AMOC is weaker. This dipole is associatedwith a southward shift of the ITCZ (e.g.Stouffer et al., 2006;Chiang et al., 2008). The development of such a dipole is dueto a decrease in interhemispheric transport of heat by the At-lantic ocean. The atmosphere also plays a role.Chiang andBitz (2005) andYang and Liu(2005) show that an imposedcooling in the North Atlantic propogates towards the Equatorand cools the SST to the South through a Wind-Evaporation-SST feedback (Chiang et al., 2008).
The Indian monsoon response to an AMOC weakeningis consistent with a southward shift of the ITCZ. However,specific mechanisms have been suggested for the monsoonvariations concomitant with the millennial scale events oc-curing in the North Atlantic. On the basis of observationaldata from 1871 to 2003,Goswami et al.(2006) propose thatthe Indian summer monsoon and Atlantic Multidecadal Os-cillation (AMO) could be linked via a modification of themeridional gradient of the temperature of the upper half ofthe troposhere (which they term “TT”). They show that fora warm North Atlantic, there is an increase in the merid-ional gradient of TT, which, in turn, favours a stronger mon-soon. Using a coupled ocean-atmosphere model on whichthey impose a positive sea surface temperature anomaly inthe North Atlantic,Lu et al. (2006) show that in addition tothe atmospheric connection via the TT meridional gradient,coupled ocean-atmosphere feedbacks in the Indian and West-ern Pacific Ocean help instensifying the monsoon. Indeed,the warm anomaly in the North Atlantic is associated withwarm anomalies in the Indian and western Pacific oceans,which help producing more precipitation and induce an en-hanced monsoon circulation.Zhang and Delworth(2005)show that the weakening of the East Asian monsoon in theircoupled GCM with a weaker AMOC is related to a change ofthe Pacific Walker circulation and the Rossby wave responseto the resulting dampened convection over Indonesia acts toweaken the Indian monsoon.
1.3 Fresh water hosing in glacial conditions
All the experiments cited above were run in the present-dayor pre-industrial contexts, i.e. for present or pre-industrial
www.clim-past.net/5/551/2009/ Clim. Past, 5, 551–570, 2009
554 M. Kageyama et al.: Glacial climate sensitivity to AMOC strength
greenhouse gas concentrations and ice-sheet extent and to-pography. On the other hand, millennial scale variability islargest during glacial times. Using the climate model of in-termediate complexity CLIMBER-2,Ganopolski and Rahm-storf (2001) show that a glacial climate is much more sen-sitive to fresh water fluxes in the North Atlantic than an in-terglacial climate. Using a fully coupled ocean-atmospheregeneral circulation model,Hu et al.(2008) show that whenthe Bering Strait is closed, the recovery of the AMOC froman “off” to an “on” state is slower, due to the fact that thefresh water introduced in the North Atlantic takes a longertime to be removed from this region when the Arctic andPacific oceans are not connected.Bitz et al.(2007) also ob-tain a much slower recovery of the AMOC in a glacial worldbut instead ascribe it to more extensive sea-ice cover in theNorth Atlantic and Nordic Seas. Finally,Weber and Dri-jfhout (2007) show that the glacial AMOC is more sensitiveto fresh water discharges than the present one, and that therecovery timescales from the collapse are much longer.
In terms of glacial surface climate response to a collapsein the AMOC,Ganopolski and Rahmstorf(2001), along withthe follow-up studies ofClaussen et al.(2003) andJin et al.(2007), show a cooling of the North Atlantic, extending overEurasia, and a smaller cooling over the Pacific and NorthAmerica. The response in the Southern Hemisphere is anoverall warming, consistent with the bipolar see-saw mech-anism. In addition, using the same model,Jin et al.(2007)show that the decrease in Eurasian temperatures associatedwith a weakening of the AMOC can be responsible for aweakening of the Asian monsoon. The thermal response toa collapse of the AMOC simulated by the HadCM3 fullycoupled atmosphere-ocean general circulation model (He-witt et al., 2006) is broadly consistent with the results of theCLIMBER-2 climate model of intermediate complexity.
Using the coupled ocean-atmosphere model ECBILT-CLIO forced with full glacial boundary conditions,Timmer-mann et al.(2005) andKrebs and Timmermann(2007) in-vestigate the mechanisms for the teleconnections betweenthe North Atlantic oceanic state and equatorial Pacific tem-peratures and salinities, during a transient meltwater pulseexperiment in which the AMOC shuts down and recov-ers. Analysing fully coupled as well as partially coupledatmosphere-ocean simulations, they examine the respectiveroles of the atmosphere and the ocean in the response to theAMOC collapse. They find that the North Atlantic coolingassociated with the AMOC collapse is advected downstreamover the Eurasian continent and is largely responsible, on itsown, for the atmospheric circulation changes simulated intheir coupled experiments. This includes a weakening of theAsian monsoon and an intensification of the trade winds overthe northern tropical Pacific, both related to changes in themeridional temperature gradient. In addition, the sea-levelincrease associated to the oceanic response has a global im-pact on the thermocline structure via a standing wave pattern.In the Western Pacific, this adjustment involves the transport
of cold and salty waters in the Pacific warm pool. The re-sponse is further amplified by the fact that trade winds inten-sify and precipitation decreases in this area.
Fluckiger et al.(2008) use the same model to show thatthe surface climate response to an increase in AMOC is notlinear with respect to the AMOC strength. In addition, thesimulated surface climate response to an AMOC intensifica-tion is dependent on the season, with the high northern lat-itudes undergoing the maximum climate changes in winterwhile the differences over the mid-latitude Eurasian conti-nent are largest in spring due to a shift of the period of snowretreat. This, in turn, is responsible for an earlier break ofthe Siberian high pressure and an earlier setup of the Asianmonsoon. The dependence of the climate response on theseason has important implications for the interpretation ofproxy data, as they are often more sensitive to the climate ofone particular period of the year.
1.4 Objectives of the present study
Hence, to our knowledge, there are not many fresh waterhosing experiments run in a glacial climatic context withfully coupled ocean-atmosphere general circulation models.In this study, we report on new results obtained with theIPSL CM4 model. We consider the surface climate sensi-tivity to a weak change in an active AMOC (18 vs. 15 Sv)and to a collapse of the AMOC (15 vs. 2 Sv). We first de-scribe the model and simulations (Sect.2). Then we analysethe reasons for differences in the AMOC of the three simu-lations (Sect.3.1) and briefly examine their impact on globalheat transports (Sect.3.2). In Sect.3.3, we present the sig-nature of these AMOC states in terms of surface climate andcompare it with the available paleo-records and in Sect.4,we study the timing of the climate changes in the simulationin which the AMOC collapses. This leads us to postulate onmechanisms for these climate changes, which we investigatefurther for three regions: the northern extratropics, the trop-ical Atlantic and the Indian monsoon region (Sect.5). Thisanalysis is the main objective of the present study. It is notour goal here to compare the climatic sensitivity to changesin AMOC between the glacial and the present states. Thisissue is treated in a companion study (Swingedouw et al.,2009).
2 Description of the climate model simulations
The model used in the present study is the coupled ocean-atmosphere IPSLCM4 model (Marti et al., 2006, 2009). Theatmospheric component of this coupled model is LMDZ.3.3,with resolution 96×71×19 in longitude×latitude×altitude.The horizontal grid is regular, while the vertical levels aremore numerous near the surface. This atmospheric mod-ule includes the land surface scheme ORCHIDEE which in-cludes a complex river routing scheme. The ocean module is
Clim. Past, 5, 551–570, 2009 www.clim-past.net/5/551/2009/

M. Kageyama et al.: Glacial climate sensitivity to AMOC strength 555
ORCA2, which uses an irregular horizontal grid of 182×149points with a resolution of ca. 2◦, refined over key regionssuch as the North Atlantic and near the Equator. This modelhas 31 depth levels. The sea-ice module is the LouvainIce Model (LIM). The coupling of these components is per-formed using the OASIS (version 3) coupler.
The performance of the model in its representation of themodern climate is described in detail inMarti et al. (2009).At the resolution used in the present study, the AMOC simu-lated for pre-industrial boundary conditions is weak (11 Sv)but its strength increases with resolution. This bias is partlyrelated to the fact that there is no convection in the LabradorSea in this model, for these boundary conditions (Swinge-douw et al., 2007a). This is due to an excess of precipitationin the North Atlantic and North Atlantic westerlies locatedtoo much to the South (Marti et al., 2009). Nevertheless themodel’s sensitivity to prescribed freshwater fluxes such asin Stouffer et al.(2006) is similar to other models (Swinge-douw et al., 2009), as is the case for its sensitivity to freshwa-ter fluxes in climate projections (Swingedouw et al., 2007b;Schneider et al., 2007).
In the present study, we analyse three simulations of theIPSL CM4 model with boundary conditions for the LastGlacial Maximum, as defined by the PMIP2 protocol (Bra-connot et al., 2007a, http://pmip2.lsce.ipsl.fr): we use theICE-5G ice-sheet reconstruction (Peltier, 2004), CO2, CH4and N2O atmospheric concentrations of 185 ppm, 350 ppband 200 ppb respectively (Monnin et al., 2001; Dallenbachet al., 2000; Fluckiger et al., 1999), and orbital parametersrelevant for 21 ky BP (Berger, 1978). The river routing hasbeen adapted for Last Glacial Maximum (LGM) conditions(Alkama et al., 2007). The vegetation is kept at its present-day distribution.
With such an experimental set up, snow accumulates overthe ice sheets and this freshwater sink has to be compen-sated in order to obtain stable simulations. This compen-sation is performed in three latitude bands, with limits at90◦ S/50◦ S/40◦ N/90◦ N. In each latitude band, the excess offreshwater accumulating as snow on the ice sheets, which wedefine as ”calving”, is integrated and supplied to the oceanin the same latitude band. The 40◦ N limit roughly repre-sents the southernmost latitude reached by icebergs duringice ages. Freshwater fluxes due to calving collected Northof this limit are delivered to the Atlantic and Arctic oceansbut not to the Pacific since observations suggest that theseare the regions were ice rafted detritus are most abundant. Inspite of this procedure, the first LGM simulation performedwith our model had a remaining imbalance in the freshwa-ter budget due to a slightly non conservative atmosphericconvection scheme. Therefore two additional simulations inwhich the freshwater budget is closed using different meth-ods prolong this first, unbalanced, 200-year-long simulation:in LGMa, the bias is compensated by multiplying global pre-cipitations by 2.1% over the oceans. In LGMb, the “calving”flux is multiplied by 44% in the three latitude bands defined
above. Both methods lead to a closed fresh water budget atthe atmosphere-ocean interface. LGMa has been run for 300years and LGMb for 1000 years. An additional sensitivityexperiment, LGMc, is performed, where the calving fluxesin the three regions defined above have been multiplied by100% (as compared to 44% for LGMb). In this simulation,which has been integrated for 420 years starting from year150 of LGMb, the freshwater balance is not closed.
In terms of differences of fresh water fluxes over the ocean,the largest differences between the experiments are in theNorth Atlantic/Artic region, which receives 0.08 Sv morefresh water in LGMb than LGMa, and 0.1 Sv more in LGMccompared to LGMb. These figures remain stable throughoutthe simulations. The differences in fresh water forcing arecomparatively very small over the Austral Ocean: the calvingis 0.012 Sv less in LGMb compared to LGMa and 0.015 Svless in LGMc compared LGMb. Hence, even though ourexperiments do not follow the classical fresh water hosingexperimental set-up, as described for example byStoufferet al.(2006), the freshwater flux differences in the North At-lantic/Arctic regions are of the same order of magnitude asin many other fresh water hosing experiments (cf. Sects.1.2and1.3), if not on the low side compared to the 1 Sv used insome extreme experimental set-ups.
It is not our goal here to perform a detailed comparisonof our model results with Last Glacial Maximum paleo-data.Within the PMIP2 project, an earlier LGM simulation withthe same model has been extensively compared to paleo-records and to other model results. This simulation of theLGM climate was very much in line with results from othermodels (e.g.Masson-Delmotte et al., 2006; Kageyama et al.,2006; Braconnot et al., 2007a,b; Ramstein et al., 2007; Otto-Bliesner et al., 2009). A surprising result from our LGMa orLGMb simulations compared to the pre-industrial one is theincrease in AMOC. This is in contradiction with paleodata(e.g.Lynch-Stieglitz et al., 2007) but it is found in severalmodels (Weber et al., 2007). In our model, it is partly relatedto its under-evaluation for the pre-industrial case. This wasan additional motivation to obtain a LGM simulation with acollapsed AMOC, but a more detailed comparison betweenall the LGM simulations presented here and the pre-industrialbasic state is left for a forthcoming study, as our goal hereis to better understand the differences between these threeLGM simulations.
3 Large-scale oceanic and climatic adjustments ofthe AMOC to different freshwater perturbations
3.1 Evolution of the AMOC and North Atlantic deepwater formation
The perturbation in fresh water flux into the northern NorthAtlantic and Arctic are of 0.08 Sv between LGMa andLMGb and of 0.1 Sv between LGMb and LGMc. Yet, while
www.clim-past.net/5/551/2009/ Clim. Past, 5, 551–570, 2009

556 M. Kageyama et al.: Glacial climate sensitivity to AMOC strength
0 200 400 600 800 10000
5
10
15
20
time (years)
max
AM
OC
(Sv)
Fig. 1. Time evolution of the maximum of the Atlantic Meridional Overturning Circulation (in Sv,1 Sv = 106 m3/s) in runs LGMa (black), b (red) and c (blue).
Fig. 1. Time evolution of the maximum of the Atlantic Merid-ional Overturning Circulation (in Sv, 1 Sv=106 m3/s) in runs LGMa(black), b (red) and c (blue).
LGMa and LGMb present strong and stable AMOCs, withstrengths of 18 and 15 Sv respectively, and strong NorthAtlantic Deep Water (NADW) formation that reaches thebottom of the North Atlantic Ocean in the northern mid-latitudes, the AMOC collapses to 2 Sv by the end of simula-tion LGMc (Figs.1 and2). We can therefore conclude thatthe atmosphere-ocean state in LGMb is probably close to aNorth Atlantic fresh water threshold for which the AMOCcollapses: although the additional fresh water in the NorthAtlantic is rather small in LGMc compared to other freshwater hosing experiments, the AMOC collapses within 300years. We therefore obtain two simulations with extremeAMOCs, one in the “on” state (LGMa) and one in the“off” state (LGMc) and a simulation (LGMb) with an activeAMOC slightly smaller than the LGMa maximum. LGMaand LGMb are therefore reminiscent of Greenland interstadi-als, while the extreme LGMc simulation, especially at its endwhen the AMOC has completely collapsed, is to first orderrelevant for a comparison to a Heinrich event, e.g. Heinrichevents 2 or 1 which are close to the LGM.
To understand the differences in the AMOCs of our sim-ulations, we further study the characteristics of the NADWformation. In LGMa, it essentially takes place North of New-foundland and South of Iceland (Fig.2), immediately Southof the winter ice edge, as well as in the Arctic Ocean be-neath the sea ice. Some relatively deep mixed layers arealso detected along the Norwegian coast. In LGMb, deepwater formation disappears from the Arctic Ocean while ittends to increase in the northern North Atlantic areas. Sincethis occurs simultaneously with a global reduction in AMOCstrength, this suggests that deep water formed in the Arc-tic in the LGMa simulation actually plays an important rolein this interhemispheric water transport. Figure3 illustratesthat in the Southern Labrador Sea, an anomalous mixed layerdepth pattern, consisting in a southward shift of the convec-tion site (black contours) develops in LGMb compared toLGMa. This is associated with an increase of sea ice cover
in the northwestern part of the area (pink contours) that leadsto negative anomalous ice to ocean freshwater flux due tobrine rejection and thus to a net oceanic freshwater loss fur-ther South of this ice formation area (blue colours). Thisfreshwater loss locally overwhelms the freshwater input dueto the experimental set-up (not shown). Thus, surface waterdensity tends to increase locally and this favours deep waterformation. A similar process is at play Southwest of Iceland,although the sea ice anomaly and the ice to ocean freshwa-ter flux are much weaker. Along the Norwegian coast, deepwater formation clearly decreases at around 75◦ N while itincreases locally around 65◦ N. Indeed, in this area, sea icecover, largely capping the ocean from intense atmosphericcooling and thus preventing deep water formation, is pushedby anomalous southerly winds and thus decreases around65◦ N while it increases further North (not shown). We willshow that the anomalous deepening of deep convection inthis area has an important climatic implication.
Figure4 (l.h.s.) illustrates the timescale on which thesedeep convection changes set up in LGMb. The shallowingof the mixed layer in the Arctic area (Site 5) and off theNorwegian coast (Site 2) settles within the first years of thesimulation. On the other hand, changes in the Labrador Sea(Site 3) and in the Norwegian Sea’s southern site (Site 4) aredelayed and settle after several decades. In these areas, theinterannual variability also clearly increases. This suggestsa link with a change in atmospheric variability but the cou-pled simulations make it difficult to isolate the exact mecha-nism. However, it raises the possibility for delayed climaticresponses to changes in the North Atlantic freshwater budgetthat can have important regional consequences.
As expected from Fig.1, NADW formation is practicallyshut off in LGMc (Figs.2 and4). This results from a directcapping of the deep water formation sites by the freshwater.The AMOC reduction is also associated with a southwarddisplacement of the winter sea-ice edge (Fig.2). As abovehowever, all convection sites do not cease their activity at thesame time (Fig.4, r.h.s): while the Norwegian Sea convec-tive activity immediately decreases after the start of the runand completely ceases in less than 100 years, the LabradorSea site remains very variable, sometimes reaching the ac-tivity levels of LGMb over the first hundred years of LGMc,before shutting off. The slowest site to react is the one in theIrminger Sea and South of Iceland, which finally shuts offafter 200 years of simulation. The time series of mixed layerdepth for this site in LGMb also shows more stability thanfor the two other sites, probably because it is much larger.The open area South of Iceland and along Greenland is wide,and allows convection to adjust and shift slightly accordingto changes in the forcing, while the location of convectionis probably much more constrained in the Labrador Sea andoff Norway. This might explain the greater persistence of thissite. Eventually, its time scale for shutting down is very closeto that of the AMOC itself (Fig.1), suggesting that it controlsthe strength of the AMOC. This is consistent with findings of
Clim. Past, 5, 551–570, 2009 www.clim-past.net/5/551/2009/

M. Kageyama et al.: Glacial climate sensitivity to AMOC strength 557
LGMa
−20 −10 0 10 20 30 40 50 60 70−4500
−4000
−3500
−3000
−2500
−2000
−1500
−1000
−500
0
LGMb
−20 −10 0 10 20 30 40 50 60 70−4500
−4000
−3500
−3000
−2500
−2000
−1500
−1000
−500
0
LGMc
−20 −10 0 10 20 30 40 50 60 70−4500
−4000
−3500
−3000
−2500
−2000
−1500
−1000
−500
0
−4 −2 0 2 4 6 8 10 12 14 16 18
Sv
120oW
60 oW 0
o
60
o E
120 oE 180
o W
LGMa
120oW
60 oW 0
o
60
o E
120 oE 180
o W
LGMb
200
500
800
1100
1400
1700
2000m
120oW
60 oW 0
o
60
o E
120 oE 180
o W
LGMc
40
120
200
280
m
Fig. 2. Atlantic meridional streamfunction (l.h.s) and maximum mixed layer depth reached overthe winter months (February to April) (r.h.s) for LGMa (top), LGMb (middle), LGMc (bottom),years 201–250 for LGMa and b, 521–570 for LGMc. The thick black line on the mixed layerdepth plots shows the limit of a 10% sea ice coverage in March.
Fig. 2. Atlantic meridional streamfunction (l.h.s) and maximum mixed layer depth reached over the winter months (February to April) (r.h.s)for LGMa (top), LGMb (middle), LGMc (bottom), years 201–250 for LGMa and b, 521–570 for LGMc. The thick black line on the mixedlayer depth plots shows the limit of a 10% sea ice coverage in March.
Msadek and Frankignoul(2009) who showed that the multi-decadal fluctuations of the AMOC are mostly driven by deepconvection south of Iceland in this model under modern cli-mate.
3.2 Global heat transport adjustements
The shutdown of the AMOC in LGMc induces an impor-tant weakening in oceanic heat transport. The global merid-ional oceanic heat transport is reduced by more than 0.32 PWbetween 10◦ S and 60◦ N. This decrease is lower than the
0.45 PW reduction in the Atlantic alone. The other basinstherefore compensate part of the reduction in the Atlanticheat transport. The reduction is maximum at 17◦ N whereit reaches more than 0.68 PW, i.e. a 70% decrease in LGMccompared to LGMb at the end of each simulation (Fig.5).The atmospheric meridional heat transport increases in re-sponse to the decrease in oceanic meridional heat transport,showing that the “Bjerknes compensation” effect (Bjerknes,1964; Shaffrey and Sutton, 2006) is at work here. However,a perfect compensation would require a constant radiative
www.clim-past.net/5/551/2009/ Clim. Past, 5, 551–570, 2009

558 M. Kageyama et al.: Glacial climate sensitivity to AMOC strength
100 oW
80 oW
60 oW
40 oW 20oW
0o
−1.1e−04 −7.0e−05 −3.0e−05 1.0e−05 5.0e−05 9.0e−05
Fig. 3. Colours: ice to ocean winter (January-February-March) anomalous (LGMb–LGMa)freshwater budget (in kg/m2/s). Black contours: anomalous (LGMb–LGMa) winter (JFM) mixedlayer depth. Continuous (dashed) contours show positive (negative) anomalies. Contour inter-val is 150m. The contour of zero anomaly is omitted. Pink contours: anomalous (LGMb–LGMa)winter (JFM) ice coverage. Continuous (dashed) contours show positive (negative) anomalies.Contour interval: 0.1.
Fig. 3. Colours: ice to ocean winter (January-February-March)anomalous (LGMb–LGMa) freshwater budget (in kg/m2/s). Blackcontours: anomalous (LGMb–LGMa) winter (JFM) mixed layerdepth. Continuous (dashed) contours show positive (negative)anomalies. Contour interval is 150 m. The contour of zero anomalyis omitted. Pink contours: anomalous (LGMb–LGMa) winter(JFM) ice coverage. Continuous (dashed) contours show positive(negative) anomalies. Contour interval: 0.1.
budget and no storage in any heat reservoirs. These hypothe-ses are scarcely verified (see alsoSwingedouw et al., 2009),and Fig.5 shows that the Bjerknes compensation is not total:it amounts to ca. 64% in terms of meridional heat transportat 17◦ N. Changes in ocean and atmosphere heat transportsbetween LGMa and LGMb are small compared to those as-sociated with a collapse of the AMOC. At this scale, thereis no compensation between the anomalies in oceanic andatmospheric heat transports.
3.3 Global surface climate adjustments
As expected from previous model results and from the heattransport changes discussed above, the North Atlantic Oceanis cooler when the AMOC is weaker. In LGMb, comparedto LGMa (Fig. 6, middle), this cooling is only significantat mid-latitudes, is rather constant along the year and doesnot exceed 2◦C (Fig. 7). Cooling is also simulated over thenorthern continents at mid- to high latitudes, with significantanomalies only during autumn and winter. Eurasia is slightlycooler in LGMb compared to LGMa, with a maximum dif-ference of 1◦C centred over Eastern Europe. It is thereforesurprising to obtain a warmer (by∼1◦C in annual mean) sur-
face air temperature over the Norwegian Sea, a feature whichis mainly significant during the transition seasons (Fig.7).This is linked to an anomalous warming of the ocean associ-ated with the reinforcement of the convective activity in thisarea. Finally, a cooling of around 1◦C is also found over theSoutheastern Pacific and East of the Antarctic Peninsula.
The cold anomaly over the North Atlantic is associatedwith changes in the stationary waves, as shown by the pres-ence of a cyclonic anomaly over the zone of cooling. Thisstructure can be traced from the sea surface to the 200 hPalevel and is shown for the 500 hPa level on Fig.8 (middle).If we compare the location of this cyclonic anomaly to themean flow on Fig.8 (top), we can see that it corresponds to asouthward shift of the jet-stream, which is consistent with thecooling inducing the strongest meridional temperature gra-dient more to the South than its position in LGMa. Thisanomaly can explain that the North Atlantic cooling doesnot expand over western Europe, which undergoes southerlywind anomalies.
Over northern Eurasia, another cyclonic anomaly devel-ops, bringing cold air from the North over central and easternEurope. This cyclonic anomaly occurs for autumn and win-ter, consistent with the cooling simulated over these regionsfor these seasons. It is not possible, from our experimentsonly, to determine if the cyclonic anomaly over the NorthAtlantic is responsible for the Eurasian cyclonic anomaly viaa disturbance of the autumn and winter stationary waves, orif the Eurasian cyclonic anomaly develops as a response tothe cooling over this area. However, the surface temperatureanomaly and associated atmospheric circulation anomaliesseem to act as if they sustain each other. The warming overthe Norwegian Sea does not correspond to an anomaly in thesensible heat transport (which structure, not shown, is verysimilar to the 500 hPa wind), hence confirming the rather lo-cal mechanism, developed in Sect.3.1, based on changes insea ice cover and surface winds. Precipitation differences be-tween LGMa and LGMb are scarcely significant and will notbe discussed further.
In LGMc, the whole Arctic Ocean and the North At-lantic, from 10◦ N northward, are much colder than in LGMb(Fig. 6, bottom). The surface air temperature cools by morethan 5◦C over regions in which sea ice appears in LGMc,i.e. just south of Iceland, and by up to 4◦C in the mid-latitudeNorth Atlantic. Over Eurasia, the simulated LGMc-LGMbcold anomaly is twice as strong as the LGMb–LGMa onein amplitude, but nearly covers the whole Eurasian conti-nent. Nevertheless, some regions still experience a warm-ing in LGMc compared to LGMb. Western Europe does notcool as much as the surrounding regions, to the West or tothe East. The northeastern Pacific and northwestern NorthAmerica experience a warming of 1◦C in LGMc compared toLGMb. In addition, the South Atlantic Ocean warms up by asmuch as 2◦C, which, together with the North Atlantic cool-ing, constitutes a classical bipolar see-saw response. The In-dian and Western Pacific sections of the Southern Ocean also
Clim. Past, 5, 551–570, 2009 www.clim-past.net/5/551/2009/

M. Kageyama et al.: Glacial climate sensitivity to AMOC strength 559
0 50 100 150 200 250 3000
2000
40001. deepening around Irminger Sea
AB
0 50 100 150 200 250 3000
1000
20002. shallowing off Norway (north)
A
B
0 50 100 150 200 250 3000
2000
40003. deepening in Labrador Sea
AB
0 50 100 150 200 250 3000
1000
20004. deepening off Norway
AB
0 50 100 150 200 250 3000
2000
40005. shallowing in Arctic
AB
time (years)
B − A
100 oW
80 oW
60 oW
40 oW 20oW
0o 3.
1.4.
2.5.
C − B
100 oW
80 oW
60 oW
40 oW 20oW
0o 3.
1.
2.
−1100 −900 −700 −500 −300 −100 100 300 500 700 900 1100
m
0 50 100 150 200 250 300 350 4000
1000
20001. shallowing around Irminger Sea
C
B
0 50 100 150 200 250 300 350 4000
1000
20002. shallowing off Norway
C
B
0 50 100 150 200 250 300 350 4000
2000
40003. shallowing in Labrador Sea
C
B
time (years)
Fig. 4. Timeseries of winter mean mixed layer depth (m) averaged over areas of anomalousdeep convection (indicated on the maps below the time series). Black line: LGMa, red line:LGMb, blue line: LGMc. All annual time series have been low-passed filtered using a 5-pointrunning mean.
Fig. 4. Timeseries of winter mean mixed layer depth (m) averaged over areas of anomalous deep convection (indicated on the maps belowthe time series). Black line: LGMa, red line: LGMb, blue line: LGMc. All annual time series have been low-passed filtered using a 5-pointrunning mean.
warm up in LGMc compared to LGMb, while the eastern Pa-cific section of the Southern Ocean cools by as much as 2◦C.To conclude, a weak reduction of the AMOC from 18 Sv(LGMa) to 15 Sv (LGMb) is associated with significant tem-perature anomalies of regional extent, while a strong reduc-tion of the AMOC, from 15 Sv (LGMb) to 2 Sv (LGMc),has a global imprint on the mean annual temperatures. Thetemperature response is clearly not linear w.r.t the AMOCstrength.
In terms of mean annual precipitation in LGMc comparedto LGMb (Fig.9, bottom), there is a significant drying of theNorth Atlantic mid-latitudes, Western Europe and the north-ern Mediterranean coast, by up to 0.6 mm/day, which repre-sents a 20% reduction in annual rainfall over these regions.The Gulf of Mexico and surrounding regions, as well as theAtlantic Ocean off Florida, also experience a major decreasein precipitation. The pattern of this anomaly, which strad-dles Central America over the adjacent Pacific and Atlanticoceans (Fig.9), is not associated with an underlying tem-perature anomaly (Fig.6). This suggests a change in atmo-spheric dynamics to be responsible for the large precipitationreduction. Over the Northeastern Pacific and the northwest-ern North American coast, the precipitation increases by upto 0.8 mm/day. Over the Indian sub-continent and surround-ing ocean, the rainfall also decreases, indicating a weakenedIndian monsoon. Finally, the largest change in hydrological
Fig. 5. Difference in zonally averaged northward meridional heat transports (in PW), betweenLGMa and LGMb (thin lines) and between LGMc and LGMb (thick lines). In red: the oceanicheat transport difference, in black: the atmospheric heat transport difference and in blue: theAtlantic heat transport difference. The time averages are taken over years 201–250 for LGMaand LGMb, and over years 521–570 for LGMc.
Fig. 5. Difference in zonally averaged northward meridional heattransports (in PW), between LGMa and LGMb (thin lines) and be-tween LGMc and LGMb (thick lines). In red: the oceanic heattransport difference, in black: the atmospheric heat transport differ-ence and in blue: the Atlantic heat transport difference. The timeaverages are taken over years 201–250 for LGMa and LGMb, andover years 521–570 for LGMc.
www.clim-past.net/5/551/2009/ Clim. Past, 5, 551–570, 2009

560 M. Kageyama et al.: Glacial climate sensitivity to AMOC strength
-30
-20
-10
0
10
20
30
-180 -150 -120 -90 -60 -30 0 30 60 90 120 150 180-90
-70
-50
-30
-10
10
30
50
70
90
-5
-4
-3
-2
-1
0
1
2
3
4
-180 -150 -120 -90 -60 -30 0 30 60 90 120 150 180-90
-70
-50
-30
-10
10
30
50
70
90
-5
-4
-3
-2
-1
0
1
2
3
4
-180 -150 -120 -90 -60 -30 0 30 60 90 120 150 180-90
-70
-50
-30
-10
10
30
50
70
90
Fig. 6. Mean annual surface air temperature (◦C). Top: LGMa; middle: LGMb−LGMa; bottom:LGMc–LGMb. The differences have been masked where not significant at the 95% level in astandard Student-T test. The time averages are taken over years 201–250 for LGMa and LGMb,and over years 521–570 for LGMc. Note that although this figure (and all maps hereafter) showspresent coastlines, all simulations have actually used LGM coastlines.
Fig. 6. Mean annual surface air temperature (◦C). Top: LGMa; mid-dle: LGMb–LGMa; bottom: LGMc-LGMb. The differences havebeen masked where not significant at the 95% level in a standardStudent-T test. The time averages are taken over years 201–250 forLGMa and LGMb, and over years 521–570 for LGMc. Note that al-though this figure (and all maps hereafter) shows present coastlines,all simulations have actually used LGM coastlines.
cycle is found in the tropical Atlantic where the ITCZ clearlyshifts southward. Indeed, a drying centered at around 10◦ N,the mean ITCZ location in LGMb, is accompanied by a wet-tening centered at around 10◦ S and extending over easternBrazil (cf. Sect.5.2).
How do these climate differences compare to the proxyevidence of abrupt millennial scale variability presented inSect.1.1? As discussed above, if we want to test the hy-pothesis that the recorded climatic changes are indeed dueto AMOC variations, simulations LGMa and b would bestcompare to interstadials, while LGMc would be relevantfor a Heinrich event. Qualitatively, the simulated climaticchanges between an AMOC-off state, such as in LGMc, andan AMOC-on state, such as in LGMa and b, are in agree-ment with the records (1) over the North Atlantic, Greenlandand Europe, which experience a strong cooling and drying;(2) over the tropical Atlantic, which undergoes a clear south-ward shift of the ITCZ; (3) over the Indian Peninsula andsurrounding ocean, which are characterised by a decreasedIndian monsoon. However, our model does not simulate adecrease of the South East Asian monsoon (precipitation issimilar over China in the three simulations). Furthermore,
although it does simulate an Atlantic bipolar see-saw, it doesnot produce a clear warming over Antarctica for a collapsedAMOC. Possible reasons for these discrepancies will be dis-cussed in Sect.6. The mechanisms for climate changes overthe northern extratropics, the tropical Atlantic and the Indianmonsoon region, where our model results appear to be rele-vant for interpreting the proxy records will be discussed fur-ther in Sect.5.1.
4 Timing of the response in the AMOC “off”state simulation
The timing of the heat transport change while the AMOCweakens in LGMc is fast both for the ocean and for the at-mosphere. Figure10 shows that it appears in both transportswithin a few decades. The global heat transport at 17◦ N hasdecreased by more than 0.27 PW, i.e. a half of its final de-crease in around a 60 years. The decrease in oceanic heattransport is partly compensated by the atmosphere after a fewyears. This timing pleads for a very rapid atmospheric adjust-ment to the North Atlantic cooling as modelled byYang andLiu (2005) and byShaffrey and Sutton(2006).
We can compare this timing of atmospheric and oceanictransport changes to the timing of the appearance of surfaceclimate anomalies. Indeed, the difference in annual meansurface temperature associated with a collapse of the AMOCdepicted on Fig.6 does not appear at the same rate in ev-ery region of the globe. Fig.11 (top) shows, for each point,the year after which half of the final anomaly representedon Fig. 6 is reached, and for which the anomaly remainslarger than this threshold for at least 50 years. The first re-gions which experience climate changes in LGMc comparedto LGMb are the mid-latitude western and central North At-lantic and the coastal areas of the Arctic Ocean. In theseregions, the threshold of 50% of the final response is reachedin less than 60 years after the beginning of the run (regions inblue). By this time, the AMOC is reduced by about 30% (toca. 10 Sv) and the Atlantic heat transport by half. Tempera-ture anomalies over in the North Atlantic from 30◦ N north-ward, the Arctic Ocean, Greenland, Eurasia, pass the 50%threshold by 120 years (regions in green), suggesting a rel-atively fast adjustement of the continental temperatures tothe oceanic changes via the atmospheric circulation. FurtherSouth, the tropical Atlantic off the African coast as well asAfrica North of 10◦ N pass the threshold at around the sametime. This could be related to the advection of the cold sur-face ocean anomaly along the subtropical gyre or faster ad-justements such as the Wind-Evaporation-SST feedback asproposed byChiang et al.(2008). At the same time, themean annual temperature response over the tropical SouthAtlantic also starts to appear. The next regions for which cli-mate anomalies pass over the 50% threshold are the tropicalNorth Atlantic and the South Atlantic between 10 and 20◦ S(by year 200). By that time, the AMOC is already less than
Clim. Past, 5, 551–570, 2009 www.clim-past.net/5/551/2009/
M. Kageyama et al.: Glacial climate sensitivity to AMOC strength 561
LGMb-LGMa DJF
-180 -150 -120 -90 -60 -30 0 30 60 90 120 150 180
0
30
60
90LGMc-LGMb DJF
-180 -150 -120 -90 -60 -30 0 30 60 90 120 150 180
0
30
60
90
-5 -4 -3 -2 -1 0 1 2 3 4
LGMb-LGMa MAM
-180 -150 -120 -90 -60 -30 0 30 60 90 120 150 180
0
30
60
90
-5 -4 -3 -2 -1 0 1 2 3 4
LGMc-LGMb MAM
-180 -150 -120 -90 -60 -30 0 30 60 90 120 150 180
0
30
60
90
LGMb-LGMa JJA
-180 -150 -120 -90 -60 -30 0 30 60 90 120 150 180
0
30
60
90LGMc-LGMb JJA
-180 -150 -120 -90 -60 -30 0 30 60 90 120 150 180
0
30
60
90
LGMb-LGMa SON
-180 -150 -120 -90 -60 -30 0 30 60 90 120 150 180
0
30
60
90LGMc-LGMb SON
-180 -150 -120 -90 -60 -30 0 30 60 90 120 150 180
0
30
60
90
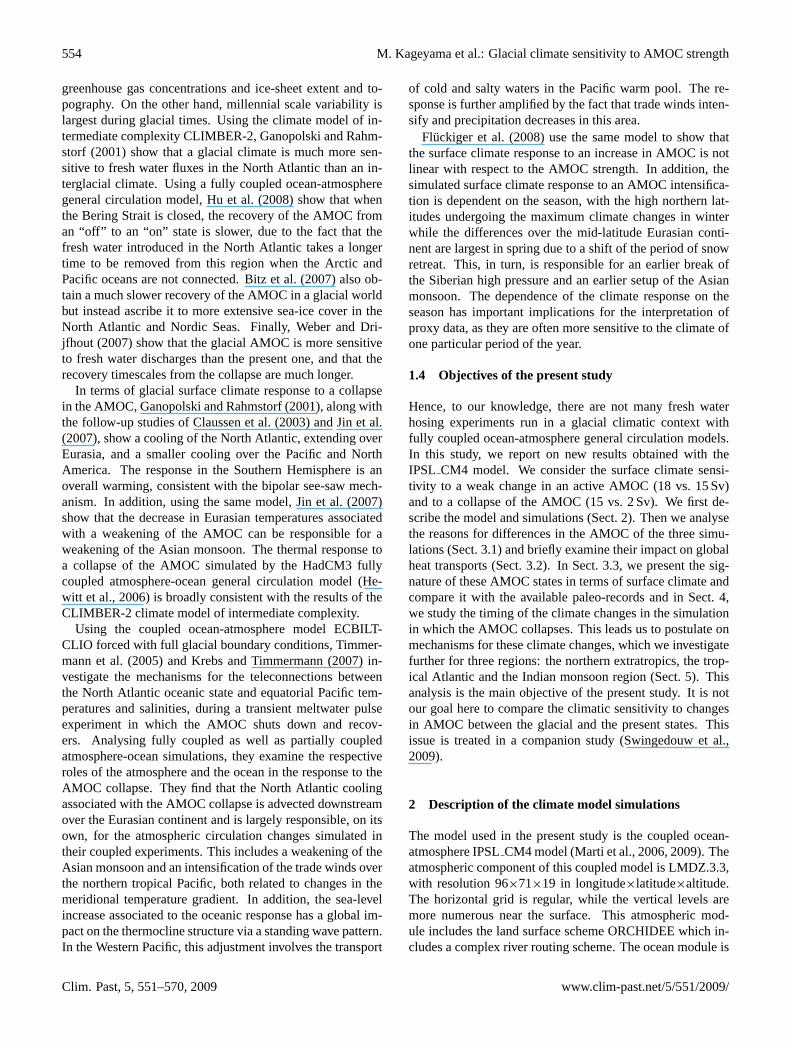
Fig. 7. LGMb–LGMa anomalies (l.h.s.) and LGMc–LGMb anomalies (r.h.s) in 2 m temperatures(in ◦C) for the 4 seasons. The differences have been masked where not significant at the 95%level in a standard Student-T test. The time averages are taken over years 201–250 for LGMaand LGMb, and over years 521–570 for LGMc.
Fig. 7. LGMb–LGMa anomalies (l.h.s.) and LGMc-LGMb anomalies (r.h.s) in 2 m temperatures (in◦C) for the 4 seasons. The differenceshave been masked where not significant at the 95% level in a standard Student-T test. The time averages are taken over years 201–250 forLGMa and LGMb, and over years 521–570 for LGMc.
5 Sv. This suggests that either the Atlantic bipolar seesaw isquite slow to establish, or that the AMOC change needs tobe strong enough for it to appear. Anomalies of the northernsubtropics need an extra 30 to 60 years to reach the Equator.The anomalies over the small region of the North Atlanticsouth of Greenland and Iceland, i.e. near the main convec-tion sites (Irminger and Labrador Seas) in LGMb, only passthe 50% threshold at around year 240. This corresponds tothe shut down of these sites (Fig.4). Finally the Northeast-ern Pacific and Northwestern America undergo the warmingshown on Fig.6 after up to 300 yrs, which excludes an ex-clusive role of changes in atmospheric stationary waves insetting up this temperature anomaly.
Over the North Atlantic and Western Europe, the timing ofthe precipitation response (Fig.11, bottom) is generally verymuch in phase with the temperature one (Fig.11, top). Theprecipitation anomaly passes over the 50% threshold beforeyear 60 for the western and central North Atlantic, beforeyear 150 for the rest of the mid-latitude North Atlantic andthe latest response occurs over the Greenland-Iceland con-vection site by year 240. This suggests a direct role of tem-perature anomalies on precipitation, the most simple mecha-nism for this link being via a reduction in evaporation. Thisis further discussed in Sect.5.1. This type of response also
occurs in an IPSLCM4 glacial ocean-atmosphere simula-tion in response to changes in river run-off (Alkama et al.,2007). The response over Central America, the Gulf of Mex-ico and the eastern equatorial Pacific appears by year 120–180 of LGMc, i.e. before the temperature anomaly passesthe 50% threshold. Over the northeastern Pacific and north-western America, the precipitation anomaly appears in twostages. The southern part of the anomaly appears by year120, while its northern part appears quite late, by year 240,similar to the temperature anomalies. This suggests a firstresponse related to atmospheric circulation changes, beforea response to the later temperature anomalies sets in. Overthe Arabian Sea and Indian sub-continent, which are the In-dian monsoon regions in our simulation (Fig.9a), the maindrying appears by year 120, but a secondary decrease occursaround the Bay of Bengal by year 240. Again, this suggestsa first response related to changes in atmospheric circulation(cf. Sect.5.3) before a second, more local mechanism, addson to this first anomaly. Changes in precipitation in the tropi-cal Atlantic also appear gradually, with the dipole associatedwith the shift of the ITCZ finally setting in at around year200 (red colour bands across Northern South America andred zone over Eastern Brazil). The mechanisms and timingof the ITCZ shift are detailed further in Sect.5.2.
www.clim-past.net/5/551/2009/ Clim. Past, 5, 551–570, 2009

562 M. Kageyama et al.: Glacial climate sensitivity to AMOC strength
30
-180 -150 -120 -90 -60 -30 0 30 60 90 120 150 180
0
-30
75
45
15
-15
90
60
30
5
-180 -150 -120 -90 -60 -30 0 30 60 90 120 150 180
0
-30
75
45
15
-15
90
60
30
5
-180 -150 -120 -90 -60 -30 0 30 60 90 120 150 180
0
-30
75
45
15
-15
90
60
30
Fig. 8. December-January-February 500 hPa winds (m/s). Top: LGMa; middle: LGMb–LGMa;bottom: LGMc–LGMb. The shading indicated points for which changes in both components ofthe wind are significant at the 95% level in a standard Student-T test. The time averages aretaken over years 201–250 for LGMa and LGMb, and over years 521–570 for LGMc.
Fig. 8. December-January-February 500 hPa winds (m/s). Top:LGMa; middle: LGMb–LGMa; bottom: LGMc-LGMb. The shad-ing indicated points for which changes in both components of thewind are significant at the 95% level in a standard Student-T test.The time averages are taken over years 201–250 for LGMa andLGMb, and over years 521–570 for LGMc.
Hence, the timing of the temperature and precipitation re-sponses to the AMOC collapse simulated in LGMc suggest:(1) over the northern extratropics, a fast (of order decades) re-sponse of the North Atlantic which propagates over Eurasia,but a much slower (of order centuries) response over NorthAmerica; (2) a fast response of the Indian monsoon, whichmight be related to the fast adjustement over the Eurasiancontinent; (3) an adjustement of the tropical Atlantic con-sistent for temperatures and precipitation, which occurs onslightly longer time-scales. In the next section, we investi-gate the mechanisms underlying these climate changes forthese three regions.
5 Mechanisms for the climatic response in the AMOC“off” simulation over selected areas
Our objective here is to understand the major features of theannual mean changes due to a collapse of the AMOC shownon Figs.6 and9 and introduced in Sects.3.3 and4. In par-ticular, as indicated above, we will focus successively onthe northern extratropics, the tropical Atlantic and the Indian
0
1
2
3
4
5
6
7
8
9
-180 -150 -120 -90 -60 -30 0 30 60 90 120 150 180-90
-70
-50
-30
-10
10
30
50
70
90
-1.8
-1.4
-1
-0.6
-0.2
0.2
0.6
1
1.4
1.8
-180 -150 -120 -90 -60 -30 0 30 60 90 120 150 180-90
-70
-50
-30
-10
10
30
50
70
90
-1.8
-1.4
-1
-0.6
-0.2
0.2
0.6
1
1.4
1.8
-180 -150 -120 -90 -60 -30 0 30 60 90 120 150 180-90
-70
-50
-30
-10
10
30
50
70
90
Fig. 9. Mean annual precipitation (mm/day). Top: LGMa; middle: LGMb–LGMa; bottom:LGMc–LGMb. The differences have been masked where not significant at the 95% level ina standard Student-T test. The time averages are taken over years 201–250 for LGMa andLGMb, and over years 521–570 for LGMc.
Fig. 9. Mean annual precipitation (mm/day). Top: LGMa; middle:LGMb–LGMa; bottom: LGMc–LGMb. The differences have beenmasked where not significant at the 95% level in a standard Student-T test. The time averages are taken over years 201–250 for LGMaand LGMb, and over years 521–570 for LGMc.
monsoon region. We will concentrate on the response to astrong AMOC perturbation. Unless explicitely indicated, allfigures and discussion will relate here to differences LGMc-LGMb.
5.1 Northern extratropics
In this region, as for the difference induced by a weak changein the AMOC (Sect.3.2), changes in atmospheric circulationappear to play an active role in setting up the thermal re-sponse to a strong decrease in AMOC. A cyclonic anomalydevelops over the region of strongest cooling of the NorthAtlantic, i.e. over the northeastern North Atlantic. Thisanomaly brings energy to northwestern Europe, hence ex-plaining the relatively low cooling over this region (Fig.8,bottom). Consistently, an anticyclonic anomaly centeredover the Central Mediterranean brings colder air to centraland eastern Europe, explaining the local maximum coolingthere (Figs.6 – bottom – and7, r.h.s – top). Hence the cool-ing of Eurasia is not only explained by advection of cold airfrom the North Atlantic by the westerlies. Superimposed tothis response, the cyclonic circulation forced by the initialcooling over the North Atlantic ocean brings warmer air towestern Europe and limits the cooling there, while the cool-ing is amplified by cold air advection further east over eastern
Clim. Past, 5, 551–570, 2009 www.clim-past.net/5/551/2009/

M. Kageyama et al.: Glacial climate sensitivity to AMOC strength 563
Fig. 10. Difference (LGMc–LGMb) in meridional northward heat transport at 17◦N by the at-mosphere (in red) and the ocean (in black).
Fig. 10. Difference (LGMc-LGMb) in meridional northward heattransport at 17◦ N by the atmosphere (in red) and the ocean (inblack).
Europe, North of the Black Sea. This behaviour is more pro-nounced in winter and spring in the temperature responseshown on Fig.7. This is consistent with the atmosphericcirculation behaviour, which is similar for winter and spring(cf. Fig.8, bottom) but with much less pronounced stationarywaves over Eurasia in summer and autumn (not shown).
The precipitation response over the North Atlantic and Eu-rope also depends on the season, partly because the precipita-tion in LGMb, as for the present observed situation, is highlyseasonal (not shown). Over the North Atlantic Ocean, the de-crease in precipitation is maximum, in extent and amplitude,in winter and minimum in summer. This drying is strongestover the eastern side of the basin, where the cooling is alsothe largest. This points to a simple relationship betweenNorth Atlantic temperature and precipitation anomalies, via adecrease in evaporation (Fig.12). Over the northern Mediter-ranean area, the decrease in precipitation is strongest in win-ter, while in western to central Europe, North of the Mediter-ranean Sea, the drying is strongest in autumn. For these tworegions, the strongest response therefore occurs at the seasonfor which the precipitation is maximum in the reference run.
The temperature response to an AMOC collapse is ratherconstant throughout the year over the Eastern Pacific andNorthwestern America, which undergo a warming (Fig.7).There are no temperature differences in the rest of the extrat-ropical Pacific. This warming can be explained by a cyclonicanomaly, present at all seasons, extending from the datelineto the West American coast and from ca. 30 to 60◦ N. How-ever, the slow timing of the response suggests that its estab-lishment also needs the surface ocean to adjust first. The pre-cise position and intensity of this cyclonic anomaly slightlychange from season to season but its net effect is that south-westerly winds bring warmer air to the Northeastern Pacificand Northwestern America. This warming is accompaniedby an increase in precipitation, which is strongest, in ampli-tude and extent, in summer and autumn. This phenomenon
Fig. 11. Top: Timing of the appearance of significant anomalies in mean annual temperature inLGMc, as compared to LGMb, defined as the first year in which the anomaly reaches at leasthalf of the final anomaly for at least 50 years (the “final” anomaly is taken as the differencebetween years 521–570 of LGMc and years 100–150 of LGMb). Bottom: Same as for top butfor the mean annual precipitation (cf. final response Fig. 9).
Fig. 11. Top: Timing of the appearance of significant anomalies in mean annual temperature inLGMc, as compared to LGMb, defined as the first year in which the anomaly reaches at leasthalf of the final anomaly for at least 50 years (the “final” anomaly is taken as the differencebetween years 521–570 of LGMc and years 100–150 of LGMb). Bottom: Same as for top butfor the mean annual precipitation (cf. final response Fig. 9).
Fig. 11. Top: Timing of the appearance of significant anomalies inmean annual temperature in LGMc, as compared to LGMb, definedas the first year in which the anomaly reaches at least half of thefinal anomaly for at least 50 years (the “final” anomaly is takenas the difference between years 521–570 of LGMc and years 100–150 of LGMb). Bottom: Same as for top but for the mean annualprecipitation (cf. final response Fig.9).
is not only related to evaporation anomalies, as for the NorthAtlantic Ocean (Fig.12), but also to the southward shift ofthe westerlies and storm-tracks which is prominent in sum-mer and autumn (not shown).
5.2 Tropical Atlantic
The modifications in atmospheric heat transport betweenLGMb and LGMc described in Sect.3.2occur via an adjust-ment of the meridional cells in the atmosphere. In LGMb,the atmospheric zonally averaged meridional streamfunction(Fig. 13, contours) shows a near symmetry about the Equa-tor, with two Hadley cells spreading from ca. 4◦ N to 30◦ Nor S. Poleward of the Hadley cells, the Ferrel cells, between30 and 50◦ N or S and finally the polar cells, mostly active inthe Northern Hemisphere, are simulated. The differences be-tween LGMc and LGMb affect every cell (Fig.13, colourshading). The largest differences are nonetheless locatednear the Equator where a large positive (clockwise) anomalyimplies a southward shift of the limit between the two Hadleycells. This shift amounts to around 10◦ of latitude. This type
www.clim-past.net/5/551/2009/ Clim. Past, 5, 551–570, 2009

564 M. Kageyama et al.: Glacial climate sensitivity to AMOC strength
Fig. 12. LGMc–LGMb precipitation (l.h.s) and evaporation (r.h.s) anomalies in mm/day for the4 seasons. The differences have been masked where not significant at the 95% level in astandard Student-T test. The time averages are taken over years 201–250 for LGMb and overyears 521–570 for LGMc.
Fig. 12.LGMc-LGMb precipitation (l.h.s) and evaporation (r.h.s) anomalies in mm/day for the 4 seasons. The differences have been maskedwhere not significant at the 95% level in a standard Student-T test. The time averages are taken over years 201–250 for LGMb and over years521–570 for LGMc.
Fig. 13. Meridional atmospheric overturning streamfunction (1012kg/s). The contours representfor the averaged value for LGMb (years 201–250), with a clockwise rotation when positive. Redshaded zones stand for positive (clockwise) differences between LGMc and LGMb (years 521–570 for LGMc, years 201-250 for LGMb). Blue shaded zones stand for negative (anticlockwise)ones.
Fig. 13. Meridional atmospheric overturning streamfunction(1012kg/s). The contours represent for the averaged value forLGMb (years 201–250), with a clockwise rotation when positive.Red shaded zones stand for positive (clockwise) differences be-tween LGMc and LGMb (years 521–570 for LGMc, years 201–250for LGMb). Blue shaded zones stand for negative (anticlockwise)ones.
of adjustment in response to an imposed Northern Hemi-sphere cooling is in agreement with several studies, (e.g.Zhang and Delworth, 2005; Chiang and Bitz, 2005; Broccoliet al., 2006).
This has a direct impact on the precipitation near the Equa-tor, with the southward shift of the main precipitation belt,by 10◦ or more, in the tropical Atlantic. In winter, the neg-ative anomaly of the anomalous precipitation dipole patternshown on Fig.12 is located at the Equator and the positiveanomaly at ca. 10◦ S. In boreal summer this pattern is shiftedNorth by ca. 10◦. The anomaly pattern therefore follows theseasonal course of the main precipitation belt, which furtherproves the relationship between the shift in ITCZ and thetropical Atlantic precipitation anomalies. A close compar-ison of the precipitation fields for LGMb (not shown) andthe corresponding LGMc-LGMb anomalies (Fig.12, l.h.s)shows that the strong precipitation decrease off the Pacificcoast of Central America can also be related to the south-ward shift of the ITCZ, although there is not as distinct acorresponding positive anomaly to the South, except in June-July-August (JJA). Over the Amazon region, the increasein precipitation in September-October-November (SON) andDecember-January-February (DJF) is further amplified by apositive feedback involving increased evaporation (Fig.12,r.h.s). Finally, the strong precipitation decrease over the Gulf
Clim. Past, 5, 551–570, 2009 www.clim-past.net/5/551/2009/

M. Kageyama et al.: Glacial climate sensitivity to AMOC strength 565
of Mexico also appears to be associated with the southwardshift of the ITCZ, or to an increase of the subsidence of thewinter Hadley cell, since the anomalies are stronger in borealautumn and winter and are not related to evaporation anoma-lies.
The impact of a strong weakening of the AMOC betweenthe simulations LGMb and LGMc on the June to September(JJAS) precipitation is shown on Fig.14a. The southwardshift of the ITCZ in the Equatorial Atlantic is accompaniedby a significant reduction in precipitation over the Africanmonsoon region during the monsoon season. Other model-ing experiments (e.g.Chang et al., 2008) have highlightedthe sensitivity of the African monsoon system to an addition-nal fresh water flux in the North Atlantic and Arctic. In ourexperiments, this impact is verified under glacial conditions.
5.3 Indian monsoon
The Indian monsoon precipitation is reduced by approxi-mately 0.5 to 2 mm/day in the Southwest of the subcontinentand in the northern Bay of Bengal in LGMc compared toLGMb. No changes are observed over land since in the refer-ence (LGMb) simulation, the largest monsoon signal is overthe ocean. The reduction of the Indian monsoon intensityis also reflected in the weakened cross-equatorial flux fromthe Indian Ocean to the Arabian Sea (Fig.14a). Hence ourexperiments show that under glacial conditions a collapse ofthe AMOC is associated with a significant remote impact onthe Indian summer monsoon activity. As stated in Sect.1.2,this teleconnection has been investigated for different timescales and there are several pathways by which the Indianmonsoon rainfall may be influenced. The connection withthe extratropics can find support in an atmospheric bridgewith the changes over the North Atlantic (Goswami et al.,2006). The influence of a weakening of the AMOC can alsomodify the (tropical) Walker circulation (e.g.Lu et al., 2006).Local ocean-atmosphere feedbacks, e.g. through changes inSSTs and evaporation, can amplify the changes.
Here we use a physical indicator of the Indian monsoonbased on the upper tropospheric temperature meridional gra-dient (Xavier et al., 2007; He et al., 2003). We computethe average of tropospheric temperature from 200 to 500 hPa(TT) for the JJAS season. The difference of TT between thesimulations LGMc and LGMb (Fig.14b) indicates a signif-icant seasonal cooling over the mid-latitudes. Over India,the meridional gradient of TT is reduced, as well as the sen-sitive heating over the Tibetan Plateau (not shown), result-ing in weaker Indian monsoon precipitation. This mecha-nism is in agreement with the teleconnection observed be-tween the Atlantic Multidecadal Oscillation and the Indianmonsoon variability byGoswami et al.(2006) andFeng andHu (2008). The anomaly of SSTs in the Northern Atlanticare passed in the upper troposphere over the whole Eurasiancontinent (cf. Sect.5.1), creating an atmospheric bridge be-tween the North Atlantic and the Asian region. Since the SST
Fig. 14. a) Difference of precipitation (mm/day) averaged for JJAS (June-July-August-September) between the simulations LGMc and LGMb (colours), and of surface winds at 10meters (m/s) (vectors); b) Difference of temperature averaged from 200 to 500 hPa (TT) forJJAS between LGMc and LGMb; for a) and b) the time averages are taken over years 201–250LGMb, and over years 521–570 for LGMc, for comparison to other figures; c) Evolution of TTaveraged over the region (50◦E-100◦E, 20◦N-50◦N) (red) and of precipitation averaged over theregion (60◦E-80◦E, 5◦N-15◦N) (blue) for LGMc minus LGMb (average over years 101–150).
Fig. 14. (a)Difference of precipitation (mm/day) averaged for JJAS(June-July-August-September) between the simulations LGMc andLGMb (colours), and of surface winds at 10 m (m/s) (vectors);(b)Difference of temperature averaged from 200 to 500 hPa (TT) forJJAS between LGMc and LGMb; for (a) and (b) the time averagesare taken over years 201–250 LGMb, and over years 521–570 forLGMc, for comparison to other figures;(c) Evolution of TT av-eraged over the region (50◦ E–100◦ E, 20◦ N–50◦ N) (red) and ofprecipitation averaged over the region (60◦ E–80◦ E, 5◦ N–15◦ N)(blue) for LGMc minus LGMb (average over years 101–150).
anomalies over the Indian Ocean and the Pacific are small,this mechanism appears to be predominant in these simula-tions. In addition, the evolution of the TT anomaly over theregion (50◦ E–100◦ E, 20◦ N–50◦ N) and of the precipitationanomaly at the southwest of the Indian peninsula is plottedon Fig.14c. A 10 years boxcar smoothing is applied on thetime series to remove the large interannual variability. Theprecipitation evolution follows that of TT anomalies and isstable after ca. 200 years. These evolutions are similar to theone of the maximum of AMOC (Fig.1).
www.clim-past.net/5/551/2009/ Clim. Past, 5, 551–570, 2009

566 M. Kageyama et al.: Glacial climate sensitivity to AMOC strength
6 Summary and discussion
The present study analyses three glacial coupled atmosphere-ocean simulations characterised by different Atlantic Merid-ional Overturning Circulations (AMOC). In response to an0.08 Sv increase in North Atlantic fresh water flux, theAMOC reduces from 18 Sv (LGMa) to 15 Sv (LGMb). Theclimate differences between these runs are restricted to thenorthern North Atlantic, Nordic Seas and Europe. The cool-ing anomaly over the Northern North Atlantic associatedwith this slightly slower AMOC is strong enough to forcea cyclonic anomaly in the atmospheric circulation over thisregion, which could take part in the slight warming over theNorwegian Sea. However, the main element explaining thissurprising warm anomaly is the reinforcement of the oceanicconvective activity in this area, partly resulting from the seaice edge pushed further North by surface winds. An anoma-lous cooling appears further east in winter, due to northerlywinds appearing as part of the stationary wave response tothe SST changes over the North Atlantic and Nordic Seas.It is not possible to disentangle the roles of the atmosphere,ocean and sea ice in the temperature difference between thetwo simulations. Further experiments, using partial couplingof the model components, would be needed to test if the at-mospheric circulation changes and oceanic/sea ice responseindeed reinforce each other, especially over the NorwegianSea, as suggested by our first analyses. The difference inprecipitation, on the other hand, is hardly significant for thesesimulations.
A further 0.1 Sv fresh water flux into the North Atlanticinduces a collapse of the AMOC in LGMc, compared toLGMb. As noted byFluckiger et al.(2008), the climatic re-sponse to this shutdown does not appear to be a simple ampli-fication of the climate anomalies simulated as a response to aweak AMOC perturbation. This has important implicationsfor paleo-record interpretations, which could otherwise a pri-ori assume a linear reponse w.r.t the forcing, i.e. in our casea change in AMOC. The surface climate anomalies are ofglobal extent, and qualitatively agree with the interpretationof paleorecords for the northern extratropics (in particular,the North Atlantic and surrounding regions such as Green-land and Europe), the tropical Atlantic, with the southwardshift of the ITCZ and the Indian monsoon region, over whichthe monsoon decreases. However, the model does not simu-late a warming over Antarctica (despite a warming over mostof the Southern Ocean) or a weakening of the East Asianmonsoon. It could simply be that the model is not sensi-tive enough to a collapse of the AMOC compared to the cli-matic changes suggested by the different paleo-records, orthat the model is missing crucial feedbacks (from dust, veg-etation or biogeochemical cycles, for instance), or that someof these climatic changes are not related to AMOC differ-ences. However, before drawing any conclusion of this type,further experiments would have to be performed. Indeed,although it is probably legitimate to claim that LGM bound-
ary conditions are closer to the boundary conditions whichprevailed during times of strong millennial abrupt changes(Marine Isotope Stage 3 (MIS3) from ca. 60 to 30 ky BP)than present conditions, these are far from being entirely re-alistic for this period (for a recent study, see e.g.Van Meer-beeck et al., 2009). In particular, MIS3 is characterised by astronger Northern Hemisphere summer insolation than dur-ing the LGM or the present, which would favour strongerIndian and South-East Asian monsoons in the basic state, asshown by the numerous studies of the Holocene climate (e.g.Braconnot et al., 2007a,b). This monsoon could then be moresensitive to AMOC changes. Also, for quantitative compar-isons, including proxies such as water isotopes in the modelwould certainly bring a lot of precise understanding of theproxy records.
Our main objective here was to investigate the mecha-nisms for possible teleconnections with the North Atlanticchanges. We have focussed our study on the three regionsfor which the results simulated by our model appeared rel-evant compared to the proxy records: the northern extrat-ropics, the tropical Atlantic and the Indian monsoon region.The climate response in the northern extratropics is domi-nated by large changes in stationary waves, with a strongcyclonic anomaly over the northern North Atlantic persis-tent throughout the year, but stronger in winter and spring.These changes in stationary waves explain the smaller cool-ing over western Europe, as compared to the North Atlantic,because this region is affected by southwesterly wind anoma-lies. They also explain a warming over the Northeastern Pa-cific and America’s northwestern coast, affected by south-westerly wind anomalies too. However in this latter case, thelong timing for the set up of this anomaly pleads for a role ofthe Pacific Ocean in forcing the associated atmospheric cir-culation anomaly. The precipitation anomalies over the At-lantic extratropics are mostly related to a strong evaporationdecrease due to the cooling there and not so much to atmo-spheric circulation changes, such as in other regions. Indeed,over the Northeastern Pacific/Northwestern America, for ex-ample, they appear to be also related with a southward shiftof the westerlies/storm-tracks.
The collapse of the AMOC is accompanied by a decreasein meridional oceanic heat transport, strongest in the Atlanticbasin, and only partly compensated by an increase of thetransport in the other ocean basins and by an increase in at-mospheric heat transport. The atmospheric meridional heattransport increase occurs via an adjustment of the meridionalcirculation, and most notably of the Hadley cells. The struc-ture of the atmospheric meridional circulation shifts south-ward by around 10◦ in the Tropics. This is accompanied bya dipole in the precipitation anomalies, with a drying Northof the thermal equator and a wettening South of it, whichconstitutes the hydrological signature of the southward shiftof the ITCZ. This signature is most prominent in the tropicalAtlantic, but part of the precipitation anomalies in the easterntropical Pacific can also be ascribed to this mechanism. The
Clim. Past, 5, 551–570, 2009 www.clim-past.net/5/551/2009/

M. Kageyama et al.: Glacial climate sensitivity to AMOC strength 567
increase in precipitation over the Amazon region appears tobe amplified by a local evaporation-precipitation feedback.Finally, we analyse the weakening of the Indian monsoonin response to the AMOC collapse as a consequence of anatmospheric bridge between the North Atlantic and the mon-soon area, which involves the large cooling of the upper tro-posphere over Eurasia, and the subsequent decrease in thetropospheric meridional gradient between India and North-ern Eurasia.
These surface climate changes associated with an AMOCshutdown do not appear simultaneously in all regions of theglobe. The timing of the response is of the order of a hundredyears over the Atlantic, Eurasia and for the Indian monsoon.The response over the northwestern Pacific is the slowest toappear, with a timescale of around 250 years. The tropi-cal Atlantic responds with intermediate timescales comparedto these extremes. This timing suggests (1) a very fast cli-matic response over the Arctic and Northern Eurasia, whichis probably related to an atmospheric stationary wave changeamplified by the sea-ice and snow-albedo feedbacks; (2) anextension of this cooling over most of Eurasia and NorthAfrica; (3) a propagation of the temperature anomalies fromthe central North Atlantic along the subtropical gyre alongthe coasts of Africa, before the temperature cools down inthe North Atlantic low latitudes; (4) relatively slower oceanresponses for the largest convection site of the northwesternNorth Atlantic, for the South Atlantic and, finally, for theNorthwestern Pacific. Comparing these results to paleodatawith sufficient temporal resolution and chronological controlwould therefore be a good test of the model’s sensitivity tofreshwater forcings and states of the AMOC.
Each step in the climatic response depicted above corre-sponds to a precise AMOC value (Fig.1). However, this doesnot mean that the AMOC has to pass below this value to ob-tain the described response. Indeed, the climatic responseover some regions such as the North Atlantic sub-tropicalgyre are indirectly related to the slow down of the AMOC,via the propagation (by different possible mechanisms) of theinitial cooling of the mid-latitude Western and Central At-lantic. It is therefore not possible, from our experiments, tostrictly disentangle the direct and immediate response to anAMOC decrease from the propagation of a signal advectedfrom another region because the AMOC decrease and the cli-mate signal propagation can occur with similar timescales.Further experiments, with different speeds of AMOC col-lapse and/or in which the atmosphere and the ocean are onlypartially coupled, would be necessary to pin down the exactroles of the ocean or the atmosphere, as has been performedby other models (e.g.Krebs and Timmermann, 2007; Yangand Liu, 2005).
Concerning the sensitivity of the AMOC under LGM con-ditions, a companion paper shows that the model we use, theIPSL CM4 model, is actually more sensitive to freshwaterinput in the North Atlantic in the glacial context analysedhere than under various interglacial climates (Swingedouw
et al., 2009). This is in line with the analyses fromGanopol-ski and Rahmstorf(2001). This difference in sensitivitysheds light on the necessity of comparing proxy data andsimulations that are under the most possible realistic bound-ary conditions. The reason for these differences is howevernot elucidated yet and will be the subject of a future study.
A final remark is related to the hydrological cycle, whichis deeply affected by a collapse in the AMOC. FollowingLeduc et al.(2007), we can wonder whether this constitutesa positive or a negative feedback compared to the freshwateranomaly which is the initial cause of the AMOC collapse.The study of these feedbacks and of the conditions neededfor a recovery of the AMOC from the “off” state obtained inour third simulation is complementary to the present studyand will be presented in a forthcoming paper.
Acknowledgements.All simulations presented in this work wererun on the Commissariat A l’Energie Atomique super-computingfacilities. This study has been partly funded by ANR-BLANCIDEGLACE (ANR-05-BLAN-0310-01).
Edited by: H. Renssen
The publication of this article is financed by CNRS-INSU.
References
Alkama, R., Kageyama, M., Ramstein, G., Marti, O., Ribstein,P., and Swingedouw, D.: Impact of a realistic river routingin coupled ocean-atmosphere simulations of the Last GlacialMaximum climate, Clim. Dynam., 30, 855–869, doi:10.1007/s00382-007-0330-1, 2007.
Altabet, M. A., Higginson, M. J., and Murray, D. W.: The effect ofmillennial-scale changes in Arabian Sea denitrification on atmo-spheric CO2, Nature, 415, 159–162, 2002.
Berger, A. L.: Long-term variations of daily insolation and Quater-nary climatic changes, J. Atmos. Sci., 35, 2362–2367, 1978.
Bitz, C. M., Chiang, J. C. H., Cheng, W., and Barsugli, J. J.: Ratesof thermohaline recovery from freshwater pulses in modern, LastGlacial Maximum, and greenhouse warming climates, Geophys.Res. Lett., 34, L07708, doi:10.1029/2006GL029237, 2007.
Bjerknes, J.: Atlantic air-sea interaction, Academic Press, 10, 1–82,1964.
Blunier, T., Chappellaz, J., Schwander, J., Dallenbach, A., Stauf-fer, B., Stocker, T. F., Raynaud, D., Jouzel, J., Clausen, H. B.,Hammer, C. U., and Johnsen, S. J.: Asynchrony of Antarctic andGreenland climate change during the last glacial period, Nature,394, 739–743, 1998.
Bond, G., Broecker, W., Johnsen, S., McManus, J., Labeyrie, L.,Jouzel, J., and Bonani, G.: correlations between climate records
www.clim-past.net/5/551/2009/ Clim. Past, 5, 551–570, 2009
568 M. Kageyama et al.: Glacial climate sensitivity to AMOC strength
from North Atlantic sediments and Greenland ice, Nature, 365,143–147, 1993.
Bout-Roumazeilles, V., Nebout, N. C., Peyron, O., Cortijo, E.,Landais, A., and Masson-Delmotte, V.: Connection betweenSouth Mediterranean climate and North African atmospheric cir-culation during the last 50 000 yr BP North Atlantic cold events,Quaternary Sci. Rev., 26, 3197–3215, 2007.
Braconnot, P., Otto-Bliesner, B., Harrison, S., Joussaume, S., Pe-terchmitt, J.-Y., Abe-Ouchi, A., Crucifix, M., Driesschaert, E.,Fichefet, T., Hewitt, C. D., Kageyama, M., Kitoh, A., Lan, A.,Loutre, M.-F., Marti, O., Merkel, U., Ramstein, G., Valdes, P.,Weber, S. L., Yu, Y., and Zhao, Y.: Results of PMIP2 coupledsimulations of the Mid-Holocene and Last Glacial Maximum -Part 1: experiments and large-scale features, Clim. Past, 3, 261–277, 2007a,http://www.clim-past.net/3/261/2007/.
Braconnot, P., Otto-Bliesner, B., Harrison, S., Joussaume, S., Pe-terchmitt, J.-Y., Abe-Ouchi, A., Crucifix, M., Driesschaert, E.,Fichefet, Th., Hewitt, C. D., Kageyama, M., Kitoh, A., Loutre,M.-F., Marti, O., Merkel, U., Ramstein, G., Valdes, P., Weber,L., Yu, Y., and Zhao, Y.: Results of PMIP2 coupled simulationsof the Mid-Holocene and Last Glacial Maximum - Part 2: feed-backs with emphasis on the location of the ITCZ and mid- andhigh latitudes heat budget, Clim. Past, 3, 279–296, 2007b,http://www.clim-past.net/3/279/2007/.
Broccoli, A. J., Dahl, K. A., and Stouffer, R. J.: Response of theITCZ to Northern Hemisphere cooling, Geophys. Res. Lett., 33,L01702, doi:10.1029/2005GL024546, 2006.
Chang, P., Zhang, R., Hazeleger, W., Wen, C., Wan, X. Q., Ji,L., Haarsma, R. J., Breugem, W. P., and Seidel, H.: Oceaniclink between abrupt changes in the North Atlantic Ocean and theAfrican monsoon, Nature Geosci., 1, 444–448, 2008.
Chiang, J. C. H. and Bitz, C. M.: Influence of high latitude ice coveron the marine Intertropical Convergence Zone, Clim. Dynam.,25, 477–496, 2005.
Chiang, J. C. H., Cheng, W., and Bitz, C. M.: Fast tele-connections to the tropical Atlantic sector from Atlanticthermohaline adjustment, Geophys. Res. Lett., 35, L07704,doi:10.1029/2008GL033292, 2008.
Claussen, M., Ganopolski, A., Brovkin, V., Gerstengarbe, F.-W.,and Werner, P.: Simulated global-scale response of the climatesystem to Dansgaard/Oeschger and Heinrich events, Clim. Dy-nam., 21, 361–370, 2003.
Clement, A. C. and Peterson, L. C.: Mechanisms of abrupt climatechange of the last glacial period, Rev. Geophys., 46, RG4002,doi:10.1029/2006RG000204, 2008.
Combourieu Nebout, N., Turon, J.-L., Zhan, R., Capotondi, L.,Londeix, L., and Pahnke, K.: Enhanced aridity and atmospherichigh-pressure stablity over the western Mediterranean during theNorth Atlantic cold events of the past 50 k.y., Geology, 30, 863–866, 2002.
Crowley, T. J.: North Atlantic deep water cools the Southern Hemi-sphere, Paleoceanography, 7, 489–497, 1992.
Dallenbach, A., Blunier, T., Fluckiger, J., Stauffer, B., Chappellaz,J., and Raynaud, D.: Changes in the atmospheric CH4 gradientbetween Greenland and Antarctica during the Last Glacial andthe transition to the Holocene, Geophys. Res. Lett., 27, 1005–1008, 2000.
Dansgaard, W., Johnsen, S. J., Clausen, H. B., Dahl-Jensen, D.,
Gundestrup, N. S., Hammer, C. U., Hvidberg, C. S., Steffensen,J. P., Sveinbjornsdottir, A. E., Jouzel, J., and Bond, G.: Evidencefor general instability of past climate from a 250-kyr ice-corerecord, Nature, 364, 218–220, 1993.
Denton, G. H., Alley, R. B., Comer, G. C., and Broecker, W. S.:The role of seasonality in abrupt climate change, Quaternary Sci.Rev., 24, 1159–1182, 2005.
Elliot, M., Labeyrie, L., and Duplessy, J.-C.: Changes in NorthAtlantic deep-water formation associated with the Dansgaard-Oeschger temperature oscillations (60–10 ka), Quaternary Sci.Rev., 21, 1153–1165, 2002.
EPICA community members: One-to-one coupling of glacial cli-mate variability in Greenland and Antarctica, Nature, 444,doi:10.1038/nature05301, 2006.
Feng, S. and Hu, Q.: How the North Atlantic Multidecadal Os-cillation may have influenced the Indian summer monsoon dur-ing the past two millennia, Geophys. Res. Lett., 35, L01707,doi:10.1029/2007GL032484, 2008.
Fluckiger, J., Dallenbach, A., Blunier, T., Stauffer, B., Stocker,T. F., Raynaud, D., and Barnola, J.-M.: Variations in atmosphericN2O concentration during abrupt climatic changes, Science, 285,227–230, 1999.
Fluckiger, J., Knutti, R., White, J. W. C., and Renssen, H.: Modeledseasonality of glacial abrupt climate events, Clim. Dynam., 31,633–645, doi:10.1007/s00382-008-0373-y, 2008.
Ganopolski, A. and Rahmstorf, S.: Rapid changes of glacial cli-mate simulated in a coupled climate model, Nature, 409, 153–158, 2001.
Genty, D., Blamart, D., Ouahdi, R., Gilmour, M., Baker, A., Jouzel,J., and Van-Exter, S.: Precise dating of Dansgaard-Oeschger cli-mate oscillations in western Europe from stalagmite data, Nature,421, 833–937, 2003.
Gonzalez, C., Dupont, L. M., Behling, H., and Wefer, G.: Neotrop-ical vegetation response to rapid climate changes during the lastglacial period: Palynological evidence from the Cariaco Basin,Quaternary Res., 69, 217–230, 2008.
Goswami, B. N., Madhusoodanan, M. S., Neema, C. P., and Sen-gupta, D.: A physical mechanism for North Atlantic SST influ-ence on the Indian summer monsoon, Geophys. Res. Lett., 33,L02706, doi:10.1029/2005GL024803, 2006.
Grimm, E. C., Watts, W. A., Jacobson, Jr., G. L., Hansen, B. C. S.,Almquist, H. R., and Dieffenbacher-Krall, A. C.: Evidence forwarm wet Heinrich events in Florida, Quaternary Sci. Rev., 25,2197–2211, 2006.
He, H. Y., Sui, C. H., Jian, M. Q., Wen, Z. P., and Lan, G. D.: Theevolution of tropospheric temperature field and its relationshipwith the onset of Asian summer monsoon, J. Meteorol. Soc. Jpn,81, 1201–1223, 2003.
Heinrich, H.: Origin and consequences of cyclic ice rafting in theNortheast Atlantic ocean during the past 130 000 years, Quater-nary Res., 29, 142–152, 1988.
Hewitt, C. D., Broccoli, A. J., Crucifix, M., Gregory, J. M.,Mitchell, J. F. B., and Stouffer, R. J.: The effect of a large fresh-water perturbation on the glacial North Atlantic ocean using acoupled General Circulation Model, J. Climate, 19, 4436–4447,2006.
Hu, A., Otto-Bliesner, B. L., Meehl, G. A., Han, W., Morrill, C.,Brady, E. C., and Briegleb, B.: Response of Thermohaline Circu-lation to Freshwater Forcing under Present Day and LGM Con-
Clim. Past, 5, 551–570, 2009 www.clim-past.net/5/551/2009/

M. Kageyama et al.: Glacial climate sensitivity to AMOC strength 569
ditions, J. Climate, 21, 2239–2258, 2008.Jin, L., Chen, F., Ganopolski, A., and Claussen, M.: Response of
East Asian climate to Dansgaard-Oeschger and Heinrich eventsin a coupled model of intermediate complexity, J. Geophys. Res.,112, D06117, doi:10.1029/2006JD007316, 2007.
Jullien, E., Grousset, F., Malaize, B., Duprat, J., Sanchez-Goni,M. F., Eynaud, F., Charlier, K., Schneider, R., Bory, A., Bout, V.,and Flores, J. A.: Low-latitude “dusty events” vs. high-latitude“icy Heinrich events”, Quaternary Res., 68, 379–386, 2007.
Kageyama, M., Laıne, A., Abe-Ouchi, A., Braconnot, P., Cortijo,E., Crucifix, M., de Vernal, A., Guiot, J., Hewitt, C. D., Kitoh,A., Kucera, M., Marti, O., Ohgaito, R., Otto-Bliesner, B., Peltier,W. R., Vettoretti, G., Weber, S. L., and MARGO project mem-bers: Last Glacial Maximum temperatures over the North At-lantic, Europe and western Siberia: a comparison between PMIPmodels, MARGO sea-surface temperatures and pollen-based re-constructions, Quaternary Sci. Rev., 25, 2082–2102, 2006.
Kissel, C.: Magnetic signature of rapid climatic variations inglacial North Atlantic, a review, Comptes-RendusGeoscience,337, 908–918, 2005.
Krebs, U. and Timmermann, A.: Tropical air-sea interactions accel-erate the recovery of the Atlantic Meridional Overturning Circu-lation after a major shutdown, J. Climate, 20, 4940–4956, 2007.
Leduc, G., Vidal, L., Tachikawa, K., Rostek, F., Sonzogni, C., Beau-fort, L., and Bard, E.: Moisture transport across Central Americaas a positive feedback on abrupt climatic changes, Nature, 445,908–911, 2007.
Leuschner, D. C. and Sirocko, F.: The low-latitude monsoon climateduring Dansgaard-Oeschger cycles and Heinrich Events, Quater-nary Science Reviews, 19, 243–254, 2000.
Lu, R., Dong, B., and Ding, H.: Impact of the Atlantic MultidecadalOscillation on the Asian summer monsoon, Geophys. Res. Lett.,33, L24701, doi:10.1029/2006GL027655, 2006.
Lynch-Stieglitz, J., , Adkins, J. F., Curry, W. B., Dokken, T.,Hall, I. R., Herguera, J. C., Hirschi, J. J.-M., Ivanova, E. V.,Kissel, C., Marchal, O., Marchitto, T. M., McCave, I. N., Mc-Manus, J. F., Mulitza, S., Ninnemann, U., Peeters, F., Yu,E.-F., and Zahn, R.: Atlantic Meridional Overturning Circula-tion During the Last Glacial Maximum, Science, 316, 66–69,doi:10.1126/science.1137127, 2007.
Manabe, S. and Stouffer, R. J.: Simulation of abrupt climate changeinduced by freshwater input to the North Atlantic Ocean, Nature,378, 165–167, 1995.
Marti, O., Braconnot, P., Bellier, J., Benshila, R., Bony, S., Brock-mann, P., Cadule, P., Caubel, A., Denvil, S., Dufresne, J.-L., Fair-head, L., Filiberti, M.-A., Foujols, M.-A., Fichefet, T., Friedling-stein, P., Goosse, H., Grandpeix, J.-Y., Hourdin, F., Krinner, G.,Levy, C., Madec, G., Musat, I., de Noblet, N., Polcher, J., andTalandier, C.: The new IPSL climate system model: IPSL-CM4,Tech. Rep. 26, IPSL, Note du Pole de Modelisation, iSSN 1288–1619, 84 pp., 2006.
Marti, O., Braconnot, P., Dufresne, J.-L., Hourdin, F., Denvil,S., Friedlingstein, P., Swingedouw, D., Mignot, J., Goosse, H.,Fichefet, T., Codron, F., Guilyardi, E., Bellier, J., Benshila, R.,Bony, S., Brockmann, P., Cadule, P., Caubel, A., Fairhead, L.,Foujols, M.-A., Grandpeix, J.-Y., Hourdin, F., Kageyama, M.,Krinner, G., Levy, C., Madec, G., Musat, I., de Noblet, N., andTalandier, C.: Key features of the IPSL ocean atmosphere modeland its sensitivity to atmospheric resolution, Clim. Dynam., ac-
cepted, 2009.Masson-Delmotte, V., Kageyama, M., Braconnot, P., Charbit, S.,
Krinner, G., Ritz, C., Guilyardi, E., Jouzel, J., Abe-Ouchi,A., Crucifix, M., Gladstone, R. M., Hewitt, C. D., Kitoh, A.,LeGrande, A. N., Marti, O., Merkel, U., Motoi, T., Ohgaito, R.,Otto-Bliesner, B., Peltier, W. R., Ross, I., Valdes, P. J., Vettoretti,G., Weber, S. L., Wolk, F., and Yu, Y.: Past and future polar am-plification of climate change: climate model intercomparisonsand ice-core constraints, Clim. Dynam., 26, 513–529, 2006.
Monnin, E.and Indermuhle, A., Dallenbach, A., Fluckiger, J., Stauf-fer, B., Stocker, T. F.and Raynaud, D., and Barnola, J.-M.: At-mospheric CO2 concentrations over the last glacial termination,Science, 291, 112–114, 2001.
Msadek, R. and Frankignoul, C.: Atlantic multidecadal oceanicvariability and its influence on the atmosphere in a climatemodel, Clim. Dynam., 33, 45–62, 2009.
Muller, J., Kylander, M., Wust, R. A. J., Weiss, D., Martinez-Cortizas, A., LeGrande, A. N., Jennerjahn, T., Behling, H., An-derson, W. T., and Jacobson, G.: Possible evidence for wet Hein-rich phases in tropical NE Australia: the Lynchs Crater deposit,Quaternary Sci. Rev., 27, 468–475, 2008.
Otto-Bliesner, B. L., Schneider, R., Brady, E. C., Kucera, M.,Abe-Ouchi, A., Bard, E., Braconnot, P., Crucifix, M., He-witt, C. D., Kageyama, M., Marti, O., Paul, A., Rosell-Mele,A., Waelbroeck, C., Weber, S. L., Weinelt, M., and Yu, Y.:A comparison of PMIP2 model simulations and the MARGOproxy reconstruction for tropical sea surface temperatures at lastglacial maximum, Clim. Dynam., 32, 799–815, doi:{10.1007/s00382-008-0509-0}, 2009.
Peltier, W. R.: Global glacial isostasy and the surface of theice-age earth: The ICE-5G (VM2) Model and GRACE, An-nual Review of Earth and Planetary Science, 32, 111–149,doi:10.1146/annurev.earth.32.082503.144359, 2004.
Peterson, L. C., Haug, G. H., Hughen, K. A., and Rohl, U.: Rapidchanges in the hydrologic cycle of the tropical North Atlanticduring the last glacial, Science, 290, 1947–1951, 2000.
Porter, S. and An, Z.: Correlation between climate events in theNorth Atlantic and China during the last glaciation, Nature, 375,305–308, 1995.
Rahmstorf, S.: Rapid climate transitions in a coupled ocean-atmosphere model, Nature, 372, 82–85, 1994.
Ramstein, G., Kageyama, M., Guiot, J., Wu, H., Hely, C., Krinner,G., and Brewer, S.: How cold was Europe at the Last GlacialMaximum? A synthesis of the progress achieved since the firstPMIP model-data comparison, Clim. Past, 3, 331–339, 2007,http://www.clim-past.net/3/331/2007/.
Rashid, H., Flower, B. P., Poore, R. Z., and Quinn, T. M.: A sim-ilar to 25 ka Indian Ocean monsoon variability record from theAndaman Sea, Quaternary Sci. Rev., 26, 2586–2597, 2007.
Ruth, U., Bigler, M., Rothlisberger, R., Siggard-Andersen, M.-L.,Kipfstuhl, S., Goto-Azuma, K., Hansson, M. E., Johnsen, S. J.,Lu, H., and Steffensen, J. P.: Ice core evidence for a very tightlink between North Atlantic and east Asian glacial climate, Geo-phys. Res. Lett., 34, L03706, doi:10.1029/2006GL027876, 2007.
Sanchez-Goni, M. F., Landais, A., Fletcher, W. J., Naughton, F.,Desprat, S., and Duprat, J.: Contrasting impacts of Dansgaard-Oeschger events over a western European latitudinal transectmodulated by orbital parameters, Quaternary Sci. Rev., 27,1136–1151, 2008.
www.clim-past.net/5/551/2009/ Clim. Past, 5, 551–570, 2009

570 M. Kageyama et al.: Glacial climate sensitivity to AMOC strength
Sanchez-Goni, M.-F., Cacho, I., Turon, J.-L., Guiot, J., Sierro, F. J.,Peypouquet, J.-P., Grimalt, J. O., and Shackleton, N. J.: Syn-chroneity between marine and terrestrial responses to millen-nial scale climatic variability during the last glacial period in theMediterranean region, Clim. Dynam., 19, 95–105, 2002.
Schneider, B., Latif, M., and Schmittner, A.: Evaluation of Differ-ent Methods to Assess Model Projections of the Future Evolutionof the Atlantic Meridional Overturning Circulation, J. Climate,20, 2121–2132, 2007.
Schulz, H., von Rad, U., and Erlenkeuser, H.: Correlation be-tween Arabian Sea and Greenland climate oscillations of the past110 000 years, Nature, 393, 54–57, 1998.
Shaffrey, L. and Sutton, R.: Bjerknes compensation and the decadalvariability of the energy transports in a coupled climate model, J.Climate, 19, 1167–1181, 2006.
Stocker, T. F.: Climate change – The seesaw effect, Science, 282,61–62, 1998.
Stommel, H. M.: Thermohaline convection with two stable regimesof flow, Tellus, 13, 224–230, 1961.
Stouffer, R. J., Yin, J., Gregory, J. M., Diwon, K. W., Spelman,M. J., Hurlin, W., Weaver, A. J., Eby, M., Flato, G. M., Hasumi,H., Hu, A., Jungclaus, J. H., Kamenovich, I. V., Levermann,A., Montoya, M., Murakami, S., Nawrath, S., Oka, A., Peltier,W. R., Robitaille, D. Y., Sokolov, A., Vettoretti, G., and Weber,S. L.: Investigating the causes of the response of the thermoha-line circulation to past and future climate changes, J. Climate,19, 1365–1387, 2006.
Swingedouw, D., Braconnot, P., Delecluse, P., Guilyardi, E., andMarti, O.: The impact of global freshwater forcing on the ther-mohaline circulation: adjustment of North Atlantic convectionsites in a CGCM, Clim. Dynam., 28, 291–305, 2007a.
Swingedouw, D., Braconnot, P., Delecluse, P., Guilyardi, E., andMarti, O.: Quantifying the AMOC feedbacks during a 2xCO2stabilization experiment with land-ice melting, Clim. Dynam.,29, 521–534, 2007b.
Swingedouw, D., Mignot, J., Braconnot, P., Mosquet, E.,Kageyama, M., and Alkama, R.: Impact of freshwater releasein the North Atlantic under different climate conditions in anOAGCM, J. Climate, accepted, 2009.
Timmermann, A., Krebs, U., Justino, F., Goosse, H., andIvanochko, T.: Mechanisms for millennial-scale global synchro-nization during the last glacial period, Paleoceanography, 20,PA4008, doi:10.1029/2004PA001090, 2005.
Turney, C. S. M., Kershaw, A. P., Clemens, S. C., Branch, N., Moss,P. T., and Fifield, L. K.: Millennial and orbital variations of ElNino/Southern Oscillation and high-latitude climate in the lastglacial period, Nature, 428, 306–310, 2004.
Van Meerbeeck, C. J., Renssen, H., and Roche, D. M.: How didMarine Isotope Stage 3 and Last Glacial Maximum climates dif-fer? - Perspectives from equilibrium simulations, Clim. Past, 5,33–51, 2009,http://www.clim-past.net/5/33/2009/.
Vellinga, M. and Wood, R. A.: Global climatic impacts of a collapseof the Atlantic thermohaline circulation, Clim. Change, 54, 251–267, 2002.
Wang, X., Auler, A. S., Edwards, R. L., Cheng, H., Cristalli, P. S.,Smart, P. L., Richards, D. A., and Shen, C.-C.: Wet periods innortheastern Brazil over the past 210 kyr linked to distant climateanomalies, Nature, 432, 740–743, 2004.
Wang, Y. J., Cheng, H., Edwards, R. L., An, Z. S., Wu, J. Y., Shen,C.-C., and Dorale, J. A.: A high-resolution absolute-dated latePleistocene monsoon record from Hulu Cave, China, Science,294, 2345–2348, 2001.
Weber, S. L. and Drijfhout, S. S.: Stability of the AtlanticMeridional Overturning Circulation in the Last GlacialMaximum climate, Geophys. Res. Lett., 34, L22706,doi:10.1029/2007GL031437, 2007.
Weber, S. L., Drijfhout, S. S., Abe-Ouchi, A., Crucifix, M., Eby, M.,Ganopolski, A., Murakami, S., Otto-Bliesner, B., and Peltier, W.R.: The modern and glacial overturning circulation in the At-lantic ocean in PMIP coupled model simulations, Clim. Past, 3,51–64, 2007,http://www.clim-past.net/3/51/2007/.
Xavier, P. K., Marzin, C., and Goswami, B. N.: An objective defi-nition of the Indian summer monsoon season and a new perspec-tive on the ENSO-monsoon relationship, Q. J. Roy. Meteor. Soc.,133, 749–764, 2007.
Yang, H. and Liu, Z.: Tropical-extra-tropical climate interaction asrevealed in idealized coupled climate model experiments, Clim.Dynam., 24, 863–879, 2005.
Zhang, R. and Delworth, T. L.: Simulated tropical response to asubstantial weakening of the Atlantic thermohaline circulation,J. Climate, 18, 1853–1860, 2005.
Clim. Past, 5, 551–570, 2009 www.clim-past.net/5/551/2009/