On the history of meridional overturning circulation schematic diagrams
46
1 On the History of Meridional Overturning Circulation Schematic Diagrams Philip L. Richardson Woods Hole Oceanographic Institution Physical Oceanography Department, MS #21 360 Woods Hole Road Woods Hole, MA 02543 USA E-mail: [email protected] July 23, 2007 Manuscript
-
Upload
independent -
Category
Documents
-
view
3 -
download
0
Transcript of On the history of meridional overturning circulation schematic diagrams

1
On the History of Meridional Overturning Circulation Schematic
Diagrams
Philip L. Richardson
Woods Hole Oceanographic Institution
Physical Oceanography Department, MS #21
360 Woods Hole Road
Woods Hole, MA 02543 USA
E-mail: [email protected]
July 23, 2007
Manuscript

2
Abstract
Recent global warming caused by humans and the prediction of a reduced Atlantic
Ocean meridional overturning circulation in the future has increased interest in the role of
the overturning circulation in climate change. A schematic diagram of the overturning
circulation called the “Great Ocean Conveyor Belt,” published by Wallace Broecker in
1987, has become a popular image that emphasizes the inter-connected ocean circulation
and the northward flux of heat in the Atlantic. This would appear to be a good time to
review the development of the conveyor belt concept and summarize the history of
overturning circulation schematics.
In the nineteenth century it was thought that symmetric overturning circulation cells
were located on either side of the equator in the Atlantic. As new hydrographic
measurements were obtained in the late nineteenth century and early twentieth century,
circulation schematics in the early twentieth century began to show the inter-hemispheric
overturning circulation in the Atlantic. In the second half of the twentieth century
schematics showed the global ocean overturning circulation including connections
between the Atlantic and the Pacific and Indian Oceans. Some recent schematics of the
overturning circulation show its complexities, but as more information is included these
schematics have also become complex and not as easy to understand as the simple
Broecker 1987 version.
Keywords: ocean conveyor belt, meridional overturning circulation. thermohaline
circulation, global ocean circulation, schematic circulation diagrams, history of ocean
circulation.
Regional terms: global ocean, Atlantic Ocean, Southern Ocean, Indian Ocean, Pacific
Ocean

3
1. Atlantic circulation
1.1 Rennell 1832
In 1832, Jane Rodd, daughter of Major James Rennell, published his chart of
surface currents of the Atlantic (Rennell, 1832) (Fig. 1). Rennell had been a surveyor for
the Royal Navy and East India Company and had a great interest in ocean circulation. As
navigation improved in the eighteenth century, ship captains began to measure surface
currents by calculating the difference between velocity of the ship measured using
position fixes and the dead-reckoned velocity of the ship through the water. Rennell
collected available ship drift velocities and mapped with arrows major ocean currents that
we now know as the Gulf Stream, Brazil Current, South Atlantic Current, and Benguela
Current. In addition to showing the circulation of the subtropical gyres in the North and
South Atlantic, Rennell’s chart shows the first evidence of a possible inter-hemispheric
overturning circulation in the Atlantic; a clear pathway is indicated by arrows westward
around southern Africa, northwestward through the eastern South Atlantic, northward
across the equator in the west, and into the Caribbean and Gulf Stream. Later improved
ship drift charts continued to show the northward flux across the equator in the North
Brazil Current. Generally these charts indicate a northward flow of warm surface water
from the Gulf Stream region into the northern North Atlantic and a southward flow of
colder water from Greenland, along the coast of Labrador, around the Grand Banks and
westward north of the Gulf Stream. A good summary of early charts and schematics
based on ship drifts is given by Peterson et al. (1996).
1.2 Lenz 1845

4
The earliest recorded deep temperature measurements in the subtropical Atlantic
were made in 1750 by Captain Henry Ellis of the British slave ship Earl of Halifax. They
revealed that warm subtropical water was confined to a relatively thin surface layer
overlying much colder water (Ellis, 1851; Wüst, 1968; Deacon, 1971; Warren, 1981).
Count Rumford (1798) who was born American as Benjamin Thompson and who served
with the British, was knighted, eventually became Count of the Holy Roman Empire and
ran the government of Bavaria, first described a circulation system to explain these
temperature observations. He suggested that cold water from north and south polar
regions spreads on the bottom of the sea toward the equator, and this produces currents at
the surface in the opposite directions. A further development of this idea was made by
Emil von Lenz (1845), a German-Russian physicist, who noted that the thermocline was
shallower near the equator than in the subtropics and proposed an upwelling of deep
water into the surface layer near the equator to compensate for poleward flow of warm
near surface water. He derived a conceptual model of the meridional overturning
circulation in the Atlantic, which consisted of two circulation cells located symmetrically
on either side of the equator. A schematic summarizing this circulation (Fig. 2) was
published later by Spiess (1928) and more recently by Wüst (1968) and Mills (2005),
who discussed early investigations of the meridional overturning circulation. The arrows
in Figure 2 summarize the inferred direction of flow based on the temperature
measurements. A curiosity is the way the arrows in the upper kilometer spiral into
implied convergence zones centered near 700 m and 40°N and 40°S. Implicit in this
schematic is the formation of equal amounts of cold water in the north and south polar
regions and a lack of inter-hemispheric exchange.
This early schematic based on the ideas of Lenz and others (see Warren, 1981) (Fig. 2)
shows a very different perception of the Atlantic overturning circulation from what we
know today. Our present perception of the overturning circulation (or thermohaline
circulation as it is sometimes known) consists of a system of horizontal and vertical
currents associated primarily with the formation of cold North Atlantic Deep Water in the
North Atlantic, the southward flow of deep water away from the source regions and
across the equator, and the northward flow of warm upper layer water back across the
equator. Part of the deep water is further cooled in the Antarctic forming Antarctic

5
Bottom Water, which spreads northward into the Atlantic, Indian and Pacific Oceans.
The overturning circulation is a complicated system of currents driven by winds, by
buoyancy forcing through evaporation, precipitation, heating, and cooling, and by mixing
due to winds and tides. Knowledge of it developed slowly as subsurface temperature and
salinity began to be accurately measured and the values accumulated into usable data
sets. Perfecting instruments to make accurate measurements took a long time. Good
historical reviews have been written by Wüst (1968), Deacon (1971), Reid (1981),
Warren (1981, 2006), Mills (2005) and Peterson et al. (1996).
1.3 Schott 1902
The earliest schematics of the Atlantic meridional overturning circulation were
developed by German oceanographers. The first was shown by Gerhard Schott (1902)
based on the Valdivia Expedition (1898-1899) (Fig. 3). Two almost-symmetric
circulation cells in the upper 2000 m are centered near a depth around 500 m. Some
deeper arrows at depths of 2000-3000 m extend northward from 60ºS to 30ºN, colliding
with southward arrows located north of around 30ºN. The northward flow near 2500 m is
in an opposite direction to later findings of deep water crossing the equator from the
north. In this and many other schematic circulation diagrams arrows indicate the direction
of flow, thought to be ocean-wide, inferred from temperature, salinity, and density
measurements. It was only much later that subsurface velocities were directly measured
accurately enough to provide realistic mean velocities, and these were mainly limited to
regions of swift boundary currents.
1.4 Brennecke 1909, 1921
Two longitudinal hydrographic sections were accomplished by Wilhelm Brennecke
through the whole Atlantic aboard the Planet during 1906-1907 and the Deutschland
during 1911-1912. In a 1909 schematic through the eastern Atlantic Brennecke sketched
two symmetric circulation cells with upwelling near the equator and two nearly-
symmetrical gyres at the surface (Brennecke, 1909) (Fig. 4). It is interesting that these
6
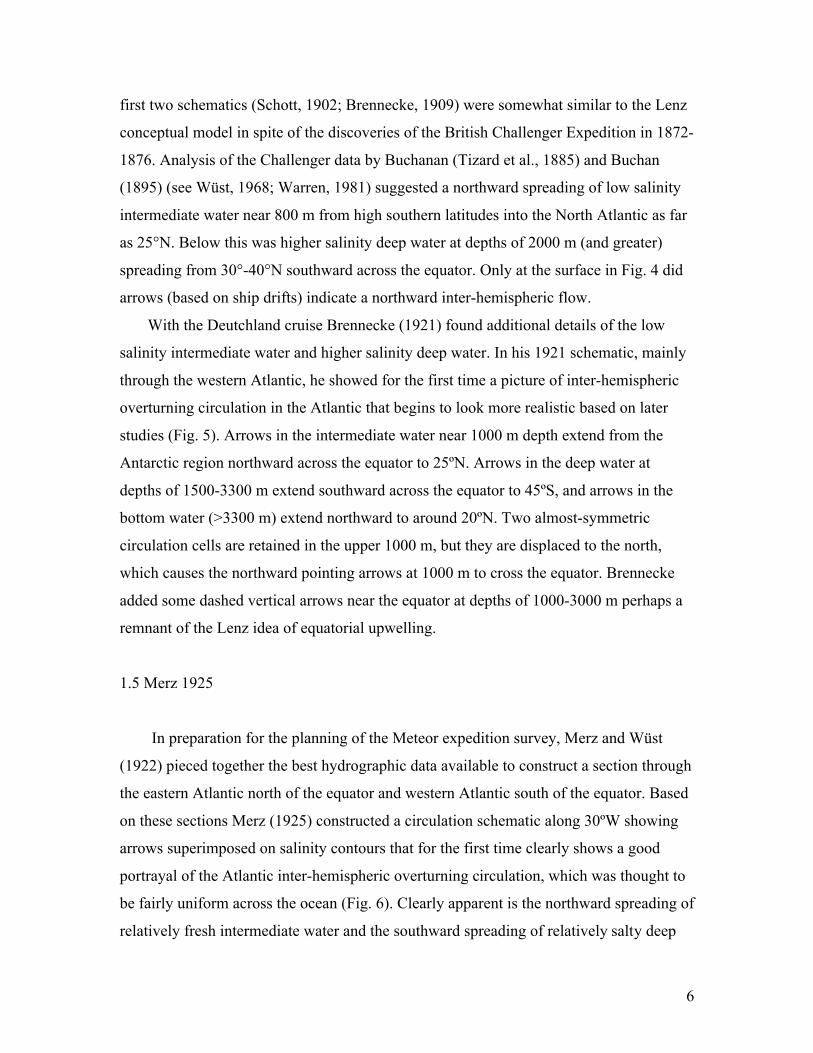
first two schematics (Schott, 1902; Brennecke, 1909) were somewhat similar to the Lenz
conceptual model in spite of the discoveries of the British Challenger Expedition in 1872-
1876. Analysis of the Challenger data by Buchanan (Tizard et al., 1885) and Buchan
(1895) (see Wüst, 1968; Warren, 1981) suggested a northward spreading of low salinity
intermediate water near 800 m from high southern latitudes into the North Atlantic as far
as 25°N. Below this was higher salinity deep water at depths of 2000 m (and greater)
spreading from 30°-40°N southward across the equator. Only at the surface in Fig. 4 did
arrows (based on ship drifts) indicate a northward inter-hemispheric flow.
With the Deutchland cruise Brennecke (1921) found additional details of the low
salinity intermediate water and higher salinity deep water. In his 1921 schematic, mainly
through the western Atlantic, he showed for the first time a picture of inter-hemispheric
overturning circulation in the Atlantic that begins to look more realistic based on later
studies (Fig. 5). Arrows in the intermediate water near 1000 m depth extend from the
Antarctic region northward across the equator to 25ºN. Arrows in the deep water at
depths of 1500-3300 m extend southward across the equator to 45ºS, and arrows in the
bottom water (>3300 m) extend northward to around 20ºN. Two almost-symmetric
circulation cells are retained in the upper 1000 m, but they are displaced to the north,
which causes the northward pointing arrows at 1000 m to cross the equator. Brennecke
added some dashed vertical arrows near the equator at depths of 1000-3000 m perhaps a
remnant of the Lenz idea of equatorial upwelling.
1.5 Merz 1925
In preparation for the planning of the Meteor expedition survey, Merz and Wüst
(1922) pieced together the best hydrographic data available to construct a section through
the eastern Atlantic north of the equator and western Atlantic south of the equator. Based
on these sections Merz (1925) constructed a circulation schematic along 30ºW showing
arrows superimposed on salinity contours that for the first time clearly shows a good
portrayal of the Atlantic inter-hemispheric overturning circulation, which was thought to
be fairly uniform across the ocean (Fig. 6). Clearly apparent is the northward spreading of
relatively fresh intermediate water and the southward spreading of relatively salty deep

7
water. Starting at the surface in the North one can follow arrows southward at depths of
1000-4000 m across the equator and then up into the upper layer in the south where they
are linked to arrows going north in the upper 1000 m. Also apparent for the first time is a
deeper overturning cell centered in the Antarctic region with some deep water from the
North Atlantic descending near Antarctica into bottom water and spreading northward to
the equator. The Merz (1925) schematic shows an inter-hemispheric conveyor-belt-like
Atlantic circulation scheme in a vertical section. This schematic is very similar to those
based on the later Meteor data, although the Meteor expedition provided a much-
improved sampling throughout the South Atlantic and a much clearer picture of the
basin-wide circulation.
Both the Brennecke (1921) and the Merz (1925) schematics are based on the idea
that subsurface water is formed at the sea surface and flows along tongue-like layers in
the ocean that retain distinctive temperature, salinity, and density characteristics over
long distances. The spreading of water along these tongues is illustrated by the arrows
inferred from the temperature, salinity, and density distributions. This idea was further
developed and exploited in the analysis of the Meteor Expedition data.
1.6 Meteor Expedition, Wüst 1949, 1957
The German Atlantic expedition of the Research Vessel Meteor during 1925-1927
has become famous for the high quality of the data and the superior resulting scientific
reports. Alfred Merz was the scientific leader, but he died a few months after the
expedition began. Captain Fritz Spiess of the Meteor took over scientific leadership of the
expedition, and Merz’s student, Georg Wüst, became leader of the oceanography studies.
Reports and schematics based on the Meteor expedition and other stations clearly
revealed features of what has become known as the Atlantic meridional overturning
circulation—North Atlantic Deep Water (NADW) flowing southward in three
identifiable layers, Subantarctic Intermediate Water plus surface water (and Antarctic
Bottom Water) flowing northward (Wüst, 1935; Albert Defant, 1941). Clearly apparent
on a vertical section through the western Atlantic based on data obtained aboard the
Meteor, aboard the Woods Hole Oceanographic Institution (WHOI) Research Vessel

8
Atlantis and a few other ships (Armauer Hansen, Carnegie, Dana, Discovery, Michael
Sars) are tongues or cores of intermediate, deep, and bottom water with their inferred
flow directions shown by arrows and the distribution of water properties like salinity and
oxygen (Fig. 7, after Wüst, 1949). Maps of water properties and geostrophic velocity
traced these tongues meridionally through the Atlantic to their general source regions and
documented for the first time that their spreading is concentrated in western boundary
currents (Figs. 8-9, after Wüst, 1957). In addition the salinity maximum layer, which
originates at the surface in the South Atlantic near 15ºS due to excess evaporation there,
was traced at a depth of near 100 m northwestward across the equator and into the
Caribbean (Defant, 1936). This indicated that virtually the whole upper layer, everything
above NADW including the intermediate water, salinity maximum layer, and surface
water (shown by ship drift velocities) crossed the equator as part of the overturning
circulation. The results of the Meteor expedition along with additional cruise data were
included in many publications and textbooks (for example by A. Defant, G. Dietrich, G.
Neumann, G. Neumann and W. J. Pierson, W. S. von Arx) in the 1960’s and since, which
helped to promote an understanding of the Atlantic circulation. Later translations of
Spiess (1928), Wüst (1935) and Defant (1936) in the period 1978-1985 made it easier for
English readers to learn more about the remarkable results of the Meteor expedition.
The flow field of the eastern regions of the Atlantic was difficult to infer from the
weak property gradients and slow speeds, but the general implication was a gradual
southward spreading of NADW through the Atlantic in a direction away from its northern
source region (Fig. 8). Some eastward protrusions from the core layers in the western
Atlantic suggested the possibility of eastward flow near the equator and at other places in
the South Atlantic, but turbulent lateral mixing could have also have accomplished this
distribution of properties.
1.7 Stommel 1957, 1958
In 1957 Henry Stommel of WHOI revolutionized the concept of the Atlantic
overturning circulation when he developed new ideas about deep circulation of the
Atlantic and published three very influential schematics of the Atlantic circulation

9
(Stommel, 1957, 1958a). One of these (Fig.10a) shows a three-dimensional schematic
“internal mode” circulation of the Atlantic illustrating that the sinking of surface water in
the north is connected to upwelling of deep water in the south by narrow western
boundary currents in each level. Both sinking and upwelling occur in relatively small
regions. The internal mode circulation (Fig. 10a) is the first three-dimensional schematic
to clearly show a continuous conveyor-belt-like meridional overturning circulation
through the Atlantic. In Fig. 10b Stommel indicated a schematic wind-driven circulation
in the upper layer and in Fig. 10c a superposition of the two showing a return flow in the
upper layer consisting of a merger of both wind-driven and internal mode circulations.
In a second figure (Fig. 11) Stommel showed the schematic circulation in the upper
and lower layers of a more realistic Atlantic. Figure 11, which also appeared in
Stommel’s (1958b) book “The Gulf Stream,” illustrates how the upper layer of the
meridional overturning circulation (internal mode) merges with the wind-driven gyre
flow, augmenting the wind-driven Benguela Current and Gulf Stream and opposing the
Brazil Current. A narrow deep western boundary current flows southward underneath and
counter to the Gulf Stream and North Brazil Current. This figure continues the idea of
upwelling occurring in a limited region in the Antarctic Circumpolar Current. Figure 11
was a very influential conceptual schematic that illustrated how the Atlantic overturning
circulation coexists with the wind-driven flow based on a straightforward linear
superposition.
The third schematic (Fig.12) illustrates Stommel’s (1958a) idea that since deep cold
water upwells into warmer thermocline water above in order to balance the downward
turbulent diffusion of heat then the deep water in the ocean interior must move poleward
to conserve potential vorticity. Instead of moving southward through the interior of the
North Atlantic, as had generally been assumed, NADW must move, paradoxically,
northward toward its source. Swift narrow western boundary currents would be needed as
conduits to balance the poleward interior flows and to carry source water southward.
Expanding on this idea Stommel drew a schematic showing for the first time the
interconnected deep flow of the oceans including the Indian and Pacific (Fig. 12). Unlike
his two earlier schematics upwelling was assumed to occur uniformly throughout the
oceans. The northern Pacific Ocean and northern Indian Ocean have no deep-water

10
formation sites like the Atlantic, so that deep water from the North Atlantic and the
Weddell Sea formation sites (each specified to be 20 Sv) enters these oceans from the
south in deep western boundary currents. Some deep flow continues eastward in the
Antarctic Circumpolar Current and passes back into the Atlantic through the Drake
Passage south of South America. This figure was not meant to represent the real ocean
flow field because the real ocean has complicated sea floor topography including major
ridge systems, which constrain the deep flow. Instead it was meant to give a general idea
of what the deep flow might look like in the absence of these sea floor features and with
uniform upwelling.
Stommel’s idea of narrow western boundary currents and poleward interior flows
was confirmed with some illustrative laboratory experiments (Stommel et al., 1958) and a
deep western boundary current was confirmed in the North Atlantic by subsurface float
measurements off South Carolina (Swallow and Worthington, 1961). The float
measurements extended the earlier Meteor results, which had showed a western boundary
current in the South Atlantic. The sluggish interior poleward flows resulting from the
uniform upwelling were too small to measure despite attempts to do so. The ocean was
found to be populated by intense mesoscale eddies and zonal currents, which make the
mean meridional flow almost impossible to measure accurately.
In order to evaluate Stommel’s (1958a) ideas and to help understand how lateral
mixing might help determine the distribution of water characteristics like salinity and
oxygen, Kuo and Veronis (1973) modeled an idealized ocean that consisted of
rectangular ocean basins connected in the south, deep western boundary currents, and
poleward interior flows. The model provided a fairly realistic distribution of oxygen
content when suitable mixing was included. A good summary map was included of the
global distribution of observed oxygen at a depth of 4 km. The results of the study tended
to validate Stommel’s ideas of deep circulation and provided help in interpreting maps of
water properties of the real ocean.
Stommel did not create a schematic of the upper layer return flow of the global
ocean that would have resulted from the upwelling out of the deep layer, a global
extension of Figure 11a. Although it was obvious that the water upwelled into the upper
layer of the Pacific and Indian Ocean must return to the Atlantic around either southern

11
Africa or South America or around both, the relative amounts of transport of the two
routes was poorly known.
2. Global ocean circulation
2.1 Broecker and Peng 1982
The first two-layer schematic of a global overturning circulation was published by
Wallace Broecker of the Lamont-Doherty Geological Observatory of Columbia
University and Tsung-Hung Peng of the Oak Ridge National Laboratory in 1982 (Fig.
13), and these authors first suggested an analogy to a “large conveyor belt” when
referring to their fun house conceptual circulation model. The lower panel of Figure 13
shows a vertical section with a conveyor-belt-like circulation with streamlines passing
through the Atlantic, Indian and Pacific Oceans. Broecker and Peng’s (1982) deep
circulation scheme (top panel) looks rather similar to the Kuo and Veronis (1973)
configuration of rectangular ocean basins and circulation except that not all of Broecker
and Peng’s deep interior flows are poleward. There are distributed upwelling sites,
multiple offshoots in all three oceans, and a “recooling” located near the southernmost
Atlantic near Antarctica. The deep-water path lies along the western boundaries of the
Atlantic, Indian and Pacific, a pattern similar to one shown by Stommel (Fig. 11). All of
the schematic upper layer return flow to the Atlantic is around southern Africa.
2.2 Gordon 1986
A more realistic schematic of the global overturning circulation was published by
Arnold Gordon (1986) of the Lamont-Doherty Geological Observatory entitled “Global
structure of the thermohaline circulation cell associated with NADW production” (Fig.
14). Figure 14 shows the Gulf Stream and Agulhas Current (the part that does not
retroflect) as well as locations of deep-water formation in the North Atlantic and
upwellings throughout the ocean basins. For the first time routes and transports of the
return flow from the Pacific and Indian Oceans were clearly specified. The volume

12
transports of major parts of the circulation are listed as 20 Sv (1 Sverdrup (Sv) = 106
m3/sec) for the NADW in the North Atlantic, 8.5 Sv passing through the Indonesian Seas
to the Indian Ocean, and 13.5 Sv returning to the Atlantic as Agulhas leakage. Gordon
assumed that the cold-water route from the Drake Passage directly into the Atlantic
overturning circulation was insignificant, although he mentioned that it could perhaps
amount to around 3 Sv. Therefore, virtually all the upper layer flow in compensation for
the formation of NADW passes from the Indian Ocean around southern Africa into the
Atlantic. In defense of this he quotes his measurement of 14 Sv entering the South
Atlantic around an Agulhas Current ring (Gordon, 1985). Gordon’s (1986) schematic
circulation diagram (Fig. 14) looks conveyor-belt-like in the sense of a global band of
arrows indicating deep water flow feeding from the Atlantic into the Indian and Pacific
and a band of upper layer arrows returning to the Atlantic, but he did not use the
conveyor belt analogy.
2.3 Broecker 1987
A schematic diagram entitled “Great Ocean Conveyor Belt” was published as an
illustration in an article written by Broecker (1987) that appeared in Natural History (Fig.
15). It was designed by a magazine illustrator, Joe Le Monnier, to be a simple cartoon to
illustrate the global ocean’s meridional overturning circulation and the northward heat
flux in the Atlantic caused in part by the wintertime formation of NADW. The conveyor
is similar to Gordon’s (1986) circulation scheme but has been simplified and made
continuous through the oceans. Broecker’s 1987 ocean conveyor is wide, colored, and
quite visually striking.
Figure 15 shows a cold and salty deep current (blue) flowing southward through the
mid-Atlantic, eastward in the Circumpolar Current region, and dividing into two deep
currents that enter the Indian and Pacific Oceans. The deep currents upwell into warm
shallow currents (red) that merge together in the Indian Ocean, flow around southern
Africa and northward through the Atlantic. In the northern North Atlantic sea-to-air heat
transfer causes the shallow current to become denser and to descend into the cold and
salty deep current. The schematic’s great strength (some would say great weakness) is its

13
simple and attractive representation of very complicated currents, complicated physical
processes, and complicated atmosphere-ocean interactions. Someone who knows little
oceanography can easily grasp the concept of a three-dimensional, interconnected, global
ocean circulation and the northward heat flux caused by the difference between warm
water going north and cold water going south in the Atlantic. Heat is gained as the upper
layer flows northward through the Atlantic tropics and heat is released in the northern
North Atlantic as water is cooled by the atmosphere in winter to form deep water.
This simple diagram omits many very important aspects of the circulation. Some of
its limitations are: It shows the sinking and upwelling in small areas; the oceanic
upwelling is thought to be widespread. It omits recycling of NADW around Antarctica to
become Antarctic Bottom Water. It suggests southward heat flux in the North Pacific. It
wildly oversimplifies horizontal flow fields, omitting ocean gyres, western boundary
currents, the Circumpolar Current and flow through the Drake Passage. It implies steady
currents, but the ocean has strong fluctuations at seasonal and other frequencies including
intense ocean eddies. Many physical oceanographers refuse to use this schematic or the
conveyor-belt concept because they believe it is a misleading oversimplification.
However, the unifying conceptual picture shown in the schematic has had wide popular
appeal and can be considered a metaphor for the real overturning circulation.
The schematic of the “Great Ocean Conveyor Belt” was adopted as a logo for the
Global Research Initiative and has become widely reproduced. It was included in the
Academy Award-winning documentary and the book about climate change by Al Gore
entitled “An Inconvenient Truth” (Gore, 2006). A modified, more complicated, version
of the schematic appears on the website of the Intergovernmental Panel On Climate
Change (IPCC see www.ipcc.ch), which projects a very likely reduction in conveyor flow
by the end of the century, perhaps on the order of 25% (Kerr, 2007). An on-line search of
“ocean conveyor” using Google Images reveals that 68 of the first 100 conveyor
schematics to be similar to Broecker’s 1987 version, followed by 22 similar to the IPCC
version, plus 4 others by E. Maier-Reimer, 4 by W. Schmitz and two others.
Broecker (1991) described the scientific background of his 1987 schematic in a
follow up article, which mentions his idea that changes in the Atlantic ocean conveyor
were responsible for the abrupt and large climatic changes experienced by the northern

14
Atlantic basin during the last glacial period. Broecker (1991) also clarified that in reality
and in contrast to Fig. 15 upwelling is widely spread with a large amount taking place in
the Antarctic. To further clarify his views, he included another figure (not shown) with 10
Sv of return flow entering the Atlantic through the Drake Passage and only 5 Sv entering
from the Indian Ocean around the tip of Africa (with 5 Sv through the Indonesian Seas).
This newer figure thus disagrees with Gordon’s 1986 and Broecker’s 1987 schematics.
The two very different views of the relative amounts of Indian Ocean water and Drake
Passage water in the overturning circulation have been a long-standing controversy,
which continues even today. Good reviews of the subject are given by Schmitz (1995,
1996a,b), de Ruijter et al. (1999), Gordon (2001), and Lutjeharms (2006). The amount of
Indian Ocean water leaking into the Atlantic and contributing to the overturning
circulation, its distribution in depth, and its variability remain controversial, although
some recent studies support a large leakage transport (Gordon, 2001; Sloyan and Rintoul,
2001; Mercier et al., 2003; Richardson, 2007). Measuring the transport is difficult
because of the complexity of the highly energetic Agulhas retroflection region including
Agulhas rings and cyclones, which translate into the Atlantic, contributing a major part of
the Indian Ocean leakage. Two recent modeling studies that used a particle tracking
technique to show pathways of the return flow concluded that virtually all the upper layer
overturning circulation in the Atlantic enters as Indian Ocean leakage transport (Speich et
al., 2001; Donners and Drijfhout, 2004).
In order to get the details of an overturning circulation schematic right requires
knowing accurately how and where deep water is transformed into upper layer water and
how the oceans are inter-connected, including how the upper layer flow returns to the
Atlantic from the Indian and Pacific. These issues relevant to the overturning circulation
are not well known and are being addressed by research programs. Recent knowledge has
been summarized in a collection of papers describing results of the World Ocean
Circulation Experiment (WOCE) published in “Ocean Circulation and Climate” (Siedler
et al., 2001). A more recent summary of the global overturning circulation, based on
inverse techniques, shows two main overturning cells—an upper cell (~17 Sv)
concentrated in the Atlantic with sinking in the North Atlantic, upwelling in the Southern
Ocean, and a lower cell (~21 Sv) with sinking around Antarctica and abyssal upwelling

15
concentrated in the Indian and Pacific Oceans (Lumpkin and Speer, 2007). Another
perspective is given by distributions of phosphate and oxygen in the deep water; these
show that roughly half of the deep water in the Pacific and Indian Oceans originates in
the northern Atlantic Ocean and half originates in the south near Antarctica (Broecker,
personal communication, 2007). A few other smaller circulation cells are also apparent in
the study of Lumpkin and Speer. In their results the majority of NADW enters the lower
cell and is transferred into denser water classes, which subsequently flow northward into
the deep Atlantic, Indian and Pacific Oceans. The linkages between the cells are
illustrated with a colored schematic showing vertical sections through the different
oceans and transports including error estimates of key circulation features of each ocean.
The Atlantic part of the lower cell was shown in Fig. 6 (Merz, 1925) and Fig. 7 (Wüst,
1949). This new study and others like it reveals some of the complications of the global
overturning circulation and points out some of the limitations of our understanding of it
and limitations of the available data.
2.4 Gordon 1991
Trying to accurately show details of the global ocean circulation with schematics can
lead them to become very complicated especially those in a plan view. A very useful
circulation diagram was developed by Gordon (1991) showing a three-dimensional view
of the global overturning circulation (Fig. 16). Vertical sections through the Atlantic,
Indian and Pacific Oceans connect with the Southern Ocean. Vertical water motions,
which are difficult to show on plan views, are clearly illustrated in the vertical sections.
This figure is the first such three-dimensional global overturning schematic and illustrates
a complicated system of flows in the ocean including the global structure of the upper
and lower overturning cells and connections. William Schmitz (1996a,b) of the Woods
Hole Oceanographic Institution colored and revised this figure as part of his
comprehensive review of the global ocean circulation and included a later version of the
figure on the cover of his report (Schmitz, 1996b). This later version was also included in
an article by Clarke et al. (2001) in the WOCE book (Siedler et al. 2001). A more recent
schematic like this is shown by Lumpkin and Speer (2007).

16
2.5 Schmitz 1996
Further developments of global overturning schematics were made by Schmitz
(1995, 1996a,b) who summarized various ocean observations and circulation schemes
and created several of his own schematics, including some with two, three and four layers
in the vertical to represent the different layers in the ocean. The simple two-layer
overturning circulation schematic is easy to see and understand, the three- and four-layer
schematics present more information about pathways, transports, vertical movements,
and water conversions but can be significantly more complicated, difficult enough that
only a dedicated reader will try to understand the patterns. A three-layer schematic of the
upper layer (Fig.17) (Schmitz, 1996b) shows the complex global overturning circulation
including bottom, deep, and upper layer water, and illustrates important aspects ignored
in two-layer conveyor schematics such as more complicated circulations and water
transformations in the various basins. Schmitz increased the value of many of his
schematics, including Fig. 17, by specifying the transport of various circulation features.
In his 1995 schematics, Schmitz indicated a low Agulhas leakage transport of 4 Sv. In his
1996b revision, he increased the leakage to 7 Sv in order to reflect an equipartition
between Drake Passage and Indian Ocean sources. Improved measurements today are
leading to changes in the details of these schematics including an increase of Agulhas
leakage transport. However, new measurements will not change the 1987 conveyor belt
schematic because the general idea it portrays has not changed significantly.
Schmitz (1996a) included numerous circulation schemes of the North Atlantic,
several of which illustrate paths of the warm-to-cold transformations in the northern
North Atlantic. Most of these schematics are plan views, but one attributed to Mike
McCartney and Ruth Curry is a colored vertical section showing the complicated
connections between different layers in the vertical, an update of the northern part of
Gordon’s (1991) Atlantic section. A novel feature is a prominent schematic eggbeater to
represent deep ocean mixing.
Two other global schematics were helpful in developing ideas of the upper layer
return flow. Gordon et al. (1992) divided the return flow into two layers and indicated the

17
transport of each layer, including 15 Sv of Agulhas leakage, 9 of which continues
northward in the overturning circulation. Sloyan and Rintoul (2001) in a somewhat
similar diagram showed that of 14 Sv in the overturning circulation in the Atlantic 10 Sv
is derived from Agulhas water. These schematics illustrate the concept that most of the
Drake Passage water that eventually flows northward in the Atlantic overturning
circulation first continues eastward through the Atlantic, loops into the Indian and
Pacific, and then returns westward around the tip of Africa after having been significantly
modified by air-sea interactions and mixing.
2.6 IPCC 2001
The Intergovernmental Panel of Climate Change report included a map entitled
“Great ocean conveyor belt” that shows some new features added to a Broecker-like
conveyor (Fig. 18). Two sites of “heat release to atmosphere” are located in the northern
North Atlantic and a third in the Weddell Sea. Water from the Weddell Sea site joins the
deep water from the Atlantic. A continuous global upper layer Circumpolar Current has a
branch flowing northward in the Atlantic and is joined by a branch from the Indian
Ocean. One curiosity (mistake?) is that the cold saline deep current (blue) appears to
twice magically flow over the top of the warm surface current (orange) in the Pacific
(http://www.ipcc.ch, figure 4-2 of the 2001 Synthesis Report under “Graphics”). This
figure including a revised version (warm over cold) under “Publications” is widely used
as an illustration of the meridional overturning circulation. A limitation is that transports
of the various current branches are not specified.
A recent schematic (not shown) by Rick Lumpkin (personal communication, 2006)
of the NOAA Atlantic Oceanographic and Meteorological Laboratory illustrates some
new features of the global ocean circulation, including the flow of Pacific water westward
around Tasmania into the Indian Ocean (an addition to the flow through the Indonesian
Seas). A novel aspect is the inclusion of schematic anticyclonic eddies, illustrating that at
some places the Atlantic overturning circulation is primarily in the form of very large,
translating, coherent eddies. The eddies are shed by the Agulhas retroflection south of
Africa, by the deep western boundary current south of the equator off Brazil and by the

18
North Brazil Current retroflection off northeastern South America. The Atlantic part of
this schematic was included in “Charting the course for Ocean Science in the United
States for the next decade,” a 2007 report of the NSTC Joint Subcommittee on Ocean
Science and Technology (http://ocean.ceq.gov/about/docs/orpp21607.pdf), and also by
Stokstad (2007). An earlier schematic of the upper layer return flow that also included
Agulhas Current rings was published by Gordon (2003). Refinements such as these are
attempting a closer match to verisimilitude.
3. Summary and conclusions
The Great Ocean Conveyor Belt schematic published by Broecker (1987) is a
metaphor for the global ocean overturning circulation. This schematic expresses some
ideas that are generally believed to be true: 1) the upper layer water in the North Atlantic
is cooled forming cold NADW, 2) NADW flows into the Southern Ocean, Indian Ocean,
and Pacific Ocean as part of a three-dimensional global overturning circulation system, 3)
the deep cold water is transformed into warmer upper layer water which returns from the
Pacific and Indian Oceans to the Atlantic around southern Africa (controversial), and 4)
the northward flow of warm upper layer water and southward flow of cold deep water in
the Atlantic causes a northward heat flux through the Atlantic. The conveyor belt
schematic does not reproduce the actual global circulation because it is much too
complicated for a simple diagram, but the schematic has served well in providing a
simple image that people can easily understand, despite its many inaccuracies and
oversimplifications. Refinements of the schematic have been made to reflect some of the
complexities of the overturning circulation, including a widespread version included in
the 2001 IPCC report. The innovative schematics of W. Broecker, A. Gordon, and W.
Schmitz have been very influential in helping people visualize aspects of the global
overturning circulation. It is difficult to be quantitative about ocean circulation, but some
of the most useful schematics have included transport estimates of circulation features.

19
Acknowledgements
Colleen Hurter found numerous older journals and books, used in the study. Dave Gray
scanned most of the figures used as illustrations. Wally Broecker and Arnold Gordon
provided Figures 15 and 16. Jim Price and Bruce Warren gave some detailed constructive
comments and suggestions on earlier versions of this paper.
References
Brennecke, W., 1909. Ozeanographie. Forschungsreise S.M.S. “Planet” 1906/07, 3, 153
pp.
Brennecke, W., 1921. Die ozeanographischen Arbeiten der Deutschen Antarktischen
Expedition 1911-1912. Aus dem Archiv der Deutschen Seewarte 39:1, 216 pp.
Broecker, W.S., 1987. The biggest chill. Natural History Magazine 97, 74-82.
Broecker, W.S., 1991. The Great Ocean Conveyor. Oceanography 4(2), 79-89.
Broecker, W.S. Peng, T.-H., 1982. Tracers in the Sea. Eldigio Press, Palisades, New
York, 690 pp.
Buchan, A., 1895. Report on oceanic circulation, based on the observations made on
board H.M.S. Challenger, and other observations. In Report on the Scientific Results of
the Voyage of the H.M.S. Challenger during the years 1873-76. A summary of the
Scientific Results, Second Part, Appendix (Physics and Chemistry, Part VIII), 38 pp.
Clarke, A., Church, J. Gould, J., 2001. Ocean Processes and Climate Phenomena. In:
Siedler, G., Church, J., Gould, J. (Eds), Ocean Circulation and Climate: Observing and
Medelling the Global Ocean. Academic Press, New York, pp. 11-30.

20
Deacon, M., 1971. Scientists and the Sea 1650-1900: A Study of Marine Science.
Academic Press, London and New York, 445 pp.
Defant, A., 1936. Schichtung und Zirkulation des Atlantischen Ozeans. Die Troposphäre.
In Wissenschaftliche Ergebnisse der Deutschen Atlantischen Expedition auf dem
Forschungs—und Vermessungsschiff “Meteor” 1925-1927, 6: 1st Part, 3, Berlin, pp. 289-
411 pp. (The Troposphere: Scientific Results of the German Atlantic Expedition of the
Research Vessel “Meteor” 1925-1927, Emery, W.J. (Ed.), 1981 Amerind, New Delhi,
113 pp.)
Defant, A., 1941. Die absolute Topographie des physikalischen Meeresniveaus und der
Drückflachen sowie die Wasserbewegungen im Raum des Atlantischen Ozeans. In
Wissenschaftliche Ergebnisse der Deutschen Atlantischen Expedition auf dem
Forschungs—und Vermessungsschiff “Meteor” 1925-27, 6:2nd Part, 1, Berlin, pp. 191-
260.
de Ruijter, W.P.M., Biastoch, A., Drijfhout, S.S., Lutjeharms, J.R.E., Matano, R.P.,
Pichevin, T., van Leeuwen, P.J., Weijer, W., 1999. Indian-Atlantic interocean exchange:
Dynamics, estimation and impact. Journal of Geophysical Research 104 (C9), 20,885-
20,910.
Donners, J., Drijfhout, S., 2004. The Lagrangian view of South Atlantic interocean
exchange in a global ocean model compared with inverse model results. Journal of
Physical Oceanography 34, 1019-1035.
Ellis, H., 1751. A letter to the Rev. Dr. Hales, F.R.S. from Captain Henry Ellis, F.R.S.
dated Jan. 7, 1750-51, at Cape Monte Africa, Ship Earl of Halifax. Philosophical
Transactions of the Royal Society of London 47, 211-214.
21
Gordon, A.L., 1985. Indian-Atlantic transfer of thermocline water at the Agulhas
retroflection. Science 227, 1030-1033.
Gordon, A.L., 1986. Interocean exchange of thermocline water. Journal of Geophysical
Research 91(C4), 5037-5046.
Gordon, A., 1991. The role of thermohaline circulation in global climate change, in
Lamont-Doherty Geological Observatory 1990 & 1991 Report, Lamont-Doherty
Geological Observatory of Columbia University, Palisades, New York, pp. 44-51.
Gordon, A.L., 2001. Interocean exchange. In: Siedler, G., Church, J., Gould, J. (Eds.),
Ocean Circulation and Climate. Academic Press, London, pp. 303-314.
Gordon, A.L., 2003. The brawniest retroflection. Nature 421, 904-905.
Gordon, A.L., Weiss, R.F., Smethie, Jr., W.M., Warner, M.J., 1992. Thermocline and
intermediate water communication between the South Atlantic and Indian Oceans.
Journal of Geophysical Research 97 (C5), 7223-7240.
Gore, A., 2006. An Inconvenient Truth: the Planetary Emergency of Global Warming and
What we can do About it. Rodale Press, Emmaus PA, 325 pp.
Kerr, R.A., 2007. Scientists Tell Policymakers We’re All Warming the World. Science
15, 754-757.
Kuo, H.-H., Veronis, G., 1973. The use of oxygen as a test for an abyssal circulation
model. Deep-Sea Research 20, 871-888.
Lenz, E., 1845. Bermerkungen über die Temperatur des Weltmeeres in verschiedenen
Tiefen. Bulletin de la Classe Physico-Mathématique de l’Académie Impériale des
Sciences de Saint-Pétersbourg 5, 67-74.

22
Lumpkin, R., Speer, K., 2007. Global ocean meridional overturning. Journal of Physical
Oceanography, in press.
Lutjeharms, J.R.E., 2006. The Agulhas Current. Springer, New York, 329 pp.
Mercier, H., Arhan, M., Lutjeharms, J.R.E., 2003. Upper-layer circulation in the eastern
Equatorial and South Atlantic Ocean in January-March 1995. Deep-Sea Research Part I
50, 863-887.
Merz, A., 1925. Die Deutsche Atlantische Expedition auf dem Vermessungs- und
Forschungsschiff “Meteor”. 1. Bericht. Sitzungsberichte der Preussischen Akademie der
Wissenschaften, Physikalische-Mathematische Klasse, Jahrgang 1925, 562-586.
Merz, A., Wüst, G., 1922. Die Atlantische Vertikalzirkulation. Zeitschrift der
Gesellschaft für Erdkunde zu Berlin, Jahrgang 1922, 1-35.
Mills, E.L., 2005. From Discovery to discovery: the hydrography of the Southern Ocean,
1885-1937. Archives of natural history 32 (2), 246-264.
Peterson, R.G., Stramma, L., Kortum, G., 1996. Early Concepts and Charts of Ocean
Circulation. Progress in Oceanography 37, 1-115.
Reid, J.L., 1981. On the Mid-Depth Circulation of the World Ocean. In: Warren, B.A.,
Wunsch, C. (Eds), Evolution of Physical Oceanography. MIT Press, Cambridge MA, pp.
70-110.
Rennell, J., 1832. An Investigation of the Currents of the Atlantic Ocean, and of Those
Which Prevail between the Indian Ocean and the Atlantic, J.G.&F. Rivington, London,
359 pp.

23
Richardson, P.L., 2007. Agulhas leakage into the Atlantic estimated with subsurface
floats and surface drifters. Deep-Sea Research Part I, in press.
Rumford, B., Count of, 1798. Of the propagation of heat in fluids. In Essays, Political,
Economical and Philosophical. T. Caldwell and W. Davies, London, pp. 199-313.
(Reprinted In: Collected Works of Count Rumford. Volume 1. The Nature of Heat, 1968.
Brown, S.C. (Ed), Belknap Press of Harvard University Press, Cambridge MA, 1968, 507
pp, 117-284.)
Schmitz, Jr., W.J., 1995. On the interbasin-scale thermohaline circulation. Reviews of
Geophysics 33(2), 151-173.
Schmitz, Jr., W.J., 1996a. On the World Ocean Circulation: Volume I, Some Global
Features/North Atlantic Circulation. Woods Hole Oceanographic Institution Technical
Report WHOI-96-03, 141 pp.
Schmitz, Jr., W.J., 1996b. On the World Ocean Circulation: Volume II, The Pacific and
Indian Oceans/A Global Update. Woods Hole Oceanographic Institution Technical
Report WHOI-96-08, 237 pp.
Schott. G., 1902. Oceanographie und maritime Meteorolgie. In Wissenschaftliche
Ergebnisse der Deutschen Tiefsee-Expedition auf dem Dampfer “Valdivia” 1898-1899,
1, 403 pp.
Siedler, G., Church, J., Gould, J. (Eds), 2001. Ocean Circulation and Climate: Observing
and Modelling the Global Ocean. Academic Press, New York, 715 pp.
Sloyan, B.M., Rintoul, S.R., 2001. Circulation, renewal, and modification of Antarctic
Mode and Intermediate Water. Journal of Physical Oceanography 31, 1005-1030.

24
Speich, S., Blanke, B., Madec, G., 2001. Warm and cold water routes of an O.G.C.M.
thermohaline conveyor belt. Geophysical Research Letters 28 (2), 311-314.
Spiess, F., 1928. Die Meteor-Fahrt. Forschungen und Ergebnisse der Deutschen
Atlantischen Expedition. 1925-1927. Dietrich Reimer. Berlin, 375 pp. (The Meteor
Expedition, Scientific Results of the German Atlantic Expedition, 1925-1927. Emery,
W.J., (Ed), 1985. Amerind Publishing, New Delhi, 429 pp.)
Stokstad, E., 2007. Ocean research gets a modest boost. Science 315, 585-586.
Stommel, H.M., 1957. A survey of ocean current theory. Deep-Sea Research 4, 149-184.
Stommel, H.M., 1958a. The abyssal circulation. Deep-Sea Research 5, 80-82.
Stommel, H.M., 1958b. The Gulf Stream: A Physical and Dynamical Description.
University of California Press, Berkeley, 202 pp.
Stommel, H.M., Arons, A.B., Faller, A.J., 1958. Some examples of stationary planetary
flow patterns in bounded basins. Tellus 10, 179-187.
Swallow, J.C., Worthington, L.V., 1961. An observation of a deep countercurrent in the
western North Atlantic. Deep-Sea Research 8, 1-19.
Tizard, T.H., Mosely, H.N., Buchanan, J.Y., Murray, J., 1885. Report on the Scientific
Results of the Voyage of the H.M.S. Challenger during the years 1873-76. Narrative of
the Cruise of H.M.S. Challenger with a General Account of the Scientific Results of the
Expedition, 1, Second Part, pp. 511-1110.
Warren, B.A., 1981. Deep Circulation of the World Ocean. In: Warren, B.A., Wunsch,
C., (Eds), Evolution of Physical Oceanography. MIT Press, Cambridge MA, pp. 6-41.

25
Warren, B.A., 2006. Historical Introduction, Oceanography of the General Circulation to
the Middle of the Twentieth Century. In: Jochum, M., Murtugudde, R. (Eds.), Physical
Oceanography Developments Since 1950. Springer, New York, pp.1-14.
Wüst, G., 1935. Schichtung und Zirkulation des Atlantischen Ozeans. Die Stratophäre. In
Wissenschaftliche Ergebnisse der Deutschen Atlantischen Expedition auf dem
Forschungs—und Vermessungsschiff “Meteor” 1925-1927, 6: 1st Part, 2, Berlin, 180 pp.
(The Stratosphere of the Atlantic Ocean, Emery, W.J., (Ed), 1978 Amerind, New Delhi,
112 pp.)
Wüst, G., 1949. Die Kreisläufe der atlantischen Wassermassen, ein neuer Versuch
räumlicher Darstellung. Forschungen und Fortschritte 25, 285-289.
Wüst, G., 1957. Stromgeschwindigkeiten und Strommengen in den Tiefen des
Atlantischen Ozeans unter besonderer Berücksichtigung des Tiefen- und Bodenwassers.
Wissenschaftliche Ergebnisse der Deutschen Atlantischen Expedition auf dem
Forschungs— und Vermessungsschiff “Meteor” 1925-1927, 6: 2nd Part, 6, Berlin, 180
pp.
Wüst, G., 1968. History of investigations of the longitudinal deep-sea circulation (1800-
1922). Bulletin de l’Institut Océanographique, Monaco, Numéro Special 2, 109-120 pp.
Figure captions
Figure 1. Rennell’s (1832) chart of the surface currents of the Atlantic Ocean based on
early ship drift measurements as shown by Deacon (1971).
Figure 2. Meridional overturning circulation scheme of the Atlantic corresponding to the
written conceptions of Lenz (1845) as shown by Spiess (1928). Two opposite
symmetrical branches of the deep currents converge and rise towards the surface at the
equator to balance poleward flow of near surface water.

26
Figure 3. Meridional overturning circulation scheme shown by Schott (1902).
Figure 4. Block diagram illustrating the circulation scheme of the eastern Atlantic
consisting of nearly-symmetrical vertical circulation cells with upwelling near the equator
and nearly-symmetrical gyre circulations at the surface (Brennecke, 1909).
Figure 5. Meridional circulation scheme mainly along the western Atlantic (Brennecke,
1921).
Figure 6. Meridional circulation scheme along 30ºW shown by Merz (1925). Arrows and
contours of salinity clearly show an inter-hemispheric circulation consisting of northward
spreading of intermediate water in about 800 m from 45ºS to 20ºN and the southward
spreading of deep water at 1500-3500 m from 30ºN to 55ºS.
Figure 7. Block diagram of surface currents, salinity contours and the meridional
circulation along a section in the western Atlantic by Wüst (1949) based on the Meteor
expedition and other hydrographic data (Wüst, 1935). Small numbers are geostrophic
speeds in cm/sec. Dashed line is the boundary (9º C) between warm and cold layers.
Figure 8. Spreading of the middle NADW in the core of a maximum of oxygen content at
depths of 2000-3000 m (Wüst, 1935) and geostrophic current flow at a depth of 2000 m
(Defant, 1941) as shown by Wüst (1957). The main southward spreading axis lies close
to the western boundary.
Figure 9. Spreading of low salinity Subantarctic Intermediate Water in about 500-900 m
(Wüst, 1935) and geostrophic current flow at a depth of 800 m (Defant, 1941) as shown
by Wüst (1957). The main northward spreading axis lies close to the western boundary.
Figure 10. Schematic interpretation of the circulation in the Atlantic constructed by
Stommel (1957) by superposing an internal mode associated with flow across a level

27
surface L at mid-depth (a) and purely wind-driven circulation in the surface layers (b).
The superposition of these two is shown in (c).
Figure 11. Schematic upper layer (a) and deep layer (b) circulation in the Atlantic
including a superposition of the internal mode and wind-driven components as shown by
Stommel (1957). Small circles indicate general regions of vertical motion connecting
surface and deep layers.
Figure 12. Schematic of deep circulation of the world ocean according to Stommel
(1958a). The circulation consists of poleward flows in the ocean interior and narrow swift
western boundary currents connecting source regions in the North Atlantic and Antarctic
to the interior flows.
Figure 13. First schematic of a global ocean conveyor belt as shown by Broecker and
Peng (1982). Their caption states: “The upper diagram is an idealized map of the patterns
of deep water flow (solid lines) and surface water flow (dashed lines). The large circles
designate the sinking of NADW in the Norwegian Sea and the recooling of water along
the perimeter of the Antarctic Continent; the shaded circles indicate the distributed
upwelling which balances this deep water generation. The lower diagram is an idealized
vertical section running from the North Atlantic to the North Pacific showing the major
advective flow pattern (solid lines) and the rain of particles (wavy lines).”
Figure 14. Global structure of the thermohaline circulation cell associated with NADW
production as shown by Gordon (1986). Gordon’s caption states: “The warm water route,
shown by solid arrows, marks the proposed path for return of upper layer water to the
northern North Atlantic as is required to maintain continuity with the formation and
export of NADW. The circled values are volume flux in 106 m3/sec, which are expected
for uniform upwelling of NADW with a production rate of 20 x 106 m3/sec. These values
assume that the return within the cold water route, via the Drake Passage (dashed line), is
of minor significance.”

28
Figure 15. The great ocean conveyor belt logo shown by Broecker (1987) as illustrated
by Joe Le Monnier, Natural History Magazine.
Figure 16. A three-dimensional schematic of global interbasin flow with typical vertical
meridional sections for each ocean and their connections in the Southern Ocean by
Gordon (1991).
Figure 17. A three-layer schematic of the global interbasin circulation by Schmitz
(1996b). Values in circles represent transport in Sverdrups. UPOCNW designates upper
ocean water, a combination of upper layer water and intermediate water. This figure was
included on the back cover of Schmitz’ (1996b) report.
Figure 18. Schematic shown on the Intergovernmental Panel of Climate Change (IPCC)
website (http://www.ipcc.ch, figure 4-2 of the 2001 Synthesis Report under “Graphics”).
The caption for this figure on the website listed under “Publications” states: “Schematic
illustration of the global circulation system in the world ocean consisting of major north-
south thermohaline circulation [THC] routes in each ocean basin joining in the Antarctic
circumpolar circulation. Warm surface currents are connected in the few areas of
deepwater formation in the high latitudes of the Atlantic and around Antarctica (blue),
where the major ocean-to-atmosphere heat transfer occurs. This current system
contributes substantially to the transport and redistribution of heat (e.g., the poleward
flowing currents in the North Atlantic warm northwestern Europe by up to 10ºC). Model
simulations indicate that the North Atlantic branch of this circulation system is
particularly vulnerable to changes in atmospheric temperature and in the hydrological
cycle. Such perturbations caused by global warming could disrupt the current system,
which would have a strong impact on regional-to-hemispheric climate. Note that this is a
schematic diagram and it does not give the exact locations of the water currents that form
part of the THC.”

Figure 1Click here to download high resolution image

Figure 2Click here to download high resolution image

Figure 3Click here to download high resolution image

Figure 4Click here to download high resolution image

Figure 5Click here to download high resolution image

Figure 6Click here to download high resolution image

Figure 7Click here to download high resolution image

Figure 8Click here to download high resolution image

Figure 9Click here to download high resolution image

Figure 10Click here to download high resolution image

Figure 11Click here to download high resolution image

Figure 12Click here to download high resolution image

Figure 13Click here to download high resolution image

Figure 14Click here to download high resolution image

Figure 15Click here to download high resolution image

Figure 16

Figure 17Click here to download high resolution image

Figure 18Click here to download high resolution image