GHULAM, AGE 11 / FAIZ, AGE 40 (Afghanistan) Ghulam and ...
10
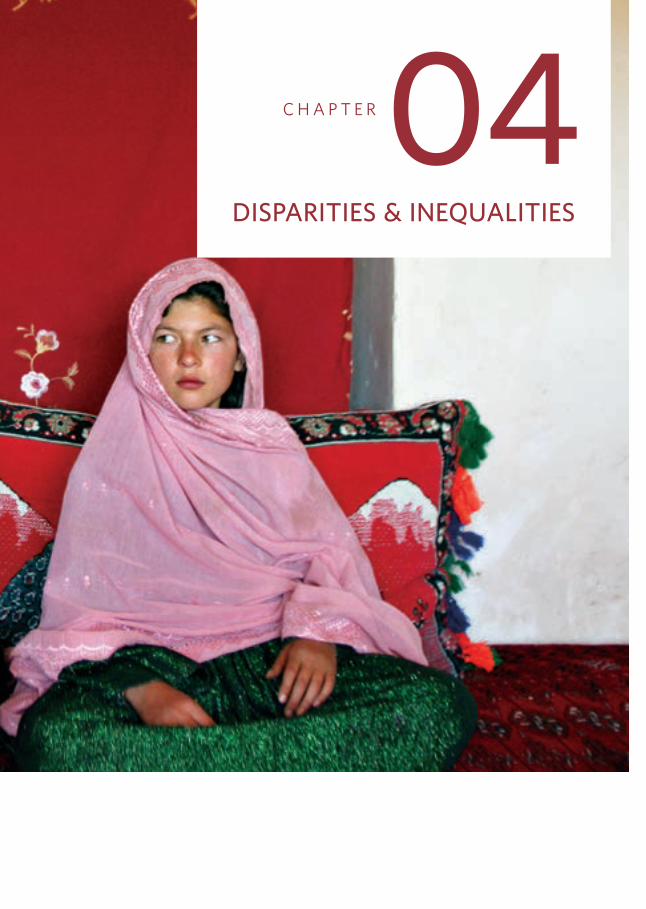
GHULAM, AGE 11 / FAIZ, AGE 40 (Afghanistan) Ghulam and Faiz, age 40, sit for a portrait in her home before their wedding in Afghanistan. According to the U.S. Department of State report “Human Rights Practices for 2011,” approximately 60 percent of girls were married younger than the legal age of 16. Once the girl’s father has agreed to the engagement, she is pulled out of school immediately. Photo by Stephanie Sinclair / VII Photo / Too Young To Wed
-
Upload
khangminh22 -
Category
Documents
-
view
3 -
download
0
Transcript of GHULAM, AGE 11 / FAIZ, AGE 40 (Afghanistan) Ghulam and ...

GHULAM, AGE 11 / FAIZ, AGE 40 (Afghanistan)Ghulam and Faiz, age 40, sit for a portrait in her home before their wedding in Afghanistan. According to the U.S. Department of State report “Human Rights Practices for 2011,” approximately 60 percent of girls were married younger than the legal age of 16. Once the girl’s father has agreed to the engagement, she is pulled out of school immediately.
Photo by Stephanie Sinclair / VII Photo / Too Young To Wed
diSPariTieS & ineqUaliTieS

34 MARRYING TOO YOUNG
A girl’s level of education, the wealth and the location of the household in which she lives, all affect the likelihood that she will become a child bride. This chapter examines disparities in the prevalence of child marriage with the aim of giving policymakers and programmers the knowledge they need to reduce and eventually eliminate this harmful practice and the inequities associated with it. Data for this analysis are drawn from 78 developing countries in which a Demographic and Health Survey or Multiple Indicators Clusters Survey was undertaken over the period 2000–2011. These countries represent close to 60 per cent of the population of all developing countries.
eFFects oF residence, education and wealtH
The results show that girls living in rural areas of the developing world tend to marry or enter into union at twice the rate of their urban counterparts (44 per cent and 22 per cent, respectively). A correspondence can also be found between the prevalence of child marriage in rural areas generally and the values observed among remote rural regions of a country (individual country profiles on child marriage can be found at: www.devinfo.info/mdg5b/profiles).
Education is one of the interventions that tend to lessen the probability that girls will marry before their eighteenth birthday. Girls with a primary education are twice as likely to marry or enter into union as those with a secondary or higher education. However, those with no education are three times more likely to marry or enter into union before age 18 as those with a secondary or higher education (Figure 5). In the case of Ethiopia, for example, women 20 to 29 years old with secondary or higher education marry at an average age that is 3.2 years higher than that of women of the same age with no education. They also have an average of 1.7 fewer children than their counterparts with no education.
cHaPter 4 DISPARITIES & INEqUALITIES

END CHILD MARRIAGE 35
Household wealth, represented in Figure 7 by wealth quintiles, also appears to affect the rate of child marriage. According to this analysis, more than half (54 per cent) of girls in the poorest 20 per cent of households are child brides, compared to only 16 per cent of girls in the richest 20 per cent of households. Note that although there is a gradual decline in child marriage as wealth increases, the prevalence of child marriage is still substantially higher in the fourth quintile than in the richest quintile. There is a remarkable correspondence between lower rates of child marriage and characteristics commonly associated with higher levels of development such as urban residence, secondary or higher education and wealth.
A somewhat different perspective emerges when disparities are analysed by absolute numbers of women (Figure 6) versus relative values (Figure 5). In 2010, over 67 million of women aged 20 to 24 were married or in union before age 18. This means that, on average, 13.5 million of them wed or entered into union every year before age 18. The majority of these girls lived in rural areas (51.9 million) – three times the number estimated for their urban counterparts (15.5 million). The more extreme disparity indicated by absolute numbers of women living in rural or urban areas, compared to relative values, is explained by the fact that rural populations are bigger overall. This emphasizes the importance for policymakers of considering population dynamics and geographic distribution.
Girls who are poor, have little or no education and live in rural areas are most likely to marry or enter into union before age 18
TOTAL
34%
44%
22%
63%
45%
20%
54%
47%
39%
29%
16%
RURAL
URBAN
NO EDUCATION
PRIMARY
SECONDARY+
POOREST 20%
SECOND
MIDDLE
FOURTH
RICHEST 20%
GEOGRAPHY
EDUCATION
WEALTH
P24 FIG 5
Figure 5 PercenTage oF Women 20-24 YearS old Who Were married or in Union BeFore age 18 BY BackgroUnd characTeriSTicS. 2000-2010
source: UNFPA database using DHS/MICS from 78 developing countries over the period 2000-2011.

36 MARRYING TOO YOUNG
Looking at disparities of education and wealth reveals other differences between relative and absolute numbers. The absolute numbers of women aged 20 to 24 with primary education who were married as children (19.5 million) is very similar to the numbers of women with secondary or higher education (19.3 million), despite the fact that girls with primary education have more than twice the probability of marrying or entering into a union before age 18. This is explained by the fact that household surveys asked women aged 20-24 years about their current state of educational attainment—not their educational level at the time they were married. Thus, the calculation of absolute numbers of women reflects a higher number of women with a secondary or higher education than would be the case if educational attainment were reported at the time of marriage or union. Many married girls may well have continued their education, but the exact number is unknown.
When looking at absolute numbers of women married or in union by age 18 in terms of wealth quintiles, the extreme disparities shown in Figure 5 soften somewhat. However, the richest 20% of the households have 2.7 times less women 20-24 years old married before the age 18 than the poorest 20%.
wide disParities in all regions
South Asia and sub-Saharan Africa have the highest prevalence of child marriage (46 per cent and 37 per cent, respectively). They also show the greatest disparities, with 50 per cent or more of girls belonging to the least advantaged groups being married—that is, girls who live in rural areas, have no education and live in the poorest 20 per cent of households (Figures 7, 8 and 9).
Most child brides live in rural areas – three times as many in urban areasFigure 6 nUmBer oF Women 20-24 YearS old in 2010 Who Were married or in Union BeFore age 18 in deVeloPing coUnTrieS in 2012 BY BackgroUnd characTeriSTicS (million)
P25 FIG 6
P30 FIG 11
51.9
15.5
28.7
19.5
19.3
17.5
16.9
14.8
11.6
6.5
RURAL
URBAN
NO EDUCATION
PRIMARY
SECONDARY+
POOREST 20%
SECOND
MIDDLE
FOURTH
RICHEST 20%
EDUCATION
GEOGRAPHY
WEALTH
source: UNFPA database using DHS or MICS data from 78 developing countries over the period 2000–2011.
END CHILD MARRIAGE 37
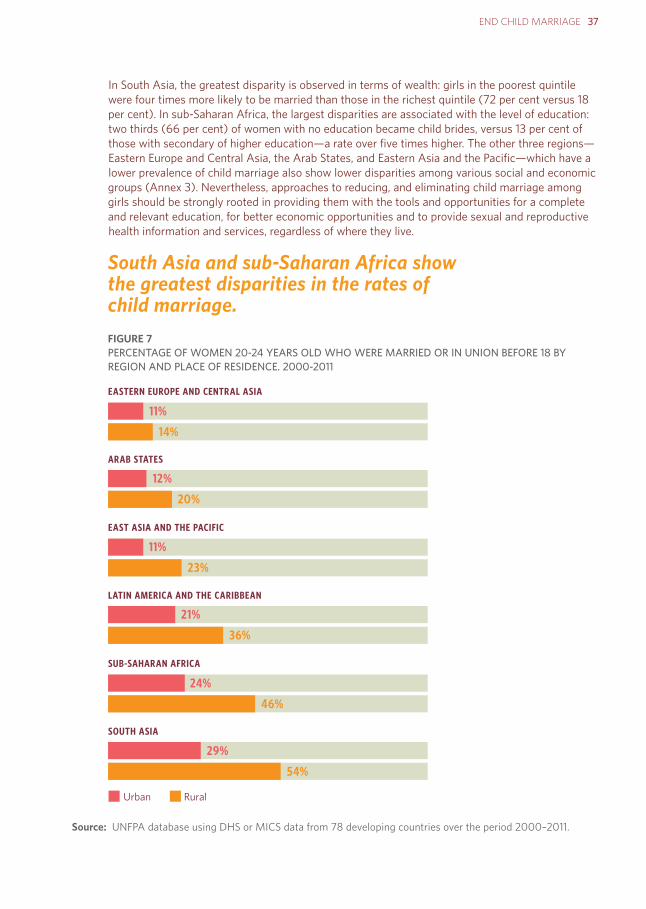
In South Asia, the greatest disparity is observed in terms of wealth: girls in the poorest quintile were four times more likely to be married than those in the richest quintile (72 per cent versus 18 per cent). In sub-Saharan Africa, the largest disparities are associated with the level of education: two thirds (66 per cent) of women with no education became child brides, versus 13 per cent of those with secondary of higher education —a rate over five times higher. The other three regions — Eastern Europe and Central Asia, the Arab States, and Eastern Asia and the Pacific—which have a lower prevalence of child marriage also show lower disparities among various social and economic groups (Annex 3). Nevertheless, approaches to reducing, and eliminating child marriage among girls should be strongly rooted in providing them with the tools and opportunities for a complete and relevant education, for better economic opportunities and to provide sexual and reproductive health information and services, regardless of where they live.
South Asia and sub-Saharan Africa show the greatest disparities in the rates of child marriage.
P26 FIG 7
P33 FIG 12
11%
14%
12%
20%
EASTERN EUROPE AND CENTRAL ASIA
ARAB STATES
EAST ASIA AND THE PACIFIC
LATIN AMERICA AND THE CARIBBEAN
SUB-SAHARAN AFRICA
SOUTH ASIA
Urban Rural
11%
23%
21%
36%
24%
46%
29%
54%
P34
Figure 7 PercenTage oF Women 20-24 YearS old Who Were married or in Union BeFore 18 BY region and Place oF reSidence. 2000-2011
source: UNFPA database using DHS or MICS data from 78 developing countries over the period 2000–2011.

38 MARRYING TOO YOUNG
P27 FIG 8
P29 FIG 11
Secondary+ No Education
EASTERN EUROPE AND CENTRAL ASIA
8%
32%
ARAB STATES
17%
54%
EAST ASIA AND THE PACIFIC
11%
17%
LATIN AMERICA AND THE CARIBBEAN
12%
25%
SUB-SAHARAN AFRICA
13%
66%
SOUTH ASIA
29%
69%
Figure 8 PercenTage oF Women 20-24 YearS old Who Were married or in Union BeFore 18 BY region and leVel oF edUcaTion. 2000-2011
Figure 9 PercenTage oF Women 20-24 YearS old Who Were married or in Union BeFore 18 BY region and WealTh qUinTile. 2000-2011
P27 FIG 9
EASTERN EUROPE AND CENTRAL ASIA
ARAB STATES
EAST ASIA AND THE PACIFIC
LATIN AMERICA AND THE CARIBBEAN
SUB-SAHARAN AFRICA
SOUTH ASIA
Richest 20% Poorest 20%
9%
18%
7%
25%
7%
29%
9%
44%
19%
54%
18%
72%
source: UNFPA database using DHS or MICS data from 78 developing countries over the period 2000–2011.
source: UNFPA database using DHS or MICS data from 78 developing countries over the period 2000–2011.

END CHILD MARRIAGE 39
education
Not surprisingly, rates of child marriage tend to be highest in regions where a large proportion of girls are out of school or whose education has been stalled. According to the United Nations Educational, Scientific and Cultural Organization (UNESCO), an estimated 75 million girls of lower secondary school age29 were either out of school or enrolled in primary school in 2007.30 The majority of these girls live in South and Western Asia (28 million) and sub-Saharan Africa (21 million). The absolute number of girls out of school or lagging behind for their age points to regions of greatest need. However, expressing the same situation as a percentage of the population provides a different picture. Thus, while South and Western Asia has the highest absolute number of children falling behind or out of school, it is in sub-Saharan Africa where the highest proportion of such girls are found (37 per cent, compared to 27 per cent for South and Western Asia).31
HealtH
Married girls’ reproductive health needs are not being met. Contraceptive use is low overall among adolescents who are married or in union. In developing countries overall, 22 per cent of adolescent girls (aged 15 to 19) who are married or in union use contraceptives, versus 61 per cent of married girls and women aged 15 to 49 years of age.
Nearly a quarter (24 per cent) of married adolescents show a high unmet need for contraception, versus 11 per cent for married women aged 15 to 49. This indicates relatively low levels of total demand satisfied for contraceptives 32 (43 per cent among married adolescents versus 85 per cent for married women aged 15 to 49).
Rates of contraceptive use are lowest in South Asia and sub-Saharan Africa (Figure 10), where the prevalence of child marriage is highest and the largest numbers of girls are lagging behind or are out of secondary school. A relatively high prevalence of contraceptive use among married adolescents is found only in Latin America and the Caribbean (53 per cent), as shown in Figure 5. Still, this is substantially lower than the rate of 73 per cent observed for all married women and girls in the region as a whole.

40 MARRYING TOO YOUNG
satisFied deMand For contracePtion
Adolescents 15-19 years of age not only have lower use of contraception but also high levels of demand not satisfied for contraception. Figure 11 presents the proportion of demand satisfied for contraception among adolescents 15-19, together with the prevalence of child marriage. At one extreme are countries such as Sierra Leone, where 10 per cent of adolescents (aged 15 to 19) married before age 15, but only 5 per cent of married adolescents overall have their demand for contraception satisfied (in other words, 95 per cent of the girls who indicated that they wanted to use contraceptives were not using them). At the other extreme, in Rwanda, a very small proportion of adolescents married before age 15 (0.2 per cent), but the large majority — 84 per cent—of adolescents who were married or in union have their demand for contraception satisfied. In the middle is Niger, where almost a third (28 per cent) of adolescent girls married before age 15, but only 28 per cent of married adolescents have their demand for contraception satisfied (72 per cent indicated that they wanted to use contraceptives, but were not using them). All three scenarios are a source of concern all women and girls who wish to use contraception should be able to do so.
The lowest rates of contraceptive use among married adolescents are found in South Asia and sub-Saharan Africa
Figure 10 conTracePTiVe PreValence raTe among girlS 15-19 YearS old Who are married or in Union, 2000-2010
53%
15%
16%
22%
23%
36%
41%
SOUTH ASIA
SUB-SAHARA AFRICA
TOTAL FOR DEVELOPING COUNTRIES
ARAB STATES
EASTERN EUROPE AND CENTRAL ASIA
EAST ASIA AND THE PACIFIC
LATIN AMERICA AND THE CARIBBEAN
Prev
alen
ce o
f ch
ild m
arri
age
by r
egio
n, 2
000
–201
0
P29 FIG 10
source: UNFPA database using DHS or MICS data from 78 developing countries over the period 2000–2011.

END CHILD MARRIAGE 41
SIERRA LEONEEITREALIBERIA
MAURITANIASENEGALNIGERIA
COMOROSGHANA
MALIYEMEN
TIMOR-LESTEBENIN
PAKISTANUGANDA
BURKINA FASOTOGONIGER
AZERBAIJANCHAD
MALDIVESNEPAL
CÔTE D’IVOIREGUINEA
SAO TOME AND PRINCIPEINDIA
DEMOCRATIC REPUBLIC OF THE CONGOHAITI
CENTRAL AFRICAN REPUBLICETHIOPIA
KENYAPHILIPPINES
GUYANAUNITED REPUBLIC OF TANZANIA
MADAGASCARARMENIA
BOLIVIAMALAWI
UZBEKISTANMOZAMBIQUE
NAMIBIACONGO
ZAMBIACAMEROON
TURKEYGABON
VIETNAMUKRAINE
DOMINICAN REPUBLICCAMBODIA
SWAZILANDHONDURAS
SOUTH AFRICAZIMBABWE
TURKMENISTANBRAZIL
BANGLADESHPERU
KAZAKHSTANCOLOMBIA
KYRGYZTANNICARAGUA
JORDANALBANIA
EGYPTMOROCCOMOLDOVA
INDONESIARWANDA
0 % 10 20 30 40 50 60 70 80 90
100
Marriage under age 15 (among girls 15–19)
Proportion of demand satisfied (among girls 15–19)
Ideal proportion of demand satisfied
Figure 11PERCENTAGE OF
ADOLESCENT
GIRLS (15-19) WHO
MARRY/IN UNION
BEFORE AGE 15,
PROPORTION OF
DEMAND FOR
CONTRACEPTION
SATISFIED AND
IDEAL PROPORTION
OF DEMAND
SATISFIED AMONG
68 COUNTRIES WITH
RECENT SURVEYS,
1988-2011
source: UNFPA database using sixty-eight countries with recent household surveys between 1988 and 2011.
Levels of satisfied demand for contraception among adolescents are very low across the majority of developing countries