
Geomorphic Effects of 2011 Floods on Channel Belt Parameters of Rapti River: A Remote Sensing and...
9
Corona Journal of Science and Technology ISSN : 2319 – 6327 (Online), Vol. 2, No. II (2013), pp. 4-12 @Corona Publication http://www.coronapublication.com Geomorphic Effects of 2011 Floods on Channel Belt Parameters of Rapti River: A Remote Sensing and GIS Approach Rajesh Kumar, Vikas Kamal and Raj Kumar Singh Abstract: The Rapti river is a major foothills fed tributary of the Ghaghara river in terms of discharge and sediment load. The planform of the Rapti is highly sinuous in the stretch under study. The present work focuses on the fluvial geomorphic features within the valley margin. The study reveals that the floodplain is formed due to lateral migration of channel and associated scroll bars in accordance with unit stream power varying from ~10 Wm -2 to 23 Wm -2 . Further an attempt has also been made to study the hydrometeorological conditions of 2011 monsoon season and its effect on channel instability. Lateral expansion, translation of meander and cut-offs formation are responsible for altering the planform of the channel. Based on the proportion of bar area to channel belt area and channel area, we indentified reach wise aggradational and degradational processes. The shifting distance and direction of central line of Nov.2011 with respect to central line of Feb.2011 were calculated in GIS environment. The general shifting trend was found to be towards SW. Key Words: Stream Power, CMZ, Flood Crest, Channel Belt, Azimuth, Interfan area, Planform I. INTORDUCTION Fluvial geomorphologists are extensively using remotely sensed satellite images along with GIS for quantification of geomorphic processes and resultant landforms at various spatial scales ranging from basin to reach level. The alluvial rivers are the most dynamic geomorphic agent of the fluvial landscape. They regularly adjust width, depth, area and hydraulic radius in response to variable discharge and sediment supply. The multidate satellite images and DEM data are highly useful to quantify these adjustments precisely in a short period of time. Rajesh Kumar, Former Senior Research Scholar, Centre for the Study of Regional Development, JNU, New Delhi-67.Email: [email protected] Vikas Kamal, Senior Research Scholar, School of Environmental Sciences, JNU, New Delhi-67. Email: [email protected] Raj Kumar Singh, Junior Research fellow, School of Environmental Sciences, JNU, New Delhi-67. Email: [email protected] The work carried out in USA by Wolman and Miller (1960) showed that the frequent floods with low magnitude rather than low frequency and high magnitude floods accomplished most of geomorphic work in terms of amount of suspended sediment load. The geomorphic effect of flooding is also assessed through the competence of stream to alter the shape and size of landforms and amount of erosion generated during floods (Wolman and Gerson, 1978). Sinha et. al. (2005) used sediment yield and stream power data for geomorphic characterization of the Gangetic plain. They further argued that high unit stream power and low sediment yield are related with degradation processes in western Gangetic plain while the low unit stream power and high sediment yield are accordant with aggradational fluvial processes in the eastern Gangetic plain. In peninsular India, Kale (2006) also quantified the geomorphic effectiveness of large floods on the Tapi, the Narmada and the Godavari river using the stream power and boulder movement data. In this study, active channel and channel belt width, area, sinuosity bar area, channel shift direction and mean length of shifting were quantified and tabulated to assess the impacts of floods on these parameters by adopting the concept of geomorphic effectiveness of floods on altering the landforms defined by Wolman and Gerson (1978). II. STUDY AREA The study stretch lies between Ikauna and Balrampur town of east Uttar Pradesh along the Rapti river which is a major tributary of the Ghaghara. The total length of stretch is ~46 Km. The landscape setting of the study area is an inter fan surface bounded by Sarda megafan in the west and Gandak megafan in the east. The thickness of Quaternary alluvial fills in inter fan area varies from 3.0 to 4.0 Km (Singh, 1996). The longitudinal Rapti fault and lineament trending NW- SE formed due to the compression from the SW.
-
Upload
independent -
Category
Documents
-
view
1 -
download
0
Transcript of Geomorphic Effects of 2011 Floods on Channel Belt Parameters of Rapti River: A Remote Sensing and...
Corona Journal of Science and Technology ISSN : 2319 – 6327 (Online), Vol. 2, No. II (2013), pp. 4-12 @Corona Publication http://www.coronapublication.com
Geomorphic Effects of 2011 Floods on Channel Belt Parameters of Rapti River: A Remote
Sensing and GIS Approach Rajesh Kumar, Vikas Kamal and Raj Kumar Singh
Abstract: The Rapti river is a major foothills fed tributary of the Ghaghara river in terms of discharge and sediment load. The planform of the Rapti is highly sinuous in the stretch under study. The present work focuses on the fluvial geomorphic features within the valley margin. The study reveals that the floodplain is formed due to lateral migration of channel and associated scroll bars in accordance with unit stream power varying from ~10 Wm-2 to 23 Wm-2. Further an attempt has also been made to study the hydrometeorological conditions of 2011 monsoon season and its effect on channel instability. Lateral expansion, translation of meander and cut-offs formation are responsible for altering the planform of the channel. Based on the proportion of bar area to channel belt area and channel area, we indentified reach wise aggradational and degradational processes. The shifting distance and direction of central line of Nov.2011 with respect to central line of Feb.2011 were calculated in GIS environment. The general shifting trend was found to be towards SW.
Key Words: Stream Power, CMZ, Flood Crest, Channel Belt, Azimuth, Interfan area, Planform
I. INTORDUCTION
Fluvial geomorphologists are extensively using remotely sensed satellite images along with GIS for quantification of geomorphic processes and resultant landforms at various spatial scales ranging from basin to reach level.
The alluvial rivers are the most dynamic geomorphic agent of the fluvial landscape. They regularly adjust width, depth, area and hydraulic radius in response to variable discharge and sediment supply. The multidate satellite images and DEM data are highly useful to quantify these adjustments precisely in a short period of time.
Rajesh Kumar, Former Senior Research Scholar, Centre for the Study of Regional Development, JNU, New Delhi-67.Email: [email protected]
Vikas Kamal, Senior Research Scholar, School of Environmental Sciences, JNU, New Delhi-67. Email: [email protected]
Raj Kumar Singh, Junior Research fellow, School of Environmental Sciences, JNU, New Delhi-67. Email: [email protected]
The work carried out in USA by Wolman and Miller (1960) showed that the frequent floods with low magnitude rather than low frequency and high magnitude floods accomplished most of geomorphic work in terms of amount of suspended sediment load. The geomorphic effect of flooding is also assessed through the competence of stream to alter the shape and size of landforms and amount of erosion generated during floods (Wolman and Gerson, 1978). Sinha et. al. (2005) used sediment yield and stream power data for geomorphic characterization of the Gangetic plain. They further argued that high unit stream power and low sediment yield are related with degradation processes in western Gangetic plain while the low unit stream power and high sediment yield are accordant with aggradational fluvial processes in the eastern Gangetic plain. In peninsular India, Kale (2006) also quantified the geomorphic effectiveness of large floods on the Tapi, the Narmada and the Godavari river using the stream power and boulder movement data.
In this study, active channel and channel belt width, area, sinuosity bar area, channel shift direction and mean length of shifting were quantified and tabulated to assess the impacts of floods on these parameters by adopting the concept of geomorphic effectiveness of floods on altering the landforms defined by Wolman and Gerson (1978).
II. STUDY AREA
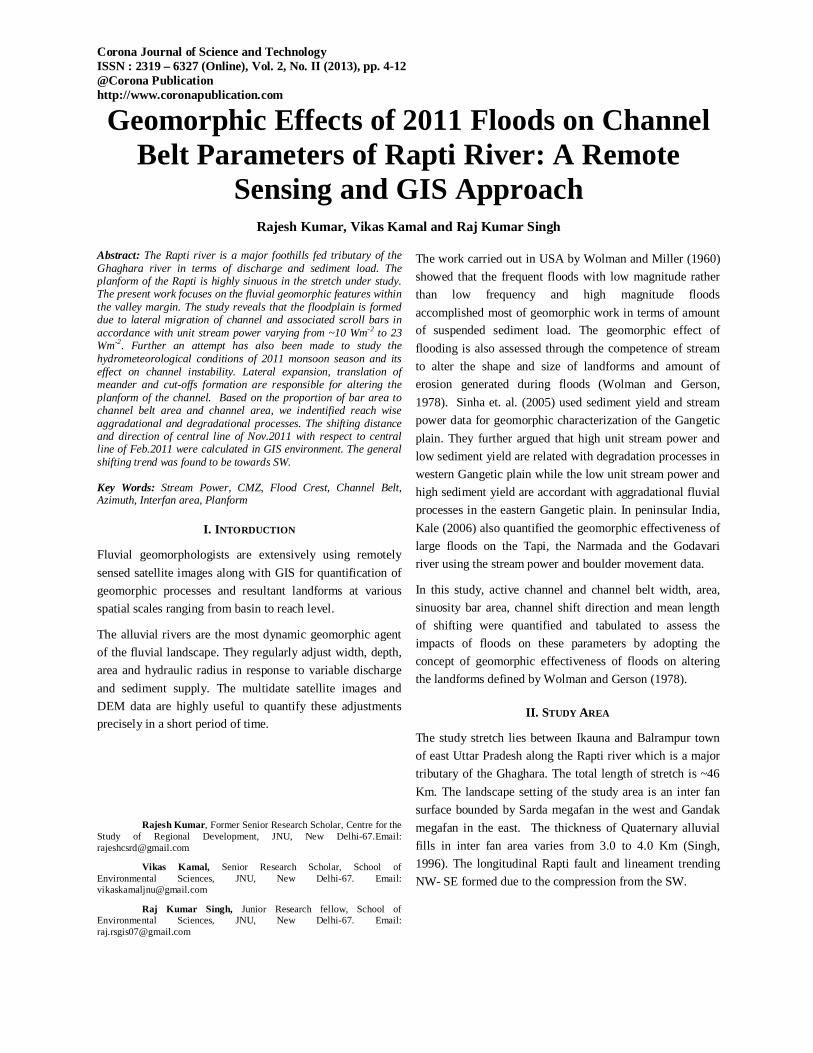
The study stretch lies between Ikauna and Balrampur town of east Uttar Pradesh along the Rapti river which is a major tributary of the Ghaghara. The total length of stretch is ~46 Km. The landscape setting of the study area is an inter fan surface bounded by Sarda megafan in the west and Gandak megafan in the east. The thickness of Quaternary alluvial fills in inter fan area varies from 3.0 to 4.0 Km (Singh, 1996). The longitudinal Rapti fault and lineament trending NW- SE formed due to the compression from the SW.
Geomorphic Effects of 2011 Floods on Channel Belt Parameters of Rapti River: A Remote Sensing and GIS Approach
(5)
Fig. 1: Location map of the study area. Lineament and exposed faults are adopted from Pati et. al. 2011. Bari Gad Fault (BGF), Main Boundary Fault (MBF), Rapti Dun and Himalayan Front Fault (HFF) were marked
using Figure 2c prepared by Yeats et. al. 1992.
Table 1a: Description of satellite, topographic map and flood atlas data set.
A. Satellite Images and DEM Data
Date/ Year Sensor Worldwide Reference
System (WRS) Resolutio
n (m)
Path Row
11 Nov. 2011
TM 143 41 30
12 Feb. 2011
ditto 143 41 30
10 Nov. 2005
ditto 143 41 30
17 Oct. 1999
ETM+, Band8 (Pan)
143 41 15
5 Nov. 1975
MSS 154 41 60
11-22 Feb. 2000
Shuttle Radar
Topographic Mission (SRTM)
SRTM DEM Ver.4 downloaded from
http://srtm.csi.cgiar.org/ 90
B. Topographic Sheet and Other Ancillary Data
Date Publisher Scale
1913-1947
Army Map Service (RMBM), Corps of Engineers, U.S. Army, Washington, D.C.
1:250K
2007-2009 Dartmouth Flood Atlas, Dartmouth Flood Observatory (http://www.dartmouth.edu/~floods/Modis.html) accessed on 23-12-2009.
Global index map
(10 degree display sheet)
Table 1b: Details of rainfall, daily discharge, daily water level and Maximum water level.
Date/Year Type of Data/Recording Station
Source
Monsoon Season-26/06/2011 to 30/09/2011.
Daily Rainfall/Mari, Nepalganj, Dhakeri, Lamahi, Bijuwartar, Libang Gaon, Sulichour, Swargadwari, Kusum, Bagasoti,Chisapani, Bhalubang, Kakardhari, Bhinga, Balrampur, Katerniaghat, Elginbridge, Chandradeepghat and Kakarahi.
Irrigation Department of Uttar Pradesh (http://irrigation.up.nic.in/flood.htm) and www.hydrology.gov.np accessed on 23-11-2011.
Monsoon Season-26/06/2011 to 23/09/2011.
Daily Discharge recorded at Kusum (Nepal
www.hydrology.gov.np accessed on 23-11-2011.
Monsoon Season-26/06/2011 to 30/09/2011.
Daily Water Level recorded at Bhinga and Balrampur
Irrigation Department of Uttar Pradesh (http://irrigation.up.nic.in/flood.htm) accessed on 23-11-2011.
1964-2000 Maximum Discharge at Tighra-Goan (1971-1992), Naya-Goan (1976-1993), Bagasoti (1976-2000) and Jalkundi (1964-2000)
http://www.hkh-friend.net.np/rhdc/DataDisp11.asp? Accessed on 15th
June, 2008.
- Annual Suspended Sediment Load (Million Tons) estimated at Jalkundi (Nepal)
Sharma (1997).
- Annual Suspended Sediment Load (Million Tons) estimated at Balrampur
Chandra (1993).

Geomorphic Effects of 2011 Floods on Channel Belt Parameters of Rapti River: A Remote Sensing and GIS Approach
(6)
The transverse normal faults namely Intaha-Parsa (IPFt), Bahraich (BFt), Colenganj-Balrampur (CBFt) and West Uttaraulla (WUFt) are trending in NE-SW direction (Figure 1). The block bounded with CBFt and WuFt faults covering the study stretch has been titling towards SW since 1.1 Ka and therefore such titling caused widening of the floodplain towards the same direction (Pati et. al. 2011). The general slope of the plain is towards east (Yadav, 1999). The study area falls in rainstorm zone-1where the humid subtropical climate prevails. It receives enormous rainfall and consequent synchronization of flooding due to break in monsoon condition when the alignment of monsoon trough is near to the foothills of Himalaya (Dhar and Nandagiri, 2003). More than 85 per cent of annual rainfall of the basin is received during monsoon season (June to mid October). Aggradation of channel bed and diminishing channel gradient downstream are main geomorphic factors for extensive flooding in this area (Yadav, 1999; Rao, 1979).
III. DATA BASE AND METHODS
Medium spatial resolution Landsat MSS, TM, ETM+ and SRTM elevation data were used in this study to map geomorphological features and to assess the geomorphic effectiveness of 2011 floods. The rainfall, instantaneous water level, daily discharge and annual sediment load data were also used to understand the general hydrometeorological condition of the study stretch (Table1a and 1b).
The average areal rainfall within the watershed was calculated using arithmetic mean method. The graphical visual correlation between average areal rainfall and water level was established at Balrampur G/D site which is located near the outlet of watershed and represents hydrological condition of the entire watershed. The geographic (lat/long) projection and WGS 84 datum were used for geocoding of topographic maps and Dartmouth Flood Atlas and later on these maps were reprojected into the projected coordinate system (UTM Zone 44N) and WGS 84 datum. Satellite images and topographic maps were used to map the geomorphological features of floodplain through seven keys of visual interpretation. The valley margin was delineated using SRTM data and Landsat ETM+ (band 8) image. The active floodplain within the valley margin was defined using the Dartmouth Flood Atlas (2006-2009) and geomorphological features. The channel migration zone (CMZ) was mapped using the channel belt of 1947, 1975, 1999, 2005 and 2011 periods (Cygnia F. Rapp and Timothy B. Abbe, 2003). The entire stretch of river was divided into six reaches based on the width of CMZ and sinuosity. Channel belt area was obtained by merging the active
channel, point, lateral and mid channel bars in GIS environment. Channel belt parameters listed in Table 3 were calculated using GIS. The sinuosity index was calculated using the Schumm’s formula (1980):
Sinuosity index (SI) =
[(Channel length)/Straight line valley length)]
Drainage area was estimated from SRTM DEM using watershed delineation algorithm written in ARC GIS-10 software. The valley gradient (m/m) was estimated along various transects using filled SRTM DEM. The above two are the major factors for stream power estimation. Water flowing along slope has mechanical power (Rhoads, 1987) and thus, stream power can be defined as “the rate of energy supply at channel bed after overcoming friction and transporting sediments” (McEwen, 1994).
The peak discharge recorded at Jalkundi, Bagasoti, Tighra-Goan and Naya –Gaon was used for bankfull discharge estimation at these sites. Log-Pearson Type-III method was applied to estimate bankfull discharge which is equivalent to 1.58 year return period discharge. The bankfull channel width at above mentioned G/D sites was estimated using Google Earth and SRTM DEM data. The drainage area, bankfull discharge and channel width at Baltara and Kursela G/D sites on Kosi river and Hayaghat on Baghmati river (Sinha et.al. 2005) and above mentioned G/D sites on Rapti river were used for formulation of regional power function equations. The bankfull discharge and channel width were estimated using the regional power function equations (1 and 2) that are expressed as:
Bankfull Discharge (Q1.58) =
1.765 (A)0.733 (R2 = 0.931) …….. (1)
Bankfull Channel Width (W) =
2.463 (Q1.58)0.606 (R2 = 0.974) ……... (2)
Total stream power gives a measure of the rate of energy expenditure per unit length of the channel (Bagnold, 1966). It can be expressed as:
Ω= γQS ..…… (3)
Where, Ω is total stream power per unit length of the channel (W m-1), γ is the specific weight of water (9800 N m-2), Q is bankfull discharge (m3 s-1) and S is the energy slope which is replaced with valley slope in this study as the channel is very avulsive.
Specific or unit stream power provides a measure of the rate of energy expenditure per unit area of the channel bed. It is expressed as:
Geomorphic Effects of 2011 Floods on Channel Belt Parameters of Rapti River: A Remote Sensing and GIS Approach
(7)
ω = Ω/W ...…… (4)
Where, ω is specific or unit stream power (W m-2) and W is the bankfull width (m) of the channel.
The channel shift was measured using the central lines of channel. Many transects were drawn along the pre-monsoon central line (February, 2011) at an equal interval of 500 metres. The azimuth and length of each transect i.e. shift were plotted on rosette to find out the shifting direction of the channel (November 2011).
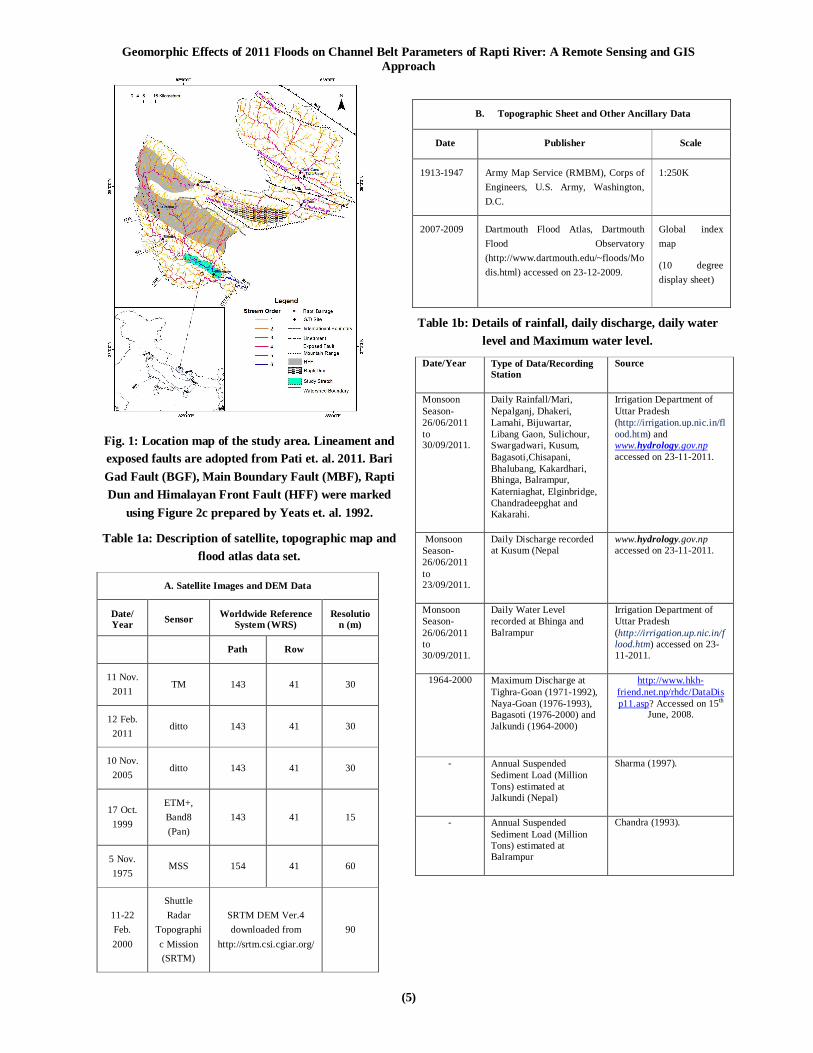
Fig. 2 : Distribution of rainfall (in mm) during monsoon season-2011.
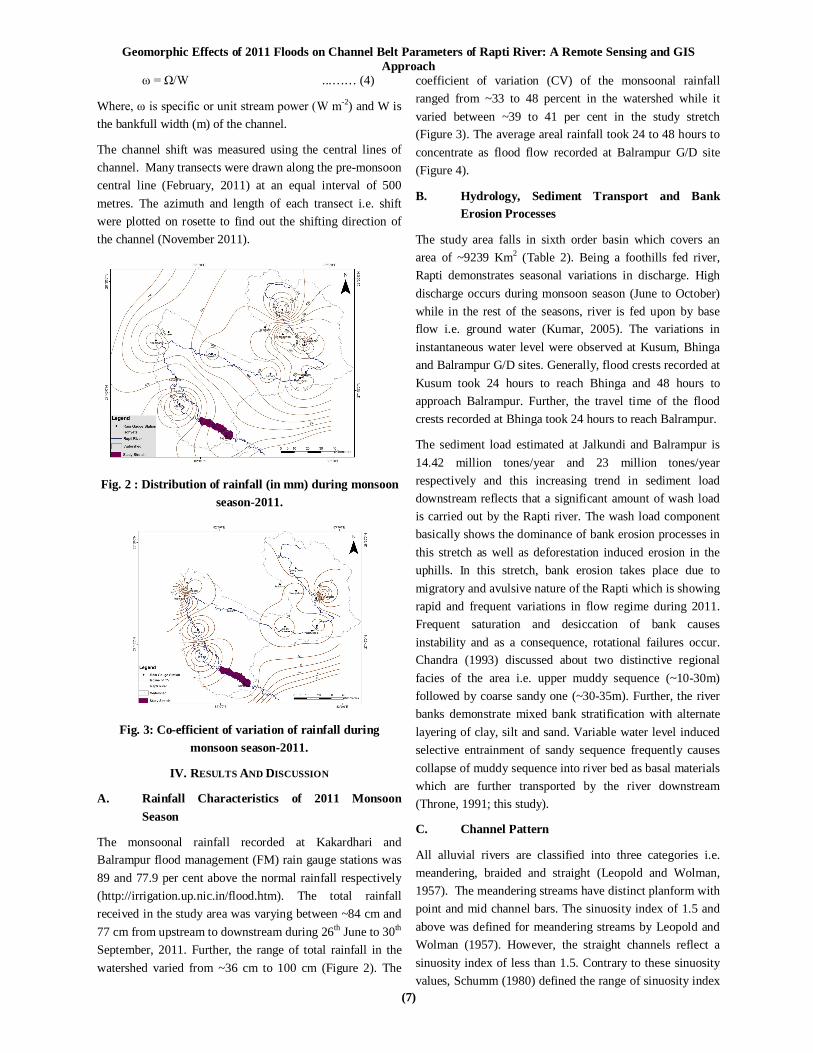
Fig. 3: Co-efficient of variation of rainfall during monsoon season-2011.
IV. RESULTS AND DISCUSSION
A. Rainfall Characteristics of 2011 Monsoon Season
The monsoonal rainfall recorded at Kakardhari and Balrampur flood management (FM) rain gauge stations was 89 and 77.9 per cent above the normal rainfall respectively (http://irrigation.up.nic.in/flood.htm). The total rainfall received in the study area was varying between ~84 cm and 77 cm from upstream to downstream during 26th June to 30th September, 2011. Further, the range of total rainfall in the watershed varied from ~36 cm to 100 cm (Figure 2). The
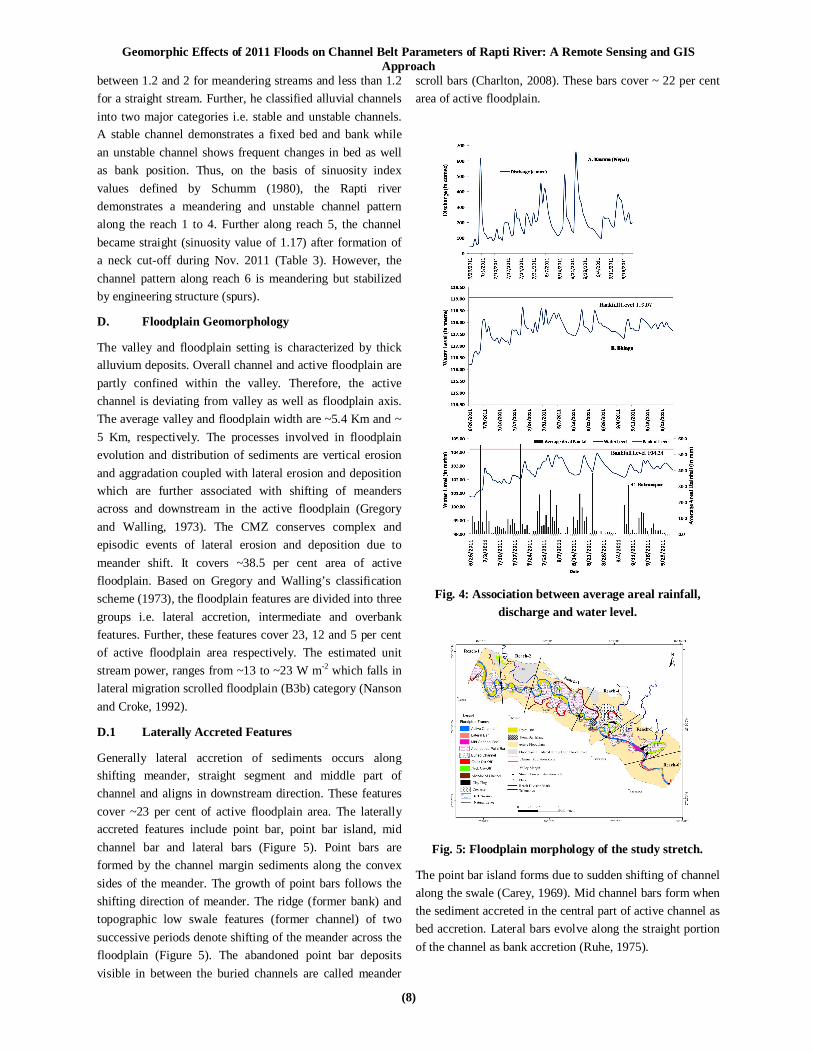
coefficient of variation (CV) of the monsoonal rainfall ranged from ~33 to 48 percent in the watershed while it varied between ~39 to 41 per cent in the study stretch (Figure 3). The average areal rainfall took 24 to 48 hours to concentrate as flood flow recorded at Balrampur G/D site (Figure 4).
B. Hydrology, Sediment Transport and Bank Erosion Processes
The study area falls in sixth order basin which covers an area of ~9239 Km2 (Table 2). Being a foothills fed river, Rapti demonstrates seasonal variations in discharge. High discharge occurs during monsoon season (June to October) while in the rest of the seasons, river is fed upon by base flow i.e. ground water (Kumar, 2005). The variations in instantaneous water level were observed at Kusum, Bhinga and Balrampur G/D sites. Generally, flood crests recorded at Kusum took 24 hours to reach Bhinga and 48 hours to approach Balrampur. Further, the travel time of the flood crests recorded at Bhinga took 24 hours to reach Balrampur.
The sediment load estimated at Jalkundi and Balrampur is 14.42 million tones/year and 23 million tones/year respectively and this increasing trend in sediment load downstream reflects that a significant amount of wash load is carried out by the Rapti river. The wash load component basically shows the dominance of bank erosion processes in this stretch as well as deforestation induced erosion in the uphills. In this stretch, bank erosion takes place due to migratory and avulsive nature of the Rapti which is showing rapid and frequent variations in flow regime during 2011. Frequent saturation and desiccation of bank causes instability and as a consequence, rotational failures occur. Chandra (1993) discussed about two distinctive regional facies of the area i.e. upper muddy sequence (~10-30m) followed by coarse sandy one (~30-35m). Further, the river banks demonstrate mixed bank stratification with alternate layering of clay, silt and sand. Variable water level induced selective entrainment of sandy sequence frequently causes collapse of muddy sequence into river bed as basal materials which are further transported by the river downstream (Throne, 1991; this study).
C. Channel Pattern
All alluvial rivers are classified into three categories i.e. meandering, braided and straight (Leopold and Wolman, 1957). The meandering streams have distinct planform with point and mid channel bars. The sinuosity index of 1.5 and above was defined for meandering streams by Leopold and Wolman (1957). However, the straight channels reflect a sinuosity index of less than 1.5. Contrary to these sinuosity values, Schumm (1980) defined the range of sinuosity index
Geomorphic Effects of 2011 Floods on Channel Belt Parameters of Rapti River: A Remote Sensing and GIS Approach
(8)
between 1.2 and 2 for meandering streams and less than 1.2 for a straight stream. Further, he classified alluvial channels into two major categories i.e. stable and unstable channels. A stable channel demonstrates a fixed bed and bank while an unstable channel shows frequent changes in bed as well as bank position. Thus, on the basis of sinuosity index values defined by Schumm (1980), the Rapti river demonstrates a meandering and unstable channel pattern along the reach 1 to 4. Further along reach 5, the channel became straight (sinuosity value of 1.17) after formation of a neck cut-off during Nov. 2011 (Table 3). However, the channel pattern along reach 6 is meandering but stabilized by engineering structure (spurs).
D. Floodplain Geomorphology
The valley and floodplain setting is characterized by thick alluvium deposits. Overall channel and active floodplain are partly confined within the valley. Therefore, the active channel is deviating from valley as well as floodplain axis. The average valley and floodplain width are ~5.4 Km and ~ 5 Km, respectively. The processes involved in floodplain evolution and distribution of sediments are vertical erosion and aggradation coupled with lateral erosion and deposition which are further associated with shifting of meanders across and downstream in the active floodplain (Gregory and Walling, 1973). The CMZ conserves complex and episodic events of lateral erosion and deposition due to meander shift. It covers ~38.5 per cent area of active floodplain. Based on Gregory and Walling’s classification scheme (1973), the floodplain features are divided into three groups i.e. lateral accretion, intermediate and overbank features. Further, these features cover 23, 12 and 5 per cent of active floodplain area respectively. The estimated unit stream power, ranges from ~13 to ~23 W m-2 which falls in lateral migration scrolled floodplain (B3b) category (Nanson and Croke, 1992).
D.1 Laterally Accreted Features
Generally lateral accretion of sediments occurs along shifting meander, straight segment and middle part of channel and aligns in downstream direction. These features cover ~23 per cent of active floodplain area. The laterally accreted features include point bar, point bar island, mid channel bar and lateral bars (Figure 5). Point bars are formed by the channel margin sediments along the convex sides of the meander. The growth of point bars follows the shifting direction of meander. The ridge (former bank) and topographic low swale features (former channel) of two successive periods denote shifting of the meander across the floodplain (Figure 5). The abandoned point bar deposits visible in between the buried channels are called meander
scroll bars (Charlton, 2008). These bars cover ~ 22 per cent area of active floodplain.
Fig. 4: Association between average areal rainfall, discharge and water level.
Fig. 5: Floodplain morphology of the study stretch.
The point bar island forms due to sudden shifting of channel along the swale (Carey, 1969). Mid channel bars form when the sediment accreted in the central part of active channel as bed accretion. Lateral bars evolve along the straight portion of the channel as bank accretion (Ruhe, 1975).
Geomorphic Effects of 2011 Floods on Channel Belt Parameters of Rapti River: A Remote Sensing and GIS Approach
(9)
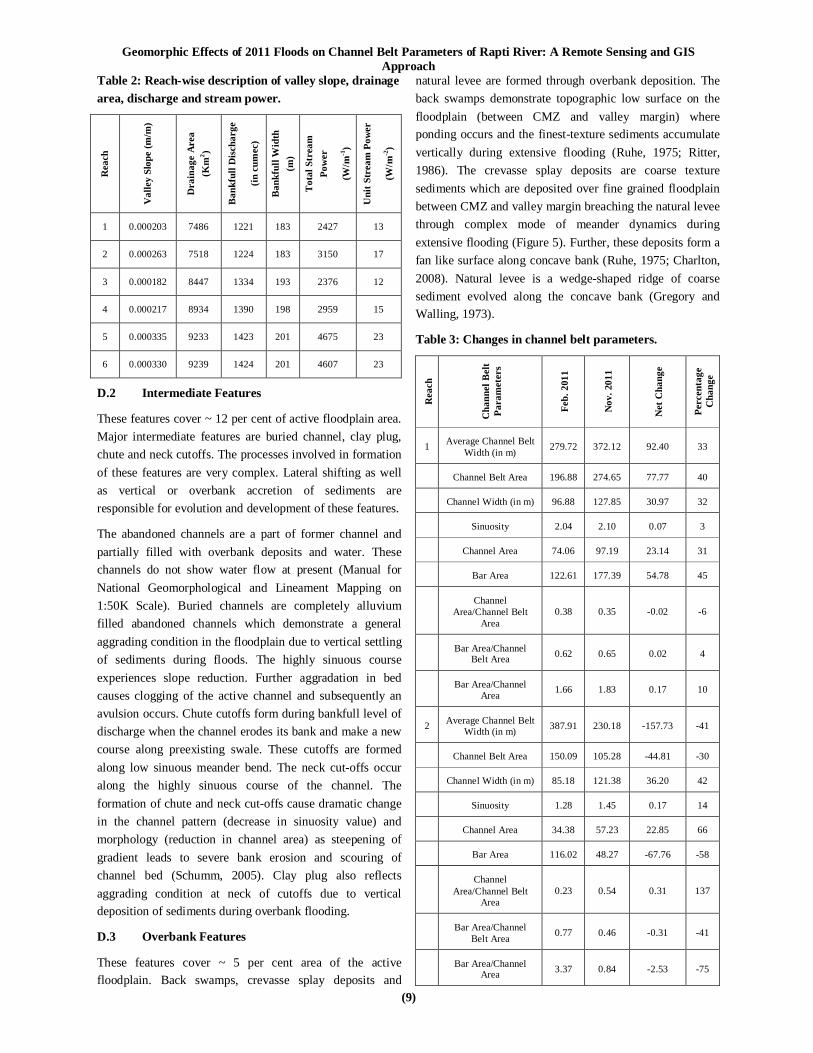
Table 2: Reach-wise description of valley slope, drainage area, discharge and stream power.
Rea
ch
Val
ley
Slop
e (m
/m)
Dra
inag
e A
rea
(Km
2 )
Ban
kful
l Dis
char
ge
(in c
umec
)
Ban
kful
l Wid
th
(m)
Tot
al S
trea
m
Pow
er
(W/m
-1)
Uni
t Str
eam
Pow
er
(W/m
-2)
1 0.000203 7486 1221 183 2427 13
2 0.000263 7518 1224 183 3150 17
3 0.000182 8447 1334 193 2376 12
4 0.000217 8934 1390 198 2959 15
5 0.000335 9233 1423 201 4675 23
6 0.000330 9239 1424 201 4607 23
D.2 Intermediate Features
These features cover ~ 12 per cent of active floodplain area. Major intermediate features are buried channel, clay plug, chute and neck cutoffs. The processes involved in formation of these features are very complex. Lateral shifting as well as vertical or overbank accretion of sediments are responsible for evolution and development of these features.
The abandoned channels are a part of former channel and partially filled with overbank deposits and water. These channels do not show water flow at present (Manual for National Geomorphological and Lineament Mapping on 1:50K Scale). Buried channels are completely alluvium filled abandoned channels which demonstrate a general aggrading condition in the floodplain due to vertical settling of sediments during floods. The highly sinuous course experiences slope reduction. Further aggradation in bed causes clogging of the active channel and subsequently an avulsion occurs. Chute cutoffs form during bankfull level of discharge when the channel erodes its bank and make a new course along preexisting swale. These cutoffs are formed along low sinuous meander bend. The neck cut-offs occur along the highly sinuous course of the channel. The formation of chute and neck cut-offs cause dramatic change in the channel pattern (decrease in sinuosity value) and morphology (reduction in channel area) as steepening of gradient leads to severe bank erosion and scouring of channel bed (Schumm, 2005). Clay plug also reflects aggrading condition at neck of cutoffs due to vertical deposition of sediments during overbank flooding.
D.3 Overbank Features
These features cover ~ 5 per cent area of the active floodplain. Back swamps, crevasse splay deposits and
natural levee are formed through overbank deposition. The back swamps demonstrate topographic low surface on the floodplain (between CMZ and valley margin) where ponding occurs and the finest-texture sediments accumulate vertically during extensive flooding (Ruhe, 1975; Ritter, 1986). The crevasse splay deposits are coarse texture sediments which are deposited over fine grained floodplain between CMZ and valley margin breaching the natural levee through complex mode of meander dynamics during extensive flooding (Figure 5). Further, these deposits form a fan like surface along concave bank (Ruhe, 1975; Charlton, 2008). Natural levee is a wedge-shaped ridge of coarse sediment evolved along the concave bank (Gregory and Walling, 1973).
Table 3: Changes in channel belt parameters.
Rea
ch
Cha
nnel
Bel
t Pa
ram
eter
s
Feb.
201
1
Nov
. 201
1
Net
Cha
nge
Perc
enta
ge
Cha
nge
1 Average Channel Belt Width (in m) 279.72 372.12 92.40 33
Channel Belt Area 196.88 274.65 77.77 40
Channel Width (in m) 96.88 127.85 30.97 32
Sinuosity 2.04 2.10 0.07 3
Channel Area 74.06 97.19 23.14 31
Bar Area 122.61 177.39 54.78 45
Channel
Area/Channel Belt Area
0.38 0.35 -0.02 -6
Bar Area/Channel Belt Area 0.62 0.65 0.02 4
Bar Area/Channel Area 1.66 1.83 0.17 10
2 Average Channel Belt Width (in m) 387.91 230.18 -157.73 -41
Channel Belt Area 150.09 105.28 -44.81 -30
Channel Width (in m) 85.18 121.38 36.20 42
Sinuosity 1.28 1.45 0.17 14
Channel Area 34.38 57.23 22.85 66
Bar Area 116.02 48.27 -67.76 -58
Channel
Area/Channel Belt Area
0.23 0.54 0.31 137
Bar Area/Channel Belt Area 0.77 0.46 -0.31 -41
Bar Area/Channel Area 3.37 0.84 -2.53 -75

Geomorphic Effects of 2011 Floods on Channel Belt Parameters of Rapti River: A Remote Sensing and GIS Approach
(10)
3 Average Channel Belt Width (in m) 286.85 256.26 -30.59 -11
Channel Belt Area 269.41 269.77 0.36 0
Channel Width (in m) 82.40 109.77 27.36 33
Sinuosity 1.53 1.71 0.19 12
Channel Area 80.54 122.47 41.92 52
Bar Area 188.42 146.59 -41.83 -22
Channel
Area/Channel Belt Area
0.30 0.45 0.16 52
Bar Area/Channel Belt Area 0.70 0.54 -0.16 -22
Bar Area/Channel Area 2.34 1.20 -1.14 -49
4 Average Channel Belt Width (in m) 254.99 276.61 21.62 8
Channel Belt Area 235.55 197.00 -38.55 -16
Channel Width (in m) 86.90 124.32 37.43 43
Sinuosity 2.52 1.92 -0.59 -24
Channel Area 84.04 88.51 4.48 5
Bar Area 151.85 108.96 -42.89 -28
Channel
Area/Channel Belt Area
0.36 0.45 0.09 26
Bar Area/Channel Belt Area 0.64 0.55 -0.09 -14
Bar Area/Channel Area 1.81 1.23 -0.58 -32
5 Average Channel Belt Width (in m) 201.2 248.39 47.19 23
Channel Belt Area 225.01 142.42 -82.59 -37
Channel Width (in m) 76.54 125.96 49.42 65
Sinuosity 2.39 1.17 -1.22 -51
Channel Area 85.87 78.08 -7.79 -9
Bar Area 139.06 64.44 -74.62 -54
Channel Area/ Channel Belt Area 0.38 0.55 0.17 44
Bar Area/Channel Belt Area 0.62 0.45 -0.17 -27
Bar Area/Channel Area 1.62 0.83 -0.79 -49
6 Average Channel Belt Width (in m) 135.56 248.39 112.84 83
Channel Belt Area 72.43 72.94 0.51 1
Channel Width (in m) 62.29 86.45 24.16 39
Sinuosity 1.29 1.3 0.01 1
Channel Area 34.48 50.32 15.85 46
Bar Area 38.04 22.61 -15.44 -41
Channel
Area/Channel Belt Area
0.48 0.69 0.21 45
Bar Area/Channel Belt Area 0.53 0.31 -0.22 -41
Bar Area/Channel Area 1.1 0.45 -0.65 -59
Fig. 6: Channel belt area of Nov.2011 and Feb.2011 within the channel migration zone (CMZ).
E. Impact of 2011 Floods on Channel Belt
The channel belt parameters have been distinctively grouped into two broad categories: 1. Areal characteristics and 2. Linear characteristics of channel belt. Areal properties of channel belt include channel area, channel belt area, bar area, ratio of channel area to channel belt, ratio of bar area to channel belt area and ratio of bar area to channel area. Linear properties include sinuosity, average channel width and channel belt width (Table 3).
There is a positive association between sinuosity and channel belt area along reach 1, 3 and 6. The increasing sinuosity is related with the increase in channel belt area due to extension and translation of meander and lateral expansion of channel except along reach 2 where the bar area decreased by 58 per cent during post monsoon season (November 2011) (Figure 6). Further, the decreasing sinuosity is related with decrease in channel belt area due to avulsion of the channel associated with cutoffs formation resulting in shifting of the entire channel belt which further readjusts with the valley slope through local incision especially along reach-4 and 5. There is marginal increase in channel belt area along the stable reach-6 due to lateral expansion in the channel (Table 3). In the post-monsoon
Geomorphic Effects of 2011 Floods on Channel Belt Parameters of Rapti River: A Remote Sensing and GIS Approach
(11)
season, the lateral expansion caused an overall increase in channel area as well as channel width along the entire stretch due to significant erosion of mid channel bar, point bar and lateral bar of pre monsoon season (Feb.2011) and pre-existing point bar surface.
The increasing ratio of bar area to channel belt area and bar area to channel area demonstrate aggradation in reach 1 while decreasing ratio of these parameters reflect degradation in all remaining reaches (Table 3).
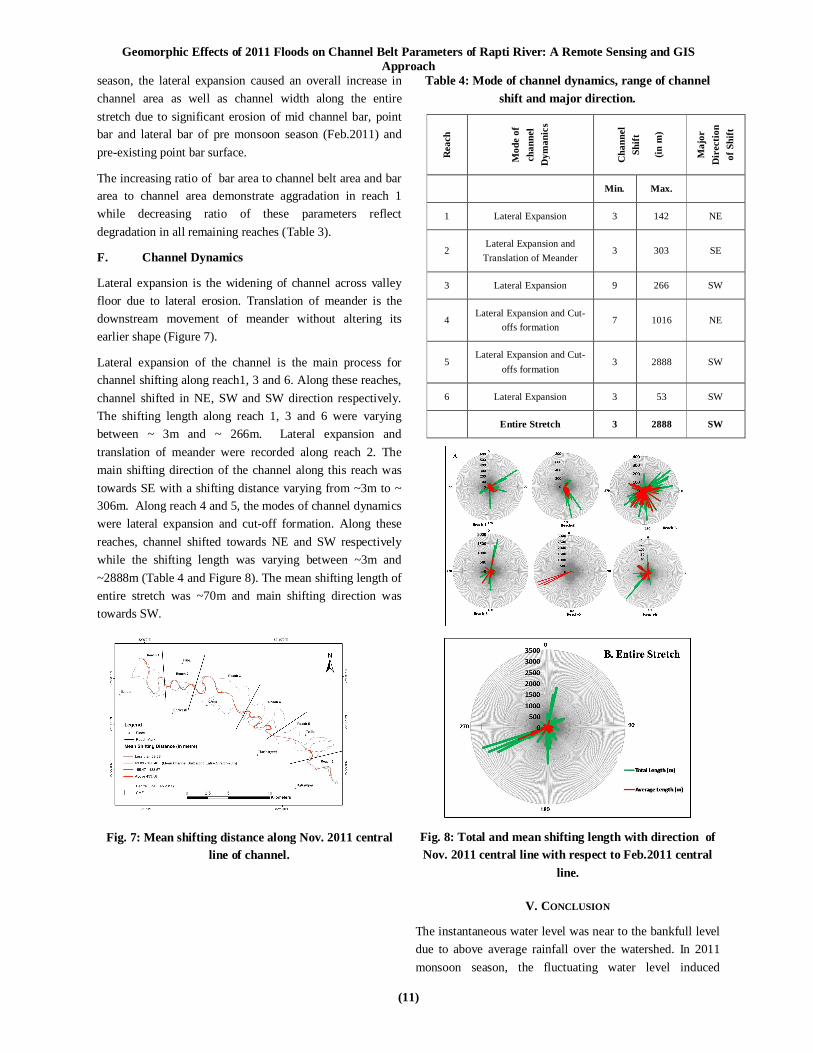
F. Channel Dynamics
Lateral expansion is the widening of channel across valley floor due to lateral erosion. Translation of meander is the downstream movement of meander without altering its earlier shape (Figure 7).
Lateral expansion of the channel is the main process for channel shifting along reach1, 3 and 6. Along these reaches, channel shifted in NE, SW and SW direction respectively. The shifting length along reach 1, 3 and 6 were varying between ~ 3m and ~ 266m. Lateral expansion and translation of meander were recorded along reach 2. The main shifting direction of the channel along this reach was towards SE with a shifting distance varying from ~3m to ~ 306m. Along reach 4 and 5, the modes of channel dynamics were lateral expansion and cut-off formation. Along these reaches, channel shifted towards NE and SW respectively while the shifting length was varying between ~3m and ~2888m (Table 4 and Figure 8). The mean shifting length of entire stretch was ~70m and main shifting direction was towards SW.
Fig. 7: Mean shifting distance along Nov. 2011 central line of channel.
Table 4: Mode of channel dynamics, range of channel shift and major direction.
Rea
ch
Mod
e of
ch
anne
l D
yman
ics
Cha
nnel
Sh
ift
(in m
)
Maj
or
Dir
ectio
n of
Shi
ft
Min. Max.
1 Lateral Expansion 3 142 NE
2 Lateral Expansion and
Translation of Meander 3 303 SE
3 Lateral Expansion 9 266 SW
4 Lateral Expansion and Cut-
offs formation 7 1016 NE
5 Lateral Expansion and Cut-
offs formation 3 2888 SW
6 Lateral Expansion 3 53 SW
Entire Stretch 3 2888 SW
Fig. 8: Total and mean shifting length with direction of Nov. 2011 central line with respect to Feb.2011 central
line.
V. CONCLUSION
The instantaneous water level was near to the bankfull level due to above average rainfall over the watershed. In 2011 monsoon season, the fluctuating water level induced

Geomorphic Effects of 2011 Floods on Channel Belt Parameters of Rapti River: A Remote Sensing and GIS Approach
(12)
instability in mixed stratified banks through rotational and block sliding processes which in turn caused changes in channel belt parameters. The main processes responsible for the channel dynamics were lateral expansion of channel, cut-offs formation and translation of meander. Overall effect of floods on channel was degradational as the proportion of bar area to channel belt area and channel area decreased significantly along all reaches except in reach 1. The overall shift in channel was ~70 m and main shifting direction was towards SW. This study can be very useful for engineers and planners to construct bridges and embankments across and along the channel respectively.
ACKNOWLEDGEMENTS
R.K. is highly thankful to Dr. Milap Chand Sharma and Prof. K.S.Sivasami (CSRD/JNU, New Delhi) who have been his mentors for last 10 years. He also extends his gratitude to Prof. Saumitra Mukherjee (SES, JNU, New Delhi) under whom he is currently working as a research scientist.
VI. REFERENCES
1. M.G. Wolman, and J.P. Miller, “Magnitude and Frequency of Forces in Geomorphic Processes”. J. Geol. 1960. 68. pp.54-74.
2. M.G. Wolman and R. Gerson, “Relative Scales of Time and Effectiveness of Climate in Watershed Geomorphology”. Earth Surf. Processes. 1978.3. pp.189-203.
3. R. Sinha. (et. al.), “Geomorphic Characterization and Diversity of the Fluvial Systems of the Gangetic Plains”. Geomorphology. 2005.70. pp. 207-225.
4. V.S.Kale, “Geomorphic Effectiveness of Extraordinary Floods on Three Large Rivers of the Indian Peninsula”. Geomorphology.2007. 85. pp.306-316.
5. I.B. Singh, “Geological Evolution of Ganga Plain-An Overview”. J.Palaeont. Soc. India. 1996. 41.pp.99-137.
6. P. Pati (et. al.), “Holocene Tectono-Geomorphic Evolution of Parts of the Upper and Middle Gangetic Plains, India”. Geomorphology. 2011. 128.pp.148-170.
7. R.P.Yadav, Floods in Eastern U.P. Delhi: Radha Publication, 1999, pp.19-28.
8. O.N. Dhar and Shobha Nandargi, “Hydrometeorological Apspects of Floods in India, Nat. Hazards.2003. 28. pp. 1-33.
9. K.L. Rao, India’s Water Wealth. New Delhi: Orient Longman Ltd., 1979, p.70.
10. B. L. Rhoads, “Stream Power Terminology”. The Professional Geographer. 1987. 39 (2). pp.189-195.
11. L.J. McEwen, “Channel Planform Adjustment and Stream Power Variations on the Middle. River Coe, Western Grampian Highlands, Scotland, Catena. 1994. 21. pp.357-374.
12. S.A.Schumm, “Plan Form of Alluvial Rivers”. Proceedings of the International Workshop on Fluvial River Problems held at Roorkee, India.March 1980.pp.4-21to 4-40.
13. R.A. Bagnold, “An Approach to the Sediment Transport Problem from General Physics”. United States Geological Survey Professional Papers. 1996.4221. pp. 37.
14. R. Kumar, Floods in the Lower Rapti River Basin: Occurrence, Causes and Management.Unpublished M.Phil Dissertation.2005. CSRD/JNU, New Delhi.
15. S. Chandra, Fluvial Landforms and Sediments in the North-Central Gangetic Plain, India. Unpublished Ph.D Thesis. Darwin College.1993. University of Cambridge, UK.
16. C.R. Thorne, “Bank Erosion and Meander Migration of the Red and Mississippi Rivers, USA”. Hydrology for the Water Management of Large River Basins, Proceedings of the Vienna Symposium, August 1991. IAHS Publication No.201. pp.301-313.
17. L.B. Leopold and M.G. Wolman, “River Channel Patterns: Braided, Meandering and Straight”. United States Geological Survey professional Paper 282-B. 1957.pp.39-85.
18. K.J. Gregory and D.E. Walling, Drainage Basin Forms and Processes: A Geomorphological Approach. London: Edward Arnold, 1973.p.261.
19. G.C.Nanson and J.C.Croke, “A Genetic Classification of Floodplains”. Geomorphology.1992.4.pp. 459-486.
20. R. Charlton, Fundamentals of Fluvial Geomorphology. London: Routledge.2008.
21. Robert V. Ruhe, Geomorphology: Geomorphic Processes and Surficial Geology, Houghton Mifflin Harcourt. 1975. pp.47-97
22. Dale F. Ritter, Process Geomorphology. United States: Wcb publishers.1978.pp.153-302.
23. Anonymous, Manual for National Geomorphological and Lineament Mapping on 1:50000 Scale. Hyderabad: GSI and ISRO. 2009. pp. 1-112.
24. C.K. Sharma, A Treaties on Water Resources in Nepal. Kathmandu. 1997.
25. R.S. Yeats et. al., “The Himalayan Frontal Fault System”. Annales Tectonicae. 1992. 6.pp.85-98.
26. S.A.Schumm, River Variability and Complexity. USA: Cambridge University Press.2005.p.30.
27. Rapp Cygnia F. and Abbe Timothy B., A Framework for Delineating Channel Migration Zones. Washington State, Department of Transportation, November 2003. http://www.ecy.wa.gov/biblio/0306027.html accessed on April 7, 2013.
28. W.C. Carey, “Formation of Flood Plain Lands”. Proc. A.S.C.E.J. Hyd.Div. HY3.1969. pp.981-984.