Geology, tectonics, and the 2002–2003 eruption of the Semeru volcano, Indonesia: Interpreted from...
44
Geology, tectonics, and the 2002–2003 eruption of the Semeru volcano, Indonesia: Interpreted from high-spatial resolution satellite imagery Solikhin Akhmad, Jean-Claude Thouret, Avijit Gupta, Andrew J.L. Har- ris, Soo Chin Liew PII: S0169-555X(11)00517-4 DOI: doi: 10.1016/j.geomorph.2011.10.001 Reference: GEOMOR 3773 To appear in: Geomorphology Received date: 29 March 2011 Revised date: 29 September 2011 Accepted date: 2 October 2011 Please cite this article as: Akhmad, Solikhin, Thouret, Jean-Claude, Gupta, Avijit, Harris, Andrew J.L., Liew, Soo Chin, Geology, tectonics, and the 2002–2003 eruption of the Semeru volcano, Indonesia: Interpreted from high-spatial resolution satellite imagery, Geomorphology (2011), doi: 10.1016/j.geomorph.2011.10.001 This is a PDF file of an unedited manuscript that has been accepted for publication. As a service to our customers we are providing this early version of the manuscript. The manuscript will undergo copyediting, typesetting, and review of the resulting proof before it is published in its final form. Please note that during the production process errors may be discovered which could affect the content, and all legal disclaimers that apply to the journal pertain.
Transcript of Geology, tectonics, and the 2002–2003 eruption of the Semeru volcano, Indonesia: Interpreted from...
�������� ����� ��
Geology, tectonics, and the 2002–2003 eruption of the Semeru volcano,Indonesia: Interpreted from high-spatial resolution satellite imagery
Solikhin Akhmad, Jean-Claude Thouret, Avijit Gupta, Andrew J.L. Har-ris, Soo Chin Liew
PII: S0169-555X(11)00517-4DOI: doi: 10.1016/j.geomorph.2011.10.001Reference: GEOMOR 3773
To appear in: Geomorphology
Received date: 29 March 2011Revised date: 29 September 2011Accepted date: 2 October 2011
Please cite this article as: Akhmad, Solikhin, Thouret, Jean-Claude, Gupta, Avijit,Harris, Andrew J.L., Liew, Soo Chin, Geology, tectonics, and the 2002–2003 eruption ofthe Semeru volcano, Indonesia: Interpreted from high-spatial resolution satellite imagery,Geomorphology (2011), doi: 10.1016/j.geomorph.2011.10.001
This is a PDF file of an unedited manuscript that has been accepted for publication.As a service to our customers we are providing this early version of the manuscript.The manuscript will undergo copyediting, typesetting, and review of the resulting proofbefore it is published in its final form. Please note that during the production processerrors may be discovered which could affect the content, and all legal disclaimers thatapply to the journal pertain.
ACC
EPTE
D M
ANU
SCR
IPT
ACCEPTED MANUSCRIPT
1
Geology, Tectonics, and the 2002-2003 Eruption of the Semeru Volcano, Indonesia:
Interpreted from High-Spatial Resolution Satellite Imagery
Solikhin Akhmad1, Jean-Claude Thouret
2*, Avijit Gupta
3, Andrew J.L. Harris
2, Soo
Chin Liew3
1 Center for Volcanology and Geological Hazard Mitigation, Jalan Diponegoro 57,
Bandung, Java, Indonesia
2* Clermont Université, Université Blaise Pascal, Laboratoire Magmas et Volcans, UMR
6524 CNRS et IRD R163, 5 rue Kessler, 63038 Clermont-Ferrand cedex, France
3 Centre for Remote Imaging, Sensing and Processing, National University of Singapore,
Lower Kent Ridge Road, 119076 Singapore
Shortened version: Geology of the Semeru volcano interpreted from High-Spatial
Resolution Satellite Imagery
Submitted to Geomorphology
* Corresponding author. Email address: [email protected]
ACC
EPTE
D M
ANU
SCR
IPT
ACCEPTED MANUSCRIPT
2
Abstract
The paper illustrates the application of high-spatial resolution satellite images in
interpreting volcanic structures and eruption impacts in the Tengger-Semeru massif in east
Java, Indonesia. We use high-spatial resolution images (IKONOS and SPOT 5) and aerial
photos in order to analyse the structures of Semeru volcano and map the deposits.
Geological and tectonic mapping is based on two DEMs and on the interpretation of aerial
photos and four SPOT and IKONOS optical satellite images acquired between 1996 and
2002. We also compared two thermal Surface Kinetic Temperature ASTER images before
and after the 2002-2003 eruption in order to delineate and evaluate the impacts of the
pyroclastic density currents. Semeru‟s principal structural features are probably due to the
tectonic setting of the volcano. A structural map of the Tengger-Semeru massif shows four
groups of faults orientated N40, N160, N75, and N105 to N140. Conspicuous structures,
such as the SE-trending horseshoe-shaped scar on Semeru‟s summit cone, coincide with
the N160-trending faults. The direction of minor scars on the east flank parallels the first
and second group of faults. The Semeru composite cone hosts the currently active
Jonggring-Seloko vent. This is located on, and buttressed against, the Mahameru edifice at
the head of a large scar that may reflect a failure plane at shallow depth. Dipping 35°
towards the SE, this failure plane may correspond to a weak basal layer of weathered
volcaniclastic rocks of Tertiary age. We suggest that the deformation pattern of Semeru
and its large scar may be induced by flank spreading over the weak basal layer of the
volcano. It is therefore necessary to consider the potential for flank and summit collapse in
the future. The last major eruption took place in December 2002 – January 2003, and
involved emplacement of block-and-ash flows. We have used the 2003 ASTER Surface
Kinetic Temperature image to map the 2002-2003 pyroclastic density current deposits. We
have also compared two 10 m-pixel images acquired before and after the event to describe
the extent and impact of an estimated volume of 5.45 x 10⁶ m
3 of block-and-ash flow
deposits. An ash-rich pyroclastic surge escaped from one of the valley-confined block-and
ash flows at 5 to 8 km distance from the crater and swept across the forest and tilled land
on the SW side of the Bang river Valley. Downvalley, the temperature of the pyroclastic
surge decreased and a mud-rich deposit coated the banks of the Bang river Valley. Thus,
hazard mitigation at Semeru should combine: (1) continuous monitoring of the eruptive
activity through an early-warning system, and (2) continuous remote sensing of the
ACC
EPTE
D M
ANU
SCR
IPT
ACCEPTED MANUSCRIPT
3
morphological changes in the drainage system due to the impact of frequent pyroclastic
density currents and lahars.
Key-words: IKONOS, SPOT5, ASTER TIR, Semeru volcano, tectonics, eruption.
1. INTRODUCTION
Remote sensing techniques provide the opportunity to study active and dangerous
volcanoes, allowing us to safely observe morphological and structural details over a large
area. This is particularly true for Semeru, an extremely active volcano in Indonesia, where
the access to the summit cone is difficult and dangerous. Standard remote sensing
techniques using high-spatial resolution images from IKONOS (1 m) and SPOT5 (2.5 m),
as well as thermal ASTER images thus offer a fruitful means with which to characterize
the volcano‟s structural features and to recognize the extent and effects of the eruptive
processes. Aerial photographs were also combined with satellite images for tracking the
morphological evolution of a persistently active volcano. This study illustrates the
application of such remote sensing techniques to define: (1) structures, faults and scars of
the edifice, (2) the evolution of a persistently active composite cone, and (3) the
emplacement of deposits from pyroclastic density currents and the morphological effects
of the 2002-2003 eruption.
Semeru volcano (8°06‟05”S, 112°55‟E) at 3676 m the highest mountain in Java, Indonesia,
is the southernmost edifice of the Semeru-Tengger volcanic massif (Fig. 1). The recent
composite cone of about 60 km3 (Thouret et al., 2007) has not been dated, but maybe Late
Pleistocene to Holocene in age. The twofold edifice (Mahameru and Young Semeru) has
been superimposed on, and buttressed to the N, by the Jambangan complex. To the S and
SE Semeru overlies weathered volcaniclastic sediments and lava flows of the Oligocene-
Miocene „Tuff and Old Andesite formation‟ (Sutawidjaja et al., 1996). Its ring plain below
400 m of about 1790 km2 supports more than one million people including the cities of
Lumajang (85,000 inhabitants) to the E and 600,000 people living in or near the city of
Malang to the W. The cone-shaped summit is bare and covered by tephra but the volcano
flanks are home to dense, evergreen forest between 900 and 2800 m in elevation. The
equatorial monsoon climate produces as much as 2,000 to 3,700 mm per year on the E and
SE flanks of Semeru whilst 200 mm of rain can fall in 24 hours every 5 years on average
(Siswowidjoyo et al., 1997).
ACC
EPTE
D M
ANU
SCR
IPT
ACCEPTED MANUSCRIPT
4
Semeru‟s eruptive activity has been recorded since 1818 and eruptions have been persistent
since 1967, probably even earlier. Its activity consists of vulcanian and phreatomagmatic
eruptions, which produce short-lived eruption columns several times a day (Thouret et al.,
2007). Strombolian eruptions also occur based on the presence of scoriae and bombs on the
upper slopes. Extrusion of lava domes take place during more intense eruptive episodes
that occur every 5 - 7 years. Pyroclastic flows occur once every five years on average,
mostly as block-and-ash flows. Block-and-ash flows triggered by dome collapse have
travelled as far as 12 km to the SE and S directions, following drainage networks (e.g. in
1994, 1995, and 2003). Lava flows from flank fissures or vents (e.g. in 1895 and 1941)
have also been recognized as far as 9 km from the summit on the SE flank. Semeru is
known as one of the most effective lahar producers on Earth (Lavigne and Thouret, 2002;
Thouret et al., 2007). Large-scale lahars exceeding 5 million m3 in volume have occurred
at least five times since 1884. During the rainy season, Semeru produces small to medium-
scale lahars (≤0.1 million m3) every week, which are triggered by the remobilization of
pyroclastic debris. Daily explosions deposit pyroclastic debris as far as 3 km from the vent
area.
Prior to 1999, SPOT‟s panchromatic band represented the highest spatial resolution
available at 10 m. These data had been shown of utility in identifying and mapping
volcanic products (e.g. Chorowicz et al., 1992). In 1999, IKONOS was launched and
provided 1 m panchromatic images of the Earth surface (e.g. Zanoni and Goward, 2003).
With the launch of Quick-Bird2 in 2001 (60 cm resolution) and of SPOT5 in 2002 (2.5 m
resolution), three very high-spatial-resolution satellite datasets were available for the
analysis of volcanic terrains and eruptive phenomena. However, a limited number of
studies with such a very high-spatial-resolution have examined the products of volcanic
eruptions (e.g., Mouginis-Mark and Garbeil, 2005; Joyce et al., 2009; Thouret et al., 2007;
2010; Miller et al., 2008).
This paper will (1) review the methods used in remote sensing and in mapping based on
DEMs, (2) describe the volcanic features of the Tengger-Semeru massif and of the Semeru
edifice, (3) analyse the tectonic setting of the Tengger-Semeru massif, (4) examine the
evolution of the Semeru summit cone since 1923, and (5) analyse the pyroclastic deposits
emplaced by the 2002-2003 eruption and their related effects.
ACC
EPTE
D M
ANU
SCR
IPT
ACCEPTED MANUSCRIPT
5
2. METHODOLOGY
This study is based on combined methods: remote sensing of optical and thermal
imagery, field observations and measurements, geologic mapping based on aerial photos,
DEM computing and analysis for interpreting landforms and structures, and 14
C of
charcoal for dating recent deposits.
The satellite images used in this study are: (1) five high-spatial resolution (1 m) IKONOS
satellite images dated 14-11-2002, 25-09-2004, 16-06-2006, 10-04-2008 and 20-08-2009;
(2) two SPOT5 images including one panchromatic (2.5 m) dated 24-10-2003 and one
multispectral (5 m) dated 26-07-2008; (3) one SPOT2 image (10 m) dated 11-05-1996 and
one SPOT1 scene (10 m) dated 08-08-1997, both at 10 m; and (4) three AST08 or ASTER
TIR Surface Kinetic Temperature products (90 m) dated 16-08-2002, 12-03-2003 and 25-
09-2005. These images have their technical specifications summarized in Table 1. The
procedure is based on visual image interpretation and on image processing techniques. The
images have been locally checked during field work and mapping carried out on the S and
SE flanks and the SE ring plain of the Semeru volcano. The IKONOS and SPOT images
were first used for mapping the structures and landforms of Semeru, and the tectonic
setting of the volcanic massif. The ASTER images were secondly used for tracking the
thermal anomalies linked to the deposits from the 2002-2003 eruption and for
mapping the impacts and changes in the S drainage of Semeru.
Aerial photographs used in this study were acquired during 1981, 1990, 2005 and 2008
aerial surveys. Furthermore, two Digital Elevation Models (DEMs) were also generated.
The first DEM was derived from the 30-m resolution Shuttle Radar Topography Mission
(SRTM), here called SRTM-DEM, and the second DEM from four quadrangles (Ranu
Pane, Senduro, Pronojiwo and Pasirian) digital maps (at a scale of 1:25,000 with a 12.5 m
contour interval). It is referred to as TOPO-DEM in the paper.
The IKONOS satellite is a high-resolution satellite operated by GeoEye, which collects
high-resolution images at 1 m (panchromatic) and 4 m (colour) spatial resolution. Its
capabilities include capturing a 3.2 m multispectral, Near-Infrared (NIR)/0.82 m
panchromatic spatial resolution at nadir. SPOT satellites have acquired images of the Earth
since 1986. Except for SPOT3 that stopped acquisition on November 1996, SPOT1, 2 and
4 formed a constellation, which was reinforced by the launching of SPOT5 in early 2002.
ACC
EPTE
D M
ANU
SCR
IPT
ACCEPTED MANUSCRIPT
6
SPOT satellites are designed to acquire images in such a way that the scenes acquired on
different dates can be compared with each other. The SPOT satellites (SPOT 1, 2, 4 and 5)
travel in a sun-synchronous orbit with 98.7° inclination at 832 km altitude, taking 26 days
to complete one orbital cycle. The orbital plane intersects the equatorial plane at two points
along a straight line known as the line of nodes. The SPOT satellites acquire data during
the day with a north-south descending path.
The Advanced Spaceborne Thermal Emission and Reflection Radiometer (ASTER) sensor
is part of NASA‟s Earth Observing System (EOS) Terra satellite platform, which was
launched on 18 December 1999 (Pieri and Abrams, 2004). ASTER allows multispectral
imaging at high to moderate spatial resolution (15– 90 m/pixel). The ASTER TIR Surface
Kinetic Temperature product is an on-demand ASTER product, generated from the five
thermal infrared (TIR) bands (acquired either during the day or night) within 8 and 12 µm
wavelength. It contains surface temperatures at 90 m spatial resolution for land areas only.
In this product, surface kinetic temperature is determined by applying Planck's Law using
the emissivity values from the Temperature-Emissivity Separation (TES) algorithm, which
uses atmospherically corrected ASTER Surface Radiance (TIR) data (Gillespie et al.,
1998). The TES algorithm first estimates emissivity in the TIR channels using the
Normalized Emissivity Method (NEM). These estimates are then used along with
Kirchoff's Law to account for the land-leaving TIR radiance that is due to sky irradiance.
This result is subtracted from TIR radiance iteratively to estimate the emitted radiance
from which temperature is calculated using the NEM module.
Processing of the images is required to improve their quality and the interpretation of the
content of the image digital data. Several processing functions have been applied to the
images, such as contrast stretching, filtering and band-ratio using the ENVI 4.7 software in
order to enhance contrasts between features. Band ratio between Near-Infra-red (NIR) and
Red Bands and the Normalized Difference Vegetation Index (NDVI = (NIR - Red)/(NIR +
Red)) are especially used on IKONOS and SPOT images to enhance contrasts between
vegetation and rocks or deposits, as well as to reduce the variation of topographic
illumination. Most common enhancement, contrast stretching, was applied to produce
sharper and clearer images. This expands the range of DN values to the full limits
determined by byte size in the digital data. In order to enhance contrasts locally in the
spatial domain, spatial filtering with a non-directional filter was applied to some images.
ACC
EPTE
D M
ANU
SCR
IPT
ACCEPTED MANUSCRIPT
7
This technique explores the distribution of pixels of varying brightness across an image. It
is especially good at detecting and sharpening boundary discontinuities between adjacent
pixels.
We have thus used seven sets of images and aerial photographs (1981, 1990, 1996, 2002,
2003, 2004 and 2008) spread over 27 years, as a time series to track the evolution of the
Semeru‟s summit cone. A long scar open to the SE and radial valleys on the S and SE
flanks was especially observed. Geo-referencing from satellite images or geo-referencing
based on Global Positioning System (GPS) Ground Control Points (GCP) was used so that
the images can be directly compared with each other.
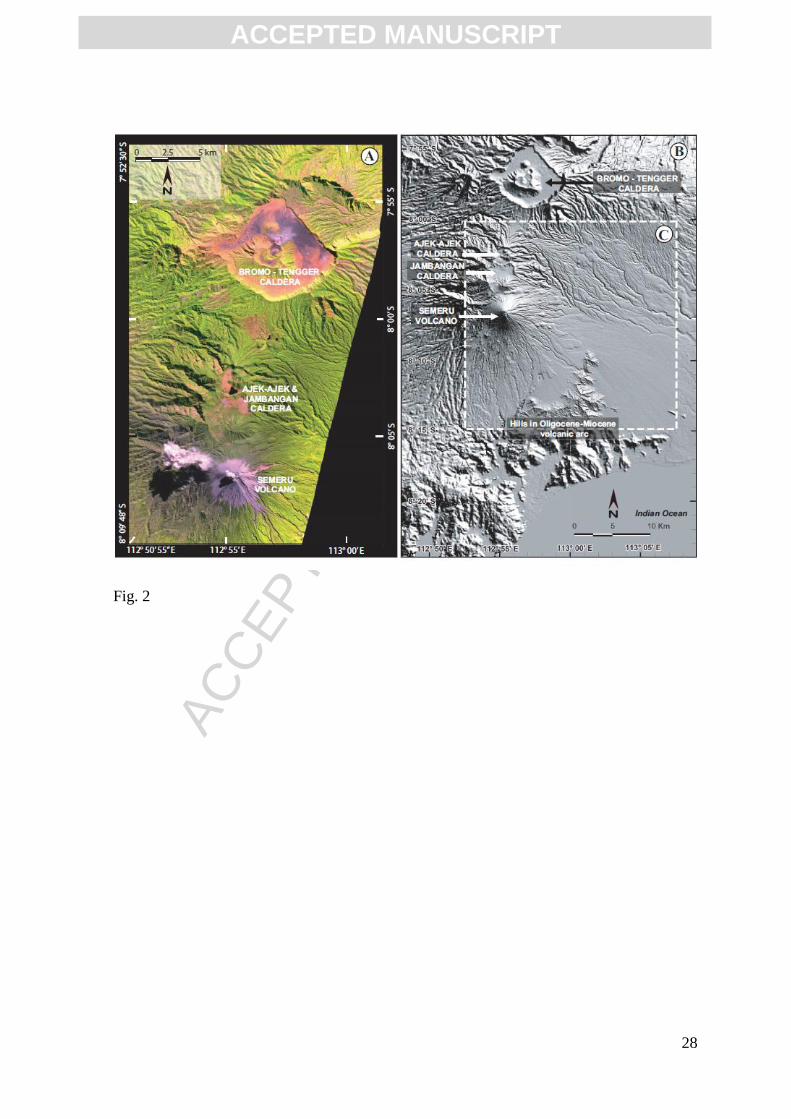
3. VOLCANIC FEATURES OF THE MASSIF AND OF THE EDIFICE
The main geological features of the Semeru-Tengger massif are presented, based on the
combined 2008 SPOT5 image (Fig. 2A) and the shaded relief SRTM-DEM (Fig. 2B) at a
regional scale. The analysis of the Semeru composite cone and its ring plain is based on the
enhanced TOPO-DEM (box area in Fig. 2C) and on the high-spatial resolution images.
The Semeru-Tengger volcanic massif with an area of about 900 km2
comprises a cluster of
calderas and strato-cones including, from north to south: the Bromo-Tengger (7.942°S,
112.95°E), Jambangan (8.065°S, 112.92°E) and Ajek-Ajek (8.042°S, 112.92°E) calderas;
the Mt. Kepolo (Fig. 1A and 3B) (8.077°S, 112.92°E) lava cone; and the composite cone
of Mt. Mahameru-Semeru. The calderas have formed and the edifices have grown over a
deeply eroded volcanic arc of Oligocene-Miocene age in south Java. The eruptive centres
of the Semeru-Tengger massif lie on a roughly north-south-trending direction, slightly
concave towards the east, which continues northward to Lake Grati (Fig. 1B), a maar at the
foot of the Tengger massif (Van Bemmelen, 1949; Situmorang, 1989; Carn et al., 1999;
Sutawidjaja et al., 1996).
The 16-km -wide Bromo-Tengger caldera in eastern Java is located at the north of the
volcanic massif and at the other end from Semeru volcano. The massive Tengger volcanic
complex consists of five overlapping composite volcanoes, each truncated by a caldera.
The most recent is the 9 x 10 km-wide Sandsea caldera, which formed incrementally
during the late Pleistocene and early Holocene (>45 ka and ca. 33 ka: Mulyadi, 1992). An
overlapping cluster of post-caldera cones was constructed on the floor of the „Sandsea‟
caldera (V in Fig. 3A) within the past several thousand years. The youngest of these is the
ACC
EPTE
D M
ANU
SCR
IPT
ACCEPTED MANUSCRIPT
8
Bromo tuff cone (Fig. 3B), one of Java's most frequently visited and most active
volcanoes, whose eruptive activity resumed on 26th November 2010. More than 50 mild-
to-moderate explosive eruptions have occurred since 1804, as recorded in the Global
Volcanic Network (GVN) data base and by Sjarifudin (1990). South of Tengger the older,
nested Jambangan and Ajek-Ajek calderas (VI and VII in Fig. 3B), which are open to the
east, are thought to have produced debris avalanches, which may or may not have been
accompanied by an eruption (Carn, 1999). No hummock related to debris-avalanche
deposits has been observed on the eastern flank of these calderas but we have identified at
least two parasitic lava or tephra cones in the area in the SPOT image and the DEM.
Several intra-caldera vents were formed, including the deep crater lake of Ranu Kumbolo
(8 in Fig. 3B) that may indicate the presence of a third eruption vent from the Ajek Ajek
caldera. The Holocene Mt. Kepolo strato-cone (9 in Fig. 3B), located near the southern rim
of Jambangan caldera, is aligned up N-S with a youthful lava cone and lava flow at the foot
of the Semeru‟s north flank. The NE-trending eruption centers form an oblique, low angle
alignment and are cut by NNE-oriented faults. Both are offset by NW-trending faults that
cut through the two groups of nested calderas: Tengger with Ngadisari and Jambangan
with Ajek-Ajek.
Although thick vegetation mantles large areas of the massif, the combined 2008 SPOT5
image (Fig. 2A) and the shaded relief SRTM-DEM (Fig. 2B) enables us to visualize the
topography and interpret the geology and landforms of the Semeru-Tengger massif on a
regional scale. The better spatial resolution TOPO-DEM (box area in Fig. 2C) highlights
the topography and morphology of the Semeru composite cone and its ring plain.
Semeru, the youngest volcano in this volcanic massif, hosts the currently active Jongring-
Seloko vent, and has been built on, and is buttressed against the Mahameru (or old
Semeru) to the West, and against the Jambangan caldera to the North. To the south and
south-east, Semeru‟s eruptive deposits and associated lahars rest against extensive outcrops
of the Oligocene-Miocene „Tuff and Old Andesite formation‟ (Sutawidjaja et al., 1996;
Thouret et al., 2007). We suggest that the boundary between Semeru deposits and the
outcrops of the Oligocene-Miocene „Tuff and Old Andesite formation‟ to the east and
south of Semeru is a reverse fault formed by compression and uplift linked to the
subduction process south of the volcano. This sharp boundary may also be interpreted as a
thrust fault overriding the Tertiary formation towards the SE as a response to lateral
spreading of the south flank of Semeru. Several NW-trending faults can be inferred from
ACC
EPTE
D M
ANU
SCR
IPT
ACCEPTED MANUSCRIPT
9
the 2008 SPOT5 image on the east and southeast flanks, whereas on the south and west
flanks the orientation of the faults shifts to NE (Fig. 4).
We divided Semeru into four parts based on geologic and geomorphological criteria and on
the visual interpretation of landforms and deposits: (1) the cone-shaped summit covered by
thick tephra fallout above about 2500 m, (2) the steep flanks between 2500 m and 900 m,
(3) the volcaniclastic fans between 900 and 400 m, and (4) the ring plain below 400 m.
(Sutawidjaja et al., 1996, Thouret et al., 2007). Overlying the large Late Pleistocene „old‟
Semeru (Mahameru) composite volcano, the bulk of the „young‟ Semeru cone (about 60
km3 of mafic medium-K andesites with 55-57wt% SiO2) is probably Holocene in age
(Sutawidjaja et al., 1996). Volcanic deposits of Mahameru-Semeru consist of lava flows,
pyroclastic-flow deposits and tephra-fall deposits, debris-avalanche, and lahar deposits
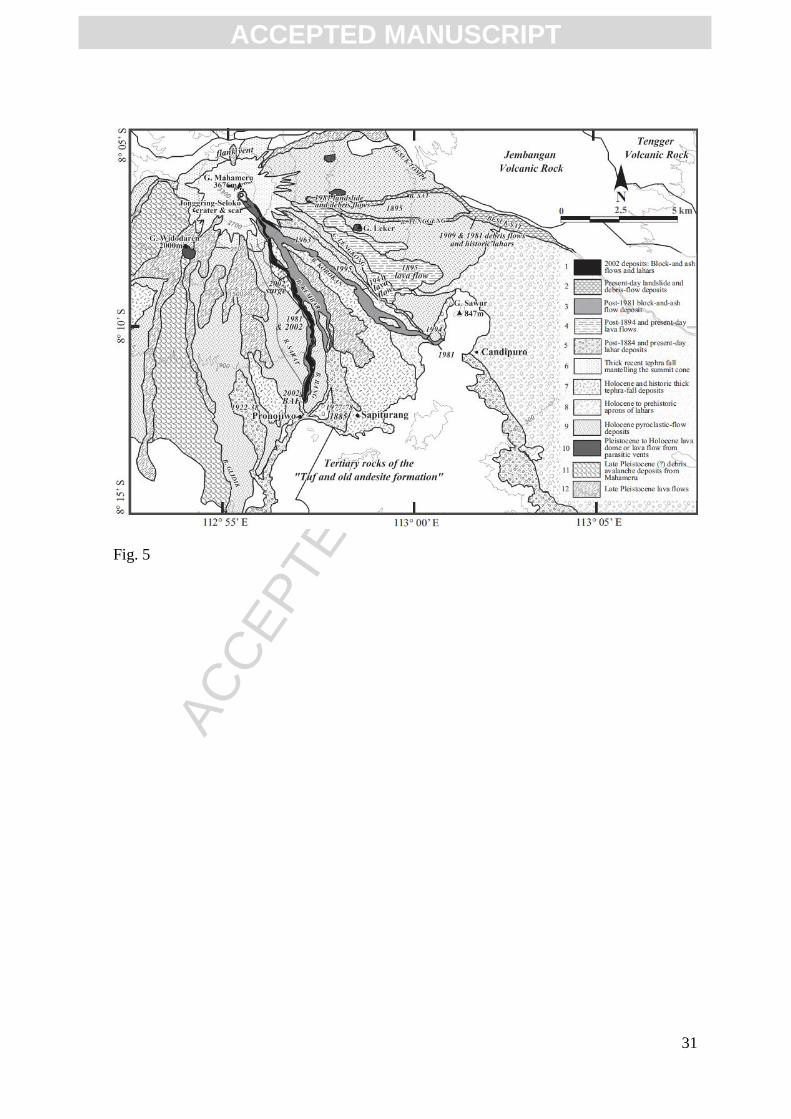
(Fig. 5). Based on our 14
C dating and on chronicles, the volcaniclastic deposits in the radial
valleys of the S and SE flanks of Semeru are middle-Late Holocene and historical. The
radial valleys such as Koboan and Lengkong Rivers contain up to three terrace systems,
the highest 8-10 m thick, the second ca.5 m thick, and the lowest 2-3 m thick. We have
used the 14
C method to date volcanic deposits forming the terraces. The pyroclastic-flow
units forming the base of the uppermost terrace <10 m thick in the Bang River Valley near
Pronojiwo yield 14
C ages of 1500 ± 30 yr BP (Gif-12358/SacA-11577 : ∂13
C=-30‰), i.e
1351-1406 cal BP (with 95.2% confidence interval). The youngest age indicates an
eruption during the 6th
or 7th
Century AD. The pyroclastic-flow units forming the top of the
uppermost terrace 10 m thick in the Lengkong Valley yield 3770 ± 40 yr 14
C BP (Gif
12290, ∂13
C=-26.39‰), i.e 3986-4283 cal yr BP (with 95.2% confidence interval). In these
valleys, while the middle terrace is ca.5 m thick and has a mid- to Late Holocene age, the
lower terrace is 2-3 m thick and is historical in age (<2000 years).
Our geologic map (Fig. 5) depicts the historic and present-day deposits of Semeru‟s
composite cone and ring plain based on previous works (see references in Thouret et al.,
2007) and on our interpretation of satellite images, aerial photos, and on fieldwork. The
prehistoric activity of Semeru is poorly known, the oldest reported eruption dating back to
just 1818 (references in Thouret et al., 2007). The current active period began in 1967
(Simkin and Siebert, 1994; Wahyudin, 1991). Since 1967, cycles of dome growth and
collapse have occurred every 5 to 7 years in the Jonggring-Seloko crater, feeding
pyroclastic flows that travelled up to 12 km along the SE-trending scar and then the
ACC
EPTE
D M
ANU
SCR
IPT
ACCEPTED MANUSCRIPT
10
drainage network towards the SE formed by the Kembar-Bang and Koboan-Lengkong
Rivers and their tributaries. The last major pyroclastic-flow producing eruption occurred in
December 2002 to January 2003. On 30th December 2002, pyroclastic flows travelled 12
km down the Kembar and Bang Valleys (GVN, 2003, 2004, and unpublished VSI reports,
Bandung).
4. REGIONAL TECTONIC SETTING OF THE SEMERU-TENGGER MASSIF
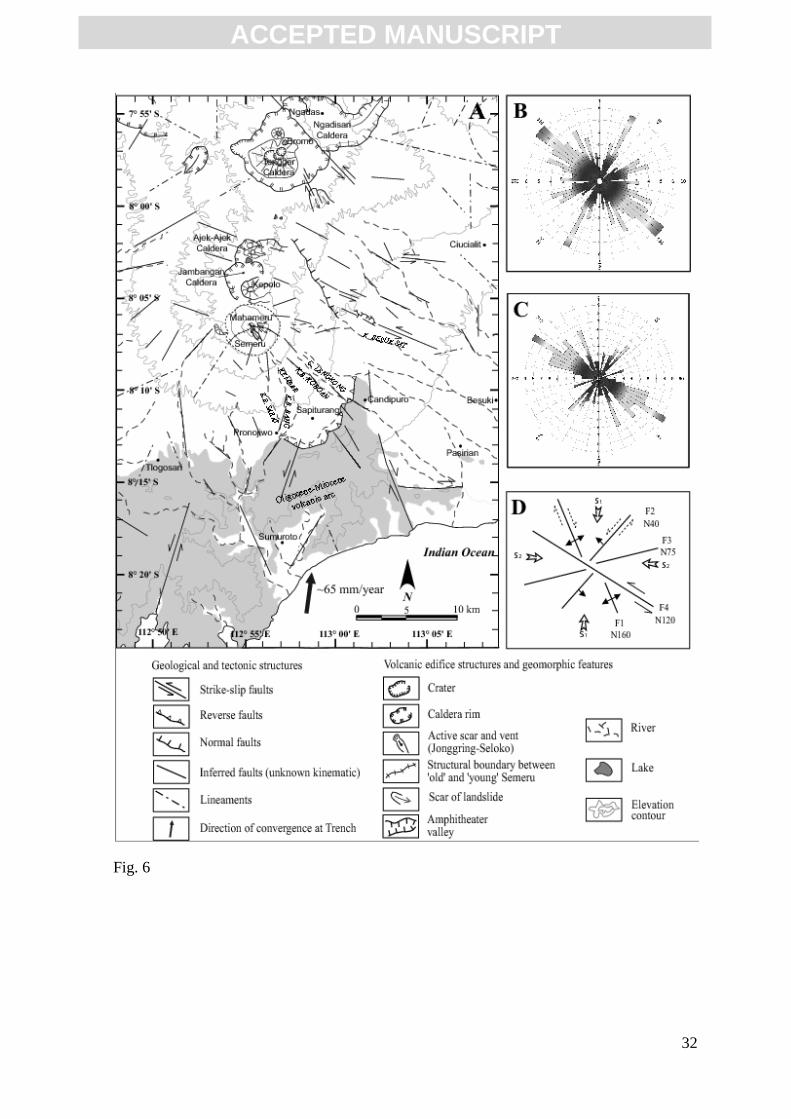
Our structural map of Semeru-Tengger volcanic massif (Fig. 6A) is based on the
interpretation of our SRTM-DEM and TOPO-DEM as well as of optical satellite images
combined with the drainage network map. This map shows the relationships between the
regional tectonic setting and the principal structures of the edifices. To obtain a map of
geological structures from satellite imagery, we specify the geometric features at surface
that reflects the topography, which is controlled by tectonic and deformation associated
with the growth structure. The most useful tool with which to recognize cumulative
deformations consists of two merged DEMs that highlight topographic variations. SRTM
and TOPO DEMs are automatically overlaid by using georeferenced mosaicing procedure
on ENVI software.
A rose diagram of lineaments and faults and a sketch portraying fault kinematics
summarize the regional tectonic setting of the massif (Fig. 6A-C). Widespread and thick
vegetation prevented many of these faults from being identified in the field. The linear
features comprise long, rectilinear topographic alignments and sudden, systematic changes
in river directions. The rose diagram of all identified linear topographic segments (Fig. 6B)
shows a prevailing NW-SE trend. Based on the second rose diagram (Fig. 6C) in which
only the long (>1 km), rectilinear topographic segments have been selected, we have
identified four groups of faults F1 to F4: (F1) a N40-trending group corresponding to
sinistral strike-slip faults observed on the S and the SW flank and ring plain of Semeru as
well as in the „old‟ (Oligocene-Miocene) volcaniclastic rocks; (F2) a N160-trending group
matching the dextral strike-slip fault in the Tertiary volcanic deposit area SE and S of
Semeru (NNW-SSE trending features on the eastern part of Semeru and a NW-SE sinistral
strike-slip fault delineate the northern limit of pyroclastic deposits from Semeru, as
deduced from the texture of these deposits on the images); (F3) a N75 group containing the
faults that guide the E and NNE alignments of the Tengger post-caldera vents ; and (F4)
the last group of N105 to N140 faults with a prevailing trend of N120, occurring on the
ACC
EPTE
D M
ANU
SCR
IPT
ACCEPTED MANUSCRIPT
11
western side of the Semeru-Tengger volcanic massif. Several amphitheaters caused by
flank erosion and open to the west are probably controlled by these NW-SE trending faults.
The fourth group of faults offsets faults of other groups, and is obviously the youngest.
Our working hypothesis on the fault kinematics and, hence, the tectonic fault regime is
summarized in Fig. 6D. The structural map of the Semeru-Tengger volcanic massif shows
that the southern area is dominated by the NNE-SSW compressional stress regime due to
subduction process at the trench <50 km to the south. This produces the first and second
groups of faults. The third group, located in the north sector, shares the same direction as
the Madura basin and magmatic intrusions from older (Pleistocene) volcanoes such as
Jambangan.
5. STRUCTURES AND EVOLUTION OF THE SEMERU SUMMIT CONE
Based on two IKONOS images and on the TOPO-DEM, we analyse the structural
features of the Semeru composite cone, which lead us to highlight the relationships
between deformations and the structural edifice growth. The evolution of the summit cone
and its SE-trending scar stems from the comparison of a time series of drawings and
photographs since 1923, completed by satellite images since 2003.
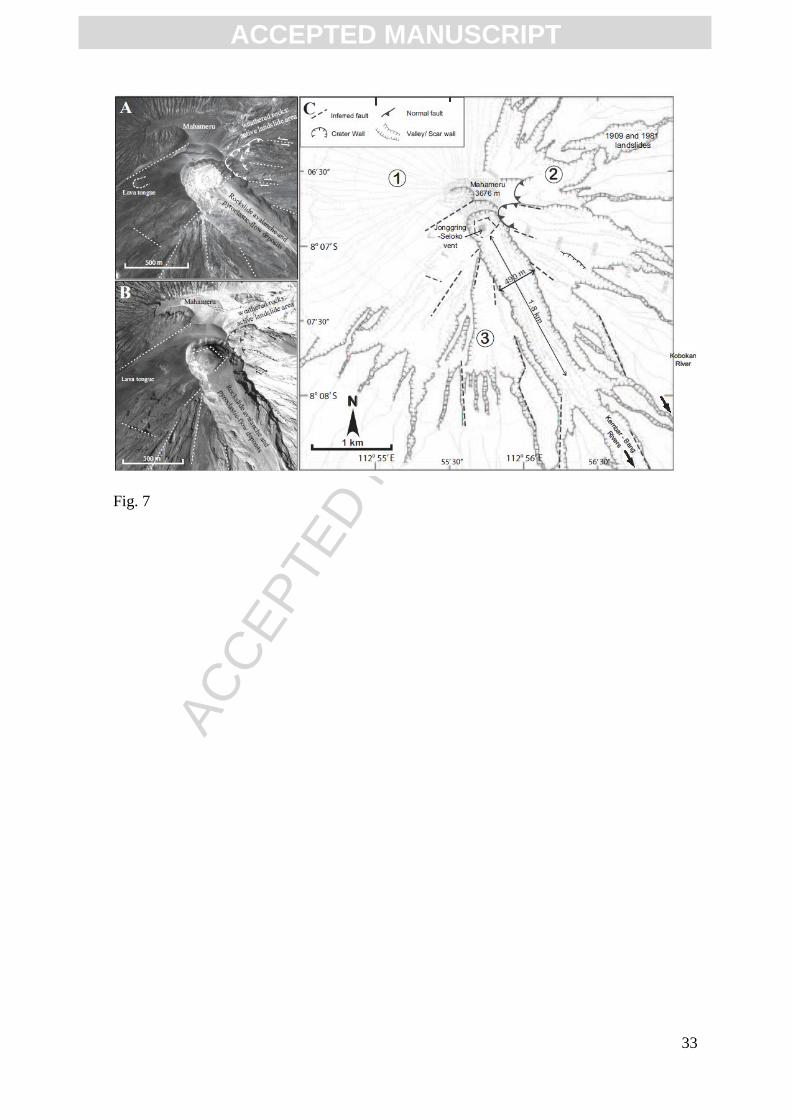
5.1. Structures and landforms
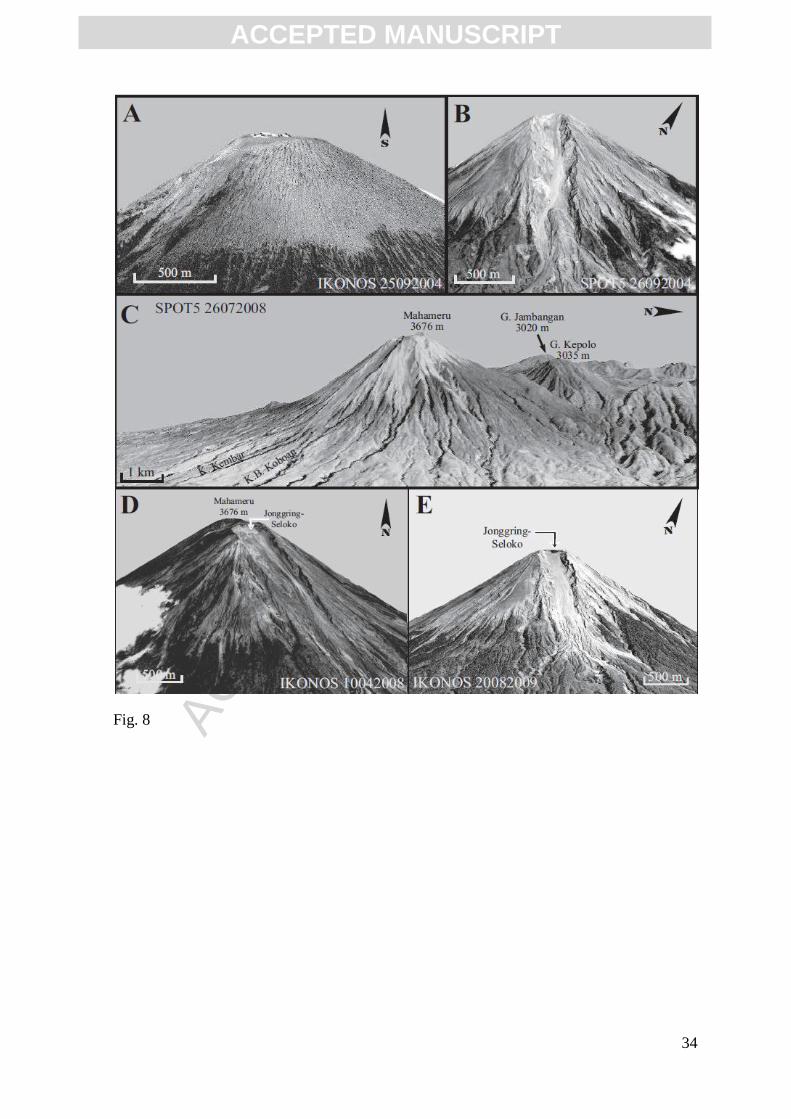
The 10th April 2008 and 20th August 2009 IKONOS images (Figs. 7A-C) show the
Mahameru summit area, Semeru‟s active Jonggring-Seloko vent in the youngest SE crater,
and a SE-trending scar. Based on the interpretation of both IKONOS images (Fig. 7C), we
divide the summit of the Semeru composite cone into three zones:
(1) The Semeru summit cone has grown on the older edifice of Mahameru. A structural
boundary is indicated between „old‟ Semeru (Mahameru) and „young‟ Semeru (Jonggring-
Seloko). Together these edifices have formed the Semeru composite volcano. The north to
southwest part of the Mahameru cone and the northwest slope of the Semeru summit cone
are covered by thick tephra fallout. The Mahameru summit area shows three arcuate
scarps, probably vent rims, suggesting that vents have migrated from NW to SE (Thouret
et al., 2007). The three crater rims are located at the intersection of the N40-, N70- and
N130-trending fractures.

ACC
EPTE
D M
ANU
SCR
IPT
ACCEPTED MANUSCRIPT
12
(2) The upper northeastern flank of the summit cone appears more weathered, comprising
reddish brown, unconsolidated deposits. To the NE of Jonggring-Seloko are the scars of
the 1909 and 1981 landslides and gullies. These form the catchment headwall of the Besuk
Sat river valley. These landslides are still active today. The 2008 and 2009 IKONOS
images (Fig. 7 A, B) and SPOT5 image (Fig. 8C) show landslides and gullies that cut in
reddish brown deposits high on the NE flank. We suggest that the unconsolidated,
weathered deposits are related to a previously active hydrothermal system beneath this
area.
(3) The southwestern to east part of the young Semeru cone (Fig. 8D, E) is fractured and
deeply cut by a dense network of gullies. The summit area consists of thick ash layers that
cover lava flows, which crop out outside the crater and scar area. The Jonggring-Seloko
crater, 500 m SE from Mahameru summit, reportedly initiated in 1913 (Van Padang,
1951). The 2008 and 2009 IKONOS images (Figs. 7A, B) display the hexagonal shape of
the vent area, a shape guided by N60-75 and N150-160-trending fractures. The stratigraphy
of the active crater wall consists of a ≤500 m-thick pile of lava flows with intercalated
pyroclastic-fall and flow deposits. To the west of Jonggring-Seloko crater, a lava tongue
from a lateral flank eruption is possibly linked to one of lava flows cropping out in the
crater wall. To the south of the vent, a lava flow is found that originates from the crater
itself. The recent active vent sits at the top of the principal SE-trending scar that cuts the
steep-sided SE flank of the edifice. This elongated horseshoe-shaped scar, about 1.8 km
long and 490 m at its widest point, channels rock-falls and pyroclastic flows during phases
of heightened activity. The orientation of the scar coincides with a N160-trending fault,
which is related to the second group of faults (Fig. 6). Minor scars cutting the west flank
are probably controlled by NW and NNE-trending faults or the first and second group of
faults.
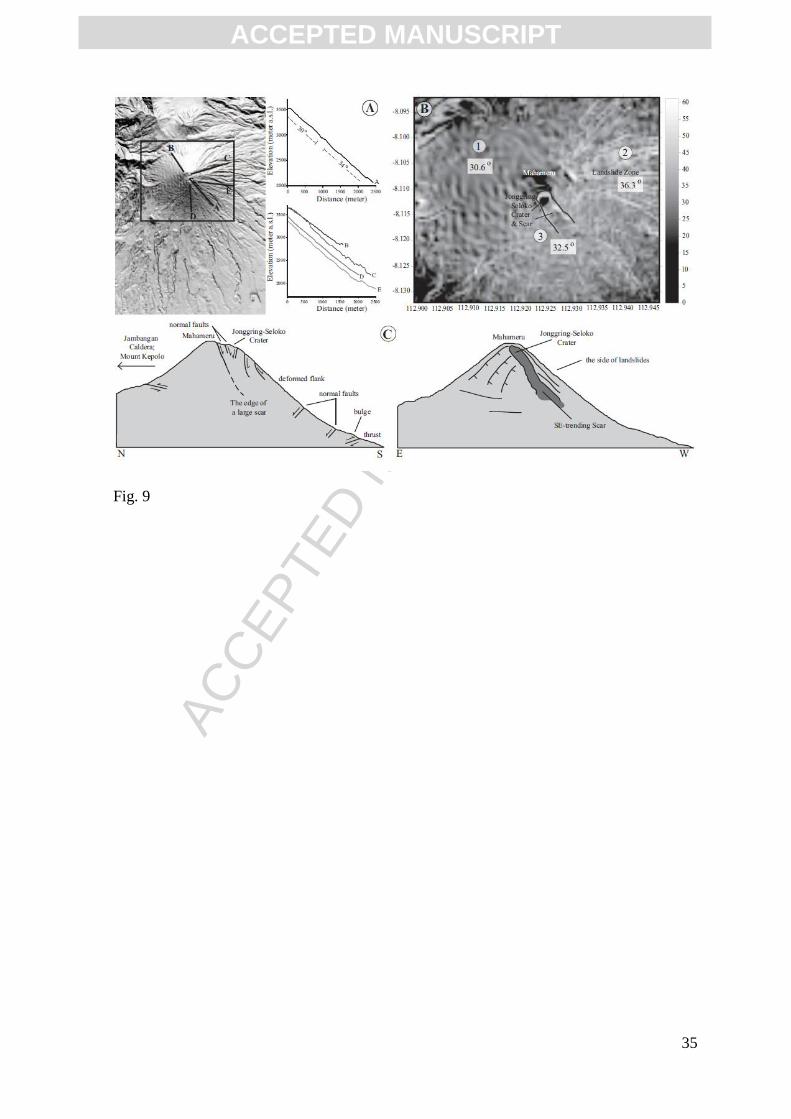
Our flank profiles of Semeru‟s summit cone are extracted from the TOPO-DEM (Fig. 9A)
and show the slope and morphology of three zones. The slope map of the Semeru summit
cone between 1800 and 3500 m (Fig. 9B) shows average slopes of 30.6° for the WNW
flank, 36.3° for the S flank, and 32.5° for the E flank. While no significant convexity is
observed in the WNW flank, the S zone and E flanks show convex-concave profiles that
suggest deformation of these flanks. The difference in slope segments and convexity in
profiles may be due to material eroded from the elongated SE-trending scar, which
ACC
EPTE
D M
ANU
SCR
IPT
ACCEPTED MANUSCRIPT
13
accumulates mid-slope on the SE flank between 1500 and 2000 m. Slope segment and
profile differences observed on the S and SE flanks are linked to normal faults mid-slope,
and thrust faults are inferred to be the influence at the base of the summit cone flank (Fig.
9B). These structures suggest that deformation has resulted from the structural growth of
the Semeru edifice. The Semeru composite cone has been built on, and is buttressed
against, the Mahameru edifice along a structural unconformity. This unconformity
probably acts as a semi-circular failure plane (Fig. 9C) but no geophysical data are
available to allow us test this hypothesis. Inferred structures such as a bulge and thrust
faults at the base of the SE summit cone flank (Fig. 9C) can also result from flank
spreading of the weak-cored volcano with asymmetric deformation (e.g. Cechi et al.,
2004). Factors that could induce volcano spreading are a weak basal layer and a
sufficiently high mass and magma influx (Borgia, 1994). A weak basal layer is known at
Semeru. Reddish brown, weathered deposits seen in the 2008 IKONOS image crop out in
the vicinity of the volcaniclastic sediment of Tertiary age (below 1000 m asl. in the
Koboan Valley on the SE flank, Figs. 4, 5). Because repeated daily explosions eject
magma from an open conduit at short time intervals (Nishi et al., 2007; Iguchi et al., 2008),
and because Semeru has a relatively shallow, narrow and pressurized conduit, the magma
influx and mass may be large enough to induce significant deformation especially in the
summit cone of the edifice.
5.2. Evolution of the summit area: elongated SE-trending scar and deep vent
A series of drawings and photographs show the morphological changes observed on the
Semeru‟s summit since 1923 (Fig. 10). The evolution of Semeru‟s summit resulted from a
combination of eruption processes: growth and collapse of domes in the Jonggring-Seloko
vent area, dome collapse-driven pyroclastic flows, and dome growth- or gravity-driven
rockslides. Between the intervals of heightened eruptive activity, the vent area remains
open with a crater up to 400 m in width and at least 200 m in depth. High vulcanian
columns or violent strombolian activity produces persistent tephra fallout. Figure 11B
shows the morphological evolution of the Jonggring-Seloko vent area and the SE-trending
scar. Although two aerial photos (1981 and 1990) and two satellite images only are shown
in Fig. 11A, the resulting map in Fig. 11B results from the interpretation of the two aerial
photos and all SPOT5 and IKONOS satellite images available between 2003 and 2009.
Two main scarps are located to the east and the west of the Jonggring-Seloko crater. To the
ACC
EPTE
D M
ANU
SCR
IPT
ACCEPTED MANUSCRIPT
14
west is the remnant of an older crater, which has been modified by a landslide, and to the
east is a landslide scar where weathered rocks have been removed. The crater has enlarged
by about 100 m from 1981 to 1990, up to a scarp towards the north, as shown on the 1981
aerial photograph (Fig. 11). This scarp results from a large collapse within the crater
formerly occupied by a lava dome. From 1990 to 2009, the crater has also expanded but
only by a few meters to reach a width of 400 m by 2009. The crater was filled by a lava
dome in 1981 but it re-opened in 1990 with a deeper vent conduit. The 1990 aerial
photograph shows that the Jonggring-Seloko crater at the base of its headwall was roughly
200 m deep at that point, comparable to the depth of the 2009 vent.
According to a 1923 aerial photograph, the SE-trending scar was not yet established
although a small channel may have been concealed between two lava flows. In 1963,
pyroclastic-flow deposits along the Besuk Semut Valley on the SE flank were the result of
dome collapse. After 1977, the summit has been eroded and a horseshoe-shaped
amphitheater valley was formed, which acted as a channel for eruption-related flows. In
1994, this structure extended downstream and into three river heads: Besuk Kembar and
Besuk Bang towards the south and Besuk Koboan toward the SSE (Figs. 4, 5). This SE
course was used again on 3rd February 1994 and 20th July 1995 by large (5-7 million m3
each) pyroclastic flows, which were channeled 11.5 km and 9.5 km, along the Koboan
Valley and in the upper course of Lengkong Valley respectively (Figs. 4, 5). On 29th
December 2002, pyroclastic flows were channeled along the principal SE-trending scar
towards the Bang and Kembar Valleys and traveled 11 km to the south as far as Supit, a
suburb of the district capital Pronojiwo.
The persistent eruptive activity of Semeru that began in 1967 started with continuous
emission of gas from a vent in the southern part of the Jenggring-Seloko crater. This was
followed by lava extrusion which formed a stream-like lava flow that moved towards the
south slope. Eruptive activity continued until 1974 and was characterized by extrusion of
lava, which created a lava dome that grew in the west and south area of the summit. The
extrusion later shifted to the SE but remained in the summit area. This eruptive activity
was accompanied by ash-producing explosions, lava avalanches, and block-and-ash flows
that widened the SE-trending channel. Since 1979, the rate of dome growth decreased, but
the activity continued with lava avalanches from the dome, occurrence of dome collapse-
driven block-and-ash flows, and explosions (GVN, 1980).
ACC
EPTE
D M
ANU
SCR
IPT
ACCEPTED MANUSCRIPT
15
After 1979, the SE-trending principal scar widened rapidly. The 1981 and 1990 aerial
photographs (Fig. 11) show the SE-trending wide scar from the upstream crater rim at
c.3300 m descending to c.2600 m, over a distance of more than 1.5 km. The scar narrowed
through the upper course of the Kembar River Valley, partly branching into the Koboan
River. The maximum scar width in 1981 was about 290 m and 350 m in 1990. The
eruptive 1994 activity resulted in extension of the scar downvalley, and it extended into the
Bang River Valley. The scar width of about 490 m at its widest point in 2009 is almost
twice the 1981 width (about 290 m). The SE-trending scar has thus expanded at a rate of
about 8 m/year over the period 1981-2009. Such an evolutionary history is difficult to
reconstruct for a dangerous volcano without satellite images.
6. THE MOST RECENT 2002-2003 (VEI 2-3) ERUPTION
Semeru is one of the few persistently active composite volcanoes on Earth erupting on
a daily basis. Based on chronicles, Thouret et al. (2007) identified three eruptive styles for
Semeru since 1818: (1) persistent vulcanian and phreatomagmatic regime of short-lived
eruption columns, which occur several times a day; (2) increased activity levels every five
to seven years to produce pyroclastic density currents (block-and-ash flows, and associated
surges) from domes growing in the Jonggring-Seloko vent; and (3) flank lava flows of
andesitic composition and aa type, stem from from parasitic lava cones and flank eruptive
vents and reached 5 to 8 km in length on the S and SE flanks (Fig. 5). The two most recent
lava flows of Semeru were emplaced on the SE flank: the 1895 lava flow reached c.10.5
km from the Jonggring Seloko vent area, covering an area of ~7 km2, whilst the 1941-1942
lava flow from a parasitic lava cone reached c.6.5 km and covered an area of ~2.5 km2.
Seven to eight years after the two 1994 and 1995 explosive episodes the eruptive activity
moved towards the second eruptive style, characterized by a high number of explosions
and pyroclastic flows at the end of December 2002 (GVN, 2002). The peak of the eruptive
episode occurred on 29th December 2002 when block-and-ash flows with a total volume of
3.5 to 5 million m3 traveled ~11 km from the summit down the Besuk Bang Valley. About
500 people were evacuated from the hamlet of Supit to the district capital Pronojiwo for
about one week but no casualties were recorded.
The 2002-2003 activity, as summarized in Appendix Table 2, was initiated by an increase
in seismic activity in March 2002. This was followed by emission of a gray plume that rose
ACC
EPTE
D M
ANU
SCR
IPT
ACCEPTED MANUSCRIPT
16
300-400 m above the summit. Several lava avalanches traveled 750 m down Kembar
Valley and several pyroclastic flows traveled downvalley (black area in Fig. 5). The
eruptive activity increased until August 2002, when a slight decrease was perceived
between September and December 2002 but the eruptive activity remained at a level higher
than normal, categorized at alert level 2 on a scale of 4 (Center of Volcanology and
Geologic Hazard Mitigation, CVGHM). Between 30th November and 28th December
2002, block-and-ash flows occurred several times, extended down the Bang River Valley,
and attained a 5 km maximum distance. Other flows were channeled along the Kembar
Valley. Voluminous block-and-ash flows and hot lahars occurred on 29th and 30th
December 2002 on the SSE flank. Block-and-ash flows of a volume of 3.25 x 10⁶m
3 were
channelled 11 km down the Bang Valley, extending as far as the Supit suburb of Pronojiwo
(Fig. 5). On 29th December 2002 trees were singed and land was covered by a muddy ash
over an area 2.2 km long and 0.5 km wide: located along the west side (right bank) of the
Bang Valley between 1250 m and 1400 m asl. (Fig. 5; GVN, 2003). The deposit was
attributed to a „wet‟ pyroclastic surge that decoupled from one of the flows moving down
the valley and which then swept across the Bang Valley to damage the forest and
agricultural land. The 29th December 2002 light brownish, block-and-ash flow deposits of
andesitic composition contain lithic blocks of dome and lava blocks up to 12.5 m in
diameter with a matrix of coarse ash. The eruptive activity continued after this event but at
a lower intensity until the end of January 2003 when the eruptive episode ended (GVN,
2004).
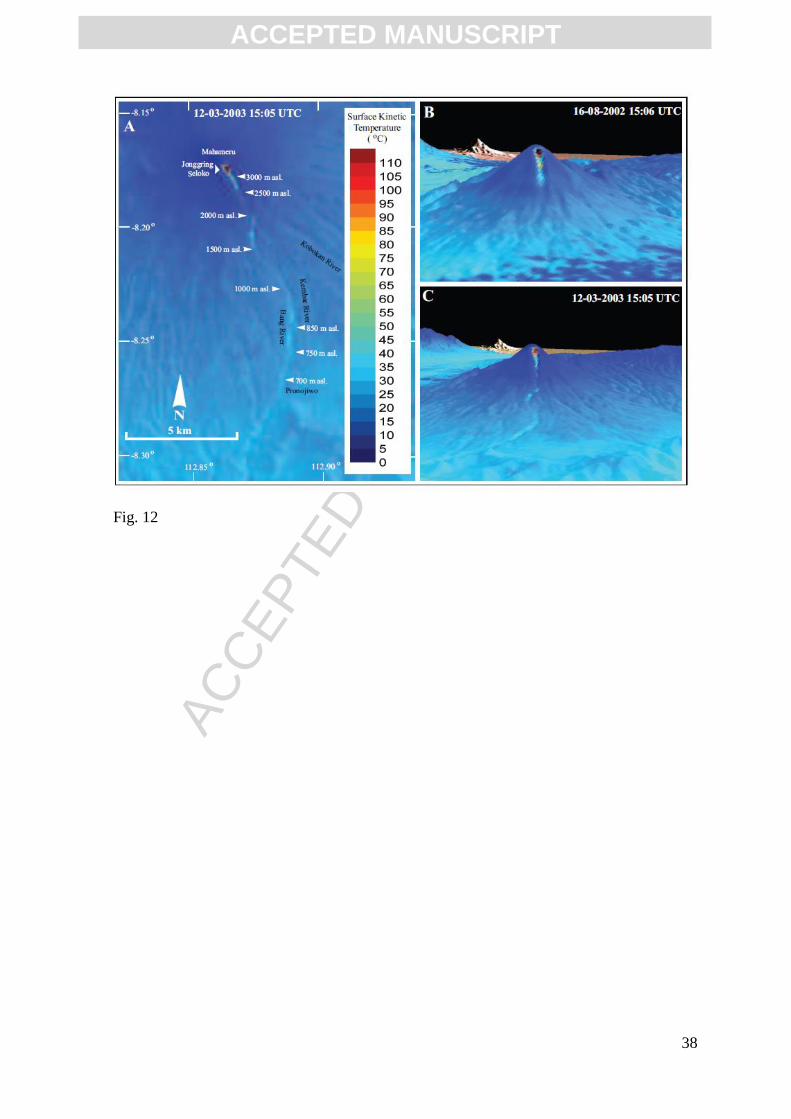
The 2002 block-and-ash flow and lahar deposits are shown in Fig. 5 and also in the 12th
March 2003 ASTER image as colour-coded pixels indicating a thermal anomaly with
respect to the image background (Fig. 12A, C). Based on the ASTER image, the thermal
anomaly occupies the 11.36 -km-long channel of Bang Valley and covers an area of about
1.65 x 10⁶ m
2. Based on field investigation by researchers of the Volcanological Survey of
Indonesia (VSI, now CVGHM), block-and-ash flow deposits in the Bang Valley at 750 m
asl had a thickness of 4-7 m. By using these data and assuming a variable thickness of
deposits, depending on local topography (minimum of 1 m and maximum of 9 m), we
calculate the volume of the 2002 block-and-ash flows deposits to be about 5.45 x 10⁶ m
3.
Remote sensing of two ASTER thermal images provides details on eruptive activity and
related deposits that have not been identified so far. The 16th August 2002 thermal image
ACC
EPTE
D M
ANU
SCR
IPT
ACCEPTED MANUSCRIPT
17
(Fig. 12B) shows thermal anomaly on the SE-trending scar extending 1.4 km from the
Jonggring-Seloko Crater with the high temperature occurring in the crater and a higher
temperature hotspot being located at a distance of 500 m from the crater. This can be
related to the eruptive activity before 16th August 2002 when most lava avalanches or
pyroclastic flows travelled about 500 m from the crater and occasionally as far as 1.4 km.
The hot spot was caused by accumulation of hot materials (lava rockslide or pyroclastic-
flow fronts) within the scar. The location of the hot spot is related to the morphology of the
SE-trending scar (Fig. 9), where it occurs at a break in slope where deposition may be
expected. The 12th March 2003 thermal image (Fig. 12C) reveals that the block-and-ash
flows deposits retained a higher temperature than its background for two months after
deposition: this may be due to slow cooling or the thermal characteristics of the block-and-
ash flow deposits that may absorb heat more effectively during the day to heat up to a
greater degree in the sun than the background surfaces. The thermal anomaly on
Jonggring-Seloko Crater and its SE-trending scar, due to persistent explosions, lava
avalanches and pyroclastic flows, was again observed.
If we compare the 24th October 2003 SPOT 5 (Panchromatic) image and the 14th
November 2002 IKONOS image, we can recognize four impacted areas. (1) The first area
is characterized by a dark gray, smooth surface which caps the thick block-and-ash flow
deposits, which extend 11.36 km from the SE-trending scar to Pronojiwo in the Bang river
Valley (Fig.13A). Within weeks of the eruption end, the top surface was already incised by
small, shallow and active channels cut by runoff. The valley-confined block-and-ash flow
deposits also widened, by two- to three-fold, the pre-eruption channel bed (Fig. 13A-C).
(2) While the second area appears brownish in the 2002 IKONOS scene, it is marked by a
light-grey to whitish colour in the 2003 SPOT5 images. This scorched or singed forested
area between 1200 and 1500 m asl was swept by the wet pyroclastic surge that extended
0.5-1 km from the Bang Valley channel at distances of 5 to 7 km from the crater (Fig.
13A). (3) Along the sinuous channel between 750 m and 1100 m, large, grey patches of
deposits on banks and valley terraces across convex and concave bends indicate over-bank
deposits of the block-and-ash flows (Fig. 13C). (4) Below 1000 m, the down-valley banks
of the Bang Valley are dusted by a thin, brownish muddy deposit. The thin, mud-rich, fine
ash layer may be due to an increase in water vapour at the time of the eruption in rainy
season and to a decrease in flow temperature at ≥11 km runout distance. The temperature
ACC
EPTE
D M
ANU
SCR
IPT
ACCEPTED MANUSCRIPT
18
of the dry ash-rich flow front at Supit was measured about 120C two days after the
emplacement.
Based on Semeru‟s historical eruptive activity, the dome collapse-driven block-and-ash
flows witnessed in 2002-2003 occur every five to seven years, so that the same event is
likely to happen again. The area potentially affected by avalanches and block-and-ash
flows is defined as a triangle-shaped area opening at 45° toward the SE with a width of
~15 km at 12 km from the vent. At least 100,000 people live in the lower part of this
triangle-shaped area (Thouret et al., 2007). This hazardous area and the E, SE and S
valleys are also threatened by syn-eruption and post-eruption lahars, which can reach the
sea 25 km away. To assess the hazard of eruptions in the future, volcano monitoring is the
main tool capable of providing an early warning to people who live or conduct their
activities in the Semeru‟s hazard zones. Other work that can be done to predict the
direction of pyroclastic flows is to monitor the evolution of the morphology of the SE-
trending scar and of the drainage network. Additional prediction may be based on
simulation runs of pyroclastic flows extent and runout using numerical codes such as
TITAN2D or VOLCFLOW over up-to-date DEMs. This is one of the objectives of our
ongoing research project.
7. CONCLUSION
The objective of our work was to use high-spatial resolution images (IKONOS and
SPOT5) to analyse the structures developing across a persistently active volcanic complex
and to map the deposits and impact of the 2002-2003 eruptive activity of Semeru volcano.
Based on our results, we reach five main conclusions.
(1)The high-spatial resolution imagery enabled us to safely study a persistently active, yet
dangerous composite volcano such as Semeru. A single SPOT5 image also allowed us to
study structural and geomorphic objects a few tens of meters over 1800 km2 in the
Tengger-Semeru volcanic massif. SPOT5 and IKONOS images were merged with ASTER
thermal imagery and digital elevation models to improve the interpretation of structures,
deposits and effects of volcanic flows. Despite limitations such as cloud and vegetation
cover, the reliable return period of the satellite orbit makes satellite time series a powerful
tool for mapping geological and geomorphological changes at an active volcano when
combined with ground-based observations (Thouret et al., 2010). Each of the data used in
ACC
EPTE
D M
ANU
SCR
IPT
ACCEPTED MANUSCRIPT
19
this study was useful for the distinct purposes of structural and geomorphic analysis. The
two SRTM-DEM and TOPO-DEM were useful for recognizing structural features and
describe the relationships between fault groups and the drainage network. The IKONOS
images helped to determine structures and deposits in the summit vent area with
unprecedented detail. The SPOT5 image enabled us to outline deposits and structures at the
regional scale of the volcanic massif. The ASTER TIR images were useful in tracking
thermal anomalies linked to recent pyroclastic deposits to be mapped during and shortly
after an eruption. In addition, the high-resolution images can be used for detailed mapping
and interpretating the summit cone and the vent area without compromising the safety of
geologists. Safety is a constant issue at a persistently active volcano such as Semeru, which
has killed several volcanologists in the recent past.
(2) Four groups of faults trending N40, N160, N75 and N120 occur on the Semeru-
Tengger volcanic massif. The first and second groups, located mostly to the south of the
massif, are related to the compressional stress regime due to convergence at the subduction
zone >50 km south of Semeru. The third group, which is dominant in the northern area of
the Tengger-Semeru massif, may be related to extension in the Madura basin. The young
N120 faults, which offset all other fault families, may be related to crustal spreading
caused by magmatic intrusions from „older‟ volcanoes such as Jambangan.
(3) Structures visible on the Semeru‟s summit cone may be related to the regional tectonic
setting. The SE-trending scar is partly controlled by the N160-trending fault, which
belongs to the second tectonic group. This scar, which channels eruption-related flows and
dome-growth related rockfalls, appeared between 1969 and 1979 and widened rapidly until
2009 at a rate of about 8 m/year. Besides the main scar, minor scars that cut down the west
flank of Semeru are likely to be controlled by NW- and NNE-trending faults.
(4) The Semeru composite cone has been built on and is buttressed against the Mahameru
edifice. Some structures, such as summit normal faults, and thrust faults at the base of the
SW to E flank of Semeru, indicate an asymmetric deformation pattern possibly induced by
flank spreading of the weak-cored volcano. The existence of the weak basal layer of
weathered volcaniclastic deposits of Tertiary age beneath Semeru is a working hypothesis
to be tested. In addition, the large mass of the edifice (about 60 km3) and the constant
magma influx (at least since 1967) are expected to create a significant deformation
especially in the upper part of the edifice. Deformation measurements and geophysical
ACC
EPTE
D M
ANU
SCR
IPT
ACCEPTED MANUSCRIPT
20
methods should be applied, and the possibility of flank collapse must be considered in the
future.
(5) An example of the hazards of Semeru is the 2002 block-and-ash flows, with a volume
of 5.45x10⁶ m
3, that caused the evacuation of 500 people and damaged the forest and tilled
land on the west side of the Bang Valley. A wet, fine-ash rich pyroclastic surge swept
across the forest and agricultural land at the edge of the Bang Valley at a distance between
5 and 8 km from the crater. The pyroclastic-flow and surge deposits marked easily
detectable morphological changes to the volcano surface. Detected morphological changes
return to our first point that time series of high-spatial resolution data can be of great utility
in tracking the rapid changes that occur in the structures and morphology of a persistently
active volcanic complex.
Acknowledgements
This work was supported by ICT-ASIE “ImagerLeRisk” and VELI (Volcanisme Explosif
Laboratoire Indonésien) programs funded by the Ministère des affaires étrangères et européennes
(MAEE) – Agence Française pour le développement (AFD). Remote sensing, processing and
interpretation have been carried out at the Laboratoire Magmas et Volcans, UMR 6524 CNRS et
IRD, Université Blaise Pascal in Clermont-Ferrand, France. Our collaborators abroad are: the
Center for Volcanology and Geological Hazard Mitigation (CVGHM) of the Geological Agency,
Ministry of Energy and Mineral Resources, Indonesia; and the Center for Remote Imaging, Sensing
and Processing (CRISP), National University of Singapore.
References
Borgia, A. (1994). Dynamic basis of volcanic spreading. J. Geoph. Res. 99, 17791-17804.
Carn, S.A. (1999). Application of synthetic aperture radar (SAR) imagery to volcano
mapping in the humid tropics: a case study in East Java, Indonesia. Bull. Volc. 61, 92–105.
Cecchi, E., van Wyk de Vries, B., Lavest, J-M. (2004). Flank spreading and collapse of
weak-cord volcanoes. Bull. Volc. 67, 72-91.
Chorowicz, J., Deffontaines, B., Huaman-Rodrigo, D., Guillande, R., Le Guern, F.,
Thouret, J.C. (1992). SPOT Satellite monitoring of the eruption of Sabancaya volcano.
Rem. Sens. Env. 42, 43-49.
ACC
EPTE
D M
ANU
SCR
IPT
ACCEPTED MANUSCRIPT
21
Gillespie, A. R., Matsunaga, T., Rokugawa, S., Hook, S. J. (1998). Temperature and
Emissivity Separation from Advanced Spaceborne Thermal Emission and Reflection
Radiometer (ASTER) Images. IEEE Trans. Geosc. Rem. Sens. 36, 1113-1126.
GVN (1980). Scientific Event Alert Network Bulletin: Semeru 5 (1).
GVN (2002). Bulletin of the Global Volcanism Network: Semeru 27 (6), 2; (9), 7-8; (12),
7.
GVN (2003). Bulletin of the Global Volcanism Network: Semeru 28 (4), 11-13; (7), 5; (9),
7-8; (10), 12; (12), 7.
GVN (2004). Bulletin of the Global Volcanism Network: Semeru 29 (6):12-13.
Iguchi, M., Yakiwara, H., Tameguri, T., Hendrasto, M., Hirabayashi, J.-I. (2008).
Mechanism of explosive eruption revealed by geophysical observations at the Sakurajima,
Suwanosejima and Semeru volcanoes. J. Volc. Geoth. Res. 178, 1-9.
Joyce, K.E., Samsonov, S., Manville, V., Jongens, R., Graettinger, A., Cronin, S.J. (2009).
Remote sensing data types and techniques for lahar path detection: A case study at Mt
Ruapehu, New Zealand. Rem. Sens. Env. 113, 8, 1778-1786.
Lavigne, F., Thouret, J.-C. (2002). Erosion, sédimentation et lahars sur le volcan Semeru,
Java-est, Indonésie. Geomorphology, from expert opinion to modelling. A tribute to Prof.
J.-C. Flageollet, Strasbourg: Centre Européen Recherches Géomorphologiques, pp. 193-
202.
Miller, V., Ammon, Ch., Voight, B., De Angelis, S. (2008). A moving block-and-ash flow
of Merapi Volcano (Indonesia) and deposit facies as imaged by IKONOS on 16 June 2006.
IAVCEI General Assembly, 18-22 August 2008, Reykjavik (Abstract).
Mouginis-Mark, P., Garbeil, H. (2005). Quality of TOPSAR topographic data for
volcanology studies at Kilauea volcano, Hawaï: an assessment using airborne lidar data.
Rem. Sens. Env. 96, 149-164.

ACC
EPTE
D M
ANU
SCR
IPT
ACCEPTED MANUSCRIPT
22
Mulyadi, E. (1992). Le complexe de Bromo-Tengger, Est Java, Indonésie. Etude
structurale et volcanologique. (Unpublished) PhD thesis, département de géologie,
université Blaise Pascal, Clermont-Ferrand, pp 136.
Nishi, K., Hendrasto, M., Mulyana, I., Rosadi, U., Purbawinata, M.A. (2007). Micro-tilt
changes preceding summit explosions at Semeru volcano, Indonesia. Earth Planets Space
59, 151–156.
Pieri, D., Abrams, M. (2004). ASTER Watches the World‟s Volcanoes: A New Paradigm
for Volcanological Observations from Orbit. J. Volc. Geoth. Res. 135, 13-28
Simkin, T., Siebert, L. (1994). Volcanoes of the world, 2nd edition. Smithsonian
Institution, Geoscience Press, Tucson, Arizona, pp 349.
Siswowidjoyo S, Sudarsono U, Wirakusumah AD (1997). The threat of hazards in the
Semeru volcano region in East Java, Indonesia. J. Asian Earth Sci. 15, 185-194.
Situmorang, T. (1989). Lahar and pyroclastic flow hazards zoning of Semeru volcano, East
Java, Indonesia (using aerial photograph). In International Symposium on Erosion and
Volcanic Debris Flow Technology, pp 12, Yogyakarta, Indonesia, July–August 1989.
Sjarifudin, M.Z. (1990). G. Bromo. Berita Berkala Vulkanologi, Edisi Khusus no. 127 (in
Indonesian), Bandung, Indonesia.
Sutawidjaja, I.S., Wahyudin, D., Kusdinar, E. (1996). Geological map of Semeru volcano,
East Java (1:50,000 scale). Direktorat Vulkanologi, VSI, Bandung, Indonesia.
Thouret, J.-C., Lavigne, F., Suwa, H., Sukatja, B., Surono (2007). Volcanic hazard at
Mount Semeru, East Java (Indonesia), with emphasis on lahars. Bull. Volc. 70, 221-244.
Thouret J.-C., Gupta A., Lube G., Cronin S.J., Surono, 2010. Analysis of the 2006 eruption
deposits of Merapi Volcano, Java, Indonesia, using high-resolution IKONOS images and
complementary ground based observations. Rem. Sens. Env. 114, 1949-1967
DOI:10.1016/j.rse.2010.03.016.
Van Bemmelen, R.W. (1949). The geology of Indonesia and adjacent archipelago, pp. 1-
150. The Hague: Government Printing Office.
ACC
EPTE
D M
ANU
SCR
IPT
ACCEPTED MANUSCRIPT
23
Van Padang, N.M. (1951). Semeru. Catalogue of the active volcanoes of the world
including solfatara fields. Part 1. Indonesia, pp 271, Napoli: International Association of
Volcanology.
Wahyudin, D (1991). Volcanology and petrology of Mt. Semeru volcanic complex, East
Java, Indonesia. Diploma of Applied Science (Volcanology), Victoria University of
Wellington, New Zealand, pp 126.
Zanoni, V.M., Goward, S.N. (2003). A new direction in Earth Observations from space:
IKONOS. Rem. Sens. Env. 88, 1-2, 1-2.
Figure captions
Figure 1. A. The 11/08/2003 SPOT5 image, looking SW and draped on a SRTM-derived
Digital Elevation Model, shows the Tengger-Semeru massif (Courtesy of CRISP Centre
for Imaging, Sensing and Processing, National University of Singapore). The Semeru-
Tengger volcanic massif comprises a cluster of calderas and composite cones including,
from N to S: the Ngadisari, Bromo-Tengger, Jambangan and Ajek-Ajek calderas, Mt.
Kepolo, and Mt. Semeru; B. Sketch maps showing the geodynamical setting of Indonesia,
the Island of Java, and the location of the Semeru composite cone south of the Semeru–
Tengger volcanic complex.
Figure 2. A. The 26/07/2008 SPOT5 image portrays the Semeru-Tengger volcanic massif.
Band combination displayed in this colour composite image includes R: Short-wave
Infrared, G: Near-Infrared and B: Red. The distinct colours of the image in the Bromo-
Tengger caldera encompass: green for vegetation, purple for loose volcanic deposit
(tephra, ash and sand), darker for „old‟ deposits and lighter for recent deposits. B. Shaded
relief image including much of the same area generated from the 90 m/pixel SRTM-based
DEM. C. Shaded relief image of enhanced DEM (enclosed in box) obtained from 1:25,000
scale topographical maps with elevation contour interval of 12.5 m. The even surface of
the N and NW summit cone flanks due to a thick tephra cover contrasts with the rough
surface and landslide scars of the eroded S, SE and SW flanks. Several topographic and
geomorphic features are indicated by arrows in C: lava cones and domes on the S and E
flanks; smooth, slightly elevated surface of lava flows above the SE flank slope; regular

ACC
EPTE
D M
ANU
SCR
IPT
ACCEPTED MANUSCRIPT
24
and smooth surface of the fans forming the SE ring plain. North of Semeru: rugged
topography carved by deep ravines in the area of Ajek-Ajek and Jambangan calderas; to
the NE and N of the Semeru ring plain, the smooth topography of aprons suggests thick
pyroclastic and/or lahar deposits.
Figure 3 (Interpreted map from Fig. 2). A. The Bromo-Tengger caldera with remarkable
landforms: I the 2 km-wide Sapikerep outlet valley; II the Ngadisari caldera; III the large
flank cone Gunung Keciri truncated by an amphitheater valley 2 km-wide, open to the SW;
IV Cemorolawang caldera; and V Tengger „sand-sea‟ (= ash-covered floor) caldera with a
parasite cone, Gunung Ijo (1), located in the west corner. The post-caldera volcanism has
formed six edifices inside the Tengger caldera: phreatomagmatic tuff rings of Gunung
Widodaren (2), Gunung Kursi (3), Segarawedi Kidul (4), Segarawedi Lor (5), Gunung
Bromo (6) and a strombolian cone, Gunung Batok (7). B. The older nested Jambangan (VI)
and Ajek-Ajek (VII) calderas extend about 6 km in a northern direction. Several intra-
caldera vents were formed including the maar of Ranu Kumbolo (8) in a deep crater. The
Holocene Mt. Kepolo strato-cone (9) is lined up with a youthful lava cone and flow (10).
Ranu Pani (11) and Ranu Regulo (12) are maars in the northern part, and two small vents
(13 and 14) are located on the east flank. C. The youngest volcano in Semeru-Tengger
massif, Semeru (15), including the currently active Jongring-Seloko vent, has been built
on, and buttressed against the Old Semeru, Mahameru (16) and Jambangan caldera to the
north. The active vent sits at the top of the principal SE-trending scar (17) in the edifice.
Several flank vents are visible on the eastern flanks (18).
Figure 4. The 2008 SPOT5 image (left) and the interpreted map (right) portray the regional
tectonic setting of Semeru Volcano and its surrounding. The faults (dashed line) were
inferred from the interpretation of SPOT -4 satellite images and drainage network map.
Note the prevailing N130- and N15-trending faults in this area.
Figure 5. Geological map of the Semeru‟s composite cone and ring plain (based on
Situmorang 1989; Simkin and Siebert 1994; Wahyudin 1991; VSI geological map by
Sutawidjaja et al. 1996; Siswowidjoyo et al. 1997; Carn 1999; Thouret et al. 2007, and
TOPO-DEM). Stratigraphic units 1 to 12 are keyed to symbols in map caption.
Figure 6. A. Structural map of the Semeru-Tengger volcanic massif, inferred from SRTM-
DEM, TOPO-DEM and optical satellite images. B. Rose diagram of lineaments showing
ACC
EPTE
D M
ANU
SCR
IPT
ACCEPTED MANUSCRIPT
25
the dominant NW-trending alignment. C. Rose diagram of faults showing four groups of
faults, F1 to F4. F4 is the youngest because offsets faults of other groups. D. The sketch
diagram depicts the regional tectonic setting around Semeru.
Figure 7 A. The 10th April 2008 IKONOS image and B. 20th August 2009 IKONOS
image show the Mahameru summit area, Jonggring-Seloko and the SE-trending principal
scar. Stratification on the wall of the crater shows a pile of lava flows separated by
pyroclastic-fall and flow deposits. Crater ring faults are visible in this image. B. Sketch
map based on the 20th August IKONOS image showing the structure and geomorphic
features of the Semeru summit cone.
Figure 8. Three IKONOS images (25-09-2004, 10-04-2008 and 20-08-2009) and two
SPOT-5 images (26-09-2004 and 26-07-2008) draped on the TOPO-DEM show the
Semeru edifice, including the Jonggring-Seloko vent and SE-trending scar, and landslide
scars on the East flank.
Figure 9. A. TOPO-DEM of Semeru with blue-red color code for elevation values and
flank section profiles showing convex-concave slopes. B. Slope map of Semeru analyzed
from TOPO-DEM, showing the different slope values between each segment described in
Fig. 8. C. North-south and east-west cross section sketches of Semeru edifice illustrating
that the younger Semeru composite cone has been built on and is buttressed against the
Mahameru edifice along an unconformity that may act as a failure plane.
Figure 10. Sketches of the Semeru edifice from 1923 to 1997 portray the morphological
changes of the summit cone. The SE scar was not visible in 1923. The 1963 lava dome and
pyroclastic flows are located on the SE flank between Koboan and Semut River Valleys.
The 1969 lava dome and pyroclastic flows are located on the south flank. The 1977 sketch
shows a horseshoe-shaped scar towards Kembar River, which expanded much in 1985. The
1994 and 1997 sketches show the 1997 lava tongue, lava dome and an eruption column.
Sapiturang is located 12 km to the SSE, G. Sawur 12 km to the SE, and Argosuko 22, 5 km
to the NW of the Jongring-Seloko crater.
Figure 11. A. Aerial photographs of 1981 and 1990 and satellite images of 25/09/2004 and
20/08/2009 reveal morphological changes of the Jongring-Seloko vent and SE-trending
scar. B. Sketch showing the evolution of the Jongring-Seloko vent and the SE-trending
scar whose width has increased from 290 m in 1981 to 490 m in 2009.

ACC
EPTE
D M
ANU
SCR
IPT
ACCEPTED MANUSCRIPT
26
Figure 12. A. The ASTER TIR surface kinetic temperature image taken on 12th March
2003 with a blue-red color code shows thermal anomalies induced by the 2002 block-and-
ash flows on Semeru along the SE-trending scar and into the Bang River Valley as far as
Supit, a suburb of Pronojiwo. B. and C. 3D surface view of 16th August 2002 and 12th
March 2003 ASTER TIR surface kinetic temperature images on TOPO-DEM, showing
thermal anomalies on Semeru before and after 29th December 2002.
Figure 13. The 14th November 2002 IKONOS image compared with 24th October 2003
SPOT-5 (panchromatic) image show the Bang river Valley prior to and after the 29th
December 2002 block-and-ash flows. The figure shows scorched and singed forests due to
pyroclastic surge (B top right) and overbank (C top left). Thick block-and-ash flows
deposits are characterized by smooth, dark grey surface (bottom left D and right E) and by
new, shallow active channels formed by runoff and lahars.
Appendix: Tables 1 and 2
Table 1. Technical characteristics of satellite sensors and images used in this study.
Table 2. The 2002-2003 Semeru‟s seismic and eruptive activity summarized from
Smithsonian Institute / USGS weekly volcanic activity reports (GVN, 2002; 2003).

ACC
EPTE
D M
ANU
SCR
IPT
ACCEPTED MANUSCRIPT
27
Fig. 1
ACC
EPTE
D M
ANU
SCR
IPT
ACCEPTED MANUSCRIPT
28
Fig. 2

ACC
EPTE
D M
ANU
SCR
IPT
ACCEPTED MANUSCRIPT
29
Fig. 3

ACC
EPTE
D M
ANU
SCR
IPT
ACCEPTED MANUSCRIPT
30
Fig. 4
ACC
EPTE
D M
ANU
SCR
IPT
ACCEPTED MANUSCRIPT
31
Fig. 5
ACC
EPTE
D M
ANU
SCR
IPT
ACCEPTED MANUSCRIPT
32
Fig. 6
ACC
EPTE
D M
ANU
SCR
IPT
ACCEPTED MANUSCRIPT
33
Fig. 7
ACC
EPTE
D M
ANU
SCR
IPT
ACCEPTED MANUSCRIPT
34
Fig. 8
ACC
EPTE
D M
ANU
SCR
IPT
ACCEPTED MANUSCRIPT
35
Fig. 9

ACC
EPTE
D M
ANU
SCR
IPT
ACCEPTED MANUSCRIPT
36
ACC
EPTE
D M
ANU
SCR
IPT
ACCEPTED MANUSCRIPT
37
Fig. 11
ACC
EPTE
D M
ANU
SCR
IPT
ACCEPTED MANUSCRIPT
38
Fig. 12

ACC
EPTE
D M
ANU
SCR
IPT
ACCEPTED MANUSCRIPT
39
Fig. 13
ACC
EPTE
D M
ANU
SCR
IPT
ACCEPTED MANUSCRIPT
40
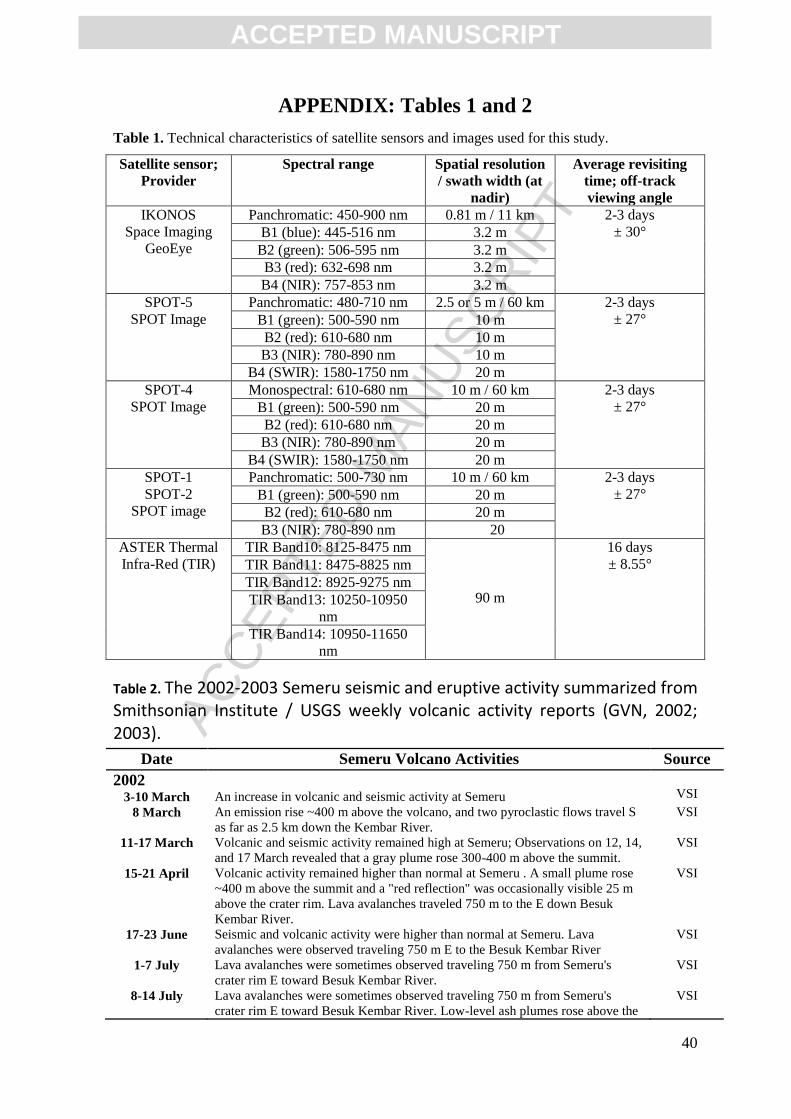
APPENDIX: Tables 1 and 2
Table 1. Technical characteristics of satellite sensors and images used for this study.
Satellite sensor;
Provider
Spectral range Spatial resolution
/ swath width (at
nadir)
Average revisiting
time; off-track
viewing angle
IKONOS
Space Imaging
GeoEye
Panchromatic: 450-900 nm 0.81 m / 11 km 2-3 days
± 30° B1 (blue): 445-516 nm 3.2 m
B2 (green): 506-595 nm 3.2 m
B3 (red): 632-698 nm 3.2 m
B4 (NIR): 757-853 nm 3.2 m
SPOT-5
SPOT Image
Panchromatic: 480-710 nm 2.5 or 5 m / 60 km 2-3 days
± 27° B1 (green): 500-590 nm 10 m
B2 (red): 610-680 nm 10 m
B3 (NIR): 780-890 nm 10 m
B4 (SWIR): 1580-1750 nm 20 m
SPOT-4
SPOT Image
Monospectral: 610-680 nm 10 m / 60 km 2-3 days
± 27° B1 (green): 500-590 nm 20 m
B2 (red): 610-680 nm 20 m
B3 (NIR): 780-890 nm 20 m
B4 (SWIR): 1580-1750 nm 20 m
SPOT-1
SPOT-2
SPOT image
Panchromatic: 500-730 nm 10 m / 60 km 2-3 days
± 27° B1 (green): 500-590 nm 20 m
B2 (red): 610-680 nm 20 m
B3 (NIR): 780-890 nm 20
ASTER Thermal
Infra-Red (TIR)
TIR Band10: 8125-8475 nm
90 m
16 days
± 8.55° TIR Band11: 8475-8825 nm
TIR Band12: 8925-9275 nm
TIR Band13: 10250-10950
nm
TIR Band14: 10950-11650
nm
Table 2. The 2002-2003 Semeru seismic and eruptive activity summarized from Smithsonian Institute / USGS weekly volcanic activity reports (GVN, 2002; 2003).
Date Semeru Volcano Activities Source
2002 3-10 March An increase in volcanic and seismic activity at Semeru
VSI
8 March An emission rise ~400 m above the volcano, and two pyroclastic flows travel S
as far as 2.5 km down the Kembar River.
VSI
11-17 March Volcanic and seismic activity remained high at Semeru; Observations on 12, 14,
and 17 March revealed that a gray plume rose 300-400 m above the summit.
VSI
15-21 April Volcanic activity remained higher than normal at Semeru . A small plume rose
~400 m above the summit and a "red reflection" was occasionally visible 25 m
above the crater rim. Lava avalanches traveled 750 m to the E down Besuk
Kembar River.
VSI
17-23 June Seismic and volcanic activity were higher than normal at Semeru. Lava
avalanches were observed traveling 750 m E to the Besuk Kembar River
VSI
1-7 July Lava avalanches were sometimes observed traveling 750 m from Semeru's
crater rim E toward Besuk Kembar River.
VSI
8-14 July Lava avalanches were sometimes observed traveling 750 m from Semeru's
crater rim E toward Besuk Kembar River. Low-level ash plumes rose above the
VSI

ACC
EPTE
D M
ANU
SCR
IPT
ACCEPTED MANUSCRIPT
41
crater
15-21 July Lava avalanches were observed traveling ~750 m from Semeru's crater rim E
toward Besuk Kembar River. Explosions produced ash plumes reaching 300-
500 m above the crater
VSI
31 July-6
August
Activity at Semeru remained at a higher level than normal, but thick fog
obscured the view.
VSI
5-18 August Volcanic and seismic activity at Semeru remained at higher-than-normal levels.
On 6 August a lava avalanche traveled ~750 m E toward Besuk Kembar River.
VSI
2-8 September Seismicity was dominated by explosion earthquakes; On 8 September at 7:47pm
an ash explosion at Semeru was accompanied by ejected incandescent material.
The material traveled 150 m E to the upper portion of the Kembar River.
VSI
22-23
September
Ash clouds were observed at Semeru rising to ~7.6 km a.s.l. on 22 September at
1453 and on 23 September at 1700. The September 23rd cloud drifted SW.
Neither cloud was visible on satellite imagery due to meteorological clouds in
the area.
Darwin
VAAC
9-22 December Volcanic and seismic activity remained above normal levels at Semeru. Ash
columns rose 400-500 m above the volcano, and lava avalanches and
pyroclastic flows were seismically recorded.
VSI
17-30
December
Volcanic and seismic activity were relatively high at Semeru. 49 lava
avalanches, 6 pyroclastic flows, and 3 floods/lahars. Explosions sent ash plumes
to 400 m above Jonggring Seloko crater.
VSI
25 December A pyroclastic flow traveled 2.5 km into the Besuk Kembar River VSI
29 December Pyroclastic flow at Besuk Bang traveled ~9 km from the summit. At 5pm-
8:15pm, a lahar traveled along the Besuk Kembar River relatively close to Supit
village. Early that morning the residents of Supit were evacuated.
VSI
30 December A pyroclastic flows traveled 2 km toward the Besuk Kembar River at 7:20am,
and at 10am, one traveled 4 km toward Supit village.
VSI
2003 1-12 January
Relatively high volcanic and seismic activity continued at Semeru; Several
explosions sent ash columns to 700 m above the crater. Lava avalanches sent
material up to 750 m from the crater rim and a pyroclastic flow traveled 1.5 km
E to the Besuk Kembar River.
VSI
13-26 January Volcanic activity remained at relatively high levels at Semeru, with ash plumes
rising 400-600 m above the summit. On 19 and 23-24 January incandescent lava
avalanches traveled ~500 m down Besuk Kembar River.
VSI
3-9 February Volcanic activity remained at high levels at Semeru, with ash plumes rising
300-400 m above the summit. On 7 February a pyroclastic flow traveled 2-4 km
into the Besuk Bang River.
VSI
24 February-2
March
Volcanism at Semeru remained at high levels. "White-gray ash plumes" were
observed rising 300-400 m above the summit.
VSI
3-9 March Volcanism at Semeru remained at high levels. "White-gray ash plume[s]" rose
to low levels above the summit and several "pyroclastic avalanches" traveled
200-2,000 m into Besuk Kembar River.
VSI
10-16 March "White-gray ash plumes" rose to low levels and several pyroclastic flows
traveled 1.5-4 km down Bang River.
VSI
17-23 March Seismic and volcanic activity continued at relatively high levels at Semeru, with
"gray ash plumes" rising 300-400 m above the summit, and several pyroclastic
flows traveling toward Bang River to runout distances of around 500 m.
VSI
24-30 March Seismic and volcanic activity continued at relatively high levels at Semeru, with
"gray ash plumes" rising to low levels, pyroclastic-flow activity, and several
explosions.
VSI
27 March A pyroclastic flow travelled around 3,750 m toward Bang River. VSI
31 March-6
April
Volcanic activity remained at relatively high levels at Semeru; "White-gray ash
plumes" rose 400-600 m above the summit.
VSI
15 April At 10:38am, a pilot reported seeing ash ~2.5 km above Semeru. No ash was
visible on satellite imagery.
Darwin
VAAC
12-18 May Volcanic and seismic activity at Semeru continued at relatively high levels.
Several small ash explosions rose to low levels above the summit.
VSI
29 May At 08:38am, plumes emitted from Semeru were visible on satellite imagery at a
height of ~6 km a.s.l. drifting NW,
Darwin
VAAC

ACC
EPTE
D M
ANU
SCR
IPT
ACCEPTED MANUSCRIPT
42
2 June At 0625am, plumes emitted from Semeru were visible on satellite imagery at a
height of ~6 km a.s.l.drifting SSE.
Darwin
VAAC
2-29 June Activity continued at high levels at Semeru. Several explosions occurred with
the highest ash plumes rising to a height of ~600 m.
VSI
21 July At 11:16pm, an ash cloud from Semeru was visible on satellite imagery
extending ~75 km to the WSW
Darwin
VAAC
31 July Based on information from an aircraft report, the Darwin VAAC reported that
an ash plume emitted from Semeru rose to ~4.5 km a.s.l. at 11:20am. No ash
was visible on satellite imagery.
Darwin
VAAC
8-9 August Thin ash plumes from Semeru were visible on satellite imagery on 8 and 9
August. On 9 August the plume extended ~40 km SW of the volcano.
Darwin
VAAC
13 August A faint ash plume from Semeru was visible on satellite imagery extending ~75
km E of the summit.
Darwin
VAAC
11-17 August Volcanic activity at Semeru continued at relatively high levels. Explosions
produced ash columns that rose to 400 m above the summit.
VSI
9 September An ash plume emitted from Semeru, rose to ~7.3 km a.s.l. and drifted S. Ash
was not visible on satellite imagery.
Darwin
VAAC
1-28
September
Volcanic activity at Semeru continued at relatively high levels. Several ash
explosions produced plumes to 400-500 m above the volcano.
DVGHM
(VSI)
October Ash explosions at Semeru continued to produce low-level plumes and
seismicity was dominated by hundreds of explosion earthquakes.
DVGHM
(VSI)
2 December At 5:28pm, satellite imagery showed an ash plume from Semeru at ~4 km a.s.l.
that extended ~55 km WSW.
Darwin
VAAC
ACC
EPTE
D M
ANU
SCR
IPT
ACCEPTED MANUSCRIPT
43
Highlights
High-spatial resolution images have been used to analyze the Semeru-
Tengger volcanoes.
High resolution satellite images have tracked changes on the active Semeru‟s
summit.
SPOT5 images have contributed to map faults and landslide scars on the
edifice.
A map of deposits and impacts from the 2003 eruption is based on thermal
ASTER images.
The effects of the 2003 pyroclastic flows are evaluated in terms of hazard
assessment.