Geography, topography, and history affect realized‐to‐potential tree species richness patterns...
11
Geography, topography, and history affect realized-to-potential tree species richness patterns in Europe Jens-Christian Svenning, Matthew C. Fitzpatrick, Signe Normand, Catherine H. Graham, Peter B. Pearman, Louis R. Iverson and Flemming Skov J.-C. Svenning ([email protected]) and S. Normand, Ecoinformatics and Biodiversity Group, Dept of Biological Sciences, Aarhus Univ., Ny Munkegade 114, DK-8000 Aarhus C, Denmark. M. C. Fitzpatrick, Univ. of Maryland Center for Environmental Science, Appalachian Lab, Frostburg, MD 21532, USA. C. H. Graham, Dept of Ecology and Evolution, Stony Brook Univ., NY 11794, USA. P. B. Pearman, Land Use Dynamics, Swiss Federal Research Inst. WSL, Zu ¨rcherstrasse 111, CH-8903 Birmensdorf, Switzerland. L. R. Iverson, Northern Research Station, US Forest Service, Delaware, OH 43015, USA. F. Skov, Dept of Wildlife Ecology and Biodiversity, National Environmental Research Inst., Aarhus Univ., Grenaavej 14, DK-8410 Kalø, Denmark. Environmental conditions and biotic interactions are generally thought to influence local species richness. However, immigration and the evolutionary and historical factors that shape regional species pools should also contribute to determining local species richness because local communities arise by assembly from regional species pools. Using the European tree flora as our study system, we implemented a novel approach to assess the relative importance of local and regional mechanisms that control local species richness. We first identified species pools that tolerate particular local environments and quantified the proportion of the pool that is present locally, i.e. the realized/potential (R/P) richness ratio. Because no consensus exists on how to estimate potential richness, we estimated it using three different approaches. Using these three estimates separately and in a combined ensemble estimate, we then analyzed the effects of potential drivers on R/P richness ratios. We predicted that the R/P richness ratio would 1) increase with decreasing distance from glacial refugia (accessibility), 2) and be generally low in geographically fragmented southern Europe because of dispersal limitation; 3) increase with actual evapotranspiration because greater availability of water and energy promotes local population persistence; and 4) increase with topographic heterogeneity because it promotes local species coexistence and facilitates long-term species survival. There was considerable variation among the three R/P richness ratio estimates, but we found consistent support for a negative effect of regional geographic fragmentation and a positive topographic effect. We also identified fairly broad support for the predicted effect of accessibility. We conclude that local tree assemblages in Europe often fail to realize a large proportion of the potential richness held in the regional species pool, partially reflecting their geographical, historical, and environmental circumstances. The dispersal-related effects of geographic fragmentation and accessibility exemplify regional controls that combine with local ecological sorting to determine local species richness. A central question in ecology and evolution addresses the determinants of species richness. The species richness of a locality is generally recognized to be influenced by its environmental conditions and biotic interactions. Never- theless, because local assemblages arise by assembly from regional species pools, colonization and the evolutionary and historical factors that shape regional species pools should also affect local species richness (Zobel 1997, Ricklefs 2004). While most ecologists and biogeographers acknowledge the roles of both local and regional processes, strong disagreement persists about their relative importance in shaping local assemblages (O’Brien et al. 2000, Francis and Currie 2003, Ricklefs 2004). For example, some authors have interpreted regressions of local species richness on regional richness as evidence for the dependence of local richness on the number of species in the regional species pool (Caley and Schluter 1997), but this approach may not differentiate between local or regional control of local richness (Hillebrand 2005). Further, while numerous studies have analyzed geographic richness patterns and conducted meta-analyses to synthesize these patterns, no consensus has emerged on the importance of local versus regional control of species richness (O’Brien et al. 2000, Francis and Currie 2003, Hawkins et al. 2003, Hortal et al. 2008, Stropp et al. 2009). One likely reason is that local and regional mechanisms are not mutually exclusive but instead act simultaneously, with the outcome depending on the study system. For instance, greater climatic stability may cause local richness to be more a function of local determinism in the tropics than at high-latitudes, which were strongly impacted by the Pleistocene glaciations (cf. McGlone 1996). High-latitude regions can exhibit strong regional effects on species richness because of geographic variability in the impact of the glaciations (Latham and Ecography 33: 10701080, 2010 doi: 10.1111/j.1600-0587.2010.06301.x # 2010 The Authors. Ecography # 2010 Ecography Subject Editors: Carsten Rahbek and Niklaus Zimmermann. Accepted 18 August 2010 1070 SDM S PECIAL ISSUE : S PECIES D ISTRIBUTION M ODELLING
Transcript of Geography, topography, and history affect realized‐to‐potential tree species richness patterns...
Geography, topography, and history affect realized-to-potential treespecies richness patterns in Europe
Jens-Christian Svenning, Matthew C. Fitzpatrick, Signe Normand, Catherine H. Graham,Peter B. Pearman, Louis R. Iverson and Flemming Skov
J.-C. Svenning ([email protected]) and S. Normand, Ecoinformatics and Biodiversity Group, Dept of Biological Sciences, Aarhus Univ.,Ny Munkegade 114, DK-8000 Aarhus C, Denmark. !M. C. Fitzpatrick, Univ. of Maryland Center for Environmental Science, AppalachianLab, Frostburg, MD 21532, USA. ! C. H. Graham, Dept of Ecology and Evolution, Stony Brook Univ., NY 11794, USA. ! P. B. Pearman,Land Use Dynamics, Swiss Federal Research Inst. WSL, Zurcherstrasse 111, CH-8903 Birmensdorf, Switzerland. ! L. R. Iverson, NorthernResearch Station, US Forest Service, Delaware, OH 43015, USA. ! F. Skov, Dept of Wildlife Ecology and Biodiversity, National EnvironmentalResearch Inst., Aarhus Univ., Grenaavej 14, DK-8410 Kalø, Denmark.
Environmental conditions and biotic interactions are generally thought to influence local species richness. However,immigration and the evolutionary and historical factors that shape regional species pools should also contribute todetermining local species richness because local communities arise by assembly from regional species pools. Using theEuropean tree flora as our study system, we implemented a novel approach to assess the relative importance of local andregional mechanisms that control local species richness. We first identified species pools that tolerate particular localenvironments and quantified the proportion of the pool that is present locally, i.e. the realized/potential (R/P) richnessratio. Because no consensus exists on how to estimate potential richness, we estimated it using three different approaches.Using these three estimates separately and in a combined ensemble estimate, we then analyzed the effects of potentialdrivers on R/P richness ratios. We predicted that the R/P richness ratio would 1) increase with decreasing distance fromglacial refugia (accessibility), 2) and be generally low in geographically fragmented southern Europe because of dispersallimitation; 3) increase with actual evapotranspiration because greater availability of water and energy promotes localpopulation persistence; and 4) increase with topographic heterogeneity because it promotes local species coexistence andfacilitates long-term species survival. There was considerable variation among the three R/P richness ratio estimates, butwe found consistent support for a negative effect of regional geographic fragmentation and a positive topographic effect.We also identified fairly broad support for the predicted effect of accessibility. We conclude that local tree assemblages inEurope often fail to realize a large proportion of the potential richness held in the regional species pool, partially reflectingtheir geographical, historical, and environmental circumstances. The dispersal-related effects of geographic fragmentationand accessibility exemplify regional controls that combine with local ecological sorting to determine local species richness.
A central question in ecology and evolution addresses thedeterminants of species richness. The species richness of alocality is generally recognized to be influenced by itsenvironmental conditions and biotic interactions. Never-theless, because local assemblages arise by assembly fromregional species pools, colonization and the evolutionaryand historical factors that shape regional species poolsshould also affect local species richness (Zobel 1997,Ricklefs 2004). While most ecologists and biogeographersacknowledge the roles of both local and regional processes,strong disagreement persists about their relative importancein shaping local assemblages (O’Brien et al. 2000, Francisand Currie 2003, Ricklefs 2004). For example, someauthors have interpreted regressions of local species richnesson regional richness as evidence for the dependence of localrichness on the number of species in the regional speciespool (Caley and Schluter 1997), but this approach may not
differentiate between local or regional control of localrichness (Hillebrand 2005). Further, while numerousstudies have analyzed geographic richness patterns andconducted meta-analyses to synthesize these patterns, noconsensus has emerged on the importance of local versusregional control of species richness (O’Brien et al. 2000,Francis and Currie 2003, Hawkins et al. 2003, Hortal et al.2008, Stropp et al. 2009). One likely reason is that localand regional mechanisms are not mutually exclusive butinstead act simultaneously, with the outcome depending onthe study system. For instance, greater climatic stability maycause local richness to be more a function of localdeterminism in the tropics than at high-latitudes, whichwere strongly impacted by the Pleistocene glaciations (cf.McGlone 1996). High-latitude regions can exhibit strongregional effects on species richness because of geographicvariability in the impact of the glaciations (Latham and
Ecography 33: 1070!1080, 2010doi: 10.1111/j.1600-0587.2010.06301.x
# 2010 The Authors. Ecography # 2010 Ecography
Subject Editors: Carsten Rahbek and Niklaus Zimmermann. Accepted 18 August 2010
1070
SDM
SPEC
IAL
ISSU
E:
SPEC
IESD
ISTRIB
UTIO
NM
OD
ELLIN
G
Ricklefs 1993, Ricklefs 2004, Svenning and Skov 2007a).Nevertheless, tropical rainforest regions may also showgeographic variation in species richness driven by regionallegacies of past climate change (Stropp et al. 2009). Giventhis complexity, an analytical framework that integratesboth local and regional mechanisms is required forimproving our understanding of the causes of variation inlocal species richness.
In this paper, we implement a novel approach to assess thelocal vs regional control of local species richness and theprobable mechanisms involved. Local environment controlsthe realized local species pool by ecological sorting. Hence,we first identify species pools that tolerate particular localenvironments and quantify the proportion of the pool that ispresent locally. This proportion defines the realized/poten-tial (R/P) richness ratio. Because the R/P richness ratiodirectly takes ecological sorting into account, analyzingpatterns in this diversity measure allows us to focus on asuite of less well-understood factors that potentially impactlocal richness. We assess two hypotheses regarding thepotential regional drivers, and two hypotheses regardingthe potential local drivers of geographic variation in the R/Prichness ratio. The R/P richness ratio should reflect regionalcontrol by 1) decreasing with increasing isolation fromglacial refugia (accessibility) when postglacial range expan-sion of species is dispersal limited (Svenning and Skov2007a) and 2) by decreasing with increasing fragmentationof a region by physical dispersal barriers such as sea straits andmountain ranges (Nekola and White 1999, Bjorholm et al.2008). That is, if immigration from the regional species poolcontrols local richness, then the degree to which localcommunity richness approaches the regional species poolwill decrease with the increasing importance of dispersallimitation as a range constraint (cf. MacArthur and Wilson1967). In contrast, the R/P richness ratio should reflect localcontrol 1) by increasing with increasing availability of waterand energy, as these resources should promote the persistenceof local populations (O’Brien et al. 2000, Hawkins et al.2003, Currie et al. 2004), and 2) by increasing withtopographic heterogeneity, which provides greater habitatdiversity and surface area, thereby promoting local speciescoexistence (Simpson 1964, O’Brien et al. 2000). Topo-graphic heterogeneity additionally may impact diversity as amore regional-level control by facilitating the long-term localsurvival of species despite the repeated Pleistocene macro-climatic changes (Bennett et al. 1991, McGlone 1996, Loboet al. 2001, Svenning and Skov 2007b).
We use the European tree flora as our study systembecause its current ecology and historical distribution isrelatively well understood, making it an ideal system forcritical interpretation of the R/P richness ratio as a newdiversity measure. Notably, Pleistocene climate changeshave strongly influenced European tree diversity and treespecies ranges (Bennett et al. 1991, Latham and Ricklefs1993, Svenning 2003, Svenning and Skov 2004, Leroy andArpe 2007, Svenning et al. 2008a), and current speciesrichness patterns reflect these historical dynamics (Svenningand Skov 2005, 2007a, b). However, contemporary climate,other environmental factors, and the intense human impacton the European landscapes join these legacies as criticalinfluences on tree species richness patterns in Europe(Svenning and Skov 2005, 2007a, b). Finally, given that
our study is the first to investigate the R/P richness ratio, noestablished methodology exists for estimating it. We explorehow three different methods of species pool estimationinfluence the magnitude and geographic patterns of the R/Prichness ratio and inferences on its drivers. We note that theregional species pool in the present study is estimated takingthe whole European tree flora into consideration. Speciesdistribution modeling (SDM) offers an obvious approachfor estimating potential richness (P) and hence R/P, butthere are numerous SDM algorithms with marked differ-ences in how closely they can fit complex species!climaterelationships (Guisan and Zimmerman 2000, Elith et al.2006). We implement an envelope model using a few keybioclimatic predictor variables, as an SDM that may bemore likely to represent the potential distribution of aspecies than would a more flexible fit-maximizing approach.We also implement a state-of-the-art presence/absence datamodeling approach in combination with more comprehen-sive sets of predictor variables. This approach likelyfits realized distributions closely, with fewer areas of over-prediction, thus providing conservative estimates of P.Finally, as an alternative to the SDM-based approaches,we use quantile regression to estimate potential richness bymodeling maximum species richness in relation to environ-mental predictors (Cade and Noon 2003). Here, potentialrichness is estimated without the need to estimate thepotential distribution of each individual species, but islimited to be no greater than the maximum observedrichness and might thus be more constrained by the realizedspecies richness patterns than the simple envelope SDMapproach. While the approaches are strongly divergentmethodologically, they are also all potentially valid andcomparisons among them of their estimates of P and R/Pand their spatial patterning remain unexplored.
Materials and methods
Study region and species
We used tree species distribution data from Atlas FloraeEuropaeae (AFE) that were mapped on an equal-area gridwith cells of approximately 50"50 km (AFE cells; Jalasand Suominen 1972!1994). The study area (n#2264 AFEcells) included most of Europe within 348N!718N and118W!328W. We excluded the former Soviet Union, wherethe sampling effort has been relatively limited and variable,and a small number of mostly coastal cells with missingenvironmental data (Fig. 1). The study species were the 58species of tall trees (]20 m) in AFE that occur in the studyarea, approximately 70% of the]20-m-tall trees in Europe.We use the same dataset as Svenning and Skov (2005), butinclude several additional species: Abies nebrodensis, Juni-perus thurifera, Platanus orientalis, Quercus trojana, andSalix caprea. Further, several taxonomic changes have beenmade: Pinus mugo, P. rotundata, and P. uncinata have beenplaced in P. mugo, Quercus pedunculiflora has been mergedinto Q. robur, Q. rotundifolia into Q. ilex, and Q. sicula intoQ. pubescens. We included all native occurrences as well asoccurrences of uncertain native status in the modeling,while naturalized occurrences were excluded (statusfrom AFE).
1071
SDM
SPEC
IAL
ISSU
E:
SPEC
IESD
ISTRIB
UTIO
NM
OD
ELLIN
G
Predictor variables
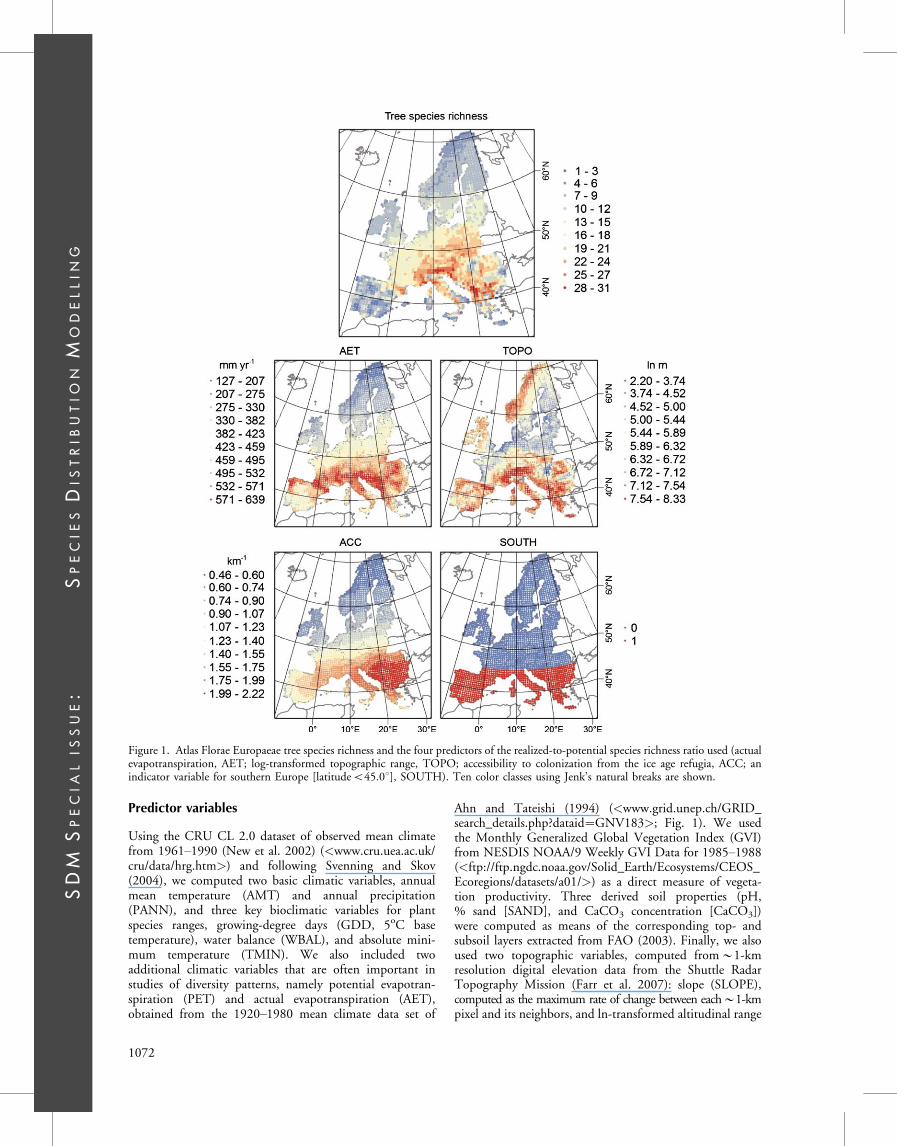
Using the CRU CL 2.0 dataset of observed mean climatefrom 1961!1990 (New et al. 2002) (/<www.cru.uea.ac.uk/cru/data/hrg.htm/>) and following Svenning and Skov(2004), we computed two basic climatic variables, annualmean temperature (AMT) and annual precipitation(PANN), and three key bioclimatic variables for plantspecies ranges, growing-degree days (GDD, 5oC basetemperature), water balance (WBAL), and absolute mini-mum temperature (TMIN). We also included twoadditional climatic variables that are often important instudies of diversity patterns, namely potential evapotran-spiration (PET) and actual evapotranspiration (AET),obtained from the 1920!1980 mean climate data set of
Ahn and Tateishi (1994) (/<www.grid.unep.ch/GRID_search_details.php?dataid#GNV183/>; Fig. 1). We usedthe Monthly Generalized Global Vegetation Index (GVI)from NESDIS NOAA/9 Weekly GVI Data for 1985!1988(/<ftp://ftp.ngdc.noaa.gov/Solid_Earth/Ecosystems/CEOS_Ecoregions/datasets/a01//>) as a direct measure of vegeta-tion productivity. Three derived soil properties (pH,% sand [SAND], and CaCO3 concentration [CaCO3])were computed as means of the corresponding top- andsubsoil layers extracted from FAO (2003). Finally, we alsoused two topographic variables, computed from!1-kmresolution digital elevation data from the Shuttle RadarTopography Mission (Farr et al. 2007): slope (SLOPE),computed as the maximum rate of change between each!1-kmpixel and its neighbors, and ln-transformed altitudinal range
Figure 1. Atlas Florae Europaeae tree species richness and the four predictors of the realized-to-potential species richness ratio used (actualevapotranspiration, AET; log-transformed topographic range, TOPO; accessibility to colonization from the ice age refugia, ACC; anindicator variable for southern Europe [latitudeB45.08], SOUTH). Ten color classes using Jenk’s natural breaks are shown.
1072
SDM
SPEC
IAL
ISSU
E:
SPEC
IESD
ISTRIB
UTIO
NM
OD
ELLIN
G
(TOPO) within an AFE grid cell, following O’Brien et al.(2000) (Fig. 1). Apart from TOPO, all environmentalvariables were recomputed as averages per AFE cell.
In addition to these local environmental variables, wealso calculated two regional predictor variables. Onevariable, accessibility (ACC) to postglacial recolonizationfrom the ice-age forest refugia, represents how easily a sitecould be reached by migration from the ice age refugia.We computed this variable by modifying and extending theapproach described in Svenning and Skov (2007a) andSvenning et al. (2008b). For each AFE cell, we computedACC as S(dij$1), where dij is the distance from the focal celli to a refuge cell j and the sum is taken across all j. Fourestimates of the locations of the potential major forestrefugia were computed by combining the two differentglacial (Last Glacial Maximum, LGM) climate data setsdeveloped in Svenning et al. (2008a) with two variations ofthe minimum climatic requirements for cool-temperatetrees developed by Leroy and Arpe (2007). Areas assessedsuitable for cool-temperate trees had GDD ]8008C, meantemperature of the coldest month ]$158C, and summerprecipitation]50 mm, or fulfilled just the GDD andtemperature requirements. The potential forest refugiawere computed at 10’ resolution and summarized perAFE cell, by classifying an AFE cell as a potential refuge if itincluded at least one 10’ pixel classified as a potentialrefuge, for Europe and Asia Minor east to 50.08 longitude.Hence, ACC incorporates postglacial recolonization fromrefuge areas east of the European study area otherwise notused in this study. Using an ensemble approach (Araujo andNew 2007), we represented ACC in the further analyses asthe mean of the four estimates, i.e. across two LGM climatescenarios and two models for the climate conditions neededfor major tree refugia (Fig. 1). Last, an indicator variablewas used to capture the contrast between the geographicallyfragmented southern Europe and the more continuous andhomogeneous northern Europe (SOUTH: 1: latitudeB45.08; 0: latitude ]45.08; Fig. 1).
Estimating realized-to-potential richness ratio
Potential richness is an estimate of the number of speciesthat could occur in an AFE cell given its environment, i.e.the ecologically relevant part of the regional species pool.Because no consensus exists on how to estimate potentialrichness, we used three distinct approaches to compute thepotential richness of a given AFE cell. Two approaches werebased on estimating the potential distributions of individualspecies using species distribution modeling (SDM: Guisanand Zimmerman 2000) and computing the potentialrichness by summing these; the third approach was basedon modeling potential species richness using quantileregression (Cade and Noon 2003). We evaluated the R/Prichness ratio obtained using each of these approachesindependently and then, because it was unclear whichmethod would lead to the most accurate estimate, we alsocombined the models using an ensemble approach, whichhandles modeling uncertainties by emphasizing consistentpatterns (Araujo and New 2007).
One of the SDM approaches (hereafter termed theproSDM approach) used a profile technique based on the
modified, fuzzy version of the simple rectilinear bioclimaticenvelope approach described in Svenning and Skov (2004).We used only three bioclimatic variables (GDD, TMIN,WBAL) for which there is strong a priori knowledge of theirimportance in plant physiology to predict species distribu-tions (Svenning and Skov 2004). For each species, all AFEcells in which a given species was recorded as present wereselected, and the following values were calculated for eachbioclimatic predictor based on its frequency distribution:the 5th percentile (B), the 25th percentile (C), the 75thpercentile (D), and the 95th percentile (E). To avoid over-estimating the envelopes due to potential outliers, the lower(A) and upper (F) limits of the envelope for a given variablewere then calculated as A#B$0.1"(C$B) and F#E%0.1"(E$D), respectively. Finally, a species was consid-ered potentially present in a given AFE cell when the cell’senvironment fell within the estimated envelope for all threebioclimatic predictors.
The other SDM approach (hereafter termed the paSDMapproach) was based on sophisticated presence/absence datamodeling (group discrimination techniques) using theBIOMOD framework (Thuiller et al. 2009). BIOMODcontains multiple algorithms for modeling species distribu-tions; for this study, we used both generalized linear models(GLMs) and random forest (RF). Both of these methodsare considered robust for capturing species!environmentrelationships (Elith et al. 2006, Lawler et al. 2006, Iversonet al. 2008), but differ markedly in their approach for doingso. For each species, we used the two modeling algorithmswith two sets of predictor variables: a simple set consistingof only the five variables GDD, TMIN, WBAL, pH, andSLOPE, and an expanded set additionally including AMT,PANN, AET, PET, GVI, SAND, and CaCO3. Bothpredictor sets were larger than the proSDM set becausewe wanted to represent more comprehensive sets ofpotential environmental range controls in the paSDMapproach. The GLMs were fitted with linear, quadratic,and cubic polynomial terms, and Akaike’s informationcriterion (AIC) was used to select the most parsimoniousmodel (Burnham and Anderson 2002). For RF, we usedBIOMOD’s default settings and grew 500 classificationtrees per species. Within BIOMOD, distribution data foreach species were partitioned randomly 50 times intocalibration (70%) and evaluation (30%) datasets, andmodels were run on each of the 50 resulting datasets foreach species. Model accuracy was calculated using the TrueSkill Statistic (TSS, Allouche et al. 2006). The TSS, anestablished approach for assessing the accuracy of weatherforecasts, compares the number of correct forecasts, minusthose attributable to random guessing, to that of ahypothetical set of perfect forecasts. For a 2"2 confusionmatrix, TSS is defined as TSS#sensitivity%specificity$1.It takes into account both omission and commission errorsand success as a result of random guessing, and ranges from$1 to %1, where %1 indicates perfect agreement andvalues of zero or less indicate a performance no better thanrandom. The TSS has recently been shown to be superior tokappa, as the former is not affected by species prevalence(Allouche et al. 2006). The probability of occurrence wasconverted into binary presence/absence using the thresholdmaximizing TSS. To synthesize the four resulting potentialrichness estimates (2 algorithms"2 sets of predictor
1073
SDM
SPEC
IAL
ISSU
E:
SPEC
IESD
ISTRIB
UTIO
NM
OD
ELLIN
G

variables), we took the average, i.e., again using an ensembleapproach (Araujo and New 2007). Because the SDMapproaches deteriorate with small sample sizes, bothproSDM and paSDM were implemented only for specieswith at least 20 occurrences (n#52 of 58 species), and theR/P richness ratios were consequently computed using therealized richness based on only these species. However,estimates of realized richness based on either the reduced orfull species data sets were highly correlated (r#0.9997).
As an alternative to the SDM approaches, we usedquantile regression to model the maximum tree speciesrichness across Europe given the environmental conditions(Cade and Noon 2003). We first selected the environ-mental predictors based on spatial regression modelingimplemented using ordinary least-squares (OLS) multipleregression. Based on the literature on plant diversitycontrols (O’Brien et al. 2000, Hawkins et al. 2003,Svenning et al. 2009), we considered the following suiteof 13 models: PANN%PET%PET2%TOPO, PANN%PET%PET2, AET%PET%WBAL%TOPO%GVI%pH,AET%PET%WBAL%TOPO, AET%WBAL%TOPO,AET%PET%TOPO, PET%WBAL%TOPO, AET%PET%WBAL, AET%WBAL, AET%PET, PET%WBAL, AET%TOPO, and AET. Model selection wasdone using AIC-based information-theoretic model selec-tion (Burnham and Anderson 2002). Because significantspatial autocorrelation remained in the regression residualsof the best model, we then repeated the regression modelingusing eigenvector-based spatial filtering (Diniz-Filho andBini 2005) to ensure that spatial autocorrelation didnot bias the model selection (Diniz-Filho et al. 2008).The spatial filters were generated as the eigenvectors of aPrincipal Coordinate Analysis of a pairwise matrix ofgeographic distances between all AFE cells, following theapproach of Diniz-Filho and Bini (2005). Geographicdistances were truncated at 600 km because at approxi-mately this distance, positive spatial autocorrelation becamenegligible (Diniz-Filho and Bini 2005). The spatial filterswere then added to the OLS regression models to controlfor spatial autocorrelation, thus allowing unbiased estimatesof regression coefficients and their significance levels. Theselection of spatial filters was done for the best unfilteredmodel, adding successively higher-order filters until spatialautocorrelation was negligible in the regression residuals(Moran’s IB0.100 for the 22 default distance classes inSAM [Rangel et al. 2006]). We considered only the first 50filters in the modeling.
After establishing the best predictive model for treespecies richness, we then reran the model using quantileregression (Cade and Noon 2003) to determine themaximum observed richness given the predictor variablesin the best spatial regression model. Quantile regressionallows analysis of the upper or lower limits of a variablerather than focusing on the mean. By modeling maximumspecies richness, this approach represents a conservativeassessment of how many species could potentially coexist inan AFE cell given its environmental conditions. Similarly,quantile regression has been used to model habitatinvasibility, as modeling of the upper limit of the richnessof invasive species would be more meaningful than meanrichness because many exotics are likely to be dispersallimited and absent from many suitable sites (Brown and
Peet 2003). Here, we represented the maximum tree speciesrichness by modeling the 95% quantile. After fitting the95% quantile regression model, we then projected it backonto the study area to estimate the potential maximumrichness per AFE cell. Although the AET%PET%WBAL%TOPO%GVI%pH model clearly emerged asthe best (with an Akaike weight of 1.00 (without filters)and 0.98 (with filters)), the adjusted R2 of the second-bestand more parsimonious model, AET%PET%TOPO, wasonly marginally lower (0.579 vs 0.585 without filters and0.725 vs 0.726 with filters). Therefore, using an ensembleapproach, we calculated the potential maximum richness asthe mean of the predictions from these two models.
For each of the three estimates of the potential richnessper AFE cell, we computed the R/P richness ratio, resettingthe ratio to 1 whenever it exceeded 1 or when the potentialrichness was estimated to be zero, since the meaningfulinterpretation in either case would be that as many speciesas could be present were indeed present. We assessed theconsistency of the three estimates in terms of magnitudeand pattern, using paired t-tests and correlation, respec-tively. To develop the ensemble prediction from the threeapproaches used to calculate R/P ratios, we subjected thethree R/P ratio estimates to a Principal ComponentsAnalysis (PCA) using their correlation matrix (to ensurethat the three estimates received equal weight). We thenused the resulting first principal component as the ensembleconsensus estimate (PC-R/P) because it was as close to all ofthe R/P estimates as possible.
Realized-to-potential richness ratio determinants
We used OLS multiple regression to test the fourhypothesized determinants of spatial variation in theR/P richness ratio. We also ran the regression modelswith spatial filtering (Diniz-Filho and Bini 2005) whennon-negligible spatial autocorrelation remained in the OLSmodel residuals (Moran’s i ]0.100 for the 22 defaultdistance classes). We used the minimum spanning treeapproach to select the truncation distance (254 km) for thecomputation of the spatial filters because spatial autocorre-lation for PC-R/P became negligible after!200 km.We implemented spatial filtering using two approaches.First, we used the residual SAC (spatial autocorrelation)approach, in which all filters that were significantlycorrelated to the OLS model residuals were added using amixed stepwise selection procedure with probability-to-enter and probability-to-leave equal to 0.05. This isequivalent to the SEVM-v3 approach of Bini et al.(2009), which was highlighted as one of two methodsthat best simultaneously minimized residual spatial auto-correlation and coefficient shifts. The second approach wasthe variance inflation factor (VIF) approach, in whichspatial filtering was done by successively adding higher-order filters to the OLS regression model until spatialautocorrelation was negligible in the regression residuals(Moran’s iB0.100 for the 22 default distance classes;Diniz-Filho and Bini 2005), but with two restrictions:first, a filter was added to the model only if it had asignificant effect (pB0.05), and was excluded again if itbecame non-significant with the addition of a higher-order
1074
SDM
SPEC
IAL
ISSU
E:
SPEC
IESD
ISTRIB
UTIO
NM
OD
ELLIN
G
filter. Second, to avoid introducing multicollinearity pro-blems (Graham 2003), any filter that caused the VIF forany of the four explanatory variables to reach 5.000 orabove was not added to the model. Only the first 75 filterswere considered in the latter approach because the VIFlimitation strongly constrained the scope for filter additionbeyond the first 50 filters. For proportional data such as theR/P richness ratios, arcsin square-root transformation mayimprove normality of residuals. In the present case, the OLSresiduals were close to normal (skewness and kurtosisBj1.0j) for R/P-proSDM and -QR, while less so for R/P-paSDM (skewness#$1.50 and kurtosis#4.72). Whiletransformation improved normality of the latter residuals, itdecreased normality of residuals for for R/P-proSDM and-QR. Hence, we report the results based on the raw R/Prichness ratio values, noting that transformation only causedminor changes in the importance of predictors.
We carried out the proSDM approach in ArcGIS 9.3using a script by F. Skov, while for the paSDM approach weused BIOMOD (Thuiller et al. 2009) in R 2.7.2 (RDevelopment Core Team 2008). We used the quantreqpackage (Koenker 2008) in R 2.8.1 (R Development CoreTeam 2008) to implement quantile regression. We usedSAM 3.0 (Rangel et al. 2006) for computing spatial filtersand the spatial R/P richness ratio modeling and used JMP7.0 (SAS Inst., Cary, NC) for the PCA.
Results
The R/P richness ratio ! consistency of the estimates
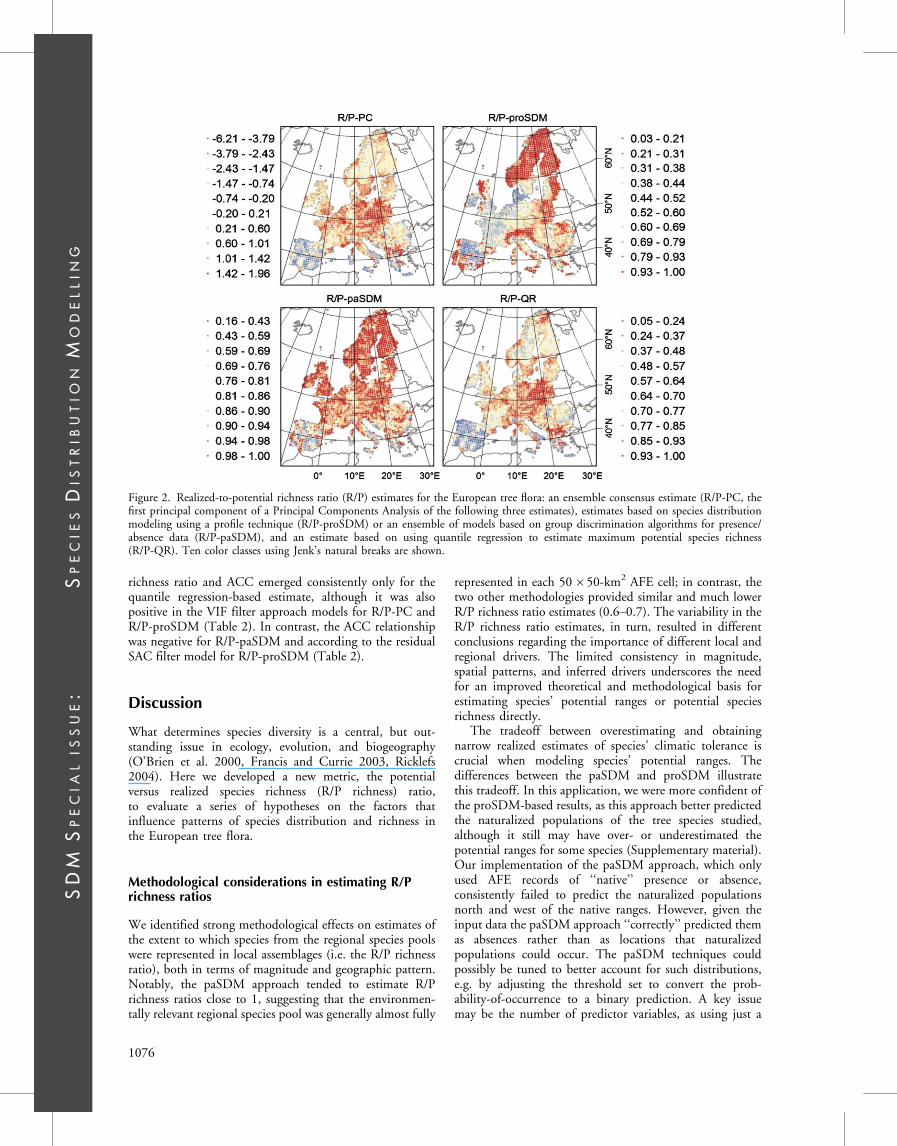
The R/P richness ratio estimates were particularly high (i.e.close to 1) for the paSDM approach, while the two otherapproaches provided similar, but much lower estimates(Table 1). In terms of their spatial patterning, the threeapproaches were only partially consistent (Fig. 2) withlow (those involving proSDM) to moderate correlations(Table 1). Nevertheless, the ensemble consensus estimate ofthe R/P richness ratio (R/P-PC) represented consistentpatterns among the three and accounted for 64% of theirvariation (Table 1). R/P-PC was most correlated to thepaSDM- and QR-based estimates, with the major consistent
patterns being a low R/P richness ratio on the IberianPeninsula and a high ratio in the Alps and eastern Europe(Table 1, Fig. 2).
Determinants of the R/P richness ratio pattern
Regarding the drivers of geographic variation in the R/Prichness ratio, we predicted that the ratio would 1) increasewith increasing accessibility to postglacial recolonizationfrom the ice-age forest refugia (ACC); 2) be generallylow in the geographically fragmented southern Europe(SOUTH#1); 3) increase with water-energy (representedby AET); and 4) increase with topographic heterogeneity(TOPO). Several aspects of the results complicate inter-pretation, however. Most notable were the strong differ-ences among the models in the statistical relationshipsbetween the R/P richness ratio and its hypothesizeddeterminants (Table 2). Furthermore, while the residualSAC filtering approach was the only approach thatsuccessfully removed residual spatial autocorrelation for allR/P richness ratio estimates, it was potentially compromisedby multicollinearity, with high VIFs for all predictorvariables (but especially for ACC; Table 2).
The most consistent pattern in the results was that theR/P richness ratio, as predicted, was lower in the geogra-phically fragmented southern Europe (Table 2). The onlymodel that did not show this effect was the model for theproSDM-based estimate under the residual SAC filteringapproach. However, here a strong and unique negativerelationship between ACC and the R/P richnessratio probably substituted for the south-vs-north contrast(Table 2). In addition, in all models and consistent with ourhypothesis, there was a general positive relationship betweenthe R/P richness ratio and TOPO, although this relation-ship was not always significant (Table 2).
The other hypothesized relationships did not receive asconsistent support across all methodologies. The modeling ofthe ensemble consensus estimate (R/P-PC) indicated thatthe R/P richness ratio increased with AET, as predicted(Table 2). However, the relationship between AET and R/Prichness ratio was always negative for the proSDM-basedestimate and absent for the paSDM-based estimate (Table 2).The hypothesized positive relationship between the R/P
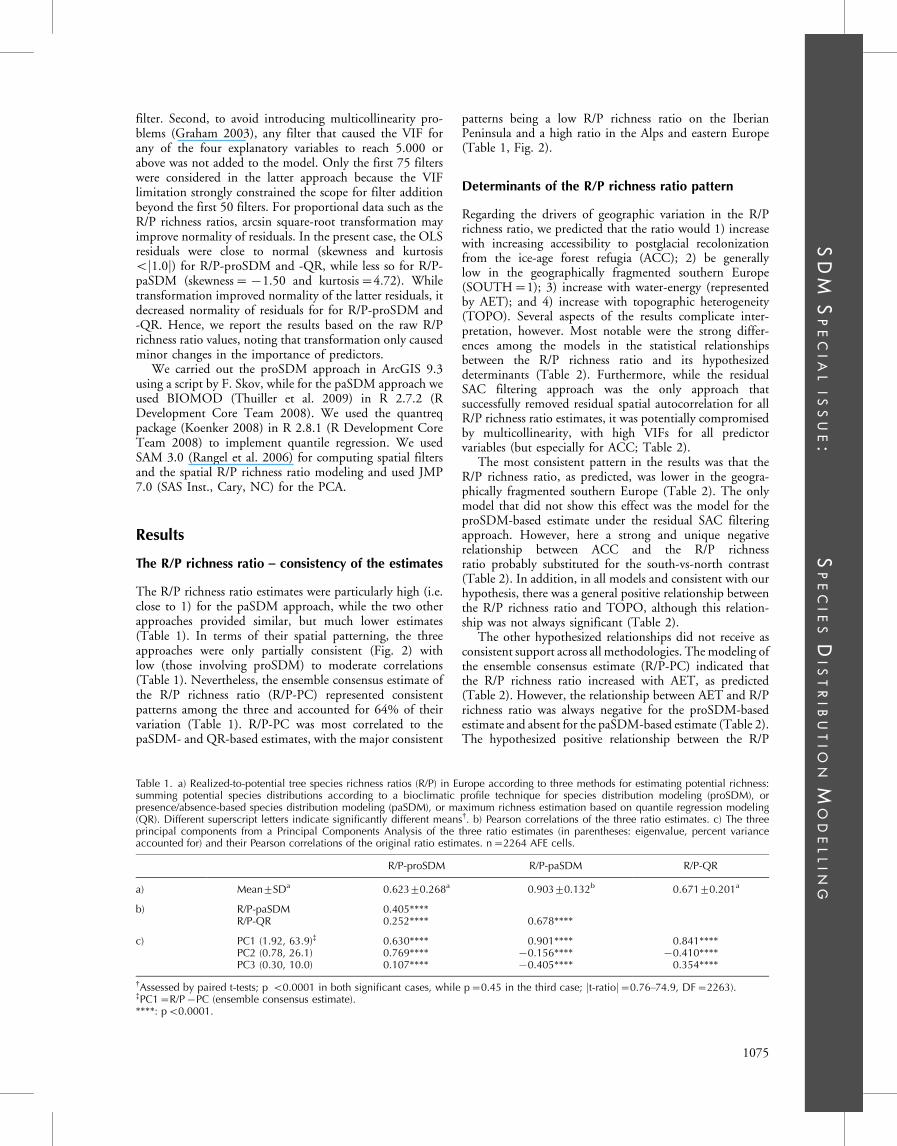
Table 1. a) Realized-to-potential tree species richness ratios (R/P) in Europe according to three methods for estimating potential richness:summing potential species distributions according to a bioclimatic profile technique for species distribution modeling (proSDM), orpresence/absence-based species distribution modeling (paSDM), or maximum richness estimation based on quantile regression modeling(QR). Different superscript letters indicate significantly different means$. b) Pearson correlations of the three ratio estimates. c) The threeprincipal components from a Principal Components Analysis of the three ratio estimates (in parentheses: eigenvalue, percent varianceaccounted for) and their Pearson correlations of the original ratio estimates. n#2264 AFE cells.
R/P-proSDM R/P-paSDM R/P-QR
a) Mean9SDa 0.62390.268a 0.90390.132b 0.67190.201a
b) R/P-paSDM 0.405****R/P-QR 0.252**** 0.678****
c) PC1 (1.92, 63.9)% 0.630**** 0.901**** 0.841****PC2 (0.78, 26.1) 0.769**** $0.156**** $0.410****PC3 (0.30, 10.0) 0.107**** $0.405**** 0.354****
$Assessed by paired t-tests; p B0.0001 in both significant cases, while p#0.45 in the third case; jt-ratioj#0.76!74.9, DF#2263).%PC1#R/P$PC (ensemble consensus estimate).****: pB0.0001.
1075
SDM
SPEC
IAL
ISSU
E:
SPEC
IESD
ISTRIB
UTIO
NM
OD
ELLIN
G
richness ratio and ACC emerged consistently only for thequantile regression-based estimate, although it was alsopositive in the VIF filter approach models for R/P-PC andR/P-proSDM (Table 2). In contrast, the ACC relationshipwas negative for R/P-paSDM and according to the residualSAC filter model for R/P-proSDM (Table 2).
Discussion
What determines species diversity is a central, but out-standing issue in ecology, evolution, and biogeography(O’Brien et al. 2000, Francis and Currie 2003, Ricklefs2004). Here we developed a new metric, the potentialversus realized species richness (R/P richness) ratio,to evaluate a series of hypotheses on the factors thatinfluence patterns of species distribution and richness inthe European tree flora.
Methodological considerations in estimating R/Prichness ratios
We identified strong methodological effects on estimates ofthe extent to which species from the regional species poolswere represented in local assemblages (i.e. the R/P richnessratio), both in terms of magnitude and geographic pattern.Notably, the paSDM approach tended to estimate R/Prichness ratios close to 1, suggesting that the environmen-tally relevant regional species pool was generally almost fully
represented in each 50"50-km2 AFE cell; in contrast, thetwo other methodologies provided similar and much lowerR/P richness ratio estimates (0.6!0.7). The variability in theR/P richness ratio estimates, in turn, resulted in differentconclusions regarding the importance of different local andregional drivers. The limited consistency in magnitude,spatial patterns, and inferred drivers underscores the needfor an improved theoretical and methodological basis forestimating species’ potential ranges or potential speciesrichness directly.
The tradeoff between overestimating and obtainingnarrow realized estimates of species’ climatic tolerance iscrucial when modeling species’ potential ranges. Thedifferences between the paSDM and proSDM illustratethis tradeoff. In this application, we were more confident ofthe proSDM-based results, as this approach better predictedthe naturalized populations of the tree species studied,although it still may have over- or underestimated thepotential ranges for some species (Supplementary material).Our implementation of the paSDM approach, which onlyused AFE records of ‘‘native’’ presence or absence,consistently failed to predict the naturalized populationsnorth and west of the native ranges. However, given theinput data the paSDM approach ‘‘correctly’’ predicted themas absences rather than as locations that naturalizedpopulations could occur. The paSDM techniques couldpossibly be tuned to better account for such distributions,e.g. by adjusting the threshold set to convert the prob-ability-of-occurrence to a binary prediction. A key issuemay be the number of predictor variables, as using just a
Figure 2. Realized-to-potential richness ratio (R/P) estimates for the European tree flora: an ensemble consensus estimate (R/P-PC, thefirst principal component of a Principal Components Analysis of the following three estimates), estimates based on species distributionmodeling using a profile technique (R/P-proSDM) or an ensemble of models based on group discrimination algorithms for presence/absence data (R/P-paSDM), and an estimate based on using quantile regression to estimate maximum potential species richness(R/P-QR). Ten color classes using Jenk’s natural breaks are shown.
1076
SDM
SPEC
IAL
ISSU
E:
SPEC
IESD
ISTRIB
UTIO
NM
OD
ELLIN
G
few predictors as in the proSDM implementation will leadto relatively broad estimates of niches and potentialdistributions, while using rather many predictors as in thepaSDM implementation will have the opposite effect,irrespective of the SDM algorithms used. Hence, thenumber of predictors used is likely to affect R/P richnessratio estimates, making careful consideration of what factorsdefine a species’ niche at the scale studied of paramountimportance. Unfortunately, this remains a largely unre-solved issue, even for a well-studied group like the Europeantrees. Alternative SDM methodologies to those implemen-ted here are being used to handle non-equilibriumdistributions. For example, using spatial filters as predictors(spatial eigenvector mapping) can improve predictions insuch cases (De Marco et al. 2008; cf. Blach-Overgaard et al.2010 for an empirical case). However, the inclusion ofspatial constraints in the modeling will cause modelpredictions to represent realized rather than potentialdistributions, and hence will not be suitable for estimatingP and R/R richness ratios. The quantile regression-basedapproach directly estimates potential richness and thusavoids the complications associated with estimating poten-tial distributions. However, potential richness can never behigher than maximum observed richness in this method(Cade and Noon 2003), thereby somewhat constrainingP towards R. Nevertheless, the low R/P-QR values ! similarto R/P-proSDM ! show that this effect was not strong inour case. We emphasize that also in this approach thenumber of predictors will determine how closely the P
estimate will be constrained by R. Regarding the ensembleconsensus estimate, it was particularly representative for thepaSDM-based method and must therefore to some extentbe similarly compromised. Given these considerations,when interpreting our results we emphasize the mostconsistent patterns. Following the ensemble approach logic(Araujo and New 2007), we considered relationships thatconsistently emerged using all four R/P richness ratioestimates as those with the strongest support. However,we also discuss relationships that were consistent for just theproSDM and quantile regression approaches as theseseemed to provide the most credible R/P richness ratioestimates (see above).
An additional methodological source of variability alsorequires consideration, namely the regression modelingused to assess the importance of the potential R/P richnessratio determinants. Spatial autocorrelation in the modelresiduals and multicollinearity are two factors that maycompromise regression results (Graham 2003, Dormannet al. 2007). In the present study, positive residual spatialautocorrelation compromised the OLS regression results.To account for this spatial autocorrelation, we repeated theregression modeling using two implementations of eigen-vector-based spatial filtering (Diniz-Filho and Bini 2005).The residual SAC (spatial autocorrelation) approach,as expected, most effectively removed residual spatialautocorrelation, but at the same time introduced multi-collinearity, with VIFs for ACC, SOUTH, and AETalways"5 and often"10. The VIFs were especially high
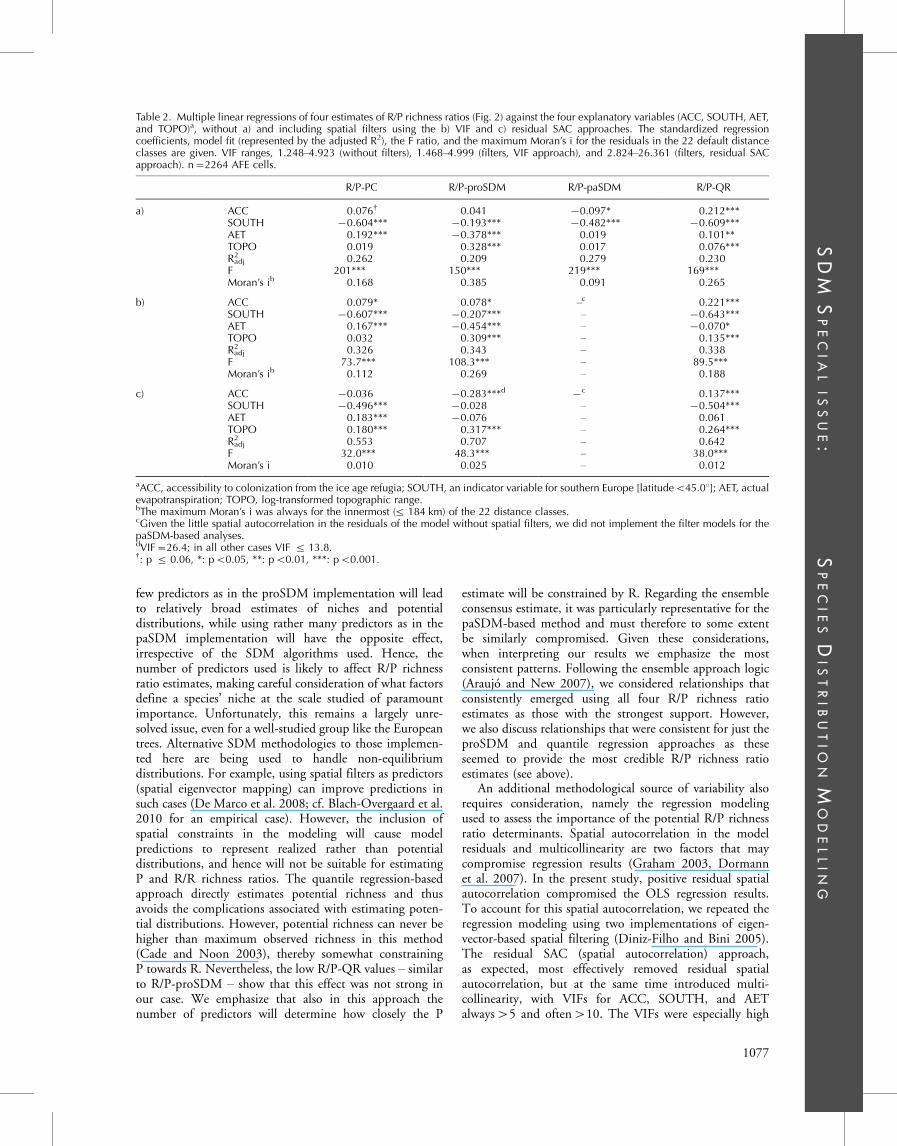
Table 2. Multiple linear regressions of four estimates of R/P richness ratios (Fig. 2) against the four explanatory variables (ACC, SOUTH, AET,and TOPO)a, without a) and including spatial filters using the b) VIF and c) residual SAC approaches. The standardized regressioncoefficients, model fit (represented by the adjusted R2), the F ratio, and the maximum Moran’s i for the residuals in the 22 default distanceclasses are given. VIF ranges, 1.248!4.923 (without filters), 1.468!4.999 (filters, VIF approach), and 2.824!26.361 (filters, residual SACapproach). n#2264 AFE cells.
R/P-PC R/P-proSDM R/P-paSDM R/P-QR
a) ACC 0.076$ 0.041 $0.097* 0.212***SOUTH $0.604*** $0.193*** $0.482*** $0.609***AET 0.192*** $0.378*** 0.019 0.101**TOPO 0.019 0.328*** 0.017 0.076***R2adj 0.262 0.209 0.279 0.230
F 201*** 150*** 219*** 169***Moran’s ib 0.168 0.385 0.091 0.265
b) ACC 0.079* 0.078* !c 0.221***SOUTH $0.607*** $0.207*** ! $0.643***AET 0.167*** $0.454*** ! $0.070*TOPO 0.032 0.309*** ! 0.135***R2adj 0.326 0.343 ! 0.338
F 73.7*** 108.3*** ! 89.5***Moran’s ib 0.112 0.269 ! 0.188
c) ACC $0.036 $0.283***d $c 0.137***SOUTH $0.496*** $0.028 ! $0.504***AET 0.183*** $0.076 ! 0.061TOPO 0.180*** 0.317*** ! 0.264***R2adj 0.553 0.707 ! 0.642
F 32.0*** 48.3*** ! 38.0***Moran’s i 0.010 0.025 ! 0.012
aACC, accessibility to colonization from the ice age refugia; SOUTH, an indicator variable for southern Europe [latitudeB45.08]; AET, actualevapotranspiration; TOPO, log-transformed topographic range.bThe maximum Moran’s i was always for the innermost (5 184 km) of the 22 distance classes.cGiven the little spatial autocorrelation in the residuals of the model without spatial filters, we did not implement the filter models for thepaSDM-based analyses.dVIF#26.4; in all other cases VIF 5 13.8.$: p 5 0.06, *: pB0.05, **: pB0.01, ***: pB0.001.
1077
SDM
SPEC
IAL
ISSU
E:
SPEC
IESD
ISTRIB
UTIO
NM
OD
ELLIN
G
for ACC, reaching 26.4 for the proSDM approach. HighVIF values such as these can bias modeling results (Graham2003). As the alternative (VIF) filter selection approach atleast partially handled spatial autocorrelation withoutintroducing strong multicollinearity, we focus on the resultsbased on this method. Nevertheless, the two modelingapproaches provided generally similar results.
Local assemblages fail to realize a large proportion ofthe regional species pool
The proSDM- and quantile regression-based results sug-gested that, in general, the realized local species richness isconsiderably less than the environmentally relevant regionalspecies pool, namely 62!67%. These results thereforesupport the general hypothesis that ecological filtering bythe local environment does not exclusively determine localrichness, but that other mechanisms also play a role (Caleyand Schluter 1997, Zobel 1997, Ricklefs 2004). In relationto the European tree flora, our study extends previousfindings that many European tree species only partially filltheir potential climatic range (Svenning and Skov 2004).We note that although the proSDM methodologyis identical to that of Svenning and Skov (2004), thequantile regression approach is a very different methodol-ogy; nevertheless, it also resulted in low R/P richness ratioestimates. Given that local assemblages fail to realize a largeproportion of the environmentally relevant regional speciespool, understanding factors that determine local representa-tion of regional diversity becomes important (Caley andSchluter 1997).
Determinants of the R/P richness ratio pattern
With respect to the four hypothesized drivers, the mostconsistent and generally strongest pattern was the southernvs northern Europe contrast, with the R/P richness ratiobeing lowest in southern Europe, as predicted from thegreater geographic fragmentation of this region. This resultsuggests that mountain ranges and seaways can limitdispersal and thereby influence the extent to which regionalspecies pools are represented in local assemblages. Thisfinding is in agreement with island biogeographic theory,which predicts lower species richness where isolation isgreater (MacArthur and Wilson 1967). Numerous studieshave found support for isolation effects in island or island-like systems (Kreft et al. 2008), but not previously in abroad-scale continental setting. Greater spatial turnover inspecies composition in geographically complex regions suchas mountainous areas and archipelagos supports theinfluence of such barriers on individual species ranges(Nekola and White 1999, Bjorholm et al. 2008). Con-sidering European trees, we also note that numerous specieshave limited distributions within southern Europe, withoutobvious substitute species in the unoccupied regions. Forinstance, Carpinus betulus, Castanea sativa, Juglans regia,Ostrya carpinifolia, Platanus orientalis and Quercus cerris arewholly or largely missing from the Iberian Peninsula, andare not replaced by sister taxa in this region (Jalas andSuominen 1972!1994). For some species, the currentabsence or rarity of native populations on the Iberian
Peninsula can be attributed to failure to re-immigrate afterlocal extirpation during the Pleistocene glacials (PostigoMijarra et al. 2008), probably because of the barriers tomigration posed by the Pyrenees and the MediterraneanSea. We note that the southern vs northern Europe contrastonly represent patterns of geographic fragmentation in avery simple manner, and additionally will also incorporateother environmental and historical differences betweennorth and south, e.g. in terms of glacial refugia locationsfor trees (Bennett et al. 1991, Leroy and Arpe 2007,Svenning et al. 2008a).
Numerous previous studies have documented positiveeffects of topographic heterogeneity on species richness(Simpson 1964, Kerr and Packer 1997, O’Brien et al. 2000,Kreft et al. 2008). We extend these results to show thattopographic heterogeneity enhances the extent to whichregional species pools are represented locally. Topographicheterogeneity had a moderately strong and relativelyconsistent positive effect on the R/P richness ratio,supporting the hypothesis that topographic heterogeneityfacilitates a greater local representation of the regionalspecies pool. This higher R/P ratio may be accomplished bypromoting local species coexistence due to greater habitatdiversity (strong local climatic and edaphic gradients) andsurface area (Simpson 1964, O’Brien et al. 2000), as well aslong-term persistence of tree species populations underclimate change (McGlone 1996, Lobo et al. 2001, Svenningand Skov 2007b). In addition, species losses due to pasthuman impacts may have been smaller in topographicallyheterogeneous mountain areas, where human land use hasbeen less intensive (Lobo et al. 2001).
The R/P richness ratio generally increased with decreas-ing distance from ice-age forest refugia, especially for thequantile regression-based results. This finding supports thehypothesis that long-term lags in migration in relationto past climate changes may still limit species distributionsand broad-scale richness (Svenning and Skov 2007a,Svenning et al. 2008b), and also affect the richness of localassemblages by limiting the extent to which regional speciespools become represented locally. Although the proSDMapproach produced low R/P richness ratio estimates forWestern Europe, in agreement with the postglacial migra-tion lag hypothesis, the high R/P richness ratio estimates forScandinavia were contrary to this hypothesis (cf. the ACCpattern in Fig. 1). This pattern may result from a smallspecies pool for the harsh boreal climate, in combinationwith more numerous and more northerly ice-age refugia forboreal species (Willis and van Andel 2004, Svenning et al.2008a), facilitating rapid early range expansions anddiminishing the limiting effect of postglacial migrationlags. A recent study of forest plant species in northernEurope found that species with wide boreal distributions, asopposed to more strictly cool-temperate species, did nothave consistently higher prevalence where accessibility topostglacial recolonization was high (Svenning et al. 2008b).In addition, the coarse grain size in this study likely affectedour ability to assess accurately the cold climate limits foralpine species. Notably, Abies alba, Larix decidua, Pinuscembra, and P. mugo, important alpine tree species that arenot currently native in Scandinavia, were mainly predictedto have suitable areas in the southern parts of Scandinavia(cf. Svenning and Skov 2004). However, the cold climate
1078
SDM
SPEC
IAL
ISSU
E:
SPEC
IESD
ISTRIB
UTIO
NM
OD
ELLIN
G

limits of these species have been somewhat underestimated,with Abies alba reported to be naturalized in southernNorway and Larix deciduas, Pinus mugo to be widelynaturalized even to northern Norway, and Pinus cembra tohave escaped in scattered locations as far north as northernNorway (Lid and Lid 1994). Hence, the high R/P richnessratios for northern Europe according to the proSDM-approach are probably too high.
We found no consistent support for a positive depen-dency of the R/P richness ratio on AET. In fact, therelationship was often estimated to be negative. Thisfinding contrasts with the hypothesized positive effect ofwater-energy availability on species coexistence, and onlocal persistence more generally (O’Brien et al. 2000,Hawkins et al. 2003, Currie et al. 2004). While ecologicalfiltering by the local environment clearly affects realizedlocal tree species richness, we did not find much support forthis hypothesized additional environmental effect. Simi-larly, in their review of the evidence for hypothesizedclimate-based mechanisms of coarse-scale variation inspecies richness, Currie et al. (2004) concluded partiallyin favor of local ecological filtering according to species’tolerance limits but did not find consistent support for twoother climate-based mechanisms. Notably, the availabledata in that study did not support proposed links betweenenergy and the number of individuals or between thenumber of individuals and species richness, i.e. localpersistence (Currie et al. 2004). Regarding the thirdclimate-based mechanism, climatic effects on speciationrates (Currie et al. 2004), geographic variation in speciationrates is unlikely to be of much importance for Europeantree diversity patterns given the pre-Quaternary age of mostspecies (Mai 1995) and the subsequent strong reshuffling oftheir ranges induced by the Quaternary climatic oscillations(Bennett et al. 1991, Svenning et al. 2008a). Methodolo-gical issues may also contribute to the absence of supportfor the expected AET effect. Notably, AET may stronglyvary within 50"50 km grid cells, especially under thewarm southern macroclimate. Hence, we cannot rule outthat AET may have a stronger effect at a finer spatialresolution.
Conclusions
We believe that the R/P ratio developed here will provide auseful new metric to explore mechanisms driving variationin species diversity. It complements the commonly usedmetric of species richness by adding additional informationon how many species could be in a given location. ForEurope (at a 50"50-km2 grain) we provide evidence thatlocal tree assemblages often do not contain all of speciesfrom the environmentally relevant regional species pool.Moreover, the proportion of the regional species pool that isrepresented in local assemblages is predictable from thegeographical, historical, and environmental factors. Wefound consistent support for the hypotheses that geographicfragmentation of a region by physical dispersal barrierslowers the R/P richness ratio, while local topographicheterogeneity increases it. We obtained less conclusiveresults for the hypotheses that increasing isolation fromthe glacial refugia should decrease the R/P richness ratio or
that the energy!water balance influences this ratio. Theeffects of geographic fragmentation and accessibility torecolonization clearly exemplify regional controls thatsupplement ecological sorting by the local environment indetermining the local species richness (cf. Zobel 1997,Ricklefs 2004). Importantly, our results varied dependingon the method used to estimate the size of the region speciespool, highlighting the latter as a crucial, but non-trivialissue. Future studies should therefore focus not only onassessing the generality of the R/P richness ratio relation-ships found in the present study, but also on strengtheningthe theoretical and modeling basis for estimating localpotential richness.
Acknowledgements ! This paper is an outcome of the workshop‘‘The Utility of Species Distribution Models as Tools for AssessingImpacts of Global Change’’, held in Riederalp, Switzerland, 11!16August 2008. We thank the Atlas Florae Europaeae project foraccess to the distribution data. We gratefully acknowledgeeconomic support from the Danish Natural Science ResearchCouncil (grant #272-07-0242 to JCS) and the Faculty of Science,Aarhus Univ. (to SN).
References
Ahn, C.-H. and Tateishi, R. 1994. Development of global30-minute grid potential evapotranspiration data set. ! J.Jap. Soc. Photogramm. Remote Sens. 33: 12!21.
Allouche, O. et al. 2006. Assessing the accuracy of speciesdistribution models: prevalence, kappa and the true skillstatistic (TSS). ! J. Appl. Ecol. 43: 1223!1232.
Araujo, M. B. and New, M. 2007. Ensemble forecasting of speciesdistributions. ! Trends Ecol. Evol. 22: 42!47.
Bennett, K. D. et al. 1991. Quaternary refugia of north Europeantrees. ! J. Biogeogr. 18: 103!115.
Bini, L. M. et al. 2009. Coefficient shifts in geographical ecology:an empirical evaluation of spatial and non-spatial regression.! Ecography 32: 193!204.
Bjorholm, S. et al. 2008. To what extent does Tobler’s 1st lawof geography apply to macroecology? A case study usingAmerican palms (Arecaceae). ! BMC Ecol. 8: 11.
Blach-Overgaard, A. et al. 2010. Determinants of palm speciesdistributions across Africa: the relative roles of climate, non-climatic environmental factors, and spatial constraints.! Ecography 33: 380!391.
Brown, R. L. and Peet, R. K. 2003. Diversity and invasibilityof southern Appalachian plant communities. ! Ecology 84:32!39.
Burnham, K. P. and Anderson, D. R. 2002. Model selectionand multi-model inference: a practical information-theoreticapproach. ! Springer.
Cade, B. S. and Noon, B. R. 2003. A gentle introduction toquantile regression for ecologists. ! Front. Ecol. Environ. 1:412!420.
Caley, M. J. and Schluter, D. 1997. The relationship betweenlocal and regional diversity. ! Ecology 78: 70!80.
Currie, D. J. et al. 2004. Predictions and tests of climate-basedhypotheses of broad-scale variation in taxonomic richness.! Ecol. Lett. 7: 1121!1134.
De Marco, P. et al. 2008. Spatial analysis improves speciesdistribution modelling during range expansion. ! Biol. Lett. 4:577!580.
Diniz-Filho, J. A. F. and Bini, L. M. 2005. Modellinggeographical patterns in species richness using eigenvector-based spatial filters. ! Global Ecol. Biogeogr. 14: 177!185.
1079
SDM
SPEC
IAL
ISSU
E:
SPEC
IESD
ISTRIB
UTIO
NM
OD
ELLIN
G
Diniz-Filho, J. A. F. et al. 2008. Model selection and informationtheory in geographical ecology. ! Global Ecol. Biogeogr. 17:479!488.
Dormann, C. F. et al. 2007. Methods to account for spatialautocorrelation in the analysis of species distributional data: areview. ! Ecography 30: 609!628.
Elith, J. et al. 2006. Novel methods improve prediction of species’distributions from occurrence data. ! Ecography 29: 129!151.
FAO 2003. Digital soil map of the world and derived soilproperties. ! CD-ROM, Rome, Italy.
Farr, T. G. et al. 2007. The Shuttle Radar Topography Mission.! Rev. Geophys. 45, RG2004, doi:10.1029/2005RG000183.
Francis, A. P. and Currie, D. J. 2003. A globally consistentrichness-climate relationship for angiosperms. ! Am. Nat. 161:523!536.
Graham, M. H. 2003. Confronting multicollinearity in ecologicalmultiple regression. ! Ecology 84: 2809!2815.
Guisan, A. and Zimmerman, N. E. 2000. Predictive habitatdistribution models in ecology. ! Ecol. Model. 135: 147!186.
Hawkins, B. A. et al. 2003. Energy, water, and broad-scalegeographic patterns of species richness. ! Ecology 84: 3105!3117.
Hillebrand, H. 2005. Regressions of local on regional diversity donot reflect the importance of local interactions or saturation oflocal diversity. ! Oikos 110: 195!198.
Hortal, J. et al. 2008. Regional and environmental effects on thespecies richness of mammal assemblages. ! J. Biogeogr. 35:1202!1214.
Iverson, L. R. et al. 2008. Estimating potential habitat for 134eastern US tree species under six climate scenarios. ! For. Ecol.Manage. 254: 390!406.
Jalas, J. and Suominen, J. (eds) 1972!1994. Atlas FloraeEuropaeae: distribution of vascular plants in Europe, Vol. 1!10.! The Committee for Mapping the Flora of Europe andSocietas Biologica Fennica Vanamo, Helsinki.
Kerr, J. T. and Packer, L. 1997. Habitat heterogeneity as adeterminant of mammal species richness in high-energyregions. ! Nature 385: 252!254.
Koenker, R. 2008. quantreg: quantile regression. ! R package ver.4.26.
Kreft, H. et al. 2008. Global diversity of island floras from amacroecological perspective. ! Ecol. Lett. 11: 116!127.
Latham, R. E. and Ricklefs, R. E. 1993. Global patterns of treespecies richness in moist forests: energy-diversity theory doesnot account for variation in species richness. ! Oikos 67: 325!333.
Lawler, J. J. et al. 2006. Predicting climate-induced range shifts:model differences and model reliability. ! Global Change Biol.12: 1568!1584.
Leroy, S. A. G. and Arpe, K. 2007. Glacial refugia for summer-green trees in Europe and south-west Asia as proposedby ECHAM3 time-slice atmospheric model simulations.! J. Biogeogr. 34: 2115!2128.
Lid, J. and Lid, D. T. 1994. Norsk flora. ! Det Norske Samlaget.Lobo, J. M. et al. 2001. Spatial and environmental determinants of
vascular plant species richness distribution in the IberianPeninsula and Balearic Islands. ! Biol. J. Linn. Soc. 73: 233!253.
MacArthur, R. H. and Wilson, E. O. 1967. The theory of islandbiogeography. ! Princeton Univ. Press.
Mai, D. H. 1995. Tertiare Vegetationsgeschichte Europas! Metoden und Ergebnisse. ! Gustav Fischer.
McGlone, M. S. 1996. When history matters: scale, time, climateand tree diversity. ! Global Ecol. Biogeogr. Lett. 5: 309!314.
Nekola, J. C. and White, P. S. 1999. The distance decay ofsimilarity in biogeography and ecology. ! J. Biogeogr. 26:867!878.
New, M. et al. 2002. A high-resolution data set of surface climateovre global land areas. ! Clim. Res. 21: 1!25.
O’Brien, E. M. et al. 2000. Climatic gradients in woody plant(tree and shrub) diversity: water-energy dynamics, residualvariation, and topography. ! Oikos 89: 588!600.
Postigo Mijarra, J. M. et al. 2008. Survival and long-termmaintenance of Tertiary trees in the Iberian Peninsula duringthe Pleistocene: first record of Aesculus L. (Hippocastanaceae)in Spain. ! Veg. Hist. Archaeobot. 17: 351!364.
R Development Core Team 2008. R: a language and environmentfor statistical computing. ! R Foundation for StatisticalComputing, Vienna.
Rangel, T. F. et al. 2006. Towards an integrated computationaltool for spatial analysis in macroecology and biogeography.! Global Ecol. Biogeogr. 15: 321!327.
Ricklefs, R. E. 2004. A comprehensive framework for globalpatterns in biodiversity. ! Ecol. Lett. 7: 1!15.
Simpson, G. G. 1964. Species density of North American recentmammals. ! Syst. Zool. 13: 57!73.
Stropp, J. et al. 2009. Disentangling regional and local treediversity in the Amazon. ! Ecography 32: 46!54.
Svenning, J.-C. 2003. Deterministic Plio-Pleistocene extinctionsin the European cool-temperate tree flora. ! Ecol. Lett. 6:646!653.
Svenning, J.-C. and Skov, F. 2004. Limited filling of the potentialrange in European tree species. ! Ecol. Lett. 7: 565!573.
Svenning, J.-C. and Skov, F. 2005. The relative roles ofenvironment and history as controls of tree species composi-tion and richness in Europe. ! J. Biogeogr. 32: 1019!1033.
Svenning, J.-C. and Skov, F. 2007a. Could the tree diversitypattern in Europe be generated by postglacial dispersallimitation? ! Ecol. Lett. 10: 453!460.
Svenning, J.-C. and Skov, F. 2007b. Ice age legacies in thegeographical distribution of tree species richness in Europe.! Global Ecol. Biogeogr. 16: 234!245.
Svenning, J.-C. et al. 2008a. Glacial refugia of temperate trees inEurope: insights from species distribution modelling. ! J. Ecol.96: 1117!1127.
Svenning, J.-C. et al. 2008b. Postglacial dispersal limitationof widespread forest plant species in nemoral Europe.! Ecography 31: 316!326.
Svenning, J.-C. et al. 2009. Plio-Pleistocene climate change andgeographic heterogeneity in plant diversity!environmentrelationships. ! Ecography 32: 13!21.
Thuiller, W. et al. 2009. BIOMOD ! a platform for ensembleforecasting of species distributions. ! Ecography 32: 1!5.
Willis, K. J. and van Andel, T. H. 2004. Trees or no trees? Theenvironments of central and eastern Europe during the LastGlaciation. ! Quat. Sci. Rev. 23: 2369!2387.
Zobel, M. 1997. The relative role of species pools in determiningplant species richness: an alternative explanation of speciescoexistence? ! Trends Ecol. Evol. 12: 266!269.
Download the Supplementary material as file E6301 from/<www.oikos.ekol.lu.se/appendix/>.
1080
SDM
SPEC
IAL
ISSU
E:
SPEC
IESD
ISTRIB
UTIO
NM
OD
ELLIN
G