Geographical Toolkit K-6 - Human Society and Its Environment
28
Geographical Toolkit K-6 Maps Fieldwork Graphs and statistics Spatial technologies Visual representations NSW DEPARTMENT OF EDUCATION Page of 1 28 Consultation Draft 20-08-2016 GEOGRAPHY K-10
-
Upload
khangminh22 -
Category
Documents
-
view
1 -
download
0
Transcript of Geographical Toolkit K-6 - Human Society and Its Environment
Geographical Toolkit K-6 Maps Fieldwork Graphs and statistics Spatial technologies Visual representations
NSW DEPARTMENT OF EDUCATION Page ! of !1 28 Consultation Draft 20-08-2016
GEOGRAPHY K-10
GEOGRAPHICAL TOOLKIT K-61
GEOGRAPHICAL TOOLS3 MAPS4 FIELDWORK10 FIELDWORK ACTIVITIES14 GRAPHS AND STATISTICS18 SPATIAL TECHNOLOGIES19 VISUAL REPRESENTATIONS 23
NSW DEPARTMENT OF EDUCATION Page ! of !2 28 Consultation Draft 20-08-2016
Acknowledgement: This booklet has been developed as a resource for K-6 teachers. It is written by HSIE advisors and writers in the Learning and Teaching Directorate and environmental education centre teachers in DoE Environmental and Zoo Education Centres (EZEC), with funding support from the Macquarie Park Directorate.
Cover: Geography fieldwork at Bobbin Head. Gibberagong EEC.
GEOGRAPHICAL TOOLS Geography K-10 syllabus elements
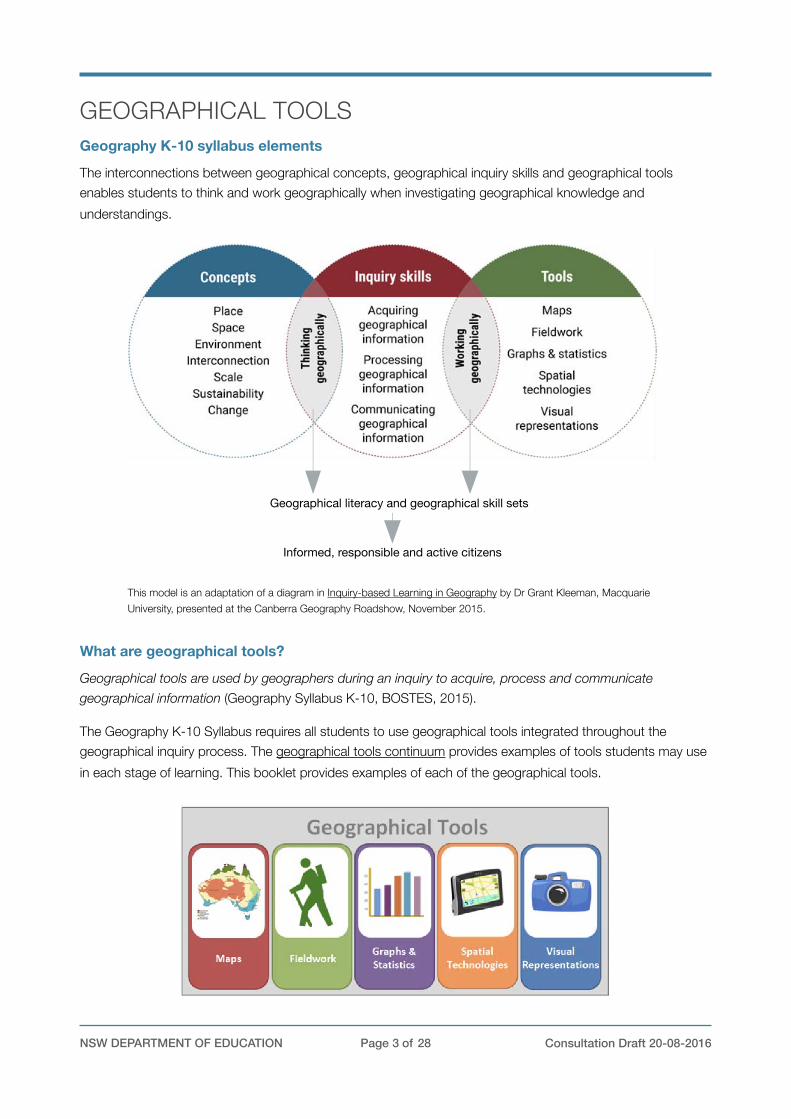
The interconnections between geographical concepts, geographical inquiry skills and geographical tools enables students to think and work geographically when investigating geographical knowledge and understandings.
What are geographical tools?
Geographical tools are used by geographers during an inquiry to acquire, process and communicate geographical information (Geography Syllabus K-10, BOSTES, 2015).
The Geography K-10 Syllabus requires all students to use geographical tools integrated throughout the geographical inquiry process. The geographical tools continuum provides examples of tools students may use in each stage of learning. This booklet provides examples of each of the geographical tools.
NSW DEPARTMENT OF EDUCATION Page ! of !3 28 Consultation Draft 20-08-2016
This model is an adaptation of a diagram in Inquiry-based Learning in Geography by Dr Grant Kleeman, Macquarie University, presented at the Canberra Geography Roadshow, November 2015.
Geographical literacy and geographical skill sets
Informed, responsible and active citizens
MAPS
Map types
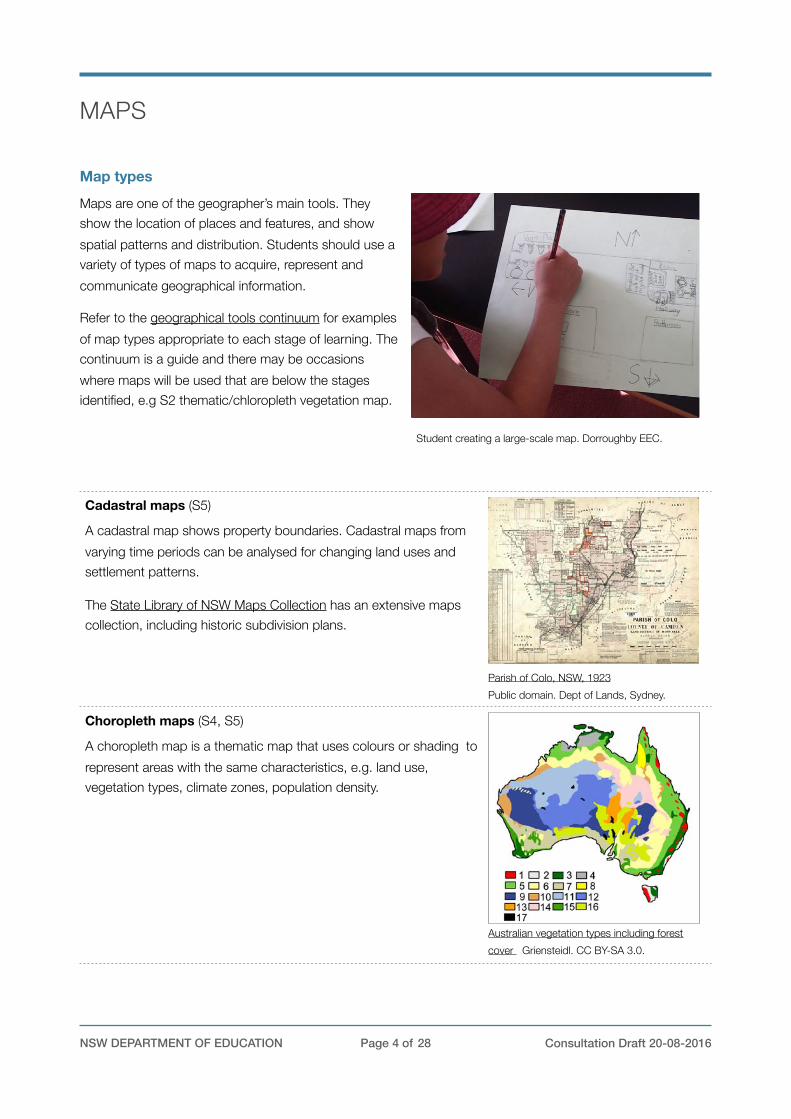
Maps are one of the geographer’s main tools. They show the location of places and features, and show spatial patterns and distribution. Students should use a variety of types of maps to acquire, represent and communicate geographical information.
Refer to the geographical tools continuum for examples of map types appropriate to each stage of learning. The continuum is a guide and there may be occasions where maps will be used that are below the stages identified, e.g S2 thematic/chloropleth vegetation map.
Cadastral maps (S5)
A cadastral map shows property boundaries. Cadastral maps from varying time periods can be analysed for changing land uses and settlement patterns.
The State Library of NSW Maps Collection has an extensive maps collection, including historic subdivision plans.
Choropleth maps (S4, S5)
A choropleth map is a thematic map that uses colours or shading to represent areas with the same characteristics, e.g. land use, vegetation types, climate zones, population density.
" Australian vegetation types including forest cover Griensteidl. CC BY-SA 3.0.
" Parish of Colo, NSW, 1923 Public domain. Dept of Lands, Sydney.
NSW DEPARTMENT OF EDUCATION Page ! of !4 28 Consultation Draft 20-08-2016
Student creating a large-scale map. Dorroughby EEC.
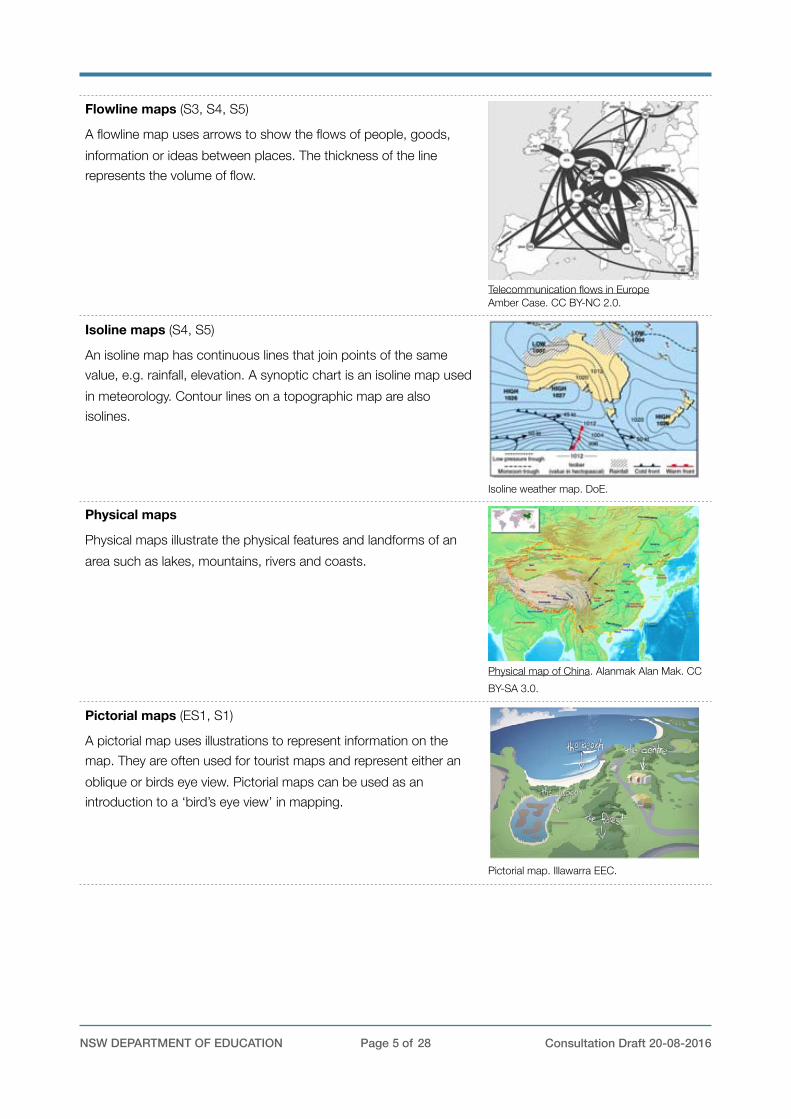
Flowline maps (S3, S4, S5)
A flowline map uses arrows to show the flows of people, goods, information or ideas between places. The thickness of the line represents the volume of flow.
Isoline maps (S4, S5)
An isoline map has continuous lines that join points of the same value, e.g. rainfall, elevation. A synoptic chart is an isoline map used in meteorology. Contour lines on a topographic map are also isolines.
Physical maps
Physical maps illustrate the physical features and landforms of an area such as lakes, mountains, rivers and coasts.
Pictorial maps (ES1, S1)
A pictorial map uses illustrations to represent information on the map. They are often used for tourist maps and represent either an oblique or birds eye view. Pictorial maps can be used as an introduction to a ‘bird’s eye view’ in mapping.
" Telecommunication flows in Europe Amber Case. CC BY-NC 2.0.
" Pictorial map. Illawarra EEC.
" Isoline weather map. DoE.
" Physical map of China. Alanmak Alan Mak. CC BY-SA 3.0.
NSW DEPARTMENT OF EDUCATION Page ! of !5 28 Consultation Draft 20-08-2016
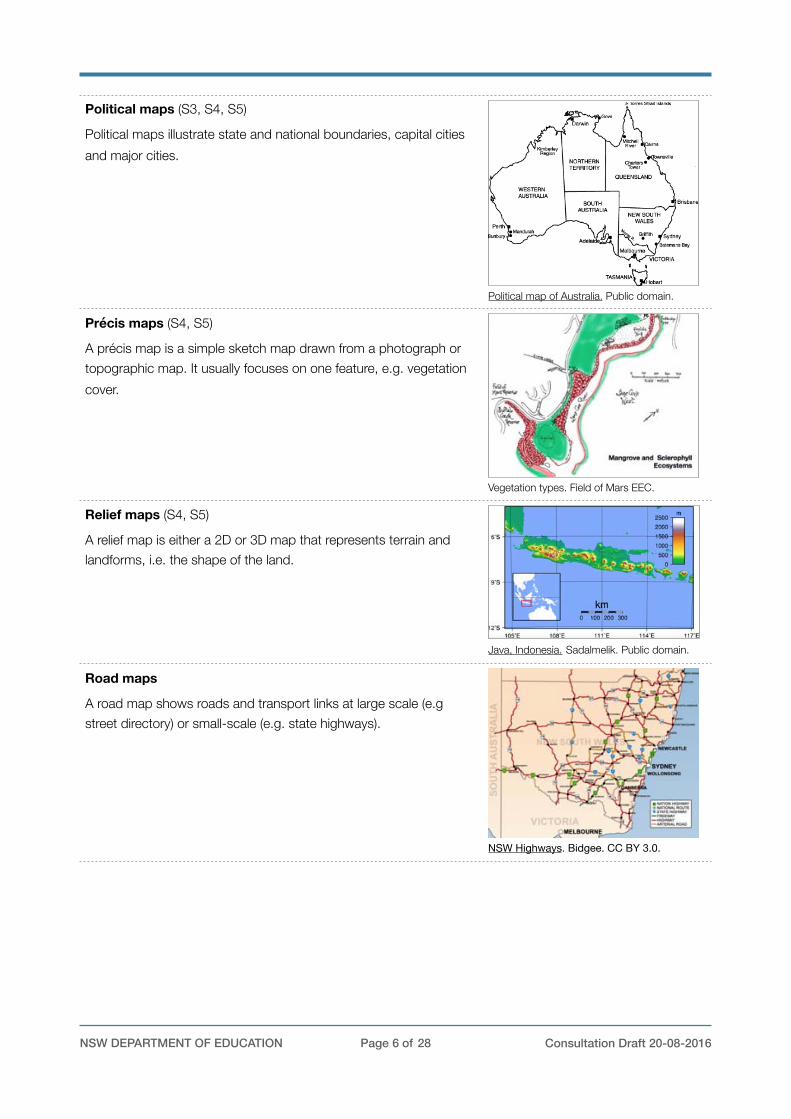
Political maps (S3, S4, S5)
Political maps illustrate state and national boundaries, capital cities and major cities.
Précis maps (S4, S5)
A précis map is a simple sketch map drawn from a photograph or topographic map. It usually focuses on one feature, e.g. vegetation cover.
Relief maps (S4, S5)
A relief map is either a 2D or 3D map that represents terrain and landforms, i.e. the shape of the land.
Road maps
A road map shows roads and transport links at large scale (e.g street directory) or small-scale (e.g. state highways).
"NSW Highways. Bidgee. CC BY 3.0.
" Vegetation types. Field of Mars EEC.
" Java, Indonesia. Sadalmelik. Public domain.
" Political map of Australia. Public domain.
NSW DEPARTMENT OF EDUCATION Page ! of !6 28 Consultation Draft 20-08-2016
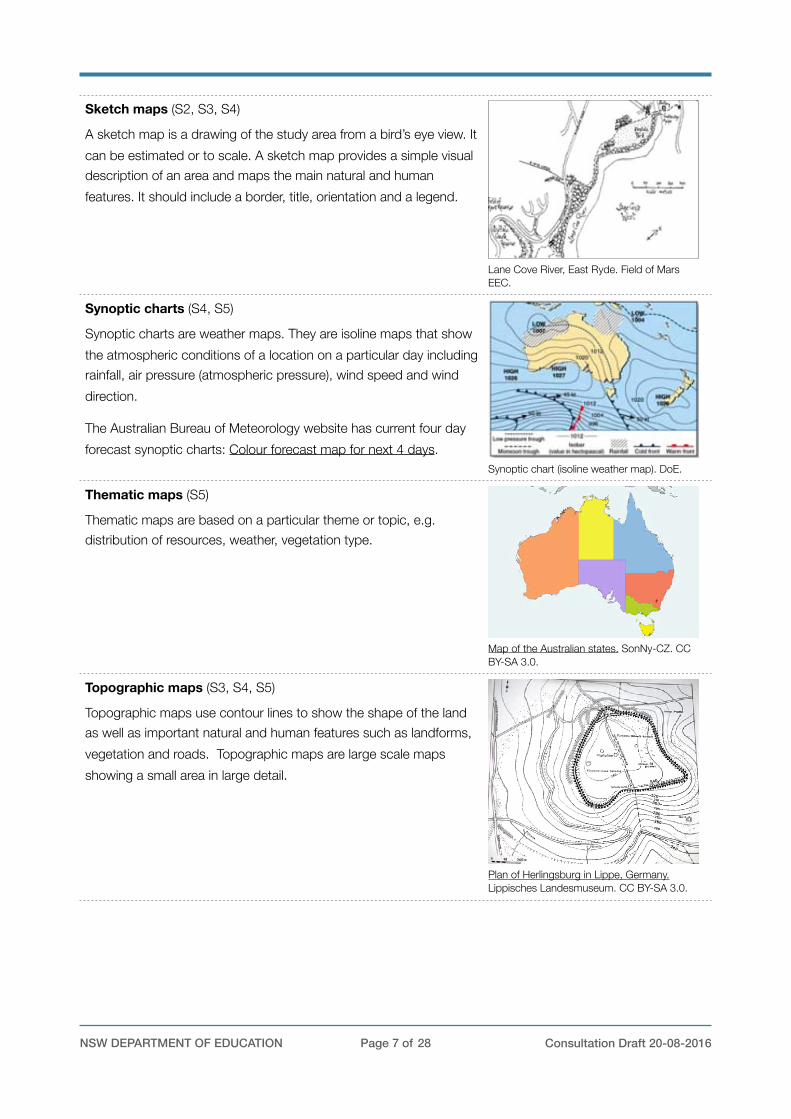
Sketch maps (S2, S3, S4)
A sketch map is a drawing of the study area from a bird’s eye view. It can be estimated or to scale. A sketch map provides a simple visual description of an area and maps the main natural and human features. It should include a border, title, orientation and a legend.
Synoptic charts (S4, S5)
Synoptic charts are weather maps. They are isoline maps that show the atmospheric conditions of a location on a particular day including rainfall, air pressure (atmospheric pressure), wind speed and wind direction.
The Australian Bureau of Meteorology website has current four day forecast synoptic charts: Colour forecast map for next 4 days.
Thematic maps (S5)
Thematic maps are based on a particular theme or topic, e.g. distribution of resources, weather, vegetation type.
Topographic maps (S3, S4, S5)
Topographic maps use contour lines to show the shape of the land as well as important natural and human features such as landforms, vegetation and roads. Topographic maps are large scale maps showing a small area in large detail.
" Map of the Australian states. SonNy-CZ. CC BY-SA 3.0.
" Lane Cove River, East Ryde. Field of Mars EEC.
" Plan of Herlingsburg in Lippe, Germany. Lippisches Landesmuseum. CC BY-SA 3.0.
" Synoptic chart (isoline weather map). DoE.
NSW DEPARTMENT OF EDUCATION Page ! of !7 28 Consultation Draft 20-08-2016
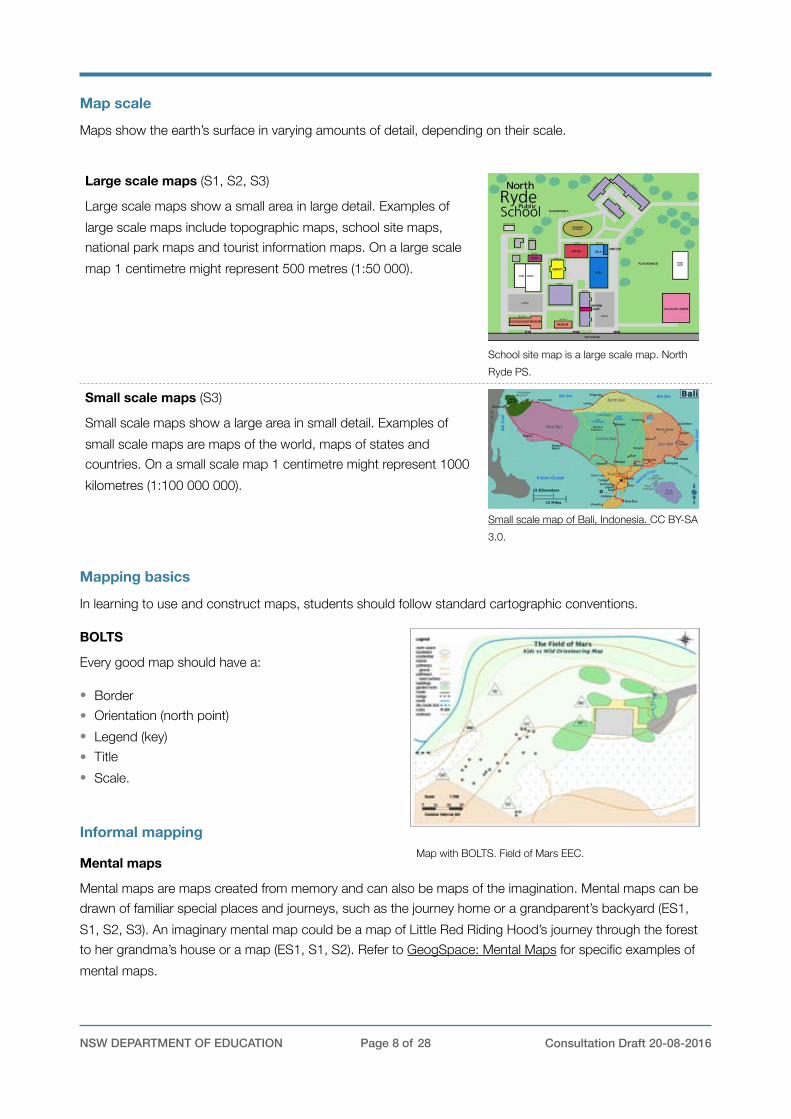
Map scale
Maps show the earth’s surface in varying amounts of detail, depending on their scale.
Mapping basics
In learning to use and construct maps, students should follow standard cartographic conventions.
BOLTS
Every good map should have a:
• Border • Orientation (north point) • Legend (key) • Title • Scale.
Informal mapping
Mental maps
Mental maps are maps created from memory and can also be maps of the imagination. Mental maps can be drawn of familiar special places and journeys, such as the journey home or a grandparent’s backyard (ES1, S1, S2, S3). An imaginary mental map could be a map of Little Red Riding Hood’s journey through the forest to her grandma’s house or a map (ES1, S1, S2). Refer to GeogSpace: Mental Maps for specific examples of mental maps.
NSW DEPARTMENT OF EDUCATION Page ! of !8 28 Consultation Draft 20-08-2016
Large scale maps (S1, S2, S3)
Large scale maps show a small area in large detail. Examples of large scale maps include topographic maps, school site maps, national park maps and tourist information maps. On a large scale map 1 centimetre might represent 500 metres (1:50 000).
Small scale maps (S3)
Small scale maps show a large area in small detail. Examples of small scale maps are maps of the world, maps of states and countries. On a small scale map 1 centimetre might represent 1000 kilometres (1:100 000 000).
" School site map is a large scale map. North Ryde PS.
" Small scale map of Bali, Indonesia. CC BY-SA 3.0.
Map with BOLTS. Field of Mars EEC.
Mud maps
Traditionally mud maps were drawn in the field in the dirt to explain how to get from one place to another. They usually accompany a story or yarn.
Students and teachers can use mud maps during fieldwork activities to explain the location of features and show interconnections. Mud maps can also be used at the conclusion of fieldwork as a consolidating activity that demonstrates their understandings.
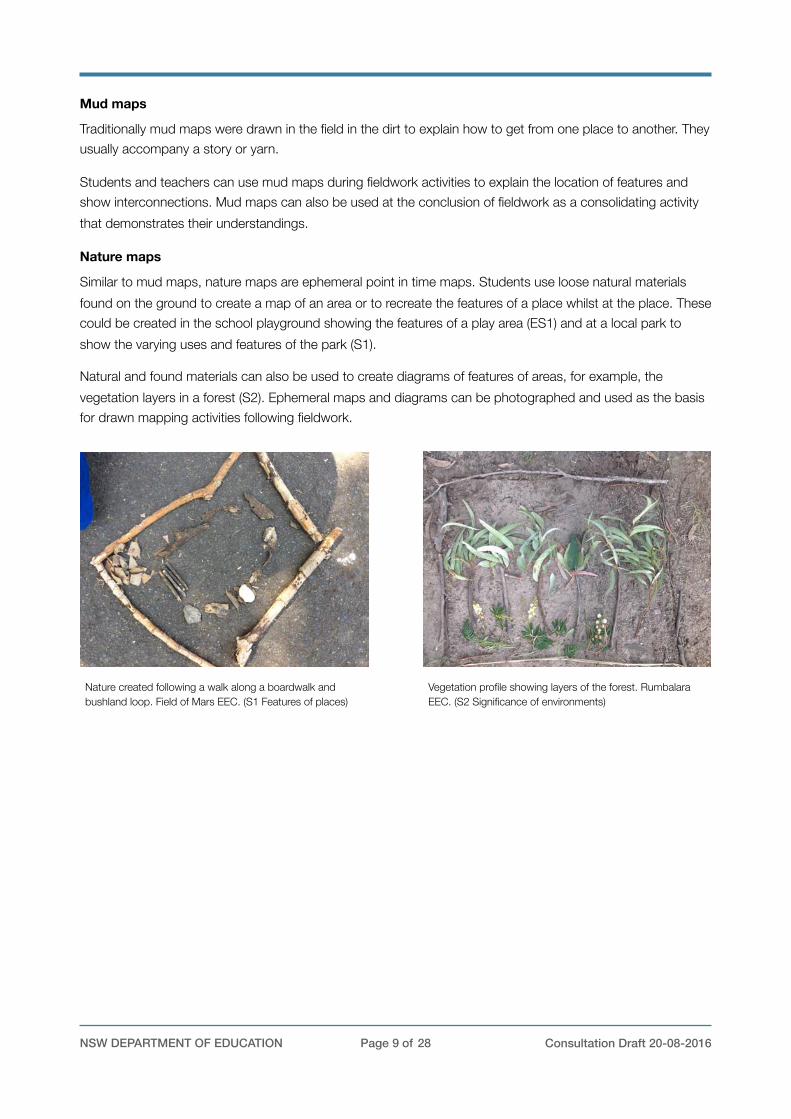
Nature maps
Similar to mud maps, nature maps are ephemeral point in time maps. Students use loose natural materials found on the ground to create a map of an area or to recreate the features of a place whilst at the place. These could be created in the school playground showing the features of a play area (ES1) and at a local park to show the varying uses and features of the park (S1).
Natural and found materials can also be used to create diagrams of features of areas, for example, the vegetation layers in a forest (S2). Ephemeral maps and diagrams can be photographed and used as the basis for drawn mapping activities following fieldwork.
NSW DEPARTMENT OF EDUCATION Page ! of !9 28 Consultation Draft 20-08-2016
Nature created following a walk along a boardwalk and bushland loop. Field of Mars EEC. (S1 Features of places)
Vegetation profile showing layers of the forest. Rumbalara EEC. (S2 Significance of environments)
FIELDWORK
Purpose of fieldwork
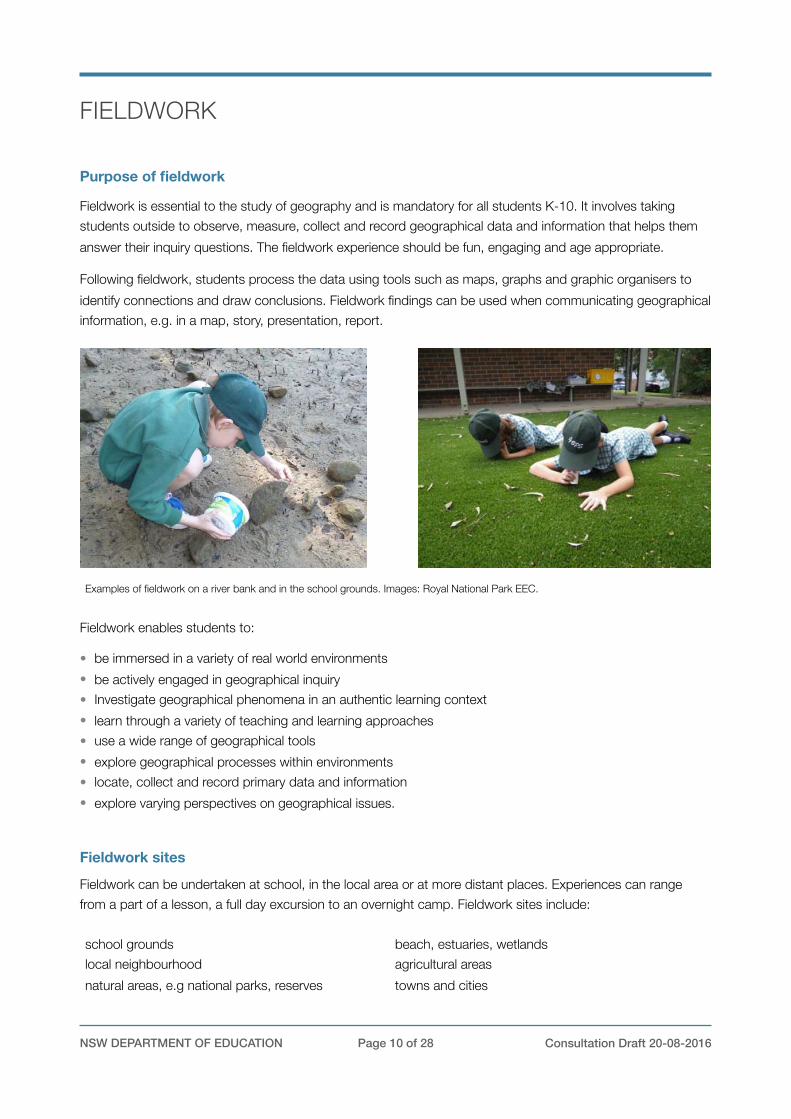
Fieldwork is essential to the study of geography and is mandatory for all students K-10. It involves taking students outside to observe, measure, collect and record geographical data and information that helps them answer their inquiry questions. The fieldwork experience should be fun, engaging and age appropriate.
Following fieldwork, students process the data using tools such as maps, graphs and graphic organisers to identify connections and draw conclusions. Fieldwork findings can be used when communicating geographical information, e.g. in a map, story, presentation, report.
Fieldwork enables students to:
• be immersed in a variety of real world environments • be actively engaged in geographical inquiry • Investigate geographical phenomena in an authentic learning context • learn through a variety of teaching and learning approaches • use a wide range of geographical tools • explore geographical processes within environments • locate, collect and record primary data and information • explore varying perspectives on geographical issues.
Fieldwork sites
Fieldwork can be undertaken at school, in the local area or at more distant places. Experiences can range from a part of a lesson, a full day excursion to an overnight camp. Fieldwork sites include:
NSW DEPARTMENT OF EDUCATION Page ! of !10 28 Consultation Draft 20-08-2016
Examples of fieldwork on a river bank and in the school grounds. Images: Royal National Park EEC.
school grounds local neighbourhood natural areas, e.g national parks, reserves
beach, estuaries, wetlands agricultural areas towns and cities
Environmental and zoo education centres
There are twenty-five DoE environmental and zoo education centres (EZEC) in NSW that provide geography fieldwork experiences. The centres have specialised measuring and recording equipment and teachers with expertise in fieldwork skills, tools and techniques.
Aboriginal and/or Torres Strait Islander sites
When proposing fieldwork for Aboriginal or Torres Strait Islander sites, consult with local communities and your local Aboriginal Education Consultative Group (AECG). Students, teachers and accompanying parents and carers need to be familiar with protocols for visiting the site and working with Aboriginal communities. Refer to the Working with Aboriginal Communities: A Guide to Community Consultation and Protocols on the BOSTES website.
Fieldwork activities for K-6
‘Primary fieldwork is about immersing pupils in their surroundings; feeling smooth rocks on the beach, smelling the air, feeling the texture of the autumn leaves in the woods, listening to the noise of the city and so on.’ Fieldwork ideas and resources, Geographical Association UK
Fieldwork activities should be integrated into teaching and learning, be planned to meet syllabus outcomes, answer the inquiry questions and be appropriate for the age of the students. In addition to formal fieldwork, incidental opportunities enable students to make impromptu observations, e.g. when moving through the school.
Fieldwork becomes more comprehensive as students move through the stages. By Stages 4 and 5, students use professional fieldwork equipment and techniques to collect complex data and information.
Fieldwork activities can include:
• plotting location, natural and human features on maps (ES1, S1, S2, S3) • recording observations through sketches and photographs (ES1, S1, S2, S3) • counting and plotting facilities for people (ES1, S1, S2, S3) • surveying people to collect information (ES1, S1, S2, S3) • counting plants using quadrats (S2, S3) • measuring distances, temperature, humidity (S2, S3) • collecting aquatic and terrestrial invertebrates (S2, S3) • testing water quality, turbidity (S3) • recording change in features along a transect (S3) • calculating direction and aspect using a compass (S3).
Suggested fieldwork activities for each stage are listed on the following pages.
Tip: Cross reference the Mathematics K-6 Syllabus Position sub-strand when selecting fieldwork tools.
NSW DEPARTMENT OF EDUCATION Page ! of !11 28 Consultation Draft 20-08-2016
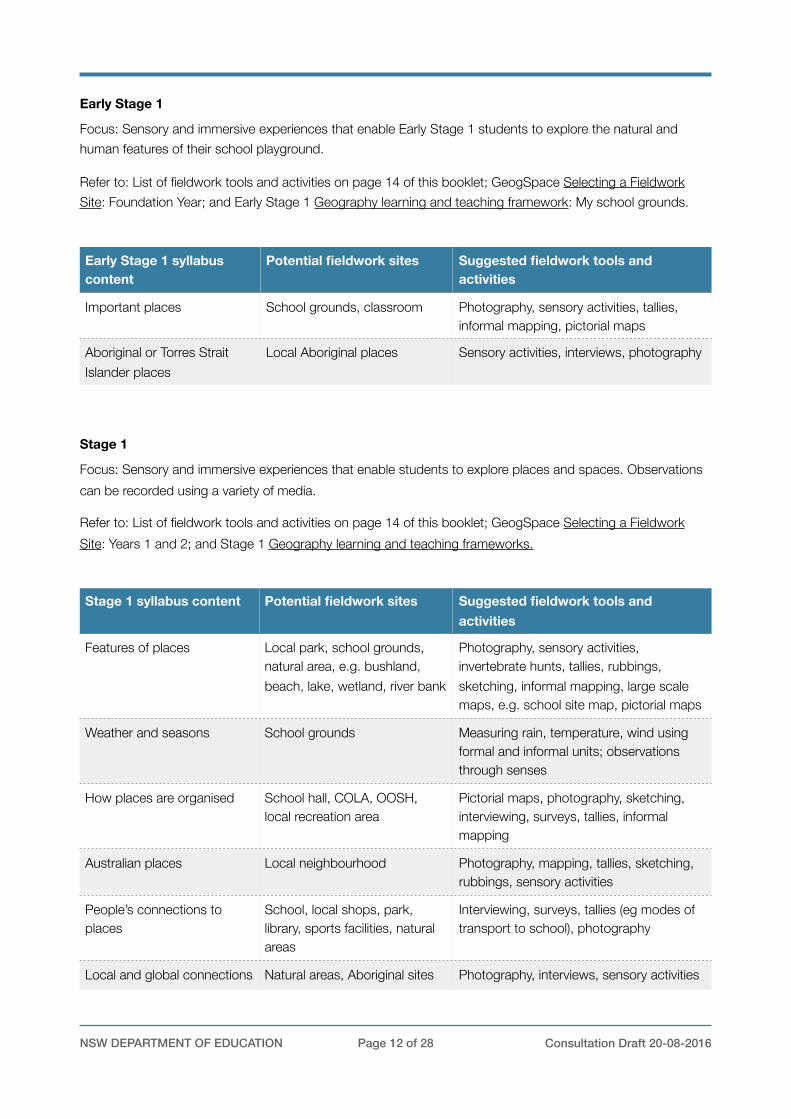
Early Stage 1
Focus: Sensory and immersive experiences that enable Early Stage 1 students to explore the natural and human features of their school playground.
Refer to: List of fieldwork tools and activities on page 14 of this booklet; GeogSpace Selecting a Fieldwork Site: Foundation Year; and Early Stage 1 Geography learning and teaching framework: My school grounds.
Stage 1
Focus: Sensory and immersive experiences that enable students to explore places and spaces. Observations can be recorded using a variety of media.
Refer to: List of fieldwork tools and activities on page 14 of this booklet; GeogSpace Selecting a Fieldwork Site: Years 1 and 2; and Stage 1 Geography learning and teaching frameworks.
Early Stage 1 syllabus content
Potential fieldwork sites Suggested fieldwork tools and activities
Important places School grounds, classroom Photography, sensory activities, tallies, informal mapping, pictorial maps
Aboriginal or Torres Strait Islander places
Local Aboriginal places Sensory activities, interviews, photography
Stage 1 syllabus content Potential fieldwork sites Suggested fieldwork tools and activities
Features of places Local park, school grounds, natural area, e.g. bushland, beach, lake, wetland, river bank
Photography, sensory activities, invertebrate hunts, tallies, rubbings, sketching, informal mapping, large scale maps, e.g. school site map, pictorial maps
Weather and seasons School grounds Measuring rain, temperature, wind using formal and informal units; observations through senses
How places are organised School hall, COLA, OOSH, local recreation area
Pictorial maps, photography, sketching, interviewing, surveys, tallies, informal mapping
Australian places Local neighbourhood Photography, mapping, tallies, sketching, rubbings, sensory activities
People’s connections to places
School, local shops, park, library, sports facilities, natural areas
Interviewing, surveys, tallies (eg modes of transport to school), photography
Local and global connections Natural areas, Aboriginal sites Photography, interviews, sensory activities
NSW DEPARTMENT OF EDUCATION Page ! of !12 28 Consultation Draft 20-08-2016
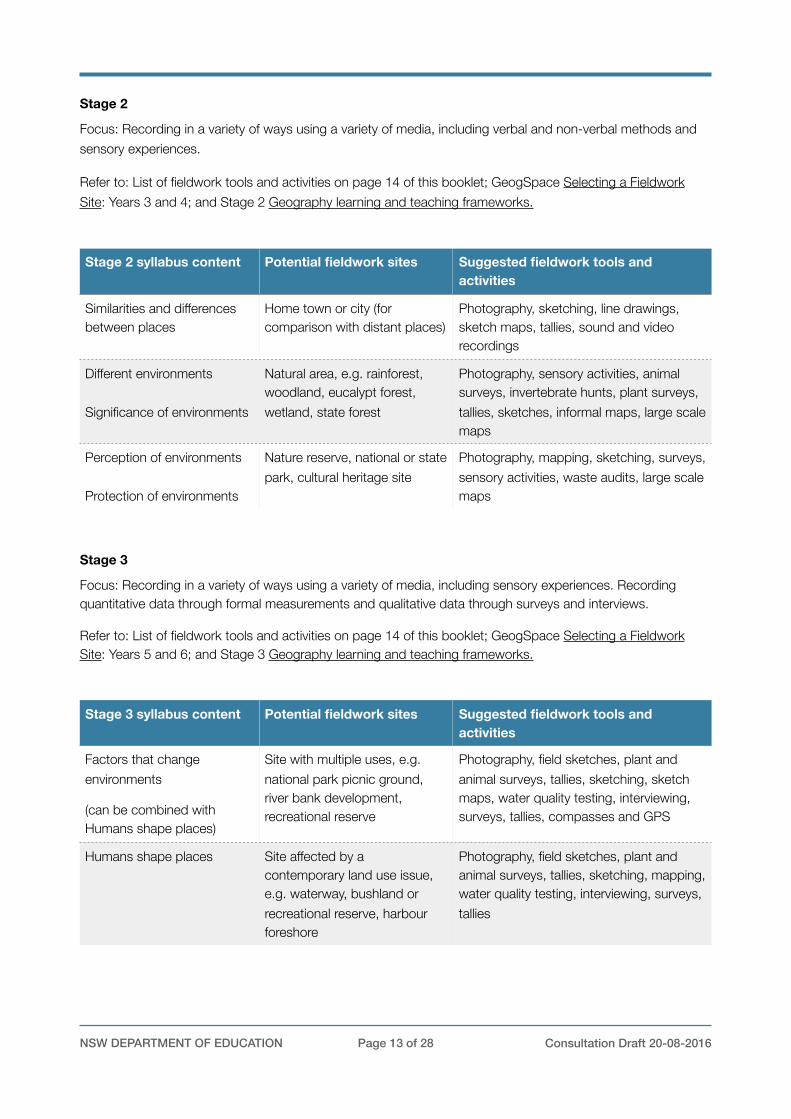
Stage 2
Focus: Recording in a variety of ways using a variety of media, including verbal and non-verbal methods and sensory experiences.
Refer to: List of fieldwork tools and activities on page 14 of this booklet; GeogSpace Selecting a Fieldwork Site: Years 3 and 4; and Stage 2 Geography learning and teaching frameworks.
Stage 3
Focus: Recording in a variety of ways using a variety of media, including sensory experiences. Recording quantitative data through formal measurements and qualitative data through surveys and interviews.
Refer to: List of fieldwork tools and activities on page 14 of this booklet; GeogSpace Selecting a Fieldwork Site: Years 5 and 6; and Stage 3 Geography learning and teaching frameworks.
Stage 2 syllabus content Potential fieldwork sites Suggested fieldwork tools and activities
Similarities and differences between places
Home town or city (for comparison with distant places)
Photography, sketching, line drawings, sketch maps, tallies, sound and video recordings
Different environments
Significance of environments
Natural area, e.g. rainforest, woodland, eucalypt forest, wetland, state forest
Photography, sensory activities, animal surveys, invertebrate hunts, plant surveys, tallies, sketches, informal maps, large scale maps
Perception of environments
Protection of environments
Nature reserve, national or state park, cultural heritage site
Photography, mapping, sketching, surveys, sensory activities, waste audits, large scale maps
Stage 3 syllabus content Potential fieldwork sites Suggested fieldwork tools and activities
Factors that change environments
(can be combined with Humans shape places)
Site with multiple uses, e.g. national park picnic ground, river bank development, recreational reserve
Photography, field sketches, plant and animal surveys, tallies, sketching, sketch maps, water quality testing, interviewing, surveys, tallies, compasses and GPS
Humans shape places Site affected by a contemporary land use issue, e.g. waterway, bushland or recreational reserve, harbour foreshore
Photography, field sketches, plant and animal surveys, tallies, sketching, mapping, water quality testing, interviewing, surveys, tallies
NSW DEPARTMENT OF EDUCATION Page ! of !13 28 Consultation Draft 20-08-2016
FIELDWORK ACTIVITIES
Sensory fieldwork activities
Sensory fieldwork activities sharpen observations. When undertaking fieldwork provide time for students to:
• Look - up, down and around. Notice details and changes. • Listen - to natural and human sounds. Notice noise and quiet. • Smell - the air, flowers and leaves. Notice the differences in smells of places. • Touch - textures of natural and human features. Notice leaves, bark and surfaces underfoot.
Treasure hunts (ES1, S1)
1. Instruct students to collect four items from the environment (from the ground) e.g. students may find seed pods/cones, leaves of different shape and colour, textures, rocks, sticks with galls, litter.
2. Classify found items into natural and human and discuss interesting features. 3. Discuss origins of litter and ways to care for places.
Colour chips (ES1, S1)
1. Ask students what colours they can see in the immediate environment. 2. Hand out colour chips to each student and ask them to match the colours to items in the environment.
Texture (ES1, S1, S2)
1. Ask students to find different textures in the environment, e.g different leaves, bark, rocks, soil, pavements. 2. Ask students to describe the textures, e.g smooth, rough, prickly, soft, waxy, furry. 3. Use crayon and paper to make rubbings to record the textures.
Sounds (ES1, S1, S2, S3)
1. Students close eyes and quietly listen to the sounds around them for several minutes. 2. Students report on what they heard.
Leaf friends (S1, S2)
1. Students collect a leaf from the ground. 2. Ask students to complete the following activities to get to know their leaf:
• Touch - the leaf with different parts of your body (e.g. cheek, back of wrist) and use words to describe its texture.
• Sight - describe what you can see on your leaf. Colours? Are there parts missing? Are there lumps in it? • Smell - What does your leaf smell like? Smell a friend’s leaf. • Tell - your leaf’s story. What’s been using your leaf and how? (E.g. caterpillar, leaf minor, gall wasp.)
Shapes (ES1, S1)
1. Provide students with cards, each cut to a different shapes, e.g. square, circle, irregular. 2. Ask them to match the shaped card to natural and humans items in the environment. 3. Back in the classroom draw the item from the environment next to the shape. 4. Label and classify the items into natural and human features.
NSW DEPARTMENT OF EDUCATION Page ! of !14 28 Consultation Draft 20-08-2016
Sound maps (S2, S3)
1. Students mark an ‘X’ in the centre of a blank page to represent the location of themselves. 2. Students sit separately and silently in their own space. 3. They use symbols, words or or other marks to represent the sounds they hear around them.
Scrunch and sniff (ES1, S1, S2, S3)
1. Before the fieldwork collect some leaves from the area being investigated, e.g. camphor laurel, bottle brush, tea tree. Crush up leaves and put them in separate containers.
2. Students smell the crushed leaves in the container and then find the matching plant. 3. Alternatively, give students a variety of leaves to scrunch and sniff in the area being investigated.
Hug a tree (S1, S2)
1. Organise students into pairs. One of the pair leads their blindfolded partner to a tree. 2. The blindfolded student gets to know the tree without being able to see it. 3. After being led back to a central position the blindfold is removed and the student finds that tree. 4. Discuss the importance of trees, e.g. hollows provide habitat for birds, bats, possums; branches are
habitat for spiders and nesting birds; leaves, seeds and flowers are food for many animals; provide oxygen, shade, wind breaks, mulch, timber, firewood and beauty.
Word clouds (S2, S3)
1. Students sit quietly and separately in a place. 2. They write words that describe the place, their feelings there and how the place makes them feel.
Interviews and survey questionnaires
Interviews (S1, S2, S3)
• Interviews are personal conversations between two people or a group of people. • Interviews collect qualitative data that contain the interviewee’s perspective and biases. • Prepare questions to elicit answers that are longer than ‘yes’ and ‘no’. • Interview in pairs so that one student asks questions and the other records notes. • Interviews are useful in collecting a variety of perceptions of places and uses of places.
NSW DEPARTMENT OF EDUCATION Page ! of !15 28 Consultation Draft 20-08-2016
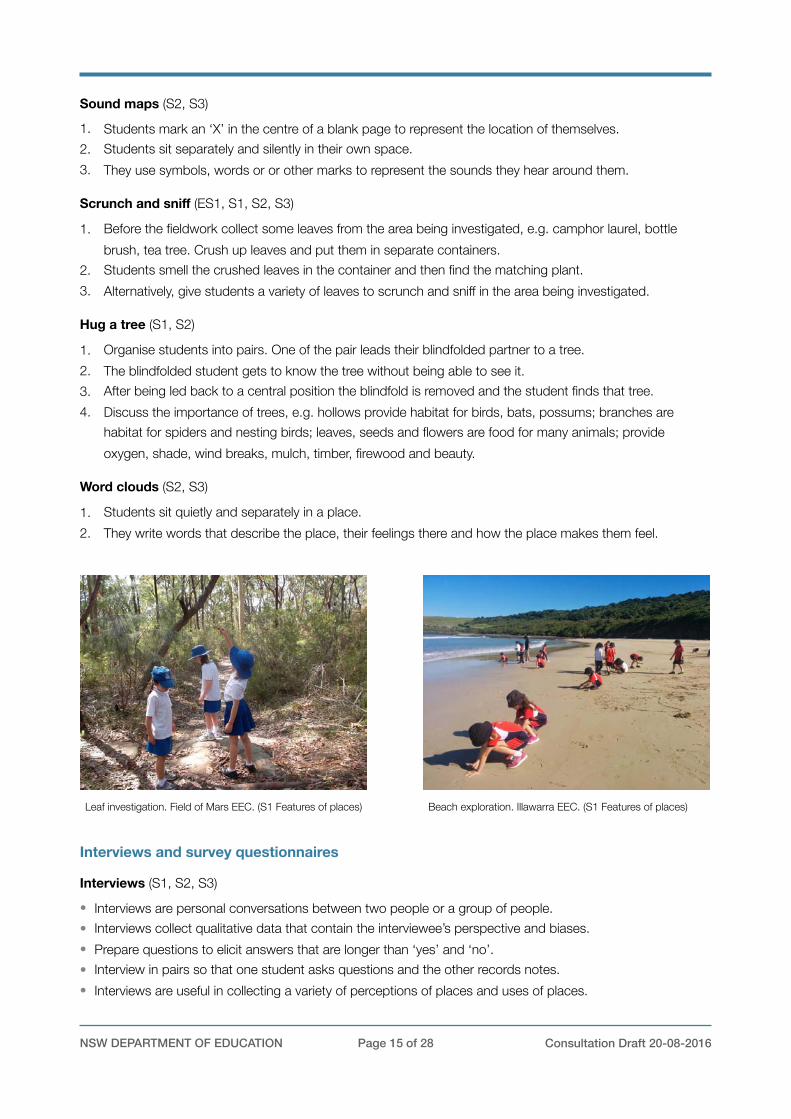
Beach exploration. Illawarra EEC. (S1 Features of places)Leaf investigation. Field of Mars EEC. (S1 Features of places)
Survey questionnaires (S1, S2, S3)
• Surveys questionnaires are usually a written list of questions to gain quantitative data collected from a number of people.
• Examples of survey questionnaires include human uses of an area, land uses, modes of transport, ways people use areas and how people perceive places.
• Students should be aware that surveys are from a representative group only.
Counting surveys (ES1, S1, S2, S3)
• Counting surveys count human and physical characteristics of a place. • Counting surveys can include modes of transport, visitor facilities in a recreation area, types of users of an
area. Counting surveys include animal and plant surveys.
Animal surveys
Tree shake (S1, S2, S3)
1. Working in groups students place a light-coloured sheet beneath a leafy tree or shrub. 2. They shake the branches to cause invertebrates to fall onto the sheet. 3. Place the invertebrates in plastic jars or bug magnifiers and record the number and types found. 4. When finished return invertebrates to the collection point.
Leaf litter hunts (S1, S2, S3)
1. Use a stick to gently lift apart the leaf litter to observe leaf litter invertebrates. 2. To collect them, place a scoop of leaf litter into a tray or onto a ground sheet. 3. Separate the leaf litter and place invertebrates in plastic jars or bug magnifiers and record the number and
types found. 4. When finished, return invertebrates to the collection point.
Animal evidence (S1, S2, S3)
1. Look for animals or signs of animals. Make a list of animal evidence, e.g. scratch marks on trees, spider webs, chewed leaves, birds’ nests, possum dreys, wasp galls, scratchings in the ground, scats, tracks.
2. Discuss animal habitats: How does a bird, possum, spider use plants for its habitat?
Dipnetting (S1, S2, S3)
1. Students use dip nets to gently scoop water from a pond or creek, with the aim of collecting aquatic macro invertebrates.
2. They tip the net contents into a light coloured container of water, e.g. a tote tray or ice cream container. 3. Students examine and identify collected invertebrates. 4. When finished, return the invertebrates to the pond.
NSW DEPARTMENT OF EDUCATION Page ! of !16 28 Consultation Draft 20-08-2016
Plant surveys
Tree matching (S2, S3)
1. Locate five to ten common species of trees or shrubs in an area. 2. Mark one of each species with a name tag, e.g. coastal banksia, cedar wattle, blackbutt. 3. Students attempt to identify the plants in the area using the reference species. 4. Record the number of each species using tally marks.
Plant bingo (S2, S3)
1. Print and laminate plant identification guides, or create into a plant bingo card. Plant identification charts may be available from local council websites.
2. Students identify and record plants using the guides. 3. Record the number of each species in a defined area, e.g. 5m x 5m.
Hoop studies (S1, S2, S3)
1. Place hoops on the ground. 2. Students examine the plants in the hoop. 3. They count the number of different types of plants in the hoop. 4. Repeat in several locations and calculate the average number of each type of plant.
Resources Fieldwork Tools and Skills, Geogspace Australia Fieldwork ideas and resources, Geographical Association UK
NSW DEPARTMENT OF EDUCATION Page ! of !17 28 Consultation Draft 20-08-2016
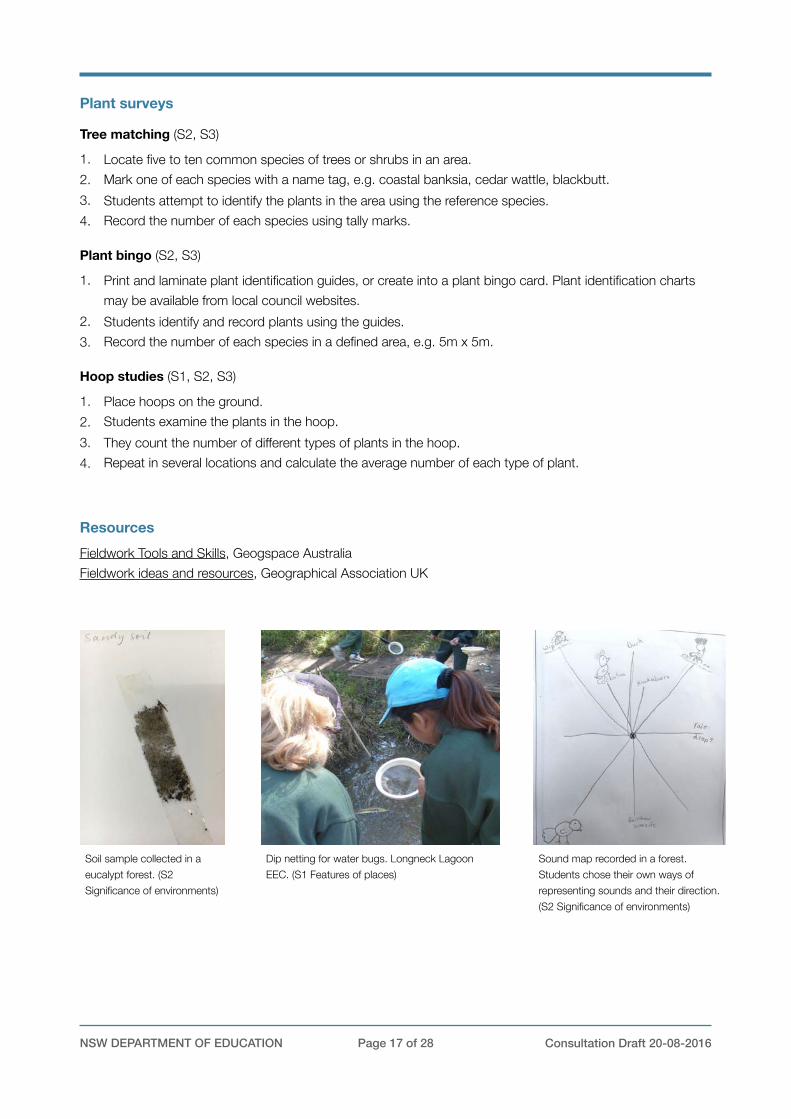
Soil sample collected in a eucalypt forest. (S2 Significance of environments)
Sound map recorded in a forest. Students chose their own ways of representing sounds and their direction. (S2 Significance of environments)
Dip netting for water bugs. Longneck Lagoon EEC. (S1 Features of places)
GRAPHS AND STATISTICS
Graphs Graphs are used by geographers to visualise and summarise quantitative data about places. They include tally charts, pictographs, column graphs, line graphs, pie graphs and climate graphs. Always include the unit of measurement when reading data from graphs, e.g. temperature in degrees celsius, rainfall in millilitres.
Refer to the geographical tools continuum for examples appropriate to each stage of learning. Also cross reference the Mathematics K-6 Syllabus Data substrand when selecting graphs as a geographical tool.
Tally charts (ES1, S1, S2)
Tally marks are used during fieldwork to record the numbers of specific natural and/or human features in a place, e.g. picnic tables in a park, lunch seats in an area of the school playground, animal evidence in a bushland area, types of management strategies in a catchment. They are also used in collating survey data.
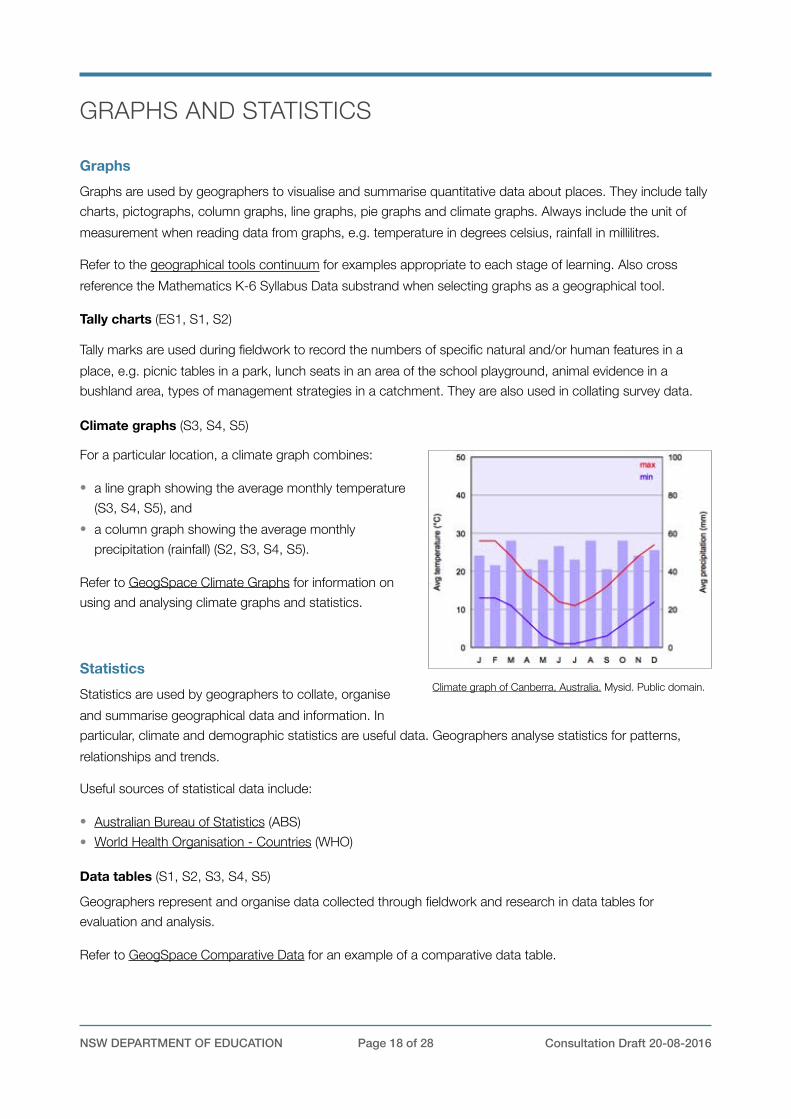
Climate graphs (S3, S4, S5)
For a particular location, a climate graph combines:
• a line graph showing the average monthly temperature (S3, S4, S5), and
• a column graph showing the average monthly precipitation (rainfall) (S2, S3, S4, S5).
Refer to GeogSpace Climate Graphs for information on using and analysing climate graphs and statistics.
Statistics Statistics are used by geographers to collate, organise and summarise geographical data and information. In particular, climate and demographic statistics are useful data. Geographers analyse statistics for patterns, relationships and trends.
Useful sources of statistical data include:
• Australian Bureau of Statistics (ABS) • World Health Organisation - Countries (WHO)
Data tables (S1, S2, S3, S4, S5)
Geographers represent and organise data collected through fieldwork and research in data tables for evaluation and analysis.
Refer to GeogSpace Comparative Data for an example of a comparative data table.
NSW DEPARTMENT OF EDUCATION Page ! of !18 28 Consultation Draft 20-08-2016
Climate graph of Canberra, Australia. Mysid. Public domain.
SPATIAL TECHNOLOGIES
Introduction to spatial technologies Spatial technologies are used by geographers to visualise, manipulate, analyse, display and record spatial data. They include virtual maps, satellite imagery, remote sensing, global positioning systems (GIS), global information systems (GIS) and augmented reality.
Refer to the video GeogSpace: Introduction to geospatial technologies.
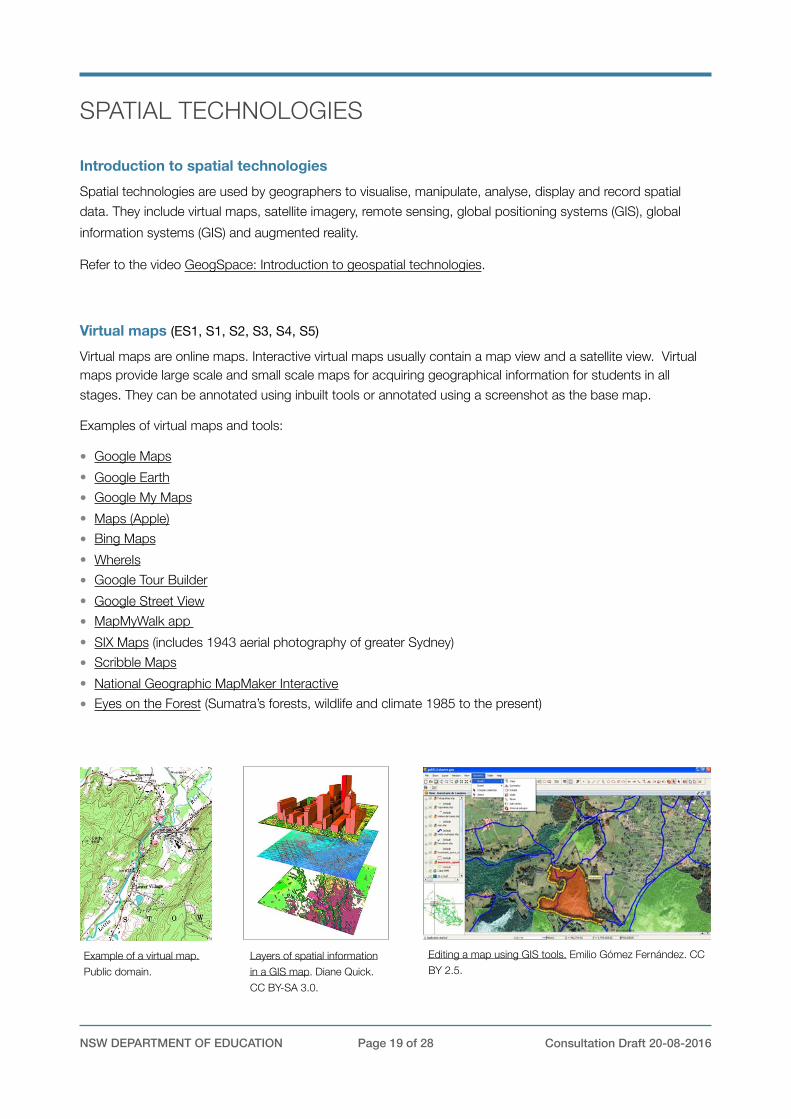
Virtual maps (ES1, S1, S2, S3, S4, S5) Virtual maps are online maps. Interactive virtual maps usually contain a map view and a satellite view. Virtual maps provide large scale and small scale maps for acquiring geographical information for students in all stages. They can be annotated using inbuilt tools or annotated using a screenshot as the base map.
Examples of virtual maps and tools:
• Google Maps • Google Earth • Google My Maps • Maps (Apple) • Bing Maps • WhereIs • Google Tour Builder • Google Street View • MapMyWalk app • SIX Maps (includes 1943 aerial photography of greater Sydney) • Scribble Maps • National Geographic MapMaker Interactive • Eyes on the Forest (Sumatra’s forests, wildlife and climate 1985 to the present)
NSW DEPARTMENT OF EDUCATION Page ! of !19 28 Consultation Draft 20-08-2016
Example of a virtual map. Public domain.
Layers of spatial information in a GIS map. Diane Quick. CC BY-SA 3.0.
Editing a map using GIS tools. Emilio Gómez Fernández. CC BY 2.5.
Notes on specific virtual maps and tools
(Due to copyright restrictions images of each mapping tool have not been included.)
Google Maps and Google Earth
The video GeogSpace: Google Maps and Google Earth explains their capabilities.
Google My Maps
Google My Maps enables the creation of custom-built maps. It is freely available for all teachers and students as part of Google Apps For Education (GAFE). To access Google My Maps: login to the DoE portal; select Google Apps for Education; select ‘Maps’; click on ‘Menu’ (small button to left of search bar with 3 lines); select 'Your places’; select ‘Maps’; open existing maps or select 'Create map' at bottom to make a new one.
Google MyMaps enables users to:
• Select different base maps (e.g. topographic, satellite, street) • Save and share easily • Pin photos (URL only, can Google search) and other details easily to a marker • Add directions to a map • Zoom in to create large-scale maps • Measure distance, perimeter, area.
Google Tour Builder
Google Tour Builder enables users to create a tour of places visited. Users can select locations on the map and add photographs, text and video. The completed tour can be shared. The tool can be used for recounting a fieldwork experience, with students providing photographs and text for specific sites investigated.
Points to note when using Google Tour Builder:
• It requires Google Earth Plugin. • Browsers which supports Google Earth 3D plugin include Firefox, Safari and Explorer. Google Tour Builder
defaults to a 2D version in other browsers. • Only use a laptop or desktop to create and or view tours. (Not a mobile device.) • Sign in using your DoE Gmail account: eg [email protected] and your password is the same
as you use to access DoE portal.
SIX Maps
SIX Maps has been developed by the NSW Department of Land and Property. It provides access to cadastral and topographic information, satellite data and aerial photography. SIX Maps does not have an annotation feature but a screenshot can be annotated in an app such as Skitch.
Users can:
• Measure area, distance • Enter or identify longitude and latitude • Search for an address, lot, suburb, POI (point of interest) • Add layers, e.g. flood imagery • Move between types of map using a sliding bar, e.g. 1943 to the present.
NSW DEPARTMENT OF EDUCATION Page ! of !20 28 Consultation Draft 20-08-2016
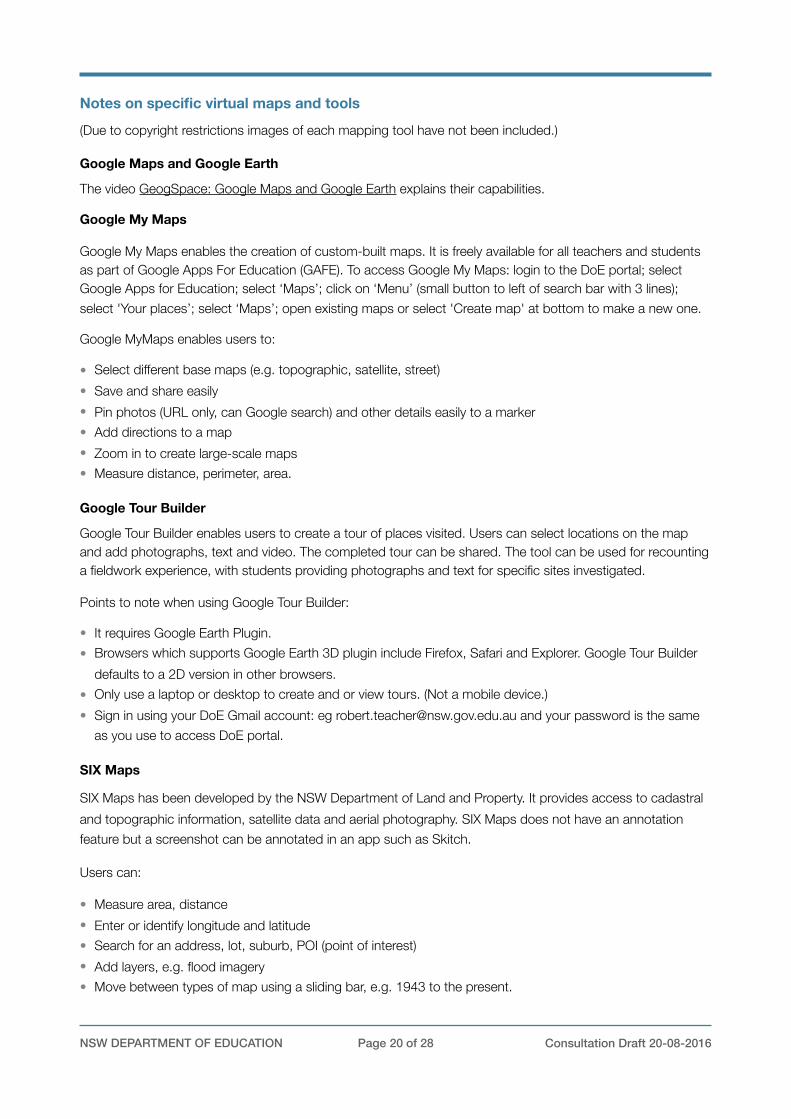
School Asset Map
A basic map of your school can be downloaded from DoE Asset Management. Steps to access your school map:
• Login to your portal • Select ‘My applications’ button • Select ‘AMS on the Web’ • Click on your school name, then ‘Fetch’ • Click on ‘PDF Plans’ • Click on ‘Site and Building Plans File’ and download pdf of site plan.
Scribble Maps
Scribble Maps is a map drawing tool. It enables users to:
• Draw on top of map and change colours • Measure area and measure distance and bearing between two points • Add text and add photos (have to know URL) • Use a huge range of markers, although these can get distracting and the
toolbar is complicated.
National Geographic Map Maker Interactive
Map Maker Interactive is an educational map making tool that uses small-scale maps. It has many positive features but there are limitations on zooming and editing is complicated.
Map Maker Interactive enables users to:
• Use different base maps (e.g. topographic, satellite, street) • Use a variety of markers and shapes • Turn on latitude and longitude lines • Add interesting layers (e.g. climate data, population data) • Measure distance (but not area).
Apps for geography
Apps that are useful geography tools include:
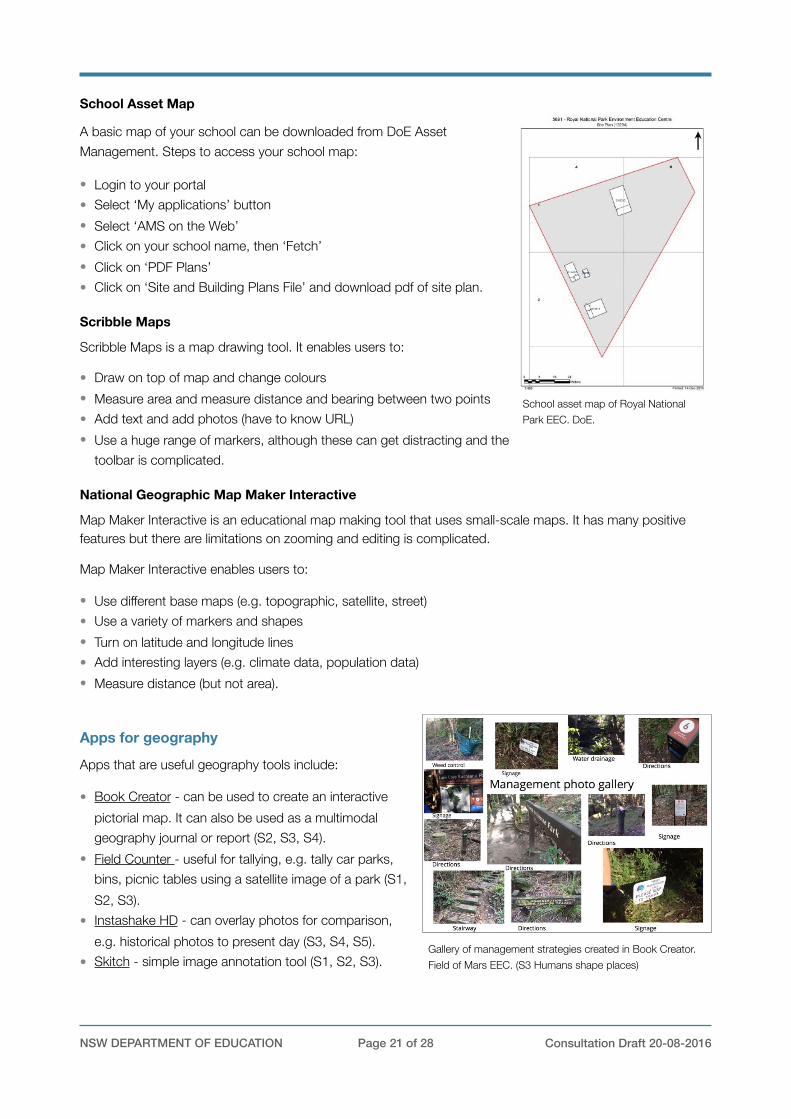
• Book Creator - can be used to create an interactive pictorial map. It can also be used as a multimodal geography journal or report (S2, S3, S4).
• Field Counter - useful for tallying, e.g. tally car parks, bins, picnic tables using a satellite image of a park (S1, S2, S3).
• Instashake HD - can overlay photos for comparison, e.g. historical photos to present day (S3, S4, S5).
• Skitch - simple image annotation tool (S1, S2, S3).
NSW DEPARTMENT OF EDUCATION Page ! of !21 28 Consultation Draft 20-08-2016
School asset map of Royal National Park EEC. DoE.
Gallery of management strategies created in Book Creator. Field of Mars EEC. (S3 Humans shape places)
GPS and GIS
Basic GPS (Global Positioning Systems) and GIS (Geographic Information Systems) are now a familiar part of life, e.g using a phone or car navigation device, tracking a pizza delivery or locating a lost mobile phone.
GPS - Global Positioning System (S2, S3, S4, S5)
GPS is a navigational system that relies on satellite signals to provide location and time information. GPS technology is integrated into mobile phones, car navigation and hand-held GPS devices. Each GPS device collects spatial data and plots it onto a base map. The digital plotting of spatial data to create visual images is a GIS (global information system).
Geocaching is an outdoor treasure hunt that requires a GPS enabled device to locate hidden items. Geocaching can provide an engaging method for undertaking geographical fieldwork, e.g each geocache could contain geographical questions to answer and data to collect (S2, S3).
GIS - Global Information System (S4, S5)
A GIS stores, manages, analyses and portrays spatial data. Sophisticated GIS maps have multiple layers of information generated by computer programs.
GIS maps are a valuable tool for geographers as they:
• are a source of geographical information, e.g. landforms, vegetation, land use • can be used for analysing spatial data, e.g. transposing mapping layers, measuring distances • can communicate spatial data, e.g. plotting fieldwork data, creating a tour.
The majority of virtual mapping tools listed previously have embedded GIS tools.
Remote sensing data (S5) Remote sensing includes the use of satellites, drones, aircraft and radars to collect geographical data and information remotely, e.g. satellite images.
Augmented reality (S5) Augmented reality (AR) is a computer-generated virtual view superimposed on a physical real world environment. Sound, video, graphics or GPS data are added to augment (supplement) the experience. Augmented reality in geography includes virtual reality videos that provide a 360 degrees viewing experience.
Virtual reality and 360 videos
Virtual reality is an immersive computer generated experience. Reasonably priced virtual reality goggles are also available, e.g Google Cardboard.
360 videos are filmed using a 360-degree camera and provide an immersive experience for the viewer, e.g. Growing a Better World (Virtual reality film) by Great Green Wall (You Tube).
NSW DEPARTMENT OF EDUCATION Page ! of !22 28 Consultation Draft 20-08-2016

VISUAL REPRESENTATIONS
What are visual representations? Visual representations include picture books, diagrams, images, photographs, paintings, illustrations, symbols, models, posters, collages, cartoons, multimedia, infographics and mind maps. They are used in all steps of the geographical inquiry process.
Refer to the geographical tools continuum for examples of visual representations appropriate to each stage of learning. There may be occasions where types of visual representations will be used that are below the stages identified, e.g. a line drawing, a simple version of a field sketch, can be completed by S2 and S3 students.
Photographs Photography is an essential geographical tool utilised during fieldwork. Photographs enable the recording and labelling of observations of features of places and are a valuable tool in describing geographical characteristics.
Contemporary photographs (ES1, S1, S2, S3, S4, S5)
Photographs in geography:
• record observations during fieldwork • enable virtual access to distant places • provide information varying from ground details to land use patterns over large areas • can be annotated with labels and descriptions • can be categorised and collated into annotated collages • add a visual element to tables, flowcharts and other graphic organisers • can be sequenced into simple slideshows with narration • can be embedded into multimodal texts and presentations.
Historical photographs (S3, S4, S5)
Historical photographs can be used by students to study changes in places over time. These can be sourced from digital collections such as Trove, State Library NSW, State Records and local libraries.
NSW DEPARTMENT OF EDUCATION Page ! of !23 28 Consultation Draft 20-08-2016
View north east over the piggery and chicken coup, Killalea State Park. Illawarra EEC. (S3 Factors that change environments)
Photographs record features of places. Botany Bay EEC. (S2 Significance of environments)
Illustrations
Sketches, field sketches, line drawings and photo sketches enable careful observation and interpretation of the features of places. They record and label features and are valuable tools in describing geographical characteristics. Labels are used to identify the main features. Annotations comment on features, areas and/or processes. Whilst apps are available to add text to photographs taken in the field, completing a hand drawn field sketch sharpens the viewer’s observational skills.
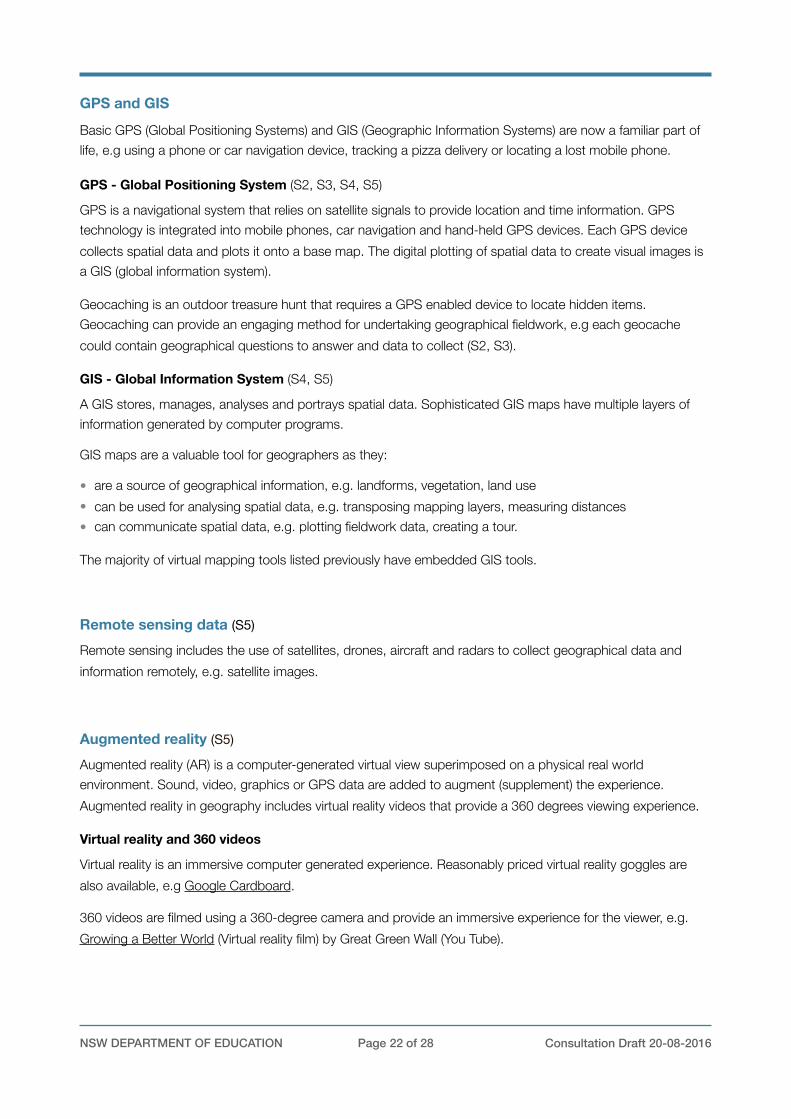
Sketches and illustrations (ES1, S1, S2, S3, S4, S5)
Sketches are a useful tool for recording features during fieldwork. A variety of media can be used, e.g. 2B pencils, scratch art, watercolour pencils, collages with natural materials, sketch apps on iPads.
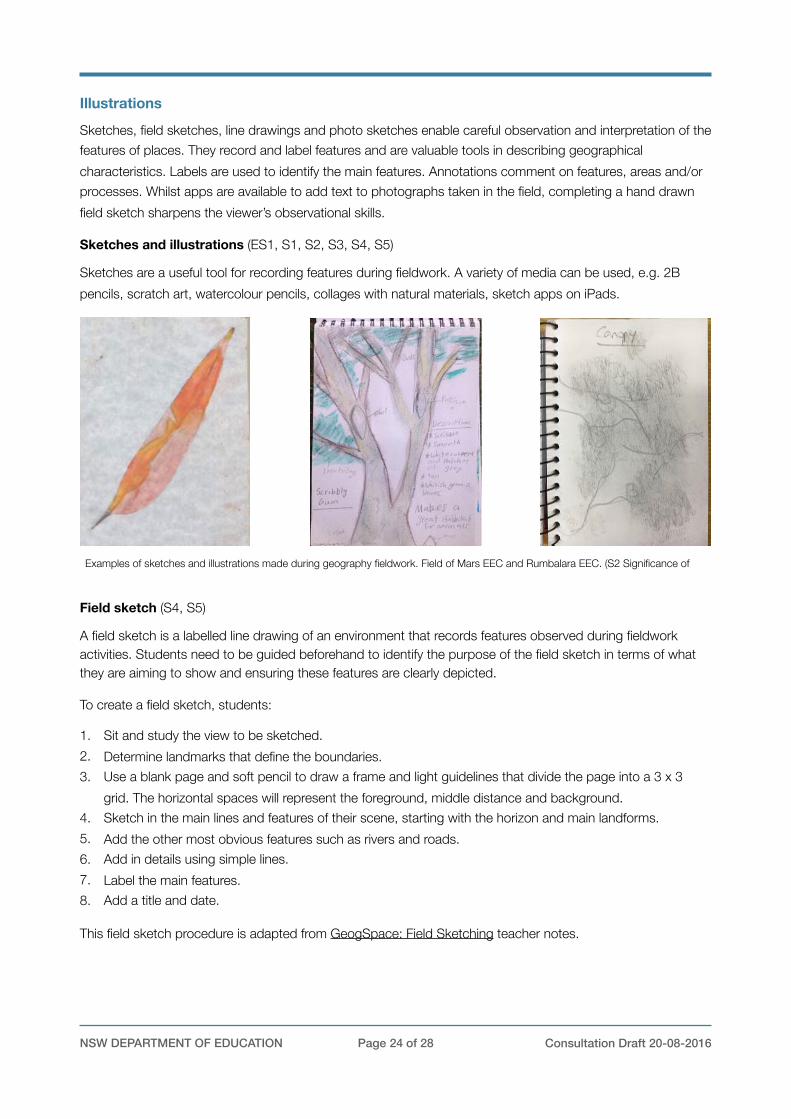
Field sketch (S4, S5)
A field sketch is a labelled line drawing of an environment that records features observed during fieldwork activities. Students need to be guided beforehand to identify the purpose of the field sketch in terms of what they are aiming to show and ensuring these features are clearly depicted.
To create a field sketch, students:
1. Sit and study the view to be sketched. 2. Determine landmarks that define the boundaries. 3. Use a blank page and soft pencil to draw a frame and light guidelines that divide the page into a 3 x 3
grid. The horizontal spaces will represent the foreground, middle distance and background. 4. Sketch in the main lines and features of their scene, starting with the horizon and main landforms. 5. Add the other most obvious features such as rivers and roads. 6. Add in details using simple lines. 7. Label the main features. 8. Add a title and date.
This field sketch procedure is adapted from GeogSpace: Field Sketching teacher notes.
NSW DEPARTMENT OF EDUCATION Page ! of !24 28 Consultation Draft 20-08-2016
Examples of sketches and illustrations made during geography fieldwork. Field of Mars EEC and Rumbalara EEC. (S2 Significance of
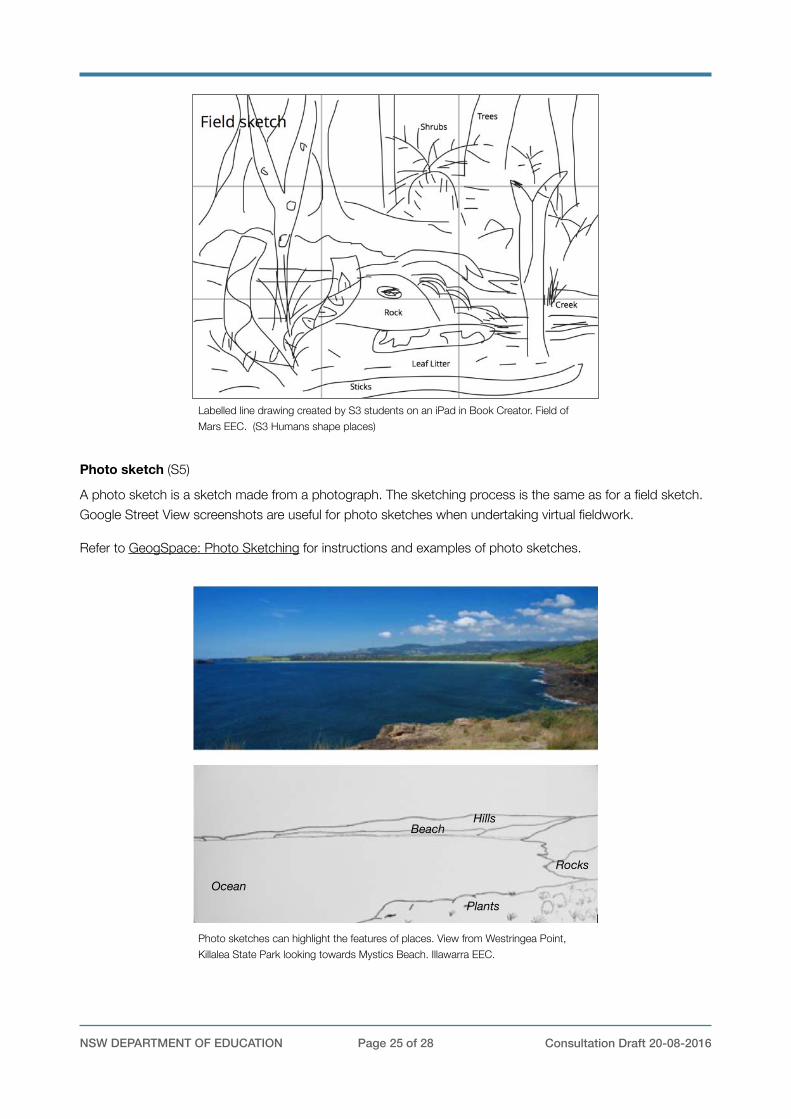
Photo sketch (S5)
A photo sketch is a sketch made from a photograph. The sketching process is the same as for a field sketch. Google Street View screenshots are useful for photo sketches when undertaking virtual fieldwork.
Refer to GeogSpace: Photo Sketching for instructions and examples of photo sketches.
NSW DEPARTMENT OF EDUCATION Page ! of !25 28 Consultation Draft 20-08-2016
Labelled line drawing created by S3 students on an iPad in Book Creator. Field of Mars EEC. (S3 Humans shape places)
Photo sketches can highlight the features of places. View from Westringea Point, Killalea State Park looking towards Mystics Beach. Illawarra EEC.
OceanPlants
Rocks
BeachHills
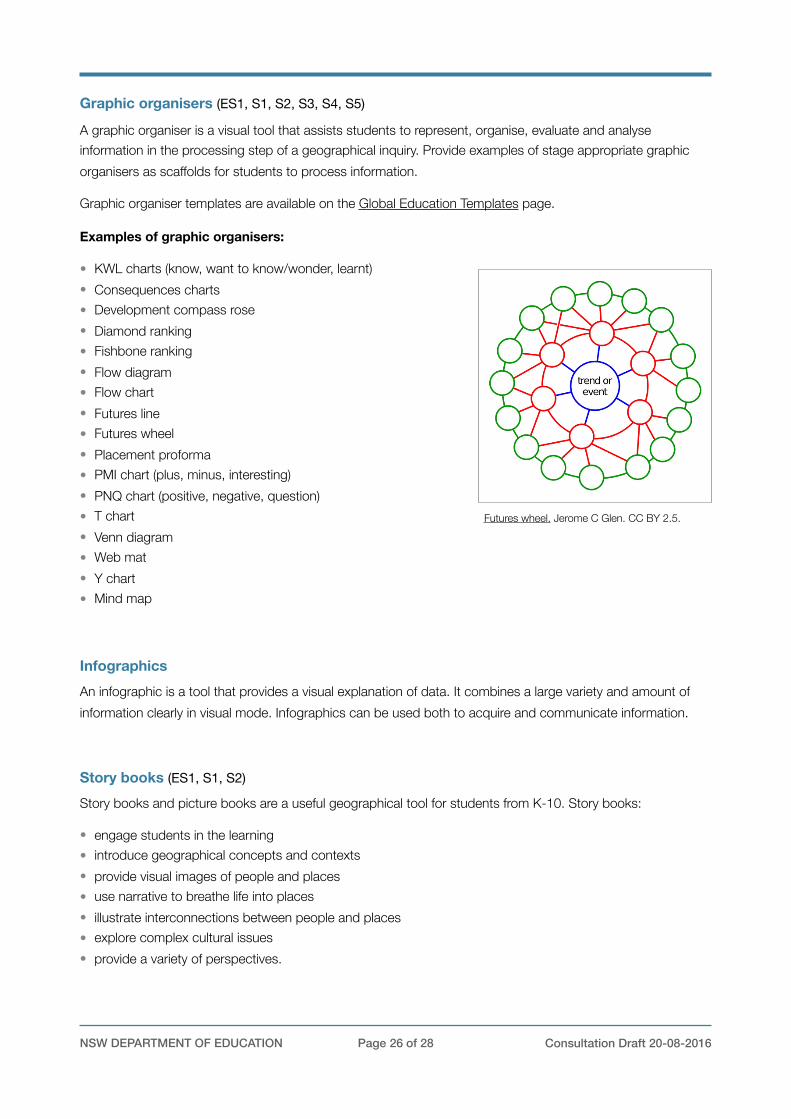
Graphic organisers (ES1, S1, S2, S3, S4, S5)
A graphic organiser is a visual tool that assists students to represent, organise, evaluate and analyse information in the processing step of a geographical inquiry. Provide examples of stage appropriate graphic organisers as scaffolds for students to process information.
Graphic organiser templates are available on the Global Education Templates page.
Examples of graphic organisers:
• KWL charts (know, want to know/wonder, learnt) • Consequences charts • Development compass rose • Diamond ranking • Fishbone ranking • Flow diagram • Flow chart • Futures line • Futures wheel • Placement proforma • PMI chart (plus, minus, interesting) • PNQ chart (positive, negative, question) • T chart • Venn diagram • Web mat • Y chart • Mind map
Infographics An infographic is a tool that provides a visual explanation of data. It combines a large variety and amount of information clearly in visual mode. Infographics can be used both to acquire and communicate information.
Story books (ES1, S1, S2) Story books and picture books are a useful geographical tool for students from K-10. Story books:
• engage students in the learning • introduce geographical concepts and contexts • provide visual images of people and places • use narrative to breathe life into places • illustrate interconnections between people and places • explore complex cultural issues • provide a variety of perspectives.
NSW DEPARTMENT OF EDUCATION Page ! of !26 28 Consultation Draft 20-08-2016
Futures wheel. Jerome C Glen. CC BY 2.5.
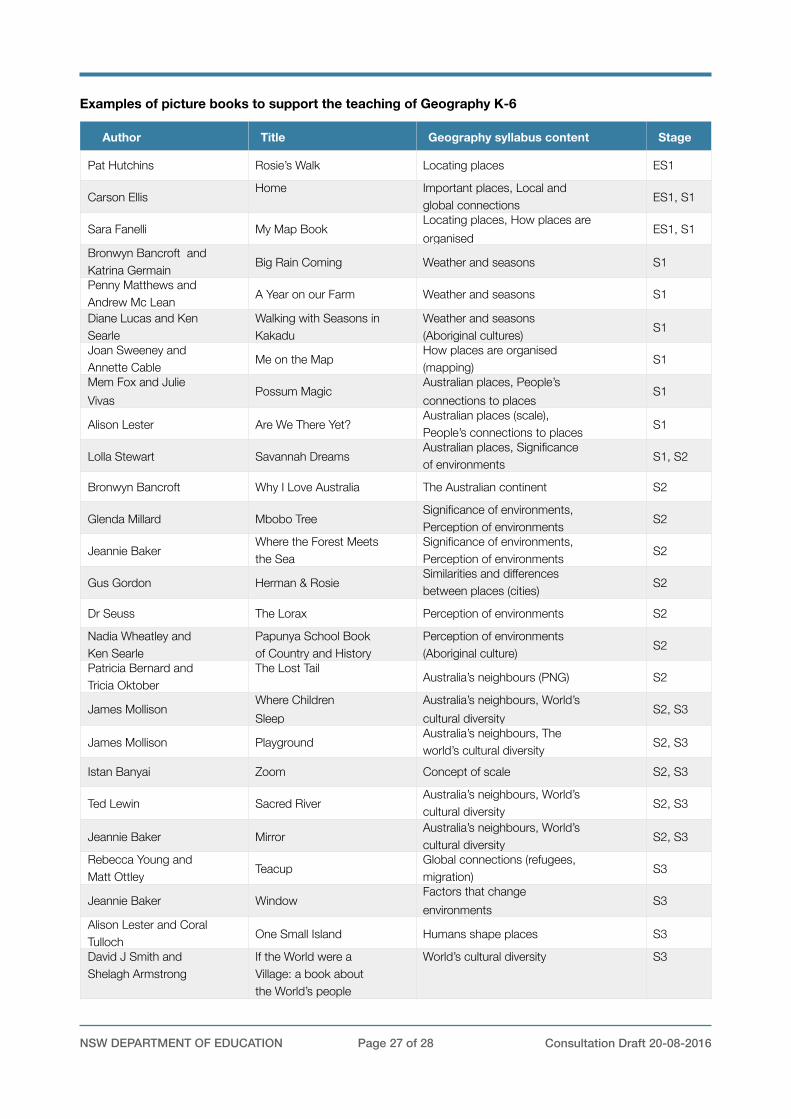
Examples of picture books to support the teaching of Geography K-6
Author Title Geography syllabus content Stage
Pat Hutchins Rosie’s Walk Locating places ES1
Carson EllisHome Important places, Local and
global connections ES1, S1
Sara Fanelli My Map Book Locating places, How places are organised
ES1, S1
Bronwyn Bancroft and Katrina Germain Big Rain Coming Weather and seasons S1
Penny Matthews and Andrew Mc Lean A Year on our Farm Weather and seasons S1
Diane Lucas and Ken Searle
Walking with Seasons in Kakadu
Weather and seasons (Aboriginal cultures) S1
Joan Sweeney and Annette Cable Me on the Map
How places are organised (mapping) S1
Mem Fox and Julie Vivas
Possum MagicAustralian places, People’s connections to places
S1
Alison Lester Are We There Yet?Australian places (scale), People’s connections to places S1
Lolla Stewart Savannah DreamsAustralian places, Significance of environments S1, S2
Bronwyn Bancroft Why I Love Australia The Australian continent S2
Glenda Millard Mbobo TreeSignificance of environments, Perception of environments S2
Jeannie Baker Where the Forest Meets the Sea
Significance of environments, Perception of environments S2
Gus Gordon Herman & RosieSimilarities and differences between places (cities) S2
Dr Seuss The Lorax Perception of environments S2
Nadia Wheatley and Ken Searle
Papunya School Book of Country and History
Perception of environments (Aboriginal culture) S2
Patricia Bernard and Tricia Oktober
The Lost Tail Australia’s neighbours (PNG) S2
James MollisonWhere Children Sleep
Australia’s neighbours, World’s cultural diversity
S2, S3
James Mollison PlaygroundAustralia’s neighbours, The world’s cultural diversity S2, S3
Istan Banyai Zoom Concept of scale S2, S3
Ted Lewin Sacred RiverAustralia’s neighbours, World’s cultural diversity S2, S3
Jeannie Baker MirrorAustralia’s neighbours, World’s cultural diversity S2, S3
Rebecca Young and Matt Ottley Teacup
Global connections (refugees, migration) S3
Jeannie Baker WindowFactors that change environments
S3
Alison Lester and Coral Tulloch One Small Island Humans shape places S3
David J Smith and Shelagh Armstrong
If the World were a Village: a book about the World’s people
World’s cultural diversity S3
NSW DEPARTMENT OF EDUCATION Page ! of !27 28 Consultation Draft 20-08-2016
NSW DEPARTMENT OF EDUCATION Page ! of !28 28 Consultation Draft 20-08-2016
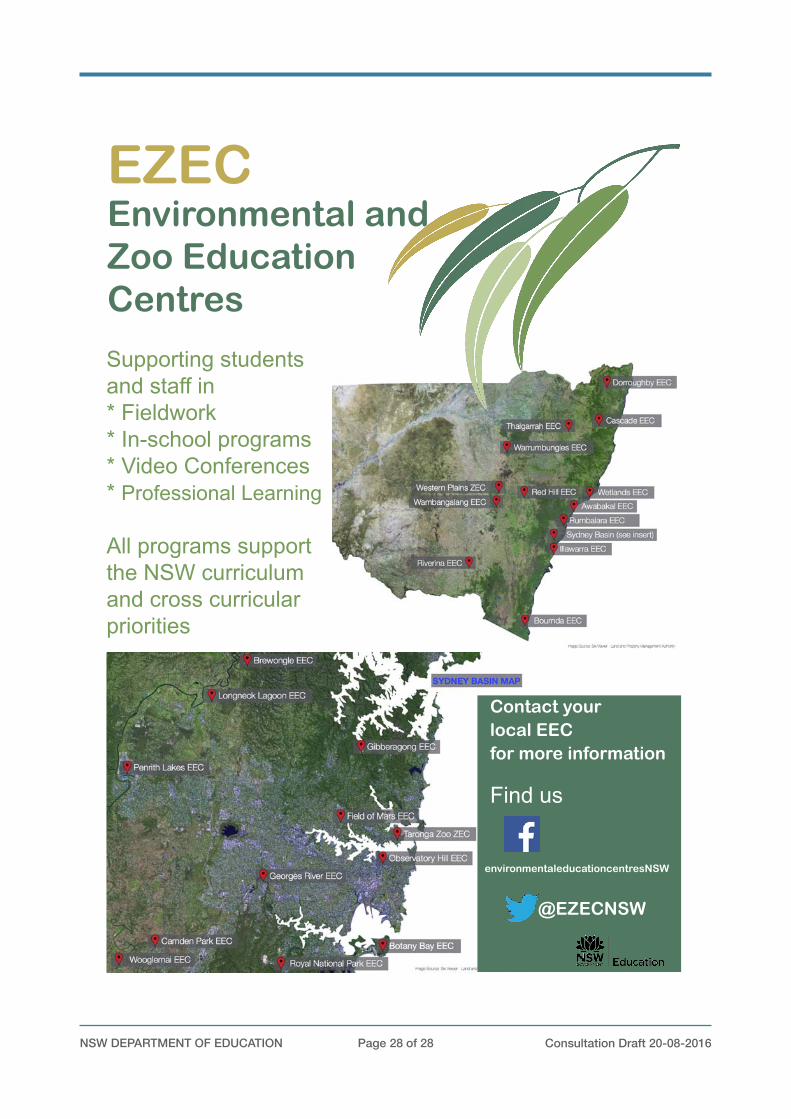
Supporting students and staff in * Fieldwork* In-school programs * Video Conferences* Professional Learning
All programs support the NSW curriculum and cross curricular priorities
Contact your local EEC for more information
Find us
environmentaleducationcentresNSW
@EZECNSW
EZECEnvironmental and Zoo Education Centres