Geographical distribution, climatic variability and thermo-tolerance of Chagas disease vectors
10
Early View (EV): 1-EV geographic distribution limits and climatic conditions across species (Gaston 2000, Gaston and Blackburn 2000), several climate-based hypotheses have been proposed. ese include the climate variability hypothesis (CVH), which states that terrestrial organisms distributed in highly variable environments (e.g. high latitudes or altitudes) are adapted to withstand a broader range of climatic condi- tions than organisms in less variable environments (e.g. low latitudes or altitudes). erefore, species at high lati- tudes (or altitudes) develop a broader range of tolerance to temperatures, hereinafter thermo-tolerance range, thus becoming more extensively distributed than species at low latitudes (or altitudes) (Snyder and Weathers 1975, Osovitz and Hofmann 2005, Compton et al. 2007). e thermo-tolerance range is a critical trait that deter- mines the physiological niche of insect species (Spicer and Gaston 1999) and it could be delimited by critical temper- atures (minimum and maximum) within which the indi- viduals are generally active (Chown and Nicolson 2004). e critical temperatures are defined as those beyond which the insects cannot respond to any further change in temperature, and therefore they will become vulnerable Ecography 38: 001–010, 2015 doi: 10.1111/ecog.01028 © 2014 e Authors. Ecography © 2014 Nordic Society Oikos Subject Editor: Sarah Diamond. Editor-in-Chief: Miguel Araújo. Accepted 3 November 2014 From a macroecological perspective, the limits for geo- graphic distribution of species may be understood as the result of the complex interactions among factors such as species-specific physiological and ecological traits, disper- sal ability, and biotic interactions (intra- and inter-specific) (Spicer and Gaston 1999, Gaston et al. 2009). A compre- hensive understanding of the underlying mechanisms that relate these factors is crucial to determine not only the cur- rent geographic distribution of a species, but also to pre- dict potential distribution into new areas. Physiological traits have important roles to shape geographical range of species and help to predict species responses to environ- mental climatic changes (Spicer and Gaston 1999, Addo- Bediako et al. 2000). Understanding how climatic variables affect the size of the geographic distribution of species is one of the main goals of climate-based hypotheses. Macrophysiology uses these hypotheses as a framework, based on the assumption that species have evolved differ- ent optima and tolerance ranges, which are represented by their present geographic distribution limits (Chown et al. 2004, Bozinovic et al. 2011). Since no single mecha- nism has been proven to explain the relationship between Geographical distribution, climatic variability and thermo-tolerance of Chagas disease vectors Gerardo J. de la Vega, Paula Medone, Soledad Ceccarelli, Jorge Rabinovich and Pablo E. Schilman G. J. de la Vega, Depto de Biodiversidad y Biología Experimental, Facultad de Ciencias Exactas y Naturales, Univ. de Buenos Aires, IBBEA- CONICET-UBA, Argentina. – P. Medone, S. Ceccarelli and J. Rabinovich, Centro de Estudios Parasitológicos y de Vectores (CONICET, CCT – La Plata, UNLP), Univ. Nacional de La Plata, La Plata, Provincia de Buenos Aires, Argentina. – P. E. Schilman ([email protected]), Laboratorio de Ecofisiología de Insectos, Depto de Biodiversidad y Biología Experimental (DBBE), Facultad de Ciencias Exactas y Naturales (FCEN), Univ. de Buenos Aires (UBA), Inst. de Biodiversidad y Biología Experimental y Aplicada (IBBEA) – CONICET-UBA, Ciudad Uni- versitaria, Pabellón II, Ciudad Autónoma de Buenos Aires (C1428EHA), Argentina. Understanding the relationship between geographic range limits and physiological traits of vector species is under increas- ing demand to predict the potential effects of global warming, not only in terms of geographic distribution of vector spe- cies but also in terms of the risk of disease transmission. Like in many other insect species, the geographical distribution of Chagas’ disease vectors is affected by temperature. is study examines, for the first time, the relationship between the limits of geographic distribution and thermo-tolerance of the most important vectors of Chagas disease, Triatoma infestans in southern South America and Rhodnius prolixus in northern South America and Central America, to test the climatic vari- ability hypothesis (CVH). We applied species distribution modeling (SDM) using bioclimatic variables and identified the most important limiting factors of the habitat suitability. en, we measured and compared: the critical thermal maximum (CTmax) and the upper lethal temperature (ULT) (measured by thermo-limit respirometry), chilled coma recovery (i.e. the time to recovery from 4 h at 0 °C) and the critical thermal minimum (CTmin). For both species the minimum temperature of the coldest month was the most important abiotic factor restricting their geographic distribution. By taking a correlative approach and testing predictions with thermal tolerance traits, it was possible to explain the southern limit distribution for both species in terms of physiological constraints. e greater temperature tolerance of T. infestans compared to R. prolixus supports the CVH.
-
Upload
conicet-ar -
Category
Documents
-
view
1 -
download
0
Transcript of Geographical distribution, climatic variability and thermo-tolerance of Chagas disease vectors

Early View (EV): 1-EV
geographic distribution limits and climatic conditions across species (Gaston 2000, Gaston and Blackburn 2000), several climate-based hypotheses have been proposed. Th ese include the climate variability hypothesis (CVH), which states that terrestrial organisms distributed in highly variable environments (e.g. high latitudes or altitudes) are adapted to withstand a broader range of climatic condi-tions than organisms in less variable environments (e.g. low latitudes or altitudes). Th erefore, species at high lati-tudes (or altitudes) develop a broader range of tolerance to temperatures, hereinafter thermo-tolerance range, thus becoming more extensively distributed than species at low latitudes (or altitudes) (Snyder and Weathers 1975, Osovitz and Hofmann 2005, Compton et al. 2007).
Th e thermo-tolerance range is a critical trait that deter-mines the physiological niche of insect species (Spicer and Gaston 1999) and it could be delimited by critical temper-atures (minimum and maximum) within which the indi-viduals are generally active (Chown and Nicolson 2004). Th e critical temperatures are defi ned as those beyond which the insects cannot respond to any further change in temperature, and therefore they will become vulnerable
Ecography 38: 001–010, 2015 doi: 10.1111/ecog.01028
© 2014 Th e Authors. Ecography © 2014 Nordic Society Oikos Subject Editor: Sarah Diamond. Editor-in-Chief: Miguel Ara ú jo. Accepted 3 November 2014
From a macroecological perspective, the limits for geo-graphic distribution of species may be understood as the result of the complex interactions among factors such as species-specifi c physiological and ecological traits, disper-sal ability, and biotic interactions (intra- and inter-specifi c) (Spicer and Gaston 1999, Gaston et al. 2009). A compre-hensive understanding of the underlying mechanisms that relate these factors is crucial to determine not only the cur-rent geographic distribution of a species, but also to pre-dict potential distribution into new areas. Physiological traits have important roles to shape geographical range of species and help to predict species responses to environ-mental climatic changes (Spicer and Gaston 1999, Addo-Bediako et al. 2000). Understanding how climatic variables aff ect the size of the geographic distribution of species is one of the main goals of climate-based hypotheses. Macrophysiology uses these hypotheses as a framework, based on the assumption that species have evolved diff er-ent optima and tolerance ranges, which are represented by their present geographic distribution limits (Chown et al. 2004, Bozinovic et al. 2011). Since no single mecha-nism has been proven to explain the relationship between
Geographical distribution, climatic variability and thermo-tolerance of Chagas disease vectors
Gerardo J. de la Vega , Paula Medone , Soledad Ceccarelli , Jorge Rabinovich and Pablo E. Schilman
G. J. de la Vega, Depto de Biodiversidad y Biolog í a Experimental, Facultad de Ciencias Exactas y Naturales, Univ. de Buenos Aires, IBBEA-CONICET-UBA, Argentina. – P. Medone, S. Ceccarelli and J. Rabinovich, Centro de Estudios Parasitol ó gicos y de Vectores (CONICET, CCT – La Plata, UNLP), Univ. Nacional de La Plata, La Plata, Provincia de Buenos Aires, Argentina. – P. E. Schilman ([email protected]), Laboratorio de Ecofi siolog í a de Insectos, Depto de Biodiversidad y Biolog í a Experimental (DBBE), Facultad de Ciencias Exactas y Naturales (FCEN), Univ. de Buenos Aires (UBA), Inst. de Biodiversidad y Biolog í a Experimental y Aplicada (IBBEA) – CONICET-UBA, Ciudad Uni-versitaria, Pabell ó n II, Ciudad Aut ó noma de Buenos Aires (C1428EHA), Argentina.
Understanding the relationship between geographic range limits and physiological traits of vector species is under increas-ing demand to predict the potential eff ects of global warming, not only in terms of geographic distribution of vector spe-cies but also in terms of the risk of disease transmission. Like in many other insect species, the geographical distribution of Chagas ’ disease vectors is aff ected by temperature. Th is study examines, for the fi rst time, the relationship between the limits of geographic distribution and thermo-tolerance of the most important vectors of Chagas disease, Triatoma infestans in southern South America and Rhodnius prolixus in northern South America and Central America, to test the climatic vari-ability hypothesis (CVH). We applied species distribution modeling (SDM) using bioclimatic variables and identifi ed the most important limiting factors of the habitat suitability. Th en, we measured and compared: the critical thermal maximum (CTmax) and the upper lethal temperature (ULT) (measured by thermo-limit respirometry), chilled coma recovery (i.e. the time to recovery from 4 h at 0 ° C) and the critical thermal minimum (CTmin). For both species the minimum temperature of the coldest month was the most important abiotic factor restricting their geographic distribution. By taking a correlative approach and testing predictions with thermal tolerance traits, it was possible to explain the southern limit distribution for both species in terms of physiological constraints. Th e greater temperature tolerance of T. infestans compared to R. prolixus supports the CVH.

2-EV
to predation, catastrophes or further temperature excess or defi cit (Byrne et al. 2004). Critical temperatures have a great value in ecological and evolutionary studies (Mitchell et al. 1993, Lighton and Turner 2004) and may be mea-sured by diff erent methods. For insect species, critical thermal minimum (CTmin) is the temperature resulting in the loss of coordinated muscle function, whereas critical thermal maximum (CTmax) is the temperature resulting in the onset of muscle spasms (Terblanche et al. 2006). Other relevant measures related to insect thermo-tolerance include lethal temperature and chill-coma recovery time (Chown and Nicolson 2004).
Previous studies suggest that global warming may aff ect insect physiology (e.g. by increasing metabolic and biting rate), thus aff ecting the transmission rate of vector-borne diseases (Rolandi and Schilman 2012). Th e knowledge of physiological tolerances such as thermo-tolerance range of insect vector species would not only contribute to the iden-tifi cation of the current active vectorial disease transmis-sion areas, but also potential new areas under future global warming. In Central and South America, Chagas disease is one of the most important vector-borne diseases, which is transmitted by insects belonging to subfamily Triatominae (Hemiptera, Reduviidae) (Schofi eld 1994). Th e majority of the 141 species (Galv ã o et al. 2003, Schofi eld and Galv ã o 2009) are distributed within or close to the inter-tropical areas, though some species are found in temperate regions with cold winters like Patagonia, in Argentina, or Indiana and Maryland, in the USA (Moncayo 1992, Carcavallo et al. 1999). Th e two most important vector species are Rhodnius prolixus in Central America and northern South America and Triatoma infestans in southern South America (Schofi eld 1994, WHO 2000, Guhl 2009). Th e eff ects of heat and temperature on physiological or behavioral pro-cesses in R. prolixus and T. infestans have been relatively well studied, such as general aspects of thermo-preference (Lazzari 1991, Canals et al. 1997, Schilman and Lazzari 2004), as well as the eff ects of heat and temperature on host fi nding and feeding (Lazzari and N ú ñ ez 1989a, b, Ferreira et al. 2007, Fresquet and Lazzari 2011), egg production, hatching and immature development time (Clark 1935, Luz et al. 1999), cessation of moulting (Okasha 1964, 1968a), learning and memory (Vinauger et al. 2013), and changes on the metabolic rate (Okasha 1968b). However, thermal tolerance traits have not been characterized for these species nor any other Chagas disease vectors.
Th e aim of this study was to explore the possible relation-ships between the thermo-tolerance and the geographic dis-tribution limits of R. prolixus and T. infestans . To this end, we combined two methodological approaches, species distribu-tion modeling (SDM) and physiological measurements. We fi rst modeled the habitat suitability of each species using bio-climatic variables and identifi ed the most important limit-ing factor that predicts habitat suitability. Th en we evaluated the thermal-tolerance limits by measuring CTmax, CTmin, upper lethal temperature (ULT) and chill-coma recovery time in both species. Finally, we analyzed the relationship between the most important limiting factors of habitat suit-ability and the thermo-tolerance range to test the CVH for R. prolixus and T. infestans .
Material and methods
Geographic analyses
Triatomine geographic distribution and ecological niche modeling Th e geographic distribution of R. prolixus and T. infestans was based on an Atlas with maps depicting the range of 115 triatomine species (Carcavallo et al. 1999). Based on these maps, a 0.1 ° ( ∼ 10 km) resolution grid was generated, the information digitized and a database built. From this database, which was previously used by Diniz-Filho et al. (2013) and Fergnani et al. (2013), and can be found in the public domain site (doi: http://dx.doi.org/10.6084/m9.fi gshare.653959), a 1% random subsample was taken for each species, resulting in 422 pseudo-presence data points for R. prolixus and 470 pseudo-presence data points for T. infestans . Th is selection included data points at central and border areas of the com-plete species distribution range assuming that species ranges are essentially the expression of a species ’ ecological niche in space (Sexton et al. 2009). In order to be more conservative, we did not take pseudo-absences due to the potential errors that can be introduced (Mackenzie and Royle 2005). A sim-ilar approach was used in Richmond et al. (2010). Using random pseudo-presence data has the advantage that there is no bias problem with sampling, although it may lead to over-predictions in characterizing climatic suitability, mainly because large-scale ‘ extent-of-occurrence ’ in geographical ranges may include some unsuitable areas, and thus tend to exaggerate actual occurrences (Graham and Hijmans 2006, Hurlbert and Jetz 2007, Jetz et al. 2008). However, a recent study concluded that some SDMs, including presence-only models like MaxEnt, are to some degree robust to locational errors in occurrence data (Graham et al. 2008).
Th e environmental variables used to model habitat suit-ability and identify the potentially limiting factor of the distribution were the bioclimatic variables related to temper-ature and precipitation at 5 arc-minutes resolution ( ∼ 10 km) available from WorldClim ( � www.worldclim.org � ). We used all the 19 bioclimatic variables (plus altitude) defi ned by WorldClim, which will be referred to their standard WorldClim acronym. Th e ecological relevant variables bio5 and bio6 were selected to compare our physiological analyses. In order to avoid collinearity among the variables, an analy-sis that computes a matrix of Pearson ’ s rank correlation coef-fi cients for all possible pairs of variables was carried out for both species using function rcorr from R software, package ‘ Hmisc ’ (R Core Team). Variables that correlated (r � 0.7) with bio5 or bio6 were excluded from further analyses. With the remaining explanatory bioclimatic variables, we assessed the extent of any remaining multicollinearity by the variance infl ation factor (VIF) for both species models using function vif of package ‘ car ’ from R software (R Core Team). To cal-culate VIF, we fi t a generalized linear model (glm) with bino-mial response ( ‘ presence/absence ’ ) containing the explanatory bioclimatic variables (10 000 pseudo-absences points were generated and used by randomly assigning unoccupied grid cells, VanDerWal et al. 2009, Barbet-Massin et al. 2012). Any variable with VIF � 10 was excluded (Zuur et al. 2009). Th e remaining variables were used to fi t a maximum entropy (MaxEnt) SDM with standard settings for the maxent
3-EV
function from the ‘ dismo ’ package in R software (Hijmans and Elith 2013). MaxEnt is a presence-only method that works with background points (Phillips et al. 2006). Th is model yields a continuous presence probability from 0 to 1, which represents the relative habitat suitability index of a given grid cell (Hijmans and Graham 2006, Phillips et al. 2006).
In order to investigate the limiting factors for geographic distribution, within MaxEnt we used the limiting factor analysis and map (Elith et al. 2010, Hill et al. 2012). At each pixel, the limiting factor analysis replaces each variable predictor by its average value at occupied sites. If a change results in the highest probability of occurrence, therefore the variable changed is viewed as a limiting factor (see Elith et al. 2010 and Hill et al. 2012, as well as its Supporting informa-tion, for more details).
Final models were run with 10-fold cross-validation and the goodness of fi t of the predictions were evaluated by the AUC (area under the receiver operating characteristic (ROC) curve) criterion, which varies from 0 to 1, with 0.5 for a model that performs not better than random, to 1.0 for a model with perfect ability to predict presence versus absence. Although, the use of AUC for testing ecological niche models obtained from presence-only data has been criticized (Lobo et al. 2007), it is very useful in SDMs for evaluating predic-tor contribution across consistent modeling conditions (e.g. background) (Elith et al. 2006, Terribile et al. 2010). MaxEnt predictions were visualized and mapped with Quantum-GIS ver. 2.0 software ( � www.qgis.org � ).
Physiological analyses
Insects For all the experiments we used unfed fi fth-instar nymphs of R. prolixus and T. infestans that had entered that instar one week before the start of the experiments. Insects were reared at 28 ° C under a 12:12 light/dark photoperiod (light on 08:00 am). Both species had been reared for over 10 gen-erations under the same controlled laboratory conditions.
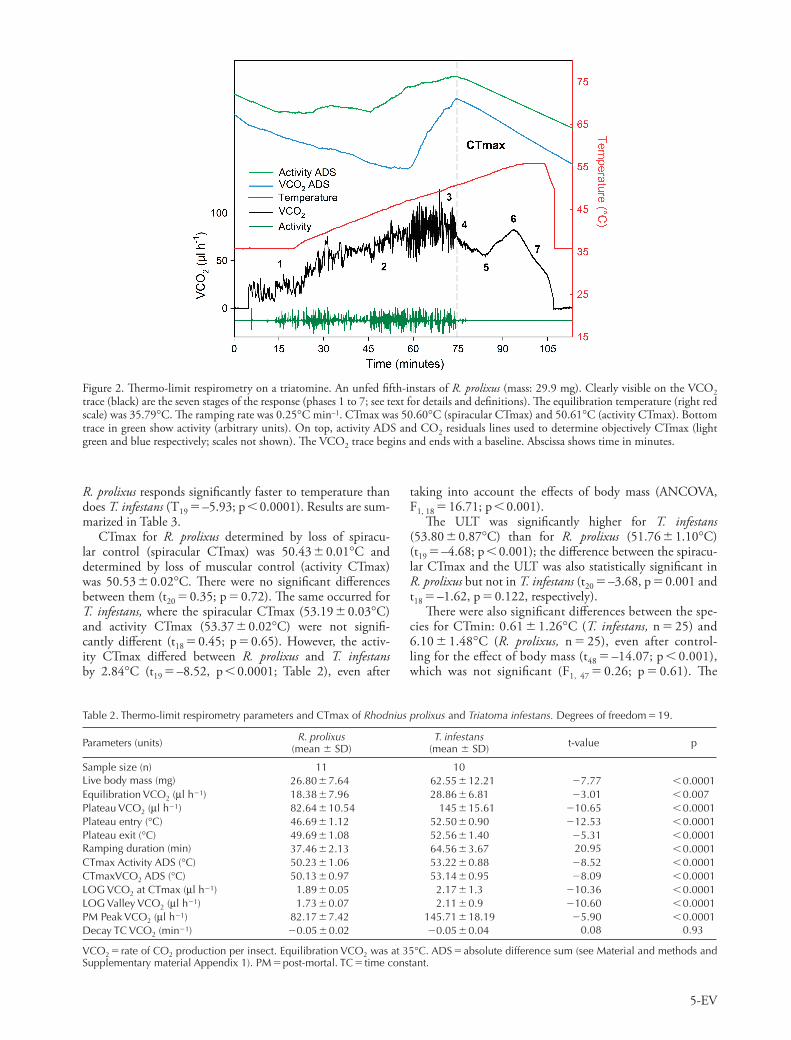
Critical thermal maxima and upper lethal temperature We used thermo-limit respirometry to determine CTmax (Lighton and Turner 2004). Within a temperature controlled cabinet, we set-up a fl ow-through respirometry system with a CO 2 IRGA attached to an activity detector to measure real time CO 2 production and motor activity in an unrestrained individual triatomine. Th e analog outputs from the analyz-ers measuring CO 2 , the insect’s activity, the temperature of the chamber, and the air fl ow rate were connected to an A/D converter and stored in a computer at 1 Hz by ExpeData data acquisition software (Sable Systems International, SSI). A protocol similar to that of Lighton and Turner (2004) was used. After recording an empty chamber as a baseline, an individual triatomine was placed in the respirometry cham-ber and the recording re-started with a temperature profi le beginning with 15 min at 35 ° C, and followed by a ramp at a rate of 0.25 ° C min – 1 . CTmax was defi ned by two crite-ria: motor activity and respiratory breakdown. To determine the respiratory CTmax more accurately, Lighton and Turner (2004) proposed the identifi cation of the infl ection point in the absolute diff erence sum (ADS), which is the cumulative
sum of the absolute diff erences between adjacent VCO 2 data points. Th is infl ection point is suggested to be an objective method for identifying the point at which short-term vari-ability in the VCO 2 data declines abruptly, thus indicating the cessation of spiracular activity by the insect. Th is tech-nique has the advantage of being highly repeatable and as objective as may be possible with such measurements. After CTmax occurred, we distinguished the ULT in the same recording (see Supplementary material Appendix 1, 5 for full details). Each insect was weighed before and after the assay to the nearest 0.1 mg on an analytical balance (Mettler AJ100, OH, USA).
Critical thermal minimum To measure CTmin, triatomines were tested on a tempera-ture plate (Pelt-plate, Sable Systems International (SSI), Las Vegas, NV, USA) connected to a SSI ’ s Pelt-5 temperature controller, which generated a temperature profi le that began with a baseline of 15 min at 20 ° C followed by a ramp at a rate of – 0.25 ° C min – 1 for 100 min. Final temperature was maintained for 10 min, and fi nally the program resets the temperature plate to 20 ° C. Insects were placed over the plate individually and confi ned by a 5 cm diameter acrylic con-tainer with plastic mesh on top. Temperatures were measured by a thermocouple (type T) attached to a SSI TC-2000 ther-mocouple meter placed as close as possible to the container. CTmin was defi ned as loss of coordinated muscle function (Terblanche et al. 2006) and it was determined when insect did not respond to a soft touch by a thin cupper fi lament through the mesh. Th e temperature at which this occurred was recorded manually by a mark superimposed on the temperature profi le recorded with data acquisition software (ExpeData; SSI, Las Vegas, NV, USA).
Chill-coma recovery time Th e time required to recover from cold exposure (ca 0 ° C), usu-ally referred as chill-coma recovery, was measured as another way to assess cold resistance . Insects were individually placed for 4 h in small containers in melting ice, and then transferred to Petri dishes (70 � 10 mm) with the bottom covered by fi lter paper in a controlled temperature cabinet at 28 ° C (i.e. same temperature at which insects were reared). Using forceps kept under cold conditions, each insect was positioned on its back on the center of a Petri dish. Recovery time was recorded when insects assumed an upright position (visually observed through a glass), or recorded as non-recovered if insects did not assumed an upright position after one hour. Each indi-vidual was weighed to the nearest 0.1 mg on an analytical balance (Mettler AJ100, OH, USA) before the assay.
In all cases, means are accompanied by sample sizes and standard deviations, except when noted (for a detailed explana-tion of methods see Supplementary material Appendix 1, 5).
Results
Geographic analyses
Geographic distribution and ecological niche modeling After correlation analysis among bioclimatic variables, six variables for T. infestans and seven variables for R. prolixus
4-EV
group of 0.838 � 0.032 and 0.839 � 0.018 for R. prolixus and T. infestans, respectively (Table 1).
Physiological analyses
CTmax for both species showed a temporal response to ramped temperatures typical of the ones found in other insects. Figure 2 illustrates the seven distinct phases described by Lighton and Turner (2004) in two Pogonomyrmex ant spe-cies: 1) the equilibration phase during which VCO 2 is con-stant, 2) beginning of the temperature ramp, with VCO 2 increasing exponentially, 3) a ‘ pre-mortal plateau ’ phase, during which VCO 2 does not increase with temperature, 4) a steep decline in VCO 2 during which a ‘ mortal fall ’ takes place because spiracular control (as measured by VCO 2 ADS) and activity (as measured by activity ADS) abruptly cease, 5) a ‘ post-mortal valley ’ , indicated by a low point in VCO 2 , 6) a new rise in VCO 2 (the ‘ post-mortal peak ’ ), followed by a slow decline in VCO 2 , and 7) a classic exponential decay which progresses (if the recording is allowed to continue for long enough) back to baseline levels. CTmax occurred dur-ing phase 4 (Fig. 2) and comparative statistics for both spe-cies are summarized in Table 2. All the parameters showed signifi cant diff erences between species except for VCO 2 time constant decay progress; eleven out of twelve thermo-respirometry and size variables were signifi cantly larger for T. infestans than for R. prolixus (Table 2). However, the live body mass diff ered signifi cant between species (t 19 � – 7.77, p � 0.0001; Table 2). Th us, the mass-independent metabolic rate was calculated by dividing catabolic fl ux rates in μ W by live mass in mg raised to the 0.856 power, which is the inter-specifi c mass scaling exponent for tracheate arthropods (Lighton et al. 2001). After live body mass and Bonferroni corrections were performed, no signifi cant diff erences in the mass-independent metabolic rate during equilibration phase (phase 1; t 19 � 1.35; p � 0.19) and plateau phases (phase 3; t 19 � 2.48; p � 0.02) were found between species. In the ramping phase (phase 2), the regressions of mass-indepen-dent metabolic rate vs temperature for R. prolixus (slope: 1.89 � 0.44; intercept: – 63.99 � 17.58) and for T. infestans (slope: 0.99 � 0.20; intercept: – 34.34 � 8.01) revealed that
were selected to fi t glm models. For T. infestans , all variance infl ation factors (VIFs) were below 10, suggesting that col-linearity was no longer a major issue (Zuur et al. 2009). For R. prolixus , however, the VIFs of bio2, bio3, bio5 and bio6 were larger than 10, so it was necessary to remove one variable. Since bio3 is a byproduct of bio2, bio5 and bio6 (bio3 � bio2 � (bio5 – bio6) – 1 � 100), we decided to exclude this variable and after this exclusion all VIFs for R. prolixus were below 10 (see Table 1 for selected variables).
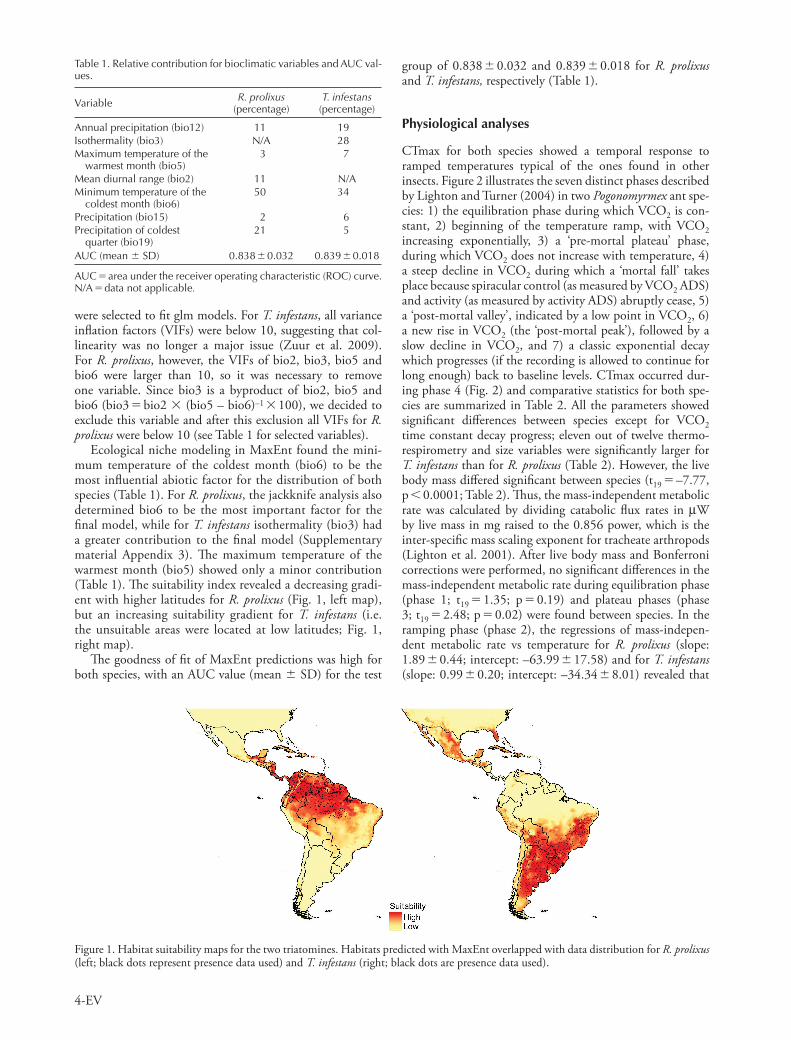
Ecological niche modeling in MaxEnt found the mini-mum temperature of the coldest month (bio6) to be the most infl uential abiotic factor for the distribution of both species (Table 1). For R. prolixus , the jackknife analysis also determined bio6 to be the most important factor for the fi nal model, while for T. infestans isothermality (bio3) had a greater contribution to the fi nal model (Supplementary material Appendix 3). Th e maximum temperature of the warmest month (bio5) showed only a minor contribution (Table 1). Th e suitability index revealed a decreasing gradi-ent with higher latitudes for R. prolixus (Fig. 1, left map), but an increasing suitability gradient for T. infestans (i.e. the unsuitable areas were located at low latitudes; Fig. 1, right map).
Th e goodness of fi t of MaxEnt predictions was high for both species, with an AUC value (mean � SD) for the test
Table 1. Relative contribution for bioclimatic variables and AUC val-ues.
Variable R. prolixus (percentage)
T. infestans (percentage)
Annual precipitation (bio12) 11 19Isothermality (bio3) N/A 28Maximum temperature of the
warmest month (bio5)3 7
Mean diurnal range (bio2) 11 N/AMinimum temperature of the
coldest month (bio6)50 34
Precipitation (bio15) 2 6Precipitation of coldest
quarter (bio19)21 5
AUC (mean � SD) 0.838 � 0.032 0.839 � 0.018
AUC � area under the receiver operating characteristic (ROC) curve. N/A � data not applicable .
Figure 1. Habitat suitability maps for the two triatomines. Habitats predicted with MaxEnt overlapped with data distribution for R. prolixus (left; black dots represent presence data used) and T. infestans (right; black dots are presence data used).
5-EV
taking into account the eff ects of body mass (ANCOVA, F 1, 18 � 16.71; p � 0.001).
Th e ULT was signifi cantly higher for T. infestans (53.80 � 0.87 ° C) than for R. prolixus (51.76 � 1.10 ° C) (t 19 � – 4.68; p � 0.001); the diff erence between the spiracu-lar CTmax and the ULT was also statistically signifi cant in R. prolixus but not in T. infestans (t 20 � – 3.68, p � 0.001 and t 18 � – 1.62, p � 0.122, respectively).
Th ere were also signifi cant diff erences between the spe-cies for CTmin: 0.61 � 1.26 ° C ( T. infestans, n � 25) and 6.10 � 1.48 ° C ( R. prolixus, n � 25), even after control-ling for the eff ect of body mass (t 48 � – 14.07; p � 0.001), which was not signifi cant (F 1, 47 � 0.26; p � 0.61). Th e
R. prolixus responds signifi cantly faster to temperature than does T. infestans (T 19 � – 5.93; p � 0.0001). Results are sum-marized in Table 3.
CTmax for R. prolixus determined by loss of spiracu-lar control (spiracular CTmax) was 50.43 � 0.01 ° C and determined by loss of muscular control (activity CTmax) was 50.53 � 0.02 ° C. Th ere were no signifi cant diff erences between them (t 20 � 0.35; p � 0.72). Th e same occurred for T. infestans, where the spiracular CTmax (53.19 � 0.03 ° C) and activity CTmax (53.37 � 0.02 ° C) were not signifi -cantly diff erent (t 18 � 0.45; p � 0.65). However, the activ-ity CTmax diff ered between R. prolixus and T. infestans by 2.84 ° C (t 19 � – 8.52, p � 0.0001; Table 2), even after
Table 2. Thermo-limit respirometry parameters and CTmax of Rhodnius prolixus and Triatoma infestans. Degrees of freedom � 19.
Parameters (units) R. prolixus (mean � SD)
T. infestans (mean � SD) t-value p
Sample size (n) 11 10Live body mass (mg) 26.80 � 7.64 62.55 � 12.21 � 7.77 � 0.0001Equilibration VCO 2 ( μ l h � 1 ) 18.38 � 7.96 28.86 � 6.81 � 3.01 � 0.007Plateau VCO 2 ( μ l h � 1 ) 82.64 � 10.54 145 � 15.61 � 10.65 � 0.0001Plateau entry ( ° C) 46.69 � 1.12 52.50 � 0.90 � 12.53 � 0.0001Plateau exit ( ° C) 49.69 � 1.08 52.56 � 1.40 � 5.31 � 0.0001Ramping duration (min) 37.46 � 2.13 64.56 � 3.67 20.95 � 0.0001CTmax Activity ADS ( ° C) 50.23 � 1.06 53.22 � 0.88 � 8.52 � 0.0001CTmaxVCO 2 ADS ( ° C) 50.13 � 0.97 53.14 � 0.95 � 8.09 � 0.0001LOG VCO 2 at CTmax ( μ l h � 1 ) 1.89 � 0.05 2.17 � 1.3 � 10.36 � 0.0001LOG Valley VCO 2 ( μ l h � 1 ) 1.73 � 0.07 2.11 � 0.9 � 10.60 � 0.0001PM Peak VCO 2 ( μ l h � 1 ) 82.17 � 7.42 145.71 � 18.19 � 5.90 � 0.0001Decay TC VCO 2 (min � 1 ) � 0.05 � 0.02 � 0.05 � 0.04 0.08 0.93
VCO 2 � rate of CO 2 production per insect. Equilibration VCO 2 was at 35 ° C. ADS � absolute difference sum (see Material and methods and Supplementary material Appendix 1). PM � post-mortal. TC � time constant.
Figure 2. Th ermo-limit respirometry on a triatomine. An unfed fi fth-instars of R. prolixus (mass: 29.9 mg). Clearly visible on the VCO 2 trace (black) are the seven stages of the response (phases 1 to 7; see text for details and defi nitions). Th e equilibration temperature (right red scale) was 35.79 ° C. Th e ramping rate was 0.25 ° C min – 1 . CTmax was 50.60 ° C (spiracular CTmax) and 50.61 ° C (activity CTmax). Bottom trace in green show activity (arbitrary units). On top, activity ADS and CO 2 residuals lines used to determine objectively CTmax (light green and blue respectively; scales not shown). Th e VCO 2 trace begins and ends with a baseline. Abscissa shows time in minutes.

6-EV
Discussion
Th is study represents the fi rst attempt to link geographical distribution and physiological limitations for T. infestans and R. prolixus , the two most important vectors of Chagas disease with very diff erent latitudinal distribution. Th e macrophysi-ology approach used combining SDMs with physiological experiments allows us to test the CVH on these insects that could explain their pattern of distribution in agreement with Rapoport’s rule. Ecological niche modeling corroborated the link between climatic parameters of the distribution of these species with their thermo-tolerance physiology.
Ecological implications
Results of the ecological niche modeling (Fig. 1) with mini-mum temperature of the coldest month as the dominant bioclimatic variable indicate that the habitat suitability index has a complementary pattern of geographic distribu-tion between R. prolixus and T. infestans : the non-suitable area for R. prolixus seems to be a suitable one for T. infestans and vice-versa. However, there is a geographic area between the two species distributions that is not predicted to hold a suitable climate space for either species: the Andes and
interspecifi c diff erence for CTmin (5.49 ° C) was larger than that for CTmax (2.84 ° C).
When insects were 4 hours exposed to a stressful cold temperature of ca 0 ° C, T. infestans had an average chill-coma recovery time of 15.63 � 3.63 min with 100% recovery (n � 25), while none of R. prolixus (0%) recovered (n � 25).
Link between geographical and physiological analyses
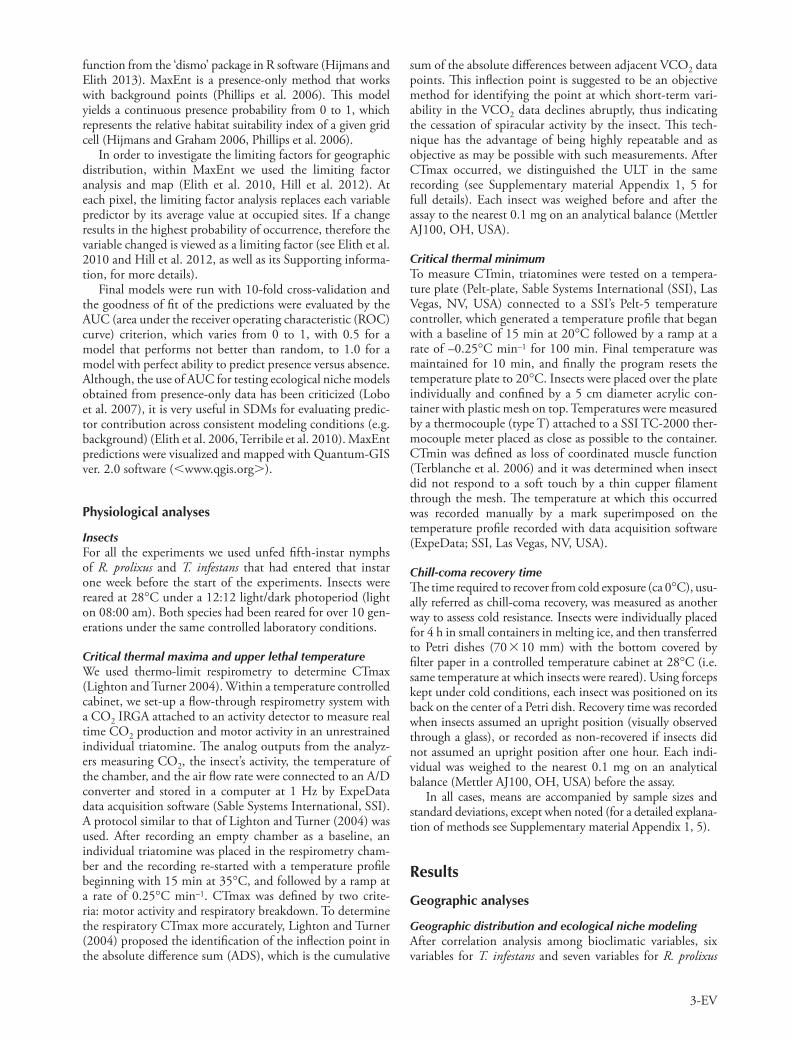
Figure 3 shows the temperature range of the presence data points used for each species and their physiological thermo-tolerance range obtained experimentally. In terms of the minimum temperature of the coldest month, the geographic presence enclosed by the 95% ellipse suggests broader limits for T. infestans (range ca 24 ° C) than for R. prolixus (range ca 8 ° C) (Fig. 3). Moreover, T. infestans was found up to ca 4 ° C below of its CTmin and 10.3 ° C when considering all points, in contrast to R. prolixus, which was not found below its CTmin (6.1 ° C). Th e upper limit of the maximum tem-perature of the warmest month was similar for both species (around 36 ° C), which was approximately 14 ° C and 17 ° C below their respective CTmax for R. prolixus and T. infestans , respectively.
Table 3.Thermo-limit respirometry parameters with mass-independence correction for Rhodnius prolixus and Triatoma infestans. Degrees of freedom � 19.
Parameters (units) R. prolixus
(mean � SD) T.infestans
(mean � SD) t-value p
Equilibration VCO 2 ( μ W � mg � 0.856 ) 0.72 � 0.20 0.63 � 0.10 1.39 0.19Plateau VCO 2 ( μ W � mg � 0.856 ) 1.42 � 0.06 1.34 � 0.06 2.48 0.02Ramping phase ( μ W � mg – 0.856 � ° C � 1 ) 1.89 � 0.44 0.99 � 0.20 � 5.93 � 0.0001
VCO 2 : rate of CO 2 production per insect. Equilibration VCO 2 was at 35 ° C.
Figure 3. Extreme temperatures for the two triatomines distributions. Th e maximum temperature ( ° C) of the warmest month and the minimum temperature ( ° C) of the coldest month are depicted for each coordinate with triatomine presence for R. prolixus (red) and T. infestans (black). Th e upper and lower physiological thermal limits (CTmax � horizontal dashed lines; CTmin � vertical dashed lines for each species) defi ne the potential maximum thermo-tolerance range: 44.13 ° C (CTmax � 50.23 ° C; CTmin � 6.10 ° C) for R. prolixus , and 52.61 ° C (CTmax � 53.22 ° C; CTmin � 0.61 ° C) for T. infestans . Ellipses enclose 95% of the presence data for each species.
7-EV
not show any signifi cant diff erences between species in their mass-independence metabolic rates during the equilibra-tion and plateau phases (Table 3). Th us, our results do not support the ‘ metabolic cold adaptation ’ hypothesis, which predicts populations or species from cooler environments (high altitude or latitude) will have either a higher metabolic rate at a common temperature or greater sensitivity of aero-bic metabolism to temperature (Clarke 1991, Terblanche et al. 2009). Instead, the sensitivity of metabolic rate to temperature of R. prolixus (inhabiting lower latitudes) was higher than the sensitivity of T. infestans (inhabiting higher latitudes). A possible explanation could be that although T. infestans is geographically distributed at lower latitudes than R. prolixus , the latter experience higher mean temperatures, but not necessary higher maximal ones. During the tempera-ture increasing ramp (phase 2 from Fig. 2), the regression of mass-independence metabolic rate vs temperature revealed that R. prolixus has a signifi cantly higher temperature sensi-tivity (higher slope) than T. infestans . Th ese results, together with diff erences between species in the temperature at which they enter the plateau (higher for T. infestans ) and the dura-tion of the ramping phase (longer for T. infestans ; Table 2) would explain the species diff erences in CTmax.
Interestingly, the signifi cant diff erences in the upper and lower thermal limits found between T. infestans and R. prolixus have persisted even after more than 10 generations under the same controlled laboratory conditions (they were reared in the same laboratory). Th us, even if there has been no diff erential acclimation, we have found intrinsic diff er-ences between the two species. It was demonstrated that acclimation account for most of the phenotypic plasticity in tsetse fl y Glossina pallidipes (Terblanche et al. 2006). Th e lat-ter together with previous results of other hematophagous insects (Lyons et al. 2012) indicate that it is reasonable to expect similar results when compared with wild populations of triatomines. Th is is evident for two malaria vector species ( Anopheles arabiensis and A. funestus ), where the thermal tol-erance from long-standing laboratory colonies and fi eld-col-lected animals were suffi ciently similar to provide reasonable surrogates when making inferences about wild population responses (Lyons et al. 2012). In fact, preliminary results for T. infestans suggest a similar CTmin measured from a fi eld population and our laboratory colony.
Linking geographical distribution to physiological traits
Both species, R. prolixus and T. infestans , are geographically distributed along areas where maximum temperatures of the warmest month are considerably lower than their respec-tive CTmax (Fig. 3). Th is could be considered as an adaptive strategy to prevent individuals from exposure to tempera-tures near their CTmax, which is extremely close to their ULT (ca 1 degree), providing a large safety buff er to extreme conditions. With respect to the minimum temperatures of the coldest month (bio6), the more tropical species, R. prolixus , inhabits areas where this variable is higher than its CTmin (Fig. 3, red ellipse), whereas T. infestans inhabits areas where the bio6 is up to ca 4 ° C lower than its CTmin (Fig. 3, blue ellipse). Since T. infestans could be found in
central part of Brazil. For the Andean region, a possible abiotic cause for the absence of both species could be the temperature decrease due to altitude, which is consistent with the fact that most triatomine species and populations are found between sea level and 1500 m a.s.l. (Carcavallo et al. 1999). For the central part of Brazil, the limiting factor maps suggests that bio6 and precipitation variables (bio12 and bio19) are limiting factors for the southern distribution of R. prolixus and the northern distribution of T. infestans (Supplementary material Appendix 4, Fig. A3). In addition, competitive biotic interactions among triatomines should not be disregarded, since most triatomines species in South America are found in this region (Rodriguero and Gorla 2004, Diniz-Filho et al. 2013).
Our results confi rm the importance of temperature in the distribution of T. infestans, as was determined by Gorla (2002), who showed by stepwise linear discriminant analy-sis a function with six statistical descriptors (four of them associated with air temperature, one associated with medium infrared radiation and one with the vegetation index) that identifi ed correctly 90% of presence and absence sites of T. infestans . In a more recent study, de Souza et al. (2010) showed that annual rainfall and annual rainfall of the most humid trimester apparently limit the spatial distribution of T. vitticeps in Brazil. On the other hand, Diniz-Filho et al. (2013) found that temperature seasonality plays a key role in richness and distribution of triatomines species.
It would be of interest to extend our results to estimate the impact of extreme temperatures on the population dynam-ics and demographic processes (e.g. mortality, birth rate, dispersion) of these two triatomine species and the subse-quent consequences on the transmission risk of Chagas dis-ease. However to do so, one would have to use an approach similar to that of Gorla et al. (1997), but such development would depend on the conversion of the upper and lower critical and lethal temperatures to the conditions of the microhabitat (domestic and sylvatic), their duration, and an estimation of the probability of reaching those critical and lethal values. We strongly suggest that such a line of research be pursued because understanding the force of transmission in epidemiology as it relates to future climate change sce-narios is important (Randolph 2009), and may represent the most robust basis for predicting future geographic changes in the transmission risk of Chagas disease within each of the aff ected countries.
Physiological implications
Th e CO 2 emission profi les of R. prolixus and T. infestans show the same seven distinct phases that have been found in all insect species studied by thermo-limit respirometry so far (Klok et al. 2004, Lighton and Turner 2004). Th is would suggest that the mechanisms responsible for the changes in CO 2 release could be conserved across insects. Addo-Bediako and collaborators found that, after controlling for trial temperature and body mass, environmental tempera-ture signifi cantly infl uences inter-specifi c variation in insect metabolic rate, with insects from colder environments tend-ing to have higher metabolic rates (Addo-Bediako et al. 2002). However, after Bonferroni correction our results do
8-EV
temperatures. Similarly, winter temperature was found as the key factor limiting the northwest expansion of leafcut-ter ant Atta texana populations in North America (Mueller et al. 2011) and northern populations of the pitcher plant mosquito Wyeomyia smithii where northern populations were more cold tolerant than those from southern ones, a consequence that the authors attributed largely to the degree of the acclimation response (Ragland and Kingsolver 2008). Physiological limits (particularly those that are heritable) should conform more closely to the position of the niche in the climatic hyperspace, being more reliable than niche boundaries to capture the variability and evolutionary pat-tern of physiological tolerance (Gouveia et al. 2014).
Conclusions
We present the fi rst measurements of critical thermal lim-its, ULT and chill-coma recovery times in vectors of Chagas disease. Data presented here for the geographical distribu-tion of R. prolixus with a low latitude distribution and T. infestans with a high one, support the climatic variability hypothesis (CVH) in both species that explains Rapoport’s rule in physiological terms. Th e larger geographical dis-tribution of T. infestans compared to R. prolixus could be explained in physiological terms by a greater tolerance to thermal variation, i.e. the CVH (Stevens 1989). Th e larger amplitude of temperature tolerance in T. infestans com-pared with that of R. prolixus could be explained by a sig-nifi cant higher CTmax and simultaneously a lower CTmin of T. infestans compared to those of R. prolixus . Diff erences between species in CTmin were more marked than diff er-ences in CTmax. Ecological niche modeling and limiting factor analysis determined that the minimum temperature of the coldest month is the key range-limiting factor of these two vector species of Chagas disease. Physiological diff erences in thermal relationships across species should be taken into account in future predictions of the geo-graphical distribution and spread of diseases ’ vectors under the eff ects of global climate change.
Acknowledgements – Th e authors thanks to Erin Rankin for critical reading of the manuscript and ANPCyT/Argentina (PICT2008-0035 and PICT2008-0268) for past fi nancial support. GJdlV, PM and SC have a PhD fellowship and PES and JR are researchers from CONICET/Argentina. We also thank the staff of the Laboratory of Insect Physiology (DBBE) for sharing the rearing of insects and editor, as well as, Matt Hill whose constructive criticisms really improved the paper. PES dedicates this paper to Prof. Josu é A. N ú ñ ez. PM and SC contributed equally to this paper.
Author contributions: conceived and designed the experiments: PES, GJdlV. Experimental assay: GJdlV, PES. Geographic analysis: GJdlV, PM, SC, JR. Contributed reagents/materials/analysis tools: JR, PES. Jointly wrote the paper: all authors participated in the critical revision of the manuscript and gave fi nal approval of the article.
References
Addo-Bediako, A. et al. 2000. Th ermal tolerance, climatic variability and latitude. – Proc. R. Soc. B 267: 739 – 745.
colder areas than their CTmin, the eff ect of microclimatic conditions on the geographic distribution of this species needs to be studied. Th ere is a seasonal variation on the domesticated populations of T. infestans, with a marked decrease of the population associated with low temperatures during winter (Gorla and Schofi eld 1989). Th is population drop implies that reduced encounter rates between vectors and hosts during this season and that transmission of T. cruzi would be at its lowest rate during the cold months. Even more important is that the lower lethal temperature (LLT) of T. infestans is ca 12 ° C below CTmin (estimated to be – 10 to – 12 ° C by Blaksley and Carcavallo 1968), which is lower than the minimum temperature of the coldest month of its geographical distribution. Th us, the LLT could be a limiting factor for the distribution of this species. In con-cordance with our chill-coma recovery results (Fig. 3 and Supplementary material Appendix 2), the stressful cold tem-perature of ca 0 ° C is ecologically relevant for R. prolixus , but would have no ecological consequences nor constraints for T. infestans ’s distribution.
Our results conform well with the macroecological prin-ciple that at higher latitudes (or altitudes) species experi-ence lower temperatures and greater seasonal variation, and consequently are expected to withstand greater tempera-ture extremes (Gaston and Chown 1999). A meta-analysis by Sunday et al. (2011) tested for relationships between thermal tolerance breadth in ectothermic animals and the latitude of the specimen ’ s location, while accounting for habitat, hemisphere, methodological diff erences and taxo-nomic affi nity; they found that thermal tolerance breadth generally increased with latitude. Our fi ndings of a broader thermal tolerance in T. infestans (higher latitudinal distri-bution) with respect to the narrower thermal tolerance of R. prolixus (lower latitudinal distribution) provide further support for this relationship between thermo-tolerance and latitude.
Many important predictions of the CVH based on other ectothermic species are consistent with our thermo-tolerance results. For example, similar responses were obtained with reptiles: species living in higher latitudes have lower CTmin values than species living in lower ones (Cruz et al. 2005). In insects, the upper lethal limits show much less variation than do the lower lethal limits (Addo-Bediako et al. 2000). Same occurs for plants, terrestrial endotherms and other ectotherms (Ara ú jo et al. 2013).
Maximum temperatures of the warmest month are more similar between the geographical distributions of R. prolixus and T. infestans, than minimum temperatures of the cold-est month (Supplementary material Appendix 2). Th erefore, the lower thermo-limit tolerance could be limiting the lati-tudinal distribution of this two species. In addition, species with low CTmin and LLT are able to occupy high, relatively cooler latitudes as well as warmer latitudes, while species with high CTmin could occupy only warmer places, such that the thermal component of climatic niches across spe-cies overlaps more than expected (Ara ú jo et al. 2013). Th is idea, together with MaxEnt results of the more important abiotic factors for R. prolixus and T. infestans distribution (Table 1) conforms well, at least for T. infestans , with fi nd-ings of Gorla and Schofi eld (1989) who determined that T. infestans populations densities are determined by winter low

9-EV
Gaston, K. and Chown, S. L. 1999. Elevation and climatic toler-ance: a test using dung beetles. – Oikos 86: 584 – 590.
Gaston, K. and Blackburn, T. 2000. Pattern and process in macro-ecology. – Blackwell.
Gaston, K. et al. 2009. Macrophysiology: a conceptual reunifi ca-tion. – Am. Nat. 174: 595 – 612.
Gorla, D. E. 2002. Variables ambientales registradas por sensores remotos como indicadores de la distribuci ó n geogr á fi ca de Triatoma infestans (Heteroptera: Reduviidae). – Ecol. Austral 12: 117 – 127.
Gorla, D. E. and Schofi eld, C. J. 1989. Population dynamics of Triatoma infestans under natural climatic conditions in the Argentine Chaco. – Med. Vet. Entomol. 3: 179 – 194.
Gorla, D. E. et al. 1997. Efecto de la temperatura sobre la dis-tribuci ó n de Triatoma infestans y el riesgo de transmisi ó n vecto-rial de la enfermedad de Chagas en Argentina. – Acta Toxicol. Argent. 5: 15 – 62.
Gouveia, S. F. et al. 2014. Climatic niche at physiological and macroecological scales: the thermal tolerance-geographical range interface and niche dimensionality. – Global Ecol. Bio-geogr. 23: 446 – 456.
Graham, C. H. and Hijmans, R. J. 2006. A comparison of meth-ods for mapping species ranges and species richness. – Global Ecol. Biogeogr. 15: 578 – 587.
Graham, C. H. et al. 2008. Th e infl uence of spatial errors in species occurrence data used in distribution models. – J. Appl. Ecol. 45: 239 – 247.
Guhl, F. 2009. Enfermedad de Chagas: realidad y perspectivas. – Rev. Biomed. 20: 228 – 234.
Hijmans, R. J. and Graham, C. H. 2006. Th e ability of climate envelope models to predict the eff ect of climate change on species distributions. – Global Change Biol. 12: 2272 – 2281.
Hijmans, R. J. and Elith, J. 2013. Species distribution modeling with R. – � http://cran.r-project.org/web/packages/dismo/vignettes/sdm � .
Hill, M. P. et al. 2012. Understanding niche shifts: using current and historical data to model the invasive redlegged earth mite, Halotydeus destructor . – Divers. Distrib. 18: 191 – 203.
Hurlbert, A. H. and Jetz, W. 2007. Species richness, hotspots, and the scale dependence of range maps in ecology and conserva-tion. – Proc. Natl Acad. Sci. USA 104: 13384 – 13389.
Jetz, W. et al. 2008. Ecological correlates and conservation implica-tions of overestimating species geographic ranges. – Conserv. Biol. 22: 110 – 119.
Klok, C. J et al. 2004. Upper thermal tolerance and oxygen limita-tion in terrestrial arthropods. – J. Exp. Biol. 207: 2361 – 2370.
Lazzari, C. R. 1991. Temperature preference in Triatoma infestans (Hemiptera: Reduviidae). – Bull. Entomol. Res. 81: 273 – 276.
Lazzari, C. R. and N ú ñ ez, J. A. 1989a. Th e response to radiant heat and the estimation of the temperature of distant sources in Triatoma infestans . – J. Insect Physiol. 35: 525 – 529.
Lazzari, C. R. and N ú ñ ez, J. A. 1989b. Blood temperature and feeding behavior in Triatoma infestans (Heteroptera: Reduvii-dae). – Entomol. Gen. 14: 183 – 188.
Lighton, J. R. B. and Turner, R. J. 2004. Th ermolimit respirome-try: an objective assessment of critical thermal maxima in two sympatric desert harvester ants, Pogonomyrmex rugosus and P. californicus . – J. Exp. Biol. 207: 1903 – 1913.
Lighton, J. R. B. et al. 2001. Low metabolic rate in scorpions: implications for population biomass and cannibalism. – J. Exp. Biol. 204: 607 – 613.
Lobo, J. M. et al. 2007. AUC: a misleading measure of the per-formance of predictive distribution models. – Global Ecol. Biogeogr. 17: 145 – 151.
Luz, C. et al. 1999. Development of Rhodnius prolixus (Hemiptera: Reduviidae) under constant and cyclic conditions of temperature and humidity. – Mem. Inst. Oswaldo Cruz 94: 403 – 409.
Addo-Bediako, A. et al. 2002. Metabolic cold adaptation in insects: a large-scale perspective. – Funct. Ecol. 16: 332 – 338.
Ara ú jo, M. B. et al. 2013. Heat freezes niche evolution. – Ecol. Lett. 16: 1206 – 1219.
Barbet-Massin, M. et al. 2012. Selecting pseudo-absences for spe-cies distribution models: how, where and how many? – Meth-ods Ecol. Evol. 3: 327 – 338.
Blaksley, J. C. and Carcavallo, R. 1968. La Enfermedad de Chagas-Mazza en la Argentina. – Ministerio de Salud, Buenos Aires, Argentina.
Bozinovic, F. et al. 2011. Physiological correlates of geographic distribution in animals. – Annu. Rev. Ecol. Evol. Syst. 42: 155 – 179.
Byrne, J. et al. 2004. Predicting climate compatibility of biological control agents in their region of introduction. – In: Cullen, J. M. et al. (eds), Proceedings of the XI International Symposium on Biological Control of Weeds. CSIRO, pp. 28 – 35.
Canals, M. et al. 1997. Preliminary studies on temperature selec-tion and activity cycles of Triatoma infestans and T. spinolai , Chilean vectors of Chagas disease. – J. Med. Entomol. 34: 11 – 17.
Carcavallo, R. U. et al. 1999. Geographical distribution and alti-latitudinal dispersion. – In: Carcavallo, R. U. et al. (eds), Atlas of Chagas ’ disease vectors in the Americas. Editorial Fiocruz, pp. 747 – 792.
Chown, S. L. and Nicolson, S. W. 2004. Insect physiological ecol-ogy: mechanisms and patterns. – Oxford Univ. Press.
Chown, S. L. et al. 2004. Macrophysiology: large-scale patterns in physiological traits and their ecological implications. – Funct. Ecol. 18: 159 – 167.
Clark, N. 1935. Th e eff ect of temperature and humidity upon the eggs of the bug, Rhodnius prolixus (Heteroptera, Reduviidae). – J. Anim. Ecol. 4: 82 – 87.
Clarke, A. 1991. What is cold adaptation and how should we meas-ure it? – Integr. Comp. Biol. 31: 81 – 92.
Compton, T. J. et al. 2007. Th ermal tolerance ranges and climate variability: a comparison between bivalves from diff ering cli-mates. – J. Exp. Mar. Biol. Ecol. 352: 200 – 211.
Cruz, F. B. et al. 2005. Th e importance of phylogenetic scale in tests of Bergmann ’ s and Rapoport’s rules: lessons from a clade of South American lizards. – J. Evol. Biol. 18: 1559 – 1574.
de Souza, R. de C. et al. 2010. Analysis of the geographical distri-bution of Triatoma vitticeps (St å l, 1859) based on data of spe-cies occurrence in Minas Gerais, Brazil. – Infect. Genet. Evol. 10: 720 – 726.
Diniz-Filho, J. A. F. et al. 2013. Geographical patterns of Triatom-inae (Heteroptera: Reduviidae) richness and distribution in the Western Hemisphere. – Insect Conserv. Divers. 6: 704 – 714.
Elith, J. et al. 2006. Novel methods improve prediction of species ’ distributions from occurrence data. – Ecography 29: 129 – 151.
Elith, J. et al. 2010. Th e art of modelling range-shifting species. – Methods Ecol. Evol. 1: 330 – 342.
Fergnani, P. N. et al. 2013. Large-scale patterns in morphological diversity and species assemblages in Neotropical Triatominae (Heteroptera: Reduviidae). – Mem. Inst. Oswaldo Cruz 108: 997 – 1008.
Ferreira, R. A. et al. 2007. Do haematophagous bugs assess skin surface temperature to detect blood vessels? – PLoS One 2: e932.
Fresquet, N. and Lazzari, C. R. 2011. Response to heat in Rhodnius prolixus : the role of the thermal background. – J. Insect Physiol. 57: 1446 – 1449.
Galv ã o, C. et al. 2003. A checklist of the current valid species of the subfamily Triatominae Jeannel, 1919 (Hemiptera, Redu-viidae) and their geographical distribution, with nomenclatural and taxonomic notes. – Zootaxa 202: 1 – 36.
Gaston, K. 2000. Global pattern in biodiversity. – Nature 405: 220 – 227.

10-EV
Rolandi, C. and Schilman, P. E. 2012. Linking global warming, metabolic rate of hematophagous vectors, and the transmission of infectious diseases. – Front. Physiol. 3: 75.
Schilman, P. E. and Lazzari, C. 2004. Temperature preference in Rhodnius prolixus , eff ects and possible consequences. – Acta Trop. 90: 115 – 122.
Schofi eld, C. J. 1994. Triatominae – biology and control. – Eurocommunica Publications, UK.
Schofi eld, C. J. and Galv ã o, C. 2009. Classifi cation, evolution, and species groups within the Triatominae. – Acta Trop. 110: 88 – 100.
Sexton, J. P. et al. 2009. Evolution and ecology of species range limits. – Annu. Rev. Ecol. Evol. Syst. 40: 415 – 436.
Snyder, G. K. and Weathers, W. W. 1975. Temperature adaptations in amphibians. – Am. Nat. 109: 93 – 101.
Spicer, J. I. and Gaston, K. J. 1999. Physiological diversity and its ecological implications. – Blackwell.
Stevens, G. C. 1989. Th e latitudinal gradient in geographical range: how so many species coexist in the tropics. – Am. Nat. 133: 240 – 256.
Sunday, J. M. et al. 2011. Global analysis of thermal tolerance and latitude in ectotherms. – Proc. R. Soc. B 278: 1823 – 1830.
Terblanche, J. S. et al. 2006. Phenotypic plasticity and geographic variation in thermal tolerance and water loss of the tsetse Glossina pallidipes (Diptera: Glossinidae): implications for dis-tribution modelling. – Am. J. Trop. Med. Hyg. 74: 786 – 794.
Terblanche, J. S. et al. 2009. Directional evolution of the slope of the metabolic rate – temperature relationship is correlated with climate. – Physiol. Biochem. Zool. 82: 495 – 503.
Terribile, L. C. et al. 2010. How many studies are necessary to compare niche-based models for geographic distributions? Inductive reasoning may fail at the end. – Braz. J. Biol. 70: 263 – 269.
VanDerWal, J. et al. 2009. Selecting pseudo-absence data for pres-ence-only distribution modeling. How far should you stray from what you know? – Ecol. Model. 220: 589 – 594.
Vinauger, C. et al. 2013. Learning and memory in Rhodnius prolixus : habituation and aversive operant conditioning of the proboscis extension response (PER). – J. Exp. Biol. 216: 892 – 900.
WHO 2000. Control of Chagas disease: second report of the WHO expert committee. – WHO Expert Committee on the Control of Chagas Disease, Brasilia, Brazil.
Zuur, A. F. et al. 2009. Mixed eff ects models and extensions in ecology with R. – Springer.
Lyons, C. L. et al. 2012. Th ermal limits of wild and laboratory strains of two African malaria vector species, Anopheles arabi-ensis and Anopheles funestus . – Malaria J. 11: 226.
Mackenzie, D. I. and Royle, J. A. 2005. Designing occupancy stud-ies: general advice and allocating survey eff ort. – J. Appl. Ecol. 42: 1105 – 1114.
Mitchell, J. D. et al. 1993. Critical thermal limits and temperature tolerance in the harvester termite Hodotermes mossambicus (Hagen). – J. Insect Physiol. 39: 523 – 528.
Moncayo, A. 1992. Chagas disease: epidemiology and prospects for interruption of transmission in the Americas. – World Health Stat. Q. 45: 276 – 279.
Mueller, U. G. et al. 2011. Evolution of cold-tolerant fungal sym-bionts permits winter fungi culture by leafcutter ants at the northern frontier of a tropical ant – fungus symbiosis. – Proc. Natl Acad. Sci. USA 108: 4053 – 4056.
Okasha, A. Y. K. 1964. Eff ects of high temperature in Rhodnius prolixus (St å l). – Nature 204: 1221 – 1222.
Okasha, A. Y. K. 1968a. Eff ects of sub-lethal high temperature on an insect, Rhodnius prolixus (St å l). III. Metabolic changes and their bearing on the cessation and delay of moulting. – J. Exp. Biol. 48: 475 – 486.
Okasha, A. Y. K. 1968b. Changes in the respiratory metabolism of Rhodnius prolixus as induced by temperature. – J. Insect Phys-iol. 14: 1621 – 1634.
Osovitz, C. J. and Hofmann, G. E. 2005. Th ermal history-dependent expression of the hsp70 gene in purple sea urchins: biogeographic patterns and the eff ect of temperature acclima-tion. – J. Exp. Mar. Biol. Ecol. 27: 134 – 143.
Phillips, S. J. et al. 2006. Maximum entropy modeling of species geographic distributions. – Ecol. Model. 190: 231 – 259.
Ragland, G. J. and Kingsolver, J. G. 2008. Evolution of thermo-tolerance in seasonal environments: the eff ects of annual temperature variation and life-history timing in Wyeomyia smithii . – Evolution 62: 1345 – 1357.
Randolph, S. E. 2009. Perspectives on climate change impacts on infectious diseases. – Ecology 90: 927 – 931.
Richmond, O. M. et al. 2010. Is the climate right for pleistocene rewilding? Using species distribution models to extrapolate cli-matic suitability for mammals across continents. – PLoS One 5: e12899.
Rodriguero, M. and Gorla, D. E. 2004. Latitudinal gradient of species richness in the New World Triatominae (Reduviidae). – Global Ecol. Biogeogr. 13: 75 – 84.
Supplementary material (Appendix ECOG-01028 at � www.ecography.org/readers/appendix � ). Appendix 1 – 5.