Geochronology and isotope geochemistry of Eocene dykes intruding the Ladakh Batholith
11
Geochronology and isotope geochemistry of Eocene dykes intruding the Ladakh Batholith A.R. Heri a, ⁎, J.C. Aitchison a,b , J.A. King a , I.M. Villa c,d a Dept. of Earth Sciences, The University of Hong Kong, Pokfulam Road, Hong Kong, China b School of Geosciences, University of Sydney, Sydney, NSW 2006, Australia c Institut für Geologie, Universität Bern, Baltzerstr. 1+3, 3012 Bern, Switzerland d Centro Universitario Datazioni e Archeometria, Università di Milano—Bicocca, 20126 Milano, Italy abstract article info Article history: Received 1 March 2014 Accepted 4 November 2014 Available online 13 November 2014 Keywords: Dykes Ladakh batholith 40 Ar– 39 Ar dating Sr–Nd isotope geochemistry In order to determine the extent and timing of dyke formation related to possible E–W extension along the south- ern margin of Eurasia during Early Cenozoic time, we examined ca. 30 mostly andesitic dykes intruding the Ladakh batholith from 10 to 50 km west of Leh (NW India). The dykes in the east of the area trend E–NE and those in the west trend N–NW. The difference in orientation is also evident in the petrography and isotopic signatures. The eastern dykes contain corroded quartz xenocrysts and show negative ε 0 (Nd) and positive ε 0 (Sr) values, whereas the western dykes do not contain quartz xenocrysts and exhibit positive ε 0 (Nd) and near-zero ε 0 (Sr) values. The variability in Sr–Nd isotopes (ε 0 (Nd) = 3.6 to −9.6, ε 0 (Sr) = 0.4 to 143) and the quartz xenocrysts can best be explained by (differing degrees of) crustal assimilation of the parent magma of the dykes. Separated minerals from five dykes were dated by 40 Ar– 39 Ar incremental heating: amphibole ages range between 50 and 54 Ma, and one biotite separate dated both by Rb–Sr and 40 Ar– 39 Ar gave an age of 45 Ma. One dated pseudotachylyte sample attests to brittle faulting at ca. 54 Ma. The combination of structural field evidence with petrographic, isotopic and geochronological analyses demonstrates that the dykes did not form from a single, progressively differentiating magma chamber, despite having formed in the same tectonic setting around the same time, and that processes such as crustal assimilation and magma mixing/mingling, also played a significant role in magma petrogenesis. © 2014 Elsevier B.V. All rights reserved. 1. Introduction The timing of the collision between the Indian and the Asian continents resulting in the largest mountain chain in the world and the mechanisms responsible for the uplift of the Tibetan plateau are controversial (Aitchison et al., 2007; Searle et al., 1987; Yin, 2006). In particular the high altitude and the forces sustaining the elevation of the plateau over a long period of time, as well as causes and timing of the present E–W extension, are subject of intense research and debate (e.g. Aitchison et al., 2009; Burchfiel et al, 1992; White et al., 2011; Williams et al., 2001, 2004). Evidence for E–W extension of the Tibetan plateau has been observed in the field (Armijo et al., 1986) as well as inferred from fault plane solutions (Molnar and Tapponier, 1978). A further indication of this regional extension is believed to be the volu- metrically small, but geographically widespread post-collisional magmatism found across the Lhasa and the Qiangtang terrane (e.g. Turner et al., 1996; Williams et al., 2004), and in the Tethyan sedimen- tary series of southern Tibet (King et al., 2007). Of special interest is the occurrence of dykes, as they can provide both the strain direction and the timing of the magma generation. Ravikant and Guha (2002) reported a Miocene ultrapotassic dyke close to Leh and determined an age of 24.3 ± 2.2 Ma by a Rb–Sr two-point whole-rock–phlogopite isochron. The dyke intrudes a microgranitic dyke of an older, andesitic and doleritic swarm and does not exhibit a cross-cutting relationship with the dykes nor an igneous contact with the Ladakh batholith (Ravikant and Guha, 2002). It must therefore have the same attitude as the older dyke swarm, which is approximately ENE–WSW. Due to its age and ultrapotassic nature, the dyke was proposed to be linked to the Miocene dykes in S-Tibet (Ravikant, 2006). Although Ravikant and Guha (2002) give no further information about other ultrapotassic dykes, it can be assumed that more post-collisional dykes exist in close proximity, since the occur- rence of post-collisional magmatism is unlikely to be restricted to one intrusion only. Weinberg and Dunlap (2000) described the older, andesitic to rhyo- litic dykes and named them `Phyang dykes', after Phyang, the village in the next side valley E of the dykes. These authors estimated that there were tens of dykes restricted to a few square kilometres, located be- tween Phyang and Taru (village W of dyke swarm). Weinberg and Lithos 212–215 (2015) 111–121 ⁎ Corresponding author. Tel.: +86 18325178735. E-mail address: [email protected] (A.R. Heri). http://dx.doi.org/10.1016/j.lithos.2014.11.001 0024-4937/© 2014 Elsevier B.V. All rights reserved. Contents lists available at ScienceDirect Lithos journal homepage: www.elsevier.com/locate/lithos
Transcript of Geochronology and isotope geochemistry of Eocene dykes intruding the Ladakh Batholith

Lithos 212–215 (2015) 111–121
Contents lists available at ScienceDirect
Lithos
j ourna l homepage: www.e lsev ie r .com/ locate / l i thos
Geochronology and isotope geochemistry of Eocene dykes intruding theLadakh Batholith
A.R. Heri a,⁎, J.C. Aitchison a,b, J.A. King a, I.M. Villa c,d
a Dept. of Earth Sciences, The University of Hong Kong, Pokfulam Road, Hong Kong, Chinab School of Geosciences, University of Sydney, Sydney, NSW 2006, Australiac Institut für Geologie, Universität Bern, Baltzerstr. 1+3, 3012 Bern, Switzerlandd Centro Universitario Datazioni e Archeometria, Università di Milano—Bicocca, 20126 Milano, Italy
⁎ Corresponding author. Tel.: +86 18325178735.E-mail address: [email protected] (A.R. Heri)
http://dx.doi.org/10.1016/j.lithos.2014.11.0010024-4937/© 2014 Elsevier B.V. All rights reserved.
a b s t r a c t
a r t i c l e i n f oArticle history:Received 1 March 2014Accepted 4 November 2014Available online 13 November 2014
Keywords:DykesLadakh batholith40Ar–39Ar datingSr–Nd isotope geochemistry
In order to determine the extent and timing of dyke formation related to possible E–Wextension along the south-ern margin of Eurasia during Early Cenozoic time, we examined ca. 30 mostly andesitic dykes intruding theLadakh batholith from 10 to 50 km west of Leh (NW India). The dykes in the east of the area trend E–NE andthose in the west trend N–NW. The difference in orientation is also evident in the petrography and isotopicsignatures. The eastern dykes contain corroded quartz xenocrysts and show negative ε0(Nd) and positiveε0(Sr) values, whereas the western dykes do not contain quartz xenocrysts and exhibit positive ε0(Nd) andnear-zero ε0(Sr) values. The variability in Sr–Nd isotopes (ε0(Nd) = 3.6 to −9.6, ε0(Sr) = 0.4 to 143) and thequartz xenocrysts can best be explained by (differing degrees of) crustal assimilation of the parent magma ofthe dykes. Separated minerals from five dykes were dated by 40Ar–39Ar incremental heating: amphibole agesrange between 50 and 54 Ma, and one biotite separate dated both by Rb–Sr and 40Ar–39Ar gave an age of45 Ma. One dated pseudotachylyte sample attests to brittle faulting at ca. 54 Ma. The combination of structuralfield evidence with petrographic, isotopic and geochronological analyses demonstrates that the dykes did notform from a single, progressively differentiating magma chamber, despite having formed in the same tectonicsetting around the same time, and that processes such as crustal assimilation and magma mixing/mingling,also played a significant role in magma petrogenesis.
© 2014 Elsevier B.V. All rights reserved.
1. Introduction
The timing of the collision between the Indian and the Asiancontinents resulting in the largest mountain chain in the world andthe mechanisms responsible for the uplift of the Tibetan plateau arecontroversial (Aitchison et al., 2007; Searle et al., 1987; Yin, 2006). Inparticular the high altitude and the forces sustaining the elevation ofthe plateau over a long period of time, as well as causes and timing ofthe present E–W extension, are subject of intense research and debate(e.g. Aitchison et al., 2009; Burchfiel et al, 1992; White et al., 2011;Williams et al., 2001, 2004). Evidence for E–W extension of the Tibetanplateau has been observed in the field (Armijo et al., 1986) as well asinferred from fault plane solutions (Molnar and Tapponier, 1978). Afurther indication of this regional extension is believed to be the volu-metrically small, but geographically widespread post-collisionalmagmatism found across the Lhasa and the Qiangtang terrane (e.g.Turner et al., 1996; Williams et al., 2004), and in the Tethyan sedimen-tary series of southern Tibet (King et al., 2007).
.
Of special interest is the occurrence of dykes, as they can provideboth the strain direction and the timing of the magma generation.Ravikant and Guha (2002) reported a Miocene ultrapotassicdyke close to Leh and determined an age of 24.3 ± 2.2 Ma by a Rb–Srtwo-point whole-rock–phlogopite isochron. The dyke intrudes amicrogranitic dyke of an older, andesitic and doleritic swarm and doesnot exhibit a cross-cutting relationship with the dykes nor an igneouscontact with the Ladakh batholith (Ravikant and Guha, 2002). It musttherefore have the same attitude as the older dyke swarm, which isapproximately ENE–WSW. Due to its age and ultrapotassic nature, thedyke was proposed to be linked to the Miocene dykes in S-Tibet(Ravikant, 2006). Although Ravikant and Guha (2002) give no furtherinformation about other ultrapotassic dykes, it can be assumed thatmore post-collisional dykes exist in close proximity, since the occur-rence of post-collisional magmatism is unlikely to be restricted to oneintrusion only.
Weinberg and Dunlap (2000) described the older, andesitic to rhyo-litic dykes and named them `Phyang dykes', after Phyang, the village inthe next side valley E of the dykes. These authors estimated that therewere tens of dykes restricted to a few square kilometres, located be-tween Phyang and Taru (village W of dyke swarm). Weinberg and

112 A.R. Heri et al. / Lithos 212–215 (2015) 111–121
Dunlap (2000) estimated that there were tens of dykes in the Phyang/Taru swarm and noted that they were restricted to a few squarekilometres. They further reported that the dykes strike N 50°–70° Eand dip between 70° SE and vertical. The dykes exhibit various compo-sitions indicated by different phenocrysts such as embayed quartz phe-nocrysts, plagioclase, hornblende and biotite. A 40Ar–39Ar incrementalheating age on one of the dykes yielded a crystallisation age from the‘plateau-like portion’ of the age spectrum as 45.7 ± 0.8 Ma (2σ)(Weinberg and Dunlap, 2000).
These Eocene dykes are ca. 20 Ma older than the ultrapotassic dykediscovered at the same locality (Ravikant, 2006; Ravikant and Guha,2002). Ravikant (2006) linked the ultrapotassic dyke to post-collisional intrusions in Tibet and thus suggested the same source andgeochemical processes described by others (Williams et al., 2001,2004). In contrast,Weinberg andDunlap (2000) interpreted the Phyangdykes as the result of minor, late-magmatic activity associated withsubduction and arc formation. Thus, these dykes may not be the resultof the same processes responsible for the post-collisional, potassic andultrapotassic magmatism in Tibet. In this study we examined dykeswithin the Ladakh batholith ranging approximately 10 to 50 km westof Leh (NW India), including those described above.
2. Geologic setting and fieldwork
2.1. The Ladakh batholith
The dykes intrude the Ladakh batholith, which is part of the calc-alkaline Trans-Himalayan batholith extending over 2500 km along thesouthern margin of the Eurasian continent. The western part of theTrans-Himalayan batholith, i.e. the Kohistan arc and the Ladakh batho-lith are believed to have been similar to the modern Aleutian arc withthe western part being intra-oceanic (Kohistan arc) and the easternpart continental (Ladakh batholith and Gangdese plutonic belt)(Rolland et al., 2000, 2002). However, it is unclear where the transitionfrom an intra-oceanic arc to a continental arc was located (Clift et al.,2002; Rolland et al., 2000, 2002). The Ladakh batholith is bounded bythe Indus suture in the south, the Shyok suture zone in the north andthe Karakoram fault in the east. However, the exact location of theShyok suture in eastern Ladakh is uncertain due to restricted access tothe area (Rolland and Pêcher, 2001; Rolland et al., 2000; Weinbergand Dunlap, 2001). The Indus suture marks the boundary between theIndian and the Eurasian continents with arc plutonic rocks located onthe north side and deformed Zanskar shelf sediments south of the su-ture. In contrast, the Shyok suture zone is proposed to either haveformed from an earlier collision of the Ladakh–Kohistan block withthe Karakoram terrane (e.g. Weinberg and Dunlap, 2000) or to resultfrom closure of a back-arc basin (Clift et al., 2002; Rolland et al., 2000,2002). The Karakoram fault is a crustal-scale dextral strike-slip faultthat separates and offsets the Ladakh batholith from its eastern contin-uation, the Gangdese batholith.
The general composition of the Ladakh batholith is described ascomplex sequences of gabbroic to granitic plutons (Schärer et al.,1984). According to Singh (1993), the batholith is predominantlycomposed of biotite- and hornblende-bearing granodiorite and less dio-rite–tonalite, quartz monzodiorite–granodiorite, biotite–hornblendegranite, leucogranite, and pink porphyritic granite, which correspondsto a typical sequence of calc-alkaline rocks. The mafic members areestimated to comprise approximately 10–20 vol.%, intermediate rocksapproximately 20–30 vol.% and granodiorites about 50 vol.% of the bath-olith (Schärer et al., 1984). Kumar, 2010 suggested a model ofmultistage mixing and mingling of coeval mafic and felsic magmas forthe formation of the Ladakh batholith, based on detailed investigationsof microgranular enclaves.
The southern margin of the Ladakh batholith is unconformablyoverlain by the Indus molasse (Fig. 1), which was deposited in anintramontane, narrow basin between the batholith and the Himalayas
(Garzanti and van Haver, 1988) and mainly comprises conglomerates,shales and sandstones recording a fluvio-alluvial sedimentary environ-ment. The material that accumulated in this intramontane basin mainlyoriginated from the batholith in the north, but also from the suture zoneand to a lesser degree from the Zanskar shelf carbonates in the south(St-Onge et al., 2010 and references therein).
Honegger et al. (1982), reported a zircon U–Pb age of 103±3Ma forthe Kargil granodiorite of the Ladakh plutonic complex and this datewas later confirmed by Schärer et al. (1984) who reported a zirconU–Pb age of 101 ± 2 Ma for the same granodiorite and 60.7 ± 0.4 Mafor a granite close to Leh. Over the last decade, more zircon U–Pb ages(especially SHRIMP ages) have been published and these rangebetween 45 and 68Ma (St-Onge et al., 2010;White et al., 2011 and ref-erences therein). White et al. (2011) concluded from the zircon U–Pbage distribution histograms that the magmatism responsible forforming the Ladakh batholith was not continuous but episodic withthree distinct pulses of magmatic activity from 45–49 Ma, 56–60 Maand 64–66 Ma. However, Ravikant et al. (2009) found only two mainmagmatic stages of granitic magmatism based on U–Pb zircon laserablation analyses: from 83–103 Ma (Early Cretaceous) and 50–67 Ma(Early Cenozoic) with a magmatic gap between 67 and 83 Ma. Reportsof inherited zircon grains found in the Ladakh batholith (Schärer et al.,1984; Weinberg and Dunlap, 2000; White et al., 2011) suggest thatthe Ladakh plutons assimilated pre-existing crustal components,although the estimated amount of crustal contribution varies fromnear-ly absent (Singh et al., 2007), through restricted (Weinberg and Dunlap,2000) to significant (Schärer et al., 1984). The Ladakh arc plutons gener-ally have initial 87Sr/86Sr and 143Nd/144Nd ratios near chondritic values(Allègre and Ben Othman, 1980; St-Onge et al., 2010; Weinberg andDunlap, 2000 and references therein).
2.2. Field relations and sampling
Fieldwork in Ladakh was focused on finding the dykes close to Tarudescribed by Ravikant and Guha (2002) and Weinberg and Dunlap(2000) as well as exploring whether additional dykes exist NW of thislocation. A path along the southern margin of the batholith on thenorthern side of the Indus valley (routewalked shown in Fig. 2) yieldedapproximately 30 dykes over a distance of ca. 40 km. It could not beunambiguously determined if some dykes were individual or continua-tions of other dykes. 21 samples were collected from 33 documentedsites listed in Supplementary Table A1. Two dykes from the Taru dykeswarm were sampled multiple times along strike. Most of the dykesoccur in pairs or belong to a swarm. Only dykes M and N were single,i.e. no other dyke was found in the surrounding 10 km2. The dykesintrude the batholith at high angles, often close to vertical.
The crust of the dykes is weathered to a dark brown to black colourcontrasting with the bright brownish to orange coloured Ladakh batho-lith, which facilitates recognition of dykes from a distance. Many of thedykes (e.g. dykes 7, T, N, U and V) can be distinguished on Google Earthsatellite images (coordinates are given in Supplementary Table A1). Thephotograph in Supplementary Fig. A1a shows dykes U and V, which areboth about 5 m wide, intruding the Ladakh batholith just north of thevillage Hemis Shugpachan. The contacts of all dykes with the host rockare sharp and do not display macroscopic reaction rims or chilled mar-gins. Approximately 2 km east of Yangthang (Fig. 2) a pseudotachylytevein was observed. The fault vein of the pseudotachylyte is about1.5 m thick and cuts the batholith vertically in N–S direction (seeSupplementary Fig. A1b). In contrast to the sharp igneous contacts ofthe dykes, thin injection veins of glass spreading away from thepseudotachylyte penetrate the surrounding host rock as shown in Sup-plementary Fig. A1c. Furthermore, clasts of host rock embedded in ablack coloured matrix can be recognised. Since pseudotachylytes havebeen proven valuable 40Ar–39Ar geochronometers (e.g. Müller et al.,2002), a sample (LiO1) was taken for 40Ar–39Ar dating.

Fig. 1. Geologic–tectonic map redrawn from Schärer et al. (1984). The box indicates the field study area, which is expanded in Fig. 2.
113A.R. Heri et al. / Lithos 212–215 (2015) 111–121
Fig. 2 shows the sampling locations including dyke orientations.The dykes found at any one locality generally have approximately thesame orientation and therefore no cross-cutting relationships wereobserved. The map reveals a dichotomy in orientation directions; westof Tunglung, the dykes are aligned N–S to NW–SE and east of Tunglungthey generally strike E–WtoNE–SW. Exceptions are the pseudotachylyte,which is located west of Tunglung and is orientated approximately NE–SWanddykesA and F in the east,which both strike 110°. Nodykes similarto that described by Ravikant and Guha (2002) were found and noneof the dykes match the description of a melanocratic rock withmegaphenocrysts of phlogopite in an aphanitic groundmass.
In addition to the dykes, the Ladakh batholith was sampled in twolocations near Leh. The two batholith samples were taken from along
Fig. 2. Map of the field area showing dyke sampling locations and orientations. Dykes in theunconformity between the Ladakh batholith and the Indus molasse is inferred from the topogr
the road leading to the Shanti Stupa located at the northern peripheryof Leh (coordinates of sampling sites are given in SupplementaryTable A1).
3. Petrography
Dykes sampled are aphanitic to fine-grained, porphyritic andesiteswith phenocrysts mostly of plagioclase with minor quartz, hornblendeand biotite. Phenocrysts are between 1 and 5 mm in diameter (exceptdyke 7 phenocrysts which exceed 1 cm) and vary in abundance fromb5 vol.% up to 70 vol.%.Matrix colours range fromdark greyish to green-ish, where greenish colours are ascribed to chloritisation andsaussuritisation; only dyke N exhibits a light brown matrix.
eastern part of the field area trend E–W to NE–SW and N–S to NW–SE in the west. Theaphic map.

114 A.R. Heri et al. / Lithos 212–215 (2015) 111–121
Plagioclase phenocrysts often exhibit oscillatorymagmatic zoning, ifthey are not completely sericitised or replaced by calcite. Dykes M, Uand V contain fresh, magmatically zoned hornblende phenocrysts,although these appear to be mechanically fragmented in dykes U andV. The name “hornblende” is used to refer to the hornblende group ofminerals based on optical properties, and not to the amphibole nomen-clature by Leake et al. (1997). Where present, quartz phenocrysts arerounded and embayed, often with coronas of chlorite, and/or sericiteand/or other, cryptocrystalline minerals (Fig. 3a). Biotite phenocrysts(dykes 5a, H and J) exhibit brown to reddish pleochroism characteristicof Ti-rich biotite. Irregular late stage overgrowths with light greenish toyellowish pleochroism is in contrast with the dark colours of the olderbiotite. Rare 1–2 mm apatite laths occur in dykes X, H and J.
Most dykes exhibit a pilotaxitic matrix with an average grain sizebetween 100 and 300 μm. Only dykes 3, 4, 4a, Q and R exhibit trachyticmatrixes. Due to alteration and minute grain size, optical identificationof alkali feldspar proved difficult. Best indicators for alkali feldspar inthe matrix are microphyric and granophyric textures, where quartzand alkali feldspar have co-precipitated. Approximately half of thedykes contain 5–10 vol.% quartz in the matrix. Only dykes 5 and N aremore acidic and contain up to 20 vol.% of quartz. In addition to feldsparand quartz, the matrix contains biotite and/or hornblende, apatite andrarely titanite. All dykes contain ≤5 vol.% magnetite. In general, theobserved mineral parageneses are high-temperature with fresh horn-blende phenocrysts indicating the amphibole is an early crystallisationproduct of the magma. This is typical for a hydrous magma whereoften amphibole is produced instead of pyroxene.
Secondary mineral phases are mainly chlorite, less calcite, sericite,epidote, rarely clinozoisite, allanite and hematite. Alteration of matrixand phenocrsyts often differs in intensity. For example, the matrix ofdyke X contains only minor secondary calcite, whereas amphibolephenocrysts are completely replaced by chlorite (Fig. 3b). Pseudomor-phism after hornblende is particularly clear in hand specimens withcharacteristic, 2–3mm longmineral laths of altered hornblende. Plagio-clase phenocrysts aremainly sericitised and/or (completely or partially)replaced by calcite. Saussuritisation of plagioclase is also observed.Many dykes contain relict amphibole or biotite that is largely replacedby chlorite, calcite and subordinate epidote and clinozoisite.
A broad spatial pattern in mineral distribution can be observed withquartz phenocrysts restricted to dykes east of Tunglung (see Fig. 2).Secondary minerals also show this spatial divide with epidote andclinozoisite more common in dykes west of Tunglung, whereas tothe east modal calcite is more abundant. Moreover, plagioclase issaussuritised west of Tunglung, but mainly sericitised in the east.
As the pseudotachylyte (Fig. 4) is inhomogeneousmodal abundancesof melt and clasts were not estimated. All clasts observed were quartzexhibiting ubiquitous deformation with grains being broken and ground
Fig. 3. (a) Thin section photomicrograph of dyke 3 under plane polarised light showing a quartzand quartz. The cryptocrystalline corona appears to be seriticised. The trachytic texture of dykesection photomicrograph of dyke X under crossed polars. The pilotaxitic matrix is composedmcompletely replaced by a chlorite pseudomorph after hornblende.
into smaller clasts (Fig. 4a). The sample is seriate with large, almostunaffected quartz grains to minute clasts embedded in a glassy matrix.Glass is completely devitrified and partly microcrystalline with smalllaths of sericite/muscovite recognisable in the matrix. Where it iscryptocrystalline a greenish fibrous network (felted appearance) isall that is visible under plane-polarised light. The green pleochroismof the meshwork is probably the result of chloritisation. Undercrossed polars (Fig. 4b), interference colours indicate the presence ofsericite/muscovite.
The leucogranite sample from the Ladakh batholith is medium-grained with a seriate grain size distribution. Biotite and hornblendeaccount for b10 vol.% of the rock. Alkali feldspars (40 vol.%) are perthiticmicrocline and orthoclase. Plagioclase is of albitic compositionwith lowextinction angles and accounts for approximately 20 vol.% of the rock.The remaining third of the granite is made up of interstitial quartz.The second, less acidic batholith sample is a medium-grained tonalitewith almost no alkali feldspar (1 vol.%) and up to 40 vol.%mafic mineralcontent. Mafic minerals are slightly altered green hornblende and bio-tite. Alteration phases associated with the mafics are epidote and lessabundant clinozoisite. Quartz content lies between 10 and 15 vol.%.Both Ladakh batholith samples are deformed. The leucogranite exhibitsminor deformation with interlobate (sub)grain boundaries in polycrys-talline quartz and undulous extinction of both biotite and quartz grains.The tonalite exhibits stronger, brittle deformation with shatteredhornblende and plagioclase grains, unfilled cracks and deformed biotitegrains. Quartz exhibits undulous extinction and formation of subgrains.
Notably, none of the dyke samples resemble the dyke reported byRavikant and Guha (2002), who described their sample as having ‘apanidiomorphic texture with large euhedral phenocrysts of zonedphlogopite along with slender prisms of clinopyroxene and sphene,and microphenocrysts of apatite laths and magnetite crystals set in acrystalline groundmass of sanidine’.
4. Geochemistry and geochronology
Whole rock geochemistry of all dyke samples and the chemistry ofminerals selected for 40Ar–39Ar dating were determined. Selection for40Ar–39Ar dating was based on petrographic examination of thinsections. Five dyke samples and the pseudotachylyte specimen wereanalysed. The remaining samples were found to be unsuitable as theyeither do not contain K-mineral phases or are too strongly altered.Most samples yielded discordant age spectra. However, these spectracan be interpreted using additional information from the irradiation-produced isotopes 37Ar (from Ca) and 38Ar (from Cl) (Allaz et al.,2011; Heri et al., 2014;Müller et al., 2002; Villa et al., 2000). For compar-ison and external control, the geochemistry of the amphiboles subjectedto 40Ar–39Ar dating was determined by microprobe analyses.
phenocryst exhibiting an intermediate zone of microphyric intergrowths of alkali feldspar3 with hornblende laths aligned around the quartz phenocrysts is recognisable. (b) Thin
ainly of plagioclase and shows signs of only minor alteration, whereas the phenocrysts are
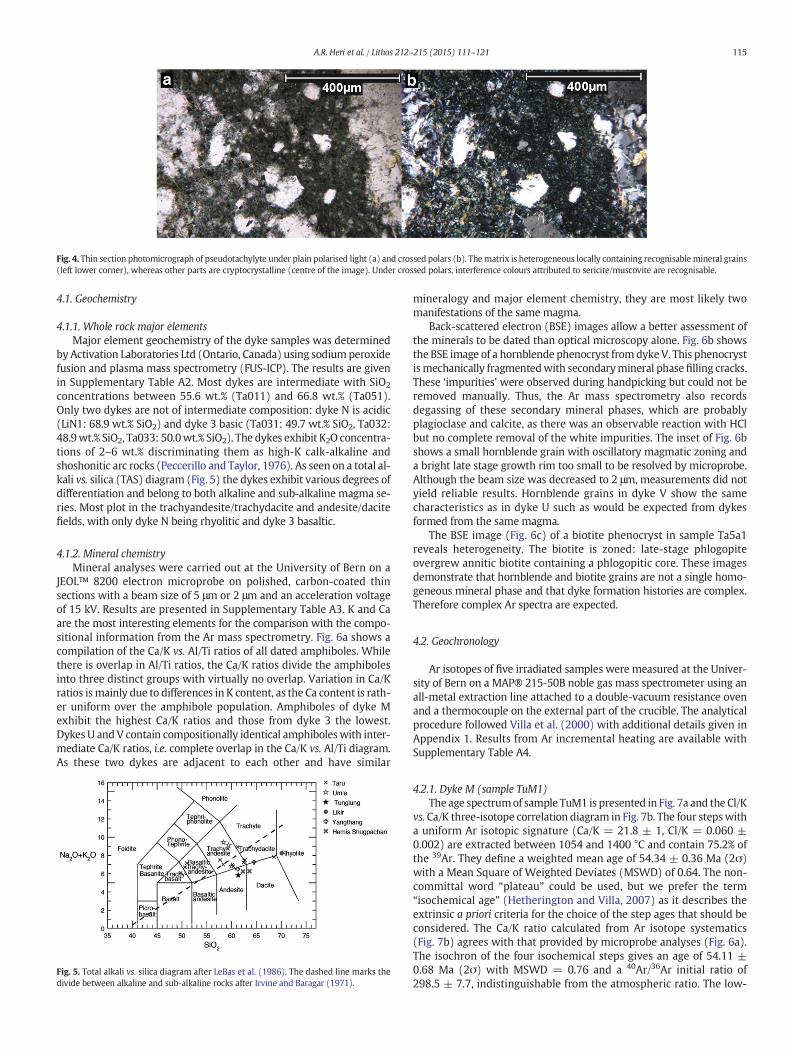
Fig. 4. Thin section photomicrograph of pseudotachylyte under plain polarised light (a) and crossed polars (b). Thematrix is heterogeneous locally containing recognisable mineral grains(left lower corner), whereas other parts are cryptocrystalline (centre of the image). Under crossed polars, interference colours attributed to sericite/muscovite are recognisable.
115A.R. Heri et al. / Lithos 212–215 (2015) 111–121
4.1. Geochemistry
4.1.1. Whole rock major elementsMajor element geochemistry of the dyke samples was determined
by Activation Laboratories Ltd (Ontario, Canada) using sodium peroxidefusion and plasma mass spectrometry (FUS-ICP). The results are givenin Supplementary Table A2. Most dykes are intermediate with SiO2
concentrations between 55.6 wt.% (Ta011) and 66.8 wt.% (Ta051).Only two dykes are not of intermediate composition: dyke N is acidic(LiN1: 68.9 wt.% SiO2) and dyke 3 basic (Ta031: 49.7 wt.% SiO2, Ta032:48.9wt.% SiO2, Ta033: 50.0wt.% SiO2). The dykes exhibit K2O concentra-tions of 2–6 wt.% discriminating them as high-K calk-alkaline andshoshonitic arc rocks (Peccerillo and Taylor, 1976). As seen on a total al-kali vs. silica (TAS) diagram (Fig. 5) the dykes exhibit various degrees ofdifferentiation and belong to both alkaline and sub-alkaline magma se-ries. Most plot in the trachyandesite/trachydacite and andesite/dacitefields, with only dyke N being rhyolitic and dyke 3 basaltic.
4.1.2. Mineral chemistryMineral analyses were carried out at the University of Bern on a
JEOL™ 8200 electron microprobe on polished, carbon-coated thinsections with a beam size of 5 μm or 2 μm and an acceleration voltageof 15 kV. Results are presented in Supplementary Table A3. K and Caare the most interesting elements for the comparison with the compo-sitional information from the Ar mass spectrometry. Fig. 6a shows acompilation of the Ca/K vs. Al/Ti ratios of all dated amphiboles. Whilethere is overlap in Al/Ti ratios, the Ca/K ratios divide the amphibolesinto three distinct groups with virtually no overlap. Variation in Ca/Kratios ismainly due to differences in K content, as the Ca content is rath-er uniform over the amphibole population. Amphiboles of dyke Mexhibit the highest Ca/K ratios and those from dyke 3 the lowest.Dykes U andV contain compositionally identical amphiboles with inter-mediate Ca/K ratios, i.e. complete overlap in the Ca/K vs. Al/Ti diagram.As these two dykes are adjacent to each other and have similar
Fig. 5. Total alkali vs. silica diagram after LeBas et al. (1986). The dashed line marks thedivide between alkaline and sub-alkaline rocks after Irvine and Baragar (1971).
mineralogy and major element chemistry, they are most likely twomanifestations of the same magma.
Back-scattered electron (BSE) images allow a better assessment ofthe minerals to be dated than optical microscopy alone. Fig. 6b showsthe BSE image of a hornblende phenocryst from dykeV. This phenocrystismechanically fragmentedwith secondarymineral phasefilling cracks.These ‘impurities’ were observed during handpicking but could not beremoved manually. Thus, the Ar mass spectrometry also recordsdegassing of these secondary mineral phases, which are probablyplagioclase and calcite, as there was an observable reaction with HClbut no complete removal of the white impurities. The inset of Fig. 6bshows a small hornblende grain with oscillatory magmatic zoning anda bright late stage growth rim too small to be resolved by microprobe.Although the beam size was decreased to 2 μm, measurements did notyield reliable results. Hornblende grains in dyke V show the samecharacteristics as in dyke U such as would be expected from dykesformed from the same magma.
The BSE image (Fig. 6c) of a biotite phenocryst in sample Ta5a1reveals heterogeneity. The biotite is zoned: late-stage phlogopiteovergrew annitic biotite containing a phlogopitic core. These imagesdemonstrate that hornblende and biotite grains are not a single homo-geneous mineral phase and that dyke formation histories are complex.Therefore complex Ar spectra are expected.
4.2. Geochronology
Ar isotopes of five irradiated samples were measured at the Univer-sity of Bern on a MAP® 215-50B noble gas mass spectrometer using anall-metal extraction line attached to a double-vacuum resistance ovenand a thermocouple on the external part of the crucible. The analyticalprocedure followed Villa et al. (2000) with additional details given inAppendix 1. Results from Ar incremental heating are available withSupplementary Table A4.
4.2.1. Dyke M (sample TuM1)The age spectrumof sample TuM1 is presented in Fig. 7a and the Cl/K
vs. Ca/K three-isotope correlation diagram in Fig. 7b. The four stepswitha uniform Ar isotopic signature (Ca/K = 21.8 ± 1, Cl/K = 0.060 ±0.002) are extracted between 1054 and 1400 °C and contain 75.2% ofthe 39Ar. They define a weighted mean age of 54.34 ± 0.36 Ma (2σ)with a Mean Square of Weighted Deviates (MSWD) of 0.64. The non-committal word “plateau” could be used, but we prefer the term“isochemical age” (Hetherington and Villa, 2007) as it describes theextrinsic a priori criteria for the choice of the step ages that should beconsidered. The Ca/K ratio calculated from Ar isotope systematics(Fig. 7b) agrees with that provided by microprobe analyses (Fig. 6a).The isochron of the four isochemical steps gives an age of 54.11 ±0.68 Ma (2σ) with MSWD = 0.76 and a 40Ar/36Ar initial ratio of298.5 ± 7.7, indistinguishable from the atmospheric ratio. The low-

5
10
15
20
25
30
35
8 10 12 14 16 18 20
Ta031 (dyke 3)TuM1 (dyke M)ChU1 (dyke U)ChV1 (dyke V)
Ca/
K
Al/Ti
a
b
c
Fig. 6. (a) Microprobe-determined Ca/K vs. Al/Ti ratios of amphiboles selected for 40Ar–39Ar dating. (b) BSE image of hornblende grain of sample ChV1 including themicroprobe analysesspot numbers (see Supplementary Table A3). The grain is fragmentedwith secondarymineral phases filling the cracks. The inset shows a grain that displaysmagmatic zoning, which wastoo small to be resolvedwith the electronmicroprobe. The hornblende grains of dyke U show the same features as the ones in dyke V described here. (c) BSE image of a biotite phenocrystof dyke 5a. The image reveals compositional zonation; Mg-rich core (dark), Fe-rich mantle (bright) and an irregularly shaped regression rim, likely retrograde Mg-rich rim.
0
5
10
15
20
25
0 0.01 0.02 0.03 0.04 0.05 0.06 0.07
Dyke M: 3-isotope correlation diagram
TuM1TuM1-isochem
Ca/
K
Cl/K
867
5
4
3
2
1
50
55
60
65
70
75
80
0 20 40 60 80 100
Dyke M: age spectrum
%39Ar
Ag
e (M
a)
1
2
3
4
5 6 7 8
Plateau: 54.34 ± 0.18 Ma (1 )
75.2 % of the 39Ar gas
hornblende
a b
Fig. 7. (a) Ar-age spectrum of dyke sample TuM1 and (b) the corresponding Cl/K vs. Ca/K three-isotope correlation diagram. Full symbols indicate isochemical steps.
116 A.R. Heri et al. / Lithos 212–215 (2015) 111–121

117A.R. Heri et al. / Lithos 212–215 (2015) 111–121
temperature steps with a different Ca/Cl/K signature pertain to othermineral phases andmust not be regressed togetherwith the amphibole.
4.2.2. Dykes U and V (samples ChU1 and ChV1)Although dykes U and V have similar amphibole compositions
(Fig. 6a) and probably originated from the same batch of melt, thecompositions of the amphibole separates (as calculated from 39Ar,38Ar and 37Ar; Table A4 and Fig. 8b) are not identical. Themineral sepa-rates used for analysis consisted of individually handpicked hornblendegrains, but the electron microprobe analysis shows that the grains arecompositionally heterogeneous at the 10 μm scale as seen in Fig. 6b.Therefore, even prolonged handpicking could not have produced amonomineralic separate, and the admixture of variable amounts andtypes of secondary minerals is reflected in the variations of the Ca/Cl/Kratios (Fig. 8b). In spite of differences between the two mineralseparates, the predominant part of the Ar release occurs for bothsamples during heating steps 5, 6 and 7 and has a uniform Ar isotopicsignature. For ChV1, the three steps 5, 6 and 7 are released between1064 and 1191 °C, contain 68% of the 39Ar and have Ca/K = 16.64 ±0.06 and Cl/K = 0.0640 ± 0.0015. For ChU1, the three steps 5, 6 and 7are released between 1050 and 1179 °C, contain 71% of the 39Ar andhave Ca/K=17.92±0.10 and Cl/K=0.0520±0.0035. These particularportions of the spectra also have identical step ages. For ChU1 theweighted mean of the step ages 5, 6 and 7 is 50.7 ± 0.3 Ma. The stepages 5, 6 and 7 of dyke V are less precise, but indistinguishable fromthis age (Fig. 8a), which supports the hypothesis that dykes U and Vare comagmatic.
Differences in modal abundance of regression phases observedduring petrographic analyses of thin sections may suggest that theprimary magma underwent slightly different post-magmatic reactions.The age spectra of the two samples (Fig. 8a) exhibit a saddle shape,which in the early days of geochronology was attributed to contamina-tion by excess Ar, but without a satisfactory explanation of the peculiarshape (Lanphere and Dalrymple, 1971). Our data provide a straightfor-ward link between the microscopic observation and the Ar isotopesystematics. The discordant step ages, which give the age spectrum itssaddle shape, are associated with the heterochemical Ca/Cl/K signature(Fig. 8b). Thus, the saddle shape is not an unexplained intrinsic propertyof a monomineralic phase. On the contrary, it is completely accountedfor by the presence of extraneous phases whose contribution affectsapproximately 30% of the 39Ar budget. The petrographic analysis revealsthese phases as retrogression products. Therefore excessively high agespertain solely to the retrograde reactions and not to a discrete free-
0
50
100
150
200
250
300
0 20 40 60 80 100
Dykes U and V: age spectra
Ag
e (M
a)
ChU1
ChV1
hornblende
a b
%39Ar
Fig. 8. (a) Ar-age spectra of samples ChU1 and ChV1. Solid line indicates sample ChU1, dashed liChV1 (diamonds) with full symbols indicating the isochemical steps. The samples show very s
flowing noble gas, “excess Ar”, that penetrated into a monomineralicmatrix.
4.2.3. Dyke 3 (sample Ta031)The amphibole age spectrum of sample Ta031 (Supplementary
Fig. A2a) is also discordant. The age vs. Ca/K diagram (SupplementaryFig. A2b) identifies steps 4 to 7 (1057–1400 °C) as those with the leastcompositional variation, albeit with detectable variations in Ca/K andCl/K ratios. These four steps account for 70% of the 39Ar release andshow Ca/K ratios ranging from 7.8 to 8.4 and Cl/K ratios between0.021 and 0.025. The weighted average of step ages 4 to 7 is 49.8 ±1.5 Ma.
4.2.4. Dyke 5a (sample Ta5a1)Two biotite separates were obtained from Dyke 5, Ta5a1 and
Ta5a1X, because the biotite grains formed two fractions during themagnetic separation. One fraction was magnetic at 0.25 A (Ta5a1X),the otherwas not (Ta5a1). On thebasis of subjective impressions duringhand-picking, it was suspected that the magnetic fraction consisted ofpurer grains and contained less interlayer contaminants. For a compar-ison of the two, both fractions were analysed. The two aliquots gavesimilar, discordant age spectra (Fig. 9a). Since the Ca concentration ofstoichiometric biotite should be close to zero, the steps recording thedegassing of biotite least affected by contaminant phases, are thosewith the lowest Ca/K ratios. Therefore heating steps 3 and 4 of bothaliquots were selected for an estimation of the age, since these stepsexhibit the lowest Ca/K ratios (Fig. 9b). The weighted average of thesestep ages is 45.1 ± 0.1 Ma. The K total concentrations calculatedfrom the total 39Ar release for aliquots Ta5a1 and Ta5a1X are 72 and74 mg/g, respectively. These slightly substoichiometric values indicatethat the biotite is not pervasively, but possibly slightly altered with7–10% K loss, or contains about 7–10% contaminant phases, or a combi-nation of both.
The isochrons show trapped 40Ar/36Ar ratios statistically indistin-guishable from air, but this is known to have no bearing on the presenceor absence of excess Ar (Foland, 1983). Therefore, the only reliable wayto estimate if the 40Ar–39Ar age of dyke 5a (and arguably of the otherdykes by analogy) is affected by excess Ar, is dating by an independentchronometer. Dyke 5a is the most suitable sample for Rb–Sr dating,because it contains biotite as high Rb/Sr and plagioclase as low Rb/Srmineral phase. Results of the Rb–Sr analyses are presented in Supple-mentary Table A5. The isochron through the three points biotite, plagio-clase and whole rock gives an age of 43 ± 60 Ma (2σ) with an initial87Sr/86Sr ratio of 0.7141 ± 0.0016 and an MSWD of 159. The MSWD is
0
0.01
0.02
0.03
0.04
0.05
0.06
0.07
0 5 10 15 20
Dykes U and V: 3-isotope correlation diagram
ChV1ChV1-isochemChU1ChU1-isochem
Cl/K
Ca/K
1
2
6
875
4
3
12
3
4
5 967
8
ne sample ChV1. (b) Cl/K vs. Ca/K three-isotope correlation diagram of ChU1 (squares) andimilar Ar isotope signatures indicating similar, but not identical compositions.

0.003
0.003
0.004
0.004
0.005
0.005
0.0 0.2 0.4 0.6 0.8 1.0
Dyke 5a: 3-isotope correlation diagram
Ta5a1Ta5a1-isochemTa5a1XTa5a1X-isochem
Cl/K
Ca/K
1
2
10
9
8
3
445
50
55
60
0 20 40 60 80 100
Dyke 5a: age spectra
%39Ar
Ag
e (M
a)
Ta5a1X
Ta5a1
7653
4
biotite
a b
0.7140
0.7160
0.7180
0.7200
0.7220
0.7240
0.7260
0.7280
0 5 10 15 20
Dyke 5a: Rb-Sr isochrons
bt
plag
wr
87S
r/ 86
Sr
87Rb/ 86Sr
plag-bt isochron:
Age = 42.53 ± 0.15 Ma
Initial 87Sr/86Sr = 0.714271
wr-bt isochron:
Age = 43.36 ± 0.77 Ma
Initial 87Sr/86Sr = 0.71403
c
Fig. 9. (a) Ar-age spectra of samples Ta5a1 (dashed line) and Ta5a1X (solid line). (b) Cl/K vs. Ca/K three-isotope correlation diagram of Ta5a1 (diamonds) and Ta5a1X (squares) with fullsymbols indicating the steps with lowest Ca/K ratios. (c) Rb–Sr isochrons of sample Ta5a1: the dashed line depicts the whole rock (wr)–biotite (bt) isochron and the solid line theplagioclase (plag)–biotite isochron.
118 A.R. Heri et al. / Lithos 212–215 (2015) 111–121
excessively high; the 87Rb/86Sr vs. 87Sr/86Sr diagram (Fig. 9c) shows thatthe plagioclase and whole rock do not lie on the same, statistically validisochron. This means that at the time of intrusion, ca. 43 Ma, they had87Sr/86Sr ratios in statistically significant isotopic disequilibrium.However, if ‘plag’, ‘bt’ and ‘wr’ all reflect crystallisation from a melt,they would be in isotopic equilibrium. One very probable cause of per-turbation of the Sr isotope record is that plagioclase is seriticised andcalcified. If the isochron is calculated with only two data points at thetime, namely either plag-bt or wr-bt, the ages are marginally distin-guishable (42.53 ± 0.15 Ma and 43.36 ± 0.77 Ma (2σ) respectively).
In any case, two-point isochrons are of doubtful reliability, as theyallow no redundant check of internal isotopic equilibrium and true co-geneticity of the analysed minerals. Our aim was simply a first ordercomparison between the Rb–Sr age of the bulk biotite of dyke 5a andthe 40Ar–39Ar age estimated from the least Ca-rich steps. Their near-agreement suggests that the 40Ar–39Ar age is not affected by a majorperturbation, and that an age of ca. 45 Ma is credible.
4.2.5. Pseudotachylyte (sample LiO1)Finally,we analysed theNE–SWoriented pseudotachylyte LiO1 from
near Likir (see Fig. 2). LiO1 yielded an age spectrum with several low-temperature steps (steps 1–5) having similar ages and Ar isotopesignatures, which indicates the degassing of reservoirs with similarcompositions (Figs. 10a, b). These are followed by high-temperaturesteps, which show increasing step ages and Cl/K and Ca/K ratios withincreasing temperature. Müller et al. (2002) discussed the systematicsof dating pseudotachylytes by 40Ar–39Ar and demonstrated thatthe data obtained by step-wise heating agree with in-situ analyses ofmatrix and clasts by laser microprobe. The low-temperature steps
40
50
60
70
80
90
100
110
120
0 20 40 60 80 100
pseudotachylyte: age spectrum
Ag
e (M
a)
%39
Ar
1 23 4
56
7
8
9
0.00 0.05 0.100
0.002
0.004
0.006
pseudotachylyte: 3-iso
0.00 0.05 0.100
0.001
0.002
0.003
0.004
0.005
0.006LiO1LiO1-isochem
C
Cl/K
34
1
25
8
a b
Fig. 10. (a) Ar-age spectrum of sample LiO1. (b) Cl/K vs. Ca/K three-isotope correlation diagramsignatures. (c) Age vs. Cl/K diagram with full symbols indicating the steps assigned to matrix f
with low Ca/K ratios can thereafter be assigned to the matrix and thehigh-temperature high-age steps with increasing Ca/K ratios to theclasts. In more detail, following Pennacchioni et al. (2006), the matrix-related steps can be further subdivided into groups, according to theheterogeneousmatrixmineralogy. Fig. 10c shows a three-isotope corre-lation diagram relating age and composition. The linear anti-correlationdefined by steps 1–5 requires a binary mixing between two (matrix)phases, while the positive slope indicated by steps 6–8 (and continuedby steps 9–10 outside the frame) is due to the increasing importanceof clast degassing. Step 3 with the lowest Cl/K ratio most closely repre-sents matrix feldspar, with an apparent age of 54.6 ± 0.1 Ma. As thematrix possibly contains sericite as a secondary reaction product afterfeldspar, and mica normally degasses at higher furnace temperaturesthan feldspar of the same grain size, we propose that steps 5 and 6represent the micaceous component of the matrix. The apparent ageof the youngest step, 47.0 ± 0.2 Ma, is thus interpreted as the closestapproximation of the secondary sericitisation of matrix feldspar. There-fore the age of pseudotachylyte formation is given by the matrixfeldspar age, 54.6 ± 0.1 Ma.
5. Isotope geochemistry
To investigate the magma sources, Rb–Sr and Sm–Nd analyses wereperformed by MC-ICP-MS (multi-collector inductively coupled plasmamass spectrometry). Details of the analytical procedure including rockdigestion and column chemistry can be found in the appendix. Theresults are available in Table A5 of the Supplementary database.
The data reveal a remarkable variability in Sr–Nd isotope geochem-istry among the dykes. Fig. 11a shows the double ε-diagram. The
0.15 0.20 0.25
tope correlation diagram
0.15 0.20 0.25
a/K
9
7
6
45
50
55
60
65
70
0.0 5.0e-4 1.0e-3 1.5e-3 2.0e-3
pseudotachylyte: 3-isotope correlation diagram
LiO1LiO1-isochem
Ag
e (M
a)
Cl/K
8
2
3
4
1
5
6
7
c
with full symbols indicating the low-temperature steps characterised by similar Ar isotopeeldspar.

119A.R. Heri et al. / Lithos 212–215 (2015) 111–121
143Nd/144Nd and the 87Sr/86Sr ratios of CHUR (Chondritic UniformReservoir) at present are taken as 0.512638 (Nägler and Kramers,1998) and 0.7045 (DePaolo, 1988, p. 82) respectively. The dykes spana range from positive, mantle-associated ε0(Nd) values with lowε0(Sr), to crust-dominated negative ε0(Nd) values with high ε0(Sr).Decreasing ε0(Nd) values are accompanied by increasing ε0(Sr) valuesand range from 3.6 to−9.6 and from 0.4 to 143, respectively. The vari-ation in isotope composition is very large considering the small sam-pling area (roughly 120 km2) and time span, during which the dykesmust have formed. This variation is virtually the same in ε0(Nd) andan even larger in ε0(Sr) as observed for the whole 30 000 km2 RomanVolcanic province (Hawkesworth and Vollmer, 1979). A causal relationbetween degree of differentiation (i.e. silica content) and isotope signa-ture can be excluded, since the TASdiagram(Fig. 5) shows that themostdifferentiated dyke (dyke N) is at the same time isotopically the mostprimitive (i.e.most mantle-like) dyke. The variability in Nd–Sr isotopeshowever, is not random. The difference in orientation between thedykes east andwest of Tunglung is reflected in the isotopic compositionof the dykes. Dykes west of Tunglung form a group with exclusivelypositive ε0(Nd) between 0.4 and 3.6 and low ε0(Sr) values between 0and 13. Those east of Tunglung in contrast show a large variation inisotopic composition with most of the dykes showing negative ε0(Nd)values. ε0(Nd) values range from −9.6 to 2.0 and ε0(Sr) values from9.6 to 143.3.
Fig. 11b presents the ε(Nd)i vs. 87Sr/86Sri values of Cretaceous toMiocene igneous rocks from Tibet and Karakoram compared to thesamples of this study. The diagram shows the large spread in Sr–Ndisotopes of the Ladakh dykes compared to the other igneous rocks.There is substantial overlap of the dykes analysed in this work withmagmatic rocks of different ages from very different locations in theHimalaya–Karakorum–Tibet region. Whereas dykes west of Tunglungare isotopically very similar to the Hemasil ultrapotassics, dykes eastof Tunglung show a large scatter overlapping the isotopic signaturesof the Baltoro granite and Manasarovar volcanics. However, there isno overlap of the dykes with the volcanic rocks of the westernLadakh–Kohistan arc in Pakistan. The distribution of data points showsno clear trend with either age or location.
From the Nd isotopic composition and the Sm/Nd element ratio it ispossible to calculate the so-called Nd model age, tDM(Nd), whichdescribes the average age of the extraction of a crustal segment fromthe depleted mantle. These ages must be used with great caution(Arndt and Goldstein, 1987) and here only the relative change is ofimportance, not the ages per se. The 143Nd/144Nd ratios of the dykesplotted against their tDM(Nd) in Fig. 11c. The dykes display decreasing143Nd/144Nd ratios (0.512824 to 0.512146) correlating with increasingtDM(Nd) from 0.46 Ga to 1.33 Ga.
-15
-10
-5
0
5
10
15
0.700 0.710 0.720
Hemasil: 9 Ma
Ladakh bath.: 60-110 Ma
Ladakh dykes: 46-54 M
Manasarovar: 16-1
W-Ladakh volc.: 110 Ma
DMM
Baltoro: 21-25 Ma
(Nd
) i
87Sr/
86S
-10
-8
-6
-4
-2
0
2
4
0 50 100 150
E of TunglungW of TunglungBatholith
Ta5a1
Ta051
UmI1
LiN1TuM1
UmJ1
UmH1
Ta021
0(N
d)
0(Sr)
a b
Fig. 11. (a) Double ε-diagramwith ε0(Sr) on the x-axis and ε0(Nd) on the y-axis. Samples from esamples by squares. (b) ε(Nd)i vs 87Sr/86Sri diagram depicting isotopic compositions of magmat(1996), Miller et al. (1999), Rolland et al. (2002), Mahéo et al. (2009). (c) 143Nd/144Nd ratiosCircled samples contain quartz xenocrysts.
6. Discussion
The dykes described by Ravikant and Guha (2002) and Weinbergand Dunlap (2000) are not restricted to an isolated dyke swarmbetween the two villages Phyang and Taru. Coeval dykes were encoun-tered along the southern margin of the Ladakh pluton as far as HemisShugpachan and are expected to also occur further west. Sampleddykes not only include andesites, but also more basaltic as well asmore acidic dykes.
The structural data show a difference in dyke orientations. Thoseeast of Tunglung trend E to NE, whereas those west of Tunglung are Nto NW oriented. In principle, the orientation of an individual dyke isnot a rigorous proxy for the prevailing stress field, as site-specific effects(e.g. host rock anisotropy, heterogeneous nucleation and/or strainlocalization, etc.) can affect dyke emplacement. Nevertheless, thesystematically (sub)parallel orientation of almost a dozen dykes ineach section makes it unlikely that random deflection produced twocontrasting, areally consistent spatial patterns. The parallelism suggestsinstead that the dykes formed in spatially restricted, extensional stressfields of different orientation during the early Eocene, while the coolingbatholith was undergoing a transition to brittle conditions. The differ-ence in orientation is accompanied by a petrologic discriminant: onlythose dykes east of Tunglung contain quartz phenocrysts.
We interpret these rounded and embayed quartz phenocrysts withor without corona structures of cryptocrystalline minerals (see Fig. 3a)as partly resorbed and reacted xenocrysts. This observation is matchedby a significant difference in isotope geochemistry. For a cogeneticsuite of dykes, it would be expected that they share a commontDM(Nd). This is because the 143Nd/144Nd ratio is not affected byfractional crystallisation and the tDM(Nd) values would be the samefor rocks from the same source independent of their degree of fraction-ation. Instead of similar tDM(Nd) values, the dykes exhibit large Sr-Ndisotope variations.
Dykes west of Tunglung tend towards the low tDM(Nd), low ε0(Sr)and high ε0(Nd) end of the observed variation range, with comparablylow variation in mantle extraction ages (Figs. 11a and c). This indicatesthat they have undergone minor crustal assimilation. In contrast, dykeseast of Tunglung scatter towards higher tDM(Nd), higher ε0(Sr) andlower ε0(Nd). Their isotope signature suggests that crustal assimilationplayed an increasingly important role in their formation, as emphasisedby the occurrence of quartz xenocrysts. Almost all dykes with143Nd/144Nd values lower than CHUR, which exclusively belong to theeastern group of dykes, contain quartz xenocrysts. The connectionbetween crustal assimilation and isotope signature is evident.
Taken together, these results suggest that the isotopic differencebetween dykes east and west of Tunglung stems from a differing
0.730 0.740
DMMLadakh volc.Ladakh dykes ELadakh dykes WLadakh bath.Hemasil BaltoroBaltoro lampr.ManasarovarTranshim. bath.Ultrapotass. S-TibetPotassics S-Tibet
a
Xungba &Bongba
Xungba &Jarga
7 Ma
S-Tibet: 18-13 Ma
ri
c
0.5121
0.5122
0.5123
0.5124
0.5125
0.5126
0.5127
0.5128
0.5129
0.4 0.6 0.8 1 1.2 1.4
E of TunglungW of TunglungBatholith
CHUR
143N
d/14
4N
d
tDMNd (Ga)
LiN1
Ta5a1
Ta051
UmH1UmJ1
astern dykes are indicated by diamonds; those fromwestern dykes by circles and batholithic rocks of various ages from the Asianmargin. Data from Searle et al. (1992), Lemennicierof the dykes plotted against their mantle extraction ages. Symbols are the same as in (a).

120 A.R. Heri et al. / Lithos 212–215 (2015) 111–121
petrogenesis that transformed the primary (possiblymantle-like)maficmagma into each individual dyke. The Nd–Sr diagram should thereforenot be viewed as an indicator of tectonic settings and their evolutionthrough time. Instead, thediagramserves as a localmonitor of processesin individual magma-chambers (e.g. assimilation of continental crust,magma mixing, digestion of wall-rocks, involvement of metasomaticfluids, etc.). The isotopic signatures of our batholith samples fit in thenarrow range reported previously (Schärer et al., 1984; Weinberg andDunlap, 2001), which was interpreted as evidence for the absenceof a crustal component in the formation of the Ladakh batholith(Weinberg and Dunlap, 2001). However, an increase in crustal involve-ment in the late stages of batholith formation was proposed by Rollandet al., 2002 based on a diorite sample (63–50Ma) from Chang La, whichshowed εNd110 = –7.5. This agrees with our Sr–Nd analyses (and Hfisotope analyses, Kumar et al., 2011), which show the involvement ofa crustal component in the formation of some of the investigated dykes.
40Ar–39Ar dating shows that the dykes formed during the EarlyEocene, 54–50 Ma ago with amphibole crystallisation ages of ca.50 Ma (dykes U and V, dyke 3) and 54 Ma (dyke M). The amphiboleage of 46 ± 1 Ma for one of the andesitic dykes in Taru reported byWeinberg and Dunlap (2000) was not reproduced. Since these authorsdo not provide further information about the dyke (such as coordinates,detailed petrography or an outcrop description) it remains unknown ifany dyke sampled by us was the same as that dated in their study. Thedykes show neither chilled margins nor back-veining. This requiresthat the host batholith was warm but melt was no longer present, i.e.,T ≤ 600 °C. This means that hornblende was closed to Ar loss (usingthe recalibrated diffusivity of Villa et al., 1996) and dates the intrusionof each dyke.
A significantly younger, but still Eocene age of 45 Ma was obtainedon the biotite mineral separate of eastern dyke 5 (Fig. 9a). This couldbe interpreted as cooling or recrystallisation age. Based on the re-evaluation of laboratory data from the literature (Villa, 2010) and onthe field calibration of biotite closure around 500 °C (Allaz et al.,2011), the biotite age of ca. 45 Ma is compatible with uniform coolingby 12 °C/Ma ever since the dykes intruded in the Eocene. However, atleast parts of the batholith must have already evolved into brittleconditions by ca. 54 Ma (as attested by pseudotachylyte LiO1, formedby brittle deformation), which requires a much faster exhumation. Analternative explanation could be that biotite dates the fluid circulationevent that led to its recrystallisation. This is based on the observationthat high temperature alteration affected most of the dykes resultingin the (individually variable) formation of secondary minerals such asepidote, secondary biotite and chlorite. However, the BSE images revealthat biotite Ta5a1 is not a homogeneous, completely recrystallisedphase, as it consists of three distinctly different compositional zones(Fig. 6c). Thus, the 45Ma biotite age cannot be attributed to a pervasive,single-stage recrystallisation that would have formed supposed “puresecondary biotite”.
As many dykes do not contain sufficiently fresh mineral phasessuitable for 40Ar–39Ar dating, our sampling was unable to resolve indetail the exact succession of dyke intrusions. Furthermore, there is acomplete lack of cross-cutting relationships between the dykes; noadditional information about the relative ages of the dykes is available,which would be of considerable help to reconstruct the chronology ofmagmatic activity. For a better, more detailed understanding of thecooling history of the batholith, the ages of the host-rock in the immedi-ate vicinity of the dykes would be needed i.e. the age of individualplutons within the plutonic complex. The need for more data is exem-plified by the much younger ages proposed by Weinberg and Dunlap(2000) for ductile deformation in the Thanglasgo-shear-zone on thenorthern side of the Ladakh range, approximately 30 km north of ourfield area.
The hierarchy of observations made in the present study is critical:from a tectonic viewpoint, the dykes are ‘all the same’; they formedabove a subduction zone and subsequently intruded in the Ladakh arc
during the Early Eocene. However, detailed petrographic and isotopicanalyses of the dykes show variations across the field area. Whilesome features of the dykes are found to be the same over tens ofkilometres, such as the occurrence of quartz xenocrysts and the orienta-tion of the dykes, other observations (alteration features, degree of dif-ferentiation) are very localised. Although it is not known howrepresentative the sampled dykes are for the entire Eocene dyke popu-lation in the Ladakh batholith, they prove one important point: a singledyke sample cannot capture the variation that exists within a popula-tion of dykes. Furthermore, our Sr–Nd isotopic data raise questionsabout the interpretation of isotopic fingerprints. When is a Sr–Nd isoto-pic fingerprint the result of crustal assimilation and when is it really thefingerprint of the original, ‘pristine’ magma? The answer to this ques-tion requires a context with petrographic and geochemical analyses.While a tight range of values is commonly interpreted as indicating asingle, primary magma source, it is unlikely that the large range ob-served here implies the existence of multiple sources. We proposeinstead that the observed isotopic variation is the result of diversifica-tion of one, primary magma after melt formation above a subductionzone. Processes responsible for the isotopic diversification of the prima-rymagma are complex andmight includemagmamixing andmingling,crustal assimilation and interaction with a presumably varying hostrock.
7. Conclusions
1. Abundant dykes crop outwest of Leh and extend fromat least Taru toHemis Shugpachan. They formed during the Early Eocene withhornblende ages of ca. 50 and 54 Ma.
2. The dykes are geochemically diverse and exhibit various degrees ofdifferentiation, implying that the term ‘andesitic dyke swarm’ is notappropriate. Large variations in Sr–Nd isotopic compositions arelinked to crustal xenocrysts and therefore the likely result of varyingdegrees of crustal assimilation.
3. Isotopic, structural and petrographic evidence suggests majordifferences in the formation and subsequent exhumation and retro-gression histories west and east of Tunglung. Western dykes do notshow substantial crustal assimilation, as they exhibit positiveε0(Nd) values and ε0(Sr) values close to chondritic values. In con-trast, those in the east have undergone a higher degree of crustalassimilation.
4. Despite exhaustive fieldwork, no ultrapotassic dykeswere found, norwere any further indicators of Miocene magmatism observed.
Supplementary data to this article can be found online at http://dx.doi.org/10.1016/j.lithos.2014.11.001.
Acknowledgements
The fieldwork in Ladakh was funded by The University of HongKong, Small Project Funding grant 200707176193. The research wasfurther supported by a General Research Fund grant from the ResearchGrant Council of Hong Kong Special Administrative Region (CERGproject HKU7001/07) awarded to JCA.
The electron microprobe was funded by SchweizerischerNationalfonds grant 200021-103479/1. Martin Robyr is thanked forthe help with handling the electronmicroprobe and acquiring stunningBSE images. We thank Klaus Mezger and Thomas Nägler for helpfuldiscussions. We also thank the reviewers Yann Rolland and RobertoWeinberg, and Chief Editor Andrew Kerr for their constructivecomments and suggestions that helped to improve the manuscript.
References
Aitchison, J.C., Ali, J.R., Davis, A.M., 2007. When and where did India and Asia collide?Journal of Geophysical Research, Solid Earth 112. http://dx.doi.org/10.1029/2006JB004706 (B05423).

121A.R. Heri et al. / Lithos 212–215 (2015) 111–121
Aitchison, J.C., Jason, R.A., Chan, A., Davis, A.M., Lo, C.-H., 2009. Tectonic implications offelsic tuffs within the Lower Miocene Gangrinboche conglomerates, southern Tibet.Journal of Asian Earth Sciences 34, 287–297.
Allaz, J., Engi, M., Berger, A., Villa, I.M., 2011. The effects of retrograde reactions and ofdiffusion on 40Ar–39Ar ages of micas. Journal of Petrology 52, 691–716.
Allègre, C.J., Ben Othman, D., 1980. Nd–Sr isotopic relationship in granitoid rocks andcontinental-crust development — a chemical approach to orogenesis. Nature 286,335–342.
Armijo, R., Tapponier, P., Mercier, J.L., Han, T.-L., 1986. Quaternary extension in southernTibet: field observations and tectonic implications. Journal of Geophysical Research91, 13803–13872.
Arndt, N.T., Goldstein, S.L., 1987. Use and abuse of crust-formation ages. Geology 15,893–895.
Burchfiel, B.C., Chen, Z., Hodges, K.V., Liu, Y., Royden, L.H., Deng, C., Xu, J., 1992. The SouthTibetan detachment system, Himalayan orogen: extension contemporaneous withand parallel to shortening in a collisional mountain belt. Geological Society ofAmerica, Special Paper 269, 1–41.
Clift, P.D., Hannigan, R., Blusztajn, J., Draut, A.E., 2002. Geochemical evolution of the Dras–Kohistan Arc during collision with Eurasia: evidence from the Ladakh Himalaya,India. The Island Arc 11, 255–273.
DePaolo, D.J., 1988. Neodymium Isotope Geochemistry: An Introduction. Springer, Heidel-berg (187 pp.).
Foland, K.A., 1983. 40Ar/39Ar incremental heating plateaus for biotites with excess Ar.Chemical Geology 41, 3–21.
Garzanti, E., van Haver, T., 1988. The Indus clastics: forearc basin sedimentation in theLadakh Himalaya (India). Sedimentary Geology 59, 237–249.
Hawkesworth, C.J., Vollmer, R., 1979. Crustal contamination versus enriched mantle -Nd-143-Nd-144 and Sr-87-Sr-86 evidence from the Italian Volcanics. Contrib.Mineral. Petrol. 69, 151–165.
Heri, A.R., Robyr, M., Villa, I.M., 2014. Petrology and geochronology of the “muscovitestandard” B4M. In: Jourdan, F., Mark, D., Verati, C. (Eds.), 40Ar/39Ar Dating: FromGeochemistry to Thermochronology, From Archaeology to Planetary Sciences.Geological Society London Special Publication 378, pp. 69–78.
Hetherington, C.J., Villa, I.M., 2007. Barium silicates of the Berisal Complex, Switzerland: astudy in geochronology and rare-gas release systematics. Geochimica etCosmochimica Acta 71, 3336–3347.
Honegger, K., Dietrich, V., Frank, W., Gansser, A., Thöni, M., Trommsdorff, V., 1982.Magmatism andmetamorphism in the Ladakh Himalayas (the Indus–Tsangpo suturezone). Earth and Planetary Science Letters 60, 253–292.
Irvine, T.N., Baragar, W.R.A., 1971. A guide to the chemical classification of the commonvolcanic rocks. Canadian Journal of Earth Sciences 8, 523–548.
King, J.A., Harris, N., Argles, T., Parrish, R.R., Charlier, B.L.A., Sherlock, S., Zhang, H., 2007.First field evidence of southward ductile flow of Asian crust beneath southernTibet. Geology 35, 727–730. http://dx.doi.org/10.1130/G23630A.1.
Kumar, S., 2010. Mafic to hybrid microgranular enclaves in the Ladakh Batholith, north-west Himalaya: implications on calc-alkaline magma chamber processes. JournalGeological Society of India 76, 5–25.
Kumar, S., Singh, B., Wu, F.-Y., Ji, W.-Q., Pathak, M., 2011. Geochemistry, zircon U–Pbgeochronology and Hf isotope of granitoids and enclaves from Ladakh Batholith,Northwest Indian Higher Himalaya. Symposium on Granites and Related Rocks,Avila, Spain, 4–9 July 2011.
Lanphere, M.A., Dalrymple, G.B., 1971. A test of the 40Ar/39Ar age spectrum technique onsome terrestrial materials. Earth and Planetary Science Letters 12, 359–372.
Leake, B.E.,Woodley, A.R., Arps, C.E.S., Birch,W.D., Gilbert, M.C., Grice, J.D., Hawthorne, F.C.,Kato, A., Kisch, H.J., Krivovichev, V.G., Linthout, K., Laird, J., Mandaring, J.A., Maresch,W.V., Nickel, E.H., Rock, N.M.S., Schumacher, J.C., Smith, D.C., Stephenson, N.C.N.,Ungaretti, L., Whittaker, E.J.W., Guo, Y.Z., 1997. Nomenclature of amphiboles: reportof the subcommittee on amphiboles of the International Mineralogical Association,commission on new minerals and mineral names. Canadian Mineralogist 35,219–246.
LeBas, M.J., LeMaitre, R.W., Streckeisen, A., Zanettin, B., 1986. A chemical classification ofvolcanic rocks based on the total alkali silica diagram. Journal of Petrology 27,745–750.
Lemennicier, Y., 1996. Le complexe métamorphique du sud Karakorum dans le secteurdu Chogo Lungma (Baltistan - nord Pakistan) (Ph.D. thesis) Université JosephFourier, Grenoble (278 pp.).
Mahéo, G., Blichert-Toft, J., Pin, C., Guillot, S., Pêcher, A., 2009. Partial melting of mantleand crustal sources beneath South Karakorum, Pakistan: implications for theMicoenegeodynamic evolution of the India–Asia Convergence Zone. Journal of Petrology 50,427–449.
Molnar, P., Tapponier, P., 1978. Active tectonics of Tibet. Journal of Geophysical Research83, 5361–5375.
Miller, C., Schuster, R., Klötzli, U., Frank, W., Purtscheller, F., 1999. Post-collisional potassicand ultrapotassic magmatism in SW Tibet: geochemical and Sr–Nd–Pb–O isotopiccontraints for mantle source characteristics and petrogenesis. Journal of Petrology40, 1399–1424.
Müller, W., Kelley, S.P., Villa, I.M., 2002. Dating fault-generated pseudotachylytes:comparison of 40Ar/39Ar stepwise-heating, laser-ablation and Rb–Sr microsamplinganalyses. Contributions to Mineralogy and Petrology 144, 57–77.
Nägler, T.F., Kramers, J.D., 1998. Nd isotopic evolution of the upper mantle during thePrecambrian: models, data and the uncertainty of both. Precambrian Research 91,233–252.
Peccerillo, A., Taylor, S.R., 1976. Geochemistry of Eocene calc-alkaline volcanic rocks fromthe Kastamonu area, Northern Turkey. Contrib. Mineral. Petrol. 58, 63–81.
Pennacchioni, G., Di Toro, G., Brack, P., Menegon, L., Villa, I.M., 2006. Brittle–ductile–brittledeformation during cooling of tonalite (Adamello, Southern Italian Alps).Tectonophysics 427, 171–197.
Ravikant, V., Guha, D., 2002. Ultrapotassic postcollisional dyke from the Leh batholith,Northwest Himalaya. Journal of the Geological Society of India 59, 473–476.
Ravikant, V., 2006. Utility of Rb–Sr geochronology in constraining Miocene and Creta-ceous events in the eastern Karakorum, Ladakh, India. Journal of Asian Earth Sciences27, 534–543.
Ravikant, V., Fu, F.-Y., Ji, W.-Q., 2009. Zircon U–Pb and Hf isotopic constraints on petrogen-esis of the Cretaceous–Tertiary granites in eastern Karakoram and Ladakh, India. Lith-os 110, 153–166 (2009).
Rolland, Y., Pêcher, A., Picard, C., 2000. Mid-Cretaceous back-arc formation and arc evolu-tion along the Asian margin: the Shyok Suture Zone in northern Ladakh (NWHimalaya). Tectonophysics 325, 145–173.
Rolland, Y., Pêcher, A., 2001. Reply to the comments on “Middle Cretaceous back-arcformation and arc evolution along the Asianmargin: the Shyok Suture Zone on northernLadakh (NWHimalaya)”. In:Weinberg, Dunlap (Eds.), Tectonophysics 340, pp. 269–271.
Rolland, Y., Picard, C., Pêcher, A., Lapierre, H., Bosch, D., Keller, F., 2002. The cretaceousLadakh arc of NW Himalaya—slab melting and melt-mantle interaction during fastnorthward drift of Indian Plate. Chemical Geology 182, 139–178.
Schärer, U., Hamet, J., Allègre, C.J., 1984. The Transhimalaya (Gangdese) plutonism in the La-dakh region: a U–Pb and Rb–Sr study. Earth and Planetary Science Letters 67, 327–339.
Searle, M.P.,Windley, B.F., Coward,M.P., Cooper, D.J.W., Rex, A.J., Rex, D., Li, T., Xiao, X., Jan,M.Q., Thakur, V.C., Kumar, S., 1987. The closing of Tethys and the tectonics of theHimalaya. Geological Society of America Bulletin 98, 678–701.
Searle, M.P., Crawford, M.B., Rex, A.J., 1992. Field relations, geochemistry, origin andemplacement of the Baltoro granite, Central Karakoram. Transactions of the Royal So-ciety of Edinburgh: Earth Sciences 83, 519–538.
Singh, B., 1993. Geological set up of a part of the Ladakh Granitoid Complex, LadakhHimalaya. Journal of Himalayan Geology 4, 57–62.
Singh, S., Kumar, R., Barley, M.E., Jain, A.K., 2007. SHRIMP U–Pb ages and depth ofemplacement of Ladakh Batholith, Eastern Ladakh, India. Journal of Asian Earth Sci-ences 30, 490–503.
St-Onge, M.R., Rayner, N., Searle, M.P., 2010. Zircon age determinations for the Ladakhbatholith at Chumathang (Northwest India): implications for the age of the India–Asia collision in the Ladakh Himalaya. Tectonophysics 495, 171–183.
Turner, S., Arnaud, N., Liu, J., Rogers, N., Hawkesworth, C., Harris, N., Kelley, S., VanCalsteren, P., Deng, W., 1996. Post-collision, shoshonitic volcanism on the TibetanPlateau: implications for convective thinning of the lithosphere and the source ofocean island basalts. Journal of Petrology 37, 45–71.
Villa, I.M., Grobéty, B., Kelley, S.P., Trigila, R., Wieler, R., 1996. Assessing Ar transport pathsandmechanisms in the McClureMountains hornblende. Contributions to Mineralogyand Petrology 126, 67–80.
Villa, I.M., Hermann, J., Müntener, O., Trommsdorff, V., 2000. 39Ar–40Ar dating of multiplyzoned amphibole generations (Malenco, Italian Alps). Contributions to Mineralogyand Petrology 140, 363–381.
Villa, I.M., 2010. Disequilibrium textures versus equilibrium modelling: geochronology atthe crossroads. Geological Society, London, Special Publications 332, 1–15.
Weinberg, R.F., Dunlap, W.J., 2000. Growth and deformation of the Ladakh Batholith,northwest Himalayas: implications for timing of continental collision and origin ofcalc-alkaline batholiths. The Journal of Geology 108, 303–320.
Weinberg, R.F., Dunlap, W.J., 2001. Comment on “Middle Cretaceous back-arc formationand arc evolution along the Asian margin: the Shyok Suture Zone in northern Ladakh(NW Himalaya)”. In: Rolland, Pêcher (Eds.), Tectonophysics 340, pp. 265–268.
White, L.T., Ahmad, T., Ireland, T.R., Lister, G.S., Forster, M.A., 2011. Deconvolving episodicage spectra from zircons of the Ladakh Batholith, northwest Indian Himalaya. Chem-ical Geology 289, 179–196.
Williams, H., Turner, S., Kelley, S., Harris, N., 2001. Age and composition of dikes in south-ern Tibet: new constraints on the timing of east–west extension and its relationshipto postcollisional volcanism. Geology 29, 339–342.
Williams, H., Turner, S., Pearce, J., Kelley, S., Harris, N., 2004. Nature of the source regions forpostcollisional, potassic magmatism in southern and northern Tibet from geochemicalvariations and inverse trace element modelling. Journal of Petrology 45, 555–607.
Yin, A., 2006. Cenozoic tectonic evolution of the Himalayan orogen as constrained byalong-strike variation of structural geometry, exhumation history, and foreland sed-imentation. Earth-Science Reviews 76, 1–131.