The role of ridge subduction in determining the geochemistry and Nd–Sr–Pb isotopic evolution of...
90
The role of ridge subduction in determining the geochemistry and Nd-Sr-Pb isotopic evolution of the Kodiak batholith in Southern Alaska Robert A. Ayuso, Peter J. Haeussler, Dwight C. Bradley, David W. Far- ris, Nora K. Foley, Gregory A. Wandless PII: S0040-1951(08)00444-7 DOI: doi: 10.1016/j.tecto.2008.09.029 Reference: TECTO 124337 To appear in: Tectonophysics Received date: 9 May 2007 Revised date: 25 August 2008 Accepted date: 10 September 2008 Please cite this article as: Ayuso, Robert A., Haeussler, Peter J., Bradley, Dwight C., Farris, David W., Foley, Nora K., Wandless, GregoryA., The role of ridge subduction in determining the geochemistry and Nd-Sr-Pb isotopic evolution of the Kodiak batholith in Southern Alaska, Tectonophysics (2008), doi: 10.1016/j.tecto.2008.09.029 This is a PDF file of an unedited manuscript that has been accepted for publication. As a service to our customers we are providing this early version of the manuscript. The manuscript will undergo copyediting, typesetting, and review of the resulting proof before it is published in its final form. Please note that during the production process errors may be discovered which could affect the content, and all legal disclaimers that apply to the journal pertain.
-
Upload
independent -
Category
Documents
-
view
0 -
download
0
Transcript of The role of ridge subduction in determining the geochemistry and Nd–Sr–Pb isotopic evolution of...
The role of ridge subduction in determining the geochemistry and Nd-Sr-Pbisotopic evolution of the Kodiak batholith in Southern Alaska
Robert A. Ayuso, Peter J. Haeussler, Dwight C. Bradley, David W. Far-ris, Nora K. Foley, Gregory A. Wandless
PII: S0040-1951(08)00444-7DOI: doi: 10.1016/j.tecto.2008.09.029Reference: TECTO 124337
To appear in: Tectonophysics
Received date: 9 May 2007Revised date: 25 August 2008Accepted date: 10 September 2008
Please cite this article as: Ayuso, Robert A., Haeussler, Peter J., Bradley, Dwight C.,Farris, David W., Foley, Nora K., Wandless, Gregory A., The role of ridge subduction indetermining the geochemistry and Nd-Sr-Pb isotopic evolution of the Kodiak batholithin Southern Alaska, Tectonophysics (2008), doi: 10.1016/j.tecto.2008.09.029
This is a PDF file of an unedited manuscript that has been accepted for publication.As a service to our customers we are providing this early version of the manuscript.The manuscript will undergo copyediting, typesetting, and review of the resulting proofbefore it is published in its final form. Please note that during the production processerrors may be discovered which could affect the content, and all legal disclaimers thatapply to the journal pertain.

ACC
EPTE
D M
ANU
SCR
IPT
ACCEPTED MANUSCRIPT
The role of ridge subduction in determining the geochemistry and Nd-Sr-Pb
isotopic evolution of the Kodiak batholith in Southern Alaska
Robert A. Ayusoa, Peter J. Haeusslerb, Dwight C. Bradleyb,
David W. Farrisc, Nora K. Foleya, and Gregory A. Wandlessa
a, *Mail Stop 954 National Center, U.S. Geological Survey, Reston, VA 20192
b4200 University Drive, U.S. Geological Survey, Anchorage, AK 99508
c Department of Geological Sciences, University of Southern California, Los Angeles, CA 90089
* Corresponding author
E-mail address: [email protected] (R.A. Ayuso)
1
ACC
EPTE
D M
ANU
SCR
IPT
ACCEPTED MANUSCRIPT
Abstract
The Paleocene Kodiak batholith, part of the Sanak-Baranof belt of Tertiary near-trench intrusive
rocks, forms an elongate body (~150 km long) that transects Kodiak Island from SW to NE. The batholith
consists of three zones (Southern, Central, and Northern) of kyanite-, muscovite-, and garnet-bearing
biotite tonalite and granodiorite and less abundant granite that intruded an accretionary prism (Kodiak
Formation, and Ghost Rocks Formation). Small and likely coeval bodies (Northern, Western, and Eastern
satellite groups) of quartz gabbro, diorite, tonalite, granodiorite, and leucogranite flank the batholith. The
batholith is calc-alkalic, has an aluminum saturation index of >1.1, FeOt/(FeOt+MgO) ~0.65 (at SiO2 = 65
wt. %), and increases in SiO2 (~61 wt. %–73 wt. %) and decreases in TiO2 (~0.9 wt. %–0.3 wt. %) from
SW to NE. As a group, the granitic rocks have light REE-enriched chondrite-normalized patterns with
small or no negative Eu anomalies, primitive mantle-normalized negative anomalies for Nb and Ti, and
positive anomalies for Pb. Small to large negative anomalies for Th are also distinctive. The quartz
gabbros and diorites are generally characterized by generally flat to light REE chondrite-normalized
patterns (no Eu anomalies), and mantle-normalized negative anomalies for Nb, Ti, and P. Pb isotopic
compositions (206Pb/204Pb =18.850–18.960; 207Pb/204Pb =15.575–15.694; 208Pb/204Pb = 38.350–39.039) are
intermediate between depleted mantle and average continental crust. The Southern zone and a portion of
the Central zone are characterized by negative εNd values of -3.7 to -0.3 and TDM ages ranging from ~ 838
Ma to 1011 Ma. Other granitic rocks from the Central and Northern zones have higher εNd values of -0.4
to +4.7 and younger TDM ages of ~ 450 to 797 Ma. Granitic and mafic plutons from the Eastern satellites
show a wide range of εNd values of -2.7 to +6.4, and TDM ages from 204 Ma to 2124 Ma. 87Sr/86Sr values
of the Southern and Central zones overlap and tend to be slightly more radiogenic (87Sr/86Sr >0.70426)
than the Northern zone (87Sr/86Sr <0.70472). 206Pb/204Pb values increase slightly from the Southern and
Central zones toward the Northern zone. There is no clear correlation of the major or trace elements with
εNd, Pb or Sr isotopic values. Kodiak Formation and the Ghost Rocks Formation overlap the isotopic
compositions (e.g., 206Pb/204Pb = 18.978 to 19.165, 87Sr/86Sr of 0.705715 to 0.707118, and εNd of -6.7 to -
2

ACC
EPTE
D M
ANU
SCR
IPT
ACCEPTED MANUSCRIPT
1.5 at 59 Ma) and TDM values (959 to 1489 Ma) of the batholith. Production of large volumes of granitic
rocks in the Sanak-Baranof belt, and particularly on Kodiak Island, reflects a sequence of processes that
includes underplating of mantle-derived mafic (possibly from the mantle wedge) and intermediate rocks
under the accretionary flysch, interlayering of mantle-derived and flyschoid rocks, and partial melting of
the mixed lithologic assemblages. Limited degrees of fractional crystallization or assimilation and
fractional crystallization influenced compositions of the granitic rocks. The contribution of mantle-
derived rocks that resided in the accretionary prism for only a short period of time prior to partial melting
likely exceeds 40% (up to 80%). The balance (60 to 20%) is from a recently recycled crustal component
represented by the Kodiak Formation. This type of progressive intracrustal melting from mixed sources
controlled the geochemical character of the batholith and is most consistent with the hypothesis that the
granitic rocks are associated with a slab-window produced by collision of a spreading oceanic center and
a subduction zone and migration beneath the accretionary prism.
Keywords: Kodiak Batholith; Alaska; Geochemistry; Radiogenic Isotopes; Origin; Ridge Subduction,
Slab Window
1. Introduction
The Paleocene Kodiak batholith (located on Kodiak Island) is part of a plutonic belt of near-
trench intrusions of gabbro, tonalite, granodiorite, and granite, which occur within rocks of the latest
Cretaceous to Eocene composite accretionary prism of the Gulf of Alaska (Fig. 1). The belt is termed the
Sanak-Baranof plutonic belt (Hudson et al., 1979), lies landward of the modern Aleutian Trench (Aleutian
Megathrust) and in the forearc of the modern Aleutian oceanic island arc. It extends for about 2100 km
from Sanak Island in the eastern Aleutian Islands to Baranof Island in southeast Alaska (Bradley et al.,
2003). On Kodiak Island in the western part of the Gulf of Alaska, the accretionary prism consists
dominantly of Late Cretaceous flysch and argillite such as the Kodiak Formation and Ghost Rocks
Formation. The accretionary sequence has been referred to as the Chugach-Prince William composite
3

ACC
EPTE
D M
ANU
SCR
IPT
ACCEPTED MANUSCRIPT
terrane in Alaska (Jones et al., 1987), one of several terranes that accreted to North America in latest
Cretaceous to, perhaps, Paleocene (Hill et al., 1981; Moore et al., 1983; Plafker et al., 1977; 1989).
Silicic plutonism intruding the accretionary prism had been thought to reflect distinct pulses of
magmatism occurring during the last stages of accretion (Hill et al., 1981; J.C. Moore referenced in
Barker et al. 1992). Recent studies of the geological signature of early Tertiary ridge subduction in
Alaska, however, emphasize continuous, rather episodic age progression from 61 to 50 Ma of the near-
trench intrusive rocks of the Sanak-Baranof belt from western Alaska to Baranof Island (e.g., Bradley et
al., 1993, 2003; Haeussler et al., 2003a, b). More importantly, there is a growing consensus that ridge-
subduction best explains the age distribution, origin, and location of near-trench plutons along the Sanak-
Baranof belt (e.g., Kusky et al., 2003, Sisson et al., 2003a, b, and references therein) even though
occurrence of such plutons in the accretionary prism in a forearc setting is atypical when compared to
classic plutonic distributions from orogenic, continental margin arcs. Moreover, in Alaska, an origin for
the plutonic rocks as a result of ridge subduction is also thought to be consistent with other distinctive
features found in the accretionary prism, such as its evolution in a high-T and low-P metamorphic
environment (Sisson et al., 1989), its unique set of structural features (Pavlis and Sisson, 1995), and
association with gold mineralization (Haeussler et al., 1995; 2003a).
The origin of the granitic magmas within the Kodiak batholith (Fig. 1) is considered in this paper
on the basis of petrography, major and trace element variations, and Nd-Sr-Pb isotopic evolution. The
geochemical results in this study provide insights into possible sources and processes that contributed to
formation of the granitic magmas, and present key geochemical fingerprints for regional comparison of
the granite sources along the Sanak-Baranof plutonic belt. We highlight geochemical features and the
crustal evolution of the accretionary wedge hosting granitic magmas thought to have been produced by
migration of the triple junction and during ridge subduction (see Bradley et al., 1993, 2003; Sisson et al.,
2003a, b). However, because the identity of the tectonic plates along the Pacific rim of Alaska during the
Late Cretaceous to the Eocene is not well established (see Bradley et al., 2003; Haeussler, et al., 2003b
for summaries), it is difficult to conclusively attribute the origin of near-trench magmatism in southern
4

ACC
EPTE
D M
ANU
SCR
IPT
ACCEPTED MANUSCRIPT
Alaska to a specific plate. Page and Engerbretson (1984) suggested two possible end-member locations
for the trench-ridge-trench triple junction involving the Kula-Farallon plate in the Late Cretaceous to
early Tertiary: a northern location in the state of Washington, and a southern location in Mexico. Neither
of these locations would explain near-trench magmatism in southern Alaska thought to have been
associated with ridge subduction. Others have proposed that intersection of the Kula-Farallon Ridge with
the southern Alaska margin (e.g., Sisson et al., 1989; 2003a; Pavlis and Sisson, 1995, and references
therein) explains the near-trench intrusions and the high temperature and low pressure metamorphism in
the accretionary wedge. Intersection of the Kula-Farallon Ridge with the continental margin of the states
of Washington, Oregon, and southern Vancouver Island in British Columbia has also been invoked to
explain the origin of oceanic basalt basement in the Coast Ranges (e.g., Engebretson et al., 1985;
Thorkelson and Taylor, 1989, and references therein).
Recent work by Haeussler et al. (2003b) noted that a single trench-ridge-trench triple junction
cannot explain simultaneous near-trench magmatism from areas separated by > 4000 km. To explain the
coeval near-trench magmatism from such widely separated areas, two contemporaneous slab windows
associated with trench-ridge-trench triple junctions were proposed. As a consequence of this argument,
another oceanic plate in the Pacific Basin in Paleocene-Eocene time was identified—the Resurrection
plate, which is bound by two trench-ridge-trench triple junctions (Haeussler et al., 2003b). In this view,
the western boundary of the Resurrection plate was located east of the Kula plate, and the southern
boundary was located north of the Farallon plate. The northern trench-ridge-trench triple junction of the
Resurrection plate intersected the southern Alaskan margin and migrated from west-to-east along a 2100
km-long coastal trend. Migration of this slab window was responsible for the Sanak-Baranof near-trench
intrusives that were generated from 61 to 50 Ma, which include the Kodiak batholith at about 58 Ma. The
southern ridge bounding the Resurrection plate intersected the continental margin of the states of
Washington and Oregon, and also southern Vancouver Island in British Columbia. Magmatism in
Washington, Oregon, and southern Vancouver Island is about 50 Ma old, and exhibits no clear record of
age progression that can be linked to migration of the triple junction. Haeussler et al. (2003b) suggest that
5

ACC
EPTE
D M
ANU
SCR
IPT
ACCEPTED MANUSCRIPT
the southern ridge was subducted sub-parallel to the continental margin and that the 50 Ma magmatic
event marks the disappearance of the Resurrection plate.
2. Geologic Setting
The granitic rocks of the Kodiak batholith have been the focus of several geochemical studies
(Hill et al., 1981; Moore et al., 1983). Only recently has a large portion of the batholith been examined in
detail, however, to establish relevant ages, structural relations, and emplacement processes (Farris et al.,
2006). The main mass of the batholith forms a narrow, irregular, interior belt on Kodiak Island,
subparallel to the modern trench as well as the regional structural grain (Fig. 1). The granitic plutons
intrude the Late Cretaceous Kodiak Formation (predominant host), which is flanked by pre-Late
Cretaceous units to the north and northwest, and by the Paleocene Ghost Rocks Formation to the south
and southeast.
2.1 The Chugach-Prince William Accretionary Prism
The Chugach-Prince William accretionary prism consists of belts of accreted ocean floor rocks
that extend for more than 2000 km along the southern margin of Alaska and are younger in a seaward
direction. A review of the geological history of these belts by Bradley et al. (2003, and references therein)
is summarized below. The belts differ in age and grade of metamorphism. The most landward belt
consists of Early Jurassic high pressure metamorphic rocks (Dusel-Bacon et al., 1993). Seaward from this
belt is an argillite-matrix mélange consisting of Triassic to Middle Cretaceous chert and basalt,
greywacke, and limestone intruded by small near-trench plutons, dikes, and a few Triassic-Jurassic
ultramafic-mafic complexes (Bradley and Kusky, 1992, and references therein). The next seaward belt is
characterized by Upper Cretaceous flysch (assigned to the Shumagin Formation, Kodiak Formation, and
Valdez Group, among others), which was particularly affected by relatively high temperature and low
pressure metamorphism. This belt also contains the largest near-trench plutons, which include the Kodiak
batholith. The plutons intruded the prism soon after it had been affected by penetrative deformation and
6
ACC
EPTE
D M
ANU
SCR
IPT
ACCEPTED MANUSCRIPT
regional metamorphism during and shortly after subduction-accretion in the Jurassic to Paleocene time
(Dusel-Bacon et al., 1993). Outboard of the Upper Cretaceous flysch belt, which contain the Ghost Rocks
Formation and Orca Group, there are other belts of flysch (e.g., Moore et al., 1983, and references
therein), and mafic and ultramafic rocks thought to have formed near the trench-ridge-trench triple
junction (Bradley et al., 2003). Younger turbidites (Eocene Sitkalidak Formation and the outboard part of
the Orca Group) were deposited and accreted after near-trench magmatism.
Sample and Reid (2003) provided a review of the evolution of the Chugach flysch terrane focused
on the possible sources of the Kodiak Formation, which is the portion of the Chugach flysch closely
associated with the genesis of the Kodiak batholith. The results constrain the tectonic origin of the terrane
to latest Cretaceous time. Structural features of the Chugach flysch are thought to reflect underplating at
a subduction zone (Plaker et al., 1977; Sample and Fisher, 1986; Sample and Moore, 1987; Fisher and
Byrne, 1987), but there is controversy over where this subduction-accretion actually occurred. Detailed
analysis of sandstone petrography, paleocurrent current and lithofacies information, and Nd isotopic
analyses of the Kodiak Formation on Kodiak Island and vicinity by Sample and Reid (2003) indicated
rapid deposition of the flysch in an area flanking an uplifting orogen. Moreover, the petrographic and
isotopic data indicate that the Chugach flysch was deposited and accreted near its source along a
convergent margin in latest Cretaceous time (adjacent to the Coast Mountains belt of British Columbia)
and, subsequently, transported by dextral shear to its current location.
Country rocks: Kodiak Formation and Ghost Rocks Formation
The Kodiak Formation is dominantly a turbidite sequence (at least 3-5 km thick) consisting of
deep-water sandstone-shale and nearly massive shale units cross-cut by shear zones (Nilsen and Moore,
1978) and by quartz veins (Vrolijk et al., 1988). Detailed descriptions of the Kodiak Formation are also
given by Sample and Fisher (1986), Fisher and Byrne (1987), and Sample and Reid (2003). Regional
grades of metamorphism are generally low, with maximum temperatures at about 200-250° C and
pressures at 2-3 kbar (Sample and Moore, 1987). After deposition, the Kodiak Formation was subducted
7

ACC
EPTE
D M
ANU
SCR
IPT
ACCEPTED MANUSCRIPT
(underplated) and became part of the accretionary prism (e.g., Nilsen and Moore, 1979; Fisher and Byrne,
1987; Sample and Moore, 1987). The metamorphic conditions were sufficient to transform shale-rich
beds of the Kodiak Formation to argillites, but the greywacke-rich sections remained generally unaffected
(Farris et al., 2006). Descriptions of the Ghost Rocks Formation are reported by Moore et al. (1983). The
unit consists of deformed sandstone- and argillite-rich sedimentary units interbedded with a mafic
plutonic-volcanic cycle of island-arc tholeiites and calc-alkaline andesites. These mafic igneous rocks
flank the main mass of the granitic Kodiak batholith to the east (present-day trenchward), and may be
coeval. Small igneous bodies, unconnected to the main mass of the Kodiak batholith at the surface, also
intrude the Kodiak Formation to the west (present-day landward).
3. Petrography, Field, and Age Relations of the Kodiak Batholith
3.1 General Statement
The Kodiak batholith covers greater than 700 km2 in surface exposure. It is roughly 150 km in
length and has a generally northeasterly trend on the interior of Kodiak Island. The batholith is
dominantly composed of intermediate felsic rocks. Zircon from six samples (tonalite and granodiorite)
selected from near the axis of the batholith (Fig. 1) and dated by the U-Pb method (thermal ionization
mass spectrometry) indicate a northeastward decreasing age trend, from 59.2±0.2 Ma at the southwest end
to 58.4±0.2 Ma at the northeast tip (Farris et al., 2006). Discrete granodiorite-granite bodies outcropping
to the north, generally along strike of the main mass of the batholith, are termed the Northern satellite
group. Flanking the main body of the batholith are discontinuous belts of smaller granitic and mafic
plutons, dikes, and volcanic rocks forming discontinuous belts (called Western and Eastern satellite
groups). K-Ar dating of biotite from plutons in the Eastern satellite group indicate ages of ~ 63-62 Ma
(Moore et al., 1983), and although this group could be related to the Kodiak batholith, the relatively
imprecise ages preclude conclusively linking all of the granitic rocks.
The Kodiak batholith ranges from biotite-, muscovite-, and garnet-bearing tonalite to granodiorite
(Ayuso et al., 2005). It is easily recognizable in the field because of a relatively wide range in the
8
ACC
EPTE
D M
ANU
SCR
IPT
ACCEPTED MANUSCRIPT
abundance of biotite, lack of amphibole, and distinctively zoned kyanite megacrysts. Mafic minerals
(biotite, titano-magnetite, and accessory minerals) in the main body of the batholith account for up to 25%
of the mode. Muscovite is locally very abundant. Typical field features include numerous country rock
xenoliths ranging from meters to millimeters, varying in extent of mechanical disaggregation and reaction
from discrete mineralogic (biotite-rich) bands to widely dispersed, remnant coarse clusters of biotite
closely associated with fine-grained garnet. Other features in the batholith include scarcity of mafic
enclaves, no petrographic evidence for reaction with a mafic magma and no field evidence (e.g. no large
volumes of gabbro or diorite, abundant mafic enclaves, mafic dikes, etc.) for reaction with a mafic
magma. Also notable are the scarcity of aplites, pegmatites, and miarolitic cavities.
The Kodiak batholith has not been mapped in detail, but existing field and petrographic
information indicate several internal zones according to general petrographic variations along a trend
from SW to NE (Fig. 1). Internal igneous contacts that would distinguish individual plutons within the
zones have not been found. Characterization of the batholith using such regional variations is provided
below, in a trend from the Southern zone, to the Central and Northern zones (Fig. 1). Here we give a
brief description of the Northern, Western and Eastern satellite groups.
3.2 Southern Zone of the Kodiak Batholith
Reconaissance examination of the batholith from southwest to northeast indicates that variations
are predominantly from tonalite to granodiorite (Fig. 2). In the Southern zone, the biotite-rich rocks are
medium grained, muscovite- and garnet-bearing, and phenocryst-poor (plagioclase mega-phenocrysts
<3%, up to ~1.5 cm in length). Textures are mostly hypidiomorphic-granular (equigranular and granitic).
Plagioclase is generally free of inclusions, but may enclose an internal K-feldspar-rich zone or be rimmed
by K-feldspar. The core of plagioclase can include a highly altered (fine-grained muscovite and epidote)
euhedral zone that also contains euhedral biotite. This is consistent with plagioclase and biotite co-
precipitation. Electron microprobe analyses indicate that most cores of plagioclase in the batholith range
from An60 to An20 (R. Ayuso, unpublished data). The majority of K-feldspars are unzoned (no albitic
9

ACC
EPTE
D M
ANU
SCR
IPT
ACCEPTED MANUSCRIPT
rims). Euhedral biotite occurs in all zones of the batholith, but may be more abundant in the Southern
zone. In some rocks, biotite adjacent to quartz, feldspar, and garnet displays feathery, lobate reaction
rims. However, biotite also encloses subhedral to euhedral garnet. Sparse, blue-green subhedral to
euhedral aluminosilicate xenocrysts (<1 cm) display fine-grained muscovite and chlorite reaction rims
and are intergrown with biotite. Fine-grained kyanite is also disseminated in the matrix, and, sheaves of
very fine-grained fibrolite (?) are found as inclusions in clusters of biotite and quartz. Euhedral to
subhedral fine-grained garnet (< 3 mm) is distributed in biotite clusters and in the matrix. Accessory
minerals are zircon, apatite, titanomagnetite, monazite, and very rare pyrite. Most rocks contain
aggregates of epidote, chlorite, and opaque oxides replacing biotite. Rare myrmekitic rims on feldspars
occur in this zone. Xenoliths of the Kodiak Formation, in parts as virtually unreacted slabs are distributed
and show various stages of mechanical disaggregation and limited chemical reaction in the granitic
matrix.
3.3 Central Zone of the Kodiak Batholith
Rocks of the Central zone do not differ greatly from the Southern zone (Fig. 2), except that they
have the highest content of mafic minerals for the batholith as a whole. In some cases the biotite-rich
tonalites are composed of a finer-grained matrix of quartz and feldspar (~1mm), larger clusters of
pseudohexagonal biotite (~1 cm) and somewhat more abundant fine-grained garnet. Fine-grained
euhedral to subhedral garnet (< 3 mm) is disseminated in the matrix, as well as surrounded by and
interleaved with, biotite and quartz. Sparse euhedral quartz microphenocrysts (~3mm), and small clusters
of muscovite are also found. Most rocks are hypidiomorphic-granular and contain distinctly interleaved
mixtures of biotite and epidote, and small, very fine-grained brecciated pods and clusters. Kyanite
xenocrysts are more abundant toward the northeast end of the batholith. Locally, the granitic rocks
contain abundant xenoliths of Kodiak Formation (up to 0.75 m) armored by narrow reaction rims, and
also contain quartz-rich pods, and small fibrolitic (?) clusters surrounded by reaction rims.
10

ACC
EPTE
D M
ANU
SCR
IPT
ACCEPTED MANUSCRIPT
3.4 Northern Zone of the Kodiak Batholith
The Northern zone (Fig. 2) is highly fractured, locally contains abundant country-rock inclusions,
including stoped blocks (up to ~1 m) and rafts (up to ~30 m?), and some aplite dikes (most <10 cm).
Coarse quartz agglomerations and nodules, coarse thick books of hexagonal brown biotite, and composite
nodules of aluminosilicate minerals, quartz, and muscovite are also found. Anhedral biotite precipitated
late, occupying irregular spaces in the granitic matrix. Fine-grained subhedral to euhedral garnet is
common, particularly associated with clusters of biotite (with quartz and feldspar).
The Northern zone rocks are fine to medium grained and vary from biotite-rich (>20%) to biotite
poor (<5%) at the scale of outcrops. Mechanical disaggregation of country-rock inclusions is common.
As a group, the rocks have relatively high contents of K-feldspar (Fig. 2). Biotite granodiorites contain
sparse garnet and muscovite and textures vary from medium grained, hypidiomorphic granular to seriate.
In a few cases, biotite foliation (~N70ºE, steeply dipping N) parallels the axis of the batholith.
Plagioclase phenocrysts (up to ~1 cm) and clusters of quartz (~1 cm) are more common than in rocks to
the south, as are the quartz pods (up to ~10cm) enveloped by reaction bands. K-feldspar forms a fine-
grained, anhedral, interstitial, interconnecting network. Color index is high where mechanical
disaggregation and hybridization are prevalent, but generally lower than that of rocks to the south.
Combinations of xenocrystic kyanite, garnet, muscovite, K-feldspar, and quartz form small agglomerates
in the matrix. Small pods of dominant poikilitic fine-grained K-feldspar intergrown with plagioclase and
quartz may represent residual melts.
3.5 Satellite Groups Adjacent to the Kodiak Batholith
The tonalite-granodiorite plutons of the Western satellite group intruded the Kodiak Formation
and closely resemble the granodioritic rocks of the Northern zone. In general, granitic rocks of the
Northern and the Eastern satellite groups are muscovite-bearing, hypidiomorphic to aplitic, porphyritic to
granular leucotonalites (Fig. 2). Plagioclase and K-feldspar mega-phenocrysts (< 5 mm) may be common.
The rocks generally have low biotite abundance (<1%), and a remarkable network of interlocking, fine-
11
ACC
EPTE
D M
ANU
SCR
IPT
ACCEPTED MANUSCRIPT
grained anhedral K-feldspar and rare garnet. Biotite can be found as part of fine-grained clusters with
garnet and quartz, and as fine grained inclusions in plagioclase cores. Thin aplitic dikes (<10 cm) and
muscovite are locally abundant, particularly near the margins of the bodies.
Part of the Eastern satellite group consists of granodioritic to gabbroic plutons (Fig. 1) that
intruded the Ghost Rocks Formation near or on the Contact fault about 30 km east of the main mass of the
batholith. Volumetrically minor pillow basalts and dikes may also be part of the igneous sequence. The
mafic rocks range from fine to medium grained (pillow basalt) to very coarse grained (quartz diorite and
quartz gabbro). Other Eastern satellite bodies are small granodioritic to dioritic bodies that intruded the
Kodiak Formation west of the Contact fault, about 5-20 kilometers from the Central zone of the batholith.
The felsic rocks from the Eastern satellites are similar to the granular, medium grained, biotite-rich
tonalitic rocks in the Central zone of the batholith. Garnet and muscovite are not abundant. A few small
miarolitic cavities (with quartz and tourmaline) were found in the more felsic rocks. The medium-grained
leucogranite is muscovite-bearing and K-feldspar rich. Although the plutons from the Eastern and
Western satellites are possibly cogenetic and part of the Kodiak batholith on the basis of field and
petrographic similarities, age and geochemical information are not sufficient to link all of these plutonic
rocks.
4. Analytical Methods
Representative whole-rock samples were collected from all rock types, and from all exposed parts
of the pluton. A total of 60 samples were analyzed for major and trace elements (Tables 1-4). Analytical
techniques included X-ray fluorescence, instrumental neutron activation, inductively coupled plasma-
atomic emission spectrometry, and classical wet-chemistry methods. Most of the samples were analyzed
by Activation Laboratories Ltd., Ancaster, Ontario by multiple techniques. International rock standards
were used to monitor data accuracy and details are available from Activation Laboratories Ltd. Many
elements were analyzed in duplicate in order to select the most precise data available. A subset of these
12
ACC
EPTE
D M
ANU
SCR
IPT
ACCEPTED MANUSCRIPT
whole-rock samples (n = 42) was analyzed for Nd, Sr, and Pb isotopic compositions (Tables 5-6) using a
multicollector, automated Finnigan-MAT 262 mass spectrometer at the U.S. Geological Survey, Reston,
VA. Detailed analytical techniques for Pb, Nd, and Sr isotopes are given in Ayuso et al. (2005), and
Ayuso and Schulz (2003). Long-term reproducibility of the Nd isotopic work was monitored using the La
Jolla standard: average value of 143Nd/144Nd = 0.511845±5 (n = 35); for the Sr isotopic analyses, SRM
987 yielded an average value of 87Sr/86Sr = 0.710245 ±5 (n = 29). Pb isotopic ratios of the whole rocks
were corrected for mass fractionation by about 0.12% amu-1 according to replicate measurements of NBS
981 (n = 25). Total blanks during the course of this study were <20 pg for Nd, <50 pg for Sr, and < 50 pg
for Pb; thus they are insignificant relative to the Nd, Sr, and Pb abundances. Depleted mantle model ages
were calculated as in the model of DePaolo (1981). The average crustal Pb evolution curve is from
Stacey and Kramers (1975).
5. Results
5.1 Kodiak batholith: Major Elements
Samples of the Kodiak batholith lie in the medium-K (calc-alkaline series) field of the K2O vs.
SiO2 and the total alkalies vs. SiO2 diagrams (e.g., Na2O+K2O < 6 wt. % and K2O <3 wt.% for SiO2 = 66
wt. %; Table 1, Fig. 3). Granitic rocks also plot along the calc-alkaline trend on a Na-Ca-K diagram (not
shown) and distinguish the zonal variations within the batholith (particularly the Southern and Central
zones as a group in comparison with the Northern zone). The AFM plot (Na2O+K2O-Fe2O3-MgO) (not
shown) also indicates that the granitic rocks dominantly follow a calc-alkaline differentiation trend and
become less alkalic (less sodic) in a trend from the Northern satellite group to the Northern zone, Central
zone, and Southern zone. A general trend of FeOtotal depletion characterizes the batholith, but some of the
granitic rocks from the Central zone, and mafic rocks from the Eastern satellites (basalt to dacite: SiO2
~46-66 wt.%) overlap the tholeiitic field. The degree of FeOtotal/MgO enrichment as a function of SiO2
(Arculus, 2003) shows that the majority of the rocks belong to a low-Fe suite. Granitic rocks from the
main mass of the batholith are compositionally distinct, plotting as a field shifted from the mafic rocks
13

ACC
EPTE
D M
ANU
SCR
IPT
ACCEPTED MANUSCRIPT
from the Eastern satellite group, and showing compositional gaps compared to the leucogranites from the
adjacent satellite bodies. The granitic rocks lie in the peraluminous to strongly peraluminous fields
(alumina saturation index, ASI= molecular [Al2O3/K2O+Na2O+CaO]), and show a wide range of ASI
(1.08–1.37). Most have ASI values higher than 1.1 (Fig. 3). For the batholith as a whole, values of ASI
do not increase consistently with silica content. The Southern and Central zones have generally higher
values of Al/(Na+K) (~1.6–2.3) than the Northern zone, and Western and Northern satellites (1.2–1.8).
Granitic rocks from the Eastern satellites are also more diverse and more aluminous (ASI ~1.46) than the
main mass of the batholith. In contrast, mafic igneous rocks in the Eastern satellites are metaluminous
[Al/(Ca+Na+K) ~0.7–0.9].
Major element compositions are plotted against SiO2 in Figure 4. Variation diagrams illustrate
inverse correlations of abundances of several oxides (e.g., Fe2O3, MgO, CaO, TiO2, and MnO) with
increasing SiO2. Figure 4 shows that the tonalitic to granitic rocks from the Southern, Central, and
Northern zones span a wide range in SiO2 (57.31–72.02%), have high Al2O3 (13.97–18.23%), low to
moderate iron (total iron as Fe2O3: 0.79–7.57%), as well as TiO2 (0.20–0.94%), P2O5 (0.13–0.25%), MgO
(0.60–4.65%), and CaO (1.98–6.02%) contents (Table 1). These rocks also have generally high Na2O
(2.71–4.27%), and moderate K2O (1.19–3.13%) so that the average value of Na2O/K2O is ~1.39 and
Na2O/(Na2O+K2O) > 0.5. Thus, the batholith is largely sodic and the Southern and Central zones
constitute a compositional group, distinct from the Northern zone, which is grouped with the Northern
and Western satellites. Plutonic rocks of the Northern (SiO2: 70.89–75.75%), Eastern (SiO2: 54.21–
67.34%, one silicifed sample at 80.41%, intruding the Kodiak Formation; SiO2: 45.92–66.01%, intruding
the Ghost Rocks Formation), and Western satellites (SiO2: 68.05–69.16%) indicate compositional
contrasts. The granitic satellite rocks have less TiO2, Fe2O3, MgO, and CaO, somewhat lower Al2O3 and
higher SiO2 and alkali element contents than granitic rocks from the Northern, Central, and Southern
zones. In the Eastern satellite group, volumetrically minor quartz gabbro and diorite contain higher CaO
and ferromagnesian elements than the batholith (Table 1).
14

ACC
EPTE
D M
ANU
SCR
IPT
ACCEPTED MANUSCRIPT
5.2 Kodiak batholith: Minor and Trace Elements
Minor and trace element variations discussed below also show that granitic rocks from the
Southern, Central, and Northern zones of the Kodiak batholith, as well as from the satellite groups, have
overlapping trends. In some cases, the plutons from the Eastern satellites, and Northern satellites occupy
distinct compositional fields (Fig. 5). Minor and trace element abundances plotted in multi-element (Fig.
6; primitive mantle-normalized, Sun and McDonough, 1989) and rare-earth element (REE) chondrite-
normalized diagrams illustrate remarkable compositional homogeneity within each zone (Fig. 7), and
especially in the granodiorites and tonalites of the Southern zone. The granitic rocks are enriched in
large-ion lithophile elements (Ba, Rb, K, Cs, and Sr), other fluid-soluble elements (e.g., U, Pb, etc.,
Tatsumi et al., 1986) and light REEs (Fig. 6) compared to N-MORB. Such distinct trace element
distributions result in high values of ratios involving the large-ion lithophile (LIL) elements relative to the
high field strength elements (Nb, Ta, Zr, Hf, Ti) and Th (HFS). Commonly, these high values of LIL/HFS
elements are taken as characteristic of volcanic arc signatures (Davidson, 1996).
The ferromagnesian elements (Sc, Cr, Co, Ni, and Zn) together with V and Ge generally decrease
in abundance relative to SiO2, consistent with compatible element behavior during evolution of the
granitic magmas (Table 2; Fig. 5). Sc and V abundances are diagnostic, and the Southern and Central
zones have higher abundances of these metals (Sc~12-25 ppm, V~51-139 ppm, respectively) than the
Northern zone and Northern satellite group (~2-14 ppm, ~13-61 ppm) (Table 2). Evidence for significant
hydrothermal alteration and sulfide mineral deposition associated with the granitic rocks has not been
found. Most samples contain low abundances of Cu (up to ~50 ppm), Pb (up to ~40 ppm, one sample at
~70 ppm), Mo (up to ~6 ppm), Sn (up to ~5 ppm), and W (up to ~2 ppm). The batholith, moreover, is
not enriched in Li, Be, B, and P, elements whose contents are known to be enhanced in rocks associated
with granite-related mineralization.
For every zone in the batholith, the multielement diagrams show a relatively tight bundle of lines
characterized by spiked patterns, small to large troughs for Th, large to moderate troughs for Nb and Ti,
15

ACC
EPTE
D M
ANU
SCR
IPT
ACCEPTED MANUSCRIPT
and large spikes for Pb (Fig. 6). The positive Pb anomaly is somewhat larger in the leucogranites of the
Northern zone. Also, although some scatter is evident for Ti, the heavy rare-earth elements and Y, the
deepest troughs for these elements are in the Northern satellites (Fig. 6-7). Granitic rocks of the Western
satellites resemble rocks of the Northern zone (Fig. 6). The Eastern satellite group shows no trend (Fig.
6).
The mantle-normalized diagrams for the granodioritic to tonalitic rocks show troughs for Nb and
Ti that could be attributed to the effects of fractionation of titanomagnetite, ilmenite, and titanite during
magma evolution and transport, or to the effects of such minerals remaining as residues after partial
melting of the source rocks. Depletions and wide variations in the abundances of Nb, Ta and Th (2.98-
9.58 ppm, 0.39-1.26 ppm, 1.23-8.12 ppm, respectively) are also key features of the Kodiak batholith that
result in highly variable ratios of incompatible elements such as Nb/Ta = 2.59-19.21, Th/U = 0.38-4.16,
and Th/Hf = 0.7-2.7 (Table 2). Such ratios, again, distinguish the different zones of the batholith, vary
widely over very narrow ranges of silica or other indices of differentiation, and plot as broad bands
instead of lines, even within individual zones. Notably, plots involving incompatible and compatible
minor elements, for example, Th/Ta vs. TiO2 (Fig. 8), highlight the zonal distinction within the batholith
(Southern and Central zones as a group: Th/Ta = 5-14, TiO2 = 0.5-0.9%; Northern zone: Th/Ta = 4-18,
TiO2 = 0.2-0.6%) and the broad variability within individual zones.
Small troughs for Rb, Sr, and P may also be evident in multielement plots of a few of the felsic
rocks, and, these troughs likely reflect fractionation of feldspars and apatite. Generally, the troughs are
deeper in the granodioritic and granitic rocks than in the tonalitic rocks (Fig. 6). The plots show moderate
abundances for lithophile elements Rb, Sr and Ba (31-124 ppm, 35-261 ppm, 394-1100 ppm,
respectively) and relatively enriched contents of Pb (2-72 ppm) in many granitic rocks. Moreover,
abundances of Rb, Sr and Ba do not change methodically with increasing SiO2 (Fig. 4) but show offsets
and gaps separating the fields of granitic rocks of the combined Southern and Central zones (Rb = 41.3-
92.8 ppm, Sr = 158.9-258.7 ppm, Rb/Sr ~0.2-0.6 at SiO2 ~57-65%), from the Northern zone (Rb = 56.4-
102.7 ppm, Sr = 159.7-261.5 ppm, Rb/Sr ~0.2-0.6, at SiO2 ~ 64-72%) (Table 2). Granitic rocks from the
16

ACC
EPTE
D M
ANU
SCR
IPT
ACCEPTED MANUSCRIPT
Northern and Western satellites are also distinct from the main mass, and in the case of the Northern
satellites, they are characteristically enriched in Rb and depleted in Sr (Rb/Sr ~ 0.6-3.7, and SiO2 ~ 74-
76%).
Rare-earth element chondrite-normalized patterns show that as a group the Kodiak batholith is
characterized by moderately steep light REEs and by gently sloping to flat heavy REEs (Fig. 7). Within
individual zones in the batholith, REE patterns are generally coincident. Variations in the total abundance
of REEs and silica uniquely distinguish the different zones (Southern and Central zones from the
Northern zone). The most distinctive patterns are in the leucogranites from the Northern satellites which
tend to have large negative Eu anomalies and are the most silicic (Fig. 7). The leucogranites also have
generally lower total REE contents (~30 ppm) than the tonalitic and granitic rocks from the main zones of
the batholith (~50-150 ppm). Quartz gabbro and diorite from the Eastern satellite group (intruding the
Ghost Rocks Formation) have higher total REE (~50-110 ppm; Table 2; Fig. 7) abundances with
increasing silica. Granitic rocks in this group, however, show no predictable trend. Values of CeN/YbN
vary from ~5-10 for the Southern and Central zones, and from ~7-11 for the Northern zone. Most granitic
rocks have small to moderate Eu negative anomalies (Eu/Eu* ~ 0.45-1.0) but a few have small positive
Eu anomalies. The negative Eu anomalies are deeper (Eu/Eu* ~ 0.15-0.40) in the most felsic rocks from
the Northern satellites, which also contain the lowest contents of Sr (and a narrow range of SiO2 = 70.89-
75.75%). Both features (Eu and Sr) are consistent with the effects of residual plagioclase. These felsic
rocks are also characterized by lower abundances and flatter slopes of the light REEs and depletion in the
heavy REEs compared to main batholith (GdN/YbN = 1.24-6.31, YbN ~ 1-5 in the satellite bodies, and
GdN/YbN = 1.07-2.06, YbN ~ 6-15 in the main batholith zones). Granitic rocks of the Eastern satellite
group in the Kodiak Formation have widely variable REE patterns, from flat (sample 01PH107B) to
gently sloping (Fig. 7). These rocks also have moderate negative Eu anomalies and include a silica-rich
sample with an U-shaped REE pattern associated with a moderate positive Eu anomaly (01PH107B).
Granitic rocks from the Western satellite group overlap the compositions of tonalite and granodiorite in
the main batholith (Fig. 7).
17
ACC
EPTE
D M
ANU
SCR
IPT
ACCEPTED MANUSCRIPT
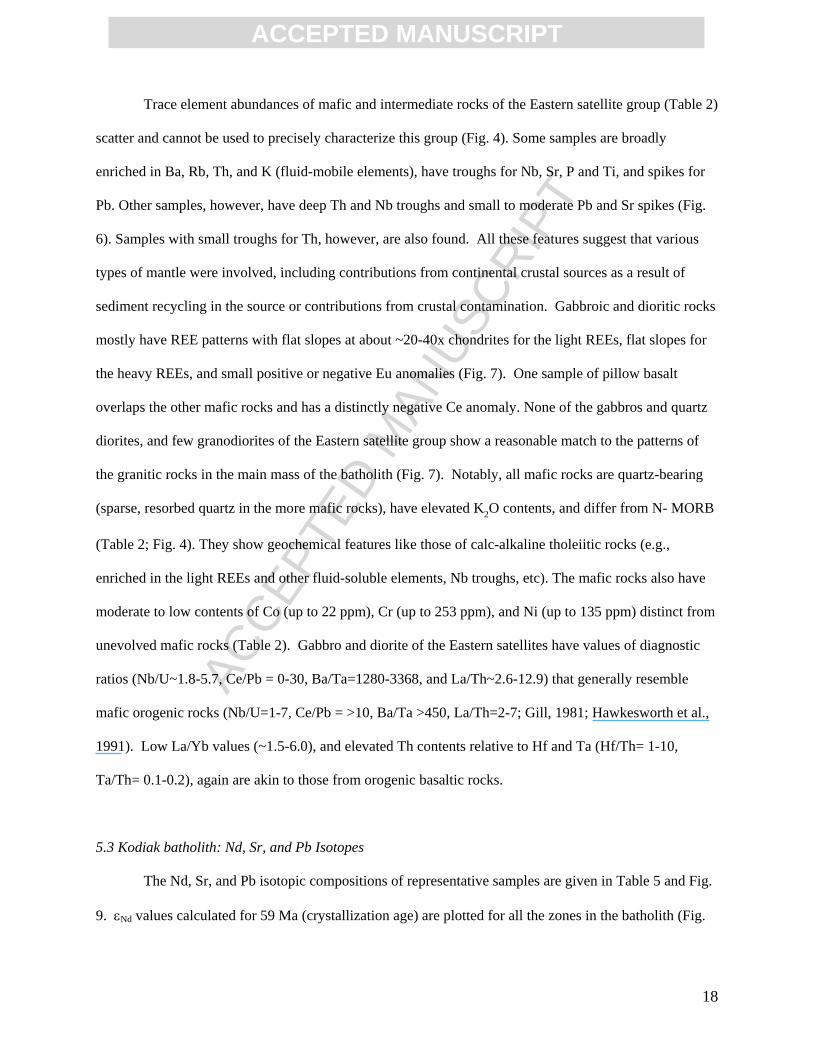
Trace element abundances of mafic and intermediate rocks of the Eastern satellite group (Table 2)
scatter and cannot be used to precisely characterize this group (Fig. 4). Some samples are broadly
enriched in Ba, Rb, Th, and K (fluid-mobile elements), have troughs for Nb, Sr, P and Ti, and spikes for
Pb. Other samples, however, have deep Th and Nb troughs and small to moderate Pb and Sr spikes (Fig.
6). Samples with small troughs for Th, however, are also found. All these features suggest that various
types of mantle were involved, including contributions from continental crustal sources as a result of
sediment recycling in the source or contributions from crustal contamination. Gabbroic and dioritic rocks
mostly have REE patterns with flat slopes at about ~20-40x chondrites for the light REEs, flat slopes for
the heavy REEs, and small positive or negative Eu anomalies (Fig. 7). One sample of pillow basalt
overlaps the other mafic rocks and has a distinctly negative Ce anomaly. None of the gabbros and quartz
diorites, and few granodiorites of the Eastern satellite group show a reasonable match to the patterns of
the granitic rocks in the main mass of the batholith (Fig. 7). Notably, all mafic rocks are quartz-bearing
(sparse, resorbed quartz in the more mafic rocks), have elevated K2O contents, and differ from N- MORB
(Table 2; Fig. 4). They show geochemical features like those of calc-alkaline tholeiitic rocks (e.g.,
enriched in the light REEs and other fluid-soluble elements, Nb troughs, etc). The mafic rocks also have
moderate to low contents of Co (up to 22 ppm), Cr (up to 253 ppm), and Ni (up to 135 ppm) distinct from
unevolved mafic rocks (Table 2). Gabbro and diorite of the Eastern satellites have values of diagnostic
ratios (Nb/U~1.8-5.7, Ce/Pb = 0-30, Ba/Ta=1280-3368, and La/Th~2.6-12.9) that generally resemble
mafic orogenic rocks (Nb/U=1-7, Ce/Pb = >10, Ba/Ta >450, La/Th=2-7; Gill, 1981; Hawkesworth et al.,
1991). Low La/Yb values (~1.5-6.0), and elevated Th contents relative to Hf and Ta (Hf/Th= 1-10,
Ta/Th= 0.1-0.2), again are akin to those from orogenic basaltic rocks.
5.3 Kodiak batholith: Nd, Sr, and Pb Isotopes
The Nd, Sr, and Pb isotopic compositions of representative samples are given in Table 5 and Fig.
9. εNd values calculated for 59 Ma (crystallization age) are plotted for all the zones in the batholith (Fig.
18
ACC
EPTE
D M
ANU
SCR
IPT
ACCEPTED MANUSCRIPT
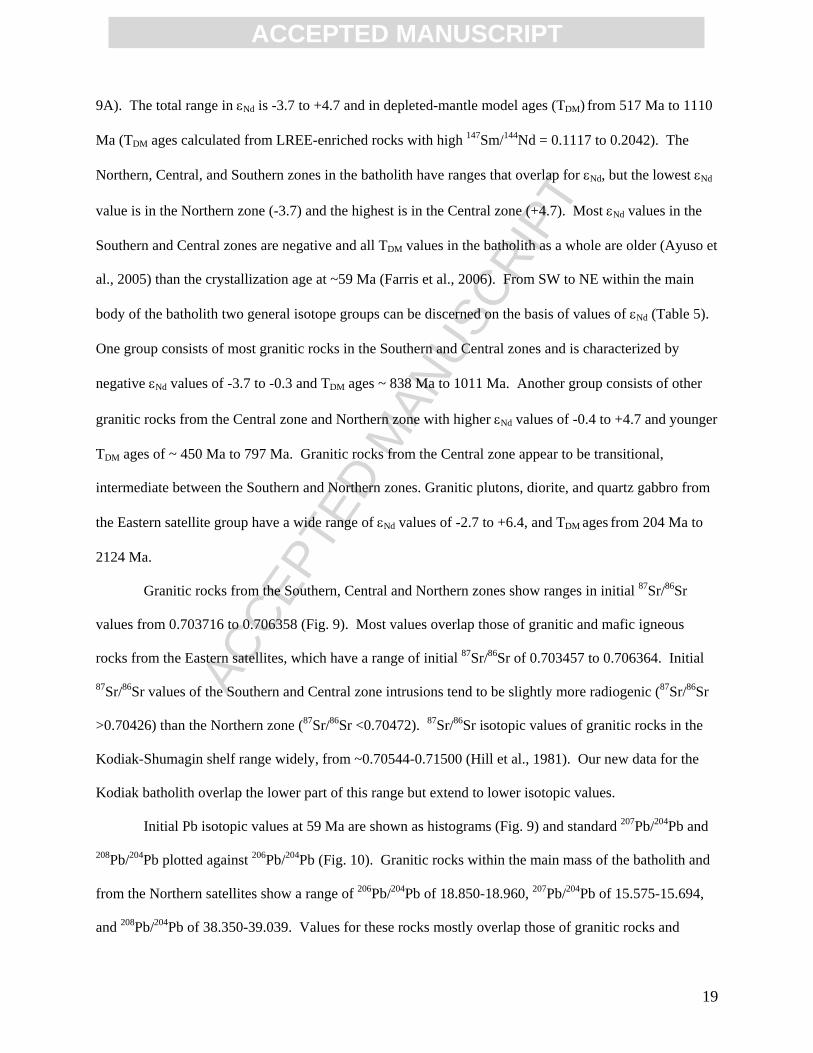
9A). The total range in εNd is -3.7 to +4.7 and in depleted-mantle model ages (TDM) from 517 Ma to 1110
Ma (TDM ages calculated from LREE-enriched rocks with high 147Sm/144Nd = 0.1117 to 0.2042). The
Northern, Central, and Southern zones in the batholith have ranges that overlap for εNd, but the lowest εNd
value is in the Northern zone (-3.7) and the highest is in the Central zone (+4.7). Most εNd values in the
Southern and Central zones are negative and all TDM values in the batholith as a whole are older (Ayuso et
al., 2005) than the crystallization age at ~59 Ma (Farris et al., 2006). From SW to NE within the main
body of the batholith two general isotope groups can be discerned on the basis of values of εNd (Table 5).
One group consists of most granitic rocks in the Southern and Central zones and is characterized by
negative εNd values of -3.7 to -0.3 and TDM ages ~ 838 Ma to 1011 Ma. Another group consists of other
granitic rocks from the Central zone and Northern zone with higher εNd values of -0.4 to +4.7 and younger
TDM ages of ~ 450 Ma to 797 Ma. Granitic rocks from the Central zone appear to be transitional,
intermediate between the Southern and Northern zones. Granitic plutons, diorite, and quartz gabbro from
the Eastern satellite group have a wide range of εNd values of -2.7 to +6.4, and TDM ages from 204 Ma to
2124 Ma.
Granitic rocks from the Southern, Central and Northern zones show ranges in initial 87Sr/86Sr
values from 0.703716 to 0.706358 (Fig. 9). Most values overlap those of granitic and mafic igneous
rocks from the Eastern satellites, which have a range of initial 87Sr/86Sr of 0.703457 to 0.706364. Initial
87Sr/86Sr values of the Southern and Central zone intrusions tend to be slightly more radiogenic (87Sr/86Sr
>0.70426) than the Northern zone (87Sr/86Sr <0.70472). 87Sr/86Sr isotopic values of granitic rocks in the
Kodiak-Shumagin shelf range widely, from ~0.70544-0.71500 (Hill et al., 1981). Our new data for the
Kodiak batholith overlap the lower part of this range but extend to lower isotopic values.
Initial Pb isotopic values at 59 Ma are shown as histograms (Fig. 9) and standard 207Pb/204Pb and
208Pb/204Pb plotted against 206Pb/204Pb (Fig. 10). Granitic rocks within the main mass of the batholith and
from the Northern satellites show a range of 206Pb/204Pb of 18.850-18.960, 207Pb/204Pb of 15.575-15.694,
and 208Pb/204Pb of 38.350-39.039. Values for these rocks mostly overlap those of granitic rocks and
19
ACC
EPTE
D M
ANU
SCR
IPT
ACCEPTED MANUSCRIPT
gabbro from the Eastern satellites, which have a range of 206Pb/204Pb of 18.854-19.054, 207Pb/204Pb of
15.543-15.587, and 208Pb/204Pb of 38.322-38.610. In a transect from SW to NE along the axis of the
batholith, the 206Pb/204Pb values of the Southern and Central zones overlap and tend to be slightly more
radiogenic (206Pb/204Pb > ~18.9) than the values of the Northern zone and Northern satellites (206Pb/204Pb
< ~18.9). The 207Pb/204Pb and 208Pb/204Pb values are about the same for all the granitic rocks regardless of
their zone. As in the case of the εNd values, granitic rocks of the Eastern satellites plot within the fields of
the Southern and Central zones (Fig. 10).
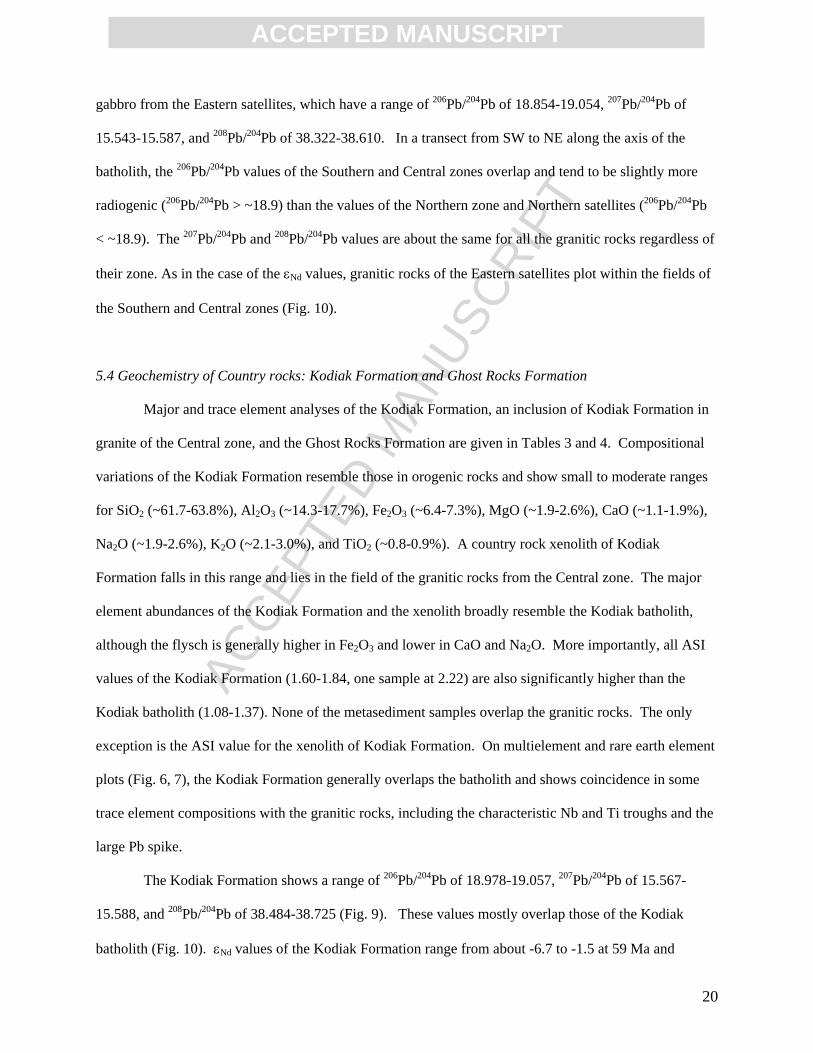
5.4 Geochemistry of Country rocks: Kodiak Formation and Ghost Rocks Formation
Major and trace element analyses of the Kodiak Formation, an inclusion of Kodiak Formation in
granite of the Central zone, and the Ghost Rocks Formation are given in Tables 3 and 4. Compositional
variations of the Kodiak Formation resemble those in orogenic rocks and show small to moderate ranges
for SiO2 (~61.7-63.8%), Al2O3 (~14.3-17.7%), Fe2O3 (~6.4-7.3%), MgO (~1.9-2.6%), CaO (~1.1-1.9%),
Na2O (~1.9-2.6%), K2O (~2.1-3.0%), and TiO2 (~0.8-0.9%). A country rock xenolith of Kodiak
Formation falls in this range and lies in the field of the granitic rocks from the Central zone. The major
element abundances of the Kodiak Formation and the xenolith broadly resemble the Kodiak batholith,
although the flysch is generally higher in Fe2O3 and lower in CaO and Na2O. More importantly, all ASI
values of the Kodiak Formation (1.60-1.84, one sample at 2.22) are also significantly higher than the
Kodiak batholith (1.08-1.37). None of the metasediment samples overlap the granitic rocks. The only
exception is the ASI value for the xenolith of Kodiak Formation. On multielement and rare earth element
plots (Fig. 6, 7), the Kodiak Formation generally overlaps the batholith and shows coincidence in some
trace element compositions with the granitic rocks, including the characteristic Nb and Ti troughs and the
large Pb spike.
The Kodiak Formation shows a range of 206Pb/204Pb of 18.978-19.057, 207Pb/204Pb of 15.567-
15.588, and 208Pb/204Pb of 38.484-38.725 (Fig. 9). These values mostly overlap those of the Kodiak
batholith (Fig. 10). εNd values of the Kodiak Formation range from about -6.7 to -1.5 at 59 Ma and
20
ACC
EPTE
D M
ANU
SCR
IPT
ACCEPTED MANUSCRIPT
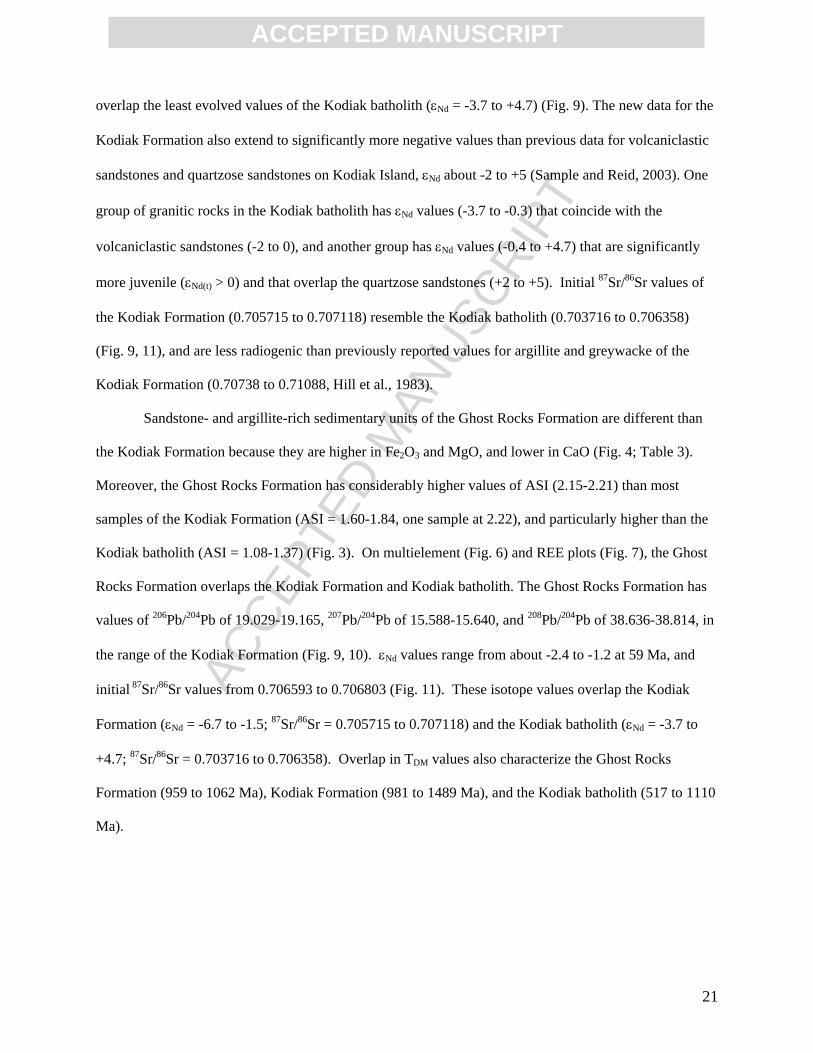
overlap the least evolved values of the Kodiak batholith (εNd = -3.7 to +4.7) (Fig. 9). The new data for the
Kodiak Formation also extend to significantly more negative values than previous data for volcaniclastic
sandstones and quartzose sandstones on Kodiak Island, εNd about -2 to +5 (Sample and Reid, 2003). One
group of granitic rocks in the Kodiak batholith has εNd values (-3.7 to -0.3) that coincide with the
volcaniclastic sandstones (-2 to 0), and another group has εNd values (-0.4 to +4.7) that are significantly
more juvenile (εNd(t) > 0) and that overlap the quartzose sandstones (+2 to +5). Initial 87Sr/86Sr values of
the Kodiak Formation (0.705715 to 0.707118) resemble the Kodiak batholith (0.703716 to 0.706358)
(Fig. 9, 11), and are less radiogenic than previously reported values for argillite and greywacke of the
Kodiak Formation (0.70738 to 0.71088, Hill et al., 1983).
Sandstone- and argillite-rich sedimentary units of the Ghost Rocks Formation are different than
the Kodiak Formation because they are higher in Fe2O3 and MgO, and lower in CaO (Fig. 4; Table 3).
Moreover, the Ghost Rocks Formation has considerably higher values of ASI (2.15-2.21) than most
samples of the Kodiak Formation (ASI = 1.60-1.84, one sample at 2.22), and particularly higher than the
Kodiak batholith (ASI = 1.08-1.37) (Fig. 3). On multielement (Fig. 6) and REE plots (Fig. 7), the Ghost
Rocks Formation overlaps the Kodiak Formation and Kodiak batholith. The Ghost Rocks Formation has
values of 206Pb/204Pb of 19.029-19.165, 207Pb/204Pb of 15.588-15.640, and 208Pb/204Pb of 38.636-38.814, in
the range of the Kodiak Formation (Fig. 9, 10). εNd values range from about -2.4 to -1.2 at 59 Ma, and
initial 87Sr/86Sr values from 0.706593 to 0.706803 (Fig. 11). These isotope values overlap the Kodiak
Formation (εNd = -6.7 to -1.5; 87Sr/86Sr = 0.705715 to 0.707118) and the Kodiak batholith (εNd = -3.7 to
+4.7; 87Sr/86Sr = 0.703716 to 0.706358). Overlap in TDM values also characterize the Ghost Rocks
Formation (959 to 1062 Ma), Kodiak Formation (981 to 1489 Ma), and the Kodiak batholith (517 to 1110
Ma).
21

ACC
EPTE
D M
ANU
SCR
IPT
ACCEPTED MANUSCRIPT
6. Discussion: Source and Origin of the Kodiak Batholith
6. 1 General Statement
The scale and extent of the Kodiak batholith, coupled with the distribution of satellite plutons of
similar age and composition intruded southwest and northeast of Kodiak Island, suggest a magmatic event
of considerable magnitude related to offscraping and underplating of the Chugach accretionary prism.
Precise identification of the heat source required for melting cold, deep-water turbidites akin to the
Kodiak Formation in the Chugach accretionary prism is an important feature bearing on the origin of the
granitic rocks. A wide variety of heat sources in the forearc environment have been proposed: 1) basalt
leaking from transform faults during subduction (Tysdal et al., 1977; Barker et al., 1992), 2)
underthrusting of a ridge-trench-trench triple junction of oceanic plates under the accretionary prism
(Marshak and Karig, 1977), 3) subduction of the Kula-Farallon ridge under the accretionary prism
(Byrne, 1979), 4) thermal surge from the subducting plate (Hudson et al., 1979), 5) conduction of heat
and advection of fluids from the hot, young subducting slab (Sisson et al., 1989), and heating in the
forearc environment resulting in combinations of MORB-type mafic rocks associated with peraluminous
felsic rocks (e.g., Groome et al., 2003), 6) upwelling of hot asthenosphere associated with decompressive
melting and generation of MORB-like melts that pond under, and intrude, the forearc (“blow-torch effect”
of DeLong et al., 1979; Plafker et al., 1989), and 7) intersection of the northern trench-ridge-trench triple
junction of the Resurrection plate (Haeussler et al., 2003b; Bradley et al., 2003). Our favored
interpretation for forming the Sanak-Baranof near-trench intrusives generated from 61 to 50 Ma,
including the Kodiak batholith at about 58 Ma is a heat source(s) in the forearc environment generated by
the intersection of the triple junction of the Resurrection plate. This forms the basis for our proposed
model.
Physical interaction between basaltic magmas and flysch in some regions of the accretionary
prism is well established (e.g., Hudson, 1994; Barker et al., 1992; Lytwyn et al., 2000; Kusky et al., 2003;
Sisson et al., 2003a, b), but determining the relative chemical contributions of contemporaneous or older
mantle-derived rocks to the magmatic source of the granitic rocks has been difficult. The role attributed
22
ACC
EPTE
D M
ANU
SCR
IPT
ACCEPTED MANUSCRIPT
to mafic magmas varies widely. For example, ~10% of the Cordova granodiorites in the eastern Gulf of
Alaska (Prince William Sound) may reflect mantle-derived contributions (Barker et al., 1992; Farmer et
al., 1993), but a tonalite-trondhjemite suite in the eastern Chugach Mountains requires involvement of >
75% mantle-derived material (Sisson et al., 2003b, Harris et al., 1996).
In the Shumagin and Sanak Islands in the Kodiak-Shumagin shelf, southwest of Kodiak Island,
Hill et al. (1981) and Hill and Morris (1982) considered MORB-like magmas to have been the most likely
heat and mass source of granitic plutons on the basis of geochemical and isotopic data (87Sr/86Sr and
δ18O). In this interpretation, the granitic intrusives were derived from a MORB-type magma that rose
through the accretionary prism and assimilated partial melts of the quartzofeldspathic and pelitic
flyschoid source (greywacke of the Shumagin Formation, which is considered correlative to the Kodiak
Formation).
On Kodiak Island, voluminous and cogenetic mafic rocks associated with the main mass of the
Kodiak batholith are not known. In the Ghost Rocks Formation, adjacent to the batholith, Moore et al.
(1983) described small mafic bodies associated with granitic plutons that in our subsequent work were
assigned to the Eastern satellite group of the Kodiak batholith. Trace element signatures of these mafic
rocks were summarized in the preceding section and show volcanic arc signatures. The rocks have high
values of LIL/HFS ratios and enrichment in fluid-soluble elements characteristic of a mantle-wedge
source (Elliott, 2003). We take the chemical features as consistent with the suggestion that calc-alkaline
rocks on Kodiak Island reflect subduction under southern Alaska (Haeussler et al., 1995; 2003b), and that
compositionally similar rocks likely underplated the prism shortly before the generation of the Kodiak
batholith. Farris et al. (2006) demonstrated an internally consistent southwest to northeast trend toward
younger crystallization ages along the axis of the batholith. The age trend was attributed to the effects of
ridge subduction. In the following section, we similarly invoke thermal input to the forearc a result of the
intersection of the northern trench-ridge-trench triple junction of the Resurrection plate in southern
Alaska, and assess the extent of chemical contributions of such a thermal source to explain the
compositional features of the Kodiak batholith.
23
ACC
EPTE
D M
ANU
SCR
IPT
ACCEPTED MANUSCRIPT
6. 2 Crustal and Mantle-derived Magmatic Sources of the Kodiak Batholith
Buoyant tonalitic to granodioritic melts derived from thermal erosion of slab window margins
have been linked to shallow melting of young subducted igneous oceanic crust (Thorkelson and
Breitsprecher, 2005). The melts have been proposed to rise from their shallow melting site (~5 km?) and
leave a residue of garnet-free amphibolite to pyroxenite (Thorkelson, 1996). In this view, mafic magmas
produced as a result of decompression melting of asthenospheric mantle upwell into the opening gap
during ridge subduction and are progressively replaced by other mantle sources. As a slab window is
transported deeper into the mantle, calc-alkaline volcanism typical of an orogenic margin is replaced by
tholeiitic to alkalic volcanism. Accordingly, the forearc crust may enclose both MORB-type mafic and
peraluminous intermediate to felsic magmas, a magmatic association that would differ from the typical
combination of calc-alkaline basalts and metaluminous granitic rocks in orogenic margins (Thorkelson
and Breitsprecher, 2005).
Young lithospheric mantle beneath newly-created crust (possibly underlying the accretionary
prism) is likely to be compositionally highly variable, in contrast to old lithospheric mantle (Zartman et
al., 1991). Also, the composition of the shallow asthenospheric mantle in continental margins has been
difficult to constrain, but studies focused on Neogene slab-window rocks from British Columbia to Baja
California suggest that shallow asthenospheric mantle resembles rocks derived from E-MORB-type
sources (Thorkelson and Taylor, 1989; Luhr et al., 1995; Gorring and Kay, 2001, and references therein).
The Kodiak batholith probably accounts for less than 10% of the exposed area on Kodiak Island,
but the granitic rocks are of sufficiently large volume (~2500 km3) to suggest that the magmas were
derived from a sizeable source region, perhaps in the order of a cube ~15 km on a side (assuming partial
melting of ~50%). Assuming that such a large source region is implicated by the partial melting events, it
is reasonable to speculate that Kodiak batholith genesis involved protoliths that had both continental and
mantle origins. In the discussion that follows we highlight problems distinguishing which geochemical
signatures are derived from contemporaneous or from older mantle-derived rocks, which of the sources
24

ACC
EPTE
D M
ANU
SCR
IPT
ACCEPTED MANUSCRIPT
known to be associated with subduction zones (e.g., depleted mantle wedge, subducted sediment, and
altered mafic oceanic crust) may have been involved, and to what extent such sources included in the
accretionary prism contributed to the granitic magmas. Within the accretionary prism, potential sources
of the granitic rocks are: (1) previously generated or contemporaneous mantle-derived MORB-type
magmas from ridge subduction that ponded at the bottom of or intruded into the turbidite fan, (2) calc-
alkaline magmas derived from metasomatized mantle-wedge (originally represented by depleted upper
mantle, Elliott, 2003) and from melting and devolatilization of subducted oceanic crust (altered MORB
and oceanic sediments) that accreted or were injected into the accretionary prism, and (3) compositionally
diverse flysch and various other older igneous rocks in the accretionary prism.
Recognizing diagnostic contributions from each of these sources in the granitic rocks on Kodiak
Island is a challenging undertaking, especially because several potential sources may have been involved,
and because the original chemical signatures of the mafic and felsic rocks could have been drastically
modified by fractional crystallization and assimilation fractional crystallization reactions during
emplacement. In the next section, we assess to what extent the observed compositional variations in the
batholith have been affected by emplacement processes before evaluating the contributions of mantle-
versus crustally-derived source rocks.
6.3 Chemical Variations within the Batholith
The oxide and trace element abundances of the Kodiak batholith are generally characterized by a
lack of orderly chemical variations as a function of SiO2, Rb/Sr, Na2O/K2O, ASI, light REE or any other
index of fractionation within each zone, and from zone to zone within the batholith. Certain geochemical
features in the granitic rocks (e.g., negative anomalies for Eu, Sr, and Ti), however, suggest that fractional
crystallization (FC) or assimilation and fractional crystallization reactions (AFC) may have affected the
rocks.
For the purposes of illustration, we tested various residual assemblages and illustrate one that best
fits the compositional variations of the granitic rocks in the Southern and Central zones (Fig. 12). The
25
ACC
EPTE
D M
ANU
SCR
IPT
ACCEPTED MANUSCRIPT
assemblage is dominated by plagioclase and clinopyroxene, and includes a limited contribution of
hornblende (although hornblende was not observed at this level of intrusion). This assessment is a first
step in establishing the processes that affected the evolution of the granitic rocks because many of the
detailed geological variables, such as the nature and proportions of the residual mineral assemblage, are
imperfectly known. Fractional crystallization (FC, Rayleigh fractionation or crystal surface-liquid
equilibrium model, Hanson 1978) and assimilation-fractional crystallization (AFC, DePaolo, 1981) paths
are summarized in Fig. 12 using elements having contrasting degrees of compatibility (e.g., Sc, K2O, and
Th). Partition coefficients were taken from compilations (Arth, 1976; Hanson, 1978; Henderson, 1986).
Bulk distribution coefficients calculated for fractionating assemblages that approximate the chemical
variations in the batholith for the Southern zone and Central zone, and for the Northern zone,
respectively: Sc (1.5; 2.55), K2O (0.16; 0.16), Rb (0.2; 0.4), Th (0.17; 0.17), Ta (0.1; 0.1), Ce (0.7; 0.01).
Fractional crystallization (FC) and assimilation-fractional crystallization (AFC) paths assume that
parental compositions are represented by 01PH-116A for the Southern and Central zones and RAAK-41
for the Northern zone (starting compositions from each zone are represented by rocks with the lowest
SiO2 contents). The assimilant is the Kodiak Formation, sample RAAK-34. The ratio of mass of
assimilant/mass fractionated (r) is 0.35 in the Southern and Central zones and 0.10 in the Northern zone.
Rock compositions from the Southern and Central zones show no optimal fits, but generally point to a
crystallizing residual assemblage consisting of plagioclase (~50-57%) and clinopyroxene (~35-40%)
along with some hornblende (up to 2%?). For the Northern zone, the assemblage consists of plagioclase
(~40-45%), K-feldspar (~12-15.1%), hornblende (~25-30.0%), biotite (~5-9.2%), and trace amounts of
accessory minerals (allanite ~ 0.2%; zircon ~ 0.1%; and sphene ~0.1%) (Figs. 12A, B).
The fractional crystallization trend fails to systematically connect the compositions of all the
granitic rocks. The discrepancies may reflect uncertainties in geological variables such as choice of
starting compositions, or selection of distribution coefficients that may not reflect magmatic evolution
during melting and transport to the upper crust (Fig. 12A, 12B). In contrast to the Southern and Central
zones, the Northern zone shows fractional crystallization trends that could reflect a residual assemblage
26

ACC
EPTE
D M
ANU
SCR
IPT
ACCEPTED MANUSCRIPT
composed of plagioclase, K-feldspar, biotite, and perhaps include a contribution of hornblende, as well as
trace amounts of allanite, zircon, and sphene. This mineral assemblage would broadly link the
compositions (for Sc and K2O, but not for Sc and Th) in the Northern zone and Northern satellites and
requires about 50% crystallization by weight for the Northern zone, and ~80% for the Northern satellites
(Fig. 12). The REE patterns preclude the presence of significant amounts of garnet in the residue. In
addition, our results suggest that there is no unique mineral assemblage capable of linking all the granitic
rocks for the batholith as a whole.
The differences among the zones, however, could be the result of combined effects of
assimilation and fractional crystallization reactions (AFC; DePaolo, 1981) involving the Kodiak
Formation. The impact of such AFC reactions can be illustrated by assuming that selected samples
represent compositions of end-member components (Fig. 12). The residual assemblage used in the
calculation was the same as that applied in our fractional crystallization model. At low to moderate ratios
of mass assimilated to mass fractionated (r <0.35), as expected from the high level of intrusion of the
composite batholith, the compositional paths for FC and AFC do not differ greatly. AFC paths that cover
the entire range of compositions in the Southern and Central zones as a group (r ~ 0.35, fraction
crystallized F ~10-50%), and for the Northern zone can be devised (r ~ 0.10, F ~20-50%). Compositional
offsets and diverging trends of the granitic rocks, however, again argue that the variations for the
batholith as a whole cannot be the result of AFC reactions involving this single continental crustal
contaminant or a simple mineral assemblage. We concede that other rocks deeper in the crust could have
been more important contaminants and could have compositions that would make the AFC curves link the
zones within the batholith more exactly. It is also possible that the batholith was affected by varying
degrees of fragmentation and assimilation, as suggested by petrographic variations, depending on whether
the host granitic magmas are in the main mass of the batholith or in the flanking belts. Petrographic
observations, for example, show that the batholith locally has abundant xenoliths armored by narrow
reaction rims, as well as quartz-rich pods and biotite (plus aluminosilicate and garnet) clusters (Ayuso et
al., 2005). Some of these areas indicate that >50% of the mode is derived from mechanical
27
ACC
EPTE
D M
ANU
SCR
IPT
ACCEPTED MANUSCRIPT
disaggregation of xenocrysts, and is thus locally consistent with an enhanced degree of reaction between
the granitic magma and the Kodiak Formation. Moreover, recent studies of fractal fragmentation of
xenoliths together with a survey of oxygen isotopic variations in plutons of the Eastern satellite belt, and
in parts of the main mass of the batholith, also suggest that assimilation was an important local process
(Farris and Paterson, 2007; Tangalos et al., 2003). We think, however, that the extent and effects
involving major and trace elements and radiogenic isotopes compositions between the magmas and
country rocks were locally controlled, and not extensive enough to account for the batholith as a whole.
We conclude that the absence of a continuum of rock compositions linking all the batholith zones
and adjacent granitic and mafic satellite groups indicates that granitic rocks on Kodiak Island formed
from distinct magmas. These magmas were unlikely to be mutually related simply by in situ FC (or AFC)
during transport from their heterogeneous source region at the bottom of the accretionary prism and
during emplacement higher in the continental crust. Also, plots involving compatible element variations
in the mafic to granitic rocks scatter and do not produce mixing lines indicative of simple mixing of felsic
melts and contemporaneous mafic mantle-derived magmas, making simple two-component mixing
unlikely. All of these processes would have produced coherent elemental trends linking cogenetic rocks,
as well as trace element ratios correlated with isotopic values of Pb, Sr, and εNd. Offsets, compositional
gaps, and the heterogeneity in isotopic compositions in the Kodiak batholith can thus be taken as evidence
that the batholith and its satellites did not evolve from a common, more mafic parent.
6.4 Mantle and Crustal Contributions
Granitic rocks of the Kodiak batholith display an orogenic signature that is reflected in
spidergram patterns with large negative spikes at Nb (and Th?), positive spikes at Pb, and TDM ages older
than 59 Ma (Figs. 6, 9). The near-chondritic values of many samples (εNd ~0), and especially, the positive
values in the main mass of the batholith (most samples have εNd = -3.7 to +2.4, one sample at +4.7) and
even higher values in the Eastern satellites (εNd = +4.2, one silica-rich sample at +6.4), closely link the
28
ACC
EPTE
D M
ANU
SCR
IPT
ACCEPTED MANUSCRIPT
granite source region on Kodiak Island to rocks with volcanic arc compositions. The 87Sr/86Sr values of
granitic rocks in the main mass of the batholith (87Sr/86Sr = 0.704705-0.706923) are also consistent with
an orogenic arc setting in which mafic magmas were derived from depleted mantle (MORB) that had
previously reacted with anatectic melts from the continental crust (hybridization), or alternatively,
originated as melts from the mantle wedge overlying a subduction zone enriched in fluid-soluble elements
and silica-rich fluids (Ba, Rb, K, Cs, Sr, Pb, Th, La, etc.) from sediment dehydration and fluid enrichment
(Hawkesworth et al., 1991) during subduction (e.g., Bebout, 1996; Ryan et al., 1996).
Although the ultimate origin of components that produced the observed elemental and isotopic
variations is difficult to establish, isotopic trends are consistent with mixing of source rocks originally
derived from the mantle wedge (MORB-type basalt enriched by fluid-soluble elements) as one
compositional end-member, together with melts and fluids derived from flysch (Fig. 13). The isotopic
variations of the Kodiak batholith are thus intermediate between the mantle wedge source that was
enriched by fluids (87Sr/86Sr <0.7030; εNd ~ +9; 206Pb/204Pb < 18.8), and fluids and/or melts from flysch
(87Sr/86Sr >0.7065; εNd ~ -4; 206Pb/204Pb > 19) of the Kodiak Formation. The overall homogeneity of the
Pb isotopes indicates that all of the Kodiak batholith rocks had a mantle end member plus a flysch end
member. A rough estimate of the isotopic contribution of a mantle-derived end member can also be
obtained by assuming a starting composition. For example, granitic samples suggest that at least 40%,
and for many samples up to 80%, of the Nd isotopic variations reflect a mantle-type component. Samples
having higher mantle contributions also have the youngest TDM ages and high values of εNd. The balance
of the Nd isotopic variation is derived from a recently recycled crustal component represented by the
Kodiak Formation, which has the oldest TDM ages and lowest values of εNd.
The batholith does not owe its origin to direct melting of MORB or simple fractional
crystallization of such mafic magmas. Most major and trace element ratios (LILE/HFS) that are predicted
to correlate with εNd, Pb, or Sr isotope compositions generated by subduction are generally decoupled. A
few exceptions are notable, for example, Cs/Ta ratios show moderate positive correlations with isotopic
29

ACC
EPTE
D M
ANU
SCR
IPT
ACCEPTED MANUSCRIPT
systems within the batholith zones (higher Cs/Ta and 206Pb/204Pb) (Fig. 13). Generally, the Northern zone
is isotopically unique (e.g., lower 206Pb/204Pb and εNd as low as -3.7) (Fig. 10). In addition, a plot of Nb/U
versus Ce/Pb (Klein, 2003) shows all samples of the Kodiak batholith and flanking igneous groups
intermediate between a predominant calc-alkaline end-member (having low values of Nb/U and Ce/Pb,
similar to volcanic arc lavas) and a minor contribution from an altered oceanic crust end-member (having
low values of Nb/U but high values of Ce/Pb) (Fig. 8). A contribution of altered oceanic crust as a
component in the source of the granitic magmas is consistent with the interpretation of Thorkelson and
Breitsprecher (2005) who described the nature of melts derived from thermal erosion of margins of slab
windows. The transitional range of trace element compositions of the granitic rocks, however, indicates
they are not simply direct melts of altered oceanic crust but likely include considerable recycled material,
possibly as old as ~1 Ga to 1.5 Ga (based on an estimate of the average crustal residence or TDM age of
the Kodiak Formation sources). No clear evidence exists for direct chemical contributions from a
depleted mantle reservoir (MORB), likely to represent ridge magma and invoked here as a possible heat
source under the prism. Such MORB-like magmas would be expected to show trace element and isotope
features intermediate between a depleted mantle source (e.g., high values of Nb/U and volcanic arc lavas
with low values of Nb/U (Fig. 8). Ratios of Ba/Th and La/SmN (Elliott, 2003) that characterize the mafic
rocks on Kodiak Island (Eastern sateelite group) overlap the field of volcanic arc rocks and plot between
contributions from altered mafic oceanic crust and sediment (Table 2). The calc-alkalic nature of the
mafic rocks resembles island-arc tholeiitic basalt found at shallow depths of the Wadati-Benioff zone
(e.g., Japan, Kuno, 1966) and resembles standard sources of continental arcs that include MORB and
sediments (subducted oceanic crust), the mantle wedge, and the continental crust (Kay, 1978, 1980).
Pb isotopic values of the Kodiak batholith fall to the right of both the geochron and average Pb
evolution curve (orogene, μ= 9.74; Zartman and Doe, 1981), at relatively higher ratios of 206Pb/204Pb for a
given value of 207Pb/204Pb (Fig. 10). Most granitic rocks (μ = 9.44−9.71, one sample at 9.97) thus show
lower values of μ than the orogene model curve, consistent with Pb isotope ratios characteristic of
30
ACC
EPTE
D M
ANU
SCR
IPT
ACCEPTED MANUSCRIPT
immature island arcs and active continental margins, as well as sub-continental lithospheric mantle that
has been previously enriched by subduction (e.g., Zartman et al., 1991). The relatively radiogenic
206Pb/204Pb values of the granitic rocks, for a given 207Pb/204Pb value, imply that the time-integrated
average composition of the source has evolved since at least ~1-1.5 Ga with U/Pb ratios consistently
lower (more mantle-like) than the average continental crust. The 207Pb/204Pb values of the granitic rocks,
however, also extend toward more radiogenic compositions than island arc lavas, falling in fields along
broad and steep slopes when compared to the 206Pb/204Pb ratios. The fields are intermediate between
depleted mantle-derived basalts (e.g., N-MORB and EMII of Zindler and Hart, 1986) and terrigenous
sediments. This feature is consistent with the occurrence of kyanite, biotite (containing fibrolite?
remnants), garnet, and muscovite in the granitic rocks and supports the idea that continental crustal rocks
were also involved with the genesis of the Kodiak batholith if these minerals represent equilibrium
residua produced during the generation of the primary peraluminous melts. However, the mineral
clusters show no conclusive petrographic evidence for melting and there is no geochemical evidence that
they represent refractory restitic material (see for example review by Clarke, 1981). Instead, at this time,
we favor the idea that the mineral clusters are likely remnants of wall rock xenoliths mechanically
dispersed during transport of the granitic magmas through the middle continental crust (~6 kb;
Richardson et al., 1969). Values of 207Pb/204Pb for the mafic rocks that are higher than typical MORB-
derived rocks, together with small to moderate Pb and Sr spikes in spidergrams highlight the
contributions of recycled continental crust in the accretionary prism (terrigenous or continental sediments
in the flysch) that evolved at high U/Pb ratios (higher than the mantle model curve at μ = ~9.5). The steep
slope of the Pb isotopic variations thus reflects source mixing and cannot be used to estimate the timing
of the recycling event.
The foregoing geochemical data support a model for the genesis of the Kodiak batholith from
partial melting of a mixed source consisting of diverse lithologic units. Mixing in the source region of the
granitic magmas helps to explain the lack of covariations of major and trace element abundances and
isotope compositions. Also, partial melting of a mixed source is consistent with decoupling of elemental
31
ACC
EPTE
D M
ANU
SCR
IPT
ACCEPTED MANUSCRIPT
abundances and ratios of the LILE/HFS from the isotope signatures and can be explained if the zonal
compositional differences within the batholith reflect the influx of different melts and the effects of
mixing isotopically different magma sources.
6.5 Melting in the Accretionary Prism
Next we will explore the notion that the granitic magmas owe their genesis to melting of a
heterogeneous source that included flysch and amphibolites. Major-element compositions of melts
produced by dehydration melting of felsic pelites, metagreywackes, and amphibolites (Fig. 3, 4) have
been reported by Patino Douce (1999). The major element abundances of the Kodiak batholith overlap
the fields for dehydration melting of amphibolites and metagreywackes (Fig. 3), and as suggested above,
may be considered to represent melts from the bottom of the accretionary prism. A small volume of
leucogranites in the Northern satellite bodies overlaps the compositions attributed to melts derived from
felsic pelites. In contrast, the mafic and intermediate igneous rocks in the Ghost Rocks Formation do not
consistently plot in a unique field. In addition, the Kodiak Formation and the Ghost Rocks Formation do
not plot always in any one field as defined by Patino Douce (1999) or exactly match the compositions of
large portions of the Kodiak batholith.
6.6 Flysch Melting
The thick and rapidly deposited turbidite sequence of the Kodiak Formation is reported by
Sample and Reid (2003) to be a voluminous turbidite fan derived from recycled orogen (volcaniclastic
sandstones) with a marked Proterozoic contribution. The fan also includes input (quartzose sandstones)
from a continental margin volcanic arc. The Kodiak Formation adjacent to the batholith is not enriched in
Al2O3 (14.3-17.7%) or depleted in the alkali elements (total Na2O+K2O: 4.4-4.7%). The flysch
compositions fall within the range of the Paleocene Orca Group (largely quartzofeldspathic trubidites,
Dumoulin, 1988), which is also thought to represent deposits derived from a magmatic arc developed near
a continental margin (Winkler, 1976; Plafker et al., 1989). However, comparison of the average
32
ACC
EPTE
D M
ANU
SCR
IPT
ACCEPTED MANUSCRIPT
compositions of the Kodiak Formation and the Orca Group flysch shows that they are not exact
analogues. For example, they are similar for SiO2 (Kodiak Formation: ~63.8%, Orca Group: 67.6%),
Al2O3 (~15.9%, and 16.0%, respectively), MgO (~2.4%, and 2.4%), and K2O (~2.6%, and 2.3%), but the
Kodiak Formation is higher in FeOtotal (~6.2%, and 4.2%), and lower in CaO (~1.4%, and 2.0%), and
Na2O (~2.2%, and 3.1%)
The general coincidence of the major and trace element data and the overlap in εNd, Sr and Pb
isotopic values of the Kodiak batholith with those of metasediments representing the Chugach
accretionary prism, however, may be used as evidence that the batholith was derived by partial melting of
metasedimentary rocks that generally resemble the Kodiak Formation. For example, the Kodiak
Formation (εNd = -6.7 to -1.5) is broadly similar to argillite (εNd = -3.8 to -0.6) and greywacke (εNd = -3.3
to -2.0) in the Orca Group, as well as phyllite and metagreywacke (εNd = -3.3 to -2.3) in the Valdez Group
from the eastern Gulf of Alaska. Also, nearly the same range of TDM values (0.84 to 1.01 Ga)
characterizes the Kodiak batholith, quartzose sandstones of the Kodiak Formation, and flysch from
eastern Gulf of Alaska. The Kodiak Formation has 87Sr/86Sr values (0.705715 to 0.707118) that resemble
the Orca and Valdez Groups (0.70602 to 0.70684, one sample at 0.70804). The Pb isotopic compositions,
moreover, show convergence between the batholith and the Kodiak Formation (Fig. 10). There is no
consensus on the source terrane for the Kodiak Formation, but, taken as a group, isotope signatures of the
flysch closely resemble the composition of the Coast Plutonic Complex, the orogenic belt along the Coast
Mountains of British Columbia and southeastern Alaska (Farmer et al., 1993; Sample and Reid, 2003).
The Complex possibly corresponds to a Phanerozoic continental margin volcanic arc source and
represents the best candidate for the recycled material in the accretionary flysch. In this case, the Chugach
flysch may have been deposited and accreted south of its current latitude (Sample and Reid, 2003).
Considering the overall compositional correspondence between the Orca Group and the Kodiak
Formation, the impact of a melting process affecting the flysch of the western Gulf of Alaska can be
evaluated by comparison to experimental melts of greywacke and dacite (Conrad et al., 1988). Such a
33
ACC
EPTE
D M
ANU
SCR
IPT
ACCEPTED MANUSCRIPT
comparison shows the following: (1) No exact match exists between the experimental greywacke and
dacite melts and the average compositions of the Kodiak batholith. Comparison to other recent
experimental melting studies of greywacke (e.g., Stevens et al., 1997) also show large compositional
divergence compared to the batholith. (2) Greywacke glass (623B, XH2O = 0.25, 925ºC) is generally a
good match, except that FeOtotal, MgO and K2O abundances are higher in the granitic rocks. Plagioclase,
orthopyroxene, ilmenite and a trace of garnet make up the residue (± quartz) for many of the runs done at
10 kbars. Notably, the estimated pressure at the bottom of the prism in the western Gulf of Alaska,
however, is from at least 4 kbar to about 7-8 kbar (Sample and Reid, 2003), lower than the 10 kbar
experimental conditions. More importantly, results of unpublished experimental work at 3-5 kbar have
plagioclase, orthopyroxene, and ilmenite (± quartz) but no garnet in the residue (referenced in Conrad et
al., 1988). Compositional discrepancies for FeOtotal, and MgO in the granitic rocks may also indicate that
the peraluminous melts were in equilibrium with plagioclase (but not quartz) and were produced at
moderate degrees of melting and high temperature (F = 70-85%, T > 900 ºC) (e.g., Miller et al., 1985).
(3) The compositions of experimental glass from dacite (326A, XH2O = 0.5, 900ºC, near the quartz-
fayalite-magnetite buffer) of Conrad et al. (1988) and the granitic rocks show good similarity for SiO2,
TiO2, Al2O3, Na2O, and P2O5. Other oxide abundances differ, in that the granitic rocks are somewhat
enriched in MgO and K2O, and depleted in FeOtotal, and CaO. (4) Dacite glass, however, has
orthopyroxene and clinopyroxene in the residue but no plagioclase. Other dacite glasses (samples 623A,
625A) produced at higher temperatures (925 to 950 ºC, XH2O = 0.25) have residual plagioclase and no
garnet, and are also similar to the average granitic rock from the Kodiak batholith. The bulk of the
observations above suggest that some of the compositional features of the Kodiak batholith, especially of
the Northern zone granitic rocks, can be explained by 70-85% melting of greywacke (and/or dacite)
within the accretionary prism at conditions of XH2O = 0.25-0.50, 925 to 950ºC, fO2 near the QFM buffer.
6.7 Amphibolite Melting
34
ACC
EPTE
D M
ANU
SCR
IPT
ACCEPTED MANUSCRIPT
Several geochemical attributes of the Kodiak Formation suggest that dehydration melting of
greywacke is insufficient to explain the geochemistry of the granitic rocks and that more mafic
components, for example, amphibolite, are needed in the source: (1) the batholith and the Kodiak
Formation show moderate overlap in major element abundances but significant differences in average
contents of FeOtotal, MgO, and CaO among others. The Kodiak Formation is also generally depleted in the
alkali elements, and as a group, has much higher ASI values (>1.5) than the granitic rocks (ASI <1.5). (2)
The Kodiak Formation and the experimental greywacke melt compositions do not show matches for SiO2,
CaO and Na2O (Kodiak Formation is too low), and for FeOtotal and MgO (Kodiak Formation is too high).
Significantly, the granitic rocks have lower SiO2 (and higher FeOtotal, MgO and K2O abundances) than the
melts of greywacke used by Conrad et al. (1988), suggesting that other non-greywacke sources were
involved. The Ghost Rocks Formation samples show even greater differences compared to the
experimental compositions (and the Kodiak batholith), as they are measurably lower in SiO2, CaO, and
Na2O, and higher in Al2O3, MgO, and FeOtotal than the Kodiak Formation. (3) Comparison of
experimental melts of greywacke and amphibolite by Patino-Douce (1999) with the Kodiak batholith
(Fig. 3, 4) shows that most of the granitic rocks overlap the field of amphibolite (e.g., the granitic rocks
show high abundances for the sum of Al2O3, FeOtotal, MgO, and TiO2 compared to the field of
metagreywacke melts).
The compositional features listed above for the Kodiak batholith reflect a mixture of sources that
included greywacke, but which also had significant contributions from a more mafic component. General
similarity of elemental abundances of the calc-alkaline mafic volcanic and intrusive rocks from the
Eastern satellite group and experimental melting studies of amphibolites provide the means to estimate
fractions of melting, temperature, water activity, and mineral assemblages controlling the evolution of
granitic melts that closely resemble the compositions of the Kodiak batholith. Sisson et al. (2005) studied
melting of moderately hydrous high-K shoshonitic high-alumina basalt, medium-K high-alumina basalt,
and medium-K basaltic andesite that characterized the mafic liquids present during the evolution of the
Sierra Nevada batholith. Except for the high-K shoshonitic high-alumina basalt, the other basalts used for
35
ACC
EPTE
D M
ANU
SCR
IPT
ACCEPTED MANUSCRIPT
the experimental work show notable similarities to the mafic rocks adjacent to the Kodiak batholith.
Experimental glasses were made at 700 MPa (about 20-25 km or ~ 6-8 kbar), which approximates the
pressure at the bottom of the accretionary prism. Gabbro from the Eastern satellite group (02-KD-31B;
Table 1) resembles the medium-K basaltic andesite of the experimental studies in SiO2 (55.57% and
53.95%), TiO2 (0.91% and 1.03%), Al2O3 (17.99% and 17.85%), MnO (0.12% and 0.15%), MgO (5.60%
and 5.43%), and K2O (1.10% and 1.19%). Moderate differences exist for CaO (8.22% and 9.33%),
FeOtotal (6.78% and 8.11%), and Na2O (3.55% and 2.74%).
Comparison of the experimental melts of Sisson et al. (2005) with the average composition of the
granitic rocks from the Kodiak batholith shows: (1) no exact match exists between the experimental melts
and the average compositions of the granitic rocks. Moreover, other detailed experimental melt studies of
amphibolite also lack exact compositional convergence with the batholith (e.g., Rapp and Watson, 1995).
Glasses obtained at 900±25ºC by Sisson et al. (2005), however, are a fair match to the entire range of
granitic compositions, from the least silicic and presumably least evolved, to the most silicic rocks. The
solidus assemblage for the amphibolites at 700 MPa included intermediate plagioclase (consistent with
small negative Eu anomalies in the Kodiak granitic rocks), amphibole, biotite, and quartz (±pyroxene, and
K-feldspar?); no garnet formed in the residue.
7. Summary and Petrogenetic Model
The large volume of granitic magma represented by the Kodiak batholith, together with plutons
of similar age and composition near Kodiak Island, suggests that they correspond to a regional magmatic
event derived from a sizeable source region. The batholith is dominantly composed of tonalite to
granodiorite. Small granodiorite-granite plutons outcrop to the north, and others, ranging from granitic to
quartz diorite and quartz gabbro flank the main body. The batholith encloses country rock xenoliths and
contains widely disseminated coarse clusters of biotite, muscovite, plagioclase, and quartz closely
associated with fine-grained garnet. Fine-grained kyanite is disseminated in the matrix and occurs as
distinctly zoned megacrysts, especially in the Northern zone of the batholith. Very fine-grained fibrolite
36
ACC
EPTE
D M
ANU
SCR
IPT
ACCEPTED MANUSCRIPT
(?) may also occur as inclusions in clusters of biotite and quartz. Mafic enclaves are generally absent.
Aplites, pegmatites, and miarolitic cavities are uncommon. The batholith contains zonal distinctions
discerned on the basis of petrographic variations, major and trace element abundances, and Nd-Sr-Pb
isotopic ratios along a trend from SW to NE (Southern zone, Central zone, and Northern zone). Plutons
flanking the main body of the batholith are assigned to the Northern, Western and Eastern satellite groups.
The Kodiak batholith is calc-alkalic (medium-K) and shows increases in SiO2 (~61 wt. %–73 wt.
%) and decreases in TiO2 (~0.9 wt. %–0.3 wt. %) in a trend from SW to NE. The zonal distinctions
identified above distinguish mainly between the Southern and Central zones taken as a group, in
comparison to the Northern zone. The least alkalic (less sodic) rocks are in the Southern zone.
FeOtotal/MgO values show that the batholith belongs to a low-Fe suite. The batholith is peraluminous to
strongly peraluminous (alumina saturation index, ASI = 1.08–1.37). The Southern and Central zones have
generally higher values of Al/(Na+K) (~1.6–2.3) than the Northern zone, and Western and Northern
satellites (1.2–1.8). Granitic rocks from the Eastern satellites are also more diverse and more aluminous
(ASI ~1.46) than the main mass of the batholith. Quartz gabbro and diorite are metaluminous
[Al/(Ca+Na+K) ~0.7–0.9]. The batholith shows no significant evidence for hydrothermal alteration and
sulfide mineral deposition.
The batholith is enriched in large-ion lithophile elements (Ba, Rb, K, Cs, and Sr), other fluid-
soluble elements (e.g., U, Pb, etc.) and light REEs compared to N-MORB. Trace element distributions
result in high values of ratios involving large-ion lithophile elements and Nb, Ta, Zr, Hf, Ti, and Th.
Generally, high values of such ratios are taken as characteristic of volcanic arc signatures. Relative
depletions and wide variations in the abundances of Nb, Ta and Th are also key features of the Kodiak
batholith. Highly variable ratios of Nb/Ta, Th/U, Th/Ta, and Th/Hf, among others, over narrow ranges of
silica or other indices of differentiation characterize the different zones. Sc, Cr, Co, Ni, Zn, V and Ge
contents generally decrease in abundance relative to SiO2, and the Southern and Central zones have
higher abundances of Sc and V than the Northern zone and Northern satellite group.
37
ACC
EPTE
D M
ANU
SCR
IPT
ACCEPTED MANUSCRIPT
The zonal distinctions are also expressed by the isotope ratios of the granitic rocks. Two groups
exist on the basis of εNd values. One group consists of the Southern and Central zones and is
characterized by negative εNd values of -3.7 to -0.3 and TDM ages ~ 838 Ma to 1011 Ma. Another group
consists of granitic rocks from the Northern zone (and a few rocks from the Central zone) showing higher
εNd values of -0.4 to +4.7 and younger TDM ages of ~ 450 Ma to 797 Ma. The Central zone thus appears
to be compositionally transitional, between the Southern and Northern zones. Granite, diorite, and gabbro
from the Eastern satellite group have a wide range of εNd values of -2.7 to +6.4, and TDM ages from 204
Ma to 2124 Ma. Initial 87Sr/86Sr values of the Southern and Central zone intrusions tend to be slightly
more radiogenic (87Sr/86Sr >0.70426) than the Northern zone. In a transect from SW to NE along the axis
of the batholith, initial 206Pb/204Pb values of the Southern and Central zones overlap and also tend to be
slightly more radiogenic (206Pb/204Pb > ~18.9) than the values of the Northern zone and Northern satellites
(206Pb/204Pb < ~18.9). As in the case of the εNd values, granitic rocks of the Eastern satellites plot within
the fields of the Southern and Central zones.
Precise identification of the chemical components in the source region of the near-trench
instrusives in the Sanak-Baranof belt and their relative contributions has proven difficult. A general
consensus exists that physical interaction involving basaltic magmas and flysch is a common mechanism
involved with the genesis of the granitic intrusions (e.g., Barker et al., 1992; Hudson, 1994; Lytwyn et al.,
2000; Kusky et al., 2003; Sisson et al., 2003a, b). However, the exact role attributed to mafic magmas, the
type of mafic magmas involved during granite generation in the near-trench environment, and
identification of diagnostic features distinguishing between contemporaneous and mantle-derived rocks
involved with granite genesis remains imperfectly known.
Our previous geochemical studies of the Cordova granodiorites in the eastern Gulf of Alaska
(Prince William Sound) suggested that the contribution of mantle-derived magma likely accounted for
less than 10% of the granitic melts and that the bulk of the melts reflected anatexis of the flysch in the
accretionary prism (Barker et al., 1992; Farmer et al., 1993). This mantle component was not precisely
38

ACC
EPTE
D M
ANU
SCR
IPT
ACCEPTED MANUSCRIPT
identified but was consistent with N-MORB-like mantle associated with ridge subduction, and mantle
associated with transform faults. Magmas associated with transform faults have a wide range in trace
element and isotopic compositions, including those ranging from N-MORB to E-MORB (e.g., Langmuir
and Bender, 1984; Kela et al., 2007). In contrast to the Cordova granodiorites, in the eastern Chugach
Mountains, granitic rocks were thought to require involvement of > 75% mantle-derived material (N-
MORB to E-MORB compositions) that underplated the base of the accretionary wedge during ridge
subduction (Sisson et al., 2003b). Also, Lytwin et al. (2000) and Bradley et al. (2003) showed that near-
trench felsic plutons and mafic to felsic dikes in the Chugach accretionary prism (Kenai Peninsula) have a
wide range of geochemical signatures. The felsic plutons and felsic dikes are calc-alkaline, and the
basaltic andesites range from MORB-like to E-MORB, but also include rocks that resemble island-arc
volcanics. The geochemical variations thus suggest that both island arc and MORB-like compositions
can exist in the same ridge system (Sisson et al., 2003b).
In the Kodiak-Shumagin shelf, Hill et al. (1981) and Hill and Morris (1982) considered MORB-
like magmas to have been the most likely heat and mass source of plutons in the accretionary prism
(particularly intrusions in Shumagin and Sanak Islands). The granitic rocks were thought to indicate
reaction of MORB-type magma and assimilation of the Shumagin Formation. On Kodiak Island, Moore
et al. (1983) conducted a survey of the geochemical features of the mafic to intermediate rocks in the
Ghost Rocks Formation adjacent to the main mass of the Kodiak batholith and described them as MORB
and andesite. Granodioritic rocks flanking the main mass of the Kodiak batholith were attributed to
mixing of MORB and sediments. Our preliminary data for these and other volumetrically minor gabbros
and diorites in the Eastern satellite group show, instead, that they are quartz-bearing, have elevated K2O
contents, and differ from typical N-MORB compositions. The mafic rocks resemble calc-alkaline
tholeiitic rocks, and display many trace element features including enrichment in the light REEs and
fluid-soluble elements, relative depletion in Nb, and values of diagnostic ratios (Nb/U, Ce/Pb, Ba/Ta, and
La/Th) that generally bear a similarity to mafic orogenic rocks.
39
ACC
EPTE
D M
ANU
SCR
IPT
ACCEPTED MANUSCRIPT
Assuming that the small volume of mafic magma adjacent to the main mass of the batholith is
cogenetic and has been characterized adequately, our favored interpretation is that the mafic rocks that
underplated (and evolved to more intermediate compositions) and were stored in the deeper levels of the
accretionary prism. The mafic rocks could represent magmatism in a continental arc setting if conditions
for melting of the mantle wedge were appropriate as a result of rising fluids liberated from the subducting
slab into the mantle wedge in forearc regions. In this scenario, metasomatizing fluids enrich the wedge in
water and fluid-soluble elements (Bebout, 1996) prior to ridge subduction under the arc. Transfer of fluid-
soluble elements conveys components to the sources of arc magmas by metasomatizing the mantle
wedge, and is a flux for partial melting leading to arc magmatism (Ryan et al., 1996).
An alternative origin for the volumetrically minor mafic rocks flanking the Kodiak batholith is
that they resemble underplated mafic magmas produced by the slab window. In this case, the observed
trace element and isotopic compositions of the mafic magmas reflect hybridization, crustal assimilation,
and mixing of N-MORB mantle and the metasedimentary rocks in the accretionary prism, or slab window
magma related to E-MORB type magma (from transform faults?). Our trace element data are not
conclusive, but elements such as Cs, Rb, Ba, Th, and Pb are significantly enriched relative to E-MORB,
and light REE contents are also considerably higher than N-MORB and E-MORB. If the mafic rocks in
the Eastern satellite group originally represented N-MORB mantle, their trace element and isotopic
signatures have been disturbed, and their exact magma type cannot be identified compellingly. Regardless
of the ultimate origin of the mafic rocks in the Kodiak batholith, however, our interpretation suggests that
ridge-trench interaction (northern trench-ridge-trench triple junction of the Resurrection plate) intersected
the southern Alaskan margin producing hot, dense MORB-type basaltic magmas generated by
decompression melting of asthenospheric mantle that upwelled into the opening gap, interacted with
peridotite in the mantle wedge underlying the volcanic arc forming compositionally transitional MORB-
like to arc magmas, and triggered partial melting of a heterogeneous source region.
Ridge subduction, thus, acted predominantly as a migrating (SW to NE) thermal trigger beneath
the accretionary prism, which sequentially partially melted a mixture of mantle-derived material and
40
ACC
EPTE
D M
ANU
SCR
IPT
ACCEPTED MANUSCRIPT
recycled continental crustal source rocks. Melt production and migration of the subducting ridge under
the prism is reflected in a trend from SW to NE along the axis of the batholith, resulting in younger
granite crystallization ages. The age trend suggests that the thermal/igneous event related to the Kodiak
batholith was relatively brief, in contrast to the typical metaluminous to peraluminous and relatively long-
lived orogenic batholiths (for example, Sierra Nevada Batholith, Peninsular Ranges Batholith of the
Californias, and Coast Batholith of Peru).
The Kodiak batholith overlaps the major and trace element compositions and εNd, Sr and Pb
isotopic values of metasedimentary rocks in the Chugach accretionary prism. The metasedimentary rocks
may represent the protoliths that provided granitic melts from the bottom of the accretionary prism. Major
and trace element analyses of the Kodiak Formation and the Ghost Rocks Formation show that they
resemble orogenic rocks. Both formations, however, differ in Fe2O3, CaO, Na2O, or MgO contents, and
are more aluminous than the Kodiak batholith. Comparison of trace element abundances (Nb, Ti, and Pb)
and ratios of 206Pb/204Pb, 207Pb/204Pb, and 208Pb/204Pb, as well as al Sr and εNd shows that the flysch mostly
overlaps the Kodiak batholith. The overall major- and trace element and isotopic similarity between the
flysch and the batholith support the idea that the granitic rocks could have been formed by anatexis of the
metasedimentary rocks. Support for this notion is also provided by experimental studies of greywacke
(Conrad et al. 1988) that has a bulk composition matching that of the Kodiak Formation. Results show
that greywacke melts closely replicate the composition of the Northern zone granites, but fail to produce
melts equivalent to the Southern and Central zones of the batholith. Instead, we suggest that the source
region in the accretionary prism undergoing melting likely included a more mafic lithology. We
suggested above that the mafic rocks (and intermediate evolutionary products) underplated and were
intercalated at the bottom of the prism prior to the arrival of the ridge. If this suggestion is reasonable,
experimental melting studies of amphibolites (Sisson et al., 2005) that have notable bulk chemical
similarities to the calc-alkaline mafic volcanic and intrusive rocks from the Eastern satellite group are
appropriate for comparison, and can be used to test whether the melt products match the compositions of
41
ACC
EPTE
D M
ANU
SCR
IPT
ACCEPTED MANUSCRIPT
the Southern and Central zones of the batholith. As reviewed above, the solidus assemblage for the
amphibolites is a fair match to the entire range of granitic compositions in the Southern and Central zones
of the batholith.
The preceding geochemical data support a model for the genesis of the Kodiak batholith from
partial melting of a mixed source consisting of a lithologically diverse sequence that included the Kodiak
Formation, and amphibolites in the source region. Estimates of mantle contributions to the batholith on
the basis of Nd isotopic compositions suggest a wide range, from 40%-80%. Samples having high mantle
contributions also have the young TDM ages and high values of εNd. The balance of the Nd isotopic budget
is thought to reflect a recently recycled crustal component represented by the Kodiak Formation, which
has the oldest TDM ages and lowest values of εNd. Partial melting of a mixed source is consistent with
decoupling of elemental abundances and ratios of the LILE/HFS from the isotope signatures in the
granitic rocks from the various zones. Mixing in the source region is also suggested by the lack of
covariations of major and trace element abundances and isotope compositions.
Geochemical observations summarized above support the idea that zonal compositional
differences represent incursion of different melts and the effects of mixing isotopically different magma
sources stored in the accretionary prism. These magmas were unlikely to be mutually related simply by in
situ fractional crystallization and assimilation and fractional crystallization reactions during transport
from their heterogeneous source region at the bottom of the accretionary prism and during emplacement
higher in the continental crust. Also, plots involving compatible element variations in the mafic to granitic
rocks scatter and do not produce mixing lines indicative of simple mixing of felsic melts and
contemporaneous mafic mantle-derived magmas, making simple two-component mixing unlikely. All of
these processes would have produced coherent elemental trends linking cogenetic rocks, as well as trace
element ratios correlated with isotopic values of Pb, Sr, and εNd. Offsets, compositional gaps, and the
heterogeneity in isotopic compositions in the Kodiak batholith can thus be taken as evidence that the
batholith and its satellites did not evolve directly from a common, more mafic parent.
42
ACC
EPTE
D M
ANU
SCR
IPT
ACCEPTED MANUSCRIPT
Significant recent advances have been made in the understanding of the petrogenesis of the near-
trench intrusives from the Sanak-Baranof belt (e.g., Bradley et al., 2003; Kusky et al., 2003, Sisson et al.,
2003a; Groome et al., 2003; Farris et al., 2006). In particular, based on an overview of ridge-trench
interactions in modern and ancient settings, Sisson et al. (2003b) suggested that although no unique
geological signature of ridge subduction events has been found, a combination of features that includes
igneous rock sequences and associated processes, records of thermal events, and changes in plate
kinematics can be diagnostic. Our study of the Kodiak batholith specifically highlights the need for
detailed documentation of diagnostic geochemical features of mantle-derived magmas and continental
sources implicated with granite genesis. In addition, we find that a more complete comprehension of the
evolution of mantle properties as a result of ridge subduction processes would better constrain models of
crustal evolution along the Sanak-Baranof belt, magmatism inboard from the slab window (back arc), and
crust-mantle interaction processes associated with changes in plate kinematics and deformation regimes.
Acknowledgements
The original manuscript was greatly improved through constructive reviews by Carter Hearn and
Jeffrey Grossman (both at the U.S. Geological Survey). We also thank two reviewers for their comments
made for the journal. For technical and laboratory assistance in the Radiogenic Isotope Laboratory, we
thank Anna Colvin, Jeremy Dillingham, Giuseppe Grezzi, John Jackson, Ann Lyon, and Jennifer Murphy.
We also extend our gratitude to P. McCrory and D. Wilson, guest editors of the special issue, for their
advice and comments in preparing the final document.
References
Arth, J.G., 1976. Behavior of trace elements during magmatic processes-A summary of theoretical
models and their applications. U.S. Geol. Survey, J. Res., 4, 41-47.
Arth, J.G., Barker, F., and Stern T.W., 1988. Coast batholith and Taku plutons near Ketchikan,
Alaska: Petrography, geochronology, geochemistry and isotopic character. Am J. Sci., 288-A,
43

ACC
EPTE
D M
ANU
SCR
IPT
ACCEPTED MANUSCRIPT
461-489.
Arculus, R.J., 2003. Use and abuse of the terms calcalkaline and calcalkalic. J. Petrol., 44, 929-935.
Ayuso, R.A., Schulz, K.J., 2003. Nd-Pb-Sr isotope geochemistry and origin of the Ordovician Bald
Mountain and Mount Chase massive sulfide deposits, northern Maine. In: Goodfellow, W.D.,
McCutcheon, S.R., Peter, J.M. (Eds.), Volcanogenic Massive Sulfide Deposits of the Bathurst
District and Northern Maine. Economic Geology Monograph 11, pp. 611-630.
Ayuso, R.A., Wooden, J.N., Foley, N.K., Seal, R., II, Sinha, A.K., 2005. U-Pb zircon ages and Pb
isotope geochemistry of gold deposits from the Carolina slate belt of South Carolina. Eco. Geol.,
100, 225-252.
Ayuso, R.A., Haeussler, P.J., Bradley, D.C., Farris, D.W., Colvin, A.S., 2005. The effects of ridge
subduction on chemical and isotopic zoning of the Kodiak batholith, southern Alaska (abs.).
Geol. Soc. Am. (abs.) 37, 80.
Barker, F., Farmer, G.L., Ayuso, R.A., Plafker, G., Lull, J.S., 1992. 50-Ma granodiorite of the
Eastern Gulf of Alaska: Melting in an accretionary prism in the forearc. J. Geophys. Research,
97, 6757-6778.
Bebout, G., 1996. Volatile transfer and recycling at convergent margins: mass balance and insights
from high-P/T metamorphic rocks: In: Bebout, G.E., Scholl, D.W., Kirby, S.H., Platt, J.P. (Eds.),
Subduction: Top to Bottom, Geophysical Monograph 96, Am. Geophys. Union, 179-193.
Bevier, M.L., Anderson, R.G., 1990. New U-Pb and K-Ar ages for igneous rocks, Iskut River map
area, B.C. Geol. Assoc. Can. Abst. Prog., 15, A-10.
Bradley, D.C., Kusky, T.M., 1992. Deforamtion history of the McHugh Complex, Seldovia
quadrangle, south central Alaska: U.S. Geological Survey Bulletin 1999, 17-32.
Bradley, D.C., Haeussler, P.J., and Kusky, T.M., 1993. Timing of Early Tertiary ridge subduction in
southern Alaska: U.S. Geological Survey Bulletin 2068, 163-177.
Bradley, D., Kusky, T., Haeussler, P., Goldfarb, R., Miller, M., Dumolin, J., Nelson, S.W., Karl, S.,
2003, Geologic signature of early Tertiary ridge subduction in Alaska: In: Sisson, V.B., Roeske,
44
ACC
EPTE
D M
ANU
SCR
IPT
ACCEPTED MANUSCRIPT
S.M., Pavlis, T.L. (Eds.), Geology of a Transpressional Orogen Developed during Ridge-Trench
Interaction along the North Pacific Margin. Geol. Soc. Am. Special Paper 371, 19-50.
Byrne, T., 1979, Late Paleocene demise of the Kula Pacific spreading center. Geology, 10, 191-196.
Clarke, D.B., 1981. The mineralogy of peraluminous granites; a review. Can. Mineral., 19, 3-17.
Class, C., Miller, D.M., Goldstein, S.L., and Langmuir, C.H., 2000. Distinguishing melt and fluid
subduction components in Umnak Volcanics, Aleutian Arc. Geochem. Geophys. Geosyst., 1,
paper number 1999GC000010.
Conrad, W.A., Nicholls, I.A., Wall, V.J., 1988. Water-saturated and undersaturated melting of
metaluminous and peraluminous crustal compositions at 10 kb: Evidence for the origin of
rhyolites in the Taupo Volcanic Zone, New Zealand, and other granitoids. J. Petrol., 29, 765-803.
Davidson, J.P., 1996. Deciphering mantle and crustal signatures in subduction zone magmatism. In:
Bebout, G.E., Scholl, D.W., Kirby, S.H., Platt, J.P. (Eds.), Subduction: Top to Bottom, Geophys.
Monograph 96, pp. 251-262.
Debaille, V., Doucelance, R., Weis, D., and Schiano, P., 2006. Multi-stage mixing in subduction
zones: Application to Merapi volcano (Java island, Sunda arc). Geochim. Cosmochim. Acta, 70,
723-741.
Delong, S.E., Schwarz, W.M., Anderson, R.N., 1979. Thermal effects of ridge subduction. Earth
Planet. Sci. Lett., 44, 239-246.
DePaolo, D.J., 1981. Trace element and isotopic effects of combined wall-rock assimilation and
fractional crystallization. Earth Planet. Sci. Lett., 53, 189-202.
Dumoulin, J. A., 1988. Sandstone petrographic evidence and the Chugach-Prince William terrane
boundary in southern Alaska. Geology, 16, 456-460.
Dusel-Bacon, C., Csejtev, B., Jr., Foster, H.L., Doyle, E.O., Nokleberg, W.J., Plafker, G., 1993.
Distribution, facies, ages, and proposed tectonic associations of regionally metamorphosed rocks
in east- and south-central Alaska: U.S. Geological Survey Professional Paper 1497-C, 1-72.
45
ACC
EPTE
D M
ANU
SCR
IPT
ACCEPTED MANUSCRIPT
Elliott, T., 2003. Tracers of the slab: In: Eiler, J. (Ed.), Inside the Subduction Factory. Geophys.
Monograph 138, Am. Geophys. Union, 23-46.
Engebretson, D.C., Cox, A.V., Gordon, R.G., 1985. Relative motions between oceanic and
continental plates in the Pacific Basin. Geol. Soc. Am. Sp. Paper 206, 59p.
Farmer, G.L., Ayuso, R.A., Plafker, G., 1993. A Coast Mountains provenance for the Valdez and
Orca Groups, southern Alaska, based on Nd, Sr, and Pb isotopic evidence. Earth Planet. Sci. Lett.,
116, 9-21.
Farris, D.W., and Paterson, S.R., 2007. Contamination of silici magmas and fractal fragmentation of
xenoliths in Paleocene plutons on Kodiak Islan, Alaska. Canadian Mineral., 45, 107-129.
Farris, D.W., Haeussler, P., Friedman, R., Paterson, S.R., Saltus, R.W., and Ayuso, R., 2006.
Emplacement of the Kodiak batholith: A consequence of slab-window migration. Geol. Soc. Am.
Bull., 118, 1360-1376.
Fisher, D., Byrne, T., 1987. Structural evolution of underthrusted sediments, Kodiak Islands, Alaska.
Tectonics, 6, 775-793.
Gill, J., 1981. Orogenic Andesites and Plate Tectonics. Springer, New York, 190.
Godwin, C.I., Gabites, J.E., and Andrew, A., 1988. A galena lead isotope data base for the Canadian
Cordillera, Province of British Columbia. Mineral. Res. Div. Pap. 1988-4.
Gorring, M.L., Kay, S.M., 2001. Mantle processes and sources of Neogene slab window magmas
from southern Patagonia, Argentina. J. Petrol., 42, 1067-1094.
Groome, W.G., Thorkelson, D.J., Friedman, R.M., Mortensen, J.K., Massey, N.W.D., Marshall,
D.D., Layer, P.W., 2003. Magmatic and tectonic history of the Leech River Complex, Vancouver
Island, British Columbia: Evidence for ridge-trench intersection and accretion of the Crescent
Terrane: In: Sisson, V.B., Roeske, S.M., Pavlis, T.L. (Eds.), Geology of a Transpressional Orogen
Developed during Ridge-Trench Interaction along the North Pacific Margin. Geol. Soc. Am.
Special Paper 371, p. 327-354.
46

ACC
EPTE
D M
ANU
SCR
IPT
ACCEPTED MANUSCRIPT
Haeussler, P.J., Bradley, D.C., Goldfarb, R.J., 2003a. Brittle deformation along the Gulf of Alaska
margin in response to Paleocene-Eocene triple junction migration: In: Sisson, V.B., Roeske, S.M.,
Pavlis, T.L. (Eds.), Geology of a Transpressional Orogen Developed during Ridge-Trench
Interaction along the North Pacific Margin. Geol. Soc. Am. Special Paper 371, p. 119-140.
Haeussler, P.J., Bradley, D.C., Wells, R., Miller, M.L., 2003b. Life and death of the Resurrection
plate: Evidence for an additional plate in the northeastern Pacific in Paleocene-Eocene time.
Geol. Soc. Am. Bull., 115, 867-880.
Haeussler, P.J., Bradley, D.C., Goldfarb, R., Snee, L., 1995. Link between ridge subduction and gold
mineralization in southern Alaska. Geology, 23, 995-998.
Hanson, G.N., 1978. The application of trace elements to the petrogenesis of igneous rocks of
granitic composition. Earth Planet. Sci. Lett., 38, 26-43.
Harris, N.R., Sisson, V.B., Wright, J.E., Pavlis, T.L., 1996. Evidence for Eocene mafic underplating
during fore-arc intrusive activity, eastern Chugach Mountains, Alaska. Geology, 24, 263-266.
Hart, S.R., 1984. A large-scale isotope anomaly in the Southern Hemisphere mantle. Nature, 309,
753-757.
Hawkesworth, C.J., Hergt, J.M., McDermott, F., Ellam, R.M., 1991. Destructive margin magmatism
and the contributions from the mantle wedge and subducted crust. Australian J. Earth Sci., 38,
577-594.
Henderson, P. 1986. Inorganic Geochemistry. Pergamon Press, 356 p.
Hill, M., Morris, J., 1982. Source rocks for Paleocene granitic intrusives of the Kodiak-Shumagin
shelf, southwest Alaska: Evidence from Pb and Nd isotopes. EOS, Trans. Am. Geophys. Union,
63, 462.
Hill, M., Morris, J., Whelan, J., 1981. Hybrid granodiorites intruding the accretionary prism, Kodiak,
Shumagin, and Sanak Islands, southwest Alaska. J. Geophys. Res., 86, 10569-10590.
Hudson, T., 1994. Crustal melting events in Alaska. In: Plafker, G., Berg, H.C. (Eds.), The Geology
of Alaska: Geol. Soc. Am., Geology of North America, v. G-1, 657-670.
47

ACC
EPTE
D M
ANU
SCR
IPT
ACCEPTED MANUSCRIPT
Hudson, T., Plafker, G., Peterman, Z.E., 1979. Paleogene anatexis along the Gulf of Alaska margin.
Geology, 7, 573-577.
Jones, D.L., Siberling, N.J., Coney, P.J., Plafker, G., 1987. Lithotectonic terrane map of Alaska
(west of the 141st meridian). U.S. Geological Survey Misc. Field Studies Map, MF-1874-A.
Karsten, J.L., Klein, E.M., Sherman, S.B., 1996. Subduction zone geochemical characteristics in
ocean ridge basalts from the southern Chile Ridge: Implications of modern ridge subduction
systems for the Archean. Lithos, 37, 143-161.
Kay, R.W., 1978. Aleutian magnesian andesites: melts from subducted Pacific ocean crust. J. Volc.
Geoth. Res., 4, 117-132.
Kay, R.W., 1980. Volcanic arc magmas: implications of a melting-mixing model for element
recycling in the crust-upper mantle system. J. Geol., 88, 497-522.
Kela, J.M., Stakes, D.S., Duncan, R.A., 2007. Geochemical and age constraints on the formation of
the Gorda Escarpment and Mendocino Ridge of the Mendocino transform fault in the NE Pacific.
Geol. Soc. Amer. Bull., 119, 88-100.
Klein, E.M., 2003. Geochemistry of the igneous oceanic crust. Treatise on Geochemistry, 3-13, 433-
463.
Kuno, H., 1966. Lateral variation of basalt magma across continental margins and island arcs. Bull.
Volcan., 29, 195-222.
Kusky, T.M., Bradley, D.C., Donley, D.T., Rowley, D, Haeussler, P.J., 2003. Controls on intrusion
of near-trench magmas of the Sanak-Baranof belt, Alaska, during Paleogene ridge subduction,
and consequences for forearc evolution: In: Sisson, V.B., Roeske, S.M., Pavlis, T.L. (Eds.),
Geology of a Transpressional Orogen Developed during Ridge-Trench Interaction along the
North Pacific Margin. Geol. Soc. Am. Special Paper 371, 269-292.
Langmuir, C.H., Bender, J.F., 1984. The geochemistry of oceanic basalts in the vicinity of transform
faults: observations and implications. Earth Planet. Sci. Lett., 69, 107-127.
48

ACC
EPTE
D M
ANU
SCR
IPT
ACCEPTED MANUSCRIPT
Luhr, J.F., Aranda-Gomez, J.J., Housh, T.B., 1995. San Quintin volcanic field, Baja California
Norte, Mexico: geology, petrology and geochemistry. J. Geophys. Res., 100, 10353-10380.
Lytwyn, J., Lockhart, S., Casey, J., Kusky, T., 2000. Geochemistry of near-trench intrusives with
ridge subduction, Seldovia quadrangle, southern Alaska. J. Geophys. Res., 105, 27,957-27,978.
Marshak, R.S., Karig, D.E., 1977. Triple junctions as a cause for anomalously near-trench igneous
activity between the trench and volcanic arc. Geology, 5, 233-236.
Miller, C.F., Watson, E.B., Rapp, R.P., 1985. Experimental investigation of mafic mineral-felsic
liquid equilibria: preliminary results and petrogenetic implications (abs.). EOS, Trans. Am.
Geophys. Union, 66, 1130.
Moore, J.C., Byrne, T., Plumley, P.W., Reid, M., Gibbons, H., Coe, R.S., 1983. Paleogene evolution
of the Kodiak Islands, Alaska: Consequences of ridge-trench interaction in a more southerly
latitude. Tectonics, 2, 265-293.
Nilsen, T.H., Moore, G.W., 1979. Reconaissance study of Upper Cretaceous to Miocene
stratigraphic units and sedimentary facies, Kodiak and adjacent islands, Alaska. U.S. Geological
Survey Professional Paper 1093, 1-34.
Patino Douce, A.E., 1999. What do experiments tell us about the relative contributions of crust and
mantle to the origin of granitic magmas? In: Castro, A., Ferandez, C., Vigneresse, J.L., (Eds.),
Understanding Granites: Integrating New and Classical Techniques, Geol. Soc. London, Special
Publication, 168, 55-75.
Pavlis, T.L., Sisson, V.B., 1995. Structural history of the Chugach metamorphic complex in the Tana
River region, eastern Alaska: A record of Eocene ridge subduction. Geol. Soc. Am. Bull., 107,
1333-1355.
Plafker, G., Jones, D.L., Pessagno, E.A., Jr., 1977. A Cretaceous accretionary flysch and mélange
terrane along the Gulf of Alaska margin: U.S. Geological Survey Circular 751B, 41-43.
49
ACC
EPTE
D M
ANU
SCR
IPT
ACCEPTED MANUSCRIPT
Plafker, G., Nokleberg, W.J., Lull, J.S., 1989. Bedrock geology and tectonic evolution of the
Wrangellia, Peninsular, and Chugach terranes along the Trans-Alaska Crustal Transect in the
Chugach Mountains and souther Copper River Basin, Alaska. J. Geophys. Res., 94, 4255-4295.
Rapp, R.P., Watson, E.B., 1995. Dehydration melting of metabasalt at 8-32 kbar: Implications for
continental growth and crust-mantle recycling. J. Petrol., 36, 891-931.
Richardson, S.W., Gilbert, M.C., Bell, P.M., 1969. Experimental determination of kyanite-andalusite
and andalusite-sillimanite equilibria: the aluminum silicate triple point. Am. J. Sci., 267, 259-272.
Ryan, J., Morris, J., Bebout, G., Leeman, B., 1996. Describing chemical fluxes in subduction zones:
insights from “depth-profiling” studies of arc and forearc rocks. In: Bebout, G.E., Scholl, D.W.,
Kirby, S.H., Platt, J.P., (Eds.), Subduction: Top to Bottom, Geophysical Monograph 96, Am.
Geophys. Union, 263-276.
Sample, J.C., Fisher, 1986. Duplexes and underplating in an ancient accretionary complex, Kodiak
islands, Alaska. Geology, 14, 160-163.
Sample, J.S., Moore, J.C., 1987. Structural style and kinematics of an underplated slate belt, Kodiak
and adjacent islands, Alaska. Geol. Soc. Am. Bull., 99, 7-20.
Sample, J.C., Reid, M.R., 2003. Large-scale, latest Cretaceous uplift along the northeast Pacific Rim:
Evidence from sediment volume, sandstone petrography, and Nd isotope signatures of the Kodiak
Formation, Kodiak Island, Alaska: In: Sisson, V.B., Roeske, S.M., Pavlis, T.L. (Eds.), Geology of
a Transpressional Orogen Developed during Ridge-Trench Interaction along the North Pacific
Margin. Geol. Soc. Am. Special Paper 371, 51-70.
Samson, S.D., Patchett, P.J., McClelland, W.C., Gehrels, G.E., 1991. Nd and Sr isotopic constraints
on the petrogenesis of the west side of the northern Coast Mountains batholith, Alaskan and
Canadian Cordillera. Can. J. Earth Sci., 28, 939-946.
Sisson, T.W., Ratajeski, K., Hankins, W.B., Glazner, A.F., 2005. Voluminous granitic magmas from
basaltic sources. Contrib. Mineral. Petrol., 148, 635-661.
50

ACC
EPTE
D M
ANU
SCR
IPT
ACCEPTED MANUSCRIPT
Sisson, V.B., Pavlis, T.L., Roeske, S.M., Thorkelson, D.J., 2003a. Introduction: An overview of
ridge-trench ineractions in modern and ancient settings: In: Sisson, V.B., Roeske, S.M., Pavlis,
T.L. (Eds.), Geology of a Transpressional Orogen Developed during Ridge-Trench Interaction
along the North Pacific Margin. Geol. Soc. Am. Special Paper, 1-18.
Sisson, V.B., Poole, A.R., Harris, N.R., Burner, H.C., Pavlis, T.L., Copeland, P., Donelick, R.A.,
McLelland, W.C., 2003b. Geochemical and geochronologic constraints for genesis of a tonalite-
trondhjemite suite and associated mafic intrusive rocks in the eastern Chugach Mountains,
Alaska: A record of ridge-transform subduction: In: Sisson, V.B., Roeske, S.M., Pavlis, T.L.
(Eds.), Geology of a Transpressional Orogen Developed during Ridge-Trench Interaction along
the North Pacific Margin. Geological Society of America Special Paper 371, p. 293-326.
Sisson, V.B., Hollister, L.S., Onstott, T.C., 1989. Petrologic and age constraints on the origin of a
low-pressure/high-temperature metamorphic complex, southern Alaska. J. Geophys. Res., 94,
4392-4410.
Stacey, J.D., Kramers, J.N., 1975. Approximation of terrestrial lead isotope evolution by a two-stage
model. Earth Planet. Sci. Lett., 36, 207-222.
Stevens, G., Clemens, J.D., Droop, G.T.R., 1997. Melt production during granulite-facies anatexis:
experimental data from “primitive” metasedimentary protoliths. Contrib. Mineral. Petrol., 128,
352-370.
Sun, S.S., McDonough, W.F. Chemical and isotopic systematics of oceanic basalts: implications for
mantle composition and processes. In: Saunders, A.D., Norry, M.J., (Eds.), Magmatism in the
Ocean Basins, Geol. Soc. Special Pub. 42, 313-345.
Tangalos, G.E., Farris, D.R., Valley, D.W., Haeussler, P.J., Haileab, B. 2003. Genesis and
contamination of the Kodiak batholith, Kodaik Island, Alaska: using O18 to quantify the
assimilated component of the batholith. Geol. Soc. Am. Abstr. Programs 35, 325.
51
ACC
EPTE
D M
ANU
SCR
IPT
ACCEPTED MANUSCRIPT
Tatsumi, Y., Hamilton, D.L., Nesbitt, R.W., 1986. Chemical characteristics of fluid phase released
from a subducted lithosphere and the origin of arc magmas: evidence from high pressure
experiments and natural rocks. J. Volc. Geoth. Res., 29, 293-309.
Taylor, S.R., and McLennan, S.M., 1985. The Continental Crust: its Composition and Evolution.
Blackwell Scientific Publications, 312 p.
Thorkelson, D.J., 1996. Subduction of diverging plates and the principles of slab window formation.
Tectonophysics, 255, 47-63.
Thorkelson, D.J., Taylor, R.P. 1989. Cordilleran slab windows. Geology, 17, 833-836.
Thorkelson, D.J., Breitsprecher, K., 2005. Partial melting of slab window margins: genesis of
adakitic and non-adakitic magmas. Lithos, 79, 25-41.
Tysdal, R.G., Case, J.E., Winkler, G.R., Clark, S.H.B., 1977. Sheeted dikes, gabbro, and pillow
basalt in flysch of coastal southern Alaska. Geology, 5, 377-383.
Vrolijk, P. Meyers, G., and Moore, J.C., 1988. Warm fluid migration along tectonic mélanges in the
Kodiak accretionary complex, Alaska. J. Geophy. Res., B9, 10313-10324.
Winkler, G.R., 1976. Deep sea fan deposition of the Lower Tertiary Orca Group, eastern Prince
William Sound, Alaska, in Recent and Ancient Sedimentary Environments in Alaska: In: Miller,
T.P. (Ed.), 1975 Symposium Proceedings, R1-R20, Alaska Geological Society, Anchorage.
Zartman, R.E., Doe, B.R., 1981. Plumbotectonics - the model. Tectonophysics, 75, 135-162.
Zartman, R.E., Futa, K., Peng, Z.C. 1991. A comparison of Sr-Nd-Pb isotopes in young and old
continental lithospheric mantle: Patagonia and eastern China, Australian J. Earth Sci., 38, 545-
557.
Zindler, A., Hart, S.R., 1986. Chemical geodynamics. Ann. Rev. Earth Planet. Sci., 14, 493-571.
Figures
Figure 1. Map of the Kodiak batholith showing internal subdivisions and sample locations: Southern
zone, Central zone, and Northern zone; groups of igneous rocks flanking the batholith: Northern
52
ACC
EPTE
D M
ANU
SCR
IPT
ACCEPTED MANUSCRIPT
satellites, Western satellites, and Eastern satellites; and country rocks shown in gray (the
Uppermost Cretaceous Kodiak Formation, and the Paleocene Ghost Rocks Formation; Sample
and Moore, 1987; Sample and Read, 2003). The Kodiak Formation outcrops east of the Uganik
thrust (landward boundary) and west of the Contact fault (seaward boundary). The Kodiak
Formation was intruded by the main mass of the Kodiak batholith (Southern, Central and
Northern zones) and the Northern and Western satellite plutons. The Ghost Rocks Formation
outcrops east of the Contact fault and was intruded by some of the Eastern satellite plutons. Map
also shows location of samples used for zircon geochronology (Farris et al., 2006). Inset map of
Alaska shows the Chugach-Prince William accretionary wedge (Chugach-Prince William
terrane), Sanak-Baranof near-trench intrusive rocks, and the Kodiak batholith (Bradley et al.,
2003).
Figure 2. Modal compositions of the granitic rocks of the Kodiak batholith. The four modal
components illustrated are quartz, plagioclase, alkali feldspar, and the sum of the mafic minerals.
The Kodiak batholith follows a calc-alkaline trend as a whole, showing moderate internal
differences that distinguish the relatively plagioclase- and mafic minerals-enriched (biotite)
Central zone from the Northern zone. In the satellite rocks, those from the Eastern satellite group
include quartz gabbro and diorite and consequently are also relatively enriched in plagioclase and
mafic minerals.
Figure 3. A) Total alkalies vs. SiO2; B) K2O vs SiO2; C) ASI (alumina saturation index) vs SiO2; D)
Al2O3/(MgO+FeOtotal+TiO2) versus Al2O3+MgO+FeOtotal+TiO2 for the Kodiak batholith, Kodiak
Formation, and Ghost Rocks Formation (symbols as in Fig. 2). Generalized fields show
experimental melt compositions of peraluminous leucogranites, metagreywacke, and amphibolite
taken from Patino Douce (1999); experimental melt compositions also shown: sample 623B from
Conrad et al. (1988), and sample 1649 from Sisson et al. (2005).
Figure 4. Major element variation diagrams for the Kodiak batholith: A) Al2O3; B) MgO; C) FeOtotal;
D) TiO2; E) Na2O; F) CaO; G) K2O; H) P2O5. Starting materials used for melting studies:
53
ACC
EPTE
D M
ANU
SCR
IPT
ACCEPTED MANUSCRIPT
greywackes (sample #623, Conrad et al., 1988), open star symbols, and medium-K basaltic
andesite (sample YOS-55A, Sisson et al., 2005), solid star symbols. The Kodiak batholith shows
inverse correlations of Al2O3, MgO, FeOtotal, TiO2, and CaO with increasing SiO2; the alkalies are
generally directly correlated with SiO2.
Figure 5. Trace element variation diagrams for the Kodiak batholith (symbols as in Fig. 2): A) Ba; B)
Sr; C) Rb; D) Zr; E) V); F) Cr; G) Ni; H) Sc. Granitic rocks from the Southern, Central, and
Northern zones of the Kodiak batholith, as well as from the satellite groups, generally have
overlapping trends or in some cases occupy distinct compositional fields (e.g., Eastern satellite
group, Northern satellite group). Contents of Sr, V, Ni, and Sc are inversely correlated with SiO2,
and Ba and Rb are directly correlated with SiO2..
Figure 6. Multi-element primitive mantle-normalized plots (Sun and McDonough, 1989) of samples
from the Kodiak batholith. Tonalite and granodiorite from: A) Southern zone (SiO2 = 62.52-65.16
wt.%); B) Central zone (SiO2 = 57.31-65.42 wt.%); C) Northern zone (SiO2 = 64.18-72.02 wt.%).
D) Granodiorite and granite from the Western and Northern satellite groups (SiO2 = 68.05-75.75
wt.%). E) Mafic, intermediate, and felsic igneous rocks of the Eastern satellite group (outer
trenchward belt), which intruded the Ghost Rocks Formation (SiO2 = 45.92-66.01 wt.%);
granodiorite and granite from the Eastern satellite group (inner trenchward belt) adjacent to
batholith, which intruded the Kodiak Formation and the Ghost Rocks Formation (SiO2 = 54.21-
80.41 wt.%). F) Kodiak Formation (SiO2 = 61.74-66.30 wt.%), Ghost Rocks Formation (SiO2 =
59.27-61.33 wt.%), and country rock inclusion in the Kodiak batholith (SiO2 = 58.24 wt.%). Also
shown for comparison are patterns for normal MORB (N-MORB), and enriched MORB (E-
MORB), (Sun and McDonough, 1989) and upper continental crust (UCC) (Taylor and
McLennan, 1985). The multi-element diagrams show a relatively tight bundle of lines
characterized by spiked patterns for individual zones in the batholith, small to large troughs for
Th, large to moderate troughs for Nb and Ti, and large spikes for Pb. The leucogranites of the
54
ACC
EPTE
D M
ANU
SCR
IPT
ACCEPTED MANUSCRIPT
Northern zone show somewhat larger Pb spikes than granitic rocks elsewhere in the batholith, and
consistently deep troughs for Ti, the heavy rare-earth elements and Y.
Figure 7. Chondrite-normalized rare-earth element diagrams of the Kodiak batholith. A) Southern
zone. B) Central zone. C) Northern zone. D) Western and Northern satellite groups. E) Mafic,
intermediate, and felsic igneous rocks of the Eastern satellite group, outer trenchward belt;
granodiorite and granite from the Eastern satellite group, inner trenchward belt adjacent to
batholith. F) Kodiak Formation, Ghost Rocks Formation, and country rock inclusion. Other
patterns are as in Fig. 6. The Kodiak batholith is characterized by moderately steep light REEs
and by gently sloping to flat heavy REEs. Individual zones have similar REE patterns.
Leucogranites from the Northern satellites generally have large negative Eu anomalies and lower
total REE contents than the tonalitic and granitic rocks from the main zones of the batholith.
Figure 8. A) Th/Ta vs TiO2. B) Ce/Pb vs. Nb/U (symbols as in Fig. 2). Fields for island arc tholeiite,
normal MORB and OIB, marine sediments, and the average composition of continental crust are
from Klein (2003). The plot of Th/Ta vs. TiO2 emphasizes the zonal distinction within the
batholith (Southern and Central zones as a group compared to the Northern zone). Compositional
fields for the batholith as a whole depart from each other and lack orderly trends even within
individual zones. The plot of Nb/U versus Ce/Pb (Klein, 2003) shows the Kodiak batholith and
flanking igneous groups plot between a calc-alkaline end-member (similar to arc lavas) and an
altered oceanic crust end-member..
Figure 9. Histograms of isotopic values for samples from the Kodiak batholith and country rocks: A)
εNd. B) TDM or crustal residence ages. C) Initial 87Sr/86Sr. D) 206Pb/204Pb; E) 207Pb/204Pb; F)
208Pb/204Pb. Main batholith includes the Southern, Central, and Northern zones; satellites refer to
the Northern, Western, and Eastern satellite groups; inclusion is Kodiak Formation in the granitic
rocks of the Central zone.
Figure 10. A) 206Pb/204Pb vs. 207Pb/204Pb, and B) 206Pb/204Pb vs. 208Pb/204Pb for the Kodiak batholith,
adjacent satellite groups, Kodiak Formation, and Ghost Rocks Formation (symbols as in Fig. 2).
55
ACC
EPTE
D M
ANU
SCR
IPT
ACCEPTED MANUSCRIPT
Orca and Valdez Groups, basaltic tuffs, and granitic rocks (near Cordova) from the eastern Gulf
of Alaska are from Barker et al. (1992) and Farmer et al. (1993). Data from Sanak pluton, and
Sanak (argillite and greywacke) from the Kodiak-Shumagin shelf from southwest Alaska are
from Hill and Morris (1982). The northern Coast Plutonic Complex (CPC) is shown for reference
(Godwin et al., 1988; Bevier and Anderson, 1990; Farmer, unpub. data). Also illustrated are the
model growth curve for average crust (S&K, tick marks at 250 m.y., Stacey and Kramers, 1974),
which closely resembles the composition of the orogene model growth curve (arc rocks). Model
growth curves for upper continental crust, orogene, and mantle (tick marks at 400 m.y.) are from
Zartman and Doe (1981). The Northern Hemisphere Reference Line (NHRL) is from Hart
(1984). A line representing an age of ~1 Byr (TDM or crustal residence age of the flysch) is shown
for reference.
Figure 11. εNd versus initial 87Sr/86Sr for the Kodiak batholith, adjacent satellite groups, Kodiak
Formation, and Ghost Rocks Formation (symbols as in Fig. 2). Granitic rocks from the Cordova
area (Barker et al., 1992) and the Orca and Valdez Groups (flysch) from eastern Gulf of Alaska
(Farmer et al., 1993) are shown for comparison. Nd and Sr isotopic data for the northern Coast
Plutonic Complex (CPC, a possible source of recycled material into the accretionary flysch) is
shown for reference (Arth et al., 1988; Samson et al., 1991; Farmer et al., 1993, and references
therein).
Figure 12. Variation diagrams for A) Sc-K2O. B) Sc-Th for the Kodiak batholith (symbols as in Fig.
2) illustrating trends of models for fractional crystallization (FC) and assimilation-fractional
crystallization (AFC). Abbreviations: FCSC, path of fractional crystallization of tonalite and
granodiorite, Southern zone and Central zones; AFCSC, path of assimilation-fractional
crystallization of tonalite and granodiorite, Southern and Central zones; FCN, fractional
crystallization of tonalite and granodiorite, Northern zone; AFCN, path of assimilation-fractional
crystallization of tonalite and granodiorite, Northern zone. Fractional crystallization and AFC
56

ACC
EPTE
D M
ANU
SCR
IPT
ACCEPTED MANUSCRIPT
57
paths show the evolution of the liquids at 0.1 increments. The FC trend does not link all the
granitic rocks. Compositional offsets and diverging trends indicate that the variations cannot be
the result of AFC reactions involving a single crustal contaminant or a simple mineral
assemblage. The extent and effects of chemical reactions between the magmas and country rocks
were limited and AFC reactions did not produce significant and systematic changes in
composition of the host granitic magmas. See text for more detailed explanation.
Figure 13. A) εNd versus 206Pb/204Pb illustrating compositional trends in the Kodiak batholith
(symbols as in Fig. 2) and possible mixing models relating the mantle wedge source (North
Pacific MORB), MORB fluid (subducted altered basaltic crust), and flysch (Kodiak Formation).
The fields and compositions representing mantle wedge plus MORB fluids, mantle wedge plus
sediment melt or sediment fluid, and possible isotopic trends as a result of mixing were modified
from Class et al. (2000), and Debaille et al. (2006). B) 87Sr/86Sr versus 206Pb/204Pb. C) 206Pb/204Pb
versus Nd/Pb. D) 207Pb/204Pb vs. Ce/Pb. Isotopic and trace element trends are consistent with
mixing of source rocks originally derived from the mantle wedge (MORB-type basalt enriched by
fluid-soluble elements) as one compositional end-member, together with melts and fluids derived
from flysch. Isotopic compositions are intermediate between the mantle wedge source (87Sr/86Sr
<0.7030; εNd ~ +9; 206Pb/204Pb < 18.8), and fluids and/or melts from flysch (87Sr/86Sr >0.7065; εNd
~ -4; 206Pb/204Pb > 19) of the Kodiak Formation.

ACC
EPTE
D M
ANU
SCR
IPT
ACCEPTED MANUSCRIPT
AK-15
AK-14
AK-31AK-32, 33, 34
AK-35
KD-70C
AK-3, 4
AK-5
KD-141APH-104B
KD-137AAK-1, 2
PH-107B
KD-72BKD-74B
KD-75D
AK-17AK-18
AK-20
AK-19
AK-21
AK-22AK-23
AK-24
AK-25
AK-39
AK-26AK-8, 9AK-12, 13
AK-10AK-7 AK-6
AK-11 AK-30
AK-28
PH-116A
AK-29AK-16
AK-27
AK-42, 43AK-41
AK-40
AK-37AK-38 AK-36
KD-60B
PH-121A
KD-56A
AK-44
Southern
zon
e
Centra
l zon
e
Kodiak
Formati
on Contac
t fault
W 153 00'
57
00'
N
62(9) Masignificantinheritance
58.5 (0.1) Ma(KD52)
58.4 (0.2) Ma(KD57A)
59.1 (0.2) Ma(RD57)
59.2 (0.2) Ma(KD56)
59.0 (0.3) Ma(KD81A)
58.9 (0.2) Ma
0 30 mi2010
0 50 km40302010
Faults
U/Pb zircon ages
(analytical error)
Westernsatellites
ο
ο
KodiakIsland
ALASKAN
Shumagin Islands
Kodiak batholith
Chugach-Prince William accretionary wedgePaleocene, Eocene plutons (large, small) Oligocene and early Miocene plutons
PrinceWilliamSound
Figure 1
Eastern satellitesNorthern zone
Western satellites
Central zone
Northern satellites
Southern zone
Sampling sites
Trenchward belt- inner zoneTrenchward belt- outer zone
Easternsatellites
Northernsatellites
Northern zone
Sanak Is.
Kodiak
Fm.
Uganik
thru
st
Kodiak
Formati
onKod
iak
Fm.
Ghost
Rocks
Formati
on
Ghost
Rocks
Formati
on
Kodiak Fm.

ACC
EPTE
D M
ANU
SCR
IPT
ACCEPTED MANUSCRIPT
QUARTZMAFICS MAFICS
MAFICS
K-FELDSPAR PLAGIOCLASE
dioritegabbro
norite
quartz dioritequartz gabbro
tonalite-
quartz-rich granitoids
granite
Central zoneSouthern zone
Northern zone Western satellites
Northern satellites
Eastern satellites/outer
Kodiak Formation
Inclusion
Ghost Rocks Formation
Figure 2
Eastern satellites/inner
grano-diorite
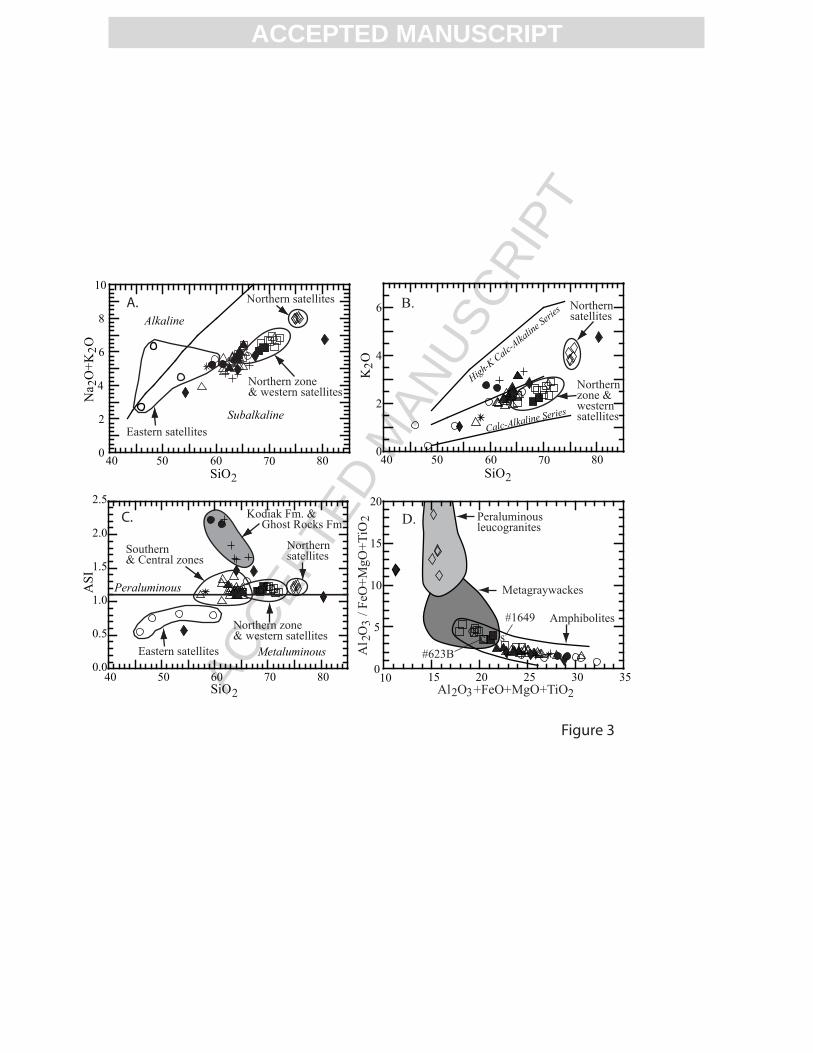
ACC
EPTE
D M
ANU
SCR
IPT
ACCEPTED MANUSCRIPT
40 50 60 70 800
2
4
6
8
10
Na
O+K
O
SiO
Subalkaline
Alkaline
2
2
2
Northern satellites
Eastern satellites
Northern zone & western satellites
A.
0
2
4
6
Calc-Alkaline Series
High-K Calc-Alka
line Seri
es
40 50 60 70 80SiO2
K O 2
Northern satellites
Northern zone & western satellites
B.
40 50 60 70 800.0
0.5
1.0
1.5
2.0
2.5
ASI
SiO 2
Metaluminous
Peraluminous
Kodiak Fm. & Ghost Rocks Fm.
Northern zone & western satellites
Northern satellitesSouthern
& Central zones
Eastern satellites
C.
10 15 20 25 30 350
5
10
15
20
Al O +FeO+MgO+TiO 2 3 2
Al
O
/ FeO
+MgO
+TiO
2
32 Peraluminous
leucogranites
Metagraywackes
Amphibolites #1649
#623Bc s
D.
Figure 3
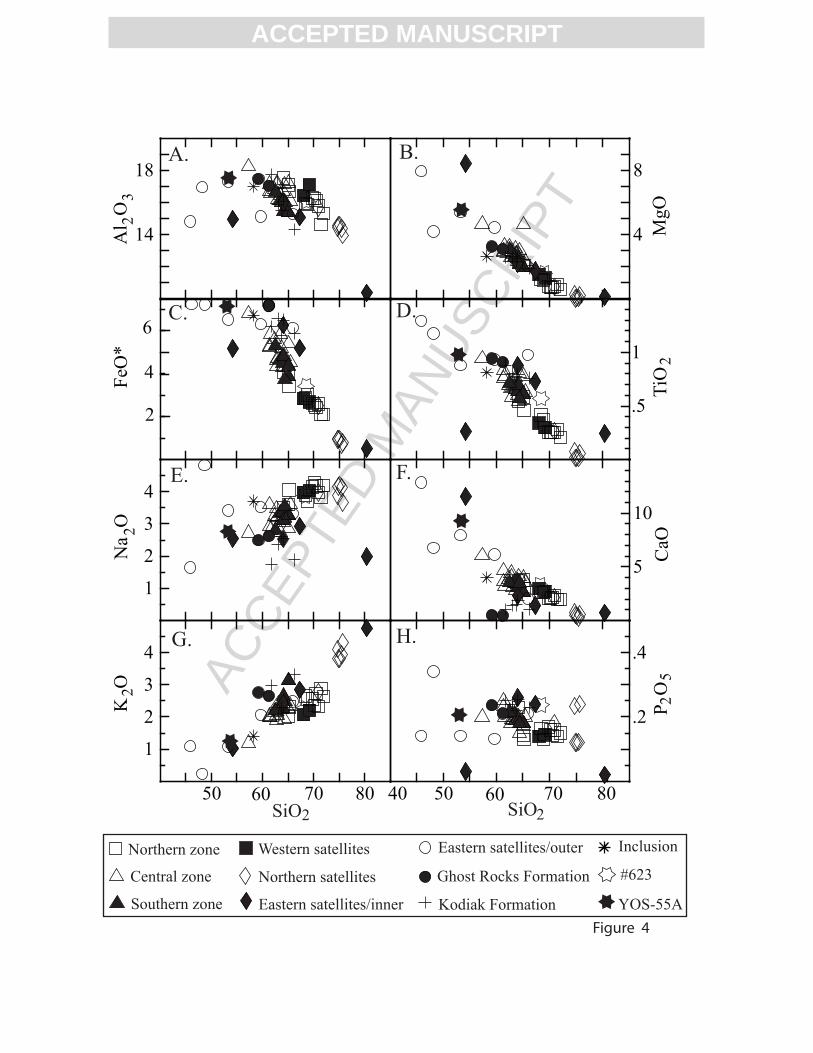
ACC
EPTE
D M
ANU
SCR
IPT
ACCEPTED MANUSCRIPT
14
18
Al
O
4
8
MgO
6
FeO
*
.5
1
1
2
3
4
5
10
CaO
50 70 80
1
2
3
4
40 60 70 80
.2
.4
2
3
TiO
2
Na
O 2
K O 2
P O 2
5
SiO2 SiO2
2
4
60 50
A. B.
C. D.
E. F.
G. H.
Central zone
Southern zone
Northern zone Western satellites
Northern satellites
Eastern satellites/inner
Eastern satellites/outer
Kodiak Formation
Inclusion
Ghost Rocks Formation
Figure 4
YOS-55A
#623

ACC
EPTE
D M
ANU
SCR
IPT
ACCEPTED MANUSCRIPT
0
500
1000
1500B
a
0
100
300
500
Sr
0
100Rb
0
100
200
Zr
0
100
200
V
0
100
200
Cr
0
50
100
Ni
0
10
30Sc
Ba = 2660
50 70 80 60 70 80SiO2 SiO2
60 50
A. B.
C. D.
G. H.
E. F.
Figure 5
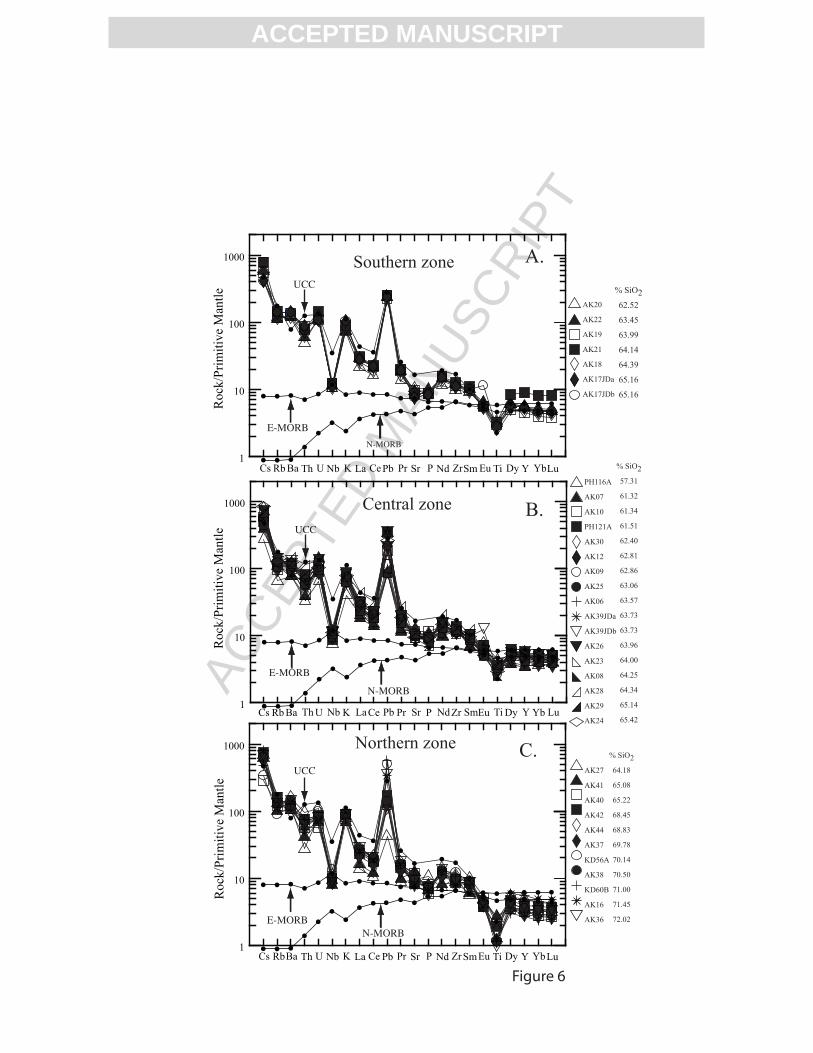
ACC
EPTE
D M
ANU
SCR
IPT
ACCEPTED MANUSCRIPT
AK20
AK22
AK19
AK21
AK18
AK17JDa
AK17JDb
% SiO262.52
63.45
63.99
64.14
64.39
65.16
65.16
1
10
100
1000 Southern zone
Roc
k/Pr
imiti
ve M
antle
N-MORB
E-MORB
UCC
Cs Rb Ba Th U Nb K La Ce Pb Pr Sr P Nd ZrSm Eu Ti Dy Y YbLu
A.
PH116A
AK07
AK10
PH121A
AK30
AK12
AK09
AK25
AK06
AK39JDa
AK39JDb
AK26
AK23
AK08
AK28
AK29
AK24
% SiO257.31
61.32
61.34
61.51
62.40
62.81
62.86
63.06
63.57
63.73
63.73
63.96
64.00
64.25
64.34
65.14
65.42
1
10
100
1000
Cs Rb Ba Th U Nb K LaCe Pb Pr Sr P NdZr SmEu Ti Dy Y Yb Lu
N-MORB
E-MORB
UCC
Roc
k/Pr
imiti
ve M
antle
Central zone B.
AK27
AK41
AK40
AK42
AK44
AK37
KD56A
AK38
KD60B
AK16
AK36
% SiO264.18
65.08
65.22
68.45
68.83
69.78
70.14
70.50
71.00
71.45
72.02
1
10
100
1000 Northern zone
N-MORB E-MORB
UCC
Roc
k/Pr
imiti
ve M
antle
Cs RbBa Th U Nb K La Ce Pb Pr Sr P Nd Zr SmEu Ti Dy Y YbLu
C.
Figure 6

ACC
EPTE
D M
ANU
SCR
IPT
ACCEPTED MANUSCRIPT
AK15
AK14
AK31
KD70DF
AK35
AK32
AK33
KD70C
% SiO268.05
69.16
70.89
74.76
74.86
75.18
75.56
75.75
.1
1
10
100
1000
Roc
k/Pr
imiti
ve M
antle
N-MORB
E-MORB
UCC Western
Northern
Satellites
Cs RbBa Th U Nb K La Ce Pb Pr Sr P Nd Zr SmEu Ti Dy Y Yb Lu
D.
InnerPH-104B
KD-137A
KD-31B
KD-141A
AK-05
OuterKD-75D
KD-74B
KD-72B
PH-107B
% SiO245.92
48.27
53.38
59.74
66.01
54.21
64.06
67.34
80.41
.1
1
10
100
1000 Satellites
Roc
k/Pr
imiti
ve M
antle
N-MORB
E-MORB
UCCEastern
Cs RbBa Th U Nb K La Ce Pb Pr Sr P Nd Zr SmEu Ti Dy Y YbLu
E.
AK01
AK02
AK11
AK03
AK04
AK43
AK34
AK13
% SiO259.27
61.33
61.74
63.07
63.78
64.07
66.30
58.24
1
10
100
1000 Ghost Rocks
Kodiak
Inclusion
N-MORB
E-MORB
UCC
Roc
k/Pr
imiti
ve M
antle
Cs RbBa Th U Nb K La Ce Pb Pr Sr P Nd Zr SmEu Ti Dy Y YbLu
F.Country Rocks
Figure 6 (continued)
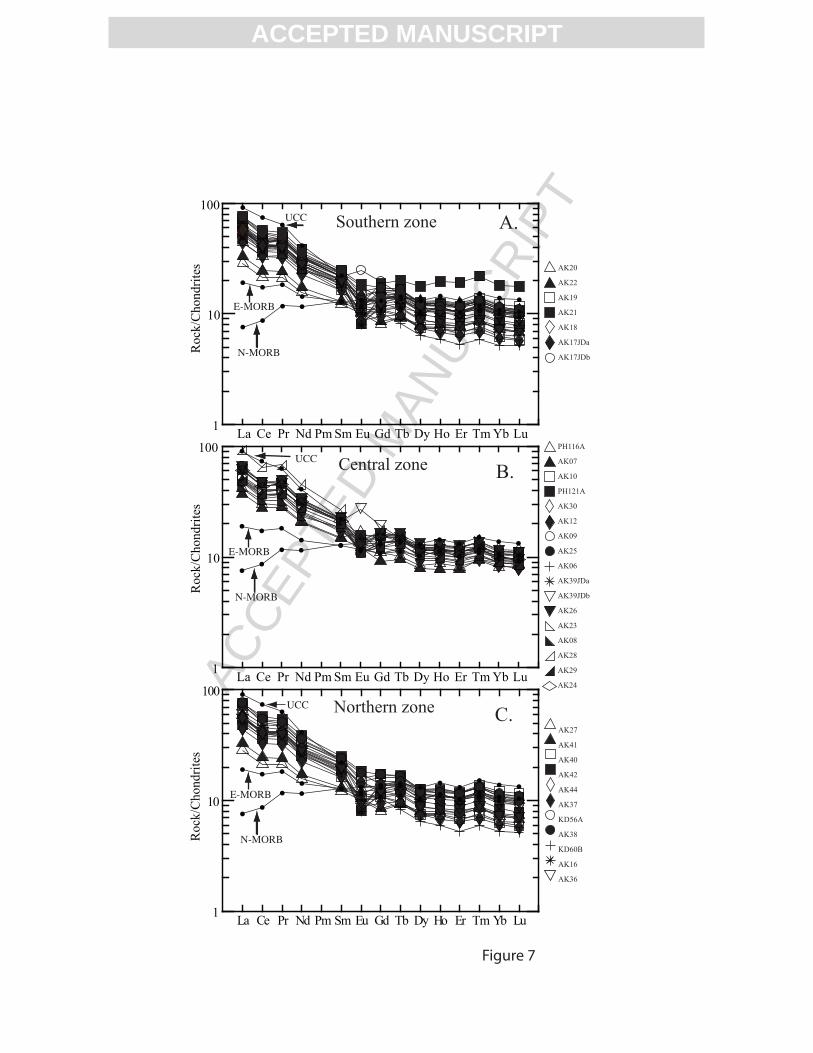
ACC
EPTE
D M
ANU
SCR
IPT
ACCEPTED MANUSCRIPT
1
10
100
La Ce Pr Nd Pm Sm Eu Gd Tb Dy Ho Er Tm Yb Lu
Roc
k/C
hond
rites
UCC
N-MORB
E-MORB
Southern zone
AK20
AK22
AK19
AK21
AK18
AK17JDa
AK17JDb
A.
1
10
100
La Ce Pr Nd Pm Sm Eu Gd Tb Dy Ho Er Tm Yb Lu
UCC
N-MORB
E-MORB
Roc
k/C
hond
rites
PH116A
AK07
AK10
PH121A
AK30
AK12
AK09
AK25
AK06
AK39JDa
AK39JDb
AK26
AK23
AK08
AK28
AK29
AK24
Central zone B.
1
10
100
La Ce Pr Nd Pm Sm Eu Gd Tb Dy Ho Er Tm Yb Lu
Northern zoneAK27
AK41
AK40
AK42
AK44
AK37
KD56A
AK38
KD60B
AK16
AK36
N-MORB
E-MORB
Roc
k/C
hond
rites
UCC C.
Figure 7

ACC
EPTE
D M
ANU
SCR
IPT
ACCEPTED MANUSCRIPT
1
10
100
La Ce Pr Nd Pm Sm Eu Gd Tb Dy Ho Er Tm Yb Lu
Satellites
AK15
AK14
AK31
KD70DF
AK35
AK32
AK33
KD70C
Western
Northern
N-MORB
UCC
E-MORB
Roc
k/C
hond
rites
D.
1
10
100
La Ce Pr Nd Pm Sm Eu Gd Tb Dy Ho Er Tm Yb Lu
N-MORB
E-MORB
UCC Satellites InnerPH-104B
KD-137A
KD-31B
KD-141A
AK-05
OuterKD-75D
KD-74B
KD-72B
PH-107B
Eastern
Roc
k/C
hond
rites
E.
1
10
100
La Ce Pr Nd Pm Sm Eu Gd Tb Dy Ho Er Tm Yb Lu
AK01
AK02
AK11
AK03
AK04
AK43
AK34
AK13
Ghost Rocks
Kodiak
Inclusion
Roc
k/C
hond
rites
UCC
N-MORB
E-MORB
F.Country Rocks
Figure 7 (continued)

ACC
EPTE
D M
ANU
SCR
IPT
ACCEPTED MANUSCRIPT
0.0 0.5 1.0 1.50
5
10
15
20
Th/T
a
TiO 2
Kodiak Fm.& Ghost Rocks Fm.
Northern zone & Western satellites
Northern satellites
Southern & Central zones
Eastern satellites
A.
Marine sediments
Figure 8
0 5 10 15 20 25 30 350
5
10
15
20
25
Nb/U
Altered crust
Arc lavas
MORB& OIB
Ce/
Pb
B.

ACC
EPTE
D M
ANU
SCR
IPT
ACCEPTED MANUSCRIPT
.702 .703 .704 .705 .706 .707 .708
Freq
uenc
y
18.7 18.8 18.9 19.0 19.1 19.20
10
20
Freq
uenc
y
15.5 15.55 15.6 15.65 15.7 15.750
10
20
38.0 38.5 39.00
10
20
Kodiak batholithSatellitesGhost Rocks Fm.Kodiak Fm.Inclusion
-10 -5 0 5 100
5
10
Freq
uenc
y
ε 0 .5 1 1.5 2 2.50
Freq
uenc
y
TNd DM (Ga)
87 86Sr/ Sr 206 204Pb/ Pb
Freq
uenc
y
Freq
uenc
y
A B
C D
E F
Figure 9207 204Pb/ Pb 208 204Pb/ Pb
5
10
5
10
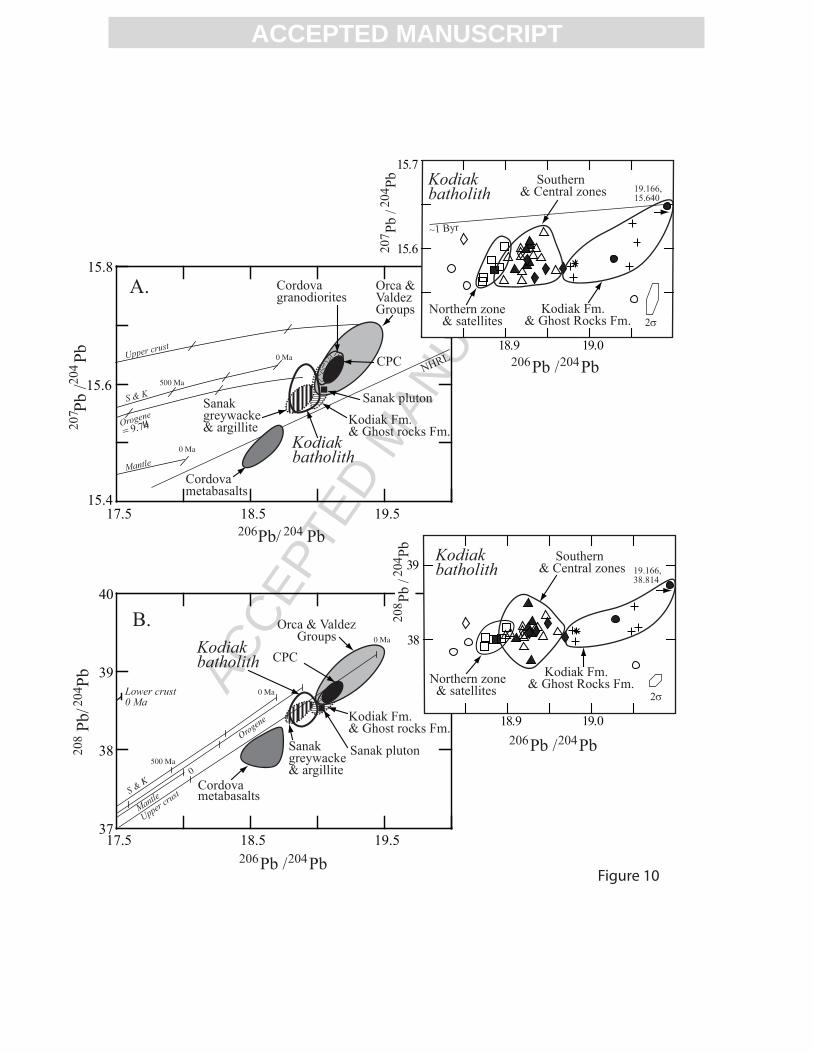
ACC
EPTE
D M
ANU
SCR
IPT
ACCEPTED MANUSCRIPT
17.5 18.5 19.537
38
39
40
S & K
Lower crust0 Ma
Orogene
0 Ma
0 Ma
0 500 Ma
18.9 19.0
38
39
17.5 18.5 19.515.4
15.6
15.8
Upper crust
S & K500 Ma
0 Ma
0 Ma
18.9 19.0
15.6
15.7
206 204Pb / Pb
208
204
Pb/
Pb
Orogene
Mantle
206 204Pb/ Pb
207
204
Pb /
P
b
NHRL
Cordovametabasalts
Cordovagranodiorites
Orca & Valdez Groups Northern zone
& satellites
Southern& Central zones
~1 Byr
Northern zone & satellites
Southern& Central zones
Kodiak Fm.& Ghost Rocks Fm.
Cordovametabasalts
Orca & Valdez Groups
µ= 9.74
19.166, 15.640
A.
B.
Figure 10
Upper crust
Mantle
207
204
Pb
/
Pb
208
204
Pb
/
Pb
2σ
2σ
19.166, 38.814
Kodiak Fm.& Ghost Rocks Fm.
CPC
Sanak greywacke & argillite
Sanak plutonKodiak Fm. & Ghost rocks Fm.
Kodiak batholith
Kodiak batholith CPC
Sanak greywacke & argillite
Kodiak Fm. & Ghost rocks Fm.
Sanak pluton
Kodiak batholith
Kodiak batholith
206 204Pb / Pb
206 204Pb / Pb

ACC
EPTE
D M
ANU
SCR
IPT
ACCEPTED MANUSCRIPT
0.703 0.704 0.705 0.706 0.707 0.708-10
-5
0
5
10
εN
d (5
9 M
a)
87 86Sr Sr (59 Ma)
Orca & Valdez Groups
Kodiak Fm. & Ghost Rocks Fm.
Cordova metabasalts Cordovagranodiorites
Figure 11
CPC
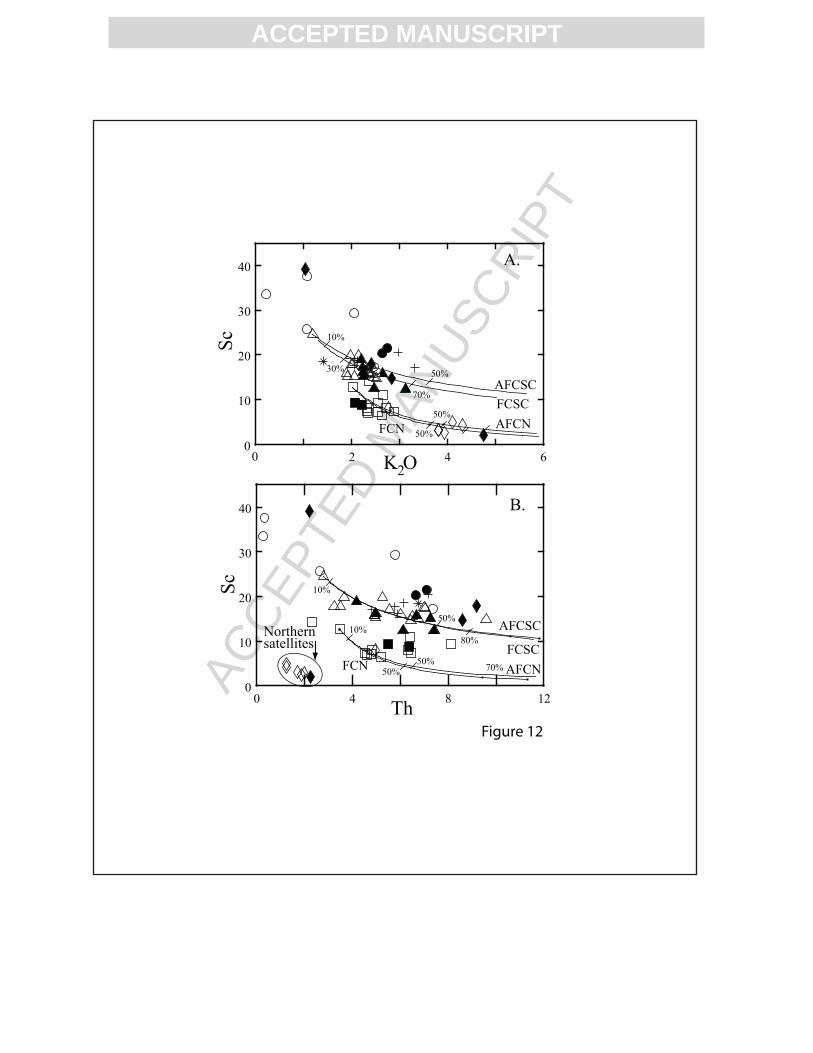
ACC
EPTE
D M
ANU
SCR
IPT
ACCEPTED MANUSCRIPT
2 4 60
10
20
30
40
Sc
0 4 8 120
10
20
30
40
Sc
Th
K O2
FCSC
AFCNFCN
AFCSC
FCN
FCSCAFCSC
70%
50%
0
80%Northernsatellites
50%
A.
B.
Figure 12
50%
10%
50%
70% AFCN
30%
50%
10%
50%
10%
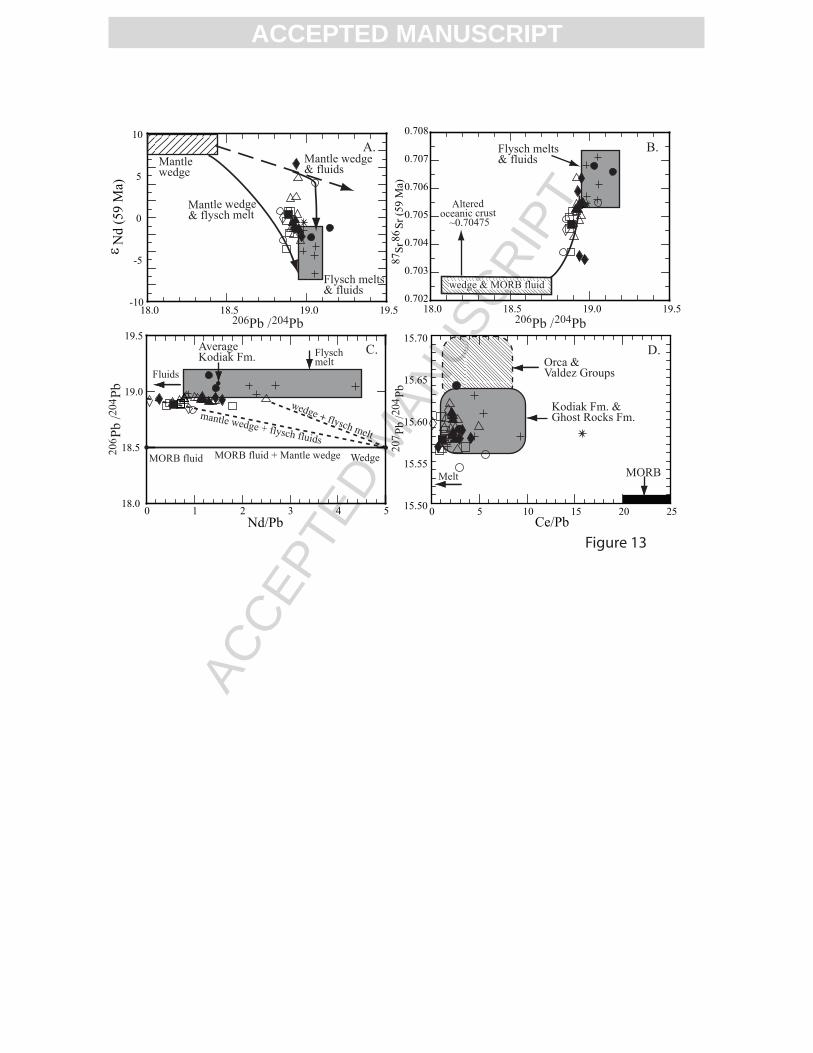
ACC
EPTE
D M
ANU
SCR
IPT
ACCEPTED MANUSCRIPT
18.0 18.5 19.0 19.5-10
-5
0
5
10
ε Nd
(59
Ma)
206 204Pb / Pb
Flysch melts& fluids
Mantle wedge
Mantle wedge& fluids
Mantle wedge& flysch melt
A.
18.0 18.5 19.0 19.50.702
0.703
0.704
0.705
0.706
0.707
0.708
wedge & MORB fluid
206 204Pb / Pb
87
86
Sr
Sr (
59 M
a)
B.
0 1 2 3 4 518.0
18.5
19.0
19.5
Nd/Pb
wedge + flysch melt
MORB fluid206
204
Pb /
P
b
Average Kodiak Fm. C.
MORB fluid + Mantle wedge Wedge
Fluids
Flysch melt
Ce/Pb
207
204
Pb /
P
b
Flysch melts& fluids
Figure 13
0 5 10 15 20 2515.50
15.55
15.60
15.65
15.70
Kodiak Fm. & Ghost Rocks Fm.
Orca & Valdez Groups
MORBMelt
Altered oceanic crust
~0.70475
mantle wedge + flysch fluids
D.

ACC
EPTE
D M
ANU
SCR
IPT
ACCEPTED MANUSCRIPT
A
Table 1. Major element compositions (ppm) of representative samples from the Kodiak batholith, adjacent intrusive and volcanic rocks flanking the batholith, Kodiak Island, Alaska
Northern Satellite Group Western Satellite Group Northern ZoneSample RA02AK31 RA02AK32 RA02AK33 RA02AK35 01KD70DV 01KD70C RA02AK15 RA02AK14 RA02AK37 RA02AK36 RA02AK38 01KD56 01KD60B
Major elements (wt. %)SiO2 70.89 75.18 75.56 74.86 74.76 75.75 68.05 69.16 69.78 72.02 70.50 70.14 71.00Al2O3 15.67 14.60 14.39 14.56 14.46 13.97 16.43 17.10 16.28 15.30 16.14 16.23 15.78TiO2 0.27 0.02 0.01 0.02 0.07 0.06 0.34 0.30 0.26 0.20 0.25 0.25 0.25Fe2O3 2.79 1.08 0.79 1.07 1.04 0.88 3.16 2.98 2.91 2.32 2.69 2.80 2.88MgO 0.75 0.06 0.06 0.05 0.29 0.22 1.53 1.30 0.77 0.60 0.70 0.73 0.77MnO 0.07 0.05 0.01 0.05 0.05 0.05 0.06 0.06 0.05 0.04 0.05 0.05 0.05CaO 2.18 0.41 0.27 0.49 0.73 0.57 2.97 2.71 2.09 1.98 2.13 2.04 2.29Na2O 3.97 4.21 4.13 4.16 3.87 3.67 3.98 4.03 4.15 4.20 4.18 4.27 3.98K2O 2.78 3.80 3.94 3.81 4.11 4.32 2.07 2.21 2.56 2.63 2.73 2.35 2.32P2O5 0.18 0.12 0.12 0.12 0.23 0.24 0.14 0.15 0.17 0.15 0.14 0.16 0.16LOI 0.64 0.77 0.81 0.67 0.64 0.60 1.40 0.90 0.97 0.64 0.64 1.19 0.86Total 100.18 100.29 100.09 99.85 100.26 100.32 100.13 100.89 99.98 100.09 100.14 100.21 100.35
S % nd 0.005 0.046 0.009 0.004 nd nd <0.001 0.005 nd 0.005 nd nd
ASI1 1.16 1.24 1.25 1.23 1.19 1.19 1.16 1.23 1.22 1.15 1.18 1.22 1.19K2O+Na2O 6.75 8.01 8.07 7.97 7.98 7.99 6.05 6.24 6.71 6.83 6.91 6.62 6.30Na2O/K2O 0.70 0.90 0.95 0.92 1.06 1.18 0.52 0.55 0.62 0.63 0.65 0.55 0.58
nd, not determined1ASI= mol Al2O3/(K2O+Na2O+CaO)2Inner: trenchward belt of rocks adjacent to batholith; intruded the Kodiak Formation and the Ghost Rocks Formation2Inner: trenchward belt of rocks adjacent to batholith; intruded the Kodiak Formation and the Ghost Rocks Formation3Outer: trenchward belt of rocks; intruded the Ghost Rocks Formation

ACC
EPTE
D M
ANU
SCR
IPT
ACCEPTED MANUSCRIPT
A Northern Zone Central Zone Central Zone
RA02AK40 RA02AK44 RA02AK42 RA02AK41 RA02AK27 RA02AK16 RA02AK28 01PH121A RA02AK29 01PH116 RA02AK30 RA02AK06 RA02AK07 RA02AK10
65.22 68.83 68.45 65.08 64.18 71.45 64.34 61.51 65.14 57.31 62.40 63.57 61.32 61.3416.70 15.89 15.93 17.09 17.53 14.62 15.53 16.58 17.19 18.23 16.78 16.41 17.13 16.660.46 0.37 0.42 0.58 0.54 0.28 0.80 0.78 0.78 0.94 0.69 0.76 0.75 0.843.79 3.34 3.19 4.47 4.53 2.34 5.34 6.49 6.01 7.57 6.21 6.49 5.80 5.872.10 1.15 1.21 2.09 2.27 0.90 3.01 3.30 4.64 4.65 3.26 3.14 2.98 2.870.07 0.05 0.05 0.07 0.08 0.05 0.08 0.11 0.09 0.12 0.11 0.12 0.09 0.102.99 2.59 2.58 3.76 3.68 1.98 3.13 3.16 3.96 6.02 3.84 2.76 3.59 4.644.05 3.69 3.88 3.61 3.52 3.81 3.18 2.81 2.85 2.71 3.24 2.74 2.92 3.602.32 2.56 2.65 2.03 2.36 2.88 2.47 1.97 2.24 1.19 2.15 2.26 2.03 2.000.13 0.13 0.16 0.14 0.23 0.14 0.15 0.20 0.17 0.20 0.21 0.20 0.23 0.251.88 0.65 0.82 0.90 0.93 0.71 1.06 2.81 1.22 1.25 1.15 1.61 2.07 0.81
99.71 99.25 99.34 99.82 99.84 99.16 99.09 99.72 104.29 100.19 100.04 100.06 98.92 98.97
nd 0.006 0.005 0.006 0.004 nd nd nd 0.002 nd nd 0.012 <0.001 nd
1.14 1.17 1.14 1.14 1.17 1.13 1.14 1.33 1.20 1.09 1.15 1.37 1.27 1.016.37 6.25 6.53 5.64 5.88 6.69 5.65 4.78 5.09 3.90 5.39 5.00 4.95 5.600.57 0.69 0.68 0.56 0.67 0.76 0.78 0.70 0.79 0.44 0.66 0.82 0.69 0.56
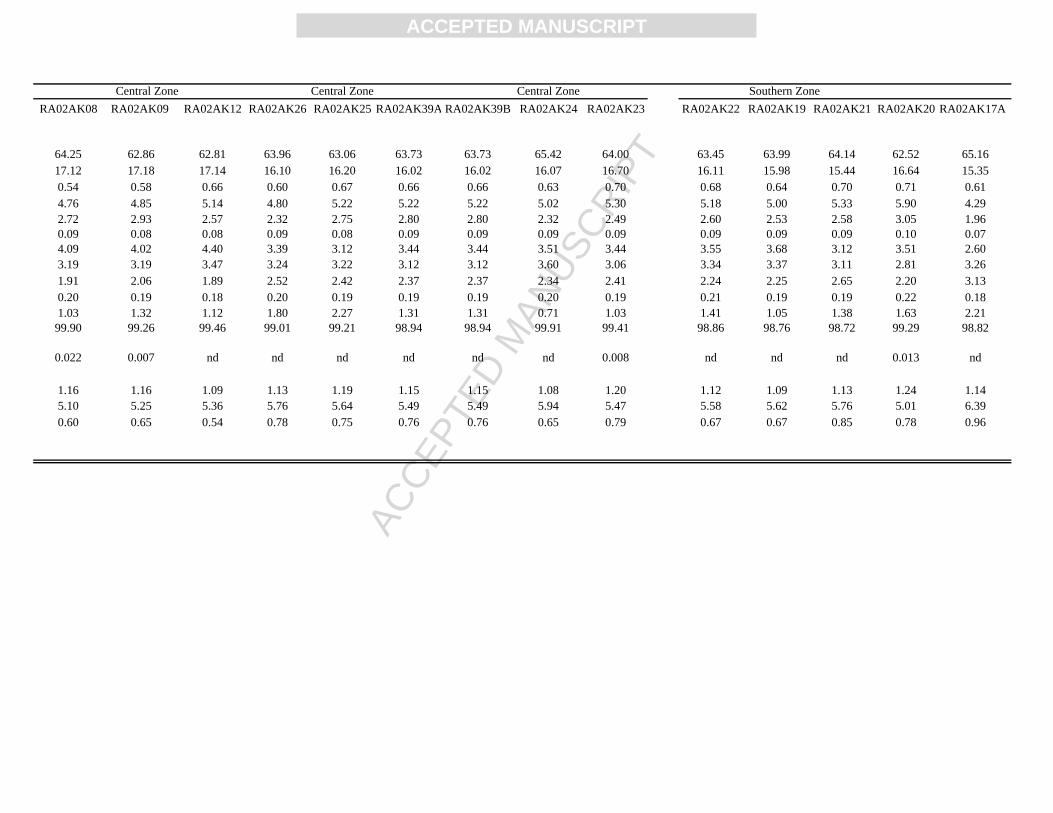
ACC
EPTE
D M
ANU
SCR
IPT
ACCEPTED MANUSCRIPT
A Central Zone Central Zone Central Zone Southern Zone
RA02AK08 RA02AK09 RA02AK12 RA02AK26 RA02AK25 RA02AK39 RA02AK39B RA02AK24 RA02AK23 RA02AK22 RA02AK19 RA02AK21 RA02AK20 RA02AK17A
64.25 62.86 62.81 63.96 63.06 63.73 63.73 65.42 64.00 63.45 63.99 64.14 62.52 65.1617.12 17.18 17.14 16.10 16.20 16.02 16.02 16.07 16.70 16.11 15.98 15.44 16.64 15.350.54 0.58 0.66 0.60 0.67 0.66 0.66 0.63 0.70 0.68 0.64 0.70 0.71 0.614.76 4.85 5.14 4.80 5.22 5.22 5.22 5.02 5.30 5.18 5.00 5.33 5.90 4.292.72 2.93 2.57 2.32 2.75 2.80 2.80 2.32 2.49 2.60 2.53 2.58 3.05 1.960.09 0.08 0.08 0.09 0.08 0.09 0.09 0.09 0.09 0.09 0.09 0.09 0.10 0.074.09 4.02 4.40 3.39 3.12 3.44 3.44 3.51 3.44 3.55 3.68 3.12 3.51 2.603.19 3.19 3.47 3.24 3.22 3.12 3.12 3.60 3.06 3.34 3.37 3.11 2.81 3.261.91 2.06 1.89 2.52 2.42 2.37 2.37 2.34 2.41 2.24 2.25 2.65 2.20 3.130.20 0.19 0.18 0.20 0.19 0.19 0.19 0.20 0.19 0.21 0.19 0.19 0.22 0.181.03 1.32 1.12 1.80 2.27 1.31 1.31 0.71 1.03 1.41 1.05 1.38 1.63 2.21
99.90 99.26 99.46 99.01 99.21 98.94 98.94 99.91 99.41 98.86 98.76 98.72 99.29 98.82
0.022 0.007 nd nd nd nd nd nd 0.008 nd nd nd 0.013 nd
1.16 1.16 1.09 1.13 1.19 1.15 1.15 1.08 1.20 1.12 1.09 1.13 1.24 1.145.10 5.25 5.36 5.76 5.64 5.49 5.49 5.94 5.47 5.58 5.62 5.76 5.01 6.390.60 0.65 0.54 0.78 0.75 0.76 0.76 0.65 0.79 0.67 0.67 0.85 0.78 0.96

ACC
EPTE
D M
ANU
SCR
IPT
ACCEPTED MANUSCRIPT
3Southern Zone Eastern Satellite Group Eastern Satellite GroupRA02AK17B RA02AK18 01PH107B2 01KD72B2 01KD74B2 01KD75D2 RA02AK053 01KD141A3 02KD31B3 01PH104B 01KD137A3
65.16 64.39 80.41 67.34 64.06 54.21 66.01 59.74 53.38 45.92 48.2715.35 16.02 10.38 15.09 15.98 14.97 15.27 15.11 17.28 14.79 16.930.61 0.57 0.25 0.73 0.88 0.26 0.97 0.93 0.88 1.29 1.174.29 4.15 0.56 5.78 6.97 5.75 6.80 7.00 7.24 9.17 9.251.96 2.16 0.13 1.76 2.21 8.41 2.01 4.42 5.38 7.92 4.160.07 0.07 0.01 0.09 0.10 0.11 0.11 0.12 0.12 0.21 0.192.60 3.46 0.70 1.37 2.28 11.55 2.00 6.11 7.90 12.83 6.723.26 3.54 1.98 2.93 2.53 2.55 3.30 3.51 3.41 1.63 6.113.13 2.47 4.76 2.84 2.41 1.03 2.47 2.05 1.06 1.07 0.220.18 0.18 0.02 0.24 0.26 0.03 0.21 0.13 0.14 0.14 0.342.21 1.63 0.54 2.15 2.18 1.41 1.91 1.27 3.04 4.16 5.75
98.82 98.64 99.74 100.32 99.86 100.28 101.06 100.39 99.83 99.13 99.11
nd nd nd nd nd nd 0.036 nd 0.034 nd nd
1.14 1.08 1.07 1.45 1.46 0.57 1.30 0.79 0.82 0.54 0.756.39 6.01 6.74 5.77 4.94 3.58 5.77 5.56 4.47 2.70 6.330.96 0.70 2.40 0.97 0.95 0.40 0.75 0.58 0.31 0.66 0.04

ACC
EPTE
D M
ANU
SCR
IPT
ACCEPTED MANUSCRIPT
5
Table 2. Trace element compositions (ppm) of representative samples from the Kodiak batholith, adjacent intrusive and volcanic rocks flanking the batholith, Kodiak Island, Alaska
Northern Satellite Group Western Satellite Group Northern Zone Northern ZonSample RA02AK31 RA02AK32 RA02AK33 RA02AK3 01KD70DV 01KD70C RA02AK15 RA02AK14 RA02AK37 RA02AK36 RA02AK38 01KD56A 01KD60B
Rb 91 119 121 113 116 125 60 71 74 80 82 56 72Cs 7.0 6.1 3.6 2.7 4.3 3.9 3.2 5.6 4.4 5.2 5.0 2.7 3.8Sr 164 37 44 36 43 34 205 198 217 191 201 243 188Ba 905 686 740 639 435 394 842 715 862 969 1020 818 873
Rb/Sr 0.56 3.20 2.73 3.15 2.70 3.68 0.29 0.36 0.34 0.42 0.41 0.23 0.38Cs/Ta 8.9 7.0 3.9 3.2 8.3 3.1 6.5 12.1 10.2 10.7 12.6 5.4 7.5
La 17.8 3.9 3.1 3.6 3.4 4.7 15.6 17.2 14.6 19.5 18.5 19.1 18.3Ce 32.7 9.1 7.2 8.3 7.1 9.4 30.3 33.7 28.5 35.5 35.8 36.0 35.0Pr 4.4 1.3 1.0 1.2 0.9 1.2 4.0 4.3 3.6 4.7 4.5 4.4 4.3Nd 16.4 6.4 5.0 5.7 4.1 4.5 15.4 16.7 14.3 17.6 17.7 17.2 16.7Sm 3.7 2.2 1.8 2.0 1.2 1.2 3.4 3.7 3.3 3.8 3.9 3.6 3.5Eu 0.8 0.1 0.1 0.1 0.1 0.1 0.7 0.6 0.7 0.7 0.6 0.8 0.8Gd 3.6 2.1 1.6 1.8 1.1 1.2 3.3 2.9 2.6 3.4 3.1 3.0 2.9Tb 0.59 0.37 0.30 0.36 0.22 0.20 0.52 0.52 0.46 0.53 0.54 0.44 0.39Dy 3.30 1.88 1.48 1.74 1.22 1.26 3.12 3.01 2.55 2.99 3.06 2.51 2.20Ho 0.65 0.23 0.19 0.22 0.22 0.22 0.64 0.59 0.48 0.59 0.58 0.51 0.41Er 1.95 0.48 0.40 0.45 0.67 0.65 1.93 1.75 1.45 1.83 1.73 1.50 1.19Tm 0.27 0.05 0.04 0.05 0.11 0.11 0.28 0.27 0.21 0.26 0.25 0.23 0.18Yb 1.69 0.28 0.24 0.25 0.74 0.77 1.71 1.66 1.33 1.56 1.64 1.42 1.15Lu 0.24 0.03 0.03 0.03 0.11 0.11 0.26 0.24 0.19 0.24 0.24 0.21 0.18
Y 18 8 6 7 6 6 18 16 13 17 16 15 12
La/Yb 10.5 14.1 12.9 14.0 4.7 6.0 9.1 10.4 11.0 12.5 11.3 13.4 15.9Total REE 88.0 28.5 22.5 25.8 21.2 25.7 81.2 87.2 74.3 93.3 92.1 91.0 87.2Ce/Pb 10.5 2.5 1.7 3.0 2.2 2.9 20.4 17.2 16.8 21.4 20.2 17.6 25.6
Zr 98 34 31 32 35 34 96 101 101 96 111 135 127Hf 3.2 2.1 1.9 1.9 1.8 1.4 3.1 3.4 3.4 3.2 3.5 3.5 3.4Nb 8 7 7 7 3 3 6 7 6 6 6 10 7Ta 0.79 0.87 0.91 0.84 0.52 1.26 0.49 0.46 0.43 0.49 0.40 0.50 0.50Th 5.0 2.0 1.9 1.7 1.3 1.2 5.5 6.4 4.8 5.2 6.3 4.6 4.5U 3.1 3.6 4.1 2.7 3.3 3.3 1.5 2.0 1.7 1.7 1.8 2.0 1.4
Nb/Ta 9.8 7.7 7.5 7.9 5.7 2.6 12.0 14.2 14.2 12.2 14.8 19.2 14.4Zr/Hf 30.2 16.7 16.6 16.7 19.9 23.8 31.0 29.7 30.2 30.1 31.8 38.6 37.9Th/U 13.0 19.3 33.8 41.4 27.0 31.7 18.9 12.6 16.7 15.3 16.3 21.0 19.1Nb/U 2.5 1.9 1.6 2.5 0.9 1.0 3.9 3.4 3.6 3.6 3.3 4.7 5.3
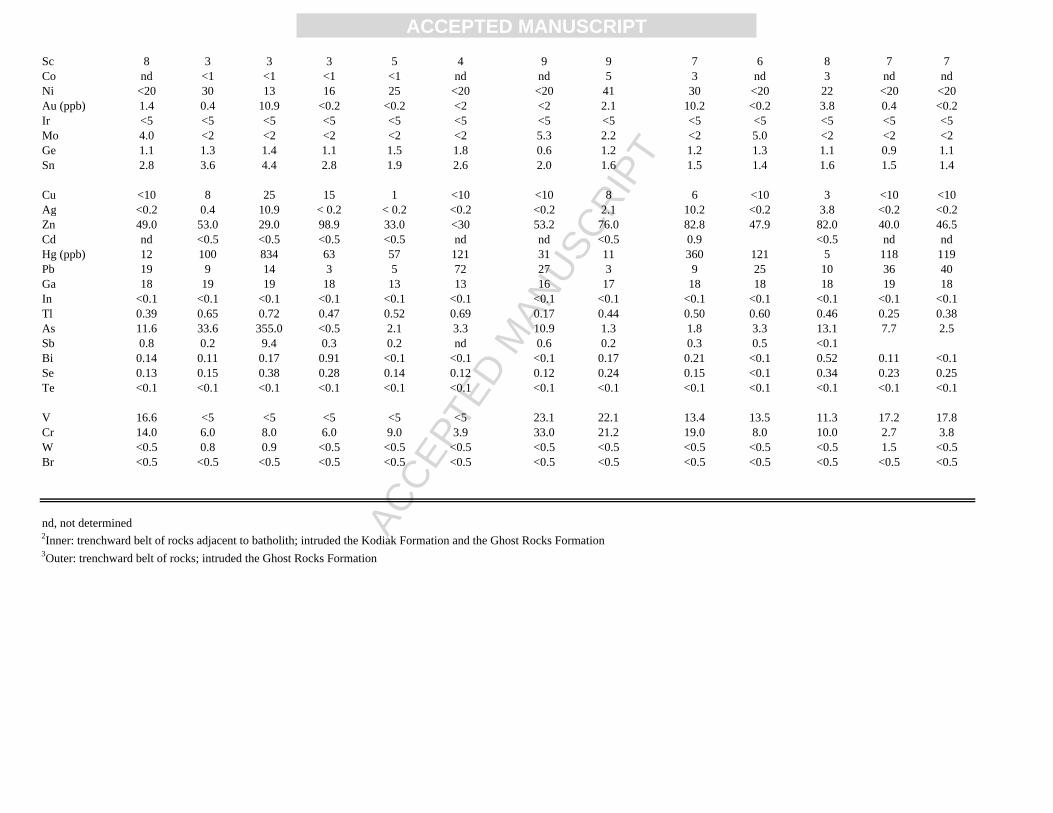
ACC
EPTE
D M
ANU
SCR
IPT
ACCEPTED MANUSCRIPT
Sc 8 3 3 3 5 4 9 9 7 6 8 7 7Co nd <1 <1 <1 <1 nd nd 5 3 nd 3 nd ndNi <20 30 13 16 25 <20 <20 41 30 <20 22 <20 <20Au (ppb) 1.4 0.4 10.9 <0.2 <0.2 <2 <2 2.1 10.2 <0.2 3.8 0.4 <0.2Ir <5 <5 <5 <5 <5 <5 <5 <5 <5 <5 <5 <5 <5Mo 4.0 <2 <2 <2 <2 <2 5.3 2.2 <2 5.0 <2 <2 <2Ge 1.1 1.3 1.4 1.1 1.5 1.8 0.6 1.2 1.2 1.3 1.1 0.9 1.1Sn 2.8 3.6 4.4 2.8 1.9 2.6 2.0 1.6 1.5 1.4 1.6 1.5 1.4
Cu <10 8 25 15 1 <10 <10 8 6 <10 3 <10 <10Ag <0.2 0.4 10.9 < 0.2 < 0.2 <0.2 <0.2 2.1 10.2 <0.2 3.8 <0.2 <0.2Zn 49.0 53.0 29.0 98.9 33.0 <30 53.2 76.0 82.8 47.9 82.0 40.0 46.5Cd nd <0.5 <0.5 <0.5 <0.5 nd nd <0.5 0.9 <0.5 nd ndHg (ppb) 12 100 834 63 57 121 31 11 360 121 5 118 119Pb 19 9 14 3 5 72 27 3 9 25 10 36 40Ga 18 19 19 18 13 13 16 17 18 18 18 19 18In <0.1 <0.1 <0.1 <0.1 <0.1 <0.1 <0.1 <0.1 <0.1 <0.1 <0.1 <0.1 <0.1Tl 0.39 0.65 0.72 0.47 0.52 0.69 0.17 0.44 0.50 0.60 0.46 0.25 0.38As 11.6 33.6 355.0 <0.5 2.1 3.3 10.9 1.3 1.8 3.3 13.1 7.7 2.5Sb 0.8 0.2 9.4 0.3 0.2 nd 0.6 0.2 0.3 0.5 <0.1Bi 0.14 0.11 0.17 0.91 <0.1 <0.1 <0.1 0.17 0.21 <0.1 0.52 0.11 <0.1Se 0.13 0.15 0.38 0.28 0.14 0.12 0.12 0.24 0.15 <0.1 0.34 0.23 0.25Te <0.1 <0.1 <0.1 <0.1 <0.1 <0.1 <0.1 <0.1 <0.1 <0.1 <0.1 <0.1 <0.1
V 16.6 <5 <5 <5 <5 <5 23.1 22.1 13.4 13.5 11.3 17.2 17.8Cr 14.0 6.0 8.0 6.0 9.0 3.9 33.0 21.2 19.0 8.0 10.0 2.7 3.8W <0.5 0.8 0.9 <0.5 <0.5 <0.5 <0.5 <0.5 <0.5 <0.5 <0.5 1.5 <0.5Br <0.5 <0.5 <0.5 <0.5 <0.5 <0.5 <0.5 <0.5 <0.5 <0.5 <0.5 <0.5 <0.5
nd, not determined2Inner: trenchward belt of rocks adjacent to batholith; intruded the Kodiak Formation and the Ghost Rocks Formation3Outer: trenchward belt of rocks; intruded the Ghost Rocks Formation
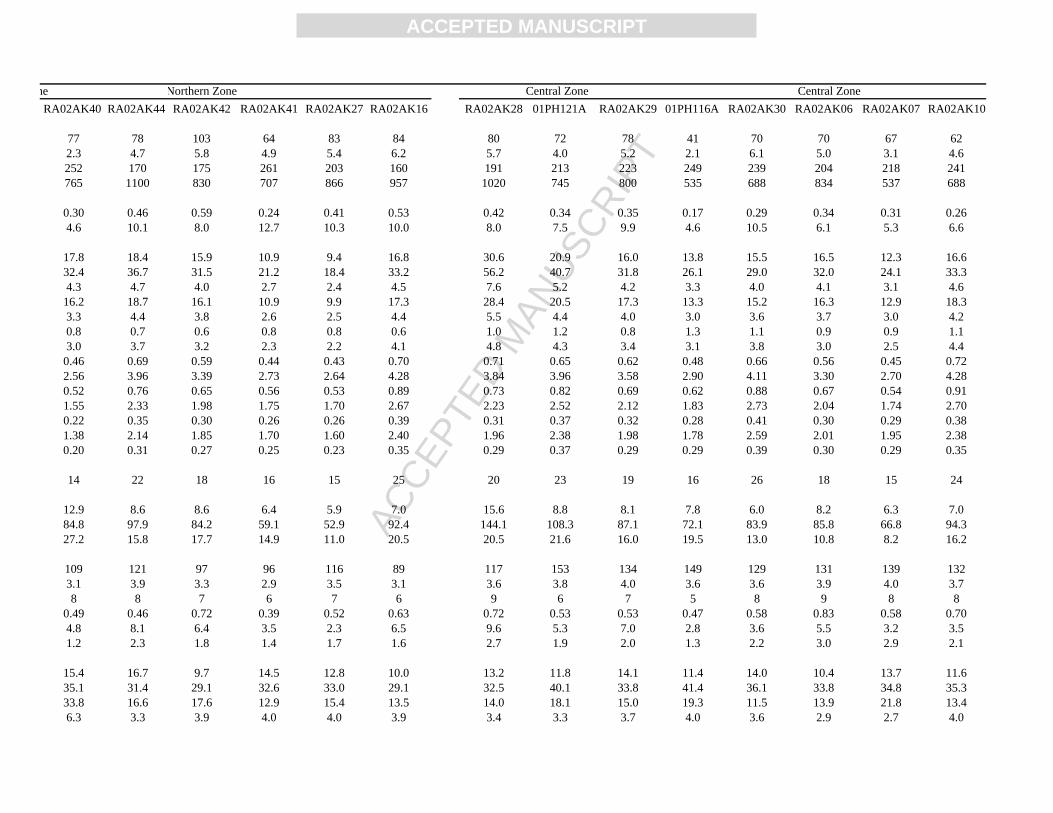
ACC
EPTE
D M
ANU
SCR
IPT
ACCEPTED MANUSCRIPT
n N
e orthern Zone Central Zone Central ZoneRA02AK40 RA02AK44 RA02AK42 RA02AK41 RA02AK27 RA02AK16 RA02AK28 01PH121A RA02AK29 01PH116A RA02AK30 RA02AK06 RA02AK07 RA02AK10
77 78 103 64 83 84 80 72 78 41 70 70 67 622.3 4.7 5.8 4.9 5.4 6.2 5.7 4.0 5.2 2.1 6.1 5.0 3.1 4.6252 170 175 261 203 160 191 213 223 249 239 204 218 241765 1100 830 707 866 957 1020 745 800 535 688 834 537 688
0.30 0.46 0.59 0.24 0.41 0.53 0.42 0.34 0.35 0.17 0.29 0.34 0.31 0.264.6 10.1 8.0 12.7 10.3 10.0 8.0 7.5 9.9 4.6 10.5 6.1 5.3 6.6
17.8 18.4 15.9 10.9 9.4 16.8 30.6 20.9 16.0 13.8 15.5 16.5 12.3 16.632.4 36.7 31.5 21.2 18.4 33.2 56.2 40.7 31.8 26.1 29.0 32.0 24.1 33.34.3 4.7 4.0 2.7 2.4 4.5 7.6 5.2 4.2 3.3 4.0 4.1 3.1 4.6
16.2 18.7 16.1 10.9 9.9 17.3 28.4 20.5 17.3 13.3 15.2 16.3 12.9 18.33.3 4.4 3.8 2.6 2.5 4.4 5.5 4.4 4.0 3.0 3.6 3.7 3.0 4.20.8 0.7 0.6 0.8 0.8 0.6 1.0 1.2 0.8 1.3 1.1 0.9 0.9 1.13.0 3.7 3.2 2.3 2.2 4.1 4.8 4.3 3.4 3.1 3.8 3.0 2.5 4.4
0.46 0.69 0.59 0.44 0.43 0.70 0.71 0.65 0.62 0.48 0.66 0.56 0.45 0.722.56 3.96 3.39 2.73 2.64 4.28 3.84 3.96 3.58 2.90 4.11 3.30 2.70 4.280.52 0.76 0.65 0.56 0.53 0.89 0.73 0.82 0.69 0.62 0.88 0.67 0.54 0.911.55 2.33 1.98 1.75 1.70 2.67 2.23 2.52 2.12 1.83 2.73 2.04 1.74 2.700.22 0.35 0.30 0.26 0.26 0.39 0.31 0.37 0.32 0.28 0.41 0.30 0.29 0.381.38 2.14 1.85 1.70 1.60 2.40 1.96 2.38 1.98 1.78 2.59 2.01 1.95 2.380.20 0.31 0.27 0.25 0.23 0.35 0.29 0.37 0.29 0.29 0.39 0.30 0.29 0.35
14 22 18 16 15 25 20 23 19 16 26 18 15 24
12.9 8.6 8.6 6.4 5.9 7.0 15.6 8.8 8.1 7.8 6.0 8.2 6.3 7.084.8 97.9 84.2 59.1 52.9 92.4 144.1 108.3 87.1 72.1 83.9 85.8 66.8 94.327.2 15.8 17.7 14.9 11.0 20.5 20.5 21.6 16.0 19.5 13.0 10.8 8.2 16.2
109 121 97 96 116 89 117 153 134 149 129 131 139 1323.1 3.9 3.3 2.9 3.5 3.1 3.6 3.8 4.0 3.6 3.6 3.9 4.0 3.78 8 7 6 7 6 9 6 7 5 8 9 8 8
0.49 0.46 0.72 0.39 0.52 0.63 0.72 0.53 0.53 0.47 0.58 0.83 0.58 0.704.8 8.1 6.4 3.5 2.3 6.5 9.6 5.3 7.0 2.8 3.6 5.5 3.2 3.51.2 2.3 1.8 1.4 1.7 1.6 2.7 1.9 2.0 1.3 2.2 3.0 2.9 2.1
15.4 16.7 9.7 14.5 12.8 10.0 13.2 11.8 14.1 11.4 14.0 10.4 13.7 11.635.1 31.4 29.1 32.6 33.0 29.1 32.5 40.1 33.8 41.4 36.1 33.8 34.8 35.333.8 16.6 17.6 12.9 15.4 13.5 14.0 18.1 15.0 19.3 11.5 13.9 21.8 13.46.3 3.3 3.9 4.0 4.0 3.9 3.4 3.3 3.7 4.0 3.6 2.9 2.7 4.0
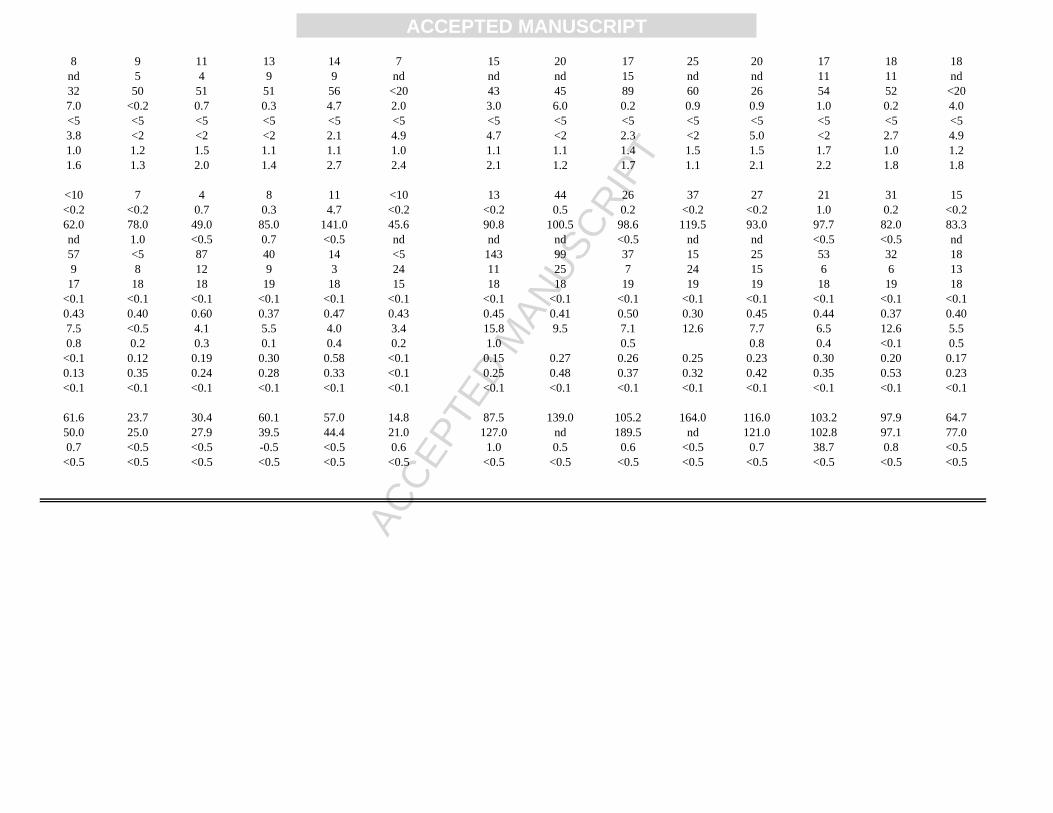
ACC
EPTE
D M
ANU
SCR
IPT
ACCEPTED MANUSCRIPT
8 9 11 13 14 7 15 20 17 25 20 17 18 18nd 5 4 9 9 nd nd nd 15 nd nd 11 11 nd32 50 51 51 56 <20 43 45 89 60 26 54 52 <207.0 <0.2 0.7 0.3 4.7 2.0 3.0 6.0 0.2 0.9 0.9 1.0 0.2 4.0<5 <5 <5 <5 <5 <5 <5 <5 <5 <5 <5 <5 <5 <53.8 <2 <2 <2 2.1 4.9 4.7 <2 2.3 <2 5.0 <2 2.7 4.91.0 1.2 1.5 1.1 1.1 1.0 1.1 1.1 1.4 1.5 1.5 1.7 1.0 1.21.6 1.3 2.0 1.4 2.7 2.4 2.1 1.2 1.7 1.1 2.1 2.2 1.8 1.8
<10 7 4 8 11 <10 13 44 26 37 27 21 31 15<0.2 <0.2 0.7 0.3 4.7 <0.2 <0.2 0.5 0.2 <0.2 <0.2 1.0 0.2 <0.262.0 78.0 49.0 85.0 141.0 45.6 90.8 100.5 98.6 119.5 93.0 97.7 82.0 83.3nd 1.0 <0.5 0.7 <0.5 nd nd nd <0.5 nd nd <0.5 <0.5 nd57 <5 87 40 14 <5 143 99 37 15 25 53 32 189 8 12 9 3 24 11 25 7 24 15 6 6 13
17 18 18 19 18 15 18 18 19 19 19 18 19 18<0.1 <0.1 <0.1 <0.1 <0.1 <0.1 <0.1 <0.1 <0.1 <0.1 <0.1 <0.1 <0.1 <0.10.43 0.40 0.60 0.37 0.47 0.43 0.45 0.41 0.50 0.30 0.45 0.44 0.37 0.407.5 <0.5 4.1 5.5 4.0 3.4 15.8 9.5 7.1 12.6 7.7 6.5 12.6 5.50.8 0.2 0.3 0.1 0.4 0.2 1.0 0.5 0.8 0.4 <0.1 0.5
<0.1 0.12 0.19 0.30 0.58 <0.1 0.15 0.27 0.26 0.25 0.23 0.30 0.20 0.170.13 0.35 0.24 0.28 0.33 <0.1 0.25 0.48 0.37 0.32 0.42 0.35 0.53 0.23<0.1 <0.1 <0.1 <0.1 <0.1 <0.1 <0.1 <0.1 <0.1 <0.1 <0.1 <0.1 <0.1 <0.1
61.6 23.7 30.4 60.1 57.0 14.8 87.5 139.0 105.2 164.0 116.0 103.2 97.9 64.750.0 25.0 27.9 39.5 44.4 21.0 127.0 nd 189.5 nd 121.0 102.8 97.1 77.00.7 <0.5 <0.5 -0.5 <0.5 0.6 1.0 0.5 0.6 <0.5 0.7 38.7 0.8 <0.5
<0.5 <0.5 <0.5 <0.5 <0.5 <0.5 <0.5 <0.5 <0.5 <0.5 <0.5 <0.5 <0.5 <0.5
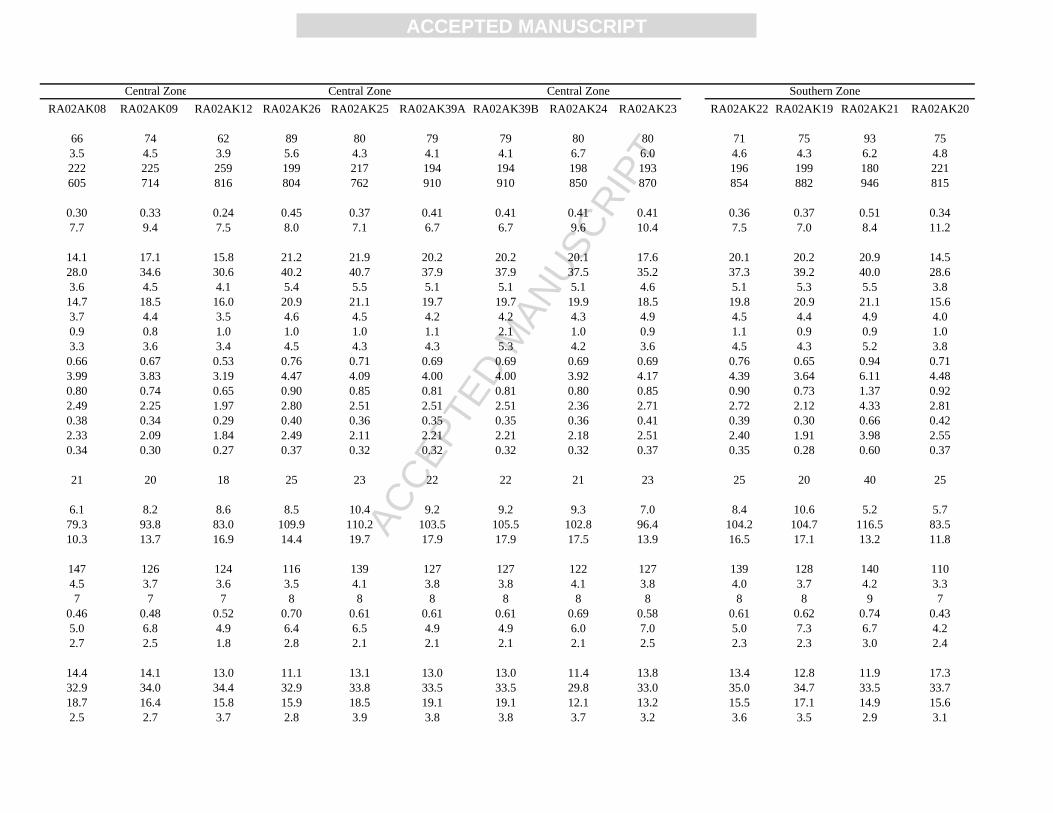
ACC
EPTE
D M
ANU
SCR
IPT
ACCEPTED MANUSCRIPT
e Central Zon Central Zone Central Zone Southern ZoneRA02AK08 RA02AK09 RA02AK12 RA02AK26 RA02AK25 RA02AK39A RA02AK39B RA02AK24 RA02AK23 RA02AK22 RA02AK19 RA02AK21 RA02AK20
66 74 62 89 80 79 79 80 80 71 75 93 753.5 4.5 3.9 5.6 4.3 4.1 4.1 6.7 6.0 4.6 4.3 6.2 4.8222 225 259 199 217 194 194 198 193 196 199 180 221605 714 816 804 762 910 910 850 870 854 882 946 815
0.30 0.33 0.24 0.45 0.37 0.41 0.41 0.41 0.41 0.36 0.37 0.51 0.347.7 9.4 7.5 8.0 7.1 6.7 6.7 9.6 10.4 7.5 7.0 8.4 11.2
14.1 17.1 15.8 21.2 21.9 20.2 20.2 20.1 17.6 20.1 20.2 20.9 14.528.0 34.6 30.6 40.2 40.7 37.9 37.9 37.5 35.2 37.3 39.2 40.0 28.63.6 4.5 4.1 5.4 5.5 5.1 5.1 5.1 4.6 5.1 5.3 5.5 3.8
14.7 18.5 16.0 20.9 21.1 19.7 19.7 19.9 18.5 19.8 20.9 21.1 15.63.7 4.4 3.5 4.6 4.5 4.2 4.2 4.3 4.9 4.5 4.4 4.9 4.00.9 0.8 1.0 1.0 1.0 1.1 2.1 1.0 0.9 1.1 0.9 0.9 1.03.3 3.6 3.4 4.5 4.3 4.3 5.3 4.2 3.6 4.5 4.3 5.2 3.8
0.66 0.67 0.53 0.76 0.71 0.69 0.69 0.69 0.69 0.76 0.65 0.94 0.713.99 3.83 3.19 4.47 4.09 4.00 4.00 3.92 4.17 4.39 3.64 6.11 4.480.80 0.74 0.65 0.90 0.85 0.81 0.81 0.80 0.85 0.90 0.73 1.37 0.922.49 2.25 1.97 2.80 2.51 2.51 2.51 2.36 2.71 2.72 2.12 4.33 2.810.38 0.34 0.29 0.40 0.36 0.35 0.35 0.36 0.41 0.39 0.30 0.66 0.422.33 2.09 1.84 2.49 2.11 2.21 2.21 2.18 2.51 2.40 1.91 3.98 2.550.34 0.30 0.27 0.37 0.32 0.32 0.32 0.32 0.37 0.35 0.28 0.60 0.37
21 20 18 25 23 22 22 21 23 25 20 40 25
6.1 8.2 8.6 8.5 10.4 9.2 9.2 9.3 7.0 8.4 10.6 5.2 5.779.3 93.8 83.0 109.9 110.2 103.5 105.5 102.8 96.4 104.2 104.7 116.5 83.510.3 13.7 16.9 14.4 19.7 17.9 17.9 17.5 13.9 16.5 17.1 13.2 11.8
147 126 124 116 139 127 127 122 127 139 128 140 1104.5 3.7 3.6 3.5 4.1 3.8 3.8 4.1 3.8 4.0 3.7 4.2 3.37 7 7 8 8 8 8 8 8 8 8 9 7
0.46 0.48 0.52 0.70 0.61 0.61 0.61 0.69 0.58 0.61 0.62 0.74 0.435.0 6.8 4.9 6.4 6.5 4.9 4.9 6.0 7.0 5.0 7.3 6.7 4.22.7 2.5 1.8 2.8 2.1 2.1 2.1 2.1 2.5 2.3 2.3 3.0 2.4
14.4 14.1 13.0 11.1 13.1 13.0 13.0 11.4 13.8 13.4 12.8 11.9 17.332.9 34.0 34.4 32.9 33.8 33.5 33.5 29.8 33.0 35.0 34.7 33.5 33.718.7 16.4 15.8 15.9 18.5 19.1 19.1 12.1 13.2 15.5 17.1 14.9 15.62.5 2.7 3.7 2.8 3.9 3.8 3.8 3.7 3.2 3.6 3.5 2.9 3.1
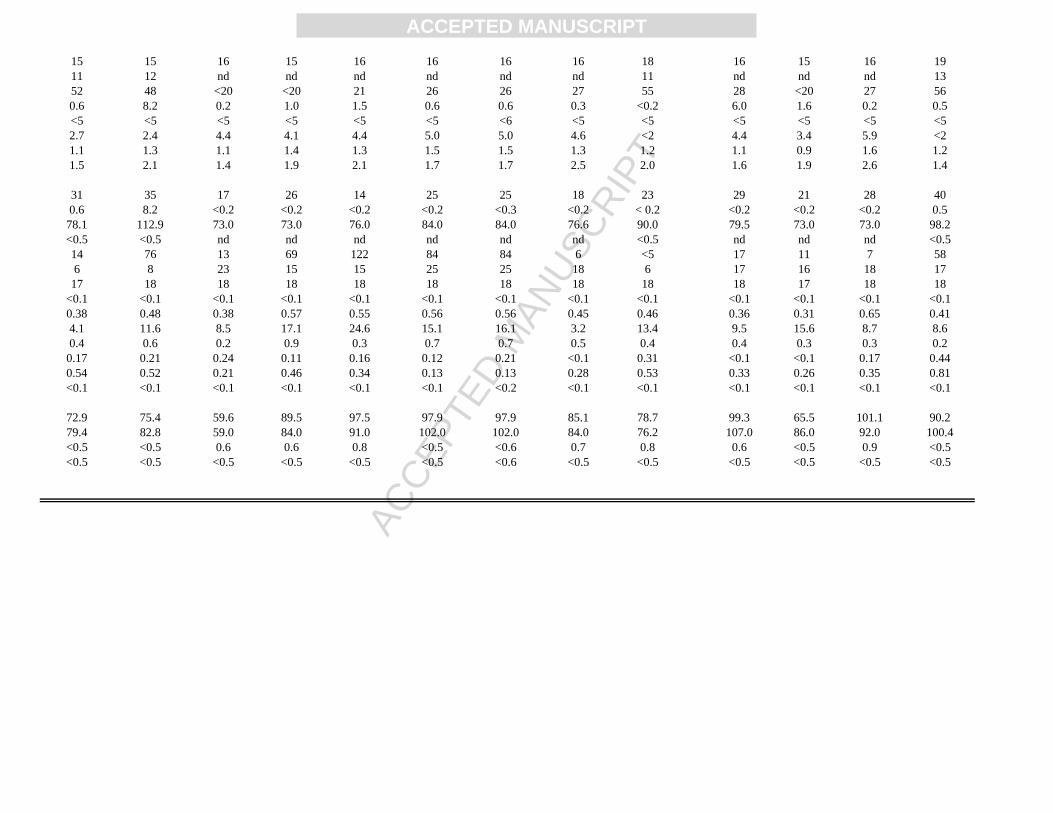
ACC
EPTE
D M
ANU
SCR
IPT
ACCEPTED MANUSCRIPT
15 15 16 15 16 16 16 16 18 16 15 16 1911 12 nd nd nd nd nd nd 11 nd nd nd 1352 48 <20 <20 21 26 26 27 55 28 <20 27 560.6 8.2 0.2 1.0 1.5 0.6 0.6 0.3 <0.2 6.0 1.6 0.2 0.5<5 <5 <5 <5 <5 <5 <6 <5 <5 <5 <5 <5 <52.7 2.4 4.4 4.1 4.4 5.0 5.0 4.6 <2 4.4 3.4 5.9 <21.1 1.3 1.1 1.4 1.3 1.5 1.5 1.3 1.2 1.1 0.9 1.6 1.21.5 2.1 1.4 1.9 2.1 1.7 1.7 2.5 2.0 1.6 1.9 2.6 1.4
31 35 17 26 14 25 25 18 23 29 21 28 400.6 8.2 <0.2 <0.2 <0.2 <0.2 <0.3 <0.2 < 0.2 <0.2 <0.2 <0.2 0.5
78.1 112.9 73.0 73.0 76.0 84.0 84.0 76.6 90.0 79.5 73.0 73.0 98.2<0.5 <0.5 nd nd nd nd nd nd <0.5 nd nd nd <0.514 76 13 69 122 84 84 6 <5 17 11 7 586 8 23 15 15 25 25 18 6 17 16 18 17
17 18 18 18 18 18 18 18 18 18 17 18 18<0.1 <0.1 <0.1 <0.1 <0.1 <0.1 <0.1 <0.1 <0.1 <0.1 <0.1 <0.1 <0.10.38 0.48 0.38 0.57 0.55 0.56 0.56 0.45 0.46 0.36 0.31 0.65 0.414.1 11.6 8.5 17.1 24.6 15.1 16.1 3.2 13.4 9.5 15.6 8.7 8.60.4 0.6 0.2 0.9 0.3 0.7 0.7 0.5 0.4 0.4 0.3 0.3 0.2
0.17 0.21 0.24 0.11 0.16 0.12 0.21 <0.1 0.31 <0.1 <0.1 0.17 0.440.54 0.52 0.21 0.46 0.34 0.13 0.13 0.28 0.53 0.33 0.26 0.35 0.81<0.1 <0.1 <0.1 <0.1 <0.1 <0.1 <0.2 <0.1 <0.1 <0.1 <0.1 <0.1 <0.1
72.9 75.4 59.6 89.5 97.5 97.9 97.9 85.1 78.7 99.3 65.5 101.1 90.279.4 82.8 59.0 84.0 91.0 102.0 102.0 84.0 76.2 107.0 86.0 92.0 100.4<0.5 <0.5 0.6 0.6 0.8 <0.5 <0.6 0.7 0.8 0.6 <0.5 0.9 <0.5<0.5 <0.5 <0.5 <0.5 <0.5 <0.5 <0.6 <0.5 <0.5 <0.5 <0.5 <0.5 <0.5

ACC
EPTE
D M
ANU
SCR
IPT
ACCEPTED MANUSCRIPT
p Southern Zone Eastern Satellite Grou Eastern Satellite Group Eastern Satellite GroupRA02AK17A RA02AK17B RA02AK18 01PH107B2 01KD72B2 01KD74B2 01KD75D2 RA02AK053 01KD141A3 02KD31B3 01PH104B3 01KD137A3
89 89 75 108 86 79 31 61 76 28 34 33.3 3.3 3.3 1.9 2.4 3.1 0.7 2.6 1.7 1.3 0.9 1.1159 159 192 89 195 179 159 253 236 318 276 461978 978 846 2660 910 1030 188 913 577 399 275 547
0.56 0.56 0.39 1.21 0.44 0.44 0.19 0.24 0.32 0.09 0.12 0.014.7 4.7 5.2 4.5 3.3 4.7 5.1 4.1 3.7 5.9 11.5 110.0
19.3 19.3 17.5 8.1 30.1 35.8 3.5 19.2 18.7 8.7 4.2 6.138.5 38.5 34.2 12.6 59.2 69.3 8.3 38.5 39.3 19.3 11.4 5.95.3 5.3 4.6 1.3 7.4 8.6 1.1 5.0 5.2 2.7 1.9 1.9
20.3 20.2 18.3 4.7 29.1 34.0 5.0 20.2 21.1 12.3 9.8 10.84.5 4.5 4.1 0.9 6.4 7.3 1.4 4.9 5.1 3.6 3.3 3.60.9 1.9 0.9 0.8 1.1 1.4 0.5 1.1 1.2 1.0 1.4 1.44.4 5.4 4.1 0.7 6.2 6.4 1.8 4.2 5.6 3.5 4.5 5.8
0.70 0.70 0.65 0.14 1.04 1.01 0.32 0.82 0.97 0.71 0.77 0.994.17 4.17 3.80 0.95 6.73 6.17 2.10 5.18 6.19 4.38 5.03 6.320.87 0.87 0.79 0.22 1.42 1.22 0.46 1.06 1.33 0.88 1.09 1.412.59 2.59 2.37 0.79 4.30 3.61 1.32 3.34 4.01 2.71 3.27 4.110.37 0.37 0.35 0.13 0.69 0.54 0.20 0.51 0.58 0.41 0.48 0.612.31 2.31 2.15 0.97 4.07 3.29 1.20 3.18 3.80 2.50 2.90 3.640.34 0.34 0.32 0.17 0.63 0.49 0.18 0.45 0.58 0.36 0.44 0.56
24 24 22 6 39 34 12 29 37 23 29 41
8.4 8.4 8.2 8.4 7.4 10.9 3.0 6.0 4.9 3.5 1.5 1.7104.5 106.5 94.1 32.4 158.5 179.1 27.5 108.0 113.5 63.0 50.5 53.216.9 16.9 13.5 5.8 14.5 31.4 7.7 9.9 15.7 24.5 76.5 23.7
125 125 123 234 232 277 27 191 249 102 139 673.8 3.8 3.8 6.7 5.8 6.6 0.9 5.8 5.9 3.0 3.1 1.98 8 8 2 9 10 1 9 4 4 1 0
0.69 0.69 0.63 0.42 0.74 0.66 0.14 0.64 0.45 0.22 0.08 0.017.4 7.4 6.1 2.3 8.6 9.2 2.2 7.3 5.8 2.6 0.3 0.32.3 2.3 2.5 2.2 4.1 2.2 1.1 3.9 2.5 0.8 0.1 0.2
11.6 11.6 11.9 4.9 12.5 15.0 6.5 14.7 10.0 20.3 8.0 20.032.9 32.9 32.0 34.7 39.9 41.8 31.0 32.9 42.1 33.9 44.3 35.327.4 27.4 22.9 56.5 35.6 25.5 42.7 23.6 45.1 21.1 36.3 3.03.5 3.5 3.0 0.9 2.3 4.5 0.8 2.4 1.8 5.7 4.4 nd
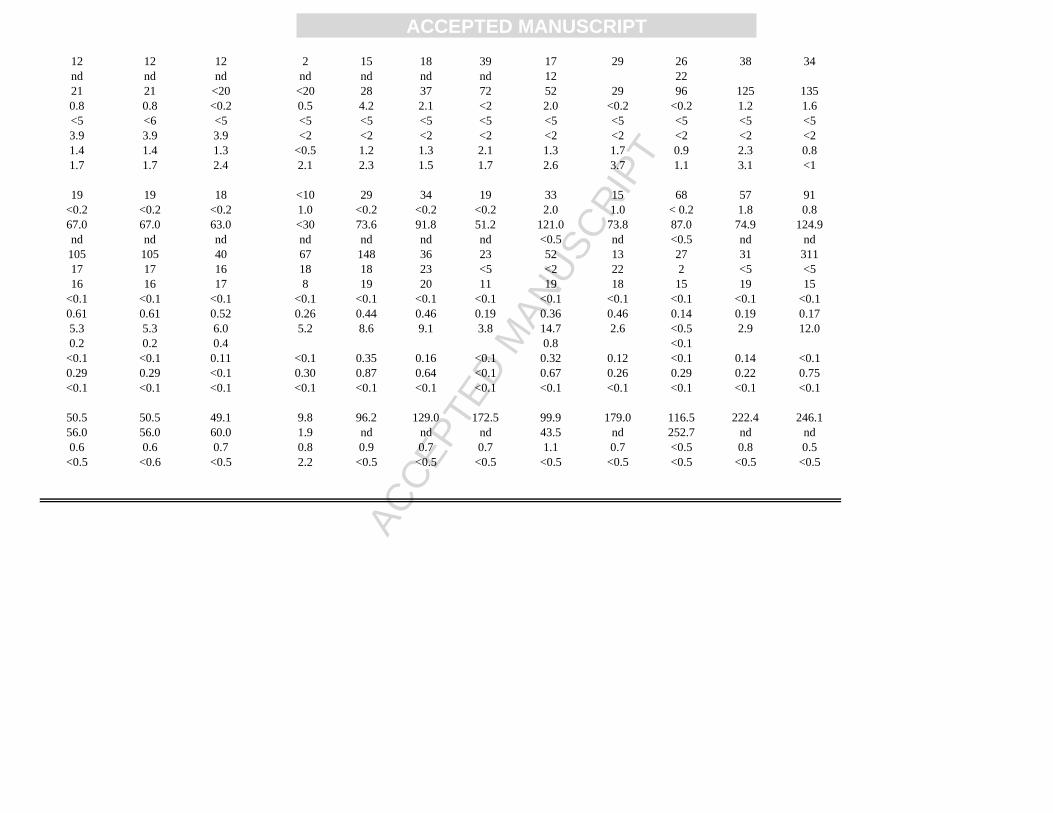
ACC
EPTE
D M
ANU
SCR
IPT
ACCEPTED MANUSCRIPT
12 12 12 2 15 18 39 17 29 26 38 34nd nd nd nd nd nd nd 12 2221 21 <20 <20 28 37 72 52 29 96 125 1350.8 0.8 <0.2 0.5 4.2 2.1 <2 2.0 <0.2 <0.2 1.2 1.6<5 <6 <5 <5 <5 <5 <5 <5 <5 <5 <5 <53.9 3.9 3.9 <2 <2 <2 <2 <2 <2 <2 <2 <21.4 1.4 1.3 <0.5 1.2 1.3 2.1 1.3 1.7 0.9 2.3 0.81.7 1.7 2.4 2.1 2.3 1.5 1.7 2.6 3.7 1.1 3.1 <1
19 19 18 <10 29 34 19 33 15 68 57 91<0.2 <0.2 <0.2 1.0 <0.2 <0.2 <0.2 2.0 1.0 < 0.2 1.8 0.867.0 67.0 63.0 <30 73.6 91.8 51.2 121.0 73.8 87.0 74.9 124.9nd nd nd nd nd nd nd <0.5 nd <0.5 nd nd105 105 40 67 148 36 23 52 13 27 31 31117 17 16 18 18 23 <5 <2 22 2 <5 <516 16 17 8 19 20 11 19 18 15 19 15
<0.1 <0.1 <0.1 <0.1 <0.1 <0.1 <0.1 <0.1 <0.1 <0.1 <0.1 <0.10.61 0.61 0.52 0.26 0.44 0.46 0.19 0.36 0.46 0.14 0.19 0.175.3 5.3 6.0 5.2 8.6 9.1 3.8 14.7 2.6 <0.5 2.9 12.00.2 0.2 0.4 0.8 <0.1
<0.1 <0.1 0.11 <0.1 0.35 0.16 <0.1 0.32 0.12 <0.1 0.14 <0.10.29 0.29 <0.1 0.30 0.87 0.64 <0.1 0.67 0.26 0.29 0.22 0.75<0.1 <0.1 <0.1 <0.1 <0.1 <0.1 <0.1 <0.1 <0.1 <0.1 <0.1 <0.1
50.5 50.5 49.1 9.8 96.2 129.0 172.5 99.9 179.0 116.5 222.4 246.156.0 56.0 60.0 1.9 nd nd nd 43.5 nd 252.7 nd nd0.6 0.6 0.7 0.8 0.9 0.7 0.7 1.1 0.7 <0.5 0.8 0.5
<0.5 <0.6 <0.5 2.2 <0.5 <0.5 <0.5 <0.5 <0.5 <0.5 <0.5 <0.5

ACC
EPTE
D M
ANU
SCR
IPT
ACCEPTED MANUSCRIPT
Table 3. Major element compositions of representative samples of the Kodiak Formation and Ghost Rocks Formation, Kodiak Island, Alaska
Ghost Rocks Formation Kodiak FormationSample RA02AK01 RA02AK02 RA02AK03 RA02AK04 RA02AK34 RA02AK43 RA02AK11 RA02AK131
Major elements (wt. %)SiO2 59.27 61.33 63.07 63.78 66.30 64.07 61.74 58.24Al2O3 17.44 17.01 15.87 15.50 14.31 16.08 17.72 16.99TiO2 0.94 0.91 0.81 0.77 0.76 0.80 0.88 0.81Fe2O3 8.39 7.97 7.29 6.43 6.54 7.23 6.91 7.48MgO 3.24 3.08 2.63 2.36 1.90 2.53 2.59 2.67MnO 0.09 0.09 0.12 0.07 0.15 0.17 0.12 0.12CaO 0.45 0.41 1.39 1.44 1.05 1.88 1.03 3.97Na2O 2.48 2.61 2.36 2.62 1.88 2.55 1.75 3.71K2O 2.75 2.64 2.05 2.30 3.32 2.12 2.97 1.41P2O5 0.24 0.21 0.24 0.22 0.23 0.25 0.25 1.14LOI 4.73 4.39 3.93 3.29 3.06 2.24 3.52 3.17Total 100.01 100.64 99.75 98.78 99.50 99.91 99.48 99.71
S % 0.121 0.337 0.153 0.203 0.009 0.367 0.004 0.038
ASI2 2.2 2.2 1.8 1.6 1.7 1.6 2.2 1.1K2O+Na2O 5.2 5.3 4.4 4.9 5.2 4.7 4.7 5.1Na2O/K2O 1.1 1.0 0.9 0.9 1.8 0.8 1.7 0.4
1Country rock inclusion in Central zone of batholith2ASI= mol Al2O3/(K2O+Na2O+CaO)
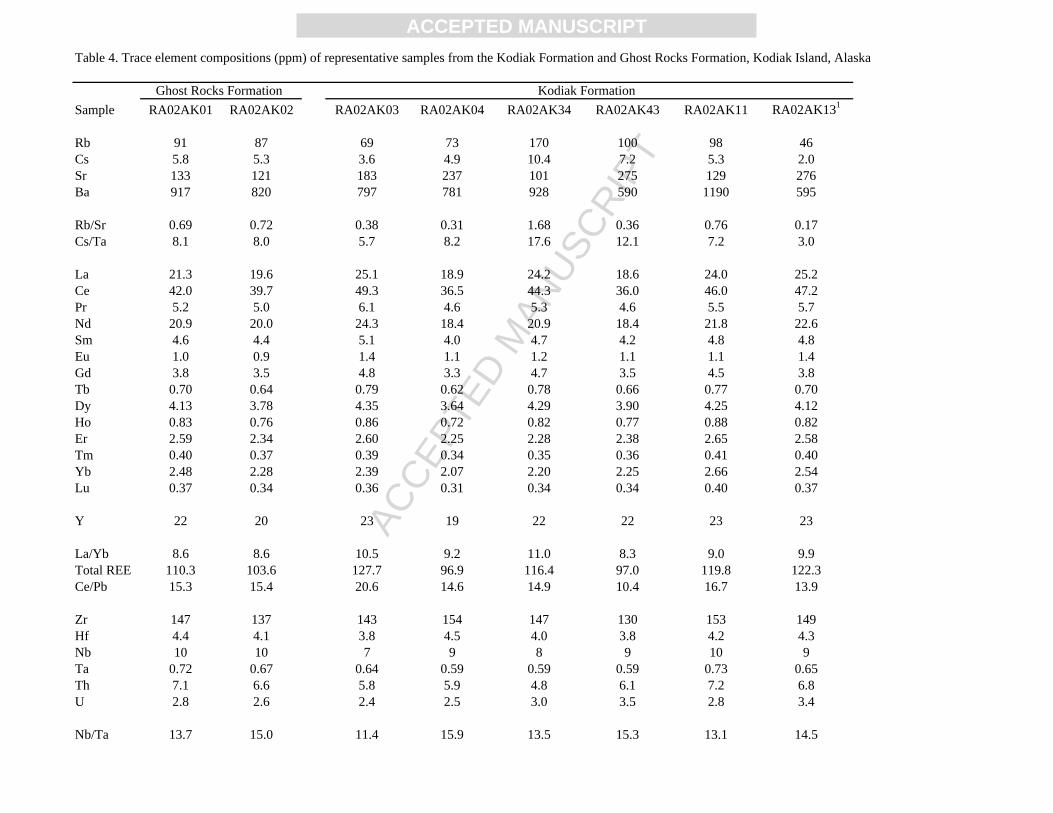
ACC
EPTE
D M
ANU
SCR
IPT
ACCEPTED MANUSCRIPT
Table 4. Trace element compositions (ppm) of representative samples from the Kodiak Formation and Ghost Rocks Formation, Kodiak Island, Alaska
Ghost Rocks Formation Kodiak Formation Sample RA02AK01 RA02AK02 RA02AK03 RA02AK04 RA02AK34 RA02AK43 RA02AK11 RA02AK131
Rb 91 87 69 73 170 100 98 46Cs 5.8 5.3 3.6 4.9 10.4 7.2 5.3 2.0Sr 133 121 183 237 101 275 129 276Ba 917 820 797 781 928 590 1190 595
Rb/Sr 0.69 0.72 0.38 0.31 1.68 0.36 0.76 0.17Cs/Ta 8.1 8.0 5.7 8.2 17.6 12.1 7.2 3.0 La 21.3 19.6 25.1 18.9 24.2 18.6 24.0 25.2Ce 42.0 39.7 49.3 36.5 44.3 36.0 46.0 47.2Pr 5.2 5.0 6.1 4.6 5.3 4.6 5.5 5.7Nd 20.9 20.0 24.3 18.4 20.9 18.4 21.8 22.6Sm 4.6 4.4 5.1 4.0 4.7 4.2 4.8 4.8Eu 1.0 0.9 1.4 1.1 1.2 1.1 1.1 1.4Gd 3.8 3.5 4.8 3.3 4.7 3.5 4.5 3.8Tb 0.70 0.64 0.79 0.62 0.78 0.66 0.77 0.70Dy 4.13 3.78 4.35 3.64 4.29 3.90 4.25 4.12Ho 0.83 0.76 0.86 0.72 0.82 0.77 0.88 0.82Er 2.59 2.34 2.60 2.25 2.28 2.38 2.65 2.58Tm 0.40 0.37 0.39 0.34 0.35 0.36 0.41 0.40Yb 2.48 2.28 2.39 2.07 2.20 2.25 2.66 2.54Lu 0.37 0.34 0.36 0.31 0.34 0.34 0.40 0.37
Y 22 20 23 19 22 22 23 23
La/Yb 8.6 8.6 10.5 9.2 11.0 8.3 9.0 9.9Total REE 110.3 103.6 127.7 96.9 116.4 97.0 119.8 122.3Ce/Pb 15.3 15.4 20.6 14.6 14.9 10.4 16.7 13.9
Zr 147 137 143 154 147 130 153 149Hf 4.4 4.1 3.8 4.5 4.0 3.8 4.2 4.3Nb 10 10 7 9 8 9 10 9Ta 0.72 0.67 0.64 0.59 0.59 0.59 0.73 0.65Th 7.1 6.6 5.8 5.9 4.8 6.1 7.2 6.8U 2.8 2.6 2.4 2.5 3.0 3.5 2.8 3.4
Nb/Ta 13.7 15.0 11.4 15.9 13.5 15.3 13.1 14.5

ACC
EPTE
D M
ANU
SCR
IPT
ACCEPTED MANUSCRIPT
Zr/Hf 33.5 33.7 37.5 34.3 36.4 34.4 36.3 34.8Th/U 2.6 2.6 2.4 2.4 1.6 1.8 2.6 2.0Nb/U 3.6 3.9 3.1 3.8 2.7 2.6 3.5 2.8
Sc 22 20 18 16 17 19 21 19Co 16 19 20 13 5 15 10 3Ni 59 62 75 57 55 86 49 19Au (ppb) 4.0 3.8 0.4 0.3 3.1 3.7 6.5 1.2Ir <5 <5 <5 <5 <5 <5 <5 <5Mo <2 3.7 2.5 2.6 3.4 <2 4.9 7.0Ge 1.1 0.9 1.4 1.2 1.2 1.3 1.4 1.1Sn 1.3 1.2 <1 <1 <1 <1 1.1 1.1
Cu 152 53 67 59 45 58 35 121Ag 4.0 3.8 0.4 0.3 3.1 3.7 6.5 1.2Zn 149.0 157.3 135.8 156.8 77.7 185.0 115.6 68.0Cd 0.9 1.3 <0.5 0.5 <0.5 0.5 <0.5 <0.5Hg (ppb) 356 373 128 96 281 41 43 56Pb 16 14 9 21 5 8 10 3Ga 22 20 18 17 19 18 20 18In <0.1 <0.1 <0.1 <0.1 <0.1 <0.1 <0.1 <0.1Tl 0.49 0.48 0.44 0.38 0.60 0.51 0.63 0.28As 14.9 19.6 18.5 15.2 56.4 210.0 19.5 16.1Sb 0.9 1.4 1.3 1.0 30.3 0.3 3.2 0.3Bi 1.29 0.97 0.69 0.55 0.42 0.14 0.48 0.67Se 0.71 0.88 0.90 0.66 0.59 0.64 0.41 0.95Te <0.1 <0.1 <0.1 <0.1 <0.1 0.1 <0.1 0.1
V 165.4 152.4 159.8 125.1 142.0 142.3 182.0 136.8Cr 109.3 96.3 110.5 81.3 94.4 92.4 106.2 81.6W 1.1 1.0 0.8 0.9 2.8 1.0 1.1 0.7Br <0.5 <0.5 <0.5 <0.5 <0.5 <0.5 <0.5 <0.5
nd, not determined
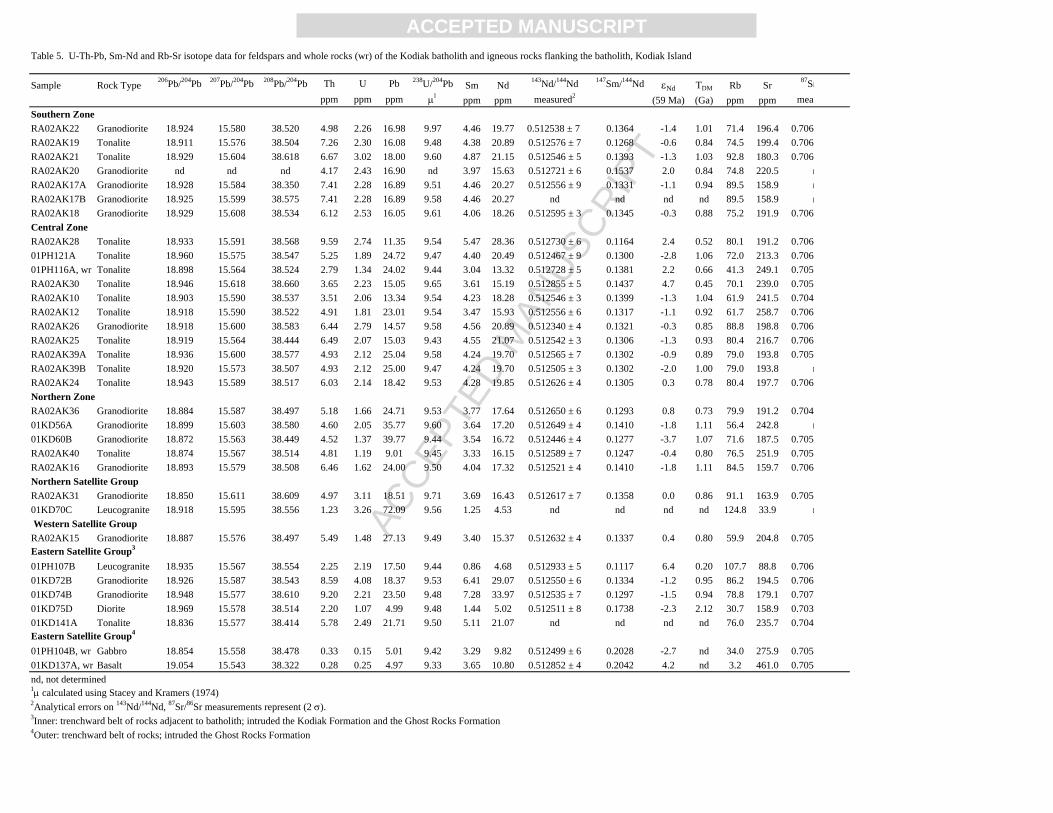
ACC
EPTE
D M
ANU
SCR
IPT
ACCEPTED MANUSCRIPT
1
Table 5. U-Th-Pb, Sm-Nd and Rb-Sr isotope data for feldspars and whole rocks (wr) of the Kodiak batholith and igneous rocks flanking the batholith, Kodiak Island
Sample Rock Type 206Pb/204Pb 207Pb/204Pb 208Pb/204Pb Th U Pb 238U/204Pb Sm Nd 143Nd/144Nd 147Sm/144Nd εNd TDM Rb Sr 87Srppm ppm ppm μ ppm ppm measured2 (59 Ma) (Ga) ppm ppm meas
Southern ZoneRA02AK22 Granodiorite 18.924 15.580 38.520 4.98 2.26 16.98 9.97 4.46 19.77 0.512538 ± 7 0.1364 -1.4 1.01 71.4 196.4 0.7063RA02AK19 Tonalite 18.911 15.576 38.504 7.26 2.30 16.08 9.48 4.38 20.89 0.512576 ± 7 0.1268 -0.6 0.84 74.5 199.4 0.706RA02AK21 Tonalite 18.929 15.604 38.618 6.67 3.02 18.00 9.60 4.87 21.15 0.512546 ± 5 0.1393 -1.3 1.03 92.8 180.3 0.706RA02AK20 Granodiorite nd nd nd 4.17 2.43 16.90 nd 3.97 15.63 0.512721 ± 6 0.1537 2.0 0.84 74.8 220.5 nRA02AK17A Granodiorite 18.928 15.584 38.350 7.41 2.28 16.89 9.51 4.46 20.27 0.512556 ± 9 0.1331 -1.1 0.94 89.5 158.9 nRA02AK17B Granodiorite 18.925 15.599 38.575 7.41 2.28 16.89 9.58 4.46 20.27 nd nd nd nd 89.5 158.9 nRA02AK18 Granodiorite 18.929 15.608 38.534 6.12 2.53 16.05 9.61 4.06 18.26 0.512595 ± 3 0.1345 -0.3 0.88 75.2 191.9 0.706Central ZoneRA02AK28 Tonalite 18.933 15.591 38.568 9.59 2.74 11.35 9.54 5.47 28.36 0.512730 ± 6 0.1164 2.4 0.52 80.1 191.2 0.706401PH121A Tonalite 18.960 15.575 38.547 5.25 1.89 24.72 9.47 4.40 20.49 0.512467 ± 9 0.1300 -2.8 1.06 72.0 213.3 0.706201PH116A, wr Tonalite 18.898 15.564 38.524 2.79 1.34 24.02 9.44 3.04 13.32 0.512728 ± 5 0.1381 2.2 0.66 41.3 249.1 0.705RA02AK30 Tonalite 18.946 15.618 38.660 3.65 2.23 15.05 9.65 3.61 15.19 0.512855 ± 5 0.1437 4.7 0.45 70.1 239.0 0.7056RA02AK10 Tonalite 18.903 15.590 38.537 3.51 2.06 13.34 9.54 4.23 18.28 0.512546 ± 3 0.1399 -1.3 1.04 61.9 241.5 0.704RA02AK12 Tonalite 18.918 15.590 38.522 4.91 1.81 23.01 9.54 3.47 15.93 0.512556 ± 6 0.1317 -1.1 0.92 61.7 258.7 0.7069RA02AK26 Granodiorite 18.918 15.600 38.583 6.44 2.79 14.57 9.58 4.56 20.89 0.512340 ± 4 0.1321 -0.3 0.85 88.8 198.8 0.7062RA02AK25 Tonalite 18.919 15.564 38.444 6.49 2.07 15.03 9.43 4.55 21.07 0.512542 ± 3 0.1306 -1.3 0.93 80.4 216.7 0.7062RA02AK39A Tonalite 18.936 15.600 38.577 4.93 2.12 25.04 9.58 4.24 19.70 0.512565 ± 7 0.1302 -0.9 0.89 79.0 193.8 0.705RA02AK39B Tonalite 18.920 15.573 38.507 4.93 2.12 25.00 9.47 4.24 19.70 0.512505 ± 3 0.1302 -2.0 1.00 79.0 193.8 nRA02AK24 Tonalite 18.943 15.589 38.517 6.03 2.14 18.42 9.53 4.28 19.85 0.512626 ± 4 0.1305 0.3 0.78 80.4 197.7 0.7063Northern ZoneRA02AK36 Granodiorite 18.884 15.587 38.497 5.18 1.66 24.71 9.53 3.77 17.64 0.512650 ± 6 0.1293 0.8 0.73 79.9 191.2 0.704701KD56A Granodiorite 18.899 15.603 38.580 4.60 2.05 35.77 9.60 3.64 17.20 0.512649 ± 4 0.1410 -1.8 1.11 56.4 242.8 n01KD60B Granodiorite 18.872 15.563 38.449 4.52 1.37 39.77 9.44 3.54 16.72 0.512446 ± 4 0.1277 -3.7 1.07 71.6 187.5 0.705RA02AK40 Tonalite 18.874 15.567 38.514 4.81 1.19 9.01 9.45 3.33 16.15 0.512589 ± 7 0.1247 -0.4 0.80 76.5 251.9 0.7052RA02AK16 Granodiorite 18.893 15.579 38.508 6.46 1.62 24.00 9.50 4.04 17.32 0.512521 ± 4 0.1410 -1.8 1.11 84.5 159.7 0.7064Northern Satellite GroupRA02AK31 Granodiorite 18.850 15.611 38.609 4.97 3.11 18.51 9.71 3.69 16.43 0.512617 ± 7 0.1358 0.0 0.86 91.1 163.9 0.70501KD70C Leucogranite 18.918 15.595 38.556 1.23 3.26 72.09 9.56 1.25 4.53 nd nd nd nd 124.8 33.9 n Western Satellite GroupRA02AK15 Granodiorite 18.887 15.576 38.497 5.49 1.48 27.13 9.49 3.40 15.37 0.512632 ± 4 0.1337 0.4 0.80 59.9 204.8 0.7054Eastern Satellite Group3
01PH107B Leucogranite 18.935 15.567 38.554 2.25 2.19 17.50 9.44 0.86 4.68 0.512933 ± 5 0.1117 6.4 0.20 107.7 88.8 0.706401KD72B Granodiorite 18.926 15.587 38.543 8.59 4.08 18.37 9.53 6.41 29.07 0.512550 ± 6 0.1334 -1.2 0.95 86.2 194.5 0.706901KD74B Granodiorite 18.948 15.577 38.610 9.20 2.21 23.50 9.48 7.28 33.97 0.512535 ± 7 0.1297 -1.5 0.94 78.8 179.1 0.707401KD75D Diorite 18.969 15.578 38.514 2.20 1.07 4.99 9.48 1.44 5.02 0.512511 ± 8 0.1738 -2.3 2.12 30.7 158.9 0.703901KD141A Tonalite 18.836 15.577 38.414 5.78 2.49 21.71 9.50 5.11 21.07 nd nd nd nd 76.0 235.7 0.7044Eastern Satellite Group4
01PH104B, wr Gabbro 18.854 15.558 38.478 0.33 0.15 5.01 9.42 3.29 9.82 0.512499 ± 6 0.2028 -2.7 nd 34.0 275.9 0.70501KD137A, wr Basalt 19.054 15.543 38.322 0.28 0.25 4.97 9.33 3.65 10.80 0.512852 ± 4 0.2042 4.2 nd 3.2 461.0 0.7054nd, not determined1μ calculated using Stacey and Kramers (1974)2Analytical errors on 143Nd/144Nd, 87Sr/86Sr measurements represent (2 σ). 3Inner: trenchward belt of rocks adjacent to batholith; intruded the Kodiak Formation and the Ghost Rocks Formation4Outer: trenchward belt of rocks; intruded the Ghost Rocks Formation
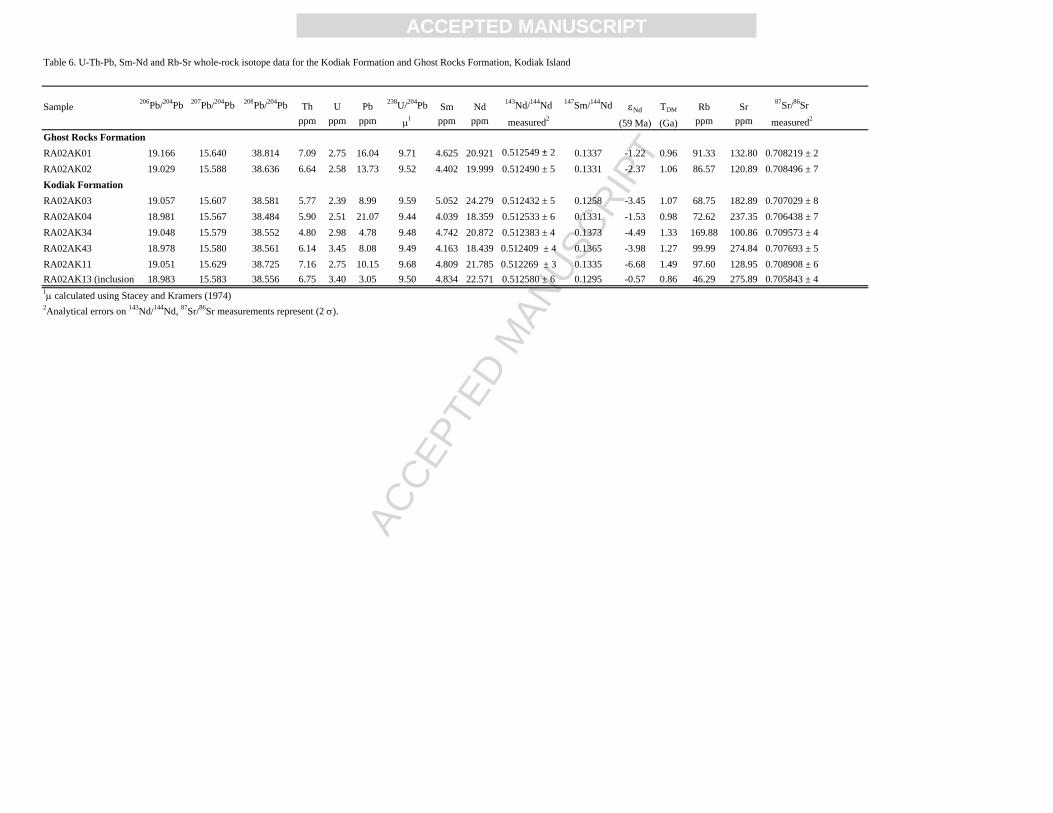
ACC
EPTE
D M
ANU
SCR
IPT
ACCEPTED MANUSCRIPT
1
Table 6. U-Th-Pb, Sm-Nd and Rb-Sr whole-rock isotope data for the Kodiak Formation and Ghost Rocks Formation, Kodiak Island
Sample 206Pb/204Pb 207Pb/204Pb 208Pb/204Pb Th U Pb 238U/204Pb Sm Nd 143Nd/144Nd 147Sm/144Nd εNd TDM Rb Sr 87Sr/86Sr
ppm ppm ppm μ ppm ppm measured2 (59 Ma) (Ga) ppm ppm measured2
Ghost Rocks FormationRA02AK01 19.166 15.640 38.814 7.09 2.75 16.04 9.71 4.625 20.921 0.512549 ± 2 0.1337 -1.22 0.96 91.33 132.80 0.708219 ± 2RA02AK02 19.029 15.588 38.636 6.64 2.58 13.73 9.52 4.402 19.999 0.512490 ± 5 0.1331 -2.37 1.06 86.57 120.89 0.708496 ± 7Kodiak FormationRA02AK03 19.057 15.607 38.581 5.77 2.39 8.99 9.59 5.052 24.279 0.512432 ± 5 0.1258 -3.45 1.07 68.75 182.89 0.707029 ± 8RA02AK04 18.981 15.567 38.484 5.90 2.51 21.07 9.44 4.039 18.359 0.512533 ± 6 0.1331 -1.53 0.98 72.62 237.35 0.706438 ± 7RA02AK34 19.048 15.579 38.552 4.80 2.98 4.78 9.48 4.742 20.872 0.512383 ± 4 0.1373 -4.49 1.33 169.88 100.86 0.709573 ± 4RA02AK43 18.978 15.580 38.561 6.14 3.45 8.08 9.49 4.163 18.439 0.512409 ± 4 0.1365 -3.98 1.27 99.99 274.84 0.707693 ± 5RA02AK11 19.051 15.629 38.725 7.16 2.75 10.15 9.68 4.809 21.785 0.512269 ± 3 0.1335 -6.68 1.49 97.60 128.95 0.708908 ± 6RA02AK13 (inclusion) 18.983 15.583 38.556 6.75 3.40 3.05 9.50 4.834 22.571 0.512580 ± 6 0.1295 -0.57 0.86 46.29 275.89 0.705843 ± 41μ calculated using Stacey and Kramers (1974)2Analytical errors on 143Nd/144Nd, 87Sr/86Sr measurements represent (2 σ).