Geochemistry of loess-paleosol sediments of Kashmir Valley, India: Provenance and weathering
18
This article appeared in a journal published by Elsevier. The attached copy is furnished to the author for internal non-commercial research and education use, including for instruction at the authors institution and sharing with colleagues. Other uses, including reproduction and distribution, or selling or licensing copies, or posting to personal, institutional or third party websites are prohibited. In most cases authors are permitted to post their version of the article (e.g. in Word or Tex form) to their personal website or institutional repository. Authors requiring further information regarding Elsevier’s archiving and manuscript policies are encouraged to visit: http://www.elsevier.com/copyright
Transcript of Geochemistry of loess-paleosol sediments of Kashmir Valley, India: Provenance and weathering

This article appeared in a journal published by Elsevier. The attachedcopy is furnished to the author for internal non-commercial researchand education use, including for instruction at the authors institution
and sharing with colleagues.
Other uses, including reproduction and distribution, or selling orlicensing copies, or posting to personal, institutional or third party
websites are prohibited.
In most cases authors are permitted to post their version of thearticle (e.g. in Word or Tex form) to their personal website orinstitutional repository. Authors requiring further information
regarding Elsevier’s archiving and manuscript policies areencouraged to visit:
http://www.elsevier.com/copyright
Author's personal copy
Geochemistry of loess-paleosol sediments of Kashmir Valley, India: Provenanceand weathering
Ishtiaq Ahmad ⇑, Rakesh ChandraDepartment of Geology and Geophysics, University of Kashmir, Hazratbal, Srinagar 190 006, India
a r t i c l e i n f o
Article history:Received 18 January 2012Received in revised form 7 December 2012Accepted 25 December 2012Available online 11 January 2013
Keywords:Loess-paleosolMiddle to Late PleistoceneGeochemistryProvenancePaleoweatheringKashmir ValleyIndia
a b s t r a c t
Middle to Late Pleistocene loess-paleosol sediments of Kashmir Valley, India, were analyzed for major,trace and REE elements in order to determine their chemical composition, provenance and intensity ofpalaeo-weathering of the source rocks. These sediments are generally enriched with Fe2O3, MgO, MnO,TiO2, Y, Ni, Cu, Zn, Th, U, Sc, V and Co while contents of SiO2, K2O, Na2O, P2O5, Sr, Nb and Hf are lowerthan the UCC. Chondrite normalized REE patterns are characterized by moderate enrichment of LREEs,relatively flat HREE pattern (GdCN/YbCN = 1.93–2.31) and lack of prominent negative Eu anomaly (Eu/Eu� = 0.73–1.01, average = 0.81). PAAS normalized REE are characterized by slightly higher LREE, depletedHREE and positive Eu anomaly. Various provenance discrimination diagrams reveal that the KashmirLoess-Paleosol sediments are derived from the mixed source rocks suggesting large provenance with var-iable geological settings, which apparently have undergone weak to moderate recycling processes.Weathering indices such as CIA, CIW and PIA values (71.87, 83.83 and 80.57 respectively) and A-CN-Kdiagram imply weak to moderate weathering of the source material.
� 2013 Elsevier Ltd. All rights reserved.
1. Introduction
Loess blanket about 10% portion of the globe (Pye, 1987). Theloess deposits are usually found very close to desert margins, tothe mountainous areas, in flood plains of large rivers, on shallowmarine shelves emerged during the last glacial periods and in theperiglacial environment. Almost all the known loess deposits areessentially of Quaternary age, but little ancient loess with age asold as Late Precambrian has been recognized (e.g., Edwards, 1979).In the last two decades, loess deposits have attracted increasingattention of the Earth Scientists mainly because of their potentialpreservation of the past climatic records. Their aeolian origin wasestablished more than a hundred years ago by the pioneering workof Von Richthofen (1882) on the Chinese Loess deposits. At present,an aeolian origin is generally accepted but the detailed processes ofthe loess formation with increasing complexity are also recognized(Smalley and Smalley, 1983). For example, a significant part of theloess deposits has been reworked and subsequently redeposited.
The chemical composition of loessic sediments is closely relatedto the mineral composition of the dust sources, post-depositionalweathering and transportation of sediments from source regionto depocenter. The bulk chemistry of these sediments preservesthe near-original signature of the provenance. Consequently, loessdiffers in chemical composition from one region to another andeven from one stratigraphic unit to another (Pye and Johnson,
1988; Taylor et al., 1983). These sediments also more faithfully re-veal paleoweathering conditions (e.g., Yang and Ding, 2004; Yanget al., 2006; Ujvari et al., 2008; Muhs et al., 2001, 2008). Like otherclastic sedimentary rocks, these loessic sediments also subjected tovarious degrees of chemical weathering and leaching. As loessweathers, elements that are soluble under surficial weatheringconditions (e.g., Ca2+, Na+, K+) can be readily leached out relativeto stable residual constituents (Al3+, Ti4+) during weathering (Nes-bitt and Young, 1982). If weathering is strong and persistent, silicais released, residual sesquioxides can be concentrated, and evensome new sesquioxides can be formed. While low degree of weath-ering of sedimentary rocks indicates the absence or weak chemicalalteration of the sediments. Thus, the fluctuation in chemicalweathering intensity reflects the systematic variations of elementabundances. The relative variations of various elements have beenused to ascertain the degree of chemical weathering (Nesbitt andYoung, 1982; Price and Velbel, 2003; Jin et al., 2006; Yang et al.,2006; Ceryan, 2008). Numerous investigations corroborate theabove aspects pertaining to provenances and weathering of loessicsediments based on geochemical signatures of loess-paleosol sed-iments (e.g., Jahn et al., 2001; Sun et al., 2007; Muhs and Budahn,2006; Liang et al., 2009).
In Kashmir, loess deposits are distributed throughout the valleyand covering an area of 500 sq. km. However, these sedimentsshow great variation in their thickness. The maximum thicknessis found on the southwestern part of the Kashmir Valley wherethese are about 22 m thick. The thickness decrease toward thenortheastern part of the valley and is measured about 4 m. These
1367-9120/$ - see front matter � 2013 Elsevier Ltd. All rights reserved.http://dx.doi.org/10.1016/j.jseaes.2012.12.029
⇑ Corresponding author. Tel.: +91 9697318304.E-mail address: [email protected] (I. Ahmad).
Journal of Asian Earth Sciences 66 (2013) 73–89
Contents lists available at SciVerse ScienceDirect
Journal of Asian Earth Sciences
journal homepage: www.elsevier .com/locate / jseaes

Author's personal copy
sediments lie within the Brunhes normal magnetic epoch (Kusum-gar et al., 1980). The loess deposits along northeastern part of theKashmir Valley are younger than 85 ka years. However, along thesouthwestern part of the valley entire loess sequence spans at least�300 ka (Singhvi et al., 1987). On the basis of micromorphologicalinvestigation, Pant et al. (1985) and Bronger and Pant (1985) pro-posed a stratigraphic comparison between two loess-paleosol se-quences both along the Himalayan and Pir Panjal flanks. Theyconcluded that along the northeastern part of the Kashmir Valley,the older loess-paleosol sequence is missing and in their places,fluvio-lacustrine sediments of the Upper Karewa exist. Lot of workhas been carried out by various workers (e.g., Agrawal et al., 1979,1988, 1989; Kusumgar et al., 1980, 1986; Krishnamurthy et al.,1982, 1985; Bronger and Pant, 1985; Pant and Dilli, 1986; Brongeret al., 1987; Gardner, 1989) to establish the lithostratigraphy ofthese sediments. However, very little data based geological workhas carried out on these loessic sediments. With the exception ofwork of Lodha et al. (1985) and Lodha (1987) no attempt has madeto carry out the geochemical study of these loess-paleosol sedi-ments. The present study examines the detailed geochemistry ofKashmir Loess-Paleosol sediments and attempts to constrain theirchemical weathering and provenance. Two representative loess-paleosol containing sequences at Dilpur (33�560N and 74�470E)and Karapur (33�500N and 74�570E) village sections along thesouthwestern part of the Kashmir Valley have been selected forthe present research work (Fig. 1). These sections represent themost complete and best records of the terrestrial sedimentationin Kashmir Valley.
2. Regional tectonic and geological setup of Kashmir Valley
Kashmir Valley comprises a very important place in the geotec-tonic of Kashmir Himalaya. The general strike of the KashmirValley is from NW to SE, running parallel to the Great Himalayan
Mountain range in the north and Pir-Panjal Mountain range inthe south. The valley takes the form of graben bounded by NW-SE trending parallel Panjal Thrust and Zanskar Thrust. Wadia(1931) described the thrust-bounded basin, as ‘Kashmir NappeZone’ comprising the rocks of Paleozoic–Mesozoic marine sedi-ments, with Precambrian basement thrusted along a regional tec-tonic plane viz., Panjal Thrust over the younger rocks of theautochthones belt. The ‘Kashmir Nappe’ forms two major axes oforogenic upheaval along the Pir-Panjal and the Great Himalayanranges. The valley posses almost complete stratigraphic record ofrocks of all ages ranging from Archean to Recent (Fig. 2).
However, Panjal Volcanic Complex and the Triassic Limestoneform the two main geological formations, underlain by the Archeanmetasedimentary rocks (Salkhala Formation) (Fig. 2). Salkhala For-mation constitutes carbonaceous slates, graphitic phyllite andschist associated with carbonaceous grey or white limestone, mar-ble, calcareous slate and calcareous schist. It also comprises sericit-ic phyllites and schists, garentiferous schists and flaggy quartzite.The outcrops of these oldest rocks are found around the northwest-ern extremity of the Kashmir Valley and portions of the Pir-Panjalrange. Exposures of Triassic sequence comprise alternate thickdark grey limestone, micaceous shale and shally-arenaceous im-pure limestone (Datta, 1983). These rocks are also associated withgranites and gneisses. The other rocks of lesser distribution includeDogra Slates, Cambro-Silurian, Zewan Formation and Muth-Quartzite (Bhat, 1982). Dogra Slates constitute dark grey shale/slate with quartzite; Cambro-Silurian rocks consist of limestone,siltstone, shale, quartzite, greenish-grey sandstone and dolomitewith stromatolite (Bhat, 1982).
The Panjal Volcanic Complex is divisible into two well-markedhorizons, the lower Agglomeratic Slate and the upper Panjal Lavaflows (Bhat and Zainuddin, 1978). The Panjal traps includes allthe coeval flows found throughout Ladakh, North Zanskar (Singhet al., 1976), Suru area (Fig. 1c; Honegger et al., 1982; Papritz
Fig. 1. Map showing the locations of the study area.
74 I. Ahmad, R. Chandra / Journal of Asian Earth Sciences 66 (2013) 73–89

Author's personal copy
and Rey, 1989; Gaetani et al., 1990; Spencer et al., 1995), KashmirValley (Pareek, 1976; Bhat and Zainuddin, 1978, 1979) where theyreach a maximum thickness of about 2500 m. Here they consist ina basal unit made of intermediate to acidic pyroclastic rocks (Par-eek, 1976) overlain by massive aphyric basaltic flows with tholei-itic to slightly alkaline affinities (Singh et al., 1976; Honeggeret al., 1982; Gupta et al., 1983; Vannay and Spring, 1993). Theserocks are also recognized in the western syntaxis of North EastPakistan (Papritz and Rey, 1989; Spencer et al., 1995). The greatestchemical variability is observed in the western syntaxis lavas(North East Pakistan) which also display features of tholeiitic toslightly alkaline affinities (Pogue et al., 1992; Spencer et al.,1995). Chauvet et al. (2008) also illustrates that Panjal lavas arecharacterized by tholeiitic to slightly alkaline affinities (seeFig. 5b; Chauvet et al., 2008).
Plio-Pleistocene glacio-fluvio-lacustrine sediments (approxi-mately 1300 meters thick) in turn overlie the Precambrian toMesozoic basement rocks. These sediments constitute the KarewaGroup (Bhatt, 1982, 1989). These sediments preserve the record ofpast four million years in which the sedimentation is controlled bythe tectonic events (Bhatt, 1982; Gardner, 1989). The soft uncon-solidated sand, clay and conglomerate sediments characterize theKarewa Group. These sediments are capped by mantle of loessicsediments of Dilpur Formation.
3. Sampling and analytical technique
Thirty-eight representative samples were collected from eachloess-paleosol horizons. The samples were air-dried and homoge-
nized and the bulk sediments of each sample were finely ground(<200 mesh) in an agate mortar. Major and trace elements weredetermined using an X-ray fluorescence (XRF) spectrometer (SI-MENS SRS sequential XRF Spectrometer) following the standardprocedure of the Geo Analytical Laboratory of the Wadia Instituteof Himalayan Geology, Dehradun, India (WIHG). The major andtrace elements were analyzed on pressed powder pallets. Loss onIgnition (LOI) was obtained by weighing after 24 hours of calcina-tion at 950 �C. Rare Earth Elements (REEs) were determined by In-duced Couple Plasma-Mass Spectrometry (ICP-MS) technique,using an open acid digestion technique following the standard pro-cedure of the Geo Analytical Laboratory at WIHG. The accuracy ofthe analytical method was established using two internationallyrecognized standard reference materials: AMAG-I and MAG (R.V).
4. Results and discussion
The major (wt%), trace (ppm) and rare earth element (ppm)concentrations of the Kashmir Loess-Paleosol sediments are re-ported in Table 1, along with the ratios of chosen pairs of major,trace and REE elements. As there is lack of geochemical data ondetrital sediments from the Himalayan belt, a comparison of datais made against the UCC; Upper Continental Crust and the availableshale standards like PAAS; Post Archean Australian Shale (Taylorand McLennan, 1985) and NASC; North American Shale Composite(Gromet et al., 1984). In addition, igneous rocks composition (Con-die, 1993), average loess composition (AVL) and global averageloess composition (GAL) (Ujvari et al., 2008) also used forcomparison.
Fig. 2. Geological map of Kashmir Himalaya (after Thakur and Rawat, 1992).
I. Ahmad, R. Chandra / Journal of Asian Earth Sciences 66 (2013) 73–89 75

Author's personal copy
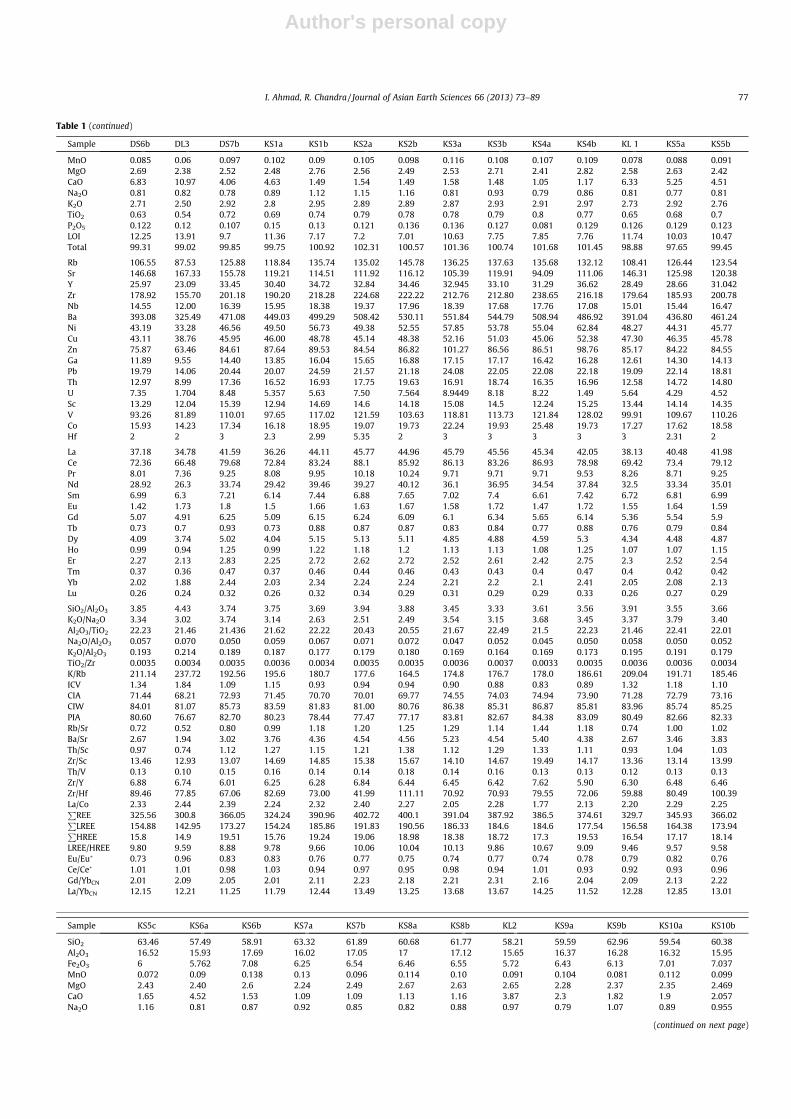
Table 1Chemical composition of loess-paleosol sediments of Karewa Group of Kashmir Valley, India.
Sample DL1 DS 1a DS1b DS2a DS2b DS3a DS3b DL2 DS4a DS4b DS5a DS5b
SiO2 51.4 58.07 52.28 51.76 61.77 60.79 60.36 54.79 61.63 50.92 54.9 60.9Al2O3 12.58 15.72 11.80 12.66 16.52 15.71 17.23 13.64 16.48 11.53 14.77 17.4Fe2O3 4.87 6 4.52 4.78 6.64 6.71 6.85 5.34 6.45 4.23 5.62 6.78MnO 0.08 0.101 0.07 0.08 0.098 0.11 0.114 0.084 0.106 0.06 0.089 0.115MgO 2.59 3.05 2.50 2.43 2.69 2.54 2.56 2.58 2.96 2.50 2.56 2.56CaO 8.6 3.15 9.95 8.47 1.64 1.30 1.32 6.26 1.38 11.33 5.41 1.21Na2O 0.87 0.98 0.89 0.8 1.13 0.97 0.86 0.87 1.04 0.88 0.85 0.77K2O 2.68 2.98 2.61 2.72 3.1 3.17 3.06 2.77 3.03 2.54 2.81 2.94TiO2 0.6 0.71 0.56 0.61 0.76 0.78 0.78 0.65 0.76 0.53 0.68 0.8P2O5 0.128 0.116 0.12 0.126 0.114 0.122 0.087 0.127 0.096 0.13 0.138 0.088LOI 14.81 8.91 13.91 14.79 5.71 8.4 7.5 11.99 7.01 14.4 11.2 7.4Total 99.20 99.78 99.24 99.22 100.17 100.64 100.72 99.10 100.94 99.09 99.02 100.96
Rb 100.9 126.12 98.70 107.55 143.21 155.93 148.13 112.19 135.64 89.03 130.28 142.14Sr 142.36 125.39 161.67 143.05 121.04 111.73 113.31 144.39 122.45 150.91 126.44 115.48Y 24.40 30.92 23.50 25.84 33.46 33.08 32.23 28.079 30.86 20.89 29.63 34.69Zr 162.09 202.73 159.22 165.04 212.02 209.96 206.19 180.78 218.16 146.20 186.27 223.99Nb 14.30 16.17 13.05 13.90 18.11 18.52 17.98 14.90 17.71 11.24 16.40 18.47Ba 374.09 462.4 349.88 394.45 529.62 566.47 547.53 416.93 511.91 312.24 451.88 526.51Ni 41.82 54.48 34.64 37.53 55.17 61.23 56.11 45.34 57.60 32.30 44.85 55.09Cu 43.24 49.45 42.47 43.03 56.10 54.54 51.147 47.48 48.33 40.05 48.44 50.08Zn 74.432 90.05 66.21 78.76 95.24 117.94 86.72 88.85 90.34 60.39 94.27 94.01Ga 12.06 15.31 11.04 12.68 16.89 17.59 17.46 12.10 15.63 10.14 14.46 16.86Pb 17.05 23.70 16.75 19.41 22.26 24.23 23.04 17.477 24.99 15.71 21.15 21.52Th 10.96 15.21 12.19 12.74 15.96 16.09 16.73 11.73 16.18 9.30 15.46 16.81U 2.98 5.33 2.35 4.19 6.44 5.79 7.11 7.08 6.28 3.85 6.56 6.82Sc 12.39 14.33 11.62 12.97 15.53 14.56 15.42 13.14 14.78 11.71 13.62 14.84V 189.34 98.11 80.56 108.35 91.43 90.1 111.6 93.7 107.5 91.62 109.56 111.76Co 15.04 18 14.19 17.26 18.71 17.2 19.3 15.52 18.4 14.6 15.82 20.6Hf 2.09 2.9 1.75 2.41 2.23 2.44 3.01 2.52 3 2 2.42 2
La 34.13 39.48 34.76 38.7 43.85 40.54 42.48 38.02 41.94 33.81 38.09 43.12Ce 66.28 76.85 68.9 76.92 84.5 80.37 83.83 73.24 80.86 64.58 74.29 83.11Pr 7.26 8.67 7.54 8.31 9.32 9.04 9.34 8.1 9.06 7.36 8.32 9.24Nd 26.71 33.04 27.1 30.08 34.41 33.8 33.65 29.79 32.58 27.53 31.29 33.95Sm 5.5 6.71 6.69 6.29 8.16 6.89 6.89 6.18 6.77 6.73 6.06 6.71Eu 1.33 1.6 1.48 1.55 2.3 1.62 1.6 1.54 1.61 1.54 1.44 1.56Gd 4.83 5.37 4.74 5.39 5.99 5.62 5.83 5.32 5.65 4.75 5.35 5.7Tb 0.71 0.77 0.69 0.75 0.84 0.84 0.84 0.74 0.81 0.67 0.79 0.83Dy 3.85 4.29 3.75 4.03 4.71 4.54 4.75 4 4.4 3.7 4.34 4.67Ho 0.96 1.08 0.91 1.02 1.21 1.14 1.19 1.02 1.08 0.92 1.05 1.21Er 2.2 2.39 2.03 2.22 2.78 2.52 2.69 2.28 2.5 2.13 2.36 2.6Tm 0.37 0.39 0.35 0.38 0.45 0.43 0.43 0.39 0.42 0.35 0.4 0.44Yb 2 2.15 1.85 1.98 2.38 2.24 2.37 2.05 2.24 1.8 2.02 2.28Lu 0.26 0.27 0.24 0.26 0.3 0.3 0.3 0.26 0.28 0.23 0.28 0.3
SiO2/Al2O3 4.08 3.69 4.42 4.08 3.73 3.86 3.50 4.01 3.73 4.41 3.71 3.5K2O/Na2O 3.08 3.04 2.91 3.4 2.74 3.24 3.55 3.18 2.91 2.88 3.30 3.81Al2O3/TiO2 20.96 22.14 21.01 20.75 21.73 20.04 22.08 20.98 21.68 21.61 21.72 21.75Na2O/Al2O3 0.069 0.062 0.075 0.063 0.068 0.062 0.049 0.063 0.063 0.076 0.057 0.044K2O/Al2O3 0.21 0.18 0.22 0.21 0.18 0.20 0.17 0.20 0.18 0.22 0.19 0.168TiO2/Zr 0.0037 0.0035 0.0035 0.0036 0.0035 0.0037 0.0037 0.0035 0.0034 0.0036 0.00365 0.0035K/Rb 220.47 196.14 219.73 209.94 179.69 169.02 171.48 204.95 185.44 237.18 179.04 171.69ICV 1.61 1.07 1.78 1.57 0.97 0.99 0.90 1.36 0.95 1.91 1.21 0.87CIA 68.58 70.90 67.14 69.42 70.01 70.222 73.72 69.94 71.09 67.133 71.67 75.27CIW 81.46 82.97 80.01 82.78 81.62 82.97 85.89 82.65 82.80 79.93 84.07 87.29PIA 77.17 79.48 75.28 78.68 77.97 79.20 83.10 78.80 79.41 75.20 80.74 84.87Rb/Sr 0.70 1.00 0.61 0.75 1.18 1.395 1.30 0.77 1.10 0.58 1.03 1.23Ba/Sr 2.62 3.68 2.160 2.75 4.37 5.06 4.83 2.88 4.18 2.06 3.57 4.553Th/Sc 0.88 1.06 1.04 0.98 1.02 1.10 1.08 0.89 1.09 0.79 1.13 1.13Zr/Sc 13.08 14.14 13.70 12.72 13.65 14.42 13.37 13.75 14.76 12.48 13.67 15.09Th/V 0.05 0.15 0.15 0.11 0.17 0.17 0.14 0.12 0.15 0.10 0.14 0.15Zr/Y 6.64 6.55 6.77 6.38 6.33 6.34 6.39 6.43 7.06 6.99 6.28 6.45Zr/Hf 77.55 69.90 90.98 68.48 95.07 86.05 68.50 71.73 72.72 73.10 76.97 111.99La/Co 2.26 2.19 2.44 2.24 2.34 2.35 2.20 2.44 2.27 2.31 2.40 2.09P
REE 297.6 349.41 307.5 339.73 383.74 362.15 373.98 329.8 363.02 297.65 335.57 373.41P
LREE 141.21 166.35 146.47 161.85 182.54 172.26 177.79 156.87 172.82 141.55 159.49 177.69P
HREE 15.18 16.71 14.56 16.03 18.66 17.63 18.4 16.06 17.38 14.55 16.59 18.03LREE/HREE 9.30 9.95 10.05 10.09 9.78 9.77 9.66 9.76 9.94 9.72 9.61 9.85Eu/Eu� 0.793 0.82 0.81 0.82 1.01 0.80 0.78 0.83 0.80 0.84 0.78 0.78Ce/Ce� 1.01 0.99 1.03 1.04 1.00 1.01 1.02 1.00 1.01 0.98 1.00 1.00Gd/YbCN 1.93 2.00 2.05 2.18 2.02 2.01 1.97 2.08 2.02 2.11 2.12 2.00La/YbCN 11.26 12.12 12.40 12.90 12.16 11.95 11.83 12.24 12.36 12.40 12.45 12.48
Sample DS6b DL3 DS7b KS1a KS1b KS2a KS2b KS3a KS3b KS4a KS4b KL 1 KS5a KS5b
SiO2 54.05 51.74 57.71 56.02 61.42 63.68 62.26 58.35 59.33 62.18 61.11 54.55 54.24 56.42Al2O3 14.01 11.66 15.43 14.92 16.62 16.14 16.03 16.91 17.77 17.2 17.12 13.95 15.24 15.41Fe2O3 5.13 4.27 5.81 5.71 6.38 6.14 6.23 6.65 6.82 6.31 6.64 5.34 5.68 5.74
76 I. Ahmad, R. Chandra / Journal of Asian Earth Sciences 66 (2013) 73–89
Author's personal copy
Table 1 (continued)
Sample DS6b DL3 DS7b KS1a KS1b KS2a KS2b KS3a KS3b KS4a KS4b KL 1 KS5a KS5b
MnO 0.085 0.06 0.097 0.102 0.09 0.105 0.098 0.116 0.108 0.107 0.109 0.078 0.088 0.091MgO 2.69 2.38 2.52 2.48 2.76 2.56 2.49 2.53 2.71 2.41 2.82 2.58 2.63 2.42CaO 6.83 10.97 4.06 4.63 1.49 1.54 1.49 1.58 1.48 1.05 1.17 6.33 5.25 4.51Na2O 0.81 0.82 0.78 0.89 1.12 1.15 1.16 0.81 0.93 0.79 0.86 0.81 0.77 0.81K2O 2.71 2.50 2.92 2.8 2.95 2.89 2.89 2.87 2.93 2.91 2.97 2.73 2.92 2.76TiO2 0.63 0.54 0.72 0.69 0.74 0.79 0.78 0.78 0.79 0.8 0.77 0.65 0.68 0.7P2O5 0.122 0.12 0.107 0.15 0.13 0.121 0.136 0.136 0.127 0.081 0.129 0.126 0.129 0.123LOI 12.25 13.91 9.7 11.36 7.17 7.2 7.01 10.63 7.75 7.85 7.76 11.74 10.03 10.47Total 99.31 99.02 99.85 99.75 100.92 102.31 100.57 101.36 100.74 101.68 101.45 98.88 97.65 99.45
Rb 106.55 87.53 125.88 118.84 135.74 135.02 145.78 136.25 137.63 135.68 132.12 108.41 126.44 123.54Sr 146.68 167.33 155.78 119.21 114.51 111.92 116.12 105.39 119.91 94.09 111.06 146.31 125.98 120.38Y 25.97 23.09 33.45 30.40 34.72 32.84 34.46 32.945 33.10 31.29 36.62 28.49 28.66 31.042Zr 178.92 155.70 201.18 190.20 218.28 224.68 222.22 212.76 212.80 238.65 216.18 179.64 185.93 200.78Nb 14.55 12.00 16.39 15.95 18.38 19.37 17.96 18.39 17.68 17.76 17.08 15.01 15.44 16.47Ba 393.08 325.49 471.08 449.03 499.29 508.42 530.11 551.84 544.79 508.94 486.92 391.04 436.80 461.24Ni 43.19 33.28 46.56 49.50 56.73 49.38 52.55 57.85 53.78 55.04 62.84 48.27 44.31 45.77Cu 43.11 38.76 45.95 46.00 48.78 45.14 48.38 52.16 51.03 45.06 52.38 47.30 46.35 45.78Zn 75.87 63.46 84.61 87.64 89.53 84.54 86.82 101.27 86.56 86.51 98.76 85.17 84.22 84.55Ga 11.89 9.55 14.40 13.85 16.04 15.65 16.88 17.15 17.17 16.42 16.28 12.61 14.30 14.13Pb 19.79 14.06 20.44 20.07 24.59 21.57 21.18 24.08 22.05 22.08 22.18 19.09 22.14 18.81Th 12.97 8.99 17.36 16.52 16.93 17.75 19.63 16.91 18.74 16.35 16.96 12.58 14.72 14.80U 7.35 1.704 8.48 5.357 5.63 7.50 7.564 8.9449 8.18 8.22 1.49 5.64 4.29 4.52Sc 13.29 12.04 15.39 12.94 14.69 14.6 14.18 15.08 14.5 12.24 15.25 13.44 14.14 14.35V 93.26 81.89 110.01 97.65 117.02 121.59 103.63 118.81 113.73 121.84 128.02 99.91 109.67 110.26Co 15.93 14.23 17.34 16.18 18.95 19.07 19.73 22.24 19.93 25.48 19.73 17.27 17.62 18.58Hf 2 2 3 2.3 2.99 5.35 2 3 3 3 3 3 2.31 2
La 37.18 34.78 41.59 36.26 44.11 45.77 44.96 45.79 45.56 45.34 42.05 38.13 40.48 41.98Ce 72.36 66.48 79.68 72.84 83.24 88.1 85.92 86.13 83.26 86.93 78.98 69.42 73.4 79.12Pr 8.01 7.36 9.25 8.08 9.95 10.18 10.24 9.71 9.71 9.71 9.53 8.26 8.71 9.25Nd 28.92 26.3 33.74 29.42 39.46 39.27 40.12 36.1 36.95 34.54 37.84 32.5 33.34 35.01Sm 6.99 6.3 7.21 6.14 7.44 6.88 7.65 7.02 7.4 6.61 7.42 6.72 6.81 6.99Eu 1.42 1.73 1.8 1.5 1.66 1.63 1.67 1.58 1.72 1.47 1.72 1.55 1.64 1.59Gd 5.07 4.91 6.25 5.09 6.15 6.24 6.09 6.1 6.34 5.65 6.14 5.36 5.54 5.9Tb 0.73 0.7 0.93 0.73 0.88 0.87 0.87 0.83 0.84 0.77 0.88 0.76 0.79 0.84Dy 4.09 3.74 5.02 4.04 5.15 5.13 5.11 4.85 4.88 4.59 5.3 4.34 4.48 4.87Ho 0.99 0.94 1.25 0.99 1.22 1.18 1.2 1.13 1.13 1.08 1.25 1.07 1.07 1.15Er 2.27 2.13 2.83 2.25 2.72 2.62 2.72 2.52 2.61 2.42 2.75 2.3 2.52 2.54Tm 0.37 0.36 0.47 0.37 0.46 0.44 0.46 0.43 0.43 0.4 0.47 0.4 0.42 0.42Yb 2.02 1.88 2.44 2.03 2.34 2.24 2.24 2.21 2.2 2.1 2.41 2.05 2.08 2.13Lu 0.26 0.24 0.32 0.26 0.32 0.34 0.29 0.31 0.29 0.29 0.33 0.26 0.27 0.29
SiO2/Al2O3 3.85 4.43 3.74 3.75 3.69 3.94 3.88 3.45 3.33 3.61 3.56 3.91 3.55 3.66K2O/Na2O 3.34 3.02 3.74 3.14 2.63 2.51 2.49 3.54 3.15 3.68 3.45 3.37 3.79 3.40Al2O3/TiO2 22.23 21.46 21.436 21.62 22.22 20.43 20.55 21.67 22.49 21.5 22.23 21.46 22.41 22.01Na2O/Al2O3 0.057 0.070 0.050 0.059 0.067 0.071 0.072 0.047 0.052 0.045 0.050 0.058 0.050 0.052K2O/Al2O3 0.193 0.214 0.189 0.187 0.177 0.179 0.180 0.169 0.164 0.169 0.173 0.195 0.191 0.179TiO2/Zr 0.0035 0.0034 0.0035 0.0036 0.0034 0.0035 0.0035 0.0036 0.0037 0.0033 0.0035 0.0036 0.0036 0.0034K/Rb 211.14 237.72 192.56 195.6 180.7 177.6 164.5 174.8 176.7 178.0 186.61 209.04 191.71 185.46ICV 1.34 1.84 1.09 1.15 0.93 0.94 0.94 0.90 0.88 0.83 0.89 1.32 1.18 1.10CIA 71.44 68.21 72.93 71.45 70.70 70.01 69.77 74.55 74.03 74.94 73.90 71.28 72.79 73.16CIW 84.01 81.07 85.73 83.59 81.83 81.00 80.76 86.38 85.31 86.87 85.81 83.96 85.74 85.25PIA 80.60 76.67 82.70 80.23 78.44 77.47 77.17 83.81 82.67 84.38 83.09 80.49 82.66 82.33Rb/Sr 0.72 0.52 0.80 0.99 1.18 1.20 1.25 1.29 1.14 1.44 1.18 0.74 1.00 1.02Ba/Sr 2.67 1.94 3.02 3.76 4.36 4.54 4.56 5.23 4.54 5.40 4.38 2.67 3.46 3.83Th/Sc 0.97 0.74 1.12 1.27 1.15 1.21 1.38 1.12 1.29 1.33 1.11 0.93 1.04 1.03Zr/Sc 13.46 12.93 13.07 14.69 14.85 15.38 15.67 14.10 14.67 19.49 14.17 13.36 13.14 13.99Th/V 0.13 0.10 0.15 0.16 0.14 0.14 0.18 0.14 0.16 0.13 0.13 0.12 0.13 0.13Zr/Y 6.88 6.74 6.01 6.25 6.28 6.84 6.44 6.45 6.42 7.62 5.90 6.30 6.48 6.46Zr/Hf 89.46 77.85 67.06 82.69 73.00 41.99 111.11 70.92 70.93 79.55 72.06 59.88 80.49 100.39La/Co 2.33 2.44 2.39 2.24 2.32 2.40 2.27 2.05 2.28 1.77 2.13 2.20 2.29 2.25P
REE 325.56 300.8 366.05 324.24 390.96 402.72 400.1 391.04 387.92 386.5 374.61 329.7 345.93 366.02P
LREE 154.88 142.95 173.27 154.24 185.86 191.83 190.56 186.33 184.6 184.6 177.54 156.58 164.38 173.94P
HREE 15.8 14.9 19.51 15.76 19.24 19.06 18.98 18.38 18.72 17.3 19.53 16.54 17.17 18.14LREE/HREE 9.80 9.59 8.88 9.78 9.66 10.06 10.04 10.13 9.86 10.67 9.09 9.46 9.57 9.58Eu/Eu� 0.73 0.96 0.83 0.83 0.76 0.77 0.75 0.74 0.77 0.74 0.78 0.79 0.82 0.76Ce/Ce� 1.01 1.01 0.98 1.03 0.94 0.97 0.95 0.98 0.94 1.01 0.93 0.92 0.93 0.96Gd/YbCN 2.01 2.09 2.05 2.01 2.11 2.23 2.18 2.21 2.31 2.16 2.04 2.09 2.13 2.22La/YbCN 12.15 12.21 11.25 11.79 12.44 13.49 13.25 13.68 13.67 14.25 11.52 12.28 12.85 13.01
Sample KS5c KS6a KS6b KS7a KS7b KS8a KS8b KL2 KS9a KS9b KS10a KS10b
SiO2 63.46 57.49 58.91 63.32 61.89 60.68 61.77 58.21 59.59 62.96 59.54 60.38Al2O3 16.52 15.93 17.69 16.02 17.05 17 17.12 15.65 16.37 16.28 16.32 15.95Fe2O3 6 5.762 7.08 6.25 6.54 6.46 6.55 5.72 6.43 6.13 7.01 7.037MnO 0.072 0.09 0.138 0.13 0.096 0.114 0.10 0.091 0.104 0.081 0.112 0.099MgO 2.43 2.40 2.6 2.24 2.49 2.67 2.63 2.65 2.28 2.37 2.35 2.469CaO 1.65 4.52 1.53 1.09 1.09 1.13 1.16 3.87 2.3 1.82 1.9 2.057Na2O 1.16 0.81 0.87 0.92 0.85 0.82 0.88 0.97 0.79 1.07 0.89 0.955
(continued on next page)
I. Ahmad, R. Chandra / Journal of Asian Earth Sciences 66 (2013) 73–89 77

Author's personal copy
Table 1 (continued)
Sample KS5c KS6a KS6b KS7a KS7b KS8a KS8b KL2 KS9a KS9b KS10a KS10b
K2O 2.81 2.76 2.86 2.86 2.93 2.97 2.98 2.87 2.82 2.84 2.52 2.340TiO2 0.78 0.70 0.77 0.81 0.78 0.77 0.77 0.69 0.77 0.78 0.89 0.934P2O5 0.103 0.12 0.147 0.11 0.103 0.114 0.11 0.139 0.122 0.105 0.115 0.115LOI 6.63 7.47 7.84 7.87 7.81 7.89 7.75 8.33 10 7.16 7.79 6.38Total 101.61 98.08 100.43 101.66 101.62 100.61 101.83 99.19 101.57 101.59 99.43 98.73
Rb 128.20 144.38 128.59 150.19 131.86 134.12 133.48 128.15 127.30 131.43 111.75 99.45Sr 118.15 110.92 125.44 106.66 106.65 112.83 113.71 135.61 121.18 119.34 128.97 138.3Y 29.56 33.99 33.75 34.12 33.34 35.06 34.10 31.122 34.618 33.52 34.99 34.38Zr 232.10 223.22 206.77 228.21 232.30 223.47 223.05 207.66 217.38 230.88 233.59 235.3Nb 17.98 18.56 17.55 18.18 18.64 18.60 17.15 16.737 18.072 19.52 19.09 19.73Ba 534.81 460.74 513.11 516.68 501.27 479.25 495.15 478.10 534 524.45 447.87 418.6Ni 40.94 51.54 59.83 53.55 56.94 55.18 60.26 43.473 51.09 44.18 47.39 43.84Cu 42.02 46.90 57.50 51.20 47.80 48.82 47.66 48.317 49.69 45.03 47.62 43.90Zn 77.23 94.08 89.04 113.18 87.57 98.89 94.73 86.088 98.44 83.34 92.87 80.26Ga 15.71 16.72 17.28 15.63 16.27 15.65 16.54 14.182 15.94 15.12 16.15 15.29Pb 20.53 24.06 23.98 21.46 20.57 21.93 21.19 20.318 22.94 21.38 19.72 18.27Th 15.60 18.18 18.09 15.28 15.39 17.55 15.77 16.909 17.27 17.86 13.03 12.43U 3.71 3.85 6.312 6.48 5.08 5.29 6.28 4.8175 5.416 4.470 7.88 5.366Sc 13.43 14.7 15.64 – – – – – – – – –V 114.74 106.22 117.33 – – – – – – – – –Co 19.35 19.21 19.3 – – – – – – – – –Hf 2.28 3 2.39 – – – – – – – – –
La 42.97 41.81 42.11 – – – – – – – – –Ce 86.35 82.5 85.21 – – – – – – – – –Pr 9.46 8.85 9.16 – – – – – – – – –Nd 34.35 33.15 33.7 – – – – – – – – –Sm 6.7 6.72 7.15 – – – – – – – – –Eu 1.63 1.63 1.81 – – – – – – – – –Gd 5.39 5.59 5.96 – – – – – – – – –Tb 0.78 0.8 0.87 – – – – – – – – –Dy 4.15 4.43 4.7 – – – – – – – – –Ho 0.99 1.12 1.17 – – – – – – – – –Er 2.17 2.48 2.64 – – – – – – – – –Tm 0.36 0.41 0.43 – – – – – – – – –Yb 1.92 2.13 2.39 – – – – – – – – –Lu 0.25 0.28 0.29 – – – – – – – – –
SiO2/Al2O3 3.84 3.60 3.33 3.95 3.62 3.56 3.60 3.71 3.64 3.86 3.64 3.78K2O/Na2O 2.42 3.40 3.28 3.09 3.44 3.62 3.38 2.95 3.56 2.65 2.83 2.44Al2O3/TiO2 21.17 22.48 22.97 19.62 21.85 22.07 22.23 22.7 21.2 20.87 18.3 17.1Na2O/Al2O3 0.070 0.050 0.049 0.057 0.049 0.048 0.051 0.061 0.048 0.065 0.054 0.059K2O/Al2O3 0.170 0.173 0.161 0.17 0.171 0.174 0.174 0.183 0.172 0.174 0.154 0.146TiO2/Zr 0.0033 0.0031 0.0037 0.0035 0.0033 0.0034 0.0034 0.0033 0.0035 0.0033 0.0038 0.0039K/Rb 181.95 159.20 184.63 158.50 184.46 183.82 185.32 185.9 183.8 179.4 187.2 195.4ICV 0.90 1.07 0.89 0.89 0.86 0.87 0.88 1.07 0.94 0.92 0.96 0.99CIA 70.66 73.74 74.80 72.25 74.07 74.19 73.66 71.30 74.33 71.17 74.26 73.74CIW 81.23 85.63 86.07 84.01 85.90 86.30 85.53 83.06 86.29 82.22 84.78 83.53PIA 77.93 82.87 83.60 80.91 83.22 83.63 82.75 79.71 83.66 78.95 82.27 81.01Rb/Sr 1.08 1.30 1.02 1.40 1.23 1.18 1.17 0.94 1.05 1.10 0.86 0.71Ba/Sr 4.52 4.15 4.09 4.84 4.700 4.24 4.35 3.52 4.40 4.39 3.47 3.02Th/Sc 1.16 1.23 1.15Zr/Sc 17.28 15.18 13.22Th/V 0.13 0.17 0.15Zr/Y 7.85 6.56 6.12 6.68 6.96 6.37 6.54 6.67 6.27 6.88 6.67 6.84Zr/Hf 101.80 74.40 86.51La/Co 2.22 2.17 2.18P
REE 378.93 366.56 376.73 – – – – – – – – –P
LREE 181.46 174.66 179.14 – – – – – – – – –P
HREE 16.01 17.24 18.45 – – – – – – – – –LREE/HREE 11.33 10.13 9.70 – – – – – – – – –Eu/Eu� 0.84 0.82 0.85 – – – – – – – – –Ce/Ce� 1.04 1.02 1.04 – – – – – – – – –Gd/YbCN 2.25 2.10 2.00 – – – – – – – – –La/YbCN 14.77 12.96 11.63 – – – – – – – – –
Sample Kashmir Loess-Paleosol UCC PAAS NASC AVLb GALc Granited Felsic volcanice Andesitef Basaltg
Min. Max. Avg.a
SiO2 50.92 63.68 58.38 66 62.8 64.8 71.19 70.71 73.8 73.2 59.5 50.3Al2O3 11.53 17.77 15.54 15.2 18.9 16.9 11.63 11.74 13.4 14.0 16.8 15.7Fe2O3 4.23 7.08 5.99 5 7.22 5.65 3.68 3.75 2.2 2.8 6.8 9.10MnO 0.06 0.138 0.09 0.08 0.11 0.06 0.07 0.07 –MgO 2.24 3.05 2.55 2.2 2.2 2.86 2.05 2.15 0.4 0.4 3.3 6.7CaO 1.05 11.33 3.72 4.2 1.3 3.63 6.46 6.67 1.2 1.3 6.8 9.5Na2O 0.77 1.16 0.90 3.9 1.2 1.14 1.69 1.68 3.5 3.7 3.7 3K2O 2.34 3.17 2.83 3.4 3.7 3.97 2.21 2.22 4.8 4.3 1.2 0.85TiO2 0.53 0.93 0.72 0.5 1 0.7 0.69 0.71 0.25 0.34 0.78 1.45P2O5 0.081 0.15 0.11 0.4 0.16 0.13 0.14 0.14 0.09 0.06 0.2 0.28
78 I. Ahmad, R. Chandra / Journal of Asian Earth Sciences 66 (2013) 73–89

Author's personal copy
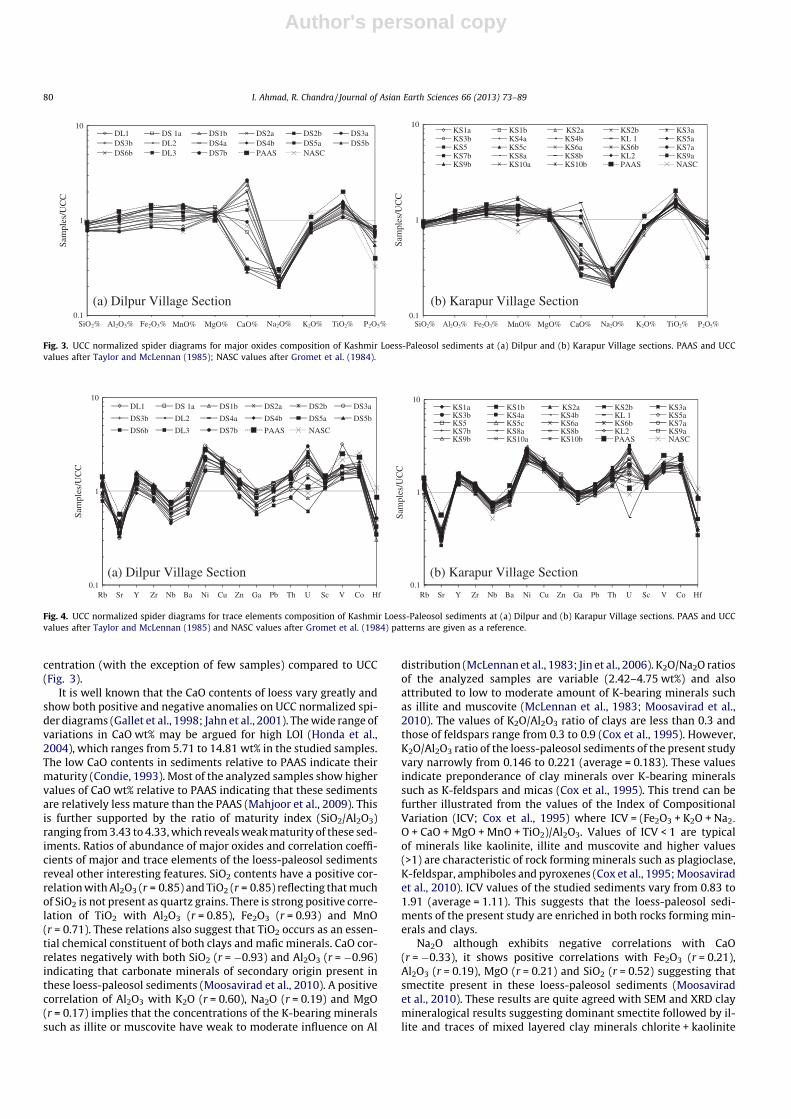
Fig. 3 shows the distribution of major element contents ofthe Kashmir Loess-Paleosol sediments normalized to UCC (UpperContinental Crust; Taylor and McLennan, 1985). The UCC nor-malized PAAS (Taylor and McLennan, 1985) and NASC (Grometet al., 1984) values also show similar patterns to that of Kashmir
Loess-Paleosol sediments. By comparison with UCC (Taylor andMcLennan, 1985), these sediments are slightly depleted inSiO2, K2O and P2O5 and show large variation in CaO concentra-tions (Fig. 3). However, Na2O depleted in all the samples,whereas Al2O3, MgO, MnO and Fe2O3 show slightly higher con-
Table 1 (continued)
Sample Kashmir Loess-Paleosol UCC PAAS NASC AVLb GALc Granited Felsic volcanice Andesitef Basaltg
Min. Max. Avg.a
LOI 5.71 14.81 9.35 – – – – – – – – –Rb 87.53 155.93 125.93 112 160 125 78 79 170 130 41 29Sr 94.09 167.33 125.80 350 200 142 210 208 122 160 360 280Y 20.89 36.62 31.11 22 27 35 24 26 45 20 27Zr 146.2 238.65 204.73 190 210 200 319 322 250 215 160 131Nb 11.24 19.73 16.84 25 19 13 13 14 21 20 8 5Ba 312.24 566.47 469.61 550 650 636 427 427 800 850 650 410Ni 32.3 62.84 49.46 20 55 58 26 27 7 8 42 68Cu 38.76 57.5 47.58 25 50 – 19 19 – – – –Zn 60.39 117.94 87.76 71 85 – 56 57 – – – –Ga 9.55 17.59 14.90 17 – – 12 12 – – – –Pb 14.06 24.99 20.87 20 – – 14 15 25 23 20 6Th 8.99 19.63 15.31 10.7 14.6 12.3 9 9 18 10.2 4 2.4U 1.49 8.94 5.62 2.8 3.1 2.66 5 2.5 8 1.2Sc 11.62 15.64 13.93 11 16 14.9 8 5 13 18 33V 80.56 189.34 110.29 60 150 130 78 79 18 30 140 260Co 14.19 25.48 18.20 10 23 25.7 – – 3 6 22 35Hf 1.75 5.35 2.66 5.8 5 6.3 – – 6.5 – 4 3.4
La 33.81 45.79 40.62 30 38 31.1 28 29 40 28 20 11Ce 64.58 88.1 78.26 64 80 66.7 59 61 94 65 44 27Pr 7.26 10.24 8.85 7.1 8.83 – – – –Nd 26.3 40.12 33.06 26 32 27.4 – – 46 25 23 14Sm 5.5 8.16 6.81 4.5 5.6 5.59 – – 8.8 5 3.90 4Eu 1.33 2.3 1.63 0.88 1.1 1.18 – – 0.9 0.9 1 1.4Gd 4.74 6.34 5.59 3.8 4.7 5.5 – – 7.63 4.87 4.14 4.01Tb 0.67 0.93 0.79 0.64 0.77 0.85 – – 1.15 0.78 2 0.65Dy 3.7 5.3 4.48 3.5 4.68 5.54 – – – – – –Ho 0.91 1.25 1.09 0.8 0.99 – – – – – – –Er 2.03 2.83 2.45 2.3 2.85 3.27 – – – – – –Tm 0.35 0.47 0.41 0.33 0.4 – – – – – – –Yb 1.8 2.44 2.14 2.2 2.8 3.06 – – 3.2 2.9 2 2.7Lu 0.23 0.34 0.28 0.32 0.43 0.46 – – 0.54 0.78 0.31 0.43
SiO2/Al2O3 3.33 4.43 3.77 4.343 3.32 3.83 6.12 6.02 5.50 5.22 3.54 3.20K2O/Na2O 2.42 3.81 3.16 0.87 3.08 3.48 1.30 1.32 1.37 1.16 0.32 0.28Al2O3/TiO2 17.1 22.97 21.31 30.4 18.9 24.14 16.85 16.53 53.6 41.179 21.53 10.82Na2O/Al2O3 0.044 0.076 0.058 0.256 0.063 0.067 0.145 0.143 0.261 0.264 0.220 0.191K2O/Al2O3 0.146 0.221 0.183 0.223 0.195 0.234 0.190 0.189 0.358 0.307 0.071 0.054TiO2/Zr 0.0031 0.0039 0.0035 0.0026 0.0047 0.0035 0.0021 0.0022 0.001 0.0015 0.0048 0.0110K/Rb 158.5 237.72 189.31 – – – – – – – – –ICV 0.83 1.91 1.1125 1.26 0.88 1.06CIA 67.133 75.27 71.87 – – – – – – – – –CIW 79.93 87.29 83.83 – – – – – – – – –PIA 75.2 84.87 80.57 – – – – – – – – –Rb/Sr 0.52 1.44 1.027 – – – 0.371 0.379 1.393 0.8125 0.1138 0.1035Ba/Sr 1.94 5.4 3.852 1.57 3.25 4.47 2.033 2.052 6.557 5.3125 1.805 1.464Th/Sc 0.74 1.38 1.081 0.97 0.91 0.82 1.12 – 3.6 0.784 0.222 0.072Zr/Sc 12.48 19.49 14.36 17.27 13.12 13.42 39.875 – 50 16.538 8.888 3.969Th/V 0.05 0.18 0.136 0.17 0.09 0.09 0.115 0.113 1 0.34 0.028 0.009Zr/Y 5.9 7.85 6.59 8.63 7.77 5.71 13.29 12.38 5.555 – 8 4.851Zr/Hf 41.99 111.99 79.26 32.75 42 31.74 – – 38.461 – 40 38.529La/Co 1.77 2.44 2.247 3 1.65 1.21 – – 13.333 4.666 0.909 0.3142P
REE 297.6 402.72 356.13 – – – – – – – – –P
LREE 139.88 190.2 167.62 – – – – – – – – –P
HREE 14.55 19.53 17.24 – – – – – – – – –LREE/HREE 8.78 11.23 9.74 – – – – – – – – –Eu/Eu� 0.73 1.01 0.81 – – – – – – – – –Ce/Ce� 0.92 1.04 0.99 – – – – – – – – –Gd/YbCN 1.93 2.31 2.09 – – – – – – – – –La/YbCN 11.25 14.77 12.57 – – – – – – – – –
Major oxides are in wt%, Trace elements in ppm. Total iron expressed as FeOT in c–g.a Loess-paleosol composition from Kashmir Valley (n = 38) on the basis of this study.b Average loess 3 composition from the mean of sixteen (1–16) averages of eleven loess regions (n = 192), southwestern Hungary (Ujvari et al., 2008).c Global average loess composition from the mean of seventeen (1–17) averages of eleven loess regions (n = 244) (Ujvari et al., 2008).d Average chemical composition of Phanerozoic granite (Condie, 1993).e Average chemical composition of Meso-Cenozoic felsic volcanic rocks (Condie, 1993).f Average chemical composition of Meso-Cenozoic andesite (Condie, 1993).g Average chemical composition of Meso-Cenozoic basalt (Condie, 1993).
I. Ahmad, R. Chandra / Journal of Asian Earth Sciences 66 (2013) 73–89 79
Author's personal copy
centration (with the exception of few samples) compared to UCC(Fig. 3).
It is well known that the CaO contents of loess vary greatly andshow both positive and negative anomalies on UCC normalized spi-der diagrams (Gallet et al., 1998; Jahn et al., 2001). The wide range ofvariations in CaO wt% may be argued for high LOI (Honda et al.,2004), which ranges from 5.71 to 14.81 wt% in the studied samples.The low CaO contents in sediments relative to PAAS indicate theirmaturity (Condie, 1993). Most of the analyzed samples show highervalues of CaO wt% relative to PAAS indicating that these sedimentsare relatively less mature than the PAAS (Mahjoor et al., 2009). Thisis further supported by the ratio of maturity index (SiO2/Al2O3)ranging from 3.43 to 4.33, which reveals weak maturity of these sed-iments. Ratios of abundance of major oxides and correlation coeffi-cients of major and trace elements of the loess-paleosol sedimentsreveal other interesting features. SiO2 contents have a positive cor-relation with Al2O3 (r = 0.85) and TiO2 (r = 0.85) reflecting that muchof SiO2 is not present as quartz grains. There is strong positive corre-lation of TiO2 with Al2O3 (r = 0.85), Fe2O3 (r = 0.93) and MnO(r = 0.71). These relations also suggest that TiO2 occurs as an essen-tial chemical constituent of both clays and mafic minerals. CaO cor-relates negatively with both SiO2 (r = �0.93) and Al2O3 (r = �0.96)indicating that carbonate minerals of secondary origin present inthese loess-paleosol sediments (Moosavirad et al., 2010). A positivecorrelation of Al2O3 with K2O (r = 0.60), Na2O (r = 0.19) and MgO(r = 0.17) implies that the concentrations of the K-bearing mineralssuch as illite or muscovite have weak to moderate influence on Al
distribution (McLennan et al., 1983; Jin et al., 2006). K2O/Na2O ratiosof the analyzed samples are variable (2.42–4.75 wt%) and alsoattributed to low to moderate amount of K-bearing minerals suchas illite and muscovite (McLennan et al., 1983; Moosavirad et al.,2010). The values of K2O/Al2O3 ratio of clays are less than 0.3 andthose of feldspars range from 0.3 to 0.9 (Cox et al., 1995). However,K2O/Al2O3 ratio of the loess-paleosol sediments of the present studyvary narrowly from 0.146 to 0.221 (average = 0.183). These valuesindicate preponderance of clay minerals over K-bearing mineralssuch as K-feldspars and micas (Cox et al., 1995). This trend can befurther illustrated from the values of the Index of CompositionalVariation (ICV; Cox et al., 1995) where ICV = (Fe2O3 + K2O + Na2-
O + CaO + MgO + MnO + TiO2)/Al2O3. Values of ICV < 1 are typicalof minerals like kaolinite, illite and muscovite and higher values(>1) are characteristic of rock forming minerals such as plagioclase,K-feldspar, amphiboles and pyroxenes (Cox et al., 1995; Moosaviradet al., 2010). ICV values of the studied sediments vary from 0.83 to1.91 (average = 1.11). This suggests that the loess-paleosol sedi-ments of the present study are enriched in both rocks forming min-erals and clays.
Na2O although exhibits negative correlations with CaO(r = �0.33), it shows positive correlations with Fe2O3 (r = 0.21),Al2O3 (r = 0.19), MgO (r = 0.21) and SiO2 (r = 0.52) suggesting thatsmectite present in these loess-paleosol sediments (Moosaviradet al., 2010). These results are quite agreed with SEM and XRD claymineralogical results suggesting dominant smectite followed by il-lite and traces of mixed layered clay minerals chlorite + kaolinite
Fe2O3%Al2O3% Na2O% P2O5%SiO2% MnO% MgO% CaO%0.1
1
10
Sam
ples
/UC
C
Fe2O3%Al2O3% Na2O% TiO2% P2O5%SiO2% K2O%TiO2%K2O% MnO% MgO% CaO%0.1
1
10
Sam
ples
/UC
C
(a) Dilpur Village Section (b) Karapur Village Section
DL1 DS 1a DS1b DS2a DS2b DS3aDS3b DL2 DS4a DS4b DS5a DS5bDS6b DL3 DS7b PAAS NASC
KS1a KS1b KS2a KS2b KS3aKS3b KS4a KS4b KL 1 KS5aKS5 KS5c KS6a KS6b KS7aKS7b KS8a KS8b KL2 KS9aKS9b KS10a KS10b PAAS NASC
Fig. 3. UCC normalized spider diagrams for major oxides composition of Kashmir Loess-Paleosol sediments at (a) Dilpur and (b) Karapur Village sections. PAAS and UCCvalues after Taylor and McLennan (1985); NASC values after Gromet et al. (1984).
0.1
1
10
Sam
ples
/UC
C
DL1 DS 1a DS1b DS2a DS2b DS3a
DS3b DL2 DS4a DS4b DS5a DS5b
DS6b DL3 DS7b PAAS NASC
(a) Dilpur Village Section0.1
1
10
Rb Sr Y Zr Nb Ba Ni Cu Zn Ga Pb Th U Sc V Co Hf Rb Sr Y Zr Nb Ba Ni Cu Zn Ga Pb Th U Sc V Co Hf
Sam
ples
/UC
CKS1a KS1b KS2a KS2b KS3aKS3b KS4a KS4b KL 1 KS5aKS5 KS5c KS6a KS6b KS7aKS7b KS8a KS8b KL2 KS9aKS9b KS10a KS10b PAAS NASC
(b) Karapur Village Section
Fig. 4. UCC normalized spider diagrams for trace elements composition of Kashmir Loess-Paleosol sediments at (a) Dilpur and (b) Karapur Village sections. PAAS and UCCvalues after Taylor and McLennan (1985) and NASC values after Gromet et al. (1984) patterns are given as a reference.
80 I. Ahmad, R. Chandra / Journal of Asian Earth Sciences 66 (2013) 73–89

Author's personal copy
and chlorite (not included here). Cu shows positively correlationwith MnO (r = 0.79) and K2O (r = 0.67) and generally weak correla-tion with MgO (r = 0.29) and Na2O (r = 0.097) probably suggestingtheir occurrence in both mafic and felsic minerals (Moosaviradet al., 2010).
4.1. Trace elements
The results of the trace elements analyses are listed in Table 1.The UCC normalized patterns of trace elements of Kashmir Valleyare presented in Fig. 4; which are similar to that displayed by PAAS(Taylor and McLennan, 1985) and NASC (Gromet et al., 1984).
4.1.1. Large-ion lithophile elements (LILEs): Rb, Ba, SrA relatively large deal of variability exists in the contents of
LILEs in the Kashmir Loess-Paleosol sediments (Table 1). Ba andRb are mainly concentrated in mica and K-feldspar whereas Sr ismainly present in Ca-bearing minerals such as plagioclase, amphi-bole, pyroxene and carbonate minerals. Therefore, the ratios ofimmobile to mobile elements such as Rb/Sr and Ba/Sr ratios in-crease with increasing weathering (Nesbitt and Young, 1982).The strong positive correlation between Ba/Sr and Rb/Sr (r = 0.96)in the studied samples suggests that both Rb and Ba generally re-mained immobile during weathering. However, slightly lower con-centration of Ba than the Rb on UCC normalized spider diagramprobably suggests only subtle depletion of Ba during pedogenesisbecause Ba is less resistant than Rb (Fig. 4). Sr shows negative cor-relation against Rb (r = �0.82) and Ba (r = �0.81). This depletion ofSr is due to its high mobility during pedogenesis. This relationshipis also demonstrated on UCC normalized spider diagrams (Fig. 4).Likewise, with the increase in chemical weathering intensity, K willnormally show depletion against Rb, thus leading to a lower K/Rbratio (Wronkiewicz and Condie, 1989). The elemental ratio of K/
Rb (ppm) below 300 indicates immobility of Rb (Chen et al.,1998). This K/Rb ratio of the studied samples ranges from 158.5to 237.72 (Table 1). This corroborates that the Kashmir Loess-Paleosol sediments are not subjected to intense weathering.
4.1.2. High field strength elements (HFSEs): Y, Zr, Nb, Hf, Th, UThe elements Zr, Nb, Hf, Y, Th and U are enriched in felsic rather
than mafic rocks (Feng and Kerrich, 1990). Additionally, along withthe REEs, these high field strength elements reflect provenancecompositions (e.g., Taylor and McLennan, 1985). In analyzed sam-ples, Zr has normalized value similar to UCC while Y, Th and U withthe exception of few samples are enriched compared to UCC (Fig. 4,Table 1). However, Nb and Hf, which are abundant in felsic rocks,strongly depleted in these sediments.
4.1.3. Transition trace elements (TTEs): Ni, Cu, Zn, Sc, V, CoIn the analyzed samples, concentration of Cu, Sc, V and Co is
higher than the UCC (Fig. 4), whereas Zn with the exception offew samples is higher than the UCC. Ni is also strikingly enrichedthan UCC. Vanadium shows very weak positively correlation withTiO2 (r = 0.20). Positive correlations of Co, Ni, Cu, V and Zn withboth Fe2O3 (r = 0.73, 0.81, 0.73, 0.17 and 0.68 respectively) andAl2O3 (r = 0.82, 0.82, 0.67, 0.20 and 0.64 respectively) indicate thatthese elements are linked with iron oxides and clay minerals(Hirst, 1962). These trace elements are abundant in the soil devel-oped on basalt (Taylor and McLennan, 1985; Wronkiewicz andCondie, 1987; Condie et al., 1995; Liu et al., 1996; Zhang et al.,2007). During weathering and pedogenesis of the ferromagnesiansilicate minerals of the parent basalt, these elements easily re-moved from the soil and associated with clay minerals. Therefore,enrichment of transition trace elements in Kashmir Loess-Paleosolsediments with respect to the average composition of the Upper
0.1
1
10
Sam
ples
/PA
AS
(c) Dilpur Village section
DL1 DS1a DS1b DS2a DS2bDS3a DS3b DL2 DS4a DS4bDS5a DS5b DS6b DL3 DS7b
1
10
100
1000
Sam
ples
/Cho
ndri
te
(a) Dilpur Villlage section
DL1 DS1a DS1b DS2a DS2bDS3a DS3b DL2 DS4a DS4bDS5a DS5b DS6b DL3 DS7bUCC PAAS NASC
1
10
100
1000
Sam
ples
/Cho
ndri
te
(b) Karapur Village Section
KS1a KS1b KS2a KS2b KS3aKS3b KS4a KS4b KL 1 KS5aKS5 KS5c KS6a KS6b UCCPAAS NASC
0.1
1
10
La Ce Nd Sm Eu Gd Tb Yb Lu
La Ce Nd Sm Eu Gd Tb Dy Yb Lu La Ce Nd Sm Eu Gd Tb Dy Yb Lu
La Ce Nd Sm Eu Gd Tb Yb Lu
Sam
ples
/PA
AS
(d) Karapur Village section
KS1a KS1b KS2a KS2b KS3aKS3b KS4a KS4b KL 1 KS5aKS5 KS5c KS6a KS6b
Fig. 5. Chondrite and PAAS normalized REE patterns of Kashmir Loess-Paleosol sediments at (a) Dilpur and (b) Karapur Village sections. PAAS and UCC values after Taylor andMcLennan (1985) and NASC values after Gromet et al. (1984) patterns are given as a reference.
I. Ahmad, R. Chandra / Journal of Asian Earth Sciences 66 (2013) 73–89 81

Author's personal copy
Continental Crust (UCC) suggests significant basic input from thesource terrain.
4.2. Rare Earth Elements (REEs)
The chondrite normalized REE patterns for Kashmir Loess-Paleosol sediments are similar to that displayed by UCC, PAAS(Taylor and McLennan, 1985) and NASC (Gromet et al., 1984)(Fig. 5a, b). It reveals that the Kashmir Loess-Paleosol sedimentshave fractionated REE patterns, with LaCN/YbCN ratio varying from11.25 to 14.77, LaCN/SmCN from 3.06 to 4.18 and
PLREE/
PHREE
ratio ranges from 8.78 to 11.23 (Table 1), suggesting moderateenrichment of LREEs. Total REE (
PREE) abundances are variable
in these sediments, which range from 297.6 to 402.72 ppm (Ta-ble 1). The GdCN/YbCN ratios (1.93–2.31) which is almost similarto (GdCN/YbCN = 1–2) ratio of Taylor and McLennan (1985), suggestrelatively flat HREE pattern. The GdCN/YbCN ratios less than 2.5,suggest that these sediments are derived from the less HREE de-pleted source rocks (Bakkiaraj et al., 2010).
The Eu and Ce anomalies are expressed as: Eu/Eu� = (EuCN)/{(SmCN) � (GdCN)}0.5 and Ce/Ce� = (CeCN)/{(LaCN)0.666 � (NdCN)0.333.Eu anomaly of the studied samples ranges between 0.73 and 1.01(average = 0.81). The lack of prominent negative Eu anomaly(Fig. 5a and b; Table 1) attributes to the partial weathering of pla-gioclase feldspar, suggesting robustness of REE during weathering.Ce anomaly ranges from 0.92 to 1.04 (average = 0.99), suggestingweak post depositional alteration during pedogenesis. On PAASnormalized REE plots (Fig. 5c, d), these sediments are distinguishedby the slightly higher LREE, depleted HREE and positive Eu and Ceanomalies.
5. Provenance
Many investigators have demonstrated that chemical composi-tion of sedimentary rocks is related to that of their source regions(e.g., Fralick and Kronberg, 1997 and references therein; Cullers,2000; Alvarez and Roser, 2007; Manikyamba et al., 2008; Spallettiet al., 2008; Akarish and El-Gohary, 2008, 2011; Paikaray et al.,2008; Dey et al., 2009; Kalsbeek and Frei, 2010; Mishra and Sen,2010). In published literature, several major, trace and rare earthelement based discrimination diagrams have been proposed to in-fer the source/provenance of sedimentary rocks (e.g., Bhatia andCrook, 1986; Roser and Korsch, 1988; Hayashi et al., 1997; Amajor,1987). In the provenance discrimination diagram of Roser and Kor-sch (1988), the formulated discriminant functions (i.e., bivariates)are based on concentrations of both immobile and variably mobilemajor elements. On this diagram, the loess-paleosol sediments ofthe present study plot in the fields of intermediate igneous andquartzose sedimentary provenance (Fig. 6). This suggests that theloess-paleosol sediments are derived from mixed source rocks.
In igneous rocks, Al resides mostly in feldspars and Ti in maficminerals (e.g., olivine, pyroxene, hornblende, biotite and ilmenite).Therefore, the A1/Ti ratios of igneous rocks generally increase withincreasing SiO2 contents (Hayashi et al., 1997). The values of Al2O3/TiO2 (wt%) ratio increase from (a) 3 to 8 in mafic igneous rocks(SiO2 content from 45 to 52 wt%), (b) 8 to 21 in intermediate igne-ous rocks (SiO2 content from 53 to 66 wt%) and (c) 21 to 70 in felsicigneous rocks (SiO2 content from 66 to 76 wt%). The Al2O3/TiO2
(wt%) ratio of the present loess-paleosol sediments ranges from20.04 to 22.23 (SiO2 contents from 50.92 to 63.68 wt%) display ma-fic to intermediate composition. According to Hayashi et al. (1997),the SiO2 contents of normal igneous rocks can be evaluated fromtheir Al2O3/TiO2 ratio by the following equation:
SiO2 ðwt%Þ ¼ 39:34þ 1:2578ðAl2O3=TiO2Þ � 0:0109ðAl2O3=TiO2Þ2
Since Al and Ti are immobile and behave similarly during resid-ual weathering and transportation, the silica content of the sourcerocks can be inferred from the Al2O3/TiO2 ratio of sedimentaryrocks using the above equation. When Al2O3/TiO2 ratios of theloess-paleosol sediments of the present study are substituted inthe equation of Hayashi et al. (1997), the SiO2 contents of theloess-paleosol sediments are found to range narrowly from 57.62to 62.48 wt% (average 61.18 wt%). Average SiO2 contents(61.18 wt%) indicate that the inferred source rocks are intermedi-ate igneous rocks. These estimates agree quite well with the actualSiO2 contents of these sediments, ranging from 50.92 to 63.68 wt%suggesting intermediate composition.
Amajor (1987) proposed Al2O3 vs TiO2 (wt%) binary plot as aprovenance indicator. The application of this plot on the KashmirLoess-Paleosol sediments (Fig. 7) indicates that all the samples fallalong the basalt + ryolite/granite line. This further indicates thatthe Kashmir Loess-Paleosol sediments are derived from mixedsource sediments ranging in composition from mafic and felsicsource rocks.
Ratios of both compatible and incompatible elements are usefulfor differentiating between felsic and mafic source components.The immobile elements La and Th are more abundant in felsic thanin basic rocks, whereas Sc is more concentrated in basic rocks thanin felsic rocks (Taylor and McLennan, 1985; Wronkiewicz and Con-die, 1987). These elements are effective in tracing loess provenance(Liu et al., 1993; Gallet et al., 1996; Sun, 2002a,b; Muhs and Bu-dahn, 2006). Bhatia and Crook (1986) proposed La–Th–Sc ternarydiagram to study the tectonic setting of sedimentary rocks. Subse-quently, Cullers (1994a,b) used this diagram to discriminate felsicand basic provenance of the fine-grained sediments. In this La–Th–Sc diagram, data of Kashmir Loess-Paleosol sediments fall in a re-gion of mixed source rocks (Fig. 8). The fact that all the samplesplot close to the values of UCC, PAAS and NASC, indicating largeprovenance with variable geographical and geological setting (Gal-let et al., 1996).
6. Sorting and recycling
Sedimentary recycling processes are accompanied by fraction-ation and enrichment of heavy minerals, notably Zr. Zircon is phys-ically and chemically ultra-stable mineral that can indicate theeffect of recycling (McLennan et al., 1993). An example of thiscan be illustrated for Kashmir Loess-Paleosol sediment. In Fig. 9aTh/Sc ratio is plotted against Zr/Sc ratio. The Zr/Sc ratio is a usefulindex of zircon enrichment (sediment recycling) since Zr is
-10 -8 -6 -4 -2 0 2 4 6 8 10
DF1
-10
-8
-6
-4
-2
0
2
4
6
8
10
DF2
Mafic igneous provenance
Quartzosesedimentaryprovenance
Intermediateigneous provenance
Felsic igneousprovenance
+ Dilpur Village sectionKarapur Village section
Fig. 6. Provenance discriminant functions diagram for Kashmir Loess-Paleosolsediments (discriminant fields are after Roser and Korsch, 1988).DF1 = 30.6038 � TiO2/Al2O3 � 12.541 � Fe2O3/Al2O3 + 7.329 �MgO/Al2O3 + 12.031� Na2O/Al2O3 + 35.42 � K2O/Al2O3 � 6.382; DF2 = 56.500 � TiO2/Al2O3 � 10.879 �Fe2O3/Al2O3 + 30.875 �MgO/Al2O3 � 5.404 � Na2O/Al2O3 + 11.112 � K2O/Al2O3-3.89.
82 I. Ahmad, R. Chandra / Journal of Asian Earth Sciences 66 (2013) 73–89

Author's personal copy
strongly enriched in Zircon, whereas Sc is not enriched but gener-ally preserves a signature of the provenance similar to REE (McLen-nan, 1989). In contrast, Th/Sc ratio is a good overall indicator ofigneous chemical differentiation processes since Th is typicallyan incompatible element, whereas Sc is typically compatible inigneous rocks (McLennan et al., 1993; Borges et al., 2008). In case
of Kashmir Loess-Paleosol sediments, it can be seen that both Th/Sc and Zr/Sc ratios do not follow a trend consistent with igneousdifferentiation being the primary control (i.e., provenance)(Fig. 9a). In contrast, these sediments clustered close to the pri-mary compositional trend than the trend involving zircon addition,suggesting weak to moderate sedimentary recycling. In addition, Zrpreferentially incorporates into HREE relative to LREE and its accu-mulation would lead to HREE enrichment and a decrease in (La/Yb)CN ratio with increasing Zr contents. However, there exist weakto moderate correlation between Zr and (La/Yb)CN ratio (r = 0.43) ofthe analyzed samples (Fig. 9b) again suggesting weak to moderatesedimentary recycling.
The SiO2/Al2O3 ratio is sensitive to sediment recycling andweathering processes, and Roser and Korsch (1986) have used itas a signal of sediment maturity, with values increasing as quartzsurvives preferentially to feldspars, mafic minerals and lithicgrains. Average values <4.0 characterize immature sedimentation,while values >5.0–6.0 in sediments are an indication of progressivematurity and mature sediments with values >6.0 (Roser et al.,1996). When values exceed 7.0, and peak at >10.0 suggest stronglymature sediments. The SiO2/Al2O3 values that range between �3.0and 5.0 characterize immature–weakly mature sediments (Roseret al., 1996). The SiO2/Al2O3 (wt%) values of Kashmir Loess-Paleosolsediments that range between 3.33 and 4.43 (Table 1), indicateimmature–weakly mature.
Loess deposits can provide us with a natural sampling of largeregions of surficial crust (Taylor et al., 1983). This is because theyare widespread and made by several mechanisms, which producesilt-sized particles (e.g., glacial grinding, desert weathering anddeflation, ‘‘mountain loess’’ process operating with high-energytransfer and frequent freeze–thaw conditions) in various sedimen-tary environments (Gallet et al., 1998; Tripathi and Rajamani,1999; Wright, 2001). These characteristics make loess suitablefor estimating the average chemical composition of the UCC (Tay-lor et al., 1983). However, the composition of loess cannot be useddirectly to infer UCC composition. Recent studies show that thegeochemistry of loess differs from region to region, depending onsource materials (e.g., Muhs and Bettis, 2003; Sun et al., 2007). InFig. 10a, SiO2 and Al2O3 concentrations of the studied samples plotclose to the composition of andesite and basalt (values after Con-die, 1993) but far from the GAL (global average loess) and AVL(average loess) (Ujvari et al., 2008) and granite and felsic volcanicigneous rocks (values after Condie, 1993). The lower SiO2 contentof these Kashmir Loess samples relative to the AVL and GAL mightreflect that these samples had a smaller proportion of silt-sizedquartz than other worldwide loess deposits (Fig. 10a and b). InFig. 10c and d, the average composition of Kashmir Loess-Paleosol
0 10 20 30 40 500.0
0.5
1.0
1.5
2.0
2.5
Bas
alt
r
Basalt+
yolite/gran
ite
r
Ryolite/g anite+basalt
Ryolite/granite
+ Dilpur Village sectionKarapur Village section
TiO
2(w
t%)
Al2O3 (wt%)
Fig. 7. Al2O3 vs TiO2 (wt%) binary plot showing basalt + ryolite/granite composi-tional field of Kashmir Loess-Paleosol sediments (after Amajor, 1987).
La (ppm)
Sc (ppm)Th (ppm)
Clay, silt, sandand gravels frommixedsourcesTypical
Granitic gneisssouces
Amphibolite sources
Clay, silt, sand from amphibolite source
Metabasic sources
+ Dilpur Village sectionKarapur Village sectionUCCPAASNASC
Fig. 8. La–Th–Sc ternary diagram showing mixed sources for Kashmir Loess-Paleosol sediments (fields defined by Cullers, 1994a). UCC and PAAS values afterTaylor and McLennan (1985) and NASC values after Gromet et al. (1984).
1 10 1000.1
1.0
10.0
Basalt
Andesite
Granite(a)
Zr/Sc (ppm)
Th/
Sc (
ppm
)
+ Dilpur Village sectionKarapur Village section
0 100 200 300
Zr (ppm)
0
10
20
30+ Dilpur Village section
Karapur Village section
(La/
Yb)
CN
(b)
Fig. 9. (a) Th/Sc vs Zr/Sc plot for Kashmir Loess-Paleosol sediments (after McLennan et al., 1993). Samples define much shorter trend and fall along a trend intermediatebetween trend involving zircon addition (solid line) and primary compositional trend (dashed line) suggestive of weak to moderate sedimentary recycling. Plot of (b) (La/Yb)CN vs Zr (ppm) (after Asiedu et al., 2004) showing weak correlation consistent with the weak to moderate sedimentary recycling.
I. Ahmad, R. Chandra / Journal of Asian Earth Sciences 66 (2013) 73–89 83

Author's personal copy
sediments also plot close to the andesite (values after Condie,1993). Therefore, strong regional variation is detected by compar-ing the average composition of some individual geochemicalparameters of Kashmir Loess to AVL and GAL (Fig. 10a–d). Thesefindings indicated that the composition of Kashmir Loess is veryclose to the andesite and basalt than the others referencesmaterials.
7. Weathering intensity
Chemical weathering intensity of source rocks is controlledmainly by source rock composition, duration of weathering, cli-matic conditions and rates of tectonic uplift of source region
(e.g., Wronkiewicz and Condie, 1987). About 75% of the labilematerial of the upper crust is composed of feldspars and volcanicglass and chemical weathering of these materials ultimately re-sults in the formation of clay minerals (e.g., Nesbitt and Young,1984, 1989; Taylor and McLennan, 1985; Fedo et al., 1995). Thedistribution of elements within the profile is used to assess the nat-ure and degree of weathering (Nesbitt and Young, 1982; McLen-nan, 1989). Both precipitation and temperature acceleratechemical weathering in soils and cause depletion of alkali and alka-line earth elements (Ca, Mg, Na and K) at the expense of refractoryelements such as Ti and Al. Therefore, the concentration of individ-ual element in the profile is directly influenced by change in con-centration of other elements. The amount of these elementssurviving in soil profiles and in sediments derived from them is asensitive index of the intensity of chemical weathering (Nesbittet al., 1997).
The degree of source weathering is quantified variously. Fewindices of weathering have been proposed based on abundancesof mobile and immobile element oxides (Na2O, CaO, K2O andAl2O3). Among the known indices of weathering, the Chemical In-dex of Alteration (CIA; Nesbitt and Young, 1982) is well establishedas a method of quantifying the degree of source weathering. Sourceweathering and elemental redistribution during diagenesis canalso be assessed using Plagioclase Index of Alteration (PIA; Fedoet al., 1995) and Chemical Index of Weathering (CIW; Harnois,1988). The equations of the above indices are:
CIA ¼ Al2O3=ðAl2O3 þ CaO� þ Na2Oþ K2OÞf g � 100
CIW ¼ Al2O3=ðAl2O3 þ CaO� þ Na2OÞf g � 100
PIA ¼ ðAl2O3—K2OÞ=ðAl2O3 þ CaO� þ ðNa2O—K2OÞf g � 100
In the above equations, CaO� is the content of CaO incorporatedin silicate fraction and all major oxides are expressed in molar pro-portions. The CaO content of the loess-paleosol sediments of the
0 4 8 12 160.0
0.3
0.6
0.9
1.2
Granite
Felsic VolcanicKashmir Loess
Basalt GALAVL
Andesite
(d)
Th/
V (
ppm
)
Zr/V (ppm)
50 55 60 65 70 75 8010
12
14
16
18
Kashmir Loess
Granite
Felsic Volcanic
Basalt
Andesite
AVLGAL
(a)
Al 2
O3
(wt%
)
SiO2 (wt%)
50 55 60 65 70 75 800.2
0.4
0.6
0.8
1.0
1.2
1.4
Kashmir Loess
Granite
Felsic Volcanic
Basalt
Andesite
AVLGAL
(b)
TiO
2(w
t%)
SiO2 (wt%)
0 15 30 45 60 75
Ni (ppm)
0.0
0.5
1.0
1.5
2.0
Kashmir Loess
Granite
Felsic Volcanic
Basalt
AndesiteAVL
GAL
(c)
TiO
2(w
t%)
Fig. 10. Scatter plots of (a) Al2O3 vs SiO2 wt%, (b) TiO2 vs SiO2 wt%, (c) TiO2 wt% vs Ni (ppm) and (d) Th/V vs Zr/V (ppm) comparing Kashmir Loess-Paleosol sediments (thisstudy) with average loess composition (AVL) and global average loess composition (GAL) (values from Ujvari et al. (2008)). Average values of igneous rock compositions(granite, basalt, felsic volcanic and andesite) (after Condie, 1993) and Chinese Loess composition (values from Taylor et al., 1983), Gallet et al. (1996) and Jahn et al. (2001) arealso shown for comparison.
Al2O3
K2OCaO*+Na2O
Kaolinit, Gibbsit, Chlorite
50
90
100
80
70
60
CIA
Plagioclase
Illite
K-feldspar
Smectite
Muscovite
Predicted weatheringtrend
+ Dilpur Village sectionKarapur Village section
UCCPAASNASC
Fig. 11. Al2O3�(CaO� + Na2O)�K2O ternary diagram for Kashmir Loess-Paleosolsediments (after Nesbitt and Young, 1982, 1989), compared to data for Post-Archean Average Shale (PAAS) and Upper Continental Crust (UCC) given by Taylorand McLennan (1985); and North American Shale Composite (NASC) given byGromet et al. (1984).
84 I. Ahmad, R. Chandra / Journal of Asian Earth Sciences 66 (2013) 73–89

Author's personal copy
present study varies from 1.21 to 11.33 wt% (average = 5.46 wt%).The P2O5 contents range from 0.087 to 0.156 wt%. There is no directmethod to distinguish and quantify the contents of CaO belongingto silicate fraction and non-silicate fraction (carbonates and apa-tite). McLennan (1993) proposed an indirect method for quantify-ing CaO content of silicate fraction assuming reasonable values ofCaO/Na2O ratio of silicate material. The procedure for quantifica-tion of CaO contents of silicate fraction involves subtraction of mo-lar proportion of P2O5 from the molar proportion of CaO. Onsubtraction, if the ‘‘remaining number of moles’’ found to be lessthan the molar proportion of Na2O, then the ‘‘remaining numberof moles’’ is considered as the molar proportion of CaO of silicatefraction. If the ‘‘remaining numbers of moles’’ are greater thanthe molar proportion of Na2O, then the molar proportion of Na2Ois taken as the molar proportion of CaO of silicate fraction.
Following the procedure of McLennan (1993), the CIA, CIW andPIA values of the loess-paleosol sediments have been determinedand the results are provided in Table 1. CIA value 50 or less repre-sents unweathered rocks and soils. CIA value range from 50 to 60indicates incipient pedogenesis, whereas CIA value range from 60to 80 indicates moderate degree of pedogenesis. Higher values ofCIA from 80 to 100 indicate intense pedogenesis (McLennan,2001; Abdou and Shehata, 2007). The CIA values of KashmirLoess-Paleosol sediments indicate that the degree of source weath-ering varies from 67.13 to 75.27 (average = 71.87). CIW valuesranging from 80 to 95 with Sr contents of 75 to 200 ppm suggestmoderate losses of Ca, Na and Sr. In contrast, the CIW values rangebetween 90 and 98 with Sr contents <100 ppm indicate intenselosses of these elements (Condie, 1993; Nyakairu and Koeberl,2001). The CIW value of Kashmir Loess-Paleosol sediments rangesfrom 79.93 to 87.29 (average = 83.83) and Sr concentration varybetween 94.09 and 167.33 ppm suggesting a moderate loss ofthese elements during pedogenic modification (Table 1). The PIAvalue ranges from 70 to 90 also reflects an intermediate degreeof weathering (Selvaraj and Chen, 2006). PIA values of loess-paleo-sol sediments of Kashmir Valley vary from 75.20 to 84.87 (aver-age = 80.57), which vividly indicate moderate degree ofweathering.
PIA monitors and quantifies the progressive weathering of feld-spars to clay minerals (Fedo et al., 1995). PIA values of sediments
suggest intense destruction of feldspars during the course of sourceweathering, transport, sedimentation and diagenesis. During theinitial stages of weathering of feldspar-bearing source material,Ca leached more rapidly than Na and K. With increasing weather-ing, the total alkali content (K2O + Na2O) decreases with increase inK2O/Na2O ratio. This is due to destruction of plagioclase feldsparsamong which plagioclase is preferentially removed than K-feld-spars (Nesbitt and Young, 1984). Detrital grains of feldspars in sed-iments can preserve imprints of varied degrees of alterationwitnessed at the source region and during transport, sedimenta-tion and diagenesis. PIA shows weak positive correlation withK2O (r = 0.30) and negative correlation with K2O + Na2O wt%(r = �0.064), Na2O (r = �0.56), MgO (r = �0.042) and CaO(r = �0.56). This vividly indicates that the weathering has pro-ceeded to the stage where only mobile elements have beenremoved.
Mobility of elements during the progress of chemical weather-ing and post-depositional chemical modifications of source mate-rial can also be evaluated by plotting the molar proportions ofAl2O3, Na2O, K2O and CaO� (CaO in silicate fraction) in A–CN–K ter-nary diagram (Nesbitt and Young, 1982, 1984). In the A–CN–K dia-gram (A = Al2O3; CN = CaO� + Na2O; K = K2O), the Kashmir Loess-Paleosol sediments plot above the plagioclase-potash feldspar line(Fig. 11). The samples fall intermediate between A–CN and A–Klines, which show removal of Ca and Na to intermediate extentdue to destruction of plagioclase (Buggle et al., 2008). The plotsdo not exhibit any inclination towards the K apex indicating thatthe loess-paleosol sediments were not subjected to potash metaso-matism during diagenesis (Moosavirad et al., 2010). Further, theratios of immobile elements such as La/Co, Zr/Y and Zr/Hf, showno correlation with Al2O3 (r = �0.49, 0.00094, 0.076 respectively)and CIA values (r = �0.58, r = �0.029 and r = 0.051 respectively)which suggest that these elements are resistant to chemicalweathering.
Some studies suggest that REEs can be fractionated duringchemical weathering and especially in humid climates (Ronovet al., 1967; Roaldsete, 1973). To see if the intensity of weatheringof loess-paleosol sediments affected REE distributions, the LaCN/YbCN ratios plotted against the CIA, CaO and Na2O wt% (Fig. 12).A correlation is not apparent between these parameters, as would
10 12 14 16 18 2065
70
75
80
85
CIA
(La/Yb)CN
(a) + Dilpur Village sectionKarapur Village section
10 12 14 16 18 200
5
10
15
20
(La/Yb)CN
CaO
(w
t%)
+ Dilpur Village sectionKarapur Village section
(b)
10 12 14 16 18 200
1
2
Na 2
O (
wt%
)
(La/Yb)CN
(c) + Dilpur Village sectionKarapur Village section
Fig. 12. (a) CIA vs LaCN/YbCN, (b) CaO wt% vs LaCN/YbCN and (c) Na2O wt% vs PIA plots for Kashmir Loess-Paleosol sediments suggesting that the REE are not affected byweathering.
I. Ahmad, R. Chandra / Journal of Asian Earth Sciences 66 (2013) 73–89 85

Author's personal copy
be expected if the REE distributions influenced by weathering. TheLaCN/YbCN ratio of the studied samples do not correlates with theweathering indices (CIW vs LaCN/YbCN; r = 0.090 and PIA vs LaCN/YbCN; r = 0.14). This lack of evidence of intense paleoweatheringat the source depicted by the LREE/HREE (LaCN/YbCN) fractionationsuggests that the REEs are not subjected to weathering (Cai et al.,2008).
PAAS (Post Archean Australian Shale, Taylor and McLennan,1985) normalized REE patterns of Kashmir Loess-Paleosol sedi-ments are moderately depleted in HREE relative to PAAS (Fig. 5cand d). Eu and Ce anomalies are higher than PAAS. This suggeststhat these elements remained conservative during weathering.Hence, REE pattern of the studied samples is mainly inherited fromthe source provenance.
The use of CIA index in weathering studies assumes that this in-dex is a measurement of the amount of the chemical weatheringundergone by the studied rocks. However, other factors that mayaffect the CIA value and need to be taken into account include sed-imentary sorting, sediment provenance and post-depositional pro-cesses that lead to K+ addition (e.g. diagenetic illitization andmetasomatism). Sedimentary sorting can significantly influencethe chemical composition of terrigenous sediments due to grainsize and mineral sorting (Bauluz et al., 2000). For instance, alumi-num is concentrated in the clays, hence the larger the transport(i.e. distal regions), the finer the sediments and the higher the Alconcentration (Soreghan and Soreghan, 2007). There is also a ten-dency of larger grain sizes to concentrate feldspars, which leads tolower CIA values (Zimmerman and Bahlburg, 2003). Therefore, theuse of the CIA as a weathering index, however, can be limited bythe inheritance of clays from sedimentary rocks in the source area.However, the geochemical study of Kashmir Loess-Paleosol sedi-ments reveals that these sediments are enriched in rock formingminerals with significant proportion of clays, indicating that CIAvalue to some extent is affected by these clays. In addition, theA�CN�K diagram (Fig. 11) also indicates that these loess-paleosolsediments are not subjected to potash metasomatism. Further,plots of Th/Sc vs Zr/Sc (ppm) and (La/Yb)CN vs Zr (ppm) show weakto moderate effect of sorting on the studied samples. Therefore,weathering intensity inferred from the various plots indicatingmoderate degree of weathering, probably suggest combined resultof weathering, provenance and grain size effect due to transporta-tion processes. Hence, on the bases of these geochemical observa-tions it is proposed that the Kashmir Loess-Paleosol sedimentsexperienced weak to moderate degree of weathering. The weather-ing has proceeded to the stage where only plagioclase feldspar(both Ca-rich plagioclase and Na-rich plagioclase) are partially re-moved. Among the trace elements, Sr is the only element affectedby the process of pedogenesis followed by Ba.
Integrating the results of various provenance discriminationdiagrams (Roser and Korsch, 1988), Al2O3 vs TiO2 (wt%) (Amajor,1987), La–Th–Sc diagram (Cullers, 1994a,b), elemental ratios andREE contents in these sediments, it reveals that these sedimentspreserve the signatures of intermediate igneous or mixed felsicand mafic source rocks. The presence of significant proportion ofclays in the Kashmir Loess, led earlier workers (e.g. Brongeret al., 1987) to conclude that these sediments are partly derivedfrom the distant source and partly from the local source rocks. Ear-lier, DeTerra and Paterson (1939) on the basis of relatively highclay concentrations suggested that the Kashmir Loess-Paleosolsediments are derived from beyond the Pir Panjal. However, thereis no preferred pathway of deposition of these sediments. DuringPlio-Pleistocene, southwestern monsoon does not reach the valleyas Pir Panjal mountain range effectively blocks it out. In addition,there appear to be no nearby source for the loess nor an effectivemechanism by way of which wind could pass this mountain bar-rier. However, monsoon was also weaker during the glacial phases
(Duplessy, 1982). Therefore, in the absence of any suitable mecha-nism of transport, it is proposed that the westerlies are the possiblemechanism. The western disturbances, which enter the KashmirValley from west and north-west during the winter months, arebrought by the westerlies. The westerlies blow toward Asia andpasses over the Asia Minor (Turkey, or the peninsula of Anatolia),Iran, Afghanistan, Baluchistan, NE Pakistan and then northwesternIndia. These westerlies might have brought fine-grained sedimentsto Kashmir Valley. However, contribution from the nearby sourcesalso not excluded, because the katabatic winds blowing down fromthe mountain slopes could have also picked up fine material fromthe glacial front and redeposited them on valley floor. Therefore, itis proposed that the Kashmir Loess-Paleosol sediments are derivedfrom mixed source sediments, mostly from the distant source re-gion suggesting large provenance with variable geological settings.
8. Conclusions
This paper reports the first detailed multi-elements geochemi-cal study to understand the chemical weathering and provenanceof loess-paleosol sediments of the Karewa Group of Kashmir Val-ley, India. Geochemical studies carried out have revealed thefollowing:
In comparison with UCC, these sediments are generally en-riched with Fe2O3, MgO, MnO (with the exception of few samples),TiO2, Ni, Cu, Zn, Sc, V and Co. Al2O3 is slightly higher than the UCCwhile CaO and U show large variations in comparison with UCC. Rbis generally similar to UCC whereas Ba is slightly lower than theUCC. However, the contents of SiO2, K2O, Na2O, P2O5, Sr, Nb andHf, which are associated with felsic rocks, are lower than theUCC. Th, U, Zr and Y with the exception of few samples are higherthan the UCC. Chondrite normalized REE patterns are characterizedby moderate enrichment of LREEs, relatively flat HREE pattern(GdCN/YbCN = 1.93–2.31), lack of prominent negative Eu anomaly(Eu/Eu� = 0.73–1.01, average = 0.81) and variable amount of totalREE (
PREE = 297.6–402.72). PAAS normalized REE patterns have
slightly higher LREE and moderately depleted HREE. Eu and Ceanomalies are relative higher than PAAS. This suggests robustnessof REE during weathering.
Integrating the results of provenance discrimination diagram(Roser and Korsch, 1988), plot of Al2O3 vs TiO2 (wt%) (Amajor,1987), La–Th–Sc diagram (Cullers, 1994a,b), elemental ratios andREE contents in these sediments, it is concluded that the geochem-ical characteristics preserve the signatures of intermediate igneousor mixed source from felsic and mafic rocks which apparently haveundergone weak to moderate recycling processes. Probably, thewesterlies have brought these fine-grained sediments to KashmirValley. However, contribution from the nearby sources also not ex-cluded, because the katabatic winds blowing down from themountain slopes could have also picked up fine material fromthe glacial front and redeposited them on valley floor. Therefore,it is proposed that the Kashmir Loess-Paleosol sediments are de-rived from mixed source sediments, mostly from the distant sourceregion suggesting large provenance with variable geologicalsettings.
However, paleoweathering at the source depicted by variousweathering indices suggest that the source experienced moderatedegree of weathering. Plot of the Kashmir Loess-Paleosol sedi-ments on A–CN–K ternary diagram also reiterate moderate weath-ering. This diagram further indicates that the loess-paleosolsediments are not subjected to potash metasomatism during dia-genesis. ICV values and Pearson correlation between various majorelements, trace elements and REE suggest that the Kashmir Loess-paleosol sediments are enriched in both rocks forming mineralsand clay contents, indicating that the values of CIA, CIW and PIA
86 I. Ahmad, R. Chandra / Journal of Asian Earth Sciences 66 (2013) 73–89

Author's personal copy
to some extent are affected by these clays. Hence, the presence ofclay minerals in Kashmir Loess-Paleosol sediments over estimatesthe values of weathering indices. Therefore, weathering intensityinferred from the various weathering indices, indicating moderatedegree of weathering, probably suggests combined result of weath-ering and grain size effect due to transportation processes. Further,ratios of various immobile elements such as La/Co, Zr/Y and Zr/Hfshow no correlation with Al2O3 and CIA values, suggesting thatthese elements are not subjected to chemical weathering. Also,LaCN/YbCN ratio shows no correlation with CaO wt%, Na2O wt%,CIA, CIW and PIA, indicating that the chemical weathering didnot fractionate LREE from HREE. Hence, it is proposed that theKashmir Loess-Paleosol sediments experienced weak to moderatedegree of weathering. This is further supported by the ratio ofmaturity index (SiO2/Al2O3 wt%) ranging from 3.33 to 4.43 and plotof Zr (ppm) vs (La/Yb)CN which reveals weak maturity of these sed-iments and likely record a weak to moderate recycling effect fromtheir source rocks.
Acknowledgments
The author is thankful to Dr. B.R. Arora, Director Wadia Instituteof Himalayan Geology (WIHG), Dehradun, for providing access tolaboratory and analytical facilities.
References
Abdou, A.A., Shehata, M.G., 2007. Geochemical study of the shales of Gebel GhorabiMember, Bahariya Oasis, western Desert, Egypt. Australian Journal of Basic andApplied Sciences 1, 553–560.
Agrawal, D.P., Athavale, R.N., Krishnamurthy, R.V., Kusumgar, S., Murthy, C.R.K.,Natiyal, V., 1979. In: Conference and Field Workshop on the Stratigraphy ofLoess and Alluvial Deposits, Budapest, Szeged, Hungary.
Agrawal, D.P., Juyal, N., Sharma, P., Gardner, R., Rendell, H., 1988. Palaeogeographyof the loess deposits of Kashmir. Proceedings of the Indian National ScienceAcademy 54, 383–389.
Agrawal, D.P., Dodia, R., Kotlia, B.S., Razdan, H., Sahni, A., 1989. The Plio-Pleistocenegeologic and climatic records of the Kashmir Valley, India: a review and newdata. Palaeogeography, Palaeoclimatology, Palaeoecology 73, 267–286.
Akarish, A.I.M., El-Gohary, A.M., 2008. Petrography and geochemistry of lowerPaleozoic sandstones, East Sinai, Egypt: implications for provenance andtectonic setting. Journal of African Earth Sciences 52, 43–54.
Akarish, A.I.M., El-Gohary, A.M., 2011. Provenance and source area weatheringderived from the Pre-Cenomanian sandstones, East Sinai, Egypt. Journal ofApplied Sciences 11, 3070–3088.
Alvarez, N.O., Roser, B.P., 2007. Geochemistry of black shales from the LowerCretaceous Paja Formation, Eastern Cordillera, Colombia: source weathering,provenance and tectonic setting. Journal of South American Earth Science 23,271–289.
Amajor, L.C., 1987. Major and trace elements geochemistry of Albin and Touronianshales from the Southern Benue trough, Nigeria. Journal of African Earth Science6, 633–641.
Asiedu, D.K., Dampare, S.B., Sakyi, P.A., Yakubo, B.B., Osae, S., Nyarko, B.J.B., Manu, J.,2004. Geochemistry of Paleoproterozoic metasedimentary rocks from the Birimdiamondiferous field, southern Ghana: Implications for provenance and crustalevolution at the Archean-Proterozoic boundary. Geochemical Journal 38, 215–228.
Bakkiaraj, D., Nagendra, R., Nagarajan, R., Armstrong-Altrin, J.S., 2010. Geochemistryof Sandstones from the Upper Cretaceous Sillakkudi Formation, Cauvery Basin,Southern India: implication for provenance. Journal Geological Society of India76, 453–467.
Bauluz, B., Mayayo, M.J., Fernandez-Nieto, C., Lopez, J.M.G., 2000. Geochemistry ofPrecambrian and Paleozoic siliciclastic rocks from the Iberian Range (NE Spain):implications for source-area weathering, sorting, provenance and tectonicsetting. Chemical Geology 168, 135–150.
Bhat, M.I., 1982. Thermal and tectonic evolution of Kashmir Basin vis-a-vispetroleum prospectus. Tectonophysics 88, 127–132.
Bhat, M.I., Zainuddin, S.M., 1978. Environment of eruption of the Panjal Traps.Himalayan Geology 8, 727–738.
Bhat, M.I., Zainuddin, S.M., 1979. Origin and evolution of Panjal volcanics.Himalayan Geology 9, 421–461.
Bhatia, M.R., Crook, K.A.W., 1986. Trace element characteristics of graywackes andtectonic setting discrimination of sedimentary basins. Contributions toMineralogy and Petrology 92, 181–193.
Bhatt, D.K., 1982. A review of the stratigraphy of the Karewa Group (Pliocene-Quaternary), Kashmir. Man and Environment 6, 46–55.
Bhatt, D.K., 1989. Lithostratigraphy of Karewa Group, Kashmir Valley, India andCritical Review of Its Fossil Record. Memoires Geological Survey of India 122.
Borges, J.G., Gus, Y., Moon, S., Noh, H., 2008. Provenance and weathering control onriver bed sediments of the eastern Tibetan Plateau and the Russian Far East.Chemical Geology 254, 52–72.
Bronger, A., Pant, R.K., 1985. Micromorphology and genesis of paleosols of someselected loess profiles in the Kashmir Valley and their relevance to stratigraphyand paleoclimate. In: Agrawal, D.P., Kusumgar, S., Krishnamurthy, R.V. (Eds.),Climate and Geology of Kashmir and Central Asia for the last 4 Million Years.Today and Tomorrow’s Printers and Publishers, New Delhi, pp. 131–140.
Bronger, A., Pant, R.K., Singhvi, A.K., 1987. Pleistocene climatic changes andlandscape evolution in the Kashmir Basin, India: Paleopedologic andChronostratigraphic studies. Quaternary Research 27, 167–181.
Buggle, B., Glaser, B., Zoller, L., Hambach, U., Markovic, S., Glaser, I., Gerasimenko, N.,2008. Geochemical characterization and origin of Southeastern and EasternEuropean loess (Serbia, Romania, Ukraine). Quaternary Science Reviews 27,1058–1075.
Cai, G., Guo, F., Liu, X., Sui, S., Li, C., Zhao, L., 2008. Geochemistry of Neogenesedimentary rocks from the Jiyang basin, North China Block: the roles of grainsize and clay minerals. Geochemical Journal 42, 381–402.
Ceryan, S., 2008. New chemical weathering indices for estimating the mechanicalproperties of rocks: a case study from the Kurtun Granodiorite, northeastTurkey. Turkish Journal of Earth Sciences 17, 187–207.
Chauvet, F., Lapierre, H., Bosch, D., Guillot, S., Mascle, G., Vannay, J.-C., Cotton, J.,Keller, F., 2008. Geochemistry of the Panjal traps basalts (NW Himalaya):records of the Pangea Permian break-up. Bull. Soc. geol. France 179, 383–395.
Chen, J., Ji, J.F., Qiu, G., Lu, H.Y., 1998. Geochemical studies on the intensities ofchemical weathering in the Luochuan loess-paleosol sequence, China. ScienceChina Series D 41, 235–241.
Condie, K.C., 1993. Chemical composition and evolution of the upper continentalcrust- contrasting results from surface sample and shales. Chemical Geology104, 1–37.
Condie, K.C., Dengate, J., Cullers, R.L., 1995. Behavior of rare earth elements in apaleoweathering profile on granodiorite in the Front Range, Colorado, USA.Geochimica et Cosmochimica Acta 59, 279–294.
Cox, R., Lower, D.R., Cullers, R.L., 1995. The influence of sediment recycling andbasement composition on evolution of mud rock chemistry in the southwesternUnited States. Geochemical et Cosmochimica Acta 59, 2919–2940.
Cullers, R.L., 1994a. The chemical signature of source rocks in size fractions ofHolocene stream sediment derived from metamorphic rocks in the wetmountains region, Colorado, USA. Chemical Geology 113, 327–343.
Cullers, R.L., 1994b. The controls on the major-and trace-element variation ofshales, siltstones and sandstones of Pennsylvanian–Permian age from upliftedcontinental blocks in Colorado to platform sediments in Kansas, USA.Geochemical et Cosmochimica Acta 58, 4955–4972.
Cullers, R.L., 2000. The geochemistry of shales, siltstones and sandstones ofPennsylvanian–Permian age, Colorado, USA: implications for provenance andmetamorphic studies. Lithos 51, 181–203.
Datta, N.K., 1983. Geology, evolution and hydrocarbon prospects of Kashmir Valley.Petroleum Asia Journal 17, 1–179.
DeTerra, H., Paterson, T.T., 1939. Studies on the Ice Age in India and AssociatedHuman Cultures. Carnegie Institute, Washington, pp. 1–354.
Dey, S., Rai, A.K., Chaki, A., 2009. Palaeoweathering, composition and tectonics ofprovenance of the Proterozoic intracratonic Kaladgi-Badami basin, Karnataka,southern India: evidence from sandstone petrography and geochemistry.Journal of South Asian Earth Sciences 34, 703–715.
Duplessy, J.C., 1982. Glacial to interglacial contrasts in the northern Indian Ocean.Nature 295, 494–498.
Edwards, M.B., 1979. Late Precambrian glacial loessites from North Norway andSvalbard. Journal of Sediments Petrology 49, 85–92.
Fedo, C.M., Nesbitt, H.W., Young, G.M., 1995. Unraveling the effects of potassiummetasomatism in sedimentary rocks and paleosols, with implications forpaleoweathering conditions and provenance. Geology 23, 921–924.
Feng, R., Kerrich, R., 1990. Geochemistry of fine grained Clastic sediments in theArchean Abitibi greenstone belt, Canada: implications for provenance andtectonic setting. Geochemical et Cosmochimica Acta 54, 1061–1081.
Fralick, P.W., Kronberg, B.I., 1997. Geochemical discrimination of clasticsedimentary rock sources. Sedimentary Geology 113, 111–124.
Gaetani, M., Garzanti, E., Tintori, A., 1990. Permo-Carboniferous stratigraphy in SEZanskar and NW Lahul (NW Himalaya, India). Eclogae Geologicae Helvetiae 83,143–161.
Gallet, S., Jahn, B., Torii, M., 1996. Geochemical characterization of the Luochuanloess-paleosol sequence, China, and paleoclimatic implications. ChemicalGeology 133, 67–88.
Gallet, S., Jahn, B.M., Van Vliet Lanoe, B., Dia, A., Rossello, E., 1998. LoessGeochemistry and its implications for the practical origin and composition ofthe upper Continental crust. Earth and Planetary Science Letters 156, 157–172.
Gardner, R., 1989. Late Quaternary loess and Paleosols, Kashmir Valley, India.Zeitschrift Geomorphologie. N.F. Suppliment Buddapes 6, 225–245.
Gromet, L.P., Dymek, R.F., Haskin, L.A., Korotev, R.L., 1984. The North American ShaleComposite: its compilation, major and trace element characteristics.Geochimica et Cosmochimica Acta 48, 2469–2482.
Gupta, K.R., Gergan, J.T., Kumar, S., 1983. Geochemistry of the volcanic rocks of thenorthwestern Himalaya and its bearing in tectonics. In: Sinha, A.K. (Ed.) Cont.Geosc. Res. Himal., Dehra Dun 2, pp. 9–18.
I. Ahmad, R. Chandra / Journal of Asian Earth Sciences 66 (2013) 73–89 87

Author's personal copy
Harnois, L., 1988. The CIW index: a new chemical index of weathering. SedimentaryGeology 55, 319–322.
Hayashi, K.I., Fujisawa, H., Holland, H.D., Ohomoto, H., 1997. Geochemistryof�1.9 Ga sedimentary rocks from northern Labrador, Canada. Geochemical etCosmochimica Acta 61, 4115–4137.
Hirst, D.M., 1962. The geochemistry of modern sediments from the Gulf of Paria II.The location and distribution of trace elements. Geochemical et CosmochimicaActa 26, 1174–1187.
Honda, M., Yabuki, S., Shimizu, H., 2004. Geochemical and isotopic studies ofAeolian sediments in China. Sedimentology 51, 211–230.
Honegger, K., Dietrich, V., Frank, W., Gansser, A., Thoeni, M., Trommsdorff, V., 1982.Magmatism and metamorphism in the Ladakh Himalayas (the Indus-Tsangposuture zone). Earth and Planetary Science Letters 60, 253–292.
Jahn, B.M., Gallet, S., Han, J.M., 2001. Geochemistry of the Xining, Xifeng and Jixiansections, Loess Plateau of China: Eolian dust provenance and paleosol evolutionduring the last 140 ka. Chemical Geology 178, 71–94.
Jin, Z.D., Cao, J.J., Wu, J.L., Wang, S.M., 2006. A Rb/Sr record of catchment weatheringresponse to Holocene climate change in Inner Mongolia. Earth Surface Processesand Landforms 31, 285–291.
Kalsbeek, F., Frei, R., 2010. Geochemistry of Precambrian sedimentary rocks used tosolve stratigraphical problems: an example from the Neoproterozoic Voltabasin, Ghana. Precambrian Research 176, 66–75.
Krishnamurthy, R.V., DeNitro, M.J., Pant, R.K., 1982. Isotopic evidence for Pleistoceneclimatic changes in Kashmir, India. Nature 298, 640–641.
Krishnamurthy, R.V., Bhattacharya, S.K., Pant, R.K., DeNiro, M.J., 1985. Stable carbonisotope ratios of the Paleosols and their paleoecological implications. In:Agrawal, D.P., Kusumgar, S., Krishnamurthy, R.V. (Eds.), Climate and Geology ofKashmir and Central Asia for the last 4 Million Years. Today and Tomorrow’sPrinters and Publishers, New Delhi, pp. 147–150.
Kusumgar, S., Agrawal, D.P., Krishnamurthy, R.V., 1980. Studies on the loessdeposits of the Kashmir Valley and Dating. Radiocarbon 22, 757–762.
Kusumgar, S., Kotlia, B.S., Agrawal, D.P., Sahani, A., 1986. Biochronologie des fossilde vertebres des formation des Karewa du Cachemire, Inde. L’Anthropologie,Paris 90, 151–164.
Liang, M., Guo, Z., Kahmann, A.J., Oldfield, F., 2009. Geochemical characteristics ofthe Miocene Eolian deposits in China: Their provenance and climateimplications. Geochemistry Geophysics Geosystems 10, 1–16.
Liu, C.Q., Masuda, A., Okada, A., Yabuki, S., Zhang, J., Fan, Z.-F., 1993. A geochemicalstudy of loess and desert sand in northern china: implications for Continentalcrust weathering and composition. Chemical Geology 106, 359–374.
Liu, T.S., Guo, Z.T., Wu, N.Q., Lu, H.Y., 1996. Prehistoric vegetation on the LoessPlateau: steppe or forest. Journal of Southeast Asian Earth Science 13, 341–346.
Lodha, G.S., 1987. Development of X-Ray Fluorescence System and Its Application toKashmir Paleoclimatic Studies. Ph.D. thesis. Kashmir University, Srinagar.
Lodha, G.S., Sawhney, K.J.S., Razdan, H., Lal, M., 1985. Trace elements in the KanchiNala, (Kashmir) loess deposits. In: Climate and Geology of Kashmir and CentralAsia for the last 4 Million Years. Current Trend in Geology, vol. 6. Today andTomorrow Printers and Publishers, New Delhi, pp. 147–150.
Mahjoor, A.S., Karimi, M., Rastegarlari, A., 2009. Mineralogical and geochemicalcharacteristics of clay deposits (Central Iran) and their applications. JournalApplied Science 9, 601–614.
Manikyamba, C., Kerrich, R., Gonzalez-Alvarez, I., Mathur, M., Khanna, C.T., 2008.Geochemistry of Paleoproterozoic black shales from the IntracontinentalCuddapaha basin, India: implications for provenance, tectonic setting, andweathering intensity. Precambrian Research 162, 424–440.
McLennan, S.M., 1989. Rare earth elements in sedimentary rocks; influence ofprovenance and sedimentary processes. In: Lipin, B.R., McKay, G.A. (Eds.),Geochemistry and Mineralogy of Rare Earth Elements. Reviews of Mineralogy21, 169–200.
McLennan, S.M., 1993. Weathering and global denudation. Journal of Geology 101,295–303.
McLennan, S.M., 2001. Relationships between the traces element composition ofsedimentary rocks and upper continental crust. Geochemistry GeophysicsGeosystems 2, 24, 2000GC000109.
McLennan, S.M., Taylor, S.R., Eriksson, K.A., 1983. Geochemistry of Archean shalesfrom the Pilbara Super group, Western Australia. Geochimica et CosmochimicaActa 47, 1211–1222.
McLennan, S.M., Hemming, D.K., Hanson, G.N., 1993. Geochemical approaches tosedimentation, provenance and tectonics. Geological Society of America SpecialPaper 284, 21–40.
Mishra, M., Sen, S., 2010. Geological signatures of Mesoproterozoic siliciclastic rocksof the Kaimur Group of the Vindhyan Supergroup, Central India. Chinese Journalof Geochemistry 20, 21–32.
Moosavirad, S.M., Janardhana, M.R., Sethumadhav, M.S., Moghadam, M.R., Shankara,M., 2010. Geochemistry of lower Jurassic shales of the Shemshak Formation,Kerman Province, Central Iran: Provenance, source weathering and tectonicsetting. Chemie der Erde-Geochemistry 71, 279–288.
Muhs, D.R., Bettis III, E.A., 2003. Quaternary loess-paleosol sequences as examples ofclimate-driven sedimentary extremes. Geological Society of America SpecialPaper 370, 53–74.
Muhs, D.R., Budahn, J.R., 2006. Geochemical evidence for the origin of lateQuaternary loess in central Alaska. Canadian Journal of Earth Sciences 43,323–337.
Muhs, D.R., Bettis III, E.A., Been, J., McGeehin, J., 2001. Impact of climate and parentmaterial on chemical weathering in loess-derived soils of the Mississippi RiverValley. Soil Science Society of America Journal 65, 1761–1777.
Muhs, D.R., Ager, T.A., Skipp, G., Beann, J., Budahn, J., McGeehin, J.P., 2008.Paleoclimatic significance of chemical weathering in loess-derived paleosolsof Subarctic Central Alaska. Arctic, Antarctic and Alpine Research 40, 396–411.
Nesbitt, H.W., Young, G.M., 1982. Early Proterozoic climates and plate motioninferred from major element chemistry of lutites. Nature 299, 715–717.
Nesbitt, H.W., Young, G.M., 1984. Prediction of some weathering trends of plutonicand volcanic rocks based on thermodynamic and kinetic considerations.Geochemical et Cosmochimica Acta 48, 1523–1534.
Nesbitt, H.W., Young, G.M., 1989. Formation and diagenesis of weathering profiles.Journal of Geology 97, 129–147.
Nesbitt, H.W., Fedo, C.M., Young, G.M., 1997. Quartz and feldspar stability, steadyand non-steady state weathering, and petrogenesis of siliciclastic sands andmuds. Journal of Geology 105, 173–191.
Nyakairu, G.W.A., Koeberl, C., 2001. Mineralogy and chemical composition anddistribution of rare earth elements in clay-rich sediments from central Uganda.Geochemical Journal 35, 13–28.
Paikaray, S., Banerjee, S., Mukherji, S., 2008. Geochemistry of shales fromPalaeoproterozoic to Neoproterozoic Vindhyan Supergroup: implications onprovenance, tectonics and paleoweathering. Journal of Asian Earth Sciences 32,34–48.
Pant, R.K., Dilli, K., 1986. Loess deposits of Kashmir, Northwest Himalaya, India.Journal of Geological Society of India 28, 289–292.
Pant, R.K., Krishnamurthy, R.V., Tandon, S.K., Bisht, K., 1985. Loess lithostratigraphyof Kashmir basin, India. In: Agrawal, D.P., Kusumgar, S., Krishnamurthy, R.V.(Eds.), Climate and Geology of Kashmir and Central Asia for the last4 Million Years. Today and Tomorrow’s Printers and Publishers, New Delhi,pp. 123–129.
Papritz, K., Rey, R., 1989. Evidence for the occurrence of Permian Panjal Trap basaltsin the lesser and higher-Himalaya of the western syntaxis area, NE Pakistan.Eclogae Geologicae Helvetiae 82, 603–627.
Pareek, H.S., 1976. On studies of the agglomeratic slate and Panjal trap in theJhelum, Liddar and Sind Valleys Kashmir. Records of Geological Survey of India107, 12–37.
Pogue, K.R., Dipietro, J.A., Khan, S.R., Hughes, S.S., Dilles, J.H., Lawrence, R.D., 1992.Late Paleozoic rifting in northern Pakistan. Tectonics 11, 871–883.
Price, J.R., Velbel, M.A., 2003. Chemical weathering indices applied to weatheringprofiles developed on heterogeneous felsic metamorphic parent rocks.Chemical Geology 202, 397–416.
Pye, K., 1987. Aeolian Dust and Dust Deposits. Academic Press, London, pp 334.Pye, K., Johnson, R., 1988. Stratigraphy, geochemistry and thermoluminescence ages
of Lower Mississippi Valley Loess. Earth Surface Processes and Landforms 13,103–124.
Roaldsete, 1973. Rare earth elements in Quaternary clays of the Numedal area,southern Norway. Lithos 6, 349–372.
Ronov, A.B., Balashov, Yu.A., Migdisov, A.A., 1967. Geochemistry of rare earthelements in the sedimentary cycle. Geokhimiya 1, 3–19.
Roser, B.P., Korsch, R.J., 1986. Determination of tectonic setting of sandstone-mudstone suites using SiO2 content and K2O/Na2O ratio. Journal of Geology 94,635–650.
Roser, B.P., Korsch, R.J., 1988. Provenance signatures of sandstone-mudstone suitesdetermined using discriminant function analysis of major-element data.Chemical Geology 67, 119–139.
Roser, B.P., Cooper, R.A., Nathan, S., Tulloch, A.J., 1996. Reconnaissance sandstonegeochemistry, provenance, and tectonic setting of the lower Paleozoic terranesof the West Coast and Nelson, New Zealand. New Zealand Journal of Geologyand Geophysics 39, 1–16.
Selvaraj, K., Chen, C.-T.A., 2006. Moderate chemical weathering of subtropicalTaiwan: constraints from solid-phase geochemistry of sediments andsedimentary rocks. Journal of Geology 114, 101–116.
Singh, M.P., Manda, M.M., Sinha, P.K., 1976. The Ralakung volcanics of the Zanskarvalley (Ladakh), its geological setting, petrography, petrogeochemistry and acomparative study with the Panjal volcanics of the NW Himalaya. GeologicalSurvey of India Miscellaneous Publication 41, 218–228.
Singhvi, A.K., Bronger, A., Pant, R.K., Sauer, W., 1987. Thermoluminescence datingand its implications for the chronostratigraphy of loess-paleosol sequences inthe Kashmir Valley, India. Chemical Geology 65, 45–56.
Smalley, I.J., Smalley, V., 1983. Loess material and loess deposits: formation,distribution and consequences. In: Aeolian Sediments and Process.Developments in Sedimentology 38, 51–68.
Soreghan, M.J., Soreghan, G.S., 2007. Whole-rock geochemistry of upper Paleozoicloessite, western Pangaea: implications for paleo atmospheric circulation. Earthand Planetary Science Letters 255, 117–132.
Spalletti, L.A., Queralt, I., Matheos, S.D., Colombo, F., Maggi, J., 2008. Sedimentarypetrology and geochemistry of siliciclastic rocks from the upper JurassicTordillo Formation (Neuquén Basin, western Argentina): implications forprovenance and tectonic setting. Journal of South American Earth Science 25,440–463.
Spencer, D.A., Tonarini, S., Pognante, U., 1995. Geochemical and Sr–Nd isotopiccharacterization of higher Himalayan eclogites and associated metabasites.European Journal of Mineralogy 7, 89–102.
Sun, J., 2002a. Source regions and formation of the loess sediments on the highmountain regions of northwestern China. Quaternary Research 58, 341–351.
Sun, J., 2002b. Provenance of loess material and formation of loess deposits on theChinese Loess Plateau. Earth and Planetary Science Letters 203, 845–859.
88 I. Ahmad, R. Chandra / Journal of Asian Earth Sciences 66 (2013) 73–89

Author's personal copy
Sun, J., Li, S.-H., Muhs, D.R., Li, B., 2007. Loess sedimentation in Tibet: Provenance,processes, and link with Quaternary glaciations. Quaternary Science Reviews26, 2265–2280.
Taylor, S.R., McLennan, S.M., 1985. The Continental Crust: Its Composition andEvolution. Blackwell, Oxford, p. 312.
Taylor, S.R., McLennan, S.H., McCulloch, M.T., 1983. Geochemistry of loess,continental crustal composition and crustal model ages. Geochimica etCosmochemica Acta 47, 1897–1905.
Thakur, V.C., Rawat, B.S., 1992. Geological map of the Western Himalaya. Publishedunder the Authority of the Surveyor General of India. Printing Group of Surveyof India, 101 (HLO).
Tripathi, J.K., Rajamani, V., 1999. Geochemistry of the loessic sediments on DelhiRidge, eastern Thar Desert, Rajasthan: implications for exogenic processes.Chemical Geology 155, 265–278.
Ujvari, G., Varga, A., Balogh-Brunstad, Z., 2008. Origin, weathering and geochemicalcomposition of loess in southwestern Hungary. Quarterly Research 69, 421–437.
Vannay, J.C., Spring, L., 1993. Geochemistry of the continental basalts within theTethyan Himalaya of Lahul-Spiti and SE Zanskar, NW India. In: Treloar, P.J.,Searle, M.P. (Eds.), Himalayan Tectonics. Geological Society Special Publication74, 237–249.
Von Richthofen, F., 1882. On the mode of origin of the loess. In: Smalley, I.J. (Ed.),Loess: Lithology and Genesis. Benchmark Paper in Geology 26: 1975. Dowden,Hutchinson and Ross, New York, NY, p. 428.
Wadia, D.N., 1931. The syntaxis of NW Himalaya, its rocks, tectonics and orogeny.Records Geological Survey of India 65, 189–220.
Wright, J.S., 2001. ‘‘Desert’’ loess versus ‘‘glacial’’ loess: quartz silt formation, sourceareas and sediment pathways in the formation of loess deposits.Geomorphology 36, 231–256.
Wronkiewicz, D.J., Condie, K.C., 1987. Geochemistry of Archean shales from theWitwatersrand Supergroup, South Africa: source-area weathering andprovenance. Geochimica et Cosmochemica Acta 51, 2401–2416.
Wronkiewicz, D.J., Condie, K.C., 1989. Geochemistry and provenance of sedimentsfrom the Pongola Supergroup, South Africa: Evidence for a 3.0-Ga-oldcontinental craton. Geochimica et Cosmochemica Acta 53, 1537–1549.
Yang, S.L., Ding, Z.L., 2004. Comparison o f particle size characteristics of the Tertiaryred clay and Pleistocene loess in the Chinese Loess Plateau: implications fororigin and sources of the red clay. Sedimentology 51, 77–93.
Yang, S., Ding, F., Ding, Z., 2006. Pleistocene chemical weathering history of Asianarid and semi-arid regions recorded in loess deposits of China and Tajikistan.Geochimica et Cosmochemica Acta 70, 1695–1709.
Zhang, G.-L., Pan, J.-H., Huang, C.-M., Gong, Z.-T., 2007. Geochemical features of asoil chronosequence developed on basalt in Hainan Island, China. RevistaMexicana de Ciencias Geologicos 24, 261–269.
Zimmerman, U., Bahlburg, H., 2003. Provenance analysis and tectonic setting of theOrdovician clastic deposits in the Southern Puna Basin, NW Argentina.Sedimentology 50, 1079–1104.
I. Ahmad, R. Chandra / Journal of Asian Earth Sciences 66 (2013) 73–89 89