Soils, weathering zones, and landscapes in the upland loess ...
343
Iowa State University Digital Repository @ Iowa State University Retrospective eses and Dissertations 1966 Soils, weathering zones, and landscapes in the upland loess of Tama and Grundy counties, Iowa omas Eugene Fenton Iowa State University Follow this and additional works at: hp://lib.dr.iastate.edu/rtd Part of the Agriculture Commons , and the Soil Science Commons is Dissertation is brought to you for free and open access by Digital Repository @ Iowa State University. It has been accepted for inclusion in Retrospective eses and Dissertations by an authorized administrator of Digital Repository @ Iowa State University. For more information, please contact [email protected]. Recommended Citation Fenton, omas Eugene, "Soils, weathering zones, and landscapes in the upland loess of Tama and Grundy counties, Iowa " (1966). Retrospective eses and Dissertations. Paper 2859.
-
Upload
khangminh22 -
Category
Documents
-
view
0 -
download
0
Transcript of Soils, weathering zones, and landscapes in the upland loess ...
Iowa State UniversityDigital Repository @ Iowa State University
Retrospective Theses and Dissertations
1966
Soils, weathering zones, and landscapes in theupland loess of Tama and Grundy counties, IowaThomas Eugene FentonIowa State University
Follow this and additional works at: http://lib.dr.iastate.edu/rtd
Part of the Agriculture Commons, and the Soil Science Commons
This Dissertation is brought to you for free and open access by Digital Repository @ Iowa State University. It has been accepted for inclusion inRetrospective Theses and Dissertations by an authorized administrator of Digital Repository @ Iowa State University. For more information, pleasecontact [email protected].
Recommended CitationFenton, Thomas Eugene, "Soils, weathering zones, and landscapes in the upland loess of Tama and Grundy counties, Iowa " (1966).Retrospective Theses and Dissertations. Paper 2859.
This dissertation has been
microfihned exactly as received 66-6980
FENTON, Thomas Eugene, 1933— SOILS, WEATHERING ZONES, AND LANDSCAPES IN THE UPLAND LOESS OF TAMA AND GRUNDY COUNTIES, IOWA.
Iowa State University of Science and Technology Ph.D., 1966 Agriculture, soil science
University Microfilms. Inc., Ann Arbor, Michigan

SOILS, WEATHERING ZONES, AND LANDSCAPES IN THE
UPLAND LOESS OF TAMA AND GRUNDY COUNTIES, IOWA
A Dissertation Submitted to the
Graduate Faculty in Partial Fulfillment of
The Requirements for the Degree of
DOCTOR OF PHILOSOPHY
Major Subject: Soil Morphology and Genesis
by
Thomas Eugene Fenton
Approved:
In Charge of Major Work
Iowa State University Of Science and Technology
Ames, Iowa
1966
Signature was redacted for privacy.
Signature was redacted for privacy.
Signature was redacted for privacy.

ii
TABLE OF CONTENTS
Page
INTRODUCTION 1
Objectives of the Study 1
Location and Description of Areas Studied 6
BACKGROUND 7
Pleistocene Geology g
Geomorphic Surfaces and Weathering Zones 14
Soils 17
METHODS AND PROCEDURES 24
Field Investigation 24
Laboratory Procedures 24
Particle-size analysis 25 Organic carbon 25 Soil reaction 25 Calcium carbonate equivalent 25 Exchangeable cations 26 Free iron 26 Total iron 26 Total magnesium and potassium of the <ly clay 27
fraction Total phosphorus 27 Organic phosphorus 27
INVESTIGATIONS IN GENESEO AREA 28
Stratigraphy 31
Stratigraphie sequence of Geneseo divide area 31 Stratigraphie sequence of lower landscape 56 Stratigraphie sequence under slopes that 62
descend from divide area to lower landscape
Discussion 85 Summary 9 7
iii
Page
Landscape 99
Buried surfaces 99 Constructional Tazewell surfaces 108 Floodplain surfaces 118 Hillslope surfaces 118
Weathering Zones in the Wisconsin Loess 119
Weathering zones present and their general 120 characteristics
Distribution of weathering zones 121 Chemical characteristics 125 Discussion 129
Soils 130
Distribution and correlation of soil mapping 131 units
Characteristics of soils on upland-summit and 137 terrace surfaces
Characteristics of soils on hillslope surface 154 S3 of Hayward paha
Characteristics of soils on hillslope surfaces 163 descending from upland-summit surfaces 5 and 6
Summary 167
INVESTIGATIONS IN PALERMO AREA 170
Preliminary Studies 170
Four-Mile Creek area and Four-Mile Creek to 171 Palermo traverse
Stratigraphy 181
Stratigraphie sequence of Palermo divide area 181
Landscape of Palermo Area 210
Buried surfaces 211 Construction Tazewell surfaces 213
Weathering Zones in the Wisconsin Loess 216
Weathering zones present and their distri- 217 bution
Chemical characteristics 223
iv
Page
Soils 228
Distribution and correlation of soil mapping 228 units
Characteristics of soils on upland-summit 232 surface
Summary 244
DISCUSSION 247
Properties of Tama Soils on Different Landscape 247 Levels
Soils on Slopes 254
Soil Profiles and Weathering Profiles 256
Soils and Landscapes 263
SUMMARY 268
BIBLIOGRAPHY 272
ACKNOWLEDGMENTS 280
APPENDIX A 281
Glossary of Terms Used in Description of Sites 281
Descriptions of Sites in Geneseo Area 284
APPENDIX B 310
Locations of Sites in Four-Mile Creek Paha Traverse 310 and Four-Mile Creek to Palermo Area Traverse
Descriptions of Sites in Palermo Area 311
V
LIST OF FIGURES
Page
1. Distribution of lowan drift in northeastern Iowa 3
2. Location of research areas in northeastern Iowa 5
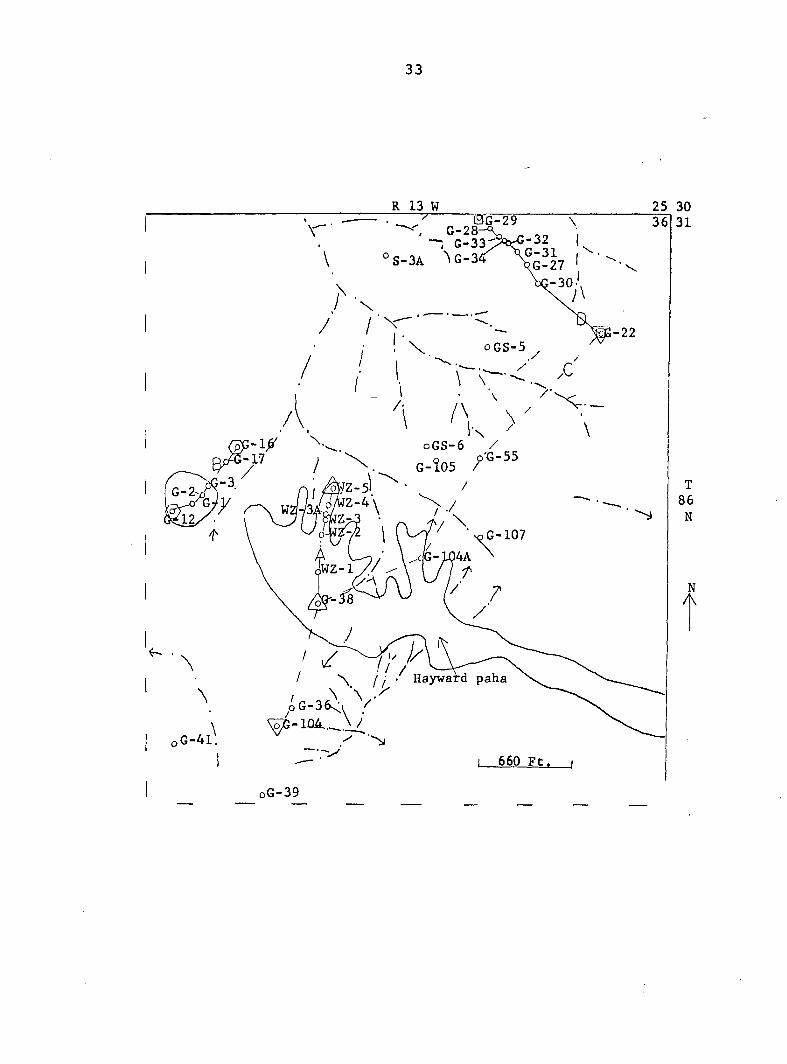
3. Location of drilling sites, traverses, divide area, 33 and lower landscape in section 36, T86N, R13W, Tama County, Iowa
4. Distribution of sand, clay, and calcium carbonate 39 equivalent in Tama soil, Wisconsin loess and Yarmouth-Sangamon paleosol at site WZ-1
5. Distribution of sand, clay, free iron, and total 44 iron in Wisconsin loess, Yarmouth-Sangamon paleosol, and Kansan till at site G-402
6. Cross section of traverse A, located near center of 65 section 36, T86N, R13W, Tama County, Iowa
7. Variation of particle-size ratio of Wisconsin loess 73 with elevation at sites WZ-1, WZ-2, WZ-3, WZ-4 and WZ-5
8. Distribution of particle-size ratios of Wisconsin 75 loess with depth at sites WZ-1, WZ-2, WZ-3, WZ-4, and WZ-5
9. Distribution of <2\i clay in Yarmouth-Sangamon 79 paleosol (PI) and truncated Yarmouth-Sangamon paleosol (PIT) at sites WZ-3 and WZ-3A
10. Cross section of traverse B, located west of center 83 of section 36, T86N, R13W, Tama County, Iowa
11. Cross section of traverse C, located in section 36, 87 T86N, R13W, Tama County, Iowa
12. Cross section of Traverse D, located in section 36, 90 T86N, R13W, Tama County, Iowa
13. Distribution of land surfaces in NE^ section 36, 104 E^ section 25, and the SE^ section 24, T86N, R13W, Tama County, Iowa
14. Location of drilling sites in sections 24, 25, and 110 36, T86N, R13W, Tama County, Iowa
vi
Page
15. Distribution of total phosphorus, pH, calcium 128 carbonate equivalent, and weathering zones in Tama soil and Wisconsin loess at site WZ-1
16. Distribution of soil mapping units in NE^ section 133 36, section 25, and the SEj^ section 24, T86N, R13W, Tama County, Iowa
17. Particle-size distribution in Tama soils at sites 140 WZ-1, GS-6, GS-5, GS-4, and Pal-1
18. Organic carbon distribution in Tama soils at sites 140 WZ-1, GS-6, GS-5, GS-4, and Pal-1
19. Distribution of cation-exchange capacity in Tama 143 soils at sites WZ-1, GS-6, GS-5, GS-4, and Pal-1
20. Distribution of base saturation in Tama soils at 143 sites WZ-1, GS-6, GS-5, GS-4, and Pal-1
21. Distribution of free iron in Tama soils at sites 147 WZ-1, GS-6, GS-5, and Pal-1
22. Distribution of organic phosphorus in Tama soils 147 at sites WZ-1, GS-6, GS-5, and Pal-1
23. Distribution of total phosphorus in Tama soils at 150 sites WZ-1, GS-6, GS-5, and Pal-1
24. Distribution of nonexchangeable magnesium of <ly 153 clay in Tama soils at sites WZ-1, GS-5, and Pal-1
25. Distribution of nonexchangeable potassium of <ly 156 clay in Tama soils at sites WZ-1, GS-5, and Pal-1
26. Particle-size distribution in soils on hillslope 159 surface S3 of the Hayward paha
27. Organic carbon distribution in soils on hillslope 159 surface S3 of the Hayward paha
28. Particle-size distribution in Dinsdale soil at 166 site S3A
29. Organic carbon distribution in Dinsdale soil at 166 site S3A
30. Cross section of Four-Mile Creek paha traverse 173
vii
Page
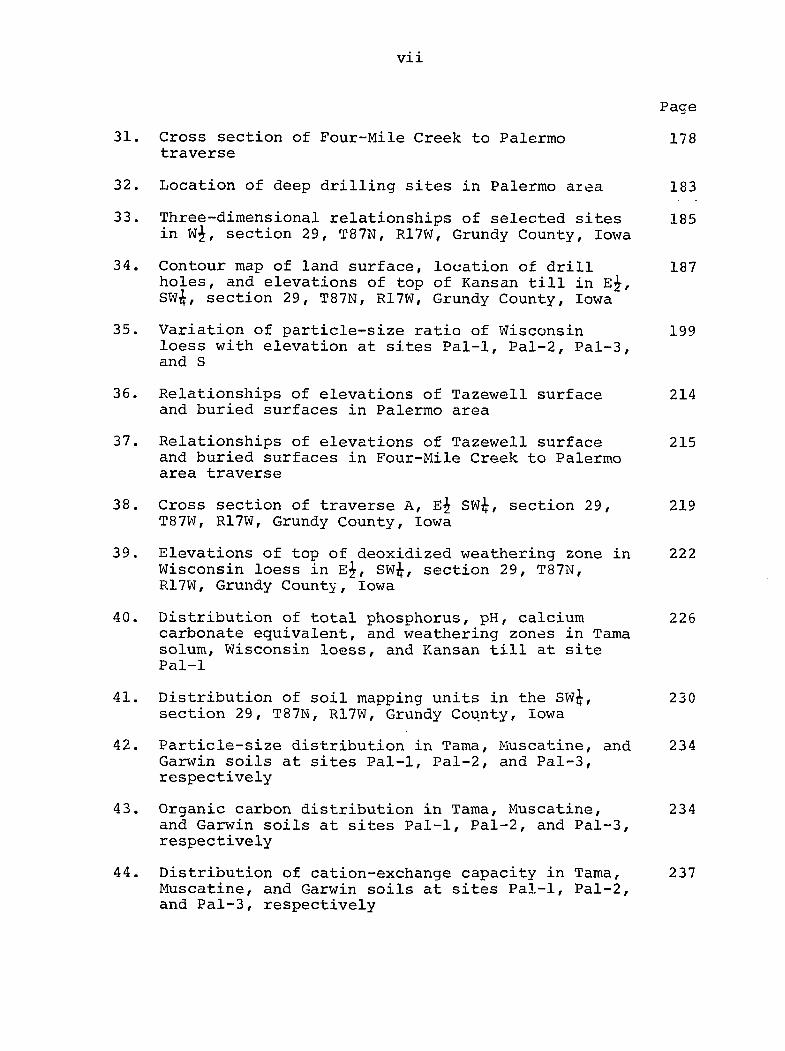
31. Cross section of Four-Mile Creek to Palermo 178 traverse
32. Location of deep drilling sites in Palermo area 183
33. Three-dimensional relationships of selected sites 185 in W^, section 29, T87N, R17W, Grundy County, Iowa
34. Contour map of land surface, location of drill 187 holes, and elevations of top of Kansan till in E^, SW^, section 29, T87N, R17W, Grundy County, Iowa
35. Variation of particle-size ratio of Wisconsin 199 loess with elevation at sites Pal-1, Pal-2, Pal-3, and S
36. Relationships of elevations of Tazewell surface 214 and buried surfaces in Palermo area
37. Relationships of elevations of Tazewell surface 215 and buried surfaces in Four-Mile Creek to Palermo area traverse
38. Cross section of traverse A, SW&, section 29, 219 T87W, R17W, Grundy County, Iowa
39. Elevations of top of deoxidized weathering zone in 222 Wisconsin loess in E^, SW&, section 29, T87N, R17W, Grundy County, Iowa
40. Distribution of total phosphorus, pH, calcium 226 carbonate equivalent, and weathering zones in Tama solum, Wisconsin loess, and Kansan till at site Pal-1
41. Distribution of soil mapping units in the SW&, 230 section 29, T87N, R17W, Grundy County, Iowa
42. Particle-size distribution in Tama, Muscatine, and 234 Garwin soils at sites Pal-1, Pal-2, and Pal-3, respectively
43. Organic carbon distribution in Tama, Muscatine, 234 and Garwin soils at sites Pal-1, Pal-2, and Pal-3, respectively
44. Distribution of cation-exchange capacity in Tama, 237 Muscatine, and Garwin soils at sites Pal-1, Pal-2, and Pal-3, respectively
viii
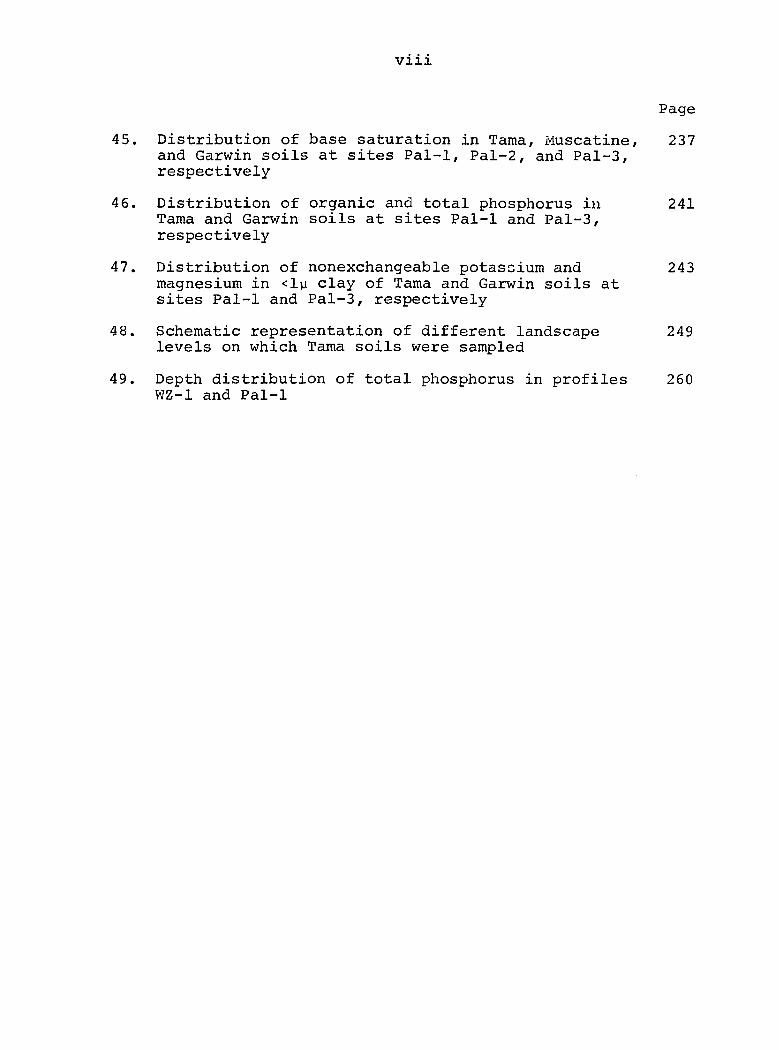
Page
45. Distribution of base saturation in Tama, Muscatine, 237 and Garwin soils at sites Pal-1, Pal-2, and Pal-3, respectively
46. Distribution of organic and total phosphorus in 241 Tama and Garwin soils at sites Pal-1 and Pal-3, respectively
47. Distribution of nonexchangeable potassium and 243 magnesium in <lp clay of Tama and Garwin soils at sites Pal-1 and Pal-3, respectively
48. Schematic representation of different landscape 249 levels on which Tama soils were sampled
49. Depth distribution of total phosphorus in profiles 260 WZ-1 and Pal-1
ix
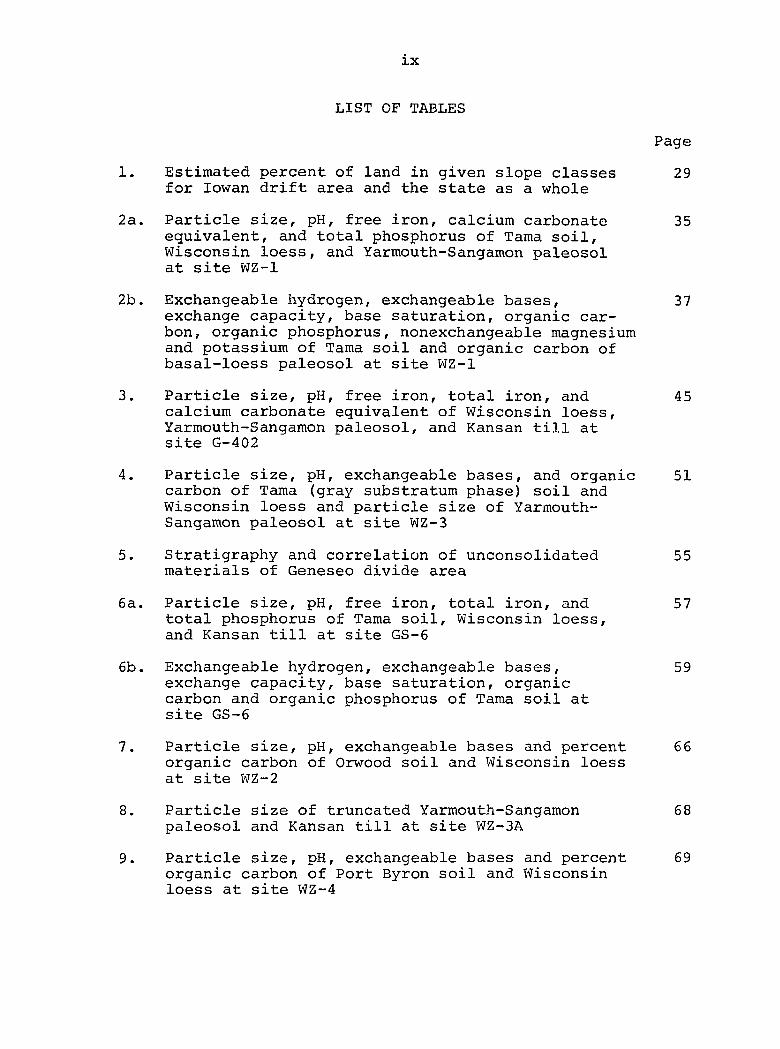
LIST OF TABLES
Page
1. Estimated percent of land in given slope classes 29 for lowan drift area and the state as a whole
2a. Particle size, pH, free iron, calcium carbonate 35 equivalent, and total phosphorus of Tama soil, Wisconsin loess, and Yarmouth-Sangamon paleosol at site WZ-1
2b. Exchangeable hydrogen, exchangeable bases, 37 exchange capacity, base saturation, organic carbon, organic phosphorus, nonexchangeable magnesium and potassium of Tama soil and organic carbon of basal-loess paleosol at site WZ-1
3. Particle size, pH, free iron, total iron, and 45 calcium carbonate equivalent of Wisconsin loess, Yarmouth-Sangamon paleosol, and Kansan till at site G-402
4. Particle size, pH, exchangeable bases, and organic 51 carbon of Tama (gray substratum phase) soil and Wisconsin loess and particle size of Yarmouth-Sangamon paleosol at site WZ-3
5. Stratigraphy and correlation of unconsolidated 55 materials of Geneseo divide area
6a. Particle size, pH, free iron, total iron, and 57 total phosphorus of Tama soil, Wisconsin loess, and Kansan till at site GS-6
6b. Exchangeable hydrogen, exchangeable bases, 59 exchange capacity, base saturation, organic carbon and organic phosphorus of Tama soil at site GS-6
7. Particle size, pH, exchangeable bases and percent 66 organic carbon of Orwood soil and Wisconsin loess at site WZ-2
8. Particle size of truncated Yarmouth-Sangamon 68 paleosol and Kansan till at site WZ-3A
9. Particle size, pH, exchangeable bases and percent 69 organic carbon of Port Byron soil and Wisconsin loess at site WZ-4
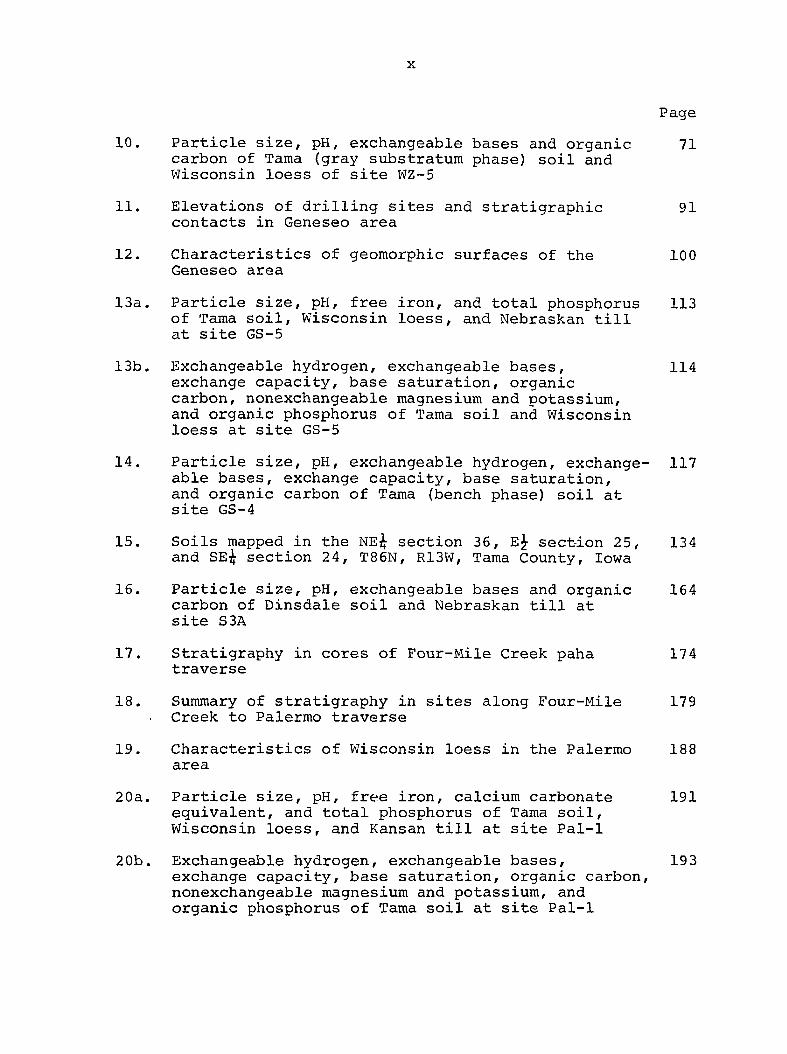
X
Page
10. Particle size, pH, exchangeable bases and organic 71 carbon of Tama (gray substratum phase) soil and Wisconsin loess of site WZ-5
11. Elevations of drilling sites and stratigraphie 91 contacts in Geneseo area
12. Characteristics of geomorphic surfaces of the 100 Geneseo area
13a. Particle size, pH, free iron, and total phosphorus 113 of Tama soil, Wisconsin loess, and Nebraskan till at site GS-5
13b. Exchangeable hydrogen, exchangeable bases, 114 exchange capacity, base saturation, organic carbon, nonexchangeable magnesium and potassium, and organic phosphorus of Tama soil and Wisconsin loess at site GS-5
14. Particle size, pH, exchangeable hydrogen, exchange- 117 able bases, exchange capacity, base saturation, and organic carbon of Tama (bench phase) soil at site GS-4
15. Soils mapped in the NE^ section 36, E^ sect-ion 25, 134 and SE^ section 24, T86N, R13W, Tama County, Iowa
16. Particle size, pH, exchangeable bases and organic 164 carbon of Dinsdale soil and Nebraskan till at site S3A
17. Stratigraphy in cores of Four-Mile Creek paha 174 traverse
18. Summary of stratigraphy in sites along Four-Mile 179 Creek to Palermo traverse
19. Characteristics of Wisconsin loess in the Palermo 188 area
20a. Particle size, pH, free iron, calcium carbonate 191 equivalent, and total phosphorus of Tama soil, Wisconsin loess, and Kansan till at site Pal-1
20b. Exchangeable hydrogen, exchangeable bases, 19 3 exchange capacity, base saturation, organic carbon, nonexchangeable magnesium and potassium, and organic phosphorus of Tama soil at site Pal-1
xi
Page
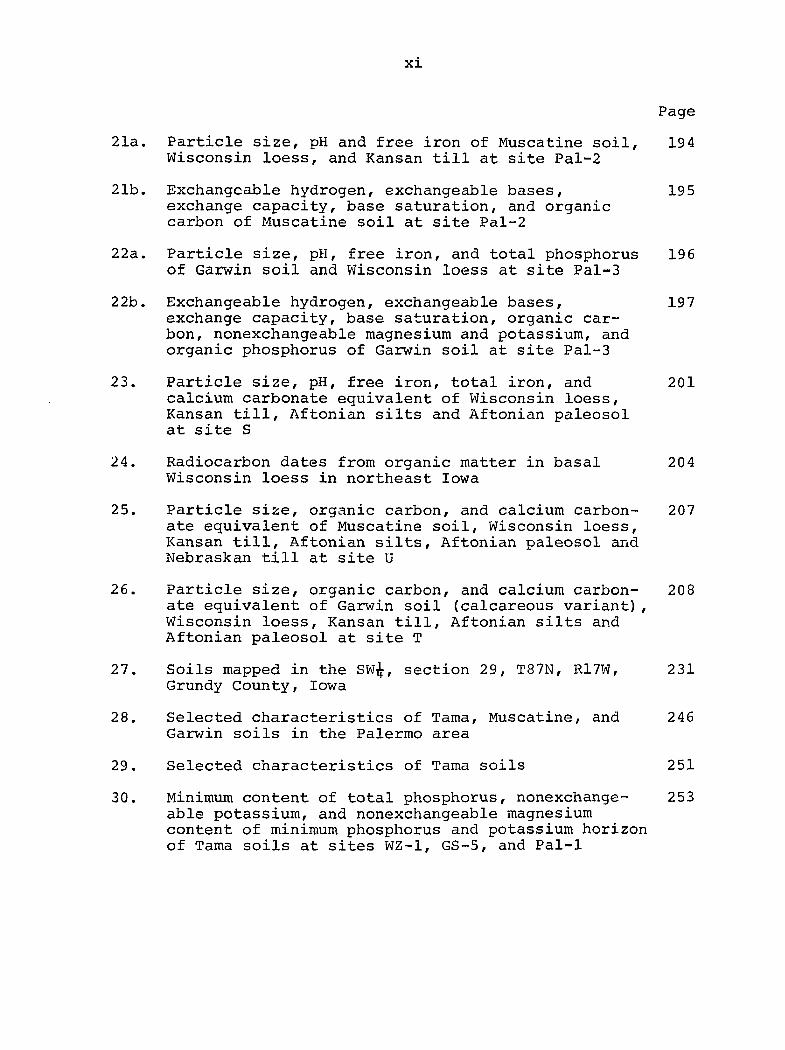
21a. Particle size, pH and free iron of Muscatine soil, 194 Wisconsin loess, and Kansan till at site Pal-2
21b. Exchangeable hydrogen, exchangeable bases, 195 exchange capacity, base saturation, and organic carbon of Muscatine soil at site Pal-2
22a. Particle size, pH, free iron, and total phosphorus 196 of Garwin soil and Wisconsin loess at site Pal-3
22b. Exchangeable hydrogen, exchangeable bases, 197 exchange capacity, base saturation, organic carbon, nonexchangeable magnesium and potassium, and organic phosphorus of Garwin soil at site Pal-3
23. Particle size, pH, free iron, total iron, and 201 calcium carbonate equivalent of Wisconsin loess, Kansan till, Aftonian silts and Aftonian paleosol at site S
24. Radiocarbon dates from organic matter in basal 204 Wisconsin loess in northeast Iowa
25. Particle size, organic carbon, and calcium carbon- 207 ate equivalent of Muscatine soil, Wisconsin loess, Kansan till, Aftonian silts, Aftonian paleosol and Nebraskan till at site U
26. Particle size, organic carbon, and calcium carbon- 208 ate equivalent of Garwin soil (calcareous variant), Wisconsin loess, Kansan till, Aftonian silts and Aftonian paleosol at site T
27. Soils mapped in the SWjL, section 29, T87N, R17W, 231 Grundy County, Iowa
28. Selected characteristics of Tama, Muscatine, and 246 Garwin soils in the Palermo area
29. Selected characteristics of Tama soils 251
30. Minimum content of total phosphorus, nonexchange- 253 able potassium, and nonexchangeable magnesium content of minimum phosphorus and potassium horizon of Tama soils at sites WZ-1, GS-5, and Pal-1
1
INTRODUCTION
The work reported in this thesis is a part of a research
project established in northeastern Iowa in 1961. The purpose
of this project was to study the evolution of the landscapes
and the relationships of the soils to these landscapes in the
southern portion of the lowan drift area (Figure 1). Research
areas were selected in four different areas of Tama and Grundy
Counties (Figure 2). This thesis is concerned with the
Geneseo, Four-Mile Creek, and Palermo areas. Work in the Salt
Creek area was reported by Hall (1965).
Objectives of the Study
Within the framework of the overall project described
above, the specific objectives of this thesis were:
(1) To study the landscape of selected areas within the
borders of the lowan drift area in northeastern
Iowa.
(2) To study the weathering zones of the loess.
(3) To study the properties of selected soils and relate
the genesis of these soils to the landscape.
(4) To better understand the relationships among land
scapes, weathering zones, and soils in the selected
study areas.
(5) To elucidate methods and principles that aid in more
rapid and efficient soils investigation and mapping.
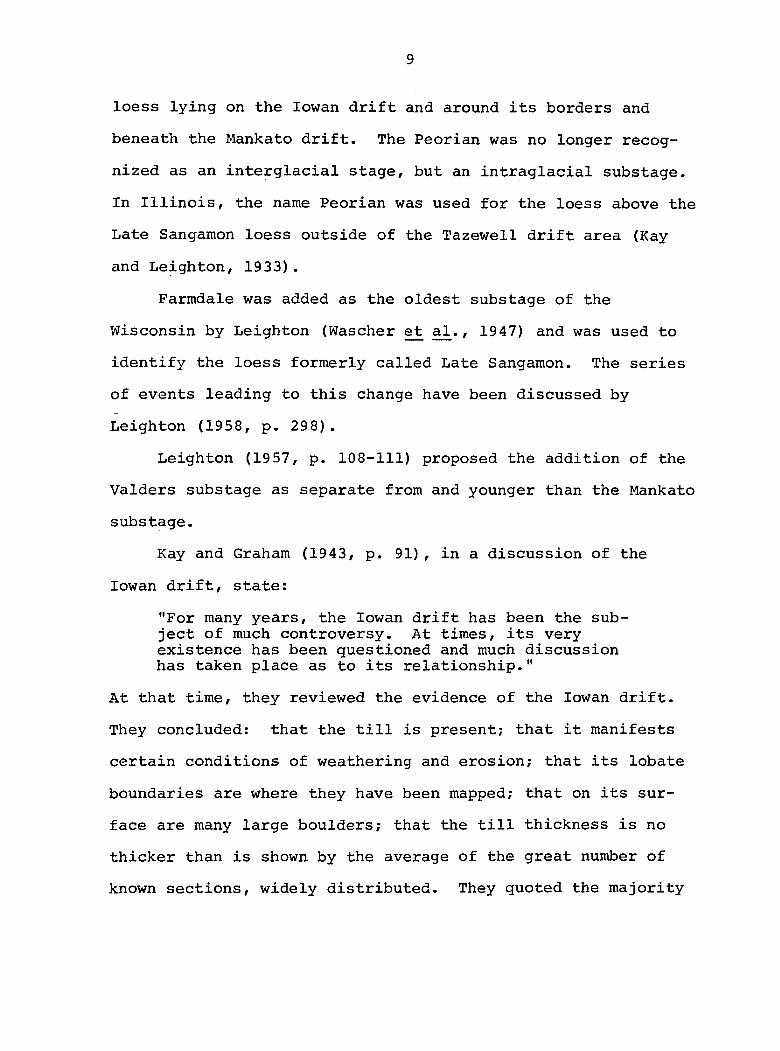
Figure 1. Distribution of lowan drift in northeastern Iowa (after Alden and Leighton, 1917)
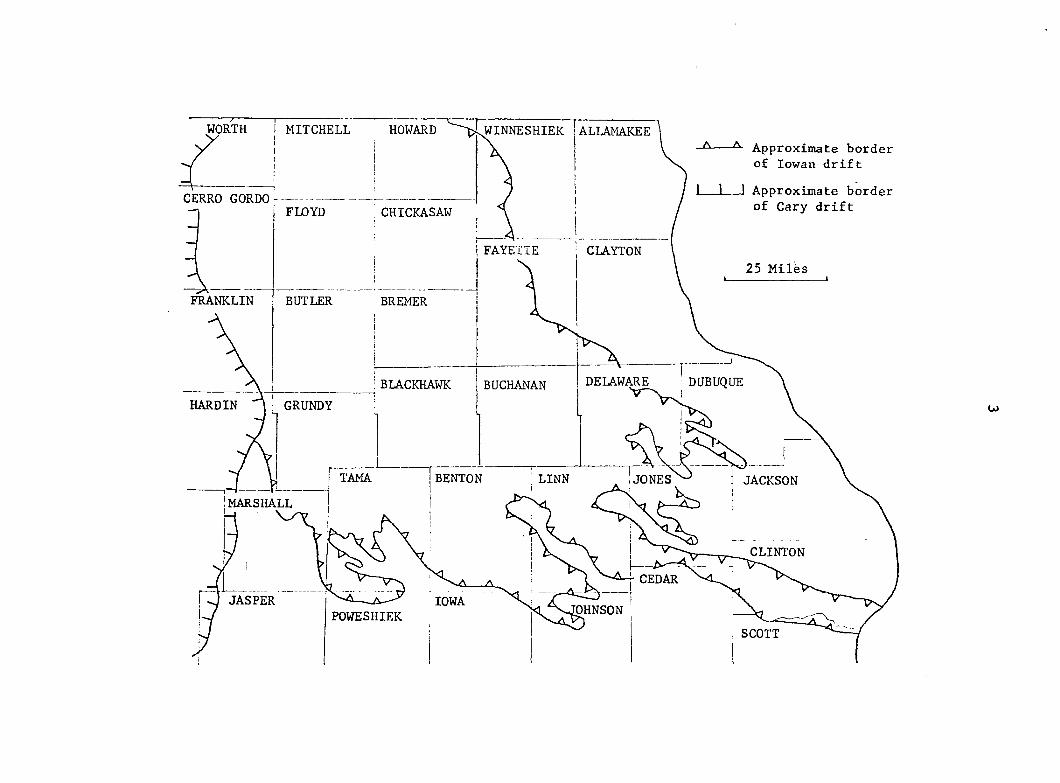
WORTH MITCHELL HOWARD WINNESHIEK ALLAMAKEE
— ^ ^ A p p r o x i m a t e b o r d e r of lowan drift
Approximate border
of Gary drift CERRO GORDO
FLOYD CHICKASAW
! FAYETTE CLAYTON
25 Milk
FRANKLIN BUTLER BREMER
DELAWARE DUBUQUE BIACKHAWK BUCHANAN
HARDIN : GRUNDY
, JONES TAMA BENTON LINN JACKSON
'MARSHALL
CLINTON
CEDAR
r J JASPER IOWA "OHNSON
POWESHIEK
SCOTT
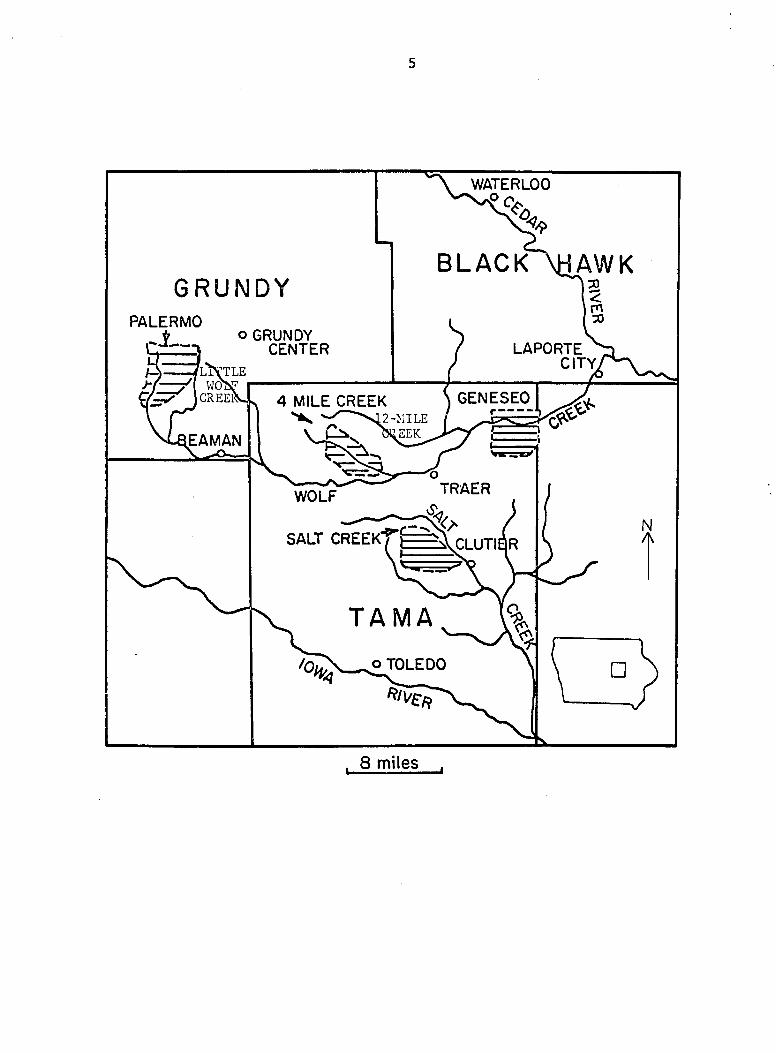
Figure 2. Location of research areas in northeastern Iowa
5
WATERLOO
BLACK \HAWK GRUNDY
PALERMO o GRUNDY
CENTER LAPORTE CITY
LIVTLE WOV CREElV GENESEO 4 MILE CREEK
EAMAN
TRAER WOLF
SALT CREEKT t
o TOLEDO
8 miles
6
Location and Description of Areas Studied
The areas studied are located in sections 29 and 32,
T87N, R17W (Palermo area) Grundy County, Iowa; and sections
24, 25, and 36, T86N, R13W (Geneseo area) Tama County, Iowa
(Figure 2). A cross-county traverse connecting an area of
Kansan till (Four-Mile Creek area, section 28, T86N, R15W,
Tama County, Iowa) to the Palermo area was also a part of this
study. The above areas are drained by Wolf Creek, or in the
case of the Four-Mile Creek area, by a tributary of Wolf
Creek.
The Palermo area is located near the head of Wolf Creek,
and is characterized by a loess mantled landscape of slight
relief and closed depressions. It is within the Tama-
Muscatine soil association area. The landscape of the Geneseo
area is characterized by a series of stepped levels, the
highest of which is a paha and forms the southern boundary of
the area. Materials in this area include loess, till, and
alluvium. The Geneseo area is included in the Dinsdale-Tama
soil association area.

7
BACKGROUND
The background discussion includes a suitmiary of the
Pleistocene geology of Iowa. Pleistocene deposits of Tama and
Grundy Counties located in northeast Iowa are dominantly loess
and glacial till. Soil scientists are interested in these
deposits because they are the major soil parent materials in
these areas. Knowledge of the sequences and variations in the
characteristics of the Pleistocene deposits is, therefore, an
aid in predicting and understanding the properties of soils
that develop from these deposits. An understanding of the
Pleistocene deposits also aids in evaluating the time factor
of soil formation. Maximum time since deposition of the later
Pleistocene deposits, many of which have soil profiles in
their upper part, may be obtained using stratigraphie control
of the deposits and radiocarbon dating.
Geomorphic surfaces and weathering zones are discussed
because they are useful in interpreting landscape modifica
tions and environmental changes that have occurred in the
geologic past. Also they have been shown to be valuable aids
in better understanding soil-landscape relationships. Infor
mation concerning geomorphic surfaces and weathering zones is
not available for northeast Iowa specifically, but general
principles have been established through detailed studies in
other areas of Iowa.
The present study is concerned primarily with the
8
characteristics and landscape relationships of the moderately
well and well drained loess derived soils of Tama and Grundy
Counties. Therefore, a summary of the information available
for this group of soils is included as background information.
Pleistocene Geology
Kay and Apfel (1929, p. 9) listed the five glacial stages
recognized at that time from oldest to youngest as the
Nebraskan, the Kansan, the Illinoian, the' lowan, and the
Wisconsin. The interglacial stages were the Aftonian, which
separated the Nebraskan and Kansan; the Yarmouth, which separ
ated the Kansan and Illinoian; the Sangamon, which separated
the Illinoian and lowan; and the Peorian, which separated the
lowan and Wisconsin stages. Leighton (1933) and Kay and
Leighton (1933) published papers in which they revised the
previous classification of the glacial stages. The lowan was
recognized as a substage of the Wisconsin rather than a separ
ate stage of glaciation. Substages of the Wisconsin were from
youngest to oldest:
Mankato (Late Wisconsin) Gary (Middle Wisconsin) Tazewell (Early Wisconsin) lowan
Kay and Graham (1943, p. 9) recognized only the lowan and
Mankato substages of the Wisconsin in Iowa. The lowan drift
and Mankato drift were separated by the Peorian loess, which
was thought to be closely related in age to the lowan. At
that time the term Peorian was used in Iowa for the widespread
9
loess lying on the lowan drift and around its borders and
beneath the Mankato drift. The Peorian was no longer recog
nized as an interglacial stage, but an intraglacial substage.
In Illinois, the name Peorian was used for the loess above the
Late Sangamon loess outside of the Tazewell drift area (Kay
and Leighton, 1933).
Farmdale was added as the oldest substage of the
Wisconsin by Leighton (Wascher et a]^., 1947) and was used to
identify the loess formerly called Late Sangamon. The series
of events leading to this change have been discussed by
Leighton (1958, p. 298).
Leighton (1957, p. 108-111) proposed the addition of the
Valders substage as separate from and younger than the Mankato
substage.
Kay and Graham (1943, p. 91), in a discussion of the
lowan drift, state:
"For many years, the lowan drift has been the subject of much controversy. At times, its very existence has been questioned and much discussion has taken place as to its relationship."
At that time, they reviewed the evidence of the lowan drift.
They concluded; that the till is present; that it manifests
certain conditions of weathering and erosion; that its lobate
boundaries are where they have been mapped; that on its sur
face are many large boulders; that the till thickness is no
thicker than is shown by the average of the great number of
known sections, widely distributed. They quoted the majority
10
of lowan till exposures as ranging from 1 to 7 or 8 feet and
the average thickness of the till probably did not exceed 10
feet.
Unanswered, but recognized as problems, were the extreme
thinness of the till of a glacier as extensive as the lowan,
the digitate form of the southeast margin of the drift (Figure
1), and the Kansan islands within the till borders.
Radiocarbon dates obtained by Ruhe and Scholtes (1959),
and Ruhe et a2. (1957) from wood taken from till identified
as lowan by many previous workers raised doubt as to the
relative positions of the lowan and Farmdale substages. The
wood dates range from >29,000 to >37,000 years before present.
On this basis, they considered the lowan as the earliest sub-
stage of the Wisconsin, being older than Farmdale, which in
its type area is 22,900 ± 900 to 26,100 ± 600 (Frye and
Willman, 1960, p. 2-3). More recently, Frye et aJL. (1962,
p. 2) extended the dates of the Farmdale substage to the
period of 22,000 to 28,000 years before present.
Shaffer (1954) extended the Green River lobe of Tazewell
ice west of the Mississippi River to the eastern border of the
Goose Lake channel in Clinton County, Iowa. He extended it
northwestward to within 1-1/2 miles of the village of Goose
Lake, across an area previously mapped as lowan and Kansan
drift.
In the same study, he suggested that the Tazewell terrace
on the lower Iowa River might be contemporaneous with the
11
upstream high terrace of Lake Calvin, which raised the ques
tion of possible contemporaneity of the Tazewell and the lowan.
Kay (1931) published a paper concerning the pebble band
on the lowan till in which he discussed the relationships of
the loess and till. The following are observations he made.
Where the pebble band is not present, the loess lies directly
on the till. Where no loess is present on the till, the till
in upland sections is leached to a depth of approximately five
feet. Where loess is on the pebble band or on till and is of
sufficient thickness to be unleached in its lower part, the
underlying lowan till is unleached to its surface. Where the
loess is thin and leached, the upper part of the till is
leached also, whether the pebble band is or is not present.
The combined leaching of the loess and till is about the same
in depth as where no loess overlies the till. The loess of
Wisconsin Age in Iowa was referred to as Peorian by Kay and
Graham (1943, p. 157).
A loess overlying the Sangamon weathered zone and differ
ing from the overlying loess was first recognized by Leighton
(1926), who applied the time term "Late Sangamon loess". It
was originally thought to be Late Sangamon in age because it
had an organic zone at the top, it was ncncalcareous wherever
thin, and it laid below the calcareous Wisconsin loess. The
loess formerly referred to as "Late Sangamon" was changed to
Farmdale in 1947 (Wascher et al., 1947). This change resulted
from a series of events which have been discussed by Leighton
12
(1958, p. 298-299). It was recognized (Leighton, 1958, p. 299)
that the sediment of the Farmdale substage is comprised of
several materials besides loess such as colluvial wash, muck,
aqueous silt, wood, and peat.
Wascher et (1947) reported that Farmdale loess extends
from Owensboro, Kentucky down to and beyond Natchez,
Mississippi. Ruhe (1954) reported this loess in Iowa and its
relation to the Missouri River Valley. A radiocarbon date
(W-141) from Pottawattomie County, Iowa was reported as 24,500
i 800 years before present. Dates reported in Illinois near
the classic Farm Creek section of Leighton from the uppermost
one foot of peat overlying Farmdale silt were 22,900 ± 900 and
3 to 4 feet deep 25,100 * 800 (Leighton, 1960).
Flint (1955) dropped the term "Peorian" and used terms of
associated drifts to identify the different loess deposits.
At present, the loess of Iowa that is Farmdale and younger is
designated as Wisconsin loess (Ruhe, 1954). The basal part of
the Wisconsin loess of Iowa is Farmdale in age (Ruhe et aJL.,
19 57). Since the Wisconsin loess passes under the Des Moines
lobe of Gary Age, whose base dates about 14,000 years before
present, the loess is pre-Cary in age in its uppermost part,
Farmdale in age in the lowermost part, thus Farmdale-Tazewell
in age (or approximately 25,000 to 14,000 years before pres
ent) .
A striking characteristic of the lowan drift area of
northeast Iowa is the paha. Paha have long been recognized by
13
Pleistocene geologists. As described by McGee (1890, p. 397),
they were:
"...loess capped eminences, sometimes elongated to ridges miles in length, sometimes shortened to elliptical hills."
This term was used by McGee to describe the isolated loess-
capped knobs and ridges within and on the borders of the lowan
drift.
A typical paha according to McGee consisted of the
following:
1) loess 2) loose sand 3) drift 4) indurated rock
Later, separate studies by Shimek (1908) and Scholtes (1955)
reported that the loose sand may be absent and the indurated
rock may not be discernible.
Scholtes (1955) modified the original ideas of McGee. He
defined paha as Wisconsin loess-capped prominences with pre-
lowan nuclei, oriented in a west-east to a northwest-southeast
direction, occurring either within the lowan drift plain or
along its borders, and partially or completely surrounded by
lowan till. He postulated that the paha originated because of
the existence of pre-Iowan prominences, usually of Kansan till,
which the lowan glacier did not override.
Scholtes (1955) applied the term Wisconsin to the loess
of the paha because no stratigraphie divisions were found in
the loess. It was recognized that the paha may contain loess
14
increments deposited during all of the Wisconsin Age, but it
was thought to consist primarily of lowan loess.
Scholtes (1955) also studied the soils of the paha. In
part, he concluded that the parent material of the soils on
the paha is poorly sorted loess, of which a portion may have
been deposited by the wind as sand and sand-sized aggregates
of silt and clay. He also reported considerable physical
differences between soils of the paha and soils developed from
blanket loess. The soils of the paha exhibited the same
general trends of increasing volume weight, decreasing aera
tion and total porosity, and decreasing permeability with
depth as do the soils from blanket loess. However, they
exhibited these tendencies in an irregular manner. Available
phosphorus and potassium were similar to the adjacent glacial
soils, but lower than the loess soils south of the lowan
glacial drift plain.
The soil forming factor, which was thought to be respon
sible for most of the differences between soils on the paha
and those adjacent to the paha, was parent material, with
vegetation secondary.
Geomorphic Surfaces and Weathering Zones
Elements of the soil landscape, their origin, evolution,
and relationship have been discussed in detail (Ruhe, 1956,
1959, 1960) .
Ruhe (1956) studied a landscape that is characteristic of
15
much of the southern half of Iowa. Slopes along axes of
interfluves were broken at two or three places by distinct
changes in gradient. Each interfluve had a sequence of
stepped levels that rose from the valley shoulders to the
upland divide. The sequence of levels was attributed to
multicyclic erosion of a glacial-till landscape.
The high level, mantled by Wisconsin loess, was con
trolled by a surface characterized by deep, highly weathered
paleosols unchanged by erosion since Kansan time. A paleosol
was defined as a "fossil" soil that formed on a landscape
during the geologic past. The low level of the landscape, cut
into the Kansan till below the level of the surfaces charac
terized by having paleosols, was lacking paleosols. It was
concluded that loess deposition closely followed the cutting
of the erosion surface; thus, sufficient time was not avail
able for soil development in the uppermost part of the till
prior to mantling of the surface by lowan-Tazewell loess.
Through these relationships, the age of the surface was iden
tified with soils or soil associations related to each
geomorphic surface.
The lower horizons of one of the paleosols on the higher
surface described by Ruhe (1956) is the "gumbotil" as identi
fied by Kay and Apfel (1929, p. 235). In earlier studies,
(Kay, 1916a), the concept had been developed that the gumbotil
of the flat tabular divide was the product of a very long
weathering period of the underlying glacial till. However,
16
Kay did not recognize gumbotil as a buried soil. Kay reported
successive changes in the degree of weathering with increasing
depth. He was able to identify these differences which made
up the profile of weathering. The gumbotil, with a soil layer
in places at the top, was underlain successively by the oxi
dized and leached zone, the oxidized and unleached zone, and
the unoxidized and unleached zone. Later, numbers were
applied to these zones (Leighton and MacClintock, 1930).
The weathering zones identified by Ruhe (1954) in the
lowan-Tazewell loess of southwestern Iowa were, from the sur
face downward: oxidized and leached zone, deoxidized and
unleached zone, oxidized and unleached zone, and the deoxi
dized and leached zone. The deoxidized and leached zone was
underlain by a weakly developed (AC) soil profile thought to
represent a Farmdale paleosol.
Regional distribution of weathering zones in the lowan-
Tazewell loess of southwestern Iowa was discussed by Ruhe,
Prill, and Riecken (1955). The generalized sequence of
weathering zones present was: oxidized and leached, deoxi
dized and unleached, oxidized and unleached, and deoxidized
and leached. They concluded the deoxidized zones were relict
features of a pre-existing water table and zone of saturation,
and were not related to the present environment. Postulated
possible causes of the water table and zone of saturation were
general conditions of poorer drainage and/or two paleo-climatic
changes toward greater precipitation.
17
Ruhe and Scholtes (1956) found the upper deoxidized zone
of the lowan-Tazewell loess to be independent of the faunal
zonation. Because the deoxidized zone crosses stratigraphie
horizons of the lowan and Tazewell loess, the zone must be
representative of weathering conditions in the loess subse
quent to deposition. They placed the age of the upper
deoxidized zone as post-Tazewell or later Wisconsin.
Daniels (1957) concluded that the outcrops of the loess
weathering zones, the distribution of the soils, and the
geomorphic surfaces were closely related. The percent base
saturation, particle-size distribution, and free iron content
of the soils studied were found to be related to the age of
the surface and the chemical properties of the loess zones
from which the profiles had developed. The dominant factor in
soil development in the area studied was the inherent proper
ties of the lowan-Tazewell loess.
Ruhe (1956, p. 446) discussed the problems involved in
laboratory study of the paleosols. The calcareous loess
deposited over the soil in the geologic past was subsequently
leached. The downward percolating solution enriched the
buried soil with calcium, magnesium, and iron, so that
standard soil-chemistry determinations have little value in
characterization.
Soils
The present study is concerned primarily with the
18
characteristics of the moderately well to well drained loess
derived Brunizem soils of Tama and Grundy Counties, Iowa.
These soils, presently classified in the Tama series, have not
always been so classified. The purpose of the following dis
cussion is to summarize the changes and information concerning
these soils.
In the early history of soil classification, the United
States was physiographically divided into soil provinces
(Whitney, 1909, p. 83). Iowa and most of the Midwest was
included in the glacial and loessial regions within which only
two major upland soil series were recognized. All the dark-
colored upland glacial and loessial soils were included in the
Marshall series. The other major upland series recognized was
the Miami, which included mainly the soils of forested areas.
A comparison of two soil survey reports of Tama County,
Iowa, one published in 1905 (Ely ̂ ̂., 1905), the other in
1950 (Aandahl and Simonson, 1950), emphasizes the changes that
have occurred in soil classification during this period. In
the 1905 report, only 5 soil types, representing 3 different
soil series were recognized. These series were the Marshall,
Miami, and Kaskaskia. The latter series included the soils of
the bottoms and the other two series included all the upland
units, used as discussed above. In the 1950 report thirty
different soil types, representing 20 different soil series,
including the Tama series, were recognized.
Thus, in the early classification of soils, the present
19
Tama series was included in the Marshall series. Later, the
Marshall series was restricted to soils formed from loess and
eventually, as a result of continued bifurcation of the
classification system, this series was no longer recognized in
northeast Iowa. Many of the soils previously included in this
series were then classified as members of the Tama series.
The Tama series was first named and described in the
U.S.D.A. publication "Soil Survey of Black Hawk County, Iowa"
(Tharp and Harper, 1919). The surface of Tama silt loam was
described as a friable silt loam, black when wet and dark
brown or dark grayish brown when dry. Material was usually no
coarser than very fine sand and was composed predominantly of
silt size particles. There was little change in color or
texture to a depth of 10 or 15 inches, except below the plow
line where the clay percentage increased slightly. A color
change to pronounced brown or light brown occurred below 18 or
20 inches, and the material was usually a silty clay loam,
quite plastic when moist and crumbly when dry. Depth of the
dark colored horizon was attributed to the accumulation of
organic matter under a prairie vegetation. An abrupt change
to a coarse gritty yellowish brown material ranging from
sandy loam to clay loam occurred at an average depth of about
35 inches. The material above this depth was referred to as
loess. An acid reaction was described to a depth of 5 or 6
feet, and the material was calcareous below this depth. This
material was considered to have excellent moisture conditions
20
and relatively deep aeration. At present, a soil with these
characteristics would be included in the range of the Dinsdale
series.
Tama silt loam was listed as the predominant upland type
throughout the southwestern half of Black Hawk County. The
topography, in general, is undulating or gently rolling. A
second phase, Tama silt loam, rolling phase, was also recog
nized. The topography associated with this phase varies from
strongly rolling to hilly and occasionally hilly. Stevenson
et a2. (1920) listed Tama silt loam as the most extensive soil
type in this county.
The soil survey report of Benton County, Iowa (Lounsbury
et al., 1925, p. 1233-1234), describes a Tama silt loam
similar to the original one in Black Hawk County, but does not
describe the sandy loam to clay loam texture as in the
original Tama. A shallow phase of this series was also recog
nized. It resembled typical Tama in the surface but had
limestone bedrock at 28 to 30 inches. A shallow phase of Tama
was recognized in the soil survey report of Butler County
(Elwell and Poulson, 1928, p. 29), but this phase referred to
depth of surface rather than depth to different material. The
soil survey report of Jones County, Iowa (O'Neal and Devereux,
1928, p. 23) described a typical Tama silt loam to a depth of
30 to 36 inches. The next lower layer or substratum did not
differ greatly from the one above. The color was described as
yellow or grayish yellow and the texture as heavy silt loam.
21
This layer was identified as a silty material or loess, little
modified by weathering. Iron stains, concretions, and gray
mottles were common below a depth of four feet.
The description of Carrington silt loam was similar to
the Tama described above, except it was underlain at a depth
of 36 inches by brown or yellowish brown granular clay loam
material. Apparently the original Tama silt loam (Tharp and
Harper, 1919) was now included in this soil type.
The Tama series, as described by Brown (1936), had been
subdivided into 4 types and 3 phases in contrast to the single
phase variant reported by Stevenson et (1920) . Riecken
and Smith (1949) described the Tama soils as having developed
under grass vegetation on the loess-covered slopes and rounded
ridges of about 2 to 15 percent gradient. Surface color was
described as dark brown and the moderately permeable subsoil
was yellowish-brown. Tama was listed in two different soil
association areas, the Tama-Muscatine in east-central Iowa and
the Tama-Down in northeast Iowa.
The "normal phase" of Tama silt loam (Aandahl and
Simonson, 1950) was described as formed from loess under grass
vegetation in undulating uplands. Slope range was listed as 3
to 8 percent. Main variations noted were in thickness of the
surface soil and depth to glacial drift. The depth to glacial
drift ranged from 48 to 72 inches, but could be only 24 inches,
or as much as 100 to 250 inches.
Smith et al. (1950) discussed the Tama series in detail
22
using it as a "modal" or ideal Prairie soil. The topography
of this loess-derived soil was described as gently undulating
to rolling. Native vegetation was tall grass prairie (chiefly
Andropogan furcatus). Average annual rainfall was about 34
inches of which 24 inches came during the warm season.
Average monthly temperatures ranged from about 18°F. in
January to 74°F. in July with a frost free period of about 160
days.
White (1953) included two profiles of Tama silty clay
loam in his study of soil biosequences.
Arnold (1963) made a detailed study of two Tama profiles,
one from eastern Iowa and the other from east central Iowa.
The soil from eastern Iowa was not considered to be a typical
Brunizem or a modal Tama soil because it contained an extra
morphological feature, an argillic horizon with grainy gray
ped coats between the overlying mollic epipedon-cambic horizon
sequence and the underlying C horizon. The soil was thought
to be polygenetic. Arnold postulated that a Gray-Brown
Podzolic soil was formed under deciduous forest having silans
developed in the upper part of the illuvial clay horizon and
subsequently was buried under additional increments of loess.
Grasses then become the dominant vegetation and a cumulic
regosolic Brunizem soil developed into the present Brunizem
soil with a relict eluvial-illuvial horizon sequence of a
Gray-Brown Podzolic soil that has been modified by subsequent
development of the overlying Brunizem.
23
The Tama profile from east central Iowa was considered to
be a near modal Tama. However, it did have a few weakly
expressed silans in its lower subsoil. It may also have been
polygenetic, but based on the soil morphology of the profile
no inference could be made that there has been any influence
other than that of prairie vegetation.
Oschwald et al. (1965) included Tama as one of the
dominant soils in two different soil association areas in
Iowa, the Tama-Muscatine and the Dinsdale-Tama. Tama soils
were described as well drained soils developed from moderately
thick loess primarily under prairie vegetation. Slopes of 2
to 5 percent were listed as most extensive but ranged from 1
to 20 percent. The surface layer was described as a very dark
brown silty clay loam, 9 to 16 inches thick unless eroded.
The subsoil was described as a moderately permeable dark brown
silty clay loam and the substratum was leached loess, silt
loam in texture.
Physical and chemical properties of the Tama series have
been reported by Smith et al. (1950). Wells (1963) and Protz
(1965) included samples of the B horizon of Tama soils in
their regional studies of potassium and magnesium content of
loess-derived prairie soils.
24
METHODS AND PROCEDURES
Field Investigation
The field investigation consisted of geologic and soils
investigations. Deep borings were made with a Concore drill
rig and/or a Belgian auger. Elevations of sites from which
samples were collected were obtained using bench level cir
cuits all established with reference to benchmarks of the
U.S. Coast and Geodetic Survey. The accuracy obtained was
plus or minus 6 inches. Sample sites were located on aerial
photographs using triangulation methods or taped distance from
a readily discernible reference point. Other sites, described
but not sampled, were located in some cases by the above
method but many were located by visual inspection of the
aerial photograph.
Geomorphic surfaces were delineated on 8-inch to the mile
aerial photographs. A contour map of a selected area in the
Palermo area was constructed.
The soils were mapped on 8-inch to the mile photographs.
Selected profiles were sampled using a hydraulic probe. The
cores collected were placed in core boxes for storage prior to
sample preparation.
Laboratory Procedures
The samples selected for laboratory study were air dried,
crushed to pass a two-millimeter sieve, and stored in one-pint
ice cream cartons.
25
Particle-size analysis
The pipette method (Kilmer and Alexander, 1949) was used
for particle-size analysis. Sodium hexametaphosphate (Tyner,
1939) was used to disperse the soil sample. Hydrogen peroxide
was used to destroy organic matter. Sedimentation times were
taken from the nomograph by Tanner and Jackson (1947) . The
31-62 micron fraction was calculated by subtracting the sum of
the other fractions from 100 percent. Wet sieving was used to
determine the fraction larger than 62 microns.
Organic carbon
Organic carbon was determined using a modification of the
Walkley method as outlined by the U.S. Salinity Laboratory
Staff (1954) . Barium diphenylamine sulfonic acid was used as
the indicator rather than ortho-phenanthroline ferrous sulfate.
Soil reaction
The pH was determined with a combination glass and refer
ence electrode on a Beckman Model 180 battery-operated pocket
pH meter. A 1:1 soil-water mixture was stirred, allowed to
stand for 30 minutes, restirred, and the pH read.
Calcium carbonate equivalent
Calcium carbonate equivalent was determined using the
gravimetric method outlined by the U.S. Salinity Laboratory
Staff (1954).
26
Exchangeable cations
Exchangeable bases were extracted from four-gram samples
according to the method outlined by Jackson (1958). Total
exchangeable bases were determined according to the procedure
outlined by Black (1961) except the indicator used was a 1-1
mixture of methyl red and methylene blue.
Exchangeable hydrogen was extracted using the method out
lined by Black (1961) except neutral, normal barium acetate
was used in place of calcium acetate. The acidity formed was
titrated with sodium hydroxide using phenolphthlein as the
indicator.
Free iron
The free iron was extracted using the sodium dithionite-
sodium citrate extraction procedure as outlined by the Lincoln
Soil Survey Laboratory.^ The iron in solution was determined
colorimetrically using a Bausch and Lomb Spectronic 20 colori
meter.
Total iron
Total iron was determined using a General Electric XRD-6
Spectrometer. The chromium tube was operated at 40 milliamps
and 75 kilovolts. A lithium fluoride crystal was used.
^Lincoln Soil Survey Laboratory, Lincoln, Nebraska. Information on laboratory procedure. Private communication. 1965.
27
Total magnesium and potassium of the <ly clay fraction
The procedure outlined by Protz (19 65) was followed in
the separation and digestion of the <lp fraction. The
magnesium concentration was determined using a Perkin-Elmer
Model 214 Atomic Absorption Spectrophotometer. The potassium
concentration was determined using a Coleman Model 21 Flame
Photometer.
Total phosphorus
One gram of soil, ground to pass a 60 mesh sieve, was
fused with 5 grams of Na2C03 in a platinum crucible. The
sample was placed in a muffle furnace and fused at a tempera
ture of 950® C. for 30 minutes. The fused melt was dissolved
in distilled water, filtered and made up to 100 ml. An
aliquot of this solution was used to determine the phosphorus
in solution by a vanadomolybdophosphoric yellow color method
of Kitson and Mellon as described by Jackson (1958, p. 151-
154) using a Bausch and Lomb Spectronic 20.
Organic phosphorus
The organic phosphorus was determined by the ignition
method as described by Legg and Black (1955). The phosphorus
in solution was determined using a Bausch and Lomb Spectronic
20 with a 660 micron filter.
28
INVESTIGATIONS IN GENESEO AREA
Kay and Graham (1943, p. 100) included the part of Tama
County in which the Geneseo study area is located within the
boundaries of the lowan drift area (Figure 1). The general
location of the Geneseo study area is shown in Figure 2. More
specifically, this area includes parts of sections 24, 25, and
36, T86N, R13W, Tama County, Iowa.
Alden and Leighton (1917) described the lowan drift plain
as a drift-mantled erosional topography. They attributed lack
of accordance in the lowan area to unequal mantling of a rela
tively fresh drift on Kansan gumbotil. The topography of the
lowan drift area is slightly rolling with long gentle slopes.
Arnold et al. (1960) estimated slope classes for all counties
in Iowa. The estimates were based on a statistical sample
representing approximately a 2 percent sample. From their
data, 8 counties located within the boundaries of the lowan
drift were selected to characterize the slope gradient classes
within the lowan area. The areas for each slope class for
these counties were totaled and averaged. These values,
together with the averages for the state as given by Arnold
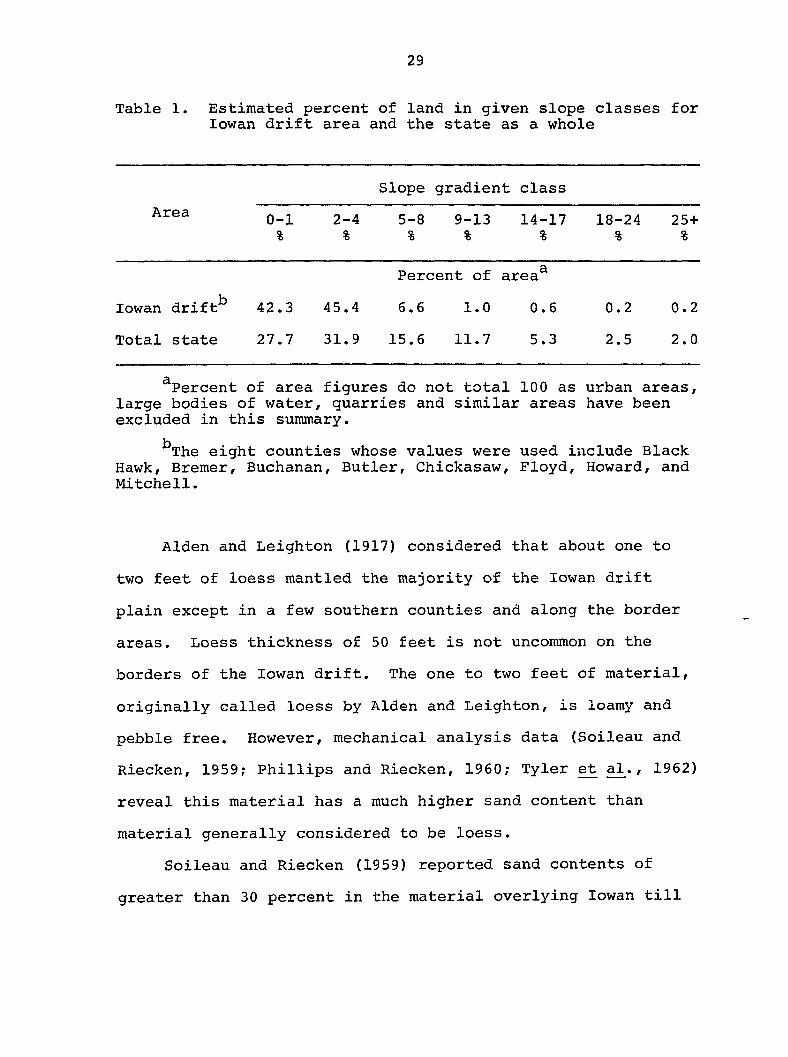
et al., are listed in Table 1.
Within the lowan drift area, 87.7 percent of the total
land area has slopes of less than 5 percent. For the state as
a whole, only 59.6 percent of the land area has slopes of less
than 5 percent.
29
Table 1. Estimated percent of land in given slope classes for lowan drift area and the state as a whole
Slope gradient class
Area 0-1 2-4 5-8 9-13 14-17 18-24 25+ % % % % % % %
Percent of area^
lowan drift^ 42.3 45.4 6.6 1.0 0.6 0.2 0.2
Total state 27.7 31.9 15.6 11.7 5.3 2.5 2.0
^Percent of area figures do not total 100 as urban areas, large bodies of water, quarries and similar areas have been excluded in this summary.
^The eight counties whose values were used include Black Hawk, Bremer, Buchanan, Butler, Chickasaw, Floyd, Howard, and Mitchell.
Alden and Leighton (1917) considered that about one to
two feet of loess mantled the majority of the lowan drift
plain except in a few southern counties and along the border
areas. Loess thickness of 50 feet is not uncommon on the
borders of the lowan drift. The one to two feet of material,
originally called loess by Alden and Leighton, is loamy and
pebble free. However, mechanical analysis data (Soileau and
Riecken, 1959; Phillips and Riecken, 1960; Tyler et a^., 1962)
reveal this material has a much higher sand content than
material generally considered to be loess.
Soileau and Riecken (1959) reported sand contents of
greater than 30 percent in the material overlying lowan till
30
in Bremer County. Phillips and Riecken (1960) described the
parent material of the Floyd and Tripoli soils as a two-story
material consisting of a thin layer of sandy-silt material,
19 to 32 inches thick, overlying lowan till. Sand content of
the sandy-silt material ranged from 20 to 40 percent. Tyler
et al. (1962) reported sand contents ranging from 20 to 35
percent in the material overlying lowan till in Howard County.
They noted the upper story material has been called loess, but
pointed out that it also has some characteristics of material
designated as pedisediment in the Kansan till landscape of
southwestern Iowa (Ruhe, 1956).
Local thick accumulations of loess within the lowan area
have long been recognized (McGee, 1890). Loess deposits
within the lowan area were also recognized in early soil
reports of Iowa. Loess derived soils were shown on soil maps
and described in county soil reports. Examples of a few
selected reports, all authored by Stevenson and Brown, include
Bremer (1917), Benton (1927), Grundy (1927), Jones (1929), and
Butler (1933). Scholtes (1955, p. 172) located many local
accumulations of thick loess within and on the borders of the
lowan drift.
Paha "was the term McGee used to describe the isolated
loess-capped knobs and ridges within and on the borders of the
lowan drift area. More recently Scholtes (1955) defined paha
as Wisconsin loess-capped prominences with pre-Iowan nuclei
oriented in a west-east to a northwest-southeast direction
31
occurring either within the lowan drift plain or along its
border and partially or completely surrounded by lowan till.
He postulated that the paha originated because of the exist
ence of pre-Iowan prominences usually of Kansan till which the
lowan glacier did not override.
Relationships of the geologic deposits in the present
study were determined in the following way. A stable topo
graphic high on the landscape was chosen as a starting point.
A deep hole was bored and characteristics of, and changes in,
the materials were recorded. Elevations of the site and of
the change in material were also recorded. The deposits were
traced laterally to lower levels of the landscape by boring a
series of holes. Correlation and interpretation of each site
was related back to all previous sites.
A paha conforming to the classic definition of McGee
(1890) forms the divide on the southern boundary of the
Geneseo study area (Figure 3). This paha will hereafter be
referred to as the Hayward paha. The general location of this
paha and of the sites for this area are shown in Figure 3.
Detailed descriptions and exact locations _of these sites are
given in Appendix A.
Stratigraphy
Stratigraphie sequence of Geneseo divide area
Loess Loess thickness of the Geneseo divide area was
determined at site WZ-1 (Figure 3) located on the summit of
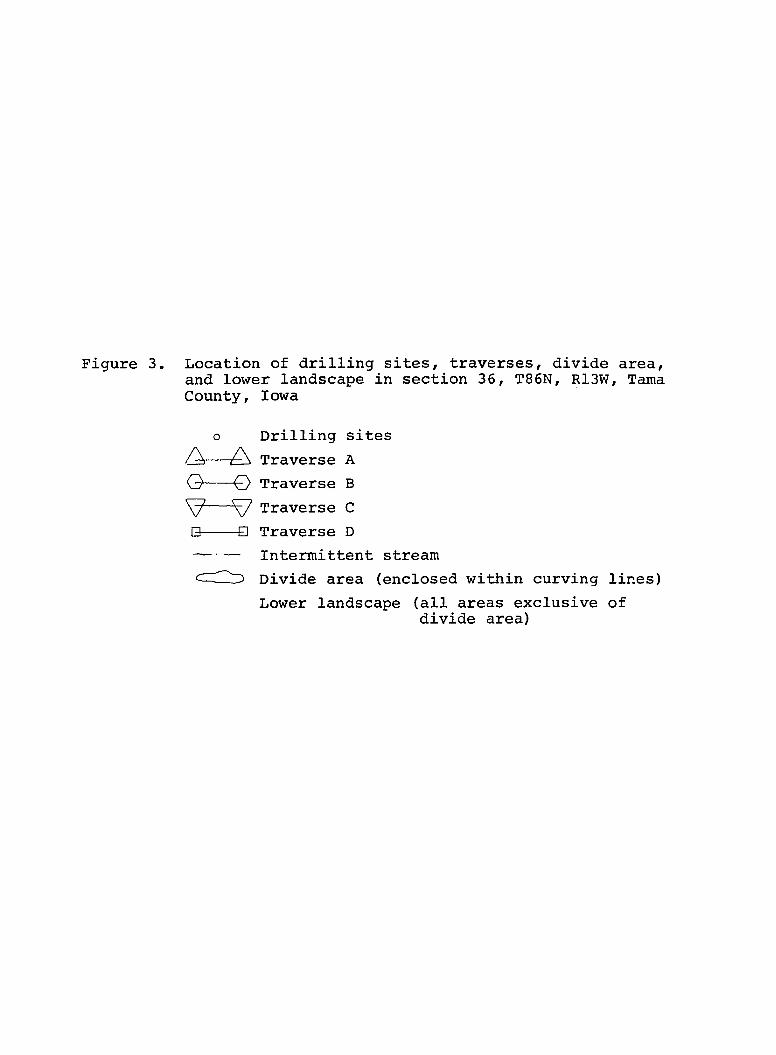
Figure 3. Location of drilling sites, traverses, divide area, and lower landscape in section 36, T86N, R13W, Tama County, Iowa
o Drilling sites
/^> Traverse A
O O Traverse B
^ Traverse C
• • Traverse D
— -— Intermittent stream
CZZZZ) Divide area (enclosed within curving lines)
Lower landscape (all areas exclusive of divide area)
33
R 13 W
\
7 BG-29 \
• -,°G-33^-32^ s
25 30 36l31
°S-3A ^G-3
/ /
/
G-27
ÛGS-5
N OGS-6 /
G-Î05
4^ '
-s]
vo G-107
• / / / \ j j • Hayward
^-1Û4,_ W
660 Ft.
oG-41.
oG-39
34
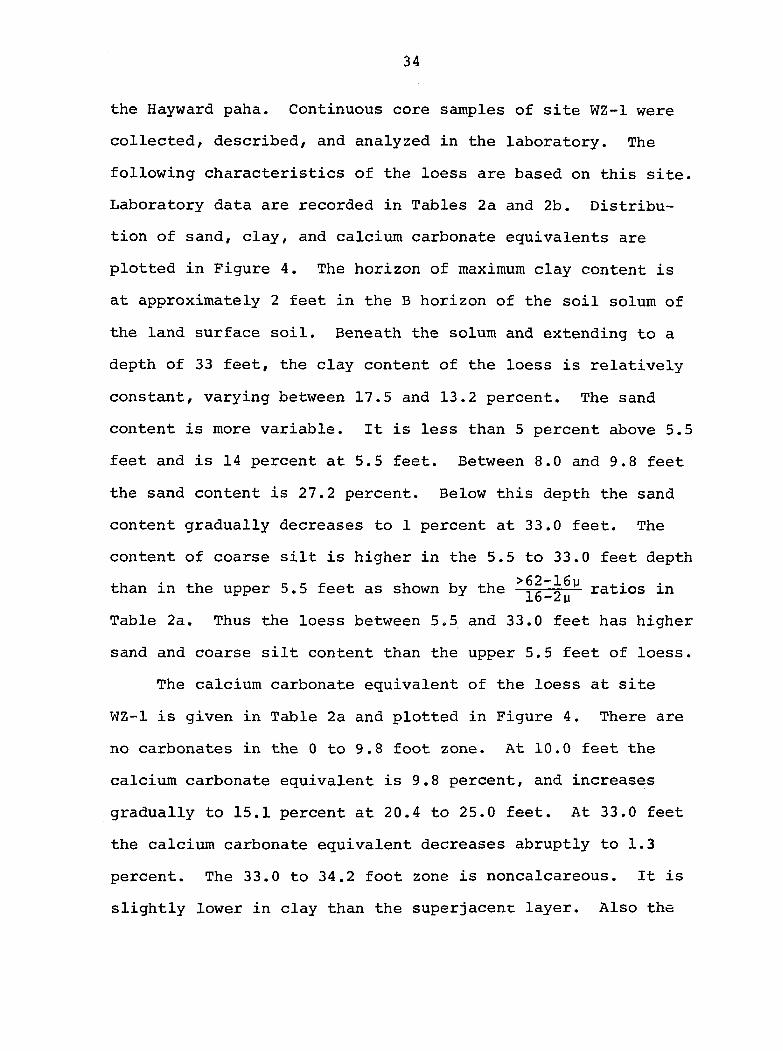
the Hayward paha. Continuous core samples of site WZ-1 were
collected, described, and analyzed in the laboratory. The
following characteristics of the loess are based on this site.
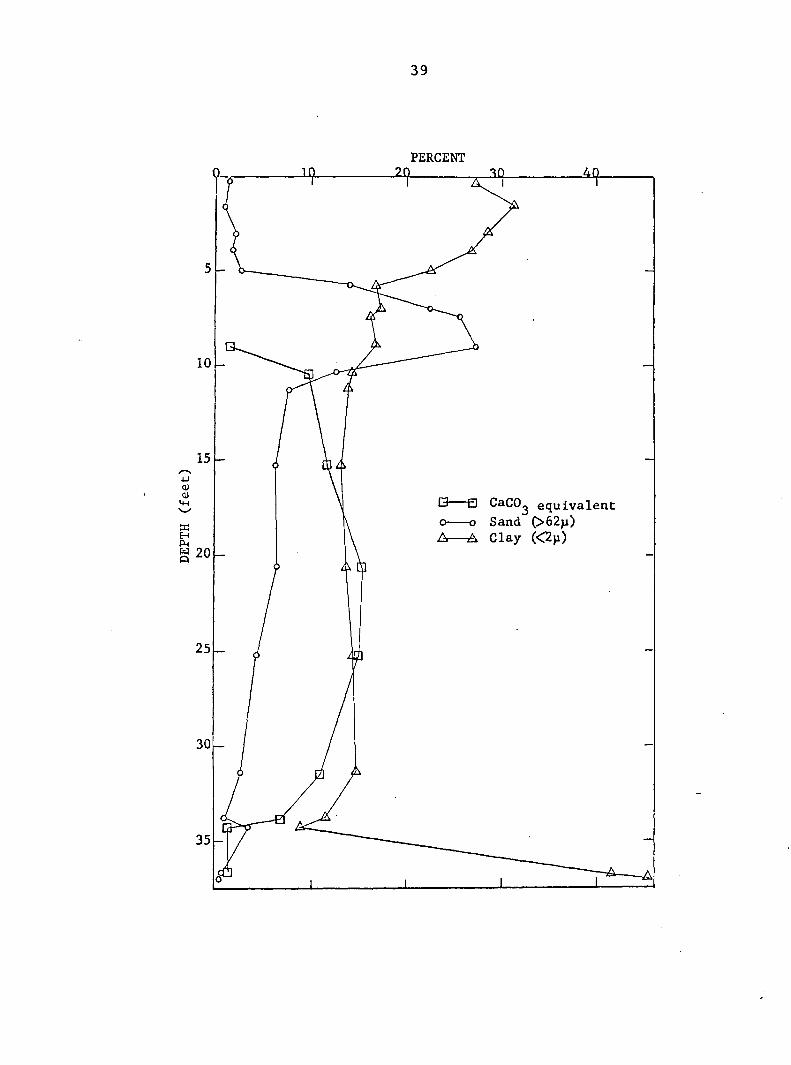
Laboratory data are recorded in Tables 2a and 2b. Distribu
tion of sand, clay, and calcium carbonate equivalents are
plotted in Figure 4. The horizon of maximum clay content is
at approximately 2 feet in the B horizon of the soil solum of
the land surface soil. Beneath the solum and extending to a
depth of 33 feet, the clay content of the loess is relatively
constant, varying between 17.5 and 13.2 percent. The sand
content is more variable. It is less than 5 percent above 5.5
feet and is 14 percent at 5.5 feet. Between 8.0 and 9.8 feet
the sand content is 27.2 percent. Below this depth the sand
content gradually decreases to 1 percent at 33.0 feet. The
content of coarse silt is higher in the 5.5 to 33.0 feet depth
t h a n i n t h e u p p e r 5 . 5 f e e t a s s h o w n b y t h e ̂ r a t i o s i n
Table 2a. Thus the loess between 5.5 and 33.0 feet has higher
sand and coarse silt content than the upper 5.5 feet of loess.
The calcium carbonate equivalent of the loess at site
WZ-1 is given in Table 2a and plotted in Figure 4. There are
no carbonates in the 0 to 9.8 foot zone. At 10.0 feet the
calcium carbonate equivalent is 9.8 percent, and increases
gradually to 15.1 percent at 20.4 to 25.0 feet. At 33.0 feet
the calcium carbonate equivalent decreases abruptly to 1.3
percent. The 33.0 to 34.2 foot zone is noncalcareous. It is
slightly lower in clay than the superjacent layer. Also the
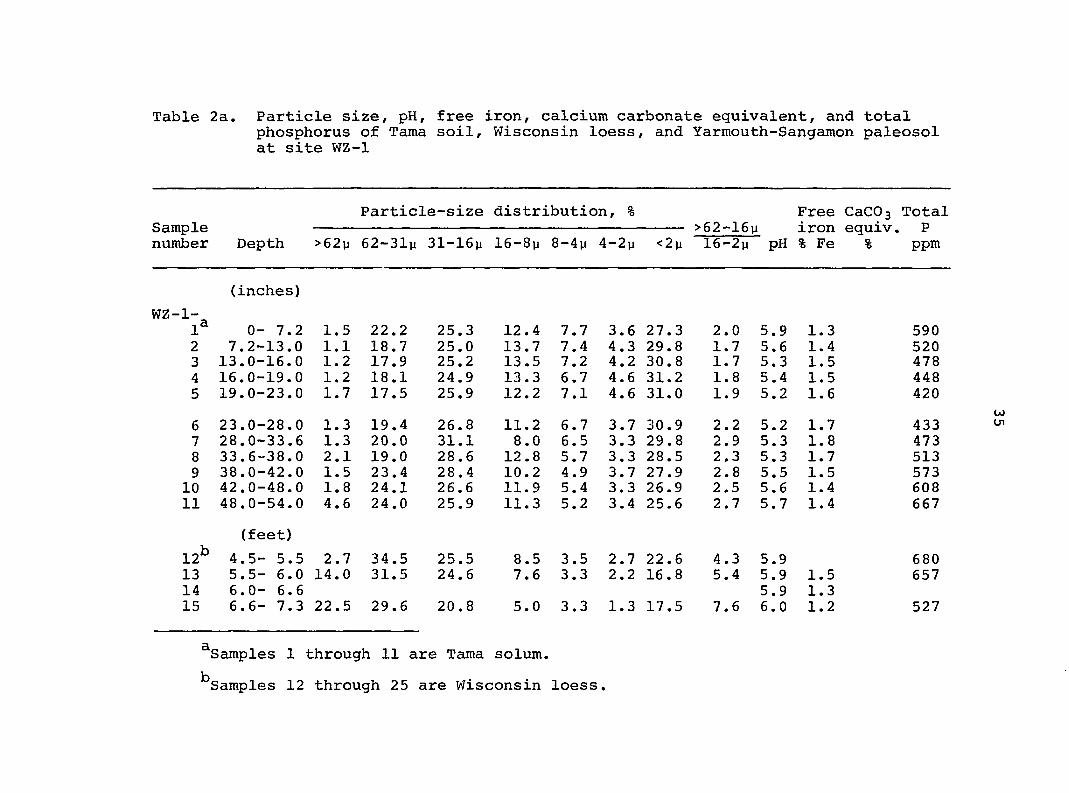
Table 2a. Particle size, pH, free iron, calcium carbonate equivalent, and total phosphorus of Tama soil, Wisconsin loess, and Yarmouth-Sangamon paleosol at site WZ-1
Particle-size distribution, % Free CaCOg Total Sample >62-16p iron equiv. P number Depth >62% 62-31% 31-16% 16-8% 8-4% 4-2% <2% 16-2% pH % Fe % ppm
(inches)
WZ-1-1^ 0- 7.2 1.5 22.2 25.3 12.4 7.7 3.6 27.3 2.0 5.9 1.3 590 2 7.2-13.0 1.1 18.7 25.0 13.7 7.4 4.3 29.8 1.7 5.6 1.4 520 3 13.0-16.0 1.2 17.9 25.2 13.5 7.2 4.2 30.8 1.7 5.3 1.5 478 4 16.0-19.0 1.2 18.1 24.9 13.3 6.7 4.6 31.2 1.8 5.4 1.5 448 5 19.0-23.0 1.7 17.5 25.9 12.2 7.1 4.6 31.0 1.9 5.2 1.6 420
6 23.0-28.0 1.3 19.4 26.8 11.2 6.7 3.7 30.9 2.2 5.2 1.7 433 7 28.0-33.6 1.3 20.0 31.1 8.0 6.5 3.3 29.8 2.9 5.3 1.8 473 8 33.6-38.0 2.1 19.0 28.6 12.8 5.7 3.3 28.5 2.3 5.3 1.7 513 9 38.0-42.0 1.5 23.4 28.4 10.2 4.9 3.7 27.9 2.8 5.5 1.5 573 10 42.0-48.0 1.8 24.1 26.6 11.9 5.4 3.3 26.9 2.5 5.6 1.4 608 11 48.0-54.0 4.6 24.0 25.9 11.3 5.2 3.4 25.6 2.7 5.7 1.4 667
(feet)
12^ 4.5- 5.5 2.7 34.5 25.5 8.5 3.5 2.7 22.6 4.3 5.9 680 13 5.5- 6.0 14.0 31.5 24.6 7.6 3.3 2.2 16.8 5.4 5.9 1.5 657 14 6.0— 6.6 5.9 1.3 15 6.6— 7.3 22.5 29.6 20.8 5.0 3.3 1.3 17.5 7.6 6.0 1.2 527
^Samples 1 through 11 are Tama solum.
^Samples 12 through 25 are Wisconsin loess.
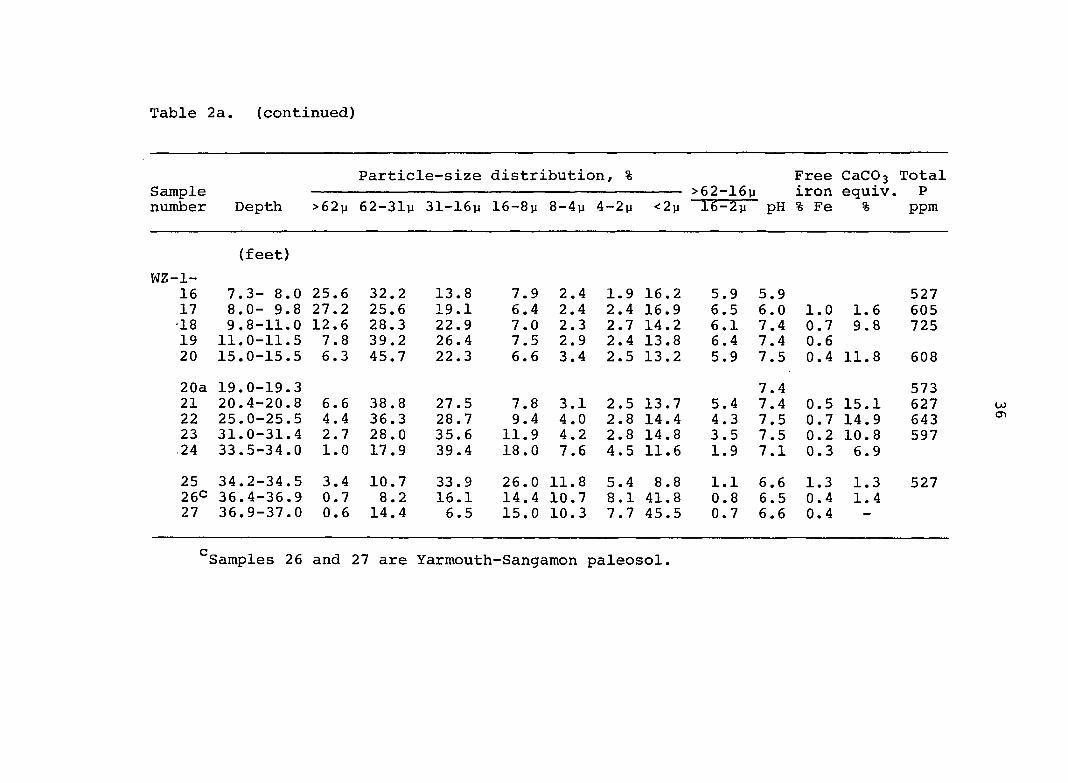
Table 2a. (continued)
Particle-size distribution, % Free CaCOg Total Sample >62-16% iron equiv. P number Depth >62% 62-31% 31-16% 16-8% 8-4% 4-2% <2% 16-2% pH % Fe % ppm
(feet)
WZ-1-16 7.3- 8.0 25.6 32.2 13.8 7.9 2.4 1.9 16.2 5.9 5.9 527 17 8.0- 9.8 27.2 25.6 19.1 6.4 2.4 2.4 16.9 6.5 6.0 1.0 1.6 605 18 9.8-11.0 12.6 28.3 22.9 7.0 2.3 2.7 14.2 6.1 7.4 0.7 9.8 725 19 11.0-11.5 7.8 39.2 26.4 7.5 2.9 2.4 13.8 6.4 7.4 0.6 20 15.0-15.5 6.3 45.7 22.3 6.6 3.4 2.5 13.2 5.9 7.5 0.4 11.8 608
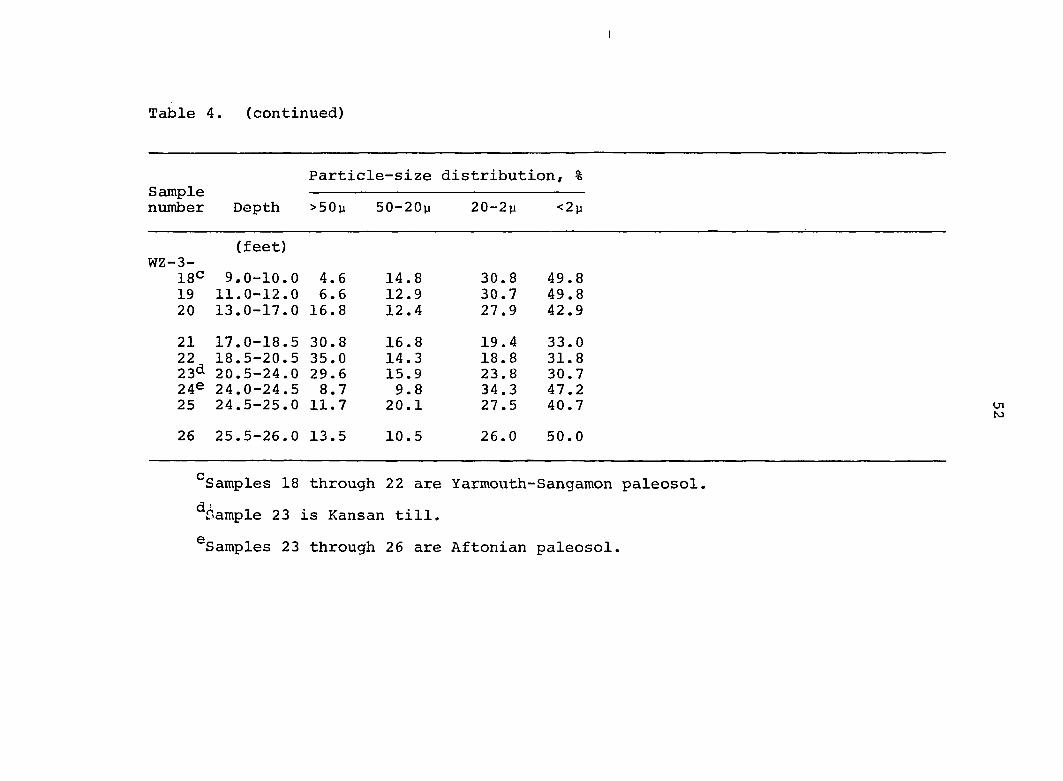
20a 19.0-19.3 7.4 573 21 20.4-20.8 6.6 38.8 27.5 7.8 3.1 2.5 13.7 5.4 7.4 0.5 15.1 627 22 25.0-25.5 4.4 36.3 28.7 9.4 4.0 2.8 14.4 4.3 7.5 0.7 14.9 643 23 31.0-31.4 2.7 28.0 35.6 11.9 4.2 2.8 14.8 3.5 7.5 0.2 10.8 597 .24 33.5-34.0 1.0 17.9 39.4 18.0 7.6 4.5 11.6 1.9 7.1 0.3 6.9
25 34.2-34.5 3.4 10.7 33.9 26.0 11.8 5.4 8.8 1.1 6.6 1.3 1.3 527 26C 36.4-36.9 0.7 8.2 16.1 14.4 10.7 8.1 41.8 0.8 6.5 0.4 1.4 27 36.9-37.0 0.6 14.4 6.5 15.0 10.3 7.7 45.5 0.7 6.6 0.4 -
^Samples 26 and 27 are Yarmouth-Sangamon paleosol.
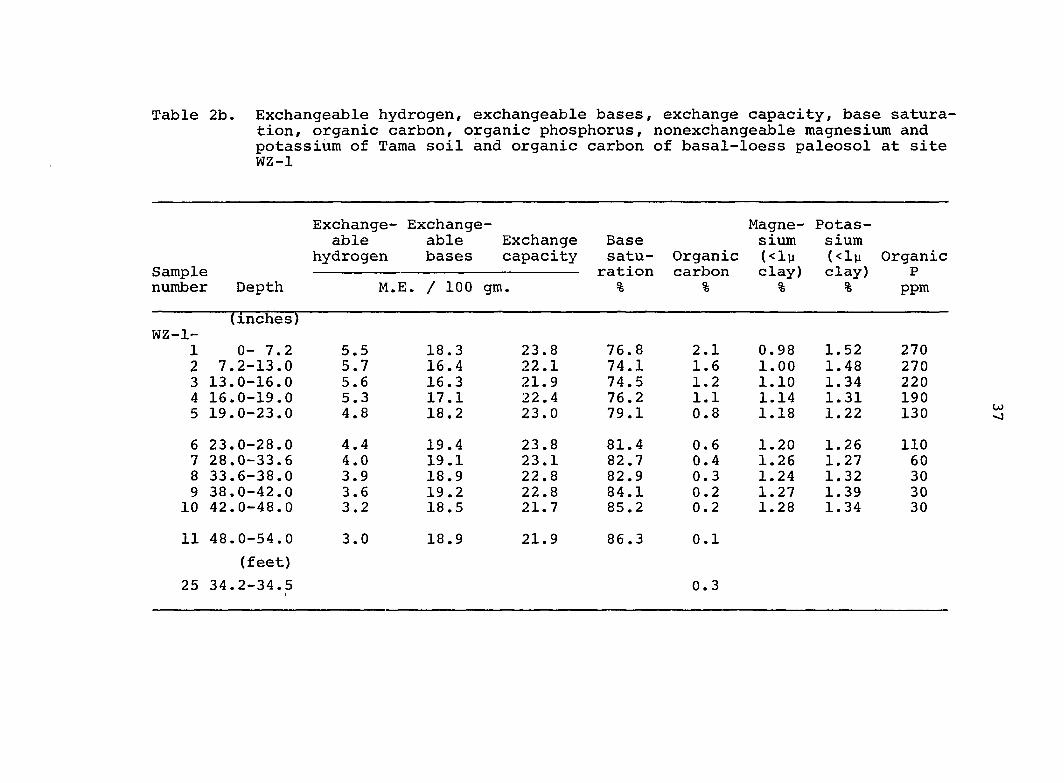
Table 2b. Exchangeable hydrogen, exchangeable bases, exchange capacity, base saturation, organic carbon, organic phosphorus, nonexchangeable magnesium and potassium of Tama soil and organic carbon of basal-loess paleosol at site WZ-1
Sample number Depth
(inches)
Exchange- Exchangeable able Exchange
hydrogen bases capacity
M.E. / 100 gm.
Magne- Potas-Base sium sium satu- Organic {<ly (<lp Organic ration carbon clay) clay) P % % % % ppm
WZ-1-1 0-7.2 5.5 18.3 23.8 76.8 2.1 0.98 1.52 270 2 7.2-13.0 5.7 16.4 22.1 74.1 1.6 1.00 1.48 270 3 13.0-16.0 5.6 16.3 21.9 74.5 1.2 1.10 1.34 220 4 16.0-19.0 5.3 17.1 22.4 76.2 1.1 1.14 1.31 190 5 19.0-23.0 4.8 18.2 23.0 79.1 0.8 1.18 1.22 130 w
6 23.0-28.0 4.4 19.4 23.8 81.4 0.6 1.20 1.26 110 7 28.0-33.6 4.0 19.1 23.1 82.7 0.4 1.26 1.27 60 8 33.6-38.0 3.9 18.9 22.8 82.9 0.3 1.24 1.32 30 9 38.0-42.0 3.6 19.2 22.8 84.1 0.2 1.27 1.39 30 10 42.0-48.0 3.2 18.5 21.7 85.2 0.2 1.28 1.34 30
11 48.0-54.0 3.0 18.9 21.9 86.3 0.1
(feet)
25 34.2-34.5 1
0.3
Figure 4. Distribution of sand, clay, and calcium carbonate equivalent in Tama soil, Wisconsin loess and Yarmouth-Sangamon paleosol at site WZ-1 (data from Table 2a)
39
PERCENT
5
10
15
4J
13 • CaCO^ equivalent
o o Sand (>62}i) A—A Clay (<2p)
25
30
35
40
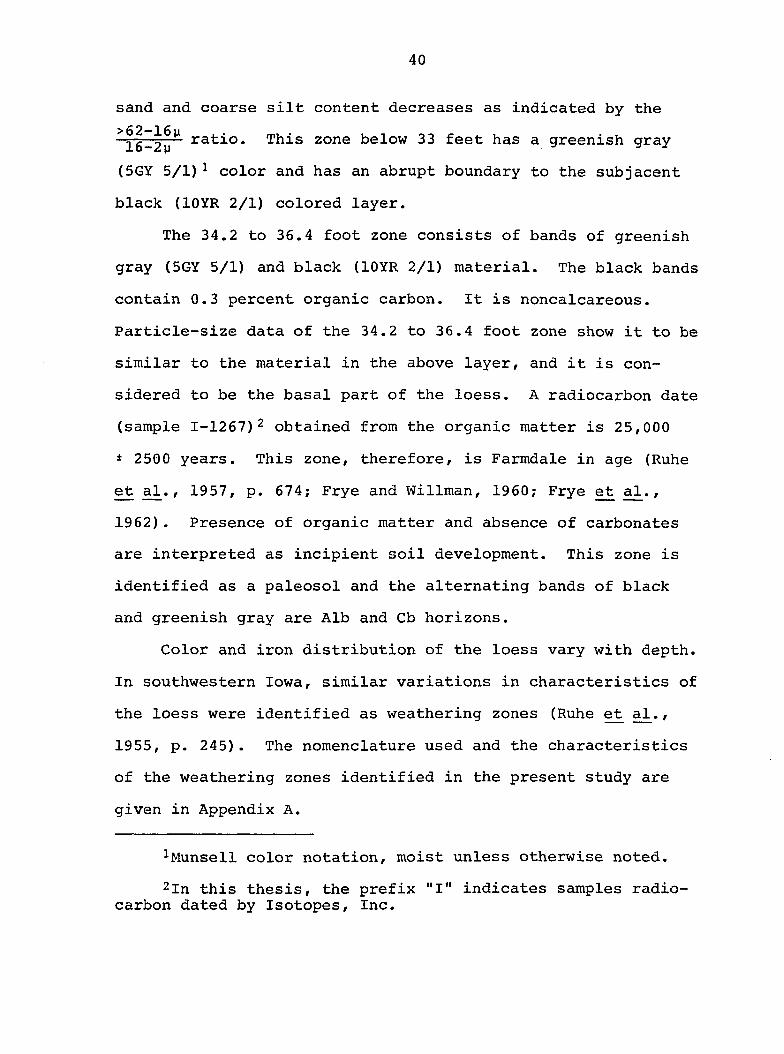
sand and coarse silt content decreases as indicated by the
^16-2p^ ratio. This zone below 33 feet has a greenish gray
(5GY 5/1)^ color and has an abrupt boundary to the subjacent
black (lOYR 2/1) colored layer.
The 34.2 to 36.4 foot zone consists of bands of greenish
gray (5GY 5/1) and black (lOYR 2/1) material. The black bands
contain 0.3 percent organic carbon. It is noncalcareous.
Particle-size data of the 34.2 to 36.4 foot zone show it to be
similar to the material in the above layer, and it is con
sidered to be the basal part of the loess. A radiocarbon date
(sample 1-1267)̂ obtained from the organic matter is 25,000
± 2500 years. This zone, therefore, is Farmdale in age (Ruhe
et al., 1957, p. 674; Frye and Willman, 1960; Frye et al.,
1962). Presence of organic matter and absence of carbonates
are interpreted as incipient soil development. This zone is
identified as a paleosol and the alternating bands of black
and greenish gray are Alb and Cb horizons.
Color and iron distribution of the loess vary with depth.
In southwestern Iowa, similar variations in characteristics of
the loess were identified as weathering zones (Ruhe e;t a2.,
1955, p. 245). The nomenclature used and the characteristics
of the weathering zones identified in the present study are
given in Appendix A.
^Munsell color notation, moist unless otherwise noted.
2ln this thesis, the prefix "I" indicates samples radiocarbon dated by Isotopes, Inc.
41
The weathering zones described in the Wisconsin loess of
site WZ-1 are:
Surficial soil 0-54.0 inches Mottled oxidized and leached 4.5- 9.8 feet Mottled oxidized and unleached 9.8-12.3 feet Deoxidized and unleached 12.3-20.0 feet Oxidized and unleached 20.0-30.5 feet Unoxidized and unleached 30.5-33.0 feet Unoxidized and leached 33.0-34.0 feet Basal-loess paleosol 34.0-36.4 feet
The presence of a deoxidized zone on a landscape position that
presently is well drained suggests a past environment that
differed from the present.
Upper till At site WZ-1 (Figure 3), the basal-loess
paleosol is underlain by a fine-textured paleosol. Charac
teristics that distinguish the fine-textured paleosol from the
basal-loess paleosol are the high clay content, dark gray
color, and strong very fine subangular blocky structure.
Particle-size data of the upper two horizons (Table 2a, sample
WZ-1, 26 and 27) shows a low sand content (0.7 and 0.6 percent
>62vi) and a relatively high clay content (41.8 and 45.5 per
cent <2ii) . Continuous clay films cover the ped surfaces.
Color of the horizons sampled ranged from dark gray (SY 4/1)
to very dark gray (5Y 3/1).
The paleosol beneath 36 feet of loess on the Hayward paha
is buried too deeply for detailed study. Therefore, a newly
exposed cut, 4-1/2 miles northwest of the Hayward paha (middle
of section 10, T86N, R13W) was used for a more detailed study
of a paleosol stratigraphically equivalent to the one present

42
at site WZ-1. As site WZ-1, this site is also located on a
divide. This site is designated as G-402.
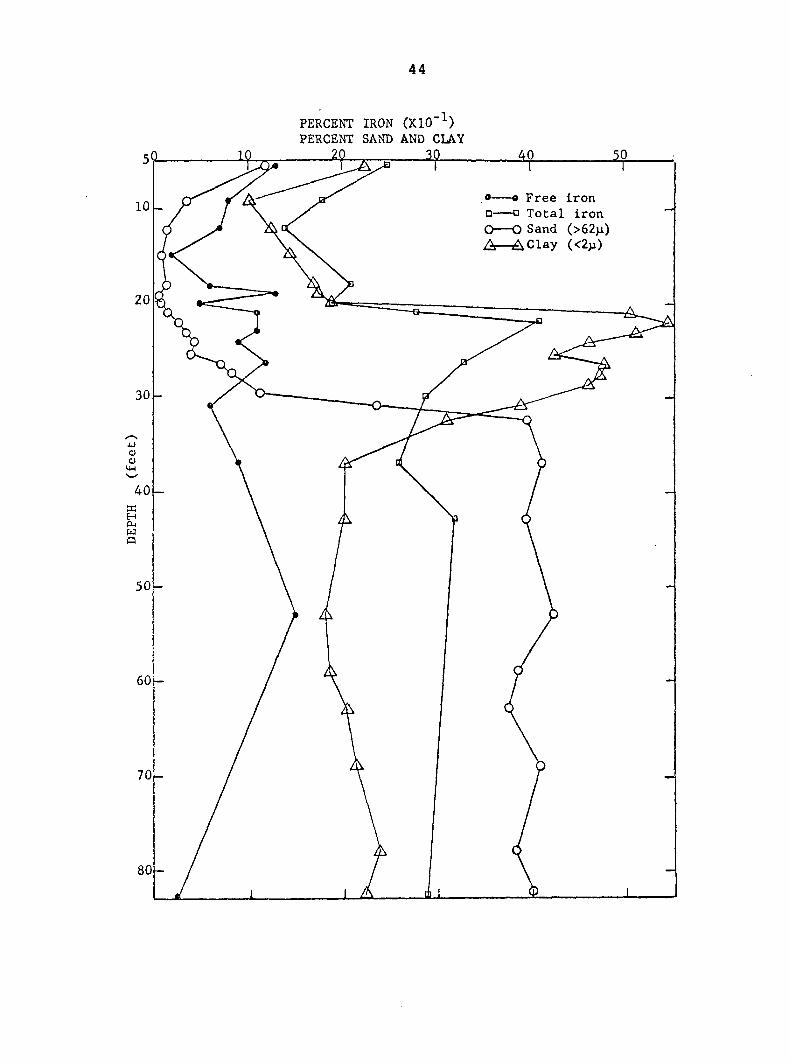
A plot of the distribution of sand, clay, free iron, and
total iron of the G-402 site is shown in Figure 5. Data for
this site are presented in Table 3. The material in the upper
20 feet is loess. The B horizon of the paleosol surmounting
the till begins at 20.2 feet. Matrix colors of the paleosolum
range from dark gray (lOYR 4/1) to gray and dark gray (5Y 5/1
and 4/1). Red and yellowish red mottles comprise 2 to 20 per
cent of the colors in the paleosolum. Maximum clay percentage
is 55.1 percent at 21.9 feet and thick continuous clay films
are present on the very fine angular blocky peds.
The clay texture extends downward to 30.9 feet. The
paleosolum thickness is 12.2 feet. There is a decrease in
clay at 25.3 feet and then an increase at 26.3 feet. The sand
content of the lower B horizon increases from 11.3 percent at
29.3 feet to 39.9 percent at 32.5 feet and clay content
decreases from 46.3 percent to 31.1 percent. Texture grades
from clay loam at 30.9 feet to loam at 35 feet. Below this
depth to 84.5 feet, the till is loam in texture. Sand con
tent is relatively constant, ranging between 37.8 percent and
42.5 percent. Clay content of the till below 35 feet ranges
from 18.1 percent to 24.0 percent.
The low sand content of the upper paleosolum, as compared
to the underlying till, and the variation in clay content of
the upper paleosolum indicate this paleosol may have formed
Figure 5. Distribution of sand, clay, free iron, and total iron in Wisconsin loess, Yarmouth-Sangamon paleosol, and Kansan till at site G-402 (data from Table 3)
44
PERCENT IRON (Xlû'^) PERCENT SAND AND CLAY
,« ® Free iron D D Total iron
O O Sand (>62)i) A—lé^Clay (<2p)
20
4J
40
8 0 -
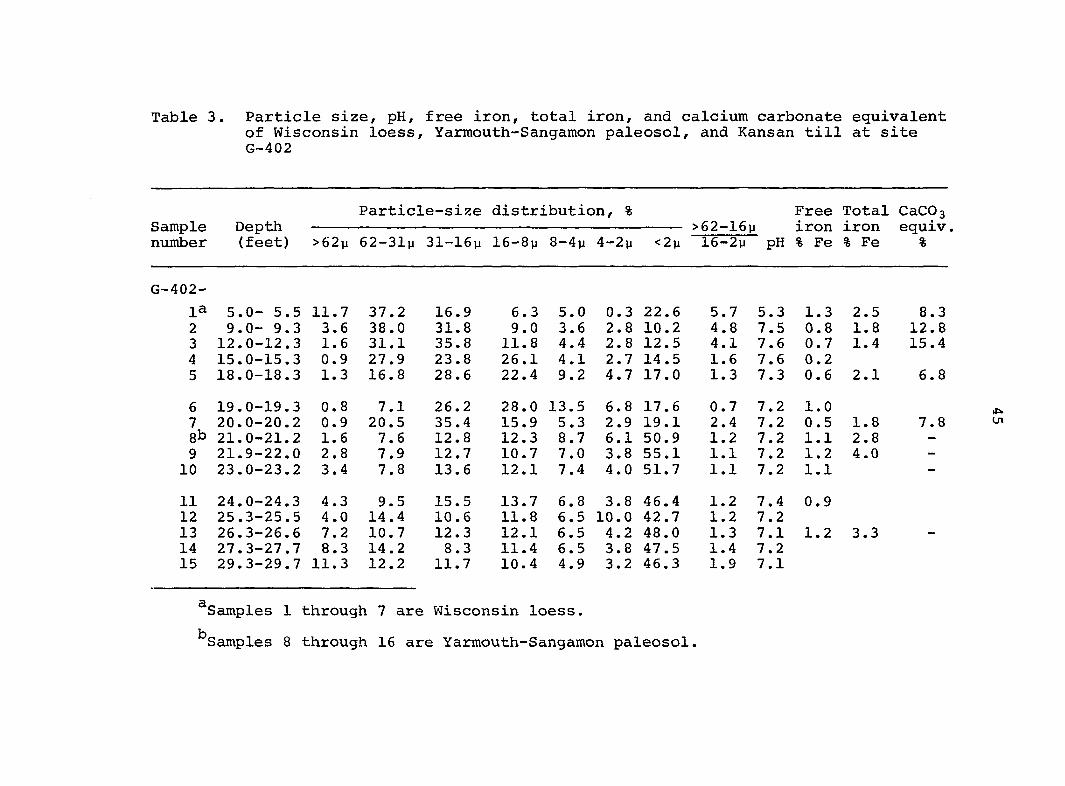
Table 3. Particle size, pH, free iron, total iron, and calcium carbonate equivalent of Wisconsin loess, Yarmouth-Sangamon paleosol, and Kansan till at site G-402
Particle-size distribution, % Free Total CaCOg Sample Depth >62-16m iron iron equiv. number (feet) >62y 62-31p 31-16% 16-8% 8-4% 4-2% <2% 16-2% pH % Fe % Fe %
G-402-
la 5.0- 5.5 11.7 37.2 16.9 6.3 5.0 0.3 22.6 5.7 5.3 1.3 2.5 8.3 2 9.0- 9.3 3.6 38.0 31.8 9.0 3.6 2.8 10.2 4.8 7.5 0.8 1.8 12.8 3 12.0-12.3 1.6 31.1 35.8 11.8 4.4 2.8 12.5 4.1 7.6 0.7 1.4 15.4 4 15.0-15.3 0.9 27.9 23.8 26.1 4.1 2.7 14.5 1.6 7.6 0.2 5 18.0-18.3 1.3 16.8 28.6 22.4 9.2 4.7 17.0 1.3 7.3 0.6 2.1 6.8
6 19.0-19.3 0.8 7.1 26.2 28.0 13.5 6.8 17.6 0.7 7.2 1.0 7 20.0-20.2 0.9 20.5 35.4 15.9 5.3 2.9 19.1 2.4 7.2 0.5 1.8
CO
8b 21.0-21.2 1.6 7.6 12.8 12.3 8.7 6.1 50.9 1.2 7.2 1.1 2.8 -
9 21.9-22.0 2.8 7.9 12.7 10.7 7.0 3.8 55.1 1.1 7.2 1.2 4.0 -
10 23.0-23.2 3.4 7.8 13.6 12.1 7.4 4.0 51.7 1.1 7.2 1.1 —
11 24.0-24.3 4.3 9.5 15.5 13.7 6.8 3.8 46.4 1.2 7.4 0.9 12 25.3-25.5 4.0 14.4 10.6 11.8 6.5 10.0 42.7 1.2 7.2 13 26.3-26.6 7.2 10.7 12.3 12.1 6.5 4.2 48.0 1.3 7.1 1.2 3.3 -
14 27.3-27.7 8.3 14.2 8.3 11.4 6.5 3.8 47.5 1.4 7.2 15 29.3-29.7 11.3 12.2 11.7 10.4 4.9 3.2 46.3 1.9 7.1
^Samples 1 through 7 are Wisconsin loess.
^Samples 8 through 16 are Yarmouth-Sangamon paleosol.
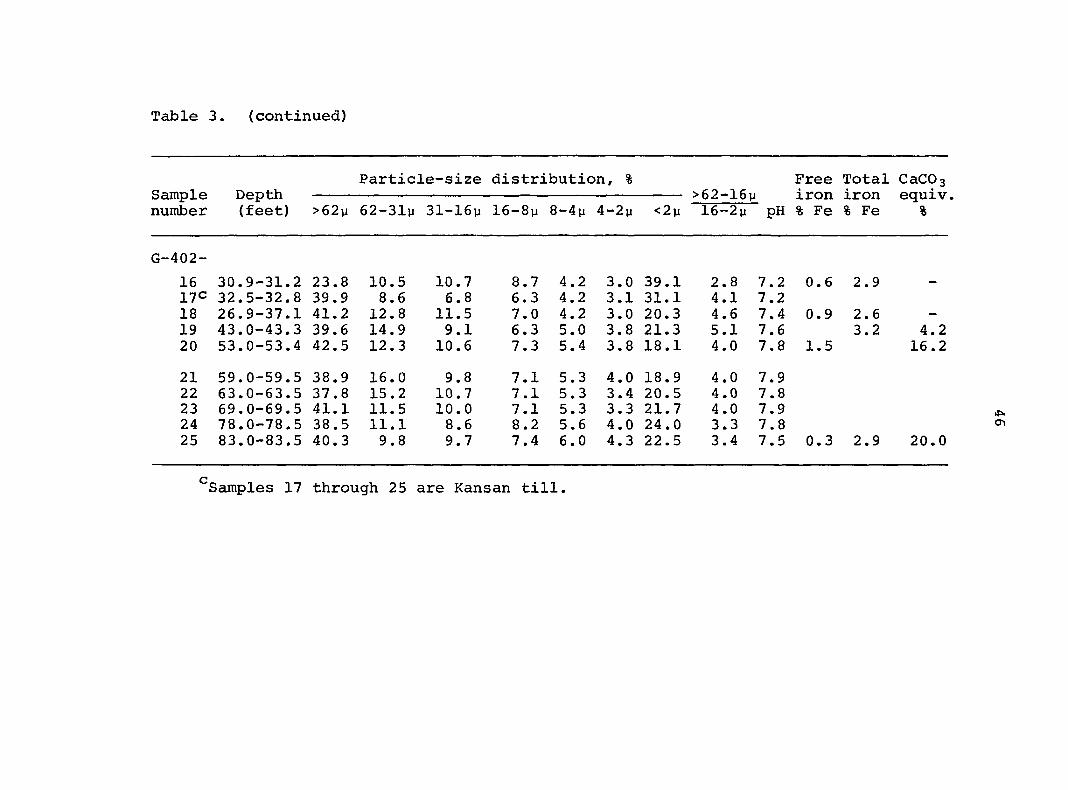
Table 3. (continued)
Particle-size distribution, % Free Total CaCOg Sample Depth >62-16p iron iron equiv. number (feet) >62% 62-31% 31-16% 16-8% 8-4% 4-2% <2% 16-2% pH % Fe % Fe %
G—402 —
16 30.9-31.2 23.8 10.5 10.7 8.7 4.2 3.0 39.1 2.8 7.2 0.6 2.9 -
17c 32.5-32.8 39.9 8.6 6.8 6.3 4.2 3.1 31.1 4.1 7.2 18 26.9-37.1 41.2 12.8 11.5 7.0 4.2 3.0 20.3 4.6 7.4 0.9 2.6 -
19 43.0-43.3 39.6 14.9 9.1 6.3 5.0 3.8 21.3 5.1 7.6 3.2 4.2 20 53.0-53.4 42.5 12.3 10.6 7.3 5.4 3.8 18.1 4.0 7.8 1.5 16.2
21 59.0-59.5 38.9 16.0 9.8 7.1 5.3 4.0 18.9 4.0 7.9 22 63.0-63.5 37.8 15.2 10.7 7.1 5.3 3.4 20.5 4.0 7.8 23 69.0-69.5 41.1 11.5 10.0 7.1 5.3 3.3 21.7 4.0 7.9 24 78.0-78.5 38.5 11.1 8.6 8.2 5.6 4.0 24.0 3.3 7.8 25 83.0-83.5 40.3 9.8 9.7 7.4 6.0 4.3 22.5 3.4 7.5 0.3 2.9 20.0
^Samples 17 through 25 are Kansan till.
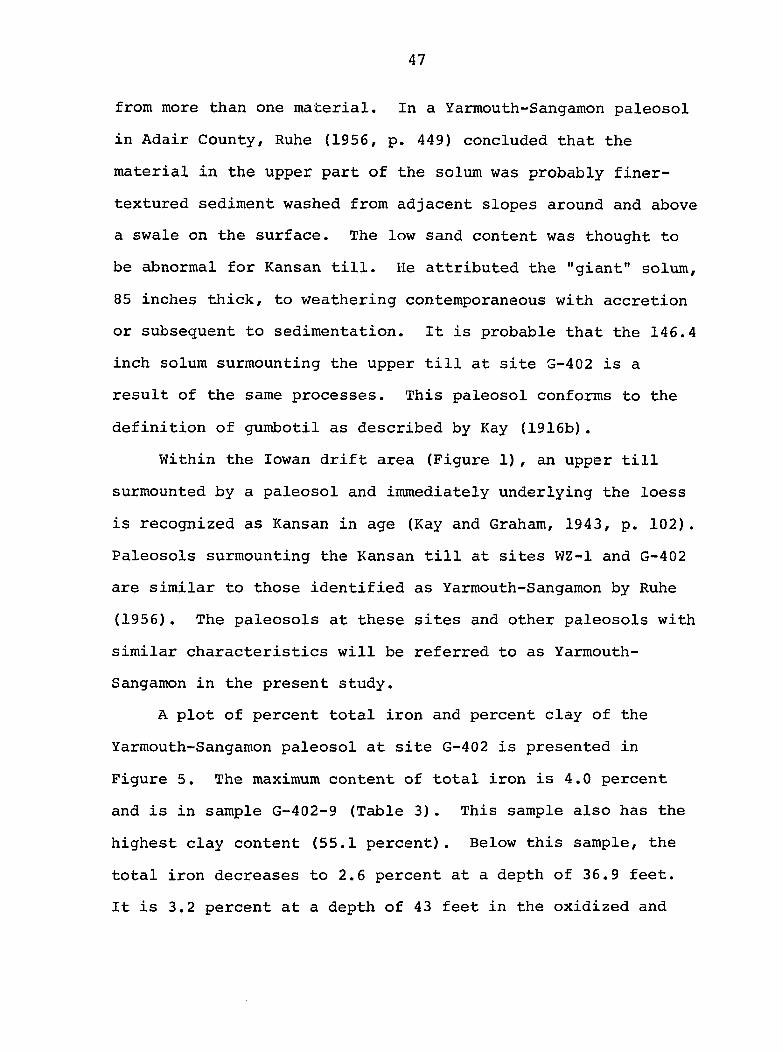
47
from more than one material. In a Yarmouth-Sangamon paleosol
in Adair County, Ruhe (1956, p. 449) concluded that the
material in the upper part of the solum was probably finer-
textured sediment washed from adjacent slopes around and above
a swale on the surface. The low sand content was thought to
be abnormal for Kansan till. He attributed the "giant" solum,
85 inches thick, to weathering contemporaneous with accretion
or subsequent to sedimentation. It is probable that the 146.4
inch solum surmounting the upper till at site G-402 is a
result of the same processes. This paleosol conforms to the
definition of gumbotil as described by Kay (1916b).
Within the lowan drift area (Figure 1), an upper till
surmounted by a paleosol and immediately underlying the loess
is recognized as Kansan in age (Kay and Graham, 1943, p. 102).
Paleosols surmounting the Kansan till at sites WZ-1 and G-402
are similar to those identified as Yarmouth-Sangamon by Ruhe
(1956). The paleosols at these sites and other paleosols with
similar characteristics will be referred to as Yarmouth-
Sangamon in the present study.
A plot of percent total iron and percent clay of the
Yarmouth-Sangamon paleosol at site G-402 is presented in
Figure 5. The maximum content of total iron is 4.0 percent
and is in sample G-402-9 (Table 3). This sample also has the
highest clay content (55.1 percent). Below this sample, the
total iron decreases to 2.6 percent at a depth of 36.9 feet.
It is 3.2 percent at a depth of 43 feet in the oxidized and

48
unleached till. The clay content beneath the sample of maxi
mum clay decreases gradually to 20.3 percent at a depth of
36.9 feet.
Content of free iron in the solum of the Yarmouth-
Sangamon paleosol increases in the zone of maximum clay and
total iron (Figure 5). Values of free iron percentages in the
upper part of the paleosolum range from 0.9 to 1.2 percent.
At 30.9 feet (Table 3), in the lower part of the paleosolum,
the free iron content is 0.6 percent. At a depth of 53 feet
it is 1.5 percent. In the unoxidized and unleached till at
83 feet, the free iron content is 0.3 percent.
The depth to carbonates is 22.9 feet in the Yarmouth-
Sangamon paleosol and underlying Kansan till of site G-402.
The first sample of calcareous till (sample G-402-19, Table 3)
has a pH of 7.6 and a calcium carbonate equivalent of 4.2 per
cent. Samples of the overlying till and paleosol have pH
values ranging from 7.1 to 7.4. These are abnormally high
values for the intensity of weathering inferred from the clay
content and the depth to carbonates at this site. However,
similar relationships have been reported by Ruhe (1956,
p. 446-447) for paleosols in southwestern Iowa. The high pH
values of the paleosolum were attributed to secondary enrich
ment by downward percolating solutions from the overlying
Wisconsin loess, calcareous when deposited but subsequently
leached. The noncalcareous basal-loess paleosol, beginning at
17.5 feet and extending to 20.2 feet at the G-402 site, is a
49
possible source of enrichment for the Yarmouth-Sangamon
paleosol at this site. Thus, the pH values of the paleosolum
do not reflect the intensity of weathering associated with the
formation of this paleosol.
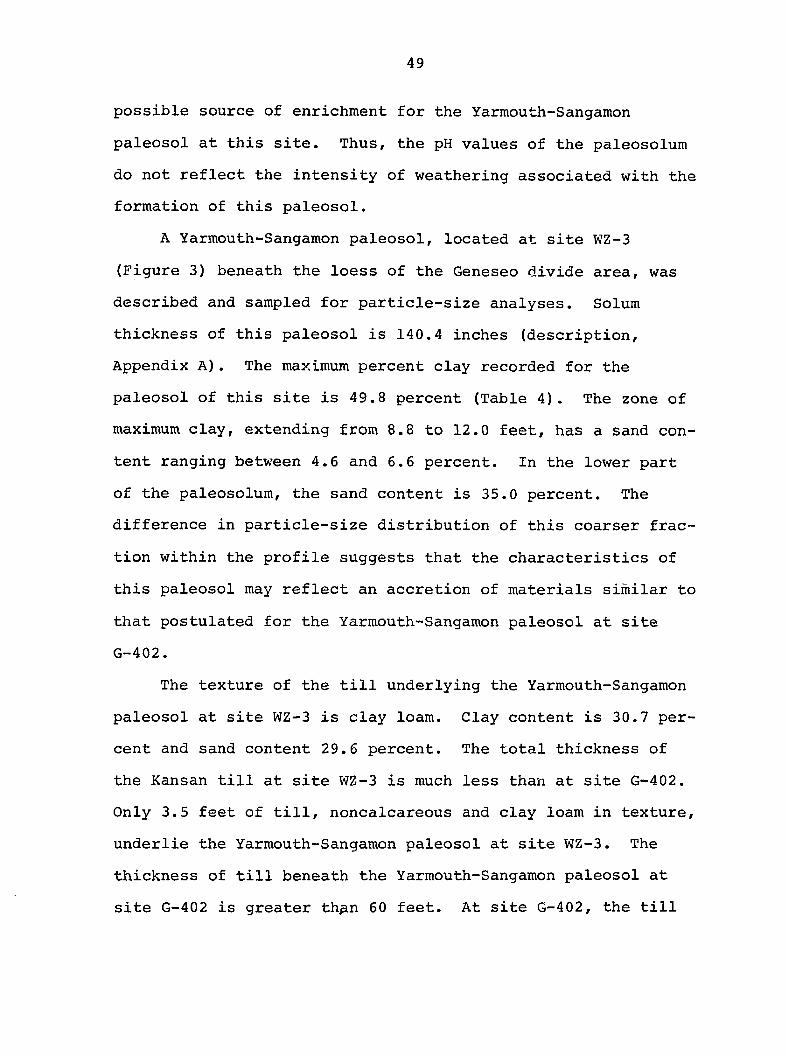
A Yarmouth-Sangamon paleosol, located at site WZ-3
(Figure 3) beneath the loess of the Geneseo divide area, was
described and sampled for particle-size analyses. Solum
thickness of this paleosol is 140.4 inches (description.
Appendix A). The maximum percent clay recorded for the
paleosol of this site is 49.8 percent (Table 4). The zone of
maximum clay, extending from 8.8 to 12.0 feet, has a sand con
tent ranging between 4.6 and 6.6 percent. In the lower part
of the paleosolum, the sand content is 35.0 percent. The
difference in particle-size distribution of this coarser frac
tion within the profile suggests that the characteristics of
this paleosol may reflect an accretion of materials similar to
that postulated for the Yarmouth-Sangamon paleosol at site
G-402.
The texture of the till underlying the Yarmouth-Sangamon
paleosol at site WZ-3 is clay loam. Clay content is 30.7 per
cent and sand content 29.6 percent. The total thickness of
the Kansan till at site WZ-3 is much less than at site G-402.
Only 3.5 feet of till, noncalcareous and clay loam in texture,
underlie the Yarmouth-Sangamon paleosol at site WZ-3. The
thickness of till beneath the Yarmouth-Sangamon paleosol at
site G-402 is greater th^n 60 feet. At site G-402, the till
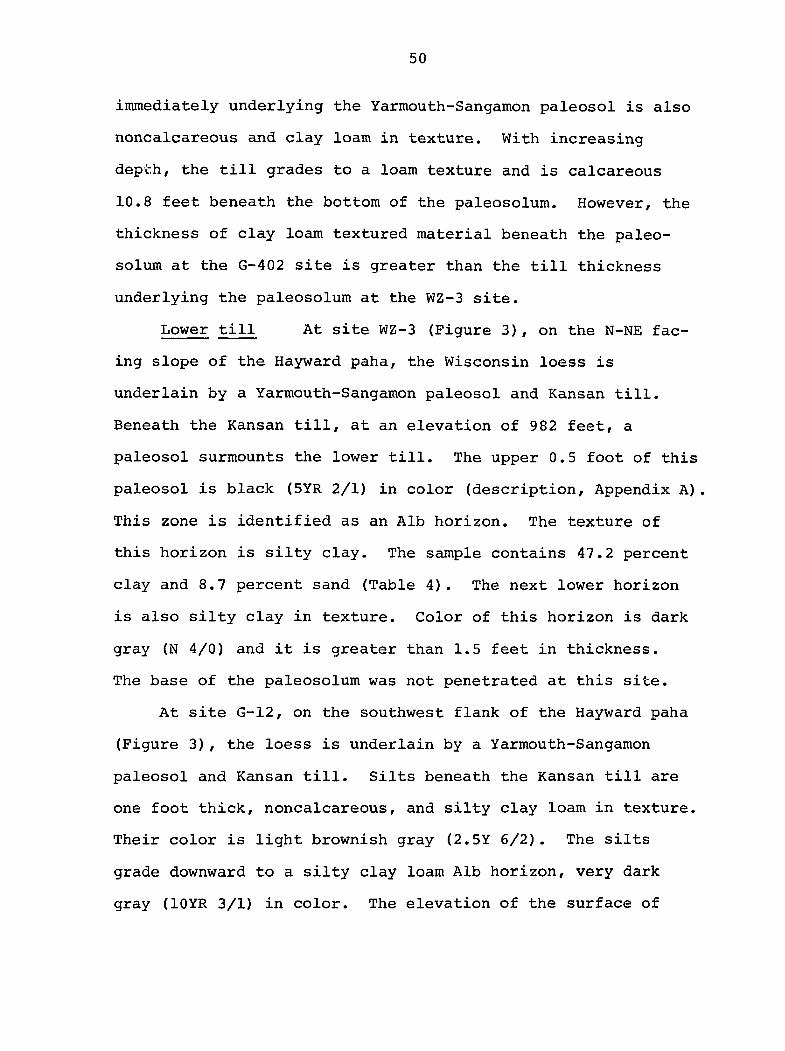
50
immediately underlying the Yarmouth-Sangamon paleosol is also
noncalcareous and clay loam in texture. With increasing
depth, the till grades to a loam texture and is calcareous
10.8 feet beneath the bottom of the paleosolum. However, the
thickness of clay loam textured material beneath the paleo
solum at the G-402 site is greater than the till thickness
underlying the paleosolum at the WZ-3 site.
Lower till At site WZ-3 (Figure 3), on the N-NE fac
ing slope of the Hayward paha, the Wisconsin loess is
underlain by a Yarmouth-Sangamon paleosol and Kansan till.
Beneath the Kansan till, at an elevation of 982 feet, a
paleosol surmounts the lower till. The upper 0.5 foot of this
paleosol is black (5YR 2/1) in color (description. Appendix A).
This zone is identified as an Alb horizon. The texture of
this horizon is silty clay. The sample contains 47.2 percent
clay and 8.7 percent sand (Table 4). The next lower horizon
is also silty clay in texture. Color of this horizon is dark
gray (N 4/0) and it is greater than 1.5 feet in thickness.
The base of the paleosolum was not penetrated at this site.
At site G-12, on the southwest flank of the Hayward paha
(Figure 3), the loess is underlain by a Yarmouth-Sangamon
paleosol and Kansan till. Silts beneath the Kansan till are
one foot thick, noncalcareous, and silty clay loam in texture.
Their color is light brownish gray (2.5Y 6/2). The silts
grade downward to a silty clay loam Alb horizon, very dark
gray (lOYR 3/1) in color. The elevation of the surface of

Table 4. Particle size, pH, exchangeable bases, and organic carbon of Tama (gray substratum phase) soil and Wisconsin loess and particle size of Yarmouth-Sangamon paleosol at site WZ-3
Exchangeable Organic
Particle-size distribution, % bases carbon Sample >62-16u —m v / number Depth >62v 62-31u 31-16u 16-8% 8-4v 4-2v <2y 16-2% pH lôûgm %
(inches) WZ-3-
1^ 0- 4.0 6.7 34.5 21.8 7.2 3.6 2.5 23.7 4.7 5.4 13.3 1.8 2 4.0- 7.5 6.5 32.9 22.4 7.8 3.8 2.2 24.4 4.5 5.0 11.2 1.0 3 7.5-11.0 7.1 31.6 24.0 7.8 3.5 2.2 23.8 4.6 5.0 10.0 0.8 4 11.0-15.0 4.1 33.3 25.1 8.6 3.7 2.0 23.2 4.4 5.0 10.8 0.6 5 15.0-19.0 4.3 32.2 27.6 7.7 3.6 1.7 22.9 4.9 5.0 11.0 0.6
6 19.0-22.0 3.9 31.3 29.3 8.1 3.4 2.1 21.9 4.7 5.1 11.8 0.4 7 22.0-30.0 2.9 30.8 30.7 8.6 3.6 2.0 21.4 4.5 5.2 12.6 0.3 8 30.0-34.0 5.6 28.6 29.8 9.2 3.7 2.0 21.1 4.3 5.2 12.6 0.2 9 34.0-38.0 2.7 27.8 33.0 10.9 3.3 1.4 20.9 4.1 5.3 15.1 0.2 10 38.0-42.0 2.4 27.6 33.5 10.6 2.8 2.0 21.1 4.1 5.4 14.0 0.1
11 42.0-48.0 2.7 25.3 33.5 10.9 4.3 1.7 21.6 3.6 5.5 15.1 0.1 12^ 48.0-53.0 3.1 24.7 33.8 11.0 4.4 2.1 20.9 3.5 5.5 15.0 0.1 13b 53.0-58.0 1.4 24.9 35.1 12.2 3.8 2.5 20.1 3.3 6.1 15.2 0.1 14 58.0-63.0 2.4 23.8 36.1 11.2 5.8 3.5 17.2 3.0 7.2 18.4
(feet)
15 5.3- 5.7 1.8 18.1 37.8 16.3 5.8 4.1 16.1 2.2 7.3 20.1 16 5.7- 7.6 3.6 11.5 27.2 22.4 11.1 6.4 17.8 1.1 7.5 24.6 17 7.6- 8.8 2.0 28.3 18.1 15.6 10.0 6.2 19.8 1.5 7.5 35.1 0.3
^Samples 1 through 12 are Tama (gray substratum phase) solum.
'^Samples 13 through 17 are Wisconsin loess.
I
Table 4. (continued)
Particle-size distribution, % Sample number Depth >50p 50-20% 20-2y <2p
(feet) WZ-3-
18^ 9.0-10.0 4.6 14.8 30.8 49.8 19 11.0-12.0 6.6 12.9 30.7 49.8 20 13.0-17.0 16.8 12.4 27.9 42.9
21 17.0-18.5 30.8 16.8 19.4 33.0 22 18.5-20.5 35.0 14.3 18.8 31.8 23^ 20.5-24.0 29.6 15.9 23.8 30.7 246 24.0-24.5 8.7 9.8 34.3 47.2 25 24.5-25.0 11.7 20.1 27.5 40.7
26 25.5-26.0 13.5 10.5 26.0 50.0
'^Samples 18 through 22 are Yarmouth-Sangamon paleosol.
^Cample 23 is Kansan till.
^Samples 23 through 26 are Aftonian paleosol.
53
this paleosol is 985.7 feet. The clay textured Bib horizon
of this paleosol is gray (lOYR 5/1) in color. The base of the
paleosolum was not penetrated at this site.
At site G-38 (Figure 3), on the summit of the Hayward
paha, a paleosol beneath the Kansan till was not identified
as such in drilling. However, the clay texture extending to a
depth of 23 feet beneath the surface of the Yarmouth-Sangamon
paleosol in this site (description. Appendix A) is thought to
also include the lower paleosol. Carbonates are present in
the till 39 feet beneath the surface of the Yarmouth-Sangamon
paleosol. Kay and Apfel (1929, p. 219) list the average depth
of leaching for similar paleosols and underlying Kansan till
as 17 feet. Also, two paleosols in vertical sequence beneath
the loess were described at sites WZ-3 and G-12, located 550
feet southwest and 1200 feet northwest respectively of site
G-38 on the same paha. It is concluded that in the drilling
of site G-38 the contact between the Kansan till and under
lying paleosol was not identified, but is present. The
estimated elevation of the surface of this paleosol is 984
feet. The lower paleosol at site G-38 is clay in texture and
grades downward into loam-textured glacial till.
The lower till of the Geneseo divide area is surmounted
by a paleosol. Frequently, noncalcareous silts of varying
thickness overlie this clay-textured paleosol. The low sand
and high silt content of the silts readily distinguish them
from the overlying coarser-textured Kansan till. Where the
54
silts are absent, the dark-colored surface horizon together
with the higher clay and lower sand content of the paleosol
distinguish it from the overlying Kansan till.
The only pre-Kansan drift recognized in Iowa is the
Nebraskan drift (Shimek, 1909), and thus the lower till in the
Geneseo area is correlated as Nebraskan. Aftonian is the
name applied to the interglacial stage representing the
weathering interval between the retreat of the Nebraskan ice
sheet and the advance of the Kansan ice sheet. Therefore,
the paleosols and silts separating the Kansan and Nebraskan
deposits are Aftonian in age and in this study will be
referred to as Aftonian silts and Aftonian paleosols.
Stratigraphy and correlation The stratigraphy and
correlation of the unconsolidated materials of the Geneseo
divide area are summarized in Table 5.
The loess of the Geneseo divide can be separated into
three distinct parts;
1) an upper increment of low sand content and a
^16-2y^ ratio generally less than 3.
2) an intermediate increment of higher sand and coarse
silt content and a ̂ ^ ratio generally greater
than 3.
3) a lower increment of low sand content in which a
paleosol is developed.
Organic matter from the paleosol developed in the basal loess
at site WZ-1 was radiocarbon dated as 25,000 ± 2500 years.
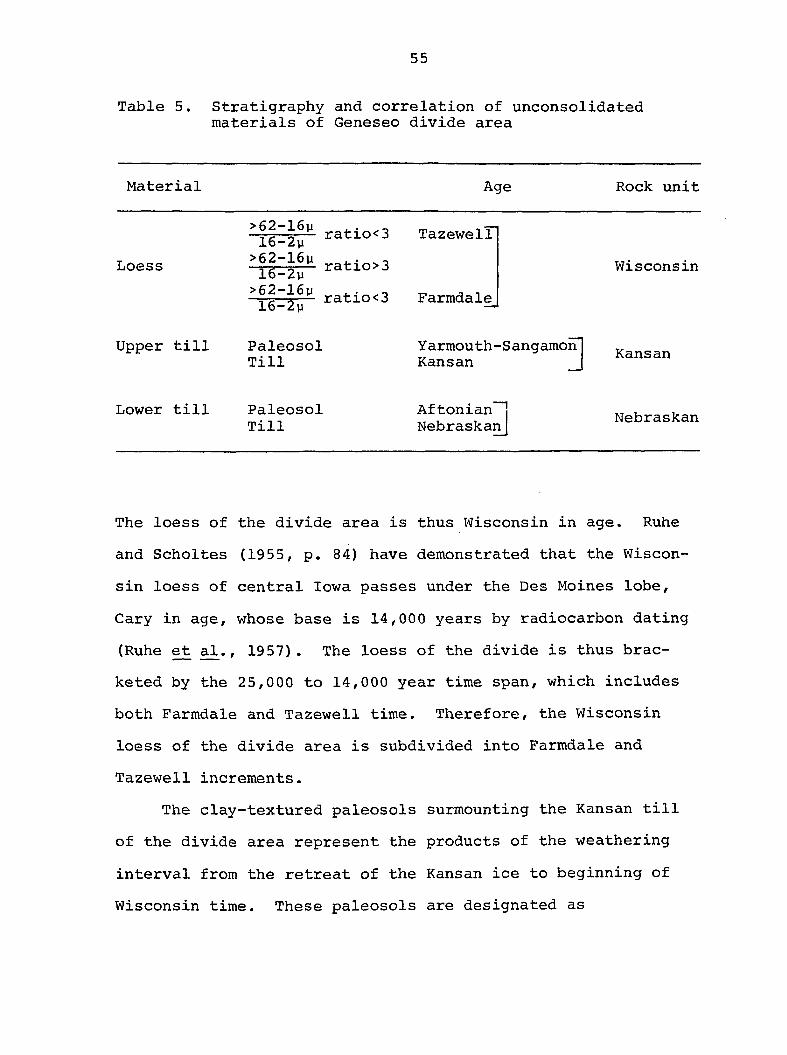
55
Table 5. Stratigraphy and correlation of unconsolidated materials of Geneseo divide area
Material Age Rock unit
>62 -16y 16 -2% >62 -16ii 16 -2v >62 -16p
Loess
16-2
ratio<3
ratio>3
ratio<3
Tazewell
Farmdale
Wisconsin
Upper till Paleosol Till
Yarmouth-Sangamonl Kansan _J Kansan
Lower till Paleosol Till
Aftonian""! NebraskanJ
Nebraskan
The loess of the divide area is thus Wisconsin in age. Ruhe
and Scholtes (1955, p. 84) have demonstrated that the Wiscon
sin loess of central Iowa passes under the Des Moines lobe,
Gary in age, whose base is 14,000 years by radiocarbon dating
(Ruhe et al., 1957). The loess of the divide is thus brac
keted by the 25,000 to 14,000 year time span, which includes
both Farmdale and Tazewell time. Therefore, the Wisconsin
loess of the divide area is subdivided into Farmdale and
Tazewell increments.
The clay-textured paleosols surmounting the Kansan till
of the divide area represent the products of the weathering
interval from the retreat of the Kansan ice to beginning of
Wisconsin time. These paleosols are designated as
56
Yarmouth-Sangamon.
The clay-textured paleosols beneath the Kansan till sur
mount the Nebraskan till and represent the weathering interval
between the retreat of the Nebraskan ice and the advance of
the Kansan. These paleosols are referred to as Aftonian.
Stratigraphie sequence of lower landscape
The area designated as lower landscape is shown on Figure
3. It has the characteristic topography of the lowan drift
plain (Kay and Graham, 1943, p. 101). The elevation of the
lower landscape on which the sites discussed in the following
section are located is approximately 990 feet, which is about
50 feet lower than the surface of site WZ-1 on the Geneseo
divide area.
Loess Core samples of site GS-6 (Figure 3), located
on a summit of the lower landscape area, were collected to a
depth of 97 inches. These samples were described and analyzed
in the laboratory. Data for this site are presented in Tables
6a and 6b. Loess thickness is 5.8 feet. The maximum clay
content, about 32 percent, is at approximately 1.5 feet in the
B horizon of the soil solum. Below this depth the clay con
tent decreases gradually to 21.4 percent at 5.8 feet. The
upper 5.5 feet of loess has a sand content that is generally
less than 5 percent and a ratio generally less than 3.
At 5.5 feet, the sand content increases to 21.4 percent and
the ratio increases to a value of 5.5. This zone is 16-2vi
characteristic of the basal loess of the lower landscape in
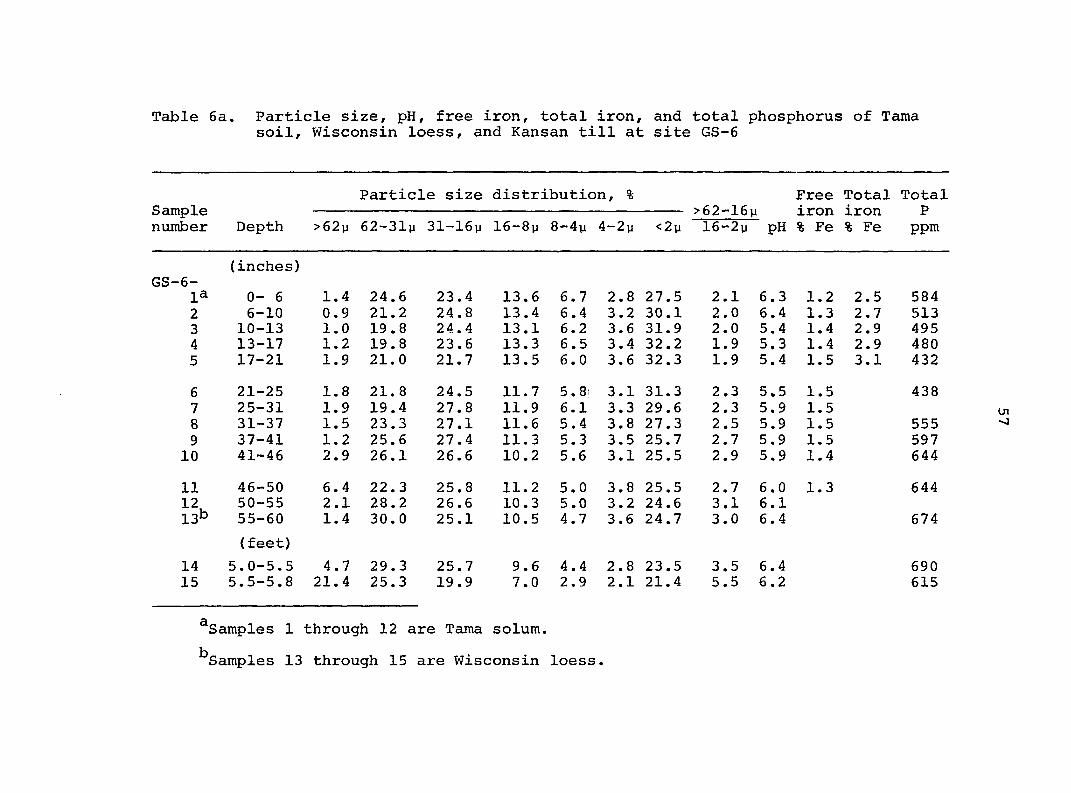
Table 6a. Particle size, pH, free iron, total iron, and total phosphorus of Tama soil, Wisconsin loess, and Kansan till at site GS-6
Particle size distribution, % Free Total Total Sample >62-16# iron iron P number Depth >62# 62-31# 31-16# 16-8# 8-4# 4-2# <2# 16-2# pH % Fe % Fe ppm
(inches) GS—6 —
la 0— 6 1.4 24.6 23.4 13.6 6.7 2.8 27.5 2.1 6.3 1.2 2.5 584 2 6 — 10 0.9 21.2 24.8 13.4 6.4 3.2 30.1 2.0 6.4 1.3 2.7 513 3 10-13 1.0 19.8 24.4 13.1 6.2 3.6 31.9 2.0 5.4 1.4 2.9 495 4 13-17 1.2 19.8 23.6 13.3 6.5 3.4 32.2 1.9 5.3 1.4 2.9 480 5 17-21 1.9 21.0 21.7 13.5 6.0 3.6 32.3 1.9 5.4 1.5 3.1 432
6 21-25 1.8 21. 8 24.5 11.7 5.8 3.1 31.3 2.3 5.5 1.5 438 7 25-31 1.9 19.4 27.8 11.9 6.1 3.3 29.6 2.3 5.9 1.5 8 31-37 1.5 23.3 27.1 11.6 5.4 3.8 27.3 2.5 5.9 1.5 555 9 37-41 1.2 25.6 27.4 11.3 5.3 3.5 25.7 2.7 5.9 1.5 597 10 41-46 2.9 26.1 26.6 10.2 5.6 3.1 25.5 2.9 5.9 1.4 644
11 46-50 6.4 22.3 25.8 11.2 5.0 3.8 25.5 2.7 6.0 1.3 644 12^ 50-55 2.1 28.2 26.6 10.3 5.0 3.2 24.6 3.1 6.1 13^ 55-60 1.4 30.0 25.1 10.5 4.7 3.6 24.7 3.0 6.4 674
(feet)
14 5.0-5.5 4.7 29.3 25.7 9.6 4.4 2.8 23.5 3.5 6.4 690 15 5.5-5.8 21.4 25.3 19.9 7.0 2.9 2.1 21.4 5.5 6.2 615
^Samples 1 through 12 are Tama solum.
^Samples 13 through 15 are Wisconsin loess.
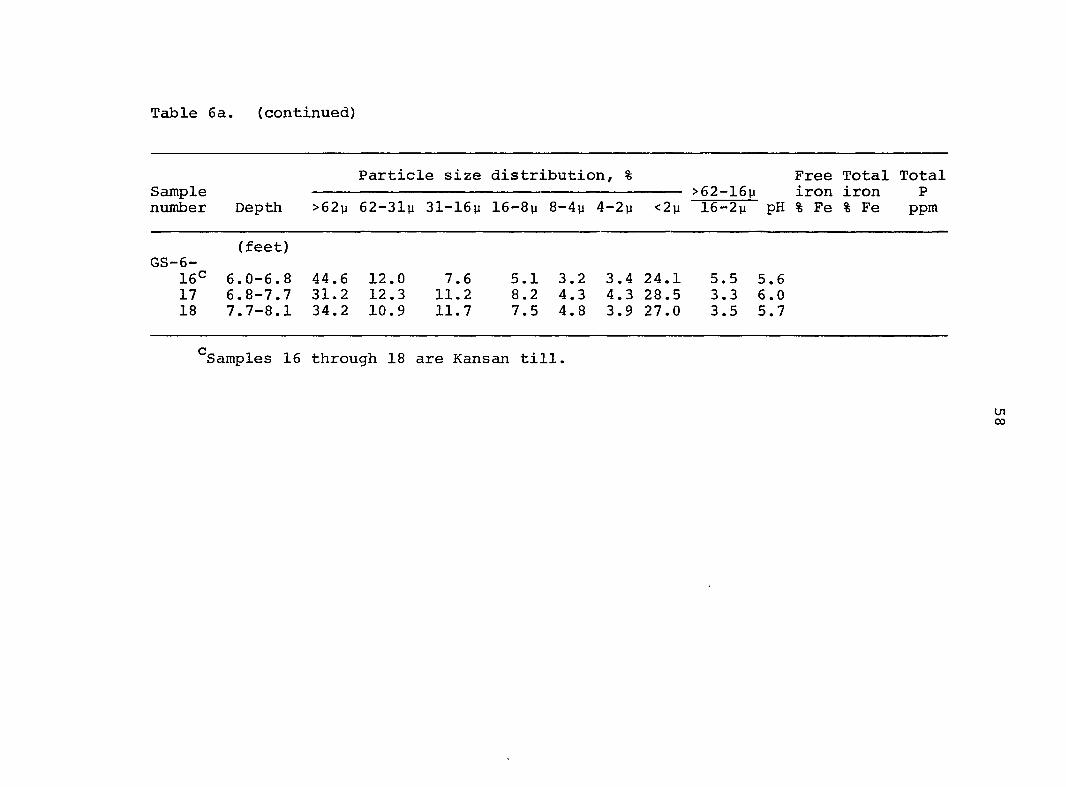
Table 6a. (continued)
Particle size distribution, % Free Total Total Sample >62-16% iron iron P number Depth >62% 62-31% 31-16% 16-8% 8-4% 4-2% <2% 16-2% pH % Fe % Fe ppm
(feet) GS—6—
16^ 6.0-6.8 44.6 12.0 7.6 5.1 3.2 3.4 24.1 5.5 5.6 17 6.8-7.7 31.2 12.3 11.2 8.2 4.3 4.3 28.5 3.3 6.0 18 7.7-8.1 34.2 10.9 11.7 7.5 4.8 3.9 27.0 3.5 5.7
c Samples 16 through 18 are Kansan till.
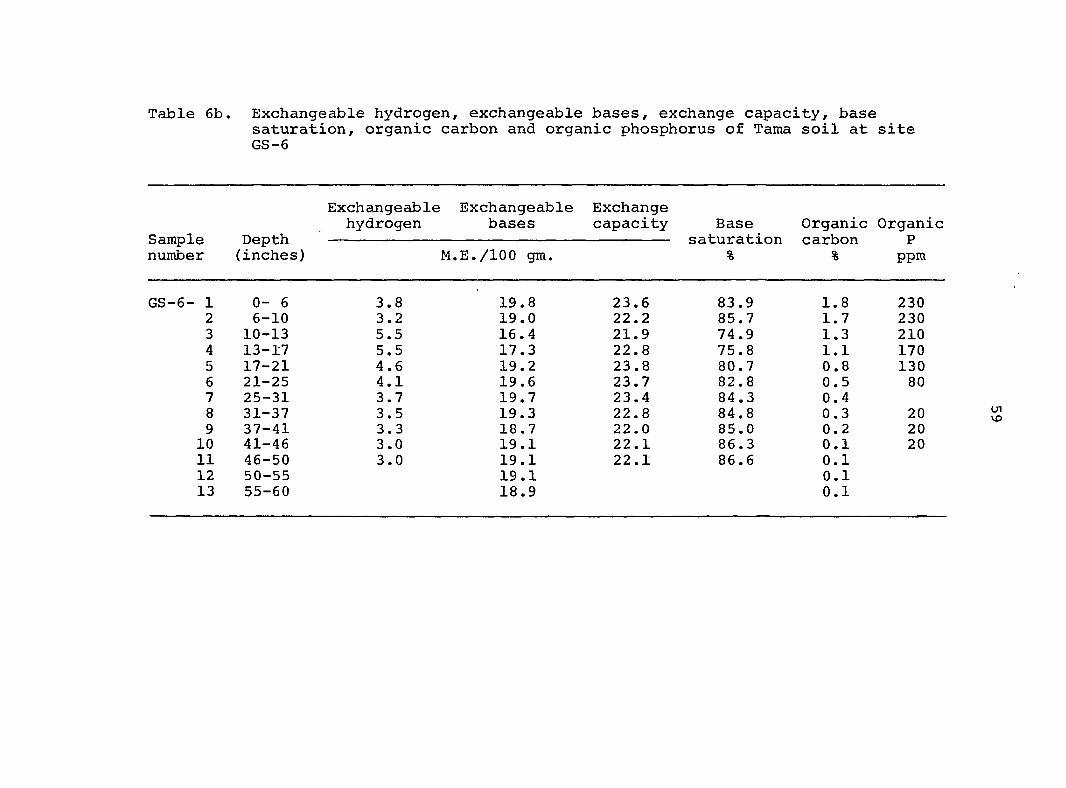
Table 6b. Exchangeable hydrogen, exchangeable bases, exchange capacity, base saturation, organic carbon and organic phosphorus of Tama soil at site GS-6
Exchangeable Exchangeable Exchange hydrogen bases capacity Base Organic Organic
Sample Depth saturation carbon P number (inches) M.E./lOO gm. % % ppm
1 0- 6 3.8 19.8 23.6 83.9 1.8 230 2 6-10 3.2 19.0 22.2 85.7 1.7 230 3 10-13 5.5 16.4 21.9 74.9 1.3 210 4 13-17 5.5 17.3 22.8 75.8 1.1 170 5 17-21 4.6 19.2 23.8 80.7 0.8 130 6 21-25 4.1 19.6 23.7 82.8 0.5 80 7 25-31 3.7 19.7 23.4 84.3 0.4 8 31-37 3.5 19.3 22.8 84.8 0.3 20 9 37-41 3.3 18.7 22.0 85.0 0.2 20 10 41-46 3.0 19.1 22.1 86.3 0.1 20 11 46-50 3.0 19.1 22.1 86.6 0.1 12 50-55 19.1 0.1 13 55-60 18.9 0.1
60
this area.
The sequence of weathering zones described in the loess
at site GS-6 is:
Surficial soil 0-3.8 feet Oxidized and leached 3.8-5.8 feet
A few yellowish brown mottles are present below a depth of 37
inches. Carbonates are not present and the maximum pH value
is 6.4 between 4.5 and 5.5 feet.
Upper till At site GS-6 (Figure 3), the basal loess
of high sand content is underlain by 0.2 foot of sand.
Beneath the sand and at a depth of 6 feet, the glacial till is
loam textured and contains a few pebbles larger than 2 mm.
The sand content is 44.6 percent and clay content is 24.1 per
cent (Table 6a). Below this depth, the sand content decreases
to 31.2 percent and clay content increases slightly. Thus,
the texture of the upper till ranges from loam to light clay
loam. There is no paleosol developed at the surface of the
upper till.
At site G-55 (Figure 3), on the same landscape level as
site GS-6, a drill hole showed 5 feet of loess underlain by
till. Surface elevation of this site is 993.1 feet. The till
is loam in texture and extends from 5 feet to 11 feet. Carbon
ates are not present in the till. As in the GS-6 site, there
is no structural or textural indication of solum development
in the till. This perhaps indicates a short time period
between exposure of the upper till surface and loess
61
deposition.
Other sites, G-22, G-30, G-36, and G-104, shown on
Figure 3 and described in Appendix A, show a similar sequence
of about 5 feet of loess underlain by a loam till. No
paleosol occurs at the surface of the upper till. At many
sites a stone line separates the till surface from the loess.
Commonly, sand of variable thickness is between the loess and
the till.
The relationship of the upper till of the lower landscape
to the upper till of the divide area (Figure 3) will be dis
cussed later.
Lower till The loess and upper till of the lower
landscape are underlain by another till, which will be
referred to as the lower till. The lower till of the lower
landscape is surmounted by a paleosol, clay in texture. At
site G-55 (Figure 3), the elevation of the surface of this
paleosol is 980.1 feet. It is overlain by silts, silt loam in
texture. Color of these silts is gray (5Y 5/1), and the
paleosol is gray to light gray (5Y 6/1) in color. The
paleosol grades downward into noncalcareous, loam-textured
glacial till. Carbonates are present in this till 15 feet
beneath the surface of the paleosol, and the till remains
calcareous below this depth.
The noncalcareous gray silts above the paleosol are
similar to the Aftonian silts present beneath the upper till
of the divide and have approximately the same elevation. The
62
elevation of the silts at site G-12 on the divide is 986.7
feet, while at site G-55 on the lower landscape the elevation
is 982.1 feet. At site G-12 these silts underlie Kansan till
which is surmounted by a Yarmouth-Sangamon paleosol. The
paleosol beneath the silts on the lower landscape is similar
to that present at sites G-12 and WZ-3. At sites WZ-3 and
G-12 on the divide, the Aftonian paleosols have elevations of
985.7 and 982 feet respectively, while at site G-55 on the
lower landscape, the paleosol has an elevation of 9 80.1 feet.
Elevation of the carbonates in the lower till is 957.1 feet
at site G-55. The elevation of the carbonates in the
Nebraskan till of site G-3B on the divide is 961 feet. Thus,
the silts, paleosol, and lower till of the lower landscape
equate in characteristics and elevations with the Aftonian
silts, Aftonian paleosols, and Nebraskan till of the divide
area.
Stratigraphie sequence under slopes that descend from divide area to lower landscape
The similarity in properties and elevations of the
paleosols beneath the upper till on the lower landscape and
the Aftonian paleosols beneath the Kansan till on the divide
area indicated they were perhaps stratigraphically equivalent.
This observation raised several questions, among which were
the following:
1) Could the Aftonian paleosol be traced from the divide area to the lower landscape?
63
2) Does the upper till of the lower landscape overlie an Aftonian paleosol and Nebraskan till?
3) If the Aftonian paleosol and Nebraskan till are immediately beneath the upper till, what happened to the Yarmouth-Sangamon paleosol and Kansan till between these two landscape levels?
4) Is there a relationship between the differences in the stratigraphy of the till and the loess on the two landscape levels?
Detailed traverses were made on slopes that descend from
the divide area to the lower landscape in an attempt to
resolve these questions.
Loess Traverse A (Figure 3) includes a series of
sites perpendicular to the axis of the divide area. Sites
G-38 and WZ-1 are located on the summit of the paha forming
the divide area and sites WZ-2, WZ-3, WZ-3A, WZ-4, and WZ-5
are located on the N-NE facing slopes of the paha. Loess
thickness decreases from a maximum of 36.4 feet at site WZ-1
to a minimum of 8.8 feet at site WZ-3 (Figure 6). At site
WZ-4, loess thickness increases to 19.8 feet and then
decreases to 13.4 feet at site WZ-5.
Particle-size distribution is variable from site to site
and also varies with depth at an individual site. The upper
loess at site WZ-2 in which the soil solum is formed has a
high sand content ranging up to 33.5 percent (Table 7). The
zone of high sand content at this site correlates in elevation
with the zone of high sand content at site WZ-1. Beneath the
solum at site WZ-2, the sand content decreases to 6.6 percent,
but the content of coarse silt remains high as is shown by the
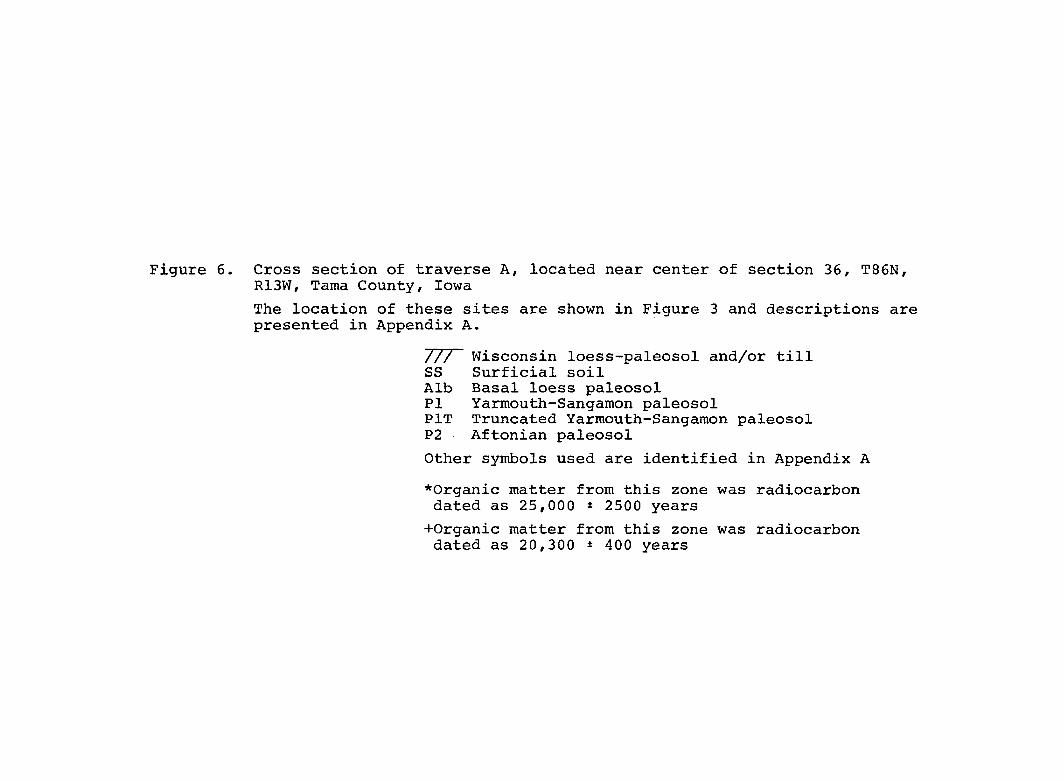
Figure 6. Cross section of traverse A, located near center of section 36, T86N, R13W, Tama County, Iowa
The location of these sites are shown in Figure 3 and descriptions are presented in Appendix A.
/// Wisconsin loess-paleosol and/or till SS Surficial soil Alb Basal loess paleosol PI Yarmouth-Sangamon paleosol PIT Truncated Yarmouth-Sangamon paleosol P2 Aftonian paleosol
Other symbols used are identified in Appendix A
•Organic matter from this zone was radiocarbon dated as 25,000 ± 2500 years
+Organic matter from this zone was radiocarbon dated as 20,300 ± 400 years
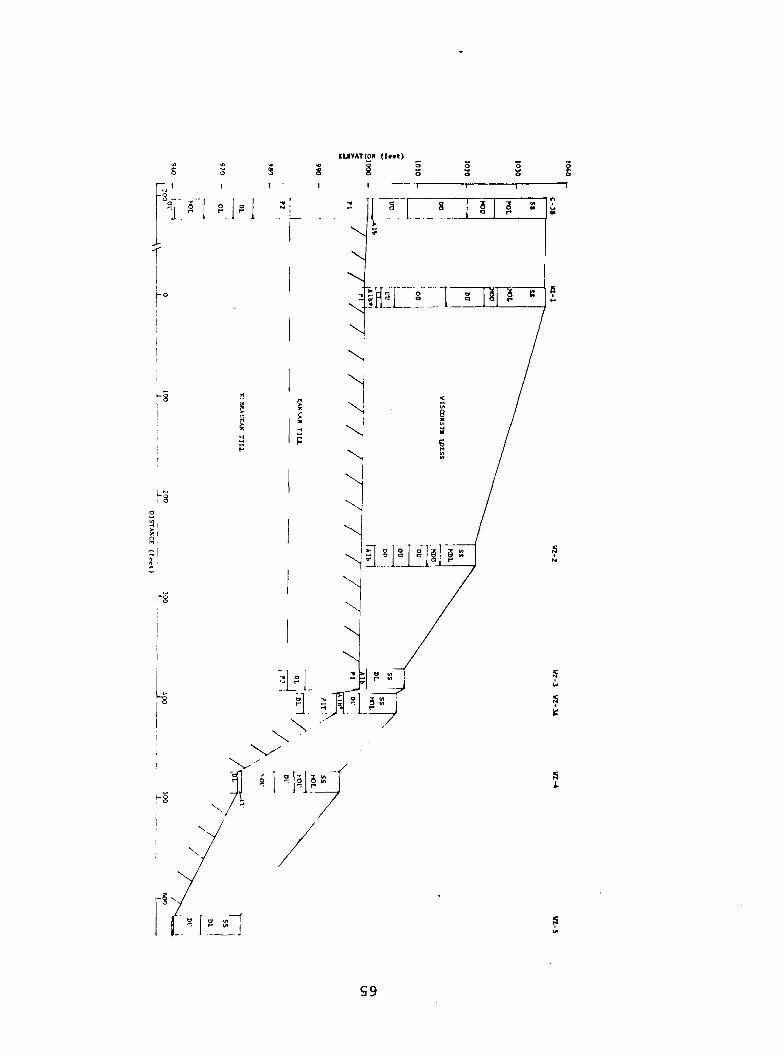
EUVATION ( I t t t )
S9
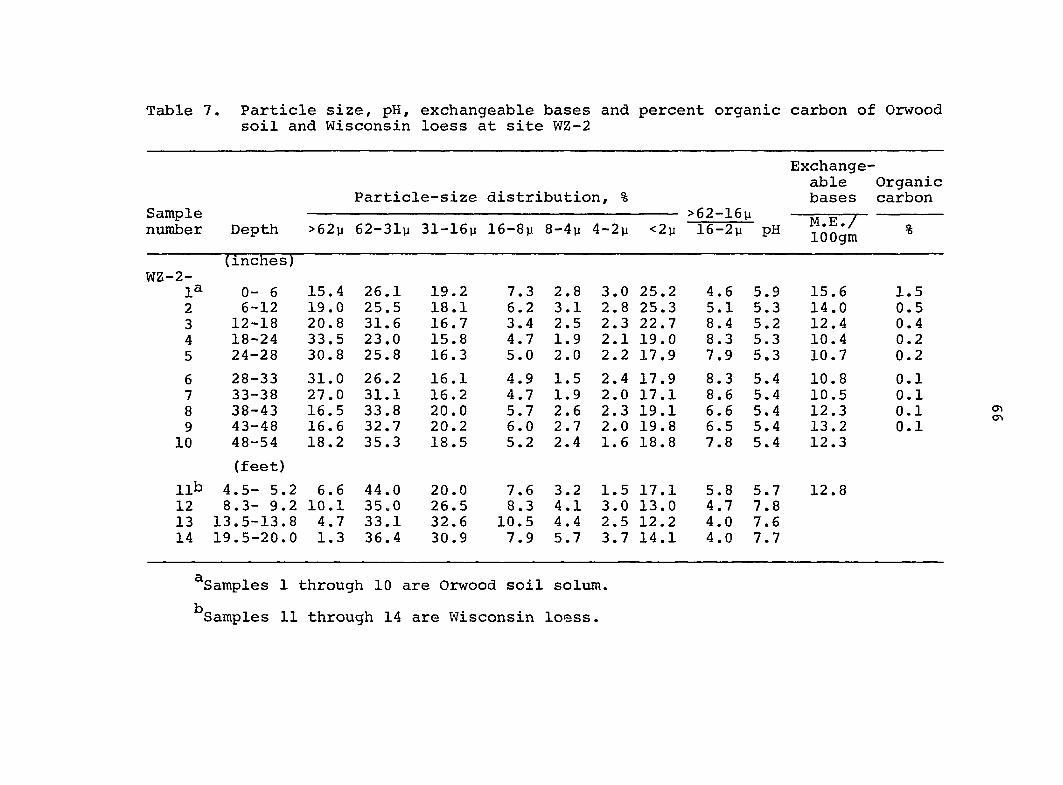
Table 7. Particle size, pH, exchangeable bases and percent organic carbon of Orwood soil and Wisconsin loess at site WZ-2
Sample number
Particle-size distribution, %
Exchangeable Organic bases carbon
>62—16y Depth >62y 62-31% 31-16% 16—8% 8—4% 4-2% <2% 16—2% pH M.E./
lOOgm %
WZ-2-1^ 2 3 4 5
6 7 8 9 10
lib 12 13 14
(inches)
0 - 6 6-12 12-18 18-24 24-28
28-33 33-38 38-43 43-48 48-54
(feet)
15.4 19.0 2 0 . 8 33.5 30.8
31.0 27.0 16.5 16.6 18.2
6.6 4.5- 5.2 8.3- 9.2 10.1 13.5-13.8 4.7 19.5-20.0 1.3
26.1 25.5 31.6 23.0 25.8
2 6 . 2 31.1 33.8 32.7 35.3
44.0 35.0 33.1 36.4
19.2 18.1 16.7 15.8 16.3
16 16 2 0 . 0 2 0 . 2 18.5
2 0 . 0 26.5 32.6 30.9
7.3 6 . 2 3.4 4.7 5.0
4.9 4.7 5.7 6 . 0 5.2
7.6 8.3 10.5 7.9
2.8 3.1 2.5 1.9 2.0
1.5 1.9 2 . 6 2.7 2.4
3.2 4.1 4.4 5.7
3.0 25.2 2.8 25.3 2.3 22.7 2.1 19.0 2.2 17.9
2.4 17.9 2.0 17.1 2.3 19.1 2.0 19.8 1.6 18.8
1.5 17.1 3.0 13.0 2.5 12.2 3.7 14.1
4.6 5.1 8.4 8.3 7.9
8.3 8 . 6 6 . 6 6.5 7.8
5.8 4.7 4.0 4.0
5.9 5.3 5.2 5.3 5.3
5.4 5.4 5.4 5.4 5.4
5.7 7.8 7.6 7.7
15.6 14.0 12.4 10.4 10.7
10.8 10.5 12.3 13.2 12.3
12.8
1.5 0.5 0.4 0 . 2 0 . 2
0.1 0.1 0.1 0.1
^Samples 1 through 10 are Orwood soil solum.
^Samples 11 through 14 are Wisconsin loess.
67
^l6-2p^ ratio (Table 7 and Figure 7). At site WZ-3, the sand
content is greatest in the upper 11 inches (Table 4), but the
maximum sand content in this profile is 7.1 percent. However,
as shown by the ratios, the loess from which the soil
profiles at sites WZ-2 and WZ-3 have developed has a higher
sand and coarse silt content than that of site WZ-1. Zones
of organic matter are present in the basal noncalcareous loess
of sites WZ-2 and WZ-3. Stratigraphically, these zones
correlated with the paleosol identified in the basal loess at
site WZ-1 (Figure 6).
At site WZ-3A, a paleosol is present in the basal non
calcareous loess. The surface of this paleosol is 5.4 feet
below the surface of the one present at site WZ-3. As at
sites WZ-1, WZ-2, and WZ-3, the paleosol is weakly developed
and is composed of alternating bands of organic matter and
leached silts. Organic matter from the basal organic zone of
site WZ-3A was radiocarbon dated (sample 1-1409) as 20,300
± 400 years. This is a younger date than the 25,000 ± 2500
year Farmdale date obtained from the basal organic zone at
site WZ-1.
At sites WZ-4 and WZ-5, the sand and coarse silt content
of the upper loess (Tables 9 and 10 and Figure 7) is greater
than that of the upper 5.5 feet of loess at site WZ-1 as shown
by the ratios. However, the maximum sand content is
much less than at site WZ-2. The first great increase in sand
is at a depth of 13.0 feet at site WZ-4. At site WZ-5, there
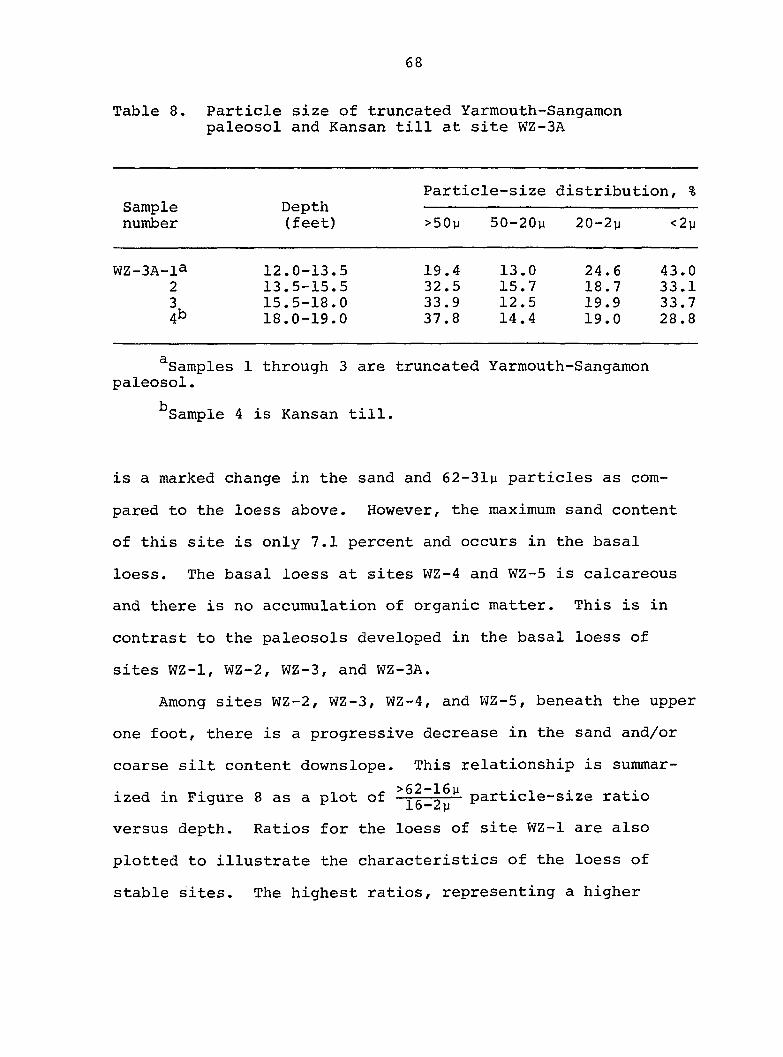
68
Table 8. Particle size of truncated Yarmouth-Sangamon paleosol and Kansan till at site WZ-3A
Particle-size distribution, % Sample Depth number (feet) >50p 50-20# 20-2# <2y
WZ-3A-ia 12.0-13.5 19.4 13.0 24.6 43.0 2 13.5-15.5 32.5 15.7 18.7 33.1 3 15.5-18.0 33.9 12.5 19.9 33.7 4b 18.0-19.0 37.8 14.4 19.0 28.8
^Samples 1 through 3 are truncated Yarmouth-Sangamon paleosol.
^Sample 4 is Kansan till.
is a marked change in the sand and 62-31# particles as com
pared to the loess above. However, the maximum sand content
of this site is only 7.1 percent and occurs in the basal
loess. The basal loess at sites WZ-4 and WZ-5 is calcareous
and there is no accumulation of organic matter. This is in
contrast to the paleosols developed in the basal loess of
sites WZ-1, WZ-2, WZ-3, and WZ-3A.
Among sites WZ-2, WZ-3, WZ-4, and WZ-5, beneath the upper
one foot, there is a progressive decrease in the sand and/or
coarse silt content downslope. This relationship is summar
ized in Figure 8 as a plot of pacticle-size ratio
versus depth. Ratios for the loess of site WZ-1 are also
plotted to illustrate the characteristics of the loess of
stable sites. The highest ratios, representing a higher
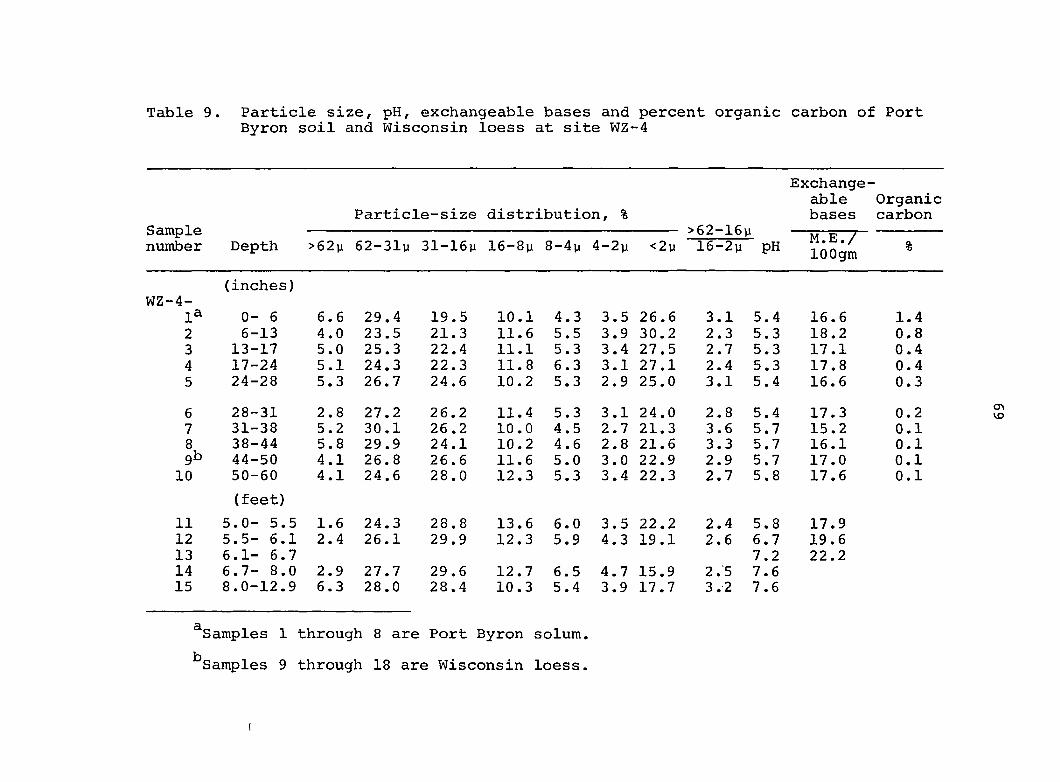
Table 9. Particle size, pH, exchangeable bases and percent organic carbon of Port Byron soil and Wisconsin loess at site WZ-4
Exchangeable Organic
Particle-size distribution, % bases carbon Sample >62-16% — number Depth >62% 62-31% 31-16% 16-8% 8-4% 4-2% <2% 16-2% pH loO m %
(inches) WZ —4—
1^ 0- 6 6.6 29.4 19.5 10.1 4.3 3.5 26.6 3.1 5.4 16.6 1.4 2 6-13 4.0 23.5 21.3 11.6 5.5 3.9 30.2 2.3 5.3 18.2 0.8 3 13-17 5.0 25.3 22.4 11.1 5.3 3.4 27.5 2.7 5.3 17.1 0.4 4 17-24 5.1 24.3 22.3 11.8 6.3 3.1 27.1 2.4 5.3 17.8 0.4 5 24-28 5.3 26.7 24.6 10.2 5.3 2.9 25.0 3.1 5.4 16.6 0.3
6 28-31 2.8 27.2 26.2 11.4 5.3 3.1 24.0 2.8 5.4 17.3 0.2 7 31-38 5.2 30.1 26.2 10.0 4.5 2.7 21.3 3.6 5.7 15.2 0.1 8 38-44 5.8 29.9 24.1 10.2 4.6 2.8 21.6 3.3 5.7 16.1 0.1 gb 44-50 4.1 26.8 26.6 11.6 5.0 3.0 22.9 2.9 5.7 17.0 0.1 10 50-60 4.1 24.6 28.0 12.3 5.3 3.4 22.3 2.7 5.8 17.6 0.1
(feet)
11 5.0- 5.5 1.6 24.3 28.8 13.6 6.0 3.5 22.2 2.4 5.8 17.9 12 5.5- 6.1 2.4 26.1 29.9 12.3 5.9 4.3 19.1 2.6 6.7 19.6 13 6.1- 6.7 7.2 22.2 14 6.7— 8.0 2.9 27.7 29.6 12.7 6.5 4.7 15.9 2.5 7.6 15 8.0-12.9 6.3 28.0 28.4 10.3 5.4 3.9 17.7 3.2 7.6
^Samples 1 through 8 are Port Byron solum.
^Samples 9 through 18 are Wisconsin loess.
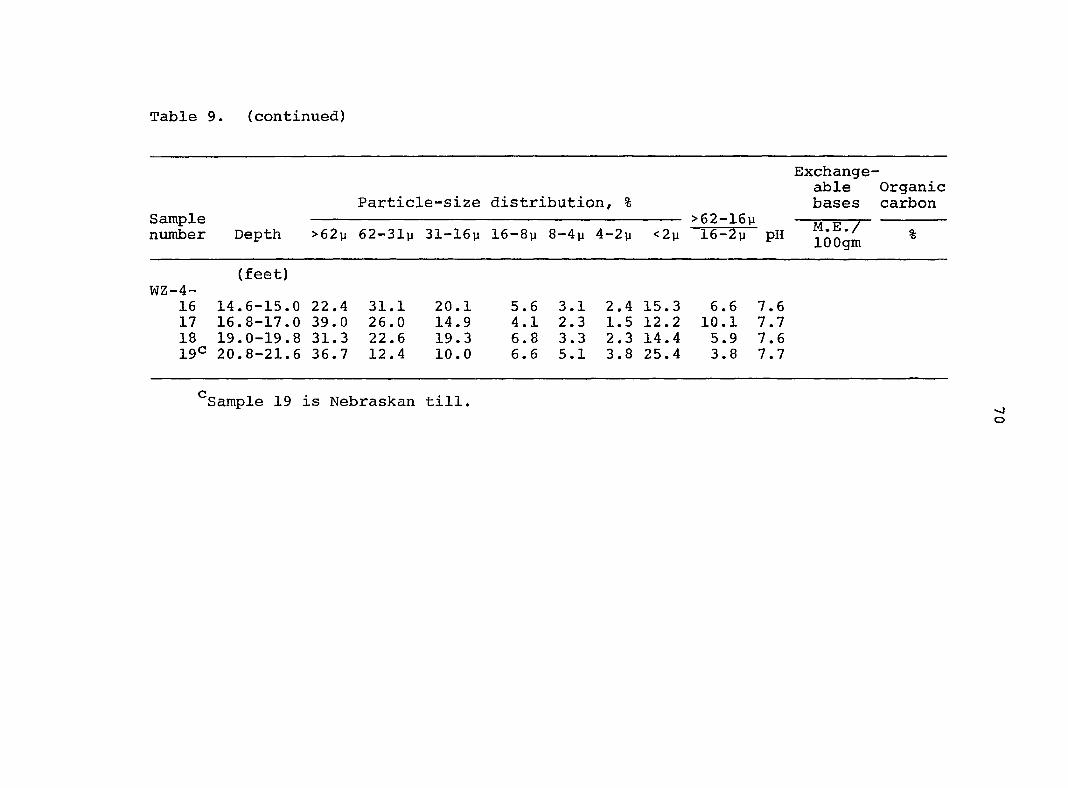
Table 9. (continued)
Exchangeable Organic
Particle-size distribution, % bases carbon Sample >62-16% —m v / number Depth >62y 62-31% 31-16% 16-8% 8-4% 4-2% <2% 16-2% pH loo'm %
(feet) WZ—4 —
16 14.6-15.0 22.4 31.1 20.1 5.6 3.1 2.4 15.3 6.6 7.6 17 16.8-17.0 39.0 26.0 14.9 4.1 2.3 1.5 12.2 10.1 7.7 18 19.0-19.8 31.3 22.6 19.3 6.8 3.3 2.3 14.4 5.9 7.6 I9C 20.8-21.6 36.7 12.4 10.0 6.6 5.1 3.8 25.4 3.8 7.7
^Sample 19 is Nebraskan till.
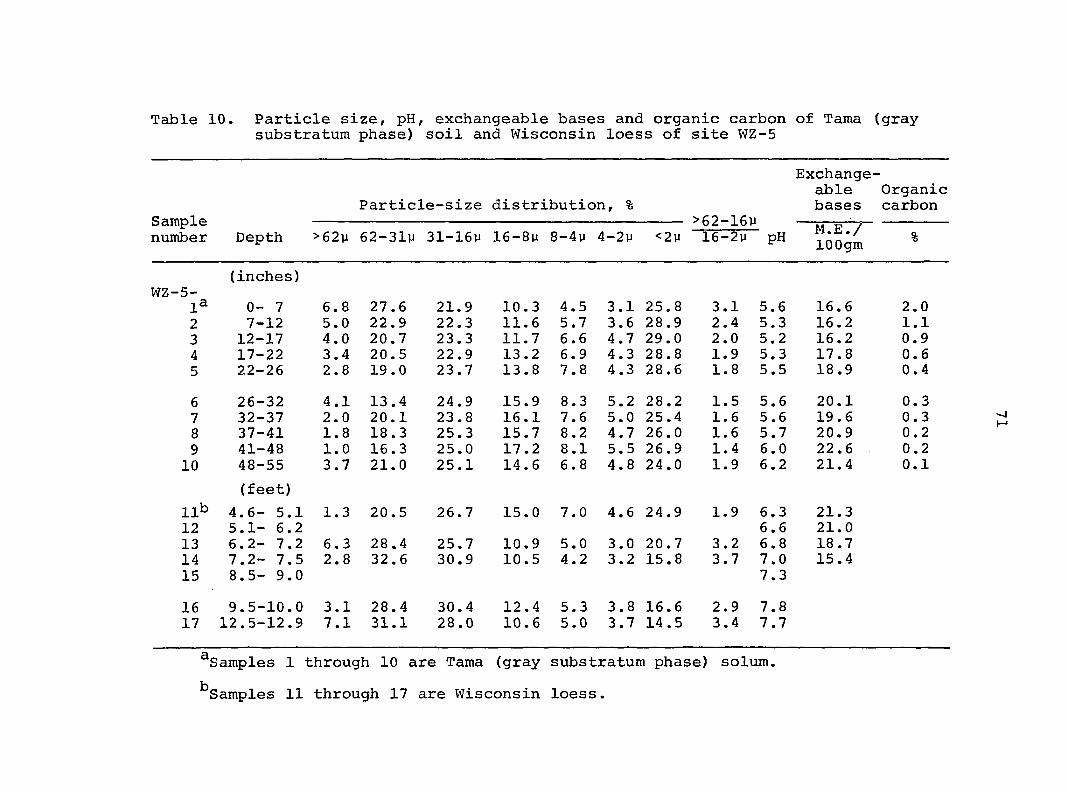
Table 10. Particle size, pH, exchangeable bases and organic carbon of Tama (gray substratum phase) soil and Wisconsin loess of site WZ-5
Exchangeable Organic
Particle-size distribution, % bases carbon Sample >62-16% —„ „ •, number Depth >62y 62-31n 31-16; 16-8; 8-4y 4-2; <2; 16-2; pH lôogm %
(inches) WZ-5-
1^ 0- 7 6.8 27.6 21.9 10.3 4.5 3.1 25.8 3.1 5.6 16.6 2.0 2 7-12 5.0 22.9 22.3 11.6 5.7 3.6 28.9 2.4 5.3 16.2 1.1 3 12-17 4.0 20.7 23.3 11.7 6.6 4.7 29.0 2.0 5.2 16.2 0.9 4 17-22 3.4 20.5 22.9 13.2 6.9 4.3 28.8 1.9 5.3 17.8 0.6 5 22-26 2.8 19.0 23.7 13.8 7.8 4.3 28.6 1.8 5.5 18.9 0.4
6 26-32 4.1 13.4 24.9 15.9 8.3 5.2 28.2 1.5 5.6 20.1 0.3 7 32-37 2.0 20.1 23.8 16.1 7.6 5.0 25.4 1.6 5.6 19.6 0.3 8 37-41 1.8 18.3 25.3 15.7 8.2 4.7 26.0 1.6 5.7 20.9 0.2 9 41-48 1.0 16.3 25.0 17.2 8.1 5.5 26.9 1.4 6.0 22.6 0.2 10 48-55 3.7 21.0 25.1 14.6 6.8 4.8 24.0 1.9 6.2 21.4 0.1
(feet)
lib 4.6- 5.1 1.3 20.5 26.7 15.0 7.0 4.6 24.9 1.9 6.3 21.3 12 5.1- 6.2 6.6 21.0 13 6.2- 7.2 6.3 28.4 25.7 10.9 5.0 3.0 20.7 3.2 6.8 18.7 14 7.2- 7.5 2.8 32.6 30.9 10.5 4.2 3.2 15.8 3.7 7.0 15.4 15 8.5- 9.0 7.3
16 9.5-10.0 3.1 28.4 30.4 12.4 5.3 3.8 16.6 2.9 7.8 17 12.5-12.9 7.1 31.1 28.0 10.6 5.0 3.7 14.5 3.4 7.7
^Samples 1 through 10 are Tama (gray substratum phase) solum.
^Samples 11 through 17 are Wisconsin loess.
Figure 7. Variation of particle-size ratio of Wisconsin loess with elevation at sites WZ-1, WZ-2, WZ-3, WZ-4 and WZ-5 (data from Tables 2a, 7, 4, 9 and 10)
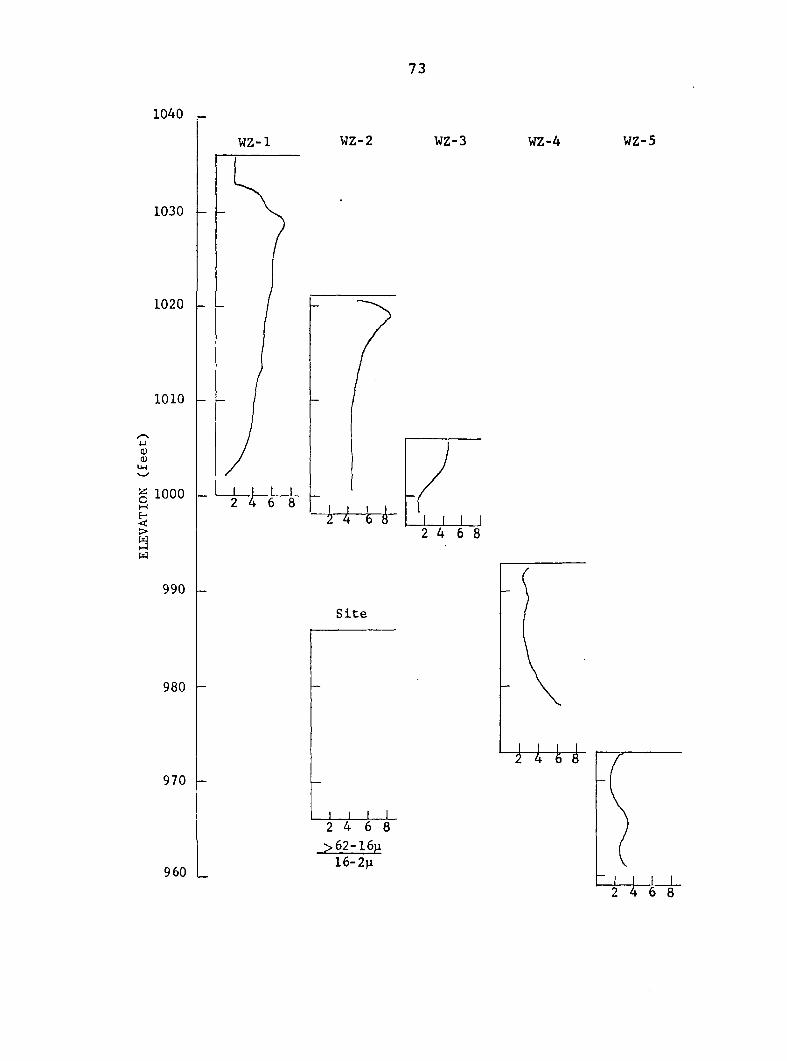
73
1040
1030
1020
1010
u 0) 0)
§ 1000 M
§ w
990
980
970
960
WZ-1 WZ-2 WZ-3 WZ-4 WZ-5
1 I L—L 2 4 6 8
2 W 1 I I I 2 4 6 8
Site
i-t-U
J I L 2 4 6 8 >62-16p 16-2)1
2 4 6 8
Figure 8. Distribution of particle-size ratios of Wisconsin loess with depth at sites WZ-1, WZ-2, WZ-3, WZ-4, and WZ-5 (data from Tables 2a, 7, 4, 9 and 10)
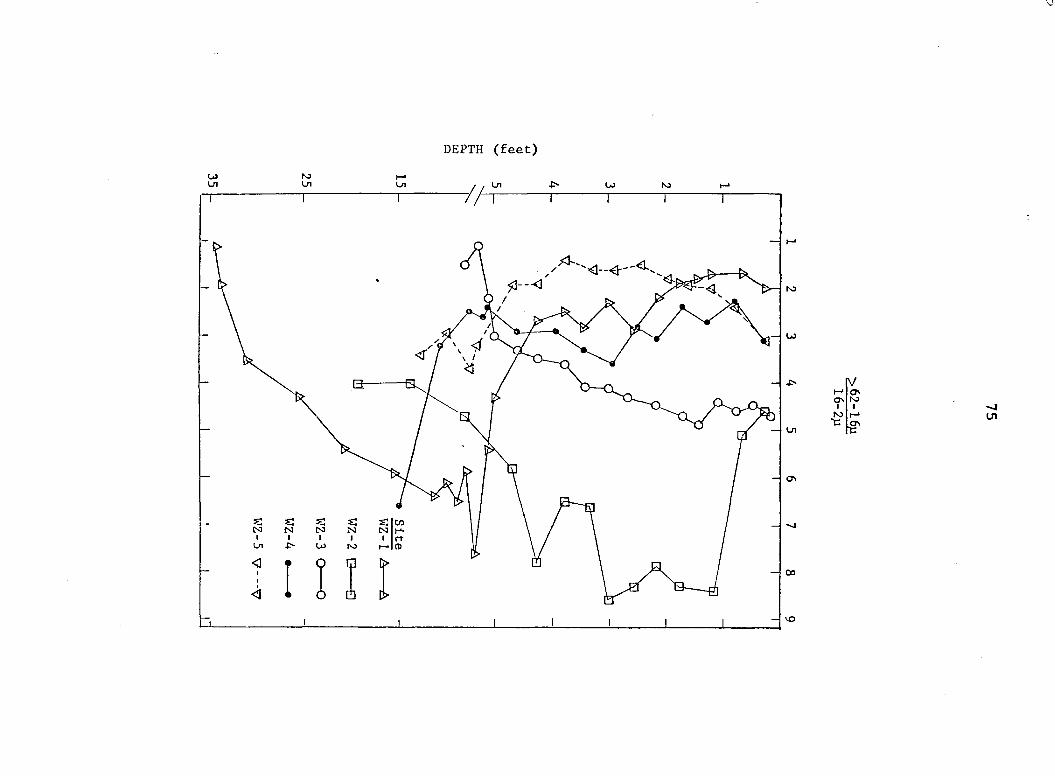
DEPTH ( fee t )
76
content of sand and/or coarse silt are associated with site
WZ-2 where the soil solum is formed in material of high sand
content. Downslope from this site, the ratios decrease
systematically, suggesting some degree of sorting subsequent
to aeolian deposition. The sorting could be a result of post-
loess erosion on the slopes.
The weathering zones present in the loess of the divide
area are shown in Figure 6. Nomenclature and general charac
teristics of the zones are given in Appendix A. The complexity
of the weathering zonation is greatest at site WZ-1 and this
site also has the maximum thickness of loess. Zonation almost
as complex occurs on the slopes such as site WZ-2, where loess
thickness is 16 feet less than at site WZ-1. The loess is
underlain by a clay-textured Yarmouth-Sangamon paleosol at
these two sites. Complex zonation is also present at site
WZ-4, which is underlain by loam-textured till. The surficial
soil of the lower landscape is underlain by only an oxidized
and leached zone. However, the point to be emphasized is that
the weathering zones present in the loess of the slopes and of
the stable divide area are more complex than those of the
lower landscape. The weathering zones will be discussed in
more detail in another section of this thesis.
Upper till At site WZ-3 (Figure 3) on the slope of
the paha, the till beneath the loess is surmounted by a
paleosol (PI, Figure 6), the surface of which has an elevation
of 997 feet. It is overlain by a basal-loess paleosol. The
77
paleosol surmounting the till has a low sand (<7 percent) con
tent and a clay content of 49.8 percent in the upper 3 feet
(Table 4). Solum thickness of this paleosol is 140.4 inches
and"; as discussed previously, the characteristics of this
paleosol may reflect an accretion of materials similar to that
postulated for the Yarmouth-Sangamon paleosol at site G-402.
At site WZ-1, 381 feet to the southwest, the elevation of the
surface of the clay-textured paleosol beneath the loess is
999.2 feet and at site G-38, 200 feet south of site WZ-1, the
elevation of the top of the paleosol is 1000 feet. Slope
gradient of the buried surface between site G-38 and site WZ-3
is about 0.5 percent.
Twenty-five feet northeast of site WZ-3, at site WZ-3A,
loess thickness increases to 12 feet and the elevation of the
top of the underlying clay-textured horizon is 991 feet. This
elevation is 6 feet below the top of the paleosol present at
site WZ-3. Field observations and morphological descriptions
indicated the clay-textured horizon immediately beneath the
loess at site WZ-3A was similar to the B23b horizon 6 feet
beneath the top of the paleosol at site WZ-3. Most notable
characteristic of the lower horizons of the paleosol at site
WZ-3 (description. Appendix A) is the higher sand content as
compared to the upper 4 feet. Particle-size data for these
paleosols, presented in Tables 4 and 8, support the field and
morphological interpretation. A plot of clay distribution
with elevation is shown in Figure 9. This plot illustrates
Figure 9. Distribution of <2y clay in Yarmouth-Sangamon paleosol (PI) and truncated Yarmouth-Sangamon paleosol (PIT) at sites WZ-3 and WZ-3A (data from Tables 4 and 8)
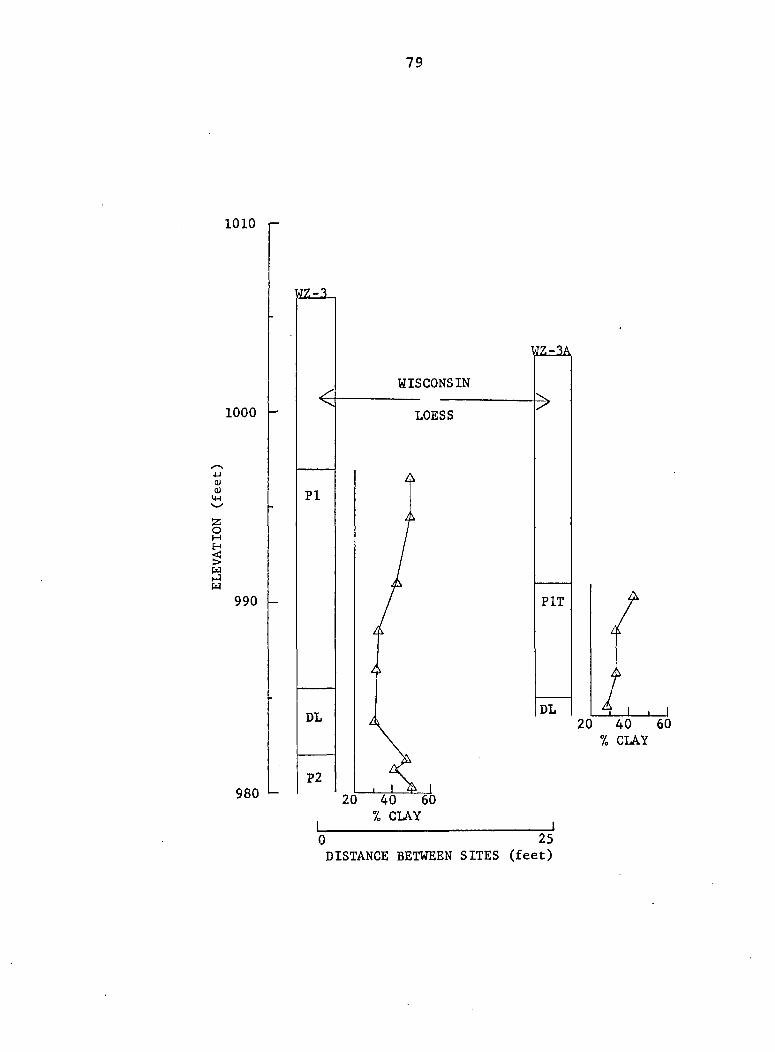
79
1010
1000
(U (U 14-1
z s
s s w
990
980
W7.-T
<
PI
DL
P2
WISCONSIN
LOESS
20 40 60
7o CIAY
WZ-.U
>
PIT
DL
J 0 25
DISTANCE BETWEEN SITES (feet)
20 40 60
7o CLAY
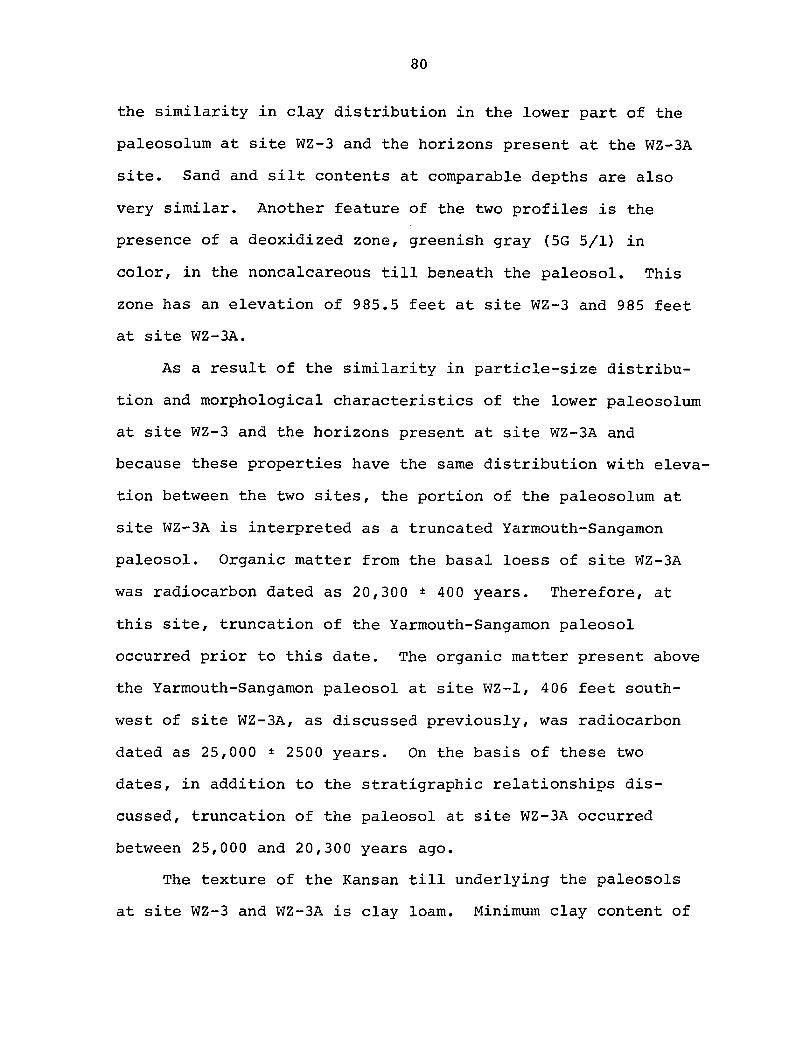
80
the similarity in clay distribution in the lower part of the
paleosolum at site WZ-3 and the horizons present at the WZ-3A
site. Sand and silt contents at comparable depths are also
very similar. Another feature of the two profiles is the
presence of a deoxidized zone, greenish gray (5G 5/1) in
color, in the noncalcareous till beneath the paleosol. This
zone has an elevation of 985.5 feet at site WZ-3 and 985 feet
at site WZ-3A.
As a result of the similarity in particle-size distribu
tion and morphological characteristics of the lower paleosolum
at site WZ-3 and the horizons present at site WZ-3A and
because these properties have the same distribution with eleva
tion between the two sites, the portion of the paleosolum at
site WZ-3A is interpreted as a truncated Yarmouth-Sangamon
paleosol. Organic matter from the basal loess of site WZ-3A
was radiocarbon dated as 20,300 ± 400 years. Therefore, at
this site, truncation of the Yarmouth-Sangamon paleosol
occurred prior to this date. The organic matter present above
the Yarmouth-Sangamon paleosol at site WZ-1, 406 feet south
west of site WZ-3A, as discussed previously, was radiocarbon
dated as 25,000 ± 2500 years. On the basis of these two
dates, in addition to the stratigraphie relationships dis
cussed, truncation of the paleosol at site WZ-3A occurred
between 25,000 and 20,300 years ago.
The texture of the Kansan till underlying the paleosols
at site WZ-3 and WZ-3A is clay loam. Minimum clay content of
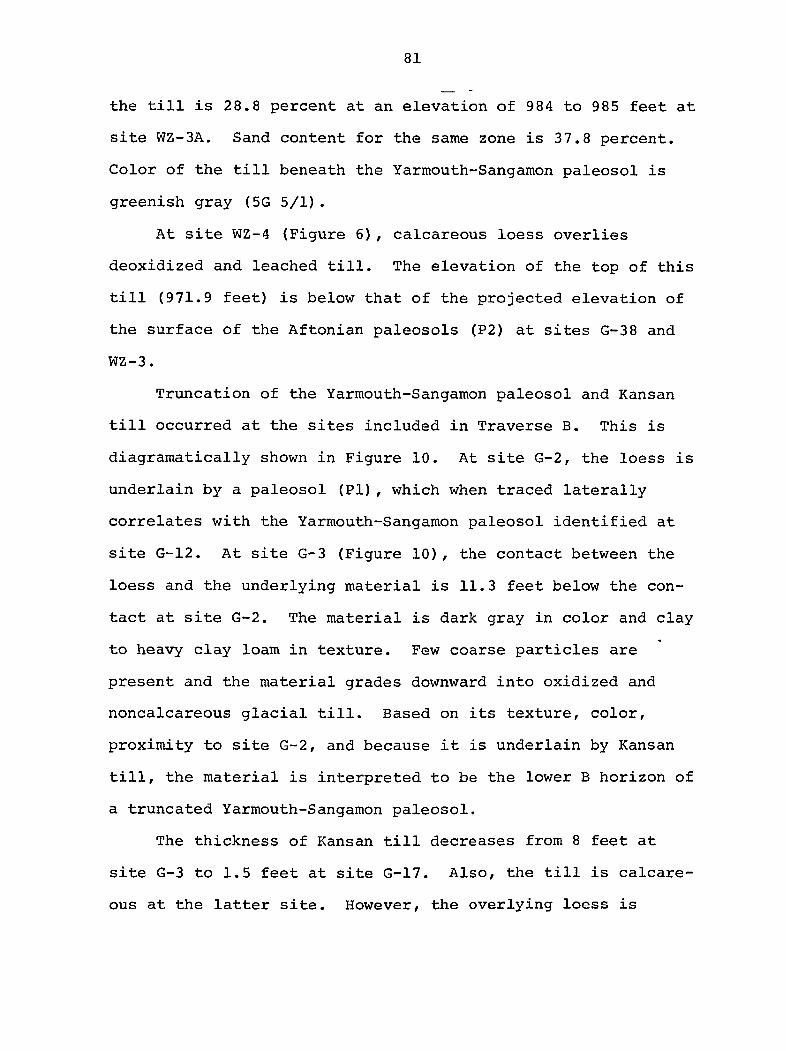
81
the till is 28.8 percent at an elevation of 984 to 985 feet at
site WZ-3A, Sand content for the same zone is 37.8 percent.
Color of the till beneath the Yarmouth-Sangamon paleosol is
greenish gray (5G 5/1).
At site WZ-4 (Figure 6), calcareous loess overlies
deoxidized and leached till. The elevation of the top of this
till (971.9 feet) is below that of the projected elevation of
the surface of the Aftonian paleosols (P2) at sites G-38 and
WZ-3.
Truncation of the Yarmouth-Sangamon paleosol and Kansan
till occurred at the sites included in Traverse B. This is
diagramatically shown in Figure 10. At site G-2, the loess is
underlain by a paleosol (PI), which when traced laterally
correlates with the Yarmouth-Sangamon paleosol identified at
site G-12. At site G-3 (Figure 10), the contact between the
loess and the underlying material is 11.3 feet below the con
tact at site G-2. The material is dark gray in color and clay
to heavy clay loam in texture. Few coarse particles are
present and the material grades downward into oxidized and
noncalcareous glacial till. Based on its texture, color,
proximity to site G-2, and because it is underlain by Kansan
till, the material is interpreted to be the lower B horizon of
a truncated Yarmouth-Sangamon paleosol.
The thickness of Kansan till decreases from 8 feet at
site G-3 to 1.5 feet at site G-17. Also, the till is calcare
ous at the latter site. However, the overlying loess is
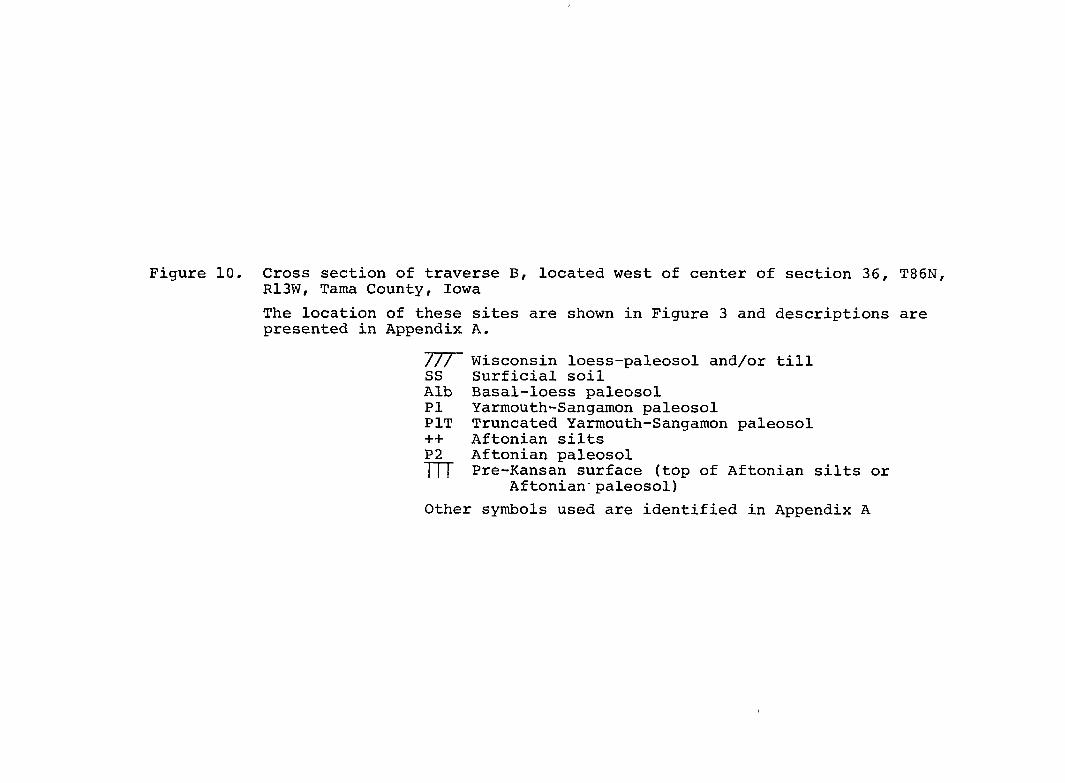
Figure 10. Cross section of traverse B, located west of center of section 36, T86N, R13W, Tama County, Iowa
The location of these sites are shown in Figure 3 and descriptions are presented in Appendix A.
/// Wisconsin loess-paleosol and/or till SS Surficial soil Alb Basal-loess paleosol PI Yarmouth-Sangamon paleosol PIT Truncated Yarmouth-Sangamon paleosol ++ Aftonian silts P2 Aftonian paleosol I I I Pre-Kansan surface (top of Aftonian silts or
Aftonian paleosol)
Other symbols used are identified in Appendix A
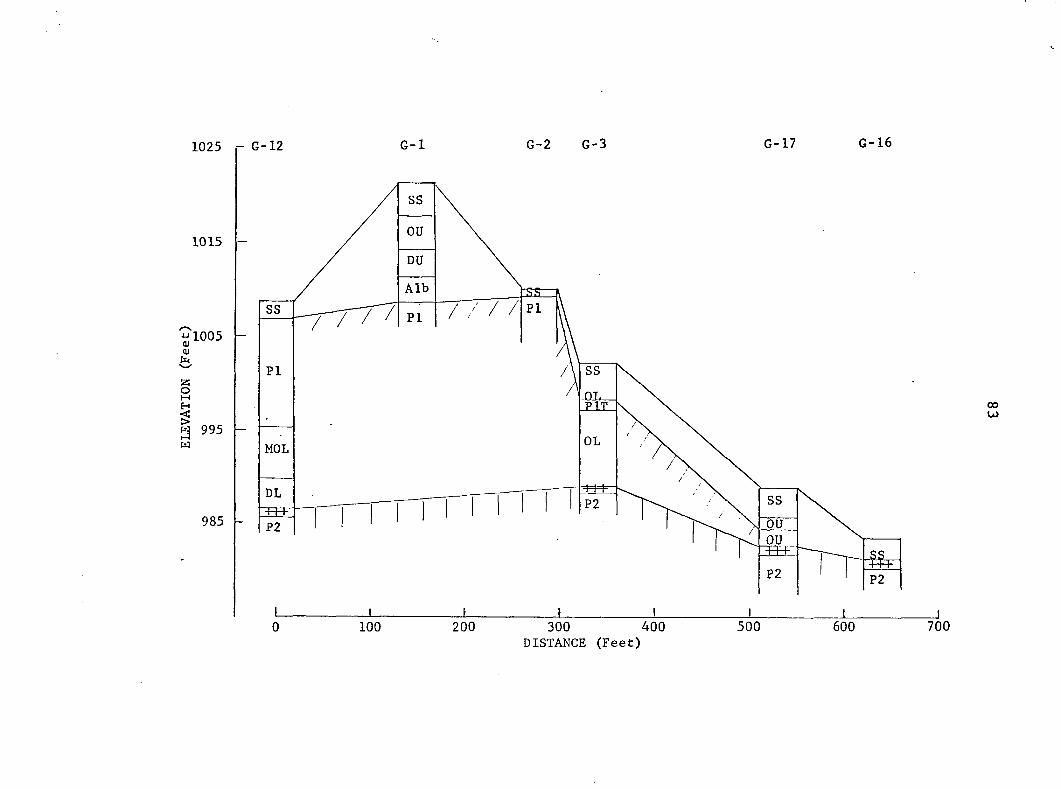
- G-12 G-1
SS
OU
DU
Alb
PI
P2
MOL
DL
PI
SS
L 0 100 200
G-2 G-3 G-17 G-16
SS PI
ss
Dl
OL
SS P2
ou OU
P2 P2
300 400 DISTANCE (Feet)
500 600

84
calcareous and the silts beneath the till are also calcareous.
Therefore, the carbonates present in the till may be the
result of secondary enrichment. At site G-16 (Figure 10),
Kansan till is not present and the loess overlies noncalcare-
ous Aftonian silts. Thus, beneath the slopes, the Yarmouth-
Sangamon paleosol and Kansan till show various stages of
truncation and may be absent at some sites.
Lower till The lower till of slopes that descend to
the lower landscape is surmounted by a clay-textured paleosol
shown as P2 in Figures 6 and 10. Silts separate the paleosol
from the overlying material at some sites.
At sites G-12 and WZ-3, the paleosols surmounting the
lower till are Aftonian in age since they occur beneath the
Yarmouth-Sangamon paleosols and Kansan till. Paleosols
designated as P2 in Figure 10, at sites G-3, 0-17, and G-16,
are also Aftonian in age. At these sites the P2 paleosols
occur beneath truncated Yarmouth-Sangamon paleosols and Kansan
till, Kansan till, and loess, respectively. At these three
sites Aftonian silts separate the Aftonian paleosols from the
overlying material.
In areas where loess thickness decreases and the Kansan
till is not present, the Aftonian silts and paleosol may be
near the surface. For example, at site G-16 the Aftonian
silts and paleosol are buried by only two feet of loess.
Thus, the range in stratigraphie sequence beneath the slopes
is as follows;
85
Wisconsin loess (Basal-loess paleosol) Yarmouth-Sangamon paleosol Kansan till Aftonian silts and/or paleosol Nebraskan till
to
Wisconsin loess Aftonian silts and/or paleosol Nebraskan till
Discussion
The stratigraphie sequence of the Geneseo divide area,
the lower landscape, and the slopes that descend from the
divide to the lower landscape were studied in detail.
The general relationship of the divide area to the lower
landscape is illustrated by Traverse C (Figure 11). This
traverse is perpendicular to the axis of the divide. Maximum
loess thickness, about 36 feet, occurs on the divide area
represented by site G-38. The surface elevation is 1036 feet.
The thicker deposits of loess are associated with the presence
of the underlying Yarmouth-Sangamon paleosol (PI). The eleva
tion of this paleosol is about 1000 feet.
At site G-55 on the lower landscape, loess thickness is
about 5 feet and the surface elevation is 993.1 feet. This
elevation is 42.9 feet lower than that of the present surface
at site G-38. However, the surface of the upper till on the
lower landscape is only 12.9 feet below the level of the
Yarmouth-Sangamon at site G-38 on the divide.
Detailed traverses show the upper till of the lower
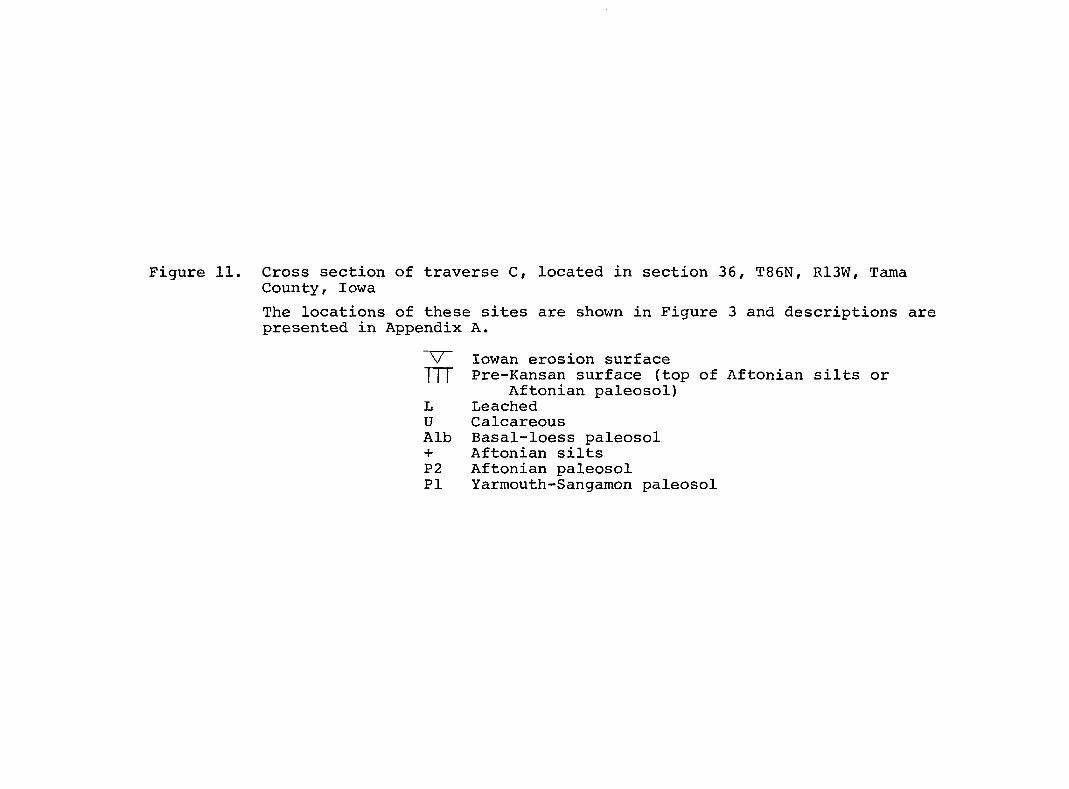
Figure 11. Cross section of traverse C, located in section 36, T86N, R13W, Tama County, Iowa
The locations of these sites are shown in Figure 3 and descriptions are presented in Appendix A.
V lowan erosion surface I I I Pre-Kansan surface (top of Aftonian silts or
Aftonian paleosol) L Leached U Calcareous Alb Basal-loess paleosol + Aftonian silts P2 Aftonian paleosol PI Yarmouth-Sangamon paleosol
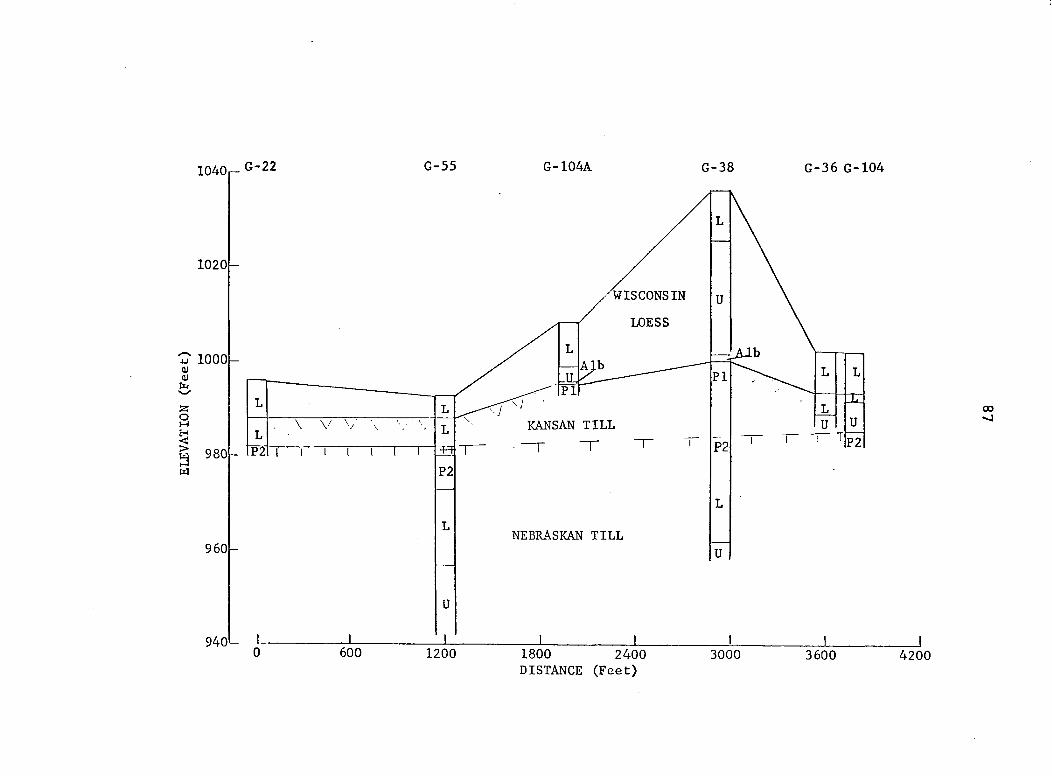
1040 G-22 G-55
1020
u lOOOl-<u CI h
a S
s a M
980- PZ
\ V \y
t i l l g
P2
960
U
94oL 600 1200
G-104A G-38 G-36 G-104
WISCONSIN
LOESS
PI PTI
KANSAN TILL
P2 P2
NEBRASKAN TILL
1800 2400 3000 3600 4200 DISTANCE (Feet)
88
landscape (previously called the lowan drift plain) is the
same till as that beneath the Yarmouth-Sangamon paleosol of
the divide area and is, therefore, Kansan till from which the
Yarmouth-Sangamon paleosol has been stripped. The paleosol
surmounting the lower till (P2 in Figure 11) of the lower
landscape is also present beneath the divide under the Kansan
till at approximately the same elevation as on the lower land
scape. Therefore, the lower till is Nebraskan and is
surmounted by an Aftonian paleosol.
Another detailed traverse (Traverse D, Figure 12)
illustrates that at lower elevations in this area the Kansan
till of the lower landscape may also be completely truncated.
At site G-22, the loess is underlain by a stone line and 6
feet of Kansan till beneath which is an Aftonian paleosol.
At sites G-30, G-27, and G-31, the thickness of both the loess
and Kansan till decreases. The 4 feet of loess at site G-32
overlies an Aftonian paleosol. At this site and the remaining
sites in Traverse D, the Kansan till is not present.
Elevations of the sites and stratigraphie contacts of the
Geneseo area are summarized in Table 11. Examination of the
elevations of the Aftonian paleosol (P2) for sites located on
the lower landscape (Table 11) in the Geneseo area indicates
the till below an elevation of approximately 9 80 feet is
Nebraskan.
The relationship of the divide area to the lower land
scape is best shown in detail by Traverses A and B (Figures 6
Figure 12. Cross section of Traverse D, located in section 36, T86N, R13W, Tama County, Iowa
The location of these sites are shown in Figure 3 and descriptions are presented in Appendix A.
/// lowan erosion surface I I I Pre-Kansan surface (top of Aftonian silts or
Aftonian paleosol) + Aftonian silts P2 Aftonian paleosol P2T Truncated Aftonian paleosol
Weathering zone terminology is given in Appendix A
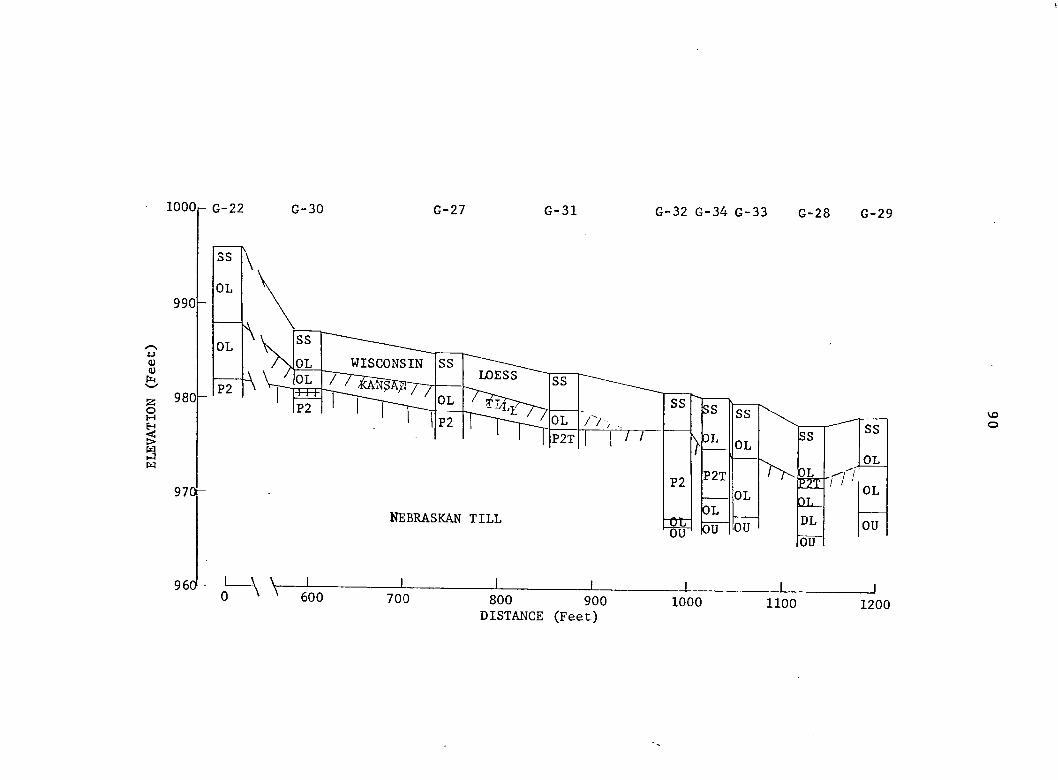
lOOOp G-22 G-30 G-27 G-31 G-32 G-34 G-33 G-28 G-29
990
980-
970-
WISCONSIN
NEBRASKAN TILL
SS ^
ss OL r/ / P2T 1 1 / /
P2
OL
>
OU
SS
DL
P2T
OL
OU
SS
OL
OL
OU
SS
EZCTi •r/ |QL_
DL
SS
OL
OL
OU
vo o
OU
960- A V 600 700 800 900 DISTANCE (Feet)
1000 1100 1200
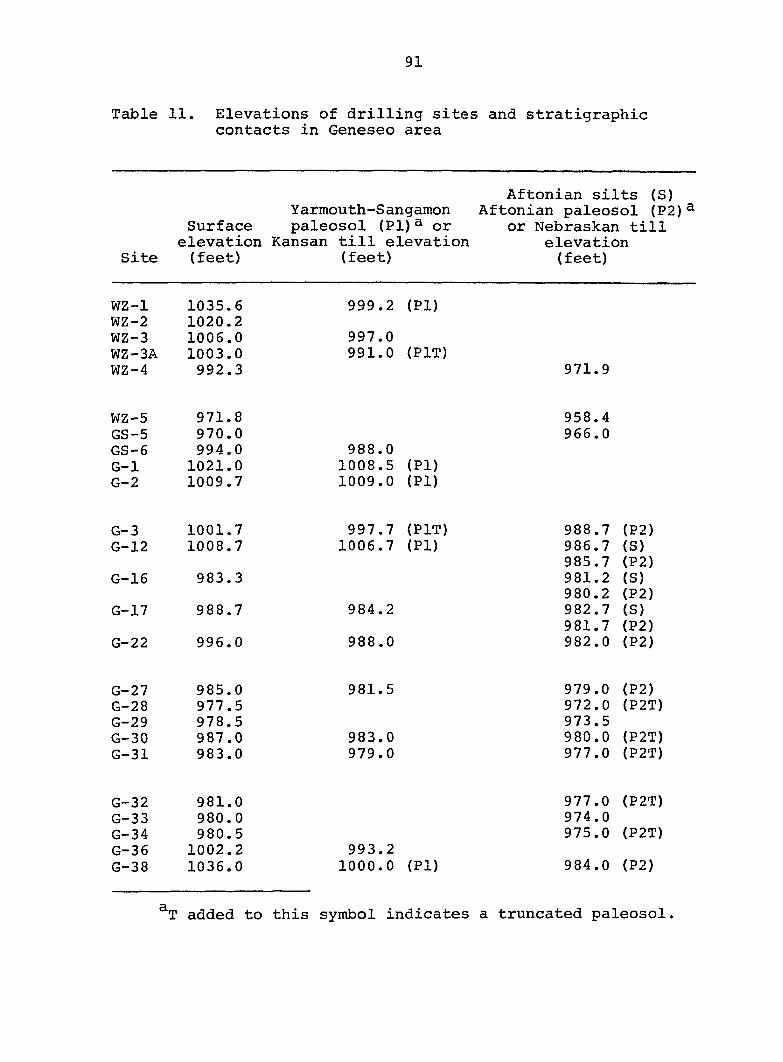
91
Table 11. Elevations of drilling sites and stratigraphie contacts in Geneseo area
Aftonian silts (S) Yarmouth-Sangamon Aftonian paleosol (P2)^
Surface paleosol (PI)^ or or Nebraskan till elevation Kansan till elevation elevation
Site (feet) (feet) (feet)
WZ-1 WZ-2 WZ-3 WZ-3A WZ-4
1035.6 1020.2 1006.0 1003.0 992.3
999.2 (PI)
997.0 991.0 (PIT)
971.9
WZ-5 GS-5 GS-6 G—1 G-2
971.8 970.0 994.0 1021.0 1009.7
988.0 1008.5 (PI) 1009.0 (PI)
958.4 966.0
G-3 G-12
G-16
G-17
G-22
1001.7 1008.7
983.3
988.7
996.0
997.7 (PIT) 1006.7 (PI)
984.2
988.0
988.7 986.7 985.7 981.2 980.2 982.7 981.7 982.0
(P2) (S) (P2) (S) (P2) (S) (P2) (P2)
G-27 G-28 G-29 G-30 G-31
985.0 977.5 978.5 987.0 983.0
981.5
983.0 979.0
979.0 972.0 973.5 980.0 977.0
(P2) (P2T)
(P2T) (P2T)
G-32 G-33 G-34 G-36 G-38
981.0 980.0 980.5 1002.2 1036.0
993.2 1000.0 (PI)
977.0 (P2T) 974.0 975.0 (P2T)
984.0 (P2)
^T added to this symbol indicates a truncated paleosol.
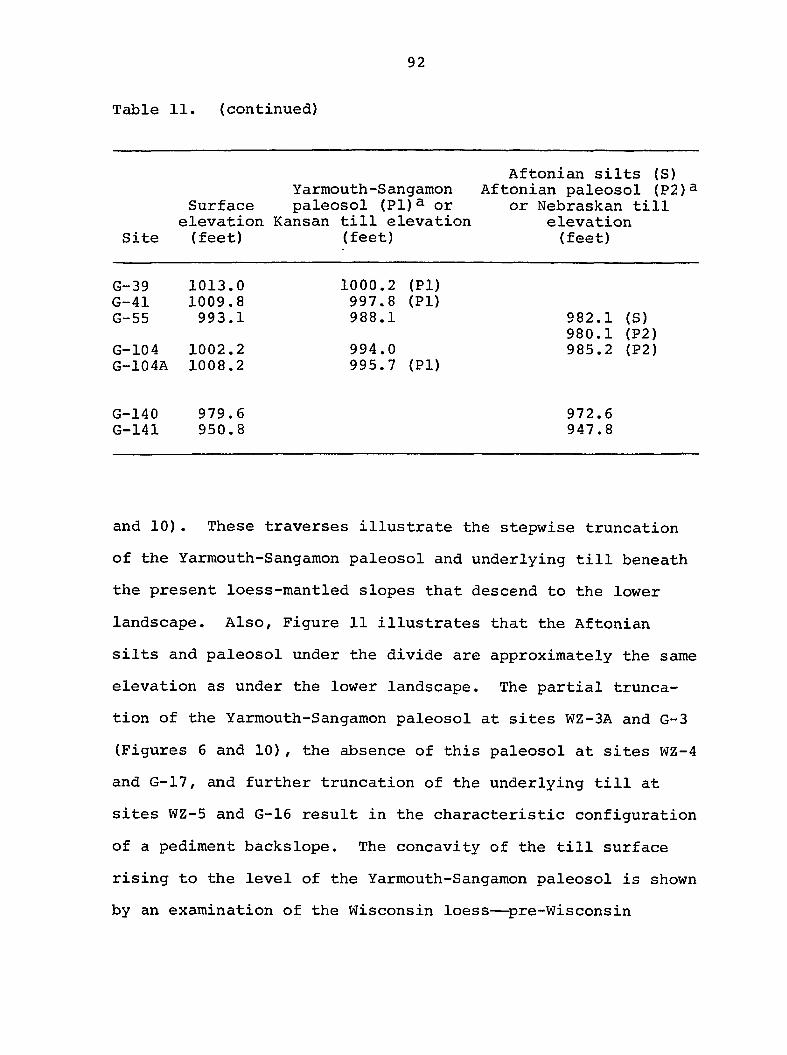
92
Table 11. (continued)
Aftonian silts (S) Yarmouth-Sangamon Aftonian paleosol (P2)&
Surface paleosol (Pi)^ or or Nebraskan till elevation Kansan till elevation elevation
Site (feet) (feet) (feet)
G-39 1013.0 1000.2 G-41 1009.8 997.8 G-55 993.1 988.1
G-104 1002.2 994.0 G-104A 1008.2 995.7
(PI) (PI)
982.1 (S) 980.1 (P2) 985.2 (P2)
(PI)
G-140 G-141
979.6 950.8
972.6 947.8
and 10). These traverses illustrate the stepwise truncation
of the Yarmouth-Sangamon paleosol and underlying till beneath
the present loess-mantled slopes that descend to the lower
landscape. Also, Figure 11 illustrates that the Aftonian
silts and paleosol under the divide are approximately the same
elevation as under the lower landscape. The partial trunca
tion of the Yarmouth-Sangamon paleosol at sites WZ-3A and G-3
(Figures 6 and 10), the absence of this paleosol at sites WZ-4
and G-17, and further truncation of the underlying till at
sites WZ-5 and G-16 result in the characteristic configuration
of a pediment backslope. The concavity of the till surface
rising to the level of the Yarmouth-Sangamon paleosol is shown
by an examination of the Wisconsin loess—pre-Wisconsin
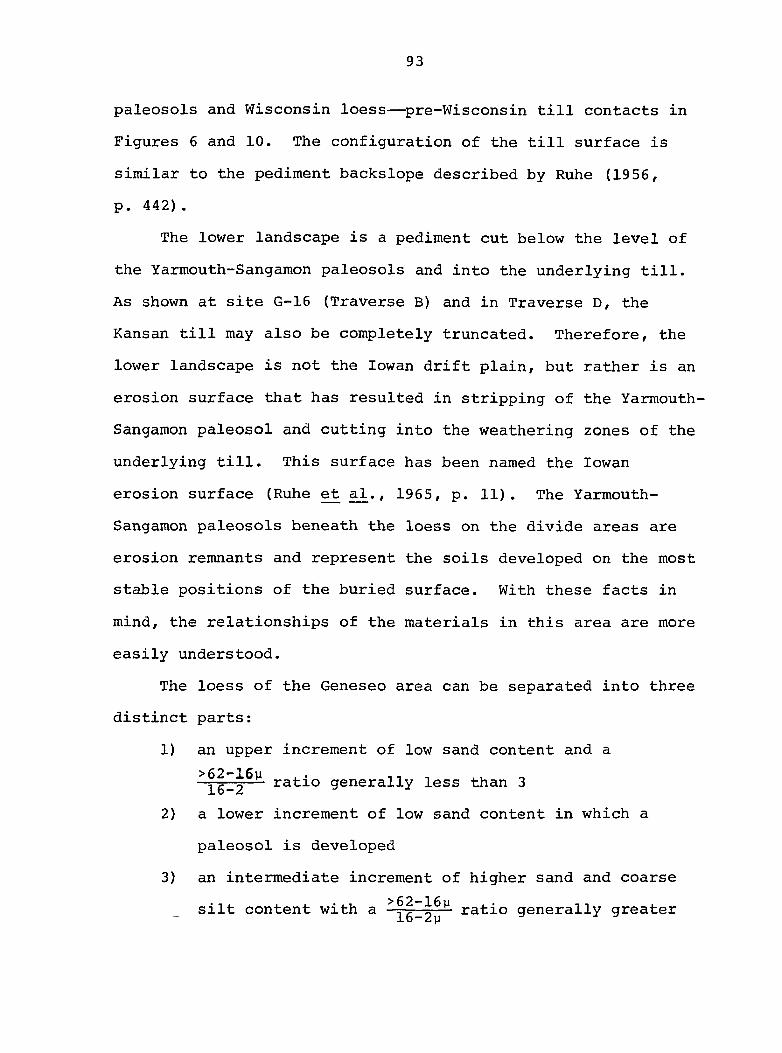
93
paleosols and Wisconsin loess—pre-Wisconsin till contacts in
Figures 6 and 10. The configuration of the till surface is
similar to the pediment backslope described by Ruhe (1956,
p. 442) .
The lower landscape is a pediment cut below the level of
the Yarmouth-Sangamon paleosols and into the underlying till.
As shown at site G-16 (Traverse B) and in Traverse D, the
Kansan till may also be completely truncated. Therefore, the
lower landscape is not the lowan drift plain, but rather is an
erosion surface that has resulted in stripping of the Yarmouth-
Sangamon paleosol and cutting into the weathering zones of the
underlying till. This surface has been named the lowan
erosion surface (Ruhe et a^., 1965, p. 11). The Yarmouth-
Sangamon paleosols beneath the loess on the divide areas are
erosion remnants and represent the soils developed on the most
stable positions of the buried surface. With these facts in
mind, the relationships of the materials in this area are more
easily understood.
The loess of the Geneseo area can be separated into three
distinct parts:
1) an upper increment of low sand content and a
ratio generally less than 3
2) a lower increment of low sand content in which a
paleosol is developed
3) an intermediate increment of higher sand and coarse
silt content with a ^26-2y^ ratio generally greater
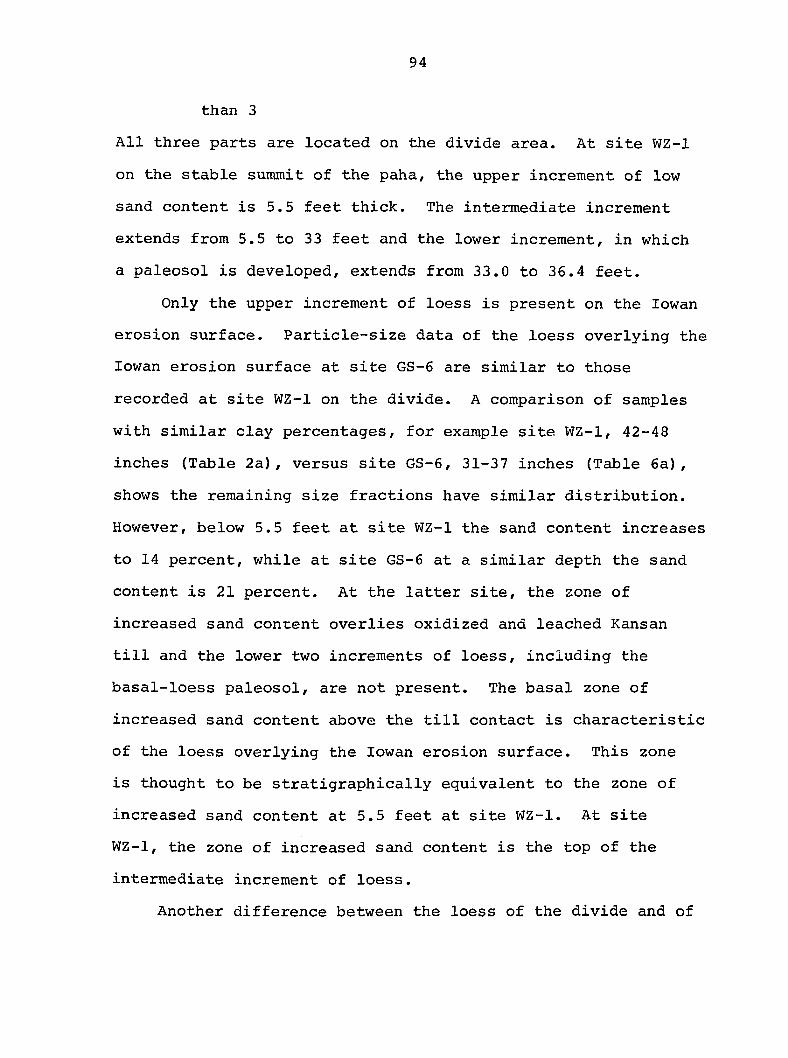
94
than 3
All three parts are located on the divide area. At site WZ-1
on the stable summit of the paha, the upper increment of low
sand content is 5.5 feet thick. The intermediate increment
extends from 5.5 to 33 feet and the lower increment, in which
a paleosol is developed, extends from 33.0 to 36.4 feet.
Only the upper increment of loess is present on the lowan
erosion surface. Particle-size data of the loess overlying the
lowan erosion surface at site GS-6 are similar to those
recorded at site WZ-1 on the divide. A comparison of samples
with similar clay percentages, for example site WZ-1, 42-48
inches (Table 2a), versus site GS-6, 31-37 inches (Table 6a),
shows the remaining size fractions have similar distribution.
However, below 5.5 feet at site WZ-1 the sand content increases
to 14 percent, while at site GS-6 at a similar depth the sand
content is 21 percent. At the latter site, the zone of
increased sand content overlies oxidized and leached Kansan
till and the lower two increments of loess, including the
basal-loess paleosol, are not present. The basal zone of
increased sand content above the till contact is characteristic
of the loess overlying the lowan erosion surface. This zone
is thought to be stratigraphically equivalent to the zone of
increased sand content at 5.5 feet at site WZ-1. At site
WZ-1, the zone of increased sand content is the top of the
intermediate increment of loess.
Another difference between the loess of the divide and of
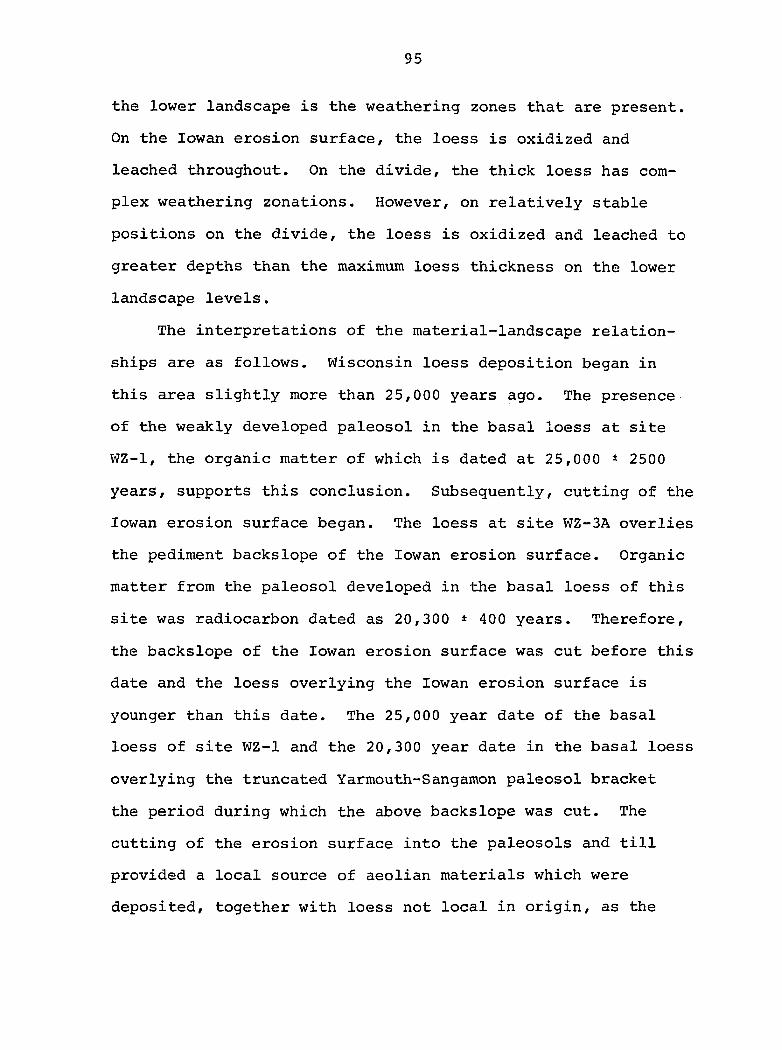
95
the lower landscape is the weathering zones that are present.
On the lowan erosion surface, the loess is oxidized and
leached throughout. On the divide, the thick loess has com
plex weathering zonations. However, on relatively stable
positions on the divide, the loess is oxidized and leached to
greater depths than the maximum loess thickness on the lower
landscape levels.
The interpretations of the material-landscape relation
ships are as follows. Wisconsin loess deposition began in
this area slightly more than 25,000 years ago. The presence
of the weakly developed paleosol in the basal loess at site
WZ-1, the organic matter of which is dated at 25,000 * 2500
years, supports this conclusion. Subsequently, cutting of the
lowan erosion surface began. The loess at site WZ-3A overlies
the pediment backslope of the lowan erosion surface. Organic
matter from the paleosol developed in the basal loess of this
site was radiocarbon dated as 20,300 ± 400 years. Therefore,
the backslope of the lowan erosion surface was cut before this
date and the loess overlying the lowan erosion surface is
younger than this date. The 25,000 year date of the basal
loess of site WZ-1 and the 20,300 year date in the basal loess
overlying the truncated Yarmouth-Sangamon paleosol bracket
the period during which the above backslope was cut. The
cutting of the erosion surface into the paleosols and till
provided a local source of aeolian materials which were
deposited, together with loess not local in origin, as the
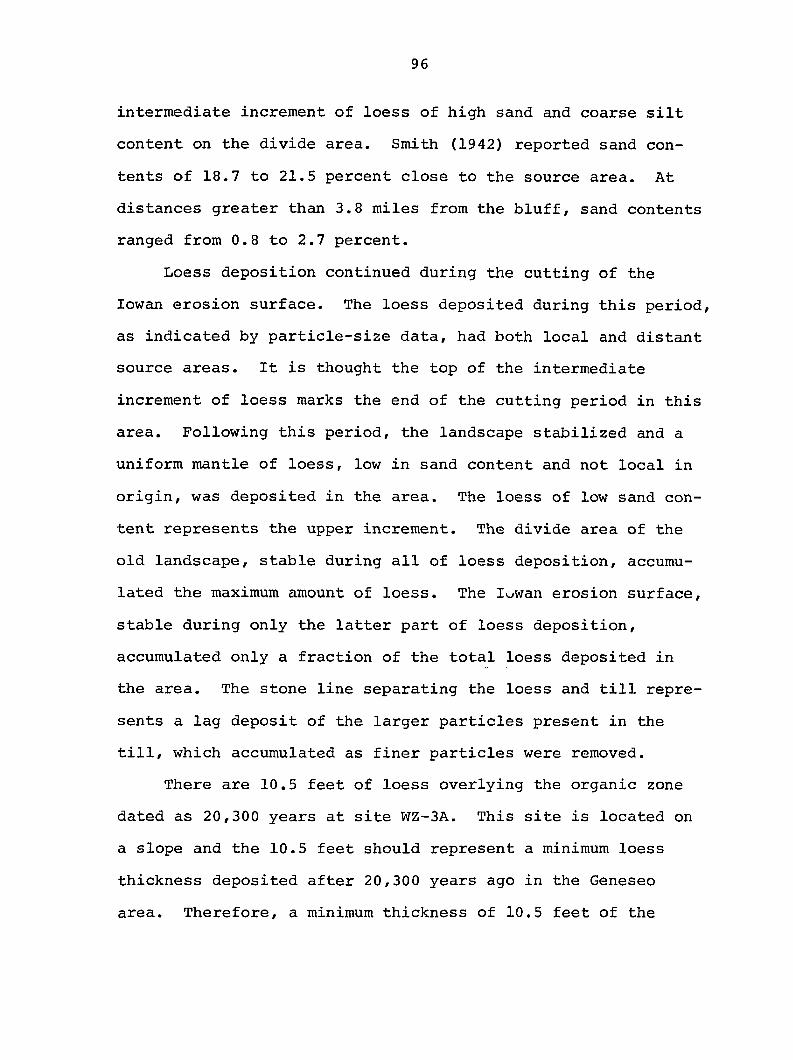
96
intermediate increment of loess of high sand and coarse silt
content on the divide area. Smith (1942) reported sand con
tents of 18.7 to 21.5 percent close to the source area. At
distances greater than 3.8 miles from the bluff, sand contents
ranged from 0.8 to 2.7 percent.
Loess deposition continued during the cutting of the
lowan erosion surface. The loess deposited during this period,
as indicated by particle-size data, had both local and distant
source areas. It is thought the top of the intermediate
increment of loess marks the end of the cutting period in this
area. Following this period, the landscape stabilized and a
uniform mantle of loess, low in sand content and not local in
origin, was deposited in the area. The loess of low sand con
tent represents the upper increment. The divide area of the
old landscape, stable during all of loess deposition, accumu
lated the maximum amount of loess. The lowan erosion surface,
stable during only the latter part of loess deposition,
accumulated only a fraction of the total loess deposited in
the area. The stone line separating the loess and till repre
sents a lag deposit of the larger particles present in the
till, which accumulated as finer particles were removed.
There are 10.5 feet of loess overlying the organic zone
dated as 20,300 years at site WZ-3A. This site is located on
a slope and the 10.5 feet should represent a minimum loess
thickness deposited after 20,300 years ago in the Geneseo
area. Therefore, a minimum thickness of 10.5 feet of the
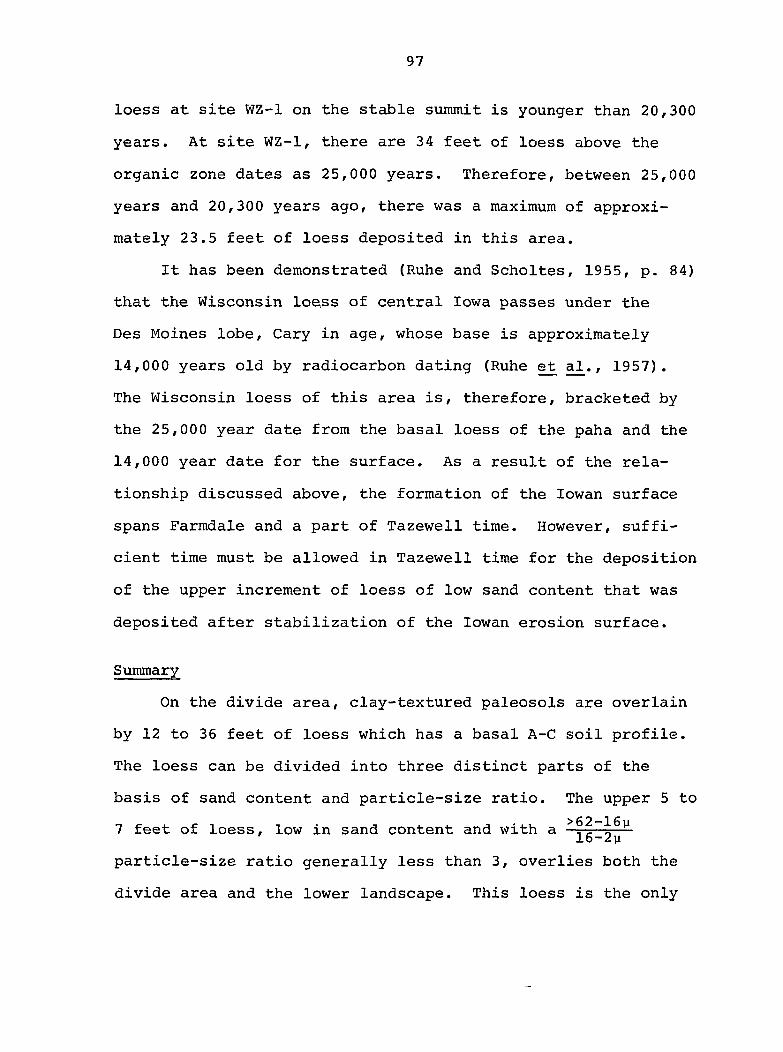
97
loess at site WZ-1 on the stable summit is younger than 20,300
years. At site WZ-1, there are 34 feet of loess above the
organic zone dates as 25,000 years. Therefore, between 25,000
years and 20,300 years ago, there was a maximum of approxi
mately 23.5 feet of loess deposited in this area.
It has been demonstrated (Ruhe and Scholtes, 1955, p. 84)
that the Wisconsin loess of central Iowa passes under the
Des Moines lobe, Gary in age, whose base is approximately
14,000 years old by radiocarbon dating (Ruhe et a2., 1957).
The Wisconsin loess of this area is, therefore, bracketed by
the 25,000 year date from the basal loess of the paha and the
14,000 year date for the surface. As a result of the rela
tionship discussed above, the formation of the lowan surface
spans Farmdale and a part of Tazewell time. However, suffi
cient time must be allowed in Tazewell time for the deposition
of the upper increment of loess of low sand content that was
deposited after stabilization of the lowan erosion surface.
Summary
On the divide area, clay-textured paleosols are overlain
by 12 to 36 feet of loess which has a basal A-C soil profile.
The loess can be divided into three distinct parts of the
basis of sand content and particle-size ratio. The upper 5 to
7 feet of loess, low in sand content and with a ^ 16-2%
particle-size ratio generally less than 3, overlies both the
divide area and the lower landscape. This loess is the only
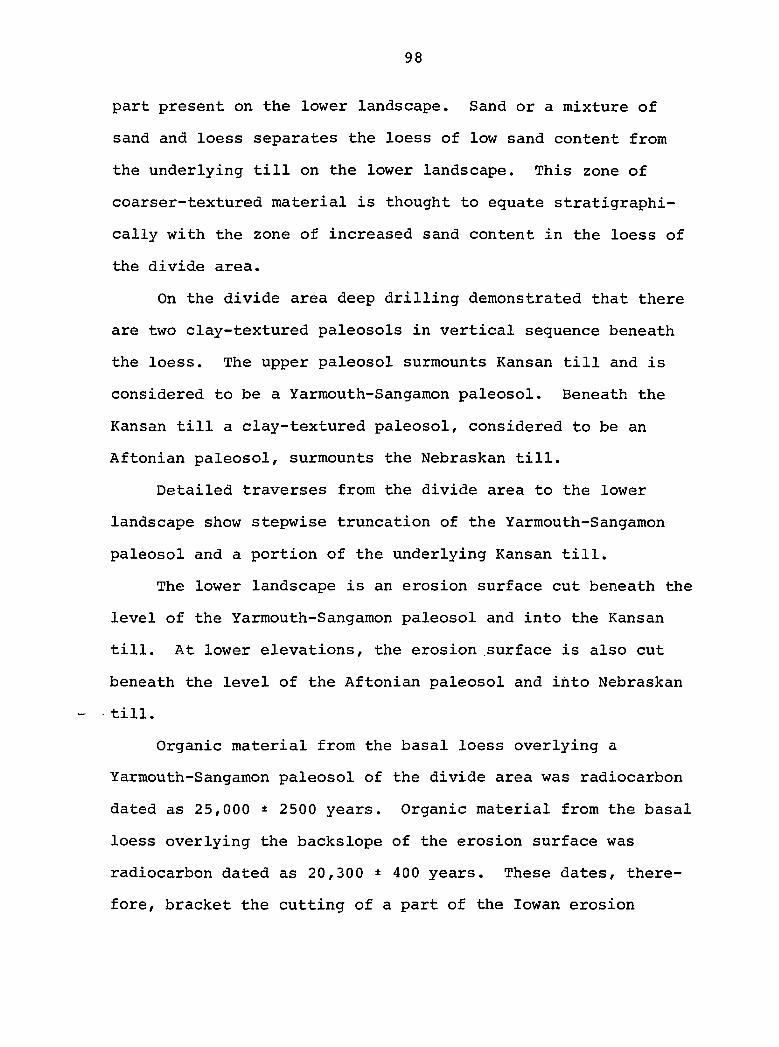
98
part present on the lower landscape. Sand or a mixture of
sand and loess separates the loess of low sand content from
the underlying till on the lower landscape. This zone of
coarser-textured material is thought to equate stratigraphi-
cally with the zone of increased sand content in the loess of
the divide area.
On the divide area deep drilling demonstrated that there
are two clay-textured paleosols in vertical sequence beneath
the loess. The upper paleosol surmounts Kansan till and is
considered to be a Yarmouth-Sangamon paleosol. Beneath the
Kansan till a clay-textured paleosol, considered to be an
Aftonian paleosol, surmounts the Nebraskan till.
Detailed traverses from the divide area to the lower
landscape show stepwise truncation of the Yarmouth-Sangamon
paleosol and a portion of the underlying Kansan till.
The lower landscape is an erosion surface cut beneath the
level of the Yarmouth-Sangamon paleosol and into the Kansan
till. At lower elevations, the erosion surface is also cut
beneath the level of the Aftonian paleosol and into Nebraskan
- till.
Organic material from the basal loess overlying a
Yarmouth-Sangamon paleosol of the divide area was radiocarbon
dated as 25,000 ± 2500 years. Organic material from the basal
loess overlying the backslope of the erosion surface was
radiocarbon dated as 20,300 ± 400 years. These dates, there
fore, bracket the cutting of a part of the lowan erosion

99
surface in this area. Subsequent to this, a mantle of loess,
low in sand content and not local in origin, was deposited
over the entire area.
Landscape
The present landscape in the Geneseo study area is com
posed of a series of stepped levels that descend from the
major divide to the major drainage in the area. Wolf Creek.
Geomorphic surfaces recognized included both buried surfaces
and land surfaces. Characteristics of the geomorphic surfaces
of this area are briefly summarized in Table 12. The distri
bution of land surfaces is shown in Figure 13.
Buried surfaces
Pre-Kansan The Wisconsin loess and Kansan till are
underlain by a surface characterized by the presence of
Aftonian silts and/or Aftonian paleosols. Characteristics of
the Aftonian silts and paleosols were discussed in the strati
graphy section. This pre-Kansan surface underlies both the
7th and 6th surfaces shown in Figure 13. However, as
illustrated in Figure 12, the pre-Kansan surface has been
truncated by the lowan erosion surface on the 5th and lower
lying surfaces in the Geneseo area.
The elevation of the pre-Kansan surface ranges from 988.7
feet at site G-3 to 979 feet at site G-27 (Table 11). These
two sites are approximately 3700 feet apart. The resulting
slope gradient on the pre-Kansan surface between these two
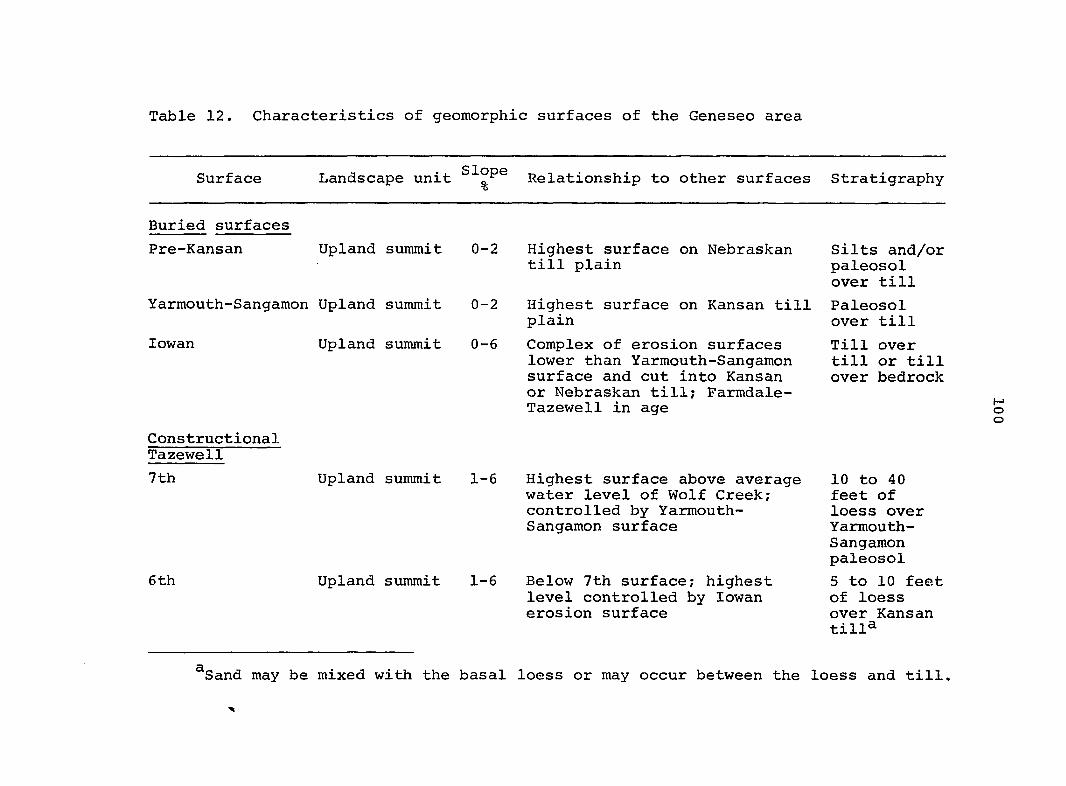
Table 12. Characteristics of geomorphic surfaces of the Geneseo area
Surface Landscape unit Relationship to other surfaces Stratigraphy
Buried surfaces
Pre-Kansan Upland summit 0-2
Yarmouth-Sangamon Upland summit
lowan Upland summit
Constructional Tazewell
7 th
6 th
0-2
0 — 6
Upland summit 1-6
Upland summit 1-6
Highest surface on Nebraskan till plain
Highest surface on Kansan till plain
Complex of erosion surfaces lower than Yarmouth-Sangamon surface and cut into Kansan or Nebraskan till; Farmdale-Tazewell in age
Highest surface above average water level of Wolf Creek; controlled by Yarmouth-Sangamon surface
Below 7th surface; highest level controlled by lowan erosion surface
Silts and/or paleosol over till
Paleosol over till
Till over till or till over bedrock
10 to 40 feet of loess over Yarmouth-Sangamon paleosol
5 to 10 feet of loess over Kansan tilia
^Sand may be mixed with the basal loess or may occur between the loess and till.
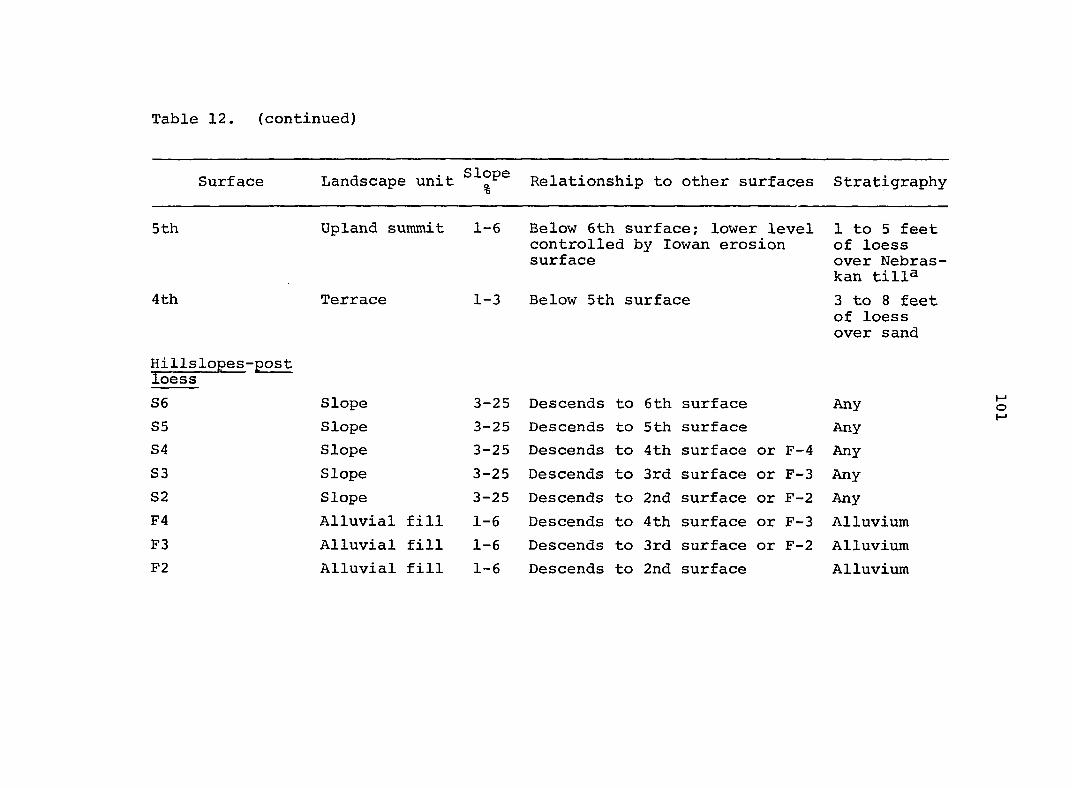
Table 12. (continued)
Surface Landscape unit
5th Upland summit 1-6
4th Terrace 1-3
Hillslopes-post loess
S6 Slope 3-25
S5 Slope 3-25
S4 Slope 3-25
S3 Slope 3-25
S2 Slope 3-25
F4 Alluvial fill 1-6
F3 Alluvial fill 1—6
F2 Alluvial fill 1-6
Relationship to other surfaces Stratigraphy
Below 6th surface; lower level controlled by lowan erosion surface
Below 5th surface
1 to 5 feet of loess over Nebras-kan till&
3 to 8 feet of loess over sand
Descends to 6 th surface Any
Descends to 5 th surface Any
Descends to 4 th surface or F-4 Any
Descends to 3rd surface or F-3 Any
Descends to 2nd surface or F-2 Any
Descends to 4 th surface or F-3 Alluvium
Descends to 3rd surface or F-2 Alluvium
Descends to 2nd surface Alluvium

Table 12. (continued)
Surface Landscape unit Relationship to other surfaces Stratigraphy
Floodplain
3rd
2nd
1st
Floodplain
Floodplain
Floodplain
1-3 Below or merges with 4th Alluvium surface
1-3 Below or merges with 3rd Alluvium surface
1-3 Below or merges with 2nd Alluvium surface; first surface above average water level of Wolf Creek i
Figure 13. Distribution of land surfaces in NE^ section 36, section 25, and the SE^ section 24, T86N, R13W,
Tama County, Iowa (characteristics of surfaces are listed in Table 12)
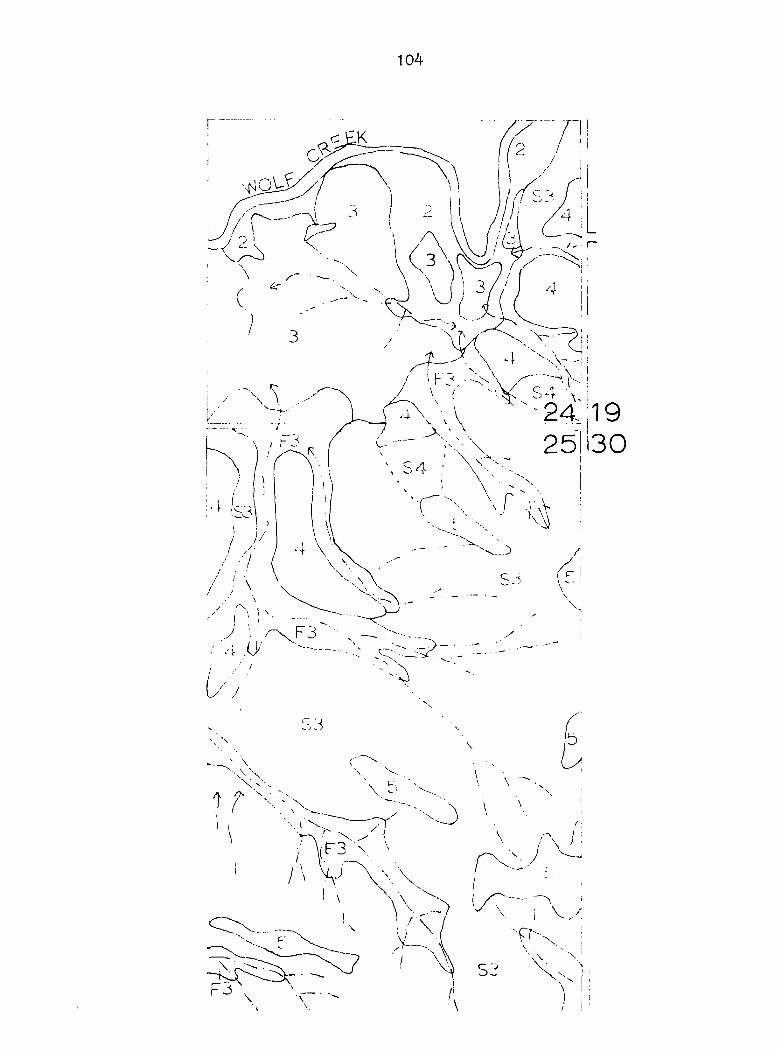
104
251130
u / X
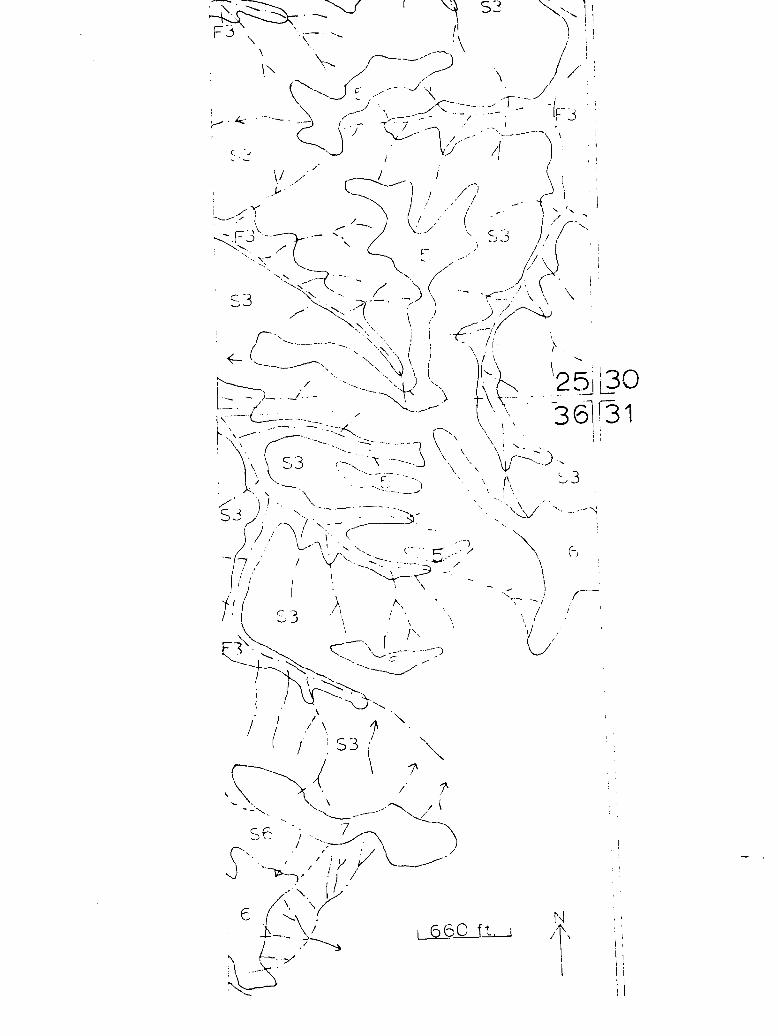
25j'L^O
361I31
f i f i O f t . I
105
sites is less than 0.3 percent. Other observations, such as
those recorded in traverse C (Figure 11) suggest the pre-
Kansan surface is one of low relief. The average elevation of
this surface in the Geneseo area, based on figures in Table 11,
is approximately 983 feet.
Yarmouth-Sangamon The Yarmouth-Sangamon surface is
the highest surface on the Kansan till plain and is charac
terized by the presence of an intensively weathered paleosol.
This buried surface underlies the 7th surface (Figure 13). A
representative profile of a soil on this surface is described
in Appendix A, site G-402.
As discussed previously in the stratigraphy section, the
solum of this Yarmouth-Sangamon paleosol conforms to the
definition of gumbotil as described by Kay (1916b). The
paleosolum begins at 20.2 feet and extends downward to 32.2
feet, below which it grades downward into oxidized and
leached, oxidized and unleached, and finally unoxidized and
unleached till at 83 feet. Data for the G-402 site are pre
sented in Table 3.
Within the Geneseo study area the elevation of the
Yarmouth-Sangamon surface ranged from 997 feet at site WZ-3
to 1009.0 feet at site G-2 (Figure 3). Thus, the maximum
difference in elevation recorded on this surface is 12.4 feet.
However, the distance between sites where the minimum and
maximum elevations is 1073 feet with a resulting slope gradi
ent of 1.2 percent. Between site G-38, which has an elevation
106
of 1000 feet, and site WZ-3 the slope gradient is approxi
mately 0.5 percent. Additional calculations between other
sites show values of similar magnitude. Thus, the Yarmouth-
Sangamon surface is relatively flat in this area. The average
elevation of this surface for the Geneseo study area is 1002.2,
which is approximately 162 feet above the average water level
of the major stream in this area. Wolf Creek.
lowan erosion surface A third buried surface recog
nized in this area is the lowan surface described by Ruhe
et al. (1965, p. 11) as an erosion-surface complex that has
stripped the Yarmouth and other pre-Wisconsin paleosols and
cut into the weathering zones of the underlying till. This
buried surface underlies the 5th and 6th surfaces shown in
Figure 13. The relationship of the lowan surface to the
Yarmouth-Sangamon surface may be determined by examining the
Wisconsin loess-pre-Wisconsin paleosols and Wisconsin loess—
pre-Wisconsin till contacts in Figures 6 and 10. The partial
truncation of the Yarmouth-Sangamon paleosol at sites WZ-3A
and G-3, the absence of this paleosol at sites WZ-4 and G-17,
and further truncation of the underlying till at sites WZ-5
and G-16 result in the characteristic configuration of a pedi
ment backslope (Ruhe, 1956, p. 442). The concavity of the
till surface rising to the level of the Yarmouth-Sangamon
paleosol shown in these diagrams (Figures 6 and 10) is similar
to the pediment backslope described by Ruhe (1956, p. 442).
Thus, the lower lying landscape surrounding the divide area is

107
a pediment cut beneath the level of the Yarmouth-Sangamon sur
face. Traverse D (Figure 12) illustrates that in this area
the lowan erosion surface truncates not only the Yarmouth-
Sangamon paleosol but also the underlying Kansan, Aftonian,
and Nebraskan deposits. At site G-22, a drill hole penetrated
7.5 feet of oxidized and leached loess overlying 6.5 feet of
oxidized and leached till. As discussed in the stratigraphy
section, this till is beneath the Yarmouth-Sangamon paleosol
of the paha and above the Aftonian deposits (Figure 11) and is
thus Kansan in age. The top of the till at site G-22 repre
sents the lowan erosion surface which at this site has an
elevation of 988 feet. This elevation is 14 feet below the
average level of the Yarmouth-Sangamon surface in this area.
The Kansan till at this site is underlain by an Aftonian
paleosol, clay in texture. The same general stratigraphy is
present at sites G-30, G-27, and G-31, but between sites G-31
and G-32, thé Kansan till is completely truncated and at site
G-32 Wisconsin loess overlies an Aftonian paleosol having an
elevation of 977 feet. The Aftonian paleosol is partially
truncated at site G-34, completely truncated at site G-33,
partially truncated at site G-28, and completely truncated at
site G-29. The Aftonian paleosol is not present at sites
north of site G-29 (Figure 12). Therefore, the lowan erosion
surface also truncates the Aftonian paleosol and, in places,
the upper weathering zones of the Nebraskan till in the
Geneseo area. Of the sites listed in Table 11, the range in
108
elevation of the lowan erosion surface for this area may be
calculated. Elevations range from 994 feet at site G-104 to
947.8 feet at site G-141. In this area then, the lowan
erosion surface truncates the Yarmouth-Sangamon paleosol,
Kansan till, Aftonian deposits, and the upper zones of the
Nebraskan till.
Constructional Tazewell surfaces
Upland-summit On the land surface, three upland-
summit surfaces are recognized (Figure 13). The 7th surface
is the highest level above the average water level of Wolf
Creek and is underlain by the buried Yarmouth-Sangamon surface.
Elevation of the highest site recorded was 1036 feet at site
G-38 (Figure 14) which has a loess thickness of 36 feet. This
site is 19 6 feet above the average water level of Wolf Creek.
Site WZ-1 is a representative profile located on the 7th
surface. This site was discussed in detail in the strati
graphy section. A radiocarbon date (1-1267) obtained from the
organic material of the paleosol developed in the basal loess
of site WZ-1 is 25,000 ± 2500 years which is a Farmdale date
(Ruhe, 1957, p. 674; Frye and Willman, 1960; Frye et al.,
1962). Thus, the basal loess of this surface is Early
Wisconsin in age, and the 36.4 feet of loess should represent
approximately the total thickness of loess deposited in this
area during Wisconsin time. Loess thickness on less stable
areas of the 7th surface is much less than that recorded on
Figure 14. Location of drilling sites in sections 24, 25, and 36, T86N, R13W, Tama County, Iowa (descriptions of these sites are in Appendix A)
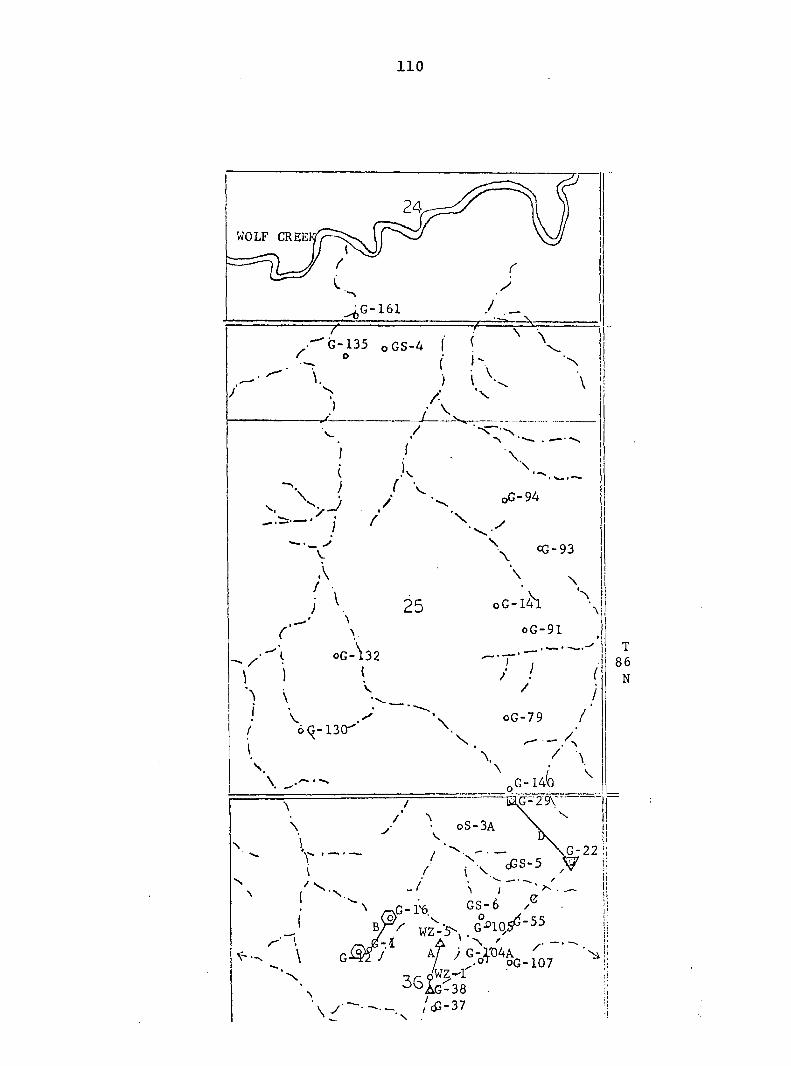
110
WOLF CREE
.G-161
G-135 oGS-4 f o
oG-94
CG-93
oG-91
oG-79 / ôq-i3(r
G--29V
oS-3A
G-22
G-1^ G-DlOg^"-^^
• i A " /. / A/
•N r^Z^l ^^AG-38
/(G-37
oG-107
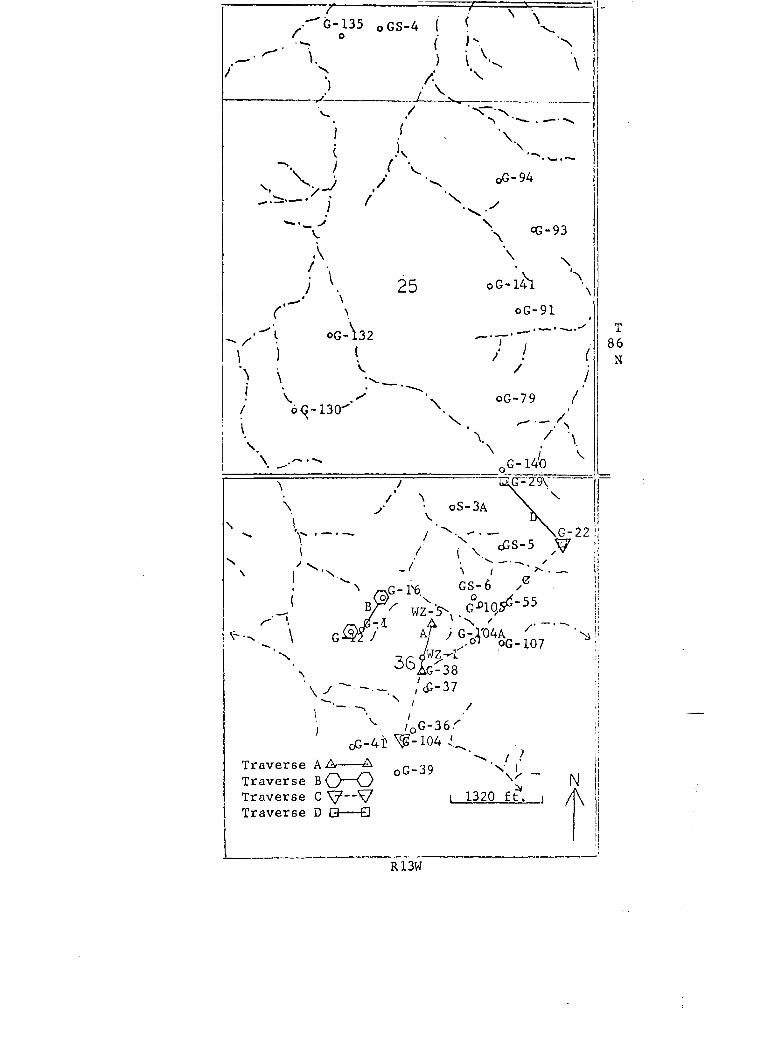
G - 1 3 5 o G S - 4
CG-93
oG-91
oG-79
OS-3A
G - 2 2 d3S-5 V
WZ-5^
oG-107
1
^^IG-38 /cC-37
/
^ /oG-36< cG-4Î) ̂ -104
Traverse _
Traverse bO—O Traverse C i 1320 £t. i
Traverse D G •
N A
R13W
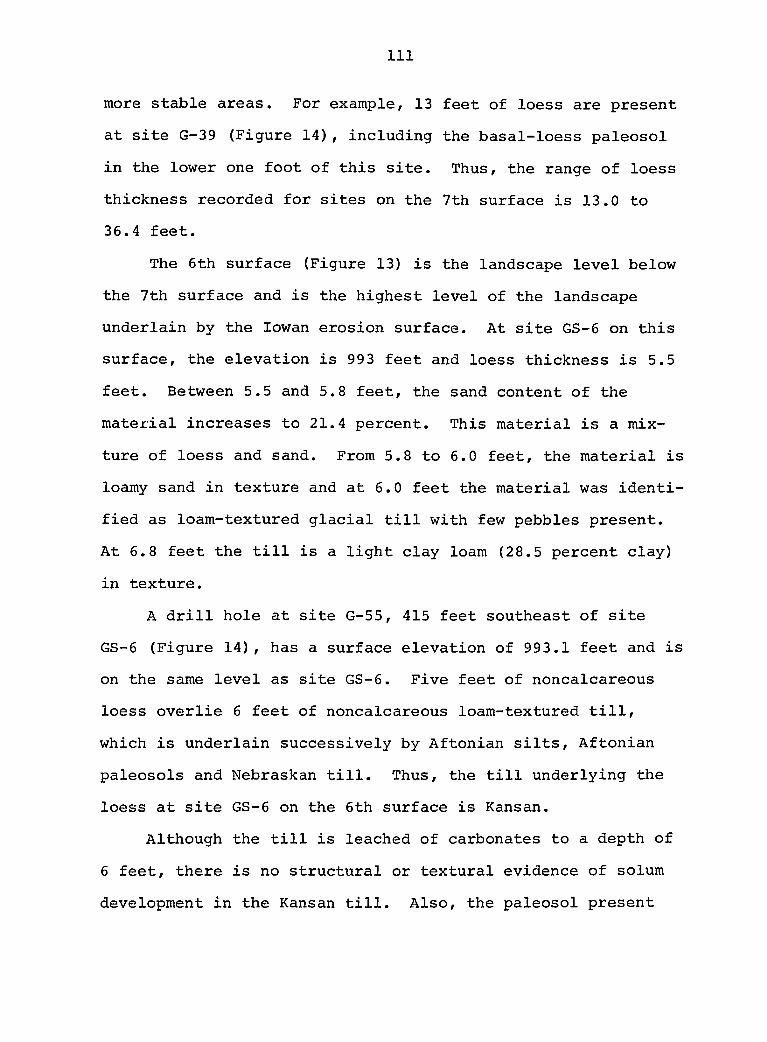
Ill
more stable areas. For example, 13 feet of loess are present
at site G-39 (Figure 14), including the basal-loess paleosol
in the lower one foot of this site. Thus, the range of loess
thickness recorded for sites on the 7th surface is 13.0 to
36.4 feet.
The 6th surface (Figure 13) is the landscape level below
the 7th surface and is the highest level of the landscape
underlain by the lowan erosion surface. At site GS-6 on this
surface, the elevation is 993 feet and loess thickness is 5.5
feet. Between 5.5 and 5.8 feet, the sand content of the
material increases to 21.4 percent. This material is a mix
ture of loess and sand. From 5.8 to 6.0 feet, the material is
loamy sand in texture and at 6.0 feet the material was identi
fied as loam-textured glacial till with few pebbles present.
At 6.8 feet the till is a light clay loam (28.5 percent clay)
in texture.
A drill hole at site G-55, 415 feet southeast of site
GS-6 (Figure 14), has a surface elevation of 993.1 feet and is
on the same level as site GS-6. Five feet of noncalcareous
loess overlie 6 feet of noncalcareous loam-textured till,
which is underlain successively by Aftonian silts, Aftonian
paleosols and Nebraskan till. Thus, the till underlying the
loess at site GS-6 on the 6th surface is Kansan.
Although the till is leached of carbonates to a depth of
6 feet, there is no structural or textural evidence of solum
development in the Kansan till. Also, the paleosol present
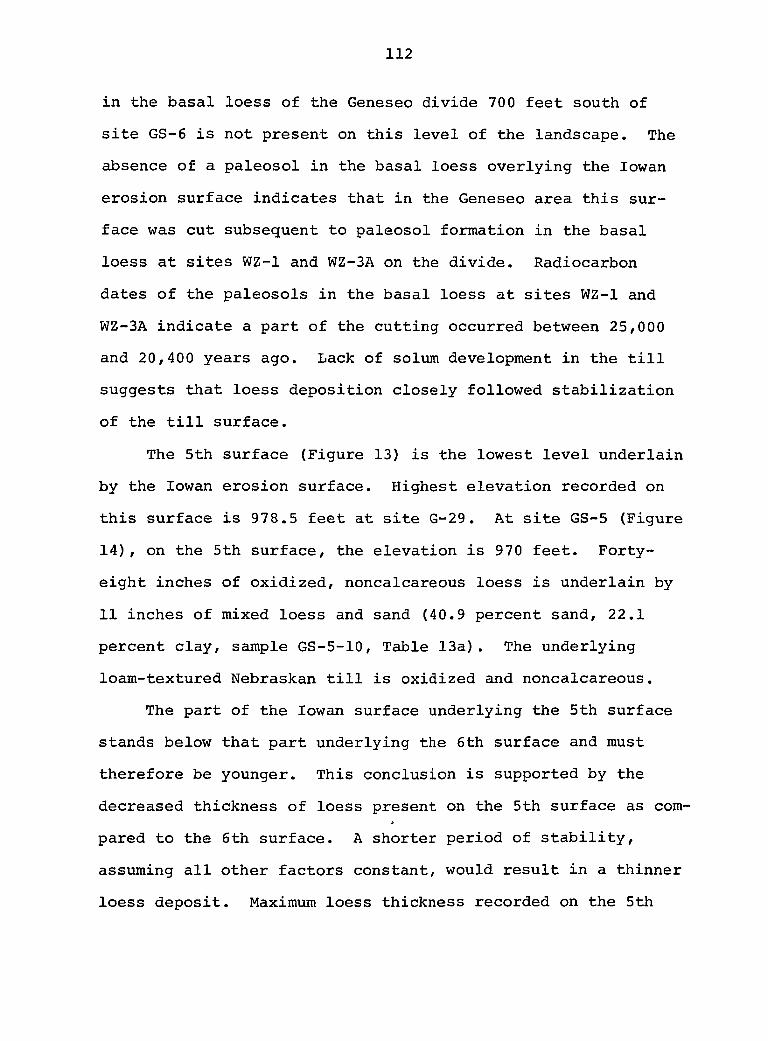
112
in the basal loess of the Geneseo divide 700 feet south of
site GS-6 is not present on this level of the landscape. The
absence of a paleosol in the basal loess overlying the lowan
erosion surface indicates that in the Geneseo area this sur
face was cut subsequent to paleosol formation in the basal
loess at sites WZ-1 and WZ-3A on the divide. Radiocarbon
dates of the paleosols in the basal loess at sites WZ-1 and
WZ-3A indicate a part of the cutting occurred between 25,000
and 20,400 years ago. Lack of solum development in the till
suggests that loess deposition closely followed stabilization
of the till surface.
The 5th surface (Figure 13) is the lowest level underlain
by the lowan erosion surface. Highest elevation recorded on
this surface is 978.5 feet at site G-29. At site GS-5 (Figure
14), on the 5th surface, the elevation is 970 feet. Forty-
eight inches of oxidized, noncalcareous loess is underlain by
11 inches of mixed loess and sand (40.9 percent sand, 22.1
percent clay, sample GS-5-10, Table 13a). The underlying
loam-textured Nebraskan till is oxidized and noncalcareous.
The part of the lowan surface underlying the 5th surface
stands below that part underlying the 6th surface and must
therefore be younger. This conclusion is supported by the
decreased thickness of loess present on the 5th surface as com
pared to the 6th surface. A shorter period of stability,
assuming all other factors constant, would result in a thinner
loess deposit. Maximum loess thickness recorded on the 5th
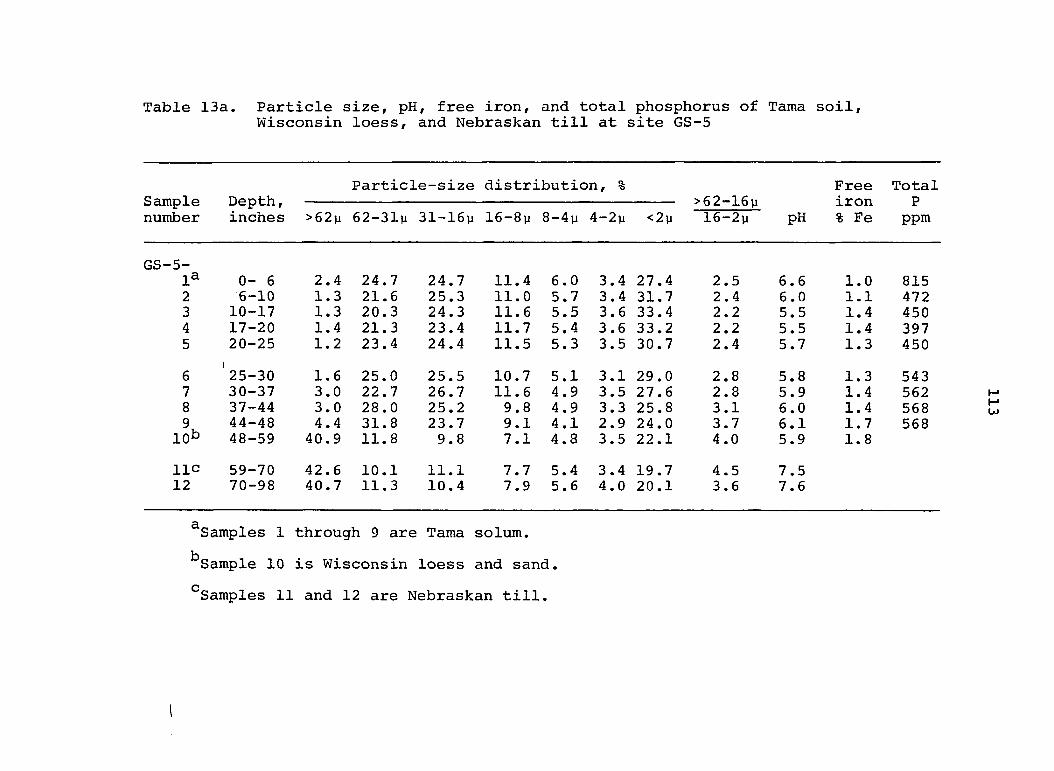
Table 13a. Particle size, pH, free iron, and total phosphorus of Tama soil, Wisconsin loess, and Nebraskan till at site GS-5
Particle-size distribution, % Free Total Sample Depth, >62-16y iron P number inches >62p 62-31# 31-16# 16-8# 8-4# 4-2# <2# 16-2# pH % Fe ppm
GS-5-1^ 0- 6 2.4 24.7 24.7 11.4 6.0 3.4 27.4 2.5 6.6 1.0 815 2 6-10 1.3 21.6 25.3 11.0 5.7 3.4 31.7 2.4 6.0 1.1 472 3 10-17 1.3 20.3 24.3 11.6 5.5 3.6 33.4 2.2 5.5 1.4 450 4 17-20 1.4 21.3 23.4 11.7 5.4 3.6 33.2 2.2 5.5 1.4 397 5 20-25 1.2 23.4 24.4 11.5 5.3 3.5 30.7 2.4 5.7 1.3 450
6 '25-30 1.6 25.0 25.5 10.7 5.1 3.1 29.0 2.8 5.8 1.3 543 7 30-37 3.0 22.7 26.7 11.6 4.9 3.5 27.6 2.8 5.9 1.4 562 8 37-44 3.0 28.0 25.2 9.8 4.9 3.3 25.8 3.1 6.0 1.4 568
44-48 4.4 31.8 23.7 9.1 4.1 2.9 24.0 3.7 6.1 1.7 568 lob 48-59 40.9 11.8 9.8 7.1 4.8 3.5 22.1 4.0 5.9 1.8
lie 59-70 42.6 10.1 11.1 7.7 5.4 3.4 19.7 4.5 7.5 12 70-98 40.7 11.3 10.4 7.9 5.6 4.0 20.1 3.6 7.6
^Samples 1 through 9 are Tama solum.
^Sample 10 is Wisconsin loess and sand.
^Samples 11 and 12 are Nebraskan till.
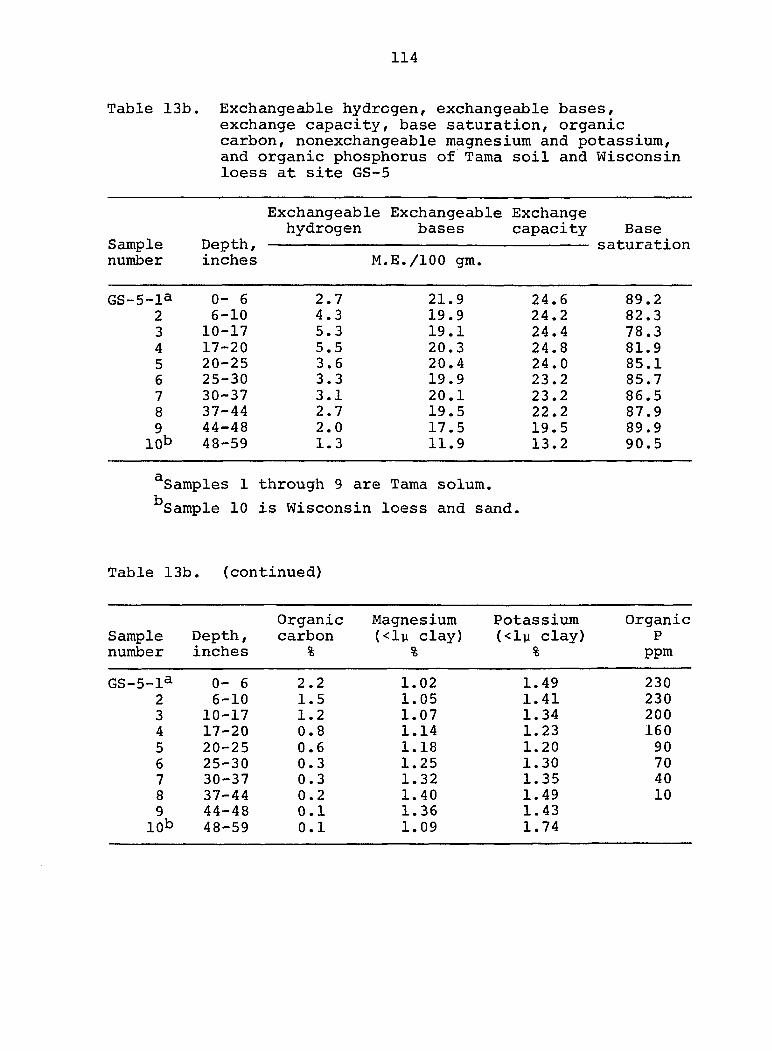
114
Table 13b. Exchangeable hydrogen, exchangeable bases, exchange capacity, base saturation, organic carbon, nonexchangeable magnesium and potassium, and organic phosphorus of Tama soil and Wisconsin loess at site GS-5
Sample number
Depth, inches
Exchangeable hydrogen
Exchangeable bases
Exchange capacity Base
saturation Sample number
Depth, inches M. E./lOO gm.
Base saturation
GS—5—1^ 0- 6 2.7 21.9 24.6 89.2 2 6-10 4.3 19.9 24.2 82.3 3 10-17 5.3 19.1 24.4 78.3 4 17-20 5.5 20.3 24.8 81.9 5 20-25 3.6 20.4 24.0 85.1 6 25-30 3.3 19.9 23.2 85.7 7 30-37 3.1 20.1 23.2 86.5 8 37-44 2.7 19.5 22.2 87.9 9 44—48 2.0 17.5 19.5 89.9 lOb 48-59 1.3 11.9 13.2 90.5
^Samples 1 through 9 are Tama solum.
^Sample 10 is Wisconsin loess and sand.
Table 13b. (continued)
Organic Magnesium Potassium Organic Sample Depth, carbon (<lli clay) (<ly clay) P number inches % % % ppm
GS-5-1^ 0- 6 2.2 1.02 1.49 230 2 6-10 1.5 1.05 1.41 230 3 10-17 1.2 1.07 1.34 200 4 17-20 0.8 1.14 1.23 160 5 20-25 0.6 1.18 1.20 90 6 25-30 0.3 1.25 1.30 70 7 30-37 0.3 1.32 1.35 40 8 37-44 0.2 1.40 1.49 10 9 44-48 0.1 1.36 1.43 lOb 48-59 0.1 1.09 1.74
115
surface in this area is 4 feet (site GS-5), while on the 6th
surface up to 7.5 feet of loess is present (site G-22).
Absence of the basal-loess paleosol and lack of solum develop
ment in the till are similar to the characteristics of the
lowan surface underlying the 6th surface.
The variation in elevations among the 7th, 6th, and 5th
surfaces is due to the combined effects of erosion and loess
deposition. The 7th surface is the highest land surface and
is underlain by the Yarmouth-Sangamon surface, which itself
occupies the divide area of the buried landscape. The
Yarmouth-Sangamon surface represents the most stable portion
of the buried landscape and it accumulated all increments of
Wisconsin loess. The 6th and 5th surfaces stand at lower
elevations and are underlain by the lowan erosion surface,
which was being cut below the level of the Yarmouth-Sangamon
surface during loess deposition. They have been stable for
shorter time periods and accumulated only the later increment
of Tazewell loess. The part of the lowan erosion surface
underlying the 5th surface is cut into the lower-lying
Nebraskan till, and the 5th surface has a lower elevation than
the 6th surface. This part of the lowan erosion surface was
one of the last parts to stablize and therefore accumulated
loess for a shorter time period.
Terrace The 4th surface (Figure 13) is a loess-
covered terrace and is the 4th highest surface above the aver
age water level of Wolf Creek. Elevations on this surface
116
range from 850 to 860 feet. Loess thickness ranges from 3 to
8 feet.
The sand content (>62%) of the material underlying the
loess at site GS-4 (Table 14) located on the 4th surface
increases from 39.2 percent at 39 inches to 86 percent at 55
inches. At site 6-161, also located on the 4th surface
(Figure 14), 3 feet of loess are underlain by 40 feet of sand
similar to that described in the GS-4 site. The sand at si te
G-161 is underlain by limestone bedrock at a depth of 43 feet.
The sand underlying the loess on the 4th surface was
traced up drainageways that head on slopes that descend to the
6th surface. For example, at site G-130 (Figure 14) sand
begins at 5 feet and extends to greater than 12 feet in depth.
At site G-132 (Figure 14) sand begins at 4.5 feet and con
tinues to a depth greater than 9 feet. Thus, at least a
portion of the sand of the terrace has as its source area the
uplands above the 4th surface.
The loess in which the soil profile is developed at site
GS-4, located on the 4th surface, has a slightly higher sand
content in the upper 39 inches (Table 14) than the soil pro
files located at sites GS-5, GS-6, and WZ-1 (Tables 13a, 6a,
and 2a) located on the upland-summit surfaces. However, the
sand content is less than 5 percent throughout the 39 inches
of loess at the GS-4 site. Also, the clay content of the sur
face horizon (0-10 inches) is less and the depth to the
horizon of maximum clay content is greater in the profile at

Table 14. Particle size, pH, exchangeable hydrogen, exchangeable bases, exchange capacity, base saturation, and organic carbon of Tama (bench phase) soil at site GS-4^
Particle-size distribution, % Sample number
Depth, inches >62)i 62-31w 31-16% 16-8% 8-4% 4-2% <2%
>62-16% 16—2% pH
GS—4—1 0-10 3.6 17.3 25.6 15.4 7.3 4.9 25.9 1.7 5.6 2 10-18 3.0 16.2 23.7 15.2 7.3 5.1 29.6 1.6 5.1 3 18-22 3.1 14.3 24.8 14.9 7.9 5.1 30.1 1.5 5.2 4 22-32 2.2 17.6 24.0 13.8 6.9 5.0 30.5 5.3 5 32-39 4.4 17.8 22.7 12.6 4.3 6.3 31.8 1.7 5.2 6 39-47 39.2 13.3 13.0 5.7 2.9 2.2 23.7 6.1 5.3 7 47-55 61.1 15.7 4.2 2.0 1.3 1.1 14.6 17.2 4.6 8 55-62 86.0 7.7 0.0 0.5 0.8 0.0 4.9 70.2 5.4
^Data from Ruhe et al. (1965, p. 40a) therein designated as profile WOC 177.
Table 14. (continued)
Sample number
Depth, inches
Exchangeable hydrogen
Exchangeable bases
M.E./lOO gm.
Exchange capacity
Base saturation
Organic carbon
GS-4-1 0-10 5.3 16.3 21.6 75.5 1.97 2 10-18 7.2 13.8 21.0 65.7 1.48 3 18-22 6.0 14.2 20.2 70.3 1.11 4 22-32 4.9 17.3 22.2 77.9 0.62 5 32-39 4.4 18.8 23.2 81.0 0.41 6 39-47 3.8 13.4 17.2 77.9 0.30 7 47-55 2.6 8.0 10.6 75.5 0.26 8 55-62 0.9 2.6 3.5 74.3 0.15
118
site GS-4 as compared to the profiles at sites GS-5, GS-6, and
WZ-1 on the upland-summit surfaces. The differences in the
amount of clay and its distribution in the upper 39 inches of
the GS-4 profile as compared to the upland soils may reflect
the influence of the coarse-textured sand underlying the loess
at the GS-4 site.
Floodplain surfaces
The lower three surfaces in this area form the present
floodplain of Wolf Creek and are designated as the 1st, 2nd,
and 3rd surfaces (Figure 13). This designation indicates the
relative elevation of the surfaces to the average water level
of Wolf Creek. For example, the 3rd surface is the 3rd high
est level above the average water level of Wolf Creek in this
area.
A log of American elm was encountered at a depth of 9.5
feet beneath the 3rd surface on the north bank of Wolf Creek.
Wood from this log yielded a radiocarbon date (1-1421) of 2080
± 115 years (Ruhe et ̂ ., 1965, p. 22). Therefore, the three
lowest surfaces in this area, which comprise the present
floodplain of Wolf Creek, are younger than 2080 ± 115 years.
Hillslope surfaces
The hillslope surfaces, comprised of slopes and alluvial
fills, associated with the upland-summit surfaces, terrace,
and floodplain of this area are listed in Table 12 and are
shown in Figure 13. The sloping surfaces are identified by
119
two symbols, the letter "S" indicating a sloping surface and
a number designating the surface or fill to which the slope
descends. For example, S3 indicates a slope that descends to
the 3rd surface or to alluvial fill 3. The alluvial fills are
identified by two symbols also. "F" indicates alluvial fill
and a number (N) designates the Nth surface or (N-1) fill to
which the alluvial fill (N) descends. For example, F3 indi
cates an alluvial fill that descends to the 3rd surface or to
the next lower alluvial fill, F2.
The angular truncation of the deoxidized weathering zones
present in the Tazewell loess at sites WZ-2 and WZ-3 (Figure
6) indicates that the uppermost increment of loess was beveled
by slopes that are post-Tazewell in age. The alluvial fills
in the valleys at the base of the slopes were not dated, so
further refinement of the age of the slopes is not possible at
this time.
Weathering Zones in the Wisconsin Loess
Weathering zones are present in the loess of northeastern
Iowa but have not been described in detail previously. The
purpose of this section is to identify the zones present,
describe their distribution, and briefly characterize selected
properties of these zones in the Wisconsin loess of the
Geneseo area. The nomenclature used in describing the
weathering zones is similar to that used by Ruhe (1954).
120
Weathering zones present and their general characteristics
A brief description of the weathering zones identified in
the Wisconsin loess in this study is given below.
Oxidized and leached zone (OL) Characteristic matrix
colors of this zone are lOYR 4/4 and 5/4. Carbonates are not
present. Light brownish gray mottles generally increase in
size and abundance with depth. Strong brown mottles and black
manganese specks also increase in number with depth.
Oxidized and unleached zone (OU) Matrix colors,
mottles, and manganese specks in this zone are similar to the
ones described above. Primary carbonates are present and
secondary carbonates are not uncommon. Often, the first iron
tubules (pipestems), strong brown and dark reddish brown in
color, appear in this zone. Manganese coatings also may
occasionally be present on horizontal or vertical cleavage
faces.
Deoxidized and leached zone (DL) Matrix colors of
this zone are 2.5Y 5/2-6/2 or 5Y 6/2. Abundant iron tubules,
strong brown and yellowish brown mottles, and black manganese
specks are other distinguishing characteristics. Carbonates
are not present.
Deoxidized and unleached zone (DU) This zone is
similar to the above zone except for the presence of primary
carbonates. Secondary carbonate nodules may also be present.
Unoxidized and leached zone (UL) Characteristic
colors of this zone have hues of N, 5Y, 5BY, 5GB, 5BG, or 5G
121
with values of 4, 5, or 6 and chromas of 1 or less. No iron
segregation is apparent, and carbonates are not present.
Bands or flecks of organic material may be present.
Unoxidized and unleached zone (UU) This zone is
similar to the one described above, except for the presence of
primary carbonates.
A modifier (M) was included to indicate those weathering
zones containing 10 to 40% mottles.
Distribution of weathering zones
Divide area The distribution of the weathering zones
of the Wisconsin loess was studied in a detailed traverse
beginning at site WZ-1 located on the summit of the paha.
Continuous core samples of the loess were collected at all
sites in this traverse except G-38. Site G-38 is included as
a part of this traverse only to show the general stratigraphy
of the summit. Identification of the weathering zone bounda
ries at site G-38 may not be as exact as the other sites
because the description is based on drill cuttings. Other
sites included in this traverse (Traverse A, Figure 6) are
sites WZ-2, WZ-3, WZ-3A, WZ-4, and WZ-5. There sites are
located on the N-NE facing slope of the paha.
The sequence of weathering zones of the Wisconsin loess
at site WZ-1 (Figure 6) is:
Surficial soil Oxidized and leached
, Mottled oxidized and leached Mottled oxidized and unleached
122
Deoxidized and unleached Oxidized and unleached Unoxidized and unleached Unoxidized and leached Basal-loess paleosol
This sequence is the most complex of the sites studied.
Organic matter from the Alb horizon of the basal-loess paleosol
at this site is radiocarbon dated (1-1267) at 25,000 ± 2500
years. Organic matter bands in the basal leached loess over
lying the Yarmouth-Sangamon paleosol at sites WZ-2 and WZ-3
correlate stratigraphically with the basal-loess paleosol
present at site WZ-1.
The weathering zones present above the basal-loess
paleosol vary among the three sites. Depth to carbonates is
greatest at site WZ-1 on the summit. The carbonates in site
WZ-1 begin in the mottled oxidized zone, while at site WZ-2
the carbonates begin in the mottled deoxidized zone. Carbon
ates are not present in the 7.5 feet of loess at site WZ-3.
The deoxidized zone at site WZ-1 is 12.3 feet beneath the sur
face and extends to 20 feet with a resulting range in elevation
of 1023.3 feet to 1015.6 feet. At site WZ-2 the mottled
deoxidized zone begins 4 feet beneath the surface and extends
to 16.6 feet with a resulting range in elevation of 1016.2 to
1006.4. Thus, there is an overlap in the elevation of the
deoxidized zones of sites WZ-1 and WZ-2. However, the eleva
tion of the top of this zone at site WZ-2 is near the elevation
of the bottom of the zone at site WZ-1. At site WZ-3, the
only weathering zone present in the loess beneath the soil
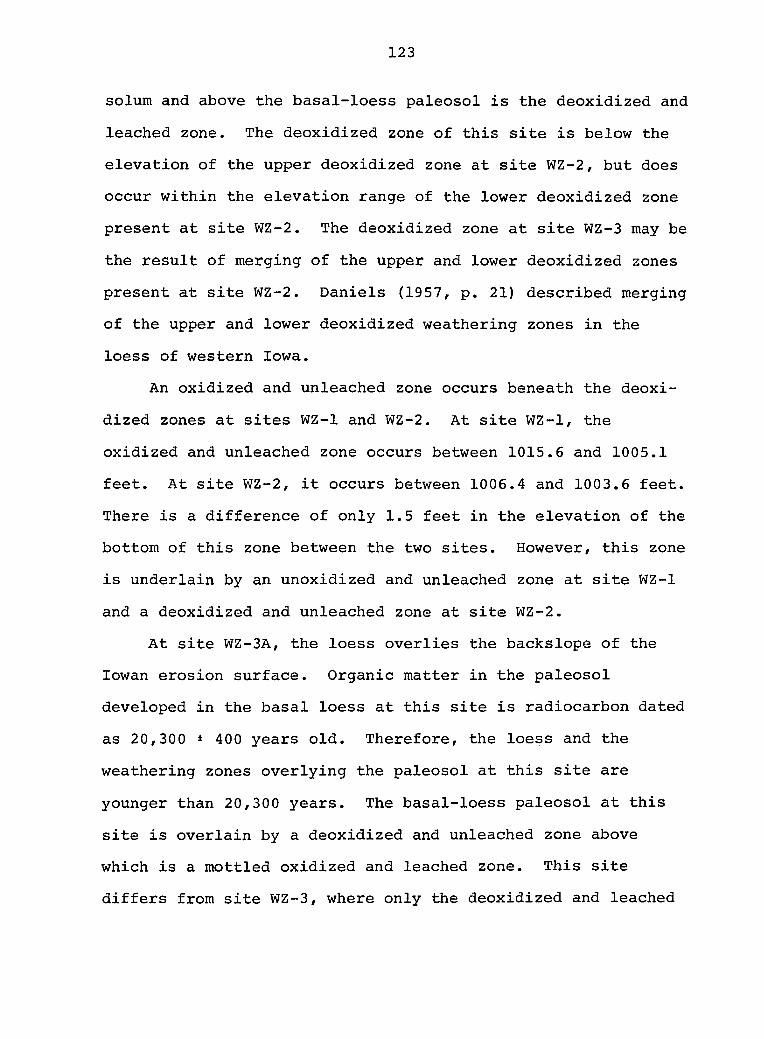
123
solum and above the basal-loess paleosol is the deoxidized and
leached zone. The deoxidized zone of this site is below the
elevation of the upper deoxidized zone at site WZ-2, but does
occur within the elevation range of the lower deoxidized zone
present at site WZ-2. The deoxidized zone at site WZ-3 may be
the result of merging of the upper and lower deoxidized zones
present at site WZ-2. Daniels (1957, p. 21) described merging
of the upper and lower deoxidized weathering zones in the
loess of western Iowa.
An oxidized and unleached zone occurs beneath the deoxi
dized zones at sites WZ-1 and WZ-2. At site WZ-1, the
oxidized and unleached zone occurs between 1015.6 and 1005.1
feet. At site WZ-2, it occurs between 1006.4 and 1003.6 feet.
There is a difference of only 1.5 feet in the elevation of the
bottom of this zone between the two sites. However, this zone
is underlain by an unoxidized and unleached zone at site WZ-1
and a deoxidized and unleached zone at site WZ-2.
At site WZ-3A, the loess overlies the backslope of the
lowan erosion surface. Organic matter in the paleosol
developed in the basal loess at this site is radiocarbon dated
as 20,300 t 400 years old. Therefore, the loess and the
weathering zones overlying the paleosol at this site are
younger than 20,300 years. The basal-loess paleosol at this
site is overlain by a deoxidized and unleached zone above
which is a mottled oxidized and leached zone. This site
differs from site WZ-3, where only the deoxidized and leached
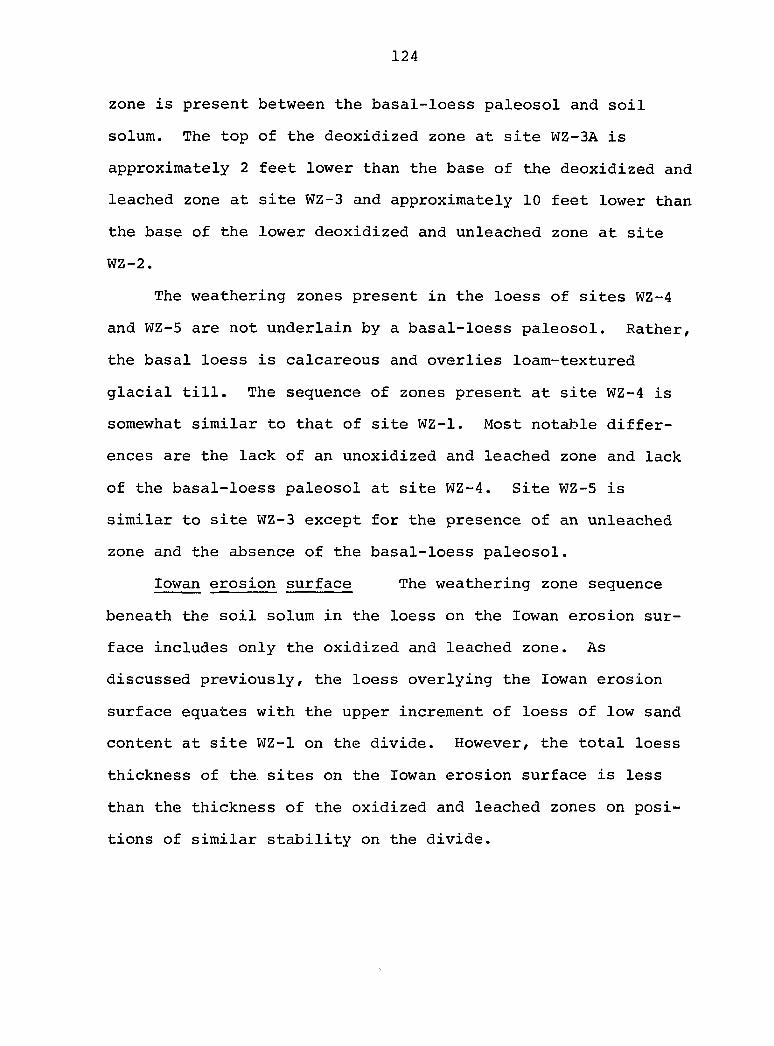
124
zone is present between the basal-loess paleosol and soil
solum. The top of the deoxidized zone at site WZ-3A is
approximately 2 feet lower than the base of the deoxidized and
leached zone at site WZ-3 and approximately 10 feet lower than
the base of the lower deoxidized and unleached zone at site
WZ-2.
The weathering zones present in the loess of sites WZ-4
and WZ-5 are not underlain by a basal-loess paleosol. Rather,
the basal loess is calcareous and overlies loam-textured
glacial till. The sequence of zones present at site WZ-4 is
somewhat similar to that of site WZ-1. Most notable differ
ences are the lack of an unoxidized and leached zone and lack
of the basal-loess paleosol at site WZ-4. Site WZ-5 is
similar to site WZ-3 except for the presence of an unleached
zone and the absence of the basal-loess paleosol.
lowan erosion surface The weathering zone sequence
beneath the soil solum in the loess on the lowan erosion sur
face includes only the oxidized and leached zone. As
discussed previously, the loess overlying the lowan erosion
surface equates with the upper increment of loess of low sand
content at site WZ-1 on the divide. However, the total loess
thickness of the sites on the lowan erosion surface is less
than the thickness of the oxidized and leached zones on posi
tions of similar stability on the divide.
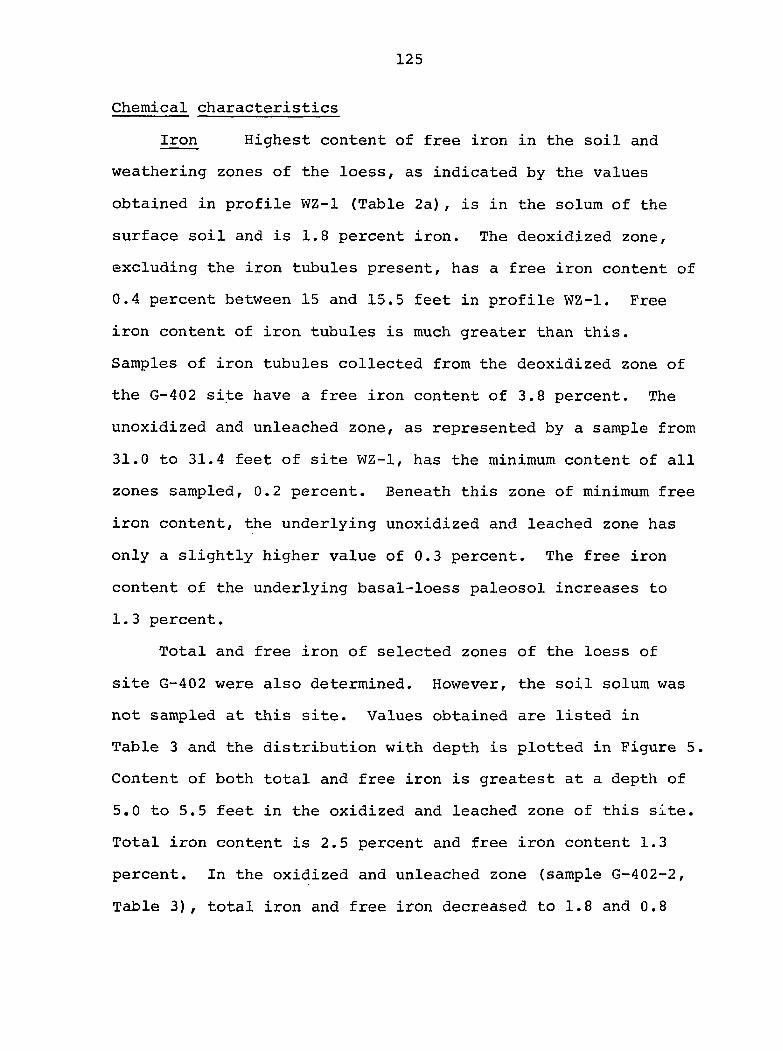
125
Chemical characteristics
Iron Highest content of free iron in the soil and
weathering zones of the loess, as indicated by the values
obtained in profile WZ-1 (Table 2a), is in the solum of the
surface soil and is 1.8 percent iron. The deoxidized zone,
excluding the iron tubules present, has a free iron content of
0.4 percent between 15 and 15.5 feet in profile WZ-1. Free
iron content of iron tubules is much greater than this.
Samples of iron tubules collected from the deoxidized zone of
the G-402 site have a free iron content of 3.8 percent. The
unoxidized and unleached zone, as represented by a sample from
31.0 to 31.4 feet of site WZ-1, has the minimum content of all
zones sampled, 0.2 percent. Beneath this zone of minimum free
iron content, the underlying unoxidized and leached zone has
only a slightly higher value of 0.3 percent. The free iron
content of the underlying basal-loess paleosol increases to
1.3 percent.
Total and free iron of selected zones of the loess of
site G-402 were also determined. However, the soil solum was
not sampled at this site. Values obtained are listed in
Table 3 and the distribution with depth is plotted in Figure 5.
Content of both total and free iron is greatest at a depth of
5.0 to 5.5 feet in the oxidized and leached zone of this site.
Total iron content is 2.5 percent and free iron content 1.3
percent. In the oxidized and unleached zone (sample G-402-2,
Table 3), total iron and free iron decreased to 1.8 and 0.8
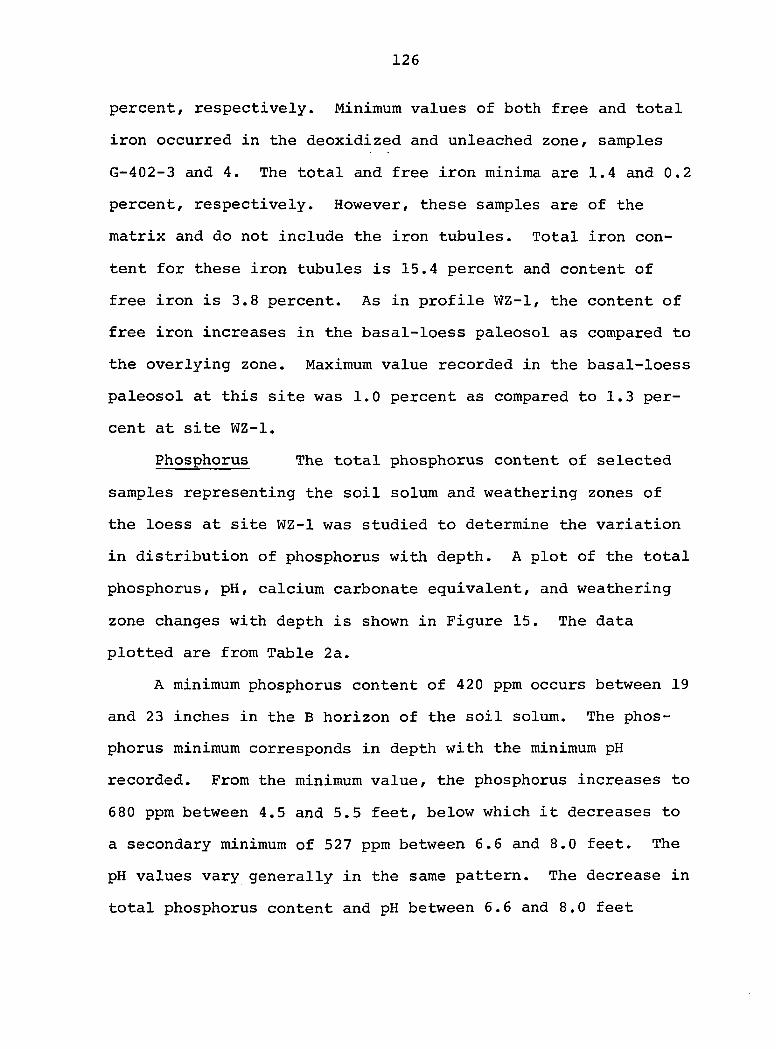
126
percent, respectively. Minimum values of both free and total
iron occurred in the deoxidized and unleached zone, samples
G-402-3 and 4. The total and free iron minima are 1.4 and 0.2
percent, respectively. However, these samples are of the
matrix and do not include the iron tubules. Total iron con
tent for these iron tubules is 15.4 percent and content of
free iron is 3.8 percent. As in profile WZ-1, the content of
free iron increases in the basal-loess paleosol as compared to
the overlying zone. Maximum value recorded in the basal-loess
paleosol at this site was 1.0 percent as compared to 1.3 per
cent at site WZ-1.
Phosphorus The total phosphorus content of selected
samples representing the soil solum and weathering zones of
the loess at site WZ-1 was studied to determine the variation
in distribution of phosphorus with depth. A plot of the total
phosphorus, pH, calcium carbonate equivalent, and weathering
zone changes with depth is shown in Figure 15. The data
plotted are from Table 2a.
A minimum phosphorus content of 420 ppm occurs between 19
and 23 inches in the B horizon of the soil solum. The phos
phorus minimum corresponds in depth with the minimum pH
recorded. From the minimum value, the phosphorus increases to
680 ppm between 4.5 and 5.5 feet, below which it decreases to
a secondary minimum of 527 ppm between 6.6 and 8.0 feet. The
pH values vary generally in the same pattern. The decrease in
total phosphorus content and pH between 6.6 and 8.0 feet
Figure 15. Distribution of total phosphorus, pH, calcium carbonate equivalent, and weathering zones in Tama soil and Wisconsin loess at site WZ-1 (data from Table 2a)
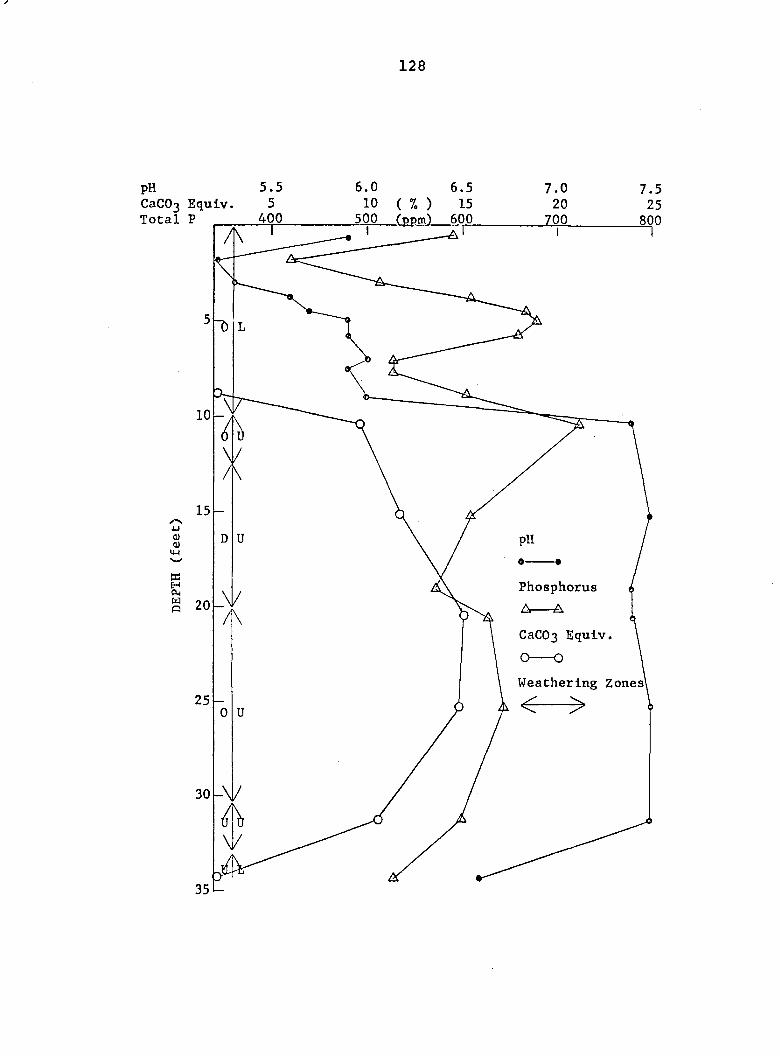
/
128
PH CaCOg Equlv Total P
Phosphorus
A A
CaC03 Equlv
O O
Weathering Zones
129
coincides with a zone of high sand content. Between 9.8 and
11 feet, the phosphorus content increases to 725 ppm. This
sample represents the beginning of the unleached zone and this
is reflected by an increase in the pH value and calcium carbon
ate equivalent. Also, this zone decreases in sand content as
compared to the overlying material. The phosphorus content
decreases in the deoxidized zone while the pH and calcium
carbonate values increase slightly. Down to the unoxidized
and leached zone, phosphorus and calcium carbonate values
change little and are parallel. Calcium carbonate equivalent,
pH, and total phosphorus all decrease in the unoxidized and
leached zone.
Discussion
The presence of the deoxidized zone with abundant iron
segregation in the loess of the divide area cannot be related
to the present topographic environment of these sites, which
is considered to be well drained. The color and iron segre
gation of these zones suggest conditions of poor aeration and
drainage. Therefore, here, as in western Iowa (Ruhe et al.,
1955), these zones are considered to be relicts ^f an earlier
environment where the water table and zone of saturation stood
at higher elevations than at present.
A deoxidized weathering zone is not present in the loess
of the lower landscape. As discussed previously, the loess of
the lower landscape equates stratigraphically with the upper
130
loess of the divide area which overlies the deoxidized zone.
The absence of the deoxidized zone in the loess of the lower
landscape in this area perhaps indicates that conditions on
the lower landscape were not favorable for formation of this
zone. There are no broad extensive flats on the lower land
scape within the Geneseo area. Another possible alternative
is that deposition of the upper part of the loess occurred
subsequent to formation of the deoxidized weathering zones.
Soils
The Geneseo area is included within the Dinsdale-Tama
soil association area (Oschwald et al., 1965) . This soil
association area is between the Tama-Muscatine and Kenyon-
Floyd-Clyde association area and is a transition zone between
these areas. Dinsdale soils have sola formed in loess 17 to
40 inches thick and glacial till. Tama soils have sola formed
in loess greater than 40 inches in thickness. In the pub
lished soil survey report of Tama County (Aandahl et a^.,
1950) , areas that presently would be mapped as Dinsdale soils
are shown as Carrington silt loam.
The native vegetation in northern Tama County in the past
has been assumed to be predominantly prairie. Presence of
grainy gray ped coats in Tama soils has been cited as evidence
of previous forest vegetation (Ryan, 1959; Arnold, 1963).
Within the Dinsdale-Tama association area, Fayette and other
soils thought to have developed under timber vegetation are
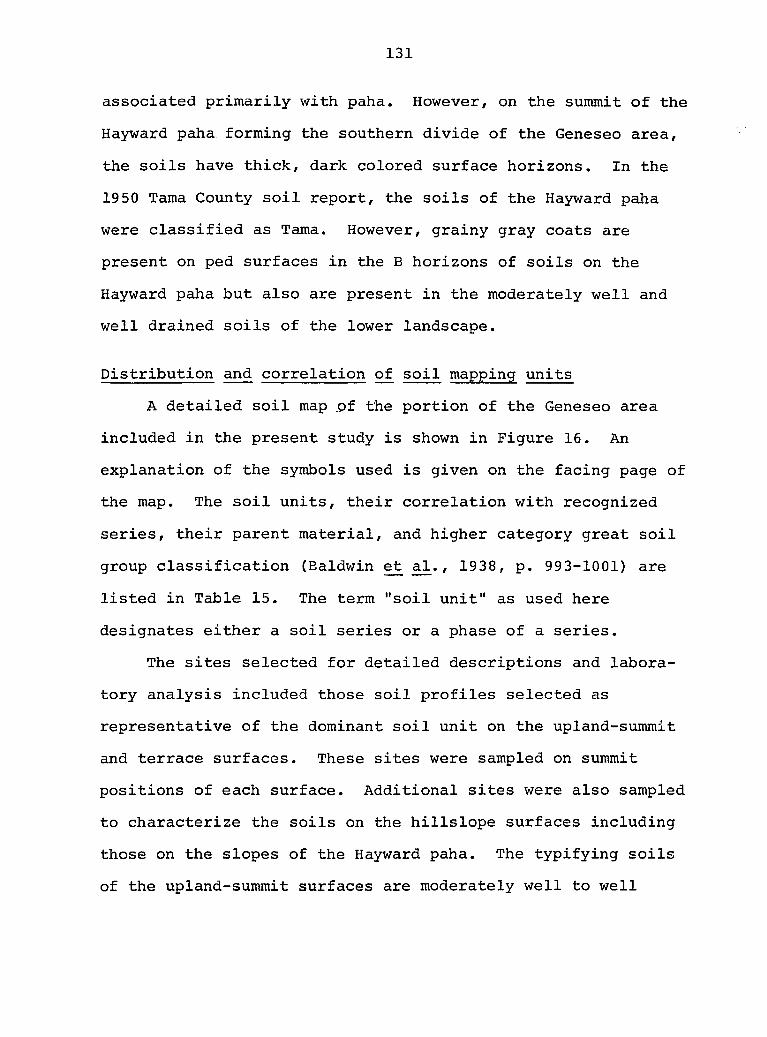
131
associated primarily with paha. However, on the summit of the
Hayward paha forming the southern divide of the Geneseo area,
the soils have thick, dark colored surface horizons. In the
1950 Tama County soil report, the soils of the Hayward paha
were classified as Tama. However, grainy gray coats are
present on ped surfaces in the B horizons of soils on the
Hayward paha but also are present in the moderately well and
well drained soils of the lower landscape.
Distribution and correlation of soil mapping units
A detailed soil map .pf the portion of the Geneseo area
included in the present study is shown in Figure 16. An
explanation of the symbols used is given on the facing page of
the map. The soil units, their correlation with recognized
series, their parent material, and higher category great soil
group classification (Baldwin et a^., 1938, p. 993-1001) are
listed in Table 15. The term "soil unit" as used here
designates either a soil series or a phase of a series.
The sites selected for detailed descriptions and labora
tory analysis included those soil profiles selected as
representative of the dominant soil unit on the upland-summit
and terrace surfaces. These sites were sampled on summit
positions of each surface. Additional sites were also sampled
to characterize the soils on the hillslope surfaces including
those on the slopes of the Hayward paha. The typifying soils
of the upland-summit surfaces are moderately well to well
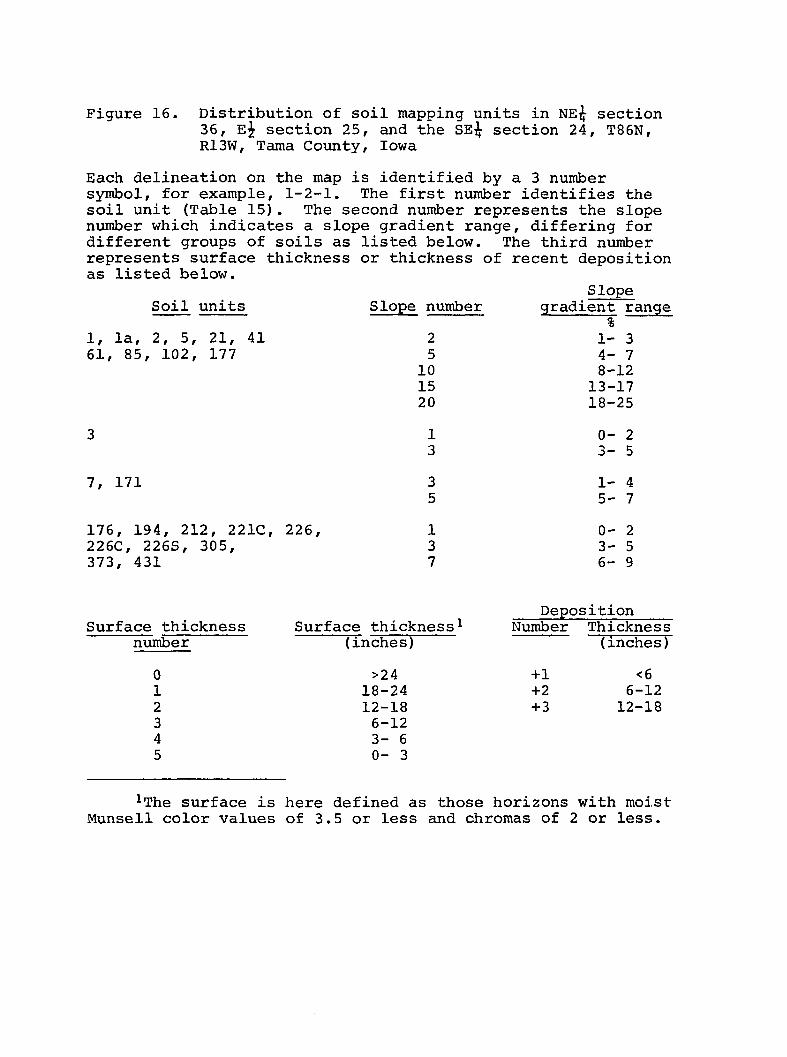
Figure 16. Distribution of soil mapping units in NE^ section 36, section 25, and the SE^ section 24, T86N, R13W, Tama County, Iowa
Each delineation on the map is identified by a 3 number symbol, for example, 1-2-1. The first number identifies the soil unit (Table 15). The second number represents the slope number which indicates a slope gradient range, differing for different groups of soils as listed below. The third number represents surface thickness or thickness of recent deposition as listed below.
Slope Soil units Slope number gradient range
% 1, la, 2, 5, 21, 41 2 1-3 61, 85, 102, 177 5 4-7
10 8-12 15 13-17 20 18-25
3 1 0 - 2 3 3 - 5
7, 171 3 1-4 5 5 - 7
176, 194, 212, 221C, 226, 1 0-2 226C, 226S, 305, 3 3-5 373, 431 7 6-9
Deposition Surface thickness Surface thickness ̂ Number Thickness
number (Tnches) (inches)
0 >24 +1 <6 1 18-24 +2 6-12 2 12-18 + 3 12-18 3 6-12 4 3- 6 5 0- 3
iThe surface is here defined as those horizons with moist Munsell color values of 3.5 or less and chromas of 2 or less.
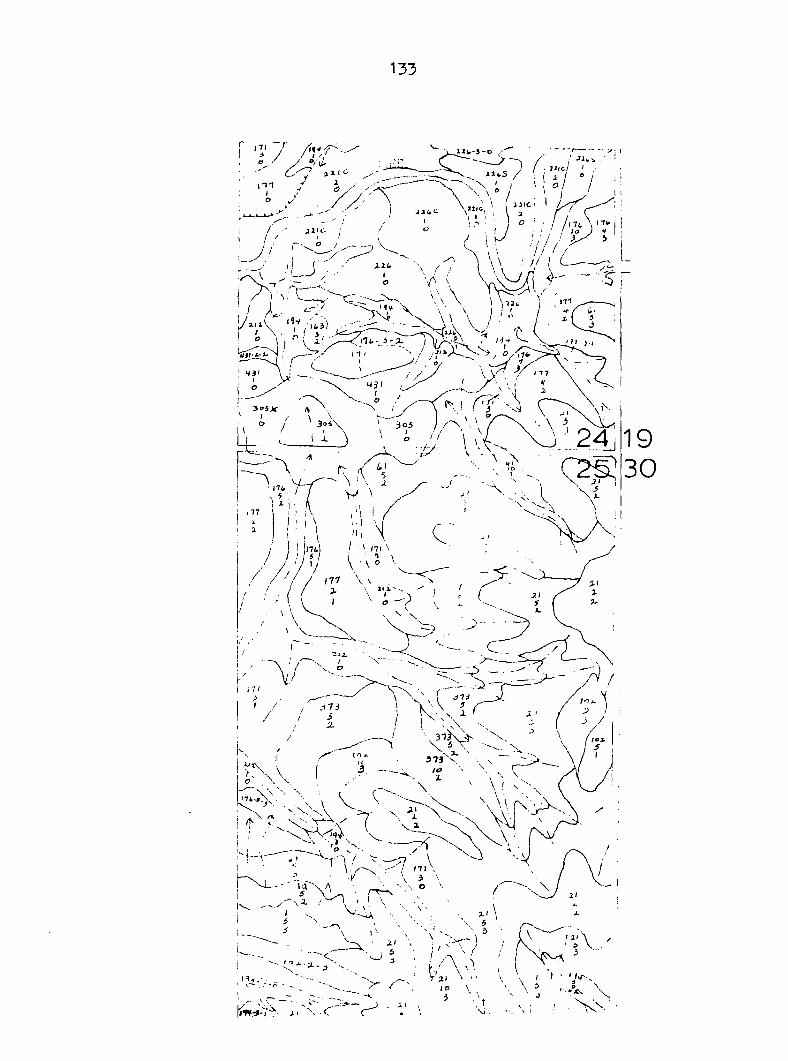
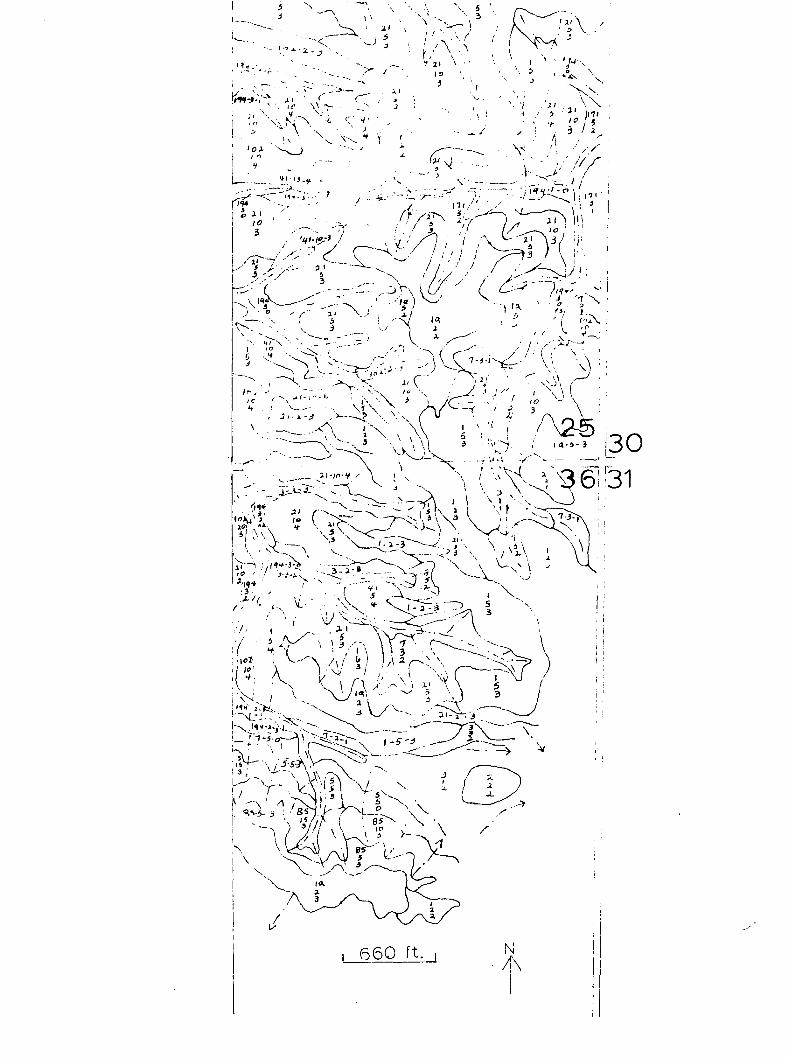
! . -
' "Oi /1 V
' • r ' r"
-N c C 't<
\ \ J
V-. •*
- ,/l
t'-li .y.
/ - •!»-•
- F- ' / 11
, 6 60 f t .
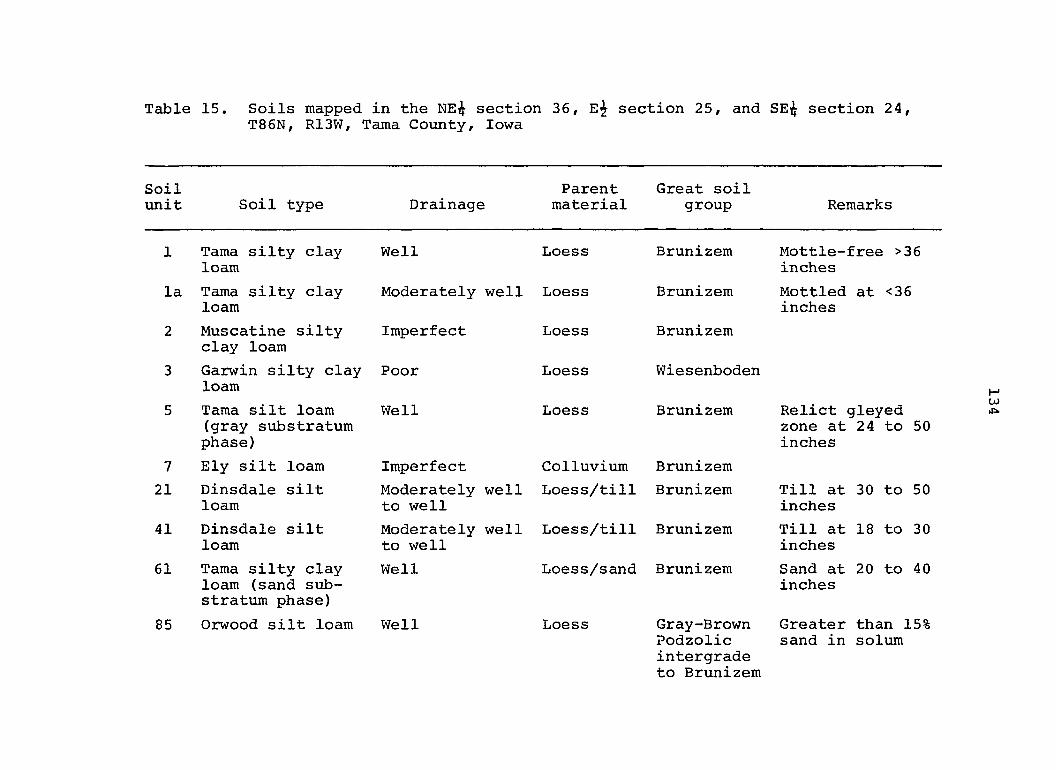
Soil unit
1
la
2
3
5
7
21
41
61
85
15. Soils mapped in the NEi^ section 36, section 25, and SEi^ section 24, T86N, R13W, Tama County, Iowa
Soil type Drainage Parent material
Great soil group Remarks
Well
Tama silty clay Well loam
Tama silty clay loam
Muscatine silty clay loam
Garwin silty clay loam
Tama silt loam (gray substratum phase)
Ely silt loam
Dinsdale silt loam
Dinsdale silt loam
Tama silty clay Well loam (sand substratum phase)
Orwood silt loam Well
Loess
Moderately well Loess
Imperfect
Poor
Loess
Loess
Loess
Brunizem
Brunizem
Brunizem
Wiesenboden
Brunizem
Colluvium Brunizem Imperfect
Moderately well Loess/till Brunizem to well
Moderately well Loess/till Brunizem to well
Loess/sand Brunizem
Loess
Mottle-free >36 inches
Mottled at <36 inches
Gray-Brown Podzolic intergrade to Brunizem
Relict gleyed zone at 24 to 50 inches
Till at 30 to 50 inches
Till at 18 to 30 inches
Sand at 20 to 40 inches
Greater than 15% sand in solum
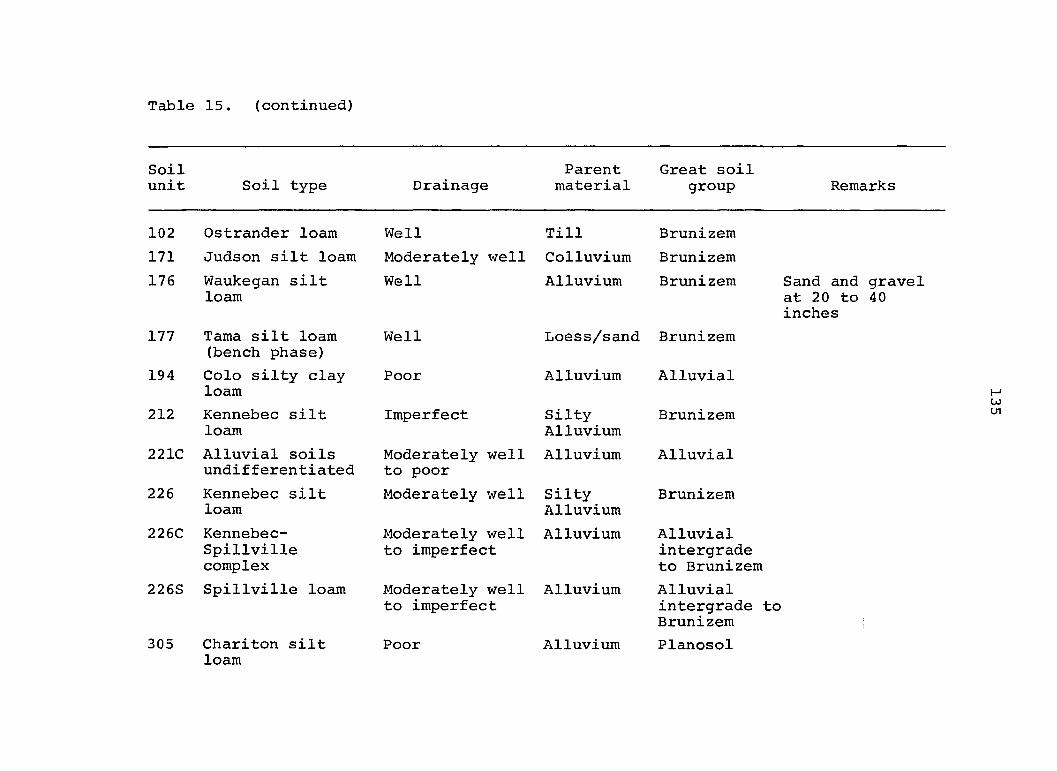
Table 15. (continued)
Soil unit Soil type Drainage
102 Ostrander loam
171 Judson silt loam
176 Waukegan silt loam
Well
Moderately well
Well
177 Tama silt loam (bench phase)
194 Colo silty clay loam
212 Kennebec silt loam
221C Alluvial soils undifferentiated
226 Kennebec silt loam
226C Kennebec-Spillville complex
226S Spillville loam
Well
Poor
Imperfect
Moderately well to poor
Moderately well
Moderately well to imperfect
Moderately well to imperfect
305 Chariton silt loam
Poor
Parent Great soil material group Remarks
Till Brunizem
Colluvium Brunizem
Alluvium Brunizem
Loess/sand Brunizem
Alluvium Alluvial
Sand and gravel at 20 to 40 inches
Silty Alluvium
Alluvium
Brunizem
Alluvial
Silty Alluvium
Alluvium
Alluvium
Alluvium
Brunizem
Alluvial intergrade to Brunizem
Alluvial intergrade to Brunizem
Planosol
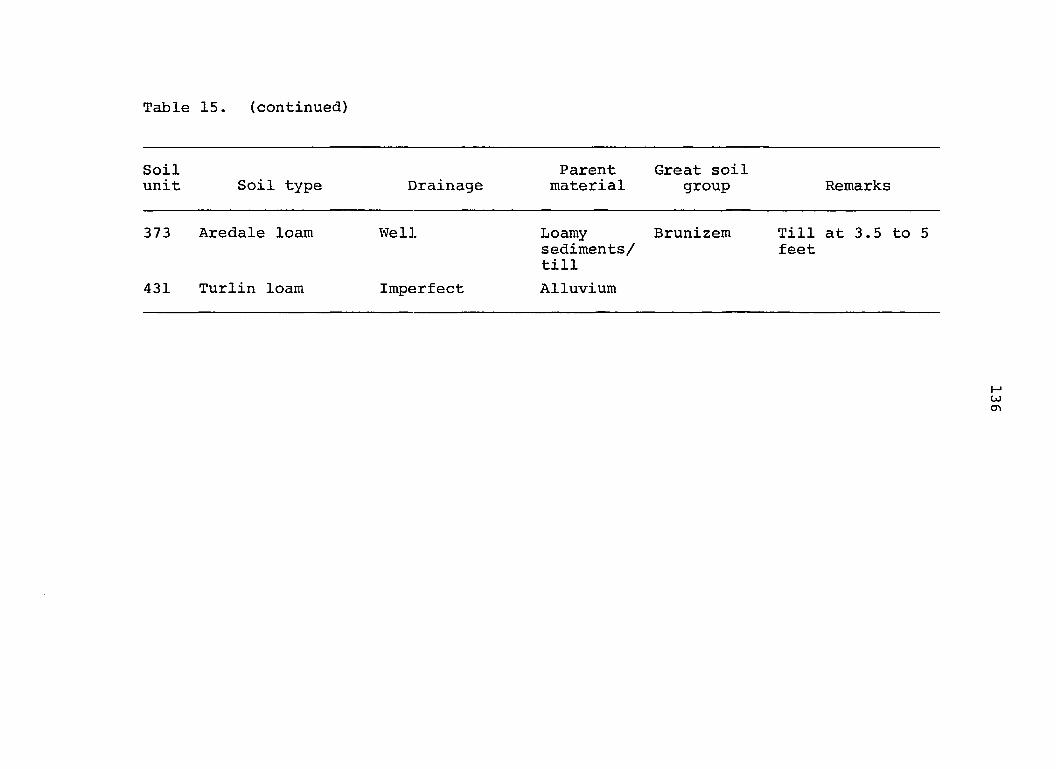
Table 15. (continued)
Soil unit Soil type Drainage
Parent material
Great soil group Remarks
373 Aredale loam Well Loamy sediments/ till
Brunizem Till feet
at 3.5 to 5
431 Turlin loam Imperfect Alluvium
137
drained Brunizem soils developed from loess.
The location of the soil profiles sampled for laboratory
study are shown in Figure 14 and detailed morphological
descriptions are presented in Appendix A. A soil profile
typical of the soils on the 7th surface was sampled at site
WZ-1. Site GS-6 was selected as a representative profile of
the 6th surface. The characteristics of these units are
included with the range of soil unit la (Table 15). On the
5th surface, the soil profile located at site GS-5 was selected
as a representative profile of this surface. The character
istics of soil profile GS-5 are included within the range of
soil unit 1 (Table 15). Soil unit la has mottles at less than
36 inches, while soil unit 1 is mottle-free to depths greater
than 36 inches. Morphologically, these units are within the
range of the Tama series as currently defined. The soil pro
file sampled at site GS-4 was selected as typical of the well
drained soils of the terrace or 4th surface. The loess at
this site was underlain by sand at a depth of 39 inches.
Characteristics of this soil profile are within the range of
soil unit 177 (Table 15) tentatively correlated as Tama silt
loam, bench phase.
Characteristics of soils on upland-summit and terrace surfaces
Laboratory data for sites WZ-1, GS-6, GS-5 and GS-4 are
recorded in Tables 2a, 2b, 6a, 6b, 13a, 13b, and 14. The
soils at sites GS-6 and WZ-1 are representative of soil unit
138
la (Table 15). The soils at sites GS-5 and GS-4 are repre
sentative soil units 1 and 177, respectively (Table 15). In
the following section, reference is also made to soil profile
Palermo 1 from the Palermo study area, which in this study
will be referred to as soil profile Pal-1. The morphological
characteristics of this soil profile are included within the
range of soil unit la, correlated as Tama silty clay loam. It
occurs on the 6th surface equivalent in the Palermo area.
Laboratory data for the Pal-1 site are recorded in Table 20a.
Particle-size distribution The percent sand and per
cent clay for the above soils are plotted in Figure 17. In
these five soils, representing soil units 1, l'a, and 177, sand
content is generally less than 5 percent and is not variable
until 50 inches is approached, except for the soil at site
GS-4. At a depth of 39 inches in this profile, the sand con
tent increases to 39.2 percent reflecting a change in
materials. In the field, the horizon between 39 and 47 inches
was described as a mixture of loess and sand, loam in texture.
Below this depth, the texture is loamy sand. The increased
sand content at site GS-5 occurs in the zone between the loess
of low sand content and the underlying till.
Clay distribution in these soils is quite similar except
for the soil at site GS-4. The surface horizon of this soil
is silt loam in texture and has a clay content of 25.9 percent.
Textures of the surface horizons of soil units 1 and la are
silty clay loam, ranging in clay content from 27.3 percent at
Figure 17. Particle-size distribution in Tama soils at sites WZ-1, GS-6, GS-5, GS-4, and Pal-1 (data from Tables 2a, 6a, 13a, 14, and 20a)
Figure 18. Organic carbon distribution in Tama soils at sites WZ-1, GS-6, GS-5, GS-4, and Pal-1 (data from Tables 2b, 6b, 13b, 14, and 20b)
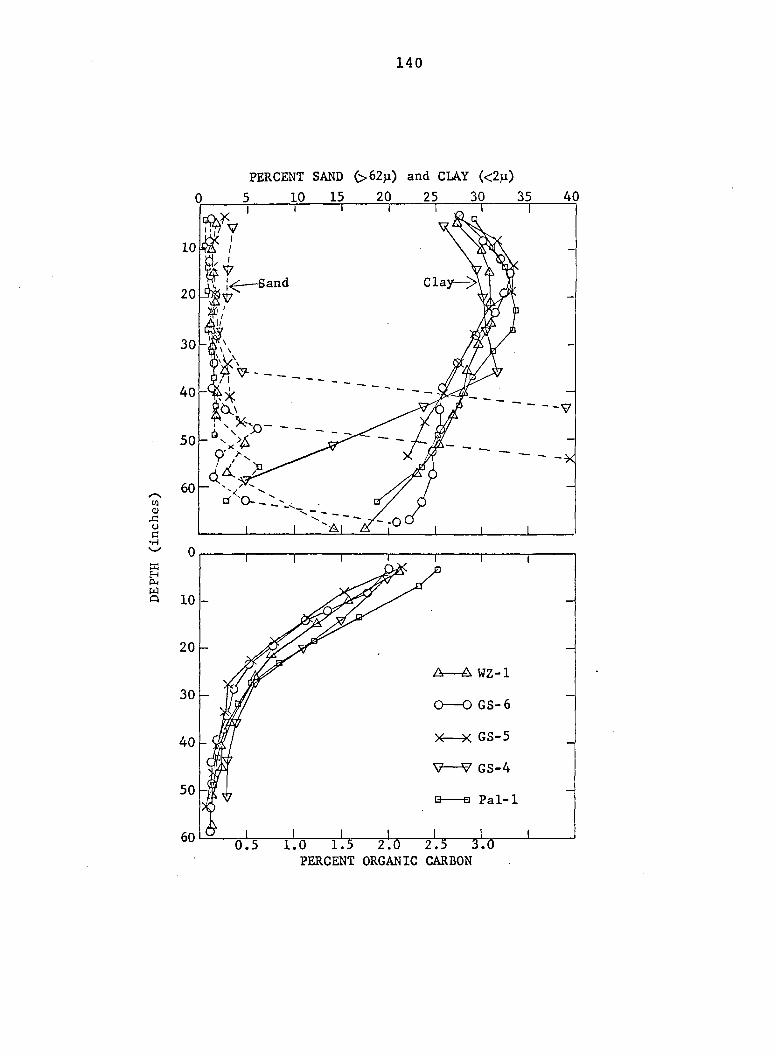
20
30
40
50
60
0
10
20
30
40
50
60
140
PERCENT SAND and CLAY (<2^)
40
-
A—A WZ-1
O O GS-6
V—V GS-4
•B Pal-1
0.5
PERCENT ORGANIC CARBON
141
site WZ-1 to 29.2 percent at the Pal-1 site. The depth to
maximum percent clay ranges from 17.5 inches at site WZ-1 to
35.5 inches at site GS-4. The greater depth to the maximum
percent clay in the latter site may be the result of the
underlying coarser material. The coarser textured lower solum
and underlying sand may have resulted in greater leaching at
this site. Excluding the 35.5-inch figure, the greatest depth
to maximum percent clay is 23 inches in the Pal-1 soil. The
percent clay present in the horizon of maximum clay content
ranges from 31.2 percent at site WZ-1 to 33.8 percent at the
Pal-1 site. Ratio of maximum percent clay in the B horizon to
minimum percent clay in the A horizon (B/A clay ratio) ranges
from 1.14 at site WZ-1 to 1.23 at site GS-4. Clay films were
not described in any of the above soils.
Organic carbon The distribution of organic carbon for
the same group of soils is shown in Figure 18. Maximum per
cent organic carbon present is 2.5 percent in the surface of
the Pal-1 soil. Minimum value recorded in the surface hori
zons is 1.9 percent at site GS-6. The depth to <0.5 percent
organic carbon ranges from 21 inches in the GS-6 soil to 32
inches in the GS-4 soil. Of all the profiles, excluding the
latter one, the maximum depth to <0.5 percent organic carbon
is 29 inches in the Pal-1 profile.
Cation-exchange capacity The cation-exchange capacity
was determined by summation of total exchangeable bases and
exchangeable hydrogen. These values are plotted in Figure 19.
Figure 19. Distribution of cation-exchange capacity in Tama soils at sites WZ-1, GS-6, GS-5, GS-4, and Pal-1 (data from Tables 2b, 6b, 13b, 14, and 20b)
Figure 20. Distribution of base saturation in Tama soils at sites WZ-1, GS-6, GS-5, GS-4, and Pal-1 (data from Tables 2b, 6b, 13b, 14, and 20b)
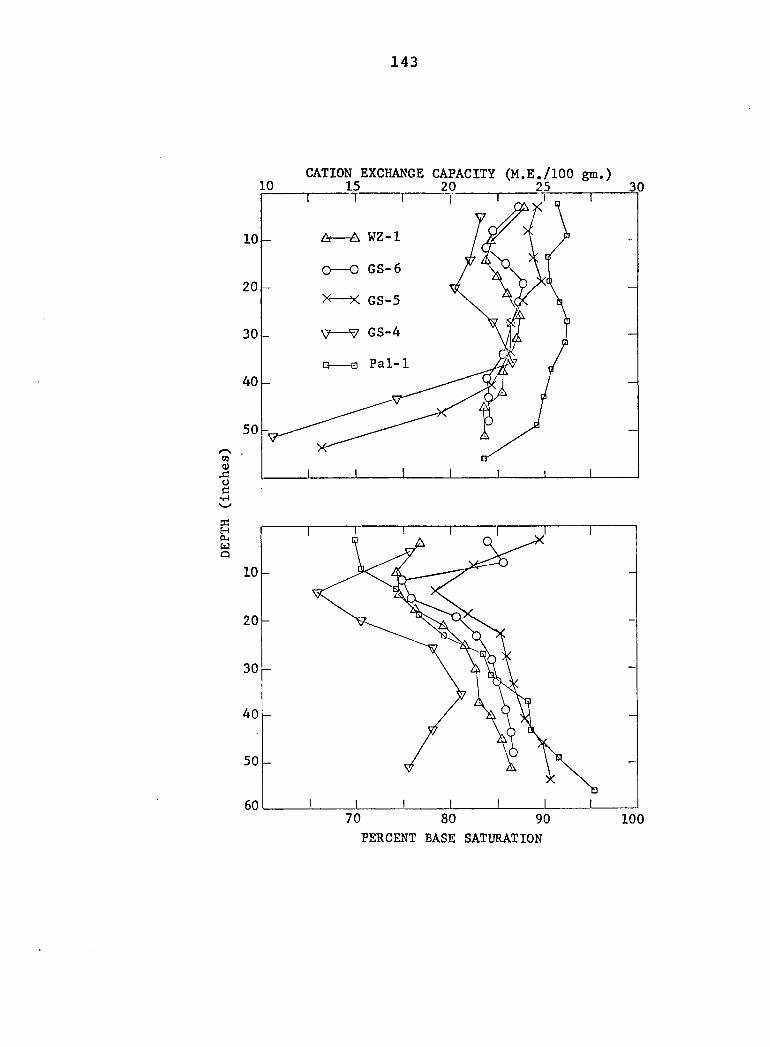
143
CATION EXCHANGE CAPACITY (M.E./lOO gm.)
1 1 1 1 1 1 1
10 A—A WZ-1 \ / -
0—0 GS- 6
20 _ \ —
X—K GS-5
30 V—V GS-4 À I -Q a Pa 1-1
40 - / —
50
1 1 1 1 1 1 o C •i-i
in H PU w Q
20
70 80 90 100 PERCENT BASE SATURATION
144
The Pal-1 profile has the greatest cation-exchange capacity to
the depth studied. A maximum value of 27.4 M.E./lOO gm. was
recorded at a depth of 25 to 29 inches in the B horizon of
this profile. The maximum values in the other soils also
occur within the B horizon, except for soil profile WZ-1 where
the maximum value of 23.8 M.E./lOO gm. occurs in the surface
horizon and in the B horizon. The range of maximum values of
cation-exchange capacity for the group of profiles shown in
Figure 19 is not large. Values range from 23.2 M.E./lOO gm.
in the GS-4 profile to 27.4 M.E./lOO gm. in the Pal-1 profile.
However, the maximum values occur at different depths in each
profile. The decrease in cation-exchange capacity in the
lower solum of the soils at sites GS-4 and GS-5 is attributed
to the decreased clay content as the contact with the under
lying material is approached.
Percent base saturation The percent base saturation
for these soils is shown in Figure 20. Base saturation values
for the surface horizons range from a low of 70 percent in the
Pal-1 profile to a maximum of 89.2 percent in the GS-5 pro
file. Between a depth of 20 and 40 inches, the values for all
the soils are grouped more closely, generally ranging between
80 and 87 percent. With increasing depth below 40 inches, the
base saturation continues to increase. An exception to this
trend is the GS-4 soil profile. This soil is lower in percent
base saturation throughout the horizons sampled with the
exception of the surface horizon. The base saturation value
145
of the surface horizon of the Pal-1 profile is the only value
lower than that of the GS-4 profile at a comparable depth.
Below the 40-inch depth in the GS-4 profile, the base satura
tion decreases and this area of decrease coincides with a
change of parent material.
Free iron The distribution of free iron for the soil
profiles located at sites WZ-1, GS-6, GS-5, and Pal-1 is shown
in Figure 21. Free iron content is at a minimum in the sur
face horizons, increases to a maximum in the B horizon, and
then decreases with depth. However, at a depth of 44 inches
in the GS-5 profile the free iron content increases to 1.7
percent, an increase of 0.3 percent as compared to the over
lying horizon. This increase is thought to reflect the
influence of the material of high sand content (40.9 percent)
beneath the loess of low sand content. This zone of high sand
content has 1.8 percent free iron.
Among these four soils, the minimum percent free iron of
the surface horizons ranges from 1.0 percent in the Pal-1 and
GS-5 profiles to 1.3 percent in the WZ-1 profile. Maximum
values of free iron in the B horizons range from 1.4 percent
in the Pal-1 and GS-5 profiles to 1.8 percent in the WZ-1 pro
file. The higher values obtained throughout the WZ-1 profile
may be an indication of timber influence in this soil. White
(1953, p. 51) reported higher amounts of free iron in profiles
considered to be influenced by timber vegetation. The abund
ance of grainy gray ped coats in the WZ-1 profile also
Figure 21. Distribution of free iron in Tama soils at sites WZ-1, GS-6, GS-5, and Pal-1 (data from Tables 2a, 6a, 13a, and 20a)
Figure 22. Distribution of organic phosphorus in Tama soils at sites WZ-1, GS-6, GS-5, and Pal-1 (data from Tables 2b, 6b, 13b, and 20b)
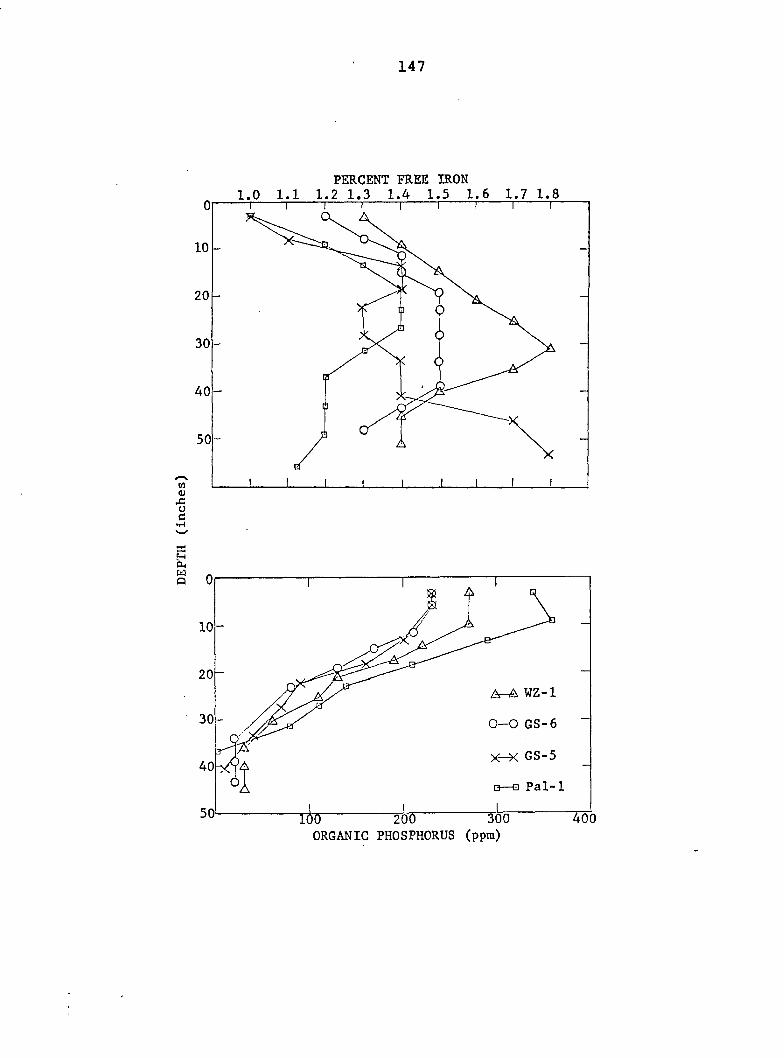
147
PERCENT FREE IRON
20
(U s: u c
04 w Q
A-A WZ-1
O—O GS-6
X-X GS-5
•—0 Pal-1
Mb R5 ^ ORGANIC PHOSPHORUS (ppm)
300
148
suggests that trees may have influenced the characteristics of
this soil.
Organic phosphorus Distribution of organic phosphorus
for the soils at sites WZ-1, GS-6, GS-5, and Pal-1 is shown in
Figure 22. In the Pal-1 profile, 330 ppm of organic phos
phorus are present in the surface horizon and this is the
maximum value obtained for the surface horizon among the four
soils. Minimum content of organic phosphorus of the surface
horizons is 230 ppm and occurs in both the GS-5 and GS-6 soil
profiles. The maximum amount of organic phosphorus present is
350 ppm. This maximum occurs between 7 and 11 inches in the
Pal-1 profile. The Pal-1 profile has the greatest content of
organic phosphorus throughout the upper solum. The relative
positions of the organic phosphorus curves among these soils
are similar to the relative positions of the organic carbon
curves of the same soils. As with the organic carbon distri
bution, the organic phosphorus distribution is higher close to
the surface and decreases with depth. Also, variation among
profiles decreases with increasing depth. Below 40 inches,
there is less than 40 ppm of organic phosphorus present in
this group of soils.
Total phosphorus The distribution of total phosphorus
for the above four soils is shown in Figure 23. Similar
trends of distribution are present among these soils. Total
phosphorus content is relatively high in the surface horizon,
decreases to a minimum in the B horizon, and then increases
Figure 23. Distribution of total phosphorus in Tama soils sites WZ-lf GS-6, GS-5, and Pal-1 (data from Tables 2a, 6a, 13a, and 20a)
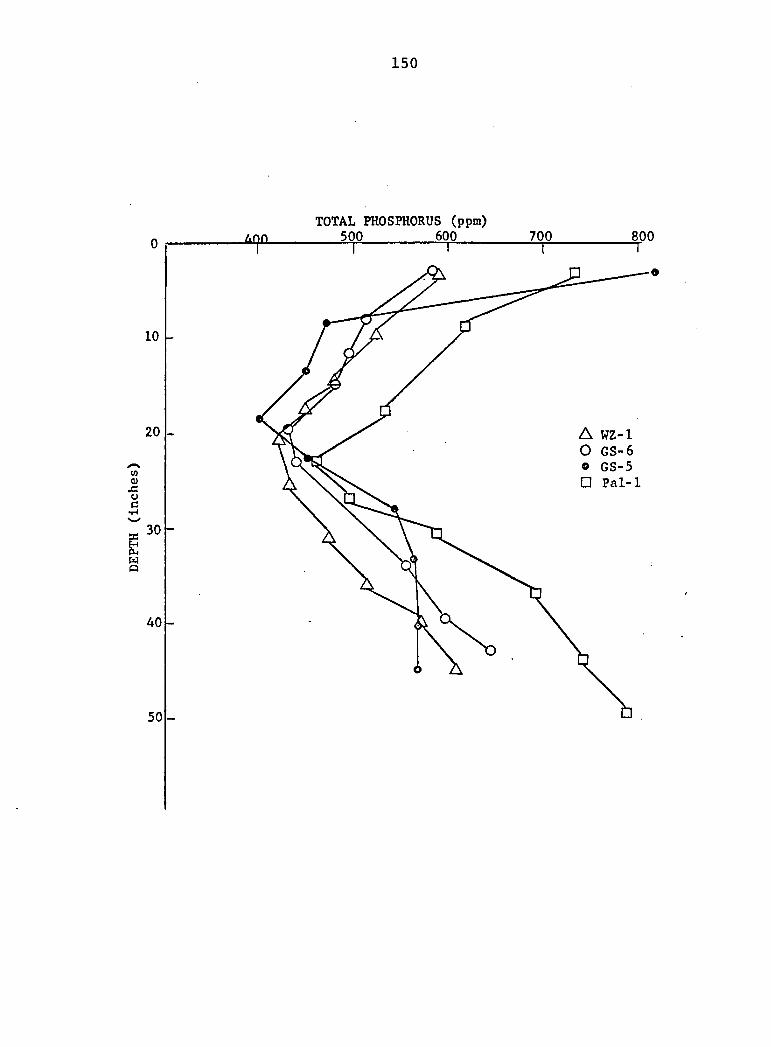
150
U|jOL TOTAL PHOSPHORUS (ppm)
500 600 700 800
10
20
w <u JC d
30
§
40
A WZ-1 O GS-6 o GS-5
• Pal-1
151
with depth. The range of total phosphorus content in the sur
face horizons varies from a minimum of 584 ppm in profile GS-6
to a maximum of 815 ppm in profile GS-5. Below the surface
horizon to the depth of the total phosphorus minimum, the GS-5
profile contains less total phosphorus than the other soils.
The minimum phosphorus content of 397 ppm occurs between 17
and 20 inches in the GS-5 profile. The depth to the minimum
total phosphorus content ranges from 18.5 inches in the GS-5
profile to 23 inches in the Pal-1 profile. The total phos
phorus content of the latter soil at the above depth is 460
ppm. The range in the minimum total phosphorus content within
each profile of this group of soils is thus 397 to 460 ppm.
In the lower solum, the WZ-1 profile has a lower total phos
phorus content, the GS-5 and GS-6 profiles are intermediate,
and the Pal-1 profile has the highest total phosphorus content.
Nonexchangeable magnesium of <ly clay fraction The
distribution of nonexchangeable magnesium of the <ly clay
fraction in the soil profiles located at sites WZ-1, GS-5, and
Pal-1 is shown in Figure 24. The magnesium content of the
surface horizons ranges from a low of 0.9 8 percent at^ite
WZ-1 to a maximum of 1.04 at site Pal-1. With increasing
depth, the magnesium content increases gradually in a
diffusion-like distribution. Between 15 and 35 inches, the
magnesium content of these soils is very similar. At a depth
of 15 inches, the magnesium content is about 1.1 percent and
gradually increases to approximately 1.3 percent at 35 inches.
Figure 24. Distribution of nonexchangeable magnesium of <lu clay in Tama soils at sites WZ-1, GS-5, and Pal-1 (data from Tables 2b, 13b, and 20b)
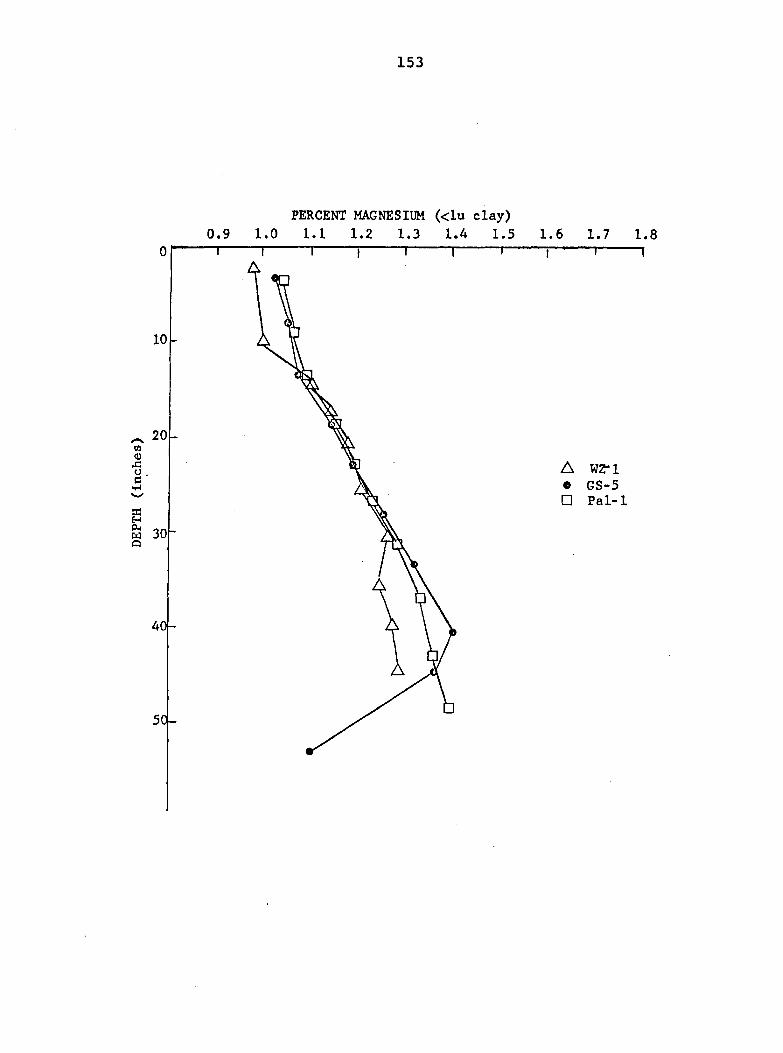
153
PERCENT MAGNESIUM (<lu clay)
1 . 1 1 . 2 1 . 3 1 . 4 1 . 5
154
Below 35 inches, the values diverge slightly but are rela
tively uniform to a depth of 48 inches. Between 48 and 59
inches in profile GS-5, the magnesium content decreases to
1.09 percent. This zone of decrease coincides with an
increase in sand content. In profiles WZ-1 and Pal-1, where
the loess remained low in sand content, magnesium content con
tinued to increase to the depth studied.
Nonexchangeable potassium of the <ly clay fraction
The distribution of nonexchangeable potassium of the <ly clay
fraction in the soil profiles located at sites WZ-1, GS-5,
and Pal-1 is shown in Figure 25. The potassium content of the
surface horizons ranges from a low of 1.49 percent in profile
GS-5 to a high of 1.63 percent in the Pal-1 profile. Within
each profile, the minimum content of potassium occurs in the B
horizon. Minimum amounts present in profiles GS-5, Pal-1, and
WZ-1 are 1.20, 1.21, and 1.22 percent, respectively. In the
lower sola, the potassium content increases gradually to a
depth of approximately 40 inches. Below this depth, the
potassium content of both the GS-5 and WZ-1 profiles decreases.
However, in the GS-5 profile, the potassium content increases
again in the basal loess of increased sand content. The Pal-1
profile continues to increase in potassium content beneath the
B horizon minimum to the depth studied.
Characteristics of soils on hillslope surface S3 of Hayward pah a
The soils associated with the sites of Traverse A
Figure 25. Distribution of nonexchangeable potassium of <lvi clay in Tama soils at sites WZ-1, GS-5, and Pal-1 (data from Tables 2b, 13b, and 20b)
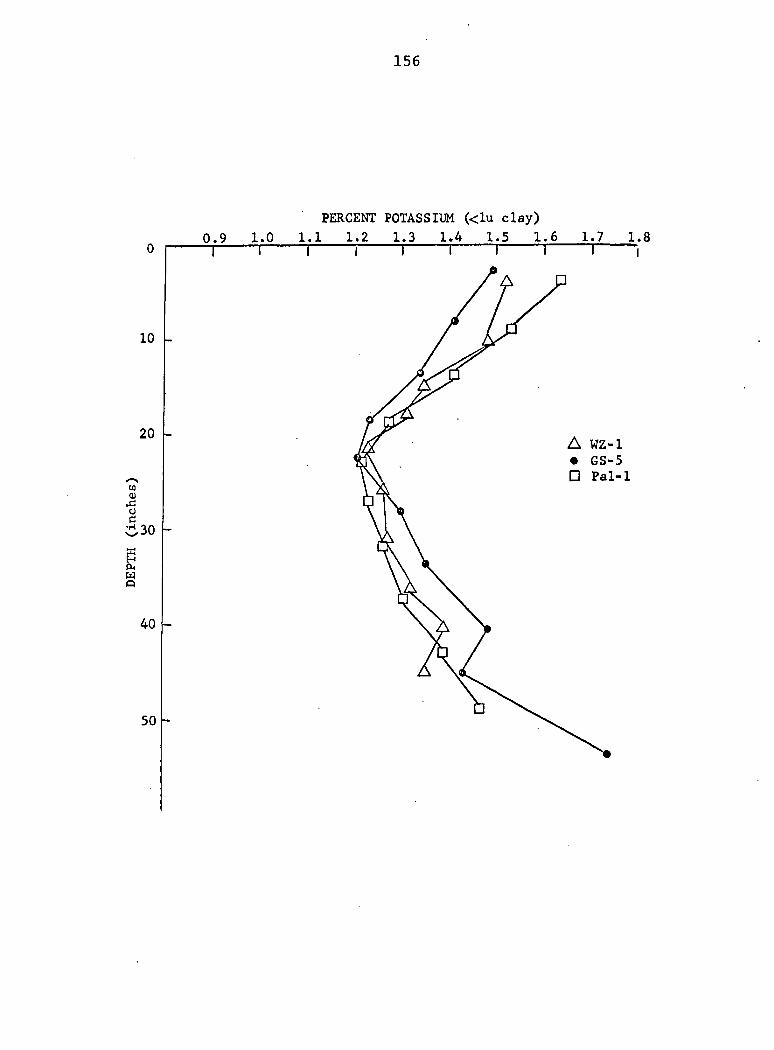
156
0.9 1.0
PERCENT POTASSIUM (<lu clay)
1.1 1.2 1.3 1.4 1.5 1.6 T
1.7 1.8 T I T T T
A WZ-1 • GS-5
• Pal-1
50
157
(Figure 6) on the N-NE facing slope of the Hayward paha (sites
WZ-2, WZ-3, WZ-4, and WZ-5) represent soil units that were
mapped only in association with the paha. In mapping, the
soil at site WZ-2 was included in soil unit 85 (Table 15) and
the soils at sites WZ-3, WZ-4, and WZ-5 were included in soil
unit 5 (Table 15). These soils occur on hillslope surface S3
(Figure 13). Laboratory data for these soils are presented in
Tables 4, 7, 9, and 10. Detailed morphological descriptions
are recorded in Appendix A.
Particle-size distribution The particle-size distri
bution of the soil located at the above sites is plotted in
Figure 26. The sand content is generally less than 7 percent
to a depth of 60 inches except for the soil profile at site
WZ-2. The sand content of the surface horizon of this soil
is 15.4 percent. Below the surface horizon, the sand content
increases to a maximum value of 33.5 percent between 18 and 24
inches. The elevation of the coarse-textured zone in which
the soil solum at this site is developed is included within
the elevation range of the coarse-textured zone of the loess
at site WZ-1 located on the summit of the paha.
The surface horizons of the soils on the slopes of the
paha are silt loam in texture. However, the higher sand con
tent of the soil at site WZ-2 results in a gritty silt loam
texture at this site. The maximum percent clay present in
this group of soils is 30.2 percent between 6 and 13 inches in
the soil profile at site WZ-4. The horizon of maximum clay
Figure 26. Particle-size distribution in soils on hillslope surface S3 of the Hayward paha (data from Tables 4, 7, 9, and 10)
Figure 27. Organic carbon distribution in soils on hillslope surface S3 of the Hayward paha (data from Tables 4, 7, 9, and 10)
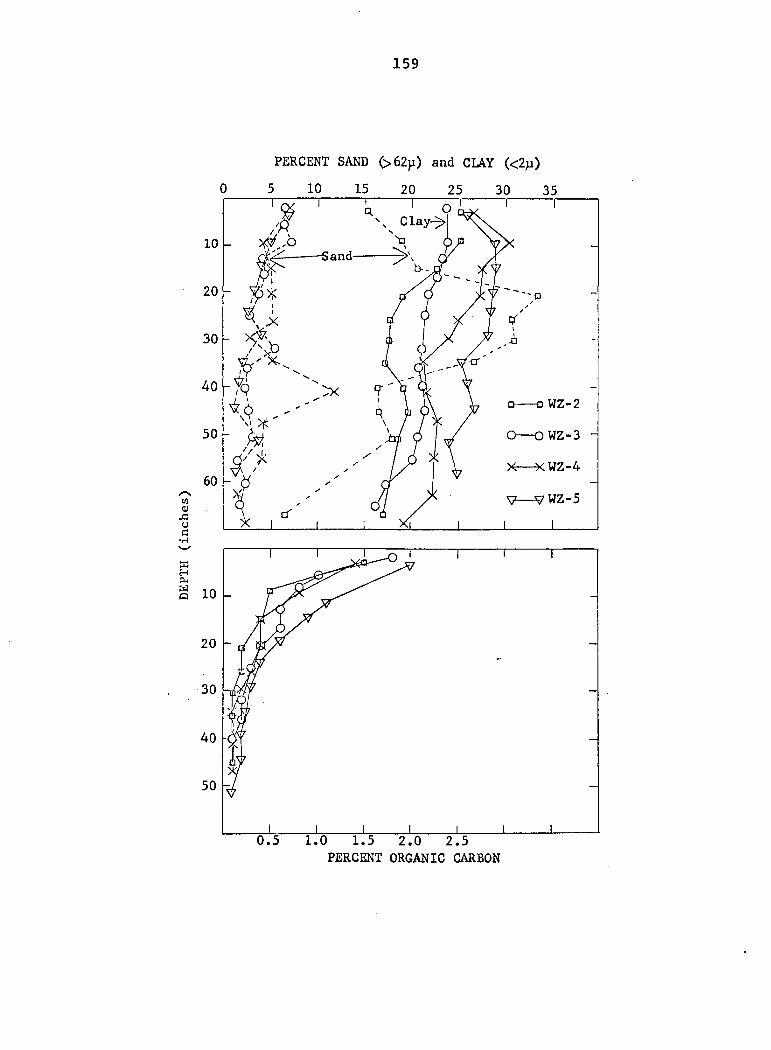
159
PERCENT SAND (>62p) and CLAY (<2p)
0 20
10 Sand
20 --0
30
^ WZ-2
50 O o WZ-3
X—XWZ-4 60
V—V WZ-5
10
20
30
40
50
0.5 1.0 I 1.5 2.0 2.5
PERCENT ORGANIC CARBON
160
content in the above soils is either in the surface horizon or
immediately below the surface horizon. Below a depth of 40
inches in all the profiles shown in Figure 26, there is evi
dence of a second zone of increased clay content. However,
the secondary maximum in all profiles is less than the clay
maximum zone near the surface.
As discussed previously in the stratigraphy section, a
plot of the ratios for these soils (Figure 8) suggests
a systematic decrease in the particle-size distribution down-
slope from site WZ-2. An examination of the plot of <2p clay
(Figure 26) shows that below a depth of 15 inches the soil
with the greatest ratio (Figure 8) has the minimum
clay content. A decreasing particle-size ratio among the
other profiles is associated with an increasing content of <2y
clay.
Organic carbon The distribution of organic carbon for
this group of soils is plotted in Figure 27. The maximum con
tent of organic carbon among these soils is 2.0 percent in the
surface horizon of the soil at site WZ-5. This soil has the
greatest organic carbon content to a depth of 50 inches. The
other three soils are grouped more closely. The minimum
organic carbon content of the surface horizons is 1.4 percent
in the soil profile located at site WZ-4. However, beneath
the surface horizon, the coarse-textured soil at site WZ-2
tends to have a lower organic carbon content. The depth to
<0.5 percent organic carbon ranges from a maximum of 22 inches
161
at site WZ-5 to a minimum of 12 inches at site WZ-2.
As compared to the soils of the upland-summit surfaces,
these soils have less organic carbon throughout the solum.
Also, the depth to the horizon of maximum clay content is less
as compared to the soils of the upland-summit surfaces. These
characteristics of the soils on the slopes may reflect the
influence of erosion on soil properties.
Correlation The sites on the slopes of the paha were
not selected as characteristic profiles of a soil unit.
Rather, they are sites in a traverse, the purpose of which was
to determine the stratigraphy and weathering zonation under
the slopes of the divide area. Therefore, some of the soils
at these sites are inclusions within mapping units.
The soil at site WZ-2 has characteristics similar to
soils of the Orwood series. The members of the Orwood series
are described as Gray-Brown Podzolic soils intergrading to
Brunizems. However, in mapping, the soil at site WZ-2 was
included within soil unit 85, which is considered to be a
Brunizem, with a surface thickness ranging between 6 and 12
inches. At present, there is not an established series with
which to correlate soil unit 85. However, the strongly acid
reaction (pH values of 5.1 to 5.5, Table 7) of the solum of
the soil at site WZ-2, in addition to the presence of grainy
gray ped coats, does suggest the possibility of timber influ
ence. As a result of these characteristics, which are within
the range of the Orwood series, and because of the small
162
acreage of soil unit 85, it is suggested that this soil unit
be correlated as Orwood silt loam.
The characteristics of the soil located at site WZ-3,
except for clay content, are included within the range of soil
unit 5 (Table 15). The gleyed colors of the B horizons of
this unit are considered a result of the relict deoxidized
weathering zone in the loess. The soil at site WZ-3 is silt
loam in texture throughout the solum. It has a lower clay
content throughout the solum than other soils included within
soil unit 5. For example, the soil located at site WZ-5 is
included within soil unit 5. At this site, the soil is silty
clay loam in texture from a depth of 7 to 32 inches (Table 10).
The maximum clay content is 29 percent in the soil at site
WZ-5 as compared to 24.4 percent in the horizon of maximum
clay accumulation at the WZ-3 site (Table 4). Thus, the soil
at site WZ-3 is considered to be an inclusion within soil unit
5, tentatively correlated as Tama silt loam, gray substratum
phase. The soil profile described at site WZ-5 is considered
to be a modal profile of soil unit 5.
The characteristics of the soil described at site WZ-4
are included within the range of the Port Byron series. This
series is similar to the Tama series but has a lower clay con
tent throughout the solum. However, the soil at site WZ-4 was
included within a delineation of soil unit 5. The character
istics of soil unit 5 were discussed previously. The soil at
site WZ-4, therefore, is considered to be an inclusion within
163
soil unit 5.
Characteristics of soils on hillslope surfaces descending from upland-summit surfaces 5 and ^
One of the most extensive soils formed on the slopes des
cending from the 5th and 6th surface is soil unit 21 correlated
as Dinsdale silt loam. The solum of this soil is formed in
two materials, loess and glacial till. Thickness of the loess
ranges from 30 to 50 inches in this unit. This soil is con
sidered to be a moderately well to well drained Brunizem. A
detailed morphological description of the soil described and
sampled as characteristic of this unit is in Appendix A.
Location of the site selected (site S3A) is shown in Figure 14.
Laboratory data are presented in Table 16.
Particle-size distribution The percent sand and per
cent clay for the above soil are plotted in Figure 28. Sand
content is 4 percent or less in the upper 20 inches of the
profile. Below this depth, the sand content increases to 20.8
percent in the basal loess. At a depth of 32.5 inches, the
parent material of this soil changes from loess to glacial
till. The sand content of the solum formed in till is greater
than 40 percent. The clay content of the surface horizon is
25.3 percent. The clay content increases to a maximum of 30.8
percent between 10 and 14 inches, below which it decreases
gradually to 25.3 percent in the basal loess. At 33 inches,
the clay content decreases abruptly to 20.6 percent in the
lower solum formed in till. The clay content increases
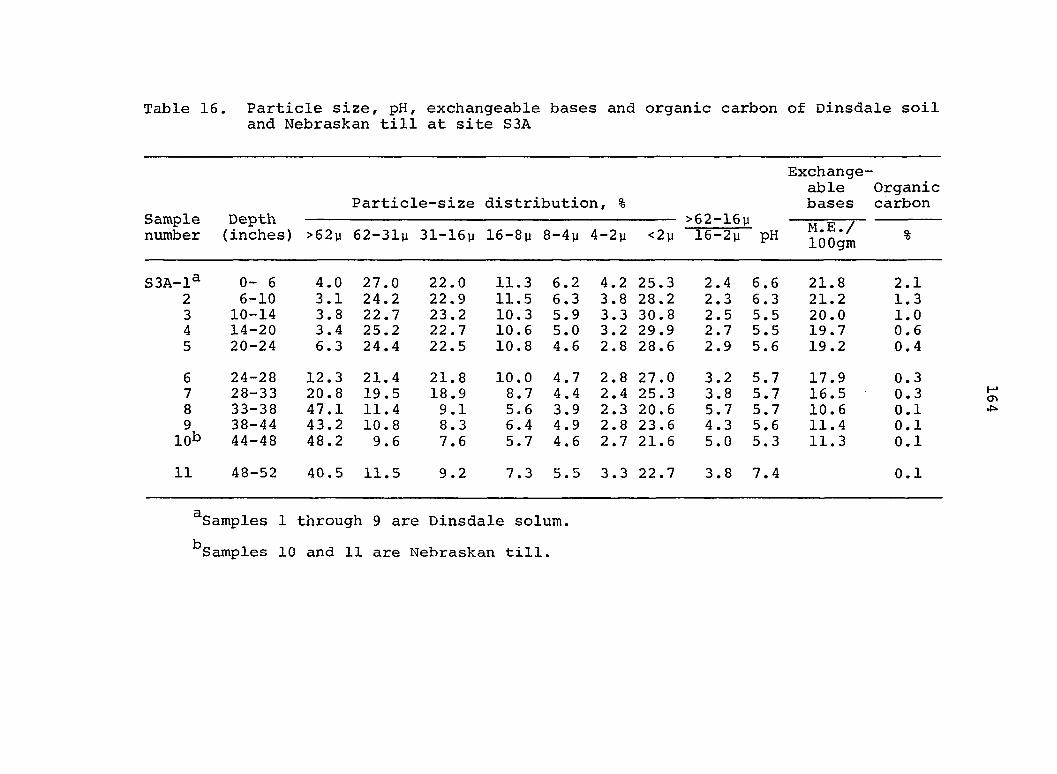
Table 16. Particle size, pH, exchangeable bases and organic carbon of Dinsdale soil and Nebraskan till at site S3A
Exchangeable Organic
Particle-size distribution, % bases carbon Sample Depth >62-16# — „ > number (inches) >62p 62-31# 31-16# 16-8# 8-4# 4-2# <2# 16-2# pH loogm %
-1^ 0- 6 4.0 27.0 22.0 11.3 6.2 4.2 25.3 2.4 6.6 21.8 2.1 2 6-10 3.1 24.2 22.9 11.5 6.3 3.8 28.2 2.3 6.3 21.2 1.3 3 10-14 3.8 22.7 23.2 10.3 5.9 3.3 30.8 2.5 5.5 20.0 1.0 4 14-20 3.4 25.2 22.7 10.6 5.0 3.2 29.9 2.7 5.5 19.7 0.6 5 20-24 6.3 24.4 22.5 10.8 4.6 2.8 28.6 2.9 5.6 19.2 0.4
6 24-28 12.3 21.4 21.8 10.0 4.7 2.8 27.0 3.2 5.7 17.9 0.3 7 28-33 20.8 19.5 18.9 8.7 4.4 2.4 25.3 3.8 5.7 16.5 0.3 8 33-38 47.1 11.4 9.1 5.6 3.9 2.3 20.6 5.7 5.7 10.6 0.1 9 38-44 43.2 10.8 8.3 6.4 4.9 2.8 23.6 4.3 5.6 11.4 0.1 10^ 44-48 48.2 9.6 7.6 5.7 4.6 2.7 21.6 5.0 5.3 11.3 0.1
11 48-52 40.5 11.5 9.2 7.3 5.5 3.3 22.7 3.8 7.4 0.1
^Samples 1 through 9 are Dinsdale solum.
^Samples 10 and 11 are Nebraskan till.
Figure 28. Particle-size distribution in Dinsdale soil at site S3A (data from Table 16)
Figure 29. Organic carbon distribution in Dinsdale soil at site S3A (data from Table 16)
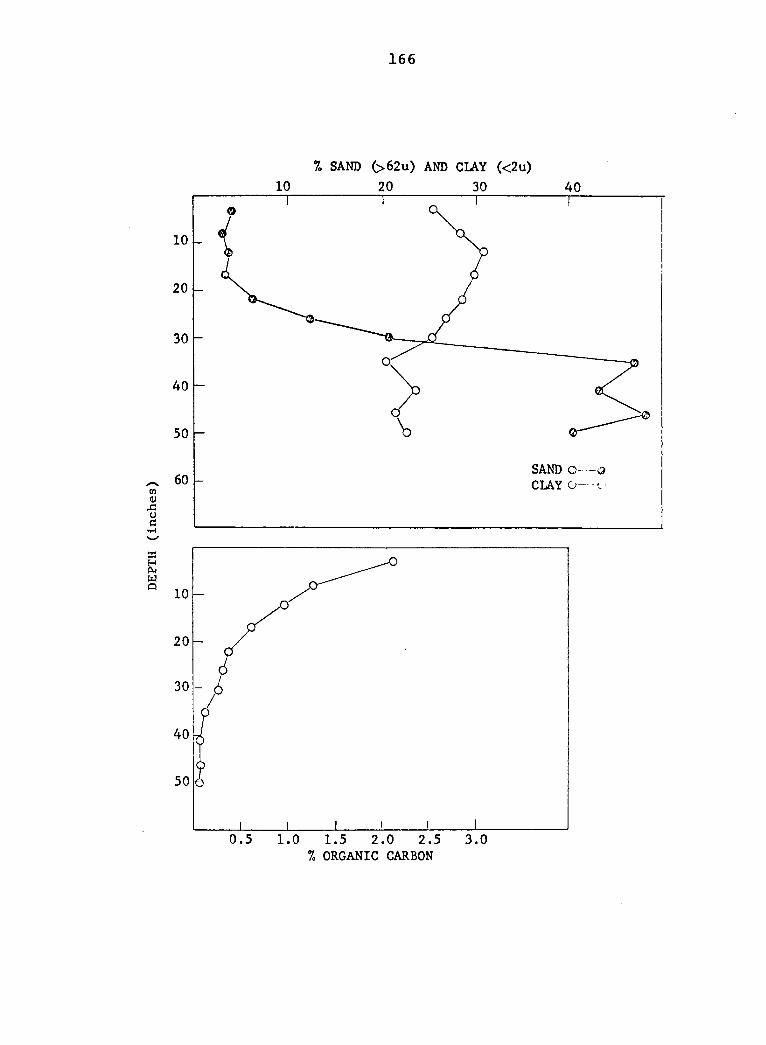
166
% SAND (>62u) AND CLAY (<2u)
10 20 30 40
40
SAND O - - o
CLAY O-CO o -C o c
20
50
0.5 1.0 1.5 2.0 2.5 3.0
% ORGANIC CARBON
167
slightly below this depth and is 22.7 percent in the calcare
ous Nebraskan till at 48 inches.
The surface of this soil is thus silt loam in texture.
From 6 to 28 inches, it is a light silty clay loam. The basal
loess in which the B31 horizon is developed is a gritty silt
loam and the lower solum, developed in till, and the under
lying till is loam in texture.
Organic carbon The distribution of organic carbon for
the Dinsdale soil at site S3A is plotted in Figure 29. The
maximum percent organic carbon present is 2.1 percent in the
surface horizon. Beneath the surface, the organic carbon con
tent decreases gradually to 0.1 percent at a depth of 33
inches. The depth to <0.5 percent organic carbon is 20 inches.
Summary
The soils on the upland-summit surfaces are represented
by soil units 1 and la, correlated as Tama silty clay loam.
Soils sampled at sites WZ-1, GS-6, and Pal-1 are representa
tive of soil unit la. These soils have mottles above 36
inches. The soil sampled at site GS-5 is mottle-free to
greater than 36 inches and is representative of soil unit 1.
Comparison of the physical and chemical properties of soil
units 1 and la, sampled at the above sites, shows they are
similar in most properties.
The soil sampled at site GS-4 on the 4th surface is
representative of soil unit 177, correlated as Tama silt loam.
168
bench phase. The well drained soils of the 4th surface are
formed, in part, from the same parent material as the soils of
the upland-summit surfaces. The terrace surface and the
upland-summit surfaces on which the soils have formed are of
the same age. However, loess thickness at the GS-4 site is
only 39 inches and the loess is underlain by sand. The
physical and chemical properties of the soil at the GS-4 site
vary from those of the soils on the upland-summit surfaces.
The soil at site GS-4 has a silt loam textured A horizon. The
soils of the upland-summit surfaces have light silty clay loam
textures in the A horizon. The depth to the horizon of maxi
mum clay content is greater in the GS-4 soil than the soils of
the upland-summit surface. The GS-4 profile also has a lower
cation-exchange capacity and base saturation throughout the
solum as compared to the other soils.
The location of the 4th surface, adjacent to the major
drainage in the area. Wolf Creek, together with the variations
in properties of the soil sampled on this surface, as compared
to the soils of the upland-summit surfaces, perhaps suggests
the possibility of timber influence in the genesis of this
soil. However, surface thickness, pH values, and abundance of
grainy gray coats are similar to the soils of the upland-
summit surfaces. The variations in some of the properties of
the GS-4 profile may be related to the influence of the
coarser sand underlying the loess. The underlying coarser-
textured material may have influenced the weathering
169
environment on this area of the landscape.
The soils on the sloping surfaces, as a group, differ
from the soils of the upland-summit and terrace surfaces in
content of organic carbon and depth to the horizon of maximum
clay content. The soils on the slopes have lower amounts of
organic carbon throughout the profile and have a shallower
depth to the horizon of maximum clay content as compared to
the soils of the upland-summit and terrace surfaces. These
differences may reflect the influence of erosion on less
stable landscape positions.
170
INVESTIGATIONS IN PALERMO AREA
Preliminary Studies
The Palermo area (Figure 2) forms a portion of the major
divide between the Iowa and Cedar Rivers and is characterized
by a loess mantled landscape of slight relief. Some closed
depressions are present. The loess is about 16 feet thick.
The Palermo area was included within the boundaries of the
lowan drift area (Kay and Graham, 1943, p. 100). On the basis
of their work, calcareous till underlying calcareous loess was
expected to be present in the Palermo area. This would be the
classic lowan till.
However, in the present study, preliminary borings of the
Palermo area showed that a noncalcareous till underlies the
commonly calcareous loess. This till was free of carbonates
to depths ranging from 1.5 to 13 feet. No solum was present
in the upper part of the till. The thickness of the till
ranged from 7.5 to 28 feet. Beneath the till subjacent to the
loess, a clay-textured paleosol surmounts a lower or second
till.
At some sites, the basal loess contains organic matter.
A radiocarbon date (1-1265) of >30,000 years before present
was obtained from the basal loess of one site. Organic
material from the paleosol subjacent to the upper till was
radiocarbon dated as >40,000 years before present.
The key problem in the stratigraphy of the upper till is
171
the absence of carbonates in its upper part and the absence
of a paleosol. The absence of carbonates contradicts that
this till is the classic lowan till. The absence of a
paleosol presents problems in placing the upper till with
Kansan till. If the upper till is indeed Kansan, evidence
would seem to lie outside of the Palermo study area. There
fore, the stratigraphy and weathering zonation of the Palermo
area were related by a traverse to the stratigraphy and
weathering zones of the Four-Mile Creek study area. The
latter area is about 19 miles southeast of the Palermo area
(Figure 2). The starting point for the traverse was the
summit of a paha on the north border of the Four-Mile Creek
area. This paha or divide area is the high level of the land
scape separating the drainage areas of Four-Mile Creek and
Twelve-Mile Creek (Figure 2).
Four-Mile Creek area and Four-Mile Creek to Palermo traverse
A series of seven holes (Figure 30) were drilled from the
summit of the paha to the lower landscape. The lower land
scape has the typical topographic form of the loess-covered
lowan drift plain. The stratigraphy of these holes is
summarized in Table 17.
At cores 1 and 2 , 28 feet of loess, noncalcareous to a
depth of 10 feet, is present. The lower one foot of loess of
core 1 is noncalcareous and contains organic matter flecks and
is designated as a basal-loess paleosol (Figure 30).

Figure 30. Cross section of Four-Mile Creek paha traverse (after Ruhe et al., 1965)
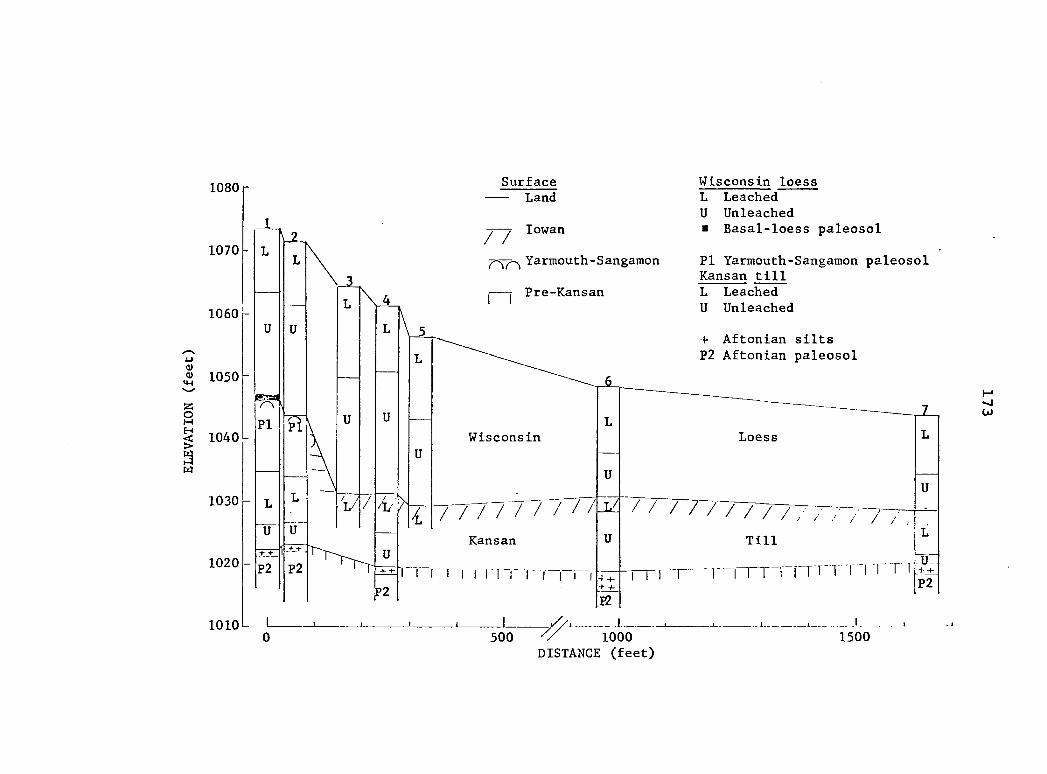
Surface
— Land
lowan / /
Yarmouth-Sangamon
Pre-Kansan
Wisconsin loess L Leached
U Unleached • Basai-loess paleosol
PI Yarmouth-Sangamon paleosol Kansan till
L
U
Leached
Unleached
+ Aftonian silts
P2 Aftonian paleosol
Wisconsin
TT^T/ / 7 / /
Kansan
i I I I
U
U
4 +
Loess
Till
1—l'n
!
L
U
/ / / , L
"T 'I T T T ~ÛT _t+_ P2
500
12
1000 DISTANCE (feet)
1500
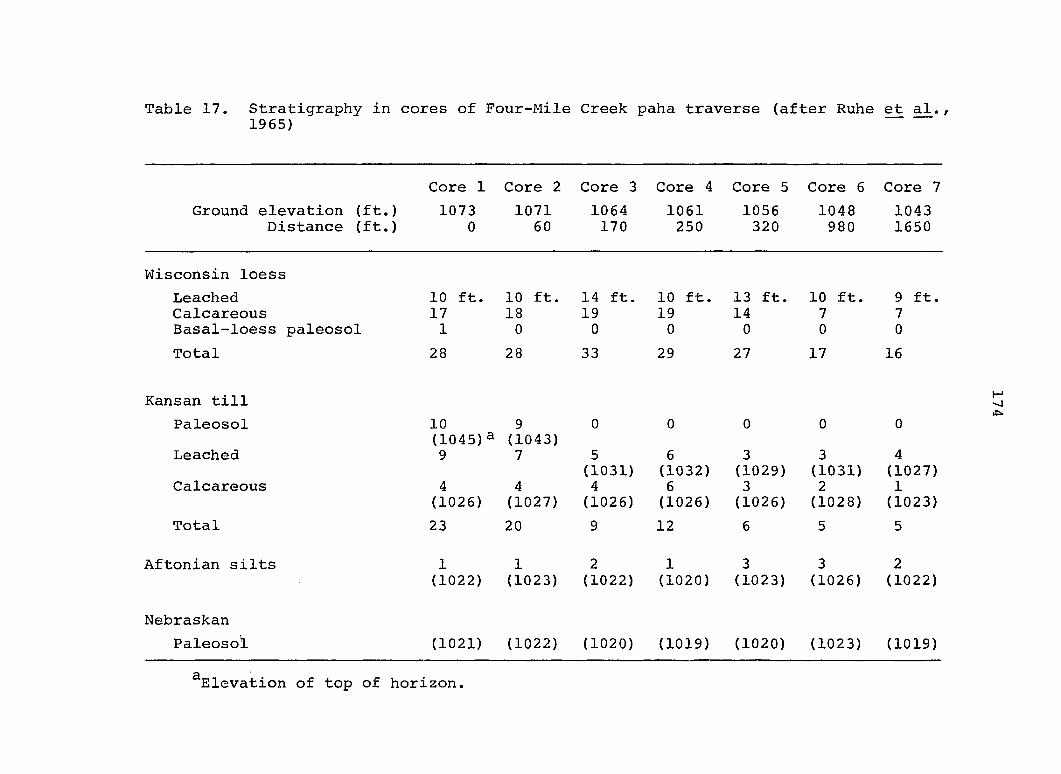
Table 17. Stratigraphy in cores of Four-Mile Creek paha traverse (after Ruhe et al., 1965)
Ground elevation Distance
Core 1
(ft.) 1073 (ft.) 0
Core 2 Core 3
1071 1064 60 170
Core 4 Core 5
1061 1056 250 320
Core 6 Core 7
1048 1043 980 1650
Wisconsin loess
Leached Calcareous Basal-loess paleosol
Total
10 ft. 17 1
28
10 ft. 18 0
28
14 ft. 19
0
33
10 ft. 19 0
29
13 ft. 14 0
27
10 ft. 7 0
17
9 ft. 7 0
16
Kansan till
Paleosol
Leached
Calcareous
Total
10 9 (1045)3 (1043) 9 7
4 (1026)
23
4 (1027)
20
0
5 (1031) 4
(1026)
0
6 (1032) 6
(1026)
12
0
3 (1029) 3
(1026)
0
3 (1031) 2
(1028)
0
4 (1027) 1
(1023)
Aftonian silts 1 (1022)
1 (1023)
2 (1022)
1 (1020)
3 (1023)
3 (1026)
2 (1022)
Nebraskan
Paleosol (1021) (1022) (1020) (1019) (1020) (1023) (1019)
^Elevation of top of horizon.
175
Clay-textured paleosols underlie the loess in cores 1 and
2. The characteristics of these paleosols are similar to the
Yarmouth-Sangamon paleosols described in the Geneseo area.
The paleosols in cores 1 and 2 grade downward successively
into oxidized and leached and oxidized and unleached Kansan
till. Silts separate the calcareous Kansan till from a lower
clay-textured paleosol, designated as an Aftonian paleosol in
Figure 30.
The stratigraphy of cores 3, 4, 5, 6 and 7 differs from
that of cores 1 and 2 only in that the paleosol developed in
the basal loess and the Yarmouth-Sangamon paleosol surmounting
the Kansan till is absent. The elevation of the top of the
noncalcareous till beneath the loess at core 3, located on the
slope descending to the lower landscape, is 1031 feet. At
cores 4, 5, and 6, elevations of the top of this zone are
1032, 1029 and 1031 feet, respectively. At core 7, the land
scape has the typical topographic form of the lowan drift
plain, and the elevation of the top of the noncalcareous till
beneath the loess is 1027 feet. Thus, the elevation of the
top of the noncalcareous till is similar on the lower land
scape and beneath the present slopes that descend to the lower
landscape.
Elevations of the calcareous zone in the Kansan till
beneath the Yarmouth-Sangamon paleosols at cores 1 and 2 are
1026 and 1027 feet respectively. Elevations of the calcareous
zone in the till at cores 4 and 6, located on the slope that
176
descends to the lower landscape level, are 1026 and 1028 feet,
respectively. The elevation of the top of the calcareous zone
in the till beneath the loess at core 7 is 1023 feet. Thus,
the elevation of the carbonate zone in the Kansan till beneath
the Yarmouth-Sangamon paleosols at cores 1 and 2 is similar to
the elevation of the carbonate zone in the till beneath the
loess at sites 4, 6 and 7.
The elevation of the top of the Aftonian silts is 1022
feet at core 1 and 1022 feet at core 7. Between these two
sites, the elevations of the top of the silts are 1023, 1020
and 1026 at cores 2, 4, and 6, respectively. The underlying
Aftonian paleosols also have a relatively constant elevation
between cores 1 and 7. Thus, in the Four-Mile Creek study
area, the upper till in cores 1 through 7 is Kansan till. In
cores 3 through 7 the Yarmouth-Sangamon paleosol has been
removed by erosion. It is to be noted that in these cores
leached Kansan till underlies calcareous loess (Figure 30).
The eroded Kansan till surface has been named the "lowan
erosion surface" (Ruhe ̂ a]^., 1965, p. 11).
From the site of core 7 in the Four-Mile Creek study
area a traverse was made on the Four-Mile—^Twelve-Mile Creek
divide and the Little Wolf-Black Hawk Creek divide to the
Palermo area (Figure 2). The stratigraphy in the sites of the
Four-Mile Creek to Palermo traverse is shown in Figure 31 and
is summarized in Table 18. Locations of these sites are given
in Appendix B. Site G (Figure 31) is less than a mile
Figure 31. Cross section of Four-Mile Creek to Palermo traverse (after Ruhe et al., 1965) (location of these sites are in Appendix B)
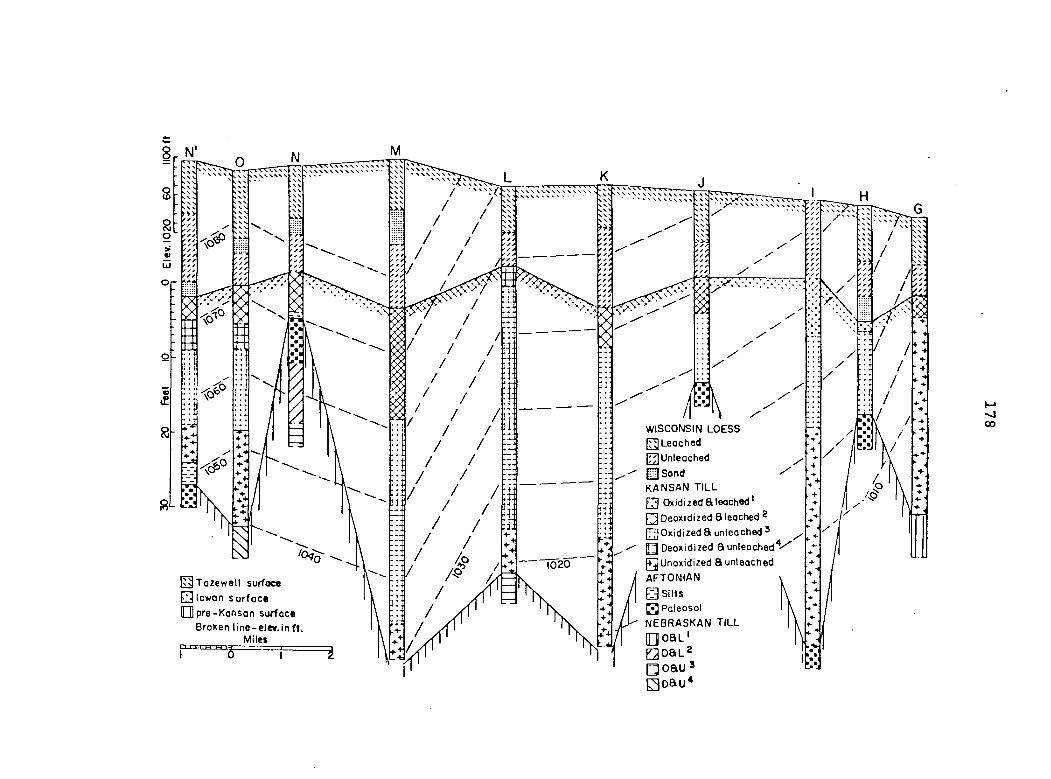
WISCONSIN LOESS [g] Leached
QUnleoched
[ïïlJSond
KANSAN TILL
FTI Oxidized a leached'
Q Deoxidized Bleached ̂
[]20*idized a unieached ' ^
Q Deoxidized aunleoched*/
QUnoxidized a unleocned
AFTONIAN [13 Tazewell surfoce
n lowon Surface
[[]] pre-Konson surface
Broken line-elev.in ft. Miles
S Silts n Poleosol
NEBRASKAN TILL
OoaL' QoaL^ poau ' • oau*
•vj 00
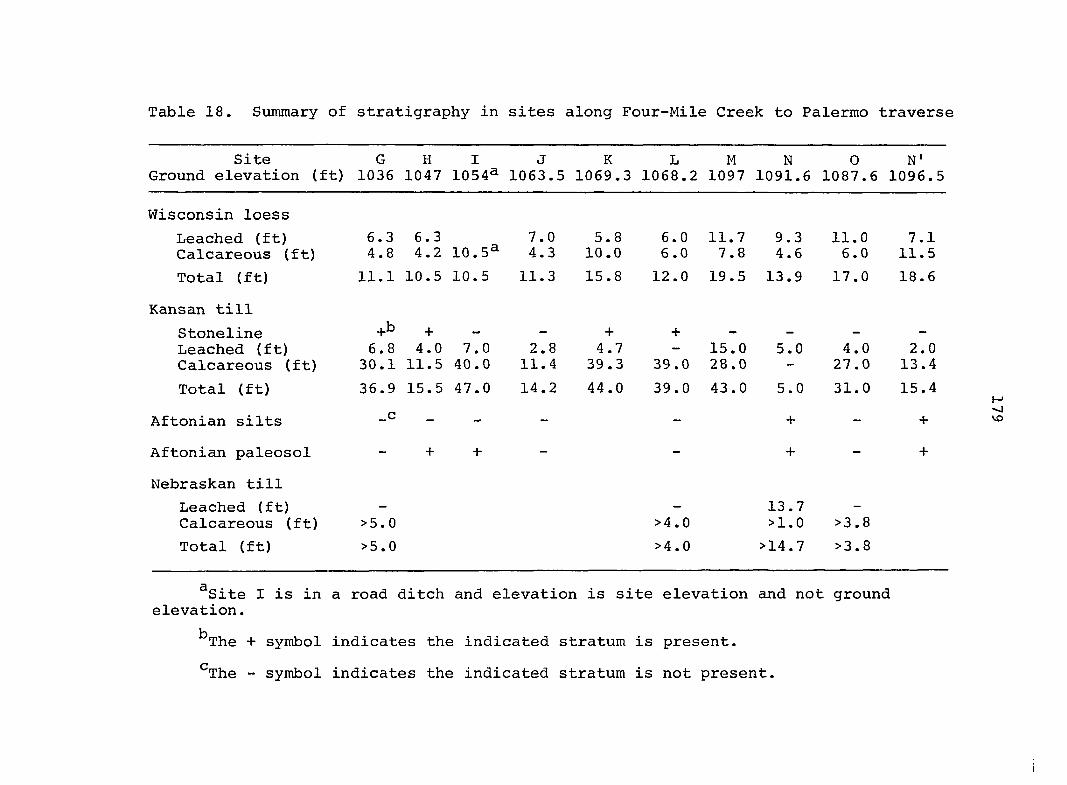
Table 18. Summary of stratigraphy in sites along Four-Mile Creek to Palermo traverse
Site Ground elevation (ft)
G 1036
H 1047
I 1054a
J 1063.5
K 1069.3
L 1068.2
M 1097
N 1091.6
0 1087.6
N' 1096.5
Wisconsin loess
Leached (ft) Calcareous (ft)
6.3 4.8
6.3 4.2 10.5a
7.0 4.3
5.8 10.0
6.0 6.0
11.7 7.8
9.3 4.6
11.0 6.0
7.1 11.5
Total (ft) 11.1 10.5 10.5 11.3 15.8 12.0 19.5 13.9 17.0 18.6
Kansan till
Stoneline Leached (ft) Calcareous (ft)
+b 6.8 30.1
+ 4.0 11.5
7.0 40.0
2.8 11.4
+ 4.7 39.3
+
39.0 15.0 28.0
5.0 4.0 27.0
2.0 13.4
Total (ft) 36.9 15.5 47.0 14.2 44.0 39.0 43.0 5.0 31.0 15.4
Aftonian silts _c - - - - + - +
Aftonian paleosol - + + - - + - +
Nebraskan till
Leached (ft) Calcareous (ft) >5.0 >4.0
13.7 >1.0 >3.8
Total (ft) >5.0 >4.0 >14.7 >3.8
Site I is in a road ditch and elevation is site elevation and not ground elevation.
The + symbol indicates the indicated stratum is present.
'The - symbol indicates the indicated stratum is not present.
180
northwest of core 7. The sites in this traverse are located on
divide areas which are assumed to have been stable since the
end of loess deposition. Thus, the land surface of the divide
areas is considered to be Tazewell in age. Land-surface
elevation of site G is 1038 feet and at site N' (Figure 31) in
the Palermo area it is 1096 feet. Therefore, the regional
slope gradient is less than 0.1 percent.
Data in Table 18 shows loess thickness at the sites shown
in Figure 31 ranges from 10.5 feet at site H and I to 19.5
feet at site M. Noncalcareous till with no solum development
in the till underlies calcareous loess at all sites except
site L. At site L, the upper till is calcareous throughout.
Depth to carbonates in the Kansan till, except for the site
noted, ranges from 2.0 feet at site N' to 15 feet at site M.
Aftonian silts are present at sites N and N'. Aftonian
paleosols are present at sites H, I, J, N and N'. The Kansan
till was separated from the Nebraskan till on the basis of
changes in the weathering zones at sites where the Aftonian
paleosols were absent. For example, at site L the separation
of the two tills was made on the basis of unoxidized and
unleached Kansan till overlying oxidized and unleached
Nebraskan till.
The conclusions reached from the Four-Mile Creek to
Palermo traverse is that the stratigraphy of core 7 (Figure
30) can be traced to the Palermo area. A comparison of site
N' (Figure 31) located in the Palermo area of the Four-Mile
181
Creek to Palermo traverse, and core 7 in the Four-Mile Creek
area shows the stratigraphy of these two sites is very similar.
Therefore, the upper till of the Palermo area is Kansan till.
In the Palermo area, several deep holes were made to
penetrate the Kansan till. Their locations are shown in
Figure 32. The three-dimensional relationships of these sites
are shown in Figure 33. Site N' in this figure is the site
also included in the Four-Mile Creek to Palermo traverse and
is identified by the same symbol. It should be noted that all
the sites shown in Figure 33 have calcareous loess overlying
leached till. This characteristic is present in cores 3 to 7
in the Four-Mile Creek traverse and all the sites included in
the Four-Mile Creek to Palermo area traverse except for site L.
The characteristics of the deposits of the Palermo area
will be discussed in the following section.
Stratigraphy
Stratigraphie sequence of Palermo divide area
Wisconsin loess A contour map (Figure 34) of the land
surface was constructed in the E^, SW&, section 29, T87N,
R17W, Grundy County, Iowa. This map was constructed to charac
terize the land surface and to establish the relationship of
the land surface and the underlying till surface. Borings
were made at each of the sites shown in Figure 34. Character
istics of the loess at these sites are recorded in Table 19.
The sites are identified by the co-ordinates in Figure 34, for
Figure 32. Location of deep drilling sites in Palermo area
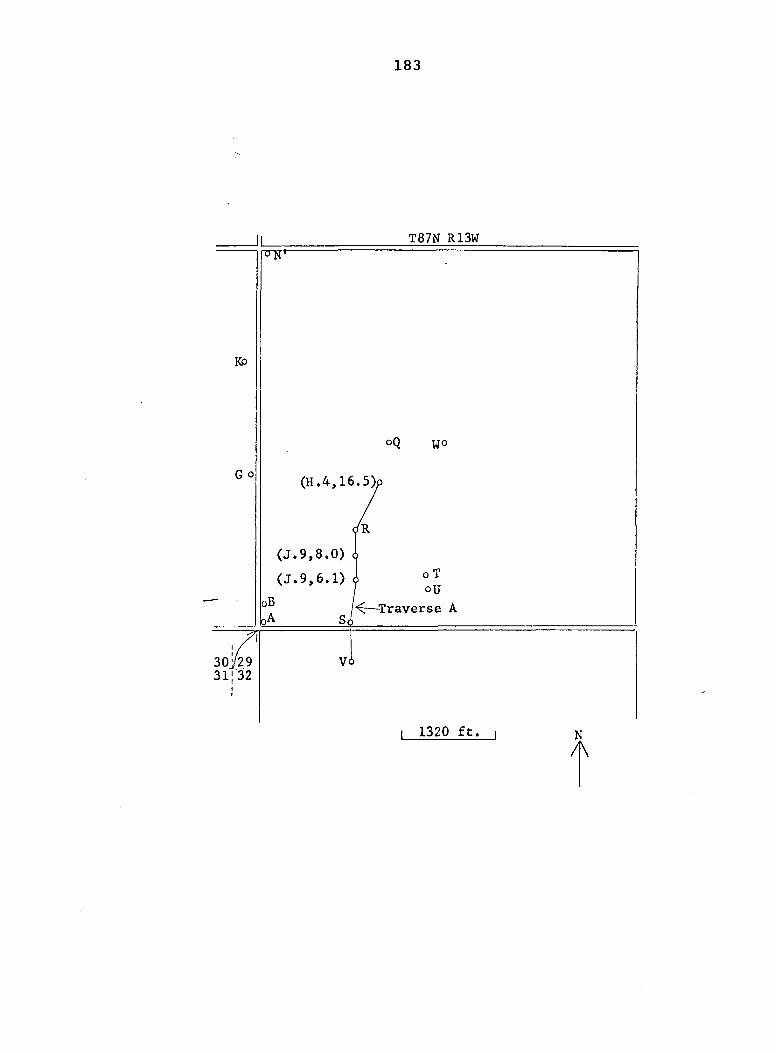
183
T87N R13W trifi
K3
oQ WO
G o (H.4,16.5k
(J.9,8.0)
(J.9,6.1)
oB .A
/R
oT oU
—Traverse A
30^29 31132
1320 ft. N
A
Figure 33. Three-dimensional relationships of selected sites in section 29, T87N, R17W, Grundy County, Iowa
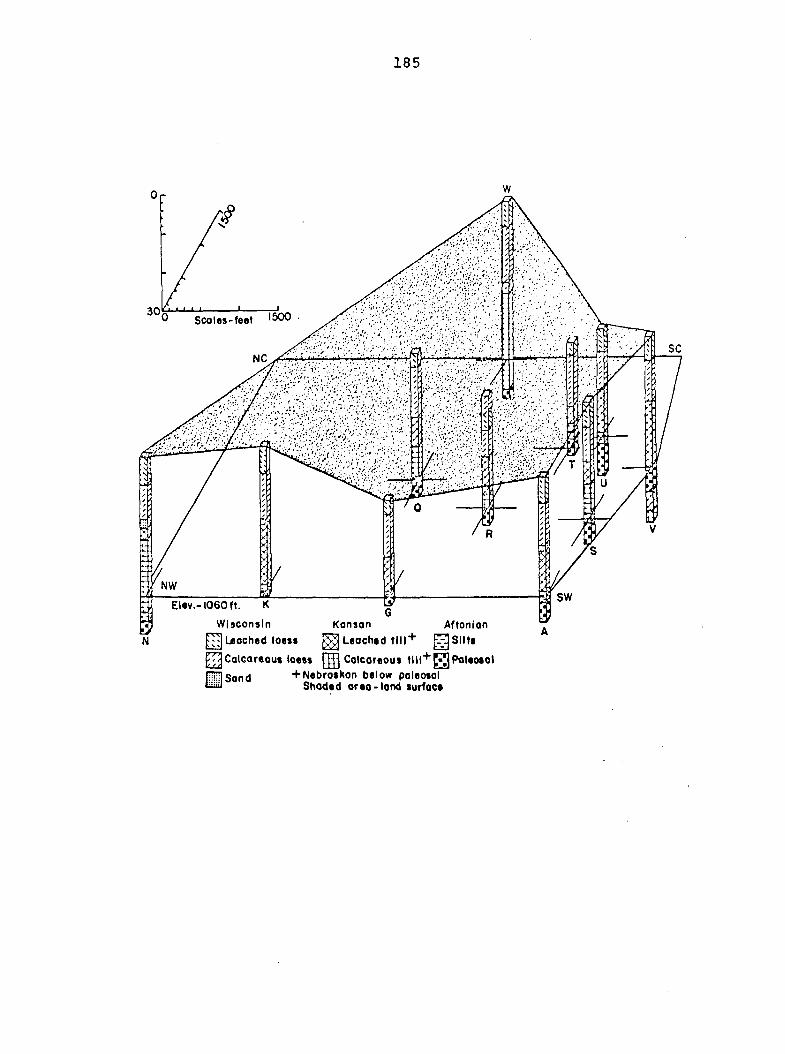
185
Scales-feet
Elev.. 1060 ft. K
Wisconsin Kansan Aftonian
N ^Laoched loess ^ Leoched tlll"^ ^Silts
Calcareous loess : Calcareous tlll"^[|^Poleo>ol
+ Nebfoskon below poleosol Shaded orea-land surfoce
Figure 34. Contour map of land surface, location of drill holes, and elevations of top of Kansan till in E&, SW&, section 29, T87N, R17W, Grundy County, Iowa (Elevation in feet of the top of the Kansan till is indicated by the number near the drill hole, for example, 1073.)
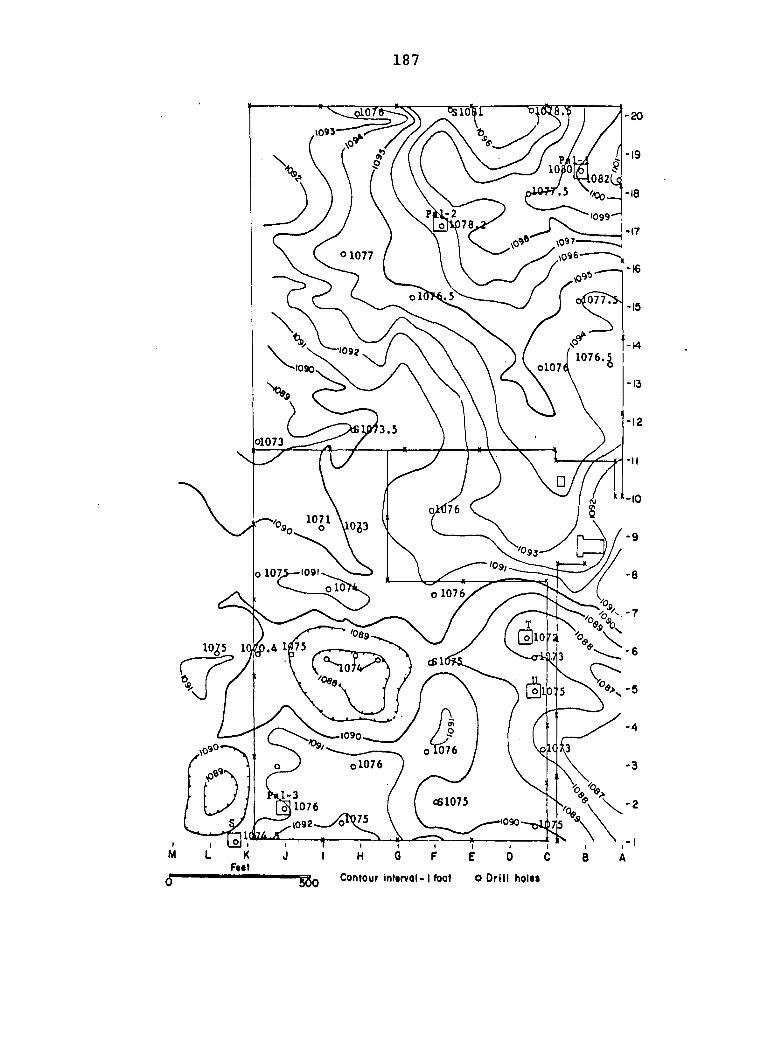
187
-20
-19 1080
077. -15
-W
1090
-13
O1073
-10
1071
o 107. 1091
olO
c£li
1090
o 1076
1-3 ^1076
1092-
C6107S
I M
Fut Contour Inttrvol-1 foot o Drill hoi#*
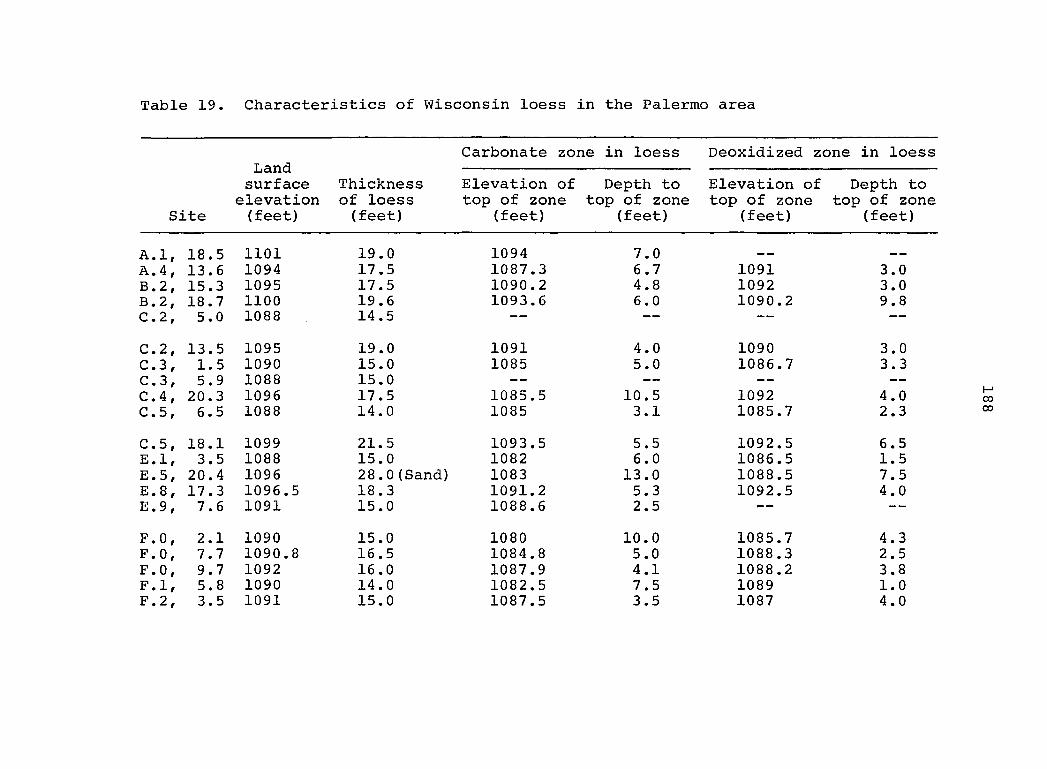
Table 19. Characteristics of Wisconsin loess in the Palermo area
Carbonate zone in loess Deoxidized zone in loess Land surface Thickness Elevation of Depth to Elevation of Depth to elevation of loess top of zone top of zone top of zone top of zone
Site (feet) (feet) (feet) (feet) (feet) (feet)
A.l, 18.5 1101 19.0 1094 7.0 — —
A.4, 13.6 1094 17.5 1087.3 6.7 1091 3.0 B.2, 15.3 1095 17.5 1090.2 4.8 1092 3.0 B . 2 , 18.7 1100 19.6 1093.6 6,0 1090.2 9.8 C.2, 5.0 1088 14.5 —
C.2, 13.5 1095 19.0 1091 4.0 1090 3.0 C.3, 1.5 1090 15.0 1085 5.0 1086.7 3.3 C.3, 5.9 1088 15.0 C.4, 20.3 1096 17.5 1085.5 10.5 1092 4.0 C.5, 6.5 1088 14.0 1085 3.1 1085.7 2.3
C.5, 18.1 1099 21.5 1093.5 5.5 1092.5 6.5 E.l, 3.5 1088 15.0 1082 6.0 1086.5 1.5 E.5, 20.4 1096 28.0(Sand) 1083 13.0 1088.5 7.5 E.8, 17.3 1096.5 18.3 1091.2 5.3 1092.5 4.0 E.9, 7.6 1091 15.0 1088.6 2.5 — —
F.O, 2.1 1090 15.0 1080 10.0 1085.7 4.3 F.O, 7.7 1090.8 16.5 1084.8 5.0 1088.3 2.5 F.O, 9.7 1092 16.0 1087.9 4.1 1088.2 3.8 F.l, 5.8 1090 14.0 1082.5 7.5 1089 1.0 F.2, 3.5 1091 15.0 1087.5 3.5 1087 4.0
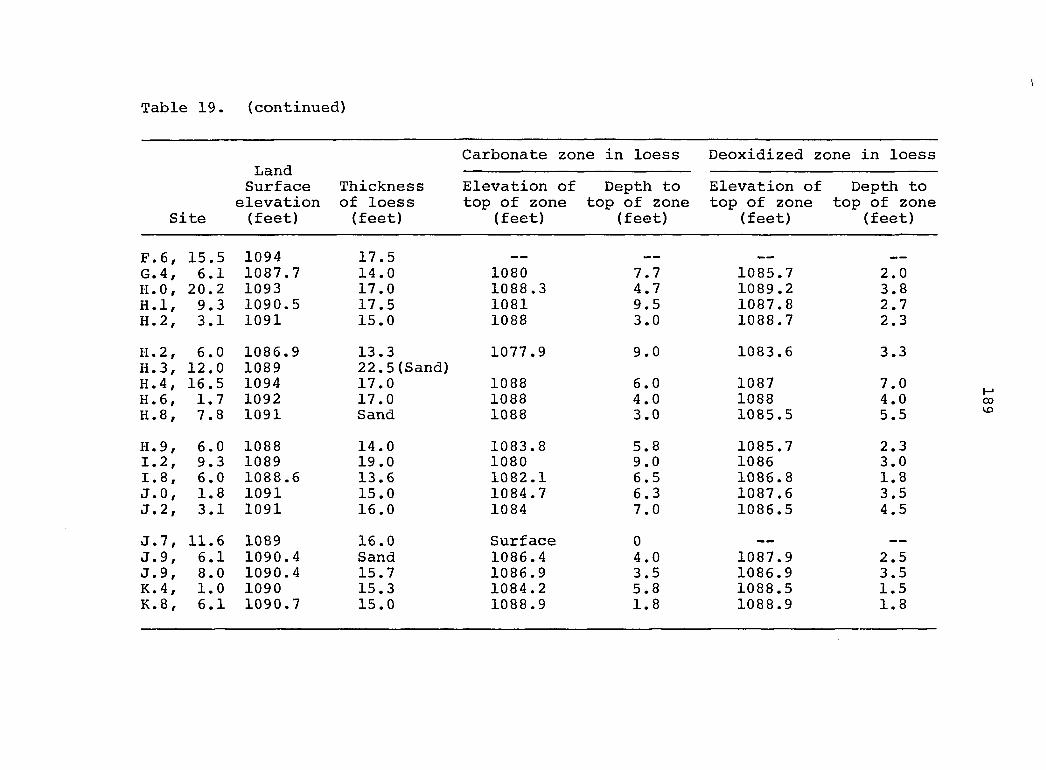
Table 19. (continued)
Carbonate zone in loess Deoxidized zone in loess Land Surface Thickness Elevation of Depth to Elevation of Depth to elevation of loess top of zone top of zone top of zone top of zone
Site (feet) (feet) (feet) (feet) (feet) (feet)
F.6, 15.5 1094 17.5 — — — — — —
G.4, 6.1 1087.7 14.0 1080 7.7 1085.7 2.0 H.O, 20.2 1093 17.0 1088.3 4.7 1089.2 3.8 H.l, 9.3 1090.5 17.5 1081 9.5 1087.8 2.7 H. 2, 3.1 1091 15.0 1088 3.0 1088.7 2.3
H.2, 6.0 1086.9 13.3 1077.9 9.0 1083.6 3.3 H.3, 12.0 1089 22.5(Sand) H.4, 16.5 1094 17.0 1088 6.0 1087 7.0 H.6, 1.7 1092 17.0 1088 4.0 1088 4.0 H.8, 7.8 1091 Sand 1088 3.0 1085.5 5.5
H.9, 6.0 1088 14.0 1083.8 5.8 1085.7 2.3 1.2, 9.3 1089 19.0 1080 9.0 1086 3.0 1.8, 6.0 1088.6 13.6 1082.1 6.5 1086.8 1.8 J.O, 1.8 1091 15.0 1084.7 6.3 1087.6 3.5 J.2, 3.1 1091 16.0 1084 7.0 1086.5 4.5
J.7, 11.6 1089 16.0 Surface 0 mm m»
J.9, 6.1 1090.4 Sand 1086.4 4.0 1087.9 2.5 J.9, 8.0 1090.4 15.7 1086.9 3.5 1086.9 3.5 K.4, 1.0 1090 15.3 1084.2 5.8 1088.5 1.5 K.8, 6.1 1090.7 15.0 1088.9 1.8 1088.9 1.8
190
example site (C.3, 1.5). The figure near the site location in
Figure 34 is the till elevation at that site. Elevations pre
ceded by "S", for example site (E.5, 20.4), indicate sites at
which ^nd extends to depths of 6 to 8 feet below the base of
the loess.
Average thickness of loess in 16.4 feet at the sites
shown in Figure 34 and listed in Table 19. The minimum thick
ness of loess recorded is 14 feet and the maximum thickness is
21.5 feet.
Particle-size distribution of the loess at sites Pal-1,
Pal-2 and Pal-3, the locations of which are shown in Figure 34,
is recorded in Tables 20a, 21a, and 22a. Sand content of the
loess in which the soil solum is developed at each of these
sites is less than 3 percent. The ^26-2p^ particle-size ratio
is less than 3 throughout the solum at each of these sites.
However, at a depth of 8.7 feet at the Pal-1 site, 9.1 feet at
the Pal-2 site and 8.5 feet at the Pal-3 site, the sand and
coarse silt content increase as indicated by the increase of
the ratios (Figure 35).
Below the depth at which the increase in particle-size
ratio first occurs, lenses of sand are present in the loess of
this area. For example, sample Pal-2-17 (Table 21a) contains
58 percent >62p material. It has been reported (Arey, 1909,
p. 90) that sand everywhere underlies the loess in Grundy
County. This observation is supported by the sand described
between the loess and till of many sites described in this
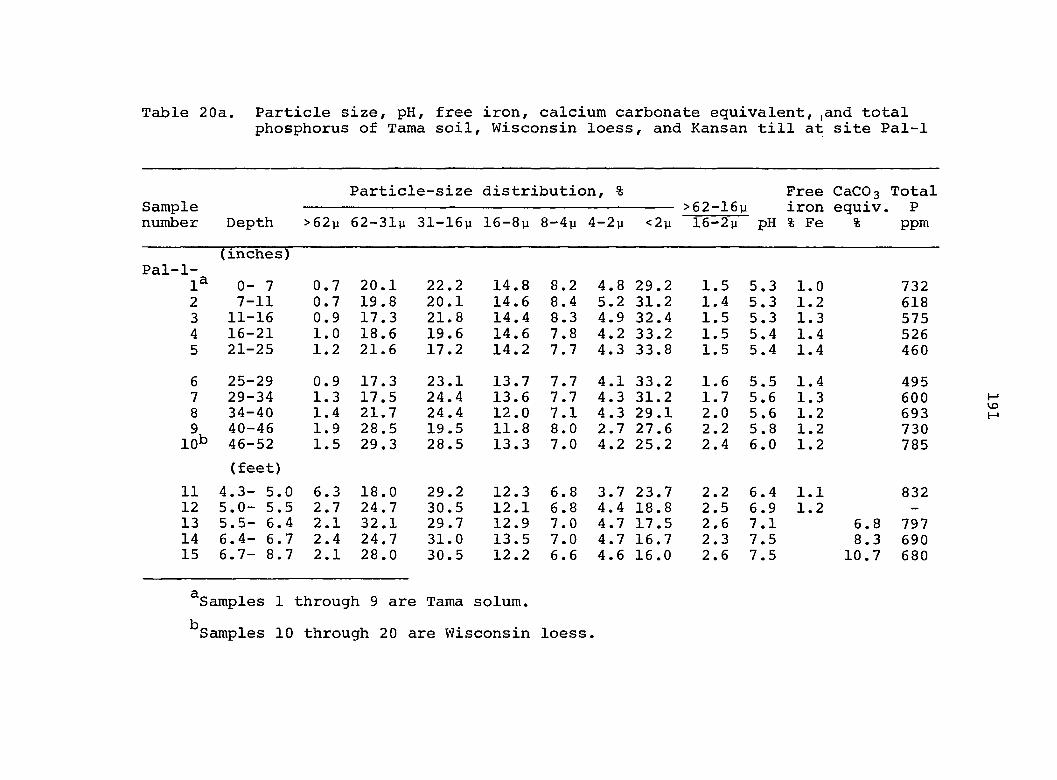
Table 20a. Particle size, pH, free iron, calcium carbonate equivalent, ,and total phosphorus of Tama soil, Wisconsin loess, and Kansan till at site Pal-1
Particle-size distribution, % Free CaCOg Total Sample >62-16y iron equiv. P number Depth > 62y 62-31y 31-16; 16—8p 00
1 r
4-2; < 2 p 16-2; pH % Fe % ppm
(inches) Pal-1-
1^ 0- 7 0.7 20.1 22.2 14.8 8.2 4.8 29.2 1.5 5.3 1.0 732 2 7-11 0.7 19.8 20.1 14.6 8.4 5.2 31.2 1.4 5.3 1.2 618 3 11-16 0.9 17.3 21.8 14.4 8.3 4.9 32.4 1.5 5.3 1.3 575 4 16-21 1.0 18.6 19.6 14.6 7.8 4.2 33.2 1.5 5.4 1.4 526 5 21-25 1.2 21.6 17.2 14.2 7.7 4.3 33.8 1.5 5.4 1.4 460
6 25-29 0.9 17.3 23.1 13.7 7.7 4.1 33.2 1.6 5.5 1.4 495 7 29-34 1.3 17.5 24.4 13.6 7.7 4.3 31.2 1.7 5.6 1.3 600 8 34-40 1.4 21.7 24.4 12.0 7.1 4.3 29.1 2.0 5.6 1.2 693
40 — 46 1.9 28.5 19.5 11.8 8.0 2.7 27.6 2.2 5.8 1.2 730 10^ 46-52 1.5 29.3 28.5 13.3 7.0 4.2 25.2 2.4 6.0 1.2 785
(feet)
11 4.3- 5.0 6.3 18.0 29.2 12.3 6.8 3.7 23.7 2.2 6.4 1.1 832 12 5.0- 5.5 2.7 24.7 30.5 12.1 6.8 4.4 18.8 2.5 6.9 1.2 —
13 5.5- 6.4 2.1 32.1 29.7 12.9 7.0 4.7 17.5 2.6 7.1 6. 8 797 14 6.4- 6.7 2.4 24.7 31.0 13.5 7.0 4.7 16.7 2.3 7.5 8. 3 690 15 6.7- 8.7 2.1 28.0 30.5 12.2 6.6 4.6 16.0 2.6 7.5 10. 7 680
^Samples 1 through 9 are Tama solum.
^Samples 10 through 20 are Wisconsin loess.
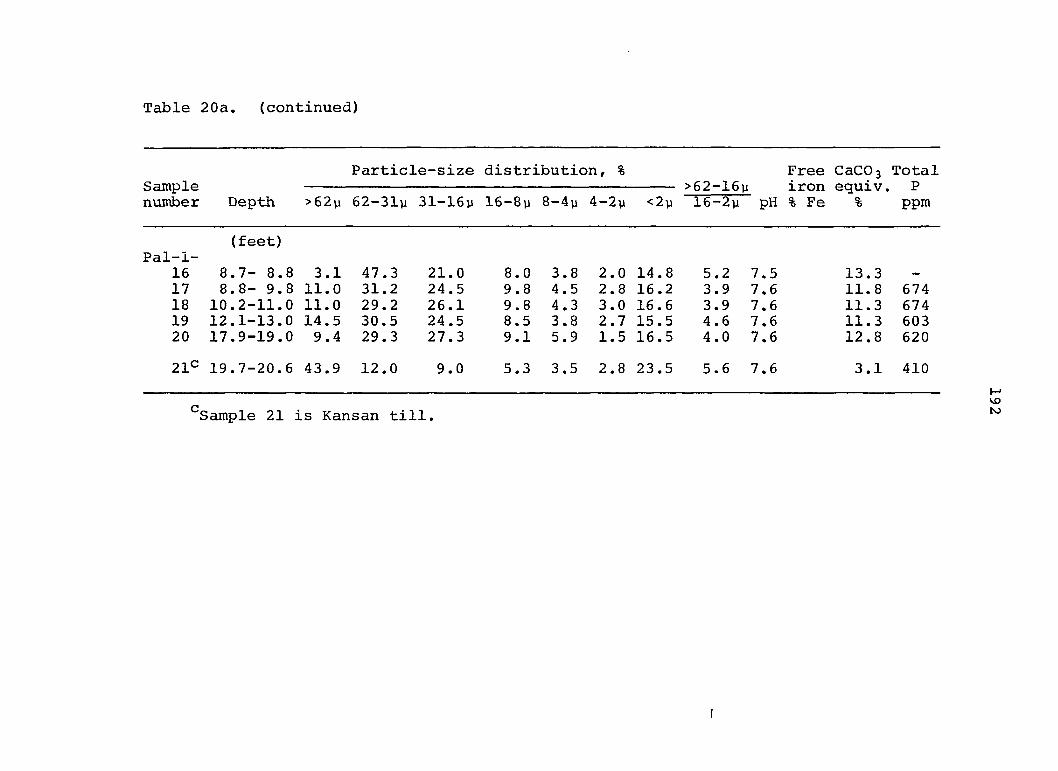
Table 20a. (continued)
Particle-size distribution, % Free CaCOg Total Sample >62-16% iron equiv. P number Depth >62% 62-31% 31-16% 16-8% 8-4% 4-2% <2% 16-2% pH % Fe % ppm
(feet) Pal-1-
16 8.7- 8.8 3.1 47.3 21.0 8.0 3.8 2.0 14.8 5.2 7.5 13.3 -
17 8.8- 9.8 11.0 31.2 24.5 9.8 4.5 2.8 16.2 3.9 7.6 11.8 674 18 10.2-11.0 11.0 29.2 26.1 9.8 4.3 3.0 16.6 3.9 7.6 11.3 674 19 12.1-13.0 14.5 30.5 24.5 8.5 3.8 2.7 15.5 4.6 7.6 11.3 603 20 17.9-19.0 9.4 29.3 27.3 9.1 5.9 1.5 16.5 4.0 7.6 12.8 620
2ic 19.7-20.6 43.9 12.0 9.0 5.3 3.5 2.8 23.5 5.6 7.6 3.1 410
M VO
Sample 21 is Kansan till.
f
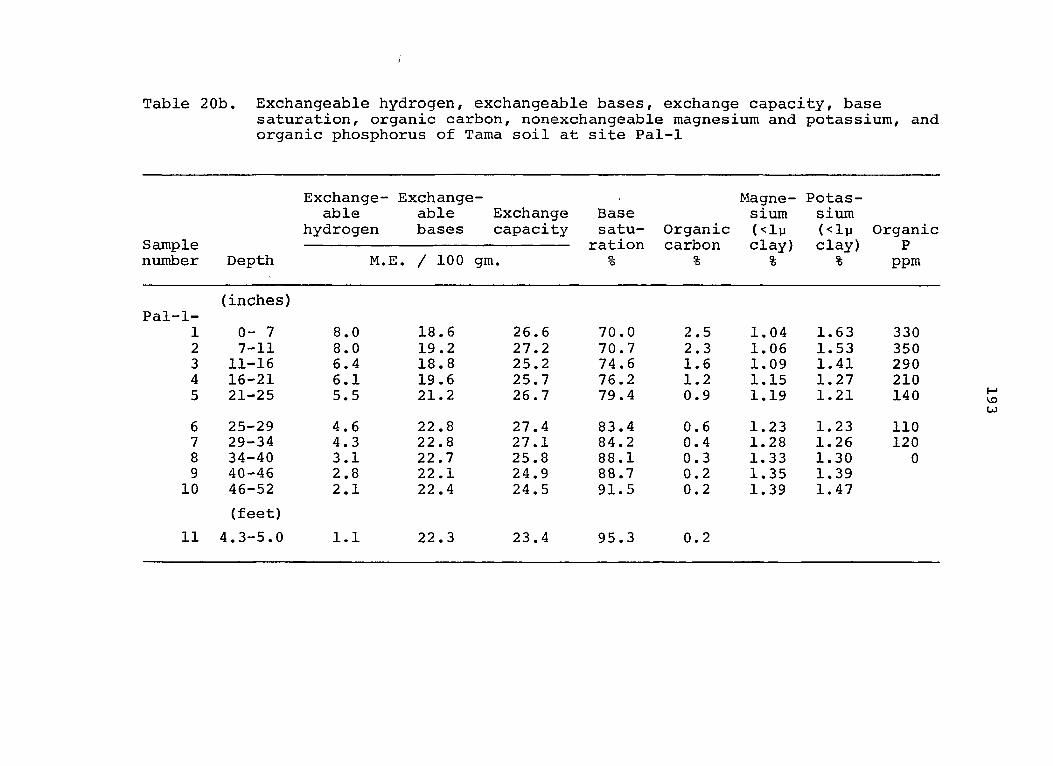
Table 20b. Exchangeable hydrogen, exchangeable bases, exchange capacity, base saturation, organic carbon, nonexchangeable magnesium and potassium, and organic phosphorus of Tama soil at site Pal-1
Exchange- Exchange- Magne- Potas-able able Exchange Base sium sium
hydrogen bases capacity satu- Organic (<ly (<lp Organic Sample ration carbon clay) clay) P number Depth M.E. / 100 gm. % % % % ppm
(inches) Pal-1-
1 0- 7 8.0 18.6 26.6 70.0 2.5 1.04 1.63 330 2 7-11 8.0 19.2 27.2 70.7 2.3 1.06 1.53 350 3 11-16 6.4 18.8 25.2 74.6 1.6 1.09 1.41 290 4 16-21 6.1 19.6 25.7 76.2 1.2 1.15 1.27 210 5 21-25 5.5 21.2 26.7 79.4 0.9 1.19 1.21 140
6 25-29 4.6 22.8 27.4 83.4 0.6 1.23 1.23 110 7 29-34 4.3 22.8 27.1 84.2 0.4 1.28 1.26 120 8 34-40 3.1 22.7 25.8 88.1 0.3 1.33 1.30 0 9 40—46 2.8 22.1 24.9 88.7 0.2 1.35 1.39 10 46-52 2.1 22.4 24.5 91.5 0.2 1.39 1.47
(feet)
11 4.3-5.0 1.1 22.3 23.4 95.3 0.2
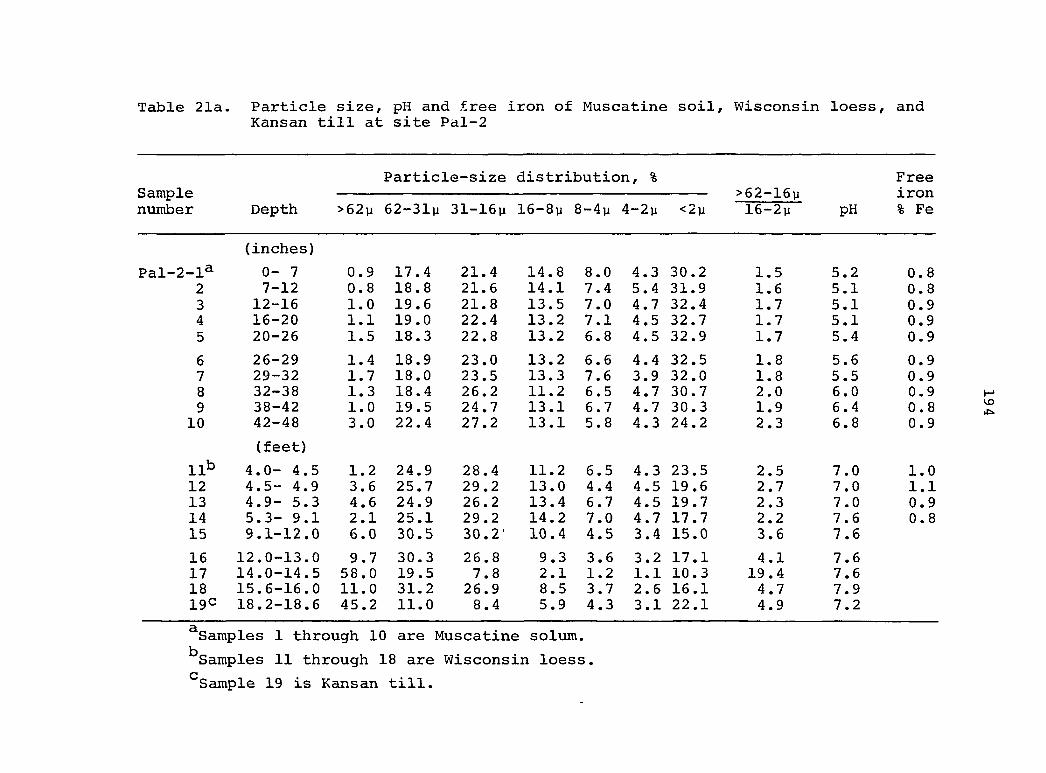
Table 21a. Particle size, pH and free iron of Muscatine soil, Wisconsin loess, and Kansan till at site Pal-2
Particle-size distribution, % Free Sample >62-16% iron number Depth >62y 62-31% 31-16% 16-8% 8-4% 4-2% <2% 16-2% pH % Fe
(inches)
-1^ 0- 7 0.9 17.4 21.4 14.8 8.0 4.3 30.2 1.5 5.2 0.8 2 7-12 0.8 18.8 21.6 14.1 7.4 5.4 31.9 1.6 5.1 0.8 3 12-16 1.0 19.6 21.8 13.5 7.0 4.7 32.4 1.7 5.1 0.9 4 16-20 1.1 19.0 22.4 13.2 7.1 4.5 32.7 1.7 5.1 0.9 5 20-26 1.5 18.3 22.8 13.2 6.8 4.5 32.9 1.7 5.4 0.9
6 26-29 1.4 18.9 23.0 13.2 6.6 4.4 32.5 1.8 5.6 0.9 7 29-32 1.7 18.0 23.5 13.3 7.6 3.9 32.0 1.8 5,5 0.9 8 32-38 1.3 18.4 26.2 11.2 6.5 4.7 30.7 2.0 6.0 0.9 9 38-42 1.0 19.5 24.7 13.1 6.7 4.7 30.3 1.9 6.4 0.8 10 42-48 3.0 22.4 27.2 13.1 5.8 4.3 24.2 2.3 6.8 0.9
(feet)
11^ 4.0- 4.5 1.2 24.9 28.4 11.2 6.5 4.3 23.5 2.5 7.0 1.0 12 4.5- 4.9 3.6 25.7 29.2 13.0 4.4 4.5 19.6 2.7 7.0 1.1 13 4.9- 5.3 4.6 24.9 26.2 13.4 6.7 4.5 19.7 2.3 7.0 0.9 14 5.3- 9.1 2.1 25.1 29.2 14.2 7.0 4.7 17.7 2.2 7.6 0.8 15 9.1-12.0 6.0 30.5 3 0 . 2 10.4 4.5 3.4 15.0 3.6 7.6
16 12.0-13.0 9.7 30.3 26.8 9.3 3.6 3.2 17.1 4.1 7.6 17 14.0-14.5 58.0 19.5 7.8 2.1 1.2 1.1 10.3 19.4 7.6 18 15.6-16.0 11.0 31.2 26.9 8.5 3.7 2.6 16.1 4.7 7.9 I9C 18.2-18.6 45.2 11.0 8.4 5.9 4.3 3.1 22.1 4.9 7.2
^Samples 1 through 10 are Muscatine solum.
^Samples 11 through 18 are Wisconsin loess.
^Sample 19 is Kansan till.
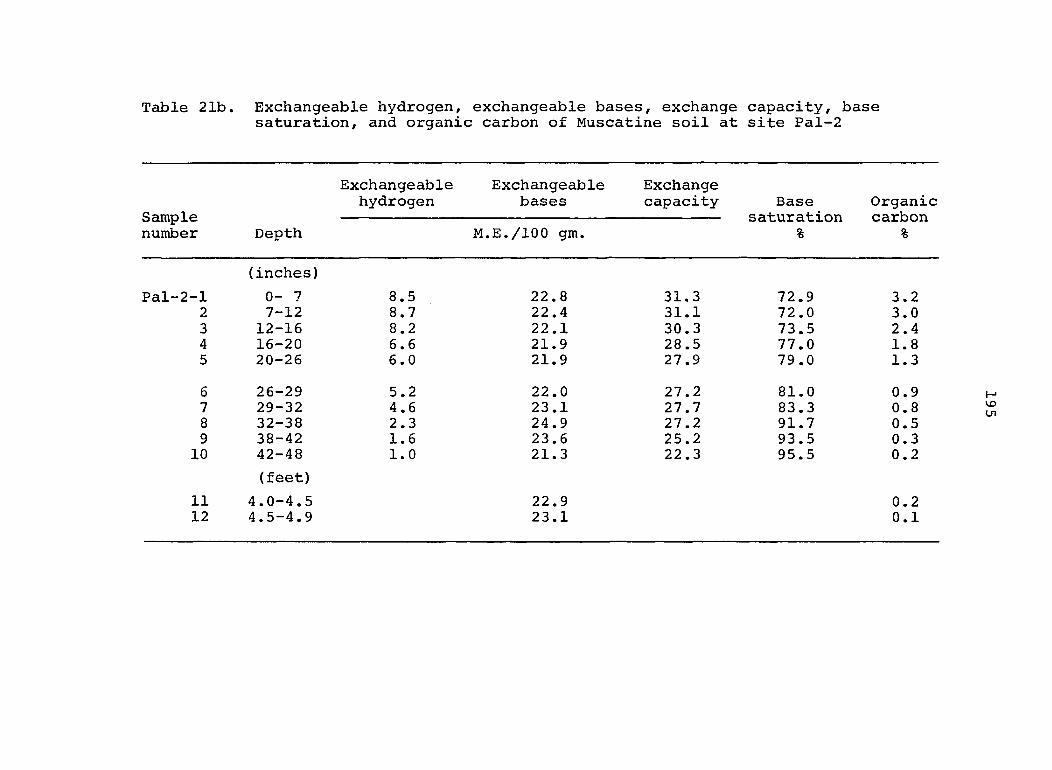
Table 21b. Exchangeable hydrogen, exchangeable bases, exchange capacity, base saturation, and organic carbon of Muscatine soil at site Pal-2
Exchangeable Exchangeable Exchange hydrogen bases capacity Base Organic
Sample saturation carbon number Depth M.E./lOO gm. % %
(inches)
Pal-2-1 0- 7 8.5 22.8 31.3 72.9 3.2 2 7-12 8.7 22.4 31.1 72.0 3.0 3 12-16 8.2 22.1 30.3 73.5 2.4 4 16-20 6.6 21.9 28.5 77.0 1.8 5 20-26 6.0 21.9 27.9 79.0 1.3
6 26-29 5.2 22.0 27.2 81.0 0.9 7 29-32 4.6 23.1 27.7 83.3 0.8 8 32-38 2.3 24.9 27.2 91.7 0.5 9 38-42 1.6 23.6 25.2 93.5 0.3 10 42-48 1.0 21.3 22.3 95.5 0.2
(feet)
11 4.0-4.5 22.9 0.2 12 4.5-4.9 23.1 0.1
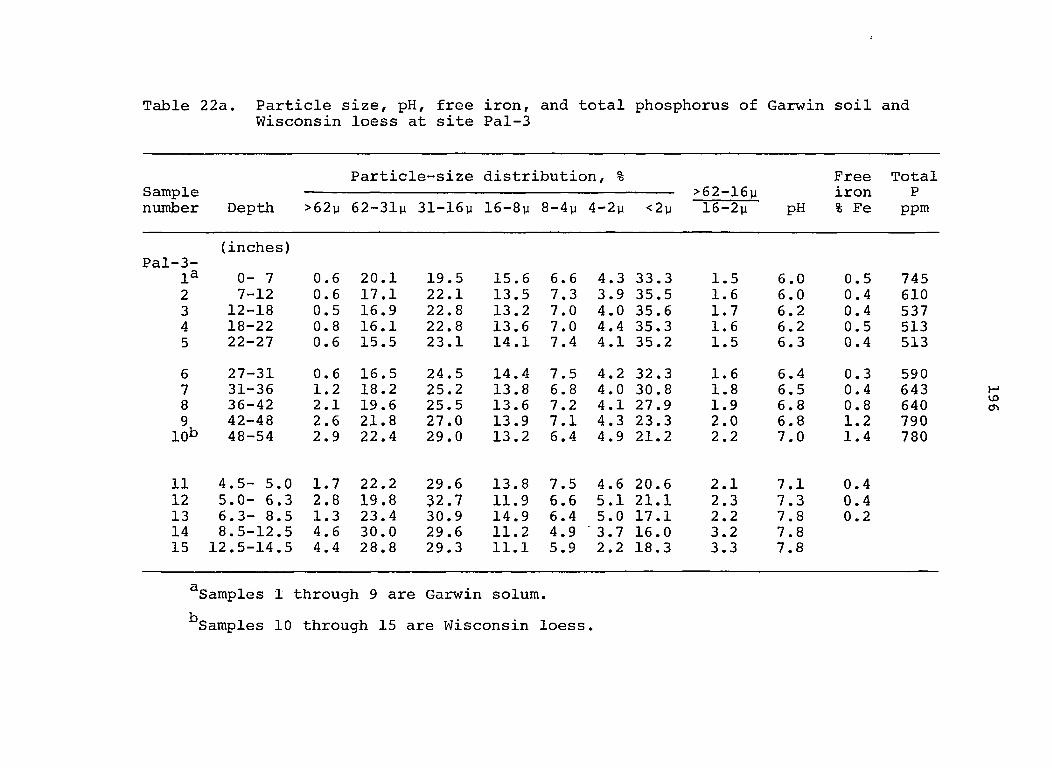
Table 22a. Particle size, pH, free iron, and total phosphorus of Garwin soil and Wisconsin loess at site Pal-3
Particle-size distribution, % Free Total Sample >62-16% iron P number Depth >62% 62-31% 31-16% 16-8% 8-4% 4-2% <2% 16-2% pH % Fe ppm
(inches) Pal-3-
1^ 0- 7 0.6 20.1 19.5 15.6 6.6 4.3 33.3 1.5 6.0 0.5 745 2 7-12 0.6 17.1 22.1 13.5 7.3 3.9 35.5 1.6 6.0 0.4 610 3 12-18 0.5 16.9 22.8 13.2 7.0 4.0 35.6 1.7 6.2 0.4 537 4 18-22 0.8 16.1 22.8 13.6 7.0 4.4 35.3 1.6 6.2 0.5 513 5 22-27 0.6 15.5 23.1 14.1 7.4 4.1 35.2 1.5 6.3 0.4 513
6 27-31 0.6 16.5 24.5 14.4 7.5 4.2 32.3 1.6 6.4 0.3 590 7 31-36 1.2 18.2 25.2 13.8 6.8 4.0 30.8 1.8 6.5 0.4 643 8 36-42 2.1 19.6 25.5 13.6 7.2 4.1 27.9 1.9 6.8 0.8 640 9 42-48 2.6 21.8 27.0 13.9 7.1 4.3 23.3 2.0 6.8 1.2 790
10^3 48-54 2.9 22.4 29.0 13.2 6.4 4.9 21.2 2.2 7.0 1.4 780
11 4.5- 5. 0 1.7 22.2 29.6 13.8 7.5 4.6 20.6 2.1 7.1 0.4 12 5.0- 6. 3 2.8 19.8 32.7 11.9 6.6 5.1 21.1 2.3 7.3 0.4 13 6.3- 8. 5 1.3 23.4 30.9 14.9 6.4 5.0 17.1 2.2 7.8 0.2 14 8.5-12. 5 4.6 30.0 29.6 11.2 4.9 3.7 16.0 3.2 7.8 15 12.5-14. 5 4.4 28.8 29.3 11.1 5.9 2.2 18.3 3.3 7.8
^Samples 1 through 9 are Garwin solum.
^Samples 10 through 15 are Wisconsin loess.
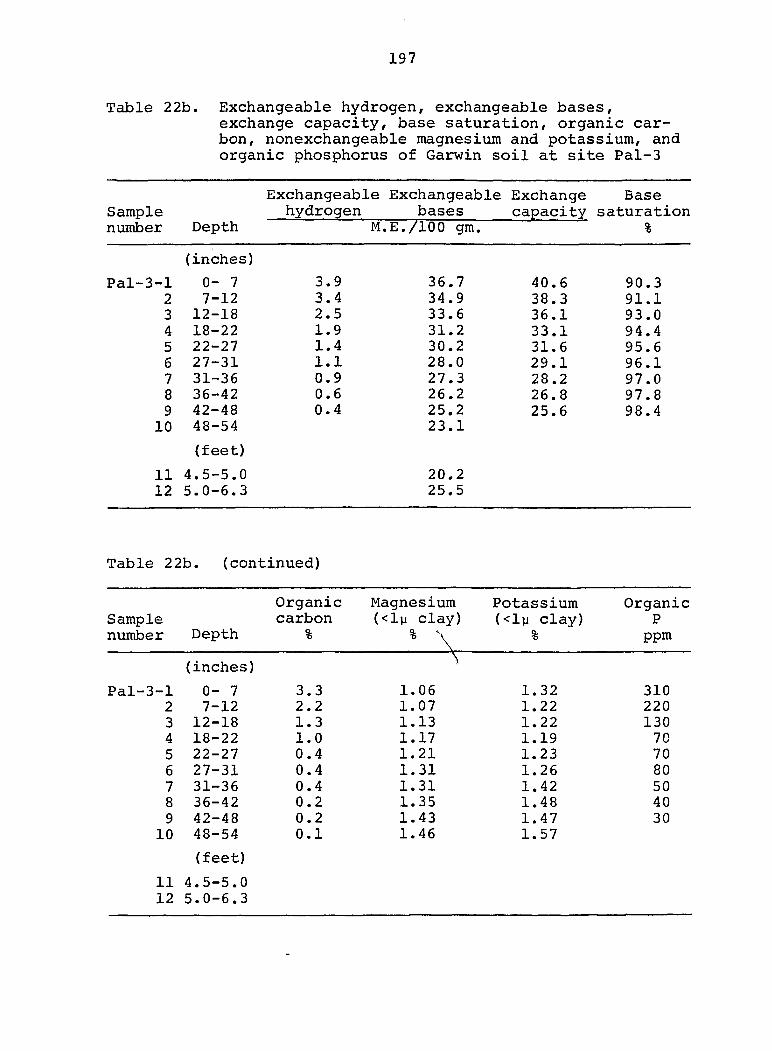
197
Table 22b. Exchangeable hydrogen, exchangeable bases, exchange capacity, base saturation, organic carbon, nonexchangeable magnesium and potassium, and organic phosphorus of Garwin soil at site Pal-3
Exchangeable Exchangeable Exchange Base Sample hydrogen bases capacity saturation number Depth M.E./lOO gm. %
(inches)
Pal-3-1 0- 7 3.9 36.7 40.6 90.3 2 7-12 3.4 34.9 38.3 91.1 3 12-18 2.5 33.6 36.1 93.0 4 18-22 1.9 31.2 33.1 94.4 5 22-27 1.4 30.2 31.6 95.6 6 27-31 1.1 28.0 29.1 96.1 7 31-36 0.9 27.3 28.2 97.0 8 36-42 0.6 26.2 26.8 97.8 9 42-48 0.4 25.2 25.6 98.4 10 48-54 23.1
(feet)
11 4.5-5.0 12 5.0-6.3
20 .2 25.5
Table 22b. (continued)
Organic Magnesium Potassium Organic Sample carbon (<ly clay) (<1% clay) P number Depth % ^ \ % ppm
(inches)
3-1 0- 7 3.3 1.06 1.32 310 2 7-12 2.2 1.07 1.22 220 3 12-18 1.3 1.13 1.22 130 4 18-22 1.0 1.17 1.19 70 5 22-27 0.4 1.21 1.23 70 6 27-31 0.4 1.31 1.26 80 7 31-36 0.4 1.31 1.42 50 8 36-42 0.2 1.35 1.48 40 9 42-48 0.2 1.43 1.47 30 10 48-54 0.1 1.46 1.57
(feet)
11 4.5-5.0 12 5.0-6.3
Figure 35. Variation of particle-size ratio of Wisconsin loess with elevation at sites Pal-1, Pal-2, Pal-3, and S (data from Tables 20a, 21a, 22a, and 23)
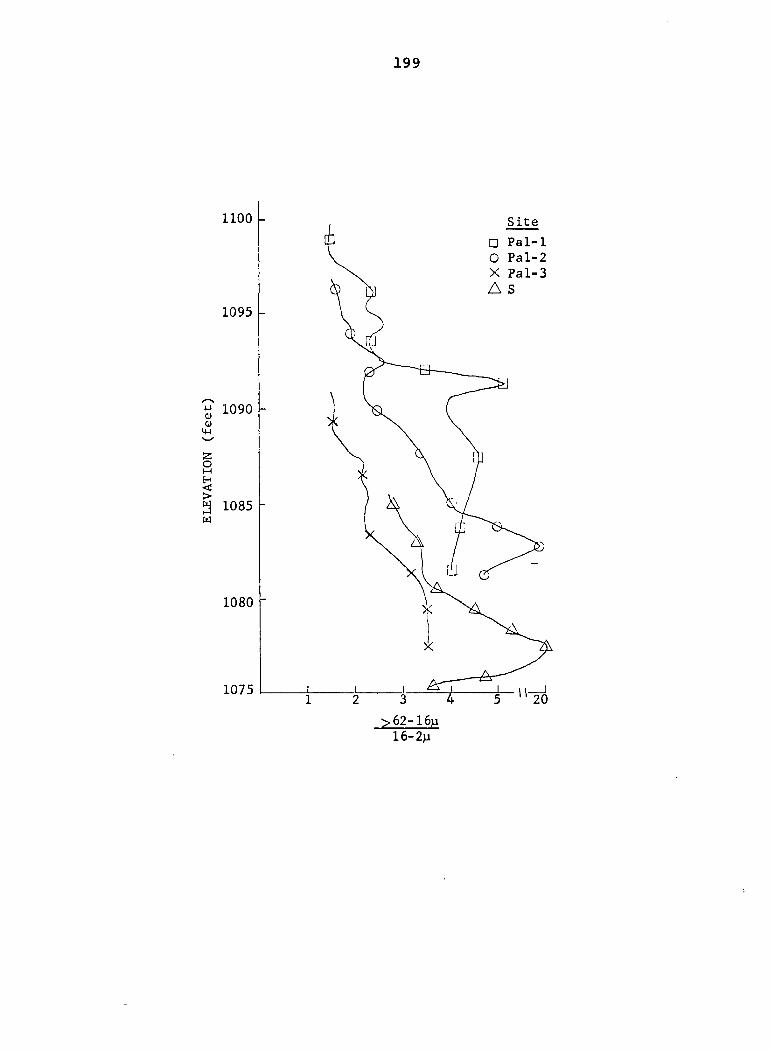
199
1100 -
1095 -
0) 0)
iw
I g
1090
g 1085 M
1080
1075
>62-16# 16-2M
Site
• Pal-1
O Pal-2 X Pal-3
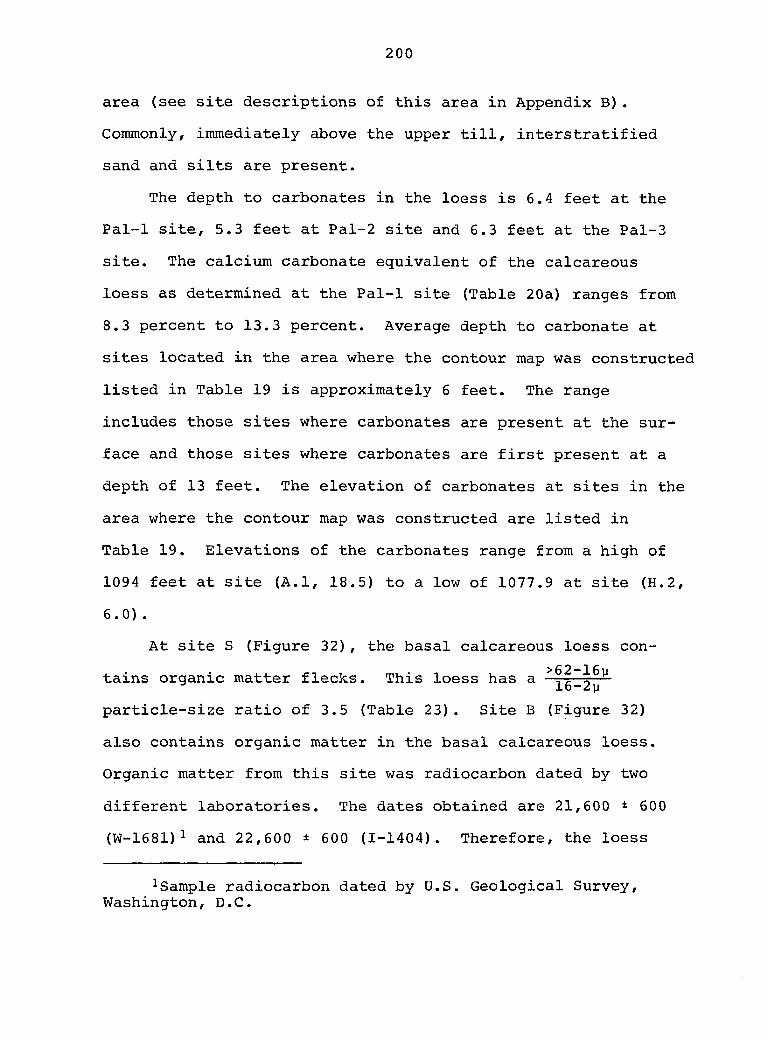
200
area (see site descriptions of this area in Appendix B).
Commonly, immediately above the upper till, interstratified
sand and silts are present.
The depth to carbonates in the loess is 6.4 feet at the
Pal-1 site, 5.3 feet at Pal-2 site and 6.3 feet at the Pal-3
site. The calcium carbonate equivalent of the calcareous
loess as determined at the Pal-1 site (Table 20a) ranges from
8.3 percent to 13.3 percent. Average depth to carbonate at
sites located in the area where the contour map was constructed
listed in Table 19 is approximately 6 feet. The range
includes those sites where carbonates are present at the sur
face and those sites where carbonates are first present at a
depth of 13 feet. The elevation of carbonates at sites in the
area where the contour map was constructed are listed in
Table 19. Elevations of the carbonates range from a high of
1094 feet at site (A.l, 18.5) to a low of 1077.9 at site (H.2,
6.0) .
At site S (Figure 32), the basal calcareous loess con
tains organic matter flecks. This loess has a
particle-size ratio of 3.5 (Table 23). Site B (Figure 32)
also contains organic matter in the basal calcareous loess.
Organic matter from this site was radiocarbon dated by two
different laboratories. The dates obtained are 21,600 ± 600
(W-1681)i and 22,600 ± 600 (1-1404). Therefore, the loess
1Sample radiocarbon dated by U.S. Geological Survey, Washington, D.C.
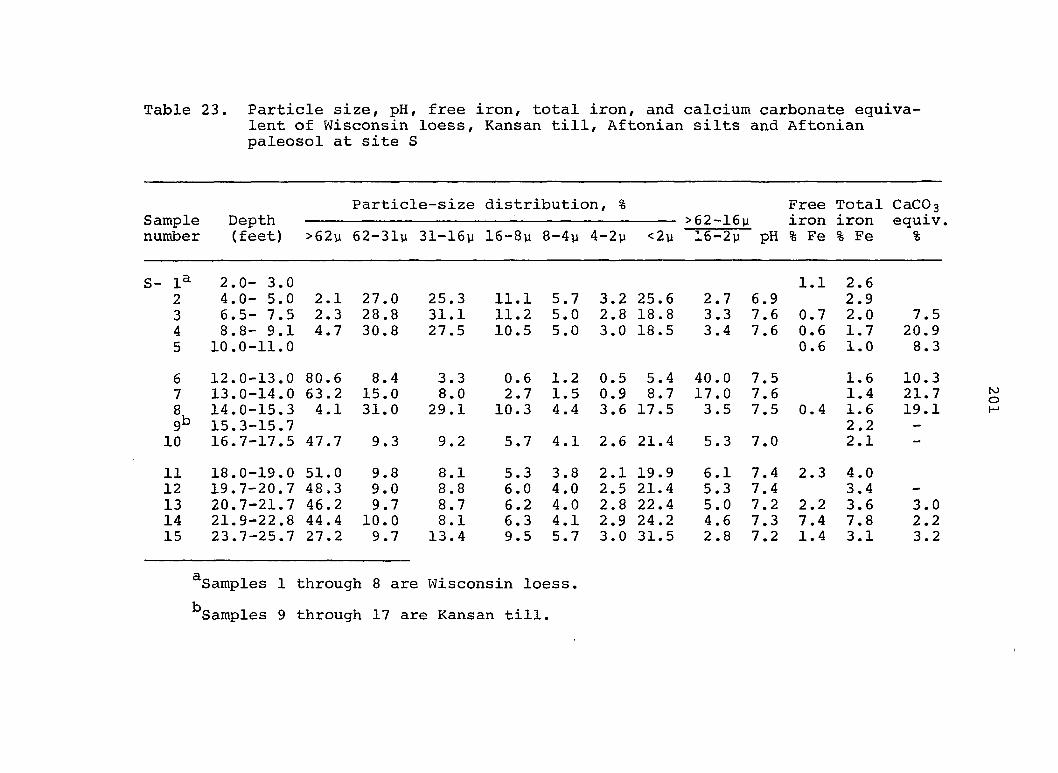
Table 23. Particle size, pH, free iron, total iron, and calcium carbonate equivalent of Wisconsin loess, Kansan till, Aftonian silts and Aftonian paleosol at site S
Particle-size distribution, % Free Total CaCOg Sample Depth : >62-16% iron iron equiv. number (feet) >62% 62-31% 31-16% 16-8% 8-4% 4-2% <2% 16-2% pH % Fe % Fe %
1^ 2.0- 3.0 1.1 2.6 2 4.0- 5.0 2.1 27.0 25.3 11.1 5.7 3.2 25.6 2.7 6.9 2.9 3 6.5- 7.5 2.3 28.8 31.1 11.2 5.0 2 . 8 18.8 3.3 7.6 0.7 2.0 7.5 4 8.8- 9.1 4.7 30.8 27.5 10.5 5.0 3.0 18.5 3.4 7.6 0.6 1.7 20.9 5 10.0-11.0 0.6 1.0 8.3
6 12.0-13.0 80.6 8.4 3.3 0.6 1.2 0.5 5.4 40.0 7.5 1.6 10.3 7 13.0-14.0 63.2 15.0 8.0 2.7 1.5 0.9 8.7 17.0 7.6 1.4 21.7
14.0-15.3 4.1 31.0 29.1 10.3 4.4 3.6 17.5 3.5 7.5 0.4 1.6 19.1 9b 15.3-15.7 2.2 -
10 16.7-17.5 47.7 9.3 9.2 5.7 4.1 2.6 21.4 5.3 7.0 2.1 —
11 18.0-19.0 51.0 9.8 8.1 5.3 3.8 2.1 19.9 6.1 7.4 2.3 4.0 12 19.7-20.7 4 8 . 3 9.0 8.8 6.0 4.0 2.5 21.4 5.3 7.4 3.4 -
13 20.7-21.7 46.2 9.7 8.7 6.2 4.0 2.8 22.4 5.0 7.2 2.2 3.6 3.0 14 21.9-22.8 44.4 10.0 8.1 6.3 4.1 2.9 24.2 4.6 7.3 7.4 7.8 2.2 15 23.7-25.7 27.2 9.7 13.4 9.5 5.7 3.0 31.5 2.8 7.2 1.4 3.1 3.2
^Samples 1 through 8 are Wisconsin loess.
^Samples 9 through 17 are Kansan till.
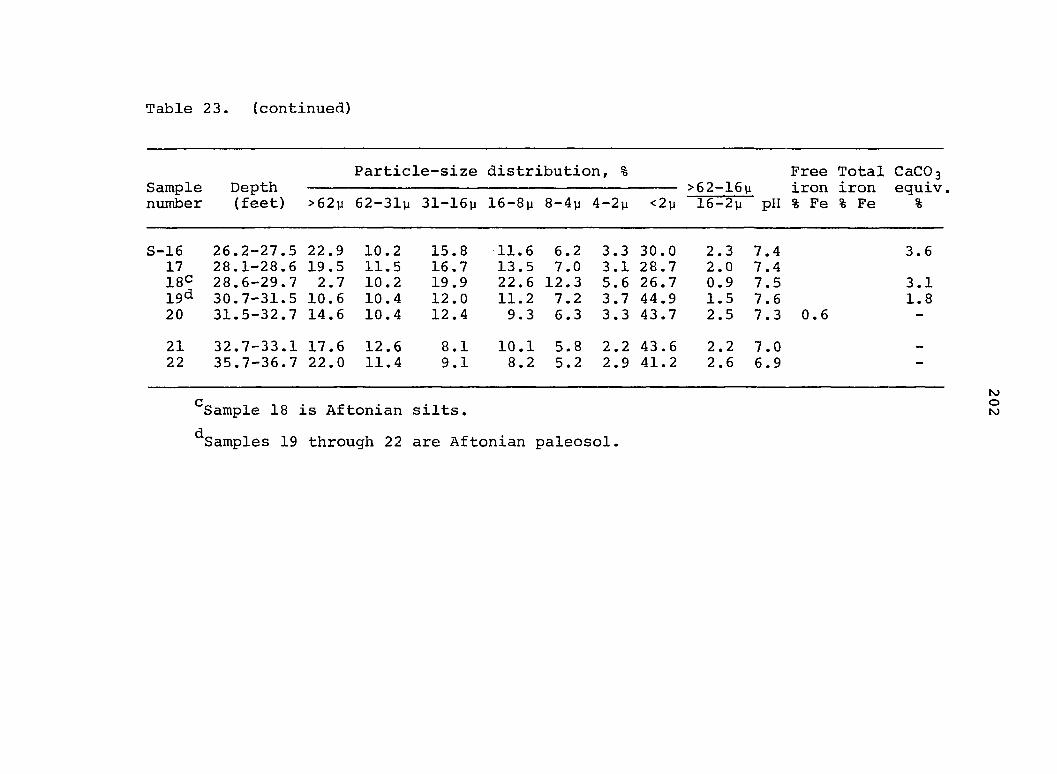
Table 23. (continued)
Particle-size distribution, % Free Total CaCOg Sample Depth >62-16% iron iron equiv. number (feet) >62y 62-31% 31-16% 16-8% 8-4% 4-2% <2% 16-2% pH % Fe % Fe %
16 26.2-27.5 22.9 10.2 15.8 11.6 6.2 3.3 30.0 2.3 7.4 3.6 17 28.1-28.6 19.5 11.5 16.7 13.5 7.0 3.1 28.7 2.0 7.4 18C 28.6-29.7 2.7 10.2 19.9 22.6 12.3 5.6 26.7 0.9 7.5 3.1 igd 30.7-31.5 10.6 10.4 12.0 11.2 7.2 3.7 44.9 1.5 7.6 1.8 20 31.5-32.7 14.6 10.4 12.4 9.3 6.3 3.3 43.7 2.5 7.3 0.6 -
21 32.7-33.1 17.6 12.6 8.1 10.1 5.8 2.2 43.6 2.2 7.0 _
22 35.7-36.7 22.0 11.4 9.1 8.2 5.2 2.9 41.2 2.6 6.9 -
^Sample 18 is Aftonian silts.
^Samples 19 through 22 are Aftonian paleosol.

203
above the organic zone in the Palermo area was deposited over
a time period ranging from approximately 22,000 years to
14,000 years ago.
The dates reported in the present study from organic
matter accumulations in the basal Wisconsin loess indicates
the organic matter has a wide range in age. These dates are
summarized in Table 24. In addition, two dates from the Salt
Creek area (Hall, 1965) are included. The organic zones, in
all cases, are overlain by several feet of calcareous loess.
The overlying calcareous loess, in addition to the depth of
the organic material below the surface, should minimize the
possibility of contamination by more recent organic carbon.
In the past, a paleosol developed in the basal Wisconsin
loess in Iowa (Ruhe et , 1957) has been designated as a
Farmdale paleosol if its radiocarbon age fell within recog
nized Farmdale age (22,000-25,000 years). The Farmdale
paleosol in the type area in Illinois is radiocarbon dated at
22,900 ± 900 (W-68) to 25,150 ± 600 (W-381) years (Frye and
Willman, 1960, p. 6). The Farmdalian time-stratigraphic unit
is recognized as including 22,000 to 28,000 years before pres
ent (Frye et al., 1962, p. 2). The first three dates listed
in Table 24, namely, 1-1269, 1-1267, and 1-1404, are included
within Farmdale time. However, the remaining dates are
younger than the Farmdale dates cited.
The younger dates, samples W-1681, 1-1409, and W-1687,
are included within the range of Woodfordian time of Illinois.
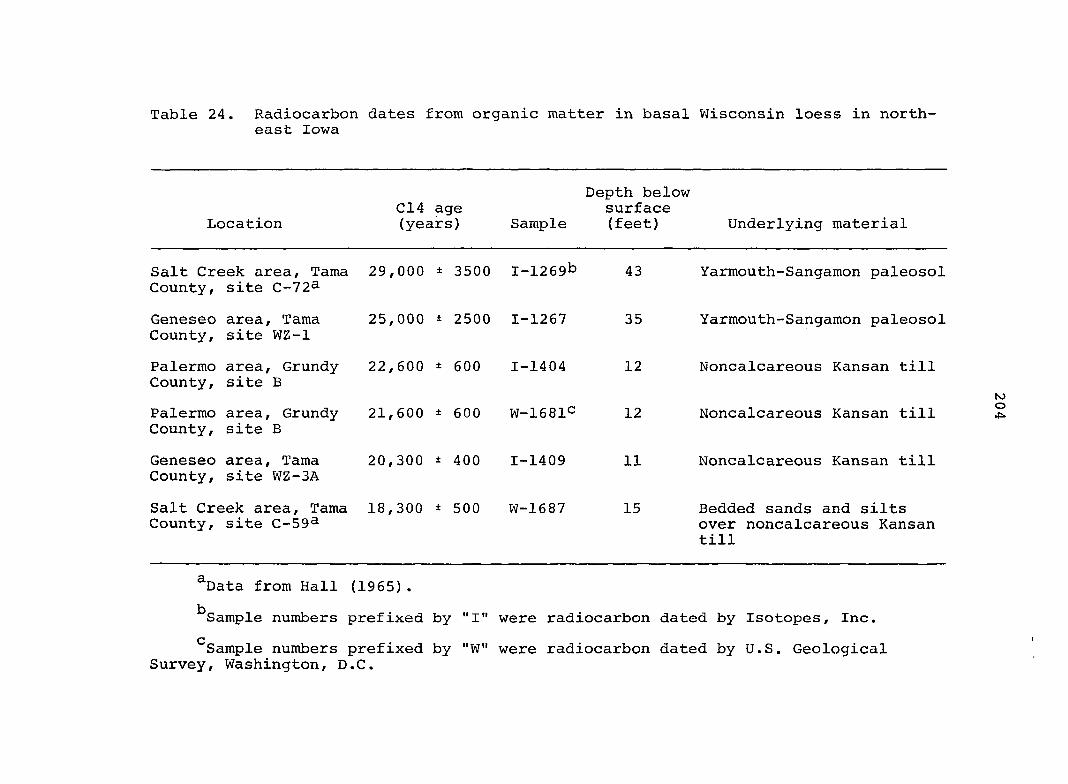
Table 24. Radiocarbon dates from organic matter in basal Wisconsin loess in northeast Iowa
Depth below C14 age surface
Location (years) Sample (feet) Underlying material
Salt Creek area, Tama County, site C-72&
29, 000 ± 3500 I-1269b 43 Yarmouth-Sangamon paleosol
Geneseo County,
area, Tama site WZ-1
25, 000 ± 2500 I-•1267 35 Yarmouth-Sangamon paleosol
Palermo County,
area, Grundy site B
22, 600 ± 600 I-•1404 12 Noncalcareous Kansan till
Palermo County,
area, Grundy site B
21, 600 ± 600 W-1681C 12 Noncalcareous Kansan till
Geneseo County,
area, Tama site WZ-3A
20, 300 ± 400 I-•1409 11 Noncalcareous Kansan till
Salt Creek area, Tama County, site C-59&
00 r—1
300 ± 500 w-1687 15 Bedded sands and silts over noncalcareous Kansan till
^Data from Hall (1965).
^Sample numbers prefixed by "I" were radiocarbon dated by Isotopes, Inc.
Sample numbers prefixed by "W" were radiocarbon dated by U.S. Geological Survey, Washington, D.C.

205
Frye and Willman {I960, p. 2) consider Woodfordian time as
ranging from 22,000 to 12,500 years ago. One of the dates,
W-1687, is included with the Tazewell time of Leighton (1965),
which he considered to range from 19,500 to 15,750 years ago.
Therefore, the paleosol developed in the basal Wisconsin loess
does not coincide with the rock-stratigraphic unit Farmdale
and should not be referred to as a Farmdale paleosol. Rather,
the basal-loess paleosol is a soil-stratigraphic unit that
transgresses not only Farmdale time, but also a part of
Tazewell or Woodfordian time. The dates listed in Table 24
show the time period transgressed by the basal-loess paleosol
within the study areas in northeast Iowa is from 29,000 to
18,300 years before present. Therefore, the paleosol devel
oped in the basal Wisconsin loess should be renamed. The time
transgression is best illustrated in the Salt Creek area and
therefore the buried soil is named the Salt Creek paleosol.
It is within this area that the organic material in the basal
loess has the widest range in age. The organic material in
the basal loess at site C-72 is 29,000 years old and approxi
mately 700 feet to the northwest, at site C-59, organic matter
in the basal loess is 18,300 years old. From the data now
available, the time transgressed by the Salt Creek paleosol is
approximately 10,700 years.
Kansan till As discussed previously in the Four-Mile
Creek to Palermo traverse the upper till of the Palermo area
is identified as Kansan till. In the Palermo area, the
206
Yarmouth-Sangamon paleosol and part of the oxidized and
leached till have been eroded. The elevations of the top of
the Kansan till at the sites located in the area where the
contour map was constructed are listed next to the site loca
tions in Figure 34. The elevations preceded by "S", for
example site (H.3, 12.0), indicate sites at which sand extends
to depths of 6 to 8 feet before till was encountered. Sites
such as this perhaps indicate a drainage network on the buried
surface. However, the majority of observations indicate the
buried till surface has little relief.
The texture of the Kansan till in the Palermo area ranges
from loam to light clay loam as indicated by field descrip
tions. Laboratory data support the field observations. At
site S, the loess-till contact is at a depth of 15.3 feet.
From 15.3 to 28.6 feet the clay content of the till ranges
from 19.9 percent to 24.2 percent (Table 23). Sand content
varies from 44.4 percent to 51 percent and the till is loam in
texture. Between 22.8 feet and 28.6 feet, the sand content
decreases to about 20 percent. The clay content increases to
approximately 30 percent and the till is light clay loam in
texture. The textural class range of loam to clay loam of the
Kansan till is also supported by particle-size data of sites
U and T (Tables 25 and 26). The upper one foot of Kansan till
sampled at Pal-1 and Pal-2 sites (Tables 20a and 21a) is loam
in texture.
The Kansan till, beneath the calcareous loess, is

Table 25. Particle size, organic carbon, and calcium carbonate equivalent of Muscatine soil, Wisconsin loess, Kansan till, Aftonian silts, Aftonian paleosol and Nebraskan till at site U
Particle -size distribution, % Organic CaCOg Sample Depth >50-20y carbon equiv number (feet) >50y 50-20y 20-2y <2y 20-2y % %
U- 1^ 0-0.5 1.6 34.5 28.1 35.8 1.3 4.3 —
2 2.0- 2.5 2.7 31.9 34.8 30.6 1.0 0.4 -
3 3.3- 3.9 4.5 43.4 30.7 21.4 1.6 0.2 10.4 4b 4.9- 5.3 5.6 44.9 30.0 19.5 1.7 0.1 14.6 5 6.9- 7.3 4.7 43.6 30.6 21.1 1.6 0.1 12.2
6 8.3- 8.9 8.4 32.8 41.7 17.1 1.0 0.1 12.8 7^ 16.0-16.5 16.6 23.6 24.1 35.7 1.7 0.1 -
8 17.5-18.0 13.6 23.8 24.8 37.8 1.5 0.1 -
9 18.3-18.8 48.5 13.3 15.2 23.0 4.1 0.1 1.3 10 19.5-20.0 42.9 15.7 15.6 25.8 3.7 - -
11 22.9-23.6 12.3 33.7 20.3 33.7 2.2 — —
12 24.6-25.1 22.9 20.2 24.7 32.2 1.7 - -
13d 26.8-27.4 1.4 35.0 43.2 20.4 0.8 - -
14e 28.5-29.0 27.4 18.5 24.6 29.5 1.9 - —
15f 32.0-32.5 19.4 16.2 23.0 41.4 2.9 0.1 -
16 36.8-37.4 29.1 17.9 16.1 36.9 2.9 — —
179 40.8-41.4 44.2 17.8 18.0 20.0 3.4 - 7.9
^Samples 1 through 3 are Muscatine soil solum.
^Samples 4 through 6 are Wisconsin loess.
^Samples 7 through 12 are Kansan till.
'^Sample 13 is Aftonian silts.
^Sample 14 is Aftonian gravels.
^Samples 15 and 16 are Aftonian paleosol.
^Sample 17 is Nebraskan till.
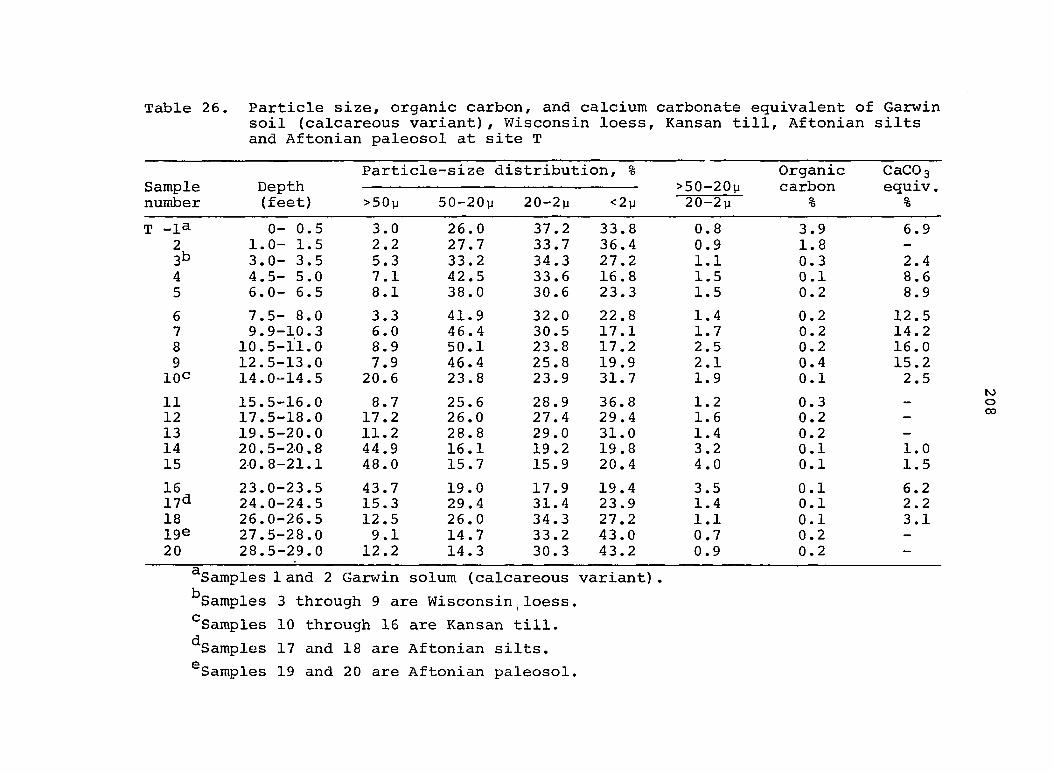
Table 26. Particle size, organic carbon, and calcium carbonate equivalent of Garwin soil (calcareous variant), Wisconsin loess, Kansan till, Aftonian silts and Aftonian paleosol at site T
Particle -size distribution, % Organic CaCOg Sample Depth >50-20# carbon equiv. number (feet) >50y 50-20y 20-2u <2y 20-2y % %
T -la 0- 0.5 3.0 26.0 37.2 33.8 0.8 3.9 6.9 2 1.0- 1.5 2.2 27.7 33.7 36.4 0.9 1.8 —
3b 3.0- 3.5 5.3 33.2 34.3 27.2 1.1 0.3 2.4 4 4.5- 5.0 7.1 42.5 33.6 16.8 1.5 0.1 8.6 5 6.0- 6.5 8.1 38.0 30.6 23.3 1.5 0.2 8.9
6 7.5- 8.0 3.3 41.9 32.0 22.8 1.4 0.2 12.5 7 9.9-10.3 6.0 46.4 30.5 17.1 1.7 0.2 14.2 8 10.5-11.0 8.9 50.1 23.8 17.2 2.5 0.2 16.0 9 12.5-13.0 7.9 46.4 25.8 19.9 2.1 0.4 15.2 IOC 14.0-14.5 20.6 23.8 23.9 31.7 1.9 0.1 2.5
11 15.5-16.0 8.7 25.6 28.9 36.8 1.2 0.3 —
12 17.5-18.0 17.2 26.0 27.4 29.4 1.6 0.2 -
13 19.5-20.0 11.2 28.8 29.0 31.0 1.4 0.2 -
14 20.5-20.8 44.9 16.1 19.2 19.8 3.2 0.1 1.0 15 20.8-21.1 48.0 15.7 15.9 20.4 4.0 0.1 1.5
16 23.0-23.5 43.7 19.0 17.9 19.4 3.5 0.1 6.2 17d 24.0-24.5 15.3 29.4 31.4 23.9 1.4 0.1 2.2 18 26.0-26.5 12.5 26.0 34.3 27.2 1.1 0.1 3.1 19e 27.5-28.0 9.1 14.7 33.2 43.0 0.7 0.2 -
20 28.5-29.0 12.2 14.3 30.3 43.2 0.9 0.2 -
^Samples land 2 Garwin solum (calcareous variant).
^Samples 3 through 9 are Wisconsin loess.
^Samples 10 through 16 are Kansan till.
^Samples 17 and 18 are Aftonian silts.
^Samples 19 and 20 are Aftonian paleosol.
209
noncalcareous in its upper part at most sites in the Palermo
area. However, there is no evidence of solum development in
the till. The depth of carbonates, summarized from descrip
tions in this area, ranges from 1 to 15 feet. However, the
reaction of the noncalcareous till is neutral to mildly alka
line. The pH values of the Kansan till at site S are about
7.0 to 7.5 (Table 23). The high pH values perhaps indicate
secondary enrichment from the overlying loess. The overlying
calcareous loess has calcium carbonate equivalents of about 20
percent at site S. The calcium carbonate equivalent of the
calcareous till at this site is only about 3 percent (Table
23) .
The color of the upper part of the Kansan till in the
Palermo area at 19 of 50 sites summarized is greenish gray
(5G 5/1-6/1). With increasing depth below the greenish gray
zone, the color usually grades to olive brown or yellowish
brown. At the remainder of the sites, the colors are gray or
yellowish brown or a mixture of these two colors.
Nebraskan till A clay-textured Aftonian paleosol
underlies the Kansan till and surmounts the Nebraskan till in
the Palermo area (Figure 33). At many sites, the Aftonian
paleosol is overlain by Aftonian silts. The silts present at
site S (Table 23, sample S-18) have a sand content of 2.7 per
cent and a clay content of 26.7 percent. They are sd.lt loam
in texture and gray (5Y 5/1) in color. The III Allb horizon
of the Aftonian paleosol at site S (description. Appendix B)
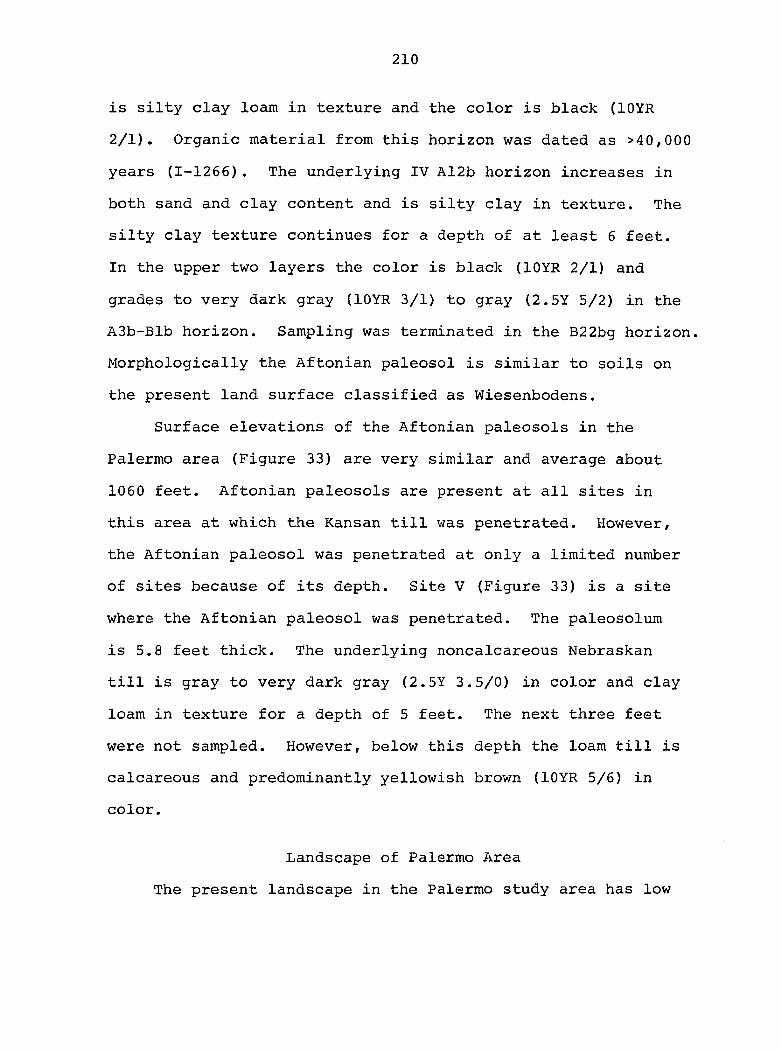
210
is silty clay loam in texture and the color is black (lOYR
2/1). Organic material from this horizon was dated as >40,000
years (1-1266). The underlying IV Al2b horizon increases in
both sand and clay content and is silty clay in texture. The
silty clay texture continues for a depth of at least 6 feet.
In the upper two layers the color is black (lOYR 2/1) and
grades to very dark gray (lOYR 3/1) to gray {2.5Y 5/2) in the
A3b-Blb horizon. Sampling was terminated in the B22bg horizon.
Morphologically the Aftonian paleosol is similar to soils on
the present land surface classified as Wiesenbodens.
Surface elevations of the Aftonian paleosols in the
Palermo area (Figure 33) are very similar and average about
1060 feet. Aftonian paleosols are present at all sites in
this area at which the Kansan till was penetrated. However,
the Aftonian paleosol was penetrated at only a limited number
of sites because of its depth. Site V (Figure 33) is a site
where the Aftonian paleosol was penetrated. The paleosolum
is 5.8 feet thick. The underlying noncalcareous Nebraskan
till is gray to very dark gray (2.5Y 3.5/0) in color and clay
loam in texture for a depth of 5 feet. The next three feet
were not sampled. However, below this depth the loam till is
calcareous and predominantly yellowish brown (lOYR 5/5) in
color.
Landscape of Palermo Area
The present landscape in the Palermo study area has low
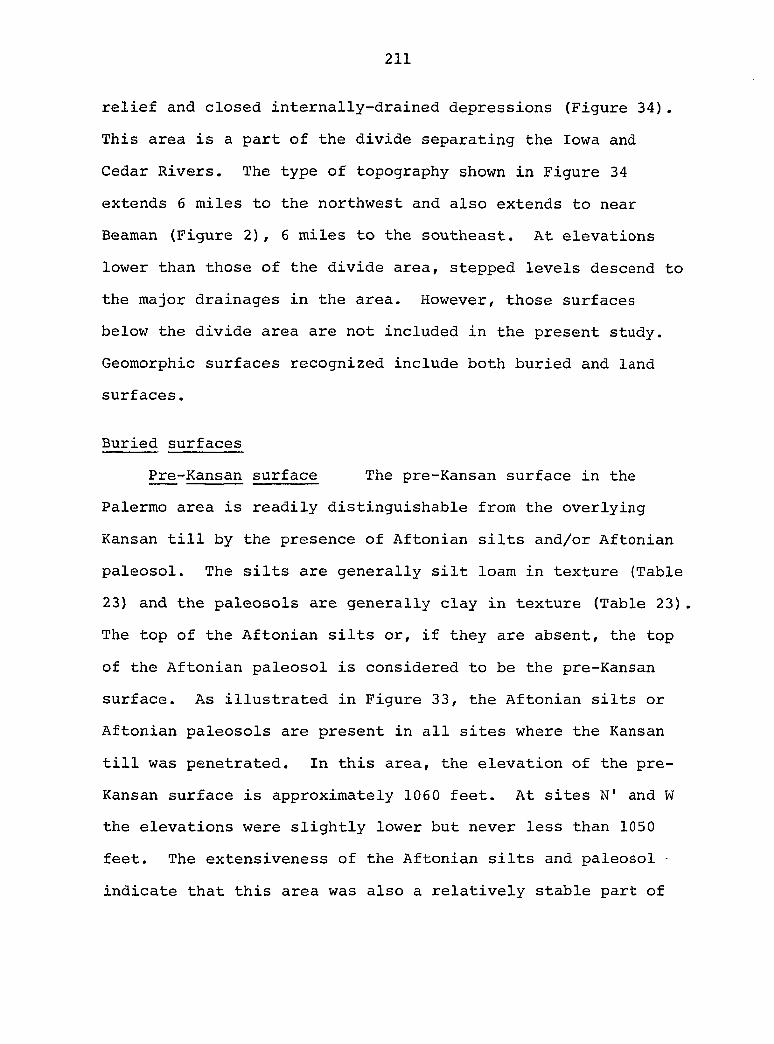
211
relief and closed internally-drained depressions (Figure 34).
This area is a part of the divide separating the Iowa and
Cedar Rivers. The type of topography shown in Figure 34
extends 6 miles to the northwest and also extends to near
Beaman (Figure 2), 6 miles to the southeast. At elevations
lower than those of the divide area, stepped levels descend to
the major drainages in the area. However, those surfaces
below the divide area are not included in the present study.
Geomorphic surfaces recognized include both buried and land
surfaces.
Buried surfaces
Pre-Kansan surface The pre-Kansan surface in the
Palermo area is readily distinguishable from the overlying
Kansan till by the presence of Aftonian silts and/or Aftonian
paleosol. The silts are generally silt loam in texture (Table
23) and the paleosols are generally clay in texture (Table 23).
The top of the Aftonian silts or, if they are absent, the top
of the Aftonian paleosol is considered to be the pre-Kansan
surface. As illustrated in Figure 33, the Aftonian silts or
Aftonian paleosols are present in all sites where the Kansan
till was penetrated. In this area, the elevation of the pre-
Kansan surface is approximately 1060 feet. At sites N' and W
the elevations were slightly lower but never less than 1050
feet. The extensiveness of the Aftonian silts and paleosol -
indicate that this area was also a relatively stable part of
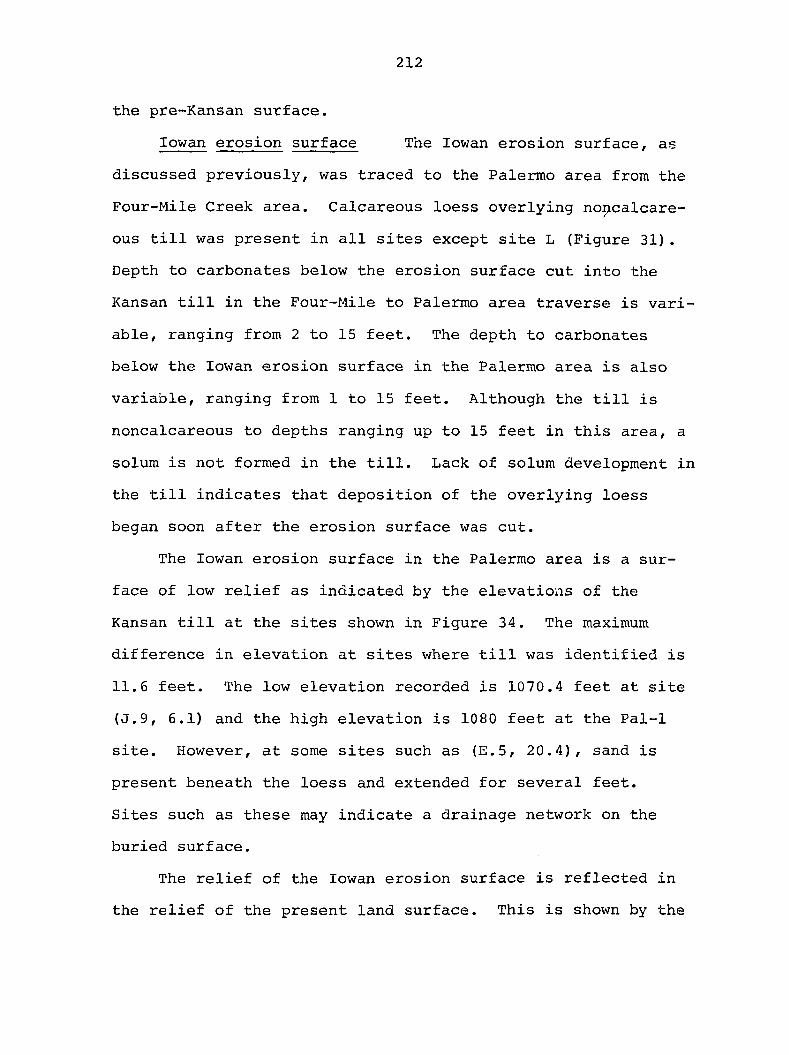
212
the pre-Kansan surface.
lowan erosion surface The lowan erosion surface, as
discussed previously, was traced to the Palermo area from the
Four-Mile Creek area. Calcareous loess overlying nopcalcare-
ous till was present in all sites except site L (Figure 31).
Depth to carbonates below the erosion surface cut into the
Kansan till in the Four-Mile to Palermo area traverse is vari
able, ranging from 2 to 15 feet. The depth to carbonates
below the lowan erosion surface in the Palermo area is also
variable, ranging from 1 to 15 feet. Although the till is
noncalcareous to depths ranging up to 15 feet in this area, a
solum is not formed in the till. Lack of solum development in
the till indicates that deposition of the overlying loess
began soon after the erosion surface was cut.
The lowan erosion surface in the Palermo area is a sur
face of low relief as indicated by the elevations of the
Kansan till at the sites shown in Figure 34. The maximum
difference in elevation at sites where till was identified is
11.6 feet. The low elevation recorded is 1070.4 feet at site
(J.9, 6.1) and the high elevation is 1080 feet at the Pal-1
site. However, at some sites such as (E.5, 20.4), sand is
present beneath the loess and extended for several feet.
Sites such as these may indicate a drainage network on the
buried surface.
The relief of the lowan erosion surface is reflected in
the relief of the present land surface. This is shown by the
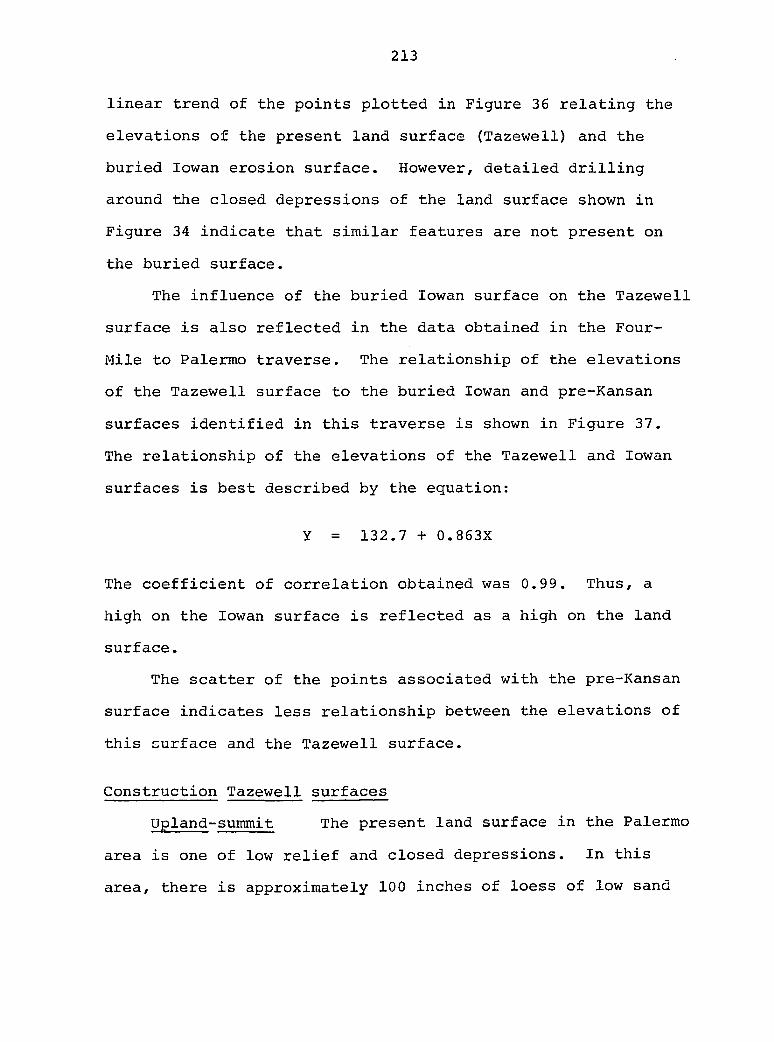
213
linear trend of the points plotted in Figure 36 relating the
elevations of the present land surface (Tazewell) and the
buried lowan erosion surface. However, detailed drilling
around the closed depressions of the land surface shown in
Figure 34 indicate that similar features are not present on
the buried surface.
The influence of the buried lowan surface on the Tazewell
surface is also reflected in the data obtained in the Four-
Mile to Palermo traverse. The relationship of the elevations
of the Tazewell surface to the buried lowan and pre-Kansan
surfaces identified in this traverse is shown in Figure 37.
The relationship of the elevations of the Tazewell and lowan
surfaces is best described by the equation:
y = 132.7 + 0.863X
The coefficient of correlation obtained was 0.99. Thus, a
high on the lowan surface is reflected as a high on the land
surface.
The scatter of the points associated with the pre-Kansan
surface indicates less relationship between the elevations of
this surface and the Tazewell surface.
Construction Tazewell surfaces
Upland-summit The present land surface in the Palermo
area is one of low relief and closed depressions. In this
area, there is approximately 100 inches of loess of low sand
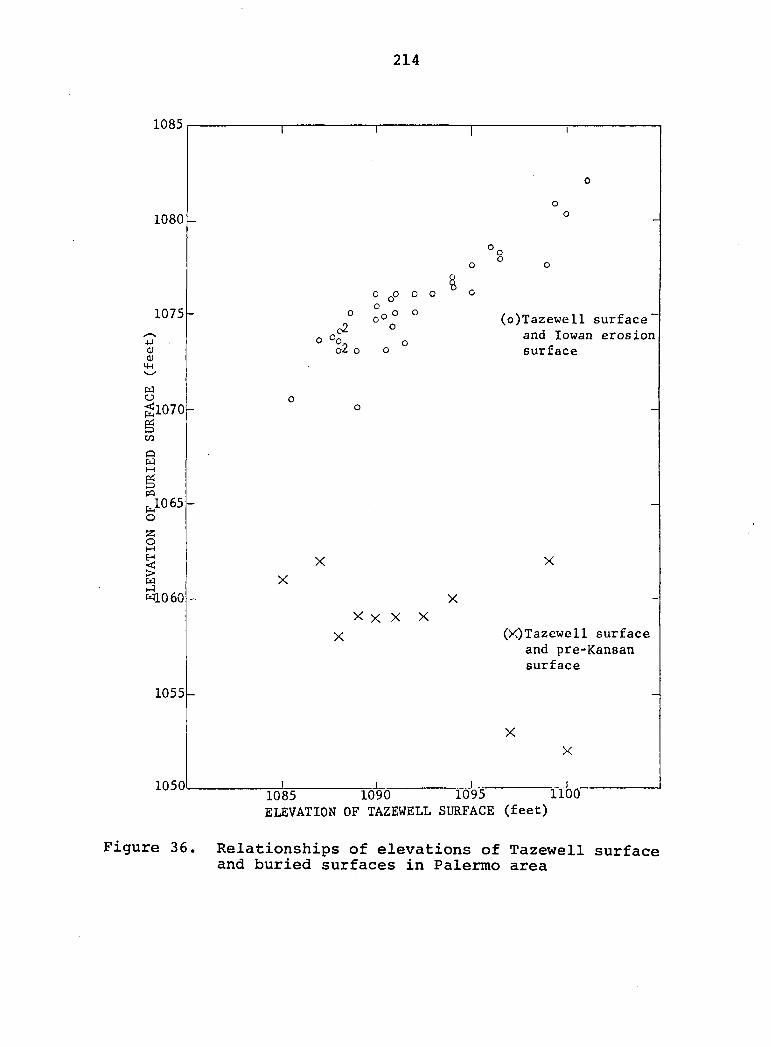
214
1085
1080
1075
0 QO o o o
o o ? o
<D 0)
w
gko70^
Q w
o ai o o
A
k' o z s g
1065
X
W1060 X
X X X X
X
1055-
1050L j_
o o
(o)Tazewell surface" and lowan erosion surface
X
(X)Tazewell surface and pre-Kansan surface
X
X
.. I 1085 1090 1095 1100
ELEVATION OF TAZEWELL SURFACE (feet)
Figure 36. Relationships of elevations of Tazewell surface and buried surfaces in Palermo area
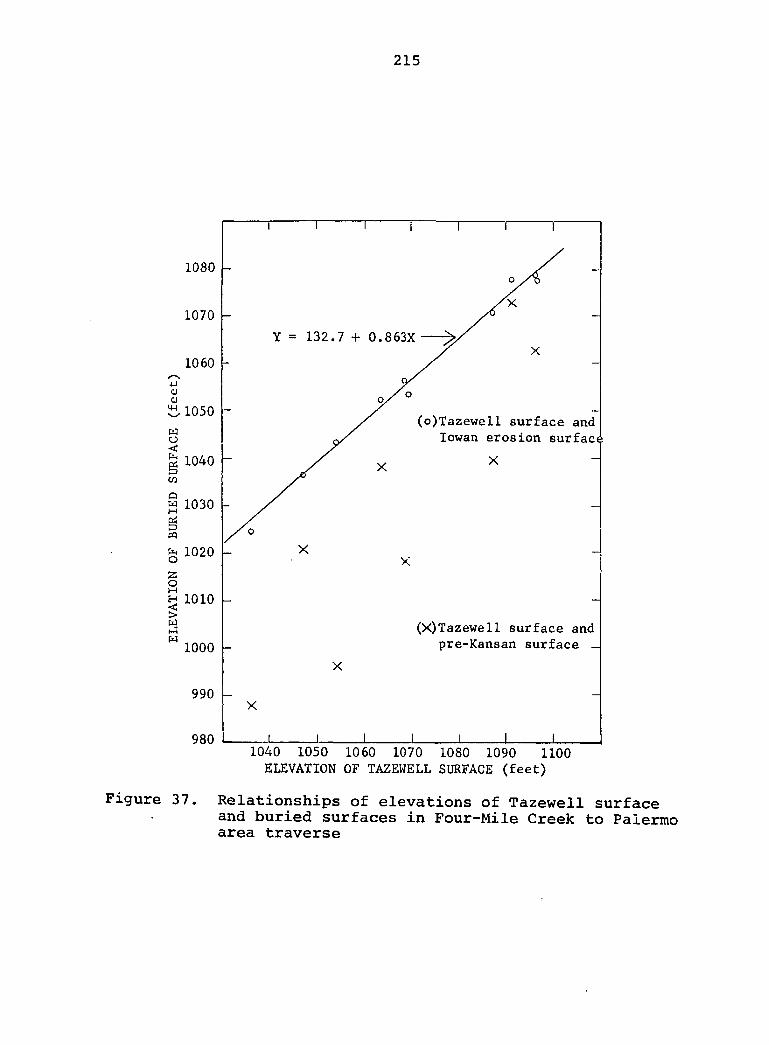
215
1080
1070
1060 •U OJ 0) ^ 1050
w a
1040
w
M 1030
M
g 1020 g
S h 1010
a M
1000
990
Y = 132.7 + 0.863X ^
(o)Tazewell surface and
lowan erosion surfacc
X
(X)Tazewell surface and
pre-Kansan surface _
X
980 1040 1050 1060 1070 1080 1090 1100
ELEVATION OF TAZEWELL SURFACE (feet)
Figure 37. Relationships of elevations of Tazewell surface and buried surfaces in Four-Mile Creek to Palermo area traverse
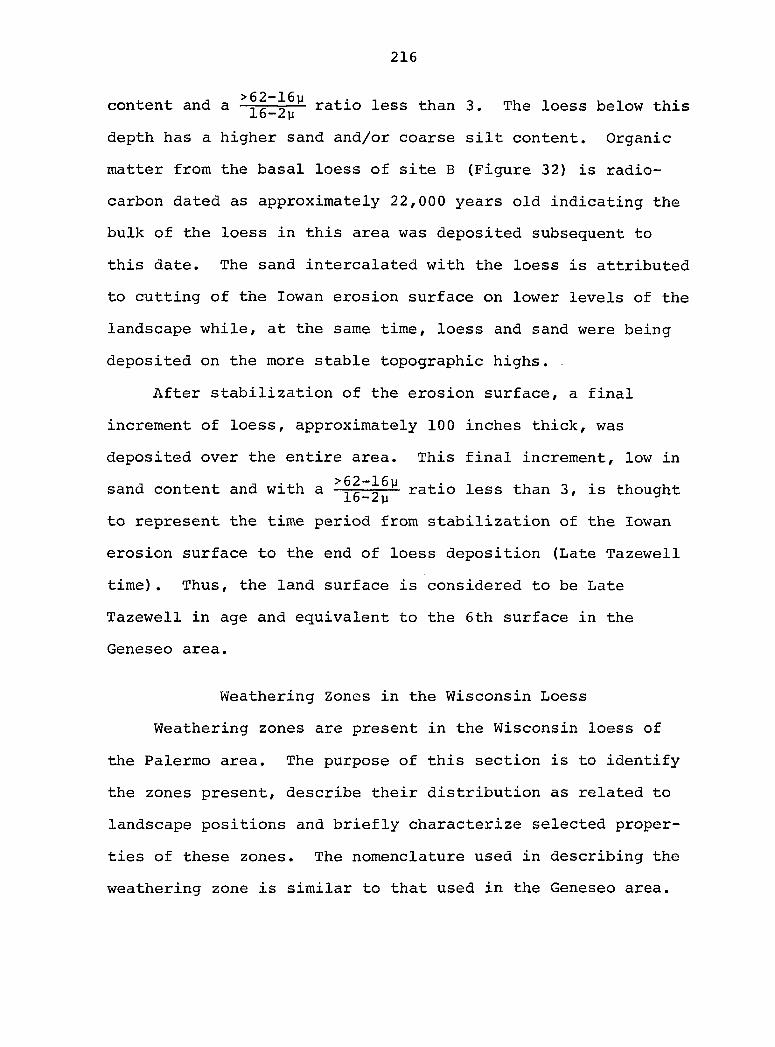
216
content and a ratio less than 3. The loess below this 16-2y
depth has a higher sand and/or coarse silt content. Organic
matter from the basal loess of site B (Figure 32) is radio
carbon dated as approximately 22,000 years old indicating the
bulk of the loess in this area was deposited subsequent to
this date. The sand intercalated with the loess is attributed
to cutting of the lowan erosion surface on lower levels of the
landscape while, at the same time, loess and sand were being
deposited on the more stable topographic highs. .
After stabilization of the erosion surface, a final
increment of loess, approximately 100 inches thick, was
deposited over the entire area. This final increment, low in
sand content and with a ratio less than 3, is thought
to represent the time period from stabilization of the lowan
erosion surface to the end of loess deposition (Late Tazewell
time). Thus, the land surface is considered to be Late
Tazewell in age and equivalent to the 6th surface in the
Geneseo area.
Weathering Zones in the Wisconsin Loess
Weathering zones are present in the Wisconsin loess of
the Palermo area. The purpose of this section is to identify
the zones present, describe their distribution as related to
landscape positions and briefly characterize selected proper
ties of these zones. The nomenclature used in describing the
weathering zone is similar to that used in the Geneseo area.
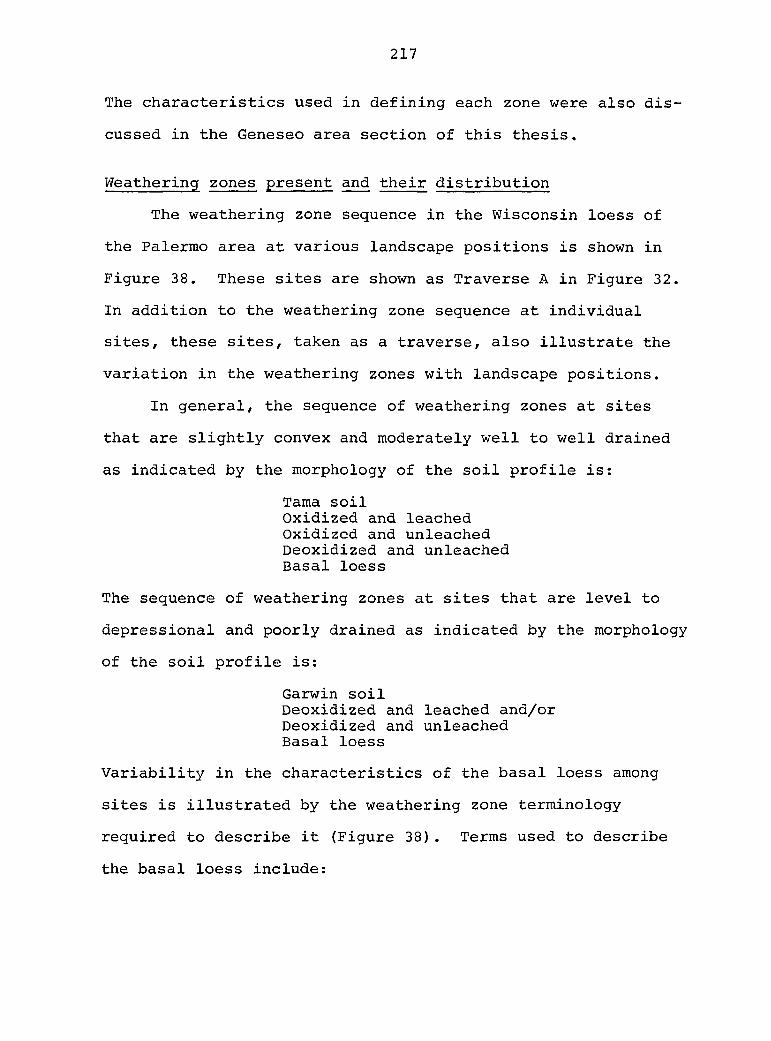
217
The characteristics used in defining each zone were also dis
cussed in the Geneseo area section of this thesis.
Weathering zones present and their distribution
The weathering zone sequence in the Wisconsin loess of
the Palermo area at various landscape positions is shown in
Figure 38. These sites are shown as Traverse A in Figure 32.
In addition to the weathering zone sequence at individual
sites, these sites, taken as a traverse, also illustrate the
variation in the weathering zones with landscape positions.
In general, the sequence of weathering zones at sites
that are slightly convex and moderately well to well drained
as indicated by the morphology of the soil profile is:
Tama soil Oxidized and leached Oxidized and unleached Deoxidized and unleached Basal loess
The sequence of weathering zones at sites that are level to
depressional and poorly drained as indicated by the morphology
of the soil profile is:
Garwin soil Deoxidized and leached and/or Deoxidized and unleached Basal loess
Variability in the characteristics of the basal loess among
sites is illustrated by the weathering zone terminology
required to describe it (Figure 38). Terms used to describe
the basal loess include:
Figure 38. Cross section of traverse A, E'^ SM&, section 29, T87W, R17W, Grundy County, Iowa
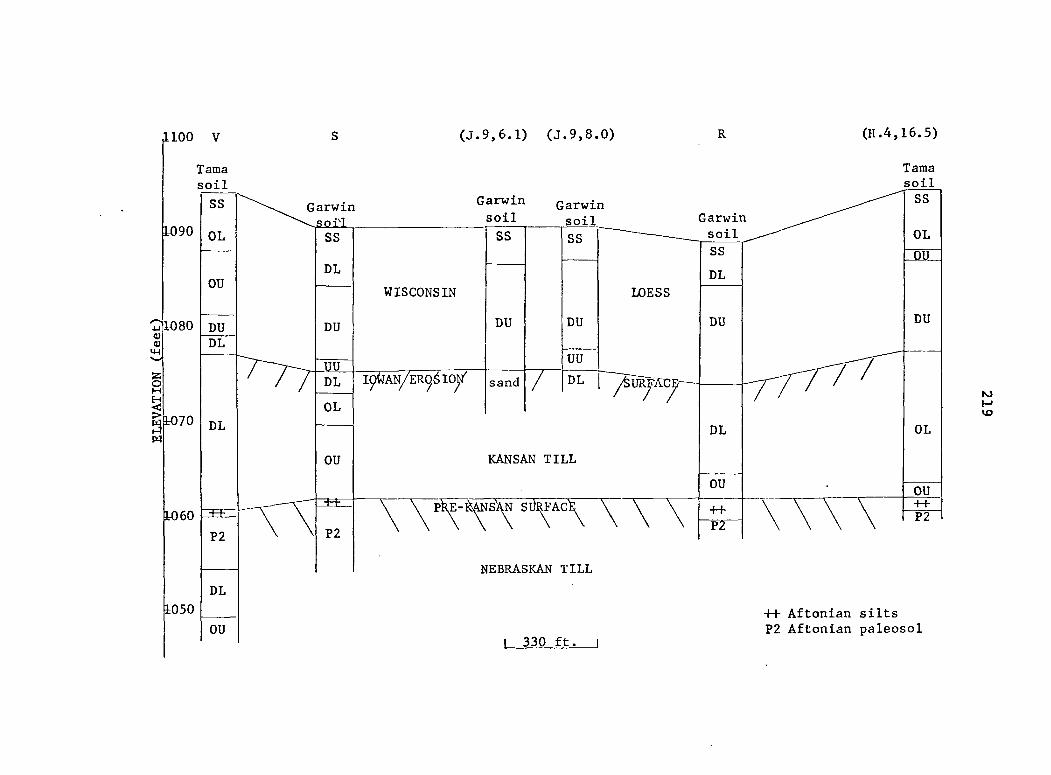
(H.4,16.5) (J.9,6.1) (J.9,8.0) ilOO
Tama soil
Tama
soil SS Garwin
soil SS Garwin
soil Garwin
Garwin
soil 1090 OL OL SS SS SS SS Oil
DL DL OU
WISCONSIN LOESS
DU DU DU DU DU DU DL
UU m
DL DL sand m
OL
DL OL DL
KANSAN TILL OU
OU OU
-H-1060 P2 F 2
P2 P2
NEBRASKAN TILL
DL
1050 ++ Aftonian silts P2 Aftonian paleosol OU
220
Deoxidized and leached Deoxidized and unleached Unoxidized and leached Unoxidized and unleached
A summary of all descriptions in the Palermo area shows the
dominant color of the basal loess is gray (N 5/0).
Presence of organic matter in the basal loess is quite
variable. However, field observations indicate the proba
bility of the basal loess containing organic matter is greater
at sites where the land surface soil profile is poorly drained
as indicated by present morphology.
The basal unleached loess of site B (Figure 32) is gray
(N 5/0) in color. It also contains organic matter which has
been dated. Dates obtained from two different laboratories of
the organic material at this site are 21,600 ± 600 years
(W-1681) and 22,600 ± 600 years (1-1404). Therefore, the
loess of the Palermo area and the weathering zones in the
loess are younger than these dates.
A deoxidized zone was described in the loess at all sites
in the Palermo area. This zone merges with the gleyed hori
zons of the poorly drained soil profiles and begins at depths
as great as 9.8 feet on landscape positions that at present
are well drained. Elevations of the top of the deoxidized
zone for the sites shown in Figure 39 are recorded in Table 19.
On the majority of sites within the area where the contour map
was constructed, the elevation of the top of the deoxidized
zone varies between 1086 and 1089 feet (Figure 39). An
Figure 39. Elevations of top of deoxidized weathering zone in Wisconsin loess in eJ, SW&, section 29, T87N, R17W, Grundy County, Iowa (data from Table 19; numbers near drilling site indicate elevation of top of deoxidized zone at that site)
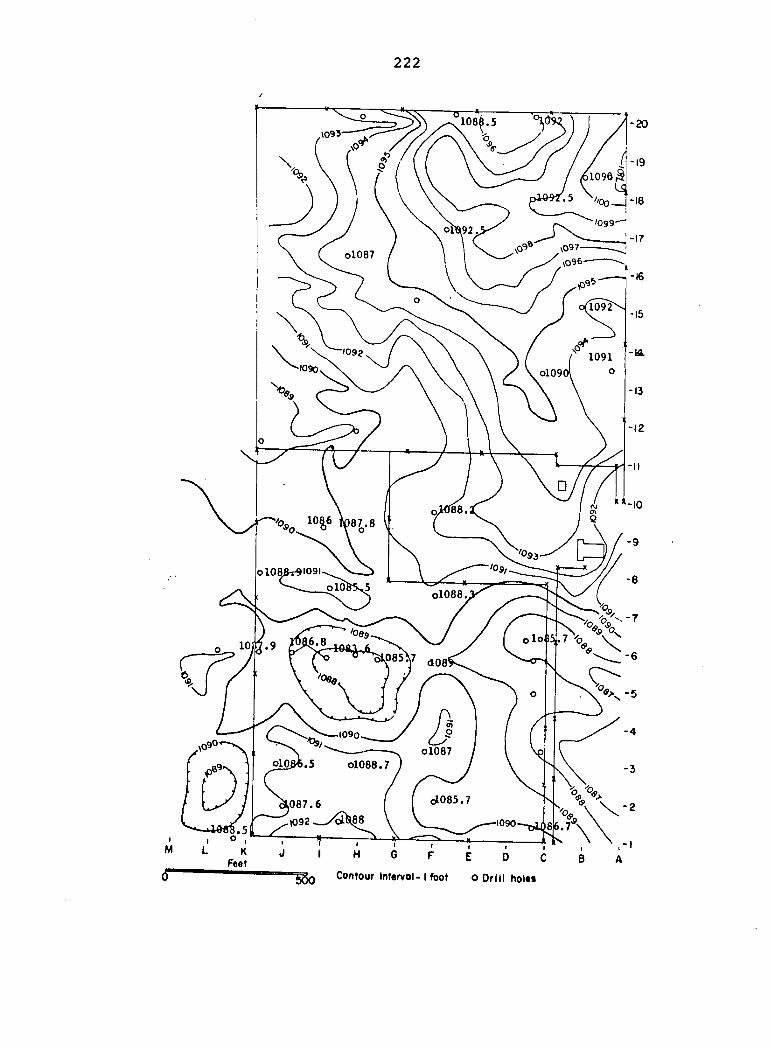
222
oX087
% 4)87.8
o108j&t9IO9I
01088
085^7
.5 O1088.7 O1087
a085.7 087.6
1092—_/olCl88
ZK-'X I H Q F E D C
Contour lnt«rvol-I foot o Drill holts
223
exception to the above statement is the northeast corner of
the contoured area (Figure 39), which is a high area on the
present landscape. The elevation of the top of the deoxidized
zone in this area ranges between 1090 feet and 1092.5 feet.
Average depth to carbonates for the sites shown in
Figure 39 is approximately 6 feet. The range in depth to car
bonates varies from those calcareous at the surface to one
site at which carbonates are present at 13 feet.
In landscape positions that are slightly convex and
higher in elevation, the surficial soil is Tama, for example,
sites V and (H.4, 16.5) in Traverse A (Figure 38). The soil
solum at these sites grades downward into the oxidized and
leached weathering zone of the loess. On landscape positions
that at present are poorly drained, the soil solum merges with
the deoxidized and leached zone or the deoxidized and unleached
zone depending on solum thickness and depth to carbonates. An
imperfectly drained soil is not included in Traverse A. How
ever, at site Pal-2, the solum of the imperfectly drained
Muscatine soil overlies the deoxidized and leached zone at a
depth of 4 feet. In this respect, the Muscatine soil is simi
lar to the Garwin soil, which is poorly drained. However, in
the Garwin soil, solum characteristics, at least in part, may
have been inherited from the deoxidized weathering zone.
Chemical characteristics
Iron The weathering zones in the Wisconsin loess were
224
separated on the basis of differences in iron distribution,
color, and carbonate content. Total iron, free iron, and cal
cium carbonate equivalent of the weathering zones in the
Wisconsin loess at site S are listed in Table 23.
The deoxidized and leached zone at site S has a free iron
content of 1.1 percent iron and a total iron content of 2.6
percent iron. These samples are only of the matrix and do not
include the iron tubules which, as discussed previously, are
much higher in both total and free iron. Maximum content of
total iron (2.9 percent) in the loess at this site is in the
deoxidized and leached zone between 4 and 5 feet. In the
deoxidized and leached zone, between 5.8 and 14.0 feet, the
content of both total and free iron decreases as compared to
the deoxidized and leached zone. The minimum content of free
iron, 0.4 percent, is in the unoxidized and unleached basal
loess. The total iron content of this zone is approximately
the same as that present in the deoxidized and unleached zone.
Phosphorus The total phosphorus content of selected
samples representing the soil solum and weathering zones of
the Wisconsin loess at the Pal-1 site (Figure 34) were studied
to determine the variation in distribution of phosphorus with
depth. A plot of the total phosphorus, pH, calcium carbonate
equivalent, and weathering zone changes with depth is shown in
Figure 40. The data plotted are from Table 20a.
A minimum phosphorus content of 460 ppm occurs between 21
and 25 inches in the B horizon of the Tama solum. The pH of
Figure 40. Distribution of total phosphorus, pH, calcium carbonate equivalent, and weathering zones in Tama solum, Wisconsin loess, and Kansan till at site Pal-1
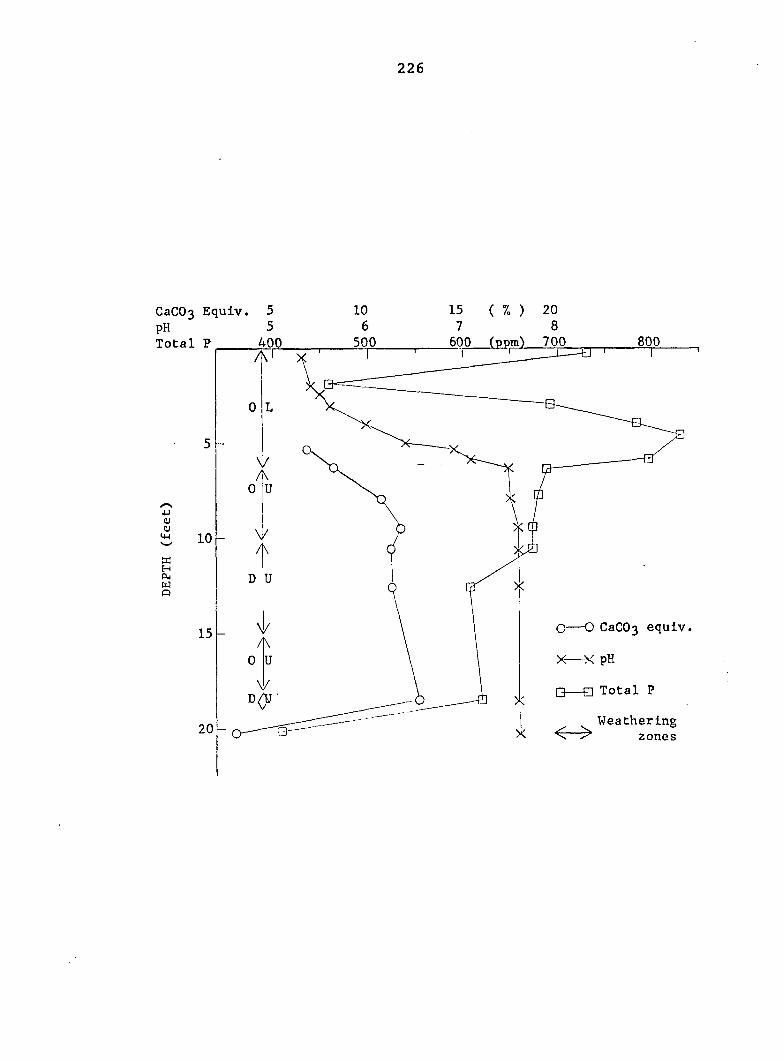
226
CaCOg Equiv
pH
Total P
OJ 0)
K h PL, w p
600 (ppm) 700
O—O CaCOg equiv.
X—X pH
•—• Total P
Weathering ^ ̂ zones
227
this horizon is 5.4. This value is 0.1 of a pH unit greater
than the minimum pH recorded in this soil profile. Below the
21 to 25 inch depth, the total phosphorus content increases to
a maximum value of 832 ppm between 4.3 and 5.0 feet in the
oxidized and leached zone beneath the soil solum. The pH of
the zone of maximum total phosphorus is 6.4. At a depth of
6.4 feet, the loess is oxidized and calcareous. The pH is 7.5
and the calcium carbonate equivalent is 8.3 percent. Total
phosphorus content decreases to 690 ppm. Below a depth of 6.4
feet and down to the Kansan till contact at 19.7 feet, there
is little variation in pH and calcium carbonate equivalent
values. However, within the deoxidized and unleached zone,
the total phosphorus content decreases from 674 ppm between
10.2 and 11.0 feet to 603 ppm between 12.1 and 13.0 feet.
The weathering zones of the loess change from oxidized
and unleached to deoxidized and unleached at 10.1 feet with no
significant change in pH, calcium carbonate equivalent or
total phosphorus. At a depth of 12.1 feet within the deoxi
dized and unleached zone, the phosphorus content decreases
from 674 ppm to 603 ppm. The zone between 12.1 and 13.0 feet
contains a small amount of sand which may be associated with
the decrease in total phosphorus. The total phosphorus con
tent of 410 ppm in the Kansan till between 19.7 and 20.6 feet
is less than the phosphorus value in the overlying loess.
228
Soils
Distribution and correlation of soil mapping units
A soil map of the SW^ of section 29, T87N, R17W in the
Palermo area is shown in Figure 41. An explanation of the
symbols used is given on the facing page of the map. The soil
units, their correlation with recognized series, their parent
material and higher category great soil group classification
(Baldwin et ̂ ., 1938, p. 993-1001) are listed in Table 27.
The term "soil unit" as used here designates either a soil
series or a phase of a soil series.
Sites Pal-1, Pal-2, and Pal-3 were described and sampled
to characterize the dominant soil units in the Palermo area.
The location of these sites, (B.2, 18.7), (E.8, 17.3) and
(J.O, 1.8) are shown in Figure 34. Morphological descriptions
are in Appendix B. The soil at the Pal-1 site is within the
range of soil unit la, correlated as Tama silty clay loam
(Table 27). At the Pal-2 site, the soil is within the range
of soil unit 2, correlated as Muscatine silty clay loam (Table
27). The soil at the Pal-3 site is included within the range
of soil unit 3, correlated as Garwin silty clay loam. The
Pal-1 profile was analyzed in detail to provide comparison
with other well to moderately well drained loess derived soils
of other geomorphic surfaces of the Geneseo area. In addition,
the Pal-1, Pal-2, and Pal-3 sites were sampled to the depth of
the underlying till to characterize the weathering zones of
the loess at these sites.

Figure 41. Distribution of soil mapping units in the SW^, section 29, T87N, R17W, Grundy County, Iowa
Each delineation on the map is identified by three numbers, for example, 3-1-2. The first number identifies the soil unit (Table 27). The second number represents the slope number which indicates a slope gradient range, differing for different groups of soils as listed below. The third number represents surface thickness as listed below.
Soil units
1, la, 2
Slope number Slope gradient range
1-3
3, 3c, 6, 194
15
1
1
0 -2
0-1
Surface thickness number
0
1
2
Surface thickness^ Cinches )
>24
18-24
12-18
^The surface is here defined as those horizons with moist Munsell color values of 3.5 or less and chromas of 2 or less.
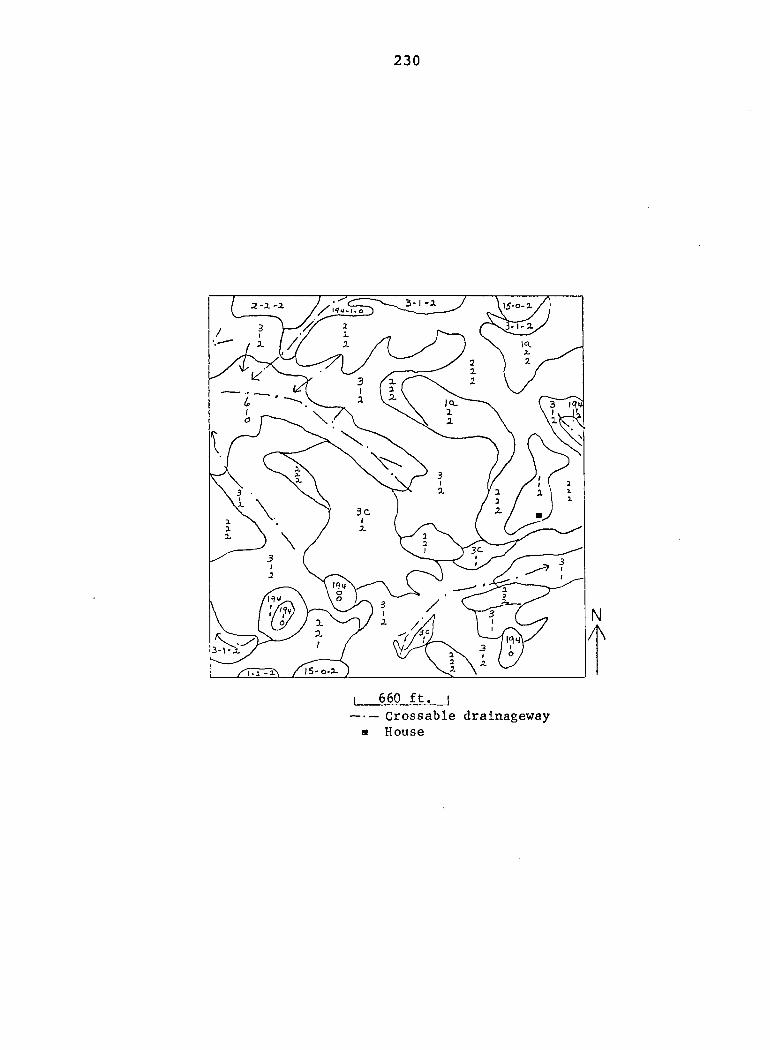
230
7~T^ /''11'
3-1 -a 2 -X -1
3C
I 660 ft. I
Crossable drainageway
• House
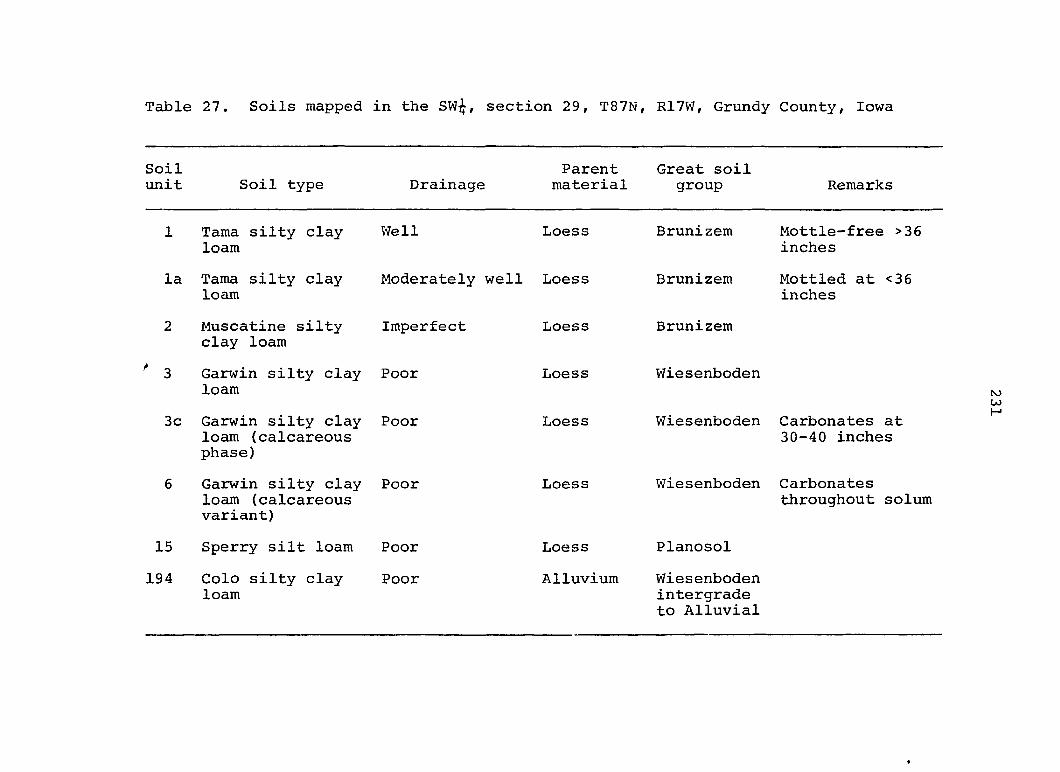
Table 27. Soils mapped in the SW^, section 29, T87N, R17W, Grundy County, Iowa
Soil unit Soil type Drainage
Parent material
Great soil group Remarks
1 Tama silty clay loam
la Tama silty clay loam
2 Muscatine silty clay loam
Well Loess
Moderately well Loess
Imperfect
3 Garwin silty clay Poor loam
3c Garwin silty clay Poor loam (calcareous phase)
6 Garwin silty clay Poor loam (calcareous variant)
15 Sperry silt loam Poor
194 Colo silty clay Poor loam
Loess
Loess
Loess
Loess
Loess
Alluvium
Mottle-free >36 inches
Mottled at <36 inches
Brunizem
Brunizem
Brum zem
Wiesenboden
Wiesenboden Carbonates at 30-40 inches
Wiesenboden Carbonates throughout solum
Planosol
Wiesenboden intergrade to Alluvial
232
Examination of the contour map (Figure 34) reveals a sur
face of low relief and closed depressions. The imperfectly
drained and poorly drained soils, Muscatine and Garwin, pre
dominate on the landscape (Figure 41). A slight change in the
microrelief is correlated with an impressive change in soil
morphology as evidenced by a comparison of the contour and
soil maps (Figures 34 and 41). The slight rises in the land
scape have soils with well or imperfectly drained profiles.
This relationship is also illustrated in the traverse shown in
Figure 38.
Characteristics of soils on upland-summit surface
Laboratory data for sites Pal-1, Pal-2, and Pal-3 are
recorded in Tables 20a, 20b, 21a, 21b, 22a, and 22b.
Particle-size distribution The percent sand and per
cent clay of the Tama, Muscatine and Garwin soils located at
sites Pal-1, Pal-2, and Pal-3 are plotted in Figure 42. In
these three soils, sand content is less than 3 percent to a
depth of 50 inches. Clay content of the surface horizon
ranges from 29.2 percent in the Tama soil to 33.3 percent in
the Garwin soil. The Muscatine soil has 30.2 percent clay in
the surface horizon. The Garwin soil is highest in clay con
tent to a depth of 30 inches. Below this depth, the Garwin
soil grades to a silt loam texture at a shallower depth than
the Muscatine and Tama soils. Clay content of the Muscatine
soil is slightly higher than the Tama soil in the surface

Figure 42. Particle-size distribution in Tama, Muscatine, and Garwin soils at sites Pal-1, Pal-2, and Pal-3, respectively (data from Tables 20a, 21a, and 22a)
Figure 43. Organic carbon distribution in Tama, Muscatine, and Garwin soils at sites Pal-1, Pal-2, and Pal-3, respectively (data from Tables 20b, 21b, and 22b)
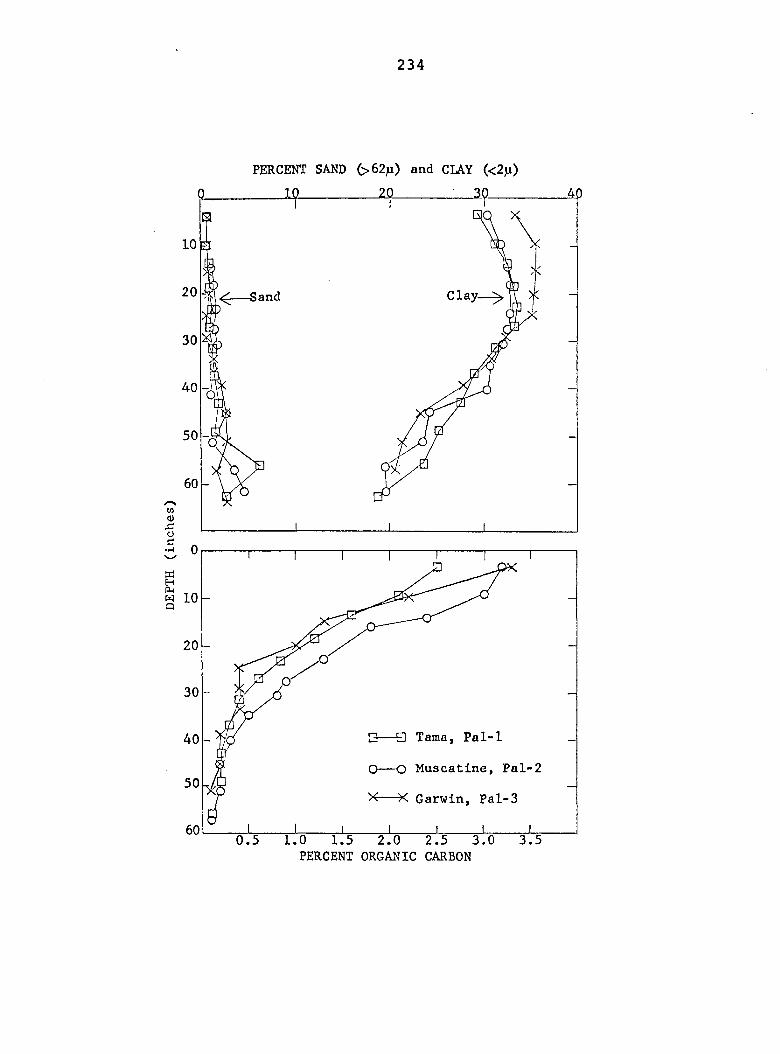
234
PERCENT SAND (>62|i) and CLAY (<2p)
20.
20 Sand
30
40
M 10
20
•—• Tama, Pal-1
O—O Muscatine, Pal-2 50
X X Garwin, Pal-3
0.5 0 1.5 2.0 2.5
PERCENT ORGANIC CARBON
235
horizon, but is slightly lower in the horizon of maximum clay
content. The ratio of maximum percent clay in the B horizon
to minimum percent clay in the A horizon (B/A clay ratios) is
1.16 in Tama, 1.09 in Muscatine and 1.07 in Garwin.
Organic carbon The distribution of organic carbon for
the same three soils is shown in Figure 43. Maximum percent
organic carbon present is 3.3 percent in the surface of the
Garwin soil. However, below the surface horizon the Muscatine
soil has a higher content of organic carbon than the other
soils.
The Tama soil has a lower organic carbon content in the
surface horizon than either the Muscatine or Garwin soils.
Below the surface horizon, distribution of organic carbon is
not greatly different in the Tama and Garwin soils sampled in
this area, but the amount of organic carbon in the B horizon
is slightly less in the Garwin soil. The depth to <0.5 per
cent organic carbon is 29 inches in the Tama soil, 32 inches
in the Muscatine soil and 22 inches in the Garwin soil. At a
depth of 56 inches, organic carbon content is 0.1 percent or
less in these three soils.
Cation-exchange capacity Cation-exchange capacities
of the Tama, Muscatine and Garwin soils sampled were deter
mined by summation of the total exchangeable bases and
exchangeable hydrogen. The values obtained are plotted in
Figure 44. The Garwin soil has the highest cation-exchange
capacity among these soils. The exchange capacity is 40.6
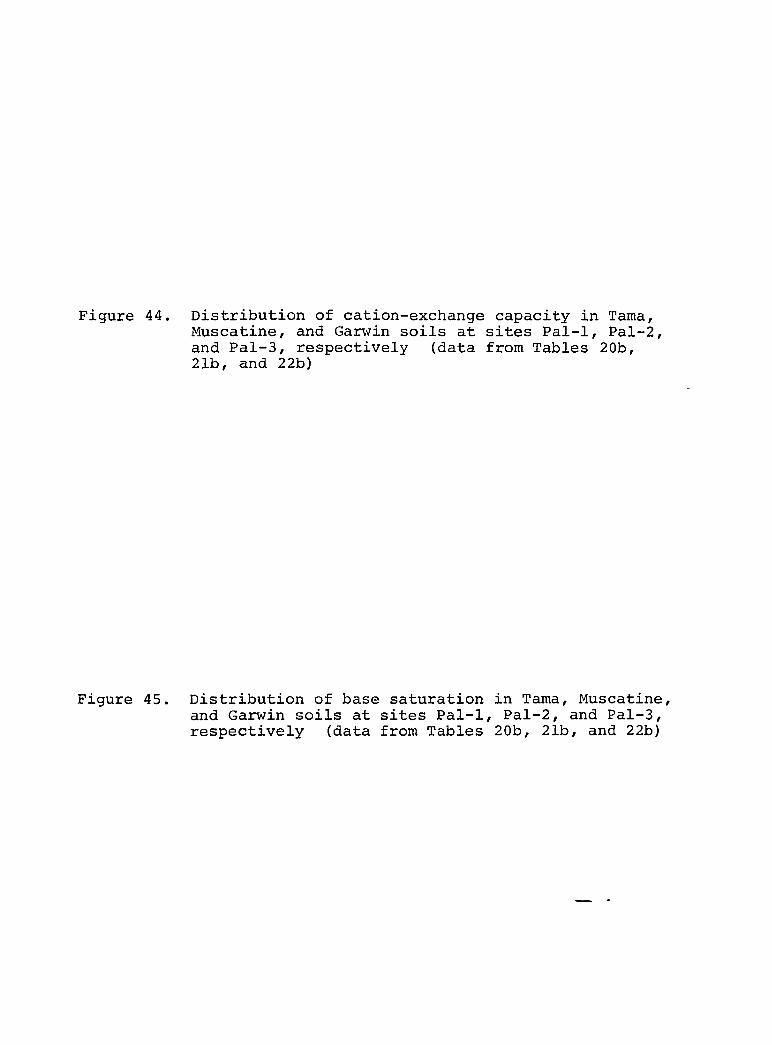
Figure 44. Distribution of cation-exchange capacity in Tama, Muscatine, and Garvin soils at sites Pal-1, Pal-2, and Pal-3, respectively (data from Tables 20b, 21b, and 22b)
Figure 45. Distribution of base saturation in Tama, Muscatine, and Garwin soils at sites Pal-1, Pal-2, and Pal-3, respectively (data from Tables 20b, 21b, and 22b)

237
CATION EXCHANGE CAPACITY (M.E./lOO gm.)
20
20
30
Q a Tama, Pal-1
O—O Muscatine, Pal-2 50
X—X Garwin, Pal-3 CO <D x: o c •H
g w a
20
30
40
50
70 80 90 100 PERCENT BASE SATURATION
238
M.E./lOO gm. in the surface horizon and decreases with depth.
The higher cation-exchange capacity of the Garwin soil may be
due to differences in the amount and/or type of clay and/or
type of organic matter when compared to the Muscatine profile
of similar or higher organic carbon content. Maximum values
of cation-exchange capacities within each profile are in the
surface horizon of the Muscatine and Garwin soils. Maximum
value in the moderately well drained Tama soil is slightly
below 30 inches and is in the B horizon. Slightly below 30
inches, the values of cation-exchange capacities for these
three soils are within a range of 1 milliequivalent. However,
this value represents the maximum exchange capacity for the
Tama soil, but is well below the maximum exchange capacities
of the Muscatine and Garwin soils.
Percent base saturation The percent base saturation
for these soils is shown in Figure 45. The Gairwin soil has a
base saturation of greater than 90 percent throughout the pro
file. The Tama and Muscatine soils have similar base
saturation values in the upper solum. In the surface horizon,
the Muscatine soil has a base saturation of 72.9 percent and
the Tama soil is 70.0 percent base saturated. The base satura
tion values are quite similar to a depth of 30 inches.
However, the Muscatine soil has 90 percent base saturation at
a depth of 34 inches and the Tama soil has 90 percent base
saturation below a depth of 46 inches.
Organic and total phosphorus Organic and total
239
phosphorus distributions of the Tama and Garwin soils are
plotted in Figure 46. The Tama soil has a higher organic
phosphorus content to a depth of 35 inches. The values of the
surface horizons of these two soils are within a range of 20
ppm. However, below the surface to a depth of 35 inches, the
differences are greater than 20 ppm. Total phosphorus amount
and distribution is quite similar in these two soils. However,
the Garwin profile has a slightly higher content in the sur
face. The total phosphorus minimum of 460 ppm is at a depth
of 21 to 25 inches in the Tama profile. Minimum value in the
Garwin profile is 513 ppm and is at a depth of 18 to 27 inches.
However, the minimum value of the inorganic phosphorus, that
is the difference between the total and organic, is at a depth
of 7 to 12 inches in the Garwin profile as compared to a depth
of 11 to 16 inches in the Tama profile.
Nonexchangeable magnesium of <lu clay fraction The
distribution of nonexchangeable magnesium of the <ly clay
fraction for the Tama and Garwin soils sampled at the Pal-1
and Pal-3 sites is shown in Figure 47. The magnesium content
of the surface horizon of the Tama soil is 1.04 percent and
that of the Garwin profile 1.06 percent. With increasing
depth, the magnesium content increases gradually in a
diffusion-like distribution. The Garwin soil has slightly
higher magnesium values throughout the profile. Distribution
of magnesium is similar to a depth of 27 inches, but below
this depth greater differences are present between the two
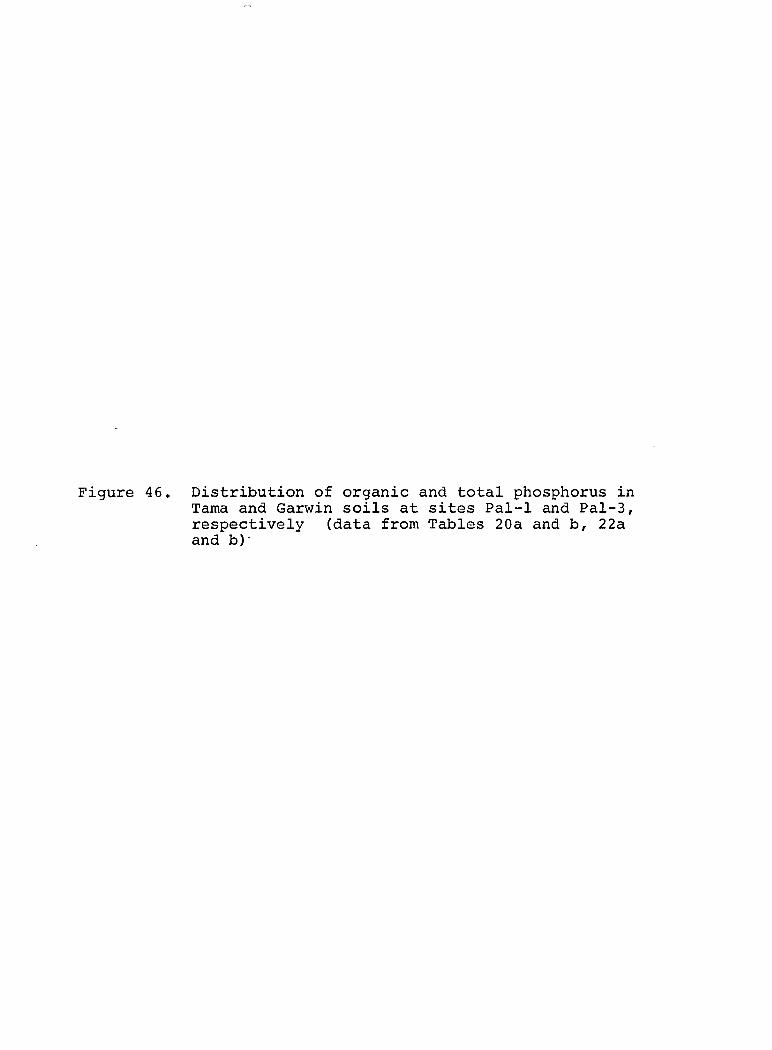
Figure 46. Distribution of organic and total phosphorus in Tama and Garwin soils at sites Pal-1 and Pal-3, respectively (data from Tables 20a and b, 22a and b)
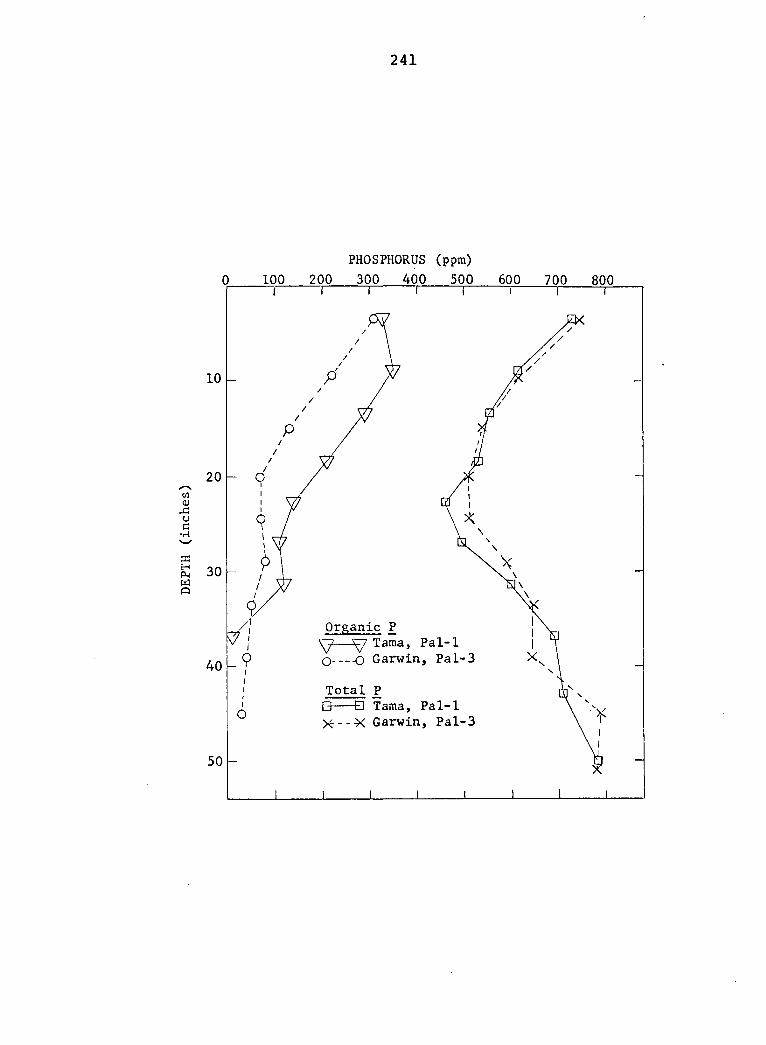
241
PHOSPHORUS (ppm)
100 200 300 400 500 600 700 800
20 CO (U o c
•1-1
a g 30 w o
Organic P ^ Tama, Pal-1
0----0 Garwin, Pal-3 40
Total P • • Tama, Pal-1
X - - X G a r w i n , P a l - 3
50
Figure 47. Distribution of nonexchangeable potassium and magnesium in <lp clay of Tama and Garwin soils at sites Pal-1 and Pal-3, respectively (data from Tables 20b and 22b)
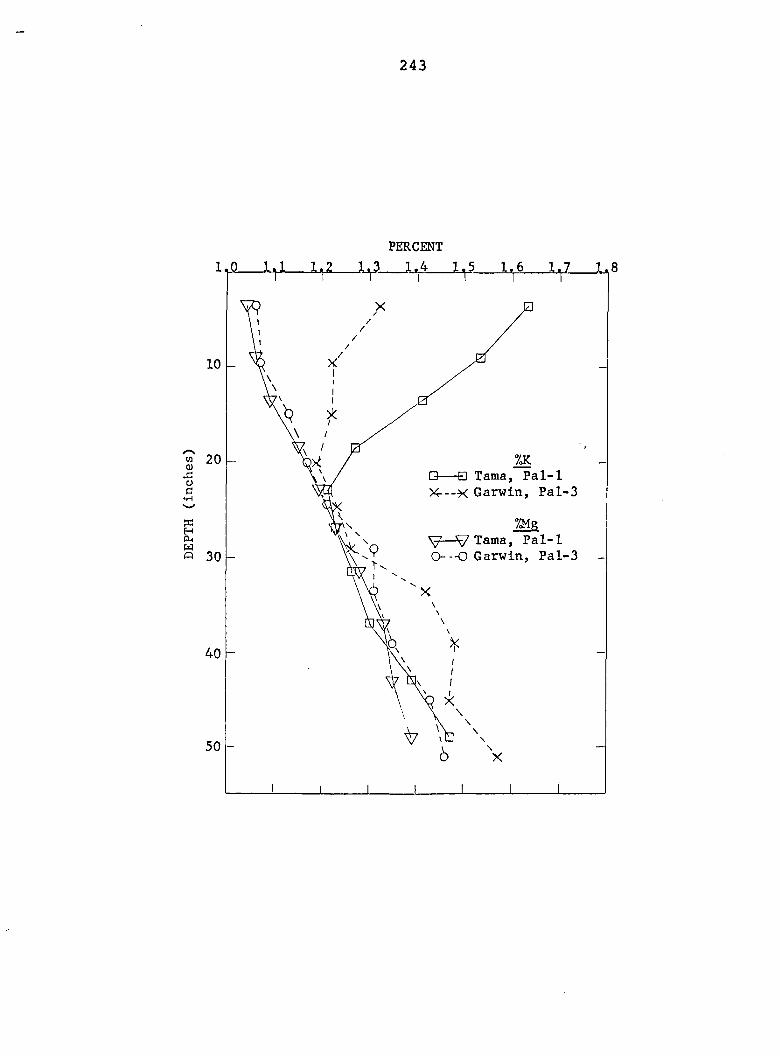
243
PERCENT
10
20 % • S Tama, Pa 1-1
X---X Garwin, Pal-3
'Ms. —VTama, Pal-1
O—O Garwin, Pal-3 30
40
50
244
soils than in the upper part of the profile. Maximum value
in the Garwin profile to the depth studied is 1.46 percent.
In the Tama profile the maximum value recorded at approxi
mately the same depth is 1.39 percent.
Nonexchangeable potassium of the <ly clay fraction
The distribution of nonexchangeable potassium of the Tama and
Garwin soils is plotted in Figure 47. The surface horizons of
the Tama and Garwin soils have potassium contents of 1.63 per
cent and 1.32 percent, respectively. Minimum values of
potassium in both soils are located in the B horizon. The
1.19 percent value of the Garwin soil is slightly less than
the 1.21 percent value of the Tama soil. The decrease from
the surface to the minimum content in the B horizon is much
greater in the moderately well drained Tama soil. However,
the depth to the minimum potassium content is greatest in the
poorly drained Garwin soil. Differences in potassium content
between the two soils are much greater than the difference in
magnesium content.
Summary
The dominant soil units in the Palermo area are la, 2,
and 3. These soil units are correlated as Tama silty clay
loam, Muscatine silty clay loam, and Garwin silty clay loam,
respectively. The Garwin soil analyzed has a higher clay con
tent than the Tama and Muscatine soils to a depth of 30
inches. The Garwin soil also has a greater cation-exchange
245
capacity and a higher base saturation than the Tama and
Muscatine soils. Organic carbon content of the Garwin soil
is higher in the surface horizon and decreases more abruptly
with depth than in the Tama soil. They are both lower in
organic carbon than the Muscatine soil. Total phosphorus
distribution is quite similar in the Tama and Garwin soils.
Organic phosphorus content, however, is greater in the Tama
soil. Nonexchangeable magnesium distribution of the <ln clay
of the Tama and Garwin soils is quite similar. In the upper
solum, the poorly drained Garwin soil has a lower content of
nonexchangeable potassium in the <lp clay than the Tama soil.
However, in the lower solum, the Garwin soil has a greater
content of nonexchangeable potassium. Other selected charac
teristics of the Tama, Muscatine, and Garwin soils are
summarized in Table 28.
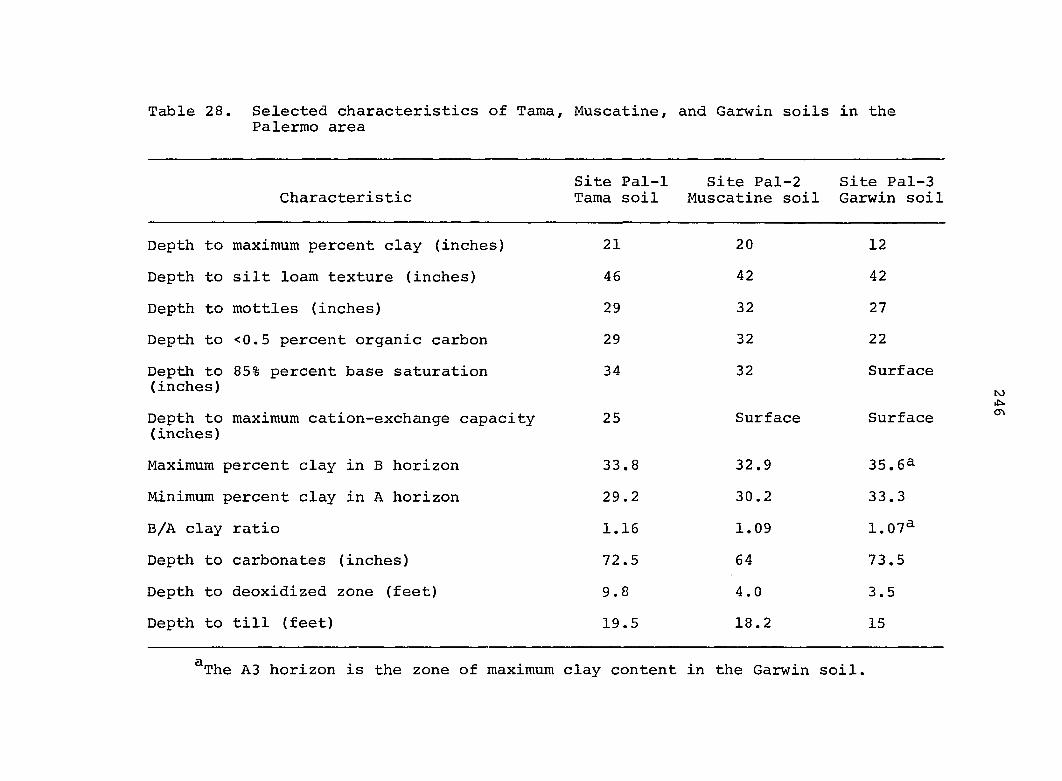
Table 28. Selected characteristics of Tama, Muscatine, and Garwin soils in the Palermo area
Characteristic Site Pal-1 Tama soil
Site Pal-2 Muscatine soil
Site Pal-3 Garwin soil
Depth to maximum percent clay (inches) 21 20 12
Depth to silt loam texture (inches) 46 42 42
Depth to mottles (inches) 29 32 27
Depth to <0.5 percent organic carbon 29 32 22
Depth to (inches)
85% percent base saturation 34 32 Surface
Depth to (inches)
maximum cation-exchange capacity 25 Surface Surface
Maximum percent clay in B horizon 33.8 32.9 35.65
Minimum percent clay in A horizon 29.2 30.2 33.3
B/A clay ratio 1.16 1.09 1.07a
Depth to carbonates (inches) 72.5 64 73.5
Depth to deoxidized zone (feet) 9.8 4.0 3.5
Depth to till (feet) 19.5 18.2 15
^The A3 horizon is the zone of maximum clay content in the Garwin soil.
247
DISCUSSION
An objective of this study was to better understand the
relationship among landscapes, weathering zones, and soils.
In the following paragraphs, results obtained in the present
study will be discussed in an attempt to explain these
relationships.
Properties of Tama Soils on Different Landscape Levels
The variation in landscape levels on which the Tama soils
included in the present study were sampled is shown schema
tically in Figure 48. The stepped levels of the buried land
scape are heterogeneous in properties and age. On different
levels of the buried landscape, in materials immediately
beneath the loess, the range is from clay-textured Yarmouth-
Sangamon paleosols to loam-textured glacial till. The buried
surfaces range in age from Yarmouth-Sangamon to Tazewell. The
thickness of the overlying loess varies with the age of the
buried surfaces. As a result of the variation in properties
and age of the buried surfaces, it might be expected that the
land surface soils on different landscape levels would also
have a wide range in properties.
Jenny (1941, p. 15) postulated that climate, organisms,
topography, parent material, and time are the independent
variables that define the soil system. Theoretically, for a
given combination of the above variables, only one kind of
Figure 48. Schematic representation of different landscape levels on which Tama soils were sampled
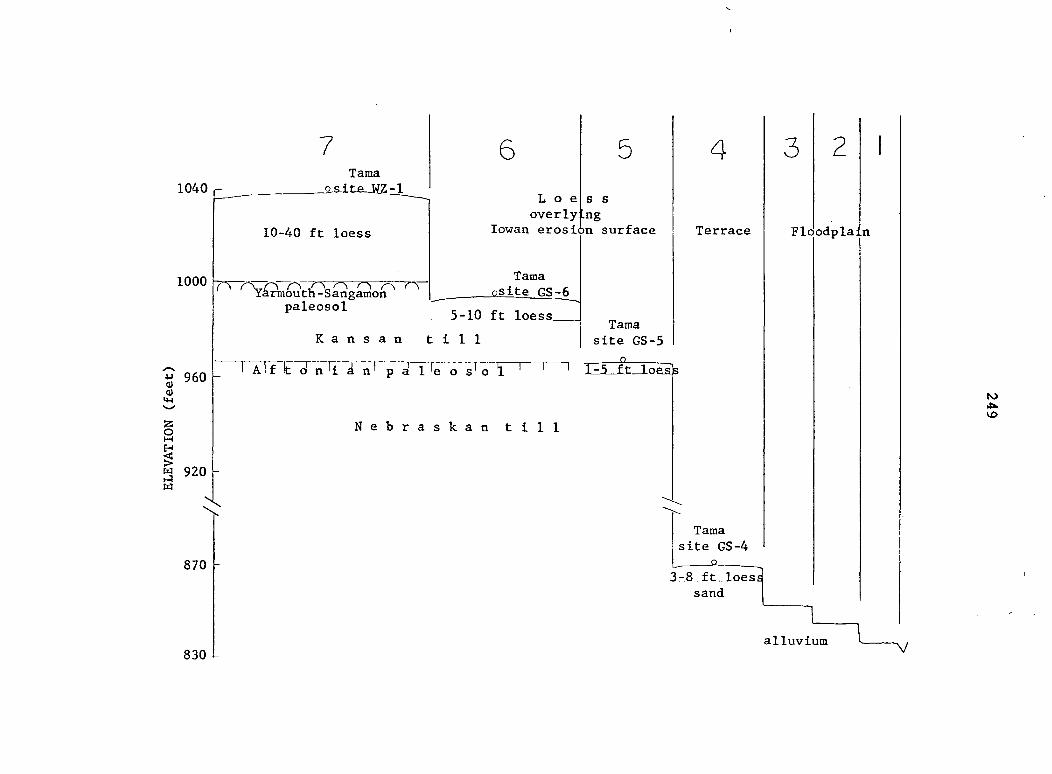
7 1040 -
Tama
_as-ite-JiZ -1
6
10-40 ft loess
1000 ^ rmouth-Sangamon
paleosol
5
L o e s s
overly Lng lowan erosion surface
Tama osite nS-6
5-10 ft loess_
K a n s a n t i l l Tama
site GS-5
n
4
Terrace
« 960 0) (+4
S
s W 920 M M
A l f t n " ^ ~ â n ' p a 1 ' e ( i s ' o Î ' ' E U f t Z î o ë à b
N e b r a s k a n t i l l
870
Tama
site GS-4 Q
3 2
Flo odplaln
3-8_f t^Loess
sand
830 L alluvium
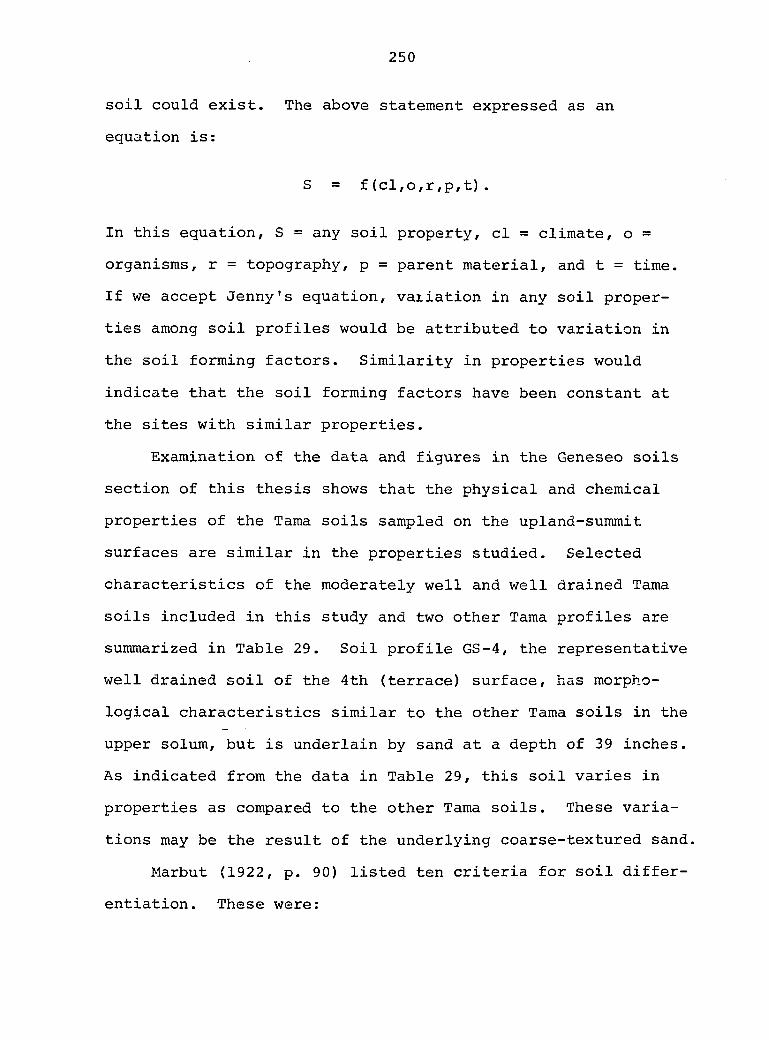
250
soil could exist. The above statement expressed as an
equation is:
S = f(cl,o,r,p,t).
In this equation, S = any soil property, cl = climate, o =
organisms, r = topography, p = parent material, and t = time.
If we accept Jenny's equation, variation in any soil proper
ties among soil profiles would be attributed to variation in
the soil forming factors. Similarity in properties would
indicate that the soil forming factors have been constant at
the sites with similar properties.
Examination of the data and figures in the Geneseo soils
section of this thesis shows that the physical and chemical
properties of the Tama soils sampled on the upland-summit
surfaces are similar in the properties studied. Selected
characteristics of the moderately well and well drained Tama
soils included in this study and two other Tama profiles are
summarized in Table 29. Soil profile GS-4, the representative
well drained soil of the 4th (terrace) surface, has morpho
logical characteristics similar to the other Tama soils in the
upper solum, but is underlain by sand at a depth of 39 inches.
As indicated from the data in Table 29, this soil varies in
properties as compared to the other Tama soils. These varia
tions may be the result of the underlying coarse-textured sand.
Marbut (1922, p. 90) listed ten criteria for soil differ
entiation. These were:
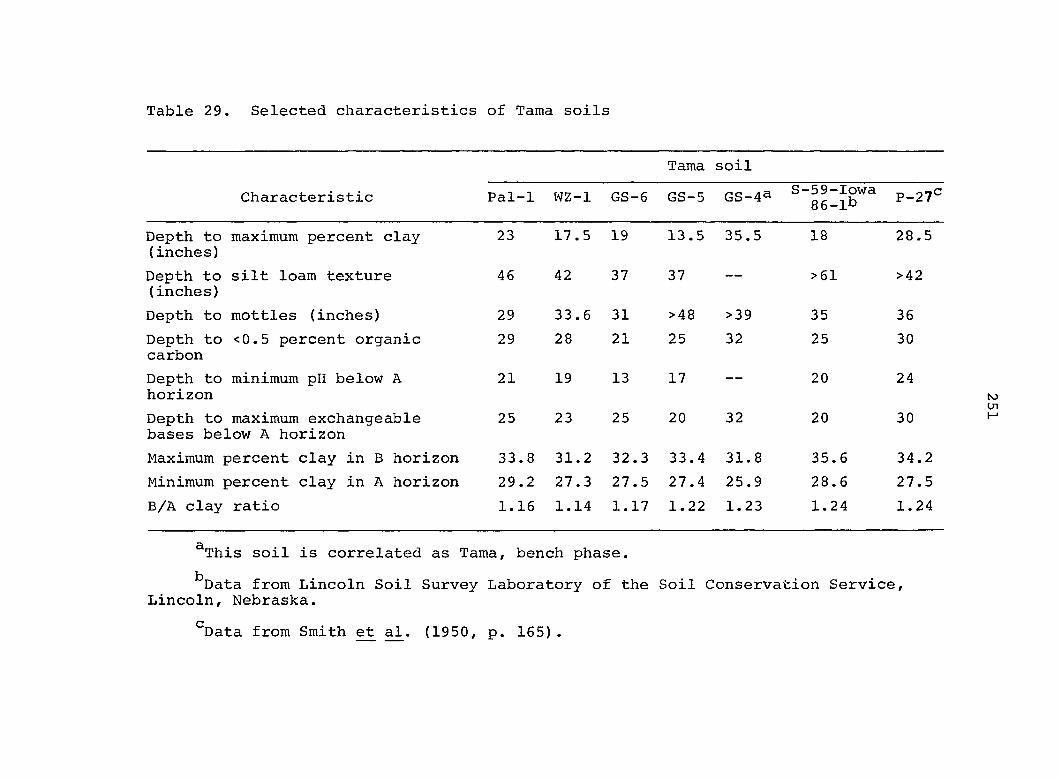
Table 29. Selected characteristics of Tama soils
Tama soil
Characteristic Pal -1 WZ-1 GS -6 GS-5 GS-4^ S-59-Iowa 86-lb
P-27C
Depth to (inches)
maximum percent clay 23 17.5 19 13.5 35.5 18 28.5
Depth to (inches)
silt loam texture 46 42 37 37 >61 >42
Depth to mottles (inches) 29 33.6 31 >48 >39 35 36
Depth to carbon
<0.5 percent organic 29 28 21 25 32 25 30
Depth to horizon
minimum pH below A 21 19 13 17 20 24
Depth to maximum exchangeable bases below A horizon
25 23 25 20 32 20 30
Maximum percent clay in B horizon 33 .8 31.2 32 .3 33.4 31.8 35.6 34.2
Minimum percent clay in A horizon 29 .2 27.3 27 .5 27.4 25.9 28.6 27.5
B/A clay ratio 1. 16 1.14 1. 17 1.22 1.23 1.24 1.24
^This soil is correlated as Tama, bench phase.
^Data from Lincoln Soil Survey Laboratory of the Soil Conservation Service, Lincoln, Nebraska.
*^Data from Smith et al. (1950, p. 165) .
252
(1) Number of horizons in the soil profile (2) Color of the various horizons, with
special emphasis on the surface one or two
(3) Texture of the horizons (4) Structure of the horizons (5) Relative arrangement of the horizons (6) Chemical composition of the horizons (7) Thickness of the horizons (8) The thickness of the true soil (9) The character of the soil material (10) The geology of the soil material
Chemical composition as a soil differentia has centered mainly
around the exchange characteristics of the soil for the last
several decades. However, more rapid methods are not avail
able for total chemical analysis of the total soil or various
fractions of the soil.
Total phosphorus, nonexchangeable magnesium and potassium
of the <l)j clay fraction of three upland Tama soils, located
at sites WZ-1, GS-5, and Pal-1, were determined. These soils
were thought to represent the widest range in properties of
the upland Tama soils sampled. Inspection of the plots of
these elements (Figures 23, 24, and 25) shows a high degree of
uniformity in these properties, not only in distribution with
depth, but also in content. The minimum contents of total
phosphorus, nonexchangeable potassium, and nonexchangeable
magnesium of the horizons of minimum phosphorus and potassium
content are listed in Table 30. These values illustrate the
similarity in properties among the three soils.
A key factor in the similarity of the soils on the differ
ent landscape levels is the nature of the parent material.
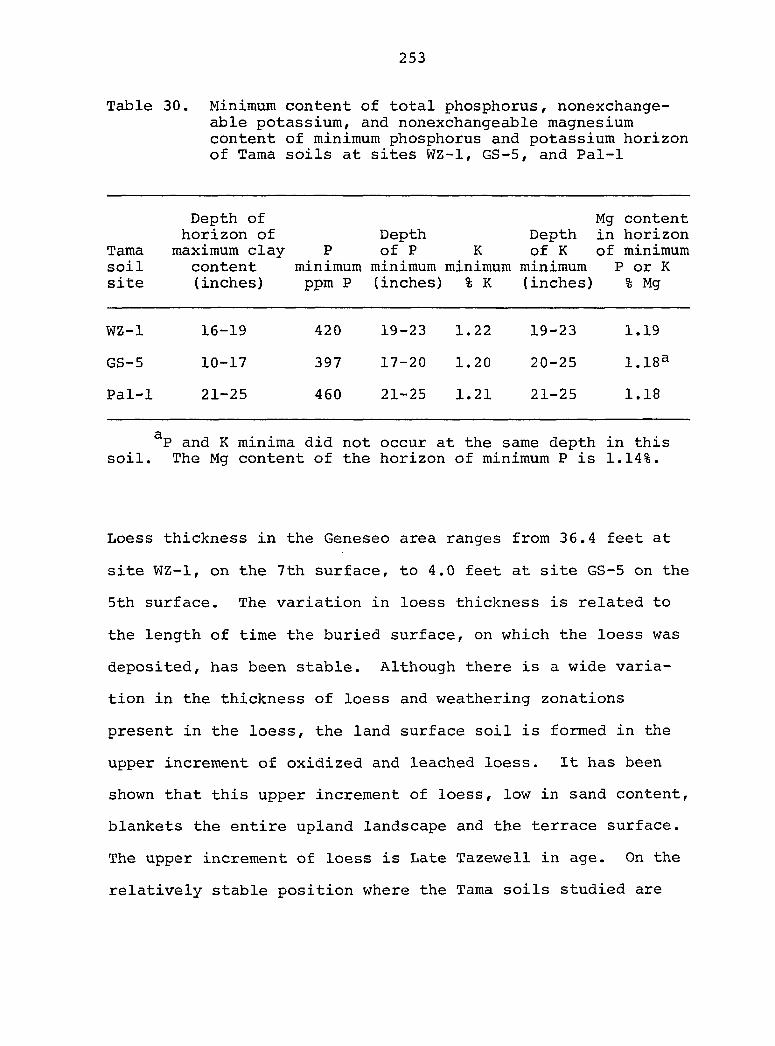
253
Table 30. Minimum content of total phosphorus, nonexchange-able potassium, and nonexchangeable magnesium content of minimum phosphorus and potassium horizon of Tama soils at sites WZ-1, GS-5, and Pal-1
Depth of Mg content horizon of Depth Depth in horizon
Tama maximum clay P of P K of K of minimum soil content minimum minimum minimum minimum P or K site (inches) ppm P (inches) % K (inches) % Mg
WZ-1 16-19 420 19-23 1.22 19-23 1.19
GS-5 10-17 397 17-20 1.20 20-25 1.183
Pal-1 21-25 460 21-25 1.21 21-25 1.18
^P and K minima did not occur at the same depth in this soil. The Mg content of the horizon of minimum P is 1.14%.
Loess thickness in the Geneseo area ranges from 36.4 feet at
site WZ-1, on the 7th surface, to 4.0 feet at site GS-5 on the
5th surface. The variation in loess thickness is related to
the length of time the buried surface, on which the loess was
deposited, has been stable. Although there is a wide varia
tion in the thickness of loess and weathering zonations
present in the loess, the land surface soil is formed in the
upper increment of oxidized and leached loess. It has been
shown that this upper increment of loess, low in sand content,
blankets the entire upland landscape and the terrace surface.
The upper increment of loess is Late Tazewell in age. On the
relatively stable position where the Tama soils studied are
254
located, it is assumed that the time of soil formation dates
from the end of loess deposition in Iowa, approximately 14,000
years before present (Ruhe and Scholtes, 1957).
Therefore, the soil forming factors of time and parent
material are constants for these soils. Also, these soils
occur on slightly convex upland-summit surfaces and so topo
graphy is a constant. If we accept Jenny's equation, the
similarity of the properties indicates that the remaining two
soil forming factors, climate and organisms, are also con
stants among these soils. This does not imply that there have
been no variations in the climatic and/or organism factors
during soil formation. However, if variations did occur, they
had the same effects at these three sites.
Soils on Slopes
The characteristics of the soils formed on the upland-
summit surfaces in the Geneseo area are uniform regardless of
the thickness of the underlying loess or the weathering zona-
tion present in the loess. However, the characteristics of
the sloping soils associated with the upland-summit surfaces,
in many cases, are related to the stratigraphy of the loess
and the weathering zones present in the loess. For example,
the high sand content of the soil solum at site WZ-2 and more
generally in soil unit 85 is related to a zone of increased
sand content in the loess. At site WZ-1, located on an
upland-summit surface, the same strata are buried by 5.5 feet
255
of loess, low in sand content. However, on the less stable
landscape positions, as at site WZ-2, the slope has beveled
the sand strata and they outcrop on the present land surface.
An example of the influence of weathering zones on soil
characteristics is shown in the soil profile at site WZ-3.
This site is located on a landscape position that presently is
well drained. However, morphological characteristics, such as
gray color and segregated iron in the lower solum, suggest
conditions of poor drainage. Detailed tracing reveals that
these features are related to a relict deoxidized zone in the
Wisconsin loess and are not related to the present drainage
condition of this site.
Thus, in areas where the loess is relatively thick, inter-
bedded with sand, and has weathering zones present, the soil
pattern on the slopes may be quite complex. However, the soil
pattern on the slopes is more predictable and understandable
with a knowledge of the stratigraphy and weathering zonation
beneath the most stable part of the summits from which the
slopes descend.
On the lower landscape in the Geneseo area, for example
the 6th surface, the loess thins and many of the soils have
sola formed from both loess and glacial till. Again, these
variations are best understood by observations which begin on
the summit.
256
Soil Profiles and Weathering Profiles
The soil profile (U.S. Soil Survey Staff, 1951, p. 173)
includes the collection of all the genetic horizons, the
natural organic layers on the surface, and the parent material
or other layer beneath the solum that influences the genesis
and behavior of the soil. The weathering profile, the concept
of which was developed by Kay (1916a), is defined as the
succession of layers (or zones) of unconsolidated material
that differ physically and chemically from the subjacent
unaltered material from which it has been produced by weather
ing. The solum and soil may be considered as the uppermost
part of the weathering profile. Some investigators, for
example Leighton and MacClintock (19 62), stress the importance
of recognizing the proper distinction between a profile of
weathering and a soil profile. In actual practice, however,
the distinction is not clear cut. Soil and its lower boundary
with "not soil" is the vague lower limit of common rooting of
the dominant native perennial plants or the vague lower limit
of the genetic horizons, whichever is deeper (U.S. Soil Survey
Staff, 1960, p. 1).
In the present study, it was not attempted to separate
the boundary between soil and "not soil". Rather, the base of
the soil solum was determined using soil properties, such as
structure, color and texture. The soil solum in the soils
studied is considered to be equivalent to the A and B horizons.
The material beneath the solum was described using weathering
257
zone terminology. This procedure is satisfactory. However,
in the case of poorly drained soils such as Garwin, the gleyed
B horizon merges imperceptibly with the deoxidized weathering
zone. In fact, the solum may have formed in the deoxidized
weathering zone.
The present soil classification system (U.S. Soil Survey
Staff, 1961) is largely solum oriented and relies heavily on
the presence or absence of diagnostic horizons most of which
are located within the solum. Classification criteria, or
more specifically series criteria, based only on solum charac
teristics imply that in Iowa and the Midwest generally, depth
of study for classification purposes need seldom exceed 4 to
5 feet.
Study of soil properties to depths of only 4 or 5 feet
may be adequate to place soils in different categories in the
present classification system. However, it is questionable
that this approach results in a better understanding of the
soil, including the differences among soils and the reasons
for these differences. As pointed out by the U.S. Soil Survey
Staff (1961, p. 30), solum is not a synonym for soil, which
often includes or even consists of C horizon material.
Recent studies, such as those by Glenn e^ al. (1960),
Brophy (1959), and Droste and Tharin (1958), indicate that a
better understanding of alterations occuring in the solum is
aided by the study of material well beneath the solum and into
the lower geological weathering zone. The total phosphorus
258
distribution of the WZ-1 and Pal-1 profiles of this study
(Figure 49) is perhaps an example of alteration beneath the
limits of the solum. At site WZ-1, the base of the solum is
at 54 inches and in the Pal-1 profile, at 46 inches. However,
to a depth of approximately 8 feet, the total phosphorus con
tent of the Pal-1 profile is greater, but distribution with
depth is similar in both profiles. Both profiles have an
apparent zone of depletion from the surface down to approxi
mately 40 inches. Below this depth and extending to
approximately 6.5 feet is a zone of accumulation. The samples
in the WZ-1 profile, 6.6 to 7.3 feet and 7.3 to 8.0 feet,
decrease greatly in total phosphorus content. In the WZ-1
profile, this area of decrease coincides with a zone of high
sand content. However, the Pal-1 profile also decreases at
approximately the same depth with no change in particle-size
distribution (Table 20a) . The decrease does coincide with the
top of the unleached zone in profile Pal-1 but not in profile
WZ-1 in which carbonates are at 9.8 feet. Thus the decrease
is apparently not related to the presence of carbonates or to
a textural change. Beneath this depth in profile Pal-1 a
further decrease was recorded. However, in profile WZ-1 the
total phosphorus content reaches a second maximum between 9
and 11 feet and then decreases to approximately the same value
as in profile Pal-1. Thus, the phosphorus content of the
little altered parent material underlying the soil solum is
about 600 ppm. The sample of leached Kansan till in profile

Figure 49. Depth distribution of total phosphorus in profiles WZ-1 and Pal-1 (data from Tables 2a and 20a)
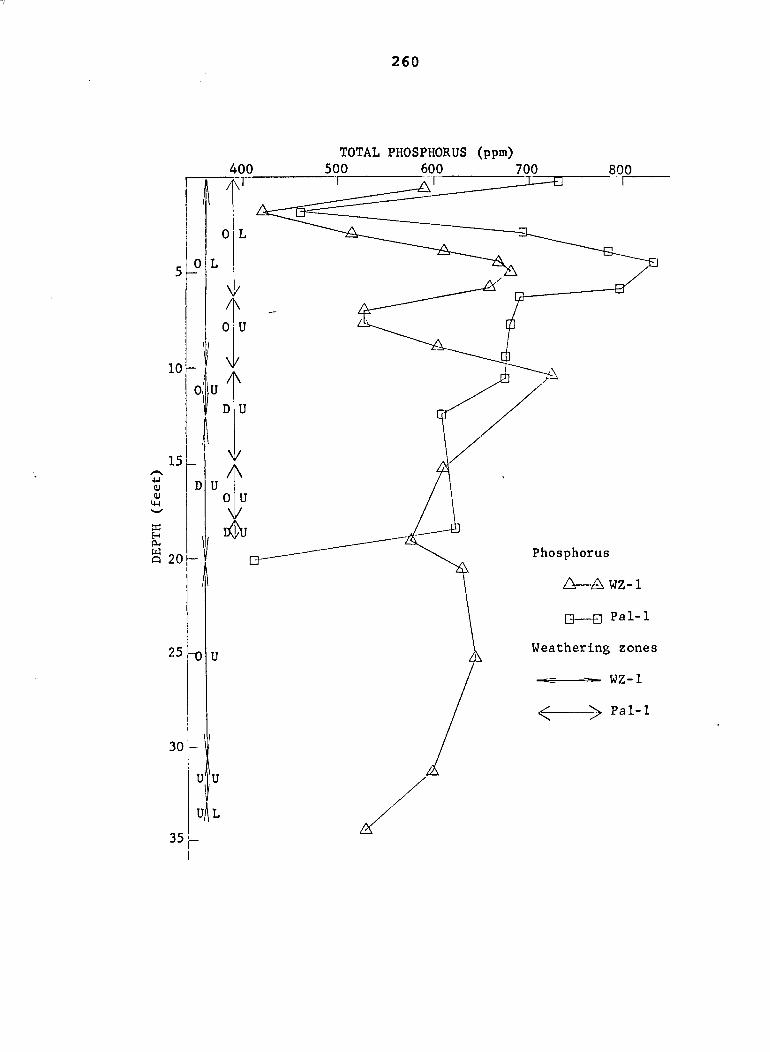
260
TOTAL PHOSPHORUS (ppm)
400 500 600 700 800
Phosphorus o 20
Weathering zones -0
WZ-1
^ Pal-1
261
Pal-1 has a lower total phosphorus content than the overlying
loess.
With increasing depth in profile WZ-1 there are no great
changes in the total phosphorus content from 15 to 33 feet.
However, within this depth range there are slight variations
that may be associated with the weathering zones. There is a
slight decrease in the deoxidized and leached zone, a slight
increase in the oxidized and leached zone and a decrease in
the unoxidized and unleached zone. Below this depth, the
phosphorus content decreases in the unoxidized and leached
zone overlying the basal-loess paleosol.
Runge (1963, p. Ill) interpreted the phosphorus distri
bution in terms of eluvial and illuvial concepts of soil
genesis. Applying this concept to the profiles WZ-1 and Pal-1,
the 0 to approximately 40 inch zone is the phosphorus eluvial
horizon (phosphorus A2 horizon); below this depth to approxi
mately 6 feet is the phosphorus illuvial horizon (phosphorus
B2 horizon). Total phosphorus below a depth of 6 feet in
profile Pal-1 therefore represents the phosphorus C horizon.
The phosphorus maximum below the depth of 9 feet in profile
WZ-1 is suggestive of a buried phosphorus illuvial horizon
(phosphorus B2b horizon) but may be associated with the coarse
strata in the loess. Below a depth of 15 feet and extending
to 33 feet in profile WZ-1 is the phosphorus C horizon of this
profile.
The point to be emphasized here is that the similarity in
262
the phosphorus distribution between the two profiles suggests
that the distribution into eluvial and illuvial zones, which
may be considered genetic horizons, extend to depths well
beneath the solum. Thus, there is a possibility that other
elements, such as potassium, may also have illuvial zones
beneath the limits of the solum.
In the case of total phosphorus distribution, the ques
tion may be raised as to the significance of a phosphorus
illuvial zone extending from 40 inches to 7.5 feet. However,
one should also consider the relationship of the soils on the
stable part of the landscape to those on the slopes. It has
been shown that sand strata and weathering zones, buried at
depths greater than 5.5, feet on the summits, outcrop on the
slopes and influence the characteristics of the soils on the
slopes. Is it not possible that the same thing may occur with
the illuvial phosphorus zone? If so, does this property have
any significant effect on soil classification, plant growth,
response to fertilization, and other properties that agrono-
mically are important? Questions such as these require
additional investigations.
Results in the present study indicate that study of soils
as landscape units as well as profiles is desirable. Valuable
information involving landscape development and soil proper
ties may be obtained by study of the soil profile and
weathering zones that occur beneath the soil solum. Soil
forming factors of time and parent material in the present
263
study are examples of two variables that cannot be adequately
evaluated through study of only the solum.
Soils and Landscapes
Relationships between soils and landscapes have long been
recognized. However, much of the early work was very general
in nature. For example, the early classification schemes of
soils were related to landscapes. The "Final Classification
of Soils" by Dokuchaiev in 1900 contains categories designated
as zones which include among others, desert, steppe, and
boreal zones. These were soil units that could be given broad
geographic expression. The same ideas are in the zonal,
intrazonal, and azonal categories in the U.S. soil classifica
tion scheme of 1938 (Baldwin et al., 1938).
General relationships do not adequately explain either
the variations in soils or landscapes within larger areas.
Studies directed toward a better understanding of the rela
tionships between soils and landscapes within a specific area,
of necessity, must be more precise. A goal of the present
study is to better identify and quantify the variables in
soil-landscape studies.
The scope of the variables has changed through years of
study. According to the concept of soil as defined in the
Russian school of soil science about 1870, the morphology of
each soil, as expressed in its profile, reflects the combined
effects of a particular set of genetic factors responsible for
264
its development. C. F. Marbut introduced this concept, which
emphasized individual soil profiles,to the United States.
Great emphasis on detailed soil maps in the United States
perhaps resulted in broadening the concept of soil to include
the range of profiles from a modal profile. Milne (1936) pro
posed the term "catena" as a summarizing unit to denote a
specified kind of complex of differing soils on the landscape.
Jenny (1941, p. 17) studied the variation of soil proper
ties with the soil forming factors; climate, vegetation,
relief, parent material, and time. However, as pointed out
by Jenny (1941, p. 261), not all parts of the world are
equally suited for the evaluation of quantitative functions
between soil properties and soil forming factors. Jenny con
cludes that in the field we must be satisfied with approxima
tion and general trends.
According to Kellogg (U.S. Soil Survey Staff, 1951, p. 5),
a soil is not really understood until its genesis and the
reasons why it varies from other soils are known. Classifica
tion of soils on the basis of morphology alone is possible,
but probably not satisfactory. Genesis is needed to guide the
work and test the results. Kellogg (U.S. Soil Survey Staff,
1951, p. 7) also considers soils as landscapes as well as pro
files. As discussed by Ruhe (1960), soils occur on landscapes
and are a part of them. Therefore, soils may be evaluated
relative to the evolution of the elements of the landscape.
In the past, some soil studies have used the age of the
265
geologic materials as the time factor in soil formation.
However, as illustrated in certain studies, for example Ruhe
(1956) , the age of the geologic material is not the prime con
cern in the study of^sqils. Rather, it is the age of the
geomorphic surface on which the soil is formed.
In the present study, on the slopes that descend from
the 7th surface in the Geneseo area, soils have formed in
Wisconsin loess. Wisconsin loess is also the parent material
of the soils on the upland-summit surface, which dates from
about 14,000 years ago. On the slopes, strata of sand and
deoxidized weathering zones outcrop. These same zones are
buried deeply beneath the surface on the upland-summit sur
face, but have been beveled by the slopes and outcrop
downslope from the summit. The angular truncation of the sand
strata and weathering zones indicate the slopes are younger
than the upland-summit surface. Therefore, the soils on the
slopes differ from the soils of the upland-summit surface in
the soil-forming factors of time, relief, and parent material.
A geomorphic surface may be considered as a portion of
the earth's surface that can be defined in space and time.
Therefore, studies such as those by Ruhe and the present pro
ject in northeast Iowa, of which this thesis is a part,
attempt to identify the time and space relationships of the
geologic materials, soils, and landscapes. They are attempts
to define more specifically or to quantify the variables con
sidered important in soil formation.
266
The presence of gleyed horizons with segregated iron in
soils on landscape positions that presently are well drained,
for example site WZ-3 in the Geneseo area, is an example where
morphology alone is not adequate for proper classification.
However, detailed study shows the gleyed horizon and segre
gated iron at the WZ-3 site are related to a relict deoxi
dized weathering zone in the loess. Therefore, these
characteristics are inherited and are not related to the
present soil environment. The above relationships are most
easily understood when related to the characteristics of sites
on more stable summit positions.
Knowledge of the past history of the landscape should be
an important factor in soil genesis studies. In the present
study, a detailed genesis study of Tama soils included in the
present study would be best attempted on the 7th surface in
the Geneseo area. On the 7th surface, the sequence of weather
ing zones of the Wisconsin loess indicates that the environ
ment in the past was different from the present. On the lower
surfaces in the Geneseo area, only the oxidized and leached
zone is present in the loess. There is no indication of past
climatic variation. Also, on the 7th surface, the loess is
thick enough that samples may be obtained from little altered
loess. As indicated by the total phosphorus distribution at
the WZ-1 and Pal-1 sites, alterations occur beneath the limits
of the solum. Glenn et aJ^. (1960) have reported that the
genesis of loessial montmorillonite begins long before the
267
free calcium carbonate has been leached out. Alterations
attributed to chemical weathering were reported as deep as 13
feet beneath the surface. Therefore, at the other Tama sites
in the Geneseo area, loess thickness would be a limiting
factor in a detailed soil genesis study.
It appears that to better understand processes involved
in soil genesis and, in addition, to better understand soils
as landscape units, observations and analyses of samples well
beneath the limits of the soil solum is a necessity. A basic
understanding of the landscape on which soils occur, and of
which they are a part is, in the opinion of the author, an
essential part of any investigation designed to better iden
tify and quantify the variables considered important in soil
formation.
268
SUMMARY
The objectives of this study were to better understand
the relationships among landscape, weathering zones, and soils
in the southern portion of lowan drift area in northeastern
Iowa. Study areas were selected in Tama and Grundy Counties.
On the divide area of the present landscape in the
Geneseo area, two clay-textured paleosols in vertical sequence
are overlain by 12 to 36 feet of Wisconsin loess which has a
basal A-C soil profile. The Wisconsin loess can be divided
into three distinct parts on the basis of sand content and
particle-size ratio. The upper 5 to 7 feet of loess, low in
sand content and with a ^26-2y^ particle-size ratio generally
less than 3, overlies both the divide area and the lower land
scape. This loess is the only part present on the lower
landscape. Sand, or a mixture of sand and loess, separates
the loess of low sand content from the underlying till of the
lower landscape.
The upper clay-textured paleosol of the divide area sur
mounts Kansan till and is considered to be a Yarmouth-Sangamon
paleosol. Beneath the Kansan till, a second clay-textured
paleosol surmounts the Nebraskan till and is considered to be
an Aftonian paleosol. Detailed traverses from the divide area
to the lower landscape, previously considered to be the lowan
drift plain, show stepwise truncation of the Yarmouth-Sangamon
paleosols and a portion of the underlying till. The lower
269
landscape is, therefore, an erosion surface cut beneath the
level of the Yarmouth-Sangamon surface. At lower elevations
on the lower landscape, the erosion surface is also cut
beneath the level of the Aftonian paleosol and into Nebraskan
till. This erosion surface complex has been named the lowan
erosion surface.
Organic material from the basal-loess paleosol overlying
a Yarmouth-Sangamon paleosol of the divide area was radio
carbon dated as 25,000 years old. Organic material from the
basal loess overlying the backslope of the lowan erosion sur
face was radiocarbon dated as 20,300 years old. These dates
bracket the cutting of a part of the lowan erosion surface in
the Geneseo area.
Another detailed traverse, from the summit of the divide
to the lower landscape, previously considered to be the lowan
drift plain, was made in the Four-Mile Creek area. As in the
Geneseo area, downslope from the summit, the Yarmouth-Sangamon
paleosol and upper weathering zones of the till show various
stages of truncation. The upper till of the lower landscape
is not lowan till, but is Kansan till from which the paleosol
and a part of the till has been eroded.
The stratigraphy of the lower landscape of the Four-Mile
Creek area, that is loess overlying the lowan erosion surface
cut into Kansan till, was traced to the Palermo area. Observa
tions were made on divide areas along a traverse connecting
the Four-Mile Creek and Palermo areas. Calcareous loess
270
overlying leached till is present in the majority of sites in
this traverse and in the Palermo area. This relationship
contradicts the long accepted weathering relationship of loess
over till in the lowan till area.
Organic matter in the basal-loess paleosol in the Palermo
area is dated as about 22,000 years old. Other dates of
organic matter from the basal-loess paleosol in northeast Iowa
range from 18,300 years to 29,000 years old. These dates
transgress Farmdale and a part of Tazewell time. Therefore,
it was proposed that the basal-loess paleosol be recognized as
a soil-stratigraphic unit and be named the Salt Creek paleosol.
The moderately well to well drained loess derived soils
of the upland-summit surfaces are underlain by a buried land
scape of complex history and properties. The land-surface
soils occur on various levels of the landscape. The under
lying loess varies greatly in thickness and weathering zones
present. However, these soils are morphologically very simi
lar and are within the range of the Tama series as now defined.
Laboratory analyses of these soils show they are also
similar in various characteristics such as particle-size
distribution, organic carbon content, pH, base saturation,
cation-exchange capacity, free iron, and organic phosphorus
distribution. Total phosphorus content and nonexchangeable
potassium and magnesium contents of the <lp clay fraction of
three of the above soils, thought to represent the widest
range in characteristics, were also determined. The
271
individual elements determined show a high degree of uniformity
in content and distribution with depth among these soils.
A key factor in the similarities among the Tama soils
studied is the characteristics of the parent material. In all
cases, the soil solum is formed in the upper increment of
oxidized and leached loess of low sand content. This incre
ment of construction loess was deposited over the entire
landscape in Late Tazewell time and soil formation on the
upland-summit surfaces dates from the end of Wisconsin loess
deposition, approximately 14,000 years ago.
Soil on slopes that descend from the 7th surface are also
formed in Wisconsin loess. However, they are formed on a more
recent geomorphic surface. The characteristics of these soils,
in many cases, are related to the stratigraphy of the loess
and the weathering zones present in the loess. They differ
from the soils of the upland-summit surface in the soil-
forming factors of time, relief, and parent material.

272
BIBLIOGRAPHY
Aandahl, A. R. and Simonson, R. W. 1950 Soil survey of Tama County, Iowa. U.S. Dept. Agr.
Soil Survey Rept., Ser. 1938, No. 22.
Alden, W. C. and Leighton, M. M. 1917 The lowan drift: a review of evidences of the lowan
stage of glaciation. Iowa Geol. Survey 26; 49-212.
Arey, M. F. 1909 Geology of Grundy County. Iowa Geol. Survey 20:
65-95.
Arnold, R. W. 1963 Silans in some brunizem soils. Unpublished Ph.D.
thesis. Library, Iowa State University of Science and Technology, Ames, Iowa.
Arnold, R. W., Tyler, L. E., and Riecken, F. F. 1960 Estimates of slope classes by counties in Iowa.
Iowa Acad. Sci. Proc. 67: 260-267.
Baldwin, M., Kellogg, C. E., and Thorp, J. 1938 Soil classification. U.S. Dept. Agr. Yearbook 1938:
979-1001.
Black, C. A. 1961 Laboratory methods of soil investigation: soil
fertility. Mimeographed. Dept. Agronomy, Iowa State University of Science and Technology, Ames, Iowa.
Brophy, J. A. 1959 Heavy mineral ratios of Sangamon weathering profiles
in Illinois. Illinois Geol. Survey Circ. 273.
Brown, P. E. 1936 Soils of Iowa. Iowa Agr. Expt. Sta. Special Rept. 3.
Daniels, R. B. 1957 Landscape relationships of the Marshall, Dow, and
Napier soil series. Unpublished Ph.D. thesis. Library, Iowa State University of Science and Technology, Ames, Iowa.
Daniels, R. B., Simonson, G. H., and Handy, R. L. 1961 Ferrous iron content and color of sediments.
Soil Sci. 91: 378-382.
273
Broste, J. B. and Tharin, J. C. 1958 Alteration of clay minerals in Illinoian till.
Geol. Soc. America Bull. 69: 61-68.
Elwell, J. A. and Poulson, E. N. 19 28 Soil survey of Butler County, Iowa. Bur. Chemistry
and Soils, U.S. Dept. Agr., Washington, D. C.
Ely, C. W., Coffey, G. N., and Griffen, A. M. 1905 Soil survey of Tama County, Iowa. Bur. of Soils,
U.S. Dept. Agr., Washington, D. C.
Flint, R. F. 1955 Pleistocene geology of eastern South Dakota. U.S.
Geol. Prof. Paper 262.
Frye, J. C., Glass, H. D., and Willman, H. B. 1962 Stratigraphy and mineralogy of the Wisconsin loesses
of Illinois. Illinois Geol. Survey Circ. 334.
Frye, J. C. and Willman, H. B. 1960 Classification of the Wisconsinan stage in the Lake
Michigan glacial lobe. Illinois Geol. Survey Circ. 285.
Glenn, R. C., Jackson, M. L., Hole, F. D., and Lee, G. B. 1960 Chemical weathering of layer silicate clays in
loess-derived Tama silt loam of southwestern Wisconsin. Clay and Clay Minerals 8; 63-83.
Hall, G. F. 1965 Geomorphology and soils of the lowan-Kansan border
area, Tama County, Iowa. Unpublished Ph.D. thesis. Library, Iowa State University of Science and Technology, Ames, Iowa.
Jackson, M. L. 1958 Soil chemical analysis. Prentice-Hall, Inc.,
Englewood Cliffs, New Jersey.
Jenny, H. 1941 Factors of soil formation. McGraw-Hill Book Co.,
Inc., New York, New York.
Kay, G. F. 1916a Some features of the Kansan drift in southern Iowa,
(abs.) Geol. Soc. America Bull. 27: 115-117.
Kay, G. F. 1916b Gumbotil, a new term in Pleistocene geology.
Science New Ser., 44: 637-638.

274
Kay, G. F. 1931 Origin of the pebble band on lowan till. Jour.
Geology 39: 377-380.
Kay, G. F. and Apfel, E. T. 1929 The pre-Illinoian Pleistocene geology of Iowa.
Iowa Geol. Survey 34: 1-304.
Kay, G. F. and Graham, J. B. 1943 The Illinoian and post-Illinoian Pleistocene geology
of Iowa. Iowa Geol. Survey 38: 1-262.
Kay, G. F. and Leighton, M. M. 19 33 The Eldoran epoch of the Pleistocene period. Geol.
Soc. America Bull. 44; 669-673.
Kilmer, V. J. and Alexander, L. T. 1949 Methods of making mechanical analysis of soils.
Soil Sci. 68: 15-24.
Legg, J. 0. and Black, C. A. 1955 Determination of organic phosphorus in soils. II.
Ignition method. Soil Sci. Soc. America Proc. 19: 139-143.
Leighton, M. M. 1926 A notable type Pleistocene section: the Farm Creek
exposure near Peoria, Illinois. Jour. Geology 34: 167-174.
Leighton, M. M. 1933 The naming of the subdivisions of the Wisconsin
glacial age. Science New Ser. 77: 168.
Leighton, M. M. 1957 The Cary-Mankato-Valders problem. Jour. Geology 65:
108-111.
Leighton, M. M. 1958 Important elements in the classification of the
Wisconsin glacial stage. Jour. Geology 66: 288-309.
Leighton, M. M. 1960 The classification of the Wisconsin glacial stage of
north central United States. Jour. Geology 68: 529-552.
Leighton, M. M. 1965 The stratigraphie succession of Wisconsin loess in
the Upper Mississippi River Valley. Jour. Geology 73: 323-345.
275
Leighton, M. M. and MacClintock, P. 1930 Weathered zones of the Drift-Sheets of Illinois.
Jour. Geology 38: 28-53.
Leighton, M. M. and MacClintock, P. 1962 The weathered mantle of glacial tills beneath
original surfaces in north central United States. Jour. Geology 70: 267-293.
Lounsbury, C., Elwell, J. A., Boatman, B., and Benton, T. H. 1925 Soil Survey of Benton County, Iowa. Bur. Soils,
U.S. Dept. Agr., Washington, D. C.
Marbut, C. F. 1922 Soil classification: life and work of C. F. Marbut.
Artcraft Press, Columbia, Missouri.
McGee, W. J. 1890 The Pleistocene history of northeastern Iowa.
U.S. Geol. Survey 11: 199-577.
Milne, G. 1936 A provisional soil map of East Africa. African Agr.
Research Station, Amani Soil Research.
O'Neal, A. M. and Devereux, R. E. 1928 Soil survey of Jones County, Iowa. Bur. Chemistry
andSoils, U.S. Dept. Agr., Washington, D. C.
Oschwald, W. R., Riecken, F. F., Dideriksen, R. I., Scholtes, W. H., and Schaller, F. W.
1965 Principal soils of Iowa. Iowa State University of Science and Technology Cooperative Extension Service Special Report 42.
Phillips, J. A. and Riecken, F. F. 1960 Characteristics of the Floyd and some related soils
in Floyd and Bremer Counties, Iowa. Iowa Acad. Sci. Proc. 67: 277-289.
Protz, R. 1965 Magnesium and stage of development of loess-derived
soils of Iowa. Unpublished Ph.D. thesis. Library, Iowa State University of Science and Technology, Ames, Iowa.
Riecken, F. F. and Smith, G. D. 1949 Principal upland soils of Iowa: Agronomy 49. Agr.
Ext. Service, Iowa State University of Science and Technology, Ames, Iowa.
276
Ruhe , R. V. 1954 Pleistocene soils along the Rock Island relocation
in southwestern Iowa. Am. Rail. Engr. Assoc. Bull. 514: 639-645.
Ruhe, R. V. 19 56 Geomorphic surfaces and the nature of soils.
Sci. 82: 441-455. Soil
Ruhe, R. 1959
V. Stone lines in soils. Soil Sci. 87: 223-231.
Ruhe, R. 1960
V, Elements of the soil landscape. Internat. Congr. Soil Science, 7th, Trans. 23: 165-170.
Ruhe, R. v., Dietz, W. P., Fenton, T. E., and Hall, G. F. 19 65 The lowan problem. Unpublished paper presented at
sixteenth annual meeting. Midwest Friends of Pleistocene, Marshalltown, Iowa, May, 1965. Multilithed. Soil Conservation Service, U.S. Dept. Agr., Ames, Iowa.
Ruhe, R. v . . Prill, R. C . , and Riecken, F. F. 1955 Profile characteristics of some loess-derived soils
and soil aeration. Soil Sci. Soc. America Proc. 19; 345-347.
Ruhe, R. v . , Rubin, M., and Scholtes, W. H. 1957 Late Pleistocene radiocarbon chronology in Iowa.
Am. Jour. Sci. 255: 671-689.
Ruhe, R. V. and Scholtes, W. H. 1955 Radiocarbon dates in central Iowa.
63: 82-92. Jour. Geology
Ruhe, R. V. and Scholtes, W. H. 1956 Age and development of soil landscapes in relation
to climatic and vegetational changes in Iowa. Soil Sci. Soc. America Proc. 20: 264-273.
Ruhe, R. V. and Scholtes, W. H. 1959 Important elements in the classification of the
Wisconsin glacial stage: a discussion. J. Geology 67: 585-593.
Runge, E. 1963
C. A. Influence of natural drainage on iron and phosphorus distribution in some Iowa soils. Unpublished Ph.D. thesis. Library, Iowa State University of Science and Technology, Ames, Iowa.

277
Ryan, P. 1959 Morphology and extent of Muscatine and Tama soil
series in Muscatine County, Iowa. Unpublished M.S. thesis. Library, Iowa State University of Science and Technology, Ames, Iowa.
Scholtes, W. H. 1955 Properties and classification of the paha loess-
derived soils in northeastern Iowa. Iowa Acad. Sci. Proc. 57: 283-291.
Shaffer, P. R. 1954 Extension of Tazewell glacial substage of western
Illinois and eastern Iowa. Geol. Soc. America Bull. 65: 443-456.
Shimek, B. 1908 The loess of the paha and river ridge. Iowa Acad.
Sci. Proc. 15; 117-136.
Shimek, B. 1909 Aftonian sand and gravels in western Iowa. Geol.
Soc. America Bull. 20: 399-408.
Smith, G. D. 1942 Illinois loess. Illinois Agricultural Experiment
Station Bulletin 490.
Smith, G. D., Allaway, W. H., and Riecken, F. F. 1950 Prairie soils of the Upper Mississippi Valley. Adv.
in Agronomy 2: 157-205.
Soileau, J. M. and Riecken, F. F. 1959 Profile characteristics of some forest-formed soils
derived from lowan till. Iowa Acad. Sci. Proc. 66: 263-269.
Stevenson, W. H. and Brown, P. E. 1917 Soil survey of Bremer County, Iowa. Iowa Agr. Exp.
Station, Ames, Iowa.
Stevenson, W. H. and Brown, P. E. 1927a Soil survey of Benton County, Iowa. Iowa Agr. Exp.
Station, Ames, Iowa.
Stevenson, W. H. and Brown, P. E. 1927b Soil survey of Grundy County, Iowa. Iowa Agr. Exp.
Station, Ames, Iowa.
278
Stevenson, W. H. and Brown, P. E. 1929 Soil survey of Jones County, Iowa. Iowa Agr. Exp.
Station, Ames, Iowa.
Stevenson, W. H. and Brown, P. E. 1933 Soil survey of Butler County, Iowa. Iowa Agr. Exp.
Station, Ames, Iowa.
Stevenson, W. H., Brown, P. E., Corson, G. E., and Harper, H. J.
1920 Soil survey of Black Hawk County, Iowa. Iowa Agr. Exp. Station, Ames, Iowa.
Tanner, C. B. and Jackson, M. L. 1947 Nomographs of sedimentation times for soil particles
under gravity or centrifugal acceleration. Soil Sci. Soc. America Proc. 12: 60-65.
Tharp, W. E. and Harper, H. J. 1919 Soil survey of Black Hawk County, Iowa. Bur. Soils,
U.S. Dept. Agr., Washington, D. C.
Tyler, L. E., Riecken, F. F., and Allen, J. S. 1962 Properties and genesis of soils developed in very
firm till in northeastern Iowa. Soil Sci. Soc. America Proc. 26: 275-281.
Tyner, E. H. 1939 The use of sodium metaphosphate for dispersion of
soils for mechanical analysis. Soil Sci. Soc. America Proc. 4: 103-113.
U.S. Salinity Laboratory Staff 1954 Diagnosis and improvement of saline and alkaline
soils. U.S. Dept. Agr. Handbook 60.
U.S. Soil Survey Staff 1951 Soil survey manual. U.S. Dept. Agr. Handbook 18,
U.S. Soil Survey Staff 19 60 Soil classification; a comprehensive system: 7th
approximation. U.S. Government Printing Office, Washington, D.C.
U.S. Soil Survey Staff 1962 Soil survey manual. U.S. Dept. Agr. Handbook 18,
Supplement.
279
Wascher, H. L., Humbert, R. P., and Cady, J. G. 1947 Loess in the Southern Mississippi Valley: identifi
cation and distribution of the loess sheets. Soil Sci. Soc. America Proc. 12: 389-399.
Wells, K. L. 1963 Potassium and stage of development relationships in
some loess-derived soils of Iowa. Unpublished Ph.D. thesis. Library, Iowa State University of Science and Technology, Ames, Iowa.
White, E. M. 1953 The genesis and morphology of some transitional
brunizem-gray-brown podzolic soils. Unpublished Ph.D. thesis. Library, Iowa State University of Science and Technology, Ames, Iowa.
Whitney, Milton. 1909 Soils of the United States. U.S. Dept. Agr. Bur. of
Soils Bull. 55.
280
ACKNOWLEDGMENTS
The author wishes to express his appreciation to
Dr. F. F. Riecken and Dr. R. V. Ruhe for their helpful advice
and criticism during the course of this study and the prepara
tion of this manuscript. Special acknowledgment is also given
to Dr. W. H. Scholtes who guided the early stages of the
author's graduate program before his assignment in Uruguay.
The assistance of the other members of the author's
graduate committee (Dr. W. E. Loomis, Dr. R. S. Hansen, and
Dr. C. A. Black) is greatly appreciated.
Appreciation is also expressed to W. P. Dietz, G. F. Hall,
and R. C. Shuman for counsel and assistance during the course
of this study.
The assistance, encouragement, and understanding given
the author by his wife, Sharon, and children, John, David, and
Julie, is gratefully acknowledged.
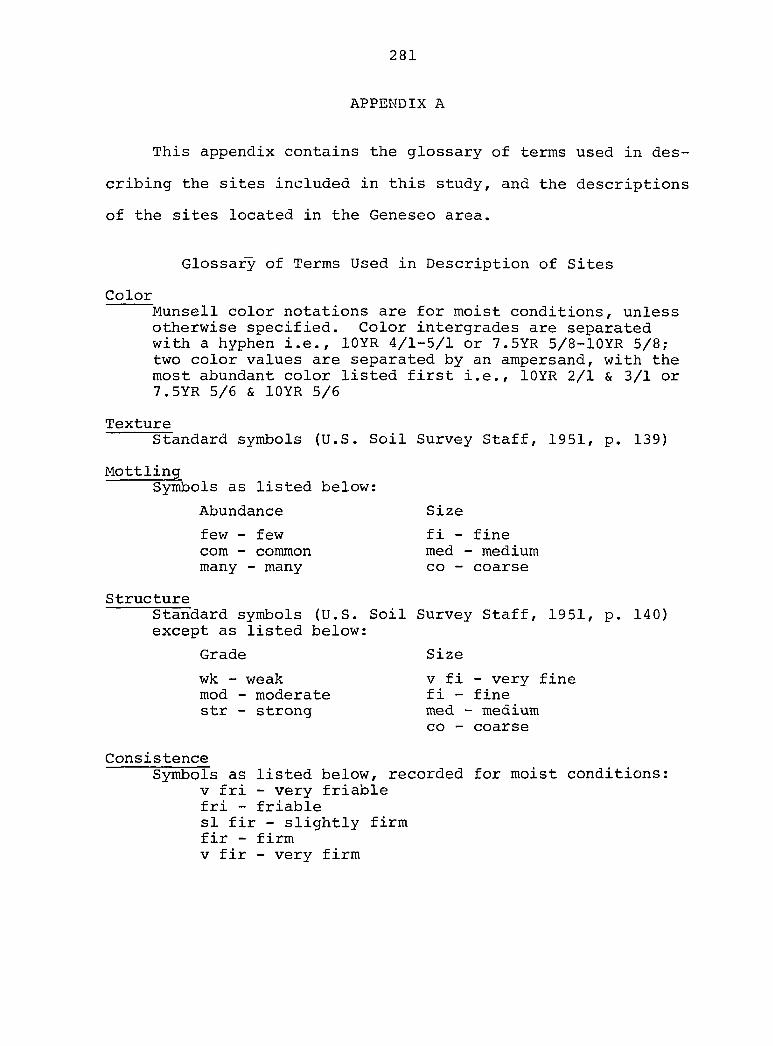
281
APPENDIX A
This appendix contains the glossary of terms used in des
cribing the sites included in this study, and the descriptions
of the sites located in the Geneseo area.
Glossary of Terms Used in Description of Sites
Color Munsell color notations are for moist conditions, unless otherwise specified. Color intergrades are separated with a hyphen i.e., lOYR 4/1-5/1 or 7.5YR 5/8-lOYR 5/8; two color values are separated by an ampersand, with the most abundant color listed first i.e., lOYR 2/1 & 3/1 or 7.5YR 5/6 & lOYR 5/6
Texture Standard symbols (U.S. Soil Survey Staff, 1951, p. 139)
Mottling Symbols as listed below;
Abundance Size
few - few fi - fine com - common med - medium many - many co - coarse
Structure Standard symbols (U.S. Soil except as listed below:
Grade
wk - weak mod - moderate str - strong
Survey Staff, 1951, p. 140)
Size
V fi - very fine fi - fine med - medium CO - coarse
Consistence Symbols as listed below, recorded for moist conditions:
V fri - very friable fri - friable si fir - slightly firm fir - firm V fir - very firm
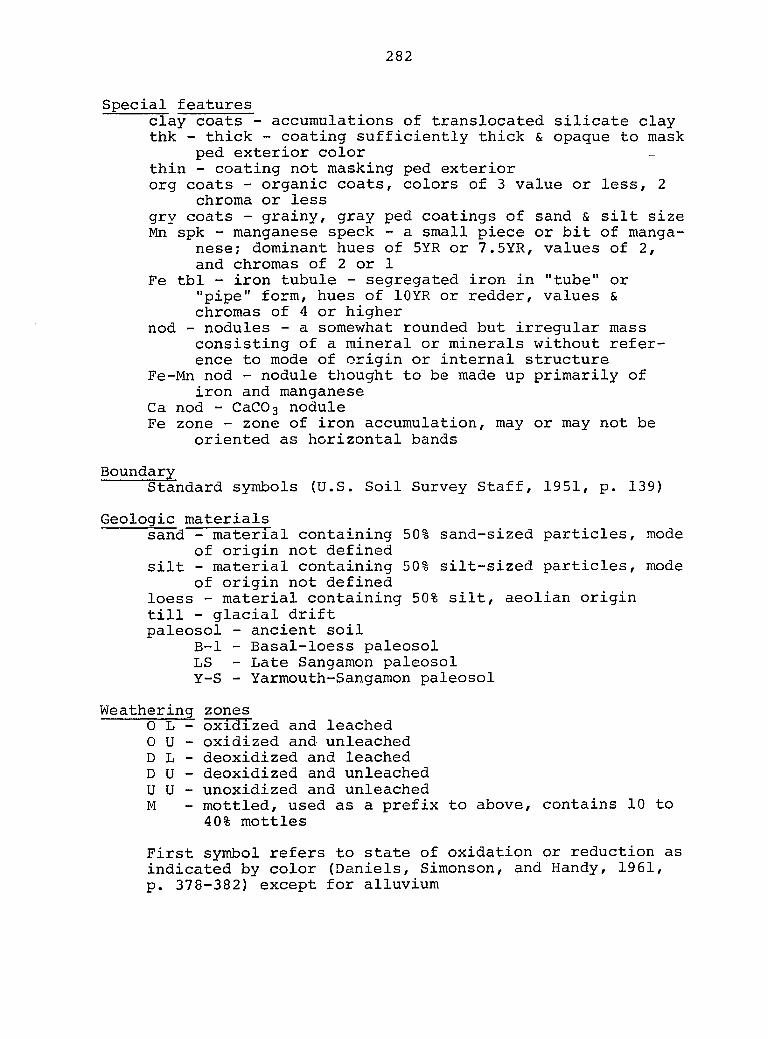
282
Special features clay coats - accumulations of translocated silicate clay thk - thick - coating sufficiently thick & opaque to mask
ped exterior color thin - coating not masking ped exterior org coats - organic coats, colors of 3 value or less, 2
chroma or less gry coats - grainy, gray ped coatings of sand & silt size Mn spk - manganese speck - a small piece or bit of manga
nese; dominant hues of 5YR or 7.5YR, values of 2, and chromas of 2 or 1
Fe tbl - iron tubule - segregated iron in "tube" or "pipe" form, hues of lOYR or redder, values & chromas of 4 or higher
nod - nodules - a somewhat rounded but irregular mass consisting of a mineral or minerals without reference to mode of origin or internal structure
Fe-Mn nod - nodule thought to be made up primarily of iron and manganese
Ca nod - CaCOg nodule Fe zone - zone of iron accumulation, may or may not be
oriented as horizontal bands
Boundary Standard symbols (U.S. Soil Survey Staff, 1951, p. 139)
Geologic materials sand - material containing 50% sand-sized particles, mode
of origin not defined silt - material containing 50% silt-sized particles, mode
of origin not defined loess - material containing 50% silt, aeolian origin till - glacial drift paleosol - ancient soil
B-1 - Basal-loess paleosol LS - Late Sangamon paleosol Y-S - Yarmouth-Sangamon paleosol
Weathering zones 0 L - oxidized and leached OU- oxidized and unleached D L - deoxidized and leached DU- deoxidized and unleached U U - unoxidized and unleached M - mottled, used as a prefix to above, contains 10 to
40% mottles
First symbol refers to state of oxidation or reduction as indicated by color (Daniels, Simonson, and Handy, 1961, p. 378-382) except for alluvium
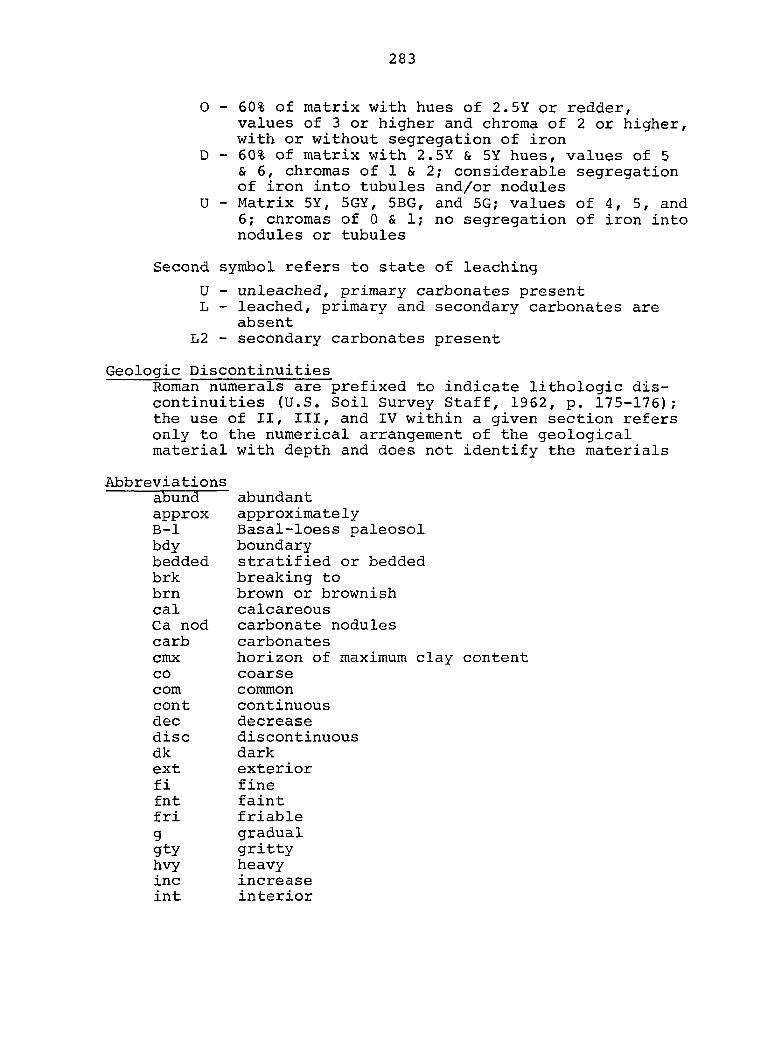
283
0 - 60% of matrix with hues of 2.5Y or redder, values of 3 or higher and chroma of 2 or higher, with or without segregation of iron
D - 60% of matrix with 2.5Y & 5Y hues, values of 5 & 6, chromas of 1 & 2; considerable segregation of iron into tubules and/or nodules
U - Matrix 5Y, 5GY, 5BG, and 5G; values of 4, 5, and 6; chromas of 0 & 1; no segregation of iron into nodules or tubules
Second symbol refers to state of leaching
U - unleached, primary carbonates present L - leached, primary and secondary carbonates are
absent L2 - secondary carbonates present
Geologic Discontinuities Roman numerals are prefixed to indicate lithologie discontinuities (U.S. Soil Survey Staff, 1962, p. 175-176); the use of II, III, and IV within a given section refers only to the numerical arrangement of the geological material with depth and does not identify the materials
Abbreviations abund abundant approx approximately B-1 Basal-loess paleosol bdy boundary bedded stratified or bedded brk breaking to brn brown or brownish cal calcareous Ca nod carbonate nodules carb carbonates cmx horizon of maximum clay content CO coarse com common cont continuous dec decrease disc discontinuous dk dark ext exterior fi fine fnt faint fri friable g gradual gty gritty hvy heavy inc increase int interior
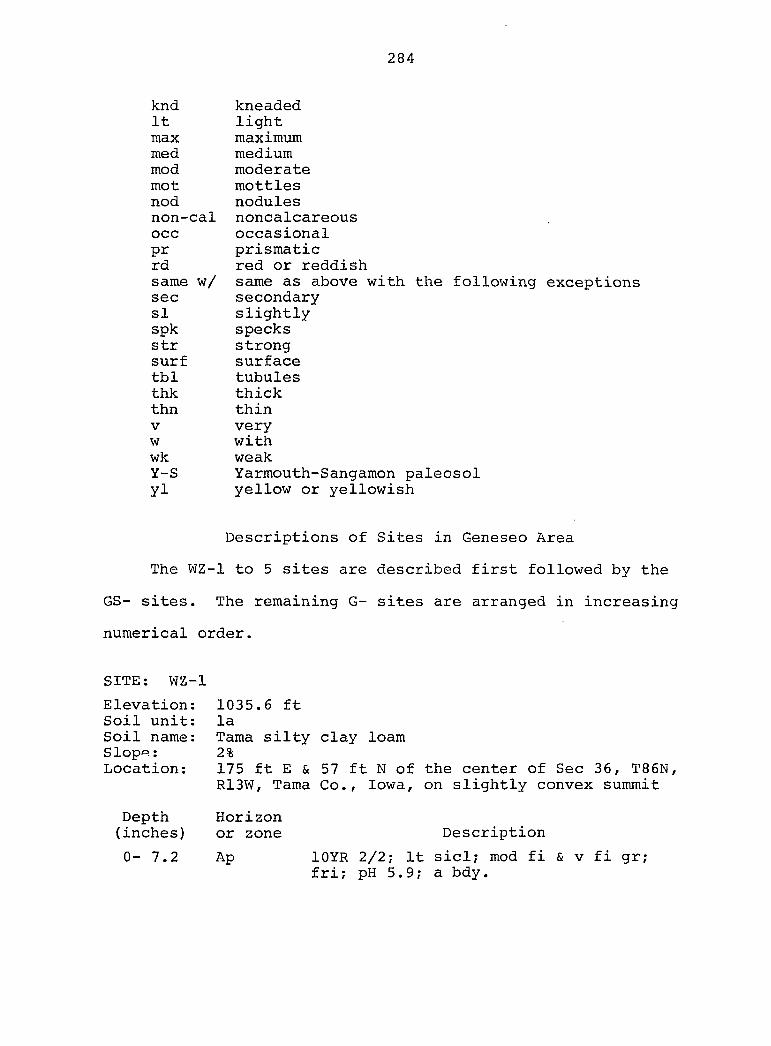
284
knd kneaded It light max maximum med medium mod moderate mot mottles nod nodules non-cal noncalcareous occ occasional pr prismatic rd red or reddish same w/ same as above with the following exceptions sec secondary si slightly spk specks str strong surf surface tbl tubules thk thick thn thin v very w with wk weak Y-S Yarmouth-Sangamon paleosol y i yellow or yellowish
Descriptions of Sites in Geneseo Area
The WZ-1 to 5 sites are described first followed by the
GS- sites. The remaining G- sites are arranged in increasing
numerical order.
SITE: WZ-1
Elevation: Soil unit: Soil name: Slopo: Location:
1035.6 ft la Tama silty clay loam 2% 175 ft E & 57 ft N of the center of Sec 36, T86N, R13W, Tama Co., Iowa, on slightly convex summit
Depth (inches)
0- 7.2
Horizon or zone
Ap
Description
lOYR 2/2; It sicl; mod fi & fri; pH 5.9; a bdy.
V fi gr;
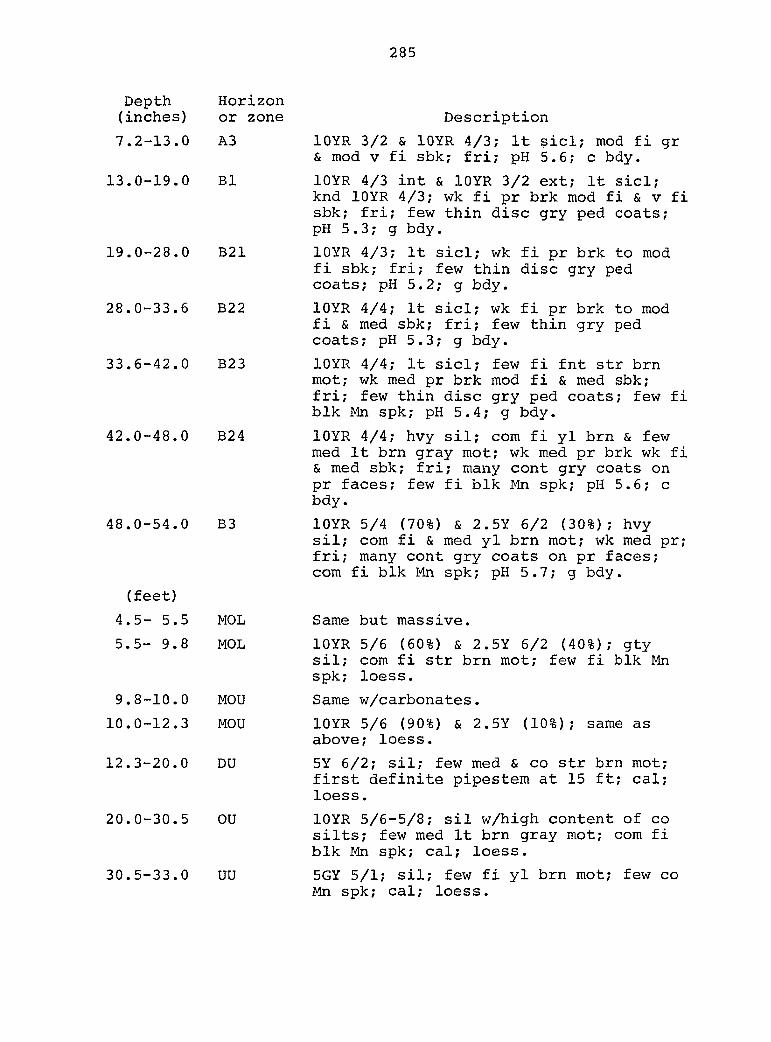
285
Depth Horizon (inches) or zone
7.2-13.0 A3
13.0-19.0 B1
19.0-28.0 B21
28.0-33.6 B22
33.6-42.0 B23
42.0-48.0 B24
48.0-54.0 B3
(feet)
4.5- 5.5 MOL
5.5- 9.8 MOL
9.8-10.0 MOU
10.0-12.3 MOU
12.3-20.0 DU
20.0-30.5 OU
30.5-33.0 UU
Description
lOYR 3/2 & lOYR 4/3; It sicl; mod fi gr & mod V fi sbk; fri; pH 5.6; c bdy.
lOYR 4/3 int & lOYR 3/2 ext; It sicl; knd lOYR 4/3; wk fi pr brk mod fi & v fi sbk; fri; few thin disc gry ped coats; pH 5.3; g bdy.
lOYR 4/3; It sicl; wk fi pr brk to mod fi sbk; fri; few thin disc gry ped coats; pH 5.2; g bdy.
lOYR 4/4; It sicl; wk fi pr brk to mod fi & med sbk; fri; few thin gry ped coats ; pH 5.3; g bdy.
lOYR 4/4; It sicl; few fi fnt str brn mot; wk med pr brk mod fi & med sbk; fri; few thin disc gry ped coats; few fi blk Mn spk; pH 5.4; g bdy.
lOYR 4/4; hvy sil; com fi yl brn & few med It brn gray mot; wk med pr brk wk fi & med sbk; fri; many cont gry coats on pr faces; few fi blk Mn spk; pH 5.6; c bdy.
lOYR 5/4 (70%) & 2.5Y 6/2 (30%); hvy sil; com fi & med yl brn mot; wk med pr; fri; many cont gry coats on pr faces; com fi blk Mn spk; pH 5.7; g bdy.
Same but massive.
lOYR 5/6 (60%) & 2.5Y 6/2 (40%); gty sil; com fi str brn mot; few fi blk Mn spk; loess.
Same w/carbonates.
lOYR 5/6 (90%) & 2.5Y (10%); same as above; loess.
5Y 6/2; sil; few med & co str brn mot; first definite pipestem at 15 ft; cal; loess.
lOYR 5/6-5/8; sil w/high content of co silts; few med It brn gray mot; com fi blk Mn spk; cal; loess.
5GY 5/1; sil; few fi yl brn mot; few co Mn spk; cal; loess.
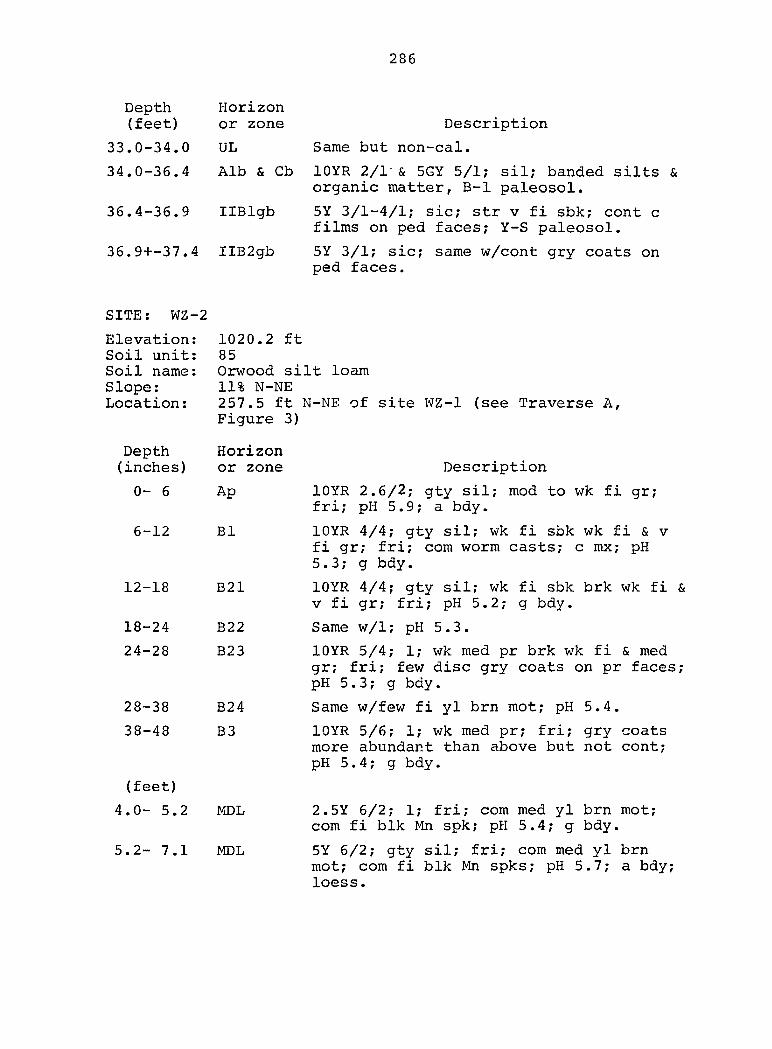
286
Depth (feet)
33.0-34.0
34.0-36.4
36.4-36.9
36.9+-37.4
Horizon or zone Description
UL Same but non-cal.
Alb & Cb lOYR 2/1-& 5GY 5/1; sil; banded silts organic matter, B-1 paleosol.
IIBlgb 5Y 3/1-4/1; sic; str v fi sbk; cont c films on ped faces; Y-S paleosol.
IIB2gb 5Y 3/1; sic; same w/cont gry coats on ped faces.
SITE: WZ-2
Elevation: Soil unit: Soil name: Slope: Location:
Depth (inches)
0- 6
6-12
12-18
18-24
24-28
28-38
38-48
(feet)
4.0- 5.2
5.2- 7.1
1020.2 ft 85 Orwood silt loam 11% N-NE 257.5 ft N-NE of site WZ-1 (see Traverse A, Figure 3)
Horizon or zone
Ap
B1
B21
B22
B23
B24
B3
MDL
MDL
Description
lOYR 2.6/2; gty sil; mod to wk fi gr; fri; pH 5.9; a bdy.
lOYR 4/4; gty sil; wk fi sbk wk fi & v fi gr; fri; com worm casts; c mx; pH 5.3; g bdy.
lOYR 4/4; gty sil; wk fi sbk brk wk fi & V fi gr; fri; pH 5.2; g bdy.
Same w/1; pH 5.3.
lOYR 5/4; 1; wk med pr brk wk fi & med gr; fri; few disc gry coats on pr faces; pH 5.3; g bdy.
Same w/few fi yl brn mot; pH 5.4.
lOYR 5/6; 1; wk med pr; fri; gry coats more abundant than above but not cont; pH 5.4; g bdy.
2.5Y 6/2; 1; fri; com med yl brn mot; com fi blk Mn spk; pH 5.4; g bdy.
5Y 6/2; gty sil; fri; com med yl brn mot; com fi blk Mn spks; pH 5.7; a bdy; loess.
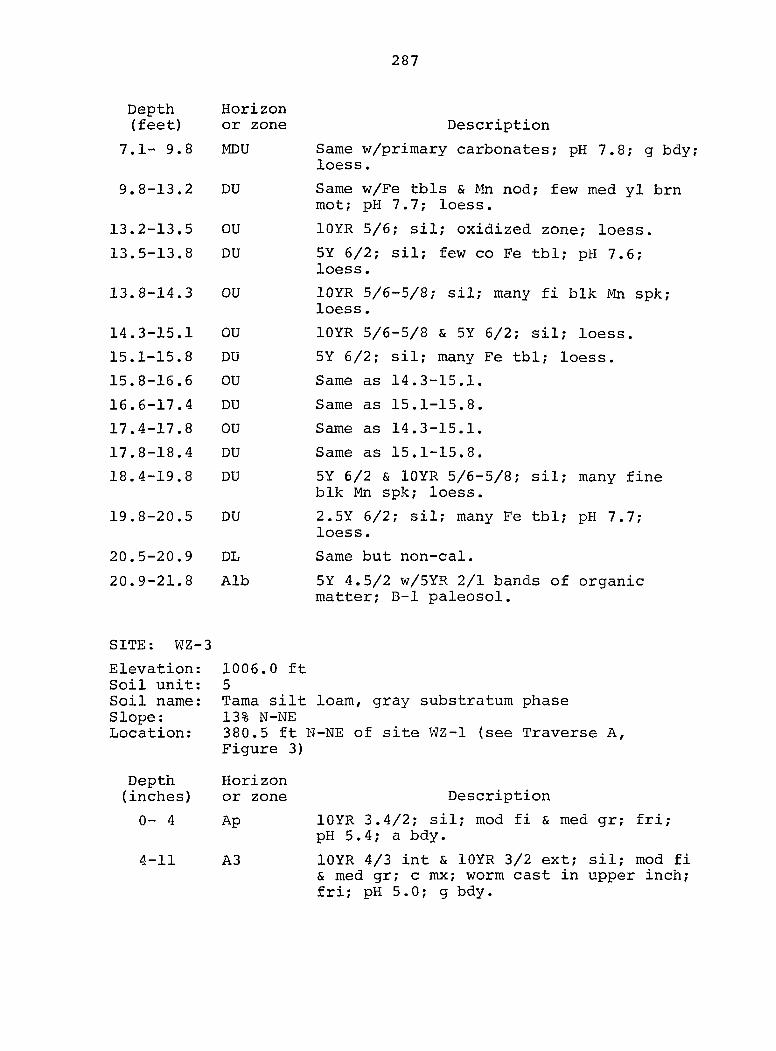
287
Depth (feet)
7.1- 9.8
9.8-13.2
13.2-13.5
13.5-13.8
13.8-14.3
14.3-15.1
15.1-15.8
15.8-16.6
16.6-17.4
17.4-17.8
17.8-18.4
18.4-19.8
19.8-20.5
20.5-20.9
20.9-21.8
SITE: WZ-3
Elevation: Soil unit: Soil name: Slope : Location:
Depth (inches)
0- 4
4-11
Horizon or zone Description
MDU Same w/primary carbonates; pH 7.8; g bdy; loess.
DU Same w/Fe tbls & Mn nod; few med yl brn mot; pH 7.7; loess.
OU lOYR 5/6; sil; oxidized zone; loess.
DU 5Y 6/2; sil; few co Fe tbl; pH 7.6; loess.
OU lOYR 5/6-5/8; sil; many fi blk Mn spk; loess.
OU lOYR 5/6-5/8 & 5Y 6/2; sil; loess.
DU 5Y 6/2; sil; many Fe tbl; loess.
OU Same as 14.3-15.1.
DU Same as 15.1-15.8.
OU Same as 14.3-15.1.
DU Same as 15.1-15.8.
DU 5Y 6/2 & lOYR 5/6-5/8; sil; many fine blk Mn spk; loess.
DU 2.5Y 6/2; sil; many Fe tbl; pH 7.7; loess.
DL Same but non-cal.
Alb 5Y 4.5/2 w/5YR 2/1 bands of organic matter; B-1 paleosol.
1006.0 ft 5 Tama silt loam, gray substratum phase 13% N-NE 380.5 ft N-NE of site WZ-1 (see Traverse A, Figure 3)
Horizon or zone Description
Ap lOYR 3.4/2; sil; mod fi & med gr; fri; pH 5.4; a bdy.
A3 lOYR 4/3 int & lOYR 3/2 ext; sil; mod fi & med gr; c mx; worm cast in upper inch; fri; pH 5.0; g bdy.
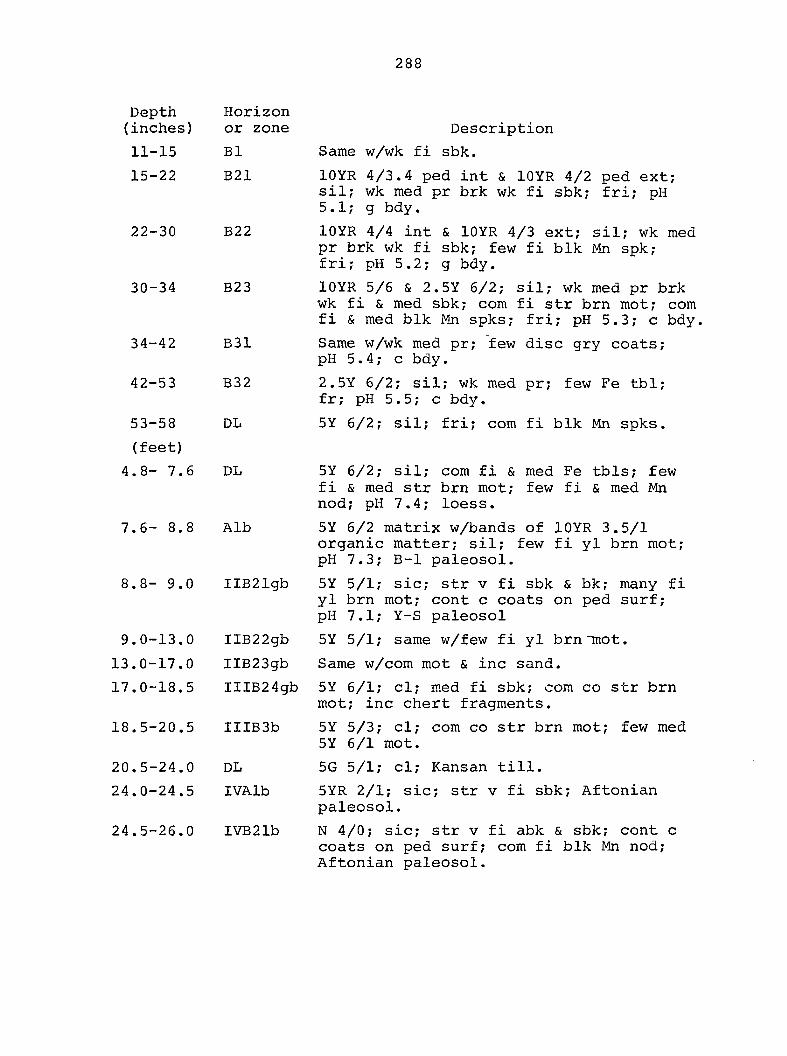
288
Depth (inches)
11-15
15-22
22-30
30-34
34-42
42-53
53-58
(feet)
4.8- 7.6
7.6— 8.8
8.8- 9.0
9.0-13.0
13.0-17.0
17.0-18.5
18.5-20.5
20.5-24.0
24.0-24.5
Horizon or zone
B1
B21
B22
B23
B31
B32
DL
DL
Alb
IIB21gb
IIB22gb
IIB23gb
IIIB24gb
IIIB3b
DL
IVAlb
24.5-26.0 IVB21b
Description
Same w/wk fi sbk.
lOYR 4/3.4 ped int & lOYR 4/2 ped ext; sil; wk med pr brk wk fi sbk; fri; pH 5.1; g bdy.
lOYR 4/4 int & lOYR 4/3 ext; sil; wk med pr brk wk fi sbk; few fi blk Mn spk; fri; pH 5.2; g bdy.
lOYR 5/6 & 2.5Y 6/2; sil; wk med pr brk wk fi & med sbk; com fi str brn mot; com fi & med blk Mn spks; fri; pH 5.3; c bdy.
Same w/wk med pr; few disc gry coats; pH 5.4; c bdy.
2.5Y 6/2; sil; wk med pr; few Fe tbl; fr; pH 5.5; c bdy.
5Y 6/2; sil; fri; com fi blk Mn spks.
5Y 6/2; sil; com fi & med Fe tbls; few fi & med str brn mot; few fi & med Mn nod; pH 7.4; loess.
5Y 6/2 matrix w/bands of lOYR 3.5/1 organic matter; sil; few fi yl brn mot; pH 7.3; B-1 paleosol.
5Y 5/1; sic; str v fi sbk & bk; many fi yl brn mot; cont c coats on ped surf; pH 7.1; Y-S paleosol
5Y 5/1; same w/few fi yl brn "mot.
Same w/com mot & inc sand.
5Y 6/1; cl; med fi sbk; com co str brn mot; inc chert fragments.
5Y 5/3; cl; com co str brn mot; few med 5Y 6/1 mot.
5G 5/1; cl; Kansan till.
5YR 2/1; sic; str v fi sbk; Aftonian paleosol.
N 4/0; sic; Str v fi abk & sbk; cont c coats on ped surf; com fi blk Mn nod; Aftonian paleosol.
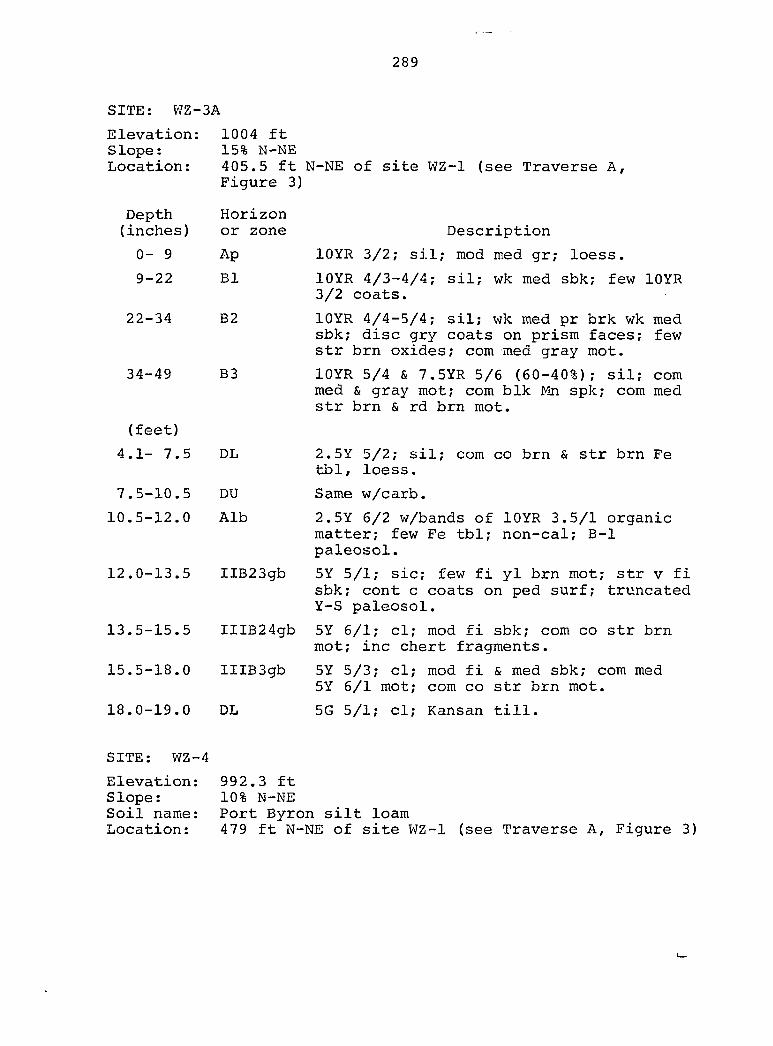
289
SITE: WZ-3A
Elevation: Slope : Location:
Depth (inches)
0 — 9
9-22
22-34
34-49
(feet)
4.1- 7.5
7.5-10.5
10.5-12.0
12.0-13.5
13.5-15.5
15.5-18.0
18.0-19.0
1004 ft 15% N-NE 405.5 ft N-NE of site WZ-1 (see Traverse A, Figure 3)
Horizon or zone
Ap
B1
B2
B3
DL
DU
Alb
IIB23gb
IIIB24gb
IIIB3gb
DL
Description
lOYR 3/2; sil; mod med gr; loess.
lOYR 4/3-4/4; sil; wk med sbk; few lOYR 3/2 coats.
lOYR 4/4-5/4; sil; wk med pr brk wk med sbk; disc gry coats on prism faces; few str brn oxides; com med gray mot.
lOYR 5/4 & 7.5YR 5/6 (60-40%); sil; com med & gray mot; com blk Mn spk; com med str brn & rd brn mot.
2.5Y 5/2; sil; com co brn & str brn Fe tbl, loess.
Same w/carb.
2.5Y 6/2 w/bands of lOYR 3.5/1 organic matter; few Fe tbl; non-cal; B-1 paleosol.
5Y 5/1; sic; few fi yl brn mot; str v fi sbk; cont c coats on ped surf; truncated Y-S paleosol.
5Y 6/1; cl; mod fi sbk; com co str brn mot; inc chert fragments.
5Y 5/3; cl; mod fi & med sbk; com med 5Y 6/1 mot; com co str brn mot.
5G 5/1; cl; Kansan till.
SITE: WZ-4
Elevation: 992.3 ft Slope: 10% N-NE Soil name: Port Byron silt loam Location: 479 ft N-NE of site WZ-1 (see Traverse A, Figure 3)
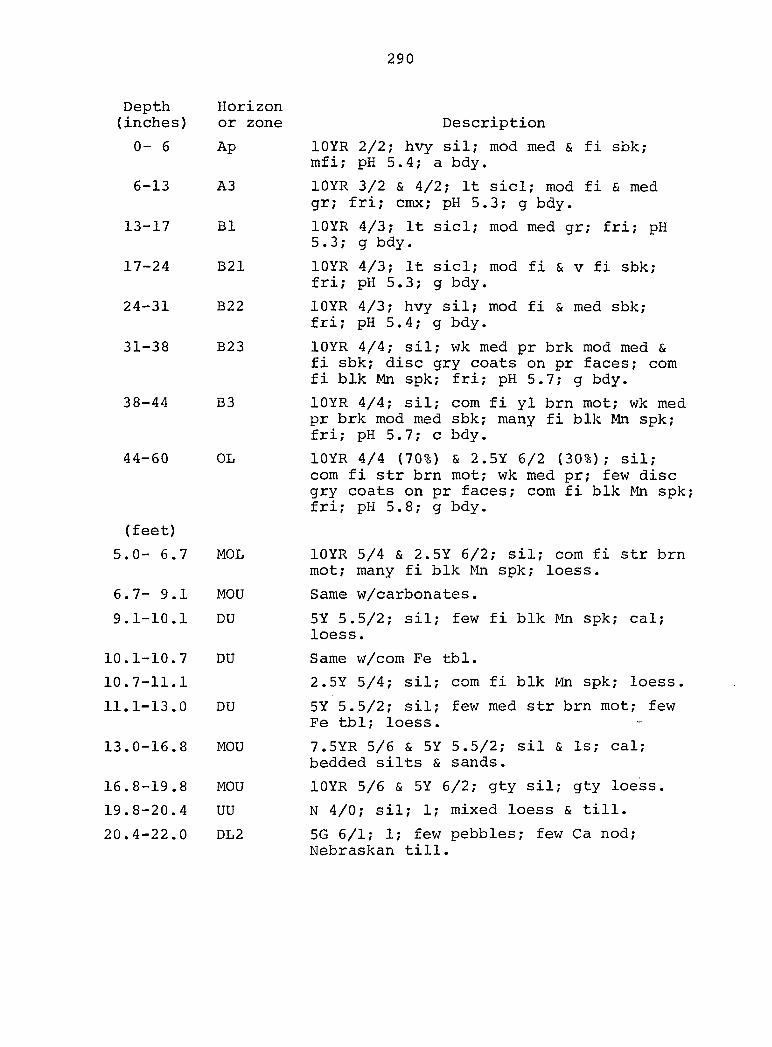
Depth (inches)
0 — 6
6-13
13-17
17-24
24-31
31-38
38-44
4 4—60
(feet)
5.0- 6.7
6.7- 9.1
9.1-10.1
10.1-10.7
10.7-11.1
11.1-13.0
13.0-16.8
16.8-19 .8
19.8-20.4
20.4-22.0
290
Horizon or zone Description
Ap lOYR 2/2; hvy sil; mod med & fi sbk; mfi; pH 5.4; a bdy.
A3 lOYR 3/2 & 4/2; It sicl; mod fi & med gr; fri; cmx; pH 5.3; g bdy.
Bl lOYR 4/3; It sicl; mod med gr; fri; pH 5.3; g bdy.
B21 lOYR 4/3; It sicl; mod fi & v fi sbk; fri; pH 5.3; g bdy.
B22 lOYR 4/3; hvy sil; mod fi & med sbk; fri; pH 5.4; g bdy.
B23 lOYR 4/4; sil; wk med pr brk mod med & fi sbk; disc gry coats on pr faces; com fi blk Mn spk; fri; pH 5.7; g bdy.
B3 lOYR 4/4; sil; com fi yl brn mot; wk med pr brk mod med sbk; many fi blk Mn spk; fri; pH 5.7; c bdy.
OL lOYR 4/4 (70%) & 2.5Y 6/2 (30%); sil; com fi str brn mot; wk med pr; few disc gry coats on pr faces; com fi blk Mn spk; fri; pH 5.8; g bdy.
MOL lOYR 5/4 & 2.5Y 6/2; sil; com fi str brn mot; many fi blk Mn spk; loess.
MOU Same w/carbonates.
DU 5Y 5.5/2; sil; few fi blk Mn spk; cal; loess.
DU Same w/com Fe tbl.
2.5Y 5/4; sil; com fi blk Mn spk; loess.
DU 5Y 5.5/2; sil; few med str brn mot; few Fe tbl; loess.
MOU 7.5YR 5/6 & 5Y 5.5/2; sil & Is; cal; bedded silts & sands.
MOU lOYR 5/6 & 5Y 6/2; gty sil; gty loess.
UU N 4/0; sil; 1; mixed loess & till.
DL2 5G 6/1; 1; few pebbles; few Ca nod; Nebraskan till.
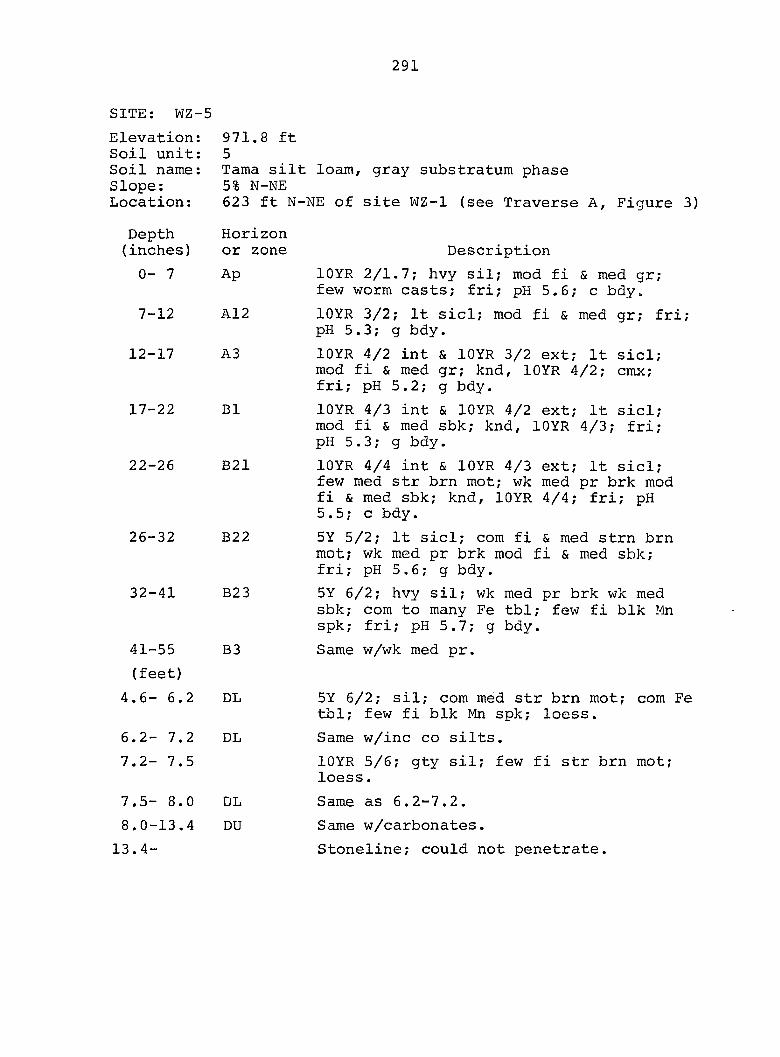
291
SITE: WZ-5
Elevation: Soil unit: Soil name: Slope: Location:
Depth (inches)
0- 7
7-12
12-17
17-22
22-26
26-32
32-41
971.8 ft 5 Tama silt loam, gray substratum phase 5% N-NE 623 ft N-NE of site WZ-1 (see Traverse A, Figure 3)
Horizon or zone
Ap
A12
A3
B1
B21
B22
B23
41-55 B3
(feet)
4.6-6.2 DL
6.2-7.2 DL
7.2- 7.5
7.5-8.0 DL
8.0-13.4 DU
13.4-
Description
lOYR 2/1.7; hvy sil; mod fi & med gr; few worm casts; fri; pH 5.6; c bdy.
lOYR 3/2; It sicl; mod fi & med gr; fri; pH 5.3; g bdy.
lOYR 4/2 int & lOYR 3/2 ext; It sicl; mod fi & med gr; knd, IGYR 4/2; cmx; fri; pH 5.2; g bdy.
10YR 4/3 int & lOYR 4/2 ext; It sicl; mod fi & med sbk; knd, lOYR 4/3; fri; pH 5.3; g bdy.
lOYR 4/4 int & lOYR 4/3 ext; It sicl; few med str brn mot; wk med pr brk mod fi & med sbk; knd, lOYR 4/4; fri; pH 5.5; c bdy.
5Y 5/2; It sicl; com fi & med strn brn mot; wk med pr brk mod fi & med sbk; fri; pH 5.6; g bdy.
5Y 6/2; hvy sil; wk med pr brk wk med sbk; com to many Fe tbl; few fi blk !!4n spk; fri; pH 5.7; g bdy.
Same w/wk med pr.
5Y 6/2; sil; com med str brn mot; com Fe tbl; few fi blk Mn spk; loess.
Same w/inc co silts.
lOYR 5/6; gty sil; few fi str brn mot; loess.
Same as 6.2-7.2.
Same w/carbonates.
Stoneline; could not penetrate.
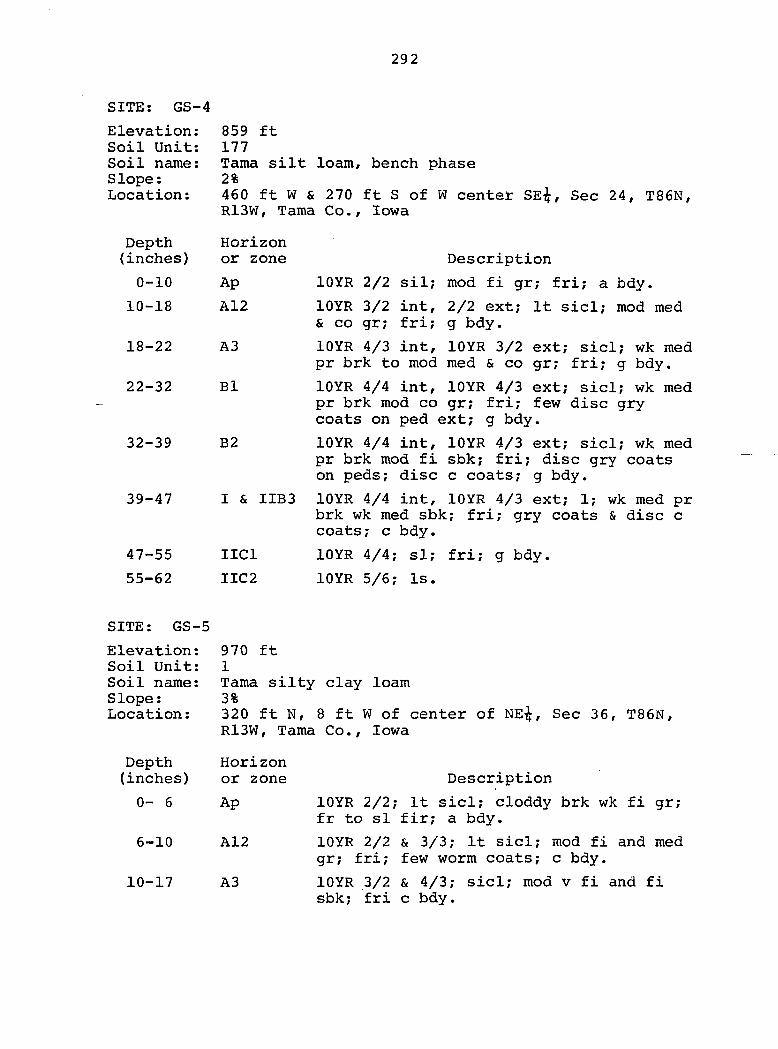
292
SITE: GS-4
Elevation: Soil Unit: Soil name; Slope : Location:
Depth (inches)
0-10
10-18
18-22
22-32
32-39
39-47
47-55
55-62
859 ft 177 Tama silt loam, bench phase 2% 460 ft W & 270 ft S of W centet SE&, Sec 24, T86N, R13W, Tama Co., Iowa
Horizon or zone
Ap
A12
A3
B1
B2
I & IIB3
IICl
IIC2
Description
lOYR 2/2 sil; mod fi gr; fri; a bdy.
lOYR 3/2 int, 2/2 ext; It sicl; mod med & CO gr; fri; g bdy.
lOYR 4/3 int, lOYR 3/2 ext; sicl; wk med pr brk to mod med & co gr; fri; g bdy.
lOYR 4/4 int, lOYR 4/3 ext; sicl; wk med pr brk mod co gr; fri; few disc gry coats on ped ext; g bdy.
lOYR 4/4 int, lOYR 4/3 ext; sicl; wk med pr brk mod fi sbk; fri; disc gry coats on peds; disc c coats; g bdy.
lOYR 4/4 int, lOYR 4/3 ext; 1; wk med pr brk wk med sbk; fri; gry coats & disc c coats; c bdy.
lOYR 4/4; si; fri; g bdy.
lOYR 5/6; Is.
SITE: GS-5
Elevation: Soil Unit: Soil name; Slope ; Location ;
Depth (inches)
0— 6
6-10
10-17
970 ft 1 Tama silty clay loam 3% 320 ft N, 8 ft W of center of NE^, Sec 36, T86N, R13W, Tama Co., Iowa
Horizon or zone
Ap
A12
A3
Description
lOYR 2/2; It sicl; cloddy brk wk fi gr; fr to si fir; a bdy.
lOYR 2/2 & 3/3; It sicl; mod fi and med gr; fri; few worm coats; c bdy.
lOYR 3/2 & 4/3; sicl; mod v fi and fi sbk; fri c bdy.
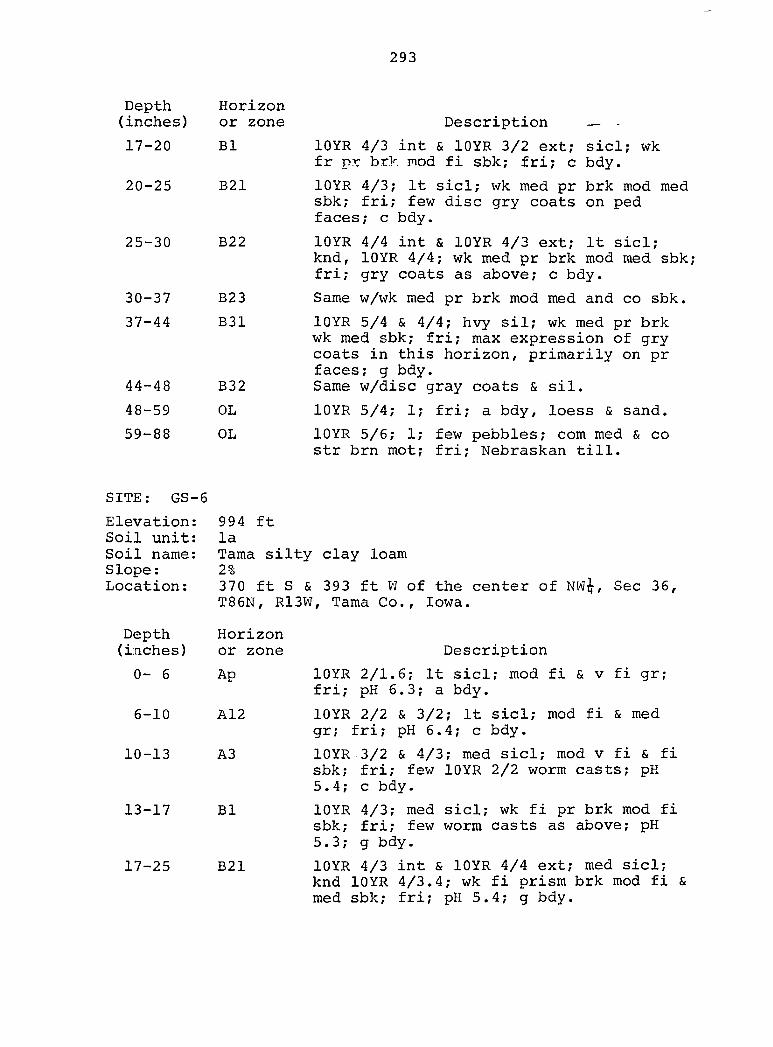
293
Depth Horizon (inches) or zone Description — -
17-20 B1 lOYR 4/3 int & lOYR 3/2 ext; sicl; wk fr pr brk mod fi sbk; fri; c bdy.
20-25 B21 lOYR 4/3; It sicl; wk med pr brk mod med sbk; fri; few disc gry coats on ped faces; c bdy.
25-30 B22 lOYR 4/4 int & lOYR 4/3 ext; It sicl; knd, lOYR 4/4; wk med pr brk mod med sbk; fri; gry coats as above; c bdy.
30-37 B23 Same w/wk med pr brk mod med and co sbk.
37-44 B31 lOYR 5/4 & 4/4; hvy sil; wk med pr brk wk med sbk; fri; max expression of gry coats in this horizon, primarily on pr faces; g bdy.
44-48 B32 Same w/disc gray coats & sil.
48-59 OL lOYR 5/4; 1; fri; a bdy, loess & sand.
59-88 OL lOYR 5/6; 1; few pebbles; com med & co str brn mot; fri; Nebraskan till.
SITE: GS-6
Elevation: Soil unit: Soil name: Slope : Location:
Depth (inches)
0- 6
6-10
10-13
13-17
17-25
994 ft la Tama silty clay loam 2% 370 ft S & 393 ft W of the center of NW^, Sec 36, T86N, R13W, Tama Co., Iowa.
Horizon or zone
Ap
A12
A3
B1
B21
Description
lOYR 2/1.6; It sicl; mod fi & v fi gr; fri; pH 6.3; a bdy.
lOYR 2/2 & 3/2; It sicl; mod fi & med gr; fri; pH 6.4; c bdy.
lOYR 3/2 & 4/3; med sicl; mod v fi & fi sbk; fri; few 10YR 2/2 worm casts; pH 5.4; c bdy.
lOYR 4/3; med sicl; wk fi pr brk mod fi sbk; fri; few worm casts as above; pH 5.3; g bdy.
lOYR 4/3 int & lOYR 4/4 ext; med sicl; knd lOYR 4/3.4; wk fi prism brk mod fi & med sbk; fri; pH 5.4; g bdy.
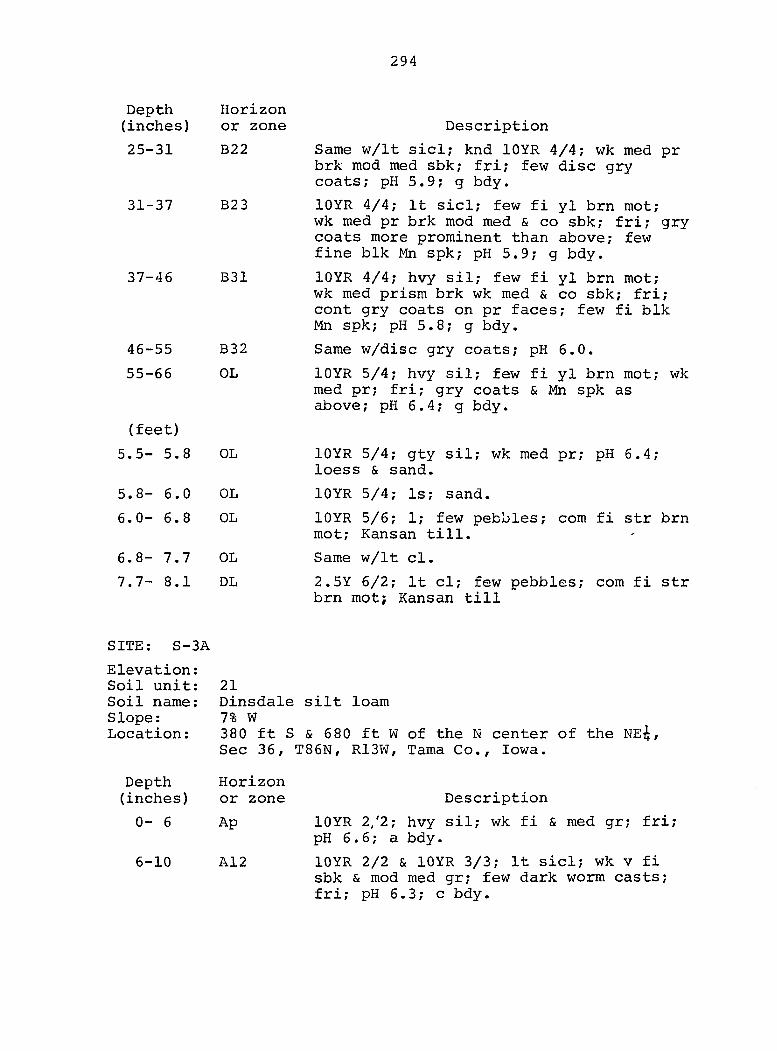
294
Depth Horizon (inches) or zone Description
25-31 B22 Same w/lt sicl; knd lOYR 4/4; wk med pr brk mod med sbk; fri; few disc gry coats; pH 5.9; g bdy.
31-37 B23 lOYR 4/4; It sicl; few fi yl brn mot; wk med pr brk mod med & co sbk; fri; gry coats more prominent than above; few fine blk Mn spk; pH 5.9; g bdy.
37-46 B31 lOYR 4/4; hvy sil; few fi yl brn mot; wk med prism brk wk med & co sbk; fri; cont gry coats on pr faces; few fi blk Mn spk; pH 5.8; g bdy.
46-55 332 Same w/disc gry coats; pH 6.0.
55-66 OL lOYR 5/4; hvy sil; few fi yl brn mot; wk med pr; fri; gry coats & Mn spk as above; pH 6.4; g bdy.
(feet)
5.5- 5.8 OL lOYR 5/4; gty sil; wk med pr; pH 6.4; loess & sand.
5.8-6.0 OL lOYR 5/4; Is; sand.
6.0- 6.8 OL lOYR 5/6; 1; few pebbles; com fi str brn mot; Kansan till.
6.8- 7.7 OL Same w/lt cl.
7.7-8.1 DL 2.5Y 6/2; It cl; few pebbles; com fi str brn mot; Kansan till
SITE; S-3A
Elevation: Soil unit: Soil name: Slope: Location:
Depth (inches)
0— 6
6-10
21 Dinsdale silt loam 7% W 380 ft S & 680 ft W of the N Sec 36, T86N, R13W, Tama Co.,
center of the NE&, Iowa.
Horizon or zone
Ap
A12
Description
lOYR 2/2; hvy sil; wk fi & med gr; fri; pH 6.6; a bdy.
lOYR 2/2 & lOYR 3/3; It sicl; wk v fi sbk & mod med gr; few dark worm casts; fri; pH 6.3; c bdy.
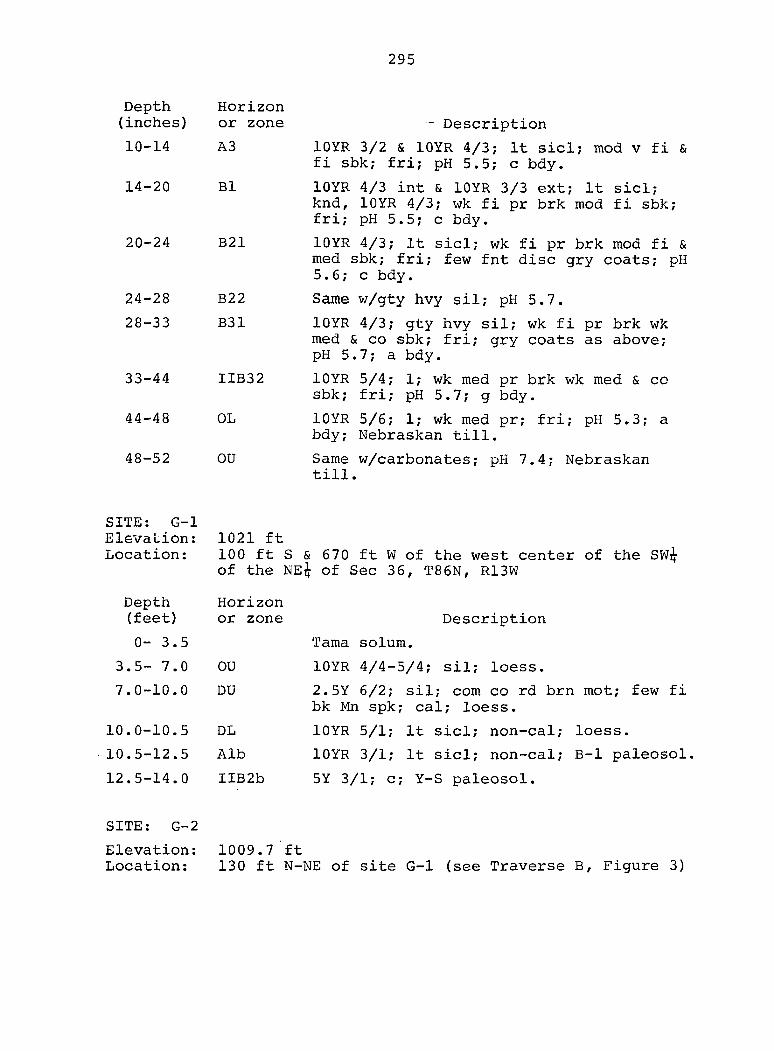
295
Depth (inches)
10-14
14-20
20-24
24-28
28-33
33-44
44-48
48-52
SITE; G-1 ElevaLion: Location:
Depth (feet)
0-3.5
3.5- 7.0
7.0-10.0
10.0-10.5
10.5-12.5
12.5-14.0
SITE: G-2
Elevation: Location:
Horizon or zone
A3
B1
B21
B22
B31
IIB32
OL
OU
- Description
lOYR 3/2 & lOYR 4/3; It sicl; mod v fi & fi sbk; fri; pH 5.5; c bdy.
lOYR 4/3 int & lOYR 3/3 ext; It sicl; knd, lOYR 4/3; wk fi pr brk mod fi sbk; fri; pH 5.5; c bdy.
lOYR 4/3; It sicl; wk fi pr brk mod fi & med sbk; fri; few fnt disc gry coats; pH 5.6; c bdy.
Same w/gty hvy sil; pH 5.7.
lOYR 4/3; gty hvy sil; wk fi pr brk wk med & CO sbk; fri; gry coats as above; pH 5.7; a bdy.
lOYR 5/4; 1; wk med pr brk wk med & co sbk; fri; pH 5.7; g bdy.
lOYR 5/6; 1; wk med pr; fri; pH 5.3; a bdy; Nebraskan till.
Same w/carbonates; pH 7.4; Nebraskan till.
1021 ft 100 ft S & 670 ft W of the west center of the SW^ of the NE^f of Sec 36, T86N, R13W
Horizon or zone Description
Tama solum.
OU lOYR 4/4-5/4; sil; loess.
DU 2.5Y 6/2; sil; com co rd brn mot; few fi bk lyin spk; cal; loess.
DL lOYR 5/1; It sicl; non-cal; loess.
Alb lOYR 3/1; It sicl; non-cal; B-1 paleosol.
IIB2b 5Y 3/1; c; Y-S paleosol.
1009.7 ft 130 ft N-NE of site G-1 (see Traverse B, Figure 3)
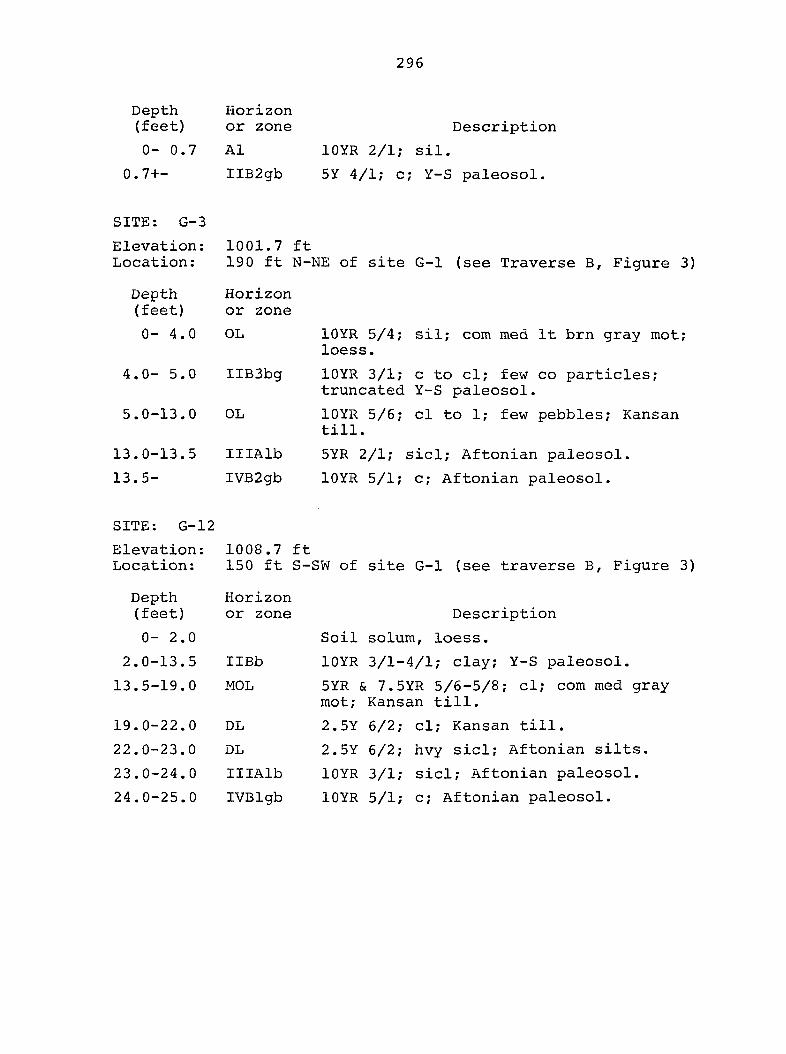
296
Depth (feet)
0- 0.7
0.7+-
Horizon or zone
A1
IIB2gb
Description
lOYR 2/1; sil.
5Y 4/1; c; Y-S paleosol.
SITE: G-3
Elevation: 1001.7 ft Location: 190 ft N-NE of site G-1 (see Traverse B, Figure 3)
Depth (feet)
Horizon or zone
0-4.0 OL
4.0- 5.0 IIBBbg
5.0-13.0 OL
13.0-13.5 IIIAlb
13.5- IVB2gb
lOYR 5/4; sil; com med It brn gray mot; loess.
lOYR 3/1; c to cl; few co particles; truncated Y-S paleosol.
lOYR 5/6; cl to 1; few pebbles; Kansan till.
5YR 2/1; sicl; Aftonian paleosol.
lOYR 5/1; c; Aftonian paleosol.
SITE: G-12
Elevation: Location:
Depth (feet)
0 - 2 . 0
2.0-13.5
13.5-19.0
19.0-22.0
22.0-23.0
23.0-24.0
24.0-25.0
1008.7 ft 150 ft S-SW of site G-1 (see traverse B, Figure 3)
Horizon or zone Description
Soil solum, loess.
IIBb lOYR 3/1-4/1; clay; Y-S paleosol.
MOL 5YR & 7.5YR 5/6-5/8; cl; com med gray mot; Kansan till.
DL 2.5Y 6/2; cl; Kansan till.
DL 2.5Y 6/2; hvy sicl; Aftonian silts.
IIIAlb lOYR 3/1; sicl; Aftonian paleosol.
IVBlgb lOYR 5/1; c; Aftonian paleosol.
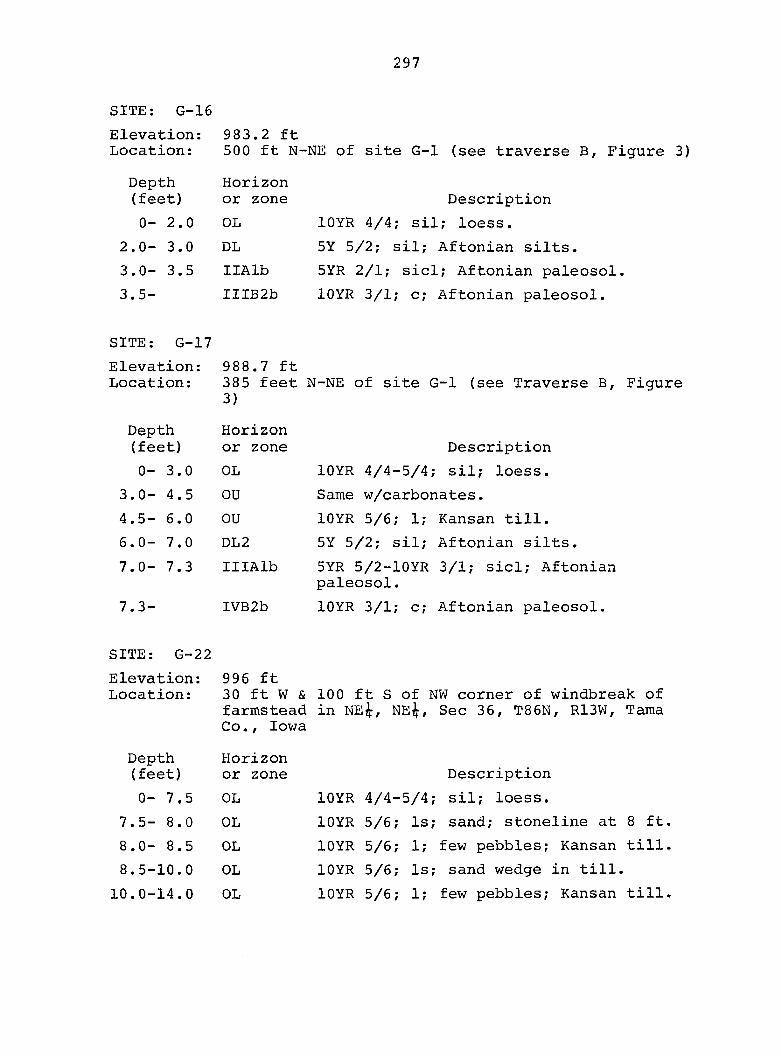
297
SITE: G-16
Elevation: Location:
Depth (feet)
0 - 2 . 0
2.0- 3.0
3.0- 3.5
3.5-
983.2 ft 500 ft N-NE of site G-1 (see traverse B, Figure 3)
Horizon or zone
OL
DL
IIAlb
IIIB2b
Description
lOYR 4/4; sil; loess.
5Y 5/2; sil; Aftonian silts.
5YR 2/1; sicl; Aftonian paleosol,
lOYR 3/1; c; Aftonian paleosol.
SITE; G-17
Elevation: Location:
Depth (feet)
0-3.0
3.0- 4.5
4.5- 6.0
5.0— 7.0
7.0- 7.3
7.3-
988.7 ft 385 feet N-NE of site G-1 (see Traverse B, Figure 3)
Horizon or zone Description
OL lOYR 4/4-5/4; sil; loess.
OU Same w/carbonates.
OU lOYR 5/6; 1; Kansan till.
DL2 5Y 5/2; sil; Aftonian silts.
IIIAlb 5YR 5/2-lOYR 3/1; sicl; Aftonian paleosol.
IVB2b lOYR 3/1; c; Aftonian paleosol.
SITE: G-22
Elevation: Location:
Depth (feet)
0- 7.5
7.5- 8.0
8.0- 8.5
8.5-10.0
10.0-14.0
996 ft 30 ft W & 100 ft S of NW corner of windbreak of farmstead in NE&, NE&, Sec 36, T86N, R13W, Tama Co., Iowa
Horizon or zone
OL
OL
OL
OL
OL
Description
lOYR 4/4-5/4; sil; loess.
lOYR 5/6; Is; sand; stoneline at 8 ft.
lOYR 5/6; 1; few pebbles; Kansan till.
lOYR 5/6; Is; sand wedge in till.
lOYR 5/6; 1; few pebbles; Kansan till.
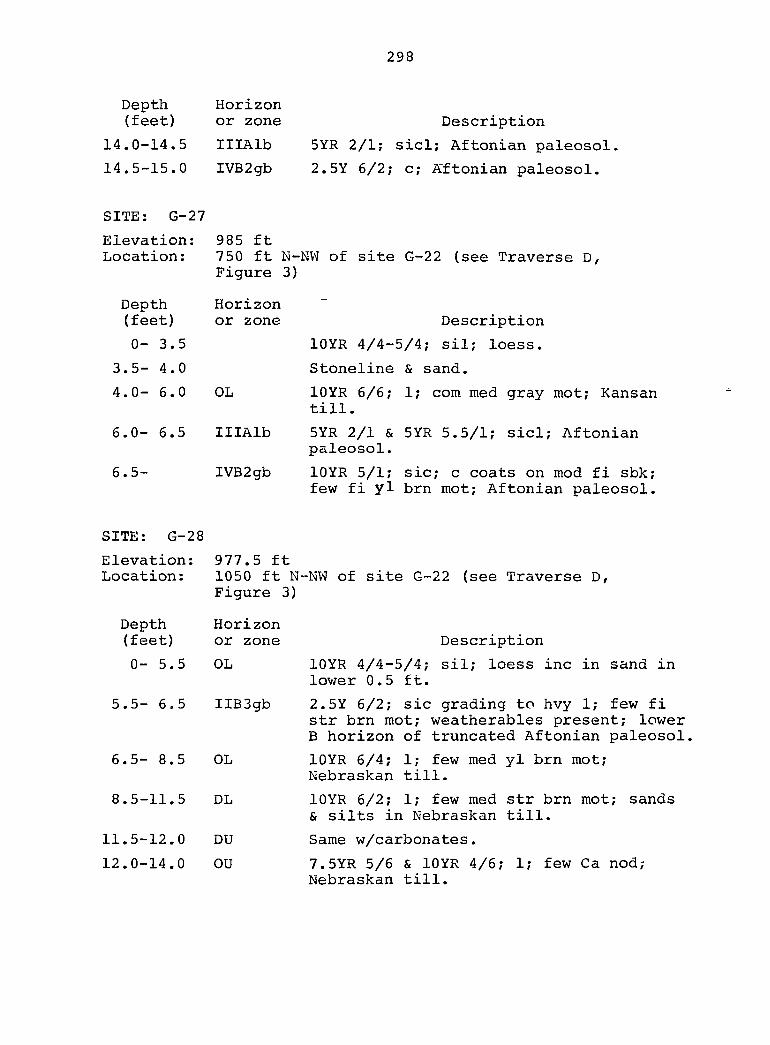
298
Depth (feet)
14.0-14.5
14.5-15.0
Horizon or zone
IIIAlb
IVB2gb
Description
5YR 2/1; sicl; Aftonian paleosol
2.5Y 6/2; c; Aftonian paleosol.
SITE: G-27
Elevation: 985 ft Location: 750 ft N-NW of site G-22 (see Traverse D,
Figure 3)
Depth (feet)
0- 3.5
3.5- 4.0
4.0- 6.0
6.0- 6.5
6.5-
Horizon or zone
OL
IIIAlb
IVB2gb
Description
lOYR 4/4-5/4; sil; loess.
Stoneline & sand.
lOYR 6/6; 1; com med gray mot; Kansan till.
5YR 2/1 & 5YR 5.5/1; sicl; Aftonian paleosol.
lOYR 5/1; sic; c coats on mod fi sbk; few fi yl brn mot; Aftonian paleosol.
SITE: G-28
Elevation: 977.5 ft Location: 1050 ft N~NW of site G-22 (see Traverse D,
Figure 3)
Depth Horizon (feet) or zone Description
0-5.5 OL lOYR 4/4-5/4; sil; loess inc in sand in lower 0.5 ft.
5.5- 6.5 IIB3gb 2.5Y 6/2; sic grading to hvy 1; few fi str brn mot; weatherables present; lower B horizon of truncated Aftonian paleosol.
6.5- 8.5 OL lOYR 6/4; 1; few med yl brn mot; Nebraskan till.
8.5-11.5 DL lOYR 6/2; 1; few med str brn mot; sands & silts in Nebraskan till.
11.5-12.0 DU Same w/carbonates.
12.0-14.0 OU 7.5YR 5/6 & lOYR 4/6; 1; few Ca nod; Nebraskan till.
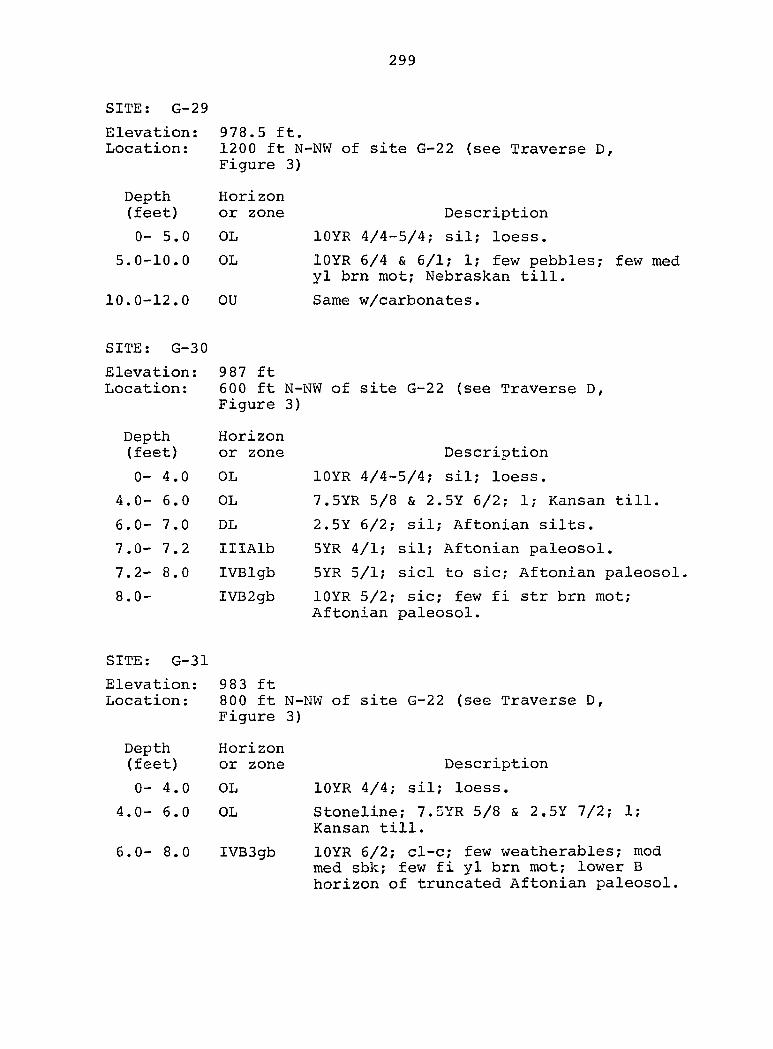
299
SITE: G-29
Elevation: Location:
Depth (feet)
0- 5.0
5.0-10.0
10.0-12.0
978.5 ft. 1200 ft N-NW of site G-22 (see Traverse D, Figure 3)
Horizon or zone
OL
OL
OU
Description
lOYR 4/4-5/4; sil; loess.
10YR 6/4 & 6/1; 1; few pebbles; few med yl brn mot; Nebraskan till.
Same w/carbonates.
SITE: G-30
Elevation: Location:
Depth (feet)
0- 4.0
4.0- 6.0
6.0— 7.0
7.0- 7.2
7.2- 8.0
8.0-
987 ft 600 ft N-NW of site G-22 (see Traverse D, Figure 3)
Horizon or zone Description
OL lOYR 4/4-5/4; sil; loess.
OL 7.5YR 5/8 & 2.5Y 6/2; 1; Kansan till.
DL 2.5Y 6/2; sil; Aftonian silts.
IIIAlb 5YR 4/1; sil; Aftonian paleosol.
IVBlgb 5YR 5/1; sicl to sic; Aftonian paleosol,
IVB2gb lOYR 5/2; sic; few fi str brn mot; Aftonian paleosol.
SITE: G-31
Elevation: 983 ft Location: 800 ft N-NW of site G-22 (see Traverse D,
Depth (feet)
0-4.0
4.0- 6.0
6 . 0 - 8 . 0
Figure 3)
Horizon or zone
OL
OL
IVB3gb
Description
lOYR 4/4; sil; loess.
Stoneline; 7.5YR 5/8 & 2.5Y 7/2; 1; Kansan till.
lOYR 6/2; cl-c; few weatherables; mod med sbk; few fi yl brn mot; lower B horizon of truncated Aftonian paleosol,
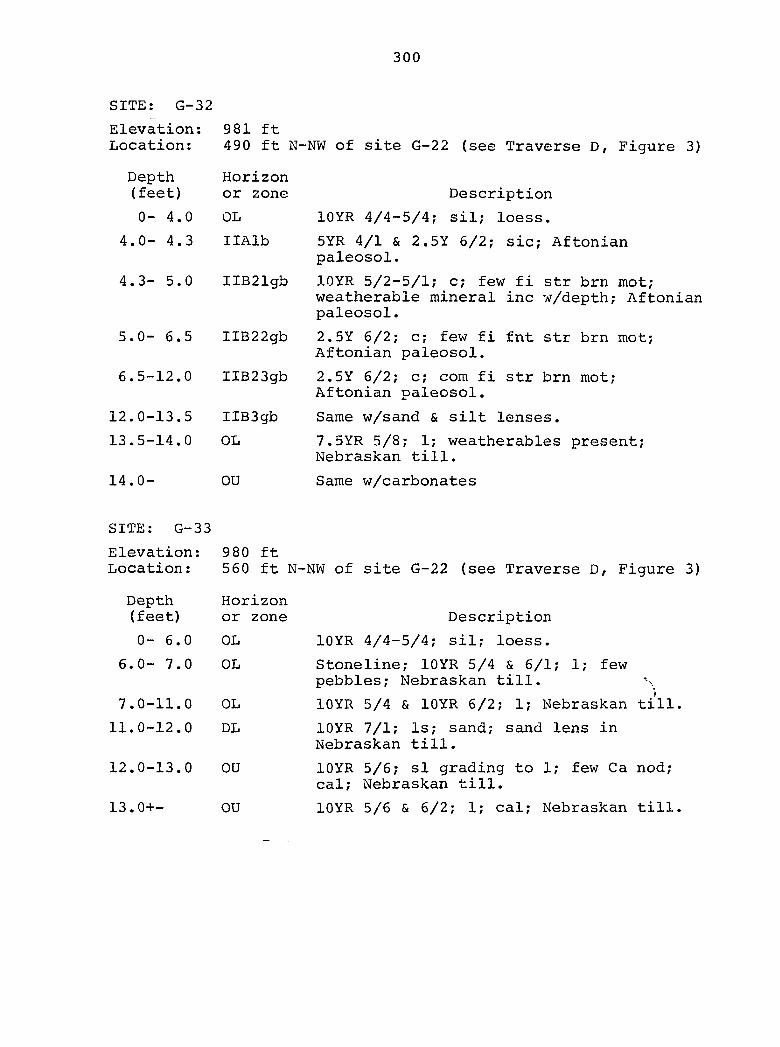
300
SITE: G-32
Elevation: 981 ft Location: 490 ft N-NW of site G-22 (see Traverse D, Figure 3)
Depth (feet)
0- 4.0
4.0- 4.3
Horizon or zone
OL
IIAlb
4.3- 5.0 IIB21gb
5.0- 6.5 IIB22gb
6.5-12.0 IIB23gb
12.0-13.5 IIB3gb
13.5-14.0 OL
Description
lOYR 4/4-5/4; sil; loess.
5YR 4/1 & 2.5Y 6/2; sic; Aftonian paleosol.
lOYR 5/2-5/1; c; few fi str brn mot; weatherable mineral inc w/depth; Aftonian paleosol.
2.5Y 6/2; c; few fi fnt str brn mot; Aftonian paleosol.
2.5Y 6/2; c; com fi str brn mot; Aftonian paleosol.
Same w/sand & silt lenses.
7.5YR 5/8; 1; weatherables present; Nebraskan till.
14.0- OU Same w/carbonates
SITE: G-33
Elevation: 9 80 ft Location: 560 ft N-NW of site G-22 (see Traverse D, Figure 3)
Depth Horizon (feet) or zone Description
0-6.0 OL lOYR 4/4-5/4; sil; loess.
6.0-7.0 OL Stoneline; 10YR 5/4 & 6/1; 1; few pebbles; Nebraskan till. \
7.0-11.0 OL lOYR 5/4 & lOYR 6/2; 1; Nebraskan till.
11.0-12.0 DL lOYR 7/1; Is; sand; sand lens in Nebraskan till.
12.0-13.0 OU lOYR 5/6; si grading to 1; few Ca nod; cal; Nebraskan till.
13.0+- OU lOYR 5/6 & 6/2; 1; cal; Nebraskan till.
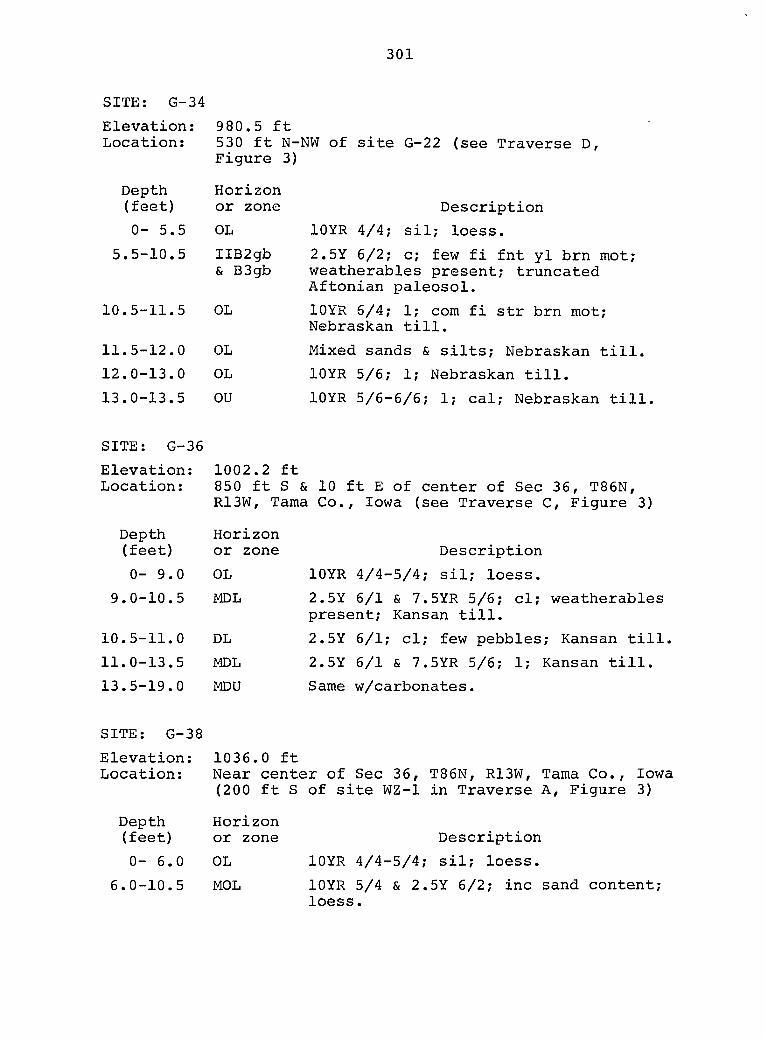
301
SITE: G-34
Elevation: Location:
Depth (feet)
0- 5.5
5.5-10.5
10.5-11.5
11.5-12.0
12.0-13.0
13.0-13.5
980.5 ft 530 ft N-NW of site G-22 (see Traverse D, Figure 3)
Horizon or zone Description
OL lOYR 4/4; sil; loess.
IIB2gb 2.5Y 6/2; c; few fi fnt yl brn mot; & B3gb weatherables present; truncated
Aftonian paleosol.
OL lOYR 6/4; 1; com fi str brn mot; Nebraskan till.
OL Mixed sands & silts; Nebraskan till.
OL lOYR 5/6; 1; Nebraskan till.
OU lOYR 5/6-6/6; 1; cal; Nebraskan till.
SITE: G-36
Elevation: Location:
Depth (feet)
0-9.0
9.0-10.5
10.5-11.0
11.0-13.5
13.5-19.0
1002.2 ft 850 ft S & 10 ft E of center of Sec 36, T86N, R13W, Tama Co., Iowa (see Traverse C, Figure 3)
Horizon or zone
OL
MDL
DL
MDL
MDU
Description
lOYR 4/4-5/4; sil; loess.
2.5Y 6/1 & 7.5YR 5/6; cl; weatherables present; Kansan till.
2.5Y 6/1; cl; few pebbles; Kansan till.
2.5Y 6/1 & 7.5YR 5/6; 1; Kansan till.
Same w/carbonates.
SITE: G-38
Elevation: 1036.0 ft Location: Near center of Sec 36, T86N, R13W, Tama Co., Iowa
(200 ft S of site WZ-1 in Traverse A, Figure 3)
Depth (feet)
0 - 6 . 0
6.0-10.5
Horizon or zone
OL
MOL
Description
lOYR 4/4-5/4; sil; loess.
lOYR 5/4 & 2.5Y 6/2; inc sand content; loess.
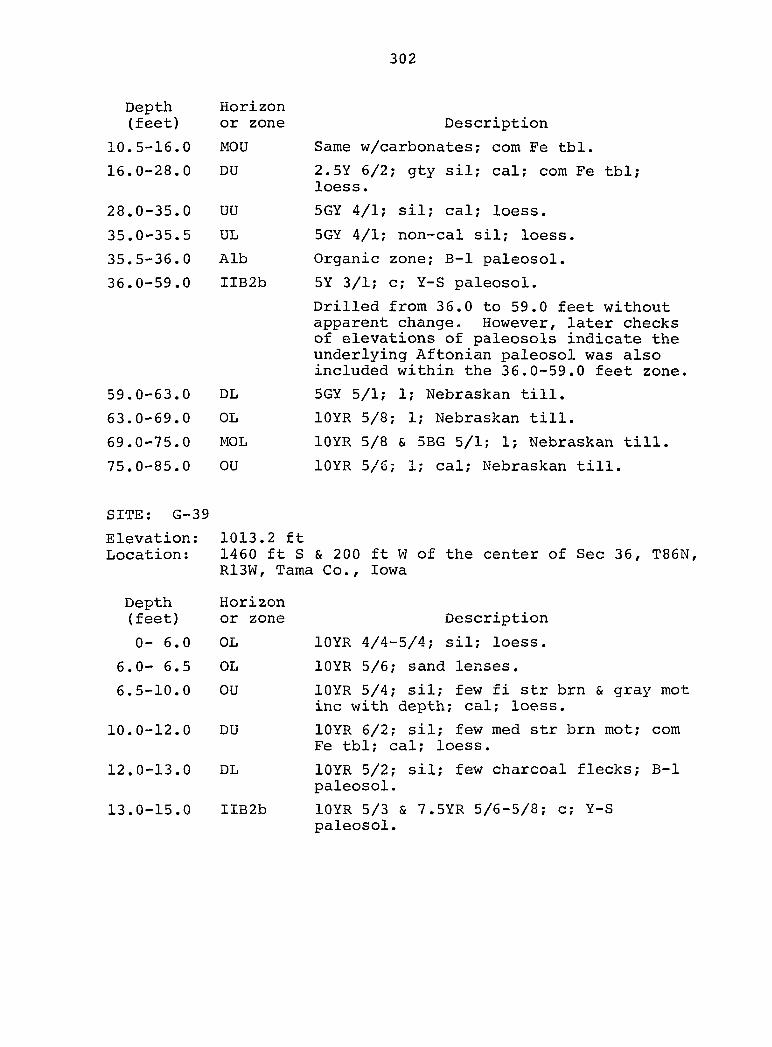
302
Depth (feet)
10.5-16.0
16.0-28.0
28.0-35.0
35.0-35.5
35.5-36.0
36.0-59.0
59.0-63.0
63.0-69.0
69.0-75.0
75.0-85.0
Horizon or zone
MOU
DU
UU
UL
Alb
IIB2b
DL
OL
MOL
OU
Description
Same w/carbonates; com Fe tbl.
2.5Y 6/2; gty sil; cal; com Fe tbl; loess.
5GY 4/1; sil; cal; loess.
5GY 4/1; non-cal sil; loess.
Organic zone; B-1 paleosol.
5Y 3/1; c; Y-S paleosol.
Drilled from 36.0 to 59.0 feet without apparent change. However, later checks of elevations of paleosols indicate the underlying Aftonian paleosol was also included within the 36.0-59.0 feet zone.
5GY 5/1; 1; Nebraskan till.
lOYR 5/8; 1; Nebraskan till.
lOYR 5/8 & 5BG 5/1; 1; Nebraskan till.
lOYR 5/6; 1; cal; Nebraskan till.
SITE; G-39
Elevation: 1013.2 ft Location: 1460 ft S & 200 ft W of the center of Sec 36, T86N,
R13W, Tama Co., Iowa
Depth Horizon (feet) or zone Description
0-6.0 OL lOYR 4/4-5/4; sil; loess.
6.0-6.5 OL lOYR 5/6; sand lenses.
6.5-10.0 OU lOYR 5/4; sil; few fi str brn & gray mot inc with depth; cal; loess.
10.0-12.0 DU lOYR 6/2; sil; few med str brn mot; com Fe tbl; cal; loess.
12.0-13.0 DL lOYR 5/2; sil; few charcoal flecks; B-1 paleosol.
13.0-15.0 IIB2b lOYR 5/3 & 7.5YR 5/6-5/8; c; Y-S paleosol.
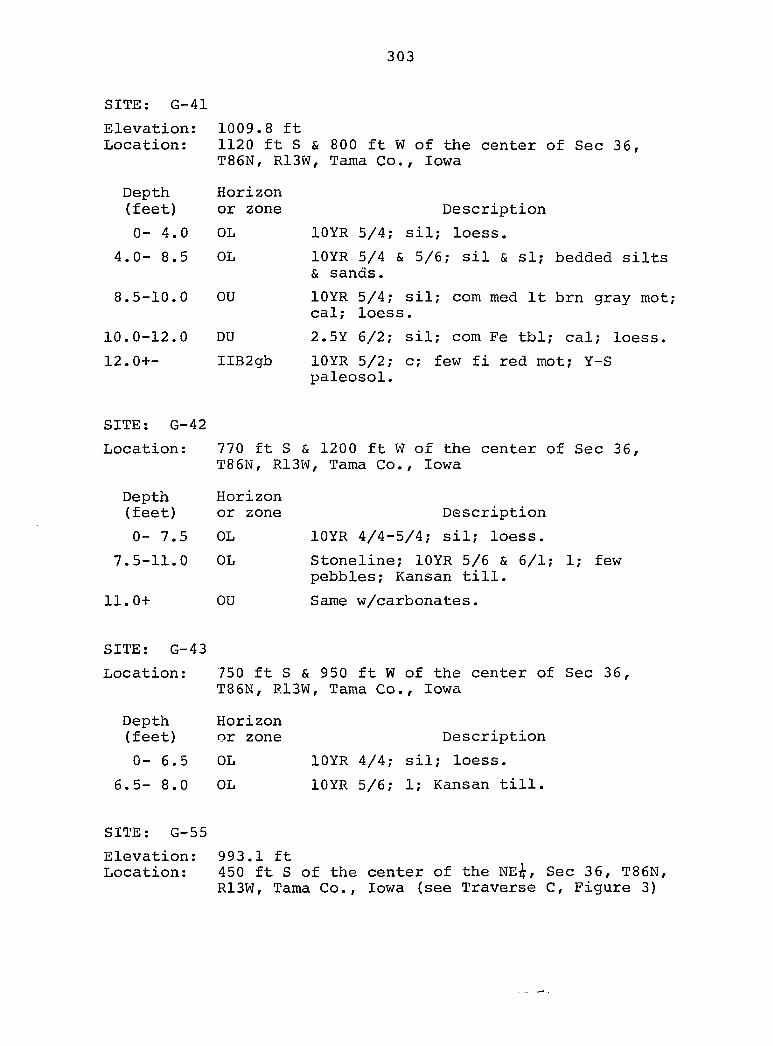
303
SITE; G-41
Elevation: 1009.8 ft Location: 1120 ft S & 800 ft W of the center of Sec 36,
T86N, R13W, Tama Co., Iowa
Depth (feet)
0-4.0
4.0- 8.5
8.5-10.0
10.0-12.0
12.0+-
Horizon or zone
OL
OL
OU
DU
IIB2gb
Description
lOYR 5/4; sil; loess.
lOYR 5/4 & 5/6; sil & si; bedded silts & sands.
lOYR 5/4; sil; com med It brn gray mot; cal; loess.
2.5Y 6/2; sil; com Fe tbl; cal; loess.
lOYR 5/2; c; few fi red mot; Y-S paleosol.
SITE: G-42
Location :
Depth (feet)
0- 7.5
7.5-11.0
11.0+
770 ft S & 1200 ft W of the center of Sec 36, T86N, R13W, Tama Co., Iowa
Horizon or zone
OL
OL
OU
Description
lOYR 4/4-5/4; sil; loess.
Stoneline; 10YR 5/6 & 6/1; 1; few pebbles; Kansan till.
Same w/carbonates.
SITE: G-43
Location:
Depth (feet)
0- 6.5
6.5- 8.0
750 ft S & 950 ft W of the center of Sec 36, T86N, R13W, Tama Co., Iowa
Horizon or zone
OL
OL
Description
lOYR 4/4; sil; loess.
10YR 5/6; 1; Kansan till.
SITE: G-55
Elevation: 993.1 ft Location: 450 ft S of the center of the NE&, Sec 36, T86N,
R13W, Tama Co., Iowa (see Traverse C, Figure 3)
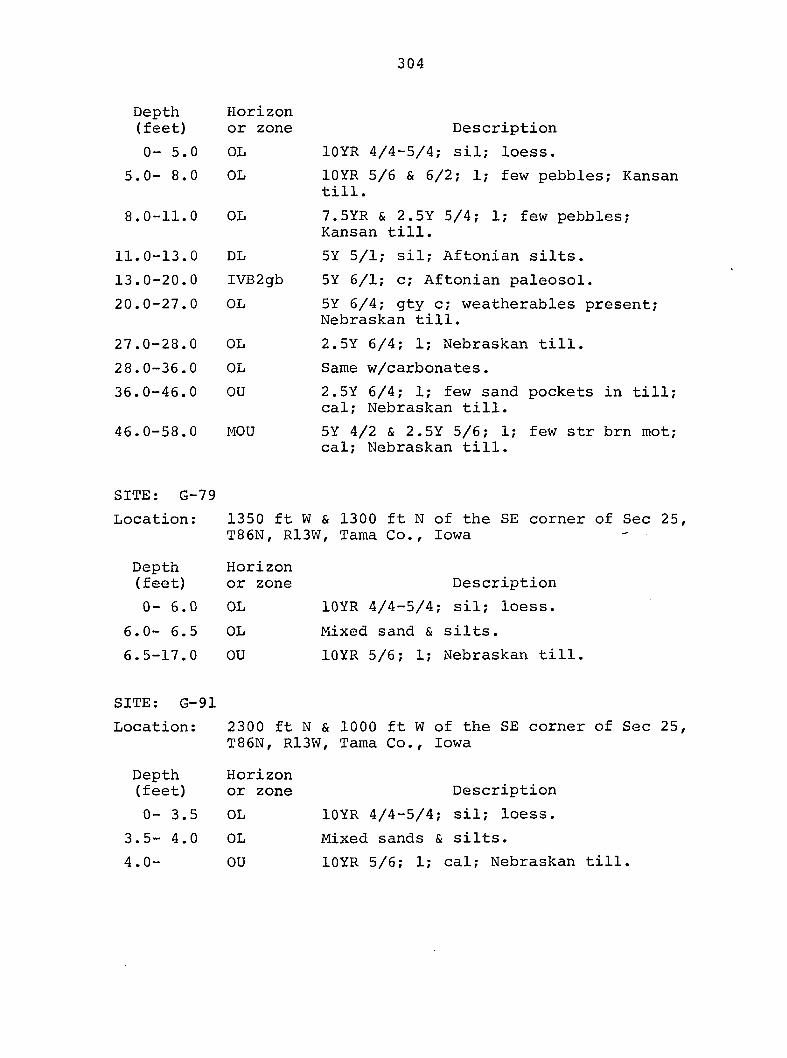
304
Depth Horizon (feet) or zone Description
0-5.0 OL lOYR 4/4-5/4; sil; loess.
5.0- 8.0 OL 10YR 5/6 & 6/2; 1; few pebbles; Kansan till.
8.0-11.0 OL 7.5YR & 2.5Y 5/4; 1; few pebbles; Kansan till.
11.0-13.0 DL 5Y 5/1; sil; Aftonian silts.
13.0-20.0 IVB2gb 5Y 6/1; c; Aftonian paleosol.
20.0-27.0 OL 5Y 6/4; gty c; weatherables present; Nebraskan till.
27.0-28.0 OL 2.5Y 6/4; 1; Nebraskan till.
28.0-36.0 OL Same w/carbonates.
36.0-46.0 OU 2.5Y 6/4; 1; few sand pockets in till; cal; Nebraskan till.
46.0-58.0 MOU 5Y 4/2 & 2.5Y 5/6; 1; few str brn mot; cal; Nebraskan till.
SITE: G-79
Location: 1350 ft W & 1300 ft N of the SE corner of Sec 25, T86N, R13W, Tama Co., Iowa
Depth Horizon (feet) or zone Description
0- 6.0 OL lOYR 4/4-5/4; sil; loess.
6.0- 6.5 OL Mixed sand & silts.
6.5-17.0 OU lOYR 5/6; 1; Nebraskan till.
SITE: G-91
Location: 2300 ft N & 1000 ft W of the SE corner of Sec 25, T86N, R13W, Tama Co., Iowa
Depth Horizon (feet) or zone Description
0- 3.5 OL lOYR 4/4-5/4; sil; loess.
3.5-4.0 OL Mixed sands & silts.
4.0- OU lOYR 5/6; 1; cal; Nebraskan till.

305
SITE: G-93
Location:
Depth (feet)
0- 3.0
3.0- 4.0
4.0-
850 ft N & 750 ft W of the E center of Sec 25, T86N, R13W, TamajCo., Iowa
Horizon or zone
OL
OL
OU
Description
lOYR 4/4; sil; loess.
lOYR 5/6; 1; Nebraskan till.
Same w/carbonates.
SITE; G-94
Location:
Depth (feet)
0- 4.0
4.0- 6.0
6.0- 7.5
7.5- 8.0
1500 ft N of the N center of the SE&, Sec 25, T86N, R13W, Tama Co., Iowa, on low ridgetop
Horizon or zone
OL
OL
OL
OU
Description
lOYR 4/4; sil; loess.
lOYR 5/6; sand w/few silt lenses.
lOYR 5/6; 1; Nebraskan till.
Same w/carbonates.
SITE: G-104
Elevation: Location :
Depth (feet)
0- 3.5
3.5- 6.0
6 . 0 — 8 . 0
8 . 0 - 8 . 2
8.2-10.5
10.5-17.0
17.0-17.2
17.2-18.0
1002.2 ft 1000 ft S & 80 ft W of the center of Sec 36, T86N, R13W, Tama Co., Iowa (see Traverse C, Figure 3)
Horizon or zone
OL
OL
OL
OL
IIIAlb
IVB2gb
Description
Solum; loess.
lOYR 4/3; sil; com med str brn & It brn gray mot; few fi blk Mn spk.
lOYR 4/4; sil; mot as above.
Sand lens.
lOYR 5/6 & 2.5Y 5/2; cl; com med str brn mot inc w/depth; Kansan till.
Same w/carbonates.
5YR 3/1; sicl; Aftonian paleosol.
2.5Y 6/1; c; Aftonian paleosol.
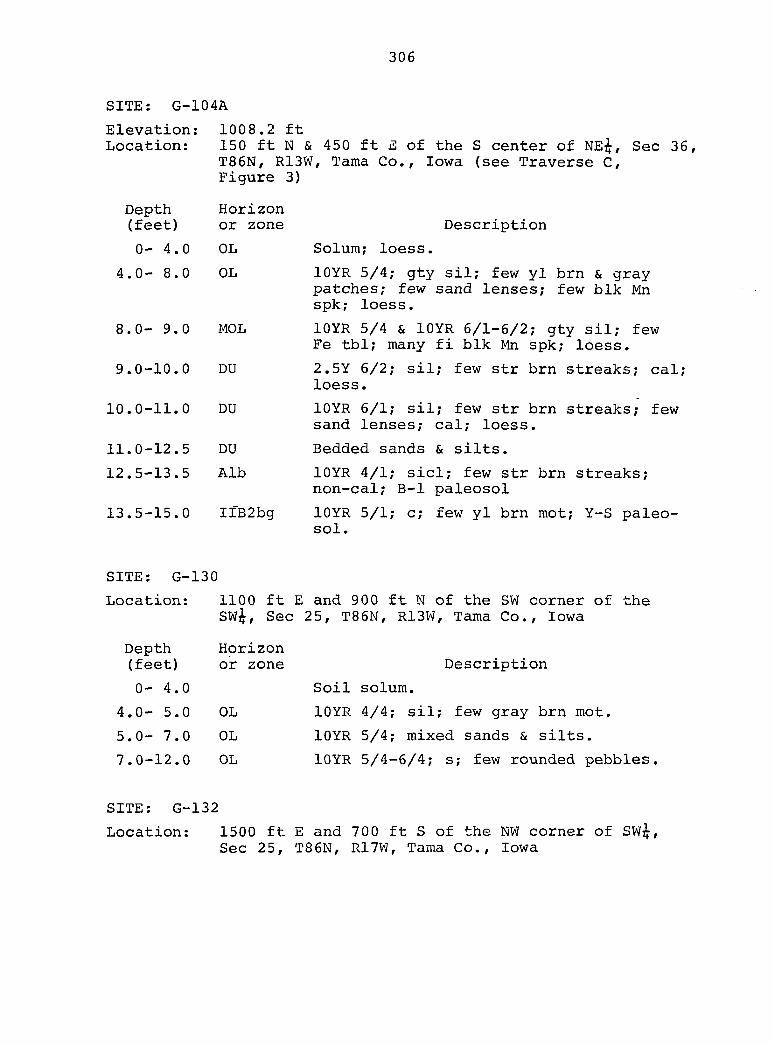
306
SITE: G-104A
Elevation: Location:
Depth (feet)
0- 4,
4.0— 8,
8.0- 9
9.0-10.0
10.0-11.0
11.0-12.5
12.5-13.5
13.5-15.0
1008.2 ft 150 ft N & 450 ft E of the S center of NE^, Sec 36, T86N, R13W, Tama Co., Iowa (see Traverse C, Figure 3)
Horizon or zone
OL
OL
MOL
DU
DU
DU
Alb
IIB2bg
Description
Solum; loess,
lOYR 5/4; gty sil; few yl brn & gray patches; few sand lenses; few blk Mn spk; loess.
lOYR 5/4 & lOYR 6/1-6/2; gty sil; few Fe tbl; many fi blk Mn spk; loess.
2.5Y 6/2; sil; few str brn streaks; cal; loess.
10YR 6/1; sil; few str brn streaks; few sand lenses; cal; loess.
Bedded sands & silts.
lOYR 4/1; sicl; few str brn streaks; non-cal; B-1 paleosol
10YR 5/1; c; few yl brn mot; Y-S paleosol.
SITE; G-130
Location:
Depth (feet)
1100 ft E and 900 ft N of the SW corner of SW&, Sec 25, T86N, R13W, Tama Co., Iowa
Horizon or zone Description
0
1 o Soil
4.0- 5.0 OL lOYR
5.0- 7.0 OL lOYR
7.0-12.0 OL lOYR
SITE; G-132
Location: 1500 ft E and Sec 25, T86N, ]
:he

307
Depth (feet)
0- 4.5
4.5- 6.0
6.0— 9.0
9.0+-
Horizon or zone
OL
OL
OL
OU
Description
lOYR 2/2-4/3; gty sil.
Mixed sands & silts.
Clean sorted sand.
Same w/carbonates.
SITE; G-135
Location: 1700 ft E & 400 ft S of the W center of the SW^, Sec 24, T86N, R17W, Tama Co., Iowa
Depth (feet)
0- 4.0
4.0- 8.5
Horizon or zone
OL
Description
Soil solum.
lOYR 5/4-4/4; Is & sand; grades to lOYR 5/4; loose sand.
SITE: G-140
Elevation: Location:
979.6 ft North road ditch, 1350 ft W of NE corner of Sec 36, T86N, R13W, Tama Co., Iowa
Depth Horizon (feet) or zone Description
0- y.O Ditch and fill.
7.0- 9.0 OL lOYR 5/6; 1 to cl; Nebraskan till.
9.0-21.0 OL lOYR 5/4; 1; few med yl brn & It brn gray mot; Nebraskan till.
21.0-24.0 DU lOYR 6/1 & 5/1; cl; few med str brn mot; cal; Nebraskan till.
24.0-27.0 MDU 5Y 2/1; cl; few med yl brn mot; cal; Nebraskan till.
27.0-32.0 UU N 3/0; cl; few med dk olive gray & olive mot; cal; Nebraskan till.
32.0-35.0 UU N 4/0; cl; cal; Nebraskan till.
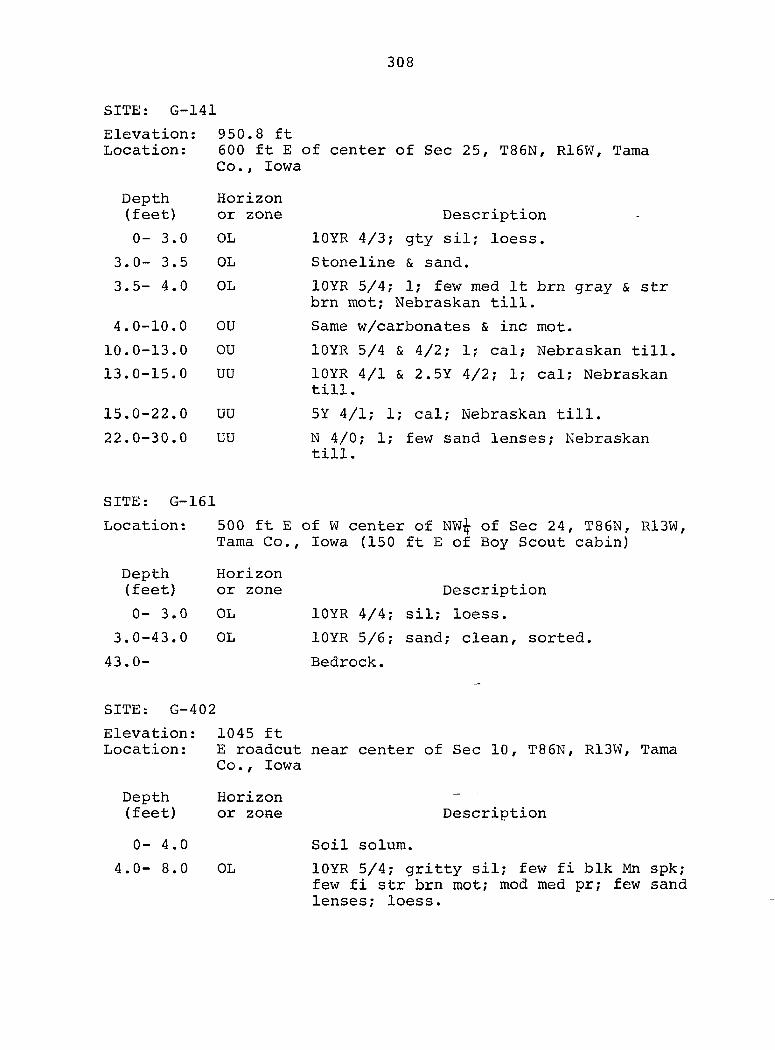
308
SITE: G-141
Elevation: 950.8 ft Location: 600 ft E of center of Sec 25, T86N, R16W, Tama
Co., Iowa
Depth Horizon (feet) or zone Description
0-3.0 OL lOYR 4/3; gty sil; loess.
3.0- 3.5 OL Stoneline & sand.
3.5- 4.0 OL lOYR 5/4; 1; few med It brn gray & str brn mot; Nebraskan till.
4.0-10.0 OU Same w/carbonates & inc mot.
10.0-13.0 OU lOYR 5/4 & 4/2; 1; cal; Nebraskan till.
13.0-15.0 UU lOYR 4/1 & 2.5Y 4/2; 1; cal; Nebraskan till.
15.0-22.0 UU 5Y 4/1; 1; cal; Nebraskan till.
22.0-30.0 UU N 4/0; 1; few sand lenses; Nebraskan till.
SITE: G-161
Location:
Depth (feet)
0- 3.0
3.0-43.0
43.0-
500 ft E of W center of NW:^ of Sec 24, T86N, R13W, Tama Co., Iowa (150 ft E of Boy Scout cabin)
Horizon or zone
OL
OL
Description
lOYR 4/4; sil; loess.
lOYR 5/6; sand; clean, sorted.
Bedrock.
SITE; G-402
Elevation: Location:
Depth (feet)
0- 4.0
4.0- 8.0
1045 ft E roadcut near center of Sec 10, T86N, R13W, Tama Co., Iowa
Horizon or zone
OL
Description
Soil solum.
lOYR 5/4; gritty sil; few fi blk Mn spk; few fi str brn mot; mod med pr; few sand lenses; loess.
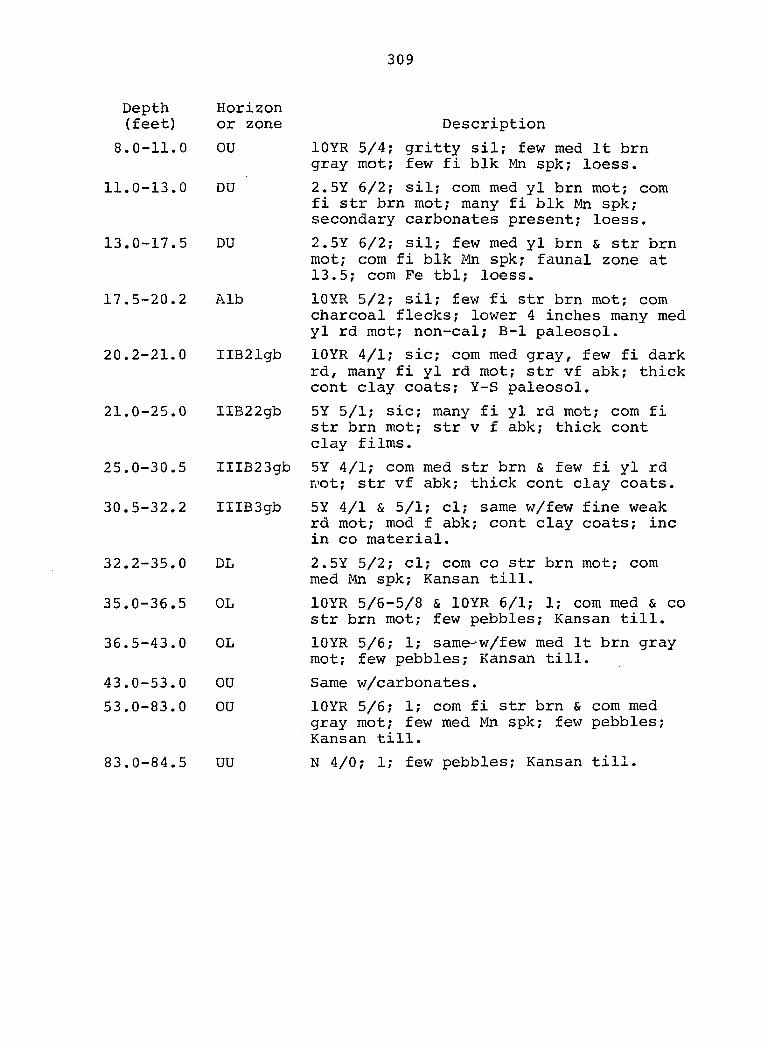
309
Depth Horizon (feet) or zone Description
8.0-11.0 OU lOYR 5/4; gritty sil; few med It brn gray mot; few fi blk Mn spk; loess.
11.0-13.0 DU 2.5Y 6/2; sil; com med yl brn mot; com fi str brn mot; many fi blk Mn spk; secondary carbonates present; loess.
13.0-17.5 DU 2.5Y 6/2; sil; few med yl brn & str brn mot; com fi blk Mn spk; faunal zone at 13.5; com Fe tbl; loess.
17.5-20.2 Alb lOYR 5/2; sil; few fi str brn mot; com charcoal flecks; lower 4 inches many med yl rd mot; non-cal; B-1 paleosol.
20.2-21.0 IIB21gb lOYR 4/1; sic; com med gray, few fi dark rd, many fi yl rd mot; str vf abk; thick cont clay coats; Y-S paleosol.
21.0-25.0 IIB22gb 5Y 5/1; sic; many fi yl rd mot; com fi str brn mot; str v f abk; thick cont clay films.
25.0-30.5 IIIB23gb 5Y 4/1; com med str brn & few fi yl rd n'ot; str vf abk; thick cont clay coats.
30.5-32.2 IIIB3gb 5Y 4/1 & 5/1; cl; same w/few fine weak rd mot; mod f abk; cont clay coats; inc in CO material.
32.2-35.0 DL 2.5Y 5/2; cl; com co str brn mot; com med Mn spk; Kansan till.
35.0-36.5 OL lOYR 5/6-5/8 & lOYR 6/1; 1; com med & co str brn mot; few pebbles; Kansan till.
36.5-43.0 OL lOYR 5/6; 1; same-w/few med It brn gray mot; few pebbles; Kansan till.
43.0-53.0 OU Same w/carbonates.
53.0-83.0 OU lOYR 5/6; 1; com fi str brn & com med gray mot; few med Mn spk; few pebbles; Kansan till.
83.0-84.5 UU N 4/0; 1; few pebbles; Kansan till.
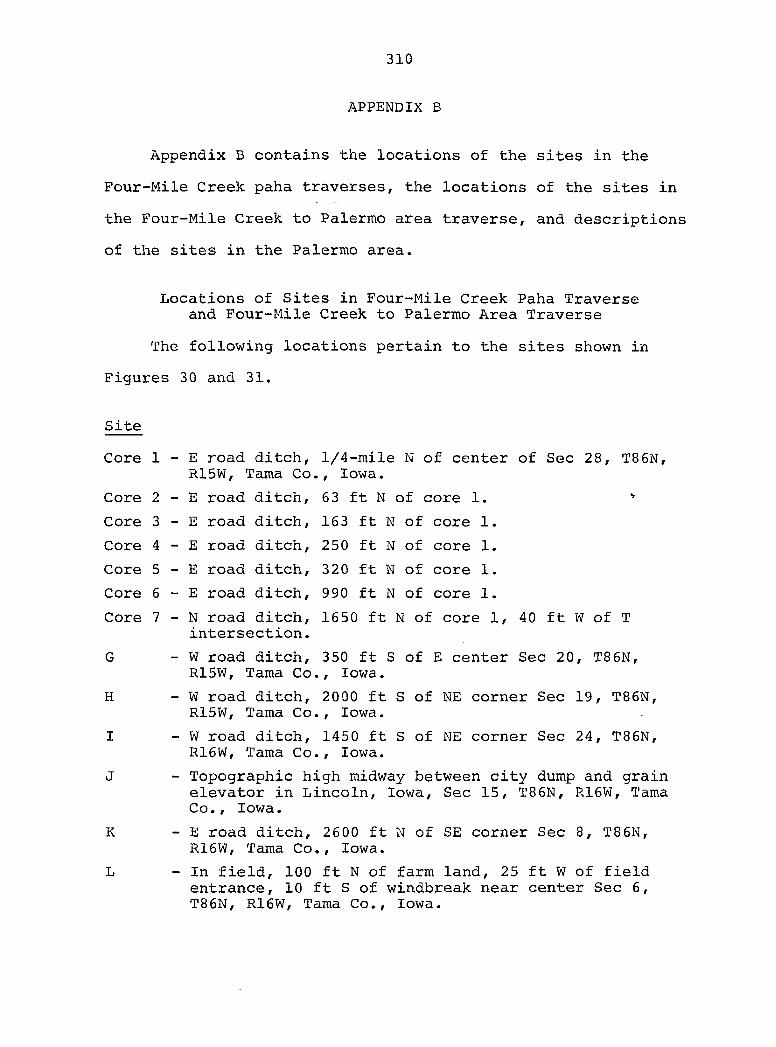
310
APPENDIX B
Appendix B contains the locations of the sites in the
Four-Mile Creek paha traverses, the locations of the sites in
the Four-Mile Creek to Palermo area traverse, and descriptions
of the sites in the Palermo area.
Locations of Sites in Four-Mile Creek Paha Traverse and Four-Mile Creek to Palermo Area Traverse
The following locations pertain to the sites shown in
Figures 30 and 31.
Site
Core 1 - E road ditch, 1/4-mile N of center of Sec 28, T86N, R15W, Tama Co., Iowa.
Core 2 - E road ditch, 63 ft N of core 1. »
Core 3 - E road ditch, 163 ft N of core 1.
Core 4 - E road ditch, 250 ft N of core 1.
Core 5 - E road ditch, 320 ft N of core 1.
Core 6 - E road ditch, 990 ft N of core 1.
Core 7 - N road ditch, 1650 ft N of core 1, 40 ft W of T intersection.
G - W road ditch, 350 ft S of E center Sec 20, T86N, R15W, Tama Co., Iowa.
H - W road ditch, 2000 ft S of NE corner Sec 19, T86N, R15W, Tama Co., Iowa.
I - W road ditch, 1450 ft S of NE corner Sec 24, T86N, R16W, Tama Co., Iowa.
J - Topographic high midway between city dump and grain elevator in Lincoln, Iowa, Sec 15, T86N, R16W, Tama Co., Iowa.
K - E road ditch, 2600 ft N of SE corner Sec 8, T86N, R16W, Tama Co., Iowa.
L - In field, 100 ft N of farm land, 25 ft W of field entrance, 10 ft S of windbreak near center Sec 6, T86N, R16W, Tama Co., Iowa.
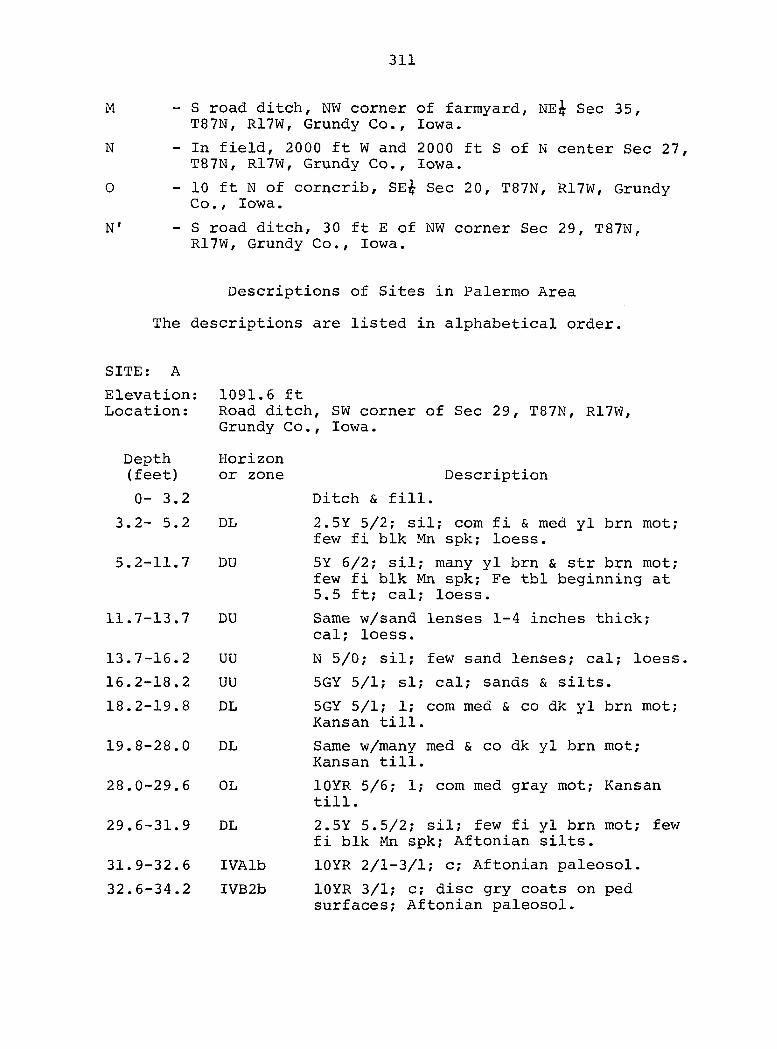
311
M - S road ditch, NW corner of farmyard, NEi^ Sec 35, T87N, R17W, Grundy Co., Iowa.
N - In field, 2000 ft W and 2000 ft S of N center Sec 27, T87N, R17W, Grundy Co., Iowa.
0 - 10 ft N of corncrib, SE^ Sec 20, T87N, R17W, Grundy Co., Iowa.
N' - S road ditch, 30 ft E of NW corner Sec 29, T87N, R17W, Grundy Co., Iowa.
Descriptions of Sites in Palermo Area
The descriptions are listed in alphabetical order.
SITE: A
Elevation: 1091.5 ft Location: Road ditch, SW corner of Sec 29, T87N, R17W,
Grundy Co., Iowa.
Depth Horizon (feet) or zone Description
0- 3.2 Ditch & fill.
3.2-5.2 DL 2.5Y 5/2; sil; com fi & med yl brn mot; few fi blk Mn spk; loess.
5.2-11.7 DU 5Y 6/2; sil; many yl brn & str brn mot; few fi blk Mn spk; Fe tbl beginning at 5.5 ft; cal; loess.
11.7-13.7 DU Same w/sand lenses 1-4 inches thick; cal; loess.
13.7-15.2 UU N 5/0; sil; few sand lenses; cal; loess.
16.2-18.2 UU 5GY 5/1; si; cal; sands & silts.
18.2-19.8 DL 5GY 5/1; 1; com med & co dk yl brn mot; Kansan till.
19.8-28.0 DL Same w/many med & co dk yl brn mot; Kansan till.
28.0-29.6 OL lOYR 5/6; 1; com med gray mot; Kansan till.
29.5-31.9 DL 2.5Y 5.5/2; sil; few fi yl brn mot; few fi blk Mn spk; Aftonian silts.
31.9-32.6 IVAlb lOYR 2/1-3/1; c; Aftonian paleosol.
32.6-34.2 IVB2b lOYR 3/1; c; disc gry coats on ped surfaces; Aftonian paleosol.
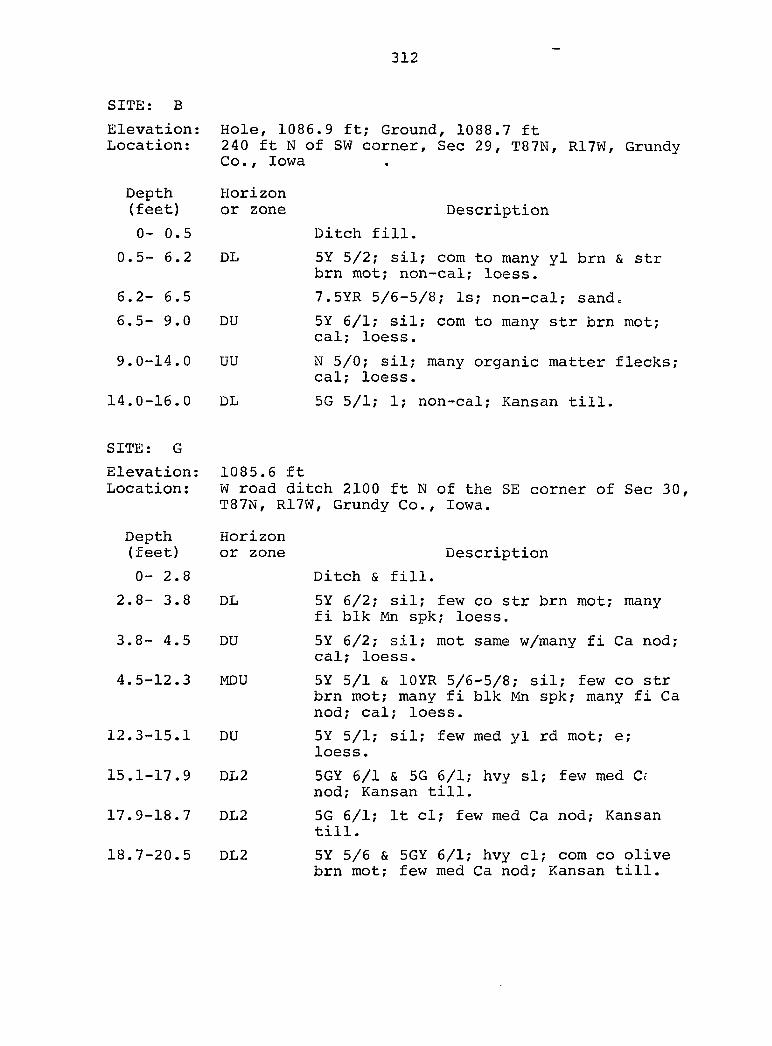
312
SITE: B
Elevation: Hole, 1086.9 ft; Ground, 1088.7 ft Location; 240 ft N of SW corner. Sec 29, T87N, R17W, Grundy
Co., Iowa
Depth Horizon (feet) or zone Description
0- 0.5 Ditch fill.
0.5-6.2 DL 5Y 5/2; sil; com to many yl brn & str brn mot; non-cal; loess.
6.2- 6.5 7.5YR 5/6-5/8; Is; non-cal; sandc
6.5- 9.0 DU 5Y 6/1; sil; com to many str brn mot; cal; loess.
9.0-14.0 UU N 5/0; sil; many organic matter flecks; cal; loess.
14.0-16.0 DL 5G 5/1; 1; non-cal; Kansan till.
SITE: G
Elevation: 1085.6 ft Location; W road ditch 2100 ft N of the SE corner of Sec 30,
T87N, R17W, Grundy Co., Iowa.
Depth Horizon (feet) or zone Description
0- 2.8 Ditch & fill.
2.8-3.8 DL 5Y 6/2; sil; few co str brn mot; many fi blk Mn spk; loess.
3.8-4.5 DU 5Y 6/2; sil; mot same w/many fi Ca nod; cal; loess.
4.5-12.3 MDU 5Y 5/1 & lOYR 5/6-5/8; sil; few co str brn mot; many fi blk Mn spk; many fi Ca nod; cal; loess.
12.3-15.1 DU 5Y 5/1; sil; few med yl rd mot; e; loess.
15.1-17.9 DL2 5GY 6/1 & 5G 6/1; hvy si; few med C; nod; Kansan till.
17.9-18.7 DL2 5G 6/1; It cl; few med Ca nod; Kansan till.
18.7-20.5 DL2 5Y 5/6 & 5GY 6/1; hvy cl; com co olive brn mot; few med Ca nod; Kansan till.
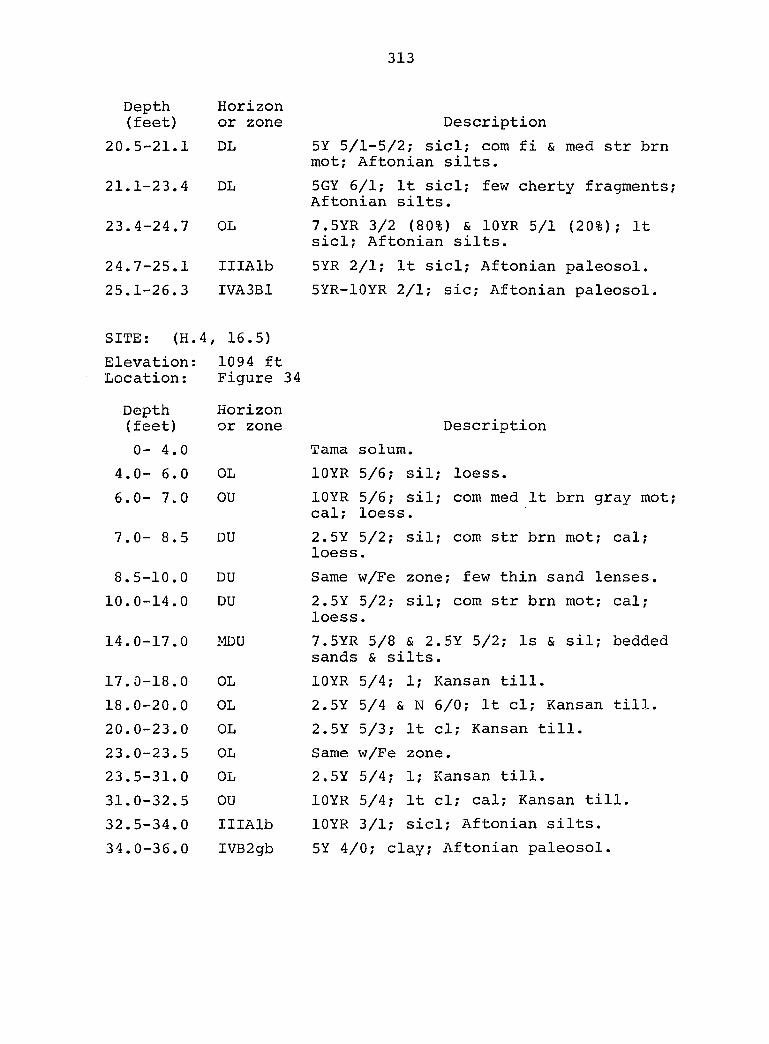
313
Depth (feet)
20.5-21.1
21.1-23.4
23.4-24.7
24.7-25.1
25.1-26.3
Horizon or zone
DL
DL
OL
IIIAlb
IVA3B1
Description
5Y 5/1-5/2; sicl; com fi & med str brn mot; Aftonian silts.
5GY 6/1; It sicl; few cherty fragments; Aftonian silts.
7.5YR 3/2 (80%) & lOYR 5/1 (20%); It sicl; Aftonian silts.
5YR 2/1; It sicl; Aftonian paleosol.
5YR-10YR 2/1; sic; Aftonian paleosol.
SITE: (H.4, 16.5)
Elevation: Location:
Depth (feet)
0- 4.0
4.0- 6.0
6.0— 7 » 0
7.0- 8.5
8.5-10.0
10.0-14.0
14.0-17.0
17.0-18.0
18.0-20.0
20.0-23.0
23.0-23.5
23.5-31.0
31.0-32.5
32.5-34.0
34.0-36.0
1094 ft Figure 34
Horizon or zone
OL
OU
DU
DU
DU
MDU
OL
OL
OL
OL
OL
OU
IIIAlb
IVB2gb
Description
Tama solum.
lOYR 5/6; sil; loess.
lOYR 5/6; sil; com med It brn gray mot; cal; loess.
2.5Y 5/2; sil; com str brn mot; cal; loess.
Same w/Fe zone; few thin sand lenses.
2.5Y 5/2; sil; com str brn mot; cal; loess.
7.5YR 5/8 & 2.5Y 5/2; Is & sil; bedded sands & silts.
lOYR 5/4; 1; Kansan till.
2.5Y 5/4 & N 6/0; It cl; Kansan till.
2.5Y 5/3; It cl; Kansan till.
Same w/Fe zone.
2.5Y 5/4; 1; Kansan till.
lOYR 5/4; It cl; cal; Kansan till.
lOYR 3/1; sicl; Aftonian silts.
5Y 4/0; clay; Aftonian paleosol.
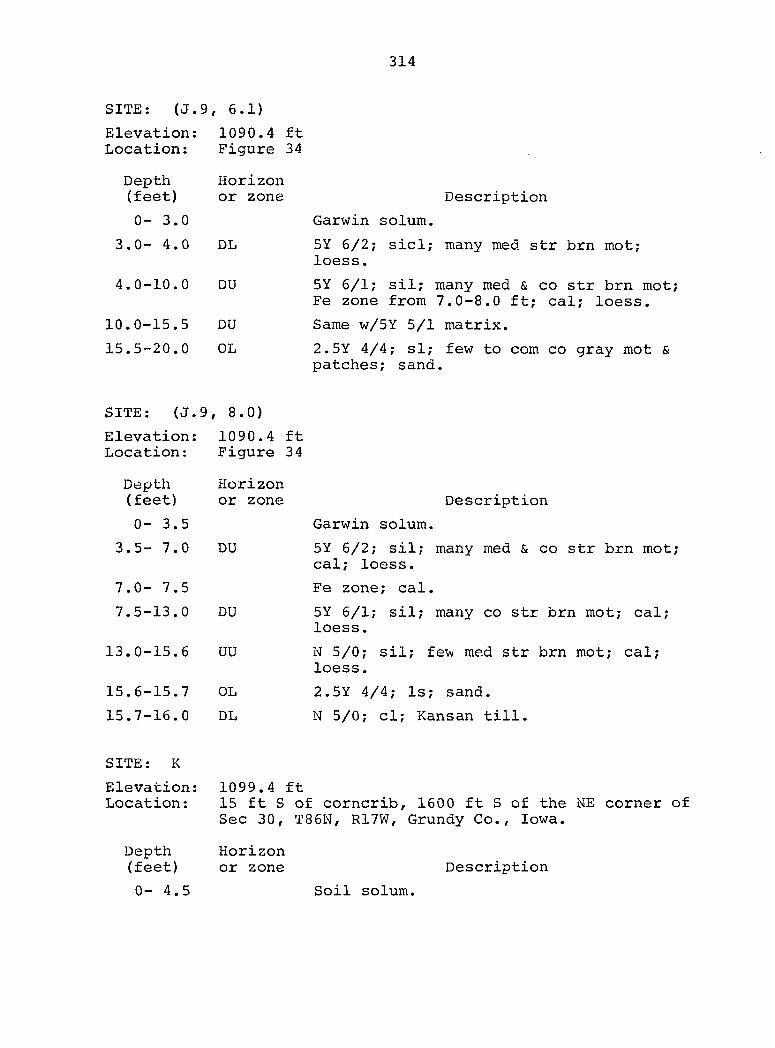
314
SITE: (J.9, 6.1)
Elevation: 1090.4 ft Location: Figure 34
Depth (feet)
0- 3.0
3.0- 4.0
4.0-10.0
10.0-15.5
15.5-20.0
Horizon or zone
DL
DU
Description
DU
OL
Garwin solum.
5Y 6/2; s id; many med str brn mot; loess.
5Y 6/1; sil; many med & co str brn mot; Fe zone from 7.0-8.0 ft; cal; loess.
Same w/5Y 5/1 matrix.
2.5Y 4/4; si; few to com co gray mot & patches; sand.
SITE; (J.9, 8.0)
Elevation: 1090.4 ft Location: Figure 34
Depth (feet)
0- 3.5
3.5- 7.0
7.0- 7.5
7.5-13.0
13.0-15.6
15.6-15.7
15.7-16.0
Horizon or zone
DU
Description
DU
UU
OL
DL
Garwin solum.
5Y 6/2; sil; many med & co str brn mot; cal; loess.
Fe zone; cal.
5Y 6/1; sil; many co str brn mot; cal; loess.
N 5/0; sil; few med str brn mot; cal; loess.
2.5Y 4/4; Is; sand.
N 5/0; cl; Kansan till.
SITE: K
Elevation: 1099.4 ft Location: 15 ft S of corncrib, 1600 ft S of the NE corner of
Sec 30, T86N, R17W, Grundy Co., Iowa.
Depth Horizon (feet) or zone Description
0- 4.5 Soil solum.
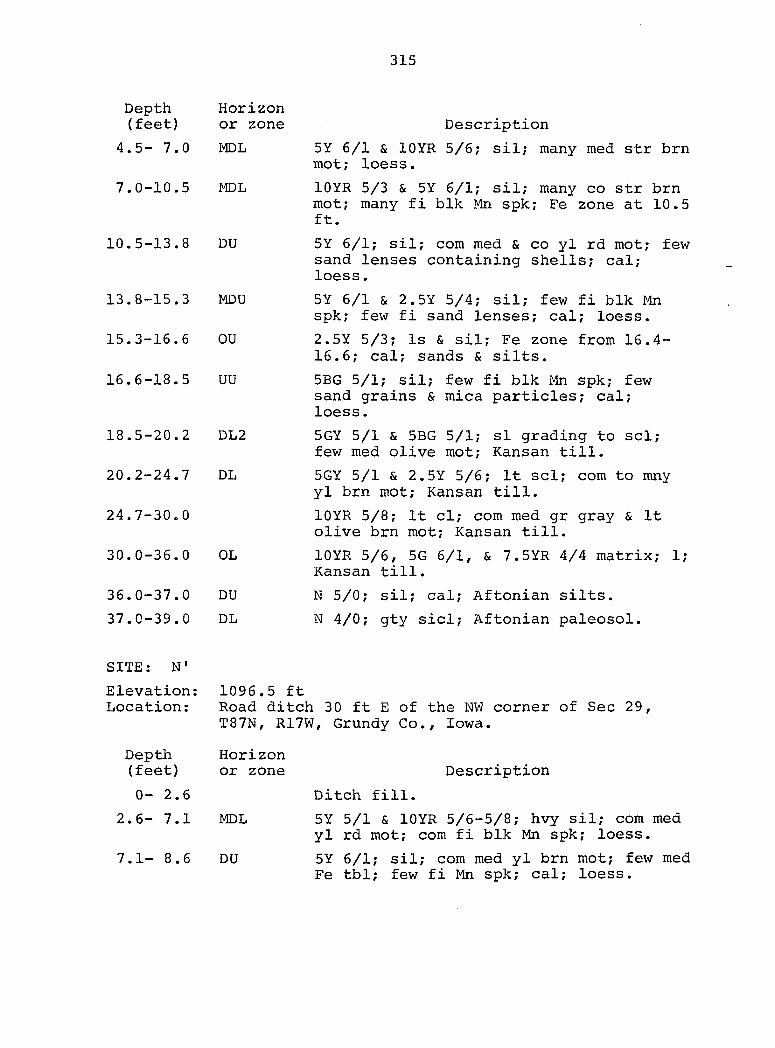
315
Depth (feet)
4.5- 7.0
7.0-10.5
10.5-13.8
13.8-15.3
15.3-16.6
16.6-18.5
18.5-20.2
20.2-24.7
24.7-30.0
30.0-36.0
36.0-37.0
37.0-39.0
SITE: N'
Elevation: Location:
Depth (feet)
0 - 2 . 6
2.6- 7.1
7.1- 8.6
Horizon or zone Description
MDL 5Y 6/1 & lOYR 5/6; sil; many med str brn mot; loess.
MDL lOYR 5/3 & 5Y 6/1; sil; many co str brn mot; many fi blk Mn spk; Fe zone at 10.5 ft.
DU 5Y 6/1; sil; com med & co yl rd mot; few sand lenses containing shells; cal; loess.
MDU 5Y 6/1 & 2.5Y 5/4; sil; few fi blk Mn spk; few fi sand lenses; cal; loess.
OU 2.5Y 5/3; Is & sil; Fe zone from 16.4-16.6; cal; sands & silts.
UU 5BG 5/1; sil; few fi blk Mn spk; few sand grains & mica particles; cal; loess.
DL2 5GY 5/1 & 5BG 5/1; si grading to scl; few med olive mot; Kansan till.
DL 5GY 5/1 & 2.5Y 5/6; It scl; com to mny yl brn mot; Kansan till.
10YR 5/8; It cl; com med gr gray & It olive brn mot; Kansan till.
OL lOYR 5/6, 5G 6/1, & 7.5YR 4/4 matrix; 1; Kansan till.
DU N 5/0; sil; cal; Aftonian silts.
DL N 4/0; gty sicl; Aftonian paleosol.
1096.5 ft Road ditch 30 ft E of the NW corner of Sec 29, T87N, R17W, Grundy Co., Iowa.
Horizon or zone Description
Ditch fill.
MDL 5Y 5/1 & lOYR 5/6-5/8; hvy sil; com med yl rd mot; com fi blk Mn spk; loess.
DU 5Y 6/1; sil; com med yl brn mot; few med Fe tbl; few fi Mn spk; cal; loess.
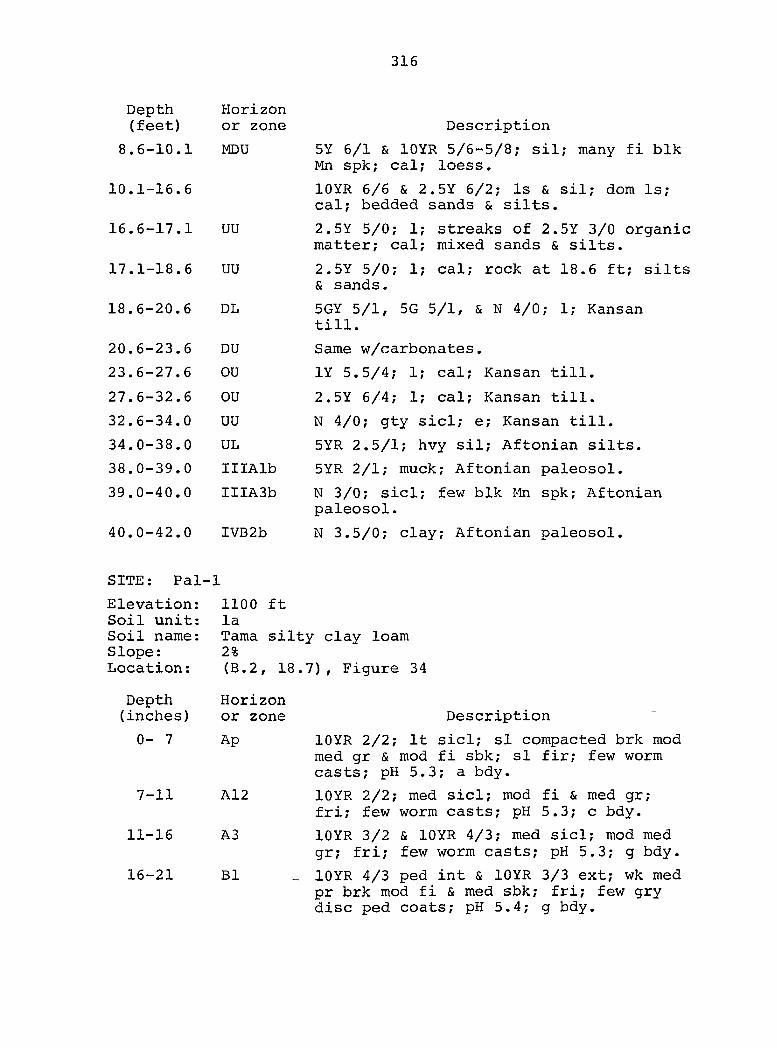
316
Depth (feet)
8.6-10.1
10.1-16.6
16.6-17.1
17.1-18.6
18.6-20.6
20.6-23.6
23.6-27.6
27.6-32.6
32.6-34.0
34.0-38.0
38.0-39.0
39.0-40.0
40.0-42.0
SITE: Pal
Elevation: Soil unit: Soil name: Slope: Location:
Depth (inches)
0- 7
7-11
11-16
16-21
Horizon or zone
MDU
UU
UU
DL
DU
OU
OU
UU
UL
IIIAlb
IIIA3b
IVB2b
Description
5Y 6/1 & lOYR 5/6-5/8; sil; many fi blk Mn spk; cal; loess.
lOYR 6/6 & 2.5Y 6/2; Is & sil; dom Is; cal; bedded sands & silts.
2.5Y 5/0; 1; streaks of 2.5Y 3/0 organic matter; cal; mixed sands & silts.
2.5Y 5/0; 1; cal; rock at 18.6 ft; silts & sands.
5GY 5/1, 5G 5/1, & N 4/0; 1; Kansan till.
Same w/carbonates.
lY 5.5/4; 1; cal; Kansan till.
2.5Y 6/4; 1; cal; Kansan till.
N 4/0; gty sicl; e; Kansan till.
5YR 2.5/1; hvy sil; Aftonian silts.
5YR 2/1; muck; Aftonian paleosol.
N 3/0; sicl; few blk Mn spk; Aftonian paleosol.
N 3.5/0; clay; Aftonian paleosol.
1100 ft la Tama silty clay loam 2% (B.2, 18.7), Figure 34
Horizon or zone Description
Ap lOYR 2/2; It sicl; si compacted brk mod med gr & mod fi sbk; si fir; few worm casts; pH 5.3; a bdy.
A12 lOYR 2/2; med sicl; mod fi & med gr; fri; few worm casts; pH 5.3; c bdy.
A3 lOYR 3/2 & lOYR 4/3; med sicl; mod med gr; fri; few worm casts; pH 5.3; g bdy.
B1 _ lOYR 4/3 ped int & lOYR 3/3 ext; wk med pr brk mod fi & med sbk; fri; few gry disc ped coats; pH 5.4; g bdy.
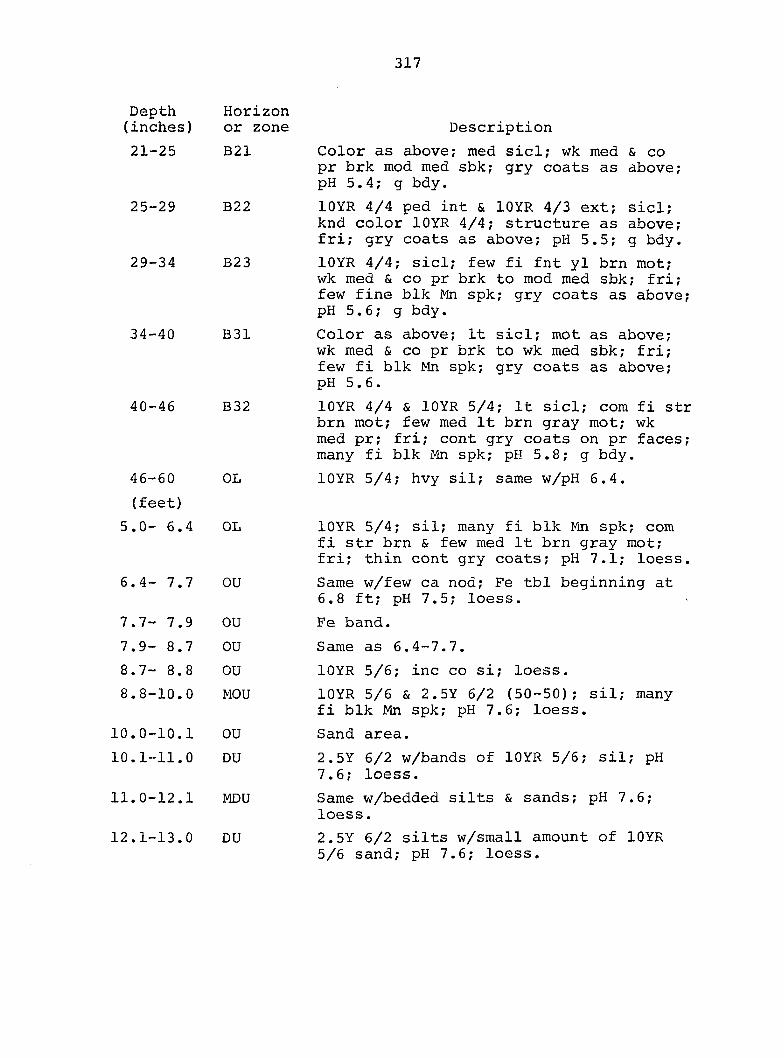
317
Depth Horizon (inches) or zone Description
21-25 B21 Color as above; med sicl; wk med & co pr brk mod med sbk; gry coats as above; pH 5.4; g bdy.
25-29 B22 lOYR 4/4 ped int & lOYR 4/3 ext; sicl; knd color lOYR 4/4; structure as above; fri; gry coats as above; pH 5.5; g bdy.
29-34 B23 lOYR 4/4; sicl; few fi fnt yl brn mot; wk med & co pr brk to mod med sbk; fri; few fine blk Mn spk; gry coats as above; pH 5.6; g bdy.
34-40 B31 Color as above; It sicl; mot as above; wk med & co pr brk to wk med sbk; fri; few fi blk Mn spk; gry coats as above; pH 5.6.
40-46 B32 lOYR 4/4 & lOYR 5/4; It sicl; com fi str brn mot; few med It brn gray mot; wk med pr; fri; cont gry coats on pr faces; many fi blk Mn spk; pH 5.8; g bdy.
46-60 OL lOYR 5/4; hvy sil; same w/pH 6.4.
(feet)
5.0- 6.4 OL lOYR 5/4; sil; many fi blk Mn spk; com fi str brn & few med It brn gray mot; fri; thin cont gry coats; pH 7.1; loess.
6.4-7.7 OU Same w/few ca nod; Fe tbl beginning at 6.8 ft; pH 7.5; loess.
7.7-7.9 OU Fe band.
7.9-8.7 OU Same as 6.4-7.7.
8.7- 8.8 OU lOYR 5/6; inc co si; loess.
8.8-10.0 MOU lOYR 5/6 & 2.5Y 6/2 (50-50); sil; many fi blk Mn spk; pH 7.6; loess.
10.0-10.1 OU Sand area.
10.1-11.0 DU 2.5Y 6/2 w/bands of lOYR 5/6; sil; pH 7.6; loess.
11.0-12.1 MDU Same w/bedded silts & sands; pH 7.6; loess.
12.1-13.0 DU 2.5Y 6/2 silts w/small amount of lOYR 5/6 sand; pH 7.6; loess.
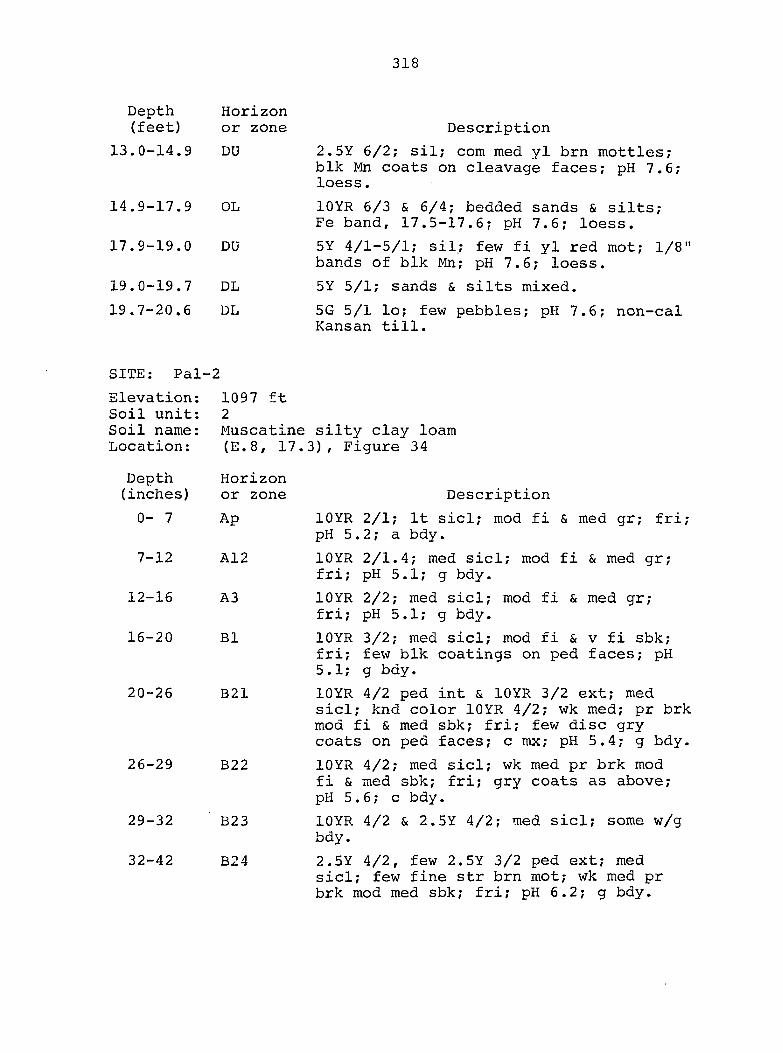
318
Depth Horizon (feet) or zone Description
13.0-14.9 DU 2.5Y 6/2; sil; com med yl brn mottles; blk Mn coats on cleavage faces; pH 7.6; loess.
14.9-17.9 OL lOYR 6/3 & 6/4; bedded sands & silts; Fe band, 17.5-17.6; pH 7.6; loess.
17.9-19.0 DU 5Y 4/1-5/1; sil; few fi yl red mot; 1/8" bands of blk Mn; pH 7.6; loess.
19.0-19.7 DL 5Y 5/1; sands & silts mixed.
19.7-20.6 DL 5G 5/1 lo; few pebbles; pH 7.6; non-cal Kansan till.
SITE: Pal-2
Elevation: 1097 ft Soil unit: 2 Soil name: Muscatine silty clay loam Location: (E.8, 17.3), Figure 34
Depth Horizon (inches) or zone Description
0- 7 Ap lOYR 2/1; It sicl; mod fi & med gr; fri; pH 5.2; a bdy.
7-12 A12 lOYR 2/1.4; med sicl; mod fi & med gr; fri; pH 5.1; g bdy.
12-16 A3 lOYR 2/2; med sicl; mod fi & med gr; fri; pH 5.1; g bdy.
16-20 B1 lOYR 3/2; med sicl; mod fi & v fi sbk; fri; few blk coatings on ped faces; pH 5.1; g bdy.
20-26 B21 lOYR 4/2 ped int & lOYR 3/2 ext; med sicl; knd color lOYR 4/2; wk med; pr brk mod fi & med sbk; fri; few disc gry coats on ped faces; c mx; pH 5.4; g bdy.
26-29 B22 lOYR 4/2; med sicl; wk med pr brk mod fi & med sbk; fri; gry coats as above; pH 5.6; c bdy.
29-32 B23 lOYR 4/2 & 2.5Y 4/2; med sicl; some w/g bdy.
32-42 B24 2.5Y 4/2, few 2.5Y 3/2 ped ext; med sicl; few fine str brn mot; wk med pr brk mod med sbk; fri; pH 6.2; g bdy.
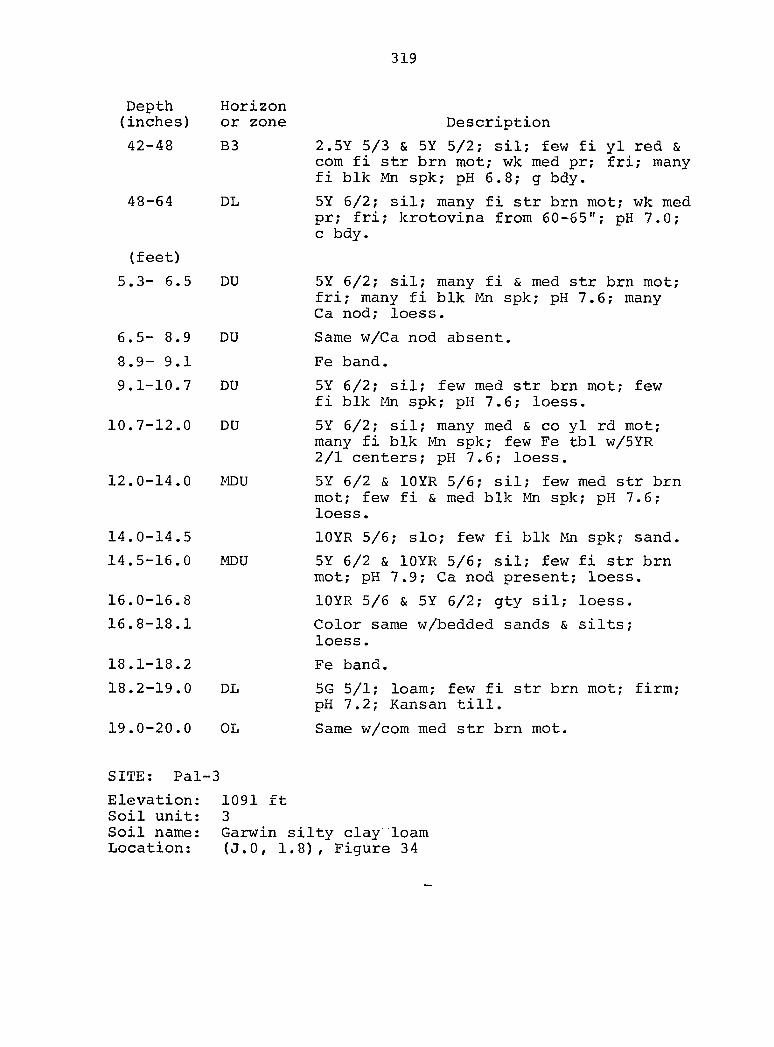
319
Depth Horizon (inches) or zone Description
42-48 B3 2.5Y 5/3 & 5Y 5/2; sil; few fi yl red & com fi str brn mot; wk med pr; fri; many fi blk Mn spk; pH 6.8; g bdy.
48-64 DL 5Y 6/2; sil; many fi str brn mot; wk med pr; fri; krotovina from 60-65"; pH 7.0; c bdy.
(feet)
5.3-6.5 DU 5Y 6/2; sil; many fi & med str brn mot; fri; many fi blk Mn spk; pH 7.6; many Ca nod; loess.
6.5- 8.9 DU Same w/Ca nod absent.
8.9-9.1 Fe band.
9.1-10.7 DU 5Y 6/2; sil; few med str brn mot; few fi blk rto spk; pH 7.6; loess.
10.7-12.0 DU 5Y 6/2; sil; many med & co yl rd mot; many fi blk I4n spk; few Fe tbl w/5YR 2/1 centers; pH 7.6; loess.
12.0-14.0 MDU 5Y 6/2 & lOYR 5/6; sil; few med str brn mot; few fi & med blk Mn spk; pH 7.6; loess.
14.0-14.5 lOYR 5/6; slo; few fi blk Mn spk; sand.
14.5-16.0 MDU 5Y 6/2 & lOYR 5/6; sil; few fi str brn mot; pH 7.9; Ca nod present; loess.
16.0-16.8 lOYR 5/6 & 5Y 6/2; gty sil; loess.
16.8-18.1 Color same w/bedded sands & silts; loess.
18.1-18.2 Fe band.
18.2-19.0 DL 5G 5/1; loam; few fi str brn mot; firm; pH 7.2; Kansan till.
19.0-20.0 OL Same w/com med str brn mot.
SITE: Pal-3
Elevation: 1091 ft Soil unit; 3 Soil name: Garwin silty clay loam Location: (J.O, 1.8), Figure 34
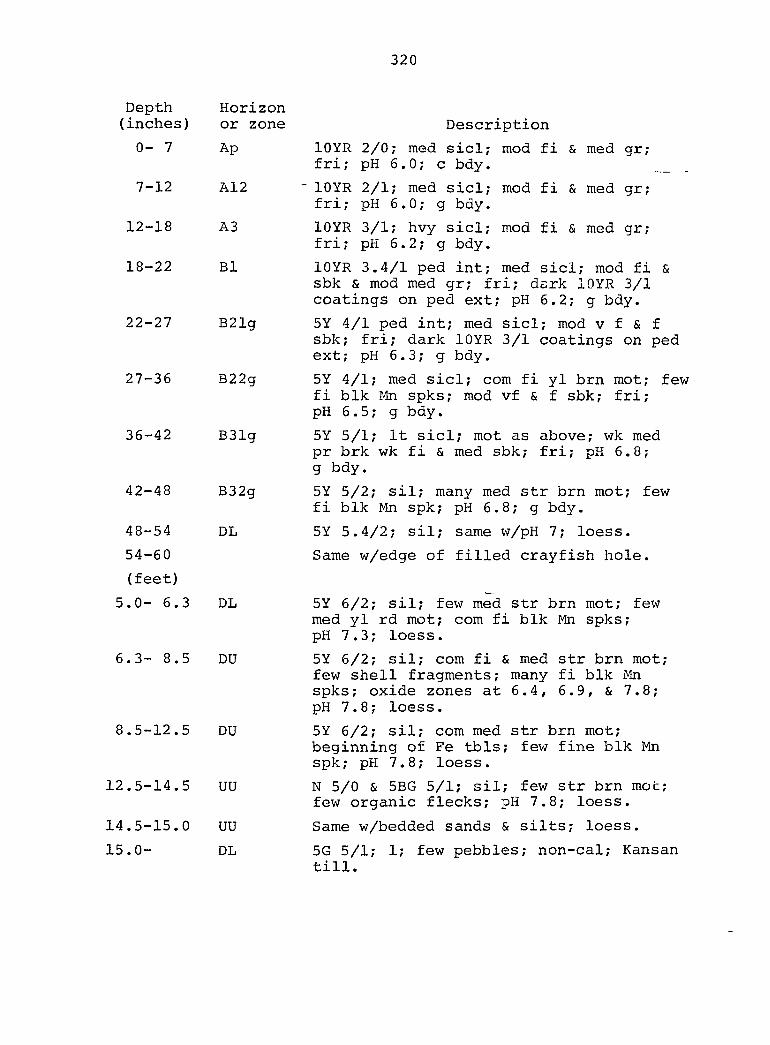
320
Depth Horizon (inches) or zone Description
0- 7 Ap lOYR 2/0; med sicl; mod fi & med gr; fri; pH 6.0; c bdy.
7-12 A12 " lOYR 2/1; med sicl; mod fi & med gr; fri; pH 6.0; g bdy.
12-18 A3 lOYR 3/1; hvy sicl; mod fi & med gr; fri; pH 6.2; g bdy.
18-22 Bl lOYR 3.4/1 ped int; med sicl; mod fi & sbk & mod med gr; fri; dark lOYR 3/1 coatings on ped ext; pH 6.2; g bdy.
22-27 B21g 5Y 4/1 ped int; med sicl; mod v f & f sbk; fri; dark lOYR 3/1 coatings on ped ext; pH 6.3; g bdy.
27-36 B22g 5Y 4/1; med sicl; com fi yl brn mot; few fi blk r/tn spks; mod vf & f sbk; fri; pH 6.5; g bdy.
36-42 B31g 5Y 5/1; It sicl; mot as above; wk med pr brk wk fi & med sbk; fri; pK 6.8; g bdy.
42-48 B32g 5Y 5/2; sil; many med str brn mot; few fi blk Mn spk; pH 6.8; g bdy.
48-54 DL 5Y 5.4/2; sil; same w/pH 7; loess.
54-60 Same w/edge of filled crayfish hole.
(feet)
5.0-6.3 DL 5Y 6/2; sil; few med str brn mot; few med yl rd mot; com fi blk Mn spks; pH 7.3; loess.
6.3-8.5 DU 5Y 6/2; sil; com fi & med str brn mot; few shell fragments; many fi blk Mn spks; oxide zones at 6.4, 6.9, & 7.8; pH 7.8; loess.
8.5-12.5 DU 5Y 6/2; sil; com med str brn mot; beginning of Fe tbls; few fine blk Mn spk; pH 7.8; loess.
12.5-14.5 UU N 5/0 & 5BG 5/1; sil; few str brn mob; few organic flecks; pH 7.8; loess.
14.5-15.0 UU Same w/bedded sands & silts; loess.
15.0- DL 5G 5/1; 1; few pebbles; non-cal; Kansan till.
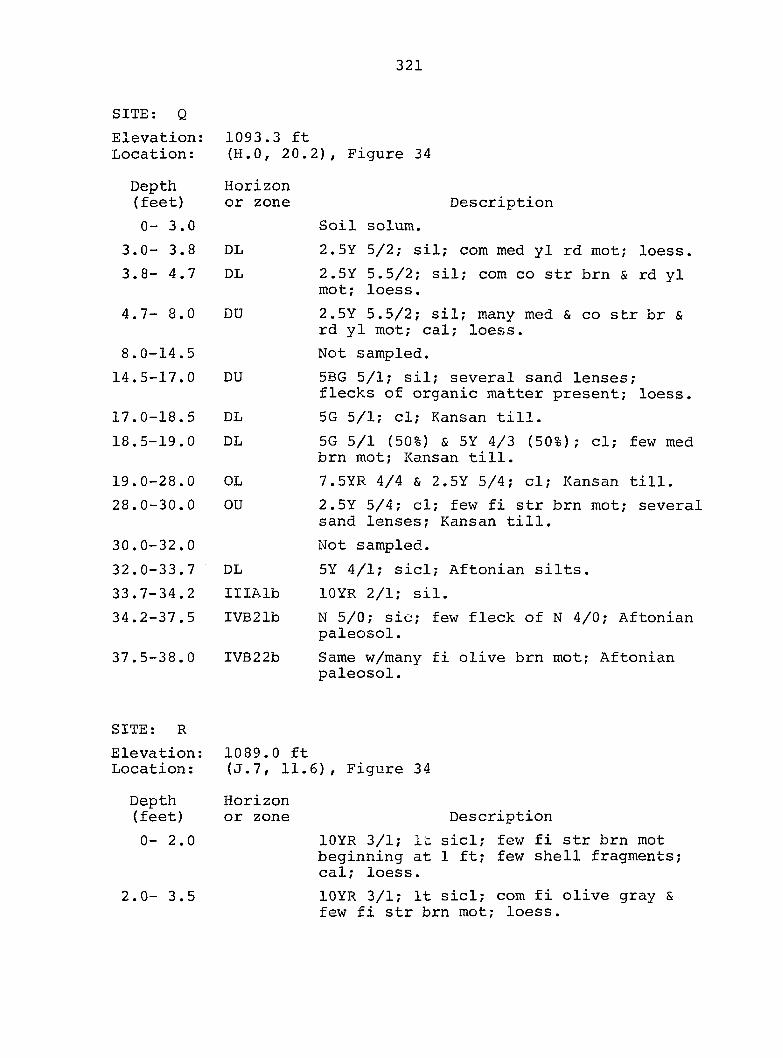
321
SITE:
Elevation: Location:
Depth (feet)
0- 3.0
3.0- 3.8
3.8- 4.7
4.7- 8.0
8.0-14.5
14.5-17.0
17.0-18.5
18.5-19.0
19.0-28.0
28.0-30.0
30.0-32.0
32.0-33.7
33.7-34.2
34.2-37.5
37.5-38.0
1093.3 ft (H.O, 20.2), Figure 34
Horizon or zone
DL
DL
DU
DU
DL
DL
OL
OU
DL
IIIAlb
IVB21b
IVB22b
Description
Soil solum.
2.5Y 5/2; sil; com med yl rd mot; loess.
2.5Y 5.5/2; sil; com co str brn & rd yl mot; loess.
2.5Y 5.5/2; sil; many med & co str br & rd yl mot; cal; loess.
Not sampled.
5BG 5/1; sil; several sand lenses; flecks of organic matter present; loess.
5G 5/1; cl; Kansan till.
5G 5/1 (50%) & 5Y 4/3 (50%); cl; few med brn mot; Kansan till.
7.5YR 4/4 & 2.5Y 5/4; cl; Kansan till.
2.5Y 5/4; cl; few fi str brn mot; several sand lenses; Kansan till.
Not sampled.
5Y 4/1; sicl; Aftonian silts.
lOYR 2/1; sil.
N 5/0; sic; few fleck of N 4/0; Aftonian paleosol.
Same w/many fi olive brn mot; Aftonian paleosol.
SITE: R
Elevation: Location :
Depth (feet)
0 - 2 . 0
2.0- 3.5
1089.0 ft (J.7, 11.6), Figure 34
Horizon or zone Description
lOYR 3/1; it sicl; few fi str brn mot beginning at 1 ft; few shell fragments; cal; loess.
lOYR 3/1; It sicl; com fi olive gray & few fi str brn mot; loess.
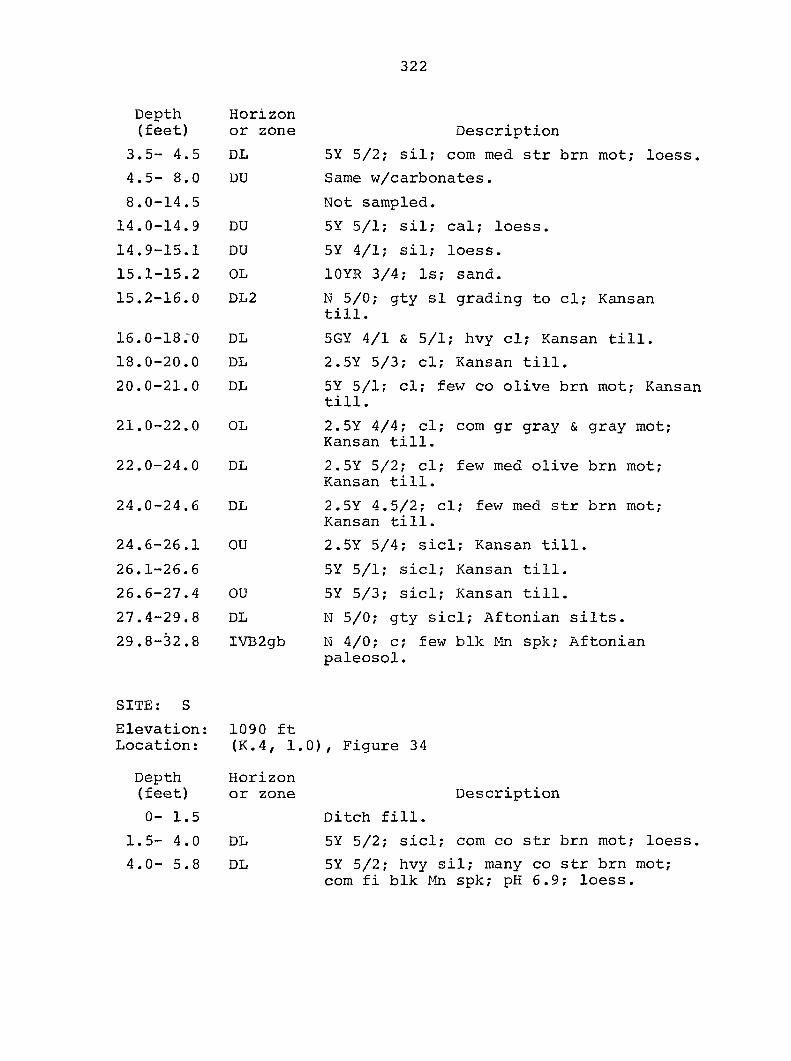
322
Depth (feet)
3.5- 4.5
4.5- 8.0
8.0-14.5
14.0-14.9
14.9-15.1
15.1-15.2
15.2-16.0
16.0-18:0
18.0-20.0
20.0-21.0
21.0-22.0
22.0-24.0
24.0-24.6
24.6-26.1
26.1-26.6
26.6-27.4
27.4-29.8
29.8-32.8
SITE: S
Elevation: Location:
Depth (feet)
0- 1.5
1.5- 4.0
4.0- 5.8
Horizon or zone Description
DL 5Y 5/2; sil; com med str brn mot; loess.
DU Same w/carbonates.
Not sampled.
DU 5Y 5/1; sil; cal; loess.
DU 5Y 4/1; sil; loess.
OL lOYR 3/4; Is; sand.
DL2 K 5/0; gty si grading to cl; Kansan till.
DL 5GY 4/1 & 5/1; hvy cl; Kansan till.
DL 2.5Y 5/3; cl; Kansan till.
DL 5Y 5/1; cl; few co olive brn mot; Kansan till.
OL 2.5Y 4/4; cl; com gr gray & gray mot; Kansan till.
DL 2.5Y 5/2; cl; few med olive brn mot; Kansan till.
DL 2.5Y 4.5/2; cl; few med str brn mot; Kansan till.
OU 2.5Y 5/4; sicl; Kansan till.
5Y 5/1; sicl; Kansan till.
OU 5Y 5/3; sicl; Kansan till.
DL N 5/0; gty sicl; Aftonian silts.
IVB2gb N 4/0; c; few blk Mn spk; Aftonian paleosol.
1090 ft (K.4, 1.0), Figure 34
Horizon or zone Description
Ditch fill.
DL 5Y 5/2; sicl; com co str brn mot; loess,
DL 5Y 5/2; hvy sil; many co str brn mot; com fi blk Mn spk; pH 6.9; loess.
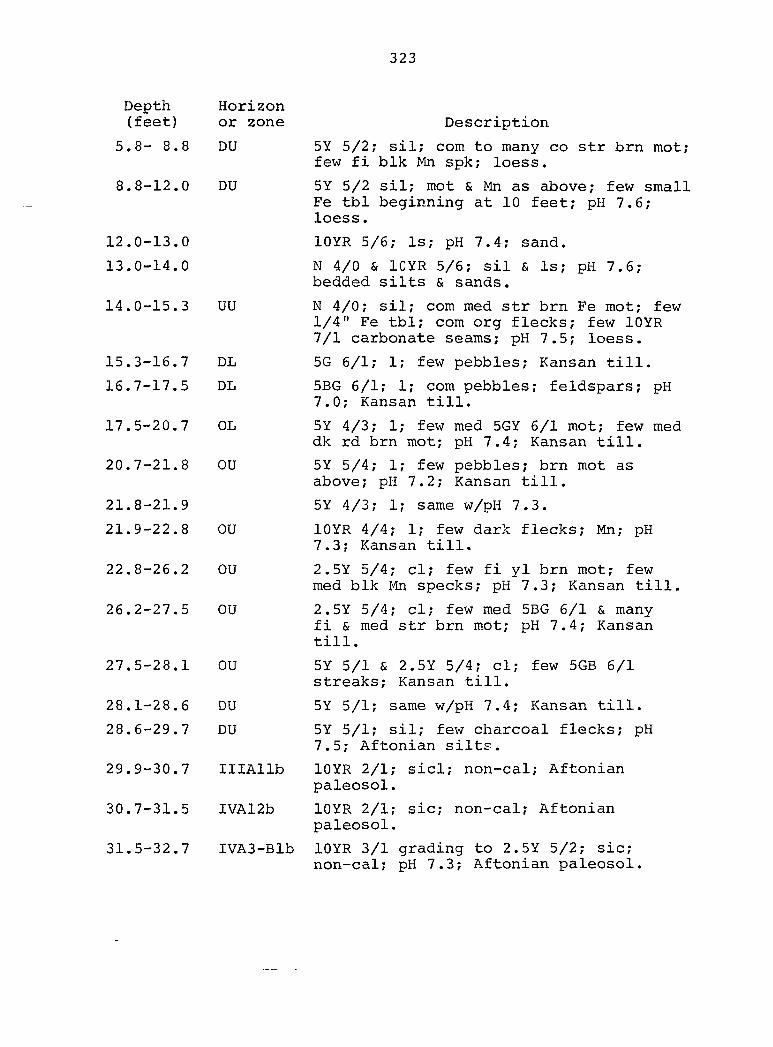
323
Depth Horizon (feet) or zone Description
5.8-8.8 DU 5Y 5/2; sil; com to many co str brn mot; few fi blk Mn spk; loess.
8.8-12.0 DU 5Y 5/2 sil; mot & Mn as above; few small Fe tbl beginning at 10 feet; pH 7.6; loess.
12.0-13.0 lOYR 5/6; Is; pH 7.4; sand.
13.0-14.0 N 4/0 & ICYR 5/6; sil & Is; pH 7.6; bedded silts & sands.
14.0-15.3 UU N 4/0; sil; com med str brn Fe mot; few 1/4" Fe tbl; com org flecks; few lOYR 7/1 carbonate seams; pH 7.5; loess.
15.3-16.7 DL 5G 6/1; 1; few pebbles; Kansan till.
16.7-17.5 DL 5BG 6/1; 1; com pebbles; feldspars; pH 7.0; Kansan till.
17.5-20.7 OL 5Y 4/3; 1; few med 5GY 6/1 mot; few med dk rd brn mot; pH 7.4; Kansan till.
20.7-21.8 OU 5Y 5/4; 1; few pebbles; brn mot as above; pH 7.2; Kansan till.
21.8-21.9 5Y 4/3; 1; same w/pH 7.3.
21.9-22.8 OU lOYR 4/4; 1; few dark flecks; Mn; pH 7.3; Kansan till.
22.8-26.2 OU 2.5Y 5/4; cl; few fi yl brn mot; few med blk Mn specks; pH 7.3; Kansan till.
26.2-27.5 OU 2.5Y 5/4; cl; few med 5BG 6/1 & many fi & med str brn mot; pH 7.4; Kansan till.
27.5-28.1 OU 5Y 5/1 & 2.5Y 5/4; cl; few 5GB 6/1 streaks; Kansan till.
28.1-28.6 DU 5Y 5/1; same w/pH 7.4; Kansan till.
28.6-29.7 DU 5Y 5/1; sil; few charcoal flecks; pH 7.5; Aftonian silts.
29.9-30.7 IIIAllb lOYR 2/1; sicl; non-cal; Aftonian paleosol.
30.7-31.5 IVAl2b lOYR 2/1; sic; non-cal; Aftonian paleosol.
31.5-32.7 IVA3-Blb lOYR 3/1 grading to 2.5Y 5/2; sic; non-cal; pH 7.3; Aftonian paleosol.
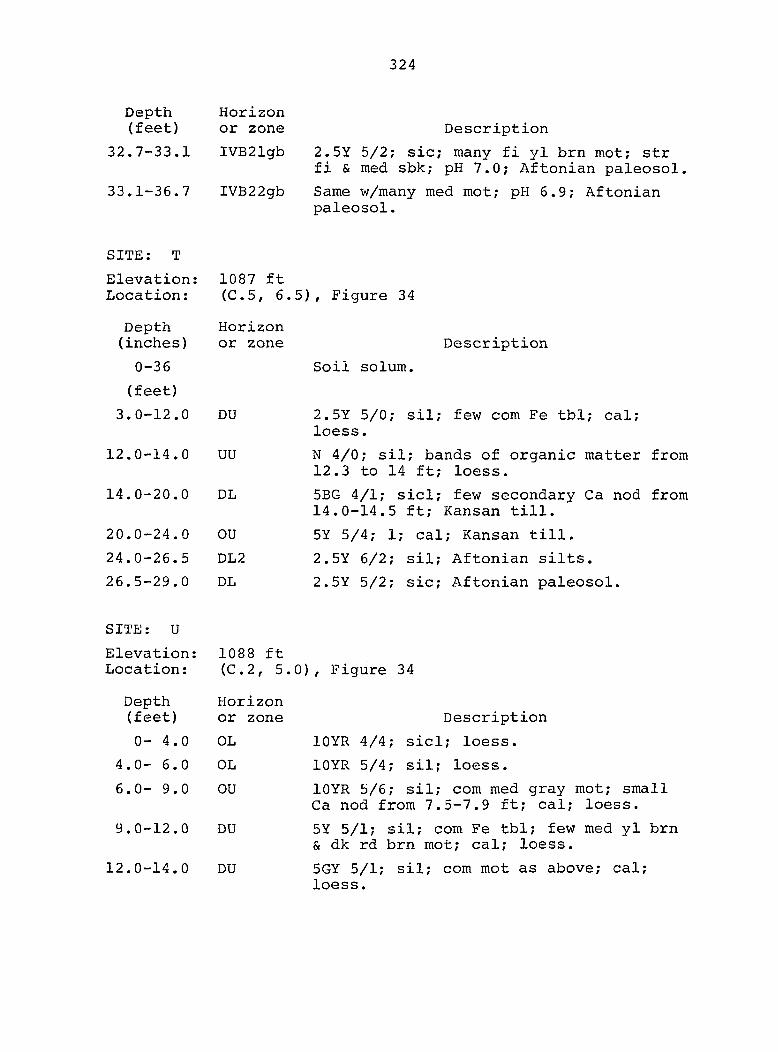
324
Depth (feet)
32.7-33.1
33.1-36.7
SITE: T
Elevation: Location:
Depth (inches)
0-36
(feet)
3.0-12.0
12.0-14.0
14.0-20.0
20.0-24.0
24.0-26.5
26.5-29.0
SITE: U
Elevation: Location:
Depth (feet)
0- 4.0
4.0— 6.0
6.0- 9.0
9.0-12.0
12.0-14.0
Horizon or zone
IVB21gb
IVB22gb
Description
2.5Y 5/2; sic; many fi yl brn mot; str fi & med sbk; pH 7.0; Aftonian paleosol,
Same w/many med mot; pH 6.9; Aftonian paleosol.
1087 ft (C.5, 6.5), Figure 34
Horizon or zone Description
Soil solum.
DU 2.5Y 5/0; sil; few com Fe tbl; cal; loess.
UU N 4/0; sil; bands of organic matter from 12.3 to 14 ft; loess.
DL 5BG 4/1; sicl; few secondary Ca nod from 14.0-14.5 ft; Kansan till.
OU 5Y 5/4; 1; cal; Kansan till.
DL2 2.5Y 6/2; sil; Aftonian silts.
DL 2.5Y 5/2; sic; Aftonian paleosol.
1088 ft (C.2, 5.0), Figure 34
Horizon or zone Description
OL lOYR 4/4; sicl; loess.
OL lOYR 5/4; sil; loess.
OU lOYR 5/6; sil; com med gray mot; small Ca nod from 7.5-7.9 ft; cal; loess.
DU 5Y 5/1; sil; com Fe tbl; few med yl brn & dk rd brn mot; cal; loess.
DU 5GY 5/1; sil; com mot as above; cal; loess.
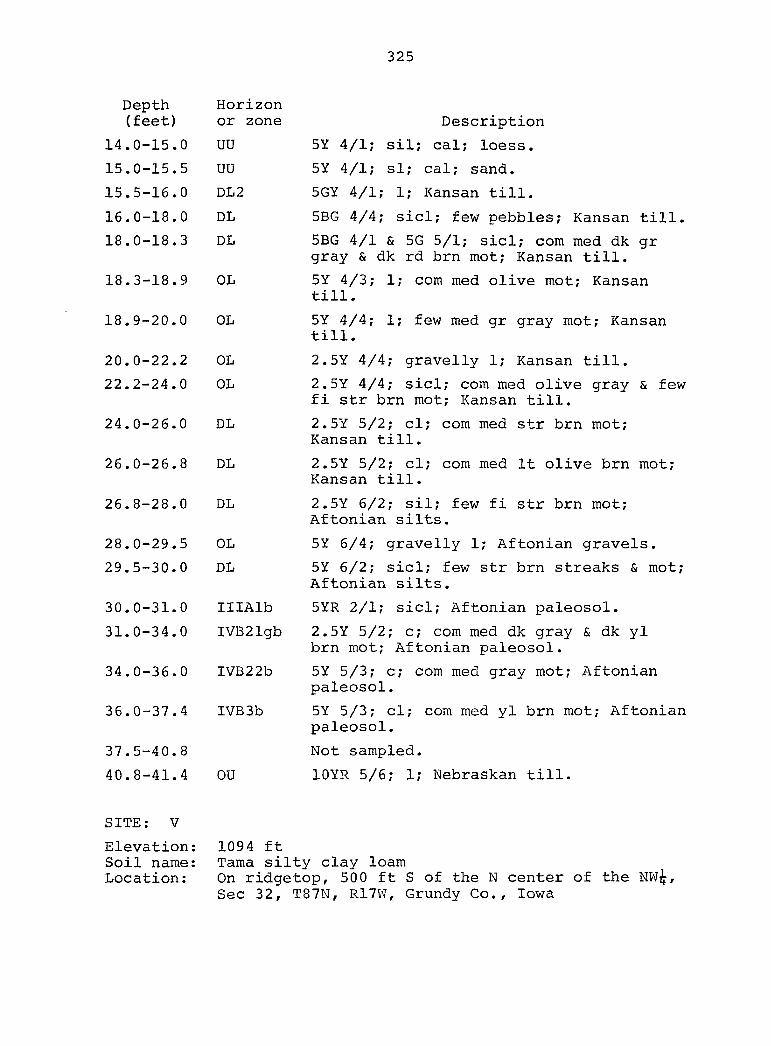
325
Depth Horizon (feet) or zone Description
14.0-15.0 UU 5Y 4/1; sil; cal; loess.
15.0-15.5 UU 5Y 4/1; si; cal; sand.
15.5-16.0 DL2 5GY 4/1; 1; Kansan till.
16.0-18.0 DL 5BG 4/4; sicl; few pebbles; Kansan till.
18.0-18.3 DL 5BG 4/1 & 5G 5/1; sicl; com med dk gr gray & dk rd brn mot; Kansan till.
18.3-18.9 OL 5Y 4/3; 1; com med olive mot; Kansan till.
18.9-20.0 OL 5Y 4/4; 1; few med gr gray mot; Kansan till.
20.0-22.2 OL 2.5Y 4/4; gravelly 1; Kansan till.
22.2-24.0 OL 2.5Y 4/4; sicl; com med olive gray & few fi str brn mot; Kansan till.
24.0-26.0 DL 2.5Y 5/2; cl; com med str brn mot; Kansan till.
26.0-26.8 DL 2.5Y 5/2; cl; com med It olive brn mot; Kansan till.
26.8-28.0 DL 2.5Y 6/2; sil; few fi str brn mot; Aftonian silts.
28.0-29.5 OL 5Y 6/4; gravelly 1; Aftonian gravels.
29.5-30.0 DL 5Y 6/2; sicl; few str brn streaks & mot; Aftonian silts.
30.0-31.0 IIIAlb 5YR 2/1; sicl; Aftonian paleosol.
31.0-34.0 IVB21gb 2.5Y 5/2; c; com med dk gray & dk yl brn mot; Aftonian paleosol.
34.0-36.0 IVB22b 5Y 5/3; c; com med gray mot; Aftonian paleosol.
36.0-37.4 IVB3b 5Y 5/3; cl; com med yl brn mot; Aftonian paleosol.
37.5-40.8 Not sampled.
40.8-41.4 OU lOYR 5/6; 1; Nebraskan till.
SITE: V
Elevation; 1094 ft Soil name; Tama silty clay loam Location: On ridgetop, 500 ft S of the N center of the NW&,
Sec 32, T87N, R17W, Grundy Co., Iowa
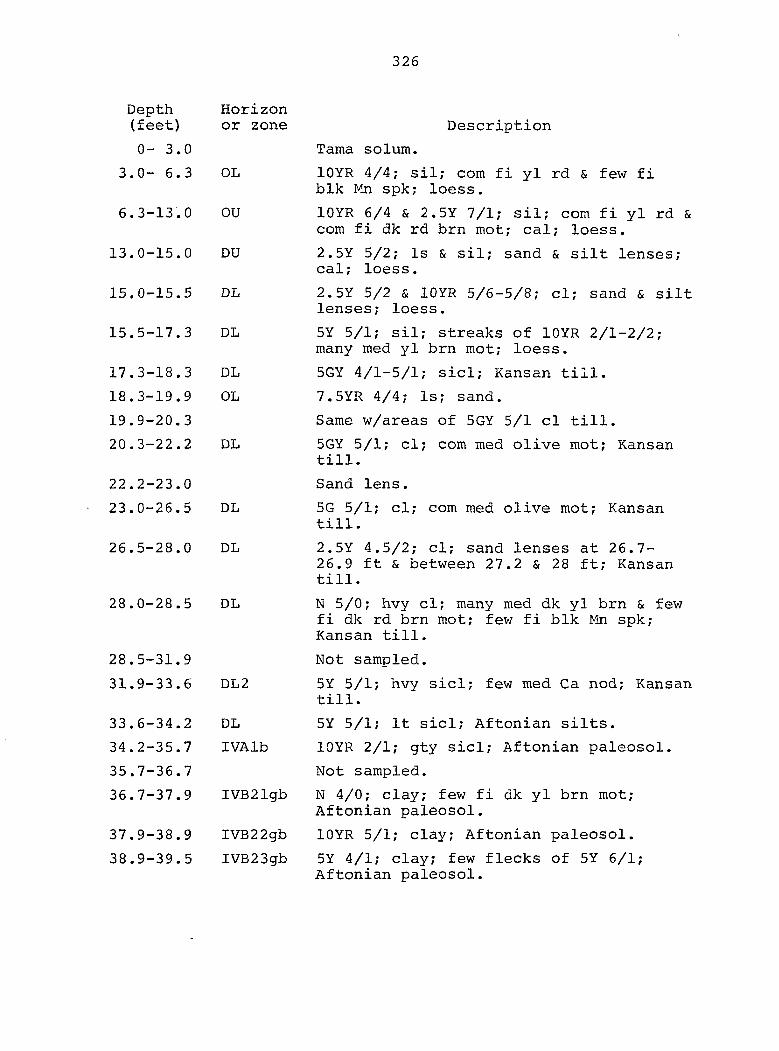
326
Depth Horizon (feet) or zone
0- 3.0
3.0-6.3 OL
6.3-13.0 OU
13.0-15.0 DU
15.0-15.5 DL
15.5-17.3 DL
17.3-18.3 DL
18.3-19.9 OL
19.9-20.3
20.3-22.2 DL
22.2-23.0
23.0-26.5 DL
26.5-28.0 DL
28.0-28.5 DL
28.5-31.9
31.9-33.6 DL2
33.6-34.2 DL
34.2-35.7 IVAlb
35.7-36.7
36.7-37.9 IVB21gb
37.9-38.9 IVB22gb
38.9-39.5 IVB23gb
Description
Tama solum.
lOYR 4/4; sil; com fi yl rd & few fi blk Mn spk; loess.
lOYR 6/4 & 2.5Y 7/1; sil; com fi yl rd & com fi dk rd brn mot; cal; loess.
2.5Y 5/2; Is & sil; sand & silt lenses; cal; loess.
2.5Y 5/2 & lOYR 5/6-5/8; cl; sand & silt lenses; loess.
5Y 5/1; sil; streaks of lOYR 2/1-2/2; many med yl brn mot; loess.
5GY 4/1-5/1; sicl; Kansan till.
7.5YR 4/4; Is; sand.
Same w/areas of 5GY 5/1 cl till.
5GY 5/1; cl; com med olive mot; Kansan till.
Sand lens.
5G 5/1; cl; com med olive mot; Kansan till.
2.5Y 4.5/2; cl; sand lenses at 26.7-26.9 ft & between 27.2 & 28 ft; Kansan till.
N 5/0; hvy cl; many med dk yl brn & few fi dk rd brn mot; few fi blk Mn spk; Kansan till.
Not sampled.
5Y 5/1; hvy sicl; few med Ca nod; Kansan till.
5Y 5/1; It sicl; Aftonian silts.
10YR 2/1; gty sicl; Aftonian paleosol.
Not sampled.
N 4/0; clay; few fi dk yl brn mot; Aftonian paleosol.
lOYR 5/1; clay; Aftonian paleosol.
5Y 4/1; clay; few flecks of 5Y 6/1; Aftonian paleosol.
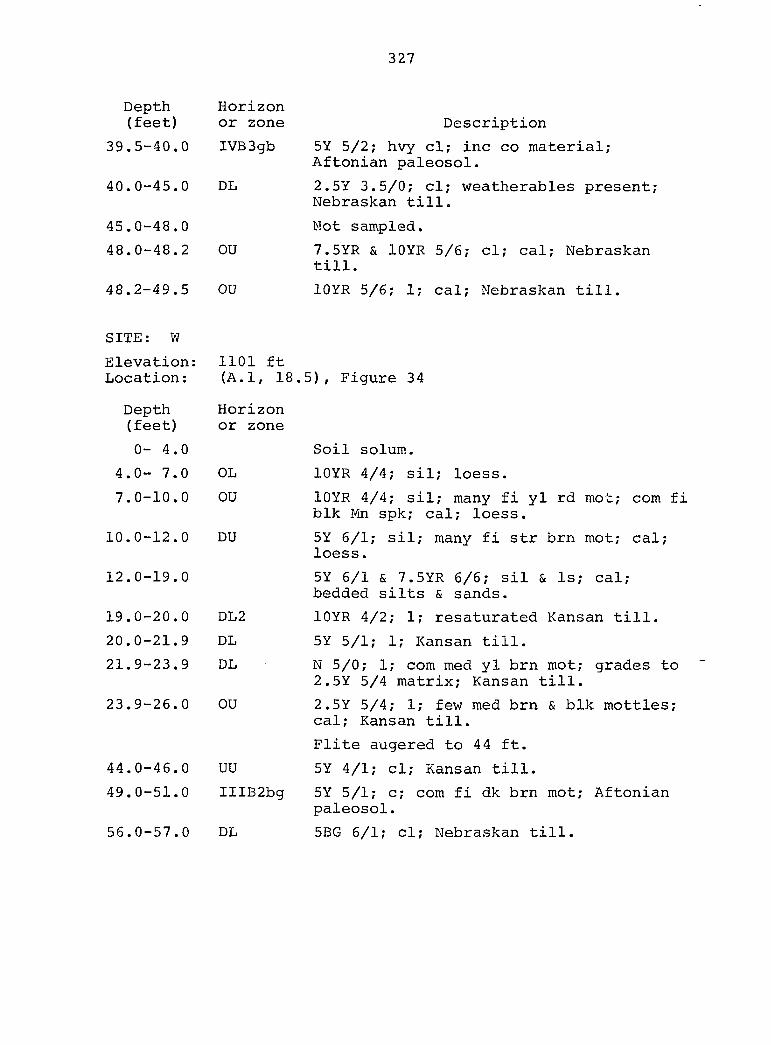
327
Depth (feet)
39.5-40.0
40.0-45.0
45.0-48.0
48.0-48.2
48.2-49.5
SITE: W
Elevation: Location:
Depth (feet)
0- 4.0
4.0- 7.0
7.0-10.0
10.0-12.0
12.0-19.0
19.0-20.0
20.0-21.9
21.9-23.9
23.9-26.0
44.0-46.0
49.0-51.0
56.0-57.0
Horizon or zone
IVB3gb
DL
OU
OU
Description
5Y 5/2; hvy cl; inc co material; Aftonian paleosol.
2.5Y 3.5/0; cl; weatherables present; Nebraskan till.
Mot sampled.
7.5YR & lOYR 5/6; cl; cal; Nebraskan till.
lOYR 5/6; 1; cal; Nebraskan till.
1101 ft (A.l, 18,
Horizon or zone
OL
OU
DU
DL2
DL
DL
OU
UU
IIIB2bg
DL
5), Figure 34
Soil solum.
lOYR 4/4; sil; loess.
lOYR 4/4; sil; many fi yl rd mot; com fi blk Mn spk; cal; loess.
5Y 6/1; sil; many fi str brn mot; cal; loess.
5Y 6/1 & 7.5YR 6/6; sil & Is; cal; bedded silts & sands.
lOYR 4/2; 1; resaturated Kansan till.
5Y 5/1; 1; Kansan till.
N 5/0; 1; com med yl brn mot; grades to 2.5Y 5/4 matrix; Kansan till.
2.5Y 5/4; 1; few med brn & blk mottles; cal; Kansan till.
Elite augered to 44 ft.
5Y 4/1; cl; Kansan till.
5Y 5/1; c; com fi dk brn mot; Aftonian paleosol.
5BG 6/1; cl; Nebraskan till.