Chapter 4. The hypothesis of eolian loess origin - the physical aspects
27
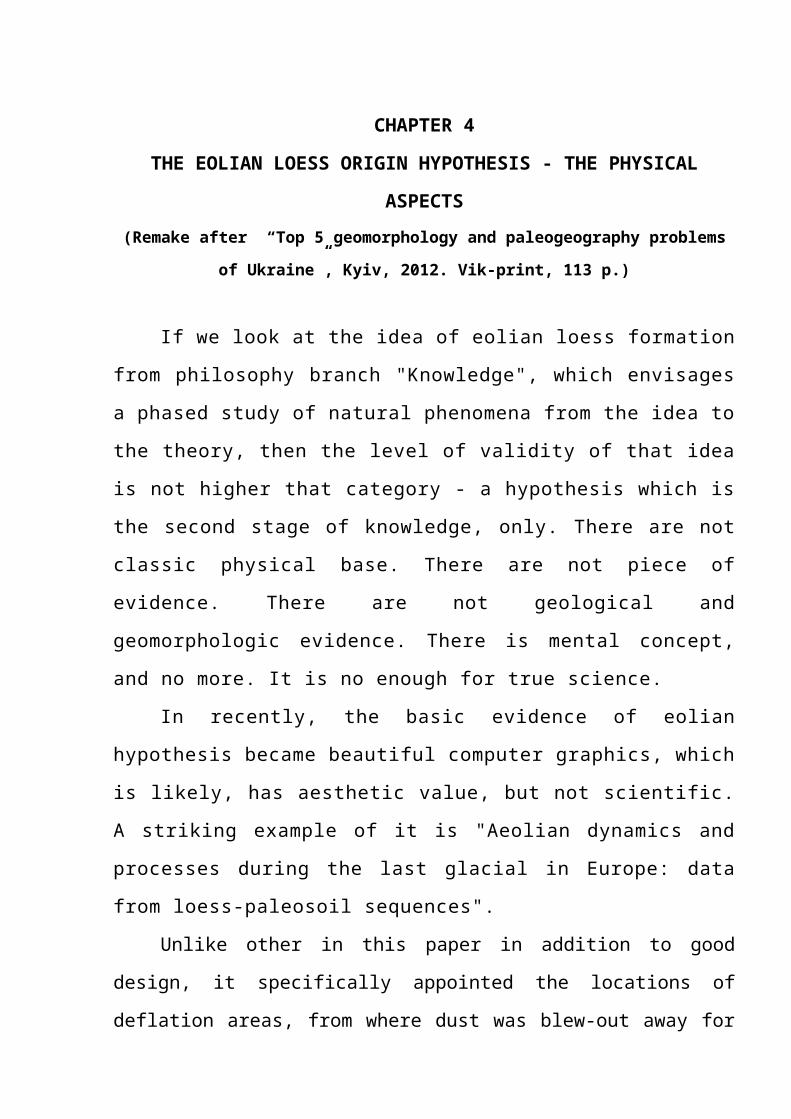
CHAPTER 4 THE EOLIAN LOESS ORIGIN HYPOTHESIS - THE PHYSICAL ASPECTS (Remake after “Top 5 geomorphology and paleogeography problems of Ukraine”, Kyiv, 2012. Vіk-print, 113 p.) If we look at the idea of eolian loess formation from philosophy branch "Knowledge", which envisages a phased study of natural phenomena from the idea to the theory, then the level of validity of that idea is not higher that category - a hypothesis which is the second stage of knowledge, only. There are not classic physical base. There are not piece of evidence. There are not geological and geomorphologic evidence. There is mental concept, and no more. It is no enough for true science. In recently, the basic evidence of eolian hypothesis became beautiful computer graphics, which is likely, has aesthetic value, but not scientific. A striking example of it is "Aeolian dynamics and processes during the last glacial in Europe: data from loess-paleosoil sequences". Unlike other in this paper in addition to good design, it specifically appointed the locations of deflation areas, from where dust was blew-out away for
-
Upload
independent -
Category
Documents
-
view
5 -
download
0
Transcript of Chapter 4. The hypothesis of eolian loess origin - the physical aspects
CHAPTER 4
THE EOLIAN LOESS ORIGIN HYPOTHESIS - THE PHYSICAL
ASPECTS (Remake after “Top 5 geomorphology and paleogeography problems
of Ukraine”, Kyiv, 2012. Vіk-print, 113 p.)
If we look at the idea of eolian loess formation
from philosophy branch "Knowledge", which envisages
a phased study of natural phenomena from the idea to
the theory, then the level of validity of that idea
is not higher that category - a hypothesis which is
the second stage of knowledge, only. There are not
classic physical base. There are not piece of
evidence. There are not geological and
geomorphologic evidence. There is mental concept,
and no more. It is no enough for true science.
In recently, the basic evidence of eolian
hypothesis became beautiful computer graphics, which
is likely, has aesthetic value, but not scientific.
A striking example of it is "Aeolian dynamics and
processes during the last glacial in Europe: data
from loess-paleosoil sequences".
Unlike other in this paper in addition to good
design, it specifically appointed the locations of
deflation areas, from where dust was blew-out away for
the formation of the European loess belt. The overall
patterns of the atmospheric circulation and transport
of dust, according to the authors, were as shown in
Fig. 4.1. What was the scheme of the atmospheric
circulation in those days, in fact, no one knows. This
pattern is fantasy of authors. For the reconstruction
of such schemes simply the sufficient input data do not
exist. It is simple example. Even today, when the huge
meteorological, geological and geomorphologic databases
exist, there is no consensus, whether we live in times
of global warming, or we are on the verge of a new ice
age. Some have come up with an interesting definition.
We live in a period of warming on the background of
general geological cooling. This is how? It is not
fantasy, it is demagogy. About what the reliable
reconstructions of the past with the return of tens of
thousands of years, can we talk? Such schemes can not
be attributed to the genre "science fiction", because
it need at least a minimum of theoretical
justification. About what the reliable reconstructions
of the past with the return of tens of thousands of
years, can we talk? Such schemes can not be attributed
to the genre "science fiction", because it needs at
least a minimum of theoretical justification.
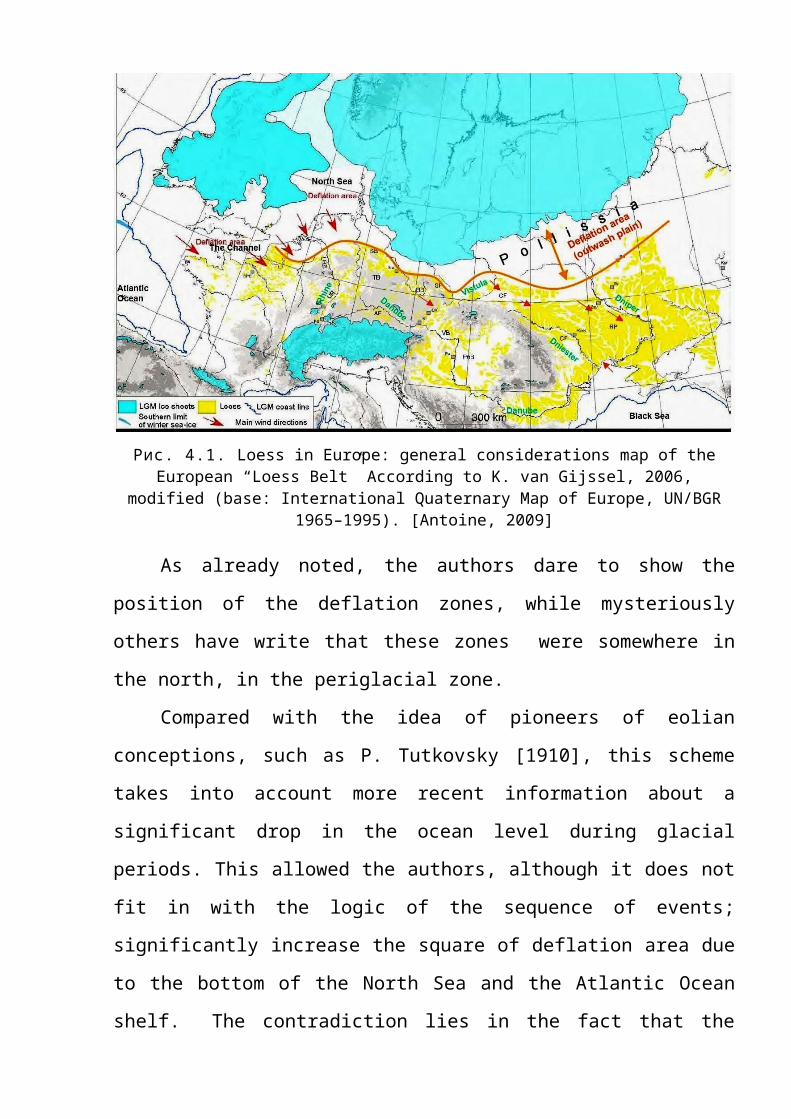
Рис. 4.1. Loess in Europe: general considerations map of theEuropean “Loess Belt” According to K. van Gijssel, 2006,
modified (base: International Quaternary Map of Europe, UN/BGR1965–1995). [Antoine, 2009]
As already noted, the authors dare to show the
position of the deflation zones, while mysteriously
others have write that these zones were somewhere in
the north, in the periglacial zone.
Compared with the idea of pioneers of eolian
conceptions, such as P. Tutkovsky [1910], this scheme
takes into account more recent information about a
significant drop in the ocean level during glacial
periods. This allowed the authors, although it does not
fit in with the logic of the sequence of events;
significantly increase the square of deflation area due
to the bottom of the North Sea and the Atlantic Ocean
shelf. The contradiction lies in the fact that the
removal of dust may begin only after the ablation of
glaciers. Prior to this, just nothing was for blowout.
The kingdom of ice spread everywhere. Both moraine,
outwash plain and even land did not exist, only water.
For some reason, authors do not take into account the
presence of enormous number of melt water. The water
must be of huge amount, melted three-kilometer icecap.
Naturally, that a significant portion of the water run
into the ocean, the level of which is constantly was
rising. And it is possible that by the time, when the
authors suggest the eolian activation, the places where
the deflation belt, were already under water.
Moreover, a significant part of the areas covered
by ice, the runoff system is not yet formed these areas
was occupied by swamps and lakes and today territories
of Baltic States mostly are wetland. A confirmation of
the significant post-glacial wetted of land we can
found in the paleogeography paper [Куниця, 2007]. If we
assume that the degradation of the glacier has
regularity, then today arid zones must been shifted to
the north i.e. Alaska, Yakutia and Taimyr, Yamal and
so on. But even using the field descriptions, satellite
imagery and geological survey data, we nowhere find the
signs of aridity. Traces of eolian activities somewhere
are present. For example, Alaska has a few small sand
areas. But in this case it concerns about the sand, but
not about clay. This fact some authors use as evidence
of the fine grain mass deflation. It is not correct
because the physical properties sand and clay are
significantly different. The effect of the wind on the
sand is possible under certain physical parameters
(humidity) in virtually all climatic zones. While fine
grain material shown the adhesion property. That
prevents the detaching of fine particles from the
surface. Detail on this later.
In general, it is clear that the final stage of the
glacial periods was not favorable for eolian activity.
Naturally, the "obvious" is not exactly a scientific
term, but the "eolizm" ideologues do not give the
slightest opportunity to go to the scientific language.
Would they have specific facts or calculations, charts,
maps, and then the scientific language was used by them
and their opponents. But in this case we have to talk
to them in one language. But in what language is not
clear.
Speaking of calculations, we propose a task. If
look at the map (Figure .4.1) we see that the deflation
area to several times less of square of loess zones.
Average thickness of the loess in Europe is 5 m. It
means from the deflation zones the 10 m rock was

withdrawn, at minimum. What rocks it was? What portion
of them belonged to the fine fraction? In any case,
gradual removal of sand leads that the big remains on
the surface begun save it. Further disinflation became
impossible. This type of surface is called deflation.
If perceive the seasonal changes of the Earth's
surface as a compressed time model of glacial epochs,
then the period of the glaciers melting will correspond
of the annual snowmelt time. We live in a frame of this
model, and no surprise that eolian activity does not
begin immediately after the disappearance of the snow.
It can start only after the land became sufficiently
dry. It is "eolian active period". The moisture level
of the sand (table 4.1) which stops its deflation has
long been well known [Захаров, 1964], but this aspect
of eolian processes, neither before nor now "eolists"
do not mention. If you look at table 4.1, you
understand why. All is simple. Any eolian activities
are impossible when moisture of sand overcome 4%. It is
tragedy for “eolists”. My condolences!
Table 4.1.

We see the 5m, 10m 15m op perfectly uniform
thickness of loess and no trace of seasonal changes.
How is it possible? Even with a layer thickness of 5 m
accumulation rate of 2 mm per year of its formation
will last 2,500 years. And all this time there was no
winter, no spring, any summer? There were the
uninterrupted wind, uninterrupted dust and
uninterrupted loess, only. There were no vegetation, no
animals, and, in the end, no people! It is stupid,that uninterruptedly is repeating in "scientific"
paper. It must to interrupt.
Continue to analyze the content of the map. Dwell
only on the assumption of the deflation areas existence
in the past in Polissia. It is unknown what kind data
were used to draw conclusions about the existence of
conditions for deflation here. After analysis of the
map seems that for map compilation any data was not
used, include the simplest physical map of Europe.

Easy to show, that the study of this simple map
would be enough for the more important conclusions.
History of European glaciations contains very important
omission. This is the role of continental topography in
postglacial water escaping. Mainly it is topographic
barrier (red line on fig. 4.2.) that running from
Germany (Rain valley) to central east Ukraine (Dnipro
valley). Its length is 1500 km more. On the west end it
starts from Harz Mountains with average elevation about
1000 m. On the east end are the Volyn and Mozyr uplands
with elevations 200 m less. Within the Dnipro-river
valley in the previous ice ages the barrier prolonged
to the east (as the end moraine) up to Smolensk–Moscow
Upland. Nevertheless, this segment of barrier was
destroyed by 5 time’s catastrophic floods of the
Holocene second half.
In general the remains of orographic barrier are
arc-form bent to the sough. Along it there is few bends
second order. All together are trap for melted glacial
water. From local bands the water escaping is
impossible in total. Drainage of these areas is carried
out by evaporation, only. This area is doomed to be
wetland long-long time after end of ice ages. The story
that this plain after the ice stages was occupied by
desert are only tale and no more. Ten thousands years
after the glaciation (Wurm LGM show by blue line on
Fig. 4.2) area stays strong wetted.
Evidences of this statement you can see on the
topographic map partly cover Polissia area on the
junction of three countries – Ukraine, Poland and
Byelorussia. During the last glaciation this area
was spaced from the ice sheet by few hundreds
kilometres. The water was coming from the southern
uplands and from ice body simultaneously. According
the geological prospecting, the lacustrine sediments
lie at the altitude near 200 m on the south of
Ukrainian Polissia. At the last stage of Wurm ice
age (12 ka BP) the water elevation in proglacial
lake was about 140m.

Fig. 4.2. Arrangement of the Wurm glacial limit and theorographic barrier that prevented runoff of melt water to the
south (Blue arrow – catastrophic flood direction, УКЩ -Ukrainian crystalline massif, BA – Voronezh massif)
Data Aggregation Geological Survey fully
confirms the strong watering of the Pripyat basin
after each glaciation. In this regard, among the
geologists was the term "Pripyat marshes." [Коржуев,
1960]. After that recall the contents of Table 4.1 and
draw conclusions.
Will not judge the quality of the entire map, but
the interpretation of the Polissia territory is
absolutely incorrect. It is useful to indicate that
Polissia deflationary zone, as shown on the map, is the
greatest.
In addition to high humidity Polissia there is
another obstacle to the deflation of fine-grained
material. First, it wills the observed data. After, the
justification will be presented. This will be done on
the basis of classical physics. It will be next reason
for disorder of "eolists".
Will not be assuming mistake to think that
"eolists" think the take-off speed and the size of
the grains have linear dependence. The smaller the
grain size of the smaller should be the speed of the
wind. Then for dust, it can be close to zero. How as
it is in reality?
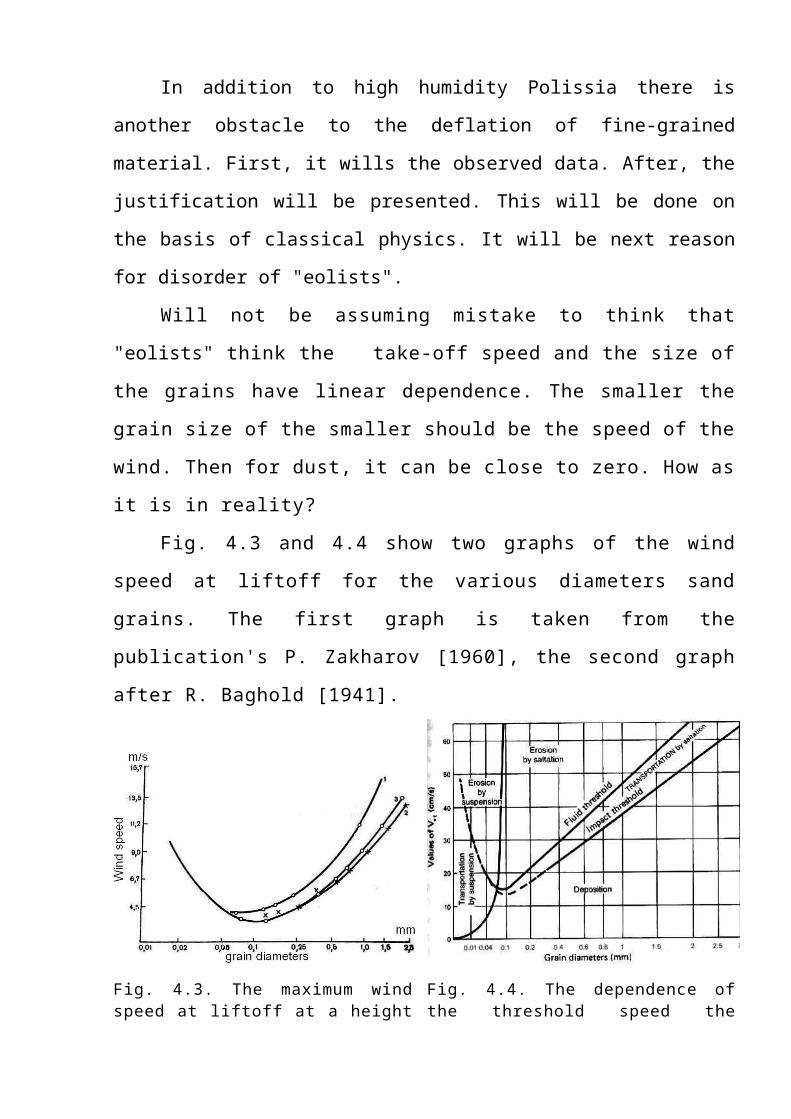
Fig. 4.3 and 4.4 show two graphs of the wind
speed at liftoff for the various diameters sand
grains. The first graph is taken from the
publication's P. Zakharov [1960], the second graph
after R. Baghold [1941].
Fig. 4.3. The maximum windspeed at liftoff at a height
Fig. 4.4. The dependence ofthe threshold speed the
of 15 cm, required toinitiate movement of soilparticles: 1 - sand; 2 -sandy loam; 3 - heavy loam.
separation from grain size.
Both graphs have the same character of the
curve. From grains diameter of about 0.1 mm, the
curve of the speed liftoff to rise in both sides, in
the direction of decrease and increase the grain
size. The both wings have almost linear curve, as
seen from Fig. 4.4 the proportional scale saved. For
example, speed liftoff of particles of 0.02 mm is
the same that required for particles of 0.6 mm.
According P. Zakharov speed of wind must be about 7
m/s at a height of 15 cm above ground.
Explaining the law of increasing the liftoff
speed with decreasing grain size, A. Ivanov said
that the reason interpret by increasing of molecular
forces [1972], i.e., responsibility for this
widespread in nature and well-studied phenomenon -
adhesion. Its physical aspects are widely known
among physicists, but either among naturalists. Its
ubiquity can be seen even from the titles of the
papers, such as «Theoretical and experimental
investigations in planetary dust adhesion» [Perko,
2002].
This name reflects the adhesion and it
participation in geological processes. People in
everyday life and production activities are
constantly faced with adhesion. For example, noting
that after a while the cement itself hardens, and a
bunch of fresh clay after a while covered with a
solid crust, and in the subsequent time a bunch of
soft clay bulk material turned into a monolith.
Flour and sugar behave in the same manner. The
question, can the wind destroy such compacted
substance? Answer is simple, no!
To say that the concept adhesion is alien for
geology is impossible. Enough on the Internet to
search by keyword «Loess adhesion force» or «Clay
adhesion force» and it becomes clear that in
engineering geology this phenomenon is known,
studied and taken into account when calculations of
subsidence, resistance structures, etc. It is
strange that those who offer a certain pattern of
interaction different substances, loess, failed to
learn its main physical properties.
A good example of adhesion is earth roads loess
provinces. In the long absence of rain in they
formed a thick fluffy layer of dust, in which the
feet sink. When on such roads car rides, its kinetic
energy is partly focus on destruction of monolithic
loess, which are transformed into a loose mass, i.e.

in dust. This mass is lifted into the air following
a car and forms dense clouds of dust that hang in
the air for a long time and slowly travel with weak
wind. Day after day track gets deeper. Several
decades ago, a smaller cloud of dust, on such roads
could also be observed for slow moving carts. A
smaller dust clouds rose from under pedestrian feet.
That is, the apparent ease of lifting dust and its ease
of movement by wind and gave impetus for the emergence
of eolian loess formation version. Too easily dust
rose. Reality was a bit more complicated, and
interestingly, even much more interesting.
Sooner or later, but the rains started. Rainwater flows
into a rut bring back the blown out loess. After a
while the puddles became dry, dirt, due to
manifestations of adhesion, became compact, then it
forms a hard crust on which we can confidently go and
can drive the lorry. After then, everything is back to
initial point: the fluffy dust, running car, clouds of
dust, track, puddles, sludge, crust, and finally, the
idea of eolian origin of loess has been forge.
Congratulations!
Let's try to break this vicious circle! It has
already been said about the scrutiny of the effects
of wind on sand and clay surfaces. Let us dwell on

some details. In the phenomenon of migration of sand
blown studied not only the physical principles of
the wind effects on the surface, but also the
participation of factors such as a change of wind
speed with height, surface moisture, seasonality,
the impact on the wind-sand flow of the
electrostatic field. With respect to clay particles
transportation by wind, anything like this is not
done. It is vain. Since then we had to start.
To fill this gap, we will analyze why and how
the dust flies out from under the wheels of cars and
carts in loess roads. Of field prospecting
experience we can say that the car is moving at
average speed of about 20 km/h or 5.6 m/s. We assume
that the velocity air relative to ground is car
velocity, i.e. the 5.6 m/s. The extrapolating of
speed at liftoff (Fig. 4.3), we find that for a
given rate, it could raise the grains diameter of
from 0.035 mm to 0.5 mm. But as is known, about 80 %
of the loess fraction lies in interval from a 0.05
mm and 0.002 mm. And 5—30 % is clay with grain less
0,002 mm. This means that at a given speed, only the
largest particles will liftoff. As can be seen from
both graphs, the experimental results limited of
grain size from 0.015 and 0.04 mm. On Fig. 4.4 the
line of graph continued by dotted, i.e. these values
are assumed.
The wind speed at the height of 15 cm for the
liftoff of particles: 0.05 mm is 4.7 m/s (in terms
of standard height weathervanes about 10 m/s). For
particle less than 0.015 experimental data not
presented. For 0.015 mm grain extrapolated rate
equals 13.5 m/s at a height of 15 cm, or about 27
meters at an altitude wind vane. What is the speed
of separation should be for smaller particles are
impossible to say.
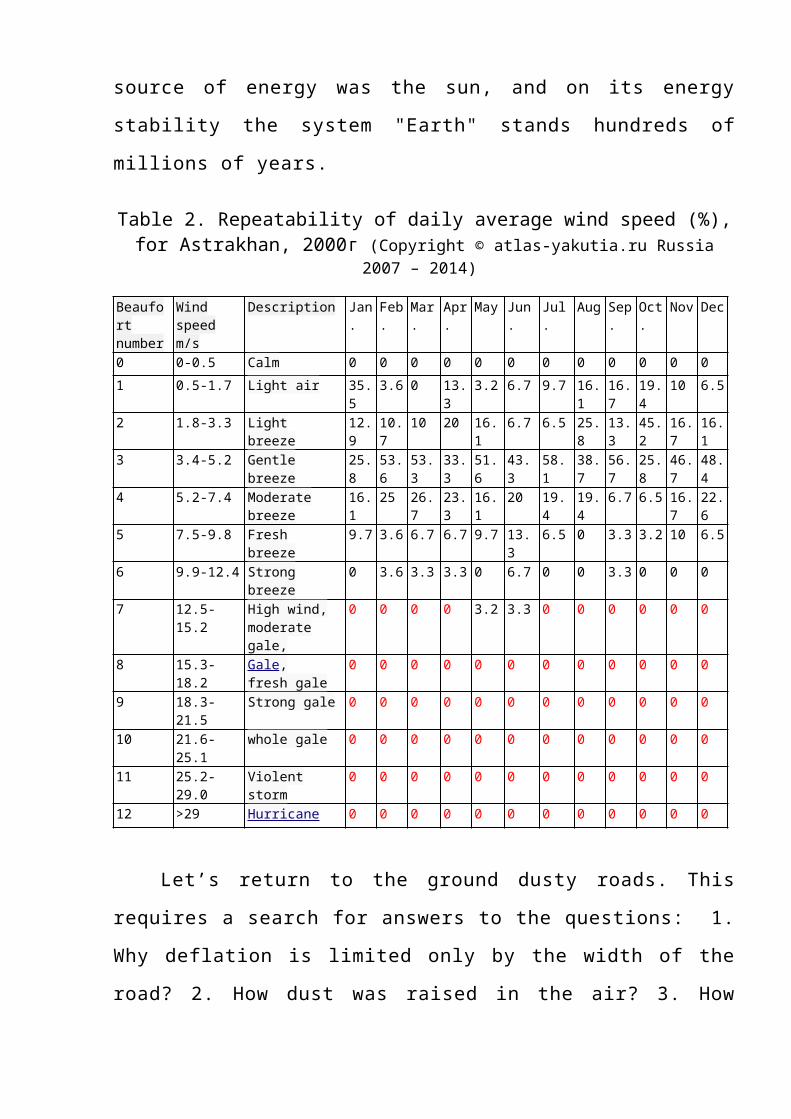
But even the rate of 27 m/s is sufficient for
denial of eolian conception origin of loess. In
Beaufort scale this rate of wind lie in the whole
gale category. Obviously, for small grains the wind
must be even stronger. For the present climate these
rates of wind are rare and mentioned in weather
reports, when it comes to hurricanes or storms. Even
in the windiest area, which has the Caspian Sea
region, the wind rates above 7-Beaufort number are
unknown (Table 2б for areas marked on the map in
Fig. 4.1 as deflation zone, these figures for
eolian activity is even less favorable (Look tohttp://www.atlas-yakutia.ru/weather/wind/climate_russia-
povt_wind.html). Assume that in those days atmosphere
energy was other no reason. Today, as then, the
source of energy was the sun, and on its energy
stability the system "Earth" stands hundreds of
millions of years.
Table 2. Repeatability of daily average wind speed (%),for Astrakhan, 2000г (Copyright © atlas-yakutia.ru Russia
2007 – 2014)
Beaufort number
Wind speed m/s
Description Jan.
Feb.
Mar.
Apr.
May Jun.
Jul.
Aug Sep.
Oct.
Nov Dec
0 0-0.5 Calm 0 0 0 0 0 0 0 0 0 0 0 01 0.5-1.7 Light air 35.
53.6 0 13.
33.2 6.7 9.7 16.
116.7
19.4
10 6.5
2 1.8-3.3 Light breeze
12.9
10.7
10 20 16.1
6.7 6.5 25.8
13.3
45.2
16.7
16.1
3 3.4-5.2 Gentle breeze
25.8
53.6
53.3
33.3
51.6
43.3
58.1
38.7
56.7
25.8
46.7
48.4
4 5.2-7.4 Moderate breeze
16.1
25 26.7
23.3
16.1
20 19.4
19.4
6.7 6.5 16.7
22.6
5 7.5-9.8 Fresh breeze
9.7 3.6 6.7 6.7 9.7 13.3
6.5 0 3.3 3.2 10 6.5
6 9.9-12.4 Strong breeze
0 3.6 3.3 3.3 0 6.7 0 0 3.3 0 0 0
7 12.5-15.2
High wind,moderate gale,
0 0 0 0 3.2 3.3 0 0 0 0 0 0
8 15.3-18.2
Gale,fresh gale
0 0 0 0 0 0 0 0 0 0 0 0
9 18.3-21.5
Strong gale 0 0 0 0 0 0 0 0 0 0 0 0
10 21.6-25.1
whole gale 0 0 0 0 0 0 0 0 0 0 0 0
11 25.2-29.0
Violent storm
0 0 0 0 0 0 0 0 0 0 0 0
12 >29 Hurricane 0 0 0 0 0 0 0 0 0 0 0 0
Let’s return to the ground dusty roads. This
requires a search for answers to the questions: 1.
Why deflation is limited only by the width of the
road? 2. How dust was raised in the air? 3. How

formed the dust clouds, which took of volume in
hundreds cubic meters?
The answer to the
first question is almost
is, it needs only
detailed. Deflation is
limited by the width of
roads in loess (clay)
areas and occurs due to
anthropogenic activities.
Motion of lorry supports
surface rocks in the loose
bulk state. If the virgin
surface and has even minimal vegetation, the wind
erosion or non-existent, or it provokes by animals
activities. Most clearly evidenced of it presents on
the space views on arid zones. For example please
look on the West Kazakhstan (fig. 4.5).
The answers to second and third questions
require some remarks. Unfortunately, until today all
geography theory stands on the concept that derived
from direct observations of human organs, sight,
hearing, smell and feeling on contact. Physical
laws, except gravity, rarely involved. For example,
every one after the post-secondary schools is know
Fig. 4. 5. Detailed space image of the plateau Ustuyrt area. White spots are rodent settlements.

the phenomenon as electrification and electrostatic
forces. But how often they are used to explain
natural phenomena?
Everybody knows that when the solid part
transfers by the wind they are electrified. Air
becomes one sign and solids become opposite. So when
the dust rises up in the air under the pressures of
feet or wheels it instantly electrified. Between
the particles an electrostatic force emerges that
pushes away the particles in different directions.
Dispersion makes gravity and aerodynamics secondary
factors. Therefore, the lifted dust occupies the
maximum of possible volume. Slow discharge of dust
is the cause of slow it sedimentation. The presence
of residual charge makes the fluffy dust. Partly the
dust was removed outside the road.
Note, the above text does not preclude the
natural deflation of clay rocks. Interesting
examples of this have solonchak (sor) and blowout
basins of western Kazakhstan. But this phenomenon is
not primitive as represented by some researchers.
There is dry surface, there is a breeze and it is
enough. Deflation began. The physical properties of
dry clay surface are slightly different from the

concrete. Who tried to spade it, one knows. For
beginnings, the surface must be disintegrated. And
then rocks can be removed by wind. It is an
interesting process line with strong operations
sequence. Step by step. About it will speak in the
next time.
Литература:
1. Армашевский П. Я. О происхождении лесса (Общая геологическаякарта России, лист ( Полтава – Харьков – Обаянь), Труды Геол.Ком., т. ХУ, №1, 1903. с 2. Афанасьев А.П. и др. Новые материалы к изучению движениятукуланов Центральной Якутии. - В кн.: Природа и хозяйствоСибири. Якутск, 1977, с. 55-56.3. Веклич М. Ф. Западное ричерноморьеб Юго-Запад и ЦентрЕвропейскаой части СССР // Геохронология СССР, т. 3, (Новейшийэтап). Под ред. Зубакова В. А. – Л., Наука, 1974. с. 85-94. 4. Величко А. А., Тимирева С.Н. Западная Сибирь — великаяпозднеледниковая пустыня // Природа. 2005. №5. С. 54–62.5. Возгрін. Б. Д, Гладких M. І,; Рижов С. М.; Суховій М. О. Нові данніщодо геологічного датування палеоантропологічних решток зс.Лащове. - Археологія України , Інститут археології НАНУкраїни, 2004, с. 71-75;6. Вознячук Г. Н. К стратиграфии и палеогеографии неоплейстоценаБелоруссии и смежных территорий // Пробл. Палеогеогр. антроп.Белоруссии: Минск. 1973. с. 45-75 7. Геоморфологічна карта України // Національний Атлас України(електронна версія) / Палієнко В. П. Під ред. Л. Г. Руденка.– Київ: ІГ НАНУ, 2006.8. Гладких M. І, Рижов С. М, Синиця Є. В. Охоронні розкопки наКанівщині / Археологічні відкриття в Україні 2001-2002 р.р., ІAHAH України, 2002, с. 109-1119. Горецкий Г. И. Об уточнении геологических датировок палеолитаРусской равнины. - Тр. ГИН АН СССР, 1959, вып. 32. с.21-3510. Дмитриев А.И. Микроэволюционные процессы в популяцияхископаемых грызунов прикаспия в голоцене // ВестникНижегородского университета им. Н.И. Лобачевского. Сер. Биол.Вып. 1 (9). Матер. VIII Всерос. популяцион. семин. «Популяции впростр. и времени» (11–15.04.2005 г.) Н. Новгород. Узд.Нижегородского госунив. 2005. С. 57-67.11. Залеський І.І. Зелінський П., Федорович С. Вік еолових форм урайоні смт. Маневичі // Природа Зах. Полісся та прилег. терит. –Зб. наук. праць. - №. 5 – Луцьк, 2008. – С. 8 – 13.12. Заморій П. К. Четвертинні відклади Української РСР: В 2 ч. –К. : Вид-во КГУ, 1961. – Ч. 1. – 550 с.; 13. Захаров П.С. Пыльные бури. Л., Гидрометеоиздат, 1965. - 164с.
14. Звід пам’яток історії і культури України: Полтав. Обл. ./Новосанжарський район/, упоряднтак В. О. Мокляк, - Полтава,Дивосвіт, 2007. – 178 с. ; 15. Иванов А.П. Физические основы дефляции песков пустыни.Ашхабад, 1972 - 112 с.16. Історичний Атлас України, 2010.17. Калечиц Е.Г. Первоначальное заселение территорииБелоруссии // Минск, Наука и техника, 1984. – 159 с.18. Карлов Н. Н., Кравченко А. И. Четвертичные вулканические пеплыокрестностей Днепропетровска //Тр. Комис. по изучению четверт.периода, вып. ХIII, 1957, с. 290-300.;19. Карта неотектонічних рухів // Національний Атлас України(електронна версія) / Палієнко В. П. Під ред. Л. Г. Руденка.– Київ: ІГ НАНУ, 2006.20. Климатический справочник СССР. Вып.10, УССР и МССР. Киев,1950, - 713 с. 21. Коржуев, С. С. Рельеф Припятского Полесья / С. С. Коржуев. –Мн., 1960. 141 с.22. Крокос В. І. Четвертичная серия Днепропетровського района //Путеводитель экскурсии второй четверт-геол конф. - М. -Л.,1932. - С. 145-161. 23. Куница Н. И. Природа Украины в плейстоцене. – Черновцы,Рута, 2007, 240с.24. Левицький І.Ф. Гінцівська палеолітична стоянка // Палеоліт інеоліт Укрїни, т.1., вип. 3, К., 1949. с.198-236.25. Личков Б.Л. К вопросу о существовании пустынь в четвертичноевремя в Европе // Зап. Киев. о-ва естествоисп. — К., 1928. — Т.28. — Вып. 3. — С. 42. 26. Малеева А.Г. История фауны грызунов и природного очага чумысеверо-западного Прикаспия в позднем антропогене: Автор. дисс.канд. биол. наук. Свердловск: 1967. 17 с. 27. Маринич А.М. Геоморфология Юного Полесья. Киев, изд-воКиевского госуниверситета, 1963. - 252 с.28. Мороз С. А. Олігостромова природа Канівськихдислокацій //Сучасний стан та перспек. розв. геоморфол.,неотектон. та палеогеог. Антроп. України, 1996. – с. 19-21. 29. Нехорошев П.Е. Конец среднего палеолита на Русской равнине всвете материалов стоянки Шлях // Актуальные проблемы первобытнойархеологии восточной Европы: Сборник Статей / АрхеологическийАльманах, № 20. – Донецк: «Донбас» 2009. с.111-129.30. Нужний Д.Ю., Ступак Д.В., Шидловський П.С. Розкопкипізньопалеолітичного поселення Семенівка III у басейні Трубежу у1997-1998 pp. // Археологічні відкриття в Україні 1997 - 1998pp. – К., 1998. - С. 115-118.

31. Пазинич В. Г. Геофізика явища еолової акумуляції. – К. :Геопрогноз, 1994 - 47 с.32. Пазинич В. Катастрофічні повені голоценового періоду налівобережжі середнього Дніпра // Наукові праці УкрНДГМІ, 2009,Вип. 258. с. 160-168. 33. Пазинич В.Г., Стахів М.П. Результати обстеження алювіальноїтовщі в кар’єрі м. Комсомольськ (Полтавська обл.) // Фіз.географія та геоморфол. № 55, К., 2009. с. 175-176 34. Пазинич В.Г. Серебряков В.Л. Результати радіовуглецевогодатування похованого ґрунту з Ярошівського граніт. кар’єру //Фіз. Геогр..та геомор.. № 61, К., 2010. с. 145-150.35. Пазинич В. Періодичність катастрофічних повеней в басейніДніпра // Фізична географія та геоморфологія № 61, Київ, 2010.с. 174-18236. Пазинич В., Галаган О., Пазинич Н. До протиріч у датуваннідніпровської «морени» // Фізична географія та геоморфологія №59, Київ, 2010, с. 144-148.37. Пидопличко И. Г. Новый метод определения геологическоговозраста ископаемых костей четвертичной системы, К., Изд-во АНУССР, отд. вып., 1952, 90 С. 38. Пазинич В. Г. Періодичність катастрофічних повеней в басейніДніпра // Фізична географія та геоморфологія № 61, Київ, 2010,с. 174-18239. Пазинич В. Г. Топ-5 геоморфологічних та палеогеографічнихпроблем України, Київ, 2012. Вік-Принт, 113с.40. Переверзнєв С.И., Сорокун А.А. Дослідження неолітичної стоянкиРоманків на Київщині // Кам’яна доба, вип..13., Шлях, К., 2010.– с.254-269. 41. Петренко Л.В., Третяк П.Р., Ковалюх Н.Н. Геохронологияформирования аллювиальных отложений р. Днестр в позднем голоцене// Стратиг. и коррел. морск. и контин. отлож. Украины, Зб. науч.труд. ИГН, К.: 1987. С.78-85. 42. Підопдічко І.Г. Дослідження палеоліту в УРСР //Палеоліт і неоліт України,Т.1. Вип.1, АН УРСР, 1949. – с. 7-36.43. Підопдічко І.Г. Палеолітична стоянка Новгород-Сівенрськ //Палеоліт інеоліт України, Т.1. Вип.2, АН УРСР, 1949. – с. 65-107.44. Попов А.И., Тумель Н.В. и др. Региональная криолитология || Уч.Пособие, Изд-во Моск. ун-та, 1989, 255 с.45. Ризниченко В. В. О геоморфологических особенностях итектонике района прирыва Днепра через Украинскую кристаллическуюполосу // Тр. ком. по изуч. четверт. периода. – 1932. -Вып. 2. – С. 4-32.
46. Степанчук В. М. та інш. Багатошарова стоянка Міра насередньому Дніпрі: основні результати розкопок 2000 року.Кам’яна доба України, вип. . 5., К., Шлях, 2004 – С. 62-99. 47. Степанчук В.Н. Нижний и средний палеолит Украины. –Черновцы, Зелена Буковина, 2006. 463 с. 48. Саваренский Ф. П. Четвертичные отложения в районеДнепростроя // Путеводидель екскурсий второй четвертично-геологической конференции. - М. -Л., 1932. - С. 163-184. 49. Тутковский П. А. О происхождении озерных лессов. Трудыобщества исследователей, Житомир, 1912. 240 с. 50. Финаев А.Ф. Модель переноса и выпадения пылевого аэрозоля вюжных районах Таджикистана //Археология и палеоэкология Евразии.Новосибирск, 2004. с.349-358.51. Чапалыга А. Л. Позднеледниковое обводнение в Понто-Каспийскомбассейне как прототип Всемирного потопа // В книге: Экологияантропогена и современности: природа и человек. СПб. :Гуманистика, 2004. 52. Четвертинні відклади // Національний Атлас України (електроннаверсія) / Возгрін Б.Д., Гожик П.Ф., . Під ред. Л. Г. Руденка.– Київ: ІГ НАНУ, 2006.53. Швец Г. І. Водність Дніпра. - К. : АН УРСР, 1960. – 148 с. 54. Шелкопляс В. Н., Христофорова Т. Ф. Возраст плейстьоценовыхозерно-ледниковых отложений перигляцыальной зоны УССР, //Перигляциальные образования плоейстоцена (Препринт ИГН 80-16),К., 1980, с. 39-40 55. Aeolian Sediment Transport. www.geo.utep.edu/pub/ hurtado/241256. Antoine P., Rousseau D., Hatte C., Gauthier C., Moine O., Iang A., Fuchs M., Zöller L., Lagroix F., Sima S. Aeolian dynamics and processes during the last glacial in Europe: data from loess-palaeosol sequences // Laboratoire de Géographie Physique, UMR 8591 CNRS, Meudon France, 2009. (pages-142.unibe.ch/science/adom/pdf/ADOM_Antoine.pdf)57. Bagnold, R. A. The Physics of Blown Sand and DesertDunes, Methuen, N-Y., 1941. 58. Cserny, T., Nagy-Bodor E. Limnogeological investigations on LakeBalaton. -- In: Gierlowski-Kordesch, E., K. Kelts (Eds): LakeBasins through Space and Time. AAPG Studies in Geology 46, 2000.p. 605-618.59. Dinu Al., Soficaru A., Miriţoiu N. The Mesolithic at the Danube’sIron gates: new radiocarbon dates and old stratigraphies,Documenta Praehistorica, 34, 2007, p. 31 – 52.60. Fedorowicz S., Ùanczont M., Muc A,. Comparison of luminescence (TLand OSL) dating results from selected loess profiles in SE
Poland and the NW Ukraine Geologija. 2005. Vilnius Nr. 50. p.19–2661. Fladerer F. A calf-dominated mammoth age profile from the 27 kyBP stadial Krems-Wachtberg site in the middle Danube valley //Advances in mammoth research, Deinsea 9, 2003. p. 135-158.62. Fodor L., Csillag G., Németh K., Budai1 T., Cserny T., Martin U.,Brezsnyánszky K., Dewey J. Tectonic development, morphotectonics andvolcanism of the Transdanubian Range: a field guide //Occasional Papers of the Geological Instit. Hungary, volume 204.2005, p. 59-86.63. Fodor L., Bada G., Csillag G., Horváth E., Ruszkiczay-rüdiger Z., Síkhegyi F.New data on neotectonic structures and morphotectonics of thewestern and central Pannonian Basin Occasional Papers of theGeological Institute of Hungary, volume 204, 2005, p. 35-44.64. Frechen M., Terhorst B., Rahle W. The Upper Pleistoceneloess/palaeosol sequence from Schatthausen in North Baden-Württemberg // Quaternary Science Journal. 56/3 2007 p.212-22765. Frechen M., Kösel M., Rähle W. The Late Pleistocene loess profi le Nussloch (SW wall). // Quaternary Science Journal. 56/4 2007 p.227-25566. Frechen M., Schirmer W. Luminescence Chronology of the Schwalbenberg II Loess in the Middle Rhine Valley Quaternary Science Journal, 60 / 1, 2011 p. 78–8967. Gerasimenko N. Stari Bezradychi section // The Ukraine Quaternary explored: the middle and upper Pleistocene of the middle Dnieper area and its importance for East-West European correlation (9-14 September 2001). Keiv, 2001. – p. 13-19.68. Hooke Roger LeB. . Principles of Glacier Mechanics. Second Edition Department of Earth Sciences and Climate Change Institute University of Maine, Orono, 200569. Huhmann M. Landschaftsentwicklung gegenwartigeBodendegradation ausgewahlter Gebiete am oberen Dnister(Westukraine) – Marburg, Lahn/2005/ - XXYIII, 299S.70. Jary Z. Zapis zmian klimatu w górnoplejstoceńskich sekwencjachlessowo-glebowych w Polsce i w zachodniej części Ukrainy. Zdzisław Jary. Instytut Geografii, Wroclaw, 2007. p. 136.71. Klimaszewski М. Geomorfologia. – Warszawa. 1978. – S.101072. Kukla V.J.,, Lozek V., Barta V. Das Lessprofil von Nove Mesto imWaagtal Eiszeitalter und Gegenwart Band 12 Seite 73-941961.73. Lisá L., Fišáková N. The Dolní Věstonice – Pavlov settlement complex // Abstract book and confer. guide, OIS 3 Confer. Anthropos Pavilion, 15th - 17th of March, Brno 2010, p. 52-61
74. Nádor A., Sinha R., MagyariA., Tandon S.K., Medzihradszky Z., Babinszkia E.,Thamó-Bozsó E., Unge Z.r, Singh A.. Late Quaternary (Weichselian)alluvial history and neotectonic control on fluvial landscapedevelopment in the southern Körös plain, Hungary,Palaeogeography, Palaeoclimatology, Palaeoecology 299 (2011) 1–14.75. Neruda P. Moravia during ois 3: Cultural relations.Praehistoria vol. 9–10 (2008–2009) p.125-149 76. Perko H. A. Theoretical and experimental investigations inplanetary dust adhesion. Colorado State University Fort Collins,Colorado Spring 2002, p.213.77. Ringer A., Lengye Gl. The upper Palaeolithic site at Budapest Corvin-tér, Praehistoria vol. 9–10 (2008–2009) . p. 205-213 78. Rousseau D.-D., Antoine P., Gerasimenko N., Sima1 A., Fuchs M., Hatt´e C., Moine O., Zoeller L. // North Atlantic abrupt climatic events of the last glacial period recorded in Ukrainian loess deposits. Climate of the Past. Clim. Past, 7, 221–234, 2011 79. S´ıkhegyi F.. Active structural evolution of the western andcentral parts of the Pannonian basin: a geomorphologicalapproach EGU Stephan Mueller Spec. Public. Series, 3, 203–216,200280. Simon U., Einwögerer T. An Upper Palaeolithic Open Air Sitenear Saladorf (Lower Austria), Wiss. Mitt. Niederösterr.Landesmuseum, 19б 2008ю зю 141-14881. Sümegi1 P., Molnár M., Svingor E., Szántó Z., Hum1 L., Gulyás1 S. Resultsof radiocarbon analysis of upper weichselian loess sequencesfrom hungary // radiocarbon, Vol 49, Nr 2, 2007, p 1023–103082. Schielein P., Schellmann G., Lomax J.. Stratigraphy of LateQuaternary fluvial terraces at the confluence of the Lech andDanube valleys Quaternary Science Volume 60 / Number 4 / 2011 /414–424 / DOI 10.3285/eg.60.4.0283. Székely B., Molnár G., Ferencz E., Dövényi P., Krumrei I. and Timár G.Swaths of topographic sink depressions interpreted as remnantsof paleomeanders in the vicinity of Lake Balaton, Hungary:evidences of young uplift or base level drop?, 2005. GeophysicalResearch Abstracts, Vol. 7, 09989, 2005.84. Vlačik M. Carnivores from Trenčianske Bohuslavice – PodTureckom and Moravany – Lopata II , two Gravettian open-airsites in Slovakia Slovensky kras acta Carsologica slovacasuppl. 1 113 – 124 Liptovsky mikulaš, 2009.85. Zieliński P, Sokołowski R.J., Fedorowicz S. and Jankowski M. -Stratigraphic position of fluvial and aeolian deposits in theŻabinko site (w Poland) based on tl dating/ G eochronometria

(2011) 38 , Journal on methods and applications of absolute chronology : 64-71 , Мarch 01, 2011.86. Zolitschka B, Negendank J F W, Lottermoser B G, Sedimentologicalproof and dating of the early Holocene volcanic eruption ofUlmener Maar (Vulkaneifel, Germany). Geol Rundschau, 84: 1995. 213-219