GEOCHEMICAL ASSESSMENT OF THE UNCONFINED AQUIFER IN A RECENTLY RECLAIMED WETLAND AREA: A CASE STUDY...
13
GEOCHEMICAL ASSESSMENT OF THE UNCONFINED AQUIFER IN A RECENTLY RECLAIMED WETLAND AREA: A CASE STUDY FROM THE PO RIVER DELTA Dario Di Giuseppe 1,* , Barbara Faccini 1 , Micòl Mastrocicco 1 , Nicolò Colombani 2 , Massimo Coltorti 1 , Giacomo Ferretti 1 1 Dipartimento di Fisica e Scienze della Terra, Università di Ferrara 2 Dipartimento Scienze della Terra, Università “Sapienza” di Roma * Corresponding author: E-mail [email protected] Abstract This study focuses on the distribution of main anions and nitrogen species in the unconfined aquifer of a recently reclaimed land. In a 6 ha experimental field, 10 piezometers for water level measurement and groundwater sampling have been installed. After one year of monitoring, results show that the high chloride and ammonium concentrations are due to inherited from the previous brackish conditions and to organic matter mineralization, respectively. Seasonal variations and Cl/Br ratio show that the 1 m deep sub surface drainage system is the main factor conditioning the chemical characteristics and the piezometric depth of the aquifer. Keywords: unconfined aquifer, anion and nitrogen species, sub-surface drainage system Introduction In the last decades, the rapid urbanization of Italian coastlines required the widening of residential and agricultural areas. During the nineteenth century, the mechanical draining of swamps to convert them into farmland exploitable for human activities has been a common practice. Before the reclamation, the whole Po delta area was a water-saturated salt marsh and soil formation was very limited; the pedogenic processes, like gleying and organic matter mineralization, started after drainage (Bini and Zilocchi 2004). In these terrains, the reclamation process keeps the depth of the water table (and the related capillary fringe) of the unconfined aquifer near to the topographic surface. Soluble salts accumulated in the sediments before reclamation are responsible for the high salinity of groundwater, a major problem for all the coastal aquifers (Arslan 2013). The Po River Delta represents a delicate, biodiversity-rich ecosystem where the equilibrium between hydrosphere
Transcript of GEOCHEMICAL ASSESSMENT OF THE UNCONFINED AQUIFER IN A RECENTLY RECLAIMED WETLAND AREA: A CASE STUDY...

GEOCHEMICAL ASSESSMENT OF THE UNCONFINED AQUIFER IN A RECENTLY
RECLAIMED WETLAND AREA: A CASE STUDY FROM THE PO RIVER DELTA
Dario Di Giuseppe 1,*
, Barbara Faccini1, Micòl Mastrocicco
1, Nicolò Colombani
2, Massimo
Coltorti1, Giacomo Ferretti
1
1 Dipartimento di Fisica e Scienze della Terra, Università di Ferrara
2 Dipartimento Scienze della Terra, Università “Sapienza” di Roma
* Corresponding author: E-mail [email protected]
Abstract
This study focuses on the distribution of main anions and nitrogen species in the unconfined aquifer
of a recently reclaimed land. In a 6 ha experimental field, 10 piezometers for water level
measurement and groundwater sampling have been installed. After one year of monitoring, results
show that the high chloride and ammonium concentrations are due to inherited from the previous
brackish conditions and to organic matter mineralization, respectively. Seasonal variations and
Cl/Br ratio show that the 1 m deep sub surface drainage system is the main factor conditioning the
chemical characteristics and the piezometric depth of the aquifer.
Keywords: unconfined aquifer, anion and nitrogen species, sub-surface drainage system
Introduction
In the last decades, the rapid urbanization of Italian coastlines required the widening of residential
and agricultural areas. During the nineteenth century, the mechanical draining of swamps to convert
them into farmland exploitable for human activities has been a common practice. Before the
reclamation, the whole Po delta area was a water-saturated salt marsh and soil formation was very
limited; the pedogenic processes, like gleying and organic matter mineralization, started after
drainage (Bini and Zilocchi 2004). In these terrains, the reclamation process keeps the depth of the
water table (and the related capillary fringe) of the unconfined aquifer near to the topographic
surface. Soluble salts accumulated in the sediments before reclamation are responsible for the high
salinity of groundwater, a major problem for all the coastal aquifers (Arslan 2013). The Po River
Delta represents a delicate, biodiversity-rich ecosystem where the equilibrium between hydrosphere

and soil has been altered by land reclamation and intense agricultural activity. Given the high
human pressure on the unconfined aquifer, a thorough study of this environment is necessary for its
preservation.
The goal of this study is to characterize a portion of the unconfined aquifer lying below the
agricultural reclaimed lands through: (1) the geochemical characterization of groundwater and the
possible influence of the palaeo-environment; (2) the assessment of land reclamation impact; (3) the
identification of the role played by agricultural exploitation and of the environmental risks linked to
human activities.
Materials and methods
Study area
The study site is an agricultural field located near Codigoro town in the eastern province of Ferrara
(Italy). Codigoro is only 13 km from the Adriatic coast and is characterized by a microclimate
influenced by the sea. Rainfalls locally reach the regional pluviometric minimum, with an average
annual value varying between 500 and 700 mm, and the marine thermoregulation maintains the
minima over zero, reducing the number of night frosts. The sedimentary facies of the Po River
Delta (and related soils) reflect climatic changes and human impacts that deeply modified the
configuration of the local hydrological system, which is represented by the migrating branches of
the Po River (Amorosi et al., 2002; Bianchini et al., 2012; Stefani and Vincenzi, 2005). In the Delta
area, changes in the sedimentary facies are paralleled by distinctive variations in the chemical
composition of sediments (Bianchini et al. 2012, 2013; Amorosi et al. 2002). The evolution and the
type of reclaimed Po Delta soils is well explained by Bini and Zilocchi (2004). The area consists of
topographically depressed zones (interdistributary bays now kept dry by the action of mechanical
water pumps) enclosed by topographic highs (paleochannels and paleodunes). In 1860, the
surroundings of the actual Codigoro city were almost entirely occupied by lagoons gradually dried
up in the subsequent decades (Bondesan, 1990); today the entire Codigoro Municipality is on land.
A capillary surface water system, consisting of a network of mainly West-East–oriented channels
and drainage ditches, is continuously drained by pumping stations that maintain this lowland dry
and discharge the waters towards the sea (Mastrocicco et al., 2012a).
The study area is located between the ancient Po Gaurus to the left and a minor distributary channel
to the right (Fig. 1). With a height of about – 3 m a.s.l., it resides in an intensively cultivated
agricultural area whose predominant crops are maize and cereals.

Figure 1 - The study area. Location of piezometers and soil profile
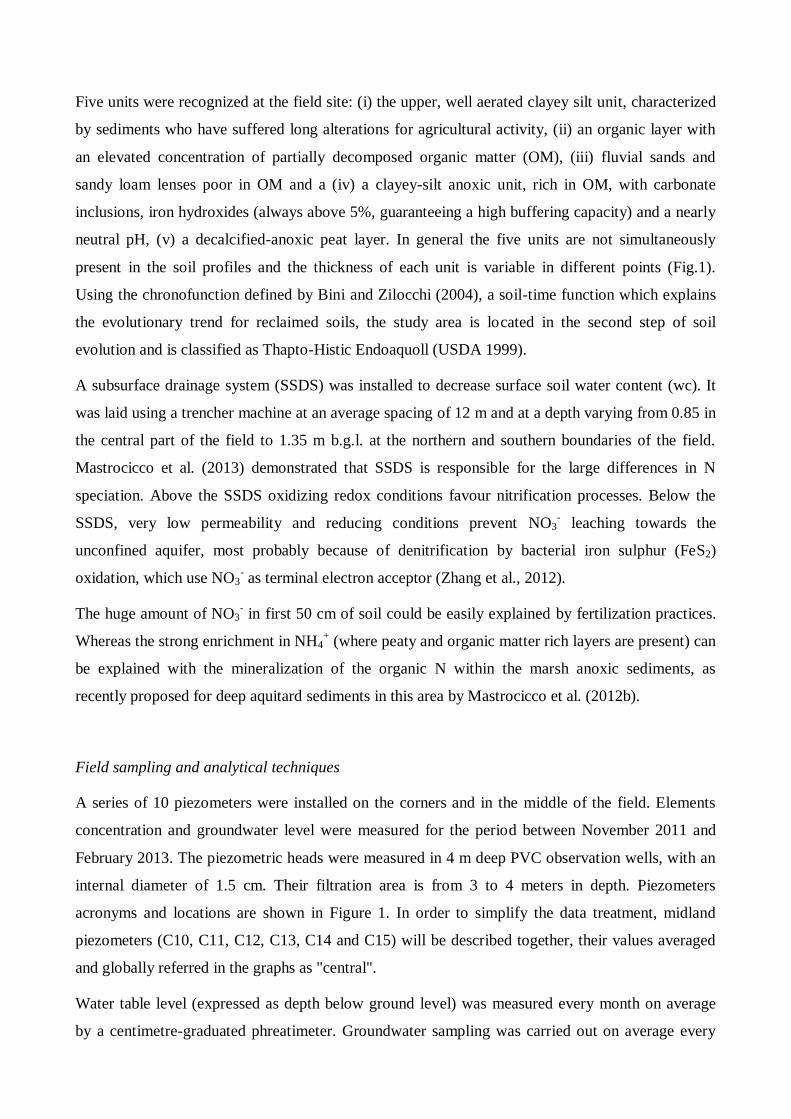
Five units were recognized at the field site: (i) the upper, well aerated clayey silt unit, characterized
by sediments who have suffered long alterations for agricultural activity, (ii) an organic layer with
an elevated concentration of partially decomposed organic matter (OM), (iii) fluvial sands and
sandy loam lenses poor in OM and a (iv) a clayey-silt anoxic unit, rich in OM, with carbonate
inclusions, iron hydroxides (always above 5%, guaranteeing a high buffering capacity) and a nearly
neutral pH, (v) a decalcified-anoxic peat layer. In general the five units are not simultaneously
present in the soil profiles and the thickness of each unit is variable in different points (Fig.1).
Using the chronofunction defined by Bini and Zilocchi (2004), a soil-time function which explains
the evolutionary trend for reclaimed soils, the study area is located in the second step of soil
evolution and is classified as Thapto-Histic Endoaquoll (USDA 1999).
A subsurface drainage system (SSDS) was installed to decrease surface soil water content (wc). It
was laid using a trencher machine at an average spacing of 12 m and at a depth varying from 0.85 in
the central part of the field to 1.35 m b.g.l. at the northern and southern boundaries of the field.
Mastrocicco et al. (2013) demonstrated that SSDS is responsible for the large differences in N
speciation. Above the SSDS oxidizing redox conditions favour nitrification processes. Below the
SSDS, very low permeability and reducing conditions prevent NO3- leaching towards the
unconfined aquifer, most probably because of denitrification by bacterial iron sulphur (FeS2)
oxidation, which use NO3- as terminal electron acceptor (Zhang et al., 2012).
The huge amount of NO3- in first 50 cm of soil could be easily explained by fertilization practices.
Whereas the strong enrichment in NH4+ (where peaty and organic matter rich layers are present) can
be explained with the mineralization of the organic N within the marsh anoxic sediments, as
recently proposed for deep aquitard sediments in this area by Mastrocicco et al. (2012b).
Field sampling and analytical techniques
A series of 10 piezometers were installed on the corners and in the middle of the field. Elements
concentration and groundwater level were measured for the period between November 2011 and
February 2013. The piezometric heads were measured in 4 m deep PVC observation wells, with an
internal diameter of 1.5 cm. Their filtration area is from 3 to 4 meters in depth. Piezometers
acronyms and locations are shown in Figure 1. In order to simplify the data treatment, midland
piezometers (C10, C11, C12, C13, C14 and C15) will be described together, their values averaged
and globally referred in the graphs as "central".
Water table level (expressed as depth below ground level) was measured every month on average
by a centimetre-graduated phreatimeter. Groundwater sampling was carried out on average every

two months after emptying the piezometer with a peristaltic pump. The samples were extracted with
a small inertial tube and filtered with 0.45 μm polypropylene syringe filters. They have been kept in
a portable refrigerator and taken to laboratories to be immediately analysed for pH, EC, ammonium
and main anions. Water samples were filtered through 0.22 μm Dionex polypropylene filters prior
to anion analysis. Anions (NO3-, Cl
-, Br
-, NO2
-, SO4
-2, PO4
-3) were analysed using an isocratic dual
pump ion chromatography ICS-1000 Dionex. An AS-40 Dionex auto-sampler was employed to run
the analyses; quality Control (QC) samples were run every 10 samples and the standard deviation
for all QC samples was better than 4%. NH4+ was measured with a CADAS 100 UV/Vis
spectrophotometer (Hach-Lange, UK). Meteorological data (air temperature, humidity, barometric
pressure, wind speed and direction, wind chill, heat index, rain, rain rate, solar radiation, solar
energy, UV indexes) have been registered each half an hour by a Davis Vantage Pro2 Plus weather
station equipped with a 24-hour fan-aspirated radiation shield, located about 1 km from the field.
Results
Water table level
The piezometric level were measured monthly between November 2011 and February 2013. It
varied from −300 to −20 cm below the ground level (b.g.l.), with minimum and maximum values
recorded in different season depending on the SSDS action and the heights of the surrounding
canals (Figure 2). In the period between November 2011 and spring 2012, the water table was very
deep, the higher levels being found in middle field and C1 piezometer. In C4 the water table was
constantly lower than the others. Summer was characterized by a prolonged and heavy drought,
with only very few storm events. In July, the levels in the north and south ditches were artificially
raised, to put water into the SSDS: this induced a flow of water to the aquifer. The water table in
fact increased sharply as long as the sub-irrigation system was operating (Fig. 2). In this period the
groundwater is very high and homogenous and all the wells have a similar piezometric level, except
C4 which shows a delay in matching the general trend of the aquifer. In August, the ditch levels
were lowered and the sub-irrigation system stopped to work. Precipitation were totally absent, solar
radiation particularly intense, and the water table lowered to about 130-140 cm b.g.l.. Rainfalls
were abundant during autumn; in September and October the water table was higher than in August.
Its surface became convex (bulging upward), with the higher values in the central transect, and
decreasing towards the lateral piezometers where it was at the same level of the ditches (between
110 - 120 cm b.g.l.).

Figure 2 - Piezometric level and cumulative rain for the period between November 2011 and March 2013
Winter was characterized by a large number of rainy days, especially between January and March
2013 but the water level raised up only in the central part of the field. The piezometer in C4 showed
a discordant trend with respect to the others. The low permeability of these soils does not allow a
fast recharge of the shallow water table. However, the central piezometers are directly influenced by
rainfall events; in fact the water level has grown regularly with increasing cumulative rain only in
middle part of the field (Fig. 2).
On the contrary, the water table fluctuations recorded in the corners are not in agreement with the
cumulated rainfall: the level is buffered by the heights of the ditches that vary between -110 cm
(just below the drains) and -140cm of depth. The anomalous behaviour of the groundwater level in
C4 is probably due to the characteristics of the soil near this piezometer. During the drilling of C4
(in 2011), a thick layer of white sediments from 50 to 140 cm b.g.l. was found; mineralogical
analysis of these sediments (Malferrari et al. 2013) indicates a much higher content in CaCO3 with
respect to the rest of the field. The proximity of an old large sugar factory (now dismissed), may

lead to think that this layer is a local accumulation of waste from the sugar production. These scraps
may be rich in lime, as it is widely used within the sugar processing cycles, for example in
bleaching treatment. This particular sediment could locally alter the water circulation, causing an
insulation of C4 from the rest of the field. For this reason, it shows a delay in the response to the
fluctuations of the lateral ducts with respect to the other corner piezometers.
pH and Electrical Conductivity
Groundwater pH is stable to neutral values for most of the period of sampling. In July 2012 (when
SSDS was in use), there was a slight tendency toward alkalinity in all piezometers, returning to
neutral values in October 2012. The highest electrical conductivity values (EC) were recorded in
C4, on average 17,000 μS/cm from autumn 2011 to September 2012, and a peak at 25,000 μS/cm in
October 2012. In C1, where the sandy layer is present, less saline water was always measured (EC
is often <5000 μS/cm). The groundwater where peat layers are present (C5) shows an EC equal to
those of C1 in July 2012, and then increased in the period September-October 2012 to about 15,000
μS/cm. EC in C3 has an average value of about 10,000 μS/cm for the spring and summer 2012,
intermediate between C4 and C1. The data for the piezometers located in the middle of the field
have a clear upward trend of the EC, from about 10,000 μS/cm in July 2012 up to nearly 20,000
μS/cm in October 2012, intermediate between C4 and C5 values. The last sampling of these
piezometers, carried out after a long rainy period (in February 2013), shows a slight decrease in EC.
A slight decrease of EC was recorded in all groundwater sampled in July 2012, probably as a
consequence of SSDS action (Figure 3), since the flow of fresh water from the canals through the
drains strongly diluted the salt content of groundwater. When sub-irrigation finished, the waters
gradually regained their natural salt content, showing a gradual increase of EC.
Nitrogen species
The prevailing inorganic nitrogen species in groundwater is ammonium. In the sandy layer, NH4+
values are below 5 mg/l during the whole period of monitoring. In the rest of the field the
concentrations is influenced by the sub-irrigation system. In fact, in November 2011 NH4+
concentrations were very high, then decreased in July 2012 and rose again when the ditch level was
lowered at the end of August and the aquifer was not recharged for the lack of rain (Fig. 3). From
October to February 2013 a sharp increase of NH4+ in groundwater has been registered in C5 and all
mid-field monitoring wells, reaching values above 100 mg/l, whereas C3 returned to values similar
to those measured in November 2011 (Fig. 3). On the other hand, NO3- concentration is always very

low: significant concentrations (up to 27 mg/l) were observed only in C1, where nitrate appears to
be the predominant nitrogen species. NO2 is also always very low (on average below 1 mg/l) and
often below detection limit.
Anion species
The anion with the highest concentration in the groundwater, and most probably the main
responsible for EC variations, is chloride. Samples of wells close to the channels (C1, C3 and C5),
have lower chloride values whereas this anion is higher in the mid-field and C4 piezometers. C1
shows relatively low values (max 267 mg/l) during the whole period of monitoring; on the contrary
in all other piezometers chloride concentrations vary between 400 and 6000 mg/l (Fig. 3f). The
variations due to the SSDS action displayed by the other ions do not occur for chloride, which does
not show significant changes from November 2011 until August 2012. Large fluctuations are
instead recorded in September 2012, with a sharp increase and a sudden decrease between October
2012 and February 2013. It has to be noted that the increase in chloride appeared immediately after
the SSDS has stopped working, while the later decrease took place during the rainy months of
September and October (Fig. 2). Bromides follow the trend of chloride, although present in much
lower concentrations. Fluoride concentrations in groundwater are generally lower than 0.6 mg/l,
that is below the legal limit. Only in one isolated case (C1, October 2012) it reached 1.7 mg/l.
The amount of SO4-2
in the aquifer is highly variable and irregular. Groundwater in C4 is always
devoid of SO4-2
. C5 samples are poorer in SO4-2
with respect to those from the other piezometers of
the field; they showed a decrease between July and September (from >1000 mg/l to <500 mg/l),
followed by an increase in October, and then they remained constant at about 500 mg/l (Fig. 3e). C1
is always very rich in SO4-2
(always >1500 mg/l). It decreases constantly from April to September
2012 and then it increases sharply in October 2012. Mid-field piezometers show large fluctuations
in the concentration of SO4-2
during the whole sampling period with a marked increase in July 2012
(from <2000 mg/l to >3000 mg/l), an equally remarkable decrease in September 2012 (from >3000
mg/l to below 500 mg/l) and a new slight increase in October 2012, when it approached the values
of C5 until February 2013.
Phosphate concentrations in groundwater are always very low in the whole field, due to the poor
solubility of the phosphorus compounds: its maximum values can reach 2 mg/l, while the average
concentrations remain below 1 mg/l.

Figure 3 - Scatterplot of EC, pH, anions and ammonium in the groundwater from November 2011 to March 2013
Cl/Br ratio
Chlorine/Bromide ratio is useful to identify the source of the waters, because they are conservative
elements and represent a signature of water provenance (Davis et al., 1998; Alcalà and Custodio,
2008). Using a mixing line between the seawater and rain water (this last collected directly in the
field with a rain gauge), we can quantify how the salinity of the groundwater is influenced by
brackish water that characterized the study area before reclamation (Fig. 4). Groundwater samples
are plotted in the curve together with the ditch water. It has to be noted that the composition of
groundwater is very far from that of rainwater. C1, laying on sandy sediments, shows Cl/Br ratio
similar to the nearby ditch, whereas C5 and C3, laying on impermeable sediments, have Cl/Br ratio

departing progressively from that of the fresh water (ditch and Acque Basse channel). The mid-field
and C4 piezometers have the highest values probably because they the first are located far away
from the ditches and the second is isolated by the fine-grained lime sediment, and are thus
characterized by stagnant water conditions.
Figure 4 - Cl/Br plot for groundwater and ditch water from November 2011 to March 2013. The black line represents
the mixing between sea water and rain.
Discussion
The reclamation of land submerged by brackish water resulted in the formation of soils saturated
with groundwater for long periods. In this situation gleying soil process develops. In fact, the soil
profile shows a greenish-blue-grey colour, typical of gleysols. This is due to anaerobic organisms
that reduce ferric oxide (Bini and Zilocchi 2004). Po River Delta reclaimed soils lay below sea
level: their hydrology is totally regulated by anthropic interventions; the whole area is mechanically
kept dry with drain pumps and the water table undergoes seasonal variations linked to agricultural
cycles and land use. After a year of monitoring nine piezometers, the results emphasize that soil
texture variability strongly affects the distribution and behaviour of the chemical species. The
predominant nitrogen species in the groundwater in clayey-silt and peat sediments is ammonium,
whereas nitrate prevails in sandy layers where water circulation favours oxygenation and
nitrification.

The rising and lowering of the water level in the ditches and channels surrounding the experimental
field causes strong fluctuations of the water table. EC, pH and concentration of chloride and
bromide in groundwater is strongly influenced by the natural salinity of the soil and by the inputs of
fresh water through the SSDS from the lateral ditches, during the irrigation period in summer. Cl/Br
ratio can identify the sources of the different water inputs, distinguishing zones of active infiltration
(sandy lenses) and zones where the solute concentration gradients are diffusion driven (clayey silt
and peat lenses). NH4+ content is mainly related to the contribution of water/sediment interaction,
such as mineralization of sedimentary organic matter, rich in organic N (Lorite-Herrera et al. 2009),
and the release of NH4+ from sediments, governed by cation exchange capacity under post sulphidic
conditions (Lewandowski and Nützmann 2010), especially in association with saline groundwater
(Kroeger et al. 2007).
The chemical analyses of the groundwater show that the quality of the confined aquifer is not
optimal. Given that the water table is only a few centimetres from the ground level, the high salinity
(due to high concentrations of chlorine) may be a concern for crops. It should be noted in fact, that
these saline groundwater might affect the crop yield via salinity root stress especially for maize
crops, which are quite sensitive to it (Katerji et al. 2000). The inflow of fresh water through the
SDSS tend to lower groundwater salinity, even if this effect is mild (Fig. 3). Similarly, groundwater
dilution by rain infiltration is minimal: after a long season of rain the EC decreases only slightly;
however, on a long-term basis, this could be the only process that diminish the salt load in the upper
soil layer.
Conclusions
Swamp reclamation supplied inhabitable land and cultivable soils; however, they are a delicate
system whose management is difficult both from environmental, economic (high needs of power for
water pumps), and agricultural (highly saline soils subject to a quick depletion of nutrients) points
of view. An accurate and continuous monitoring of the reclaimed areas is recommended for a
correct conservation of the territory.
Acknowledgements
The authors thanks Francesco Droghetti for technical support during sampling campaigns. This
work has been supported by EC LIFE+ funding to ZeoLIFE project (LIFE+10 ENV/IT/000321).

References
ALCALÀ F.J., CUSTODIO E. (2008) Using the Cl/Br ratio as a tracer to identify the origin of salinity in aquifers in
Spain and Portugal. Journal of Hydrology 359:189–207.
AMOROSI A., CENTINEO M.C., DINELLI E., LUCCHINI F., TATEO F. (2002) Geochemical and mineralogical
variations as indicators of provenance changes in Late Quaternary deposits of SE Po Plain. Sediment Geol. 151:273–
292.
ARSLAN H. (2013) Application of multivariate statistical techniques in the assessment of groundwater quality in
seawater intrusion area in Bafra Plain, Turkey. Environ Monit Assess. 185:2439–2452.
BIANCHINI G., NATALI C., DI GIUSEPPE D., BECCALUVA L. (2012) Heavy metals in soils and sedimentary
deposits of the Padanian Plain (Ferrara, Northern Italy): characterisation and biomonitoring. J. Soils Sediments
12:1145-1153.
BIANCHINI G., DI GIUSEPPE D., NATALI C., BECCALUVA L. (2013) Ophiolite inheritance in the Po Plain
sediments: insights on heavy metals distribution and risk assesment. Ofioliti (in press).
BINI C., ZILOCCHI L. (2004). Soil evolution in recently reclaimed wetland areas of Northeast Italy. Agrochimica.
48:213-221.
BONDESAN M. (1990) L’area deltizia padana: caratteri geomorfologici, in: Il parco del Delta del Po. Studi e
immagini. L’ambiente come risorsa, Spazio Libri Eds, Ferrara pp. 16.
DAVIES S., WHITTEMORE D., FABRYKA-MARTIN J. (1998) Uses of chloride/bromide ratios in studies of potable
water. Ground Water 36:338–350.
KATERJI N., VAN HOORN J.W., HAMDY A., MASTRORILLI M. (2000) Salt tolerance classification of crops
according to soil salinity and to water stress day index. Agric. Water Manag. 43:99-109.
KROEGER K.D., SWARZENSKI P.W., GREENWOOD W.J., REICH C. (2007) Submarine groundwater discharge to
Tampa Bay: Nutrient fluxes and biogeochemistry of the coastal aquifer. Marine Chemistry 104:85–97.
LEWANDOWSKI J., NÜTZMANN G. (2010) Nutrient retention and release in a floodplain’s aquifer and in the
hyporheic zone of a lowland river. Ecological Engineering 36: 1156–1166.
LORITE-HERRERA M., HISCOCK K., JIMÉNEZ-ESPINOSA R. (2009) Distribution of dissolved inorganic and
organic nitrogen in river water and groundwater in an agriculturally-dominated catchment, South-East Spain. Water, Air
and Soil Pollution 198: 335–346.
MALFERRARI D., LAURORA A., BRIGATTI M. F., COLTORTI M., DI GIUSEPPE D., FACCINI B., PASSAGLIA
E., VEZZALINI M. G. (2013) Open-field experimentation of an innovative and integrated zeolitite cycle: project
definition and material characterization. Rendiconti Lincei 24:141-150.
MASTROCICCO M., GIAMBASTIANI B.M.S., SEVERI P., COLOMBANI N. (2012a) The importance of data
acquisition techniques in saltwater intrusion monitoring. Water Resour. Manag. 26: 2851-2866.
MASTROCICCO M., GIAMBASTIANI B.M.S., COLOMBANI N. (2012b) Ammonium occurrence in a salinized
lowland coastal aquifer (Ferrara, Italy). Hydrological Processes doi: 10.1002/hyp.9467.

MASTROCICCO M., COLOMBANI N., DI GIUSEPPE D., FACCINI B., COLTORTI M. (2013) Contribution of the
subsurface drainage system in changing the nitrogen speciation of an agricultural soil located in a complex marsh
environment (Ferrara, Italy). Agricultural Water Management 119:144-153.
STEFANI M., VINCENZI S. (2005) The interplay of eustasy, climate and human activity in the late Quaternary
depositional evolution and sedimentary architecture of the Po Delta system. Mar. Geol. 222–223:19–48.
USDA (1999) A Basic System of Soil Classification for Making and Interpreting Soil Surveys. 2nd edn. US Dep.
Agricult. Nat. Res. Cons. Serv., Washington, DC, Agriculture Handbook 436.
ZHANG, Y.C., SLOMP, C.P., BROERS, H.P., BOSTICK, B., PASSIER, H.F., BÖTTCHER, M.E., OMOREGIE,
E.O., LLOYD, J.R., POLYA, D.A., VAN CAPPELLEN, P. (2012) Isotopic and microbiological signatures of pyrite-
driven denitrification in a sandy aquifer. Chemical Geology 300–301:123–132.