Personnel Administration Division has recently - Corporation ...
Upload
leidenunivCategory
view
1download
0
This is not a published paper, it has not been peer-reviewed and allthe data belongs to the Netherlands Forensic Institute.
Age estimation based onparameters of the aorta in therecently deceased adult human
L.A. Middendorp, BSc.
OBJECTIVE The purpose of this study was to determine the possibility ofestimating age by the aorta.
BACKGROUND Estimating age of an unidentified human cadaver can becrucial in the forensic process. Dental, skeletal or biochemical analysis is notalways sufficient, rapid, cost-effective or accurate. The possibility exists that
the aorta is a better predictor.
METHODS A total of 104 subjects, 71 males and 33 females, aged 19 to 91years of age were examined in the Netherlands Forensic Institute. During the
standard forensic autopsy the aorta was measured for circumference on 7locations, length over 3 segments and atherosclerotic score over 4 segments.
Additional secondary variables were collected from the preliminarypathologists report. Linear multiple regressions and paired T-tests were
performed.
RESULTS High correlations were found. The best fit for males, females andmixed respectively: rM=.961, rF=1.000 and rMF=.959. Standard deviation fromthe original database 4.29737 years in males, .00142 years in females and
4.98841 years in the mixed population.
1This is not a published paper, it has not been peer-reviewed and all
the data belongs to the Netherlands Forensic Institute.

This is not a published paper, it has not been peer-reviewed and allthe data belongs to the Netherlands Forensic Institute.
CONCLUSION The aorta is a predictor of age. A functional method is derivedas well as multiple functions.
2This is not a published paper, it has not been peer-reviewed and all
the data belongs to the Netherlands Forensic Institute.

This is not a published paper, it has not been peer-reviewed and allthe data belongs to the Netherlands Forensic Institute.
In the forensic world the age of a victim can be a crucial but unknown
factor. For some time we know how to estimate the victims age by
examining the skeleton, cartilage, dentals and biochemical analysis.
[1,2] However, accuracy and ease of these methods is not always
guaranteed. Short after death the tissue is still intact and a
different body part gives rise to believe it can be utilized as age
predictor, the aorta. There have been other studies attempting to
ascertain age by the aorta. The greater majority of these studies have
been performed ante mortem.[3-13] During life the aorta is subject to
many external factors. For example the blood that is being pressed into
the aortic arch under high pressures from the left ventricle up to and
including atherosclerosis and aneurysm formation. These pathologies
lead to dilatation of the aorta. Studies have shown that the aorta
diameter is measurable with CT or MRI scans, resulting in functions and
tables describing the characteristics of the aorta per age category.[3-
13] Studies describing the characteristics in children or exceptionally
tall people have also taken place.[3,14,15] Many of these studies only
describe the correlation between the parameters ante mortem. They do,
however, show that the size of the aorta changes during life. It is
therefore conceivable that the size of the aorta can be used for the
purpose of estimating the age of the unidentified victim[14].
Because measurements performed in live patients can differ from
measurements in the deceased, post mortem, the results from the studies
cannot be used with certainty. Due to the drop in blood pressure upon
discontinuation of the heart function the aorta cannot be identified on
CT or MRI whereby no measurements can be made post mortem. Furthermore,
one should take into account the pump phase the heart is in when the3
This is not a published paper, it has not been peer-reviewed and allthe data belongs to the Netherlands Forensic Institute.Hypothesis
The aorta is a predictor
of age in the adult human
and a function can be

This is not a published paper, it has not been peer-reviewed and allthe data belongs to the Netherlands Forensic Institute.
ante mortem measurements are made. During systole the diameter is
larger than during diastole. It is also plausible that the ante mortem
diameter will at all times be larger than the post mortem diameter due
to the baseline blood pressure of approximately 80 mmHg being exerted
on the vessel wall during diastole. Therefore it is necessary to obtain
post mortem data to research if this is a practical method of
estimating age in the deceased. Horny et al created a method using the
pre-strain of the aorta to estimate the age.[16]In addition to
researching the mere possibility of estimating age on the basis of
aorta parameters, a practical method of calculating the age in the
forensic autopsy setting can be developed.
Experimental MethodAfter the pathologist had cut open the aorta the circumference was
measured over the following seven points: one cm proximal to the
brachiocephalic trunk, between the brachiocephalic trunk and the left
carotid artery, start of the descending aorta, fifth intercostal
artery, seventh intercostal artery, diaphragm and halfway between the
renal artery and the aortic bifurcation (Fig. 1). If the intercostal
arteries differed in height, the left marker was held. In addition the
length between one cm proximal to the brachiocephalic trunk to the
descending aorta, descending aorta to renal artery and renal artery to
aortic bifurcation was measured. Lastly an atherosclerosis score is
given to four parts, being the ascending aorta, the aortic arc,
descending aorta to renal artery and renal artery to aortic
bifurcation. A grading system was used to score each section. I being
no atherosclerosis, II being fatty streaks, III coded for fibrous
plaques and IV for complicated lesions. (Fig 2.)[17-21] The scoring was4
This is not a published paper, it has not been peer-reviewed and allthe data belongs to the Netherlands Forensic Institute.
Hypothesis
The aorta is a predictor
of age in the adult human
and a function can be

This is not a published paper, it has not been peer-reviewed and allthe data belongs to the Netherlands Forensic Institute.
done with the naked eye and not with a microscope. If a section had
even one lesion of a higher grade it would be scored as such.
Furthermore, the following details were gathered: sex, length of the
victim, weight of the victim, date of birth, date of death, date of
autopsy, cause of death, ethnicity, drug abuse, alcohol abuse and
resuscitation.
Figure 1. The measuring points. C1- one cm proximal to the brachiocephalic trunk C2 -
between the brachiocephalic trunk and the left Carotid artery. C3 - start of the
descending aorta C4 - 5th intercostal artery C5 - 7th intercostal artery C6 - diaphragm
C7 - halfway between the renal artery and the aortic bifurcation. L1- one cm proximal
to the brachiocephalic trunk to the descending aorta. L2- descending aorta to renal
artery L3- renal artery to aortic bifurcation. A1 - ascending aorta. A2 - the aortic
arc. A3 - descending aorta to renal artery. A4 - renal artery to aortic bifurcation.
5This is not a published paper, it has not been peer-reviewed and all
the data belongs to the Netherlands Forensic Institute.

This is not a published paper, it has not been peer-reviewed and allthe data belongs to the Netherlands Forensic Institute.
SelectionAortas were included based on state of decomposition and integrity.
Cadavers with extensive decomposed aortas could not be measured and
were therefore excluded. If the aorta had been severely damaged or was
of special value to the pathologist in the forensic process no
measurements were made.
No discrimination on basis of ethnicity, cause of death or pre-existing
disease or habits were made. Only victims older than 18 years of age
were included.
Statistical MethodThe statistical research was performed in IBM SPSS Statistics version
20. A multiple regression, an approach to modeling the relationship
between a scalar dependent variable and multiple explanatory
variables, was used creating a regression function . Two
methods were used: the Enter and Stepwise, forward selection. Enter
stipulates which variables are to be entered into the regression, while
stepwise, forward selection, starts with no variables in the model
adding significant variables until there are no more. Only forward
selection was used due to similar results generated by both forward and
backward selection.
Prerequisites for the linear regression were met: All variables were
quantitative or converted to dummy scores, the data was linear and the
relation was theoretically causal. The data was tested for
multicollinearity with Pearson’s correlation and none scored above 0.9.
[22]
6This is not a published paper, it has not been peer-reviewed and all
the data belongs to the Netherlands Forensic Institute.

This is not a published paper, it has not been peer-reviewed and allthe data belongs to the Netherlands Forensic Institute.
Continuous variables were: Circumference of the aorta, length of the
aorta sections, length of victim, weight of victim, Post-mortem
Interval, alcohol abuse, resuscitation. For categorical variables dummy
variables had to be made, which consisted of the following:
Atherosclerosis score, cause of death, ethnicity. For atherosclerosis
the first two symbols, A1 to A4, code for the area measured. The third
symbol, 0 to 3, is the score that position received. A22 is area A2
which received score 2, fibrous plaques. In the A1 score 3 was the
least common while in A2 to A4 score 1 was least common which is why
those were treated as reference.
The calculations were made both for males and females independently and
males and females combined. Both Enter and Stepwise, forward selection,
were used to try as many combinations of variables as possible. For the
male population 29 combinations were tried, for the female population 8
and the combined population only 2. Paired T-Tests were performed to
ascertain correlation and supplementary statistics.
Table 1. Descriptives of the population
Number % MeanMedia
n
Upper
range
Lower
rangeTotal
population104
Male 7168.
3
Female 3331.
7Male age in
years
41.4
639 19 84
7This is not a published paper, it has not been peer-reviewed and all
the data belongs to the Netherlands Forensic Institute.

This is not a published paper, it has not been peer-reviewed and allthe data belongs to the Netherlands Forensic Institute.
Female age in
years
46.1
245 19 91
Male length in
cm
179.
53179.5 160 203
Female length
in cm
168.
27168 151 183
Male Weight in
kg
83.1
082 50 163
Female Weight
in kg75.8 70 50 110
ResultsFor both male as female a function was found to predict the victims
age. Both the Stepwise as the Enter method gave good results. First the
male population will be discussed.
Male populationNear equal results were generated with both the stepwise as the enter
method, but the enter method proved slightly better. The difference is
not significant, but with the enter method the correlation is closer to
1 and the standard deviation of the function compared to the original
database is smaller. (Table 2) The best fit in the male population is
the Enter9m, with a correlation of rM=.961, standard deviation of 4.30
years. The function contains all seven ‘circumference of the aorta’
variables, three ‘length of the aorta’ variables, all atherosclerosis
scores and length of the victim (Function 1). The second best fit, as
can be seen in Table 2, is Enter8m. The function is near identical with
exception of the victim’s length. (Appendix)
8This is not a published paper, it has not been peer-reviewed and all
the data belongs to the Netherlands Forensic Institute.

This is not a published paper, it has not been peer-reviewed and allthe data belongs to the Netherlands Forensic Institute.
9This is not a published paper, it has not been peer-reviewed and all
the data belongs to the Netherlands Forensic Institute.

This is not a published paper, it has not been peer-reviewed and allthe data belongs to the Netherlands Forensic Institute.
Table 2. Comparison of functions with the original data in the male population. Enter8m
consists of all seven ‘circumference of the aorta’ variables, three ‘length of the
aorta’ variables and all atherosclerosis scores. Enter9m contains all seven
‘circumference of the aorta’ variables, three ‘length of the aorta’ variables, all
atherosclerosis scores and length of the victim too. Stepwise6m is made up of C5, C7,
all the atherosclerosis scores and the victim’s length. Stepwise A124m contains C5, C7
and only A1, A2 and A4, of the atherosclerosis scores. Stepwise A234m is the same but
with A2, A3 and A4 of the atherosclerosis scores.
Numbe
r
Correlat
ion
Std.
Deviation(years
)Original vs. Enter8m 51 .954 4.66499Original vs. Enter9m 51 .961 4.29737Original vs.
Stepwise6m70 .942 5.16334
Original vs.
StepwiseA124m70 .944 5.04320
Original vs.
StepwiseA234m70 .944 5.05887
Function 1. The function for the male population, also known as Enter9m. C1 to C7 are
the circumference or the aorta variables, L1 to L3 are the length of the aorta
variables, Length is the body length of the victim and the A variables are the dummy
variables for the four atherosclerosis scores.
10This is not a published paper, it has not been peer-reviewed and all
the data belongs to the Netherlands Forensic Institute.

This is not a published paper, it has not been peer-reviewed and allthe data belongs to the Netherlands Forensic Institute.
Female populationFor the female population the same regressions were performed as for
the male population but the population was much smaller. However there
was a remarkable result. In near all cases, both enter and stepwise,
the correlation was higher, and in one case, known as Enter1f, the
correlation was rF=1.0. Its standard deviation is .00142 years. The
function contains all seven ‘circumference of the aorta’ variables,
three ‘length of the aorta’ variables and all atherosclerosis scores
(Function 2). This function gives a near perfect prediction of the
victim’s age.
11This is not a published paper, it has not been peer-reviewed and all
the data belongs to the Netherlands Forensic Institute.

This is not a published paper, it has not been peer-reviewed and allthe data belongs to the Netherlands Forensic Institute.
Table 3. Comparison of functions with the original data in the female population.
Enter1f contains all seven ‘circumference of the aorta’ variables, three ‘length of the
aorta’ variables and all atherosclerosis scores. Enter2f contains only the
‘circumference of the aorta’ variables and the three ‘length of the aorta’ variables.
Enter3f contains C1, C4, L1 and L3. Stepwise1f is consists of C4 only. Stepwise2f
contains C4 and all atherosclerosis scores. Stepwise3f adds the victim’s race to the
function.
Numbe
r
Correlat
ion
Std.
Deviation(years
)Original vs.
Enter1f22 1.000 .00142
Original vs.
Enter2f22 .971 5.02013
Original vs.
Enter3f22 .968 5.35083
Original vs.
Stepwise1f30 .950 6.01754
Original vs.
Stepwise2f30 .963 5.34438
Original vs.
Stepwise3f32 .948 6.83969
12This is not a published paper, it has not been peer-reviewed and all
the data belongs to the Netherlands Forensic Institute.

This is not a published paper, it has not been peer-reviewed and allthe data belongs to the Netherlands Forensic Institute.
Function 2. The function for the female population, also known as Enter1f. C1 to C7 are
the circumference or the aorta variables, L1 to L3 are the length of the aorta
variables and the A variables are the dummy variables for the four atherosclerosis
scores.
Combined populationAttempts to create a function for both sexes were also successful. This
method was not researched intensively, only one Enter and one Stepwise
were performed. Both functions contain the sex variable. (Function 3.)
Enter gives the best fit with a correlation of rMF=.959 and a standard
deviation of 4.98841 years.
13This is not a published paper, it has not been peer-reviewed and all
the data belongs to the Netherlands Forensic Institute.

This is not a published paper, it has not been peer-reviewed and allthe data belongs to the Netherlands Forensic Institute.
Table 4. Comparison of functions with the original data in the combined population.
Enter1mf consists of all seven ‘circumference of the aorta’ variables, three ‘length of
the aorta’ variables, length of the victim, sex and all atherosclerosis scores.
Stepwise1mf contained C4, C5, L3, length of the victim, sex and all the atherosclerosis
scores.
NumberCorrelati
on
Std. Deviation
(years)Original vs.
Enter1mf73 .959 4.98841
Original vs.
Stepwise1mf97 .949 5.31826
Function 3. The function for the combined population, also known as Enter1mf. C1 to C7
are the circumference or the aorta variables, L1 to L3 are the length of the aorta
variables and the A variables are the dummy variables for the four atherosclerosis
scores. Male is the dummy variable for sex.
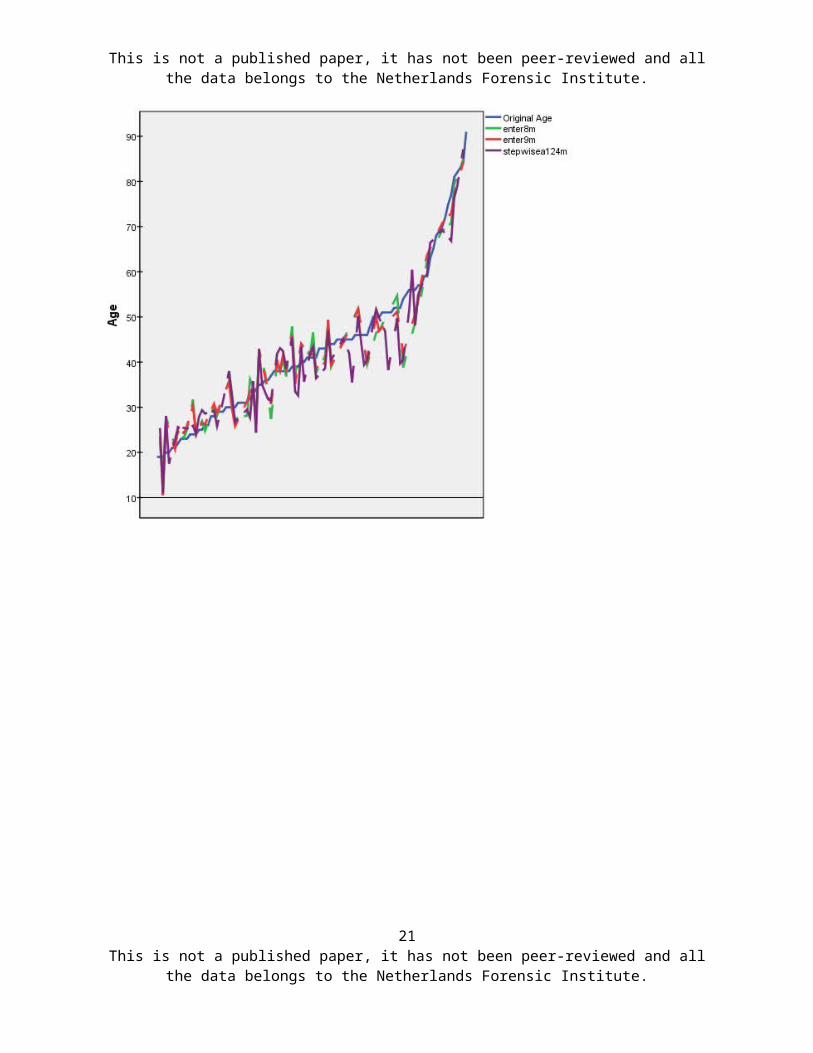
In the appendix an overview of the three best fits for the male, female
and combined populations is presented, as well as a graph portraying
the values predicted by the equations plotted against the original age.
14This is not a published paper, it has not been peer-reviewed and all
the data belongs to the Netherlands Forensic Institute.

This is not a published paper, it has not been peer-reviewed and allthe data belongs to the Netherlands Forensic Institute.
DiscussionThe aim of this study was to research if it is possible to predict the
victim’s age by the parameters of its aorta. For males this can be done
with a deviation of 4.29737 years, a window of 8.6 years, and for women
this window is less than half a year. A practical method has been
developed and created in the Netherlands Forensic Institute which can
be used to determine age in the deceased. The method has not been
verified.
Mixed versus split genderIn this study both the split population, male and female, as the mixed
population have been researched. Both gave rise to good results. Due to
a different morphology in males and females and better results in the
split population it is advised to use the different equations instead
of the combined equation. The combined equation has not been researched
as thoroughly as the split and could therefore give a less accurate
prediction.
VariablesThe circumference of the aorta, length of the aorta, atherosclerosis
score and length of the victim are the only variables that proved
predictive for the victim’s age. It is not very surprising to see that
the circumference and length of the aorta are predictive variables
because these describe the aorta itself. If the aorta would have
prognostic value than the aorta itself should be represented almost
entirely. The atherosclerosis score is also a variable specific to the
aorta and it increases with age. [4,10,23-28]Length of the victim is
linked to length of the aorta which explains its predictive value.
15This is not a published paper, it has not been peer-reviewed and all
the data belongs to the Netherlands Forensic Institute.

This is not a published paper, it has not been peer-reviewed and allthe data belongs to the Netherlands Forensic Institute.
Weight of the victim is not predictive. It can be argued that the
atherosclerosis score is linked to the weight of the victim but this
does not seem to be necessarily the case. The regressions that included
the victim’s weight showed a lower correlation and standard deviation.
BMI was tested briefly but did not prove influential. The Post-mortem
interval was not high enough to have effect on deterioration of the
aorta. Only in 5% of the victims the interval was higher than 4 days.
Alcohol abuse was excluded for two reasons. On the one hand it was very
difficult to test because the more victims were alcoholics than was
reported. Secondly, the regressions that were performed showed worse
outcomes than the regressions in which alcohol abuse was excluded.
Resuscitation was excluded for the same reasons. The cause of death
gave rise to similar problems. The cause of death was taken from the
preliminary report because the final report was not available in all
cases creating a bias. Furthermore, in 25 cases, the cause of death was
unknown. Cause of death therefore was excluded. Ethnicity was the last
variable excluded due to problems determining ethnicity objectively.
The majority, 85%, scored ‘white’, which was too vague a term to use.
Field of LiteratureThere have been many studies examining the aorta, but these are ante
mortem.[3-13] None of the post mortem studies, to the author’s best
knowledge, have utilized the method described in this study. Horny et
al did attempt a post mortem method but with pre-strain. Horny et al.
also confirms the high correlation between age and abdominal aorta
circumference and age and atherosclerosis. [16] However, no other
studies have been performed to verify the findings in this study.
16This is not a published paper, it has not been peer-reviewed and all
the data belongs to the Netherlands Forensic Institute.

This is not a published paper, it has not been peer-reviewed and allthe data belongs to the Netherlands Forensic Institute.
Study Strengths and LimitationsThe greatest strength is that this study was aimed to be practical,
giving a quick answer to the question of how old the victim was. This
is in contrast to other studies which used more precise methods, inter
alia the microscope, to obtain the measurements.[16,29] Those methods
have higher precision but take more time. In this study the age of the
victim can be calculated within minutes after the forensic autopsy.
The greatest limitation was the size of the study population. Over a
year of measuring only 104 aortas were included in the study, of which
71 were of masculine victims and 33 of feminine victims. Not all of the
included aortas could be used due to incomplete measurements. The Enter
method, in contrast to the Stepwise method, requires all of the
individual measurements, for drafting the function. Fewer measurements
can therefore be used, only 51 and 22 masculine and feminine
respectively, instead of all the measurements. Especially in C1, C2 and
L1 are measurements often omitted due to how the aorta was cut during
autopsy.
Future studyA larger study population, better cut aortas, without the often omitted
measurements, should yield a higher accuracy. A more precise function
can pave the way to a less complicated function which can be utilized
with further ease. Different locations and segments can be tested for
better results.
ConclusionIt is possible to estimate the age of a human cadaver not long dead by
the parameters of its aorta within minutes. The primary variables are
17This is not a published paper, it has not been peer-reviewed and all
the data belongs to the Netherlands Forensic Institute.

This is not a published paper, it has not been peer-reviewed and allthe data belongs to the Netherlands Forensic Institute.
the circumference of the aorta at 7 locations, the length of the aorta
over 3 segments and the atherosclerosis score over 4 segments. Length
and sex of the victim are valuable secondary variables which can
increase precision. All of these are easy and quick to measure without
the need for special tools.
AcknowledgementI thank my mentors Bela Kubat, Forensic Pathologist and
Neuropathologist, and Reza Gerretsen, MD, Senior Forensic Scientist,
Forensic Anthropologist, and the Netherlands Forensic Institute for the
opportunity they granted me.
18This is not a published paper, it has not been peer-reviewed and all
the data belongs to the Netherlands Forensic Institute.

This is not a published paper, it has not been peer-reviewed and allthe data belongs to the Netherlands Forensic Institute.
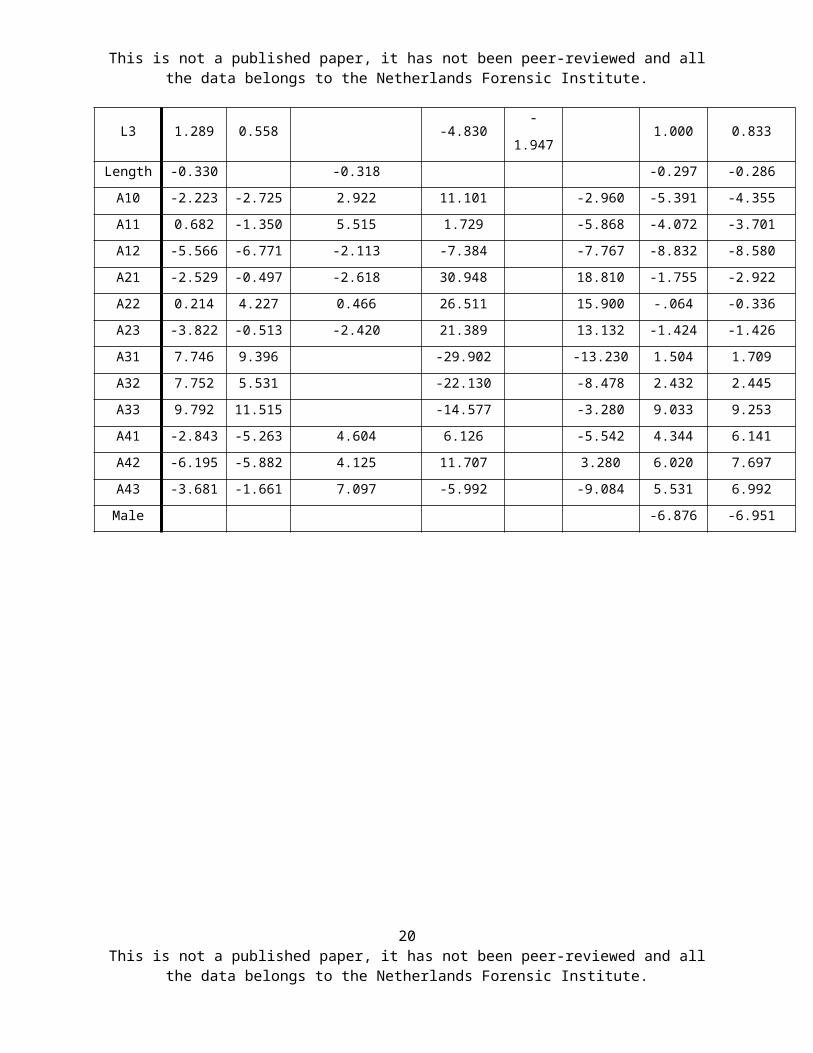
Appendix
Table 1. For all populations the values of the equations that have the best fit. The
regression function, , is applicable, Y being age, A being the constant, B
the variables and x the measured values.
C1 to C7 are the ‘circumference of the aorta’ variables, L1 to L3 are the ‘length of
the aorta’ variables, and Length is the victim’s length. The A variables are the dummy
scores for atherosclerosis. Male is the dummy variable for sex.
Variab
lesMale Female Combined
Enter9
m
Enter8
mStepwiseA124m Enter1f
Enter
2f
Stepwis
e2f
Enter1
mf
Stepwise1
mf
Consta
nt-1.989
-
47.56711.049 -67.856
-
63.71
2
-72.920 9.524 10.057
C1 0.033 -0.853 3.312 2.599 0.816
C2 -0.654 -0.664 3.599-
0.564-1.143
C3 -1.773 -1.617 36.487 6.433 0.790
C4 2.996 3.771 -4.32916.10
024.720 5.990 8.012
C5 11.084 11.126 11.669 -1.096-
0.4417.351 7.355
C6 0.071 -0.598 -1.617 0.370 0.071
C7 4.155 3.425 5.264 3.312-
1.5051.385
L1 0.039 0.383 -2.011 0.252 0.563L2 0.689 0.485 -1.226 0.496 0.035
19This is not a published paper, it has not been peer-reviewed and all
the data belongs to the Netherlands Forensic Institute.
This is not a published paper, it has not been peer-reviewed and allthe data belongs to the Netherlands Forensic Institute.
L3 1.289 0.558 -4.830-
1.9471.000 0.833
Length -0.330 -0.318 -0.297 -0.286A10 -2.223 -2.725 2.922 11.101 -2.960 -5.391 -4.355A11 0.682 -1.350 5.515 1.729 -5.868 -4.072 -3.701A12 -5.566 -6.771 -2.113 -7.384 -7.767 -8.832 -8.580A21 -2.529 -0.497 -2.618 30.948 18.810 -1.755 -2.922A22 0.214 4.227 0.466 26.511 15.900 -.064 -0.336A23 -3.822 -0.513 -2.420 21.389 13.132 -1.424 -1.426A31 7.746 9.396 -29.902 -13.230 1.504 1.709A32 7.752 5.531 -22.130 -8.478 2.432 2.445A33 9.792 11.515 -14.577 -3.280 9.033 9.253A41 -2.843 -5.263 4.604 6.126 -5.542 4.344 6.141A42 -6.195 -5.882 4.125 11.707 3.280 6.020 7.697A43 -3.681 -1.661 7.097 -5.992 -9.084 5.531 6.992Male -6.876 -6.951
20This is not a published paper, it has not been peer-reviewed and all
the data belongs to the Netherlands Forensic Institute.
This is not a published paper, it has not been peer-reviewed and allthe data belongs to the Netherlands Forensic Institute.
21This is not a published paper, it has not been peer-reviewed and all
the data belongs to the Netherlands Forensic Institute.

This is not a published paper, it has not been peer-reviewed and allthe data belongs to the Netherlands Forensic Institute.
22This is not a published paper, it has not been peer-reviewed and all
the data belongs to the Netherlands Forensic Institute.

This is not a published paper, it has not been peer-reviewed and allthe data belongs to the Netherlands Forensic Institute.
Graph 1. The three best fits for male, female and combined. The lines are the values
predicted by the equations. The X-axis indicates case number. The lines for the methods
are intermittent due to missing values. The lines show the margin the method has.
Enter1f is near identical to the Original age while the stepwise methods are more
erratic.
23This is not a published paper, it has not been peer-reviewed and all
the data belongs to the Netherlands Forensic Institute.

This is not a published paper, it has not been peer-reviewed and allthe data belongs to the Netherlands Forensic Institute.
24This is not a published paper, it has not been peer-reviewed and all
the data belongs to the Netherlands Forensic Institute.

This is not a published paper, it has not been peer-reviewed and allthe data belongs to the Netherlands Forensic Institute.
Reference List
[1] S. Ritz-Timme, C. Cattaneo, M.J. Collins, E.R. Waite, H.W.Schutz, H.J. Kaatsch, H.I. Borrman, Age estimation: the state ofthe art in relation to the specific demands of forensic practise,Int. J. Legal Med., 113 (2000) 129-136.
[2] J.P. Graham, C.J. O'Donnell, P.J. Craig, G.L. Walker, A.J. Hill,G.N. Cirillo, R.M. Clark, S.R. Gledhill, M.E. Schneider-Kolsky,The application of computerized tomography (CT) to the dentalageing of children and adolescents, Forensic Sci. Int., 195(2010) 58-62.
[3] A.R. Snider, M.A. Enderlein, D.F. Teitel, R.P. Juster, Two-dimensional echocardiographic determination of aortic andpulmonary artery sizes from infancy to adulthood in normalsubjects, Am. J. Cardiol., 53 (1984) 218-224.
[4] S. Takeda, H. Watanabe, T. Matsuzawa, Age-related change incalcifications in the thoracic aorta: a study with computedtomography, Tohoku J. Exp. Med., 149 (1986) 73-78.
[5] D. Horejs, P.M. Gilbert, S. Burstein, R.L. Vogelzang, Normalaortoiliac diameters by CT, J. Comput. Assist. Tomogr., 12 (1988)602-603.
[6] B. Sonesson, F. Hansen, H. Stale, T. Lanne, Compliance anddiameter in the human abdominal aorta--the influence of age andsex, Eur. J. Vasc. Surg., 7 (1993) 690-697.
[7] R.S. Vasan, M.G. Larson, D. Levy, Determinants ofechocardiographic aortic root size. The Framingham Heart Study,Circulation, 91 (1995) 734-740.
[8] G.M. Grimshaw, J.M. Thompson, Changes in diameter of theabdominal aorta with age: an epidemiological study, J. Clin.Ultrasound, 25 (1997) 7-13.
[9] A. Hager, H. Kaemmerer, U. Rapp-Bernhardt, S. Blucher, K. Rapp,T.M. Bernhardt, M. Galanski, J. Hess, Diameters of the thoracic
25This is not a published paper, it has not been peer-reviewed and all
the data belongs to the Netherlands Forensic Institute.

This is not a published paper, it has not been peer-reviewed and allthe data belongs to the Netherlands Forensic Institute.
aorta throughout life as measured with helical computedtomography, J. Thorac. Cardiovasc. Surg., 123 (2002) 1060-1066.
[10] F.A. Jaffer, C.J. O'Donnell, M.G. Larson, S.K. Chan, K.V.Kissinger, M.J. Kupka, C. Salton, R.M. Botnar, D. Levy, W.J.Manning, Age and sex distribution of subclinical aorticatherosclerosis: a magnetic resonance imaging examination of theFramingham Heart Study, Arterioscler. Thromb. Vasc. Biol., 22(2002) 849-854.
[11] M.F. O'Rourke, W.W. Nichols, Aortic diameter, aortic stiffness,and wave reflection increase with age and isolated systolichypertension, Hypertension, 45 (2005) 652-658.
[12] S.S. Hickson, M. Butlin, M. Graves, V. Taviani, A.P. Avolio, C.M.McEniery, I.B. Wilkinson, The relationship of age with regionalaortic stiffness and diameter, JACC. Cardiovasc. Imaging, 3(2010) 1247-1255.
[13] A. Redheuil, W.C. Yu, E. Mousseaux, A.A. Harouni, N. Kachenoura,C.O. Wu, D. Bluemke, J.A. Lima, Age-related changes in aorticarch geometry: relationship with proximal aortic function andleft ventricular mass and remodeling, J. Am. Coll. Cardiol., 58(2011) 1262-1270.
[14] V.K. Goyal, Changes with age in the aorta of man and mouse, Exp.Gerontol., 17 (1982) 127-132.
[15] C.M. Reed, P.A. Richey, D.A. Pulliam, G.W. Somes, B.S. Alpert,Aortic dimensions in tall men and women, Am. J. Cardiol., 71(1993) 608-610.
[16] L. Horny, T. Adamek, J. Vesely, H. Chlup, R. Zitny, S.Konvickova, Age-related distribution of longitudinal pre-strainin abdominal aorta with emphasis on forensic application,Forensic Sci. Int., 214 (2012) 18-22.
[17] World Health Organisation, CLASSIFICATION of atheroscleroticlesions; report of a study group, World Health Organ Tech. Rep.Ser., 57 (1958) 1-20.
26This is not a published paper, it has not been peer-reviewed and all
the data belongs to the Netherlands Forensic Institute.
This is not a published paper, it has not been peer-reviewed and allthe data belongs to the Netherlands Forensic Institute.
[18] H.C. Stary, D.H. Blankenhorn, A.B. Chandler, S. Glagov, W.Insull, Jr., M. Richardson, M.E. Rosenfeld, S.A. Schaffer, C.J.Schwartz, W.D. Wagner, ., A definition of the intima of humanarteries and of its atherosclerosis-prone regions. A report fromthe Committee on Vascular Lesions of the Council onArteriosclerosis, American Heart Association, Arterioscler.Thromb., 12 (1992) 120-134.
[19] H.C. Stary, A.B. Chandler, S. Glagov, J.R. Guyton, W. Insull,Jr., M.E. Rosenfeld, S.A. Schaffer, C.J. Schwartz, W.D. Wagner,R.W. Wissler, A definition of initial, fatty streak, andintermediate lesions of atherosclerosis. A report from theCommittee on Vascular Lesions of the Council on Arteriosclerosis,American Heart Association, Circulation, 89 (1994) 2462-2478.
[20] H.C. Stary, A.B. Chandler, R.E. Dinsmore, V. Fuster, S. Glagov,W. Insull, Jr., M.E. Rosenfeld, C.J. Schwartz, W.D. Wagner, R.W.Wissler, A definition of advanced types of atheroscleroticlesions and a histological classification of atherosclerosis. Areport from the Committee on Vascular Lesions of the Council onArteriosclerosis, American Heart Association, Arterioscler.Thromb. Vasc. Biol., 15 (1995) 1512-1531.
[21] R. Virmani, F.D. Kolodgie, A.P. Burke, A. Farb, S.M. Schwartz,Lessons from sudden coronary death: a comprehensive morphologicalclassification scheme for atherosclerotic lesions, Arterioscler.Thromb. Vasc. Biol., 20 (2000) 1262-1275.
[22] A.De Vocht, Basishandboek SPSS 17 , Bijleveld Press, 2009.
[23] L.J. Shaw, P. Raggi, D.S. Berman, T.Q. Callister, Coronary arterycalcium as a measure of biologic age, Atherosclerosis, 188 (2006)112-119.
[24] H.C. McGill, Jr., C.A. McMahan, E.E. Herderick, G.T. Malcom, R.E.Tracy, J.P. Strong, Origin of atherosclerosis in childhood andadolescence, Am. J. Clin. Nutr., 72 (2000) 1307S-1315S.
[25] G.S. Berenson, S.R. Srinivasan, W. Bao, W.P. Newman, III, R.E.Tracy, W.A. Wattigney, Association between multiplecardiovascular risk factors and atherosclerosis in children and
27This is not a published paper, it has not been peer-reviewed and all
the data belongs to the Netherlands Forensic Institute.

This is not a published paper, it has not been peer-reviewed and allthe data belongs to the Netherlands Forensic Institute.
young adults. The Bogalusa Heart Study, N. Engl. J. Med., 338(1998) 1650-1656.
[26] G.S. Berenson, W.A. Wattigney, R.E. Tracy, W.P. Newman, III, S.R.Srinivasan, L.S. Webber, E.R. Dalferes, Jr., J.P. Strong,Atherosclerosis of the aorta and coronary arteries andcardiovascular risk factors in persons aged 6 to 30 years andstudied at necropsy (The Bogalusa Heart Study), Am. J. Cardiol.,70 (1992) 851-858.
[27] J.P. Strong, H.C. McGill, Jr., C. TEJADA, R.L. HOLMAN, Thenatural history of atherosclerosis; comparison of the earlyaortic lesions in New Orleans, Guatemala, and Costa Rica, Am. J.Pathol., 34 (1958) 731-744.
[28] J.P. Strong, H.C. McGill, Jr., The natural history of coronaryatherosclerosis, Am. J. Pathol., 40 (1962) 37-49.
[29] J.S. Seo, S.Y. Lee, H.D. Kim, Quantitative analysis of aorticatherosclerosis in Korean female: a necropsy study, J. KoreanMed. Sci., 22 (2007) 536-545.
28This is not a published paper, it has not been peer-reviewed and all
the data belongs to the Netherlands Forensic Institute.
Copyright © 2022 FDOKUMEN