Reclaimed wastewater for agriculture irrigation in Qatar
15
Review Reclaimed wastewater for agriculture irrigation in Qatar Mohamed Darwish, Hassan Abdulrahim, Abdel Nasser Mabrouk, Ashraf Hassan, Basem Shomar Qatar Environment and Energy Research Institute (QEERI), Qatar Foundation, Doha, Qatar. Accepted 31 December, 2014 Highlights - The real challenge of using treated wastewater in Qatar for crop production is social. - The highly treated domestic wastewater could be a real water resource for irrigation. - Technical and economic calculations show minimum risks associated with reuse. - The findings are extremely important to similar arid countries where water is absent. - Reuse may achieve food security, combat desertification and improve life conditions. Abstract Qatar, one of the world’s poorest countries in terms of fresh water resources, has the highest water consumption per capita in the world (>500 L/day/person). The country is completely dependent on seawater desalination to meet local demands. Limited and overexploited groundwater resources (GW) are used for crop irrigation; however, due to increasing population, Qatar imports over 95% of all food. Qatar’s high volume of wastewater is currently treated using advanced technologies, often to the tertiary level. The quality of the treated wastewater (TWW) achieved allows for the water to meet standards for irrigation use; however, social factors currently inhibit this practice. This paper uses scientific, economic and technical evidence to show that TWW is a valuable and safe resource for crop irrigation that poses minimal risk to the soil, GW, and crops and is a key factor towards Qatar’s food security. Content targets the scientific community, public and policy makers. Keywords: Treated wastewater reuse;water scarcity; desalination; food security; Qatar INTRODUCTION Qatar is one of the world’s poorest countries in terms of natural freshwater resources[1]. There are no rivers, very limited rainwater, and limited replenishment of groundwater (GW), about 58 Million cubic meters per year (Mm 3 yr -1 ). The GW is overexploited with a reported abstraction increase from 56.2 Mm 3 yr -1 in 1976 to 300 Mm 3 yr -1 in 2014. Qatar's total water withdrawal in 2013 was 800 Mm 3 yr -1 . Freshwater withdrawal includes 414.382 Mm 3 yr -1 (53.6% of the total withdrawal) comes from desalted seawater (DW) and 257.2 Mm 3 yr -1 (32.4% of total withdrawal) from GW abstraction[2]. Water withdrawal originating from treating wastewater (WW), sometimes called treated sewage (TSE) was 108 Mm 3 yr - 1 (14% from total withdrawal) (Figure 1). Qatar utilizes its wealth of natural gas (NG) and oil production in urbanization and securing improved urban drinking water supply and sanitation services, which have reached 100% of Qatar’s population since 2006. Figures 2a, 2b and 2c show the history of GW withdrawal. It shows GW pumping increased from 51.2 Mm 3 yr -1 in 1976 (little less than replenishment rate) to 248.7 Mm 3 yr -1 in 2009. Figure 2a shows a decrease in *Corresponding Author’s Email: [email protected] , Tel.: + 974 66502650, Fax: + 974 4454 1528 Global Journal of Agricultural Research and Reviews Vol. 3(1), pp. 106-120, January, 2015. © Global Science Research Journals http://www.globalscienceresearchjournals.org/
Transcript of Reclaimed wastewater for agriculture irrigation in Qatar

Review
Reclaimed wastewater for agriculture irrigation in Qatar
Mohamed Darwish, Hassan Abdulrahim, Abdel Nasser Mabrouk, Ashraf Hassan, Basem Shomar
Qatar Environment and Energy Research Institute (QEERI), Qatar Foundation, Doha, Qatar.
Accepted 31 December, 2014
Highlights
- The real challenge of using treated wastewater in Qatar for crop production is social. - The highly treated domestic wastewater could be a real water resource for irrigation.
- Technical and economic calculations show minimum risks associated with reuse. - The findings are extremely important to similar arid countries where water is absent. - Reuse may achieve food security, combat desertification and improve life conditions.
Abstract Qatar, one of the world’s poorest countries in terms of fresh water resources, has the highest water consumption per capita in the world (>500 L/day/person). The country is completely dependent on seawater desalination to meet local demands. Limited and overexploited groundwater resources (GW) are used for crop irrigation; however, due to increasing population, Qatar imports over 95% of all food. Qatar’s high volume of wastewater is currently treated using advanced technologies, often to the tertiary level. The quality of the treated wastewater (TWW) achieved allows for the water to meet standards for irrigation use; however, social factors currently inhibit this practice. This paper uses scientific, economic and technical evidence to show that TWW is a valuable and safe resource for crop irrigation that poses minimal risk to the soil, GW, and crops and is a key factor towards Qatar’s food security. Content targets the scientific community, public and policy makers.
Keywords: Treated wastewater reuse;water scarcity; desalination; food security; Qatar
INTRODUCTION Qatar is one of the world’s poorest countries in terms of natural freshwater resources[1]. There are no rivers, very limited rainwater, and limited replenishment of groundwater (GW), about 58 Million cubic meters per year (Mm
3yr
-1). The GW is overexploited with a reported
abstraction increase from 56.2 Mm3 yr
-1in 1976 to 300
Mm3 yr
-1 in 2014. Qatar's total water withdrawal in 2013
was 800 Mm3 yr
-1. Freshwater withdrawal includes
414.382 Mm3 yr
-1 (53.6% of the total withdrawal) comes
from desalted seawater (DW) and 257.2 Mm3 yr
-1 (32.4%
of total withdrawal) from GW abstraction[2]. Water withdrawal originating from treating wastewater (WW), sometimes called treated sewage (TSE) was 108 Mm
3 yr
-
1 (14% from total withdrawal) (Figure 1). Qatar utilizes its
wealth of natural gas (NG) and oil production in urbanization and securing improved urban drinking water supply and sanitation services, which have reached 100% of Qatar’s population since 2006.
Figures 2a, 2b and 2c show the history of GW withdrawal. It
shows GW pumping increased from 51.2 Mm3 yr
-1 in
1976 (little less than replenishment rate) to 248.7 Mm
3 yr
-1 in 2009. Figure 2a shows a decrease in
*Corresponding Author’s Email: [email protected], Tel.: + 974 66502650, Fax: + 974 4454 1528
Global Journal of Agricultural Research and Reviews Vol. 3(1), pp. 106-120, January, 2015. © Global Science Research Journals
http://www.globalscienceresearchjournals.org/

Glob. J. Agric. Res. Rev. 107
Figure 1: Water uses and water losses in 2011 [4]
Figure 2a: Qatar farming and total GW abstraction, and number of wells from 1977 to 2009[3]
areas with underlying freshwater and brackish water (BW) suitable for irrigation. Water with total dissolved solids (TDS) between 1500-3500 mg L
-1 may be
hazardous to the irrigation of several crops, while at TDS = 3500 mg L
-1 water is unsuitable for irrigation.
Concerning GW, a report issued by Qatar’s Ministry of Environment (MoE) in 2009 predicted that the predicted year for the area with underlying freshwater of TDS < 1000 mg L
-1 to reach zero is 2018, and that for low
salinity of TDS < 2000 is 2037, and that for TDS < 3000 is 2056[3]. Many land farms have already been abandoned in Qatar due to the deterioration of GW quality. Of all groundwater abstractions 92% are for agricultural purposes, and the remaining 8% are for domestic, municipal, and industrial uses [4].
Qatar's water is becoming increasingly scarcer with GW overexploitation, population increase at a high rate,
and more need for food productions. As DW is extremely expensive and GW is depleted, treated municipal WW should be fully utilized for agriculture irrigation after proper treatment and control. Nitrogen (N) and phosphorus (P) contents of WW can reduce or eliminate the needs for synthetic fertilizers. Saudi Arabia (SA) and Jordan have national policies to reuse all treated WW effluents [5]. WW reuse for agriculture would help the country to continue farming and promotes food security. Reclaimed WW is available year-round, allows multiple cultivation cycles, typically increases with population growth, and has a much lower cost than DW. Waste Water (WW) and its Treatment in Qatar By law in Qatar, WW should be treated before being reused or disposed in the surrounding area (e.g.

Darwish et al. 108
Figure 2b: Area underlain by fresh water (<1000 mg L-1
) and good brackish water (2000-3000 mg L-1
) in North Qatar, 1971-2008[3]
Figure 2c: Groundwater balance (Adapted from [4])
Figure 3: Effect of high contents of carbon, nitrogen, and
phosphorous, toxicity and carcinogenicity due to heavy metals on the receiving water
receiving water or land). This is done by lowering the WW harmful contents to the extent that the environment would not be negatively affected. Qatar's Public Work Authority
(Ashghal) is responsible for treating the WW by building and running wastewater treatment plants (WWTPs). The WW harmful contaminants include organic materials, pathogens, nutrients, and synthetic chemicals. High content of organic matters or nutrients can lead to O2 depletion in
receiving water or eutrophication[6]. A list of several Qatar WWTPs names and capacities (in m
3 day
-1) is given [7]:
- Saililyah of (135 000 m3 day
-1) commissioned in 2008,
and was expected to reach 175 000 m3 day
-1in 2013
- Naijah (106 000 m3 day
-1) capacity, commissioned in
2006, and was expected to reach 180 000 m3 day
-1 in
2013 - Lusail (60 000 m
3 day
-1) [8].
- Doha North (234 000 m3 day
-1) was expected in 2013, and is
expected to increase to 234 000 m3 day
-1 in 2016 [9]. Doha
North is the largest, and is under-construction WWTP. - Doha industrial area (12 000 m
3 day
-1) commissioned in 2006,
was expected to reach 24 000 m3 day
-1 in 2013, and 48 000
m3 day
-1in 2016.

Glob. J. Agric. Res. Rev. 109
Figure 4a: Design capacity per treatment type of urban wastewater treatment plants in Qatar (Adapted from [10])
Figure 4b: Current Treated Effluent Rate and Distribution [7]
- Alkhor (5000 m
3 day
-1) capacity, expected to reach 10
000 m3 day
-1 in 2016
- Al Thakhira (1600 m3 day
-1), was expected to be (3200
m3 day
-1) in 2013, and is expected to increase to 42 000
m3 day
-1 is planned to add in 2019.
These numbers gave a total capacity of 352 860m3 day
-
1[8]. There are also small projects in Al Shamal,
Jumeliyah, North Camp, Shahaniyah, Al Khareeb, and AumSallal.
The total treated wastewater (TWW) capacity is expected to reach 634 860 m
3 day
-1(231.7 Mm
3 yr
-1) in
2013, 790 410 m3 day
-1 (288 Mm
3 yr
-1) in 2016, and 819
410 m3 day
-1 (299 Mm
3 yr
-1) by 2030[7]. So, the current
TWW capacity is almost equal or slightly higher than the GW used presently for agriculture. This means that utilizing the TWW in agriculture can double agricultural production and raise Qatar’s food self-sufficiency from 5.47% to more than 10%.
Nagy[4]reported that in 2012 most of WW, 335 000 m3
day-1
, are treated to a tertiary level, with 175 500 m3 day
-1
with P and N removal, 159 400 m3 day
-1 for just
disinfection, and 2000 m3 day
-1 for secondary treatment,
Figure 4a.
The current treated effluent reuse applications are: GW injection (25%), animal fodder irrigation (27%), end user and highway irrigation (37%), and disposed to lagoon (11%), see Figure 4b[7].
Part of the TWW in Qatar is reused for irrigation of animal fodder. Qatar is already one of twenties countries using the largest volumes of TWW in agriculture - about 80 000 m
3 day
-1. This is a small amount compared to
those of Saudi Arabia (595 000 m3 day
-1), Kuwait (432
000 m3 day
-1), UAE (200 000 m3 day-1), Israel (767 000
m3 day
-1), and Libya (110 000 m
3 day
-1) [10]. In Qatar,
TWW is about 30% of municipal water and this ratio would be soon more than 50% and is treated to tertiary levels. The proposed standard for treating effluent WW for reuse as given by Ashghal is shown in Table 2[7]. Reuse of WW in Agriculture: An Overview Water reuse in agriculture should be an important component of the national integrated water resources management strategy (IWR) and a part of the national strategy for sustainable water management[1]. Some of the terms used in relation to TWW reuse for agriculture irrigation are mentioned below. Untreated WW: Municipal WW collected from homes and public buildings, including: (1) Black water (excreta, urine and associated sludge) coming from toilets, (2) Grey water coming from less polluted sources such as washing hands/face, drinking, bathing, and heating and cooling, and (3) Grey water coming from kitchen water, Treated waste water (TWW): Collected municipal or industrial WW can be treated physically, biologically, and chemically in WWTPs to reduce its pollution or health hazardous substances before its disposal. Reclaimed water or recycled water: Reclaimed water or recycled water is TWW with specific conditions that can be used for beneficial purposes, such as irrigation, cooling, flushing, etc.

Darwish et al. 110
Table 1: Proposed standards for treated effluent WW for reuse[7]
Standard effluent criteria Proposed standard Future standard Basis of compliance
Suspended Solids 5 mg L-1 5 mg L
-1 90%
BOD 5 mg O2L-1 5 mgO2L
-1 90%
COD 50 mgO2L-1 50 mgO2L
-1 90%
pH 6 - 9 6 - 9 90% Ammonia 1 mg L
-1 1 mg L
-1 90%
Phosphate 1/2 mg L-1 2 mg L
-1 90%
Total Nitrogen 10 mg L-1
5 mg L-1 90%
Dissolved Oxygen 2 mg L-1(min) 2 mg L
-1(min) 90%
Chlorine (Free Residual) 0.5-1.0 mg L-1 0.5 – 1.0 mg L
-1 90%
Turbidity 2 NTU 2 NTU 90% Total Dissolved Solids 2000 mg L
-1 500 mg L
-1 90%
MPN of Fecal Coliform per 100 ml 0.0 0.0 90% Intestinal nematodes (no. of eggs per l < 1.0 0.0 95% Enteric Viruses (no. of plaque forming unit/40 liters ) < 1.0 <1.0 90% Guardia (no. of cysts per 40 liters) < 1.0 <1.0 90%
Table 2: Guideline for interpretation of water quality1[18]
Potential Irrigation Problem Units Degree of Restriction on Irrigation
None Slight to Moderate Severe
Salinity (affects crop water availability)2
ECw dS m-1 <0.7 0.7 - 3.0 > 3.0
TDS mg L-1 < 450 450 - 2000 > 2000
Infiltration (affects infiltration rate of water into the soil; evaluate using ECw and SAR together)3
SAR 0 - 3 > 0.7 0.7 - 0.2 < 0.2 3 - 6 > 1.2 1.2 - 0.3 < 0.3
6 - 12 and ECw= > 1.9 1.9 - 0.5 < 0.5
12 - 20 > 2.9 2.9 - 1.3 < 1.3
20 - 40 > 5.0 5.0 - 2.9 < 2.9
Specific Ion Toxicity (affects sensitive crops)
Sodium (Na)4
surface irrigation SAR < 3 3 - 9 > 9
sprinkler irrigation meqL-1 < 3 > 3
Chloride (CI)4
surface irrigation meq L-1 < 4 4 - 10 > 10
sprinkler irrigation meq L-1 < 3 > 3
Boron (B) meq L-1 < 0.7 0.7 - 3.0 > 3.0
Miscellaneous Effects (affects susceptible crops)
Nitrate (NO3-N) mg L-1
< 5 5 - 30 > 30
Bicarbonate (HCO3) meq L-1 < 1.5 1.5 - 8.5 > 8.5
pH Normal Range 6.5 - 8.4
1 Adapted from FAO (1985)
2ECw, means electrical conductivity, a measure of the water salinity, reported in deciSiemens per meter at 25°C (dS m
-1) or inmillimhos
per centimeter (mmhocm-1); both are equivalent.
3 SAR is the sodium adsorption ratio; at a given SAR, infiltration rate increases as water salinity increases.
4 For surface irrigation, most tree crops and woody plants are sensitive to sodium and chloride; most annual crops are not sensitive. With
overhead sprinkler irrigation and low humidity (< 30 percent), sodium and chloride may be absorbed through the leaves of sensitive crops.
Grey water: Water generated from households and other sectors (e.g. mosques) and not connected to a sewerage system can be treated and used under controlled conditions for
irrigation of home gardens and trees. It consists of more than 50% of residential wastewater (like effluent of washing machines). Undigested or partially digested slurry or solid that
results from the storage or treatment of black-water in so-called on-site sanitation systems is called fecal sludge.
Wastewater usages: WW or TWW can be re-used directly or indirectly. In direct use of untreated WW, the WW from a sewage outlet is directly disposed on land where it is used for cultivation. In addition, direct use of

Glob. J. Agric. Res. Rev. 111
Table 3: Recommended water quality criteria for irrigation[15]
Constituent
Long-
Term Use
Short-
Term Use Remarks
mg L-1
mg L-1
Aluminum 5 20
Can cause non-productiveness in acid soils, but soils at pH 5.5 to 8.0 will
precipitate the ion and eliminate toxicity.
Arsenic 0.1 2
Toxicity to plants varies widely, ranging from 12 mg L-1
for Sudan grass to less than 0.05 mg L
-1 for rice.
Beryllium 0.1 0.5 Toxicity to plants varies widely, ranging from 5 mg L
-1for kale to 0.5 mg L
-1for bush
beans.
Boron 0.75 2
Essential to plant growth, with optimum yields for many obtained at a few-tenths mg L
-1in nutrient solutions. Toxic to many sensitive plants (e.g., citrus) at 1 mg L
-1.
Usually sufficient quantities in reclaimed water to correct soil deficiencies. Most
grasses are relatively tolerant at 2.0 to 10 mg L-1
.
Cadmium 0.01 0.5 Toxic to beans, beets, and turnips at concentrations as low as 0.1 mg L
-1in nutrient
solution. Conservative limits recommended
Chromium 0.1 1 Not generally recognized as an essential growth element. Conservative limits recommended due to lack of knowledge on toxicity to plants.
Cobalt 0.05 5 Toxic to tomato plants at 0.1 mg L
-1in nutrient solution. Tends to be inactivated by
neutral and alkaline soils.
Copper 0.2 5 Toxic to a number of plants at 0.1 to 1.0 mg L-1
in nutrient solution.
Fluoride 1 15 Inactivated by neutral and alkaline soils.
Iron 5 20 Not toxic to plants in aerated soils, but can contribute to soil acidification and loss of essential phosphorus and molybdenum
Lead 5 10 Can inhibit plant cell growth at very high concentrations.
Lithium 2.5 2.5 Tolerated by most crops at concentrations up to 5 mg L
-1; mobile in soil. Toxic to
citrus at low doses - recommended limit is 0.075 mg L-1
. Manganese 0.2 10 Toxic to a number of crops at a few-tenths to a few mg L
-1in acidic soils.
Molybdenum 0.01 0.05 livestock if forage is grown in soils with high levels of available molybdenum.
Nickel 0.2 2 Toxic to a number of plants at 0.5 to 1.0 mg L
-1; reduced toxicity at neutral or
alkaline pH
Selenium 0.02 0.02 Toxic to plants at low concentrations and to livestock if forage is grown in soils with low levels of selenium.
Tin, Tungsten, & Titanium
--- ---
Effectively excluded by plants; specific tolerance levels unknown
Vanadium 0.1 1 Toxic to many plants at relatively low concentrations.
Zinc 2 10 Toxic to many plants at widely varying concentrations; reduced toxicity at
increased pH (6 or above) and in fine-textured or organic soils.
pH 6 Most effects of pH on plant growth are indirect (e.g., pH effects on heavy metals’ toxicity described above).
TDS 500 - 2000 mg L-1
1000 mg L-1
, TDS in irrigation water can affect sensitive plants. At 1000 to 2000 mg L
-1, TDS levels can affect many crops and careful management practices should
be followed. Above 2000 mg L-1
, water can be used regularly only for tolerant
plants on permeable soils.
Free Chlorine <1 mg L-1
Concentrations greater than 5 mg L-1
causes severe damage to most plants. Some sensitive plants may be damaged at levels as low as 0.05 mg L
-1.
TWW occurs when TWW is used for agriculture or other irrigation or recycling purposes. This requires storage and conveyance infrastructures to transport effluents from WWTPs directly to the site of application. In indirect use of untreated WW, this water can be diluted with other water. Indirect TWW or untreated urban WW occurs for example, when water is injected first into a groundwater aquifer and then abstracted by farmers for agriculture.Moreover, TWW used for agricultural irrigation can be used to irrigate food crops that are intended for
human consumption or to irrigate crops that are either processed before human consumption or not consumed by humans. Quality of Reclaimed TWW for Irrigation: Key Constituents TWW is already reused (or reclaimed) in Qatar, Figure 4b, for artificial GW injection, animal fodder irrigation, and highway irrigation. This water can also be reused for

Darwish et al. 112
Figure 5: Treatment technologies are available to achieve any desired level of water quality
irrigation of agricultural land besides other applications such as: landscape irrigation, urban and industrial uses, and recreational purposes with degree of treatments that suit each application. Figure 5 shows that according to the stages of WW treatment, the effluent of primary treatment (sedimentation) cannot be reused. The effluent of secondary (biological treatment) can be reused for surface irrigation of non-food crop irrigation provided it should have some quality measures such as pH between 6-9, BOD less than or equal to 30MgO2 L
-1, total
suspended solids (TSS) less than or equal to 30, total fecal coliform less than or equal to 200/100 mL, and salinity less than 1 mgCl2L
-1[11].
The effluent of tertiary (with P and N removal, disinfection and other advanced technologies) with chemical coagulation, filtration, and disinfection treatment can be applied tolandscape and Golf course irrigation, toilet flushing, vehicle washing, food crop irrigation, unrestricted recreational impoundment, and indirect potable reuses.
The suitability of TWW reuse in agriculture irrigation depends on the key constituents of the TWW. The Food and Agriculture Organization [12], recommended TWW quality forirrigation, as shown in Table 2. The recommended water quality criteria for irrigation are given in Table 3.
The TWW reused salinity is one of the main factors affecting both the crops and the soil. The salinity expressed by ECw, electrical conductivity reported in deci-Siemens per meter (dS m-1) at 25 °C or total dissolved solids expressed in mg L
-1. It is noticed that: mg
L-1
= milligrams per liter; also, mg L-1
~ 640 x EC in dS m-
1. TWW of TDS < 500 mg L
-1 has no detrimental effect on
soil, and of 500 < TDS <1000 water can affect sensitive plants, and for 1000 < TDS < 2000 can badly affect many crops. Salt accumulation in soil depends on the TDS of the TWW and the rate at which salts are removed by leaching.
Chlorine is used for TWW disinfection, and chlorine residual in mg L
-1 of less than 1 mg L
-1 has no bad effect
on plants, but at higher than 5 mg L-1
cause severe damage to most plants. Moreover, sodium absorption
ratio (SAR) is affecting the soil and should be checked as shown in Table 2. The SAR is related to the sodium ions in irrigated water. When the reuse TWW has excess sodium ions, it negatively affects the soil. When sodium ions are present in soil above certain values relative to total dissolved salts dispersed in soil, they reduce the water and air infiltration rates into the soil. The SAR is the most reliable index of the sodium hazard of irrigation water, and is defined by:
𝑆𝐴𝑅 = 𝑁𝑎
(𝐶𝑎+𝑀𝑔)/22
The ion concentrations in the SAR definition are expressed in meqL
-1.
Nitrogen (N), phosphorus (P), and potassium (K) are nutrients minerals (called primary macronutrients). They are usually lacking in soil due to their uptake by plants to grow and survive; and usually added to soil as manure or synthetic mineral fertilizers. In addition, secondary macronutrients such as calcium, magnesium, and sulfur are needed for growing crops. N helps plants in rapid growth, increases seed and fruit production, and is usually applied as a fertilizer. P has an important effect on rapid growth and for blooming and root growth. These nutrients can be obtained from application of reclaimed water, so there is an added value in using reclaimed TWW. However, in light of ever-increasing regulatory requirements for nutrient removal to address loads to receiving streams, N and/or P are often removed in municipal WWTPs such as in Qatar.
Comparison of the quality of WWTPs tertiary WW effluents based on the proposed standards given by Ashghal (Table 1), and FAO recommendation for unrestricted use of TWW for agriculture, shows that more
treatment is needed to lower the TDS of tertiary treated WW effluent from Qatar’s WWTPs from 2000 mg L
-1 (Table 1)
to 450 mg L-1
(Table 2). Micronutrients needed to grow crops include boron,
copper, iron, chloride, manganese; molybdenum, and zinc, but in small quantities as given in Table 3. These are added as required for plant growth, but their concentration increase beyond the required amounts can be toxic. Quality of Reclaimed TWW for Agriculture: Health Risks
The use of WW in agriculture can be risky from a health point of view, mainly due to its harmful constituents such as pathogens, i.e. disease-causing organisms that are usually
present in untreated or partially treated (and to some level in TWW). Many excreta-related diseases can be spread by WW reuse in agriculture to workers in the WW-irrigated fields and those consuming WW irrigated foods, especially when eaten uncooked.
Municipal WW consists of mainly water (around 99.9%), and small amounts (concentrations) of constituents (suspended and dissolved organic and inorganic solids).

Glob. J. Agric. Res. Rev. 113
Table 4: Major constituents of typical domestic wastewater[13].
Constituent Concentration, mg L
-1
Strong Medium Weak
Total solids 1200 700 350 Dissolved solids (TDS) 850 500 250 Suspended solids 350 200 100 Nitrogen (as N) 85 40 20 Phosphorus (as P) 20 10 6 Chloride
1 100 50 30
Alkalinity (as CaCO3) 200 100 50 Grease 150 100 50 BOD5 300 200 100
The constituent concentration, increases with decreasing the water consumption per capita. Table 4 shows the levels of the major constituents of strong, medium, and weak domestic WW[13]. Qatar high municipal water consumption per capita categorizes its WW constituents as weak. The main constituents of municipal wastewater are: - Pathogens - Organic matter - Nutrients (Nitrogen, Phosphorus, Potassium) - Inorganic matter (dissolved minerals) - Toxic chemicals
Some of these constituents (based on concentration and time of exposure) can be harmful to persons as they cause diseases by ingestion or contact.
Pathogens are classified as viruses, bacteria, protozoa and helminthes (Table 5) [14]. The viruses are highly contagious entero-viruses (polio, echo, coxsackie), hepatitis A and E, and a range of viruses causing diarrhea and gastroenteritis. Viruses are the smallest pathogens that can pass through filtration and be detected in drinking water. The bacteria include harmless and pathogenic coliforms, salmonella, shigella, and enterococci, and cause waterborne diseases such as typhoid, dysentery, cholera and other gastrointestinal illnesses. The protozoan pathogens are single-celled eukaryotic parasites. They survive as cysts outside their host, the most common being Giardia lambliaand Cryptosporidium.
High concentrations of excreted pathogens such as viruses, bacteria, helminthes eggs, and fecal coliforms are contained in WW, and at levels indicated in Table 4, and can survive for long
periods as shown in Table 5[15]. The relative health impact of pathogenic agents is given in Table 6.
Pathogenic bacteria in WW have lower levels than the coliform group of bacteria, and are much easier to identify and enumerate (as total coliforms per 100 mL). Escherichia coli are the most widely adopted indicator of fecal pollution and they can also be isolated and identified simply, with their numbers usually being given in the form of fecal coliforms (FC)/100 mL of WW. A brief overview of the wastewater constituents, parameters, and
possible impacts are given in Table 6. These pathogens have the potential to cause disease when transmitted to humans in sufficient quantities. Intestinal nematodes pose the highest degree of risk of infection while bacteria pose low risk. Viruses exhibit the lowest risk[16].
The greatest concern when using WW for agriculture is due to the pathogenic micro- and macro-organisms. Comprehensive relative impacts of pathogenic constituents (Plant food nutrients, suspended solids, Pathogens, biodegradable and stable organics, dissolved inorganic substances, heavy metals, hydrogen ion concentrations, and
residual chlorine in tertiary treated WW) on growing crops, human risk, discharging environment, and on soil are given in Table 7[17].
Helminthic diseases caused by Ascaris and Trichuris spp. are endemic in the population around the world where raw untreated WW is used to irrigate salad crops and/or vegetables are eaten uncooked. Numerous viruses may infect the intestinal tract and be passed in the feces, whereupon they may infect new human hosts by ingestion or inhalation.
Some information on the pathogens listed in Table 5 is given here [16]. The helminthes Ova and the parasitic worms are unlike external parasites such as lice and fleas that live inside their host. They live and feed off of living hosts, receiving nourishment and protection while disrupting their hosts' nutrient absorption, causing weakness and disease. They can live inside humans as well as other animals. Approximately 3 thousand million people globally are infected with helminthes. Because of their high mobility and lower standards of hygiene, school-age children and immune-compromised people are particularly vulnerable to these parasites.
The Nematodes are one of the most diverse of all animals. Nematode species are very difficult to distinguish; over 28 000 have been described, of which over 16 000 are parasitic. Nematodes have successfully adapted to nearly every
ecosystem from marine to fresh water. Their many parasitic forms include pathogens in most plants and animals (including humans).
Coliforms include genera that originate in feces -"Fecal Coliforms" (e.g. E. Coli) as well as genera not of fecal origin - "Coliforms" (e.g. Enterobacter, Klebsiella, Citrobacter). The assay is intended to be an indicator of fecal contamination; more specifically of E. coli which is an indicator microorganism for other pathogens that may be
present in feces. Presence of fecal coliforms in water may not be directly harmful, and does not necessarily indicate the presence of feces [18].
To prevent the transmission of communicable diseases, the WHO guidelines require that: For restricted irrigation, no more than one viable human intestinal nematode egg per liter in the irrigated water [19].
For unrestricted irrigation, besidesno more than one viable human intestinal nematode egg per liter, also no more than 1000 fecal coliform bacteria per 100mL. Unrestricted irrigation, on the other hand, refers to all crops grown for direct human consumptions. These

Darwish et al. 114
Table 5: Occurrence and survival of pathogens[14].
size [μm] Common conc. In domestic sewage [number/100mL]
Infectious dose N50
Usual survival time [days]
In Sewage
In Sewage
On Crops
Viruses 0.01 – 0.3 102 - 10
4 1 - 10 <50 <20 <15
Bacteria 0.2-10 107-10
10
Faecal coliforms
105-10
8 106-1010 <30 <50 <15
Salmonella 102-10
4 <30 <30 <30
Shigella 100-10
3 10-20 <10 <10 <5
Protozoa 10-50 Cysts:4-6 100-10
5 1-20 <15 <15 <2
Helminthes mm-cm eggs: 35- 70 100-103 1-10 months months <30
Table 6: Relative health impact of pathogenic agents[13].
High Risk (high incidence of excess infection)
Helminthes (Ancylostoma, Ascaris, Trichuris and Taenia)
Medium Risk (low incidence of excess infection)
Enteric Bacteria (Cholera vibrio, Salmonella typhosa, Shigella and possibly others)
Low Risk (low incidence of excess infection)
Enteric viruses
include those eaten raw (e.g., lettuce, salads, cucumber etc.,), and irrigation of sports fields and public parks, known as Category C. The recommended microbiological quality guidelines for wastewater use in agriculture are given as follows:
For category A reuse condition of Irrigation of crops likely to be eaten uncooked, sports fields, and public parks where Workers, consumers, public are exposed, the Intestinal nematodes(arithmetic mean no. of eggs per liter should be less than 1 (<1), and the Fecal coliforms (geometric mean no. per 100 mL) should be less than 1000 (<1000).
Similarly for category B reuse condition of irrigation of cereal crops, industrial crops, fodder crops, pasture and trees, where workers only are exposed, the Intestinal nematodes(arithmetic mean no. of eggs per liter should be less than 1 (<1), and no standard is recommended for Fecal coliforms. For category C reuse condition of Localized irrigation of crops if no exposure occurs, no applicable standards for intestinal nematodes(arithmetic mean no. of eggs per liter) or fecal coliforms[13]. Benefits of Using TWW for Agriculture TWW is already available for recycling to farmers, or for releasing into aquifer recharge. The cost involved is much less than using desalted seawater (DW) for agriculture, or continue abstraction and desalination of GW (almost brackish). The latter means more mining of fossil water. Using TWW for agriculture is the best available solution, economically and environmentally. By
not directing the TWW for agriculture, many farmers will abandon their farms and the food security problem will worsen.
The alternatives to reuse TWW, other than in agriculture, are very limited, and the TWW is disposed of in lagoons or to the sea. The reuse of TWW enables GW to be used in new purposes such as expansion of irrigated farming, or for various
environmental purposes. The major types of benefit that can be expected from the reuse of TWW are avoiding both the capital and recurrent cost of pumping GW, saving the cost of fertilizers as organic matter, N and P left in WW benefit the productivity of crops. In addition, TWW is a reliable source that is available all times.
While the WWTP are available for tertiary level treatment in Qatar, adjustments to an existing WWTP would be minimal. The real cost for using the TWW for agriculture is for installing new infrastructure for distributing the treated effluent from the WWTP to the irrigation areas (pipes, tanks, reservoirs, pumps, etc.) and recurring costs entailed (power for pumping, cleaning, etc.). The real cost of not using TWW for agriculture would be apparent from knowing the degree of food self-sufficiency in Qatar.
Growing Food in Qatar
Qatar’s agricultural land in square kilometers (km2) is
shown in Figure 6a. The total cultivated area (arable land and area under permanent crops) in 2004 was 6322 ha (about 0.6% of total Qatar area), including 67 ha of greenhouses. The total area of arable land (annual crops + temp. fallow + temp. meadows) was 2651 ha, which

Glob. J. Agric. Res. Rev. 115
Figure 6a: Agriculture land in Qatar [14]
Figure 6b: Land areas occupied by the main agriculture products
Figure 7: Irrigation potential, selected countries (2012) [23]
includes 1190 ha of vegetable crops and 1461 ha of field crops. The area under permanent crops amounts to 3412 ha and comprises 1478 ha of perennials and forage crops and 1934 ha of fruit trees. The land suitable for irrigation is 52 128 ha and most of it is classified as having marginal suitability for irrigation. All cultivated
areas are irrigated thus representing 12.1% of the land suitable for irrigation. The share of agriculture in gross domestic product (GDP) is 0.1%, [20, 21].
The long-term average water precipitation (long-term average) is 80 mm y
-1. The internal renewable water
resources (long-term average) are 56 Mm3 yr
-1, with total
actual renewable water resources of 58 Mm3 yr
-1. This
gives total actual renewable water resources per capita as (for 2 M population) 29 m
3 y
-1.Ca
-1.
The area of Qatar’s agriculture land is given in Figure 6a[22]and the land area for the products is given in Figure 6b.
Irrigation potential of selected countries in the Middle East shows that Qatar, Libya, UAE, and Kuwait have the least land in 2012.
Qatar’s food production is very limited. The 2012 food production reported by the UN Food and Agricultural organization (FAO) is given in Table 8a [23]. Table 8a gives the total production is 93 134 metric tons (MT) and cost $M 54 902. The Arab Agriculture statistic yearbook [4]reported the following data in 2011: - Rural population (77 000) to total Population (1 732 000) ratio is 4.44%. - Agriculture labor (17 290) to total labor (1 277 450) ratio is 1.35%. - Cultivated area (29 200 ha) to total area (1 143 000 ha) ratio is 2.54%. - Permanent crop area is 2600 ha, seasonal cultivated area 10500 ha, uncultivated area 16 000 ha. - Gross Agricultural Product ($M162.09) to Gross Domestic Product ($M171476.10) ratio is 0.095%. - Per Capita Agricultural Product ($93.55) to total per capita GDP ($98963.65) ratio is 0.095%. - Modern irrigation area is 280 ha. The data of the Arab Agriculture statistic yearbook on Qatar’s agriculture productions is given in Table 8b, and are compared with those given by the government’s authorities, given between brackets.
Therefore, the total agriculture production is 114 790 metric tons (MT). Modern irrigation area is 280 ha. Livestock, poultry, and fish production:
Number of slaughtered sheep and goats 105420×20 average kg per head = 2108 ton, while production is 560 ton
• Number of slaughtered sheep and goats 105 420×20 average kg head-1 (560 ton)
• Production of camel meat 2160 ton • Production of poultry meat 3650 ton • Production of milk 15890 ton • Production of eggs 37 800 ton • Production of fish 4030 ton • Production of nitrogen fertilizers 2908
200 ton (the highest in all Arab countries) Production of phosphate fertilizers (no data).
• Agricultural and food imports in 2011: Food ($M 1451.81), agriculture ($M1555.06), and total import ($M 20924.52).
0
5
10
15
mill
ion
ha
Darwish et al. 116
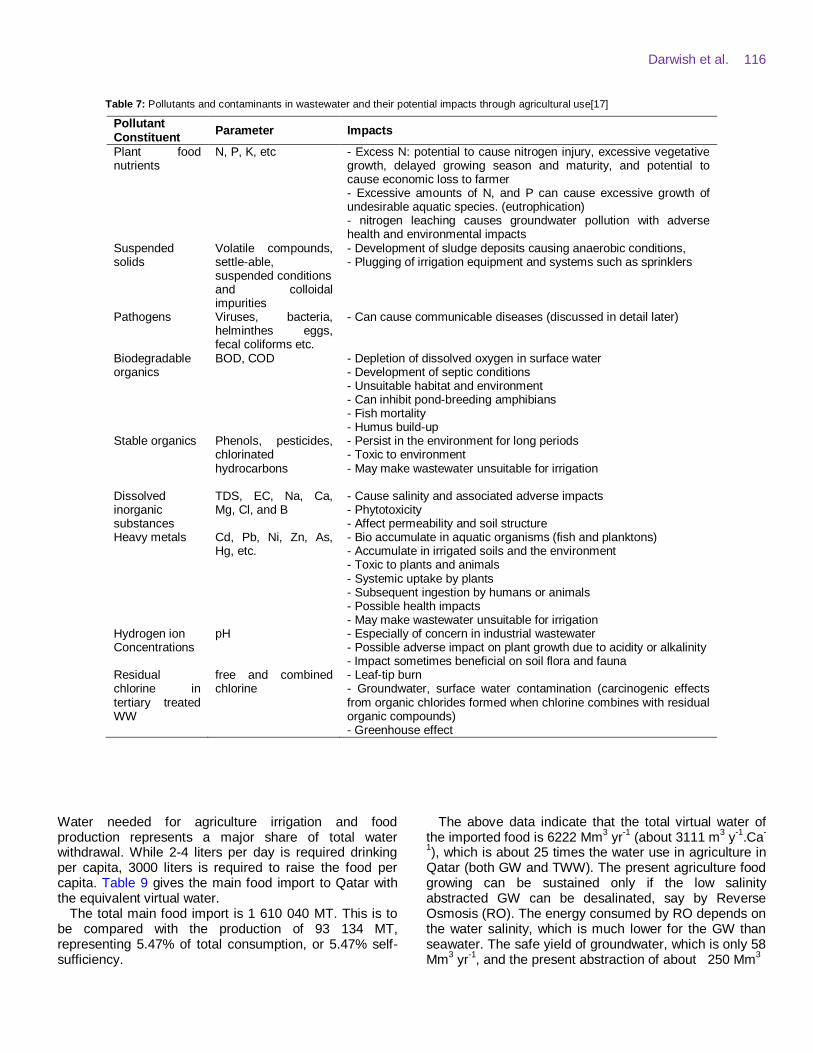
Table 7: Pollutants and contaminants in wastewater and their potential impacts through agricultural use[17]
Pollutant Constituent
Parameter Impacts
Plant food nutrients
N, P, K, etc - Excess N: potential to cause nitrogen injury, excessive vegetative growth, delayed growing season and maturity, and potential to cause economic loss to farmer - Excessive amounts of N, and P can cause excessive growth of undesirable aquatic species. (eutrophication) - nitrogen leaching causes groundwater pollution with adverse health and environmental impacts
Suspended solids
Volatile compounds, settle-able, suspended conditions and colloidal impurities
- Development of sludge deposits causing anaerobic conditions, - Plugging of irrigation equipment and systems such as sprinklers
Pathogens Viruses, bacteria, helminthes eggs, fecal coliforms etc.
- Can cause communicable diseases (discussed in detail later)
Biodegradable organics
BOD, COD - Depletion of dissolved oxygen in surface water - Development of septic conditions - Unsuitable habitat and environment - Can inhibit pond-breeding amphibians - Fish mortality - Humus build-up
Stable organics Phenols, pesticides, chlorinated hydrocarbons
- Persist in the environment for long periods - Toxic to environment - May make wastewater unsuitable for irrigation
Dissolved inorganic substances
TDS, EC, Na, Ca, Mg, Cl, and B
- Cause salinity and associated adverse impacts - Phytotoxicity - Affect permeability and soil structure
Heavy metals Cd, Pb, Ni, Zn, As, Hg, etc.
- Bio accumulate in aquatic organisms (fish and planktons) - Accumulate in irrigated soils and the environment - Toxic to plants and animals - Systemic uptake by plants - Subsequent ingestion by humans or animals - Possible health impacts - May make wastewater unsuitable for irrigation
Hydrogen ion Concentrations
pH - Especially of concern in industrial wastewater - Possible adverse impact on plant growth due to acidity or alkalinity - Impact sometimes beneficial on soil flora and fauna
Residual chlorine in tertiary treated WW
free and combined chlorine
- Leaf-tip burn - Groundwater, surface water contamination (carcinogenic effects from organic chlorides formed when chlorine combines with residual organic compounds) - Greenhouse effect
Water needed for agriculture irrigation and food production represents a major share of total water withdrawal. While 2-4 liters per day is required drinking per capita, 3000 liters is required to raise the food per capita. Table 9 gives the main food import to Qatar with the equivalent virtual water.
The total main food import is 1 610 040 MT. This is to be compared with the production of 93 134 MT, representing 5.47% of total consumption, or 5.47% self-sufficiency.
The above data indicate that the total virtual water of the imported food is 6222 Mm
3 yr
-1 (about 3111 m
3 y
-1.Ca
-
1), which is about 25 times the water use in agriculture in
Qatar (both GW and TWW). The present agriculture food growing can be sustained only if the low salinity abstracted GW can be desalinated, say by Reverse Osmosis (RO). The energy consumed by RO depends on the water salinity, which is much lower for the GW than seawater. The safe yield of groundwater, which is only 58 Mm
3 yr
-1, and the present abstraction of about 250 Mm
3

Glob. J. Agric. Res. Rev. 117
Table 8a: Food and Agricultural commodities production [24].
Rank Commodity Flag Production (Int $1000)
Production (MT)
1 Meat indigenous, chicken 13943 9789 2 Dates 11155 21843 3 Meat indigenous, sheep 5583 2051 4 Meat indigenous, goat 3858 1610 5 Eggs, hen, in shell 3574 4309 6 Tomatoes 3313 8964 7 Milk, whole fresh goat 2282 6800 8 Milk, whole fresh cow 2184 7000 9 Milk, whole fresh sheep 2142 5500 10 Milk, whole fresh camel 1773 5200 11 Pumpkins, squash and gourds 1281 7303 12 Meat indigenous, cattle 913 338 13 Eggplants (aubergines) 718 3358 14 Onions, dry 477 2270 15 Vegetables, fresh nes 409 2169 16 Maize, green 352 850 17 Cauliflowers and broccoli 309 1289 18 Cabbages and other brassicas 249 1665 19 Chillies and peppers, green 201 428 20 Lettuce and chicory 186 398
Table 8b: Qatar’s agriculture production with data taken from [24].
Cultivated area, ha
Productivity, kg ha-1
total production, ton
Wheat 10 (11) 3000 (2280) 30 (26) Barley 180 (178) 3000 540 (535) Maize 90 12556 (1225) 1130 (1130) Vegetables 2000 16765 33530 (33528) Tomatoes 290 (288) 29793 (30000) 8640 Onion 90 (86) 24667 (26000) 2220 (2223) Water melon 10 (13) 12 000 (9540) 120 (124) Melons and cantaloupes 80 (83) 9375 (9000) 750 (751) Eggplant 140 (144) 25786 (25000) 3610 (3608) Cauliflower 110 (115) 1545 (12000) 1380 (1376) Pumpkin (143) 9375 (20000) 750 (2852) Sweet Pumpkin (17) 25786 (22020) 3610 (370) Lettuce (115) 1545 (13000) 1380 (399) Mulokhia (21) 14583 (11980) 1750 (248) Radish (28) 14600 (15000) 730 (426) Carrots 10 (7) 8000 (12000) 80 (84) Broad beans, green 30 (20) 1000 (7500) 30 (148) Okra 80 (75) 3750 (4000) 300 Fruits 2550 481.08 (2500) 21 380 (21554) Dates 2370 (2366) 431.12 (8700) 20 700 (20696) Citrus (lemon only) 100 (101) 25.11 280 Protected agriculture 130 11 Grapes (1550 trees) 4 Pomegranates (14) Mulberries (13) Almond (44)
yr
-1 are not sustainable unless the aquifer storage and
recharge (ASR) is applied, with WW treated to potable condition before its injection to aquifers. The total TWW capacity is expected to reach 634 860 m
3 day
-1 (231.7
Mm3 yr
-1) in 2013, and 790 410 m
3 day
-1 (288 Mm
3 yr
-1) in
2016, and planned to be 819 410 m3 day
-1 (299 Mm
3 yr
-1)
by 2030 [7]. Therefore, the current TWW capacity is
almost equal or little higher than the GW used presently for agriculture. This means that utilizing the TWW in agriculture can double the agriculture production, and raises the country self-sufficiency from 5.47% to more than 10%.
Reuse of drainage water under Doha city (20 Mm3 yr
-1)
of TDS in the range of 7 g L-1 for irrigating salt-tolerant

Darwish et al. 118
Table 9: Qatar’s main food imports in 2011, their specific virtual water, and self-sufficiency [25]
Item Q in 1000 ton
Ton kg-1
Virtual water Mm
3
% Self sufficiency
Cereals (total) 468.97 0 0 0.37
Wheat and flour 150.28 1.6 240.448 0.02
Maize 13.7 0.71 9.727 7.62
Rice 134.18 3.4 456.212 0.00
Barley 127.76 1.91 244.022 0.42
Potatoes 42.94 0.287 12.324 0.05
Pulses (total) 14.95 1.754 26.222 0.00
Vegetables (total) 113.22 0.2 22.644 22.89
Fruits (total) 136.3 0.5 68.15 13.67
Sugar(refined) 41.11 0.318 13.073 0.00
Fats & oils(total) 55.81 3.83 213.752 0.00
Meat (total) 133.42
0 10.77
Red meat 38.96 15.415 600.568 8.68
Poultry meat 94.46 43.25 4085.395 11.60
Eggs 20.31 4.9 99.519 16.59
Milk and dairy products 130.28 1.000 130.28 22.65
Fish 23.67
37.30
crops, as suggested by FAO [15], or to be treated to irrigation requirements, a practice used in Kuwait. The long-term strategy should include ASR in the northern aquifer. Building infrastructure to supply the TWW for existing or new farm should be a priority in the time being. CONCLUSION Groundwater, mainly used for agriculture in Qatar, is overexploited, depleted, and its quality is deteriorating. The land with an underlying groundwater of total dissolved solids less than 1000 mg L
-1 (suitable for agriculture) is
expected to disappear by 2018. To continue farming, the growing capacity treated wastewater should be utilized for
agriculture irrigation. The treated wastewater key constituents affecting agriculture, as well as the health risks involved, have been addressed and should be considered in a dynamic monitoring strategy. The food import and production are presented to show the reasons for securing more water for growing more food. The findings of this study could be applied to all similar countries and mainly the countries of the Arabian Gulf.
REFERENCES
[1] Shomar B, M Darwish and C Rowell (2014). What does Integrated
Water Resources Management from Local to Global Perspective
Mean? Qatar as a Case Study, the Very Rich Country with No Water. Water Resources Management 28: 2781–2791.
[2] Darwish, M., A. Hassabou, and B. Shomar. 2013. Using Seawater
Reverse Osmosis (SWRO) Desalting System for Less Environmental Impacts in Qatar. Desalination 86: 600-605.
[3] Mo E (2009). GW final report, Studying and developing the natural
and artificial recharge of ground water aquifer in the state of Qatar (2009). Ministry of Environment of Qatar, Department of Agriculture and Water Research (DAWR), prepared by Schlumberger Water
Service (SWS). [4] Nagy M (2013). Structure and content of the Environment Statistics
Report 2013, Lessons Learnt and Data Shortcomings. Environment
Statistics Workshop, 2-3 December 2013. Retrieved 4 August, 2014, from www.qsa.gov.qa/eng/Activities/EnvironmentWorkshop2013/3_Report
_Structure_MN.pdf [5] FAO (2003). Proceedings Expert Consultation for Launching the
Regional Network on Wastewater Re-use in the Near East, Regional
Office for the Near East, World Health Organization. Food and Agriculture Organization of the United Nations, Regional Office for the Eastern Mediterranean, Cairo. Retrieved 21 September, 2014,
from ftp://ftp.fao.org/docrep/fao/008/y5186e/y5186e00.pdf [6] Wastewater Characterization & Treatment Wastewater
Characterization & Treatment, Chapter 2,
http://iqtma.uva.es/instrat/Presentaciones_pdf/Chapter2-Wastewater%20Characterization%20_%20TreatmentR.pdf, accessed Aug. 4, 2104
[7] El Emadi K, G Abdel Kerim and H El Emadi (2014). Public Works Authority Apply Sustainable Developments Concept with Sewerage Work, Qatar. Retrieved 21 September, 2014, from
http://wstagcc.org/en/wp-content/uploads/sites/2/2014/05/S6_L7_public-works-authority_Elemadi.pdf
[8] GWI (2011). Chapter 38-Qatar, Global Water Intelligence. Retrieved 21 September, 2014, from

Glob. J. Agric. Res. Rev. 119
www.globalwaterintel.com/client_media/uploaded/GWM_2011_sample_chapter.pdf
[9] Water-Technology. 2014. Doha North Sewage Treatment Works
(DNSTW), Qatar. Retrieved 20 October, 2014, from www.water-technology.net/projects/doha-north-sewage-treatment-works-dnstw-qatar/
[10] Sheierling SM, C Bartone, DD Mara and P Drechsel (2010). Wastewater Use in Agriculture: An Emerging Priority. The World Bank, Policy Research Working Paper 5412. Retrieved 10 August,
2014, from http://siteresources.worldbank.org/INTWAT/Resources/ESWWastewaterAg.pdf
[11] McKenzie C (2005). Wastewater Reuse Conserves Water and Protects Waterways. Retrieved 17 August, 2014, from www.worldwewant2015.org/file/303911/download/329873
[12]Wastewater treatment and use in agriculture (1985), Wastewater quality guidelines for agricultural use, Produced by: Natural Resources Management and Environment Department, FAO
Corporate Document Repository, http://www.fao.org/docrep/T0551E/t0551e04.htm, accessed, Aug. 4, 2104
[13]Pescod MB (1992). Wastewater Treatment and Use in Agriculture. Food and Agriculture Organization of the United Nations (FAO), Irrigation and Drainage Paper 47. Retrieved 21 September, 2014, from www.fao.org/docrep/t0551e/t0551e00.htm
[14]Margane A and A Steinel (2011). Proposed National Standard for Treated Domestic Wastewater Reuse for Irrigation, Protection of Jeita Spring. Retrieved 21 September, 2014, from
www.bgr.bund.de/EN/Themen/Wasser/Projekte/laufend/TZ/Libanon/spec_rep_4.pdf?__blob=publicationFile&v=4
[15]Bynum J (2007). Sewage Wastewater Reuse, a Third World
Solution to a Modern Disposal Problem. Retrieved 21 September, 2014, from http://thewatchers.us/water_reuse.html [16]Deakin C (2011). GCC Reuse Regulations, GE Power & Water &
Process Technologies. Retrieved 21 September, 2014, from www.sawea.org/pdf/GCC_Reuse.pdf
[17] Hussain I, L Raschid, MA Hanjra, F Marikar and W van der
Hoek (2002). Wastewater Use in Agriculture: Review of Impacts and Methodological Issues in Valuing Impacts. International Water Management Institute. Retrieved 21 September, 2014, from
www.iwmi.cgiar.org/Publications/Working_Papers/working/WOR37.pdf
[18] USEPA (2004). Guidelines for Water Reuse, Office of
Wastewater Management. U.S. Environmental Protection Agency (2004). Washington, D.C.: Office of Water, EPA/625/R-04/108. Retrieved 10 October, 2014, from
http://water.epa.gov/aboutow/owm/upload/Water-Reuse-Guidelines-625r04108.pdf
[19] WHO (2006). A Compendium of Standards for Wastewater
Reuse in the Eastern Mediterranean Region. World Health Organization, WHO-EM/CEH/142/E. Retrieved 14 October, 2014, from http://applications.emro.who.int/dsaf/dsa1184.pdf
[20] FAO AQUASTAT (2008). Irrigation in the Middle East Region in Figures, AQUASTAT Survey. Food and Agriculture Organization, FAO Water Report 34. Retrieved 21 September, 2014, from
ftp://ftp.fao.org/docrep/fao/012/i0936e/i0936e00.pdf [21] FAO's Information System on Water and Agriculture, Qatar
(2008),
http://www.fao.org/nr/water/aquastat/countries_regions/qatar/index.stm, accessed Aug. 4, 2014
[22] Trading Economics (2014). Agricultural land (sq. km) in
Qatar. Retrieved 1 October, 2014, from www.tradingeconomics.com/qatar/agricultural-land-sq-km-wb-data.html
[23] FAO (2014). FAO Statistical Yearbook, Near East and North Africa Food and Agriculture. Food and Agriculture Organization, Regional Office for the Near East and North Africa, Cairo. Retrieved
21 September, 2014, from www.fao.org/docrep/019/i3591e/i3591e.pdf
[24] FAO (2012). Food and Agricultural Commodities Production.
Food and Agriculture Organization. Retrieved 21 September, 2014, from http://faostat.fao.org/site/339/default.aspx
[25] AOAD (2011). Arab Agricultural Statistics Yearbook, Volume 31. Arab Organization for Agricultural Development. Retrieved 23 September, 2014, from
www.aoad.org/Agricultural_%20Statistical_Book_Vol31.pdf AUTHOR BIOGRAPHIES
Mohamed Darwish Dr. Darwish is a Principal Investigator for the Water Desalination &Water Treatment Group at the Qatar Environment & Energy Research Institute, Qatar Foundation. His research interest is in thermal and membrane water desalination. Address: Qatar Environment and Energy Research Institute, Qatar Foundation, PO Box 5825, Doha, Qatar. Email:[email protected]
Hassan Abdulrahim Dr. Abdulrahim is a Scientist in the Water Desalination &Water Treatment Group at the Qatar Environment & Energy Research Institute, Qatar Foundation. His research interest is in solar desalination and solar cooling. Address: Qatar Environment and Energy Research Institute, Qatar Foundation, PO Box 5825, Doha, Qatar. Email:[email protected] Abdel Nasser Mabrouk Dr. Mabrouk is a Scientist in the Water Desalination &Water Treatment Group at the Qatar Environment & Energy Research Institute, Qatar Foundation. His research interest is in water desalination. Address: Qatar Environment and Energy Research Institute, Qatar Foundation, PO Box 5825, Doha, Qatar. Email:[email protected]
Ashraf Hassan Dr. Hassan is a Scientist in the Water Desalination &Water Treatment Group at the Qatar Environment & Energy Research Institute, Qatar Foundation. His research interest is in thermal analysis for engineering systems, especially for desalination and power plants. Address: Qatar Environment and Energy Research Institute, Qatar Foundation, PO Box 5825, Doha, Qatar. Email:[email protected]
BasemShomar Dr. Shomar is the Research Director for Environmental & Chemical Sciences at the Qatar Environment & Energy Research Institute, Qatar Foundation. His research interest is in water chemistry/quality and water reuse. Address: Qatar Environment and Energy Research Institute, Qatar Foundation, PO Box 5825, Doha, Qatar. Email:[email protected] LIST OF FIGURES AND TABLES
Figure 1: Water uses and water losses in 2011 Figure 2a: Qatar farming and total GW abstraction, and number of wells from 1977 to 2009

Darwish et al. 120 Figure 2b: Area underlain by fresh water (<1000 mg L
-1)
and good brackish water (2000-3000 mg L-1
) in North Qatar, 1971-2008 Figure 2c: Groundwater balance Figure 3: Effect of high contents of carbon, nitrogen, and
phosphorous, toxicity and carcinogenicity due to heavy metals on the receiving water Figure 4a: Design capacity per treatment type of urban wastewater treatment plants in Qatar Figure 4b: Current Treated Effluent Rate and Distribution Figure 5: Treatment technologies are available to achieve any desired level of water quality Figure 6a: Agriculture land in Qatar Figure 6b: Land areas occupied by the main agriculture products Figure 6c: Irrigation potential, selected countries (2012)
Table 1: Proposed standards for treated effluent WW for reuse Table 2: Guideline for interpretation of water quality Table 3: Recommended water quality criteria for irrigation Table 4: Major constituents of typical domestic wastewater Table 5: Occurrence and survival of pathogens Table 6: Relative health impact of pathogenic agents Table 7: Pollutants and contaminants in wastewater and their potential impacts through agricultural use Table 8a: Food and Agricultural commodities production Table 8b: Qatar’s agriculture production Table 9: Qatar’s main food imports in 2011, their specific virtual water, and self-sufficiency