Geo-information Study of the Spatiotemporal Growth of Karu, Nasarawa State, Nigeria
10
Herald Journal of Geography and Regional Planning Vol. 3 (1), pp. 025 - 034 February, 2014 Available online http://www.heraldjournals.org/hjgrp/archive.htm Copyright (c) 2014 Herald International Research Journals ISSN Online: 2350 - 2185 Full Length Research Paper Geo-information Study of the Spatiotemporal Growth of Karu, Nasarawa State, Nigeria 1 CHINDO Musa Muhammad *, 2 IBRAHIM Musa Jaro, 3 JOSHUA Jonah Kunda, 4 SANNI Ahmed Abubakar 1 Department of General Studies, Federal Polytechnic Nasarawa, Nasarawa State, Nigeria. 2 Department of Geography, Ahmadu Bello University Zaria, Kaduna State, Nigeria. 3 Department of Applied Meteorological Services, Nigerian Meteorological Agency, Abuja-Nigera 4 Department of Urban and Regional Planning, Federal Polytechnic Nasarawa, Nasarawa State, Nigeria. Received December 01, 2013 Accepted February o3, 2014 For the past few decades, Nigerian towns and cities have been growing rapidly due largely to rural urban migration. Accordingly, Karu area in Nasarawa state, North-Central Nigeria has witnessed unprecedented growth particularly since Nigeria’s seat of government was relocated from Lagos to Abuja, and the consequent influx of migrants from all over the country. This raises the quest to quantify, determine the rate and map, the growth pattern of the area. This study demonstrates the usefulness of remotely sensed data and geo-information technologies to provide answers on spatial growth of the area using Erdas Imagine 9.1 and ArcGIS 9.3 GIS softwares as analytical tools. Results from this study indicates that the area grew from a mere 64.7907 km 2 in 1973 to 207.5364 km 2 in 2009, with an annual growth rates of 0.6251km 2 , 4.1666km 2 , and 8.0453km 2 between 1973 to 1986, 1986 to 1999, and 1999 to 2009 respectively, with significant spatiotemporal variability in a linear pattern along Abuja-Keffi highway. Keywords: Remote sensing, Geographic Information System, Spatiotemporal, Urban growth, Karu area INTRODUCTION Countries all over the world have urbanized significantly since the 1950s and this trend is projected to continue through the 21st century (UN, 2008). This projection is expected to take place mainly in the developing countries, as the process of urbanisation has virtually ended in Europe; whereas, in Africa, rapid urbanisation is still aggravating the rural-urban dichotomy (Kreibich 2003). Cities in the developing countries are growing very rapidly due to distress migration from their rural hinterlands. Thus, cities in developing countries’ are expected to double their total population from 2 billion in 2000 to 4 billion by 2030, and triple their total built-up areas from about 200,000 sq. km. to more than 600,000 sq. km. within the same period, thereby constitute over half (54.5%) of total urban built-up areas in the world by 2030 (Charles, 1989; Shlomo et al., 2005). *Corresponding Author E-mail: [email protected]; Tel: 08058075678 Accordingly, for the past few decades, towns and cities in Nigeria have been growing at a rapid rate both population wise and spatially, due largely to rural-urban migration (Sada and Oguntoyinbo, 1981). According to the Thematic Committee (2001), in 1950, less than 15% of the total population of Nigeria dwelt in urban centres. This rose to 23.4% in 1975 and 43.5% in 2000, and was projected to have risen to above 50% by 2010. By 2005, rapid urbanization and sprawl was estimated to been affecting about 400,000 hectares of vegetated land cover annually (Adesina, 2005). Ujoh et al. (2010) reports that urban sprawl occurred in Abuja between 1991 to 2006, which they attributed to the Federal Government directive that all government ministries, departments and parastatals should move their head offices from Lagos to the new capital; and arguably, “Lagos is expected to be the third largest city in the world” by the year 2015 (Michael, 2009. 73). However, Karu with an estimated population of 10,000 in 1991 is believed to have grown rapidly to an estimated 50,000 and 130,000 by 2001 and 2010 respectively due
-
Upload
fedpolynasportal -
Category
Documents
-
view
0 -
download
0
Transcript of Geo-information Study of the Spatiotemporal Growth of Karu, Nasarawa State, Nigeria
Herald Journal of Geography and Regional Planning Vol. 3 (1), pp. 025 - 034 February, 2014 Available online http://www.heraldjournals.org/hjgrp/archive.htm Copyright (c) 2014 Herald International Research Journals ISSN Online: 2350 - 2185
Full Length Research Paper
Geo-information Study of the Spatiotemporal Growth of Karu, Nasarawa State, Nigeria
1CHINDO Musa Muhammad*, 2IBRAHIM Musa Jaro, 3JOSHUA Jonah Kunda, 4 SANNI Ahmed
Abubakar
1Department of General Studies, Federal Polytechnic Nasarawa, Nasarawa State, Nigeria.
2Department of Geography, Ahmadu Bello University Zaria, Kaduna State, Nigeria.
3Department of Applied Meteorological Services, Nigerian Meteorological Agency, Abuja-Nigera
4Department of Urban and Regional Planning, Federal Polytechnic Nasarawa, Nasarawa State, Nigeria.
Received December 01, 2013 Accepted February o3, 2014
For the past few decades, Nigerian towns and cities have been growing rapidly due largely to rural urban migration. Accordingly, Karu area in Nasarawa state, North-Central Nigeria has witnessed unprecedented growth particularly since Nigeria’s seat of government was relocated from Lagos to Abuja, and the consequent influx of migrants from all over the country. This raises the quest to quantify, determine the rate and map, the growth pattern of the area. This study demonstrates the usefulness of remotely sensed data and geo-information technologies to provide answers on spatial growth of the area using Erdas Imagine 9.1 and ArcGIS 9.3 GIS softwares as analytical tools. Results from this study indicates that the area grew from a mere 64.7907 km
2 in 1973 to 207.5364 km
2 in 2009,
with an annual growth rates of 0.6251km2, 4.1666km
2, and 8.0453km
2 between 1973 to 1986, 1986 to
1999, and 1999 to 2009 respectively, with significant spatiotemporal variability in a linear pattern along Abuja-Keffi highway. Keywords: Remote sensing, Geographic Information System, Spatiotemporal, Urban growth, Karu area
INTRODUCTION Countries all over the world have urbanized significantly since the 1950s and this trend is projected to continue through the 21st century (UN, 2008). This projection is expected to take place mainly in the developing countries, as the process of urbanisation has virtually ended in Europe; whereas, in Africa, rapid urbanisation is still aggravating the rural-urban dichotomy (Kreibich 2003).
Cities in the developing countries are growing very rapidly due to distress migration from their rural hinterlands. Thus, cities in developing countries’ are expected to double their total population from 2 billion in 2000 to 4 billion by 2030, and triple their total built-up areas from about 200,000 sq. km. to more than 600,000 sq. km. within the same period, thereby constitute over half (54.5%) of total urban built-up areas in the world by 2030 (Charles, 1989; Shlomo et al., 2005). *Corresponding Author E-mail: [email protected]; Tel: 08058075678
Accordingly, for the past few decades, towns and cities in Nigeria have been growing at a rapid rate both population wise and spatially, due largely to rural-urban migration (Sada and Oguntoyinbo, 1981). According to the Thematic Committee (2001), in 1950, less than 15% of the total population of Nigeria dwelt in urban centres. This rose to 23.4% in 1975 and 43.5% in 2000, and was projected to have risen to above 50% by 2010. By 2005, rapid urbanization and sprawl was estimated to been affecting about 400,000 hectares of vegetated land cover annually (Adesina, 2005). Ujoh et al. (2010) reports that urban sprawl occurred in Abuja between 1991 to 2006, which they attributed to the Federal Government directive that all government ministries, departments and parastatals should move their head offices from Lagos to the new capital; and arguably, “Lagos is expected to be the third largest city in the world” by the year 2015 (Michael, 2009. 73).
However, Karu with an estimated population of 10,000 in 1991 is believed to have grown rapidly to an estimated 50,000 and 130,000 by 2001 and 2010 respectively due
026 Herald J. Geogr. Rgnl. Plann.
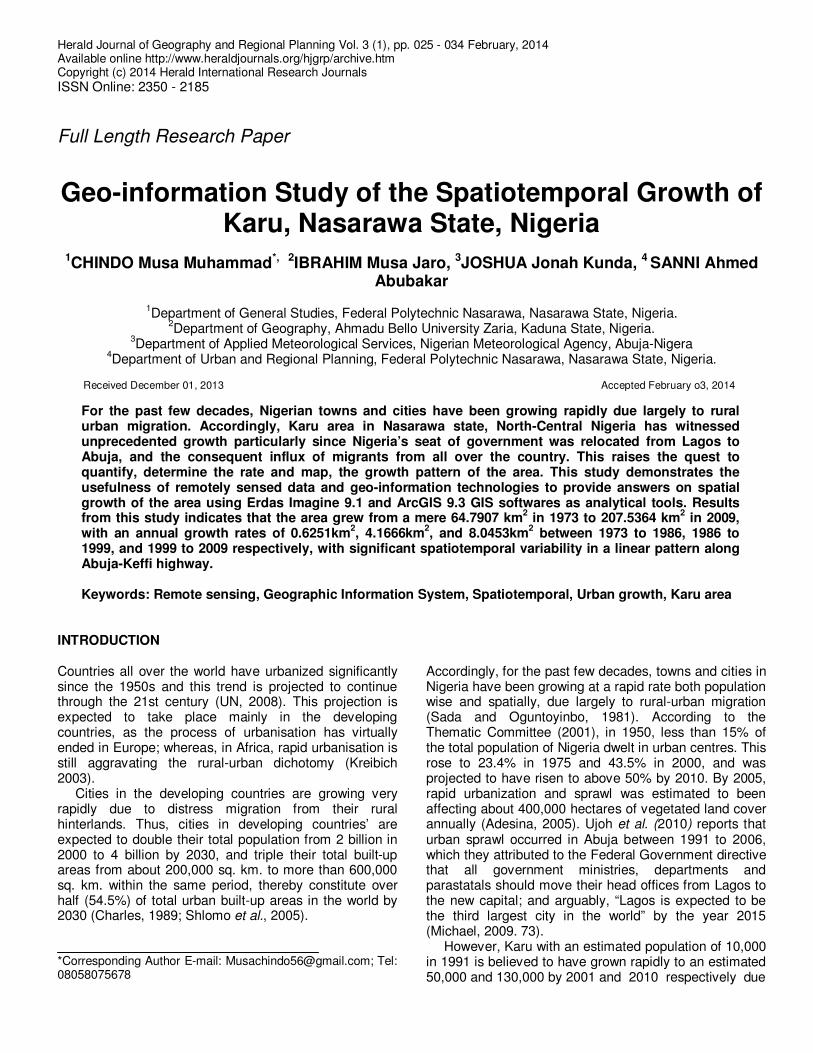
Figure 1. Karu urban area
to continuous migration of people from other parts of the country to this area due to its proximity to Abuja (Yari et al., 2002). Consequently, the area is deemed to have been growing spatially with unsatisfactory urban conditions, shortage of housing and high rental values, environmental degradation, and traffic congestion among other shortcomings. These raise some important questions such as:
• Is there any evidence of spatial growth in Karu?
• What is the growth rate? and
• What is the growth pattern? AIM AND OBJECTIVES The aim of this study was to determine the spatial growth of Karu using Geo-information techniques. The specific objectives were to:
• Determine the spatial growth of Karu
• Determine the growth rates of Karu • Map and describe the growth pattern.
Study area and data sets
Study area Studies on urban growth are now receiving more attention than ever (Bhatta, 2010). This is because planners and decision makers rely on this information to assess the extent, characteristics, and consequences of past and future development (Yang, 2007).
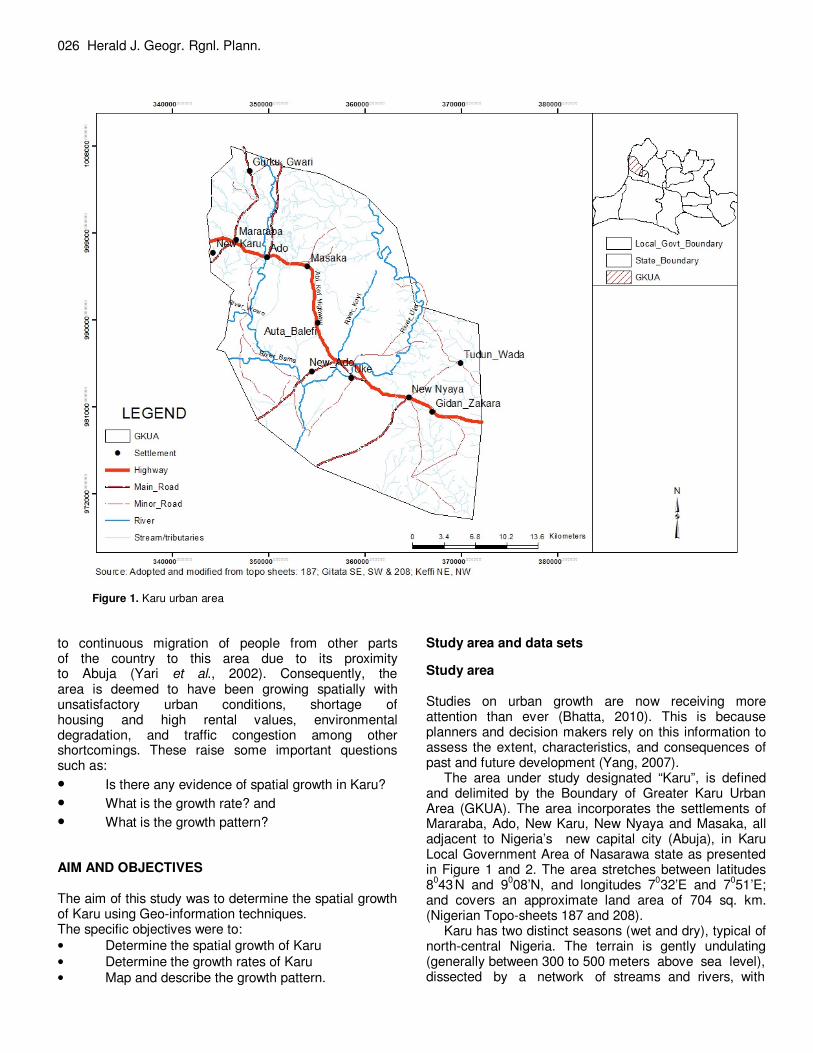
The area under study designated “Karu”, is defined and delimited by the Boundary of Greater Karu Urban Area (GKUA). The area incorporates the settlements of Mararaba, Ado, New Karu, New Nyaya and Masaka, all adjacent to Nigeria’s new capital city (Abuja), in Karu Local Government Area of Nasarawa state as presented in Figure 1 and 2. The area stretches between latitudes 8
043
’N and 9
008’N, and longitudes 7
032’E and 7
051’E;
and covers an approximate land area of 704 sq. km. (Nigerian Topo-sheets 187 and 208).
Karu has two distinct seasons (wet and dry), typical of north-central Nigeria. The terrain is gently undulating (generally between 300 to 500 meters above sea level), dissected by a network of streams and rivers, with
chindo et al. 027
Figure 2. Nasarawa state; karu urban area
Uke and Ado being the major ones. The geological feature is founded on basement complex structure that characterizes much of the country; with the major formation being a combination of different metamorphic, igneous and sedimentary rocks including alluvial deposits found mainly in the stream-beds and consisting largely of sands, gravels and clay. The soils derived from this bedrock structure are generally deep and well drained with high fertility rating and variable run-off potential, with variations mainly along the stream-beds where the soils are higher in clay content (Yari et al., 2002).
The natural vegetation in Karu is of the park savannah type, featuring dense tropical woodland with shrubs and grasses; with variations reflecting the influence of local conditions such as relief, soil, and of late, the effect of human activities. These can be identified as: shrubs dominated savannah with less density in the tree cover and more of grasses and shrubs where cultivation occurs, distinct natural vegetation along stream-beds characteristics of tropical rain forest, and sparse vegetation on the slopes of the hills, especially on the granite rock outcrops. The wildlife population in the bushes of the area comprises of grass cutters, monkeys and antelopes; though the number and composition is now being threatened by mainly deforestation and
hunting (Yari et al., 2002). Karu has a cosmopolitan outlook with many different
ethnic and tribal groups living together in harmony. The major indigenous ethnic groups in the area are Gbagyi, Koro, Yeskwa, Gwandara and Gade. There are many settlers comprising Mada, Eggon, Hausa-Fulani, Igbo, Tiv, Yoruba and many other Nigerian ethnic groups who migrated to take advantage of the economic potentials of this area. Karu has an estimated population of 124,427 (Nasarawa state, 2010) Data set Varied data sets were acquired from both primary and secondary sources. These included base map, Gazette boundary, land use/cover maps and built-up extent of the area between 1970s and 2000s. These were acquired from satellites images, topo maps and official gazette. The satellite images used comprises Landsat Multispectral Scanner (MSS -1973), Landsat Thematic Mapper (TM -1986), Landsat Enhanced Thematic Mapper (ETM -1999), and Nigeriasat1 (Ng_sat1-2009) of row54/path189; all with 28.5 meters resolution. The data intervals were approximately 13 years, and from different
028 Herald J. Geogr. Rgnl. Plann.
Table 1. Land use/cover classification scheme of the study area after Anderson, et al. 1976.
S/N Level I Level II
1 Built-up land Residential; commercial and services; industrial; transportation, communications, and utilities; mixed urban or built-up land.
2 Agricultural land
Cropland and pasture; orchards, groves, vineyards, nurseries, and ornamental; horticultural areas; confined feeding operation; and other agricultural land.
3 Forest land Deciduous, evergreen and mixed forest land.
4 Water body Rivers, streams, lakes, ponds, and reservoirs.
5 Barren land Sandy areas; bare exposed rock; quarries, and gravel pits; transitional areas and mixed barren land
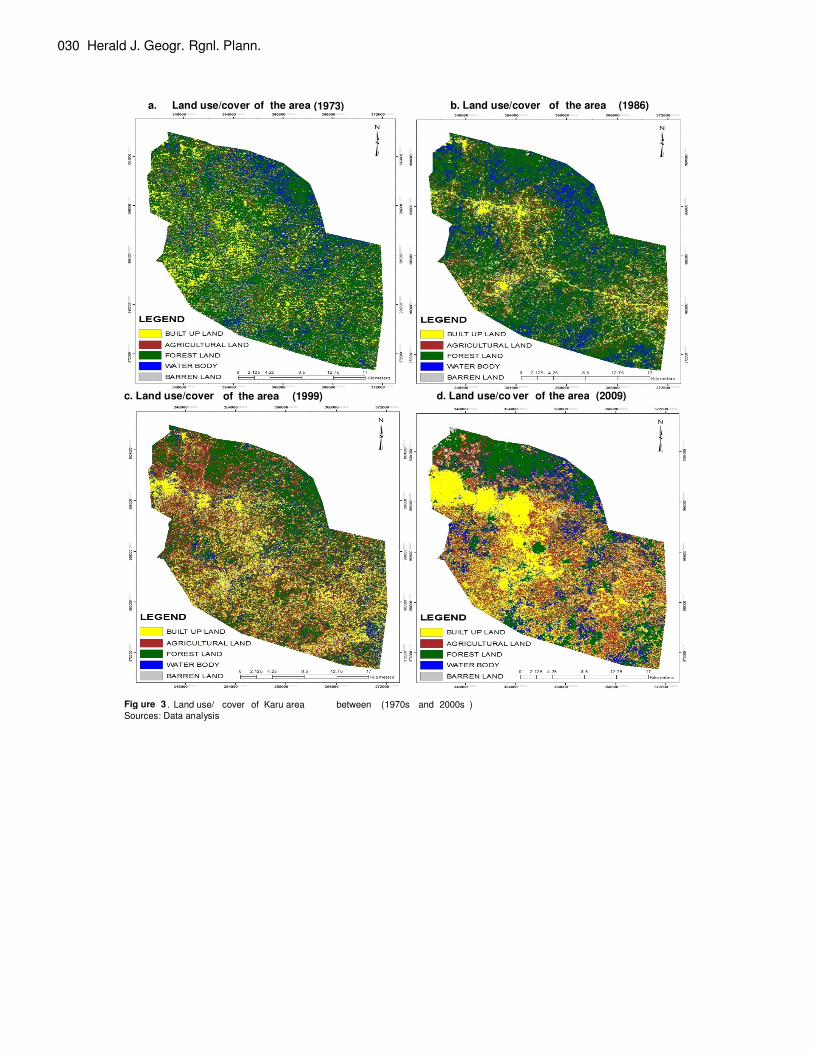
sources due to unavailability of data sets from the same sensor spanning over the study period. The topo maps comprises Nigeria topo-sheets 187 (Gitata south-east and south-west), and sheets 208 (Keffi north-east and north-west) depicting the area on the scale of 1:50,000. METHODOLOGY Reconnaissance survey A thorough reconnaissance survey of the study area was first undertaken in order to have a better perspective of the area, identify relevant geographic elements, and determine the sample places for ground truthing. Data pre-processing Composite bands comprising bands 2.3.4 which conform to Near Infra Red (NIR), Red (R) and Green (G) planes were formed for all the acquired satellite images. In order to avoid distortions, the data sets were projected to Minna Datum Zone 32. Furthermore, the datasets together with all other shape files were clipped using the gazette boundary of the study area to ensure all the shape files and data sets cover the same area (Karu). Image enhancements were also performed for all the satellite images to facilitate image classification. Image classification The satellite images were classified to extract information pertaining to land use/cover between 1970s and 2000s (see figure 3). To achieve this, a land use/cover classification scheme was first developed in-line with Anderson, et al. (1976) (see Table 1). A supervised classification scheme was adopted using maximum likelihood. Training and ground truthing with GPS and high resolution satellite image from Google Earth was carried out to check/verify and correct areas of doubt on
Data analysis To achieve the aim of this study, post classification comparison was used to analyze the classified data sets. This was because the data sets used were from different sensors sources (MSS, TM, ETM and Nigsat1), and thus could not be crossed. Data sets from different sources were however used because of unavailability of data from a particular sensor source through the study period. For example, prior to 1986, only MSS data were available, and by 1999, the TM data had been upgraded to ETM.
In the same vein, post classification comparison was achieved by first determining the total number of pixels in all the images, the areal extent of each pixel, and the number of pixel attributed to all the respective land use/cover classes. These were tabulated, and the growth rates were determined through analysis of pixels representative of the built-up area. The growth pattern was mapped and described by extracting urban land uses from all the land use/cover maps, and described respectively. RESULTS the classified images. Table 2 shows the static land use/cover of Karu area between 1970s and 2000s derived from Landsat-mss (1973), landsat-tm (1986), Landsat-etm (1999), and Nig-sat1 (2009); Row54/Path189 (Figure 3 and 4) Table 3 shows the spatial growths, and rates of growth in Karu area between 1970s and 2000s. Derived from Landsat-mss (1973), Landsat-tm (1986), Landsat-etm (1999), and Nig-sat1 (2009); Row54/Path189. Figure 5 depict the spatial growth of Karu area between 1970s and 2000s, derived from Landsat-mss (1973), Landsat-tm (1986), landsat-etm (1999), and Nigsat1 (2009); Row54/Path189 Figure 6 depict annual growth rates in Karu area between 1970s and 2000s. Derived from Landsat-mss (1973), Landsat-tm (1986), Landsat-etm (1999), and Nig-sat1 (2009); Row54/Path189.
chindo et al. 029
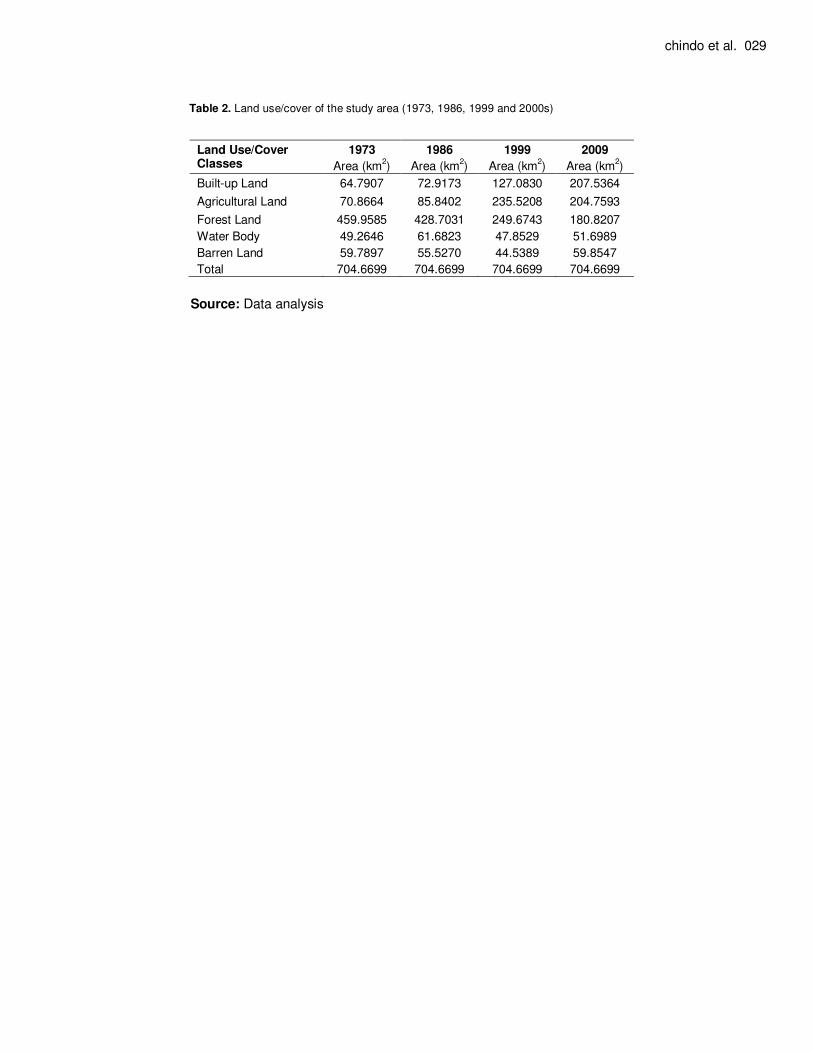
Table 2. Land use/cover of the study area (1973, 1986, 1999 and 2000s)
Source: Data analysis
Land Use/Cover Classes
1973 1986 1999 2009
Area (km2) Area (km
2) Area (km
2) Area (km
2)
Built-up Land 64.7907 72.9173 127.0830 207.5364
Agricultural Land 70.8664 85.8402 235.5208 204.7593
Forest Land 459.9585 428.7031 249.6743 180.8207
Water Body 49.2646 61.6823 47.8529 51.6989
Barren Land 59.7897 55.5270 44.5389 59.8547
Total 704.6699 704.6699 704.6699 704.6699
030 Herald J. Geogr. Rgnl. Plann.
a. Land use/cover of the area (1973)
)
b. Land use/cover of the area (1986)
c. Land use/cover of
f
the area
area
(1999)
)
d. Land use/co ver of the area (2009)
Fig ure
3 .
Land use/ cover
of
Karu area between
(1970s and
2000s )
Sources: Data analysis
chindo et al. 031
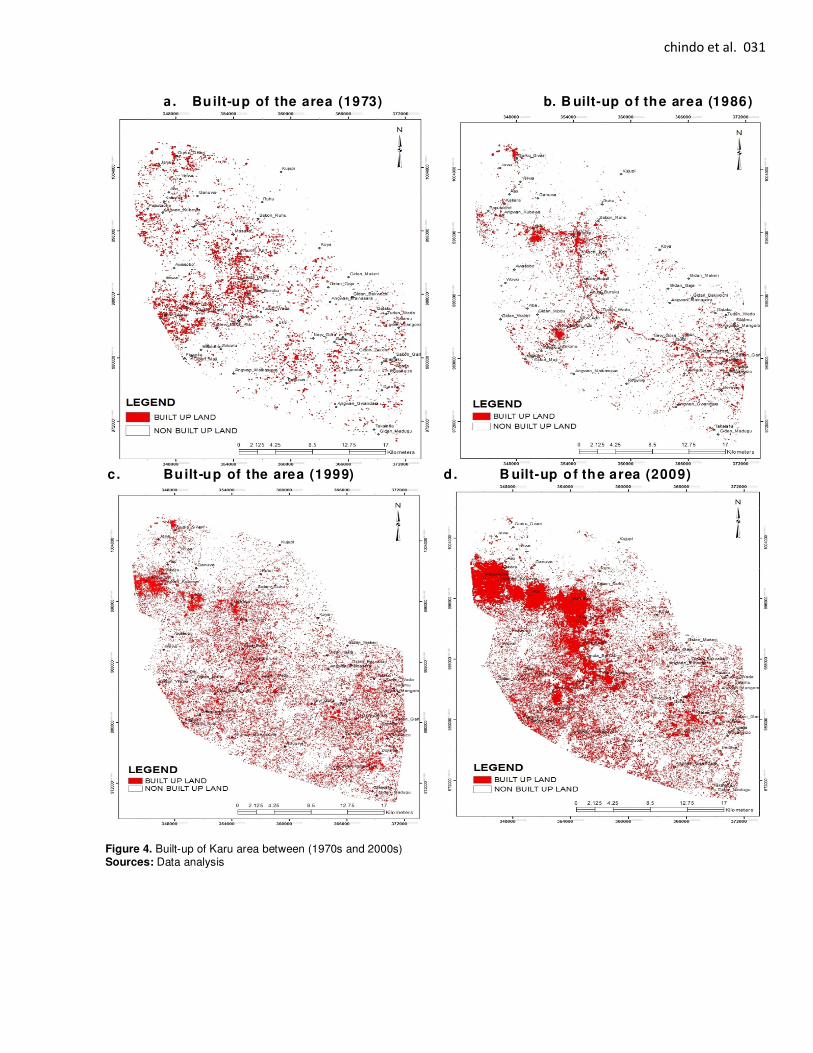
Figure 4. Built-up of Karu area between (1970s and 2000s) Sources: Data analysis
a. Built-up of the area (1973) b. B uilt-up of the area (1986)
c. Built-up of the area (1999) d . B uilt-up of the area (2009)
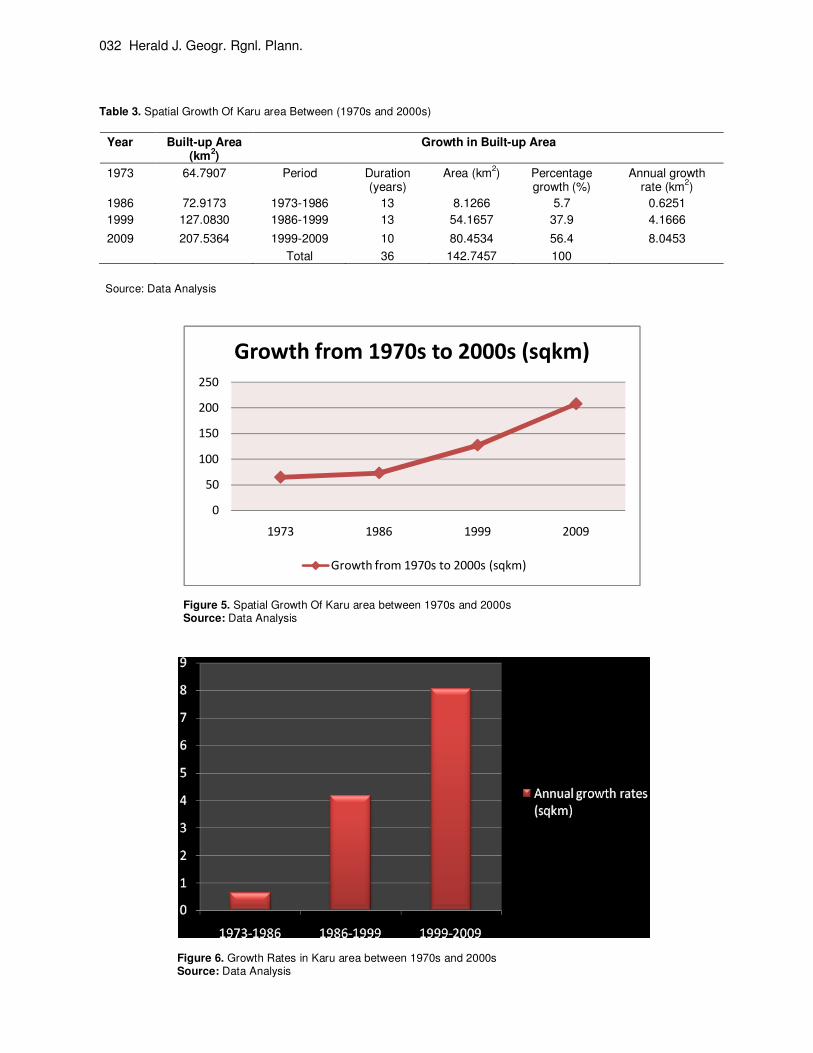
032 Herald J. Geogr. Rgnl. Plann. Table 3. Spatial Growth Of Karu area Between (1970s and 2000s)
Year Built-up Area (km
2)
Growth in Built-up Area
1973 64.7907 Period Duration (years)
Area (km2) Percentage
growth (%) Annual growth
rate (km2)
1986 72.9173 1973-1986 13 8.1266 5.7 0.6251
1999 127.0830 1986-1999 13 54.1657 37.9 4.1666
2009 207.5364 1999-2009 10 80.4534 56.4 8.0453
Total 36 142.7457 100
Source: Data Analysis
Figure 5. Spatial Growth Of Karu area between 1970s and 2000s Source: Data Analysis
Figure 6. Growth Rates in Karu area between 1970s and 2000s Source: Data Analysis
0
50
100
150
200
250
1973 1986 1999 2009
Growth from 1970s to 2000s (sqkm)
Growth from 1970s to 2000s (sqkm)
chindo et al. 033 DISCUSSION The Spatial Growth Of Karu Karu area witnessed a remarkable growth between the 1970s and 2000s; it more than tripled spatially from a mere 64.7907 sq. km. in 1973 to about 207.5364 sq. km. by 2009. However, there seems to exist great spatiotemporal variation in the growth that has taken place. As evident from table 3, between 1973 and 1986, the total built up area in the area increased only by 8.1266 sq. km. at an annual growth rate of 0.625 sq. km.. But between 1986 and 1999, the increase was remarkable having increased by 54.1657 sq. km. with an annual growth rate of 4.1666 sq. km.. Between 1999 and 2009, this sustained growth persisted, and was even more spectacular despite the number of years considered (10 years) relative to the previous intervals of 13 years. The growth was largest between the decade between 1999 and 2009, when the built-up area increased by 80.4534 sq. km., at an annual rate of 8.0453 sq. km. This is however in accord with several suppositions that the proximity of the area to Abuja is responsible for the inconceivable growth that has ensued since the relocation of Nigeria’s seat of government from Lagos to Abuja in 1991.
Growth Patterns Of Karu An appraisal of the growth pattern of Karu area revealed a definite linear growth over the period under consideration. Like several other urban settlements today, growth and distribution of population and human activities within Karu can be characterized as a product of communication and transport developments.
In the 1970s, settlements within what is now known as Karu area were typically rural settlements, scattered over the entire area as evident from figure 4a; by 1980s, there were some development of nucleated settlements around Ado, Masaka, Uke, Auta Balefi, Gora, Gidan Zakara, all along a newly visible linear transport route linking the present FCT (Abuja) and Keffi town in the present Nasarawa state. Similarly, some hinterlands such as Gurku Gwari and New Ado are linked to this major transport route by other visible access routes as evident in figure 4b. The growth of settlements within Karu area was sustained and by 1999 after Nigeria’s seat of government had been successfully moved to Abuja from Lagos, a remarkably defined linear growth pattern with a direction due west towards Abuja emerged along Abuja-Keffi highway. During this time, growth of settlements like Paputache, Agwan Kubewa (now present Maraba) as shown in figure 4c, have picked up to even outstrip settlements like Ado and Masaka which were the evident growth points in the 1980s as in figure 4b. In fact, it is these growth activities that took place during the 1990s and the consequent pressure on the local authority that
led Nasarawa State government to declare Karu area an urban conurbation in 2001.
In the 2000s, growth in Karu area became even more spectacular in favour of the western part of the area, though still along the Abuja-Keffi high way. During this period, growth in this area can still not be unrelated to proximity to Abuja, thus the increased emphasis of western part of the area bordering Abuja, as evident in figure 4d. Thus the resulting pattern of amalgamated linear branch growth that have ensued along Abuja-Keffi highway from 1970s to present, as the vacant lands in between formally nucleated rural settlements are continually being converted to built-up surfaces. CONCLUSION AND RECOMMENDATION This paper demonstrated the feasibility of geo-information sciences/technologies in quantifying urban growths. This was achieved through land use/cover classification and post classification comparison of Landsats and Nigeriansat images. The result indicates that remarkable growth has taken place in a well defined pattern in Karu area between 1970s and 2000s, but with significant spatiotemporal variability. Growth in Karu area has taken a dynamic trend within the last few decades, thereby emphasizing the contemporary trend of urbanization in sub-Saharan Africa.
With the strategic location and the current growth rate of Karu area, further growth is inevitable. Thus an urgent intervention is needed to ensure coordinated growth and development of the area. There is therefore a need for a comprehensive plan that will bring together the analyses of social, economic and physical characteristics; examines special problems and opportunities; coordinates land development with circulation, waste management, water supply, schools and other facilities; proposes ways to accomplish coordinated objectives over time; relates the plan to its impact on public revenue and expenditures; and proposes regulations, policies, and programs for implementing the plan within the area. REFRENCES Adesina FA (2005). Geo-information and Natural Resources
Exploitation in Africa: UN Economic & Social Council. Paper Delivered at the 4
th Meeting of the ‘Committee on Development and
Information’, Addis Ababa. Anderson JR (1976). “A Land Use and Land Cover Classification
System for Use with Remote Sensor Data.” U.S. Geological Survey Professional Paper 964.
Bhatta B (2010) Analysis of Urban Growth and Sprawl from Remote Sensing Data, Advances in Geographic Information Science,
Springer-Verlag Berlin Heidelberg Charles, C. (1989). The New Landscape: Urbanization in The Third
World. Mimar Book.
Kreibich V (2003). Urbanisation: Peasants and ‘Yuppies’ – Unconnected. Paper at KAAD Conference “Worlds Apart: Local and
Global Villages. From Villagization to Globalization in One Generation” Nairobi, 24 – 27 July, 2003.
034 Herald J. Geogr. Rgnl. Plann. Michael P (2009). Urban Geography: A Global Perspective. 3
rd ed,
Taylor & Francis Group, London and New York. Sada PO, Oguntoyinbo JS (1981). Urbanization Processes and
Problems. Ibadan University Press, Ibadan Nigeria. Shlomo A, Stephen CS, Daniel LC (2005). The Dynamics of Global
Urban Expansion. The World Bank, Washinton D. C.
Thematic Committee (2001). “Sustainable Urban Development and Good Governance in Nigeria”. In: Ujoh, F., Kwabe, I. D., and Ifatimehin, O. O. (2010) Understanding Urban Sprawl in The Federal Capital City, Abuja. Towards Sustainable urbanization in Nigeria. Journal of Geography and Regional Planning Vol 3(5). PP. 106-113
Ujoh F, Kwabe ID, Ifatimehin OO (2010). Understanding Urban Sprawl in the Federal Capital City, Abuja: Towards Sustainable Urbanization
. Citation: Chindo MM, Ibrahim MJ, Joshua JK, 4 Sanni A A. (2014).
Geo-information Study of the Spatiotemporal Growth of Karu, Nasarawa State, Nigeria. Herald J. Geogr. Rgnl. Plann Vol. 3 (1), pp. 025 – 034
in Nigeria. Journal of Geography and Regional Planning, 3(5): PP. 106-
113 United Nations-HABITAT (2008). Meeting The Urban Challenges: UN-
HABITAT Donors Meeting, Saville, 15-16 October 2008 Yang X (2007). Integrating Remote Sensing with GIS for Urban Growth
Characterization. In: Bin J. and Xiaobai Y. (Ed.), Geospatial Analysis and Modeling of Urban Structure and Dynamics. The GeoJournal Library, Volume 75, Springer. Chapter 12, PP. 223-250.
Yari K, Madziga B, Sani M (2002). Karu Governance and Management Institutions, Landuse Management and Urban Services Management. Karu Cities Alliance Initiative. Technical Report for The UN-HABITAT Component of Karu Development Strategy.