Genomic Organization and Expression Demonstrate Spatial and Temporal Hox Gene Colinearity in the...
17
Genomic Organization and Expression Demonstrate Spatial and Temporal Hox Gene Colinearity in the Lophotrochozoan Capitella sp. I Andreas C. Fro ¨ bius ¤a , David Q. Matus ¤b , Elaine C. Seaver* Kewalo Marine Lab, Pacific Biosciences Research Center, University of Hawaii, Honolulu, Hawaii, United States of America Abstract Hox genes define regional identities along the anterior–posterior axis in many animals. In a number of species, Hox genes are clustered in the genome, and the relative order of genes corresponds with position of expression in the body. Previous Hox gene studies in lophotrochozoans have reported expression for only a subset of the Hox gene complement and/or lack detailed genomic organization information, limiting interpretations of spatial and temporal colinearity in this diverse animal clade. We studied expression and genomic organization of the single Hox gene complement in the segmented polychaete annelid Capitella sp. I. Total genome searches identified 11 Hox genes in Capitella, representing 11 distinct paralog groups thought to represent the ancestral lophotrochozoan complement. At least 8 of the 11 Capitella Hox genes are genomically linked in a single cluster, have the same transcriptional orientation, and lack interspersed non-Hox genes. Studying their expression by situ hybridization, we find that the 11 Capitella Hox genes generally exhibit spatial and temporal colinearity. With the exception of CapI-Post1, Capitella Hox genes are all expressed in broad ectodermal domains during larval development, consistent with providing positional information along the anterior–posterior axis. The anterior genes CapI- lab, CapI-pb, and CapI-Hox3 initiate expression prior to the appearance of segments, while more posterior genes appear at or soon after segments appear. Many of the Capitella Hox genes have either an anterior or posterior expression boundary coinciding with the thoracic–abdomen transition, a major body tagma boundary. Following metamorphosis, several expression patterns change, including appearance of distinct posterior boundaries and restriction to the central nervous system. Capitella Hox genes have maintained a clustered organization, are expressed in the canonical anterior–posterior order found in other metazoans, and exhibit spatial and temporal colinearity, reflecting Hox gene characteristics that likely existed in the protostome–deuterostome ancestor. Citation: Fro ¨ bius AC, Matus DQ, Seaver EC (2008) Genomic Organization and Expression Demonstrate Spatial and Temporal Hox Gene Colinearity in the Lophotrochozoan Capitella sp. I. PLoS ONE 3(12): e4004. doi:10.1371/journal.pone.0004004 Editor: Geraldine Butler, University College Dublin, Ireland Received August 1, 2008; Accepted November 21, 2008; Published December 23, 2008 Copyright: ß 2008 Fro ¨ bius et al. This is an open-access article distributed under the terms of the Creative Commons Attribution License, which permits unrestricted use, distribution, and reproduction in any medium, provided the original author and source are credited. Funding: The funders had no role in study design, data collection and analysis, decision to publish, or preparation of the manuscript. David Q. Matus is a Robert Black Fellow of the Damon Runyon Cancer Research Foundation (DRG-1949-07). This work was supported by the National Science Foundation to E. C. S. (IBN00- 94925). Competing Interests: The authors have declared that no competing interests exist. * E-mail: [email protected] ¤a Current address: Institut fu ¨ r Allgemeine und Spezielle Zoologie, Abteilung Entwicklungsbiologie, Justus-Liebig-Universita ¨t Gießen, Gießen, Germany ¤b Current address: Biology Department, Duke University, Durham, North Carolina, United States of America Introduction Hox genes have represented one of the major paradigms of developmental biology for nearly three decades (reviewed in [1,2]). These homeodomain genes encode transcription factors that, via regulation of various downstream genes, are capable of imprinting positional identities on to distinct body domains along the anterior-posterior axis of the animal. Among the most fascinating characteristics of these genes are that Hox genes are organized into clusters in the genome in some animals, and there is a precise relationship between the order of genes in the cluster and the relative postions of expression domains along the anterior– posterior axis of the body, a phenomenon called spatial colinearity (reviewed in [3,4]). Hox genes positioned at the 39 end of the cluster are expressed and pattern the anterior end of the embryo while Hox genes at the 59 end of the cluster pattern the posterior of the embryo. In addition, in several animals (reviewed in [4]), Hox genes exhibit temporal colinearity, and the temporal order of initiation of expression reflects the order of Hox genes in the cluster (e. g., ‘‘anterior’’ genes are expressed earlier than genes with posterior expression domains). Hox genes have been isolated from all major clades of bilaterians and cnidarians that have been studied. The species-specific repertoire, genomic organization, presence or absence of clusters and, in the case of vertebrates, numbers of clusters, and their deployment have formed the basis of models of animal body plan evolution and diversification [5,6]. However, these models have been largely based on studies limited to deuterostomes and ecdysozoans, limiting the inferences that can be made about Hox genes in the protostome/deuterostome ancestor. In a recent review [3], Duboule points out that the discovery of Hox gene clusters in flies and mice quickly led to the assumption that all other animals have such clusters, yet direct demonstration of genomic linkage among Hox genes is far more limited than is generally appreciated. In addition, in animals whose genomes contain a Hox gene cluster, there is significant variation in the level PLoS ONE | www.plosone.org 1 December 2008 | Volume 3 | Issue 12 | e4004
-
Upload
independent -
Category
Documents
-
view
1 -
download
0
Transcript of Genomic Organization and Expression Demonstrate Spatial and Temporal Hox Gene Colinearity in the...

Genomic Organization and Expression DemonstrateSpatial and Temporal Hox Gene Colinearity in theLophotrochozoan Capitella sp. IAndreas C. Frobius¤a, David Q. Matus¤b, Elaine C. Seaver*
Kewalo Marine Lab, Pacific Biosciences Research Center, University of Hawaii, Honolulu, Hawaii, United States of America
Abstract
Hox genes define regional identities along the anterior–posterior axis in many animals. In a number of species, Hox genesare clustered in the genome, and the relative order of genes corresponds with position of expression in the body. PreviousHox gene studies in lophotrochozoans have reported expression for only a subset of the Hox gene complement and/or lackdetailed genomic organization information, limiting interpretations of spatial and temporal colinearity in this diverse animalclade. We studied expression and genomic organization of the single Hox gene complement in the segmented polychaeteannelid Capitella sp. I. Total genome searches identified 11 Hox genes in Capitella, representing 11 distinct paralog groupsthought to represent the ancestral lophotrochozoan complement. At least 8 of the 11 Capitella Hox genes are genomicallylinked in a single cluster, have the same transcriptional orientation, and lack interspersed non-Hox genes. Studying theirexpression by situ hybridization, we find that the 11 Capitella Hox genes generally exhibit spatial and temporal colinearity.With the exception of CapI-Post1, Capitella Hox genes are all expressed in broad ectodermal domains during larvaldevelopment, consistent with providing positional information along the anterior–posterior axis. The anterior genes CapI-lab, CapI-pb, and CapI-Hox3 initiate expression prior to the appearance of segments, while more posterior genes appear ator soon after segments appear. Many of the Capitella Hox genes have either an anterior or posterior expression boundarycoinciding with the thoracic–abdomen transition, a major body tagma boundary. Following metamorphosis, severalexpression patterns change, including appearance of distinct posterior boundaries and restriction to the central nervoussystem. Capitella Hox genes have maintained a clustered organization, are expressed in the canonical anterior–posteriororder found in other metazoans, and exhibit spatial and temporal colinearity, reflecting Hox gene characteristics that likelyexisted in the protostome–deuterostome ancestor.
Citation: Frobius AC, Matus DQ, Seaver EC (2008) Genomic Organization and Expression Demonstrate Spatial and Temporal Hox Gene Colinearity in theLophotrochozoan Capitella sp. I. PLoS ONE 3(12): e4004. doi:10.1371/journal.pone.0004004
Editor: Geraldine Butler, University College Dublin, Ireland
Received August 1, 2008; Accepted November 21, 2008; Published December 23, 2008
Copyright: � 2008 Frobius et al. This is an open-access article distributed under the terms of the Creative Commons Attribution License, which permitsunrestricted use, distribution, and reproduction in any medium, provided the original author and source are credited.
Funding: The funders had no role in study design, data collection and analysis, decision to publish, or preparation of the manuscript. David Q. Matus is a RobertBlack Fellow of the Damon Runyon Cancer Research Foundation (DRG-1949-07). This work was supported by the National Science Foundation to E. C. S. (IBN00-94925).
Competing Interests: The authors have declared that no competing interests exist.
* E-mail: [email protected]
¤a Current address: Institut fur Allgemeine und Spezielle Zoologie, Abteilung Entwicklungsbiologie, Justus-Liebig-Universitat Gießen, Gießen, Germany¤b Current address: Biology Department, Duke University, Durham, North Carolina, United States of America
Introduction
Hox genes have represented one of the major paradigms of
developmental biology for nearly three decades (reviewed in [1,2]).
These homeodomain genes encode transcription factors that, via
regulation of various downstream genes, are capable of imprinting
positional identities on to distinct body domains along the
anterior-posterior axis of the animal. Among the most fascinating
characteristics of these genes are that Hox genes are organized into
clusters in the genome in some animals, and there is a precise
relationship between the order of genes in the cluster and the
relative postions of expression domains along the anterior–
posterior axis of the body, a phenomenon called spatial colinearity
(reviewed in [3,4]). Hox genes positioned at the 39 end of the
cluster are expressed and pattern the anterior end of the embryo
while Hox genes at the 59 end of the cluster pattern the posterior of
the embryo. In addition, in several animals (reviewed in [4]), Hox
genes exhibit temporal colinearity, and the temporal order of
initiation of expression reflects the order of Hox genes in the cluster
(e. g., ‘‘anterior’’ genes are expressed earlier than genes with
posterior expression domains).
Hox genes have been isolated from all major clades of bilaterians
and cnidarians that have been studied. The species-specific
repertoire, genomic organization, presence or absence of clusters
and, in the case of vertebrates, numbers of clusters, and their
deployment have formed the basis of models of animal body plan
evolution and diversification [5,6]. However, these models have
been largely based on studies limited to deuterostomes and
ecdysozoans, limiting the inferences that can be made about Hox
genes in the protostome/deuterostome ancestor. In a recent
review [3], Duboule points out that the discovery of Hox gene
clusters in flies and mice quickly led to the assumption that all
other animals have such clusters, yet direct demonstration of
genomic linkage among Hox genes is far more limited than is
generally appreciated. In addition, in animals whose genomes
contain a Hox gene cluster, there is significant variation in the level
PLoS ONE | www.plosone.org 1 December 2008 | Volume 3 | Issue 12 | e4004

of organization of the cluster. In vertebrates, Hox genes within a
cluster share the same transcriptional orientation, and non-Hox
genes are not interspersed among them [3]. In contrast, in the
ANT-C complex of Drosophila [7] and the Hox cluster of sea
urchins [8], Hox genes are present in both transcriptional
orientations, and the Drosophila ANT-C complex also has non-
Hox genes present within the cluster. Other deuterostomes such as
the larvacean Oikopleura dioica do not have clustered Hox genes [9].
Thus, there is significant variation in genomic organization of Hox
genes even within deuterostomes.
Far less is known about Hox genes in lophotrochozoans.
Although gene fragments have been recovered from a wide range
of lophotrochozoans such as nemerteans, molluscs, flatworms, and
annelids (including echiurans), expression data for Hox genes has
been reported for many fewer species. Such expression studies
include the polychaete annelids Chaetopterus variegates [10], Platynereis
dumerilii, and Nereis virens [11]; the leeches Helobdella robusta,
Helobdella triseralis [12], and Hirudo medicinalis [13–16]; the squid
Euprymna scolopes [17]; the gastropod Haliotis asinina [18]; and the
planarian Dugesia [19–21]. Most of these studies are incomplete,
and expression for the full Hox gene complement within a single
species has not been determined. Genomic organization data is
even more limited. In the platyhelminth parasite Schistosoma
mansoni, fluorescent in situ hybridization analysis of four Hox genes
shows localization to two different chromosomes, supporting the
conclusion that S. mansoni does not have a single Hox cluster [22].
In the nemertean Lineus sanguineus, preliminary analysis shows
hybridization of two Hox genes to the same fragment of genomic
DNA by southerm blot analysis [23]. Thus, for an expected
complement of at least 10 Hox genes in lophotrochozoans [24],
evidence for more than two linked Hox genes has not yet been
reported. The lack of genomic organization and expression data
within a single lophotrochozoan species has seriously limited
analysis of gene order and determination of spatial or temporal
colinearity.
Capitella sp. I is a segmented polychaete annelid with a variable
number of adult body segments. This semi-direct developer
generates 13 segments during larval life. Following a short
nonfeeding pelagic phase, animals undergo metamorphosis, which
is accompanied by body elongation and loss of the ciliated
prototroch, telotroch, and neurotroch. Capitella sp. I juveniles
immediately commence feeding and continue to add segments by
posterior addition. The adult body plan has distinct thoracic and
abdominal regions, although within each region, segments appear
morphologically similar. The gradual formation of more than a
dozen segments during larval development in a several-day period,
the simple induction of metamorphosis, and the addition of
segments from a posterior growth zone during juvenile life enabled
us to study temporal and spatial Hox gene expression at multiple
life history stages and during two different modes of segmentation
not possible in some other polychaete models.
In this study, we present detailed genomic linkage data of the
first lophotrochozoan Hox cluster and expression patterns for these
Hox genes from the polychaete annelid Capitella sp. I during larval
and juvenile stages. We address the following questions: (1) Do the
Capitella sp. I Hox genes exhibit spatial and temporal colinearity?
(2) Are expression patterns observed consistent with possible roles
in establishing positional identity? (3) Is there a correlation
between Hox gene expression with morphological features or
boundaries (e.g., thoracic–abdominal boundary)? (4) Are Hox
genes involved in patterning of the segments added by a localized
posterior growth zone during adult life? (5) Are there common-
alities in Hox gene expression among annelids? (6) Are features of
Hox gene expression in annelids conserved with other metazoans?
Methods
Capitella sp. I CultureA colony of Capitella sp. I was maintained using culture methods
developed by [25] as described [26]. Embryos and larvae [26] and
juveniles [27] of Capitella were collected as previously described.
Cloning of Capitella sp. I Hox GenesFragments of Hox gene orthologs were isolated from either
genomic DNA (gDNA) or an excised lambda ZAPII library
generated from mixed embryonic and larval stages of Capitella sp.
I, and several degenerate primer sets corresponding to the
conserved homeodomain were used in degenerate PCR amplifi-
cations. 117-bp fragments of the central class Hox genes CapI-Dfd,
CapI-Scr, CapI-lox5, CapI-lox4, and CapI-lox2 were amplified with
the primers ELEKEF (59-GARYTNGARAARGARTT-39) and
WFQNRR (59-CKNCKRTTYTGRAACCA-39). A 141-bp frag-
ment of CapI-lb was recovered using the primers NFTNKQLT (59-
AAYTTYACHAAYAARCARYTSAC-39) and WFQNRR, and
CapI-Hox3 (155 bp) with KLARTAYT (59-AAGCTTGCCMG-
NACNGCNTAYAC-39) and WFQNRR. CapI-pb (108 bp) was
recovered by semi-nested PCR with the primers ARTAYT (59-
GCNMGNACNGCNTAYAC-39) and WFQNRR, followed by
ARTAYT and IAASLD (59-TCSARNGARGCRGCDATC-39)
with 1:100 diluted product of the first round as template for a
second PCR reaction. 159-bp fragments of CapI-Post1 and CapI-
Post2 were isolated using the primers RKKRKPY (59-MGIAAR-
AARMGIAARCCNTA-39) and WFQNRR.
Additional sequence for each Hox gene was obtained using gene
specific primers (sequences available upon request) in RACE
(rapid amplification of cDNA ends) reactions in combination with
either mixed embryonic/larval cDNA library as a template or
RACE using the SmartRACE Kit (BD Biosciences). Fragments
were conceptually spliced together and submitted to GenBank as
composite transcripts with the following accession numbers: CapI-
lab, EU196537; CapI-pb, EU196538; CapI-Hox3, EU196539; CapI-
Dfd, EU196540; CapI-Scr, EU196541; CapI-lox5, EU196542; CapI-
Antp, EU196547; CapI-lox4, EU196543; CapI-lox2, EU196544;
CapI-Post2, EU196545; and CapI-Post1, EU196546. Predicted open
reading frames (ORFs) were identified using MacVector. All
degenerate and RACE fragments were cloned into the pGEM-
Teasy vector (Promega) and sequenced at the University of Hawaii
sequencing facility or Macrogen Inc. (South Korea).
Linkage AnalysisThe Capitella sp. I genome (v1.0; Joint Genome Institute,
Department of Energy) was searched using nucleotide sequences
of Hox genes isolated by degenerate PCR. Spidey (http://www.ncbi.
nlm.nih.gov/spidey) was used to compare genomic and previously
isolated cDNA sequences to determine transcription units of
Capitella sp. I Hox genes. Lengths given for introns and exons are
based on these comparisons. Additional exons or introns might not
have been identified due to incomplete RACE products. Scaffold
data were analyzed by Genscan, a gene prediction algorithm
(http://genome.dkfz-heidelberg.de/cgi-bin/GENSCAN/genscan.
cgi), and predicted ORFs were compared with sequences in
GenBank by blastp and tblastn (http://www.ncbi.nlm.nih.gov/
BLAST).
Orthology Assignments and Phylogenetic AnalysesPutative orthology assignments of Capitella sp. I Hox sequences
were made via BLASTX searches of the GenBank database from
the National Center for Biotechnology Informaiton (NCBI). An
amino acid alignment of the 60–amino acid (AA) homeodomain
Capitella Hox Genes
PLoS ONE | www.plosone.org 2 December 2008 | Volume 3 | Issue 12 | e4004

and 12 AAs directly flanking the 39 end of the homeodomain was
generated, and includes representative sequences from acoels and
nemertodermatid flatworms (Symsagittifera roscoffensis, Nemertoderma
westbladii), chaetognaths, an ecdysozoan (Tribolium castaneum
[beetle]), lophotrochozoans (Nereis virens and Capitella sp. I [annelid]
and Euprymna scolopes [mollusk]), and a deuterostome (Branchiostoma
floridae [cephalochordate]). Additional lophotrochozoan paralog
group 7 (PG7) sequences included are from the brachiopod Lingula
anatine and the nemertean Lineus sanguineus. Bayesian phylogenetic
analyses were conducted with MrBayes 3.1.2 [28] using a mixed
amino acid model with gamma, which selected RtRev with a
100% posterior probability with 3,000,000 generations sampled
every 100 generations with 4 chains over 4 independent runs. A
summary tree was produced from the final 23,000 trees
representing 2,300,000 stationary generations per run, and
92,000 trees representing 9,200,000 stationary generations for
the consensus tree. In addition, neighbor joining (NJ) (using mean
AA distances) was conducted with PAUP* v4.0b10 [29]. ProtTest
[30] selected the rtrev+G model, which was used for maximum
likelihood (ML) analyses conducted using RAXML v2.2.1 [31]. An
initial search was conducted in RAXML v2.2.1 using 500 searches
with the rtrev+G model. A consensus of this search is shown in
Figure S3. ML bootstrap analysis was also conducted using
RAXML v2.2.1 with 1,000 iterations. Hox genes were assigned to
paralog groups using the same methodology as Kourakis et al. [32]
and Matus et al. [33], and as discussed in Balavoine et al. [24].
Based on multiple methods of phylogenetic analyses, Capitella Hox
genes cluster with representative orthologous genes from other
taxa. For example, CapI-lab clusters with chaetognath, arthropod,
annelid, cephalochordate, mollusc, and acoel Hox1/lab genes with
100% posterior probability, all belonging to PG1. Alignment is
presented in Figure S1 and available upon request.
Whole Mount In Situ HybridizationStages 2–4 embryos were permeabilized by treatment with
0.5 M sucrose/0.125 M sodium citrate for 3 min, and larvae and
juveniles were relaxed in 1:1 0.37 Mol/l MgCl2/filtered sea water
(FSW) for 15 min prior to fixation in 3.7% formaldehyde in FSW
at 4uC overnight. All stages were washed in phosphate-buffered
saline (PBS) 3 times, dehydrated, and stored in methanol at
220uC. The whole mount in situ hybridization protocol has been
published previously [34]. Linear templates for probe synthesis
were generated by PCR with oligonucleotides against SP6 and T7
promotor regions. Digoxigenin-labeled riboprobes were generated
using the MEGAscript High Yield Transcription Kit (Ambion,
Austin, Texas, United States of America) in the presence of 11-dig-
UTP (Roche). Riboprobes were hybridized to tissue in hybridiza-
tion buffer (50% formamide, 56 SSC [pH 4.5], 50 mg/ml
heparin, 0.1% Tween-20, 1% SDS, and 100 mg/ml sheared
salmon sperm DNA) at 65uC for 72 h, followed by increasingly
stringent washes of SSC to 0.056 SSC. All riboprobes were used
at working concentrations of 3 ng/ml. Riboprobes were generated
from the following fragments: 810-bp 59 RACE fragment for CapI-
lb, 1,023-bp 59 RACE fragment for CapI-pb, 1,337-bp 59 RACE
fragment for CapI-Hox3, 709-bp 59 RACE fragment for CapI-Dfd,
1,116-bp 59 RACE fragment for CapI-Scr, 947-bp 59 RACE
fragment for CapI-lox5, 662-bp 59 RACE fragment for CapI-Antp,
889-bp 59 RACE fragment for CapI-lox2, 1,090-bp 59 RACE-
fragment for CapI-Post2, and a 585-bp 59 RACE fragment, a 532-
bp 39 RACE fragment, and an 883-bp combined fragment were
tested for CapI-Post1 (wells containing CapI-Post1 probes were
extensively overstained). Specimens were analyzed using differen-
tial interference contrast (DIC) optics on a Zeiss Axioskop Plus
microscope, and digital photomicrographs were captured with a
Nikon Coolpix 4500 digital camera (4.0 megapixel). The detailed
protocol is available upon request.
Results
Isolation of Hox Gene Orthologs from Capitella sp. ITo isolate Hox genes from Capitella sp. I, a mixed-stage
embryonic and larval library was screened by PCR using
degenerate primers designed to conserved regions of previously
isolated lophotrochozoan Hox genes for specific Hox classes.
Fragments of 10 Hox genes were recovered. Additional sequence
was retrieved by RACE using gene-specific primers and by
BLAST searches of genomic trace files. An eleventh Capitella sp. I
Hox gene, CapI-Antp, was identified by a directed search of the
Capitella sp. I genome (Joint Genome Institute [JGI]). Lengths of
recovered fragments, predicted ORFs, GenBank accession num-
bers, paralogy groups, and protein ID numbers from the
annotated Capitella sp. I genome project (JGI) are shown in Table 1.
Table 1. Capitella sp. I Hox genes.
Paralogygroup
Genename
59 RACEfragment
39 RACEfragment
Compositetranscript
PredictedORF (a.a.)
Genbankaccession #
Protein ID(JGI)
PG1 CapI-lab 810 bp 781 bp 1562 bp 297 EU196537 219807
PG2 CapI-pb 971 bp - 1006 bp 238 EU196538 94911
PG3 CapI-Hox3 1337 bp 2154 bp 3081 bp 407 EU196539 219808
PG4 CapI-Dfd 709 bp 737 bp 1046 bp 181 EU196540 149640
PG5 CapI-Scr 1116 bp 779 bp 1676 bp 198 EU196541 168122
PG6 CapI-lox5 947 bp 1111 bp 2037 bp 285 EU196542 168125
PG7 CapI-Antp 662 bp - 1481 bp 105 EU196547 94879
PG8 CapI-lox4 818 bp 817 bp 1331 bp 258 EU196543 94902
PG8 CapI-lox2 908 bp 1287 bp 1768 bp 255 EU196544 225442
PG9-14 CapI-Post2 1038 bp 915 bp 1538 bp 285 EU196545 126009
PG9-14 CapI-Post1 585 bp 532 bp 736 bp 177 EU196546 70154
Protein ID numbers are from the Joint Genome Institute annotated genome of Capitella sp. I (http://genome.jgi-psf.org/Capca1/Capca1.home.html). ‘-’ indicates that aRACE fragment was not recovered.doi:10.1371/journal.pone.0004004.t001
Capitella Hox Genes
PLoS ONE | www.plosone.org 3 December 2008 | Volume 3 | Issue 12 | e4004

Orthology Assignments of Capitella sp. I Hox GenesThe Capitella sp. I genome possesses definitive members of all
four classes of Hox genes proposed to be present in the bilaterian
ancestor [32,35], including anterior, PG3, central, and posterior
class genes (Figure 1). Hox genes can be classified both by
phylogenetic analyses and also the presence of diagnostic AA
motifs found within and flanking the highly conserved 60-AA
homeodomain [24,36,37]. Phylogenetic analyses suggest a similar
Figure 1. Orthology assignments for Capitella sp. I Hox genes. Bayesian phylogenetic analysis was conducted using an alignment of the 60–amino acid homeodomain and the 12 amino acids immediately 39 of the homeodomain for representative bilaterian Hox and Parahox genes. Capitellasp. I possesses orthologs for each Hox paralogy group (PG). Sequences from representative species include Tribolium castaneum (ecdysozoan); Nereisvirens, Euprymna scolopes, and Capitella sp. I (lophotrochozoan); Flaccisagitta enflata and Spadella cephaloptera (chaetognath); Symsagitifferaroscoffensis and Nemertoderma westbladii (acoelomorphs); Branchiostoma floridae (deuterostome); and additional PG7 lophotrochozoan sequences(see Methods). Capitella sp. I sequences are delimited by arrows; Capitella sp. I Hox sequences are shown in bold. Numbers above branches indicateBayesian posterior probabilities. Ovals delimit bootstrap support .50 at a node from either neighbor-joining (NJ) or maximum likelihood (ML)analyses, while squares show bootstrap support .50 from both NJ and ML analyses. Colors are unique to each Hox PG. Individual NJ and MLbootstrap consensus trees are shown in Figures S2 and S3, respectively.doi:10.1371/journal.pone.0004004.g001
Capitella Hox Genes
PLoS ONE | www.plosone.org 4 December 2008 | Volume 3 | Issue 12 | e4004

Hox gene complement in Capitella as is found in other
lophotrochozoans (molluscs [17,18], brachiopods [37], nemerteans
[23], platyhelminths [38], and other annelids [11,32,39]). At least
10 distinct Hox genes were previously proposed to comprise the
lophotrochozoan complement [24], and we isolated 11 Capitella sp.
I Hox genes. A total of 11 Hox genes have also been reported for
Nereis virens [11]. Phylogenetic analyses suggest that these 11 genes
can each be assigned to distinct paralog groups (Figure 1),
including two anterior class genes (Labial/Hox1 and Proboscipedia/
Hox2), a single PG3 gene (Hox3/zen), six central class genes (PG4:
Deformed/Hox4; PG5: Sex combs reduced/Hox5; PG6: Lox5/fushitarazu;
PG7: Antennapedia; and PG8: Lox4/Lox2/Ultrabithorax/Abdominal-A)
and two posterior genes (PG9-14: Post1/Post2/AbdB). Capitella sp. I
has a definitive Antp/PG7 gene, which clusters with other
lophotrochozoan, ecdysozoan, and deuterostome central class
genes, including the ecdysozoan Tribolium antp gene (Figure 1).
Notably, CapI-Antp does not cluster with lophotrochozoan lox5,
lox4, or lox2 genes. This suggests that Capitella Antp is a member of
the PG7 genes, which includes other previously identified
orthologs from another polychaete (Nereis Hox7), a brachiopod
(Lingula Antp), and a nemertean (Lineus Hox7); ecdysozoan Antp
genes; a chaeotgnath Hox gene (Flaccisagitta Hox7); and possibly
deuterostome Hox6 and Hox7 genes.
The Capitella sp. I Hox ClusterCapitella sp. I Hox genes are located on three contigs: CapI-lab,
CapI-pb, CapI-Hox3, CapI-Dfd, CapI-Scr, CapI-lox5, CapI-Antp, and
CapI-lox4 are all on scaffold 70 and span 243 kbp (Figure 2). CapI-
lox2 and CapI-Post2 are located on scaffold 292 spanning 21.6 kbp.
Predicted non-Hox genes flank one side of CapI-lab on scaffold 70 and
CapI-Post2 on scaffold 292. In contrast, no genes with similarity to
previously characterized genes were identified between adjacent Hox
genes. The lack of predicted ORFs within the 100-kb 59 of CapI-lox4
(from CapI-lox4 to the end of the scaffold) and 23.4 kb 39 of CapI-lox2
(from CapI-lox2 to the end of the scaffold) is consistent with a larger
Hox cluster in the genome, although we do not currently have direct
evidence of linkage between these two scaffolds. If scaffolds 70 and
292 are linked, the cluster would span at least 345 kb. CapI-Post1 is
on scaffold 33, and predicted non-Hox genes were identified in
proximity to both 59 and 39 of this transcription unit, suggesting that
the Post1-ortholog is not part of the Capitella Hox cluster.
CapI-lab is located at the 39 end of the Hox cluster (Figure 2). Its
6-kb transcription unit is composed of two exons (617 and 872 bp
in size) separated by an 4,569 bp intron. The CapI-pb gene, located
11.6 kb 59 of CapI-lab, contains three exons (544, 254, and
173 bp). The first two are separated by a large intron of 7.7 kb,
and the small second intron (513 bp) is located within the
homeobox. CapI-Hox3 is located 7.6 kb 59 of CapI-pb. This 27.8-kb
transcription unit contains three introns (16.6, 6.7, and 1.4 kb)
separating four exons of 385, 46, 563, and 2,070 bp. CapI-Dfd has
a small transcription unit of 1.5 kb, with two exons of 395 and
651 bp, separated by a 439-bp intron, and is located 33.3 kb 59 of
CapI-Hox3. The 6.2-kb transcription unit of CapI-Scr is 31.4 kb
upstream of CapI-Dfd and consists of two exons of 612 and 876 bp,
separated by a 4.7-kb intron. The CapI-lox5 transcript is composed
of two exons (606 and 1,397 bp) and a single intron of 2 kb,
located 9.4 kb 59 of CapI-Scr. CapI-Antp is located about 17.2 kb 59
of CapI-lox5. The transcription unit of CapI-Antp contains two
exons of 640 and 841 bp separated by a 6-kb intron. The
transcription unit of CapI-lox4 is 4.5 kb and contains a single intron
of 3.2 kb separating two exons of 520 and 756 bp. CapI-lox4 is
located 90.4 kb 59 of CapI-lox5. On scaffold 70, the 5.5-kb CapI-
lox2 transcript contains a single intron of 3.8 kb separating two
exons of 1,169 and 599 bp. CapI-Post2 is located 11.4 kb 59 of
CapI-lox2 and has four exons (602, 143, 582, and 158 bp) and
three introns (122, 2,905, and 147 bp).
Capitella sp. I DevelopmentDevelopment of Capitella sp. I has been described previously
[40–43], and occurs within a parental brood tube. Following
gastrulation and elongation of the embryo along the anterior–
posterior axis, two anterior epidermal thickenings initiate
formation of the bilobed brain, and an anterior invagination at
the ventral midline marks the position of the mouth at late stage 3.
By the beginning of stage 4, two trochal bands, the prototroch and
telotroch, are formed. At stage 5, the first morphologically defined
segments are evident, and within the next 24 h, 10 segments
appear with an anterior–posterior temporal progression [26].
These 10 segments arise from the ventro–lateral region of the larva
and expand dorsally around the body circumference over time
[44]. The presumptive segmental tissue is called the ‘‘bauchplat-
ten’’ or ‘‘belly plates’’ by Eisig [40]. The medial side of the belly
plates on the ventral side of the larva contributes to the ventral
nerve cord (VNC). Additional segments are added from a posterior
growth zone, resulting in a total of 13 larval segments (nine
thoracic segments [T1–T9] and four abdominal segments [A1–
A4]). Capitella sp. I has a nonfeeding larva, and adult gut
morphogenesis occurs during late larval stages, resulting in a
distinct pharynx, esophagus, midgut, and hindgut [45]. By stage 9,
Capitella larvae are competent to undergo metamorphosis,
triggered by stimuli in the sediment. During metamorphosis, the
body loses its trochal bands, elongates, initiates feeding, and
Figure 2. Genomic organization of the Capitella sp. I Hox cluster. A total of 11 Capitella sp. I Hox genes are distributed among three scaffolds.Black lines depict two scaffolds, which contain 10 of the Capitella sp. I Hox genes. The eleventh gene, CapI-Post1, is located on a separate scaffoldsurrounded by ORFs of non-Hox genes (unpublished data). No predicted ORFs were identified between adjacent linked Hox genes. Transcription unitsare shown as boxes denoting exons, connected by lines that denote introns. Transcription orientation is denoted by arrows beneath each box. Colorcoding is the same as that used in Figure 1 for each ortholog.doi:10.1371/journal.pone.0004004.g002
Capitella Hox Genes
PLoS ONE | www.plosone.org 5 December 2008 | Volume 3 | Issue 12 | e4004
becomes limited to a benthic lifestyle. Like other polychaetes,
Capitella is capable of generating new segments at multiple life
history stages, and juveniles continue to grow by posterior addition
of segments. The body has a distinct thoracic region of nine
segments and an abdominal region of comparatively thinner
segments with approximately 55 segments in mature adults.
Larval Expression of Anterior Class Hox genes CapI-laband CapI-pb
Temporal and spatial expression of all Hox genes was analyzed
by whole mount in situ hybridization from early larval stages (stage
4) to 3 d following metamorphosis. Specificity of the probes was
confirmed by processing control larvae and juveniles without
probe or with sense probes. No staining was observed in these
controls (not shown).
During larval development, the CapI-lab transcript is expressed in
a number of distinct tissues. Weak expression is initially detectable at
stage 4 in bilateral anterio–medial domains within the presumptive
segmental tissue. This expression appears prior to segmentation
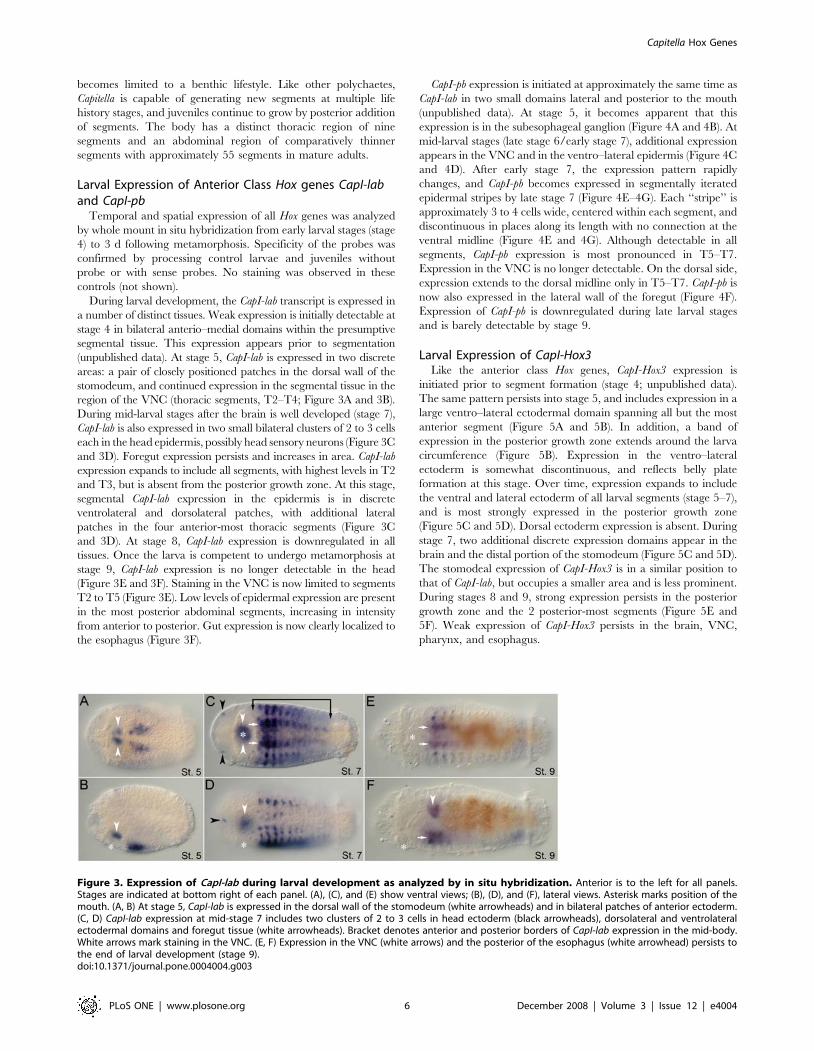
(unpublished data). At stage 5, CapI-lab is expressed in two discrete
areas: a pair of closely positioned patches in the dorsal wall of the
stomodeum, and continued expression in the segmental tissue in the
region of the VNC (thoracic segments, T2–T4; Figure 3A and 3B).
During mid-larval stages after the brain is well developed (stage 7),
CapI-lab is also expressed in two small bilateral clusters of 2 to 3 cells
each in the head epidermis, possibly head sensory neurons (Figure 3C
and 3D). Foregut expression persists and increases in area. CapI-lab
expression expands to include all segments, with highest levels in T2
and T3, but is absent from the posterior growth zone. At this stage,
segmental CapI-lab expression in the epidermis is in discrete
ventrolateral and dorsolateral patches, with additional lateral
patches in the four anterior-most thoracic segments (Figure 3C
and 3D). At stage 8, CapI-lab expression is downregulated in all
tissues. Once the larva is competent to undergo metamorphosis at
stage 9, CapI-lab expression is no longer detectable in the head
(Figure 3E and 3F). Staining in the VNC is now limited to segments
T2 to T5 (Figure 3E). Low levels of epidermal expression are present
in the most posterior abdominal segments, increasing in intensity
from anterior to posterior. Gut expression is now clearly localized to
the esophagus (Figure 3F).
CapI-pb expression is initiated at approximately the same time as
CapI-lab in two small domains lateral and posterior to the mouth
(unpublished data). At stage 5, it becomes apparent that this
expression is in the subesophageal ganglion (Figure 4A and 4B). At
mid-larval stages (late stage 6/early stage 7), additional expression
appears in the VNC and in the ventro–lateral epidermis (Figure 4C
and 4D). After early stage 7, the expression pattern rapidly
changes, and CapI-pb becomes expressed in segmentally iterated
epidermal stripes by late stage 7 (Figure 4E–4G). Each ‘‘stripe’’ is
approximately 3 to 4 cells wide, centered within each segment, and
discontinuous in places along its length with no connection at the
ventral midline (Figure 4E and 4G). Although detectable in all
segments, CapI-pb expression is most pronounced in T5–T7.
Expression in the VNC is no longer detectable. On the dorsal side,
expression extends to the dorsal midline only in T5–T7. CapI-pb is
now also expressed in the lateral wall of the foregut (Figure 4F).
Expression of CapI-pb is downregulated during late larval stages
and is barely detectable by stage 9.
Larval Expression of CapI-Hox3Like the anterior class Hox genes, CapI-Hox3 expression is
initiated prior to segment formation (stage 4; unpublished data).
The same pattern persists into stage 5, and includes expression in a
large ventro–lateral ectodermal domain spanning all but the most
anterior segment (Figure 5A and 5B). In addition, a band of
expression in the posterior growth zone extends around the larva
circumference (Figure 5B). Expression in the ventro–lateral
ectoderm is somewhat discontinuous, and reflects belly plate
formation at this stage. Over time, expression expands to include
the ventral and lateral ectoderm of all larval segments (stage 5–7),
and is most strongly expressed in the posterior growth zone
(Figure 5C and 5D). Dorsal ectoderm expression is absent. During
stage 7, two additional discrete expression domains appear in the
brain and the distal portion of the stomodeum (Figure 5C and 5D).
The stomodeal expression of CapI-Hox3 is in a similar position to
that of CapI-lab, but occupies a smaller area and is less prominent.
During stages 8 and 9, strong expression persists in the posterior
growth zone and the 2 posterior-most segments (Figure 5E and
5F). Weak expression of CapI-Hox3 persists in the brain, VNC,
pharynx, and esophagus.
Figure 3. Expression of CapI-lab during larval development as analyzed by in situ hybridization. Anterior is to the left for all panels.Stages are indicated at bottom right of each panel. (A), (C), and (E) show ventral views; (B), (D), and (F), lateral views. Asterisk marks position of themouth. (A, B) At stage 5, CapI-lab is expressed in the dorsal wall of the stomodeum (white arrowheads) and in bilateral patches of anterior ectoderm.(C, D) CapI-lab expression at mid-stage 7 includes two clusters of 2 to 3 cells in head ectoderm (black arrowheads), dorsolateral and ventrolateralectodermal domains and foregut tissue (white arrowheads). Bracket denotes anterior and posterior borders of CapI-lab expression in the mid-body.White arrows mark staining in the VNC. (E, F) Expression in the VNC (white arrows) and the posterior of the esophagus (white arrowhead) persists tothe end of larval development (stage 9).doi:10.1371/journal.pone.0004004.g003
Capitella Hox Genes
PLoS ONE | www.plosone.org 6 December 2008 | Volume 3 | Issue 12 | e4004

Larval Expression of the Central Class Hox Genes CapI-Dfd, CapI-Scr, CapI-lox5, CapI-Antp, CapI-lox4, and CapI-lox2
In contrast to anterior class Hox genes and Hox3 expression
patterns, central class Hox gene expression is limited to the
segmental ectoderm and growth zone. CapI-Dfd expression is first
detected on both sides of the ventral midline along the medial
border of the belly plates in the presumptive VNC at early stage 5
(Figure 6A and 6B). During segment formation and elongation of
the larva, this expression domain expands posteriorly and laterally.
At stage 7, CapI-Dfd broad ectodermal expression extends from the
posterior half of T2 to the posterior growth zone (Figure 6C and
6D). There is prominent labeling in the VNC and ventro–lateral
sides of the epidermis, and weaker expression in lateral and dorso–
lateral areas. Expression is absent from the dorsal midline
(Figure 6C and 6D). During stages 8 and 9, CapI-Dfd expression
is downregulated. In stage 9 larvae, expression is strongest in T2
and the most posterior segments and growth zone. Lower levels of
expression persist in between these two regions (Figure 6E and 6F).
CapI-Scr expression is initiated as the first segments form in
bilateral domains at the medial border of the belly plates in T3 and
T4 at early stage 5, with weaker expression in the ventro–lateral
ectoderm of these segments (Figure 7A). In mid-larval stages (stage
6), CapI-Scr is expressed in the VNC and ectoderm of T3–T7, most
prominently in T5. Expression extends around the circumference
of the larva, but is limited to T5 at the dorsal midline (Figure 7B
and 7C). Very low levels of expression can be detected in T8 and
Figure 4. Expression patterns of CapI-pb during larval stages. Anterior is to the left for all panels. Stages are indicated at the bottom right ofeach panel. (A), (C), and (E) show ventral views; (B), (D), (F), and (G), lateral views with ventral down. Asterisk marks the position of the mouth. (A, B)CapI-pb expression in two ectodermal clusters, lateral and slightly posterior to the mouth at stage 5 (white arrowheads). (C, D) At the transition fromstage 6 to stage 7, CapI-pb is expressed in the VNC (white arrow), including prominent expression in the subesophageal ganglion (white arrowheads),and ventro-lateral epidermis of all segments (bracket). (E, F) By late stage 7/early stage 8, the trunk has a segmentally iterated ectodermal stripepattern (black arrowhead). Additional CapI-pb expression appears in the foregut (gray arrowhead), Expression persists in the subesophageal ganglion(white arrowhead). (G) Surface view showing segmentally iterated ectodermal stripes of expression, which is most prominent in T5 to T7 (blackarrowhead).doi:10.1371/journal.pone.0004004.g004
Figure 5. Larval expression of CapI-Hox3. Anterior is to the left for all panels. Stages indicated at bottom right of each panel. (A), (C), and (E) showventral views; (B), (D), and (F), lateral views with ventral down. Position of the mouth is marked by an asterisk. (A, B) CapI-Hox3 is expressed in theventrolateral ectoderm of all segments and in the growth zone (stage 5) (gray arrowheads). (C, D) Expression in the lateral epidermis (bracket) andVNC (VNC, white arrows) of all segments, and in the posterior growth zone (gray arrowheads) at stage 7. Black arrowhead marks brain expression.White arrowhead marks expression in the dorsal wall of the stomodeum. (E, F) At late stage 8/early stage 9, expression is prominent in the posteriorsegments and growth zone (gray arrowheads), and weak in the VNC (white arrow), esophagus and pharynx (white arrowheads), and brain (blackarrowhead).doi:10.1371/journal.pone.0004004.g005
Capitella Hox Genes
PLoS ONE | www.plosone.org 7 December 2008 | Volume 3 | Issue 12 | e4004

the abdominal segments after an extended color development
reaction (unpublished data). The same pattern observed at stage 6
persists to stage 8, although at lower levels (Figure 7D).
The CapI-lox5 transcript is first detected at stage 5 in large
ventro–lateral ectodermal domains, extending to the ventral and
posterior borders of the belly plates on both sides of the ventral
midline (Figure 8A and 8B). This expression pattern expands as
additional segments form. A lateral band of expression extends
anterior from the anterior face of the main expression domain
(Figure 8B and 8D). At stage 6, CapI-lox5 expression is mostly
restricted to the ventro–lateral part of the segmental ectoderm with
an anterior expression boundary in the VNC of T4 (Figure 8C).
Laterally positioned patches of cells (one segment wide) in T2 and
T3 are also present, giving the pattern a ‘‘wing-like’’ appearance
(Figure 8D). Expression is downregulated in thoracic and anterior
abdominal segments at early stage 8, with residual expression in the
VNC and ventro–lateral epidermis. More prominent expression is
detected in the ectoderm of the two posterior-most segments and in
the growth zone (Figure 8E and 8F).
CapI-Antp expression is first detectable in the bilobed brain and
presumptive foregut at stage 5 (Figure 9A and 9B). Expression in the
ventro–lateral ectoderm of the posterior half of the trunk appears
soon thereafter, and by stage 7, it has expanded circumferentially to
span the region from T6 to the telotroch (Figure 9C and 9D).
Expression is strongest in the four anterior-most segments of this
domain. Weak expression of CapI-Antp persists in the brain and
foregut. In the transition to stage 8, a posterior expression boundary
appears, and prominent expression becomes limited to the VNC of
segments T5–T8 (Figure 9E and 9F). The anterior expression border
is in the posterior side of T5. Weaker expression is visible in T9 and
lateral ectodermal cells of T5–T8.
CapI-lox4 expression initially appears as a small domain of
ventro–lateral ectodermal cells in the posterior quarter of the mid-
body at stage 5 (Figure 10A). In contrast to most other Capitella Hox
genes, expression is initially absent from the ventral midline and
VNC. At stage 6, expression is predominantly in T7–T9, with
decreasing levels from anterior to posterior (Figure 10B and 10C).
In T7, new expression extends across the ventral midline,
connecting the lateral expression domains. During stage 7,
expression expands posteriorly, across the ventral midline, and
laterally/dorsally. At stage 8, CapI-lox4 is strongly expressed in the
VNC and segmental ectoderm of T7–T9, all abdominal segments,
and the posterior growth zone (Figure 10D and 10E). Expression
also expands to the dorsal side of the body (Figure 10E).
Figure 6. CapI-Dfd larval expression patterns. Anterior is to the left for all panels. Stages are written at the bottom right of each panel. (A), (C),and (E) show ventral views; (B), (D), and (F), lateral views. Asterisk marks position of the mouth. (A, B) At late stage 4, there is ventral ectodermalexpression along the medial border of the belly plates. (C, D) At stage 7, expression includes the VNC (white arrows) and lateral ectoderm from T2 tothe telotroch. (E, F) Expression is most prominent in the VNC of T2 (white arrows) and in the posterior-most segments and growth zone. Low levels ofbody epidermis expression persist.doi:10.1371/journal.pone.0004004.g006
Figure 7. Expression patterns of CapI-Scr during larval stages. Anterior is to the left for all panels. Stages are indicated at bottom right of eachpanel. (A), (B), and (D) show ventral views; (C), lateral view. Asterisk marks position of the mouth. (A) Initiation of CapI-Scr expression at late stage 4straddling the midline in T3 and T4 with weaker ventro-lateral expression in these segments. (B, C) Expression is in the VNC (white arrows) and lateralectoderm in segments T3 to T7 (bracket). (D) Expression at stage 8 is very similar to the pattern at stage 6 (compare with [B]).doi:10.1371/journal.pone.0004004.g007
Capitella Hox Genes
PLoS ONE | www.plosone.org 8 December 2008 | Volume 3 | Issue 12 | e4004

CapI-lox2 expression is initiated slightly after CapI-lox4 during
stage 5; however, detection is possible only after a long staining
reaction (not shown). At stage 6, weak expression of CapI-lox2 is
detectable in the ventro–lateral ectoderm of the abdominal
segments (Figure 11A and 11B). By stage 7, strong expression in
the VNC and ventral and lateral ectoderm extends from A1 to the
Figure 8. Larval expression of CapI-lox5. Anterior is to the left for all panels. Stages are indicated at bottom right of each panel. (A), (C), and (E)show ventral views; (B), (D), and (F), lateral views with ventral down. Mouth is marked by an asterisk. (A, B) Expression in the ventrolateral ectodermextends from T4 to the posterior border of the belly plates at early stage 5. Lateral bands extend rostrally from the broad expression domain (blackarrowhead). (C, D) Expression is in the VNC (white arrows), ventrolateral ectoderm, and in segmentally iterated lateral patches (black arrowheads). (E,F) At stage 8, CapI-lox5 expression becomes most prominent in the VNC (white arrows) and posterior growth zone (gray arrowheads).doi:10.1371/journal.pone.0004004.g008
Figure 9. CapI-Antp expression during larval development. Anterior is to the left for all panels. Stages are at the bottom right of each panel.(A), (C), and (E) show ventral views; (B), (D), and (F), lateral views with ventral down. Asterisk marks the position of the mouth. (A, B) CapI-Antp isexpressed in the posterior half of the mid-body in the ventrolateral ectoderm, the brain (black arrowhead), and the presumptive foregut (whitearrowheads). (C, D) Expression in the VNC (white arrows) and lateral ectoderm spans segments T6 to the telotroch (bracket). Expression is consistentlystrongest in T6 to T8. Weak expression in brain (black arrowhead) and foregut (white arrowhead) is still detectable. (E, F) Expression is largelyrestricted to the VNC of thoracic segments T5 to T9 by stage 8 (white arrows).doi:10.1371/journal.pone.0004004.g009
Figure 10. Larval expression of CapI-lox4. Anterior is to the left for all panels. Stages indicated at bottom right of each panel. (A), (B), and (D)show ventral views; (C) and (E), lateral views with ventral down. Asterisk marks position of the mouth. (A, B) Onset of CapI-lox4 expression at earlystage 5 in a ventro-lateral ectodermal domain in the posterior mid-body. (C, D) By stage 6, expression crosses the midline in T7 and connects the twoventro-lateral domains. (E, F) CapI-lox4 expression is most prominent at stage 8 and includes T7 to T9, all of the abdominal segments, and the growthzone (black bracket). White arrows point to VNC expression (white arrows).doi:10.1371/journal.pone.0004004.g010
Capitella Hox Genes
PLoS ONE | www.plosone.org 9 December 2008 | Volume 3 | Issue 12 | e4004

growth zone (Figure 11C and 11D). Over time, expression
expands into newly formed segments, including all abdominal
segments formed during larval stages (A1–A4; Figure 11E and
11F). CapI-lox2 expression is absent from the dorsal midline.
Larval Expression of the Posterior Class Hox Genes CapI-Post1 and CapI-Post2
CapI-Post1 expression was not detectable in broad ectodermal
expression domains of the larva using any of three different probes,
although expression was observed in the chaetal sacs of developing
chaetae (unpublished data).
CapI-Post2 expression is initiated at the same time as CapI-lox2
(stage 5), although at higher levels. Expression is in bilateral
ectodermal bands of the two abdominal segments present at this
stage (A1 and A2), confined to the ventro–lateral region of these
segments, and absent from the ventral midline (Figure 12A and
12B). As the larva elongates and additional segments form,
expression expands posteriorly (Figure 12C and 12D). During
stage 6 in the anterior-most abdominal segments, expression now
spans the ventral midline, connecting the lateral expression
domains (Figure 12C). Expression gradually expands dorsally but
does not connect at the dorsal midline (Figure 12D). At stage 8,
CapI-Post2 is expressed in the VNC and lateral ectoderm of all
abdominal segments, with an anterior boundary of A1 (Figure 12E
and 12F). In A1, expression is generally limited to the VNC.
Capitella Hox Gene Expression in JuvenilesIn contrast to the broad ectodermal patterns expressed during
larval development, Capitella Hox gene expression in juveniles is
generally restricted to the VNC (Figure 13), with a few notable
exceptions (see below). Hox gene expression in juveniles exhibits
precise anterior and posterior boundaries, and expression is
limited to 4 to 7 segments (Figure 13). In juveniles, the 2 to 3
anterior-most ganglia are out of register with segmental bound-
aries, and straddle adjacent segments. We report expression as it
corresponds to segmental boundaries. The anterior class Hox gene
CapI-lab is expressed from the anterior side of T2 (first ganglion) to
T8. CapI-Dfd shows expression from the posterior side of T2
(second ganglion) to T8. CapI-Hox3 is prominently expressed in the
posterior growth zone, and is also detectable in T2 through T8
(weaker in T2 and T3). The anterior central class genes CapI-Scr
and CapI-lox5 are expressed in segments T3 to T8 and T4 to T8,
respectively. CapI-Antp expression is in segments T5 to T9, and
CapI-lox4 is expressed in T7 to T9 and the anterior abdominal
Figure 11. Larval expression of CapI-lox2. Anterior is to the left for all panels. Stages are written at the bottom right of each panel. (A), (C), and (E)show ventral views; (B), (D), and (F), lateral views with ventral down. The position of the mouth is marked by an asterisk. (A, B) CapI-lox2 expression isin the ventral and ventrolateral part of the ectoderm of the abdominal segments during stage 6. (C, D) By stage 7, expression in the VNC (whitearrows) and ventral and lateral epidermis extends from A1 to the growth zone. (E, F) CapI-lox2 expression at stage 8 includes ectodermal expression inA1 to A4 and the growth zone (black bracket).doi:10.1371/journal.pone.0004004.g011
Figure 12. CapI-Post2 expression in larval stages. Anterior is to the left for all panels. Stages are marked at the bottom right of each panel. (A),(C), and (E) show ventral views; (B), (D), and (F), lateral views with ventral down. The mouth is marked by an asterisk. (A, B) Initial expression is inventrolateral ectodermal bands that span segments A1 and A2 during stage 5. Note absence of expression across the ventral midline. (C, D) By stage6, additional abdominal segments have formed, and these segments also express CapI-Post2. Expression across the ventral midline appears, althoughit is weaker than the lateral expression domains. (E, F) At stage 8, expression is apparent in the VNC (white arrows) and in the ventral and lateralepidermis of all abdominal segments (black bracket).doi:10.1371/journal.pone.0004004.g012
Capitella Hox Genes
PLoS ONE | www.plosone.org 10 December 2008 | Volume 3 | Issue 12 | e4004

segments, A1 to A3. The expression patterns of CapI-lox2 and
CapI-Post2 appear identical; VNC expression is observed in all
abdominal segments. Newly formed ganglia exhibit the strongest
expression of CapI-lox2 and CapI-Post2. CapI-Post1 expression is not
detectable in juveniles. The juvenile expression patterns contrast
with larval patterns for CapI-lab, CapI-pb, CapI-Hox3, CapI-Dfd,
CapI-lox5, and CapI-Antp, which are initially broadly expressed and
share the same posterior boundary (the posterior growth zone). At
late larval stages (stages 8/9), these patterns have been refined, and
in most cases they predict juvenile anterior and posterior
expression boundaries.
In juveniles, only CapI-lab, CapI-pb, and CapI-Hox3 are expressed
outside the VNC. Esophageal CapI-lab expression is limited to the
posterior portion of the esophagus. These CapI-lab–expressing cells
have a neural-like morphology, and are likely a subset of the
stomatogastric nervous system or sensory cells connecting to the
esophagus. The segmental epidermal stripe pattern of CapI-pb
observed in late larval stages persists into juvenile stages, albeit at
lower levels, with the most discrete stripes in T5 to T7. There is
also expression in the prepygidial epidermis. CapI-Hox3 is
expressed prominently in the mesoderm of the posterior growth
zone, and is the only CapI-Hox gene expressed in the posterior
growth zone of juveniles.
Discussion
Capitella sp. I Hox Cluster and Evolution of theLophotrochozoan Hox Cluster
Hox genes form a class of highly conserved genes that play key
roles in body plan regionalization. In addition, in a number of
cases for which genomic information is available, Hox genes
appear in clusters, presumably reflecting their evolutionary origin
by tandem duplication. Although there are several studies of Hox
genes for various annelids (e.g., Chaetopterus [10], Nereis virens [11],
and Helobdella triserealis [12]) and other lophotrochozoans such as
molluscs [17,18,46], nemerteans [23], platyhelminthes [19–21,35],
and brachiopods and priapulids [37], the linkage of Hox genes in
the genome of Capitella sp. I is the first direct evidence of a Hox
cluster in the Lophotrochozoa. Taken together, the presence of a
Hox cluster in Deuterostomia [47–53], Ecdysozoa [54–56], and
our study representing the Lophotrochozoa provides compelling
support for the interpretation that the protostome/deuterostome
ancestor also possessed a Hox gene cluster.
Eight of the 11 Capitella sp. I Hox genes are genomically linked
within a 243-kb region, and two additional Hox genes are linked on a
separate contig (CapI-lox2 and CapI-Post2), spanning 21.6 kb. Only
CapI-Post1 is not clustered with any other Capitella Hox genes.
Therefore, we cannot directly demonstrate the presence of a single
intact cluster containing all Capitella Hox genes. If additional evidence
demonstrates genome linkage between the two contigs containing
multiple Hox genes, this cluster would span at least 345 kb, larger
than vertebrate Hox clusters (70 kb to 180 kb) [57], but much smaller
than some intact arthropod Hox clusters (S. gregaria, 700 kb–2 Mbp
[58]; T. castaneum, 756 kb [59]). All clustered Capitella sp. I Hox genes
are transcribed in the same direction. Furthermore, no additional
predicted genes are identified between adjacent Hox genes,
characteristic of Hox clusters in chordates and Tribolium castaneum
[59]. In contrast, the ANT-C cluster of Drosophila contains multiple
genes between Hox genes, and the transcriptional orientation of Dfd
and ftz is reversed with respect to the order and orientation of other
genes within the complex [7].
The size of Hox transcription units varies greatly among
metazoans. Most Capitella sp. I transcription units are predicted
to be 4.0–6.2 kb, although CapI-Dfd is smaller (1.5 kb), and CapI-pb
and CapI-Hox3 are larger (9.2 kb and 27.8 kb, respectively). In
contrast, Drosophila Hox genes range from 6–70 kb, and Antp is
103 kb [7]. Vertebrate transcription units are much smaller [60],
with the first 9 genes of the human HoxA-cluster ranging from
2.25 kb to 3 kb, with the exception of HoxA3 (20.8 kb).
We also examined the genomic organization of the Capitella sp. I
Parahox genes, whose expression we previously described [27].
CapI-Xlox and CapI-Cdx (transcription unit size of 7 kb and
6.35 kb. respectively) are located approximately 33 kb apart on
the same contig (scaffold 444), whereas CapI-Gsx is on a separate
contig (scaffold 760). In contrast to Capitella Hox genes, CapI-Xlox
and CapI-Cdx have opposite transcriptional orientations. In
addition, there is at least one predicted gene between them, and
Figure 13. Hox gene expression in juveniles. All panels are ventralviews with anterior to the left. Asterisk marks the position of the mouth.Gene names are in the lower left corner of each panel. Age of animalsshown is 3 d after metamorphosis. Capitella Hox gene expressions arelargely limited to a subset of VNC ganglia in juveniles. Exceptionsinclude CapI-Hox3, which is expressed in the prepygidial growth zone(black arrowhead), and CapI-pb, which shows weak epidermal stripes(gray arrowheads).doi:10.1371/journal.pone.0004004.g013
Capitella Hox Genes
PLoS ONE | www.plosone.org 11 December 2008 | Volume 3 | Issue 12 | e4004

several genes flank CapI-Xlox and CapI-Cdx. None of the Parahox
genes are linked to any contigs containing Hox genes. In
vertebrates, the homeodomain-containing genes eve and mox are
linked to the Hox genes, a genomic organization known as the
extended Hox cluster [61]. Capitella sp. I orthologs of eve and mox
are not linked to any of the Capitella Hox genes (Frobius and
Seaver, unpublished data).
Our identification and analyses of 11 Capitella sp. I Hox genes,
including 6 central class members, advances our understanding of
protostome Hox cluster evolution. It has been suggested that the
ancestral protostome Hox cluster contained between 8 and 11 genes
[37]. The imprecision in this number reflects uncertainty in the
timing of specific paralog group duplication events within the
Ecdysozoa and Lophotrochozoa [24]. Although the presence of a
single member of PG1–PG5 in the ancestral protostome Hox cluster
is strongly supported, the evolution of the other central and posterior
class Hox genes is less clear. The identification of a definitive PG7
gene (CapI-Antp) that clusters with several other lophotrochozoan
genes, ecdysozoan Antp, and a chaetognath PG7 gene (Fen Hox7), and
its genomic position between Lox5 and Lox4 in the Capitella Hox
cluster, strongly suggests that a single PG7 class gene was present in
the ancestral protostome cluster. The hypothesis that ecdysozoan ftz
and lophotrochozoan Lox5 genes are PG6 orthologs, and not the
result of clade-specific duplication events [62], is also supported by
our analyses. From our analyses and those of others, there are
currently insufficient data to determine the relationship among PG8
genes (Lox4/Lox2/Ubx/AbdA). Lox4/Lox2 genes do not form a
monophyletic clade in our analyses, although Ubx/AbdA genes do,
suggesting that Lox4 and Lox2 as well as Ubx and AbdA arose by
separate duplication events in lophotrochozoans and ecdysozoans,
respectively [32,37]. With additional sampling in the Ecdysozoa and
Lophotrochozoa, we will likely be able to determine the timing of
these paralog group duplications. Posterior Hox genes appear to be
especially labile (‘‘posterior flexibility’’ [52]), and likely have
independently duplicated in the three bilaterian clades, making it
difficult to determine paralogy. The protostome ancestor likely
possessed a Hox cluster of 9–11 genes, including two anterior class
genes (Labial and pb), a single Hox3 gene, 5 to 6 central class genes
(Dfd, Scr, Lox5/ftz, Antp, and Lox4/Lox2/Ubx/AbdA), and 1 to 2
posterior genes. It is noteworthy that the same 11 Hox genes have
also been reported for the polychaete annelid N. virens [11]. The 11
Hox genes of Capitella sp. I that are arranged into 1 to 2 ‘‘organized
clusters’’ [3] in the genome (except CapI-Post1) share the same
transcriptional orientation, lack non-Hox genes interspersed among
them, and appear to approximate the prototypical and ancestral
organization of the protostome-deuterostome Hox cluster.
Temporal and Spatial Colinearity of Capitella Hox GeneExpression
All 10 clustered Capitella sp. I Hox genes display unique
expression patterns, and their expression is initiated within a
narrow time frame during larval development, which can be
clearly distinguished into four temporal classes (Figure 14B). The
earliest genes to initiate expression are the anterior class Hox genes
CapI-lab and CapI-pb, and CapI-Hox3, which occur before the
morphological appearance of segments. CapI-Dfd and CapI-Scr
expression is initiated shortly afterwards as the first segments
appear, followed by CapI-lox5, CapI-Antp, and CapI-lox4 expression.
The latest Hox genes to initiate expression are CapI-lox2 and CapI-
Post2. Each Capitella sp. I Hox gene exhibit its broadest and highest
expression level at a unique stage, reflecting the order of activation
for each gene. Following this peak of expression, Hox genes are
generally down-regulated, and only weak expression levels are
detectable by the end of larval development. The temporal
sequence of Hox gene activation in Capitella sp. I is correlated with
the sequence of these genes in the genomic cluster, characteristic
of temporal colinearity. In Chaetopterus, the expression of Hox1/lab,
Hox2/pb, Hox3, Hox4/Dfd, and Hox5/Scr [10] exhibits staggered
temporal onset of expression. Presuming a genomic organization
similar to that observed in Capitella, these genes would fit a
temporal colinearity paradigm. In contrast, the onset of Hox gene
Figure 14. Summary of Capitella sp. I spatial and temporal Hoxgene expression in larvae. (A) Schematic of larval expressionpatterns of 10 Hox genes. Patterns illustrated are for a mid-larval stage.Larvae have 13 segments at stage shown. (B) Diagram displaying thetemporal onset of expression for the genes displayed in (A). Verticalstripes indicate persistence of expression into juvenile stages.Schematic of Capitella sp. I ontogenesis following gastrulation is shownat bottom of figure.doi:10.1371/journal.pone.0004004.g014
Capitella Hox Genes
PLoS ONE | www.plosone.org 12 December 2008 | Volume 3 | Issue 12 | e4004

expression in Nereis virens [11], Platynereis dumerilii, and the four Hox
genes characterized in Helobdella (lb, Dfd, Scr, and Antp orthologs
[12]) does not fit a possible temporal colinearity scenerio.
During larval development, Capitella sp. I Hox genes are broadly
expressed in the ectoderm, which is most prominent in (and in
some cases restricted to) the segmental portion of the body. The
anterior-most Hox gene expression boundary is that of CapI-pb,
whose anterior boundary is immediately posterior to the mouth. In
both larval and juvenile stages, anterior boundaries of adjacent
Hox genes are staggered (Figures 14A and 15), displaced by one or
two segments from that of the adjacent gene, which is consistent
with a role in influencing the identity of one or two adjacent
segments. Following the rule of spatial colinearity, anterior
expression borders are generally arranged in the same order from
anterior to posterior as their 39 to 59 genomic position in the
cluster. With the exception of T5, each of the nine thoracic
segments has a unique Hox expression boundary (either anterior or
posterior boundary). In the abdomen, only A1 has a unique Hox
boundary. CapI-pb expression is distinct from the contiguous
ectodermal expression domains of other Hox genes; it has a stripe
pattern in all segments, suggesting involvement a process other
than anterior-posterior patterning. None of the Capitella sp. I Hox
genes is expressed in the unsegmented posterior terminus, in
contrast with pygidial expression of several Hox genes in Nereis and
Platynereis [11]. Our results demonstrate temporal and spatial
colinearity of Hox gene expression in a lophotrochozoan, and are
consistent with an ancestral role for Hox genes in patterning the
antero-posterior axis of the epidermis and central nervous system.
The presence of spatial and temporal colinearity in all three
bilaterian superclades indicates these features were likely present in
the protostome–deuterostome ancestor.
Three exceptions to the rule of spatial colinearity are observed
in Capitella sp. I: the anterior boundary of CapI-pb is displaced
anterior to that of CapI-lb, CapI-Hox3, and CapI-lab have the same
anterior expression boundary, and CapI-lox2 and CapI-Post2 share
the same anterior and posterior boundaries. Both CapI-pb and
CapI-Hox3 also exhibit noncanonical Hox gene expression (see
below). The anterior shift of the Hox2/pb expression boundary
relative to that of Hox1/lab is widely found across taxa, including
vertebrate examples such as mouse and zebrafish [63], and the
polychaetes Chaetopterus and Platynereis. Therefore, this shift may
represent a general feature rather than an exception [10,11],
although arthropods do not appear to show an anterior shift of pb
relative to lab, and Drosophila pb is displaced caudally [64]. Hox1
and Hox3 orthologs also share an anterior expression boundary in
Nereis virens and the spider Cupiennius salei [65]. Leech Hox2/pb and
Hox3 orthologs have not been isolated, and we were unable to
identify them in searches of the Helobdella genome (http://genome.
jgi-psf.org/Helro1/Helro1.home.html). Since there is a gap of
only a single segment between the anterior boundaries of He-Lox7
(Hox1) and He-Lox6 (Hox4), there may be a loss of Hox2 and Hox3
paralogs in the leech genome [12]. Although CapI-lox2 and CapI-
Post2 share the same anterior and posterior expression boundaries
and are adjacent to one another in the genome, their expression
patterns show gene-specific characteristics. CapI-lox2 is expressed
across the ventral midline and in the VNC, where CapI-Post2 is
absent, and the two genes show varying expression levels at their
anterior boundary.
One of the striking findings from our study is the biphasic
nature of Hox gene expression patterns between larval and juvenile
stages in Capitella sp. I. During larval stages, most Hox genes are
broadly expressed in the ectoderm and developing VNC, largely
share a common posterior boundary at the posterior growth zone,
and have gene-specific anterior expression boundaries. In the
transition from larval to juvenile stages, two features of Hox gene
expression change: almost all expression becomes limited to the
VNC, and discrete posterior expression boundaries appear. Gene-
specific larval anterior expression boundaries are maintained into
juvenile stages for all Hox genes except for CapI-Antp, in which the
anterior boundary shifts rostrally by one half-segment. In juveniles,
the expression of each Hox gene spans a few segments, and
adjacent Hox genes show partially overlapping but staggered
domains of expression in the VNC. For CapI-lox2 and CapI-Post2,
newly formed posterior ganglia exhibit the strongest expression,
reminiscent of the slight gradient seen in Nereis virens for these two
genes [11]. Since Capitella sp. I continues to add segments
throughout its life, and undergoes robust posterior regeneration
from multiple axial positions, there may be a need to maintain
axial information into adulthood. Distinct expression patterns
between larval and juvenile stages have not been reported in other
annelids. Chaetopterus Hox genes are expressed in the VNC during
larval development, although expression in juveniles has not been
described [10]. In Nereis, Hox1, Hox4, Hox5, and Lox5 expression
later become more restricted to the VNC in nectochaetes, but
nested central nervous system (CNS) expression does not persist
into juvenile stages [11].
During larval stages, nearly all Capitella sp. I Hox genes are
expressed in the posterior growth zone, a region that generates
larval segments 10–13, and all segments formed after metamor-
phosis. As expression patterns mature during late larval and early
juvenile stages, posterior expression boundaries appear anterior to
the growth zone. Only CapI-Hox3 shows persistent growth zone
expression in juvenile stages. This situation contrasts with a greater
number of Hox genes in Nereis juveniles that exhibit posterior
growth zone expression, including lox2, post2, Hox3, Lox5, Hox7
(Antp), and Lox4. During early larval stages in Chaetopterus, transient
growth zone expression is observed for CH-Hox1, CH-Hox2, CH-
Hox3, CH-Hox4, and CH-Hox5 [10].
Correlation of Hox Expression with MorphologicalBoundaries
Expression boundaries of several Hox genes correlate with the
transition between the thorax and abdomen in Capitella sp. I
(Figure 15). In larvae and juveniles, the anterior expression
boundaries of CapI-lox2 and CapI-Post2 mark the thoracic–
abdominal boundary. After metamorphosis, when distinct poste-
rior expression boundaries appear, CapI-Antp also has a posterior
expression boundary at the thoracic–abdominal junction. CapI-lb,
Hox3, CapI-Dfd, CapI-Scr, and CapI-lox5 all have posterior
boundaries at the anterior edge of T9 in juveniles, although each
gene has a distinct anterior boundary. CapI-lox4 is the only Hox
gene expressed in both thoracic and abdominal tagma, and whose
expression spans the thoracic–abdominal boundary. It is striking
that expression boundaries for 8 of the 10 Hox genes coincide with
either the anterior or posterior side of segment T9, and suggests
that the division between the thorax and abdomen in Capitella sp. I
is a transition zone the width of one segment, rather than a narrow
boundary. The segment T9 has a mix of both thoracic and
abdominal characteristics. The thoracic ganglia are closely spaced
relative to the substantially greater distances between ganglia of
the abdomen; the T9 ganglion shows spacing typical for thoracic
ganglia. However, T9 has hooded hook chaetae, a characteristic of
abdominal segments [66]. Organization of the VNC connectives is
notably different between the thorax and abdomen (unpublished
data), and T9 shows thoracic-like charactistics on the anterior face
of its ganglion and more distinct and widely spaced connectives on
its posterior face, typical of the abdominal ganglia.
Capitella Hox Genes
PLoS ONE | www.plosone.org 13 December 2008 | Volume 3 | Issue 12 | e4004

Capitella Hox Genes
PLoS ONE | www.plosone.org 14 December 2008 | Volume 3 | Issue 12 | e4004

A single posterior boundary shared by multiple Hox genes that
correlates with a major body transition is also observed in other
animals. In Chaetopterus, posterior boundaries of CH-Hox1 and CH-
Hox2 expression coincide with the boundary between tagma A and
B, and the posterior boundary of CH-Hox5 marks the anterior
boundary of the palette segments in tagma B (Figure 15) [10]. In
leeches, the posterior boundary of lox2 and lox4 is at the anterior
edge of the caudal ganglion, a body transition (Figure 15) [12–
14,16]. In spiders, five of the anterior Hox genes share a common
posterior boundary between the prosoma and opistosoma [67].
Noncanonical Expression of Capitella sp. I Hox GenesAlthough all Capitella sp. I Hox genes except Post1 (see below)
show nested sets of trunk ectodermal and neuroectodermal
expression, CapI-lab, CapI-pb, CapI-Hox3, and CapI-Antp have
additional expression domains, some of which are conserved with
other taxa. Both Capitella and Platynereis have Hox1/lab-positive
cells in the head epidermis, although Nereis does not [11]. These
Platynereis Hox1/lab-positive cells are apical tuft cells, a cell type
that neither Nereis nor Capitella have. Hox1/lab expression is
generally restricted to post-oral regions in other animals. CapI-
Hox3 and CapI-Antp are both expressed in the brain. To our
knowledge, expression of Hox3 and Antp orthologs or other Hox
genes in the brain has not been reported for other protostomes.
CapI-lab, CapI-pb, CapI-Hox3, and CapI-Antp are expressed in the
presumptive foregut. Foregut expression of Hox1/lab and Hox2/pb
orthologs is also reported for Chaetopterus [10], and Hox1 is
expressed at the foregut–midgut boundary in Nereis and Platynereis
metatrochophores. To our knowledge, foregut expression of Hox3
and Antp/Hox7 has not been reported for annelids other than
Capitella. Outside annelids, anterior Hox gene expression in the
developing digestive tract is observed in hemichordates [68],
chordates including Branchiostoma [69], and Drosophila [64].
Although foregut tissues originate from different germ layers in
distinct taxa, early expression of anterior class Hox genes associated
with the foregut among deuterostomes, lophotrochozoans, and
ecdysozoans appears to be conserved.
Expression data for Post1 in lophotrochozoans are quite limited.
In the cephalopod Euprymna scolopes, Post1 is expressed in the
developing ganglia of the brachial crown, but direct comparison
with annelids is difficult due to the specialized cephalopod body
plan [17]. Within annelids, Post1 expression has only been
reported for N. virens and P. dumerilii, and is detected in larval
chaetal sacs in both polychaetes [11]. In Capitella sp. I, CapI-Post1 is
not clustered with any other Capitella Hox genes or expressed in
broad ectodermal domains at any stage we examined, although we
observed expression in the chaetal sacs. CapI-Post1 may also be
expressed during life history stages other than those we analyzed, is
likely not involved in vectorial patterning, and may have been
recruited for other functions.
Hox Genes and the Evolution of the Annelid Larval BodyPlan
Expression studies support the hypothesis that ancestral annelids
used Hox genes in vectoral patterning along their main body axis.
Due to its key role in axial patterning and segment identity, it is
thought that Hox cluster evolution is intricately linked with the
evolution of the body plan itself. The five annelids in which Hox
gene expression has been studied have a number of important
species-specific differences relevant to axial patterning. These
differences include direct versus indirect development, differences
in segment number generated during larval and adult stages,
heteronomy versus homonomy, and morphology of the adult body
plan. Chaetopterus exhibits the most complex body regionalization,
with three distinct body regions and a number of segments that
possess unique specialized structures [10]. By contrast, segments in
Nereis and Platynereis are highly uniform, and distinct body regions
are not morphologically distinguishable [70]. The distinct tagma
of Capitella and Helobdella represent an intermediate level of body
regionalization.
These diverse annelid body plans correlate with striking
differences in Hox gene expression patterns. Anterior boundaries
of orthologous Hox genes are not consistently expressed in the
same segments across species (Figure 15). Thus, the use of
molecular criteria to assign homologous segment identity among
annelids may not be possible. In contrast, a common theme across
annelids is the apparent correlation between the presence of
distinct body tagma and the presence of posterior Hox gene
expression boundaries. Posterior expression boundaries in Chae-
topterus correlate with the boundary between regions A and B,
posterior expression boundaries correlate with the thoracic–
abdominal transition in Capitella, and posterior expression
boundaries correspond with the anterior boundary of the caudal
ganglion in the leech. Nereis and Platynereis lack posterior Hox gene
expression boundaries, consistent an absence of morphological
boundaries. Thus, as previously proposed by Irvine [39], the
presence of posterior boundaries of Hox gene expression in
annelids correlates with species-specific body regionalization. If
one assumes that annelids generally exhibit genomic linkage of Hox
genes in the order found in Capitella, the five Hox genes of
Chaetopterus and the clustered Hox genes of Capitella exhibit
temporal colinearity, however, neither Nereis nor Helobdella do
[11,12]. Furthermore, Nereis and Platynereis lack spatial colinearity
of anterior expression boundaries, and only two larval segments
have corresponding Hox gene expression boundaries (Figure 15,
[11]). Nvi-Hox1 and Nvi-Hox3 both have an anterior boundary at
the first setiger, and Nvi-Hox4, Nvi-Hox5, and Nvi-lox5 share an
anterior boundary at the second setiger. Nvi-Hox7, Nvi-Lox4, and
Nvi-Lox2 are localized to the posterior growth zone, and Nvi-Post2
is in the terminal pygidium. Even the direct developing leech
exhibits staggered Hox expression boundaries, although onset of
expression is at late stages and the genomic organization has yet to
be reported [12,13]. If the protostome/deuterostome ancestor
exhibited spatial and temporal colinearity, nereid Hox gene
expression appears to have relaxed regulation of expression,
perhaps reflecting its highly homonomous body plan that lacks
unique segmental identities. The variation in Hox gene expression
among Capitella sp. I, Helobdella, Platynereis, Nereis, and Chaetopterus
emphasizes the importance of comparative studies within a
phylum. Investigations of species with different life histories and
Figure 15. Comparison of Hox gene expression patterns across annelids. Generalized diagram comparing boundaries of Hox geneexpression along the main body axis of Capitella sp. I with expression boundaries in Helobdella, Chaetopterus, and Nereis. Body axis schematics areshown as boxed diagrams next to species names and include segments and tagmata for each species. Solid bars indicate strong expression andstriped bars indicate weaker expression. For Nereis, the anterior border shown is the anterior Hox gene boundary at the earliest stage expressed. Prindicates prostomium; Pe, peristome; and GZ, growth zone. Taxon-specific abbreviations: Capitella: T, thoracic segments; A, abdominal segments; andseg, segments. Chaetopterus: A, B, C, segments of body region A, B, and C, respectively. Helobdella: R, rostral segments; M, medial segments; and C,caudal segments.doi:10.1371/journal.pone.0004004.g015
Capitella Hox Genes
PLoS ONE | www.plosone.org 15 December 2008 | Volume 3 | Issue 12 | e4004

body plans play an important role in revealing insights into how
Hox genes contribute to animal body plan evolution.
Supporting Information
Figure S1 Nexus alignment used in phylogenetic analyses. A 72-
amino acid alignment was constructed using the 60 amino acids of
the homeodomain and the 12 amino acids immediately 39 of the
homeodomain from representative bilaterian taxa representing all
of the Hox and Parahox PGs. Cc indicates Capitella sp. I; Nv, Nereis
virens; Es, Euprymna scolopes; Tc, Tribolium castaneum; Bf, Branchiostoma
floridae; Nw, Nematoderma westbladi; Sr, Symsagitiffera roscofensis; Fen,
Flaccisagitta enflata; Sc, Spadella cephaloptera; Ls, Lineus sanguineus; Dj,
Dugesia japonica; and Lin, Lingula anatina.
Found at: doi:10.1371/journal.pone.0004004.s001 (0.02 MB
PDF)
Figure S2 Neighbor-joining bootstrap consensus tree. A neigh-
bor-joining (NJ) bootstrap consensus tree (using mean amino acid
distances) was constructed using PAUP* v4.0b10 [29] with 1,000
iterations, using a 72-AA alignment of representative bilaterian
Hox and Parahox genes (see Figure S1), including the 60-AA
homeodomain as well as the 12 AAs immeditately flanking the 39
end of the homeodomain. Numbers above branches indicate NJ
bootstrap support, shown as a percentage. New Capitella sp. I
sequences are shown in bold; all Capitella sequences are delimited
by an arrow.
Found at: doi:10.1371/journal.pone.0004004.s002 (0.39 MB TIF)
Figure S3 Maximum likelihood bootstrap consensus tree. A
maximum likelihood (ML) bootstrap consensus tree was construct-
ed using RAXML v2.2.1 [31] using the rtrev+G model of protein
evolution, selected via ProtTest [30]. An initial search of 500
iterations was conducted to determine consistency of recovering
the most likely tree (unpublished data). An additional 1,000
bootstrap iterations were conducted in RAXML v2.2.1. Numbers
above branches indicate ML bootstrap support shown as a
percentage. New Capitella sp. I sequences are shown in bold; all
Capitella sequences are delimited by an arrow.
Found at: doi:10.1371/journal.pone.0004004.s003 (0.40 MB TIF)
Acknowledgments
We gratefully acknowledge Rachael Schwab for generating Hox RACE
fragments for a subset of genes and Olivia Veatch for assistance with
characterization of CapI-Antp. The Capitella sp. I genomic data were
produced by the U.S. Department of Energy Joint Genome Institute.
Author Contributions
Conceived and designed the experiments: ES. Wrote the paper: ES.
Provided funding: ES. Initially conceived of the project: ES. Directly
contributed to acquisition of data and data interpretations: ES. Oversaw
the project: ES. Made substantial contributions to revisions of the original
draft of the article: ES. Performed the bulk of the acquisition, analysis and
interpretation of the data, including cloning of most Hox genes, analysis of
gene expression patterns and analysis of genomic organization: ACF.
Wrote the first draft of the manuscript: ACF. Performed gene orthology
analysis, generated the corresponding figure and wrote corresponding
section of the results, and provided comments on drafts of the manuscript:
DQM.
References
1. Carroll SB (1995) Homeotic genes and the evolution of arthropods and
chordates. Nature 376: 479–485.
2. Hughes CL, Kaufman TC (2002) Hox genes and the evolution of the arthropod
body plan. Evol Dev 4: 459–499.
3. Duboule D (2007) The rise and fall of Hox gene clusters. Development 134:
2549–2560.
4. Krumlauf R (1994) Hox genes in vertebrate development. Cell 78: 191–201.
5. Ferrier DE, Holland PW (2001) Ancient origin of the Hox gene cluster. Nat Rev
Genet 2: 33–38.
6. Averof M, Akam M (1993) HOM/Hox genes of Artemia: implications for the
origin of insect and crustacean body plans. Curr Biol 3: 73–78.
7. Brown SJ, Fellers JP, Shippy TD, Richardson EA, Maxwell M, et al. (2002)
Sequence of the Tribolium castaneum homeotic complex: the region corresponding
to the Drosophila melanogaster antennapedia complex. Genetics 160: 1067–1074.
8. Cameron RA, Rowen L, Nesbitt R, Bloom S, Rast JP, et al. (2006) Unusual gene
order and organization of the sea urchin hox cluster. J Exp Zoolog B Mol Dev
Evol 306: 45–58.
9. Seo HC, Edvardsen RB, Maeland AD, Bjordal M, Jensen MF, et al. (2004) Hox
cluster disintegration with persistent anteroposterior order of expression in
Oikopleura dioica. Nature 431: 67–71.
10. Irvine SQ, Martindale MQ (2000) Expression patterns of anterior Hox genes in
the polychaete Chaetopterus: correlation with morphological boundaries. Dev Biol
217: 333–351.
11. Kulakova M, Bakalenko N, Novikova E, Cook CE, Eliseeva E, et al. (2007) Hox
gene expression in larval development of the polychaetes Nereis virens and
Platynereis dumerilii (Annelida, Lophotrochozoa). Dev Genes Evol 217: 39–54.
12. Kourakis MJ, Master VA, Lokhorst DK, Nardelli-Haefliger D, Wedeen CJ, et
al. (1997) Conserved anterior boundaries of Hox gene expression in the central
nervous system of the leech Helobdella. Dev Biol 190: 284–300.
13. Wysocka-Diller JW, Aisemberg GO, Baumgarten M, Levine M, Macagno ER
(1989) Characterization of a homologue of bithorax-complex genes in the leech
Hirudo medicinalis. Nature 341: 760–763.
14. Aisemberg GO, Wysocka-Diller J, Wong VY, Macagno ER (1993) Antenna-
pedia-class homebox genes define diverse neuronal sets in the embryonic CNS of
the leech. J Neurobiol 24: 1423–1432.
15. Aisemberg GO, Macagno ER (1994) Lox1, an Antennapedia-class homeobox
gene, is expressed during leech gangliogenesis in both transient and stable
central neurons. Dev Biol 161: 455–465.
16. Wong VY, Aisemberg GO, Gan WB, Macagno ER (1995) The leech homeobox
gene Lox4 may determine segmental differentiation of identified neurons.
J Neurosci 15: 5551–5559.
17. Lee PN, Callaerts P, De Couet HG, Martindale MQ (2003) Cephalopod Hox
genes and the origin of morphological novelties. Nature 424: 1061–1065.
18. Hinman VF, O’Brien EK, Richards GS, Degnan BM (2003) Expression of
anterior Hox genes during larval development of the gastropod Haliotis asinina.
Evol Dev 5: 508–521.
19. Bayascas JR, Castillo E, Munoz-Marmol A, Salo E (1996) Hox genes disobey
colinearity and do not distinguish head from tail during planarian regeneration.Int J Dev Biol Suppl 1: 173S–174S.
20. Bayascas JR, Castillo E, Munoz-Marmol AM, Salo E (1997) Planarian Hox
genes: novel patterns of expression during regeneration. Development 124:141–148.
21. Bayascas JR, Castillo E, Salo E (1998) Platyhelminthes have a hox codedifferentially activated during regeneration, with genes closely related to those
of spiralian protostomes. Dev Genes Evol 208: 467–473.
22. Pierce RJ, Wu W, Hirai H, Ivens A, Murphy LD, et al. (2005) Evidence for adispersed Hox gene cluster in the platyhelminth parasite Schistosoma mansoni. Mol
Biol Evol 22: 2491–2503.
23. Kmita-Cunisse M, Loosli F, Bierne J, Gehring WJ (1998) Homeobox genes in
the ribbonworm Lineus sanguineus: evolutionary implications. Proc Natl AcadSci U S A 95: 3030–3035.
24. de Rosa R, Grenier JK, Andreeva T, Cook CE, Adoutte A, et al. (1999) Hox
genes in brachiopods and priapulids and protostome evolution. Nature 399:772–776.
25. Grassle J, Grassle JF (1976) Sibling species in the marine pollution indicatorCapitella (polychaeta). Science 192: 567–569.
26. Seaver EC, Thamm K, Hill SD (2005) Growth patterns during segmentation in
the two polychaete annelids, Capitella sp. I and Hydroides elegans: comparisons atdistinct life history stages. Evol Dev 7: 312–326.
27. Frobius AC, Seaver EC (2006) ParaHox gene expression in the polychaeteannelid Capitella sp. I. Dev Genes Evol 216: 81–88.
28. Huelsenbeck JP, Ronquist F (2001) MRBAYES: Bayesian inference of
phylogenetic trees. Bioinformatics 17: 754–755.
29. Swofford DL (2000) PAUP*. Phylogenetic Analysis Using Parsimony *and Other
Methods). 4 ed. Sunderland, Massachusetts: Sinauer Associates.
30. Abascal F, Zardoya R, Posada D (2005) ProtTest: selection of best-fit models of
protein evolution. Bioinformatics 21: 2104–2105.
31. Stamatakis A (2006) RAxML-VI-HPC: maximum likelihood-based phylogeneticanalyses with thousands of taxa and mixed models. Bioinformatics 22: 2688–2690.
32. Kourakis MJ, Martindale MQ (2000) Combined-method phylogenetic analysisof Hox and ParaHox genes of the metazoa. J Exp Zool 288: 175–191.
33. Matus DQ, Halanych KM, Martindale MQ (2007) The Hox gene complement
of a pelagic chaetognath, Flaccisagitta enflata. Integr Comp Biol 47: 854–864.
Capitella Hox Genes
PLoS ONE | www.plosone.org 16 December 2008 | Volume 3 | Issue 12 | e4004

34. Seaver EC, Kaneshige LM (2006) Expression of ‘segmentation’ genes during
larval and juvenile development in the polychaetes Capitella sp. I and H. elegans.
Dev Biol 289: 179–194.
35. Cook CE, Jimenez E, Akam M, Salo E (2004) The Hox gene complement of
acoel flatworms, a basal bilaterian clade. Evol Dev 6: 154–163.
36. Sharkey M, Graba Y, Scott MP (1997) Hox genes in evolution: protein surfaces
and paralog groups. Trends Genet 13: 145–151.
37. Balavoine G, de Rosa R, Adoutte A (2002) Hox clusters and bilaterian
phylogeny. Mol Phylogenet Evol 24: 366–373.
38. Balavoine G, Telford MJ (1995) Identification of planarian homeobox sequences
indicates the antiquity of most Hox/homeotic gene subclasses. Proc Natl Acad
Sci U S A 92: 7227–7231.
39. Irvine SQ, Martindale MQ (2001) Comparative analysis of Hox gene expression
in the polychaete Chaetopteus: implications for the evolution of body plan
regionalization. Am Zool 41: 640–651.
40. Eisig H (1899) Zur Entwicklungsgeschichte der Capitelliden. Mitt Zool Stn
Neapel 13: 1–292.
41. Reish DJ (1974) The establishment of laboratory colonies of polychaetous
annelids. Thalass Jugosl 10: 181–195.
42. Bhup R, Marsden JR (1981) The development of the central nervous system in
Capitella capitata (Polychaeta, Annelida). Can J Zool 60: 2284–2295.
43. Werbrock AH, Meiklejohn DA, Sainz A, Iwasa JH, Savage RM (2001) A
polychaete hunchback ortholog. Dev Biol 235: 476–488.
44. Thamm K, Seaver EC (2008) Notch signaling during larval and juvenile
development in the polychaete annelid Capitella sp. I. Dev Biol 320: 304–308.
45. Boyle MJ, Seaver EC (2008) Developmental expression of foxA and gata genes
during gut formation in the polychaete annelid, Capitella sp. I. Evol Dev 10:
89–105.
46. Callaerts P, Lee PN, Hartmann B, Farfan C, Choy DW, et al. (2002) HOX
genes in the sepiolid squid Euprymna scolopes: implications for the evolution of
complex body plans. Proc Natl Acad Sci U S A 99: 2088–2093.
47. Duboule D, Baron A, Mahl P, Galliot B (1986) A new homeo-box is present in
overlapping cosmid clones which define the mouse Hox-1 locus. Embo J 5:
1973–1980.
48. Graham A, Papalopulu N, Lorimer J, McVey JH, Tuddenham EG, et al. (1988)
Characterization of a murine homeo box gene, Hox-2.6, related to the Drosophila
Deformed gene. Genes Dev 2: 1424–1438.
49. Breier G, Dressler GR, Gruss P (1988) Primary structure and developmental
expression pattern of Hox 3.1, a member of the murine Hox 3 homeobox gene
cluster. Embo J 7: 1329–1336.
50. Duboule D, Dolle P (1989) The structural and functional organization of the
murine HOX gene family resembles that of Drosophila homeotic genes. Embo J 8:
1497–1505.
51. Martinez P, Rast JP, Arenas-Mena C, Davidson EH (1999) Organization of an
echinoderm Hox gene cluster. Proc Natl Acad Sci U S A 96: 1469–1474.
52. Ferrier DE, Minguillon C, Holland PW, Garcia-Fernandez J (2000) The
amphioxus Hox cluster: deuterostome posterior flexibility and Hox14. Evol Dev2: 284–293.
53. Garcia-Fernandez J, Holland PW (1994) Archetypal organization of the
amphioxus Hox gene cluster. Nature 370: 563–566.54. Beeman RW (1987) A homoeotic gene cluster in the red flour beetle. Nature
327: 247–249.55. Bender W, Akam M, Karch F, Beachy PA, Peifer M, et al. (1983) Molecular
Genetics of the Bithorax Complex in Drosophila melanogaster. Science 221: 23–29.
56. Kaufman TC, Seeger MA, Olsen G (1990) Molecular and genetic organizationof the antennapedia gene complex of Drosophila melanogaster. Adv Genet 27:
309–362.57. Acampora D, D’Esposito M, Faiella A, Pannese M, Migliaccio E, et al. (1989)
The human HOX gene family. Nucleic Acids Res 17: 10385–10402.58. Ferrier DE, Akam M (1996) Organization of the Hox gene cluster in the
grasshopper, Schistocerca gregaria. Proc Natl Acad Sci U S A 93: 13024–13029.
59. Shippy TD, Ronshaugen M, Cande J, He J, Beeman RW, et al. (2008) Analysisof the Tribolium homeotic complex: insights into mechanisms constraining insect
Hox clusters. Dev Genes Evol 218: 127–139.60. Santini S, Boore JL, Meyer A (2003) Evolutionary conservation of regulatory
elements in vertebrate Hox gene clusters. Genome Res 13: 1111–1122.
61. Minguillon C, Garcia-Fernandez J (2003) Genesis and evolution of the Evx andMox genes and the extended Hox and ParaHox gene clusters. Genome Biol 4:
R12.62. Telford MJ (2000) Evidence for the derivation of the Drosophila fushi tarazu gene
from a Hox gene orthologous to lophotrochozoan Lox5. Curr Biol 10: 349–352.63. Prince VE (1998) Hox Genes and Segmental Patterning of the Vertebrate
Hindbrain. American Zoologist 38: 634–646.
64. Pultz MA, Diederich RJ, Cribbs DL, Kaufman TC (1988) The proboscipedia locusof the Antennapedia complex: a molecular and genetic analysis. Genes Dev 2:
901–920.65. Damen WG, Tautz D (1998) A Hox class 3 orthologue from the spider Cupiennius
salei is expressed in a Hox-gene-like fashion. Dev Genes Evol 208: 586–590.
66. Schweigkofler M, Bartolomaeus T, von Salvini-Plawen L (1998) Ultrastructureand formation of hooded hooks in Capitella capitata (Annelida, Capitellida).
Zoomorphology 118: 117–128.67. Schwager EE, Schoppmeier M, Pechmann M, Damen WG (2007) Duplicated
Hox genes in the spider Cupiennius salei. Front Zool 4: 10.68. Aronowicz JaL JC (2006) Hox gene expression in the hemichordate Saccoglossus
kowalevskii and the evolution of deuterostome nervous systems. Integrative and
Comparative Biology 46: 890–901.69. Schubert M, Yu JK, Holland ND, Escriva H, Laudet V, et al. (2005) Retinoic
acid signaling acts via Hox1 to establish the posterior limit of the pharynx in thechordate amphioxus. Development 132: 61–73.
70. Fischer A, Dorresteijn A (2004) The polychaete Platynereis dumerilii (Annelida): a
laboratory animal with spiralian cleavage, lifelong segment proliferation and amixed benthic/pelagic life cycle. Bioessays 26: 314–325.
Capitella Hox Genes
PLoS ONE | www.plosone.org 17 December 2008 | Volume 3 | Issue 12 | e4004