Pruning of Sensation Mango Trees to Maintain Their Size and ...
Upload
khangminh22Category
view
2download
0
Population genomic analysis of mango (Mangifera indica)suggests a complex history of domestication
Emily J. Warschefsky1 and Eric J. B. von Wettberg1,2
1Biological Sciences, Florida International University, 11200 SW 8th St., Miami, FL 33199, USA; 2Plant and Soil Science, The University of Vermont, 63 Carrigan Drive, Burlington, VT,
USA
Author for correspondence:Emily J. Warschefsky
Tel: +1 604 827 3535Email: [email protected]
Received: 1 September 2018
Accepted: 21 January 2019
New Phytologist (2019) 222: 2023–2037doi: 10.1111/nph.15731
Key words: domestication,Mangiferaindica, perennial crop, population genomics,RADseq.
Summary
� Humans have domesticated diverse species from across the plant kingdom, yet much of our
foundational knowledge of domestication has come from studies investigating relatively few
of the most important annual food crops. Here, we examine the impacts of domestication on
genetic diversity in a tropical perennial fruit species, mango (Mangifera indica).� We used restriction site associated DNA sequencing to generate genomic single nucleotide
polymorphism (SNP) data from 106 mango cultivars from seven geographical regions along
with 52 samples of closely related species and unidentified cultivars to identify centers of
mango genetic diversity and examine how post-domestication dispersal shaped the geo-
graphical distribution of diversity.� We identify two gene pools of cultivated mango, representing Indian and Southeast Asian
germplasm. We found no significant genetic bottleneck associated with the introduction of
mango into new regions of the world. By contrast, we show that mango populations in intro-
duced regions have elevated levels of diversity.� Our results suggest that mango has a more complex history of domestication than previ-
ously supposed, perhaps including multiple domestication events, hybridization and regional
selection. Our work has direct implications for mango breeding and genebank management,
and also builds on recent efforts to understand how woody perennial crops respond to
domestication.
Introduction
Over the past 12 000 yr, humans have domesticated thousands ofspecies from across the plant kingdom (Meyer et al., 2012; Meyer& Purugganan, 2013; Gaut et al., 2015). The process of cropdomestication is a special case of co-evolution that graduallyincreases plant–human interdependence, and results in variouslevels of intensity of cultivation and breeding (Clement, 1999;Zeder, 2006; Pickersgill, 2007). As such, the domestication pro-cess provides tractable systems in which to study convergent evo-lution, gene flow, adaptation, diversification and genomeevolution (e.g. Arnold, 2004; Kovach et al., 2007; Purugganan &Fuller, 2009; Meyer & Purugganan, 2013; Olsen & Wendel,2013; The International Peach Genome Initiative, 2013; Wash-burn et al., 2016). Understanding how these evolutionary forcesimpact crop genetic diversity and characterizing the standinggenetic variation within cultivated germplasm is key to cropimprovement efforts (e.g. Iqbal et al., 2001; Burke et al., 2002;Esquinas-Alc�azar, 2005; Doebley et al., 2006; Pickersgill, 2007;Gross & Olsen, 2010; Miller & Gross, 2011; Kassa et al., 2012).However, our current understanding of plant domestication isfounded on studies of highly domesticated annual staples likecereals and grain legumes (e.g. Singh et al., 1991; Wang et al.,
1999; Matsuoka et al., 2002; Li et al., 2006; Londo et al., 2006;Huang et al., 2012; Hufford et al., 2013; Saintenac et al., 2013;Von Wettberg et al., 2018) and, consequently, there remainmany gaps in our understanding of the broader context ofdomestication – across a wide span of taxonomic and geographi-cal diversity, among species that have undergone different degreesof domestication, and among species with different life-historystrategies (Miller & Gross, 2011; Meyer et al., 2012).
One of the central dogmas of domestication is that cropsundergo an often-severe decrease in genetic diversity in responseto three key bottleneck (or founder) events (Ladizinsky, 1985;Cooper et al., 2001; Doebley et al., 2006; Van de Wouw et al.,2010; Miller & Gross, 2011). During the initial stages of culti-vation, as important traits are selected for or against, crops gen-erally undergo a ‘domestication bottleneck’ (Cooper et al.,2001; Van de Wouw et al., 2010). Compounding the primaryloss of diversity, many crops experience a secondary ‘dispersalbottleneck’ when they are introduced into new geographicalregions (Cooper et al., 2001; Van de Wouw et al., 2010). Soy-bean, for example, was subjected to an intense introduction bot-tleneck when it was introduced from Asia into North America(Hyten et al., 2006). The concept of a dispersal bottleneck isconnected to Vavilov’s premise of crop ‘centers of origin’, which
� 2019 The Authors
New Phytologist� 2019 New Phytologist Trust
New Phytologist (2019) 222: 2023–2037 2023www.newphytologist.com
Research

posits that the geographical origin of a crop contains the great-est variation of morphological types (Vavilov, 1987), therebyimplying a loss of diversity as a crop is dispersed. As breedingand cultivation intensify, some crops suffer a tertiary ‘improve-ment bottleneck’ (Cooper et al., 2001; Van de Wouw et al.,2010). The drastic reductions in diversity incurred during thesethree bottleneck events (primary, secondary, tertiary) can nega-tively impact a crop’s ability to adapt to novel environments,pests and diseases (e.g. Abbo et al., 2003; Esquinas-Alc�azar,2005). However, the relative impacts of each bottleneck varyboth within and among crops, depending in large part on thebiology of the species itself.
Perennial crop species have recently received increased atten-tion highlighting their relatively different trajectories underdomestication compared to annuals (Miller & Gross, 2011; Gautet al., 2015). In general, woody perennials retain greater levels ofgenetic diversity under cultivation than do annual species (Miller& Gross, 2011). For example, recent genome-wide analyses ofpeach (Prunus dulcis) and its close relative almond (Prunuspersica) showed no evidence of genetic bottlenecks associated withdomestication in either species (Velasco et al., 2016), and similarresults have been found for grape (Vitis vinifera; Myles et al.,2011) and apple (Malus x domestica; Gross et al., 2014). The rela-tively weak primary domestication bottleneck observed in manyperennial species is largely a result of characteristics common tothe perennial life history: a long generation time and the predom-inance of self-incompatibility (Miller & Gross, 2011). Theformer means that perennial crops have experienced fewer gener-ations of selection under domestication than their annual coun-terparts (Pickersgill, 2007), whereas the latter explains howperennials maintain high levels of heterozygosity despite the factthat their per-unit-of-time mutation rates are far slower than inannual species (Savolainen & Pyh€aj€arvi, 2007). In addition,clonal propagation techniques common in woody perennial culti-vation allow any individual – including F1 hybrids, triploids andsterile or seedless parthenocarpic individuals – to be preserved forposterity, effectively halting the domestication process in thatclone and potentially limiting the loss of genetic diversity inperennial species (Zohary, 2004; Miller & Gross, 2011). How-ever, not all perennial crops retain high levels of diversity: thetropical species coffee (Coffea arabica), cacao (Theobroma cacao)and pigeonpea (Cajanus cajan) have all experienced significantlosses of diversity during domestication (Anthony et al., 2002;Aerts et al., 2013; Yang et al., 2013; Varshney et al., 2017).
The mango, Mangifera indica L. (Anacardiaceae) is a perennialfruit tree that has been cultivated on the Indian subcontinent foran estimated 4000 yr, where it is called ‘The King of Fruits’(Mukherjee, 1949). This timeline places the domestication ofmango contemporaneously with that of citron (Citrus medica),walnut (Juglans regia), peach (Prunus persica), sweet orange(Citrus x sinensis), lychee (Litchi chinensis), lemon (Citrus limon)and jujube (Ziziphus jujuba), and before that of the other domes-ticated species in the poison ivy family: pistachio (Pistacia vera),cashew (Anacardium occidentale), Peruvian peppertree (Schinusmolle), and jocote (Spondias purpurea) (Meyer et al., 2012).Unpruned, mango trees can reach over 30 m in height and live
for more than a century, producing tons of fruit throughout theirlifetime.
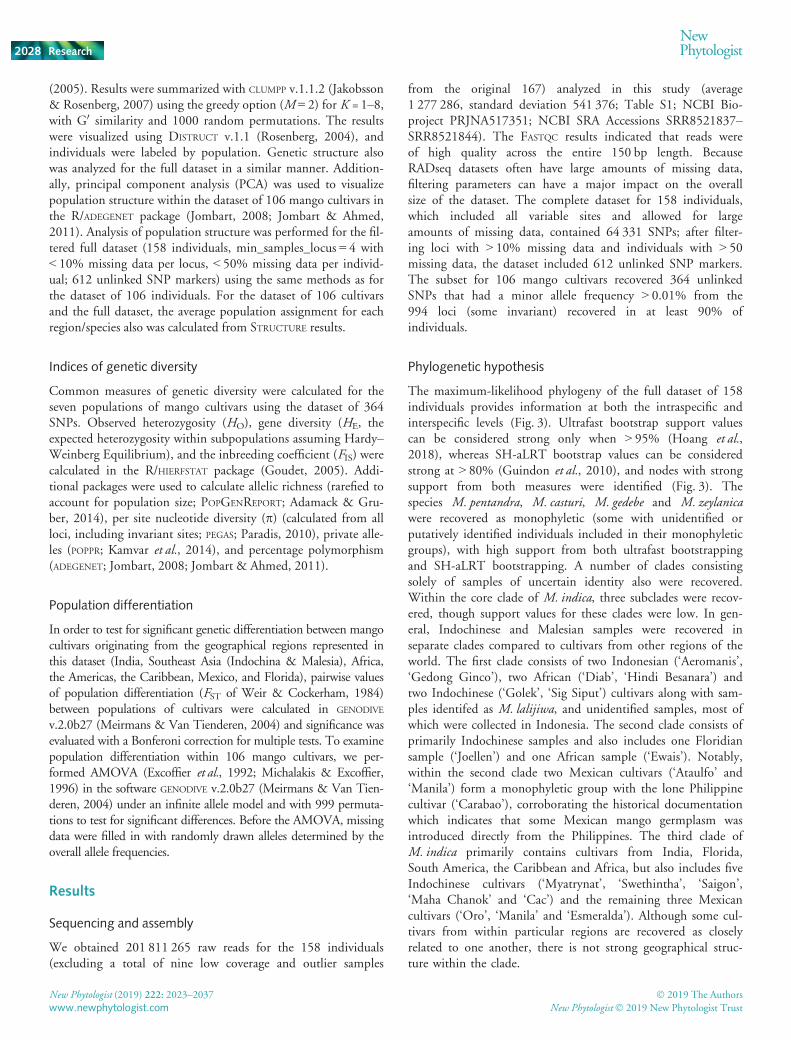
Most authors presuppose a single domestication event for cul-tivated M. indica (DeCandolle, 1884; Mukherjee, 1972; Vavilov,1987; Mukherjee & Litz, 2009; Singh, 2016), and on the basis ofhistorical documents and artifacts, M. indica is thought to havebeen cultivated in India for thousands of years before it was intro-duced elsewhere (Mukherjee, 1949; Fig. 1). Buddhist monkswere likely the first to introduce mango outside its original rangeof cultivation during their trips to Southeast Asia in the 4th and5th centuries (Mukherjee, 1949). The mango began its westwardjourney much later, when Persian traders brought the tree to EastAfrica in the 9th or 10th centuries (Mukherjee, 1949). In the 16thCentury, as global botanical trade continued to grow, the Por-tuguese likely reintroduced the mango into East Africa from theirterritory in Goa (Mukherjee, 1949). The Portuguese would con-tinue to facilitate mango’s range expansion, transporting it toWest Africa, and then to Brazil sometime around 1700 (Pope-noe, 1920; Mukherjee, 1949). From there, mango spreadthroughout the Caribbean, reaching Barbados in 1742 andJamaica by 1782 (Popenoe, 1920; Mukherjee, 1949). As a Span-ish colony, Mexico had an unique history of introductions, withmangoes arriving from the Caribbean as well as directly from thePhilippines, which also was under Spanish rule at the time (Pope-noe, 1920; Mukherjee, 1949). It was not until 1833 that the firstmango reached the shores of Florida (Popenoe, 1920). In the1900s, mango became the subject of intensive breeding programsin South Florida, which produced many of today’s most impor-tant commercial cultivars including ‘Tommy Atkins’, ‘Haden’,‘Keitt’ and ‘Kent’ (Knight et al., 2009). For this reason, SouthFlorida has been termed a secondary center of domestication formango (Knight & Schnell, 1994).
Today, mango is one of the world’s most important fruits andis grown in tropical and subtropical climates across the world(FAO, 2003; FAOSTAT, 2018), with two primary cultivar types,Indian and Indochinese, being differentiated by a suite of mor-phological characters (Crane & Campbell, 1994). Indian culti-vars tend to have an apparent color change when ripe, turningorange or red, and are rounded with fibrous, strong-flavoredflesh. They also generally have a seed that is monoembryonic,producing a single seedling. By contrast, Indochinese cultivarstend to turn yellow or remain green when ripe, display a promi-nent “nose” or “beak”, and have flesh that has little fiber and ismild in flavor. Indochinese cultivars also typically have polyem-bryonic seeds, containing a single zygotic embryo and multipleembryos derived from the maternal nucellar tissue (Mukherjee &Litz, 2009). Nucellar embryony is a rare trait in angiosperms,although the phenomenon has been observed in at least threeother species of Mangifera (M. odorata, M. laurina, M. casturi;(Kostermans & Bompard, 1993; Mukherjee & Litz, 2009; Lim,2012a,b) and is found in another cultivated genus within theorder Sapindales, Citrus (Wang et al., 2017).
Despite its importance as a global food crop and its culturalsignificance in many regions of the world, current ranges of wildM. indica are not well-characterized. Although wild populationshave been reported from northeastern India, Bangladesh, Bhutan
New Phytologist (2019) 222: 2023–2037 � 2019 The Authors
New Phytologist� 2019 New Phytologist Trustwww.newphytologist.com
Research
NewPhytologist2024

and Nepal, and may extend into Myanmar and northern Thai-land (Kostermans & Bompard, 1993), these populations havenot been recently surveyed, have never been studied in a geneticframework and are not represented in germplasm collections any-where in the world. The IUCN’s red list currently categorizeswild M. indica as ‘data deficient’ (IUCN, 2012). Other species inthe genus Mangifera are found from India to the SolomonIslands, with the region of highest diversity in Malesia.
Phylogeographical studies can elucidate the origins of cropsand reveal the impacts of domestication on these species (e.g.Olsen & Schaal, 1999; Salamini et al., 2002; Londo et al.,2006; Gunn et al., 2011; Kassa et al., 2012; Loor Solorzanoet al., 2012). Although a lack of accessible wild M. indica popu-lations precludes investigations of a primary bottleneck associ-ated with the initial domestication of mango, the recent andwell-documented history of mango’s human-mediated migra-tion into new regions of the world provides an opportunity todetermine whether the species experienced a secondary geneticbottleneck during successive founder events. Although manyprevious studies have provided insight into the molecular diver-sity and genetic structure of mango cultivars within specificregions, including Kenya (Sennhenn et al., 2013), Myanmar(Hirano et al., 2010), China (Luo et al., 2011), Colombia(Diaz-Matallana et al., 2009), Brazil (Dos Santos Ribeiro et al.,2012), Iran (Shamili et al., 2012) and, especially, India (Ravis-hankar et al., 2000, 2015; Kumar et al., 2001; Karihaloo et al.,2003; Damodaran et al., 2012; Vasugi et al., 2012; Surapaneniet al., 2013), only a handful have examined mango cultivarsoriginating across a broad geographical range. Works by Sch-nell et al. (2006) and Dillon et al. (2013), both of which usedmicrosatellite markers, found Southeast Asian mango cultivarsto be the most differentiated from other populations, whereasSherman et al. (2015) found population structure betweenAsian and Western mango cultivars using single nucleotidepolymorphisms (SNPs).
Here, we use SNP markers from double digest restriction siteassociated DNA sequencing (ddRADseq; Peterson et al., 2012)to explore geographical patterns of diversity in mango cultivarswithin genebank collections that originated from different geo-graphical regions. As a reduced representation genomic tech-nique, RADseq identifies SNPs from across the genome (Milleret al., 2007; Baird et al., 2008), and has proven to be a useful toolfor investigating population structure and phylogeography innonmodel organisms, including crop species (e.g. Xu et al., 2014;Atchison et al., 2016; Pan et al., 2016; Singh, 2016; Gao et al.,2017; Stetter et al., 2017). We aim to (1) determine the geo-graphical distribution of genetic diversity in mango, (2) testwhether India represents a ‘center of diversity’ for mango, and(3) quantify the secondary genetic bottleneck mango underwentduring its migration to Africa and the Americas. Our work has athree-fold impact, informing management practices for mangogermplasm resources, providing a better understanding of thegenomic impacts of domestication on cultivated mango, andadding to the growing body of literature that seeks to understandhow perennial plants evolve under domestication.
Materials and Methods
Sampling
In order to explore the geographical distribution of genetic diver-sity in mango, we selected 113 cultivars from mango genebanksin South Florida (Fairchild Tropical Botanic Garden (FTBG),US Department of Agriculture’s Subtropical HorticultureResearch Station (USDA)) that originated in seven different geo-graphical regions: India, Southeast Asia (Indochina (Myanmar,Thailand, Cambodia, Laos, Vietnam) and Malesia (Malaysia,Indonesia, the Philippines)), Africa (limited germplasm requiredpooling of all African samples), South America, Mexico, theCaribbean (Cuba, Jamaica, Haiti, the Dominican Republic) and
4th–5th Centuries
17th Century
1700
Mid-1700s
Mid-1800s c. 2000
B.C.E.9th–16th Centuries
Fig. 1 Map of the human-mediated migration of the mango across the globe. Colors represent the geographical populations of mango cultivars analyzedin this study and correspond to labels used throughout the results. Times shown were estimated based on historical documentation (Mukherjee, 1949). Themango is thought to have originated in India, Nepal, Bangladesh, and Bhutan (red), and domesticated in India c. 4000 yr ago. It was first dispersed intoSoutheast Asia (blue, Indochina; green, Malesia) during the 4th–5th centuries BCE, then into East and West Africa (purple) between the 9th and 17th
centuries, South America (Brazil, orange) in 1700, the Caribbean (pink) and Mexico (yellow) during the mid-1700s, and Florida (brown) during themid-1800s. Mexico received introductions both from the Caribbean and from the Philippines.
� 2019 The Authors
New Phytologist� 2019 New Phytologist TrustNew Phytologist (2019) 222: 2023–2037
www.newphytologist.com
NewPhytologist Research 2025

Florida (Fig. 2; Table S1). We attempted to sample the mostmorphologically and geographically diverse and characteristicmangoes from each region, emphasizing historical cultivarswhenever possible. Additionally, we collected leaves of 54 sam-ples of unidentified cultivars of Mangifera indica and closelyrelated Mangifera species from FTBG, Miami-Dade Fruit andSpice Park, Singapore Botanic Garden, Gardens by the Bay (Sin-gapore), Purwodadi Botanic Garden (East Java, Indonesia),Bogor Botanic Garden (West Java, Indonesia), the ForestryResearch Institute of Malaysia (Kepong Malaysia), Pasoh ForestArboretum and Reserve (Simpang Pertang, Malaysia), and indi-vidual collectors (Table S1). Fresh leaf samples were stored at�80°C or dried in silica and stored at 4°C. DNA was extractedfrom each sample using the DNEasy plant mini kit (Qiagen) or,when necessary, a modified CTAB protocol (Doyle & Doyle,1990).
RADseq library preparation and locus assembly
Three ddRADseq libraries were prepared following the protocolof Peterson et al. (2012). The 167 samples for this study werecombined with 121 other samples (sequenced for a complimen-tary study). High molecular weight DNA (300–1000 ng) wasdigested with NlaIII and MluCI (New England Biolabs, Ipswich,MA, USA). Custom-designed oligonucleotides containingunique barcode sequences were ligated onto each individualbefore pooling eight samples into 12 separate sublibraries per lane(36 sublibraries across three lanes total). Pippin Prep (SageScience, Beverly, MA, USA) was used to size-select 350-bp inserts(tight size selection, 425 bp, external marker). Short-cycle PCRwas performed in sextuplicate to amplify and add an uniqueindex to sublibraries, which were then quality-checked on an Agi-lent Bioanalyzer DNA High Sensitivity Chip (Agilent, SantaClara, CA, USA). For libraries where overamplification wasobserved, nontarget DNA was removed by size-selection on Pip-pin Prep, with a subsequent Bioanalyzer quality-check. Each ofthe three libraries was sequenced at The University of SouthernCalifornia’s Genome and Cytometry Core in a rapid run of Illu-mina HiSeq 2500 as a single lane of 150-bp single-end reads.
The program FASTQC v.0.11.4 (Andrews, 2010) was used tocheck the overall quality of raw fastq files for each sublibrary.After demultiplexing reads within each sublibrary based on theindividual barcode, seven individuals from this study wereexcluded based on low sequencing coverage; additionally, twoindividuals were removed from the cultivar dataset after prelimi-nary analysis showed them to be outliers and likely misidentifiedMangifera species. In total, 158 samples were analyzed: 106 sam-ples from known mango cultivars and 52 from closely relatedspecies or unidentified accessions (Table S1).
Raw reads were processed using the ipyRAD bioinformaticpipeline (Eaton, 2014) on Florida International University’s highperformance computing cluster (FIU HPCC) using defaultparameters except for: maxdepth = 1000, max_barcodes_mismatch = 1, filter_adapters = 2, and clust_threshold = 0.95 using denovo clustering. The threshold for clustering reads within andbetween individuals was set to 0.95 to account for previous
reports of high heterozygosity within mango (Sherman et al.,2015; Singh, 2016; Kuhn et al., 2017) and because the fulldataset included closely related Mangifera species. For populationgenetic analysis of the 106 mango cultivars, ipyRAD was used toproduce a file containing a single randomly selected (unlinked)single nucleotide polymorphism (SNP) from each locus fordownstream analyses. To produce a dataset for phylogenetic anal-ysis, which can tolerate relatively large amounts of missing data,we performed filtering (ipyRAD step 7) for the complete datasetof 158 individuals using the parameter min_samples_locus = 33.For analysis of the full dataset of 158 individuals with STRUCTUREsoftware, we used a custom python script to remove loci that had< 10% missing data and individuals < 50% missing data per indi-vidual. Because population genomic analyses are less tolerant ofmissing data than phylogenetic analysis, we filtered the datasetfor the subset of 106 mango cultivars in ipyRAD using theparameter min_samples_locus = 4, then used a custom pythonscript to filter loci that contained > 10% missing data and indi-viduals that had > 50% missing data across all loci, and finallyfiltered out loci with a minor allele frequency < 0.01 using theR/POPPR package (Kamvar et al., 2014).
Phylogenetic analysis
A maximum-likelihood phylogeny for the dataset of 158 individ-uals (min_samples_locus = 33) was estimated from the concate-nated SNP dataset (64 331 variable sites, 40 767 parsimony-informative sites) using IQ-TREE (Nguyen et al., 2015) includingmodel selection performed with an ascertainment bias to correctfor only including variable loci (-m TEST+ASC; Kalyaanamoor-thy et al., 2017), 1000 ultrafast bootstrap replicates (-bb 1000;Hoang et al., 2018) and 1000 bootstrap replicates of the Shi-modaira–Hasegawa approximate likelihood ratio test (-alrt 1000;SH-aLRT; Guindon et al., 2010). The model selection imple-mented in IQ-TREE identified TVM+F+ASC+G4 as the best-fitmodel according to Bayesian Information Criterion (BIC). Thephylogeny was rooted with the species M. gedebe, which has beenidentified as sister to all other sampled species (E. Warschefsky &E.J.B. von Wettberg, unpublished) using the program MESQUITE
(Maddison & Maddison, 2018). The tree was visualized andannotated using the R/APE (Paradis et al., 2004) and R/GGTREE(Yu et al., 2017) packages.
Population structure and admixture
In order to detect population structure and admixture within the106 mango cultivars, K-means clustering was conducted in theBayesian software STRUCTURE v.2.3.4 (Pritchard et al., 2000;Falush et al., 2003; Hubisz et al., 2009). For the dataset, lambdawas estimated by averaging the mean value of lambda with K = 1across 10 independent runs of 100 000 iterations with a 10 000step burn-in period. Using the estimated value of lambda for thedataset, 10 runs of 100 000 iterations followed by a 10 000 stepburn in were performed for K = 1–8. The optimal value of K wasdetermined using STRUCTUREHARVESTER v.0.6.94 (Earl &vonHoldt, 2012) according to the DK method of Evanno et al.
New Phytologist (2019) 222: 2023–2037 � 2019 The Authors
New Phytologist� 2019 New Phytologist Trustwww.newphytologist.com
Research
NewPhytologist2026

Fig. 2 Photographs of fruit from 35 mango cultivars from seven geographical regions (indicated by color bar below photo) included in this study. From leftto right, by row: (1) African cultivars (purple) Hindi Besanara, Piva, Sabre, Diab and Tyler; (2) South American cultivars (orange) Azucar, Fairchild,Lancetilla, Extrema and Vallenato; (3) Caribbean cultivars (pink) Madame Francis, Peach, Baptiste, San Felipe and Number 11; (4) Floridian cultivars(brown) Valencia Pride, Tommy Atkins, Kent, Keitt and Joellen; (5) Indian cultivars (red) Mallika, Langra Benarsi, Alphonso, Royal Special and Totapuri;(6) Phillipine cultivar (green) Carabao, and Mexican cultivars (yellow) Ataulfo, Manilita, Oro and Esmeralda; and (7) Southeast Asian (Malesian) cultivar(green) Aeromanis; Southeast Asian (Indochinese) cultivars (blue) Pyu Pyu Kalay, Nam Doc Mai, Saigon, and Swethintha.
� 2019 The Authors
New Phytologist� 2019 New Phytologist TrustNew Phytologist (2019) 222: 2023–2037
www.newphytologist.com
NewPhytologist Research 2027
(2005). Results were summarized with CLUMPP v.1.1.2 (Jakobsson& Rosenberg, 2007) using the greedy option (M = 2) for K = 1–8,with G0 similarity and 1000 random permutations. The resultswere visualized using DISTRUCT v.1.1 (Rosenberg, 2004), andindividuals were labeled by population. Genetic structure alsowas analyzed for the full dataset in a similar manner. Addition-ally, principal component analysis (PCA) was used to visualizepopulation structure within the dataset of 106 mango cultivars inthe R/ADEGENET package (Jombart, 2008; Jombart & Ahmed,2011). Analysis of population structure was performed for the fil-tered full dataset (158 individuals, min_samples_locus = 4 with< 10% missing data per locus, < 50% missing data per individ-ual; 612 unlinked SNP markers) using the same methods as forthe dataset of 106 individuals. For the dataset of 106 cultivarsand the full dataset, the average population assignment for eachregion/species also was calculated from STRUCTURE results.
Indices of genetic diversity
Common measures of genetic diversity were calculated for theseven populations of mango cultivars using the dataset of 364SNPs. Observed heterozygosity (HO), gene diversity (HE, theexpected heterozygosity within subpopulations assuming Hardy–Weinberg Equilibrium), and the inbreeding coefficient (FIS) werecalculated in the R/HIERFSTAT package (Goudet, 2005). Addi-tional packages were used to calculate allelic richness (rarefied toaccount for population size; POPGENREPORT; Adamack & Gru-ber, 2014), per site nucleotide diversity (p) (calculated from allloci, including invariant sites; PEGAS; Paradis, 2010), private alle-les (POPPR; Kamvar et al., 2014), and percentage polymorphism(ADEGENET; Jombart, 2008; Jombart & Ahmed, 2011).
Population differentiation
In order to test for significant genetic differentiation between mangocultivars originating from the geographical regions represented inthis dataset (India, Southeast Asia (Indochina & Malesia), Africa,the Americas, the Caribbean, Mexico, and Florida), pairwise valuesof population differentiation (FST of Weir & Cockerham, 1984)between populations of cultivars were calculated in GENODIVE
v.2.0b27 (Meirmans & Van Tienderen, 2004) and significance wasevaluated with a Bonferoni correction for multiple tests. To examinepopulation differentiation within 106 mango cultivars, we per-formed AMOVA (Excoffier et al., 1992; Michalakis & Excoffier,1996) in the software GENODIVE v.2.0b27 (Meirmans & Van Tien-deren, 2004) under an infinite allele model and with 999 permuta-tions to test for significant differences. Before the AMOVA, missingdata were filled in with randomly drawn alleles determined by theoverall allele frequencies.
Results
Sequencing and assembly
We obtained 201 811 265 raw reads for the 158 individuals(excluding a total of nine low coverage and outlier samples
from the original 167) analyzed in this study (average1 277 286, standard deviation 541 376; Table S1; NCBI Bio-project PRJNA517351; NCBI SRA Accessions SRR8521837–SRR8521844). The FASTQC results indicated that reads wereof high quality across the entire 150 bp length. BecauseRADseq datasets often have large amounts of missing data,filtering parameters can have a major impact on the overallsize of the dataset. The complete dataset for 158 individuals,which included all variable sites and allowed for largeamounts of missing data, contained 64 331 SNPs; after filter-ing loci with > 10% missing data and individuals with > 50missing data, the dataset included 612 unlinked SNP markers.The subset for 106 mango cultivars recovered 364 unlinkedSNPs that had a minor allele frequency > 0.01% from the994 loci (some invariant) recovered in at least 90% ofindividuals.
Phylogenetic hypothesis
The maximum-likelihood phylogeny of the full dataset of 158individuals provides information at both the intraspecific andinterspecific levels (Fig. 3). Ultrafast bootstrap support valuescan be considered strong only when > 95% (Hoang et al.,2018), whereas SH-aLRT bootstrap values can be consideredstrong at > 80% (Guindon et al., 2010), and nodes with strongsupport from both measures were identified (Fig. 3). Thespecies M. pentandra, M. casturi, M. gedebe and M. zeylanicawere recovered as monophyletic (some with unidentified orputatively identified individuals included in their monophyleticgroups), with high support from both ultrafast bootstrappingand SH-aLRT bootstrapping. A number of clades consistingsolely of samples of uncertain identity also were recovered.Within the core clade of M. indica, three subclades were recov-ered, though support values for these clades were low. In gen-eral, Indochinese and Malesian samples were recovered inseparate clades compared to cultivars from other regions of theworld. The first clade consists of two Indonesian (‘Aeromanis’,‘Gedong Ginco’), two African (‘Diab’, ‘Hindi Besanara’) andtwo Indochinese (‘Golek’, ‘Sig Siput’) cultivars along with sam-ples identifed as M. lalijiwa, and unidentified samples, most ofwhich were collected in Indonesia. The second clade consists ofprimarily Indochinese samples and also includes one Floridiansample (‘Joellen’) and one African sample (‘Ewais’). Notably,within the second clade two Mexican cultivars (‘Ataulfo’ and‘Manila’) form a monophyletic group with the lone Philippinecultivar (‘Carabao’), corroborating the historical documentationwhich indicates that some Mexican mango germplasm wasintroduced directly from the Philippines. The third clade ofM. indica primarily contains cultivars from India, Florida,South America, the Caribbean and Africa, but also includes fiveIndochinese cultivars (‘Myatrynat’, ‘Swethintha’, ‘Saigon’,‘Maha Chanok’ and ‘Cac’) and the remaining three Mexicancultivars (‘Oro’, ‘Manila’ and ‘Esmeralda’). Although some cul-tivars from within particular regions are recovered as closelyrelated to one another, there is not strong geographical struc-ture within the clade.
New Phytologist (2019) 222: 2023–2037 � 2019 The Authors
New Phytologist� 2019 New Phytologist Trustwww.newphytologist.com
Research
NewPhytologist2028

Population structure
The population structure of the subset of 106 mango cultivarswas first examined with the program STRUCTURE to identifygenetic groups, which found K = 3 to be optimal using the DKmethod of Evanno, though additional informative structure isobserved for K = 2 and 4 (Fig. 4a–c). For K = 3, populations fromFlorida and India have similar compositions, with high levels ofancestry from group two, moderate levels of admixture fromgroup three, and low levels of admixture from group one. Themajority of individuals in the Caribbean and South Americanpopulations have the highest level of ancestry from group three,with moderate levels of admixture from population two and lowlevels of admixture from group three. As a whole, the SoutheastAsian cultivars are distinct from cultivars from other regions,with high levels of ancestry from group one and low to moderatecontributions from groups two and three. African cultivars areinferred to have high levels of admixture among the three groups,with great variability in inferred ancestry across individuals. Simi-larly, most cultivars from Mexico show high levels of admixturefrom the three groups. Indicative of the ongoing exchange ofgermplasm across the world, all populations include some indi-viduals that deviate from the overall pattern for that population.These results also are supported when examining the average ofall individuals within each population (Table S2a–c).
Population structure also was examined for the full dataset of612 unlinked SNPs from 158 individuals (Fig. 4d–f). Individu-als were sorted and labeled by species or population. Using theDK method of Evanno, K = 2 was found to be the optimal num-ber of populations, though we observed additional informativestructure for K = 3 and 4. For K = 3, mango cultivars fromFlorida, the Caribbean, South America, Africa (with the excep-tion of two individuals), and India show high levels of sharedancestry from a single group and only a few individuals indicatelow levels of admixture with a secondary group. By contrast,almost all cultivars from Indochina and Malesia show high levelsof admixture with the second group. Admixed ancestry fromgroups one and two was also found in M. casturi, M. pentandraand M. lalijiwa. Both M. gedebe and M. laurina are assigned togroup three with little evidence of admixture. A few individuals,including three cultivars from Africa, both samples ofM. zeylanica, and multiple unidentified samples from Floridaand Malesia, were inferred to be of admixed ancestry betweengroups one and three or between all three groups. The unidenti-fied accessions in Florida and Malesia were highly variable, withindividuals assigned to group one, group three, or showingadmixture between two or more of the populations. Of note, noindividuals are inferred to have > 60% ancestry from group two.The average assignment of individuals from geographical regionsshowed similar results (Table S3a–c).
Fig. 3 Maximum-likelihood phylogeny of thefull dataset of 158Mangifera accessions.Label colors represent the seven populationsofM. indica cultivars (red, India; purple,Africa; orange, South America; pink, theCaribbean; yellow, Mexico; brown, Florida;and Southeast Asia (green, Malesia; blue,Indochina)), closely related wildMangiferaspecies (black), and accessions of uncertainidentity (grey). Nodes with high support(SH-aLRT ≥ 80% and ultrafast bootstrapping≥ 95%) are indicated by a black circle.
� 2019 The Authors
New Phytologist� 2019 New Phytologist TrustNew Phytologist (2019) 222: 2023–2037
www.newphytologist.com
NewPhytologist Research 2029

(a)
(b)
(c)
(d)
(e)
(f)
(g)
Fig. 4 Inferred population structure for 106 mango cultivars (a–c) and the full dataset of 158 individuals (d–f) as estimated by the software STRUCTURE andvisualized with the software DISTRUCT for two (a, d), three (b, e) and four (c, f) populations. Each vertical bar represents a single individual that is assignedancestry to one or more of the populations (shades of green). Individuals are sorted and labeled by geographical region or species identification (MSP,MalesiaMangifera spp.; FSP, FloridaMangifera spp.) and are in the same order across all six plots (with the exception of two outliers from the Africanpopulation removed for the dataset of 106 cultivars). (g) Average population assignment for each geographical region in the dataset of 106 individuals forthe optimal K = 3.
New Phytologist (2019) 222: 2023–2037 � 2019 The Authors
New Phytologist� 2019 New Phytologist Trustwww.newphytologist.com
Research
NewPhytologist2030

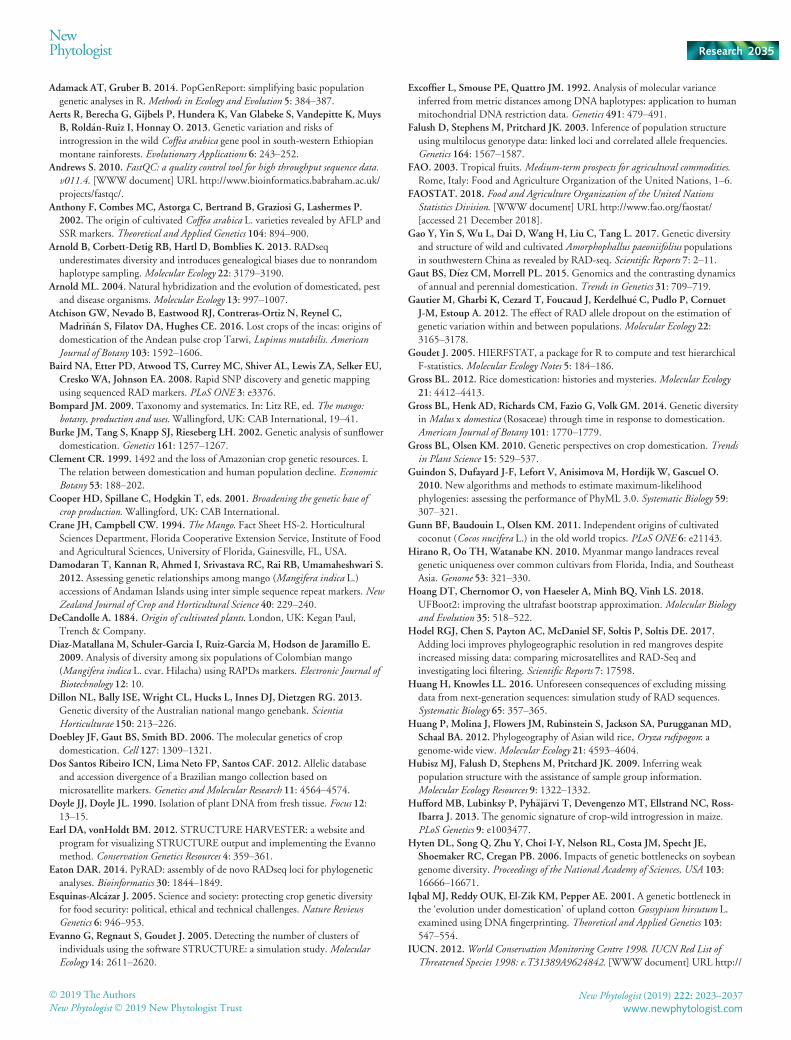
For analysis of the 106 mango cultivars using PCA, the firstprincipal component explained 9.58% of the variance whereasthe second explained 5.84% (Fig. 5). The PCA clustered cultivarsfrom Florida with those from India, whereas cultivars from theCaribbean and South America showed some differentiation.Mango cultivars from Southeast Asia were the most distinct, withlittle overlap between Southeast Asian cultivars and those fromother regions. Cultivars from Africa and Mexico were the mostwidely distributed, providing further evidence of the high varia-tion in individual genetic composition for these populations.Together, the results of clustering analyses indicate that SoutheastAsian cultivars contain unique genetic diversity that is not wellrepresented in cultivars from other regions of the world.
Genetic diversity and population differentiation
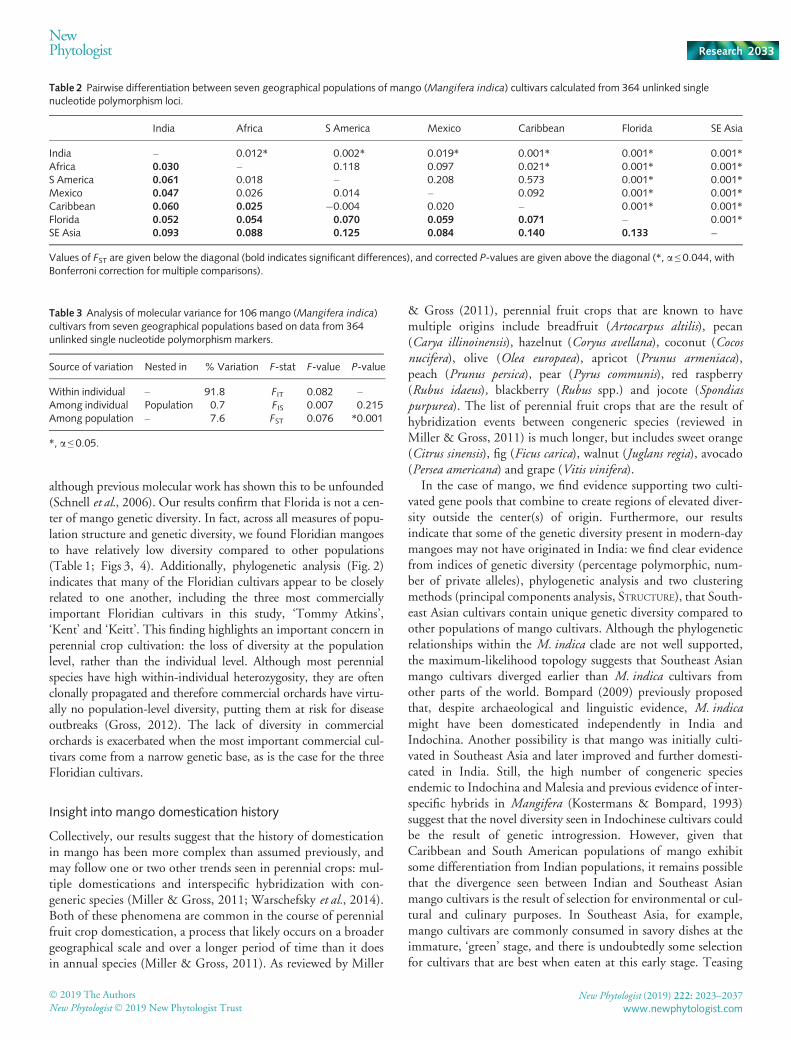
Measures of genetic diversity were calculated for the sevenpopulations of mango cultivars (Table 1) from the dataset of364 unlinked SNPs. In general, levels of diversity were similaracross all populations, although the levels of diversity for theAfrican population were consistently high compared to otherpopulations, whereas diversity in the Floridian population wasrelatively low. Levels of HO were highest for the Caribbeanand South America (0.2156 and 0.2154, respectively) and low-est for Florida and India (0.1833 and 0.1815, respectively).
Africa had the highest levels of gene diversity (HE 0.2169),whereas Florida had the lowest (0.1711). Values for theinbreeding coefficient FIS ranged from 0.0425 (Africa) to�0.0411 (Florida), indicating relatively low levels of inbreed-ing in mango cultivars. Values of allelic richness differed littlebetween populations, with the highest levels found in theAfrican and Caribbean populations (1.2106 and 1.2107,respectively) and the lowest found in the Floridian population(1.1690). We observed the highest nucleotide diversity in theAfrican population (0.0671) and the lowest in the Floridianpopulation (0.0293). Percentage polymorphism varied from83.52% in the Southeast Asian population to 54.40% in theMexican population. The number of private alleles was highestin the Indochinese population (74), for which we measurednearly five times as many private alleles as the next highestpopulation, India, which had 15.
Many pairs of populations were significantly differentiatedfrom one another by pairwise calculations of FST (Table 2). TheFloridian, Indian and Southeast Asian populations were signifi-cantly different from all other populations. Additionally, theCaribbean and African populations were significantly different.The AMOVA found that a significant amount (7.6%) of the totalvariation was segregated between populations (F = 0.076,P = 0.001), with the majority of variation (91.8%) shared acrossindividuals (Table 3).
PC1: 9.58%
PC
2: 5
.84%
Fig. 5 Principal component (PC) analysis of106 mango cultivars from sevengeographical populations. Axes are labeledwith the percentage of variation explained bythe corresponding PC. Colors represent theseven populations ofMangifera indicacultivars (red, India; purple, Africa; orange,South America; pink, the Caribbean; yellow,Mexico; brown, Florida; and Southeast Asia(green, Malesia; blue, Indochina)).
� 2019 The Authors
New Phytologist� 2019 New Phytologist TrustNew Phytologist (2019) 222: 2023–2037
www.newphytologist.com
NewPhytologist Research 2031

Discussion
Here, we analyzed mango cultivars and closely related Mangiferaspecies to describe phylogeographical patterns of diversity, explic-itly test whether India represents a ‘center of diversity’ for mango,and quantify the genetic bottleneck that mango underwent as itwas introduced into new regions of the world. Collectively, ourresults provide insight into global mango diversity as well as theprocess of domestication in one of the world’s most importantperennial fruit crops.
Geographical distribution of diversity
Patterns of genetic diversity in crops can tell us about their historyof domestication. Our analysis of genetic structure within culti-vated mango germplasm identified two primary groups, corre-sponding to Indian and Southeast Asian cultivars, with a third, lessdefined group representing Caribbean and South American culti-vars. The differentiation between Indian and Southeast Asian culti-vars supports previous genetic analysis of mango germplasmdiversity (Schnell et al., 2006; Dillon et al., 2013) and traditionalclassification of mango cultivar types as Indian or Indochinese(Crane & Campbell, 1994). Furthermore, the differentiation ofSouth American and Caribbean cultivars aligns with another recentanalysis of mango germplasm diversity, which found differentia-tion between Asian and Western cultivars (Sherman et al., 2015).
In addition to the three groups of cultivars, our analysis ofpopulation structure, principal components and nucleotide diver-sity show that the African and Mexican cultivar populations havehigh levels of admixture and diversity. In support of historicaldocumentation indicating that Mexico received germplasmdirectly from the Philippines (Mukherjee, 1949), two of the fiveMexican cultivars cluster closely with the lone Philippine cultivar.Whereas the Philippines is considered part of Malesia, the groupof Mexican and Philippine cultivars clusters with Indochineserather than Malesian cultivars in the phylogeny. Notably, theAfrican population has relatively high levels of diversity andincludes individuals that cluster with Indian and Southeast Asianpopulations. The diversity of African populations may be an
artefact of sampling cultivars that are modern introductionsrather than historical cultivars, which are rare in germplasm col-lections. Additional effort should be made to examine the diver-sity of mango cultivars in Africa and identify traditional cultivars.
Centers of diversity and dispersal bottlenecks
Traditionally, crops are thought to have a center of diversity nearwhere they were originally domesticated (Vavilov, 1987) and expe-rience a loss of this baseline diversity as the result of introductionbottlenecks (Cooper et al., 2001; Van de Wouw et al., 2010).However, relatively few studies have sought to quantify the intro-duction bottlenecks experienced by perennial species duringdomestication or test for centers of origin for these species.Whereas most scholars believe that mango was domesticated inIndia, the existence of two morphologically distinct mango cultivartypes has previously led some to suggest that Indochina played animportant role in the origin and domestication ofM. indica (Bom-pard, 2009; Iyer & Schnell, 2009). Analyzing cultivars from sevengeographical regions, we find little evidence that mango has a cen-ter of diversity in India or that it experienced a secondary geneticbottleneck during its dispersal into new regions of the world. Infact, by most measures, the Indian population of mango cultivarshas lower diversity than populations from other regions of theworld (Table 1). Similarly, although we find that the SoutheastAsian (Indochinese and Malesian) population contains uniquegenetic variation, including a large number of private alleles(Table 1; Fig. 5), it did not consistently have the highest measuresof diversity. Rather than mango germplasm having a center ofgenetic diversity that aligns with a purported center of origin inIndia or Southeast Asia, many measures of genetic diversity areslightly elevated in regions where mango is introduced: Africa,South America, the Caribbean and Mexico.
In the early 1900s, mango cultivation and breeding programsintensified in the Americas, especially in South Florida, whichwent on to produce many of today’s most commercially impor-tant cultivars. The novel characteristics of these cultivars and theirsuccess in the global market led South Florida to be dubbed a sec-ondary center of domestication (Knight & Schnell, 1994),
Popula�on Ho HE Fis Ar π %Poly Ap
Africa 0.2028 0.2169 0.0425 1.2106 4.03E-04 73.08 0Caribbean 0.2156 0.2134 –0.0094 1.2105 3.42E-04 76.37 6Florida 0.1833 0.1711 –0.0411 1.1690 2.03E-04 69.51 4India 0.1815 0.1867 0.0221 1.1839 3.41E-04 74.45 15
Mexico 0.1967 0.2045 0.0172 1.1923 3.96E-04 54.40 2S America 0.2154 0.2096 –0.0270 1.2030 3.69E-04 65.93 0SE Asia 0.1956 0.1977 0.0108 1.1954 3.57E-04 83.52 74
For each column, warmer colors reflect lower values. HO, observed heterozygosity; HE, heterozygos-ity within populations, aka ‘gene diversity’; FIS, inbreeding coefficient; Ar, allelic richness (rarefied toaccount for population size); p, nucleotide diversity (calculated with invariant loci); %Poly, percent-age polymorphic; Ap, private alleles.
Table 1 Measures of diversity for 106 mango(Mangifera indica) cultivars from sevengeographical populations calculated from 364unlinked single nucleotide polymorphism loci.
New Phytologist (2019) 222: 2023–2037 � 2019 The Authors
New Phytologist� 2019 New Phytologist Trustwww.newphytologist.com
Research
NewPhytologist2032
although previous molecular work has shown this to be unfounded(Schnell et al., 2006). Our results confirm that Florida is not a cen-ter of mango genetic diversity. In fact, across all measures of popu-lation structure and genetic diversity, we found Floridian mangoesto have relatively low diversity compared to other populations(Table 1; Figs 3, 4). Additionally, phylogenetic analysis (Fig. 2)indicates that many of the Floridian cultivars appear to be closelyrelated to one another, including the three most commerciallyimportant Floridian cultivars in this study, ‘Tommy Atkins’,‘Kent’ and ‘Keitt’. This finding highlights an important concern inperennial crop cultivation: the loss of diversity at the populationlevel, rather than the individual level. Although most perennialspecies have high within-individual heterozygosity, they are oftenclonally propagated and therefore commercial orchards have virtu-ally no population-level diversity, putting them at risk for diseaseoutbreaks (Gross, 2012). The lack of diversity in commercialorchards is exacerbated when the most important commercial cul-tivars come from a narrow genetic base, as is the case for the threeFloridian cultivars.
Insight into mango domestication history
Collectively, our results suggest that the history of domesticationin mango has been more complex than assumed previously, andmay follow one or two other trends seen in perennial crops: mul-tiple domestications and interspecific hybridization with con-generic species (Miller & Gross, 2011; Warschefsky et al., 2014).Both of these phenomena are common in the course of perennialfruit crop domestication, a process that likely occurs on a broadergeographical scale and over a longer period of time than it doesin annual species (Miller & Gross, 2011). As reviewed by Miller
& Gross (2011), perennial fruit crops that are known to havemultiple origins include breadfruit (Artocarpus altilis), pecan(Carya illinoinensis), hazelnut (Coryus avellana), coconut (Cocosnucifera), olive (Olea europaea), apricot (Prunus armeniaca),peach (Prunus persica), pear (Pyrus communis), red raspberry(Rubus idaeus), blackberry (Rubus spp.) and jocote (Spondiaspurpurea). The list of perennial fruit crops that are the result ofhybridization events between congeneric species (reviewed inMiller & Gross, 2011) is much longer, but includes sweet orange(Citrus sinensis), fig (Ficus carica), walnut (Juglans regia), avocado(Persea americana) and grape (Vitis vinifera).
In the case of mango, we find evidence supporting two culti-vated gene pools that combine to create regions of elevated diver-sity outside the center(s) of origin. Furthermore, our resultsindicate that some of the genetic diversity present in modern-daymangoes may not have originated in India: we find clear evidencefrom indices of genetic diversity (percentage polymorphic, num-ber of private alleles), phylogenetic analysis and two clusteringmethods (principal components analysis, STRUCTURE), that South-east Asian cultivars contain unique genetic diversity compared toother populations of mango cultivars. Although the phylogeneticrelationships within the M. indica clade are not well supported,the maximum-likelihood topology suggests that Southeast Asianmango cultivars diverged earlier than M. indica cultivars fromother parts of the world. Bompard (2009) previously proposedthat, despite archaeological and linguistic evidence, M. indicamight have been domesticated independently in India andIndochina. Another possibility is that mango was initially culti-vated in Southeast Asia and later improved and further domesti-cated in India. Still, the high number of congeneric speciesendemic to Indochina and Malesia and previous evidence of inter-specific hybrids in Mangifera (Kostermans & Bompard, 1993)suggest that the novel diversity seen in Indochinese cultivars couldbe the result of genetic introgression. However, given thatCaribbean and South American populations of mango exhibitsome differentiation from Indian populations, it remains possiblethat the divergence seen between Indian and Southeast Asianmango cultivars is the result of selection for environmental or cul-tural and culinary purposes. In Southeast Asia, for example,mango cultivars are commonly consumed in savory dishes at theimmature, ‘green’ stage, and there is undoubtedly some selectionfor cultivars that are best when eaten at this early stage. Teasing
Table 2 Pairwise differentiation between seven geographical populations of mango (Mangifera indica) cultivars calculated from 364 unlinked singlenucleotide polymorphism loci.
India Africa S America Mexico Caribbean Florida SE Asia
India – 0.012* 0.002* 0.019* 0.001* 0.001* 0.001*Africa 0.030 – 0.118 0.097 0.021* 0.001* 0.001*S America 0.061 0.018 – 0.208 0.573 0.001* 0.001*Mexico 0.047 0.026 0.014 – 0.092 0.001* 0.001*Caribbean 0.060 0.025 �0.004 0.020 – 0.001* 0.001*Florida 0.052 0.054 0.070 0.059 0.071 – 0.001*SE Asia 0.093 0.088 0.125 0.084 0.140 0.133 –
Values of FST are given below the diagonal (bold indicates significant differences), and corrected P-values are given above the diagonal (*, a ≤ 0.044, withBonferroni correction for multiple comparisons).
Table 3 Analysis of molecular variance for 106 mango (Mangifera indica)cultivars from seven geographical populations based on data from 364unlinked single nucleotide polymorphism markers.
Source of variation Nested in % Variation F-stat F-value P-value
Within individual – 91.8 FIT 0.082 –Among individual Population 0.7 FIS 0.007 0.215Among population – 7.6 FST 0.076 *0.001
*, a ≤ 0.05.
� 2019 The Authors
New Phytologist� 2019 New Phytologist TrustNew Phytologist (2019) 222: 2023–2037
www.newphytologist.com
NewPhytologist Research 2033

apart the seemingly complex history of domestication in mangorequires more thorough sampling of wild M. indica, Indian,Indochinese, and Malesian mango cultivars and landraces, alongwith additional samples from closely related Mangifera species inIndia and Indochina, many of which were not included in the pre-sent study.
Remaining gaps and future goals
We observed neither a center of diversity in India or Florida nor aloss of diversity associated with mango’s dispersal into Africa andthe Americas, yet this line of inquiry deserves additional attention.Given that population structure has been observed within Indianmango germplasm (Ravishankar et al., 2000, 2015; Kumar et al.,2001; Karihaloo et al., 2003; Damodaran et al., 2012; Vasugiet al., 2012; Surapaneni et al., 2013; Singh, 2016), we made aneffort to include a diverse subset of Indian cultivars in our analy-sis; however, it is possible that the individuals included here donot fully encompass the diversity present in India. Additionally,sampling from within Africa was restricted because of the limitednumber of African cultivar accessions in the FTBG genebank.Future efforts should be made to address the lack of Africangermplasm in US collections and refine our understanding of thephylogeography of mango in Africa, particularly given the diver-sity which we observed in African germplasm.
Simulation studies have shown metrics of diversity calculatedfrom RADseq datasets may be inflated because of allele dropoutand large amounts of missing data (Gautier et al., 2012; Arnoldet al., 2013); therefore, we restricted the amount of missing datain our dataset. Contrary to these expectations, our estimates ofgene diversity in mango were lower than those from the onlyother comparable report. Sherman et al. (2015) estimated genediversity from transcriptome-derived single nucleotide polymor-phism (SNP) markers in mango to have a median value of 0.28–0.43, roughly 1.5–2-fold higher than the average values calcu-lated here. The explanation for this discrepancy is not immedi-ately clear; however, more recent empirical work indicates thatmissing data may not inflate diversity indices in empiricaldatasets as much as was proposed initially (Hodel et al., 2017).One possibility for the observed differences in gene diversitybetween studies is that low sequence coverage and low tolerancefor missing data at the interspecific level in the present study pro-duced a dataset of highly conserved genomic regions, which areinherently less diverse (Huang & Knowles, 2016). As we progresstoward a high-quality sequence of the mango genome (Singh,2016; D. Kuhn, pers. comm.) better estimations of genome-wideheterozygosity in mango will be possible.
Here, we tested whether mango incurred a dispersal bottleneckby comparing cultivars from different regions of the world. How-ever, the question of whether mango underwent a primary loss ofdiversity during the initial phases of domestication cannot beanswered without including samples from mango’s wild progeni-tors, although future analysis using coalescent simulations ofdemography may help shed light on this issue. For a number of rea-sons, it may be difficult to locate and identify mango’s wild progen-itor populations. As a result of intensifying land use in the native
range of M. indica, it is possible that many populations of wildM. indica have been extirpated. Additionally, whether the individu-als in this region truly represent wild M. indica or whether they arenaturalized offspring of previously cultivated individuals may bedifficult to determine. Naturalized mango trees are frequentlyobserved in the Neotropics, and, to the casual observer, appear tobe wild (Bompard, 2009). Further complicating this problem is thefact that many closely related Mangifera species bear remarkableresemblance to cultivated mango, and common names of thesespecies are often translated to “wild mango” (Kostermans & Bom-pard, 1993; E. Warschefsky, pers. obs.). The identification andin situ and ex situ conservation of wild populations of M. indicaand its closest relatives is of critical importance to understandingthe history and improving the future of ‘The King of Fruits’.
Acknowledgements
EW was supported by an NSF Dissertation Improvement Grant(1501326), a USDA NIFA-AFRI Predoctoral Fellowship (2016-67011-25098) Doctoral Evidence Acquisition and DissertationYear Fellowships from Florida International University, andadditional funding from the International Center for TropicalBiology at Florida International University, the Kelly Foundationfor Tropical Botany, Singapore Botanic Garden, and FairchildTropical Botanic Garden. The authors thank the following insti-tutions and their staff for assistance with collections: SingaporeBotanic Garden, Forestry Research Institute of Malaysia, PasohArboretum, Kebun Raya Purwodadi, Kebun Raya Bogor, Gar-dens by the Bay, Miami Dade Fruit and Spice Park, INRAGuadeloupe, and Fairchild Tropical Botanic Garden. Thanks toRichard Campbell (FTBG) for providing comments during theplanning stages of this project, Heather Bracken-Grissom (FIU)for providing laboratory space, Laura Timm (FIU) for collabora-tion on library preparations, and John Mitchell (NYBG) forassistance withMangifera identification.
Author contributions
EJW co-developed the questions and framework, obtained fund-ing, made collections, performed laboratory work and analyses,and wrote the text; EJBvW co-developed the questions andframework, mentored the student author, assisted with obtainingfunding and analyses, and edited the text.
ORCID
Emily J. Warschefsky https://orcid.org/0000-0003-3894-6662Eric J. B. von Wettberg https://orcid.org/0000-0002-2724-0317
References
Abbo S, Berger J, Turner NC. 2003. Evolution of cultivated chickpea: four
bottlenecks limit diversity and constrain adaptation. Functional Plant Biology30: 1081–1087.
New Phytologist (2019) 222: 2023–2037 � 2019 The Authors
New Phytologist� 2019 New Phytologist Trustwww.newphytologist.com
Research
NewPhytologist2034
Adamack AT, Gruber B. 2014. PopGenReport: simplifying basic population
genetic analyses in R.Methods in Ecology and Evolution 5: 384–387.Aerts R, Berecha G, Gijbels P, Hundera K, Van Glabeke S, Vandepitte K, Muys
B, Rold�an-Ruiz I, Honnay O. 2013. Genetic variation and risks of
introgression in the wild Coffea arabica gene pool in south-western Ethiopian
montane rainforests. Evolutionary Applications 6: 243–252.Andrews S. 2010. FastQC: a quality control tool for high throughput sequence data.v011.4. [WWW document] URL http://www.bioinformatics.babraham.ac.uk/
projects/fastqc/.
Anthony F, Combes MC, Astorga C, Bertrand B, Graziosi G, Lashermes P.
2002. The origin of cultivated Coffea arabica L. varieties revealed by AFLP and
SSR markers. Theoretical and Applied Genetics 104: 894–900.Arnold B, Corbett-Detig RB, Hartl D, Bomblies K. 2013. RADseq
underestimates diversity and introduces genealogical biases due to nonrandom
haplotype sampling.Molecular Ecology 22: 3179–3190.Arnold ML. 2004. Natural hybridization and the evolution of domesticated, pest
and disease organisms.Molecular Ecology 13: 997–1007.Atchison GW, Nevado B, Eastwood RJ, Contreras-Ortiz N, Reynel C,
Madri~n�an S, Filatov DA, Hughes CE. 2016. Lost crops of the incas: origins of
domestication of the Andean pulse crop Tarwi, Lupinus mutabilis. AmericanJournal of Botany 103: 1592–1606.
Baird NA, Etter PD, Atwood TS, Currey MC, Shiver AL, Lewis ZA, Selker EU,
Cresko WA, Johnson EA. 2008. Rapid SNP discovery and genetic mapping
using sequenced RAD markers. PLoS ONE 3: e3376.
Bompard JM. 2009. Taxonomy and systematics. In: Litz RE, ed. The mango:botany, production and uses. Wallingford, UK: CAB International, 19–41.
Burke JM, Tang S, Knapp SJ, Rieseberg LH. 2002. Genetic analysis of sunflower
domestication. Genetics 161: 1257–1267.Clement CR. 1999. 1492 and the loss of Amazonian crop genetic resources. I.
The relation between domestication and human population decline. EconomicBotany 53: 188–202.
Cooper HD, Spillane C, Hodgkin T, eds. 2001. Broadening the genetic base ofcrop production. Wallingford, UK: CAB International.
Crane JH, Campbell CW. 1994. The Mango. Fact Sheet HS-2. Horticultural
Sciences Department, Florida Cooperative Extension Service, Institute of Food
and Agricultural Sciences, University of Florida, Gainesville, FL, USA.
Damodaran T, Kannan R, Ahmed I, Srivastava RC, Rai RB, Umamaheshwari S.
2012. Assessing genetic relationships among mango (Mangifera indica L.)accessions of Andaman Islands using inter simple sequence repeat markers. NewZealand Journal of Crop and Horticultural Science 40: 229–240.
DeCandolle A. 1884. Origin of cultivated plants. London, UK: Kegan Paul,
Trench & Company.
Diaz-Matallana M, Schuler-Garcia I, Ruiz-Garcia M, Hodson de Jaramillo E.
2009. Analysis of diversity among six populations of Colombian mango
(Mangifera indica L. cvar. Hilacha) using RAPDs markers. Electronic Journal ofBiotechnology 12: 10.
Dillon NL, Bally ISE, Wright CL, Hucks L, Innes DJ, Dietzgen RG. 2013.
Genetic diversity of the Australian national mango genebank. ScientiaHorticulturae 150: 213–226.
Doebley JF, Gaut BS, Smith BD. 2006. The molecular genetics of crop
domestication. Cell 127: 1309–1321.Dos Santos Ribeiro ICN, Lima Neto FP, Santos CAF. 2012. Allelic database
and accession divergence of a Brazilian mango collection based on
microsatellite markers. Genetics and Molecular Research 11: 4564–4574.Doyle JJ, Doyle JL. 1990. Isolation of plant DNA from fresh tissue. Focus 12:13–15.
Earl DA, vonHoldt BM. 2012. STRUCTURE HARVESTER: a website and
program for visualizing STRUCTURE output and implementing the Evanno
method. Conservation Genetics Resources 4: 359–361.Eaton DAR. 2014. PyRAD: assembly of de novo RADseq loci for phylogenetic
analyses. Bioinformatics 30: 1844–1849.Esquinas-Alc�azar J. 2005. Science and society: protecting crop genetic diversityfor food security: political, ethical and technical challenges. Nature ReviewsGenetics 6: 946–953.
Evanno G, Regnaut S, Goudet J. 2005. Detecting the number of clusters of
individuals using the software STRUCTURE: a simulation study.MolecularEcology 14: 2611–2620.
Excoffier L, Smouse PE, Quattro JM. 1992. Analysis of molecular variance
inferred from metric distances among DNA haplotypes: application to human
mitochondrial DNA restriction data. Genetics 491: 479–491.Falush D, Stephens M, Pritchard JK. 2003. Inference of population structure
using multilocus genotype data: linked loci and correlated allele frequencies.
Genetics 164: 1567–1587.FAO. 2003. Tropical fruits.Medium-term prospects for agricultural commodities.Rome, Italy: Food and Agriculture Organization of the United Nations, 1–6.
FAOSTAT. 2018. Food and Agriculture Organization of the United NationsStatistics Division. [WWW document] URL http://www.fao.org/faostat/
[accessed 21 December 2018].
Gao Y, Yin S, Wu L, Dai D, Wang H, Liu C, Tang L. 2017. Genetic diversity
and structure of wild and cultivated Amorphophallus paeoniifolius populationsin southwestern China as revealed by RAD-seq. Scientific Reports 7: 2–11.
Gaut BS, D�ıez CM, Morrell PL. 2015. Genomics and the contrasting dynamics
of annual and perennial domestication. Trends in Genetics 31: 709–719.Gautier M, Gharbi K, Cezard T, Foucaud J, Kerdelhu�e C, Pudlo P, Cornuet
J-M, Estoup A. 2012. The effect of RAD allele dropout on the estimation of
genetic variation within and between populations.Molecular Ecology 22:3165–3178.
Goudet J. 2005.HIERFSTAT, a package for R to compute and test hierarchical
F-statistics.Molecular Ecology Notes 5: 184–186.Gross BL. 2012. Rice domestication: histories and mysteries.Molecular Ecology21: 4412–4413.
Gross BL, Henk AD, Richards CM, Fazio G, Volk GM. 2014. Genetic diversity
inMalus x domestica (Rosaceae) through time in response to domestication.
American Journal of Botany 101: 1770–1779.Gross BL, Olsen KM. 2010. Genetic perspectives on crop domestication. Trendsin Plant Science 15: 529–537.
Guindon S, Dufayard J-F, Lefort V, Anisimova M, Hordijk W, Gascuel O.
2010. New algorithms and methods to estimate maximum-likelihood
phylogenies: assessing the performance of PhyML 3.0. Systematic Biology 59:307–321.
Gunn BF, Baudouin L, Olsen KM. 2011. Independent origins of cultivated
coconut (Cocos nucifera L.) in the old world tropics. PLoS ONE 6: e21143.
Hirano R, Oo TH, Watanabe KN. 2010.Myanmar mango landraces reveal
genetic uniqueness over common cultivars from Florida, India, and Southeast
Asia. Genome 53: 321–330.Hoang DT, Chernomor O, von Haeseler A, Minh BQ, Vinh LS. 2018.
UFBoot2: improving the ultrafast bootstrap approximation.Molecular Biologyand Evolution 35: 518–522.
Hodel RGJ, Chen S, Payton AC, McDaniel SF, Soltis P, Soltis DE. 2017.
Adding loci improves phylogeographic resolution in red mangroves despite
increased missing data: comparing microsatellites and RAD-Seq and
investigating loci filtering. Scientific Reports 7: 17598.Huang H, Knowles LL. 2016. Unforeseen consequences of excluding missing
data from next-generation sequences: simulation study of RAD sequences.
Systematic Biology 65: 357–365.Huang P, Molina J, Flowers JM, Rubinstein S, Jackson SA, Purugganan MD,
Schaal BA. 2012. Phylogeography of Asian wild rice, Oryza rufipogon: agenome-wide view.Molecular Ecology 21: 4593–4604.
Hubisz MJ, Falush D, Stephens M, Pritchard JK. 2009. Inferring weak
population structure with the assistance of sample group information.
Molecular Ecology Resources 9: 1322–1332.Hufford MB, Lubinksy P, Pyh€aj€arvi T, Devengenzo MT, Ellstrand NC, Ross-
Ibarra J. 2013. The genomic signature of crop-wild introgression in maize.
PLoS Genetics 9: e1003477.Hyten DL, Song Q, Zhu Y, Choi I-Y, Nelson RL, Costa JM, Specht JE,
Shoemaker RC, Cregan PB. 2006. Impacts of genetic bottlenecks on soybean
genome diversity. Proceedings of the National Academy of Sciences, USA 103:
16666–16671.Iqbal MJ, Reddy OUK, El-Zik KM, Pepper AE. 2001. A genetic bottleneck in
the ‘evolution under domestication’ of upland cotton Gossypium hirsutum L.
examined using DNA fingerprinting. Theoretical and Applied Genetics 103:547–554.
IUCN. 2012.World Conservation Monitoring Centre 1998. IUCN Red List ofThreatened Species 1998: e.T31389A9624842. [WWW document] URL http://
� 2019 The Authors
New Phytologist� 2019 New Phytologist TrustNew Phytologist (2019) 222: 2023–2037
www.newphytologist.com
NewPhytologist Research 2035

dx.doi.org/10.2305/IUCN.UK.1998.RLTS.T31389A9624842.en [accessed 21
December 2018].
Iyer CPA, Schnell RJ. 2009. Breeding and genetics. In: Litz RE, ed. Themango: botany, production and uses. Wallingford, UK: CAB International,
68–83.Jakobsson M, Rosenberg NA. 2007. CLUMPP: a cluster matching and
permutation program for dealing with label switching and multimodality in
analysis of population structure. Bioinformatics 23: 1801–1806.Jombart T. 2008. Adegenet: an R package for the multivariate analysis of genetic
markers. Bioinformatics 24: 1403–1405.Jombart T, Ahmed I. 2011. adegenet 1.3-1: new tools for the analysis of genome-
wide SNP data. Bioinformatics 27: 3070–3071.Kalyaanamoorthy S, Minh BQ, Wong TKF, von Haeseler A, Jermiin LS. 2017.
ModelFinder: fast model selection for accurate phylogenetic estimates. NatureMethods 14: 587–589.
Kamvar ZN, Tabima JF, Gr€unwald NJ. 2014. Poppr: an R package for genetic
analysis of populations with clonal, partially clonal, and/or sexual reproduction.
PeerJ 2: e281.Karihaloo JL, Dwivedi YK, Sunil A, Gaikwad AB, Archak S. 2003. Analysis of
genetic diversity of Indian mango cultivars using RAPD markers. Journal ofHorticultural Science and Biotechnology 78: 285–289.
Kassa MT, Penmetsa RV, Carrasquilla-Garcia N, Sarma BK, Datta S,
Upadhyaya HD, Varshney RK, von Wettberg EJB, Cook DR. 2012. Genetic
patterns of domestication in pigeonpea (Cajanus cajan (L.) Millsp.) and wild
Cajanus relatives. PLoS ONE 7: e39563.
Knight RJ, Campbell RJ, Maguire I. 2009. Important mango cultivars and their
descriptions. In: Litz RE, ed. The mango: botany, production and uses.Wallingford, UK: CAB International, 42–66.
Knight RJ, Schnell RJ. 1994.Mango introduction in Florida and the ‘Haden’
cultivar’s significance to the modern industry. Economic Botany 48: 139–145.Kostermans AJGH, Bompard JM. 1993. The mangoes: their botany, nomenclature,horticulture, and utilization. San Diego, CA, USA: Academic Press.
Kovach MJ, Sweeney MT, McCouch SR. 2007. New insights into the history of
rice domestication. Trends in Genetics 23: 578–587.Kuhn DN, Bally ISE, Dillon NL, Innes D, Groh AM, Rahaman J, Ophir R,
Cohen Y, Sherman A. 2017. Genetic map of mango: a tool for mango
breeding. Frontiers in Plant Science 8: 1–11.Kumar NVH, Narayanaswamy P, Prasad DT, Mukunda GK, Sondur SN. 2001.
Estimation of genetic diversity of commercial mango (Mangifera indica L.)cultivars using RAPD markers. Journal of Horticultural Science & Biotechnology76: 529–533.
Ladizinsky G. 1985. Founder effect in crop-plant evolution. Economic Botany 39:191–199.
Li C, Zhou A, Sang T. 2006. Rice domestication by reducing shattering. Science311: 1936–1939.
Lim TK. 2012a.Mangifera odorata. Edible medicinal and non-medicinal plants.Dordrecht, the Netherlands: Springer, 127–130.
Lim TK. 2012b.Mangifera laurina. Edible medicinal and non-medicinal plants.Dordrecht, the Netherlands: Springer, 124–126.
Londo JP, Chiang Y, Hung K, Chiang T, Schaal BA. 2006. Phylogeography of
Asian wild rice, Oryza rufipogon, reveals multiple independent domestications
of cultivated rice, Oryza sativa. Proceedings of the National Academy of Sciences,USA 103: 9578–9583.
Loor Solorzano RG, Fouet O, Lemainque A, Pavek S, Boccara M, Argout X,
Amores F, Courtois B, Risterucci AM, Lanaud C. 2012. Insight into the wild
origin, migration and domestication history of the fine flavour nacional
Theobroma cacao L. variety from Ecuador. PLoS ONE 7: e48438.
Luo C, He X-H, Chen H, Ou S-J, Gao M-P, Brown JS, Tondo CT, Schnell RJ.
2011. Genetic diversity of mango cultivars estimated using SCoT and ISSR
markers. Biochemical Systematics and Ecology 39: 676–684.Maddison WP, Maddison DR. 2018.Mesquite: a modular system for evolutionaryanalysis. Version 3.51. [WWW document] URL http://www.mesquiteproject.
org.
Matsuoka Y, Vigouroux Y, Goodman MM, Sanchez GJ, Buckler E, Doebley J.
2002. A single domestication for maize shown by multilocus microsatellite
genotyping. Proceedings of the National Academy of Sciences, USA 99:
6080–6084.
Meirmans PG, Van Tienderen PH. 2004. Genotype and Genodive: two
programs for the analysis of genetic diversity of asexual organisms.MolecularEcology Notes 4: 792–794.
Meyer RS, DuVal AE, Jensen HR. 2012. Patterns and processes in crop
domestication: an historical review and quantitative analysis of 203 global food
crops. New Phytologist 196: 29–48.Meyer RS, Purugganan MD. 2013. Evolution of crop species: genetics of
domestication and diversification. Nature Reviews Genetics 14: 840–852.Michalakis Y, Excoffier L. 1996. A generic estimation of population subdivision
using distances between alleles with special reference for microsatellite loci.
Genetics 142: 1061–1064.Miller AJAJ, Gross BL. 2011. From forest to field: perennial fruit crop
domestication. American Journal of Botany 98: 1389–1414.Miller MR, Dunham JP, Amores A, Cresko WA, Johnson EA. 2007. Rapid and
cost-effective polymorphism identification and genotyping using restriction site
associated DNA (RAD) markers. Genome Research 17: 240–248.Mukherjee SK. 1949. The mango and its wild relatives. Science and Culture 26:5–9.
Mukherjee SK. 1972.Origin of Mango (Mangifera indica). Economic Botany 26:260–264.
Mukherjee SK, Litz RE. 2009. Introduction: botany and Importance. In: Litz
RE, ed. The mango: botany, production and uses. Wallingford, UK: CAB
International, 1–18.Myles S, Boyko AR, Owens CL, Brown PJ, Grassi F, Aradhya MK, Prins B,
Reynolds A, Chia J-M, Ware D et al. 2011. Genetic structure and
domestication history of the grape. Proceedings of the National Academy ofSciences, USA 108: 3530–3535.
Nguyen LT, Schmidt HA, von Haeseler A, Minh BQ. 2015. IQ-TREE: a fast
and effective stochastic algorithm for estimating maximum-likelihood
phylogenies.Molecular Biology and Evolution 32: 268–274.Olsen KM, Schaal BA. 1999. Evidence on the origin of cassava: phylogeography
ofManihot esculenta. Proceedings of the National Academy of Sciences, USA 96:
5586–5591.Olsen KM, Wendel JF. 2013. Crop plants as models for understanding plant
adaptation and diversification. Frontiers in Plant Science 4: 290.Pan Y, Wang X, Sun G, Li F, Gong X. 2016. Application of RAD sequencing for
evaluating the genetic diversity of domesticated Panax notoginseng (Araliaceae).PLoS ONE 11: 1–17.
Paradis E. 2010. Pegas: an R package for population genetics with an integrated-
modular approach. Bioinformatics 26: 419–420.Paradis E, Claude J, Strimmer K. 2004. APE: analyses of phylogenetics and
evolution in R language. Bioinformatics 20: 289–290.Peterson BK, Weber JN, Kay EH, Fisher HS, Hoekstra HE. 2012. Double
digest RADseq: an inexpensive method for de novo SNP discovery and
genotyping in model and non model species. PLoS ONE 7: 1–11.Pickersgill B. 2007. Domestication of plants in the Americas: insights from
Mendelian and molecular genetics. Annals of Botany 100: 925–940.Popenoe W. 1920. The mango.Manual of tropical and subtropical fruits. New
York, NY, USA: Macmillan, 79–145.Pritchard JK, Stephens M, Donnelly P. 2000. Inference of population structure
using multilocus genotype data. Genetics 155: 945–959.Purugganan MD, Fuller DQ. 2009. The nature of selection during plant
domestication. Nature 457: 843–848.Ravishankar KV, Anand L, Dinesh MR. 2000. Assessment of genetic relatedness
among mango cultivars of India using RAPD markers. The Journal ofHorticultural Science and Biotechnology 75: 198–201.
Ravishankar KV, Bommisetty P, Bajpaj A, Srivastava N, Mani BH, Vasugi C,
Rajan S, Dinesh MR. 2015. Genetic diversity and population structure analysis
of mango (Mangifera indica) cultivars assessed by microsatellite markers. Trees29: 775–783.
Rosenberg NA. 2004. Distruct: a program for the graphical display of population
structure.Molecular Ecology Notes 4: 137–138.Saintenac C, Jiang D, Wang S, Akhunov E. 2013. Sequence-based mapping of
the polyploid wheat genome. G3: Genes, Genomes, Genetics 3: 1105–1114.Salamini F, Ozkan H, Brandolini A, Sch€afer-Pregl R, Martin W. 2002. Genetics
and geography of wild cereal domestication in the near east. Nature ReviewsGenetics 3: 429–441.
New Phytologist (2019) 222: 2023–2037 � 2019 The Authors
New Phytologist� 2019 New Phytologist Trustwww.newphytologist.com
Research
NewPhytologist2036

Savolainen O, Pyh€aj€arvi T. 2007. Genomic diversity in forest trees. CurrentOpinion in Plant Biology 10: 162–167.
Schnell RJ, Brown JS, Olano CT, Meerow AW, Campbell RJ, Kuhn DN. 2006.
Mango genetic diversity analysis and pedigree inferences for Florida cultivars
using microsatellite markers. Journal of the American Horticultural Society 131:214–224.
Sennhenn A, Prinz K, Gebauer J, Whitbread A, Jamnadass R, Kehlenbeck K.
2013. Identification of mango (Mangifera indica L.) landraces from Eastern
and Central Kenya using a morphological and molecular approach. GeneticResources and Crop Evolution 61: 7–22.
Shamili M, Fatahi R, Hormaza JI. 2012. Characterization and evaluation of
genetic diversity of Iranian mango (Mangifera indica L., Anacardiaceae)genotypes using microsatellites. Scientia Horticulturae 148: 230–234.
Sherman A, Rubinstein M, Eshed R, Benita M, Ish-Shalom M, Sharabi-
Schwager M, Rozen A, Saada D, Cohen Y, Ophir R. 2015.Mango (Mangiferaindica L.) germplasm diversity based on single nucleotide polymorphisms
derived from the transcriptome. BMC Plant Biology 15: 277.Singh NK. 2016.Origin, diversity and genome sequence of mango (Mangiferaindica L.). Indian Journal of History of Science 51: 355–368.
Singh SP, Gepts P, Debouck DG. 1991. Races of common bean. EconomicBotany 45: 379–396.
Stetter MG, M€uller T, Schmid KJ. 2017. Genomic and phenotypic evidence for
an incomplete domestication of South American grain amaranth (Amaranthuscaudatus).Molecular Ecology 26: 871–886.
Surapaneni M, Vemireddy LR, Begum H, Purushotham Reddy B, Neetasri C,
Nagaraju J, Anwar SY, Siddiq EA. 2013. Population structure and genetic
analysis of different utility types of mango (Mangifera indica L.) germplasm of
Andhra Pradesh state of India using microsatellite markers. Plant Systematicsand Evolution 299: 1215–1229.
The International Peach Genome Initiative. 2013. The high-quality draft
genome of peach (Prunus persica) identifies unique patterns of genetic diversity,domestication and genome evolution. Nature Genetics 45: 487–494.
Van de Wouw M, Kik C, van Hintum T, van Treuren R, Visser B. 2010.
Genetic erosion in crops: concept, research results and challenges. Plant GeneticResources 8: 1–15.
Varshney RK, Saxena RK, Upadhyaya HD, Khan A, Yu O, Kim C, Rathore A,
Seon D, Kim J, An S et al. 2017.Whole genome re-sequencing of 292
pigeonpea cultivars, landraces and wild species accessions provides targets for
domestication and genomic regions associated with agronomic traits for crop
improvement. Nature Genetics 49: 1082.Vasugi C, Dinesh MR, Sekar K, Shivashankara KS, Padmakar B, Ravishankar
KV. 2012. Genetic diversity in unique indigenous mango accessions
(Appemidi) of the Western Ghats for certain fruit characteristics. CurrentScience 103: 199–207.
Vavilov NI. 1987. Origin and geography of cultivated plants (D L€ove, ed.).Cambridge, UK: Cambridge University Press.
Velasco D, Hough J, Aradhya M, Ross-Ibarra J. 2016. Evolutionary genomics of
Peach and almond domestication. G3-Genes Genomes Genetics 7: 3985–3993.Von Wettberg EJB, Chang PL, Bas�demir F, Carrasquila-Garcia N, Korbu LB,
Moenga SM, Bedada G, Greenlon A, Moriuchi KS, Singh V et al. 2018.Ecology and genomics of an important crop wild relative as a prelude to
agricultural innovation. Nature Communications 9: 649.
Wang R, Stec A, Hey J, Lukens L, Doebley J. 1999. The limits of selection
during maize domestication. Nature 398: 236–239.Wang X, Xu Y, Zhang S, Cao L, Huang Y, Cheng J, Wu G, Tian S, Chen
C, Liu Y et al. 2017. Genomic analyses of primitive, wild and cultivated
citrus provide insights into asexual reproduction. Nature Genetics 49:765–772.
Warschefsky E, Penmetsa RV, Cook DR, von Wettberg EJB. 2014. Back to the
wilds: tapping evolutionary adaptations for resilient crops through systematic
hybridization with crop wild relatives. American Journal of Botany 101:1791–1800.
Washburn JD, Bird KA, Conant GC, Pires JC. 2016. Convergent evolution and
the origin of complex phenotypes in the age of systems biology. InternationalJournal of Plant Sciences 177: 305–318.
Weir BS, Cockerham CC. 1984. Estimating F-statistics for the analysis of
population structure. Evolution 38: 1358–1370.Xu P, Xu S, Wu X, Tao Y, Wang B, Wang S, Qin D, Lu Z, Li G. 2014.
Population genomic analyses from low-coverage RAD-Seq data: a case study on
the non-model cucurbit bottle gourd. The Plant Journal 77: 430–442.Yang JY, Scascitelli M, Motilal LA, Sveinsson S, Engels JMM, Kane NC,
Dempewolf H, Zhang D, Maharaj K, Cronk QCB. 2013. Complex origin of
Trinitario-type Theobroma cacao (Malvaceae) from Trinidad and Tobago
revealed using plastid genomics. Tree Genetics & Genomes 9: 829–840.Yu G, Smith D, Zhu H, Guan Y, Lam TT. 2017. ggtree: an R package for
visualization and annotation of phylogenetic trees with their covariates and
other associated data.Methods in Ecology and Evolution 8: 28–36.Zeder MA. 2006. Central questions in the domestication of plants and animals.
Evolutionary Anthropology: Issues, News, and Reviews 15: 105–117.Zohary D. 2004. Unconscious selection and the evolution of domesticated plants.
Economic Botany 58: 5–10.
Supporting Information
Additional Supporting Information may be found online in theSupporting Information section at the end of the article.
Table S1Metadata for samples analyzed.
Table S2 Average STRUCTURE group assignment for mango culti-vars from geographical regions for three values of K.
Table S3 Average STRUCTURE group assignment for mango culti-vars from geographical regions and Mangifera species for threevalues of K.
Please note: Wiley Blackwell are not responsible for the contentor functionality of any Supporting Information supplied by theauthors. Any queries (other than missing material) should bedirected to the New Phytologist Central Office.
� 2019 The Authors
New Phytologist� 2019 New Phytologist TrustNew Phytologist (2019) 222: 2023–2037
www.newphytologist.com
NewPhytologist Research 2037
Copyright © 2022 FDOKUMEN