COMPARATIVE STUDY OF MANGO LEATHER - Sher-e ...
60
COMPARATIVE STUDY OF MANGO LEATHER A Thesis By SREEDAM CHANDRA PAUL Examination Roll No. 10 AEFT JD-19 M Registration No. 32486 Session: 2005-06 Semester: July-December, 2011 MASTER OF SCIENCE IN FOOD ENGINEERING DEPARTMENT OF FOOD TECHNOLOGY AND RURAL INDUSTRIES BANGLADESH AGRICULTURAL UNIVERSITY MYMENSINGH NOVEMBER, 2011
-
Upload
khangminh22 -
Category
Documents
-
view
0 -
download
0
Transcript of COMPARATIVE STUDY OF MANGO LEATHER - Sher-e ...
COMPARATIVE STUDY OF MANGO LEATHER
A Thesis
By
SREEDAM CHANDRA PAUL Examination Roll No. 10 AEFT JD-19 M
Registration No. 32486 Session: 2005-06
Semester: July-December, 2011
MASTER OF SCIENCE IN
FOOD ENGINEERING
DEPARTMENT OF FOOD TECHNOLOGY AND RURAL INDUSTRIES
BANGLADESH AGRICULTURAL UNIVERSITY MYMENSINGH
NOVEMBER, 2011

COMPARATIVE STUDY OF MANGO LEATHER
A Thesis By
SREEDAM CHANDRA PAUL
Examination Roll No. 10 AEFT JD-19 M Registration No. 32486
Session: 2005-06 Semester: July-December, 2011
Submitted to the Department of Food Technology and Rural Industries Bangladesh Agricultural University, Mymensingh
in partial fulfilment of the requirements for the degree of
MASTER OF SCIENCE IN
FOOD ENGINEERING
DEPARTMENT OF FOOD TECHNOLOGY AND RURAL INDUSTRIES BANGLADESH AGRICULTURAL UNIVERSITY
MYMENSINGH
NOVEMBER, 2011

COMPARATIVE STUDY OF MANGO LEATHER
A Thesis
By
SREEDAM CHANDRA PAUL Examination Roll No. 10 AEFT JD-19 M
Registration No. 32486 Session: 2005-06
Semester: July-December, 2011
Approved as to style and content by
__________________________ Prof. Dr. M. Burhan Uddin
Supervisor
___________________________ Prof. Dr. Md. Nazrul Islam
Co-Supervisor
______________________ (Dr. Md. Abdul Alim)
Chairman Examination Committee
and Head, Department of Food Technology and Rural Industries
Bangladesh Agricultural University Mymensingh
NOVEMBER, 2011


I
ACKNOWLEDGEMENT
All praises and appreciation are for the almighty creators enabled the author to bring this thesis
in success. I express proud gratitude and respect to my teacher and research supervisor Dr. M.
Burhan Uddin, Professor, Department of Food Technology and Rural Industries, Faculty of
Agricultural Engineering and Technology, Bangladesh Agricultural University, Mymensingh
for his guidance, encourage, suggestions and timely instruction throughout the period of
research work and preparation of this thesis.
I also express proud gratitude and respect to co-supervisor Dr. Md. Nazrul Islam, Professor,
Department of Food Technology and Rural Industries, Faculty of Agricultural Engineering
and Technology, BAU, Mymensingh for his sincere co-operation to carry this research and
preparation of this thesis.
The author also humbly desire to acknowledge heartiest appreciation and cordial thanks to Dr.
Abdul Alim, Head of the Department of Food Technology and Rural Industries, Professor Dr.
Md. Shams-Ud-Din and all other respected teachers of Department of Food Technology and
Rural Industries, Faculty of Agricultural Engineering and Technology, BAU, Mymensingh
for their cordial co-operation to carry this research and preparation of this thesis.
The author received logistic and financial support from the project entitled “Technology
Dissemination for Value Addition to Horticultural Produces by Poor Farmers to Improve their
Livelihood”, funded by ASPS-II Adoptive Research Program (DANIDA) and acknowledges
with thanks.
I also like to express gratitude to Mrs. Roushan Ara Akhter, Deputy Chief Demonstrator and
Mr. Md. Azizul Haque, Deputy Chief Technical Officer and all the staff members of the Food
Technology and Rural Industries, BAU, Mymensingh for their help during the experiment.
The Author

II
ABSTRACT
The present study was concerned with the comparative study of mango leather and
development of product the purpose of this study was to analyze the composition
of mango leather and observation of shelf life of the product. Processed mango
leather contained moisture 21-23%, ash 1.36-1.81%, Protein 8.0-8.4%, total sugar
and protein 8.40-8.47%, whereas mango pulp contain moisture 85%, Ash 0.47%,
TSS 15.1%, acidity 0.16%, vitamin C 43mg/100gm and total sugar 12.02%.
Among the eight formulated products of F1 (mango pulp 100%), F2 (mango pulp
95% + sugar 5%), F3(mango pulp 100%), F4(mango pulp 95% + milk powder 5%)
F5(mango pulp 95% + sugar 5%), F6 (mango pulp 100% ), F7(mango pulp 95% +
milk powder 5%), F8 (mango pulp 95% + sugar 5%), the formulation F7 secured
highest score for overall acceptability and ranked as “like very much” by a taste
testing panel. The formulation F7 contains mango pulp 95% and milk powder 5%.
The chemical analysis showed that the quality of mango leather was satisfactory
but vitamin C was highly reduced. However the developed products contain high
amount of nutrients and were rich in energy. Developed intermediate products
were tested of their acceptability by a taste panel consisting of 10 panelists. The
consumer’s preference was measured by statistical analysis of the score obtained
from the response of the taste panel. The statistical analysis of the score showed
that all the developed products were equally acceptable and sample F7 secured the
highest score and was ranked as “like very much”. The other products were also
liked moderately as far as overall acceptability are concerned. The mango leather
was stored in high density polyethylene packaged coated with aluminum foil and
best quality of mango leather achieved during the 90th
day.

III
CONTENTS
CHAPTER PAGE NO.
ACKNOWLEDGEMENT I
ABASTRACT II
CONTENTS III
LIST OF TABLES V
LIST OF FIGURES VI
LIST OF APPENDICES VII
1. INTRODUCTION 01
2. REVIEW OF LITERATURE 03
2.1 Mango and its nutrient content 03
3. MATERIALS AND METHODS 09
3.1 Materials required 09
3.2 Apparatus required 09
3.3 Methods 09
3.3.1 Extraction of mango pulp 10
3.3.2 Processing mango pulp 11
3.3.3 Preparation of mango leather 11
3.4 Basic formulation for preparation of mango leather 13
3.5 Chemical Analysis
3.5.1
14
3.5.2 Ash content 14
Moisture content 14
3.5.3 Acidity 15

IV
3.5.4 Reducing sugar 16
3.5.5
3.5.6
Non-reducing sugar 17
3.5.7
Estimation of total sugar 18
3.5.8
Total soluble solids (TSS) 18
PH
3.5.9
18
3.5.10
Vitamin-C content (Ascorbic acid) 19
3.5.11 Protein 23
Crude fibre 20
3.6 Sensory Evaluation 25
4. RESULTS AND DISCUSSION 26
4.1 Composition of fresh mango pulp 26
4.2 Composition of mango leather prepared from mango pulp 27
4.3 Effect of storage time and temperature on the chemical
composition of mango leather 29
5. SUMMARY AND CONCLUSION 34
REFERENCES 36
APPENDICES 42

V
LIST OF TABLES
TABLE TITLE PAGE NO.
3.1 The basic formulation for preparation of mango leather
4.1 Composition of mango pulp
4.2 Composition of processed mango leather prepared from
mango pulp
4.3 Shelf life of mango leather with packaging material at
room temperature
4.4 Mean score for color flavor texture and overall
acceptability for various types of mango leather
13
26
27
30
32

VI
LIST OF FIGURES
Figure Title Page No.
3.1Schematic diagram for preparation of mango pulp 10
3.2Schematic diagrams for preparation of mango leather 12

VII
LIST OF APPENDICS
APPENDIX TITLE PAGE NO.
1.
1.1 Rating score for color of mango leather 42
1.2 Analysis of variance (ANOVA) for color mango leather 42 1.3 Duncan’s Multiple Range Test (DMRT) for color 43
2. 2.1 Rating score for flavor of mango leather 43
2.2 Analysis of variance (ANOVA) for flavor of mango leather 44
2.3 Duncan’s Multiple Range Test (DMRT) for flavor 44
3. 3.1 Rating score for texture of mango leather 45
3.2 Analysis of variance (ANOVA) for texture of mango leather 45
3.3 Duncan’s Multiple Range Test (DMRT) for texture 46
4. 4.1 Rating score for overall acceptability of mango leather 46
4.2 Analysis of variance (ANOVA) for overall acceptability
of mango leather 47
4.3 Duncan’s Multiple Range Test (DMRT) for overall
acceptability of mango 47
5. Taste testing of mango leather 48
1
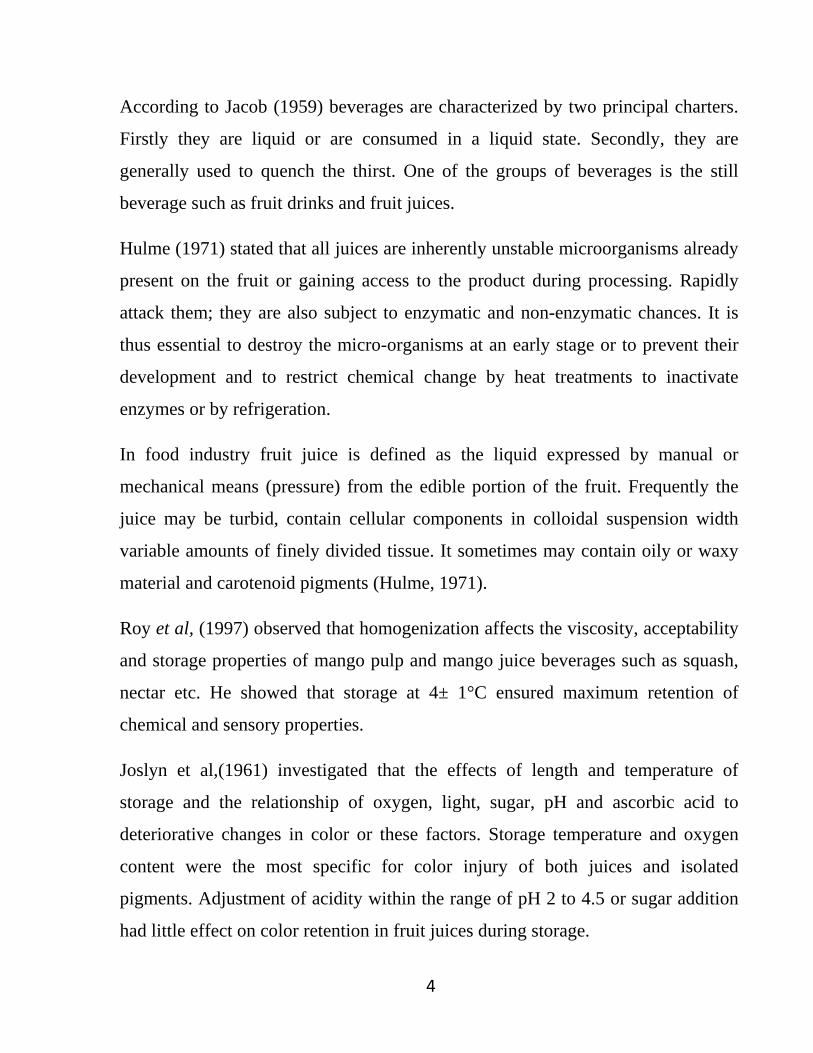
CHAPTER I
INTRODUCTION
Mango (Mangifera Indica) is called the king of fruits. It is also a delicious fruit. It
is most ancient and popular fruit in our country. There are many varieties of
mango are cultivated in our country.
The statistical data shows that in Bangladesh about 71899 acreage of land is under
mango cultivation within an annual production of 766930 metric tons (BBS,
2007). Due to the lack of post-harvest facilities losses as high as 18% (Srinivas,
et.al.1977). Mango leather is a traditional product prepared from ripe mango.
Traditionally sun drying is employed for preparing mango leather from ripe fruit
pulp. But sun dried leather is discolored and the process is unhygienic and lengthy.
Cabinet drying has been carried out for making mango leather (Heikal, et al, 1972;
Mir and Nath. 1995) resulting with better color and flavor. The main constituents
of mango are water 75- 82%; sugar 4 8.7-20%; protein 0.51%;citric acid 0.14-
0.71%; vitamin –C 8.5-50 mg per 100g and ash 0.38-0.635 ( Singh, 1968). Thus
mango is a good source of energy and nutrient.
Mango leather has very low protein content ranged from (1-2%) (Pramanik and
Segupta,1978). Protein content can be increased by adding shrimp flavor and rice
flavor when protein is isolate and 50% protein isolate (Exoma and Noriel,1989;
Payvmo et al,1981; Chauhan and Joshi 1998). Sometime additional sugar, color or
milk powder is added to the mango pulp during preparation of mango leather.
Mango is seasonal in nature and available in large quantity during the peak season.
But this fruit is perishable item and not be fresh for longer time often harvesting.

2
So adequate preservation facilities are responsible for removal of damage/spoilage
of a large quantity of its valuable fruits.
If post-harvest losses could be prevented thus farmer would get proper price of
their products.
The specific objectives of proposed study are:
• Prepare the mango leather by using mango pulp, sugar and milk
powder.
• To study the proximate composition of product.
• To study the keeping quality and shelf life of the processed mango
leather.

3
CHAPTER II REVIEW OF LITERATURE
2.1 Mango and its nutrient content
Jain (1961) has reviewed the chemical composition of mango. It is rich of
carbohydrate as well as vitamin A and C. The following is the chemical
constituent present in mango (25 varieties). Sugar constitutes main bulk of the
carbohydrates and most of the soluble solids in ripe mango.
Chemical Constituent Quantity
1. Moisture 73.9-86.75%
2. Carbohydrate 11.6-24.31%
3. Protein 0.3-1.0%
4. Fat 0.1-0.8%
5. Minerals 0.3-0.7%
6. Vitamin A 650-25940 I.U.
7.Vitamin-C 3.0-83 mg/100 g
Singh (1986) reported that the main constituents of mango were -
Chemical Constituent Quantity 1. Water 75 to 82%
2. Sugar 8.7 to 25%
3. Protein 0.51%
4. Citric acid 0.14 to 0.7%
5. Vitamin-C 8.5 to 50 mg per 100 g
6. Ash 0.38 to 0.63%
4
According to Jacob (1959) beverages are characterized by two principal charters.
Firstly they are liquid or are consumed in a liquid state. Secondly, they are
generally used to quench the thirst. One of the groups of beverages is the still
beverage such as fruit drinks and fruit juices.
Hulme (1971) stated that all juices are inherently unstable microorganisms already
present on the fruit or gaining access to the product during processing. Rapidly
attack them; they are also subject to enzymatic and non-enzymatic chances. It is
thus essential to destroy the micro-organisms at an early stage or to prevent their
development and to restrict chemical change by heat treatments to inactivate
enzymes or by refrigeration.
In food industry fruit juice is defined as the liquid expressed by manual or
mechanical means (pressure) from the edible portion of the fruit. Frequently the
juice may be turbid, contain cellular components in colloidal suspension width
variable amounts of finely divided tissue. It sometimes may contain oily or waxy
material and carotenoid pigments (Hulme, 1971).
Roy et al, (1997) observed that homogenization affects the viscosity, acceptability
and storage properties of mango pulp and mango juice beverages such as squash,
nectar etc. He showed that storage at 4± 1°C ensured maximum retention of
chemical and sensory properties.
Joslyn et al,(1961) investigated that the effects of length and temperature of
storage and the relationship of oxygen, light, sugar, pH and ascorbic acid to
deteriorative changes in color or these factors. Storage temperature and oxygen
content were the most specific for color injury of both juices and isolated
pigments. Adjustment of acidity within the range of pH 2 to 4.5 or sugar addition
had little effect on color retention in fruit juices during storage.

5
Yuan Tayshyu et al, (1996) studied the processing parameters of mango juice
quality. He showed that among the parameters desecration decreased the dissolved
oxygen and thus minimizes the loss of vitamin C during pasteurization. He found
that storage temperature (25-30°C) affects the quality of mango juice Vitamin C,
color and viscosity declined but TSS, pH, acidity etc. did not change significantly.
Ahmed et al,(1988) studied organic and mango beverage prepared with different
sugar acid combinations and evaluated their physiochemical and organoleptic
characteristics during storage at room temperature (10-330C). Different sugar and
acid concentration used had no significant effect on ascorbic acid content and
variations observed in acidity, total soluble solids TSS) and their ratio during
storage was mainly due to difference in initial sugar and acid content. Ascorbic
acid and acidity decreased whereas TSS and TSS/acid ratio increased during
storage.
Flaumenbaum and Shengeliya (1974) reported that the taste of sweetened fruit
juice depends upon the sugar/juice acid ratio. Minimum sugar content should be
18%, acidity 0.8-1.5% and the sugar/acid ratio 20-29.
Cruess(1958) observed that preservation the flavor, aroma, color and vitamin
content of the fresh juice was dependent on the degree of destruction off enzymes
or inhibition of their activity. Enzymes could be destroyed and activity could be
inhibited by pasteurization.
Ahmed (1982) reported that mangoes are one of the richest sources of vitamin-A.
They contain a good amount of Niacin and Riboflavin and a fair quantity of
vitamin C. Unripe mangoes are rich source of vitamin C and iron.

6
Miller et al, (1982) reported that mango juice have a high sugar content but is a
poor source of calcium, phosphorus and iron. Mango has sufficient yellow
pigment provide pro-vitamin A. Mango have been found to be poor source of all
three B vitamins, Thiamine, Riboflavin and Niacin. In green stage ascorbic acid
content is high than half ripe and ripe stage.
BCSIR laboratories in Rajshahi (Anonymous, 1975) investigated the compatibility
of ripe mango juice is mixture with other fruit juice such as pineapple, lemon,
guava etc. It has been observed that the mixed fruit juice had great consumer
appeal. The Central Food Technological Research Institute (CFTRI) proposed a
recipe for the preparation of a mango squash as follows; mango pulp 1 kg; water 1
kg; sugar 1 kg; citric acid 30 g; edible mange yellow color and potassium meta-
bisulphate (KMS) at the rate of 610 mg per kg of finished product (Anonymous,
1975).
EI-Nernr et al, (1989) reported that the freshly prepared and bottled juice was
analyzed for various volatile aroma compounds including esters, carboxyl
compounds, alcohols and lactose. The bottling process resulted in a sharp decrease
in the content of all volatile fractions, especially esters. During subsequent storage,
the contents of these fractions, especially alcohols and lactoses, increased to levels
higher than those in freshly prepared juice.
EI-Sarnaly et al, (1983) studied concentrated mango juice which was stored at –
12°C or 4.5°C for 11 months. Samples were analyzed at storage onset day 0), after
1 month and at 2 months intervals, for chemical composition f acidity as citric acid
%, contents of ascorbic acid, free amino-N carotenoids and pulp; color index and
% reducing sugars and non- reducing sugar) and for flavor substances (esters,
limonene, oxygenated terpenes and carboxyl compounds). He found that there
7
were marked decreases in ascorbic acid content and color index and a marked
increase in pulp content with changes being more marked for the higher storage
temperature, with changes also being greater for storage at 40°F.
FAO and WHO Jointly defined "food additive" as non-nutritive substances added
intentionally to food, generally in small quantities, to improve its appearance,
flavor, texture or storage properties. Some chemicals added to food to impart a
desired quality or for some other functional purpose may be of nutritive value.
Rangana and Bajaj (1990) reported that S02 is widely used throughout the world
principally for treating food of plant origin. It is used in the preservation of fruit
juices, pulps, beverages and concentrates; concentration used may vary from 350
to 2000 ppm. Soluble sulphite salts (e.g. K. M. S) are usually used in treating fruits
products. The activity is higher at pH below 4.0.
Ahmed (1982) reported that mangoes are one of the richest source of vitamin-A.
They contain a good amount of niacin and riboflavin and a fair quantity of
vitamin- C. Unripe mangoes are reach source of vitamin C and iron.
The mangoes can be separated into three parts skin, flesh on pulp and store,
Philippine mangoes have been found to contain 11 to 18% skin, 14-22% seed and
60-73% pulp (Prott and Del Rosorio,1973) whereas mangoes in Hawaii contains
an average of 63-77% of edible matter (Pope 1992). The flesh content of mango,
as reported from various mango growing zones, varies from 58-75% (Winton and
Winton,1935). From the result of analysis of twenty one varieties of mango
growing in Florida, it appears that the seed varies from 6.8 to 17.9 percent, the
skin 9.3 to 16.5 percent and the pulp 69.1 to 93.3 percent (Mustard and Lynch,
1954).

8
Ajila et al,(2007) reported that polyphenol contents in mango peel ranged from 45
to 78% of peel and was found at a higher level in ripe peels. Similarly, coronoid
content was higher in ripe fruit peels. Vitamin C and E contents ranged from 188
to 392 and 205 to 509 micro g/g dry peel and these were found at a higher level in
ripe peels. Both raw and ripe mango peels exhibited significant amount of
protease, peroxide, polyphenol oxidase, xylenes and amylase activities.
Vasquez at al, (2007) observed the effects of thermal mango processing on beta-
carotene stability and inactivation of peroxidase (POD) and polyphenol oxidase
(PPO) which were systematically evaluated on a laboratory scale, mimicking
typical operations in continuous and small-size batch production of mango puree.
Maximum vitamin A loss during pasteurization of mango puree did not exceed
15.4 owning to a total beta-carotene retention of 93% PPO was readily inactivated
after 1 min, whereas residual POD activities of 4.0-6.3% were defected, ever after
16 min at all pasteurization temperatures.
Rebeiro et al,(2007) reported the pulp composition of four mango cultivators
(Haden.Tommy Atkins and Uba) of the opening stage of relation to three
components with antioxidant potential (total phenolic, carotenoid and ascorbic
acid).Differences were found among the four mango cultivators in all the
components analyzed. The content of phenolic compounds ranged from 48.40
(Haden) to 2/63 mg/100g(palmer)beta-carotene from 661.27 (palmer) ; (Uba) and
total ascorbic acid ranged from 9.79 (Tommy Atkins) to 77.71 mg /100g(Uba).
These results corroborated previous information that mangoes are good source of
antioxidants in human diet.

9
CHAPTER III
MATERIALS AND METHOD
The study was conducted in the laboratory of the department of Food Technology
and Rural Industries, Faculty of Agricultural Engineering and Technology
Bangladesh Agricultural University, Mymensingh.
Materials and Apparatus required
3.1.1Materials required
i. Mango
ii. Sugar
iii. Milk Powder
3.1.2 Apparatus required
i. Electric balance
ii. Petridis
iii. Crucible
iv. Desiccator
v. Stainless steel knives
vi. Measuring Flash
vii. High density polyethylene bag with aluminum foil
Methods
a) Extraction of mango pulp
b) Processing mango pulp
c) Preparation of mango leather

10
a) Extraction of mango pulp Fresh fully ripe sound Ashwani mangoes were used for extraction of pulp. Firstly
ripe mangoes were washed within clean water then fruits were peeled by knife.
Pulp was collected by squeezing the flesh of mangos. The pulp was blended in an
electric blender. The mango pulp contains 15.1% total solid. It was stored in a
deep freeze at a temperature of -180C for future use.
Fig:3.1 Schematic diagram for preparation of mango pulp

11
b) Processing mango pulp
Fresh mango pulp contains 15.1% of total solid. So pulp TSS percentage should be
increase for quality mango leather processing. First all fresh mango pulp poured
into a bowl. Then the bowl was heated at 80-900
c) Preparation of mango leather
C until Total Soluble Solid (TSS)
percentage become 30.
At first processed mango pulp were taken and weighted by a balance. Then total
mango pulps were separated into three parts in order to processing of three kinds
of sample. After that mango pulps were mixed with weighted sugar and milk
powder according to the described formulation. Mixed pulp were heated at 80-
900C for 10 minutes and cooled. Then mixture was placed on a steel tray and
smeared with very thin layer of polyethylene to preserve sticking of mango leather
after drying. The mixture was dried by using cabinet dryer with constant
temperature 600C a maximum period of 18 hours. After drying sheet was cut into
(4"×1"×various thickness) bar form. The mango leathers were packed with high
density polyethylene bag and stored at room temperature.
Schematic flow diagram for mango leather is given in following figure:

12
Fig: 3.2 Schematic diagrams for preparation of mango leather

13
3.3 Basic formulation for preparation of mango leather
Basic formulation for preparation of mango leather is presented in the table 3.1the
formulation F1 contained mango pulp 100%. Any kinds of other ingredients are
not used in formulation F1, Formulation F2 contained mango pulp 95% and sugar
5%, Formulation F3 contained only mango pulp100%, Formulation F4 contained
mango pulp 95% and milk powder 5%, Formulation F5 contained mango pulp
95% and milk powder 5%, Formulation F6 contained only mango pulp 100%,
Formulation F7 contained mango pulp 95% and sugar 5%, Formulation F8
contained 95% mango pulp and milk powder 5% and traditional formulation Ft
Sample
contain 100% mango pulp.
Table: 3.1The basic formulation for preparation of mango leather
Formulation Ingredient (%)
Mango Pulp Sugar Milk powder
Single layer
(3mm)
F 100 1 - -
F 95 2 5 -
Two layers
(5mm)
F 100 3 - -
F 95 4 5 -
F 95 5 - 5
Three layers
(7mm)
F 100 6 - -
F 95 7 5 -
F 95 8 - 5
Traditional
(4mm)
F 100 t - -

14
3.5 Chemical Analysis
The ripe mango pulp, pineapple juice and papaya pulp and stored mixed fruit
bar were analyzed for their moisture, ash, titrable acidity, pH, total soluble solids,
total sugar, fibre content and vitamin C. All the determinations were done in
triplicate and the results were expressed as average value.
3.5.1 Moisture content
Moisture content was determined adopting AOAC (2005) method.
Procedure:
At first weight of empty previously dried (1 hr. at 100°C) crucible with cover
was taken and 5gof sample was placed on it. Then the crucible was placed in an
air oven (thermostatically controlled) and dried at temperature of 100 to 105°C
for 24 hrs. After drying, the crucible was removed from the oven and cooled in
desiccator. It was then weighed with cover glass. The crucible was again
placed in the oven, dried for 30 minutes, took out of the dryer, cooled in
desiccator and weighed. Drying, cooling, and weighing were repeated until
the two consecutive weights were the same. From these weights the percentage
of moisture in food samples was calculated as follows:
Moisture ×100
3.5.2 Ash content
Ash content of a foodstuff represents inorganic residue remaining after
destruction of organic matter. The oven-dried sample was taken in a muffle
furnace at 600' C for 4 hrs. After charring over an electric heater.

15
The difference between oven dried matter and final weight represented the ash,
which was expressed in percentage. It was calculated using the following formula:
Ash content =
Where, F= Weight of ash
I=Initial weight of dry matter
3.5.3 Acidity
Acidity was determined following the methods of Jacob (1959) and Rangana
(1990). Known volume of the, fruit pulp was measured in graduated cylinders and
then they were transferred to beakers and sufficiently. The juices were then cooled
and poured back to the same graduated measuring cylinder and made up to the lost
volume with distilled water.
Titration
10m1 pulp/juice was taken in a100ml conical flask. A few drops of 1%
phenolphthalein solution (indicator) was added to the flask and titrated with 0.1N
NaOH solution from a burette until a light pink color appeared and persist for 15
seconds. The titration was done for several times for accuracy. Percent
titrable acidity was calculated using the following formula:
Titrable acidity =
Where,
T= Titre
N= Normality
V1=Volume made up
E= Equivalent weight of acid

16
V2=Volume of sample taken for estimation
W= Weight of sample
3.5.4 Reducing sugar
The reagents used for the estimation of reducing, non-reducing and total
sugar were follows:
i) Fehling's solution (A)
ii) Feeling's solution (B)
iii) Methylene blue indicator
iv) 45% Neutral lead acetate solution
v) 22% Potassium oxalate solution
Standardization of Fehling's solution
10 ml of both Fehling's solution A and Feeling's solution B were mixed together
in a beaker. 10 ml of mixed solution was pipetted into a 250 ml conical flask
and 25 nil distilled water was added to it. Standard sugar solution was taken in
a burette. The conical flask containing mixed solution was heated on a hot plate.
When the solution began to boil, three drops of methylene blue indicator
solution was added to it. Mixed solution was titrated by standard sugar
solution. The end point was indicated by decolorization of the indicator.
Fehling's factor was calculated by using the following formula:
Fehling’s factor=

17
Preparation of the sample 10 g of filtered juice and 100 ml of distilled water were mixed in homogenizer
and transferred to 250 ml volumetric flask. The mixture was neutralized with 0.1N
NaOH and 2 ml of lead acetate solution was added and followed to stand for
10 minutes. 5 ml potassium oxalate solution was added and made to a volume
of 250 ml. Then the mixture was filtered and made the dilution.
Titration for reducing sugar
10 ml of mixed Fehling's solution was taken in a conical flask and 25 ml
of distilled water was added to it. Purified juice was taken in a burette. Conical
flask containing mixed Feeling's solution was added to the flask when boiling
started and titrated with solution taken in the burette at the same time the end
point was indicated by decolorization of indicator. Percent reducing sugar was
calculated by using the following formula:
Reducing sugar =
Where, I = mg of invert sugar required to reduce known volume of
Fehling's solution
D = dilution factor
T = titration
W = weight of sample
50 ml purified solution was taken in a conical flask.5 ml distilled water and 5 g
of citric acid were added to it. Then the conical flask was heated for 10 minutes
3.5.5 Non-reducing sugar

18
for addition of sucrose and finally cooled. The sample was then neutralized by 0.1
N NaOH solution using phenolphthalein as indicator. The volume was made
up to 100 ml with distilled water. The mixed Fehling's solution was titrated using
similar procedure followed as that for reducing sugar. The percent invert sugar
was then calculated by the similar procedure as for reducing sugar from which the
percent non-reducing sugar is calculated as follows:
% Non-reducing sugar =% Invert sugar - %Reducing sugar
3.5.6 Estimation of total sugar
Total sugar can be calculated as follows:
% Total sugar = %Reducing sugar +%Non-reducing sugar.
3.5.7 Total soluble solids (TSS)
Two drops prepared pulp was taken in a refractometer (Model no. 8987
PujiKuki Ltd. Tokyo, Japan) plate and the total soluble solids of the juice was
read directly from the refractometer.
3.5.8 pH
An electrolytic cell composed of two electrodes (caramel and glass electrode) was
standardized with buffer solution of pH = 4.0. Then the electrodes were
dipped into the test sample. A voltage corresponding to the PH of the
solution was developed and directly one can read the PH of the solution
indicated by the instrument (potentiometer).
19
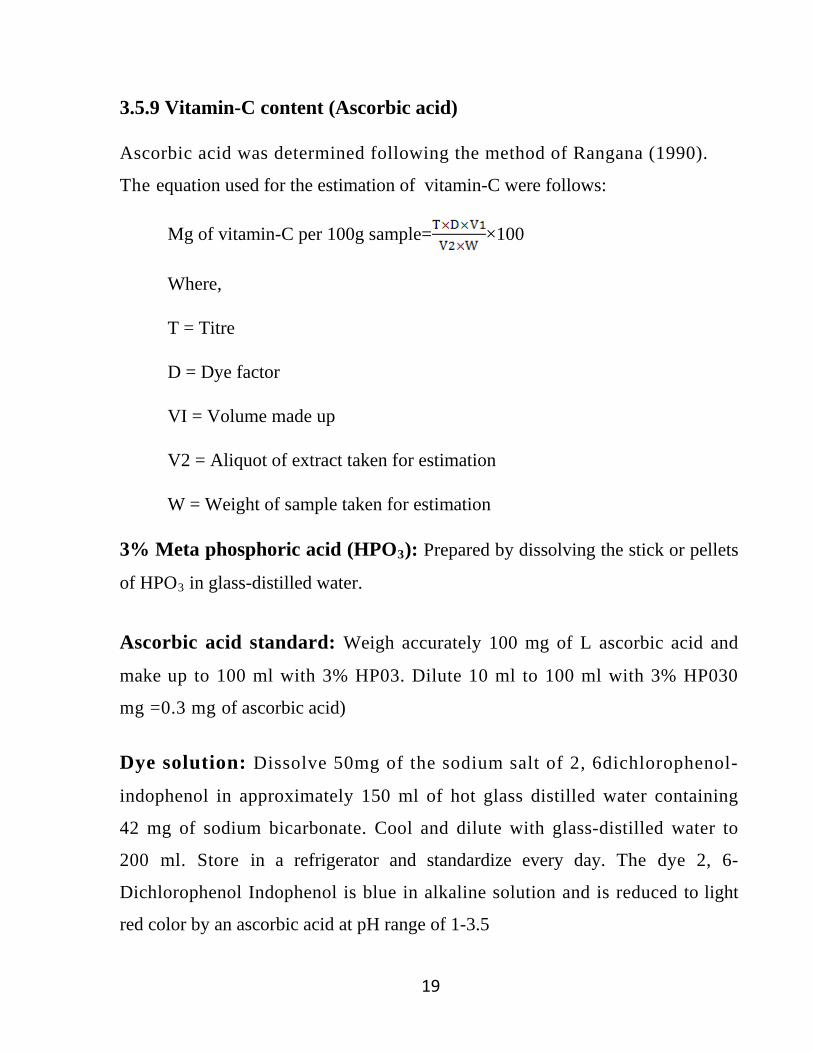
3.5.9 Vitamin-C content (Ascorbic acid)
Ascorbic acid was determined following the method of Rangana (1990).
The equation used for the estimation of vitamin-C were follows:
Mg of vitamin-C per 100g sample= ×100
Where,
T = Titre
D = Dye factor
VI = Volume made up
V2 = Aliquot of extract taken for estimation
W = Weight of sample taken for estimation
3% Meta phosphoric acid (HPO3): Prepared by dissolving the stick or pellets
of HPO3 in glass-distilled water.
Ascorbic acid standard: Weigh accurately 100 mg of L ascorbic acid and
make up to 100 ml with 3% HP03. Dilute 10 ml to 100 ml with 3% HP030
mg =0.3 mg of ascorbic acid)
Dye solution: Dissolve 50mg of the sodium salt of 2, 6dichlorophenol-
indophenol in approximately 150 ml of hot glass distilled water containing
42 mg of sodium bicarbonate. Cool and dilute with glass-distilled water to
200 ml. Store in a refrigerator and standardize every day. The dye 2, 6-
Dichlorophenol Indophenol is blue in alkaline solution and is reduced to light
red color by an ascorbic acid at pH range of 1-3.5
20
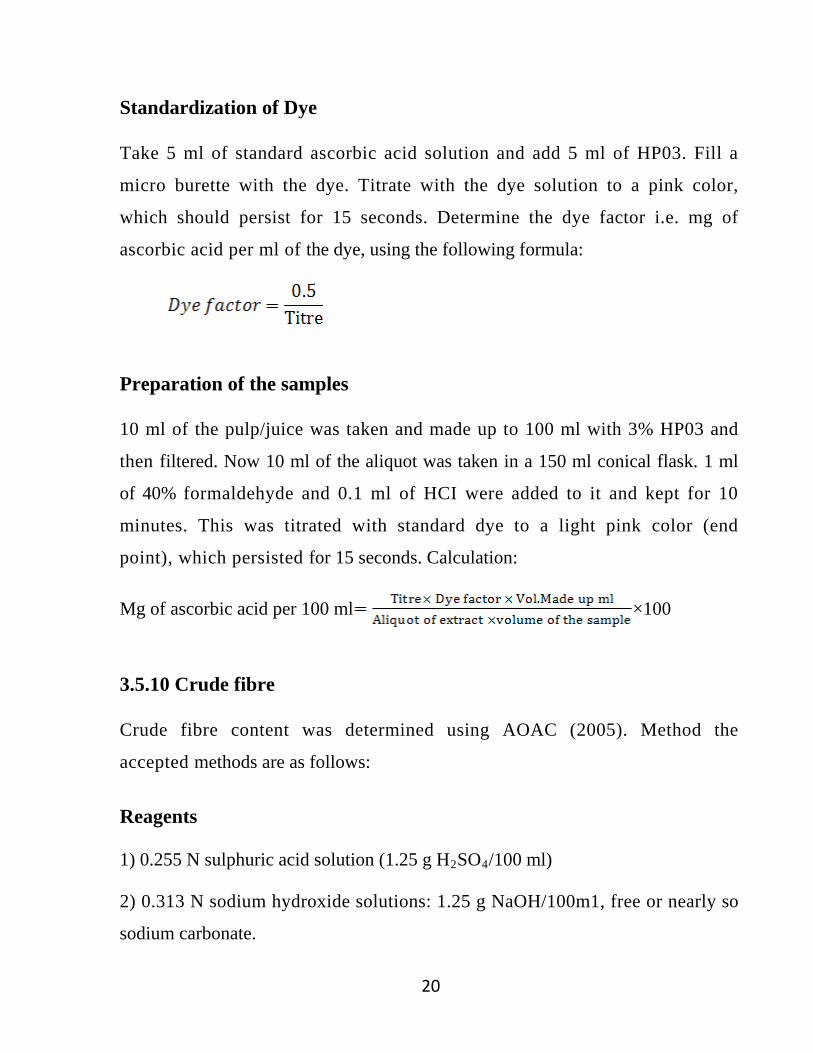
Standardization of Dye
Take 5 ml of standard ascorbic acid solution and add 5 ml of HP03. Fill a
micro burette with the dye. Titrate with the dye solution to a pink color,
which should persist for 15 seconds. Determine the dye factor i.e. mg of
ascorbic acid per ml of the dye, using the following formula:
Preparation of the samples
10 ml of the pulp/juice was taken and made up to 100 ml with 3% HP03 and
then filtered. Now 10 ml of the aliquot was taken in a 150 ml conical flask. 1 ml
of 40% formaldehyde and 0.1 ml of HCI were added to it and kept for 10
minutes. This was titrated with standard dye to a light pink color (end
point), which persisted for 15 seconds. Calculation:
Mg of ascorbic acid per 100 ml ×100
3.5.10 Crude fibre
Crude fibre content was determined using AOAC (2005). Method the
accepted methods are as follows:
Reagents
1) 0.255 N sulphuric acid solution (1.25 g H2SO4
2) 0.313 N sodium hydroxide solutions: 1.25 g NaOH/100m1, free or nearly so
sodium carbonate.
/100 ml)

21
Check the concentration of the solution 1 and 2 by titration and adjust
(if necessary) accurately to the stated concentration.
3) Asbestos: Gooch grade, medium fibre, acid-washed and ignited.
4) 10% Potassium sulphate (K2S04) Solution: Dissolve 10 g in water make
up to 100 ml.
1) Liebig condenser.
Apparatus
2) Filtering cloth: Use filtering cloth of such character that no solid
material passes through when filtering. (Retention may be tested by
passing the filtrate through Gooch.) Bucher's lilen or dressed lilen with
approximately 45 Threads per inch may be used.
Determination
Extract 2g of dry material with either or use the residue from crude fat
determination. Transfer the residue and approximately 0.5 g of asbestos, to the
digestion flask. Add 200 ml of the boiling sulphuric acid solution,
immediately connect the digestion flask with condenser, and heat. (Contents of
the flask must come to boiling within 1 min and boiling must continue briskly
for exactly 30 min.) Rotate the flask frequently until the sample is
thoroughly wetted. During digestion take care to keep the material from
remaining on the side of the digestion flask without contact with the solution.
After 30 minutes remove the flask and filter through filtering cloth in a
fluted funnel. Wash with boiling water until the washing are no longer acid. Heat

22
sodium hydroxide solution to boil under reflux condenser. Wash the residue from
acid digestion back.
Into the flask with 200 ml of boiling sodium hydroxide solution connect the
flask with reflask condenser and boil for exactly 30 min.
After 30 min of boiling remove the flask and immediately filter through
filtering cloth in a fluted funnel. Wash with water. For materials, difficult to
filter, filter through filtering cloth in a fluted funnel using vacuum and
wash with 10% potassium sulphate solution. The potassium sulphate solution
may be added during filtration, whenever it becomes difficult. Return the residue
to the digestion flask thorough washing all residues from cloth with hot
water. Filter into the Gooch crucible prepare with thin but a packed layer of
ignited asbestos. After thorough washing of the residue in the Gooch
crucible with holing water, wash with approximately 15 ml of alcohol. Dry
the crucible and the contents at 1100C to constant weight. Cool in a desiccator
and weight. Ignite the contents of crucible in anelectric muffle furnace or over a
burner at dull red heat until carbonaceous matter is destroyed (approximately 20
min). Cool in a desiccator and weight. The loss in weight represents crude fibre.
Calculation
Crude fibre ×100

23
3.5.11 Protein
The accepted methods are as follows. The reagents used for the estimation of
protein were as follows:
1) Concentrated H2S0
2)
4
Potassium, Sulphate = 100g
Copper Sulphate-10 g
Selenium dioxide=2.5 g
Digestion mixture:
3) Boric Acid Solution
4) Alkali solution
5) Mixed indicator solution
6) Standard HCI (0. 1N)
For estimation of protein, the steps were followed:
Digestion: 2g sample, 5 g digestion mixture and 25 ml H2S04
Distillation: After digestion 100ml. water , 100 ml 40% NaOH and glass
blitz were added in the kjeldahl flask which containing about 10 ml 2% boric
acid and 2-3 drops mixed indicator. About 100m1 distillate was collected just
before the distillation was stopped the receiving flask was moved. So that
were taken
in a kjeldahl digestion flask. It was heated for 4 hours in a kjeldahl digestion
and distillation apparatus) If the color of the substance is pale yellow the
digestion is complete.

24
the tip of the distilling tube was out the distillate. Some distilled was collected
in this way to make sure the condenser tube was free from traces of ammonia.
Titration: The calculation of the percent of protein in the sample using
protein factor 6.25.
Nitrogen = ×100
Where,
T= Titre value of the sample (ml)
TB=Titre value of the Bank (ml)
meq. of N2
=0.014
% Protein =% Nitrogen× Protein factor

25
3.6 Sensory Evaluation
Sensory evaluations of all the formulated mango leather were done by taste testing
panel. The taste testing panel was made up with of 10 test panelists. They were
asked to evaluate color, flavor, texture and overall acceptability by a scoring rate
on a 9 point hedonic scale. 9 Like extremely, 8 = Like very much, 7 = Like
moderately, 6 = Like slightly, 5=neither like nor dislike, 4 = Dislike slightly, 3 =
Dislike moderately, 2= Dislike very much and 1 = Dislike extremely. The
preference differences were evaluated by statistical analysis of the data for
variance and consequently Duncan's Multiple Range Test (DMRT). Procedures of
the Statistical Analysis System (SAS, 1985) were used for statistical analysis.
A panel of 10 judges tested the color, flavor, texture and overall acceptability of
mango leather in various ration. The mean scores for color, flavor, texture and
overall acceptability of different types of mango leather such as F1, F2, F3, F4 , F5,
F6 , F7 , F8 and Ft are presented in table 4.4

26
CHAPTER IV
RESULTS AND DISCUSSION
4.1 Composition of fresh mango pulp
The mango pulp was prepared as per the method described in section 3.2. The
mango pulp analyzed for moisture, ash, acidity and sugar. The results are shown in
table 4.1. The mango pulp contained moisture 85%, ash 0.47%, acidity 0.16%,
vitamin-C 43 mg per 100 g. TSS 15.01 and total sugar 12.02%.
Table 4.1 Composition of mango pulp
Chemical Constituents of mango Quantity
1. Moisture 85%
2. Ash 0.47%
3. Total soluble solid(TSS) 15.1%
4. Acidity 0.16%
5. Vitamin-C(mg/100g) 43
6. Total sugar 12.02
4.2 Composition of mango leather prepared from mango pulp
The composition of mango leather prepared from mango pulp were analyzed for
moisture, ash, acidity, vitamin-C, total sugar protein and fibre. The results are
presented in that formulation F1 contains moisture 22%, vitamin-C 13 mg/100 g,
ash 1.81%, acidity 0.09% total sugar 58.98% protein 1.0% and fibre 1.15%.
Formulation F2 contains moisture 20%, vitamin-C 13 mg/100 g, ash 1.76%, acidity
0.09%, total sugar 58.80% protein 1.0% and fibre 1.18%. Formulation F3 contains

27
moisture contain 20%, ash 1.38%, acidity 0.09. Formulation F4 contains moisture
content 21%,ash 1.48%,acidity 0.07%.Formulation F5 contains moisture content
20%, ash 1.49% , acidity 0.07% .Formulation F6 contains moisture content 23%,
acidity 0.09%,total sugar 58.85%. Formulation F7 contains moisture content 22%,
ash 1.48%, acidity 0.08% and Formulation F8 contains moisture content 21%, ash
1.44% and acidity 0.09% and traditional formulation Ft
Chemical Composition
contain moisture content
25.7%, acidity 0.09%, fibre 1.20%, ash 1.45% and protein 1.0%.
Table: 4.2 Composition of processed mango leather prepared from mango pulp
Formulation
F F1 F2 F3 F4 F5 F6 F7 F8 t
Moisture (%) 22 20 20 21 20 23 22 21 25.75
Vitamin-C (mg/100g)
13 13 14 14 11 13.90 13 13 11.35
Acidity (%) 0.09 0.08 0.09 0.07 0.07 0.09 0.08 0.09 0.09
Ash (%) 1.81 1.76 1.36 1.48 1.49 1.43 1.48 1.44 1.45
Total sugar (%) 58.98 58.8 58.95 58.00 58.90 58.85 58.80 58.95 56.5
Protein 1.0 1.0 1.0 1.0 1.0 1.0 1.0 1.0 1.0
Crude fibre 1.15 1.18 1.18 1.19 1.15 1.16 1.15 1.16 1.20
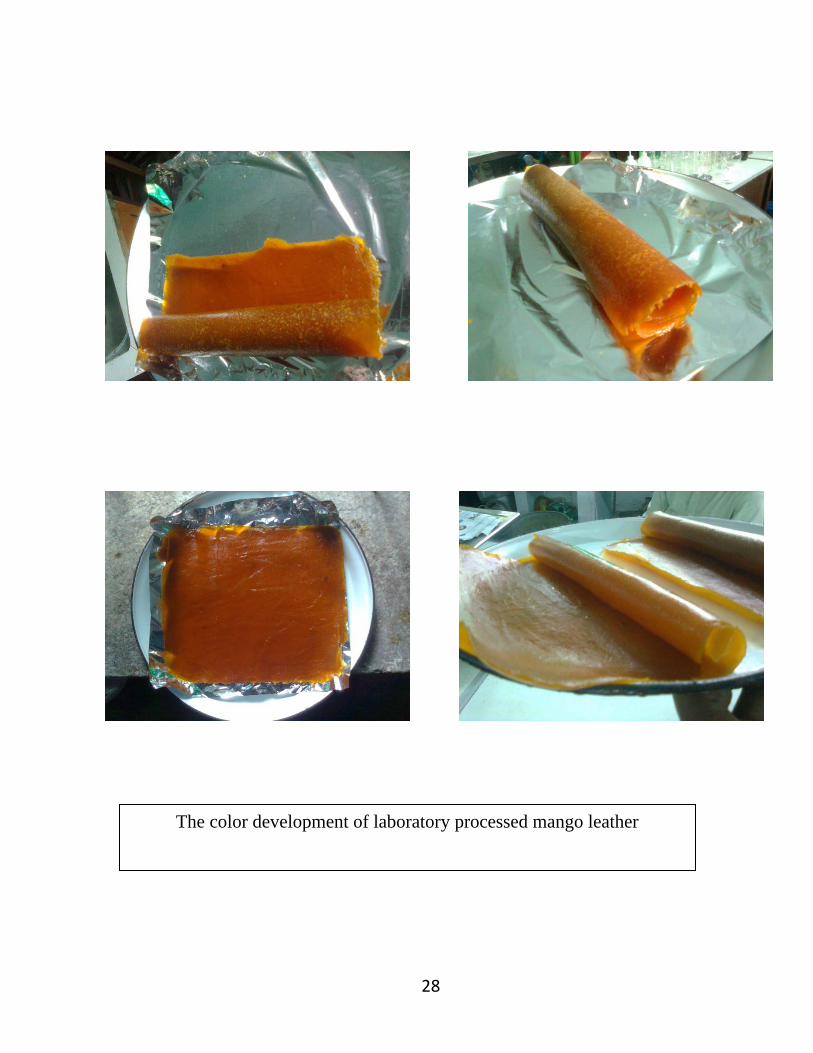
28
The color development of laboratory processed mango leather

29
4.3 Effect of storage time at room temperature on the composition of mango leather
This study was conducted to assess the storage time of 150 days, temperature (22-
250C) and packaging materials of high density polyethylene coated with
aluminium foil. Each of the samples was studied after 15 days interval. Studied
shelf life of mango leathers are given in the table 4.2. From table 4.2 we can see
that each of the sample were fresh before the observation of 120th day. There are
no changes in color, flavor and texture of product during these times.
After the observation of 90 days Ft shows light brown colour and partially off
flavour but after the observation of 120 day formulation F1, F3, F6 and F7 show
light brown color, off flavor. There is no fungal growth found during 120th day
observation. At the observation of 150th day formulation F1, F6 show light brown
color, off flavor and formulation F2, F3, F4, F5, F7 and F8 show brown color, off
flavor. Fungal growth was found during the observation of 150th day.

30
Table 4.3 Shelf life of mango leather with packaging material at room temperature
Storage period (day)
Formulation
Color Flavor Texture Fungal growth
Remarks
0
F Deep Orange 1 Pleasant Soft Not visible
Acceptable
F Light orange 2 Pleasant Soft Not visible F Deep Orange 3 Pleasant Soft Not visible F Deep Orange 4 Pleasant Soft Not visible F Light orange 5 Pleasant Soft Not visible F Deep Orange 6 Pleasant Soft Not visible F Deep Orange 7 Pleasant Soft Not visible F Light orange 8 Pleasant Soft Not visible F Light orange t Pleasant Soft Not visible
15
F Deep Orange 1 Pleasant Soft Not visible F Light orange 2 Pleasant Soft Not visible F Deep Orange 3 Pleasant Soft Not visible F Deep Orange 4 Pleasant Soft Not visible F Light orange 5 Pleasant Soft Not visible F Deep Orange 6 Pleasant Soft Not visible F Deep Orange 7 Pleasant Soft Not visible F Light orange 8 Pleasant Soft Not visible F Light orange t Pleasant Soft Not visible
30
F Deep Orange 1 Pleasant Soft Not visible F Light orange 2 Pleasant Soft Not visible F Deep Orange 3 Pleasant Soft Not visible F Deep Orange 4 Pleasant Soft Not visible F Light orange 5 Pleasant Soft Not visible F Deep Orange 6 Pleasant Soft Not visible F Deep Orange 7 Pleasant Soft Not visible F Light orange 8 Pleasant Soft Not visible F Light orange t Pleasant Soft Not visible
45
F Deep Orange 1 Pleasant Soft Not visible F Light orange 2 Pleasant Soft Not visible F Deep Orange 3 Pleasant Soft Not visible F Deep Orange 4 Pleasant Soft Not visible F Light orange 5 Pleasant Soft Not visible F Deep Orange 6 Pleasant Soft Not visible F Deep Orange 7 Pleasant Soft Not visible F Light orange 8 Pleasant Soft Not visible F Light orange t Pleasant Soft Not visible

31
60
F Deep Orange 1 Pleasant Soft Not visible
Acceptable
F Light orange 2 Pleasant Soft Not visible F Deep Orange 3 Pleasant Soft Not visible F Deep Orange 4 Pleasant Soft Not visible F Light orange 5 Pleasant Soft Not visible F Deep Orange 6 Pleasant Soft Not visible F Deep Orange 7 Pleasant Soft Not visible F Light orange 8 Pleasant Soft Not visible F Light orange t Pleasant Soft Not visible
90
F Deep Orange 1 Pleasant Soft Not visible F Light orange 2 Pleasant Soft Not visible F Deep Orange 3 Pleasant Soft Not visible F Deep Orange 4 Pleasant Soft Not visible F Light orange 5 Pleasant Soft Not visible F Deep Orange 6 Pleasant Soft Not visible F Deep Orange 7 Pleasant Soft Not visible F Light orange 8 Pleasant Soft Not visible F Light brown t Partially off flavor Soft Not visible
120
F Light brown 1 Partially off flavor Soft Not visible F Brown 2 Off flavor Hard Not visible F Light brown 3 Partially off flavor Soft Not visible F Brown 4 Off flavor Hard Not visible F Brown 5 Off flavor Hard Not visible F Light brown 6 Partially off flavor Soft Not visible F Light brown 7 Partially off flavor Soft Not visible F Brown 8 Off flavor Hard Not visible F Light brown t Partially off flavor Soft visible
150
F Light brown 1 Partially off flavor Soft Visible Fermentation F Brown 2 Off flavor Hard Visible F Brown 3 Off flavor Hard Visible F Brown 4 Off flavor Hard Visible F Brown 5 Off flavor Hard Visible F Light brown 6 Partially off flavor Soft Visible
F Brown 7 Off flavor Hard Visible
F Brown 8 Off flavor Hard Visible
F Brown t Off flavor Hard Visible

32
Sensory evaluation
For all samples ANOVA (analysis of variance) and DMRT (Duncan’s Multiple
Range Test) was done ANOVA was carried for color flavor texture and overall
acceptability at 5% significant difference.
Table: 4.4 Mean score for color flavor texture and overall acceptability for various
types of mango leather
Sample code Sensory attributes
Color Flavor Texture Overall
acceptability
F 7.31 7.3c 7.6d 7.6bc bc
F 7.42 7.3c 7.4d 7.5c bc
F 8.03 8.0b 8.1bc 7.9ab bc
F 7.84 7.5bc 7.7d 7.5abc bc
F 7.45 7.4c 7.5d 7.3bc c
F 8.66 8.1a 8.1b 8.0ab ab
F 8.67 8.6a 8.3a 8.5a a
F 7.78 7.4bc 7.5d 7.5bc bc
F 7.6t 7.5bc 7.5cd 7.6bc bc
LSD
(P<0.01) 0.4667 0.4809 0.5994 0.5510
A two way analysis of variance (ANOVA) (appendix-I) was carried out for color
preference and results revealed that there was no significant difference in color
acceptability among mango leather.

33
From table 1.3 color of the mango leather sample F7 (mango pulp 95% + milk
powder 5%) secured the highest score and can be ranked as “like very much” and
was closely followed by the other samples. While sample F1 (mango pulp 100%)
secured the lowest score (7.30) where traditional formulation secured score 7.30
but there was no significant difference among the above samples.
In case of flavor among the samples a two way analysis of variance (Appendix-II,
table 2.3) showed that there was no significant difference in flavor preference
among the mango leather. From table 4.4 it is seen that sample F7 secured the
highest score (8.60) for flavor preference and was ranked as “like very much”.
Traditional Formulation Ft also ranked as “like very much”.
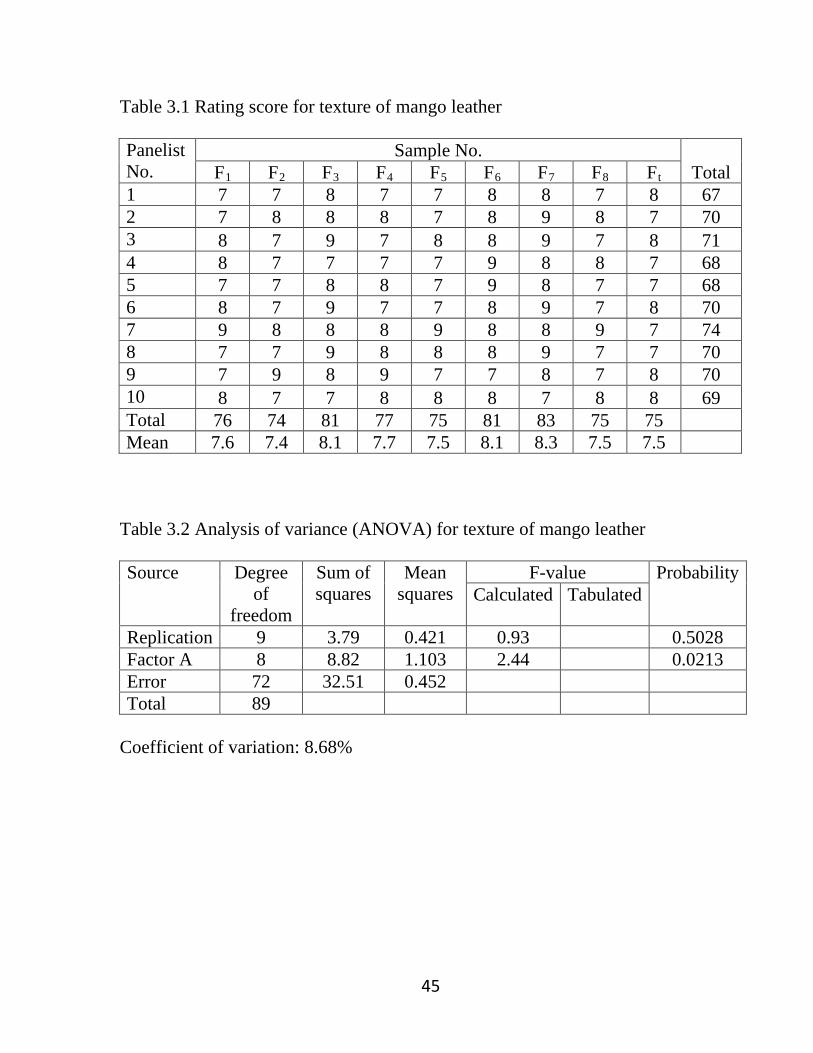
In case of texture preference among the samples (Appendix-III, table 3.1, 3.2)
showed that there was no significant difference in texture. From table 3.3 It is seen
that the sample F7 (mango pulp 95% + milk powder 5%) secured the highest score
(8.30) for texture and was ranked as “like very much” and was closely followed by
other samples. Whereas sample Ft secured 7.50 and ranked as “like very much”.
It is apparent from the results of the ANOVA (Appendix-ΙV, table 4.2, 4.3) that
there was no significant difference in overall acceptability of the sample tasted.
Sample F7 (mango pulp 95% + milk powder 5%) secured the highest score (8.50)
for overall acceptability and was ranked as “like very much”. Sample F5 (mango
pulp 95% + sugar 5%) secured the lowest score (7.30) but also was ranked as “like
very much” and sample Ft (mango pulp 100%) secured score 7.60 and ranked as
“like very much”. Thus all the samples were equally acceptable and ranked as
“like very much” while F7 secured the highest scored for all attributes.

34
CHAPTER V
SUMMARY AND CONCLUSION
The fresh “Ashini” variety mango was used in research work. Mango was
collected from Kansat upzilla of Chapainobabgonj district. After collecting
mango was stored at refrigerated temperature. Fresh mango pulp contained
moisture content 85%, ash 0.47%, acidity 0.16%, TSS 15.15, vitamin-C
43mg/100g and total sugar 12.02%. There were eight different samples prepared
by using mango pulp, sugar and milk powder on the basis of thickness.
FormulationF1 contains mango pulp 100%, F2 contains mango pulp 95% and sugar
5%, F3 contains mango pulp 100%, F4 contains mango pulp 95% and milk powder
5%, F5 contains mango pulp 95% and sugar 5%, F6 mango pulp 100%, F7 contains
mango pulp 95% and milk powder 5%, F8 contains mango pulp 95% and sugar
5% and traditional formulation Ft
Mango leather were prepared as per as standard procedure and were analyzed for
proximate composition. The processed formulation F
contained mango pulp 100%.
1, F2, F3, F4, F5, F6, F7, F8and
Ft were development of mango leather with pretreatment was organoleptically
evaluated by a taste testing panel. A statistical analysis of the score given by the
panelist on the sensory properties of various sample showed that color, flavor,
texture and overall acceptability were equally acceptable at 5% level of
significance. The statistical analysis showed that color, flavor, texture and overall
acceptability of mango leather sample F7 (mango pulp 95% + milk powder) was
more acceptable than the formulation F1, F2, F3, F4, F5, F6, F8and Ft. whereas
traditional formulation Ft secured 4th position. However there was no significant
difference among the samples. It indicates that higher properties of mango pulp
with lower level of milk powder render the most acceptable mango leather. In case

35
of texture the panelist were not able to find any significant difference among the
samples and all samples were ranked as like as moderately.
All samples were stored in room temperature (25-300C) by using high density
polyethylene coated with aluminum foil. Every sample was observed after 15days
interval for 8 observations (150 days). During the 6th observation (90 days)
traditional formulation Ft shows light brown color and partially off flavor but all
other samples show good keeping quality. During the 7th observation (120days)
fungal attack was found almost every sample.
From statistical analysis it is observed that color, flavor, texture and overall
acceptability of laboratory prepared sample F7 secured highest score and obtained
as first position where traditional sample Ft
is in fourth position. After observation
of every sample it is found that laboratory prepared samples normal shelf life 90
days, where traditional samples normal shelf life 60 days.

36
REFERENCES
Afzal, B., Kowser, S.M.,Sarker, M.A.S. and Islam, M.N. 1997.Kinetics of
mechanical, solar and sun drying of onion. Bangladesh J.Agri.Eng.8 (1 &
2): 49-61.
Ahmed, J. 1997. Dehydration of turnip and radish slices. J. Food Sci. Technol.,
India. 34(5): 410-412.
Ahmed, K.U. 1982. Mango, Gardener's book of Production and Nutrition.
Published by Mrs. Mumtaz Kamal, Bungalow 2, Krishi Khamar Sharak,
Farme Gate, Dhaka, Volume-1. Pp. 240.
Ali, Z. M., Lazan, H., Ishak, S. N. and Selamat, M. K. 1993.The biochemical basis
of accelerated softening in papaya following storage at low
temperature.Acta Horticulture, 343: 230-232.
Anwar, N. S., Zahari, S. S., Taib, 1. A. and Rahman, M.T. 2008. Effect of green
and ripe Carica papaya epicarp extracts on wound healing and during
pregnancy. Food and Chemical Toxicology, 46(7): 2384-2389
AOAC. 2005. Official Methods of Analysis. Fourteenth Edition. Association of
Official Analytical Chemists. Washington, D. C.
Askar, A. 1998. Importance and characteristics of tropical fruits. Fruit
processing, 8(7): 273-276.
Augustin, J., Swanson, B. G, and Huang, C. P. 1979.Changes in nutrient
composition of dehydrated potato products during commercial processing. J.
Food Science, 44(1): 216-219.

37
Aziz, A. B. A., EL-Nabawy, S. M., Zaki, H. A. and Abou Aziz, A. B. 1975.Effect
of different temperatures on the storage of papaya fruits and respirational
activity during storage.SeientiaHorticulturae, 3(2): 173-177.
Barua, P. C., Mohan, N. K. and Barooah, S. 1987. Biochemical changes during
storage of pineapple fruits in relation to time of harvest. South Indian
Horticulture, 35(5): 375-377.
BBS. 1997. Statistical Year Book of Bangladesh. Bangladesh Bureau of Statistics.
Stat. Div., Min. Plann., Govt. Peop. Repub. pp. 53-54.
BBS. 2007. Statistical Year Book of Bangladesh. Bangladesh Bureau of
Statistics. Stat. Div., Min. Plan., Govt. Peop. Repub.
BBS.1995. Bangladesh Bureau of Statistics, Statistical year Book of Bangladesh.
Statistics Division, Ministry of Planning, Govt. of Bangladesh. Pp. 71.
Bose, T. K. and Mitra, S. K. 1990.Fruits in tropical and subtropical, NayaProkash,
Calcutta, pp. 250-275.
Botrel, N., Caarvalho-vd-de and De-Carvalho- vd. 1993. Effect of fruit weight on
internal browning and quality in pineapple cv. Smooth cayenne. III internal
browning, total soluble solids, total titrable acidity, pH and sugars.
Desquisa-tgropecuaria-Brasileria, 28(9): 1055-1064.
Brooker, D.B., Bakker, F. W. and Hall, C. W. 1974.Drying of cereal grains,
Theory and simultanation of cereal grain drying. The AVI Pub. Co. Inc.
U.S.A. p. 185.

38
Carvalho, L. M. J. de; Castro, I. M. de and Silva, C. A. B. de. 2008. A study of
retention of sugars in the process of clarification of pineapple juice
(Ananascornosus, L. Merril) by micro- and ultra-filtration. Journal of Food
Engineering, 87(4): 447-454.
Chavasit, V., Pisaphab, R., Sungpuag, P., Jittinandana, S. and Wasantwisut, E.
2002.Changes in beta -carotene and vitamin A contents of vitamin A-rich
foods in Thailand during preservation and storages. Journal of Food
Science, 67(1): 375-379.
Collins, J. L. 1968. Fruit Preservation and Uses. The Pineapples, World Crops
Series. Leenard Hill. London. pp. 229-239.
Exams, A. and Lacroix, C. 1989.Development of a high protein paste. Influence of
processing parameters. Science Desh Aliments, 9: 285-305.
FAO. 1972. Food composition table for use East Asia. US Department of Health,
Education and Welfare.
Guggenheim, E. A. 1966. Application of statistical mechanics. Clarendon Press,
Oxford, UK, 111.
Hamilton, R. A. 1987. Papaya production in Hawaian Island. Res. Extn. Series,
No. 085.College of trop Agric. University of Hawaii. pp. 5-6.
Harsimrat-Kalsi and Dhawan, S. S. 2001. Studies on the preparation and storage of
guava fruit bar. Haryana Journal of Horticultural Sciences, 30(3/4): 187189.
Jain, N. 1961. Chemistry and Technology of mango. 'Reviews in Food Tech. 3:
131. Published by Indian Council of Agricultural Research. New Delhi.

39
Jason, A.C. 1958. A study of Evaporation and Diffusion Processing Drying of
Fish Muscle. In Fundamental aspects of the dehydration of Food-stuffs. P.
103.Society of Chemical Industry, London.
Kumar, S.S.; Kalra, R. and Nath, N. 1991. Kinetics of dehydration of bitter gourd.
J. Food Sci. Technology., India. 28(1): 52-53.
Kwaung-Sup Youn; Dong-Ho-Bae and Youn-Hee Choi. 1997. Effect of
pretreatment on the drying characteristics of dried vegetables. Korean J.
Food Sci. Technol. 29(2): 292-301.
Lal, G. Krishnamurthy, G. V., Jain, N. L. and Bhatia, B.S, 1960. Suitability of
different varieties of mango cereal flakes. Food Sci. 9:121.
Lawland, T.A. 1965. Description of two simple solar agricultural dryers, Bull du
Comples (Cooperation Mediferraneene Pour L'EnergieSolarire), 9:51.
Mustard, M. J. and Lynch, S. J. 1945. Effect of various factors upon the ascorbic
acid content of some Florida grown mangoes. Florida Agric. Exp. Sta.
Bull.,406,I.
Ogwall, W. O., Daivs, D. R. 1994. Rapid rehydration methods for dried beans.
Journal of Food Science, 59(3)L 611-612,654.
Pader, M. and Richberg, C.G. 1968. Process for dehydrated fruits, U.S. Patent 3,
365,309.

40
Palou, E., Lopez, M. A., Argaiz, A. and Welti, J. 1993. Osmotic dehydration of
Pawpaw. Effect of syrup concentration. Departmento de Ingenieria
Quimicayde Aloimentos, Universidad de las Americas-Puebla, Apartodo
Postal 1000, Santa Catarina Martir, Mexico.
Pawar, V. N., Singh, N.I., Dev, and Ingle, U.M. 1988. Solar drying white onion
flakes. Indian Food Packer, 42(2): 1528. India.
Ponting, J. D. Watters, G. L. Forrey, R. B., Jackson, R. and
Stonely, W. L. Food Technology, 20(2): 1365-1368.
Pope, W. T. 1929. Mango culture in Hawaii. Hawaii Agric. Exp. Sta. Null., 58.
Pramanik, W.K., & Sengupta, J.P. (1978). A preliminary study of composition of
mango sheets. Institutes of Chemists, 50,25-26.
Pratt, D.S. and J. I. Del Rosario. 1913. Philippine fruits, their
composition and characteristics. Philipp.J. Sci.,8,76.
Proctor, D.L. 1976. The control of insects infestation of fish during processing and
storage in the tropics. Tropical product Institute, Conference, London.
Rangana, S. 1990. Hand book of analysis and quality control for fruit and
vegetable products, 2"d
Reddy, G. V. and H. Das, 1993. Kinetics of Deep-fat frying potato and
optimization of process variables. Dairy and Food Engg.discipline, Dept. of
Agri. Eng. Indian Institute of Technology, Kharagpur, India. Am. Potato J.
105.
. Ed. Pun. Tata Mc Graw Hill Pulishing Company
Ltd., New Delhi.

41
Rudloph-V (ed.); Keey-RB, 1994. Air drying kinetics of osmotically dehydrated
fruits. Proceeding of the 9th International Drying Symposium. Gold Coast,
Australia, Volume B. 871-888.
Saravacos, G. D. and Charm, S. E. 1962.A study of the Mechanism of Fruit and
Vegetable Dehydration. Food Technol. Vol. 16, p. 78.
Schadle, E.R.; Burns, E.E. and Talley, L. J. 1983.Forced air drying of partially
freeze-dried compressed carrot bars. J. Food Sci. 48.
Sharma, V.K., A. Colangelo. and G. Spagna. 1995. Experimental investigation of
different solar dryers suitable for fruit and vegetable drying, Renewable
Energy, Vo1.6, No.4, pp.413-424.
Silva, Mercado, E., Vidal-Brotons, D. 1994. Osmotic dehydration of apple
(Granny smith) with deffernt osmotic solutions. Facultad de quimica,
Universidad Autonoma de Queretaro, Centro Universitario Cerro de
lasCampanas S/n, Queretaro, Spain.
Singh, L. B. 1968. The mango. Horticultural Research Institute, Saharanpur, Uttar
Pradesh, India. Pp. 367-379.
Sodha, M.S., A. Dang, P.K. Bansal and S.B. Sharma. 1985. An analytical and
experimental study of open sun drying and a cabinet type dryer, Solar
Energy, Vo1.38, No.3, pp. 263271.

42
APPENDICES
Appendix-I Sensory evaluation of various mango leather
Table 1.1 Rating score for color of mango leather Panelist No.
Sample No. Total F F1 F2 F3 F4 F5 F6 F7 F8 t
1 7 7 8 7 7 8 9 8 8 69 2 7 8 7 8 8 9 9 8 7 71 3 7 7 7 8 7 8 8 8 7 67 4 8 7 9 8 8 9 9 8 8 74 5 7 8 8 9 8 9 8 8 7 72 6 8 8 9 8 8 9 9 8 9 76 7 7 7 9 7 7 8 8 8 8 69 8 8 7 7 8 7 8 9 7 7 68 9 7 7 8 8 7 9 9 7 7 69 10 7 8 8 7 7 9 8 7 8 69 Total 73 74 80 78 74 86 86 77 76 Mean 7.3 7.4 8.0 7.8 7.4 8.6 8.6 7.7 7.6
Table 1.2 Analysis of variance (ANOVA) for color of mango leather Source Degree
of freedom
Sum of squares
Mean squares
F-value Probability Calculated Tabulated
Replication 9 8.04 0.894 3.26 0.0023 Factor A 8 19.36 2.419 8.82 0.0000 Error 72 19.76 0.274 Total 89
Coefficient of variation: 6.70%

43
Table 1.3 Duncan’s Multiple Range Test (DMRT) for color of mango leather LSD value = 0.4667
Sample code Original order of means
Sample code Ranked order of means
F 7.301 Fc 8.606 a F 7.402 Fc 8.607 a F 8.003 Fb 8.003 b F 7.804 Fbc 7.804 bc F 7.405 Fc 7.708 bc F 8.606 Fa 7.609
bc F 8.607 Fa 7.402 c F 7.708 Fbc 7.405 c F 7.60t Fbc 7.301
c Table 2.1 Rating score for flavor of mango leather Panelist No.
Sample No. Total F F1 F2 F3 F4 F5 F6 F7 F8 t
1 7 7 8 8 7 8 9 8 8 70 2 8 8 9 8 8 9 8 8 7 73 3 7 7 9 8 8 7 9 7 8 70 4 7 8 8 7 8 9 9 7 7 70 5 7 7 8 7 7 8 8 8 7 67 6 8 7 8 8 7 9 9 7 7 70 7 7 8 7 7 8 7 8 7 8 67 8 7 7 8 8 7 8 9 8 8 70 9 8 7 8 7 7 8 9 7 7 68 10 7 7 7 7 7 8 8 7 8 66 Total 73 73 80 75 74 81 86 74 75 Mean 7.3 7.3 8.0 7.5 7.4 8.1 8.6 7.4 7.5

44
Table 2.2 Analysis of variance (ANOVA) for flavor of mango leather Source Degree
of freedom
Sum of squares
Mean squares
F-value Probability Calculated Tabulated
Replication 9 4.32 0.480 1.65 0.1179 Factor A 8 16.36 2.044 7.02 0.0000 Error 72 20.98 0.291 Total 89
Coefficient of variation: 7.03% Table 2.3 Duncan’s Multiple Range Test (DMRT) for flavor of mango leather LSD value = 0.4809
Sample code Original order of means
Sample code Ranked order of means
F 7.301 Fd 8.607 a F 7.302 Fd 8.106 b F 8.003 Fbc 8.003 bc F 7.504 Fd 7.504 d F 7.405 Fd 7.50t cd F 8.106 Fb 7.408 d F 8.607 Fa 7.405 d F 7.408 Fd 7.301
d F 7.50t Fcd 7.302 d
45
Table 3.1 Rating score for texture of mango leather Panelist No.
Sample No. Total F F1 F2 F3 F4 F5 F6 F7 F8 t
1 7 7 8 7 7 8 8 7 8 67 2 7 8 8 8 7 8 9 8 7 70 3 8 7 9 7 8 8 9 7 8 71 4 8 7 7 7 7 9 8 8 7 68 5 7 7 8 8 7 9 8 7 7 68 6 8 7 9 7 7 8 9 7 8 70 7 9 8 8 8 9 8 8 9 7 74 8 7 7 9 8 8 8 9 7 7 70 9 7 9 8 9 7 7 8 7 8 70 10 8 7 7 8 8 8 7 8 8 69 Total 76 74 81 77 75 81 83 75 75 Mean 7.6 7.4 8.1 7.7 7.5 8.1 8.3 7.5 7.5
Table 3.2 Analysis of variance (ANOVA) for texture of mango leather Source Degree
of freedom
Sum of squares
Mean squares
F-value Probability Calculated Tabulated
Replication 9 3.79 0.421 0.93 0.5028 Factor A 8 8.82 1.103 2.44 0.0213 Error 72 32.51 0.452 Total 89
Coefficient of variation: 8.68%

46
Table 3.3 Duncan’s Multiple Range Test (DMRT) for texture of mango leather LSD value = 0.5994
Sample code Original order of means
Sample code Ranked order of means
F 7.601 Fbc 8.307 a F 7.402 Fc 8.103 ab F 8.103 Fab 8.106 ab F 7.704 Fabc 7.704 abc F 7.505 Fbc 7.601
bc F 8.106 Fab 7.508 bc F 8.307 Fa 7.50t bc F 7.508 Fbc 7.505 bc F 7.50t Fbc 7.402 c
Table 4.1 Rating score for overall of mango leather Panelist No.
Sample No. Total F F1 F2 F3 F4 F5 F6 F7 F8 t
1 8 7 8 8 7 8 9 7 8 70 2 8 8 9 7 8 8 8 8 8 72 3 7 7 8 7 7 9 9 8 7 69 4 7 8 8 7 7 8 8 7 7 67 5 9 8 7 8 7 7 8 7 7 68 6 7 8 7 7 8 8 9 8 8 70 7 8 7 7 8 7 7 9 8 7 68 8 7 7 8 8 7 9 8 7 9 70 9 8 7 8 8 7 8 8 7 8 69 10 7 8 9 7 8 8 9 8 7 71 Total 76 75 79 75 73 80 85 75 76 Mean 7.6 7.5 7.9 7.5 7.3 8.0 8.5 7.5 7.6

47
Table 4.2 Analysis of variance (ANOVA) for overall acceptability of mango leather Source Degree
of freedom
Sum of squares
Mean squares
F-value Probability Calculated Tabulated
Replication 9 2.27 0.252 0.66 0.7431 Factor A 8 10.69 1.336 3.49 0.0018 Error 72 27.53 0.382 Total 89
Coefficient of variation: 8.02% Table 4.3 Duncan’s Multiple Range Test (DMRT) for overall acceptability of mango leather LSD value = 0.5510
Sample code Original order of means
Sample code Ranked order of means
F 7.601 Fbc 8.507 a F 7.502 Fbc 8.006 ab F 7.903 Fbc 7.903 bc F 7.504 Fbc 7.601
bc F 7.305 Fc 7.60t bc F 8.006 Fab 7.502 bc F 8.507 Fa 7.508 bc F 7.508 Fbc 7.504 bc F 7.60t Fbc 7.305 c

48
APPENDIX-V
Taste testing of mango leather Name of the Tester: ………………………… Date: ……………………..
Sco
re Color Flavor Texture Acceptability
Like extremely
9 F F1
F2
F3
F4
F5
F6
F7
F8
Ft
F1
F2
F3
F4
F5
F6
F7
F8
Ft
F1
F2
F3
F4
F5
F6
F7
F8
Ft
F1
F2
F3
F4
F5
F6
F7
F8 t
Like very much
8
Like moderately
7
Like slightly
6
Neither like nor dislike
5
Dislike slightly
4
Dislike moderately
3
Dislike very much
2
Dislike extremely
1

48
F1, F2, F3, F4, F5, F6, F7 & F8
Signature
are different in their formulation .………………….