Genetic sequence stratigraphy of cool water slope carbonates (Pleistocene Eucla Shelf, southern...
12
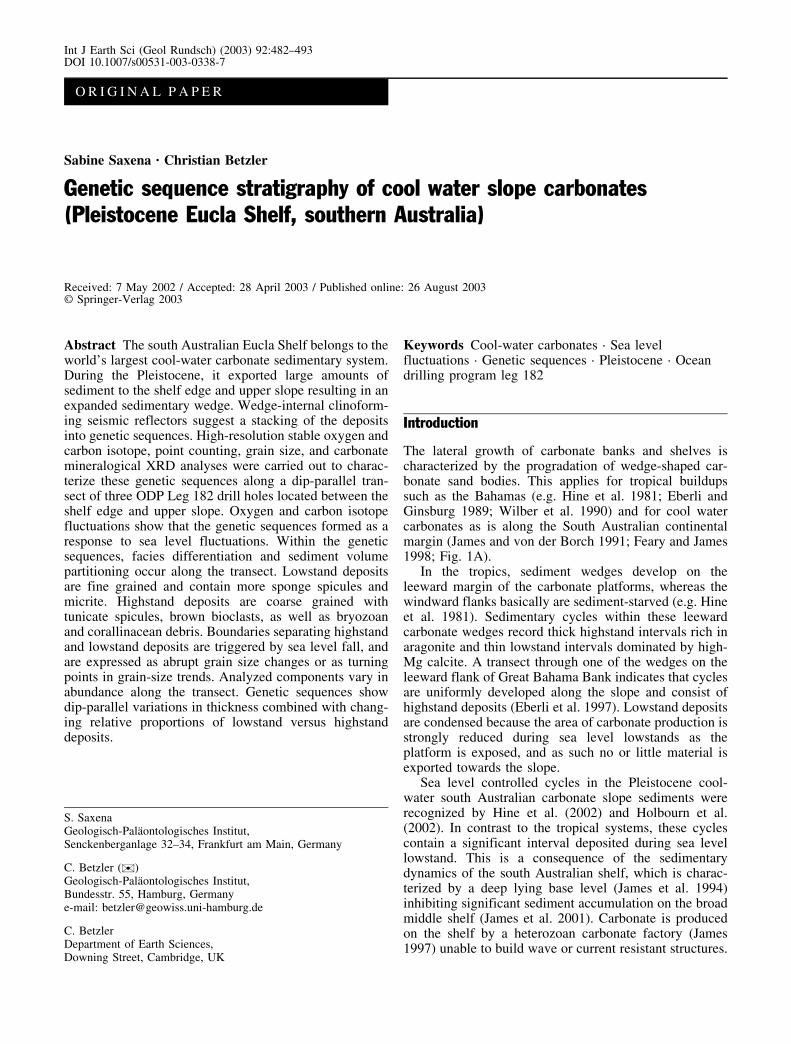
Int J Earth Sci (Geol Rundsch) (2003) 92:482–493 DOI 10.1007/s00531-003-0338-7 ORIGINAL PAPER Sabine Saxena · Christian Betzler Genetic sequence stratigraphy of cool water slope carbonates (Pleistocene Eucla Shelf, southern Australia) Received: 7 May 2002 / Accepted: 28 April 2003 / Published online: 26 August 2003 # Springer-Verlag 2003 Abstract The south Australian Eucla Shelf belongs to the world’s largest cool-water carbonate sedimentary system. During the Pleistocene, it exported large amounts of sediment to the shelf edge and upper slope resulting in an expanded sedimentary wedge. Wedge-internal clinoform- ing seismic reflectors suggest a stacking of the deposits into genetic sequences. High-resolution stable oxygen and carbon isotope, point counting, grain size, and carbonate mineralogical XRD analyses were carried out to charac- terize these genetic sequences along a dip-parallel tran- sect of three ODP Leg 182 drill holes located between the shelf edge and upper slope. Oxygen and carbon isotope fluctuations show that the genetic sequences formed as a response to sea level fluctuations. Within the genetic sequences, facies differentiation and sediment volume partitioning occur along the transect. Lowstand deposits are fine grained and contain more sponge spicules and micrite. Highstand deposits are coarse grained with tunicate spicules, brown bioclasts, as well as bryozoan and corallinacean debris. Boundaries separating highstand and lowstand deposits are triggered by sea level fall, and are expressed as abrupt grain size changes or as turning points in grain-size trends. Analyzed components vary in abundance along the transect. Genetic sequences show dip-parallel variations in thickness combined with chang- ing relative proportions of lowstand versus highstand deposits. Keywords Cool-water carbonates · Sea level fluctuations · Genetic sequences · Pleistocene · Ocean drilling program leg 182 Introduction The lateral growth of carbonate banks and shelves is characterized by the progradation of wedge-shaped car- bonate sand bodies. This applies for tropical buildups such as the Bahamas (e.g. Hine et al. 1981; Eberli and Ginsburg 1989; Wilber et al. 1990) and for cool water carbonates as is along the South Australian continental margin (James and von der Borch 1991; Feary and James 1998; Fig. 1A). In the tropics, sediment wedges develop on the leeward margin of the carbonate platforms, whereas the windward flanks basically are sediment-starved (e.g. Hine et al. 1981). Sedimentary cycles within these leeward carbonate wedges record thick highstand intervals rich in aragonite and thin lowstand intervals dominated by high- Mg calcite. A transect through one of the wedges on the leeward flank of Great Bahama Bank indicates that cycles are uniformly developed along the slope and consist of highstand deposits (Eberli et al. 1997). Lowstand deposits are condensed because the area of carbonate production is strongly reduced during sea level lowstands as the platform is exposed, and as such no or little material is exported towards the slope. Sea level controlled cycles in the Pleistocene cool- water south Australian carbonate slope sediments were recognized by Hine et al. (2002) and Holbourn et al. (2002). In contrast to the tropical systems, these cycles contain a significant interval deposited during sea level lowstand. This is a consequence of the sedimentary dynamics of the south Australian shelf, which is charac- terized by a deep lying base level (James et al. 1994) inhibiting significant sediment accumulation on the broad middle shelf (James et al. 2001). Carbonate is produced on the shelf by a heterozoan carbonate factory (James 1997) unable to build wave or current resistant structures. S. Saxena Geologisch-PalȨontologisches Institut, Senckenberganlage 32–34, Frankfurt am Main, Germany C. Betzler ( ) ) Geologisch-PalȨontologisches Institut, Bundesstr. 55, Hamburg, Germany e-mail: [email protected] C. Betzler Department of Earth Sciences, Downing Street, Cambridge, UK
-
Upload
uni-hamburg -
Category
Documents
-
view
3 -
download
0
Transcript of Genetic sequence stratigraphy of cool water slope carbonates (Pleistocene Eucla Shelf, southern...
Int J Earth Sci (Geol Rundsch) (2003) 92:482–493DOI 10.1007/s00531-003-0338-7
O R I G I N A L P A P E R
Sabine Saxena · Christian Betzler
Genetic sequence stratigraphy of cool water slope carbonates(Pleistocene Eucla Shelf, southern Australia)
Received: 7 May 2002 / Accepted: 28 April 2003 / Published online: 26 August 2003� Springer-Verlag 2003
Abstract The south Australian Eucla Shelf belongs to theworld’s largest cool-water carbonate sedimentary system.During the Pleistocene, it exported large amounts ofsediment to the shelf edge and upper slope resulting in anexpanded sedimentary wedge. Wedge-internal clinoform-ing seismic reflectors suggest a stacking of the depositsinto genetic sequences. High-resolution stable oxygen andcarbon isotope, point counting, grain size, and carbonatemineralogical XRD analyses were carried out to charac-terize these genetic sequences along a dip-parallel tran-sect of three ODP Leg 182 drill holes located between theshelf edge and upper slope. Oxygen and carbon isotopefluctuations show that the genetic sequences formed as aresponse to sea level fluctuations. Within the geneticsequences, facies differentiation and sediment volumepartitioning occur along the transect. Lowstand depositsare fine grained and contain more sponge spicules andmicrite. Highstand deposits are coarse grained withtunicate spicules, brown bioclasts, as well as bryozoanand corallinacean debris. Boundaries separating highstandand lowstand deposits are triggered by sea level fall, andare expressed as abrupt grain size changes or as turningpoints in grain-size trends. Analyzed components vary inabundance along the transect. Genetic sequences showdip-parallel variations in thickness combined with chang-ing relative proportions of lowstand versus highstanddeposits.
Keywords Cool-water carbonates · Sea levelfluctuations · Genetic sequences · Pleistocene · Oceandrilling program leg 182
Introduction
The lateral growth of carbonate banks and shelves ischaracterized by the progradation of wedge-shaped car-bonate sand bodies. This applies for tropical buildupssuch as the Bahamas (e.g. Hine et al. 1981; Eberli andGinsburg 1989; Wilber et al. 1990) and for cool watercarbonates as is along the South Australian continentalmargin (James and von der Borch 1991; Feary and James1998; Fig. 1A).
In the tropics, sediment wedges develop on theleeward margin of the carbonate platforms, whereas thewindward flanks basically are sediment-starved (e.g. Hineet al. 1981). Sedimentary cycles within these leewardcarbonate wedges record thick highstand intervals rich inaragonite and thin lowstand intervals dominated by high-Mg calcite. A transect through one of the wedges on theleeward flank of Great Bahama Bank indicates that cyclesare uniformly developed along the slope and consist ofhighstand deposits (Eberli et al. 1997). Lowstand depositsare condensed because the area of carbonate production isstrongly reduced during sea level lowstands as theplatform is exposed, and as such no or little material isexported towards the slope.
Sea level controlled cycles in the Pleistocene cool-water south Australian carbonate slope sediments wererecognized by Hine et al. (2002) and Holbourn et al.(2002). In contrast to the tropical systems, these cyclescontain a significant interval deposited during sea levellowstand. This is a consequence of the sedimentarydynamics of the south Australian shelf, which is charac-terized by a deep lying base level (James et al. 1994)inhibiting significant sediment accumulation on the broadmiddle shelf (James et al. 2001). Carbonate is producedon the shelf by a heterozoan carbonate factory (James1997) unable to build wave or current resistant structures.
S. SaxenaGeologisch-Pal�ontologisches Institut,Senckenberganlage 32–34, Frankfurt am Main, Germany
C. Betzler ())Geologisch-Pal�ontologisches Institut,Bundesstr. 55, Hamburg, Germanye-mail: [email protected]
C. BetzlerDepartment of Earth Sciences,Downing Street, Cambridge, UK
Allochems accumulate either on the inner shelf or on theouter shelf and slope. Although a carbonate factory existsduring both sea level highstand and lowstand (Holbournet al. 2002), there is a certain spatial reduction of thecarbonate production area during lowstands when parts ofthe South Australian shelf were exposed.
In the South Australian slope wedge, clinoformreflections in seismic profiles (Fig. 2) indicate stackingof the deposits into high-frequency sequences (Feary andJames 1998; Feary et al. 2000). Based on sedimentolog-ical and geochemical analyses of ODP Leg 182 drill sites,we will show how these sequences are interpreted torelate to sea level changes. It will be demonstrated that apronounced sediment volume partitioning (sensu Crossand Lessenger 1998) occurs within these genetic se-quences. According to Busch (1959), a genetic sequenceis a stratigraphic unit that contains the sediment thataccumulates in all linked depositional environmentsduring a complete base level cycle. On the Eucla Shelf,base level corresponds to wave abrasion base (James et al.1994, 2001), estimated to occur at a water depth of 70 m.For middle to late Pleistocene sea level lowstandspresented in this paper, following Shackleton (1987), anaverage lowering of base level of around 100 m can beassumed.
Cross and Lessenger (1998) describe the process ofsediment volume partitioning as a product of preservingdifferential sediment volumes within facies tracts due tochanging accommodation during times of base level falland rise. As such, sediment volume partitioning changesthe symmetry of stratigraphic cycles along a proximal todistal transect. The concept of ‘facies differentiation’, onthe other hand, describes a process in which the faciesconstituents, associations, and successions of the samegeological setting are different according to changes inbase level (Cross and Lessenger 1998). Differing fromwhat was defined by Cross and Lessenger (1998) forshallow water siliciclastic systems, both sediment volumepartitioning and facies differentiation in the Eucla Shelfcool water carbonate depositional system are not only afunction of changing accommodation, but also of theamount and main characteristics of carbonate particlesshed from the shelf to the slope and basin. Theseparameters are mainly influenced by the degree offlooding of the Eucla Shelf area. The concepts of geneticstratigraphy, volumetric partitioning, and facies differen-tiation are frequently applied to shallow-water sedimen-tary systems (e.g. Cross 1988; Cross et al. 1993; Grammeret al. 2000; Lerat et al. 2000). Although these concepts aredescribed from various settings in carbonate and mixedcarbonate-siliciclastic systems (Homewood and Eberli2000), examples of genetic stratigraphy of slope andbasinal environments, especially in cool-water carbonatedepositional systems, are still rare.
Geological setting
The southern margin of Australia constitutes the largestcool-water carbonate shelf in the modern world (e.g.,James and von der Borch 1991; Feary and James 1998).South of Eucla, the continental shelf (‘Eucla Shelf’) is anup to 300-km-wide gently dipping plain bounded by a
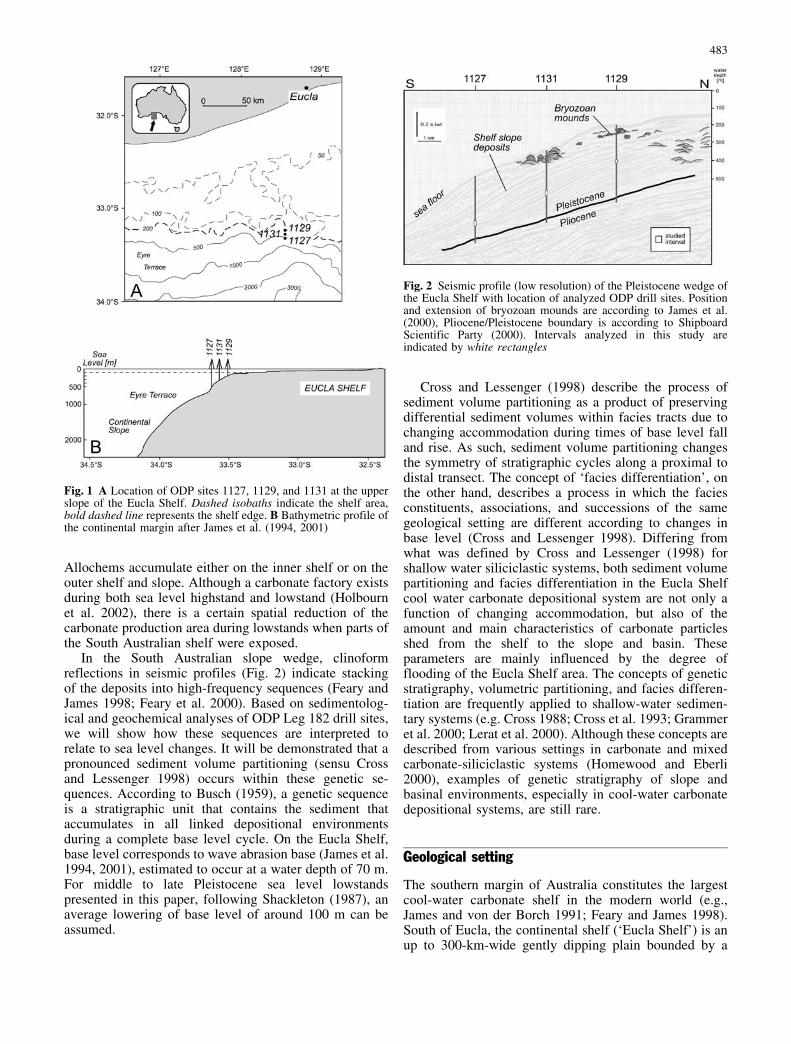
Fig. 2 Seismic profile (low resolution) of the Pleistocene wedge ofthe Eucla Shelf with location of analyzed ODP drill sites. Positionand extension of bryozoan mounds are according to James et al.(2000), Pliocene/Pleistocene boundary is according to ShipboardScientific Party (2000). Intervals analyzed in this study areindicated by white rectangles
Fig. 1 A Location of ODP sites 1127, 1129, and 1131 at the upperslope of the Eucla Shelf. Dashed isobaths indicate the shelf area,bold dashed line represents the shelf edge. B Bathymetric profile ofthe continental margin after James et al. (1994, 2001)
483
rollover shelf edge at a water depth of 200 m (Fig. 1).Wide terraces, such as the Eyre Terrace at a depth of 400–1,600 m, interrupt the continental slope (James and vonder Borch 1991; James et al. 1994; Fig. 1). James et al.(1994) developed the concept of a ‘shaved shelf’ byanalyzing the sediment dynamics on the modern EuclaShelf. Here, minor net accumulation on the vast middleshelf area is the result of the continuous interaction ofwave erosion and downslope sediment transport. Sedi-ment dredged on the modern Eucla Shelf is a mixture ofPleistocene calcareous skeletal and relict grains, Holo-cene bioclasts, as well as small amounts of quartz (Jameset al. 2001).
Seismic profiles of the outer shelf and upper slope ofthe Eucla Shelf exhibit a stacking of the Pleistocenesedimentary succession into sigmoidal clinoforms (Jamesand von der Borch 1991; Feary and James 1998; Fig. 2).The upper surface of the sedimentary wedge formed bythese clinoforms is an erosional surface. As a conse-quence of this erosion, depositional geometries arerestricted to progradation of the shelf edge (Feary andJames 1998; Fig. 3). The sediment wedge is thickestbelow the modern outer shelf and shelf edge and thinnerin both seaward and landward directions (Feary andJames 1995). Bryozoan mounds are located immediatelylandward as well as basinward of the modern shelf edge atthe transition between shelf and slope environments(Feary and James 1995, 1998; James et al. 2000; Fig. 3).Shifting of bryozoan mounds from more landwardpositions to further seaward positions within the pleis-tocene deposits (Fig. 3) is interpreted to result from theprogradation of the palaeoshelf edge throughout thePleistocene by Feary and James (1998). These bryozoanmounds are interpreted to have accumulated during timesof lowered sea level, colder climate, and strong upwellingduring both the Holocene (James et al. 2000) and the LatePleistocene (Holbourn et al. 2002).
The ODP Leg 182 drill sites analyzed are arrangedalong a N–S seismic line and provide a transect throughthe sediment wedge of the upper slope of Eucla Shelf
(Figs. 1, 2). The drill sites are site 1127 (479 m waterdepth), site 1131 at a water depth of 332 m, and the mostproximal site 1129, on the uppermost slope at a waterdepth of 202 m. The intermediate site 1131 is locatedapproximately 4 km south of the most proximal site 1129,whereas the most distal site 1127 is located 5 km south ofsite 1131. This approximately 9-km transect intersectedan almost 500-m-thick Pleistocene sedimentary succes-sion, dominated by bioclastic packstone and wackestonewith minor amounts of bioclastic grainstone (Feary et al.2000).
Methods
To document the high-frequency sedimentary cyclicitywithin the Eucla Shelf cool-water carbonate sedimentarysuccession, 164 core-samples were taken in 0.75-mintervals from sites 1127, 1129, and 1131. The sampledintervals are 345–379 m below seafloor (mbsf) at site1127, 271–348 mbsf at site 1131, and 245–281 mbsf atsite 1129 (Fig. 2). These intervals were chosen because ofgood core recovery and core quality as well as theircorrelatability along the slope transect.
For correlation of individual periplatform cycles alongthe transect, seismic horizons c17 and c18 (D. Feary,personal communication 2000) were used. Seismic hori-zons are derived by seismic stratigraphic correlation, inwhich each c-horizon represents a reflector traced throughthe high-resolution seismic dataset. Depth accuracy of theC-horizons is within 5 m. In order to gain better control ofthe boundaries of the high-frequency cycles, additionalsamples were taken several meters below and above theseismic horizons. A Middle to Late Pleistocene ageassignment of the interval studied relies on a paleomag-netic time scale developed at site 1127 (Feary et al. 2000).At this location, the Brunhes/Matuyama event (0.78 Ma)is at 343.4 mbsf, the termination of Jaramillo (0.99 Ma) at380.7 mbsf.
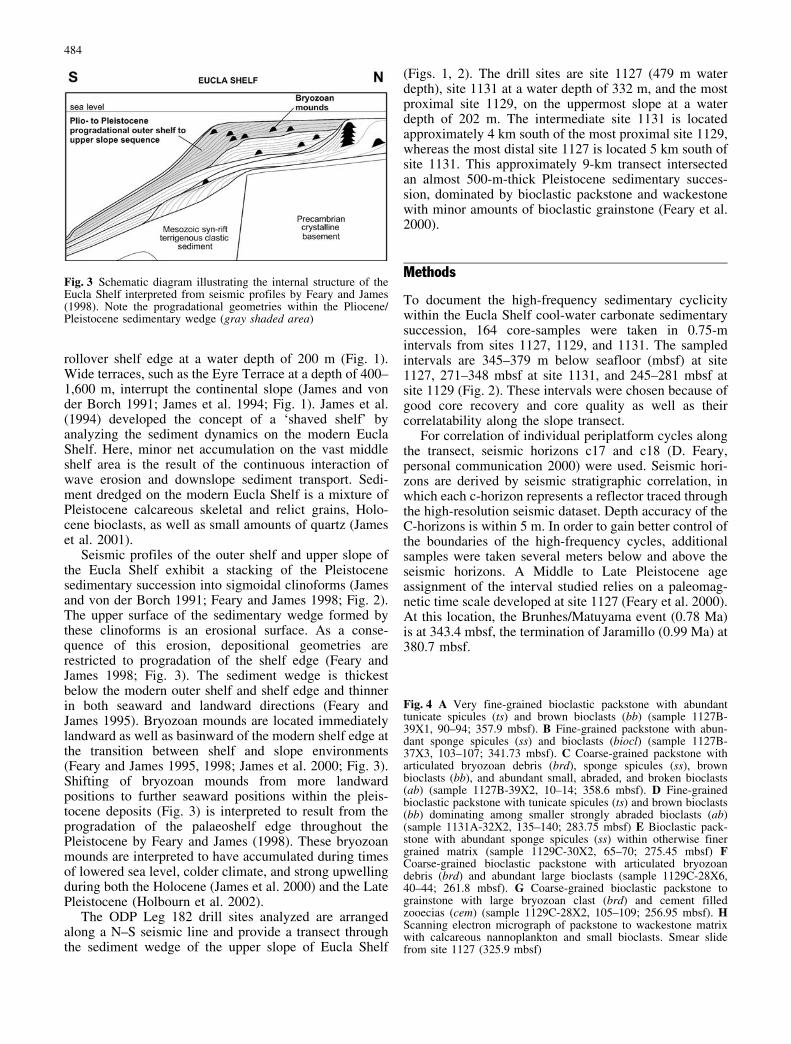
Fig. 3 Schematic diagram illustrating the internal structure of theEucla Shelf interpreted from seismic profiles by Feary and James(1998). Note the progradational geometries within the Pliocene/Pleistocene sedimentary wedge (gray shaded area)
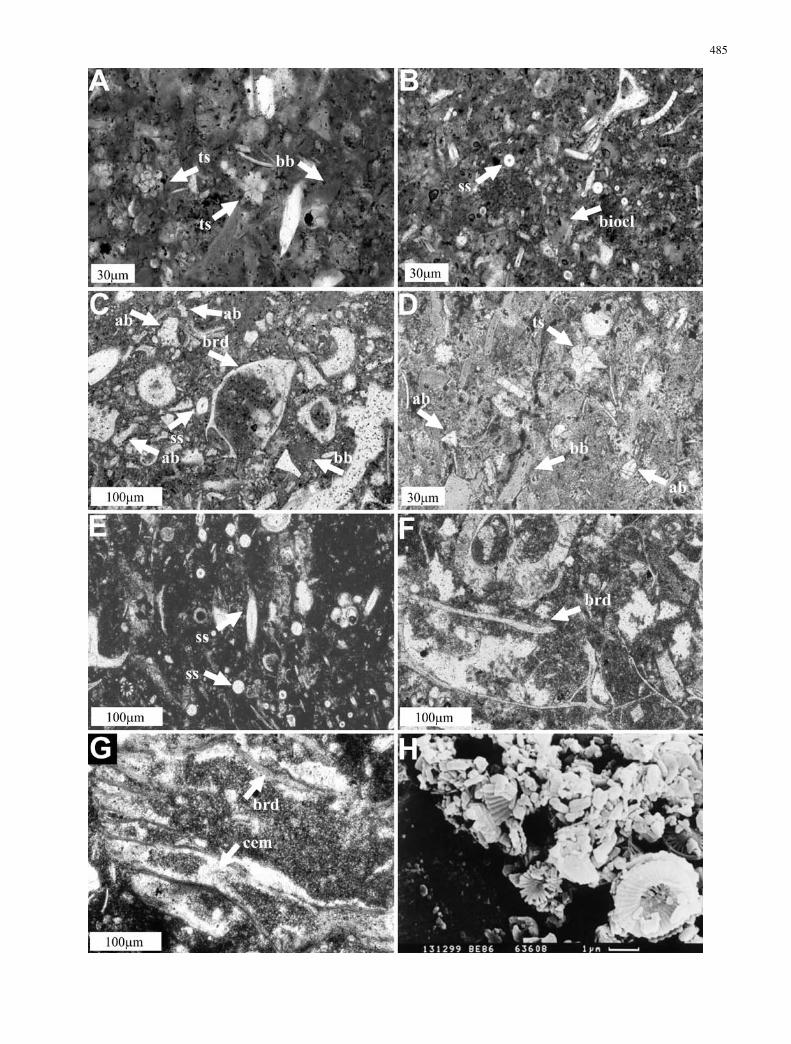
Fig. 4 A Very fine-grained bioclastic packstone with abundanttunicate spicules (ts) and brown bioclasts (bb) (sample 1127B-39X1, 90–94; 357.9 mbsf). B Fine-grained packstone with abun-dant sponge spicules (ss) and bioclasts (biocl) (sample 1127B-37X3, 103–107; 341.73 mbsf). C Coarse-grained packstone witharticulated bryozoan debris (brd), sponge spicules (ss), brownbioclasts (bb), and abundant small, abraded, and broken bioclasts(ab) (sample 1127B-39X2, 10–14; 358.6 mbsf). D Fine-grainedbioclastic packstone with tunicate spicules (ts) and brown bioclasts(bb) dominating among smaller strongly abraded bioclasts (ab)(sample 1131A-32X2, 135–140; 283.75 mbsf) E Bioclastic pack-stone with abundant sponge spicules (ss) within otherwise finergrained matrix (sample 1129C-30X2, 65–70; 275.45 mbsf) FCoarse-grained bioclastic packstone with articulated bryozoandebris (brd) and abundant large bioclasts (sample 1129C-28X6,40–44; 261.8 mbsf). G Coarse-grained bioclastic packstone tograinstone with large bryozoan clast (brd) and cement filledzooecias (cem) (sample 1129C-28X2, 105–109; 256.95 mbsf). HScanning electron micrograph of packstone to wackestone matrixwith calcareous nannoplankton and small bioclasts. Smear slidefrom site 1127 (325.9 mbsf)
484
485
Every sediment sample was divided into three parts.The larger part of the samples was freeze-dried andimpregnated with blue-colored Epoxy-Resin before prep-aration of thin sections. Two hundred-fifty point countswere carried out for quantitative analysis of thin sectionsaccording to the grain-bulk method (Dunham 1962).Components distinguished during point counting (Fig. 4)were planktonic and benthic foraminifers, tunicate andsponge spicules, echinoid debris, ostracods, bivalves,gastropods, serpulids, corallinaceans, bryozoa, brownbioclasts, pellets, micrite, glauconite, quartz, and organicmaterial. Fragmented skeletal grains, which could not beassociated with one of these groups were counted asbioclasts. The sediment matrix, i.e. the micrite of thesamples analyzed, is a mixture of calcareous nannoplank-ton and nannoplankton debris as well as very fine-grainedbiodetritus (Fig. 4H).
For grain size analysis, a remaining part of chosensediment samples were suspended in water for 24 hfollowed with dispersal by ultrasonic treatment. Grainsize fractions (<32, 32–63, and >63 �m) were separatedby wet sieving. After settling the carbonate silt fractionsmaller than 63 �m in 5-l beakers, the water was pumpedoff and the remaining sediment was oven dried at 50 �Cbefore being weighed. Comparison of grain size resultsand point count analyses showed that micrite abundanceprovides an accurate proxy for grain size fluctuations.Finer grained samples appear as micrite-rich in thecountings. Since wet-sieving is a time-consuming proce-dure, grain size analysis was only partially carried out forchosen sampling intervals.
X-ray diffraction analysis was performed separatelyfor the three grain size fractions of each bulk sample (<32,32–63, and >63 �m). Each fraction was ground andsuspended in distilled water. Then 5 mg of corundumwere added as an internal standard mineral for peakcorrections. After homogenization by ultrasonic treat-ment, XRD measurements were performed on smearmounts. Peak intensities were measured for the carbonateminerals aragonite, high-Mg calcite with more than 4mole % MgCO3, calcite, and dolomite. Relative propor-tions of the carbonate minerals were calculated by usingthe program MacDiff.
The d18O and d13C stable isotope analysis wasdetermined on the remaining part of the bulk samples.Samples were dissolved in an acid bath at 90 �C toanalyze the hereby produced CO2, using a stable isotopemass spectrometer. Data are reproducible within € 0.1‰and reported in the conventional manner relative to PDB.
Results
Sedimentary facies
Carbonates analyzed within this study are dominated byfine- to coarse-grained bioclastic packstone to wackestone(Fig. 4). Towards the more proximal settings of sites 1131and 1129 these sediments are more frequently intercalated
with coarser grainstone and finer wackestone intervals.Deposits are light gray to light olive gray and have auniform appearance due to extensive bioturbation. Brokenbioclasts are by far the most abundant components withinthese deposits (Fig. 4 A–D). They are followed to a lesserextent by sponge spicules (Fig. 4B, E), tunicate spicules(Fig. 4A, D), planktonic and benthic foraminifers (mainlyrotaliid, miliolid, and agglutinated), as well as high-Mgbrown bioclasts (Fig. 4A, D). Minor constituents arebryozoa (Fig. 4C, F) and coralline algae debris, as well asechinoderm and bivalve bioclasts. In addition to thebiogenic constituents, trace quantities of quartz andglauconite are present. Small bioclasts, tunicate spiculefragments, coccoliths and coccolith debris, as well asbioerosion chips form the sediment matrix (Fig. 4H).
Site 1127
Description
The oxygen isotope curve of this most distal location ofthe transect (Fig. 5) displays symmetric variations in d18Ovalues, while the carbonate carbon isotope curve issawtooth-shaped. Uphole trends towards heavier d13Cvalues are interrupted by rapid changes towards lightercarbon isotopes. Trends towards lighter oxygen isotopesand intervals with light d18O values (378–372, 368–358,353–346 mbsf) correspond to trends towards heaviercarbon isotope values and vice versa.
The abundance of micrite and biogenic componentsfluctuate through the succession (Fig. 5). Tunicatespicules and brown bioclasts co-vary. The occurrence ofcorallinacean debris is confined to intervals with highamounts of tunicate spicules and can reach maximumamounts of 5%. Furthermore, peak abundances ofbryozoan detritus are observed within these intervals.On the other hand, the amount of tunicate spicules isinverse proportional with respect to the amount of spongespicules and the amount of micrite, which are bothpositively correlated.
Trends in grain size variation are best developedwithin the fine fraction <32 �m and the coarse fraction>63 �m (Fig. 6). The herein analyzed interval ischaracterized by gradual increases in grain size interrupt-ed by abrupt decreases, i.e. coarsening-upward trends.One complete coarsening-upward trend is between 358and 347 mbsf (Fig. 6). The intervals between 362 and358 mbsf as well as between 347 and 338 mbsf record theupper and the lower part of another coarsening-upwardtrend, respectively.
Aragonite, high-Mg calcite, and dolomite are mainlyconcentrated in the fine fraction (<32 �m, Fig. 7).Aragonite and high-Mg calcite reach up to 34% each,while dolomite never exceeds 10% of the bulk sample.The abundances of aragonite and high-Mg calcite fluctuatewithin the sedimentary succession. Dolomite content isalso fluctuating but is phase shifted compared to abun-dances of the other metastable carbonate mineralogies.
486
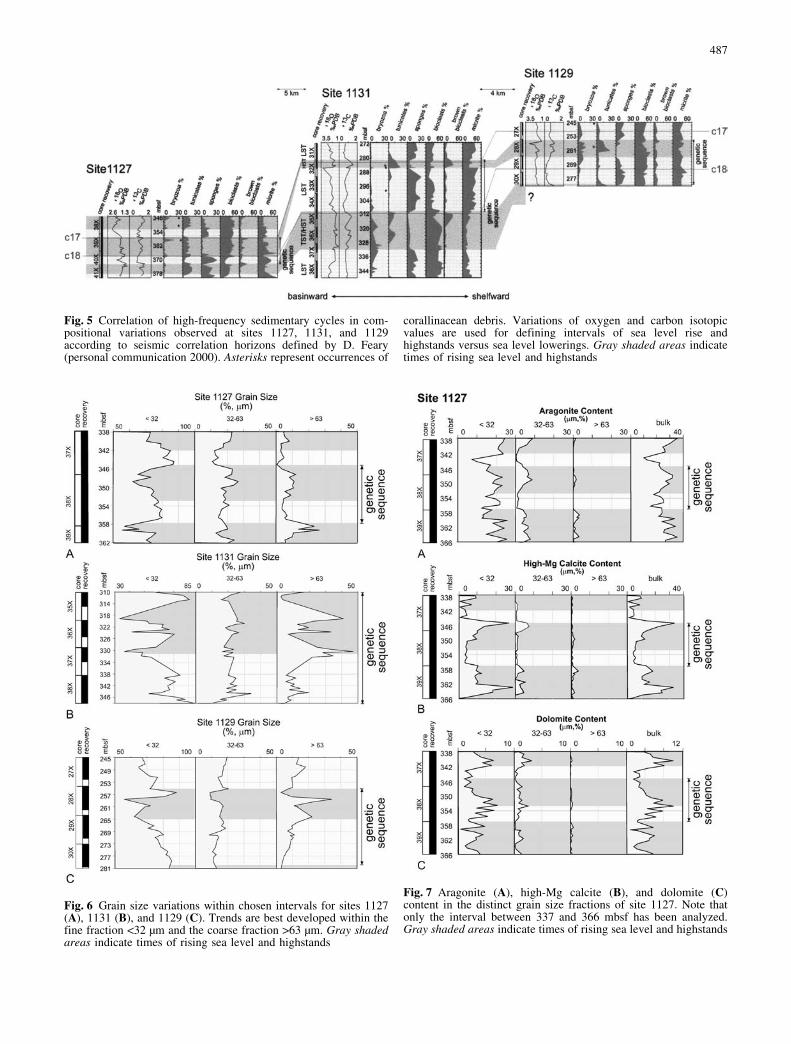
Fig. 5 Correlation of high-frequency sedimentary cycles in com-positional variations observed at sites 1127, 1131, and 1129according to seismic correlation horizons defined by D. Feary(personal communication 2000). Asterisks represent occurrences of
corallinacean debris. Variations of oxygen and carbon isotopicvalues are used for defining intervals of sea level rise andhighstands versus sea level lowerings. Gray shaded areas indicatetimes of rising sea level and highstands
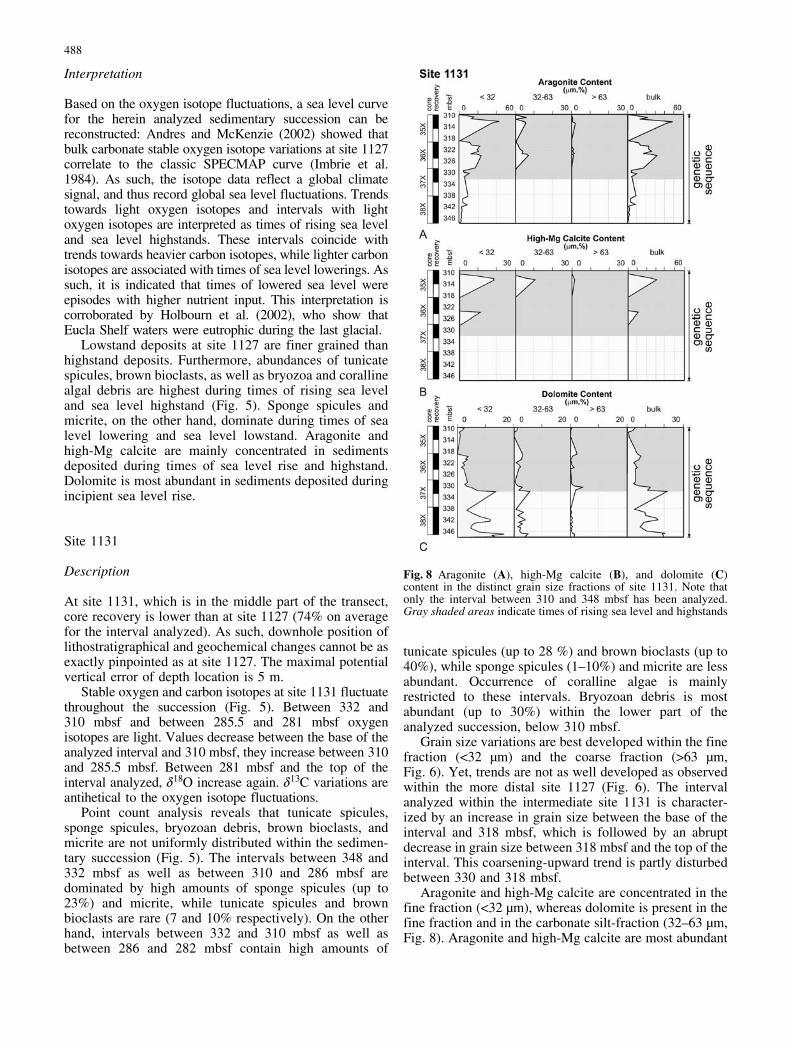
Fig. 6 Grain size variations within chosen intervals for sites 1127(A), 1131 (B), and 1129 (C). Trends are best developed within thefine fraction <32 �m and the coarse fraction >63 �m. Gray shadedareas indicate times of rising sea level and highstands
Fig. 7 Aragonite (A), high-Mg calcite (B), and dolomite (C)content in the distinct grain size fractions of site 1127. Note thatonly the interval between 337 and 366 mbsf has been analyzed.Gray shaded areas indicate times of rising sea level and highstands
487
Interpretation
Based on the oxygen isotope fluctuations, a sea level curvefor the herein analyzed sedimentary succession can bereconstructed: Andres and McKenzie (2002) showed thatbulk carbonate stable oxygen isotope variations at site 1127correlate to the classic SPECMAP curve (Imbrie et al.1984). As such, the isotope data reflect a global climatesignal, and thus record global sea level fluctuations. Trendstowards light oxygen isotopes and intervals with lightoxygen isotopes are interpreted as times of rising sea leveland sea level highstands. These intervals coincide withtrends towards heavier carbon isotopes, while lighter carbonisotopes are associated with times of sea level lowerings. Assuch, it is indicated that times of lowered sea level wereepisodes with higher nutrient input. This interpretation iscorroborated by Holbourn et al. (2002), who show thatEucla Shelf waters were eutrophic during the last glacial.
Lowstand deposits at site 1127 are finer grained thanhighstand deposits. Furthermore, abundances of tunicatespicules, brown bioclasts, as well as bryozoa and corallinealgal debris are highest during times of rising sea leveland sea level highstand (Fig. 5). Sponge spicules andmicrite, on the other hand, dominate during times of sealevel lowering and sea level lowstand. Aragonite andhigh-Mg calcite are mainly concentrated in sedimentsdeposited during times of sea level rise and highstand.Dolomite is most abundant in sediments deposited duringincipient sea level rise.
Site 1131
Description
At site 1131, which is in the middle part of the transect,core recovery is lower than at site 1127 (74% on averagefor the interval analyzed). As such, downhole position oflithostratigraphical and geochemical changes cannot be asexactly pinpointed as at site 1127. The maximal potentialvertical error of depth location is 5 m.
Stable oxygen and carbon isotopes at site 1131 fluctuatethroughout the succession (Fig. 5). Between 332 and310 mbsf and between 285.5 and 281 mbsf oxygenisotopes are light. Values decrease between the base of theanalyzed interval and 310 mbsf, they increase between 310and 285.5 mbsf. Between 281 mbsf and the top of theinterval analyzed, d18O increase again. d13C variations areantihetical to the oxygen isotope fluctuations.
Point count analysis reveals that tunicate spicules,sponge spicules, bryozoan debris, brown bioclasts, andmicrite are not uniformly distributed within the sedimen-tary succession (Fig. 5). The intervals between 348 and332 mbsf as well as between 310 and 286 mbsf aredominated by high amounts of sponge spicules (up to23%) and micrite, while tunicate spicules and brownbioclasts are rare (7 and 10% respectively). On the otherhand, intervals between 332 and 310 mbsf as well asbetween 286 and 282 mbsf contain high amounts of
tunicate spicules (up to 28 %) and brown bioclasts (up to40%), while sponge spicules (1–10%) and micrite are lessabundant. Occurrence of coralline algae is mainlyrestricted to these intervals. Bryozoan debris is mostabundant (up to 30%) within the lower part of theanalyzed succession, below 310 mbsf.
Grain size variations are best developed within the finefraction (<32 �m) and the coarse fraction (>63 �m,Fig. 6). Yet, trends are not as well developed as observedwithin the more distal site 1127 (Fig. 6). The intervalanalyzed within the intermediate site 1131 is character-ized by an increase in grain size between the base of theinterval and 318 mbsf, which is followed by an abruptdecrease in grain size between 318 mbsf and the top of theinterval. This coarsening-upward trend is partly disturbedbetween 330 and 318 mbsf.
Aragonite and high-Mg calcite are concentrated in thefine fraction (<32 �m), whereas dolomite is present in thefine fraction and in the carbonate silt-fraction (32–63 �m,Fig. 8). Aragonite and high-Mg calcite are most abundant
Fig. 8 Aragonite (A), high-Mg calcite (B), and dolomite (C)content in the distinct grain size fractions of site 1131. Note thatonly the interval between 310 and 348 mbsf has been analyzed.Gray shaded areas indicate times of rising sea level and highstands
488
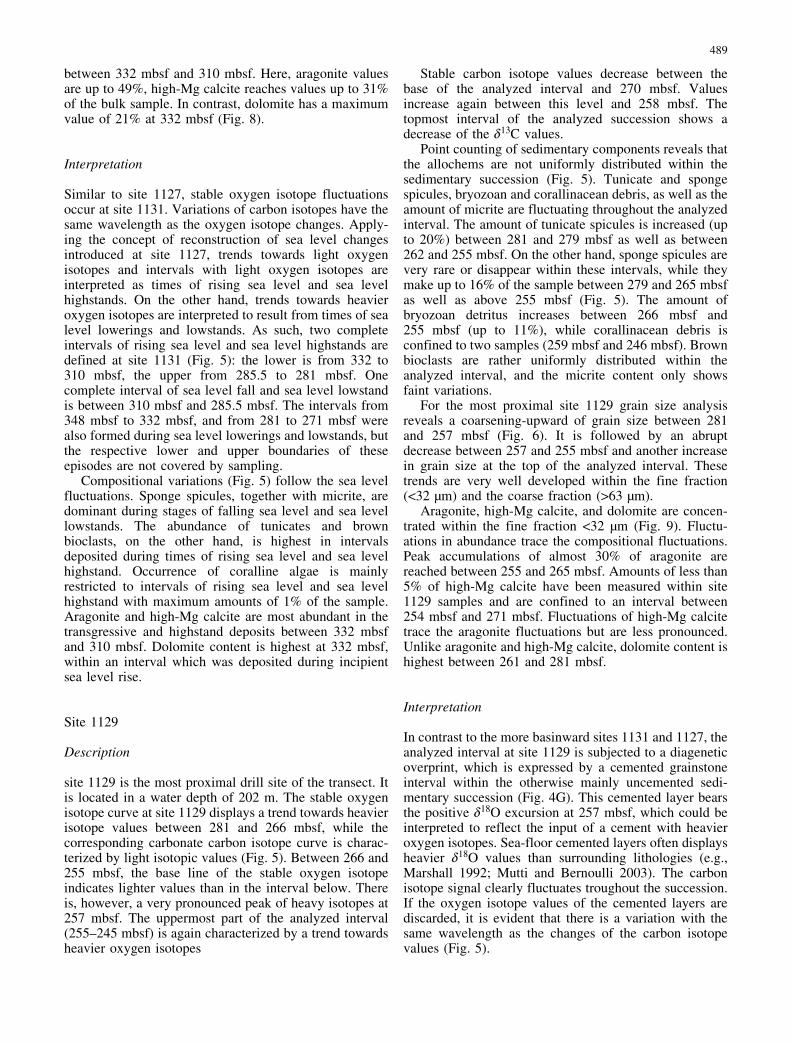
between 332 mbsf and 310 mbsf. Here, aragonite valuesare up to 49%, high-Mg calcite reaches values up to 31%of the bulk sample. In contrast, dolomite has a maximumvalue of 21% at 332 mbsf (Fig. 8).
Interpretation
Similar to site 1127, stable oxygen isotope fluctuationsoccur at site 1131. Variations of carbon isotopes have thesame wavelength as the oxygen isotope changes. Apply-ing the concept of reconstruction of sea level changesintroduced at site 1127, trends towards light oxygenisotopes and intervals with light oxygen isotopes areinterpreted as times of rising sea level and sea levelhighstands. On the other hand, trends towards heavieroxygen isotopes are interpreted to result from times of sealevel lowerings and lowstands. As such, two completeintervals of rising sea level and sea level highstands aredefined at site 1131 (Fig. 5): the lower is from 332 to310 mbsf, the upper from 285.5 to 281 mbsf. Onecomplete interval of sea level fall and sea level lowstandis between 310 mbsf and 285.5 mbsf. The intervals from348 mbsf to 332 mbsf, and from 281 to 271 mbsf werealso formed during sea level lowerings and lowstands, butthe respective lower and upper boundaries of theseepisodes are not covered by sampling.
Compositional variations (Fig. 5) follow the sea levelfluctuations. Sponge spicules, together with micrite, aredominant during stages of falling sea level and sea levellowstands. The abundance of tunicates and brownbioclasts, on the other hand, is highest in intervalsdeposited during times of rising sea level and sea levelhighstand. Occurrence of coralline algae is mainlyrestricted to intervals of rising sea level and sea levelhighstand with maximum amounts of 1% of the sample.Aragonite and high-Mg calcite are most abundant in thetransgressive and highstand deposits between 332 mbsfand 310 mbsf. Dolomite content is highest at 332 mbsf,within an interval which was deposited during incipientsea level rise.
Site 1129
Description
site 1129 is the most proximal drill site of the transect. Itis located in a water depth of 202 m. The stable oxygenisotope curve at site 1129 displays a trend towards heavierisotope values between 281 and 266 mbsf, while thecorresponding carbonate carbon isotope curve is charac-terized by light isotopic values (Fig. 5). Between 266 and255 mbsf, the base line of the stable oxygen isotopeindicates lighter values than in the interval below. Thereis, however, a very pronounced peak of heavy isotopes at257 mbsf. The uppermost part of the analyzed interval(255–245 mbsf) is again characterized by a trend towardsheavier oxygen isotopes
Stable carbon isotope values decrease between thebase of the analyzed interval and 270 mbsf. Valuesincrease again between this level and 258 mbsf. Thetopmost interval of the analyzed succession shows adecrease of the d13C values.
Point counting of sedimentary components reveals thatthe allochems are not uniformly distributed within thesedimentary succession (Fig. 5). Tunicate and spongespicules, bryozoan and corallinacean debris, as well as theamount of micrite are fluctuating throughout the analyzedinterval. The amount of tunicate spicules is increased (upto 20%) between 281 and 279 mbsf as well as between262 and 255 mbsf. On the other hand, sponge spicules arevery rare or disappear within these intervals, while theymake up to 16% of the sample between 279 and 265 mbsfas well as above 255 mbsf (Fig. 5). The amount ofbryozoan detritus increases between 266 mbsf and255 mbsf (up to 11%), while corallinacean debris isconfined to two samples (259 mbsf and 246 mbsf). Brownbioclasts are rather uniformly distributed within theanalyzed interval, and the micrite content only showsfaint variations.
For the most proximal site 1129 grain size analysisreveals a coarsening-upward of grain size between 281and 257 mbsf (Fig. 6). It is followed by an abruptdecrease between 257 and 255 mbsf and another increasein grain size at the top of the analyzed interval. Thesetrends are very well developed within the fine fraction(<32 �m) and the coarse fraction (>63 �m).
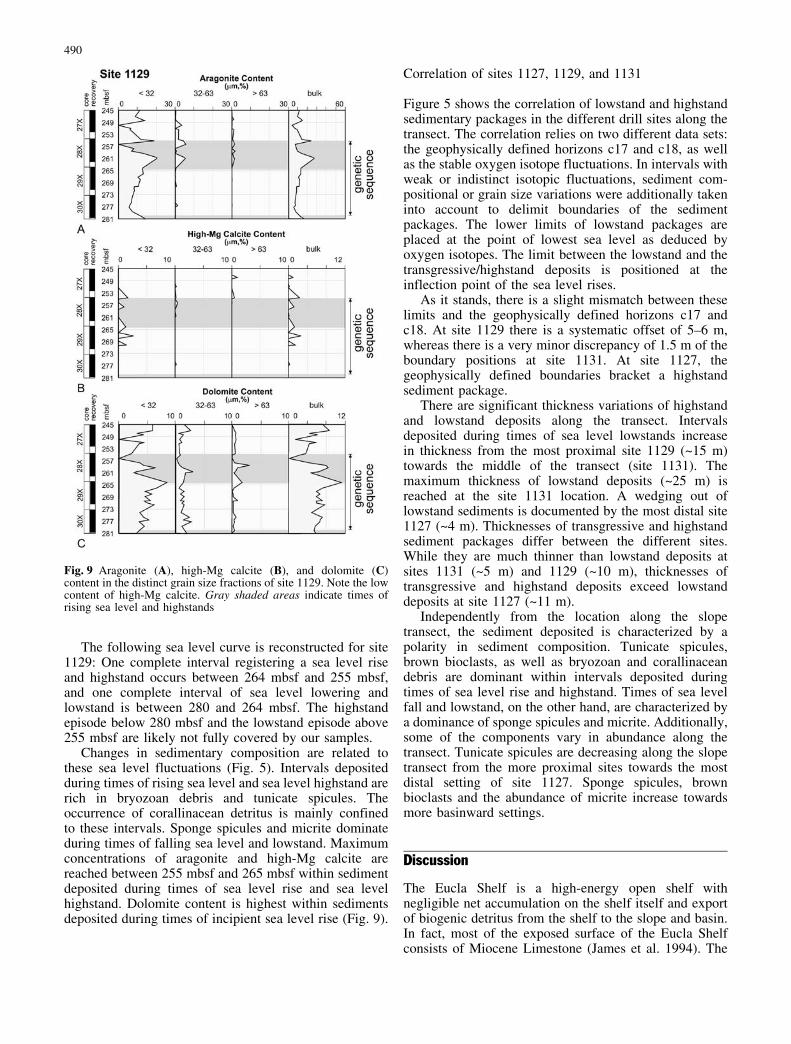
Aragonite, high-Mg calcite, and dolomite are concen-trated within the fine fraction <32 �m (Fig. 9). Fluctu-ations in abundance trace the compositional fluctuations.Peak accumulations of almost 30% of aragonite arereached between 255 and 265 mbsf. Amounts of less than5% of high-Mg calcite have been measured within site1129 samples and are confined to an interval between254 mbsf and 271 mbsf. Fluctuations of high-Mg calcitetrace the aragonite fluctuations but are less pronounced.Unlike aragonite and high-Mg calcite, dolomite content ishighest between 261 and 281 mbsf.
Interpretation
In contrast to the more basinward sites 1131 and 1127, theanalyzed interval at site 1129 is subjected to a diageneticoverprint, which is expressed by a cemented grainstoneinterval within the otherwise mainly uncemented sedi-mentary succession (Fig. 4G). This cemented layer bearsthe positive d18O excursion at 257 mbsf, which could beinterpreted to reflect the input of a cement with heavieroxygen isotopes. Sea-floor cemented layers often displaysheavier d18O values than surrounding lithologies (e.g.,Marshall 1992; Mutti and Bernoulli 2003). The carbonisotope signal clearly fluctuates troughout the succession.If the oxygen isotope values of the cemented layers arediscarded, it is evident that there is a variation with thesame wavelength as the changes of the carbon isotopevalues (Fig. 5).
489
The following sea level curve is reconstructed for site1129: One complete interval registering a sea level riseand highstand occurs between 264 mbsf and 255 mbsf,and one complete interval of sea level lowering andlowstand is between 280 and 264 mbsf. The highstandepisode below 280 mbsf and the lowstand episode above255 mbsf are likely not fully covered by our samples.
Changes in sedimentary composition are related tothese sea level fluctuations (Fig. 5). Intervals depositedduring times of rising sea level and sea level highstand arerich in bryozoan debris and tunicate spicules. Theoccurrence of corallinacean detritus is mainly confinedto these intervals. Sponge spicules and micrite dominateduring times of falling sea level and lowstand. Maximumconcentrations of aragonite and high-Mg calcite arereached between 255 mbsf and 265 mbsf within sedimentdeposited during times of sea level rise and sea levelhighstand. Dolomite content is highest within sedimentsdeposited during times of incipient sea level rise (Fig. 9).
Correlation of sites 1127, 1129, and 1131
Figure 5 shows the correlation of lowstand and highstandsedimentary packages in the different drill sites along thetransect. The correlation relies on two different data sets:the geophysically defined horizons c17 and c18, as wellas the stable oxygen isotope fluctuations. In intervals withweak or indistinct isotopic fluctuations, sediment com-positional or grain size variations were additionally takeninto account to delimit boundaries of the sedimentpackages. The lower limits of lowstand packages areplaced at the point of lowest sea level as deduced byoxygen isotopes. The limit between the lowstand and thetransgressive/highstand deposits is positioned at theinflection point of the sea level rises.
As it stands, there is a slight mismatch between theselimits and the geophysically defined horizons c17 andc18. At site 1129 there is a systematic offset of 5–6 m,whereas there is a very minor discrepancy of 1.5 m of theboundary positions at site 1131. At site 1127, thegeophysically defined boundaries bracket a highstandsediment package.
There are significant thickness variations of highstandand lowstand deposits along the transect. Intervalsdeposited during times of sea level lowstands increasein thickness from the most proximal site 1129 (~15 m)towards the middle of the transect (site 1131). Themaximum thickness of lowstand deposits (~25 m) isreached at the site 1131 location. A wedging out oflowstand sediments is documented by the most distal site1127 (~4 m). Thicknesses of transgressive and highstandsediment packages differ between the different sites.While they are much thinner than lowstand deposits atsites 1131 (~5 m) and 1129 (~10 m), thicknesses oftransgressive and highstand deposits exceed lowstanddeposits at site 1127 (~11 m).
Independently from the location along the slopetransect, the sediment deposited is characterized by apolarity in sediment composition. Tunicate spicules,brown bioclasts, as well as bryozoan and corallinaceandebris are dominant within intervals deposited duringtimes of sea level rise and highstand. Times of sea levelfall and lowstand, on the other hand, are characterized bya dominance of sponge spicules and micrite. Additionally,some of the components vary in abundance along thetransect. Tunicate spicules are decreasing along the slopetransect from the more proximal sites towards the mostdistal setting of site 1127. Sponge spicules, brownbioclasts and the abundance of micrite increase towardsmore basinward settings.
Discussion
The Eucla Shelf is a high-energy open shelf withnegligible net accumulation on the shelf itself and exportof biogenic detritus from the shelf to the slope and basin.In fact, most of the exposed surface of the Eucla Shelfconsists of Miocene Limestone (James et al. 1994). The
Fig. 9 Aragonite (A), high-Mg calcite (B), and dolomite (C)content in the distinct grain size fractions of site 1129. Note the lowcontent of high-Mg calcite. Gray shaded areas indicate times ofrising sea level and highstands
490

inner shelf has an aphotic and a photic carbonateproduction with kelp forests, molluscs, benthic foramini-fers, coralline algae, bryozoans, sponges, and echinoids(James 1997; James et al. 2001). The skeletal mineralogyis mainly calcite, high-Mg calcite, and aragonite. Towardsthe outer shelf, the biocenoeses are largely aphotic.Carbonate producers of the outer shelf are bryozoans,serpulids, barnacles, sponges, tunicates, bivalves, echi-noids, and benthic foraminifers (James 1997; James et al.2001). The Eucla Shelf shelf break is dominated bybryozoan mounds, which flourished during Late Pleis-tocene glacial sea level lowstands but are not active today(Feary et al. 2000; James et al. 2000; Holbourn et al.2002).
Sites analyzed in this study are located seaward of theshelf edge on the upper slope. Sediment particles in thisperiplatform setting are therefore an admixture of mate-rial transported downslope from the shelf and the shelfedge, as well as from an autochthonous carbonate factory.Among the group of components showing significantfluctuations in abundance, only corallinacean debris canbe reliably associated with the inner shelf photicenvironment. The high-Mg brown bioclasts may also bederived from the shelf. One possible origin of theseallochems is the biofragmentation of skeletal particles.The brown bioclasts, however, may have a similarprovenance than the brownish relict particles describedby James et al. (1997) from the adjacent modern LincolnShelf. There, such particles are most abundant in a waterdepth of 90–110 m. The brownish staining of the grainsresult from precipitation of microcrystalline high-Mgcalcite and subsequent iron-staining in meteoric tobrackish waters.
Most bryozoan debris is from articulated branchinggrowth forms (Fig. 4C). This group of bryozoans is themost widespread and abundant on the south Australianshelf (Bone and James 1993), where they occur down towater depths of 400 m. Sponges live on the shelf andupper slope, and as such spicules from these porifera inthe analyzed sediment are likely both autochthonous andallochthonous. Tunicates are an important component ofthe outer shelf and they are the most important aragonitesource within the analyzed cool-water carbonate succes-sion. Other neritic aragonite sources, such as e.g.,calcifying green algae, do not occur in this cool-watercarbonate setting (James et al. 2001). Pelagic aragonitesources, such as pteropods, were not found in the samples.In general, bioclasts are strongly reworked, and thus pointtowards the shelf as a source area.
The Pleistocene Eucla Shelf cool-water periplatformcarbonates show distinct sea level-controlled geneticsequences. A model for the formation of these shelfslope genetic sequences is proposed (Fig. 10, nos.1–4).Boundaries of the genetic sequences form during sea levellowstands, i.e., the intervals which are defined by theheaviest d18O values. They are expressed as grain sizechanges or as turning points in grain size trends. Forexample, a genetic sequence consisting of a coarsening-upward cycle occurs in proximal settings (site 1129).
Farther seaward, a genetic sequence is represented by acoarsening-upward cycle with a fining-upward portion atthe top of the cycle (site 1131 and 1127). We propose thatthis fining-upward occurs during incipient base level fall,when sediment which was previously deposited upslopebegins to be reworked and redeposited downslope. Thefining-upward part of the genetic sequence is thinning in abasinward direction.
Lowstand and transgressive/highstand deposits of theEucla shelf slope genetic sequences show differentgeometries. Whereas lowstand deposits have a lense-shaped form and thin out up- and downslope, transgres-sive and highstand deposits are more expanded and onlyshow minor lateral changes in thickness (Fig. 10).
The changing symmetry of a high-frequency sequencetogether with the recorded wedging out of lowstanddeposits towards the basin (Fig. 10, nos. 2, 4) is a product
Fig. 10 Model for formation of cool-water carbonate shelf slopehigh-frequency sequences. Highstand deposits (1, 3) are moreexpansive than lowstand deposits (2, 4). Wavebase (WB) isindicated by dashed lines; arrows indicate sea level changes. Seetext for more explanation
491
of sediment volume partitioning. During times of sealevel highstand (Fig. 10, nos. 1, 3), the inner to middleshelf area of the modern Eucla Shelf is within the zone ofwave abrasion (cf. James et al. 1994, 2001). Wavereworking of the seafloor inhibits significant accumula-tion of sediment on this part of the shelf. Conversely, theouter shelf is a region of sediment accumulation (James etal. 1994). During sea level lowstand (Fig. 10, nos. 2, 4)the shoreline shifts basinward, partially exposing theinner and middle shelf and placing the outer shelf withinthe zone of wave abrasion. The carbonate factory isthereby restricted and sediment export to the slope isreduced.
Within the Eucla Shelf slope deposits tunicatespicules, brown high-Mg bioclasts, as well as bryozoanand corallinacean debris are dominant within intervalsdeposited during times of sea level rise and highstand,whereas sponge spicules and micrite characterize depositsformed during times of sea level lowstand. This polarityin components and faunal associations represents ahighstand versus lowstand differentiation of the carbonatefactory. The controlling mechanism of this shift is notresolvable with our data. It may be related to changes ofthe water temperature on the shelf or to fluctuations of thenutrient supply.
Due to the distinct carbonate mineralogy of theallochems, aragonite and high-Mg calcite are not uni-formly distributed throughout the succession, and both areconcentrated in sediments which form during sea levelrises and sea level highstands. Throughout the sedimen-tary successions dolomite is most abundant in sedimentsdeposited at the onset of sea level rises (Figs. 7, 8, 9). Thisrelationship could reflect very early diagenetic dolomiti-zation, driven by fluid fluxes associated with sea levelchanges. Such a mechanism was proposed by Swart et al.(2000) for Eucla Shelf slope deposits. Another possiblesource of the dolomite is detrital dolomite, described fromEucla Shelf sediments by Bone et al. (1992) and James et
al. (1994). Shedding of reworked dolomite from the shelfto the slope during times of initial sea level rise isimaginable for the herein described sediments.
Summary
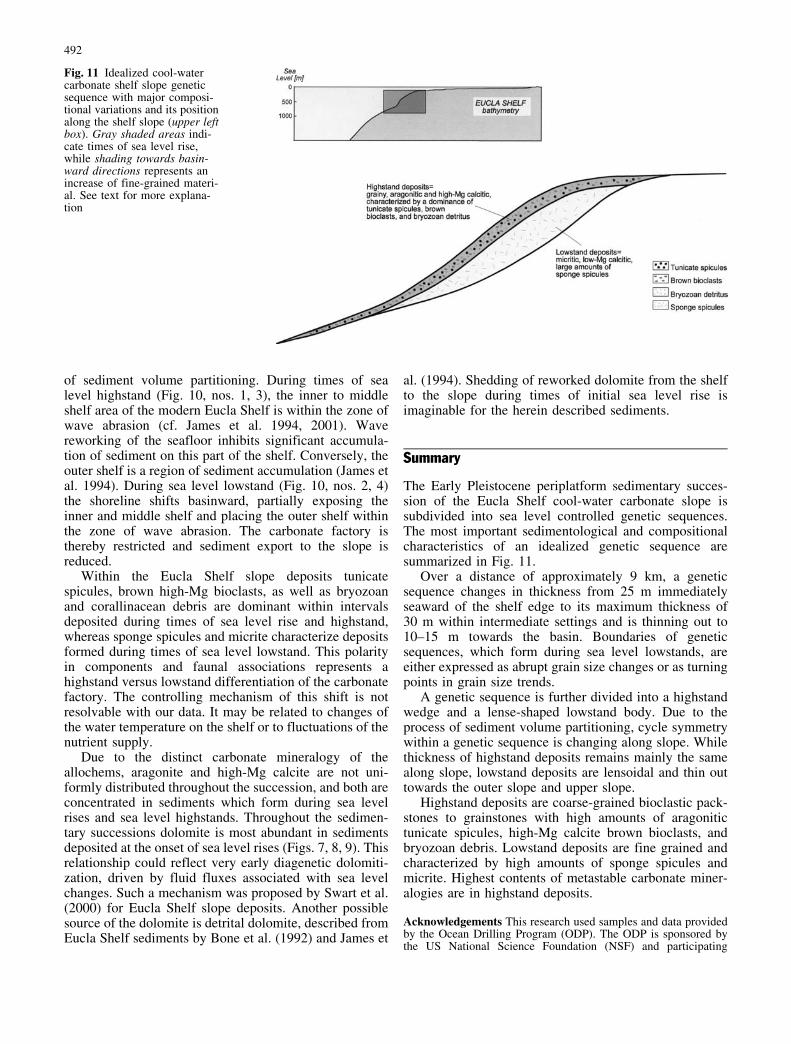
The Early Pleistocene periplatform sedimentary succes-sion of the Eucla Shelf cool-water carbonate slope issubdivided into sea level controlled genetic sequences.The most important sedimentological and compositionalcharacteristics of an idealized genetic sequence aresummarized in Fig. 11.
Over a distance of approximately 9 km, a geneticsequence changes in thickness from 25 m immediatelyseaward of the shelf edge to its maximum thickness of30 m within intermediate settings and is thinning out to10–15 m towards the basin. Boundaries of geneticsequences, which form during sea level lowstands, areeither expressed as abrupt grain size changes or as turningpoints in grain size trends.
A genetic sequence is further divided into a highstandwedge and a lense-shaped lowstand body. Due to theprocess of sediment volume partitioning, cycle symmetrywithin a genetic sequence is changing along slope. Whilethickness of highstand deposits remains mainly the samealong slope, lowstand deposits are lensoidal and thin outtowards the outer slope and upper slope.
Highstand deposits are coarse-grained bioclastic pack-stones to grainstones with high amounts of aragonitictunicate spicules, high-Mg calcite brown bioclasts, andbryozoan debris. Lowstand deposits are fine grained andcharacterized by high amounts of sponge spicules andmicrite. Highest contents of metastable carbonate miner-alogies are in highstand deposits.
Acknowledgements This research used samples and data providedby the Ocean Drilling Program (ODP). The ODP is sponsored bythe US National Science Foundation (NSF) and participating
Fig. 11 Idealized cool-watercarbonate shelf slope geneticsequence with major composi-tional variations and its positionalong the shelf slope (upper leftbox). Gray shaded areas indi-cate times of sea level rise,while shading towards basin-ward directions represents anincrease of fine-grained materi-al. See text for more explana-tion
492
countries under management of Joint Oceanographic Institutions(JOI), Inc. Funding for this research was provided by DeutscheForschungsgemeinschaft (DFG; Be 1272/6, /8), which is gratefullyacknowledged. Rainer Petschick (Frankfurt) operated the X-raydiffractometer and assisted in data processing. Isotope data used inthis study were partly generated by Peter Swart (Miami).Geophysically defined correlation horizons presented in Fig. 5were developed by David Feary (Washington). Jeff Lukasik, MariaMutti, and Brian Pratt helped in improving the manuscript throughcareful and very constructive reviews. The research was funded bythe Deutsche Forschungsgemeinschaft (Be 1272/6, /8), which isgratefully acknowledged.
References
Andres MS, McKenzie JA (2002) Data report: Late Pleistoceneoxygen and carbon isotope stratigraphy in bulk- and fine-fraction carbonate from the Great Australian Bight, ODP Leg182, site 1127. In: Hine AC, Feary DA, Malone MJ (eds)Proceedings of the ocean drilling program, scientific results, vol182 pp 1–13
Bone Y, James NP (1993) Bryozoans as carbonate sedimentproducers on the cool-water Lacepede Shelf, southern Aus-tralia. Sediment Geol 86:247–281
Bone Y, James NP, Kyser TK (1992) Synsedimentary detritaldolomite in Quaternary cool-water carbonate sediments, Lace-pede Shelf, South Australia. Geology 20:109–112
Busch DA (1959) Prospecting for stratigraphic traps. Am AssocPetrol Geol Bull 43:2829–2843
Cross TA (1988) Controls on coal distribution in transgressive-regressive cycles, Upper Cretaceous, Western Interior, USA.In: Wilgus et al. (eds) Sea-level changes: an integratedapproach. Soc Econ Pal Mineral Spec Publ 42:371–380
Cross TA, Baker MR, Chapin MA, Clark MS, Gardner MH,Hanson MS, Lessenger MA, Little LD, McDonough KJ,Sonnenfeld MD, Valasek DW, Williams MR, Witter DN(1993) Applications of high-resolution sequence stratigraphy toreservoir analysis. In: Eschard R, Doligez B (eds) Subsurfacereservoir characterization from outcrop observations. �ditionsTechnip 51:11–33
Cross TA, Lessenger MA (1998) Sediment volume partitioning:rationale for stratigraphic model evaluation and high-resolutionstratigraphic correlation. In: Gradstein FM, Sandvik KO,Milton NJ (eds) Sequence stratigraphy-concepts and applica-tions. Norwegian Petrol Soc Spec Publ 8:171–195
Dunham, RJ (1962) Classification of carbonate rocks according todepositional texture. Am Assoc Petrol Geol Mem 1:108–121
Eberli GP, Ginsburg RN (1989) Cenozoic progradation of north-western Great Bahama Bank, a record of lateral platform growthand sea-level fluctuations. SEPM Spec Publ 44:339–351
Eberli GP, Swart PK, Malone MJ et al. (1997) Proceedings of theocean drilling program, initial reports, 166. Ocean drillingprogram, College Station, TX, 850 pp
Feary DA, James NP (1995) Cenozoic biogenic mounds and buriedMiocene(?) barrier reef on a predominantly cool-water carbon-ate continental margin—Eucla basin, western Great AustralianBight. Geology 23:427–430
Feary DA, James NP (1998) Seismic stratigraphy and geologicalevolution of the Cenozoic, cool-water Eucla-Platform, GreatAustralian Bight. Am Assoc Petrol Geol Bull 82:792–816
Feary DA, Hine AC, Malone MJ et al. (2000) Proc ODP Init Rep,182 [CD-ROM]. Available from: Ocean Drilling Program,Texas A&M University, College Station, TX 77845–9547, USA
Grammer GM, Eberli GP, Van Buchem FSP, Stevenson GM,Homewood PW (2000) Application of high-resolution sequencestratigraphy in developing an exploration and productionstrategy for a mixed carbonate/siliciclastic system (Carbonif-erous) Paradox Basin, Utah, USA. In: Homewood PW, EberliGP (eds) Genetic stratigraphy on the exploration and produc-tion scales. Elf EP Mem 24:29–69
Hine AC, Wilber RJ, Neumann AC (1981) Carbonate sand bodiesalong contrasting shallow bank margins facing open seaways innorthern Bahamas. Am Assoc Petrol Geol Bull 65:261–290
Hine AC, Brooks GR, Mallinson D, Brunner CA, James NP, FearyDA, Holbourn AE, Drexler TM, Howd P (2002) Data report:Late Pleistocene-Holocene sedimentation along the upper slopeof the Great Australian Bight. In: Hine AC, Feary DA, MaloneMJ (eds) Proceedings of the ocean drilling program, scientificresults vol 182, pp 1–24
Holbourn A, Kuhnt W, James NP (2002) Late Pleistocene isotopestratigraphy and paleoceanography of the Great AustralianBight: the benthic foraminiferal record. Paleoceanography10.1029/2001PA000643 24 August 2002
Homewood PW, Eberli GP (2000) Genetic stratigraphy on theexploration and production scales. In: Homewood PW, EberliGP (eds) Genetic stratigraphy on the exploration and produc-tion scales. Elf EP Mem 24:17–27
Imbrie J, Hays JD, Martinson DG, McIntyre A, Mix AC, Morley JJ,Pisias NG, Prell WL, Shackleton NJ (1984) The orbital theoryof Pleistocene climate: support from a revised chronologyof themarine d18O record. In: Berger A, Imbrie J, Hays J, Kukla G,Saltzman B (eds) Milankovitch and climate. NATO ASI Ser C,Math Phys Sci 126:269–305
James NP (1997) The cool-water carbonate depositional realm. In:James NP, Clarke AD (eds) Cool-water carbonates. SocSediment Geol 56:1–20
James NP, von der Borch CC (1991) Carbonate shelf edge offsouthern Australia: A prograding open-platform margin. Geol-ogy 19:1005–1008
James NP, Boreen TD, Bone Y, Feary DA (1994) Holocenecarbonate sedimentation on the west Eucla Shelf, GreatAustralian Bight: a shaved shelf. Sediment Geol 90:161–177
James NP, Bone Y, Hageman SJ, Feary DA, Gostin VA (1997)Cool-water carbonate sedimentation during the terminal Qua-ternary sea-level cycle: Lincoln Shelf, southern Australia. In:James NP, Clarke AD (eds) Cool-water carbonates, SocSediment Geol 56:53–75
James NP, Feary DA, Surlyk F, Simo JAT, Betzler C, HolbournAE, Li Q, Matsuda H, Machiyama H, Brooks GR, Andres MS,Hine AC, Malone MJ, Ocean driiling program leg 182Scientific Party (2000) Quaternary bryozoan reef mounds incool-water, upper slope environments: Great Australian Bight.Geology 28:647–650
James NP, Bone Y, Collins LB, Kyser TK (2001) Surficialsediments of the Great Australian Bight: Facies dynamics andoceanography on a vast cool-water carbonate shelf. J SedimentRes 71:549–567
Lerat O, Van Buchem FSP, Eschard R, Grammer GM, HomewoodPW (2000) Facies distribution and control by accomodationwithin high-frequency cycles of the Upper Ismay Interval(Pennsylvanian, Paradox Basin, Utah, USA). In: HomewoodPW, Eberli GP (eds) Genetic stratigraphy on the explorationand production scales. Elf EP Mem 24:71–91
Marshall JD (1992) Climatic and oceanographic isotopic signalsfrom the carbonate rock record and their preservation. GeolMag 129:143–160
Mutti M, Bernoulli D (2003) Early marine lithification andhardground development on a Miocene ramp (Maiella, Italy):key surfaces to track changes in trophic resources in nontropicalcarbonate settings. J Sediment Res 73:294–306
Shackleton NJ (1987) Oxygen isotopes, ice volume and sea level.Quat Sci Rev 6:183–190
Shipboard Scientific Party (2000) Leg 182 summary. In: Feary DA,Hine AC, Malone MJ et al. (eds) Proc. ODP Init. Rep. 182,College Station, TX (Ocean drilling program), pp 1–58
Swart PK, Wortmann UG, Mitterer RM, Malone MJ, Smart PL,Feary DA, Hine AC (2000) Hydrogen sulfide-rich hydrates andsaline fluids in the continental margin of South Australia.Geology 28:1039–1042
Wilber RJ, Milliman JD, Halley RB (1990) Accumulation of bank-top sediment on the western slope of Great Bahama Bank: Rapidprogradation of a carbonate megabank. Geology 18:970–974
493


![[Cool] Gas Chromatography and Lipids](https://static.fdokumen.com/doc/165x107/6325a4b1852a7313b70e98e9/cool-gas-chromatography-and-lipids.jpg)