Gut Microbiome Characteristics in IgA Nephropathy - Frontiers

ORIGINAL RESEARCH
Genetic modulation of diabetic nephropathy among mousestrains with Ins2 Akita mutationXiuju Wu1, Richard C. Davis1, Timothy S. McMillen2, Valerie Schaeffer2, Zhiqiang Zhou1,Hongxiu Qi1, Parisa N. Mazandarani1, Roshanak Alialy1, Kelly L. Hudkins3, Aldons J. Lusis1,4 &Ren�ee C. LeBoeuf2
1 Division of Cardiology, Department of Medicine, David Geffen School of Medicine, University of California, Los Angeles, Los Angeles,
California, USA
2 Division of Metabolism, Endocrinology and Nutrition, Department of Medicine, University of Washington, Seattle, Washington, USA
3 Department of Pathology, University of Washington, Seattle, Washington, USA
4 Department of Human Genetics, University of California, Los Angeles, Los Angeles, California, USA
Keywords
Akita, Animal models, Albuminuria, Diabetic
nephropathy, Genetics.
Correspondence
Richard Davis, Division of Cardiology,
Department of Medicine, David Geffen
School of Medicine, University of California,
Los Angeles, Los Angeles, CA 90095, USA.
Tel: 310-206-4758
Fax: 310-825-2450
E-mail: [email protected]
Funding Information
This work was supported in part by 1DP3
D094311 and National Institutes of Health
Training Grant T32-DK-07789.
Received: 12 September 2014; Revised: 20
October 2014; Accepted: 21 October 2014
doi: 10.14814/phy2.12208
Physiol Rep, 2 (11), 2014, e12208,
doi:10.14814/phy2.12208
Abstract
Diabetic nephropathy (DN) is a major complication of diabetes and the lead-
ing cause of end-stage renal disease. DN is characterized by changes in kidney
structure and function but the underlying genetic and molecular factors are
poorly understood. We used a mouse diversity panel to explore the genetic
basis of DN traits in mice carrying the Ins2 Akita mutation. Twenty-eight
Akita strains were generated by breeding this panel to DBA/2.Akita mice. Male
F1 diabetic and nondiabetic littermates were evaluated for DN-related traits.
Urine albumin-to-creatinine ratios (ACRs), volume and cystatin C as well as
blood urea nitrogen and lipoprotein levels varied significantly among the dia-
betic strains. For most Akita strains, ACR values increased 2- to 6-fold over
euglycemic control values. However, six strains exhibited changes in ACR
exceeding 10-fold with two strains (NOD/ShiLt and CBA) showing 50- to 83-
fold increases. These increases are larger than previously reported among
available DN mouse models establishing these strains as useful for additional
studies of renal function. ACRs correlated with cystatin C (P = 0.0286), a
measure of hyperfiltration and an interstitial tubular marker associated with
DN onset in humans suggesting that tubule damage as well as podocyte-stress
contributed to reduced kidney function assessed by ACR. Although large
changes were seen for ACRs, severe nephropathology was absent. However,
glomerular hypertrophy and collagen IV content were found to vary signifi-
cantly among strains suggesting a genetic basis for early onset features of DN.
Our results define the range of DN phenotypes that occur among common
inbred strains of mice.
Introduction
Diabetic nephropathy (DN) is the leading cause of end-
stage renal disease (ESRD) (USRDS: the United States
Renal Data System 2003) and is also an independent risk
factor for cardiovascular disease in diabetic patients (Sar-
nak et al. 2003). Among patients with diabetes (type 1 and
type 2) the lifetime risk of DN is 20–30% (Rossing et al.
1995; USRDS: the United States Renal Data System 2003).
Early manifestations of DN include loss of podocyte
density and modestly elevated levels of urine albumin
(microalbuminuria) followed 5–10 years later by severe
proteinuria (macroalbuminuria) (Fioretto et al. 1992;
Pagtalunan et al. 1997; Mauer and Drummond 2002). The
major hallmarks of severe DN include glomerular hyper-
trophy, thickening of the glomerular basement membrane,
glomerulosclerosis, mesangial matrix expansion, podocyte
loss and tubulointerstitial fibrosis (Fioretto et al. 1992;
Arora and Singh 2013). Patients with type 1 diabetes mell-
itus (T1D) often exhibit enlarged kidneys and elevations
ª 2014 The Authors. Physiological Reports published by Wiley Periodicals, Inc. on behalf of
the American Physiological Society and The Physiological Society.
This is an open access article under the terms of the Creative Commons Attribution License,
which permits use, distribution and reproduction in any medium, provided the original work is properly cited.
2014 | Vol. 2 | Iss. 11 | e12208Page 1
Physiological Reports ISSN 2051-817X

in glomerular filtration rate (GFR) (Wiseman et al. 1985;
Mauer and Drummond 2002). DN may result in ESRD,
particularly in T1D patients, with treatments limited to
dialysis or kidney transplantation. Clinical trials focusing
on standard therapy to control hyperglycemia and hyper-
tension have not shown markedly improved outcomes
(Himmelfarb and Tuttle 2013). In fact, treatment of T1D
patient with drugs inhibiting the renin-angiotensin-aldo-
sterone system showed no improvement in glomerular
pathology although there was delay of overall renal func-
tional impairment (Mauer et al. 2009). Thus, the identifi-
cation of early markers of DN as well as new therapeutic
targets for treatments of DN associated with diabetes
remains paramount.
The precise molecular factors involved in DN are
poorly understood, and human genetic studies have been
only modestly helpful (Arora and Singh 2013). Pathways
implicated in the pathogenesis of DN are oxidative stress,
protein kinase C, activation of receptor of AGEs and
nuclear receptors including the nuclear factor–kB tran-
scription factor family and the JAK/STAT pathway (Sch-
mid et al. 2006; King 2008; Arora and Singh 2013).
Specific candidate genes have been derived for DN from
association studies and include inflammatory molecules,
TGF-beta receptors, VEGF, angiotensin-converting
enzyme, BMPs, BMP antagonists, and lipid transport
genes (reviewed in Brennan et al. 2013). Novel candidate
genes have also been identified such as FRMD3 (4.1 pro-
tein ezrin, radixin, moesin [FERM] domain containing 3)
and CARS (cysteinyl-tRNA synthatase) in association
studies involving a large cohort of T1D and control
patients (Pezzolesi et al. 2009). Genome-wide association
studies (GWAS) focusing on T1D DN have been less
informative but data support several novel candidate
genes including AFF3 and ERBB4 as well as genome-wide
significant QTLs located on other chromosomes (Fager-
holm et al. 2012; Sandholm et al. 2012). Roles for these
proteins in DN have not been defined or studied in ani-
mal models, and prognostic and therapeutic avenues
involving these genes have not been developed. Thus,
molecular pathways specific for DN remain unclear and
the identification of genes influencing susceptibility and
resistance to DN would aid in a better understanding of
processes leading to DN.
The heterogeneity and variable time of onset of DN have
complicated both molecular and genetic studies in
humans. Mouse models such as Akita and leptin receptor
and ligand deficient mice offer the opportunity to study
DN under controlled genetic and environmental condi-
tions. As yet, these mutations have been examined only on
a small set of genetic backgrounds in the mouse. In this
study, we set out to explore the range of traits associated
with DN that occur in mice carrying the Akita mutation.
Because genetic background has a profound effect on
DN pathogenesis, we tested the hypothesis that studies of
DN across a greater number of inbred mouse strains
would provide broader knowledge of DN in mouse mod-
els. Further, this information will eventually be used in a
systems biology approach to identify genes and gene
pathways controlling DN in the mouse system in order to
guide future clinical studies toward improved therapy
(Bennett et al. 2012; Ghazalpour et al. 2012). Here, we
used a large-scale mouse diversity panel to explore the
genetic basis of early onset and progression of DN in
mice carrying the Akita mutation. Male mice of strain
DBA/2 heterozygous for the Akita gene were bred to 28
different inbred strains chosen from a panel of inbred
strains that we have previously shown to be powerful in
association mapping of complex traits (Bennett et al.
2010). Kidney traits were evaluated for diabetic and
nondiabetic F1 littermates. We found that mouse strains
varied widely in extent of albuminuria (assessed as
albumin-to-creatinine ratio [ACR]) as well as urine levels
of cystatin C (cystatin C–to-creatinine ratio [CCR]), an
interstitial tubular marker associated with DN onset in
humans. A robust correlation between ACR and CCR was
found suggesting that both traits provide early markers
for potential DN. Finally, glomerular hypertrophy was
seen for many mouse strains although the extent of this
trait did not correlate with ACR. Overall, this report
provides a wider record of DN traits across mouse strains
as well as provides an important tool for further identifi-
cation of genes modulating DN.
Materials and Methods
Mice and experimental design
Male DBA/2 mice heterozygous for the Ins2 Akita muta-
tion (DBA.Akita) were purchased from The Jackson Lab-
oratory (Bar Harbor, ME) and bred to females from 28
inbred strains (also purchased from The Jackson Labora-
tory) in order to generate F1 mice. In the text and most
Figures, strain names are listed with respect to female
strain and without the “J” (except for strain A/J) denoting
the commercial source (The Jackson Laboratory).
Male F1 mice carrying the Ins2 Akita mutation as well
as F1 male euglycemic littermate controls were main-
tained on pelleted rodent chow (PicoLab rodent Diet 20
#5053; 4.5% fat by weight; 20% protein). Animals were
housed in pathogen-free conditions, in a temperature and
humidity-controlled environment (12-h light/dark cycle).
Mice were weaned at 21 days and housed as 3–5 mice
per cage. At 6 weeks of age, mice were assessed for blood
glucose (taken via tail-nick) to identify which mice were
diabetic versus euglycemic. Confirmation of genotype was
2014 | Vol. 2 | Iss. 11 | e12208Page 2
ª 2014 The Authors. Physiological Reports published by Wiley Periodicals, Inc. on behalf of
the American Physiological Society and The Physiological Society.
Diabetic Nephropathy in Akita Mouse Strains X. Wu et al.

done as described (http://jaxmice.jax.org/protocolsdb/f?
p=116:2:::NO:2:P2_MASTER_PROTOCOL_ID,P2_JRS_
CODE:176,003548). Mice were maintained for 4–5 months
with no insulin treatment at which time they were eutha-
nized by cervical dislocation following isofluorane anesthe-
sia. Blood and urine samples were taken as described
below. Tissues were weighed and either snap-frozen in
liquid nitrogen followed by storage at �80°C or placed in
buffered formalin for histological and morphological
analysis. All animal procedures were reviewed and
approved by the Institutional Care and Use Committees at
the University of California, Los Angeles and the Univer-
sity of Washington, Seattle.
Blood and plasma assays
Blood was collected from mice that were fasted for 4–5 h
and bled 4 h after the beginning of the light cycle from
the retro-orbital plexus using isofluorane anesthesia
immediately prior to euthanasia. Blood glucose levels were
monitored using a portable glucose measuring device (Al-
phaTRAK�, Abbott Laboratories, North Chicago, IL).
Plasma was isolated by centrifugation in BD Microtainer
tubes with EDTA (Becton, Dickinson and Company,
Franklin Lakes, NJ). Plasma glucose levels were measured
using the glucose oxidase reaction as monitored in a Beck-
man Glucose Analyzer 2 (Beckman Instruments). Plasma
total cholesterol, HDL cholesterol, free cholesterol, trigly-
cerides, and free fatty acid (FFA) concentrations were
determined by enzymatic assays employing colorimetric
endpoints as described previously (Hedrick et al. 1993;
Mehrabian et al. 1993; Puppione and Charugundla 1994).
Plasma BUN levels were assessed with a colorimetric assay
(Kit #DIUR-500, BioAssay Systems, Hayward, CA).
Urine assays
During the week prior to euthanasia, mouse urines were
collected and volumes assessed over 24 h using metabolic
cages designed for efficient recovery and separation of
urine from feces in individual mice (Tecniplast, West
Chester, PA). In some cases, spot urines were collected
over a period of 4–12 h using a custom-made mouse
urine collection station. The mice had free access to
water and food during the time of urine collection.
Urine albumin measurements were performed using the
Albuwell M ELISA kit (Exocell, Philadelphia, PA) and
creatinine levels in the urine were determined by The
Creatinine Companion kit (Exocell) according to the
manufacturer’s instructions. Prior to assays, urines were
diluted such that albumin and creatinine levels were in
the linear range. Urinary albumin-to-creatinine ratios
(ACRs) were calculated as microgram urinary albumin
per mg urinary creatinine. Quantification of urine cysta-
tin C protein levels were performed by Elisa procedures
as described by the manufacturers (#RD291009200R, Bio-
Vendor Research, Asheville, NC and #1019, Exocell Inc.).
Urine dilutions were 1:20 for cystatin C. For nehprin,
Elisa procedures were performed following urine dilu-
tions of 1:10 (Kit #1019, Exocell Inc.). Values were nor-
malized to urine creatinine levels as obtained from the
albumin-to-creatinine assay.
Immunohistochemistry and morphometricanalysis
Formalin fixed paraffin embedded kidneys were cut into
5 lm sections. For glomerular hypertrophy, one section per
kidney per mouse (n = 3–4 mice/strain) were stained with
H&E. All glomeruli within one complete kidney section
were counted and areas determined, excluding the Bow-
man’s capsule. Areas were quantified using ImageJ (NIH)
Software (http://rsb.info.nih.gov/ij/) by an observer blinded
to animal genotype. Visual inspection of tubule areas were
carried out to assess gross damage as a function of diabetes.
For immuno-staining, sections were deparaffinized,
rehydrated, and soaked overnight in water at 65°C. Sec-tions were then treated with protease XXIV (#HK053-5K,
BioGenex, Fremont, CA), followed by routine immuno-
staining using a kit (Kit #CTS008, R&D Systems, Minneap-
olis, MN). The antibody to collagen IV was used at a
1:1000 dilution for 1 h at room temperature (#1340-01,
Southern Biotech, Birmingham, AL). An antibody against
mouse Ki67 (Abcam, Cambridge, MA) was used to show
cellular proliferation. Macrophages were detected using
anti-mouse F4/80 antibody (Abcam). Control sections
were generated that had no treatment with primary anti-
body. Collagen IV staining was quantified within glomeruli
and expressed as percent positive immunostaining area per
total glomerulus area. Five high-powered (10X) indepen-
dent visual fields were imaged from one section per mouse,
and data obtained for ≥25 glomeruli (n = 3–4 mice/strain).
Positive staining was quantified using ImageJ (NIH) soft-
ware by an observer blinded to animal genotype.
Statistical analysis
Data are reported as mean � SEMs and statistical signifi-
cance was established at P < 0.05. Nonparametric ANOVA
(Bonferroni correction) analyses followed by multiple
comparisons were performed as appropriate, focusing on
genotype and diabetic status. Correlations among quantita-
tive traits were done using BiWeight Midcorrelation within
the WGCNA package available in R-language program-
ming (http://www.inside-r.org/packages/cran/WGCNA/docs/
bicor) (Langfelder and Horvath 2012). This is an alternative
ª 2014 The Authors. Physiological Reports published by Wiley Periodicals, Inc. on behalf ofthe American Physiological Society and The Physiological Society.
2014 | Vol. 2 | Iss. 11 | e12208Page 3
X. Wu et al. Diabetic Nephropathy in Akita Mouse Strains

to using Pearson correlations as it is less adversely affected by
outlier values.
Results
Our goal was to access DN across a wide range of mouse
genetic backgrounds in order to provide new mouse
models of DN and to identify key genetic factors modu-
lating DN severity. We took advantage of the fact that
heterozygosity of the Ins2 Akita mutation causes severe
hyperglycemia to generate a panel of F1 mice across a
large number of mouse genetic backgrounds. Among the
available congenic strains carrying the Akita mutation,
the DBA/2 background develops the most severe kidney
disease (Brosius et al. 2009; Gurley et al. 2010; Chang
and Gurley 2012) and thus, we chose it as the “donor”
strain. Female Akita mice tend to be more resistant to
the effects of the Akita mutation than male mice exhibit-
ing variable glucose levels. Therefore, we restricted our
study to males.
Albuminuria varied markedly across 28strains of diabetic mice
It is known that genetic background influences the extent
of albuminuria in diabetic patients and mice and that mi-
croalbuminura is a risk factor for progression to DN
(Long et al. 2013). Thus, we explored the genetic varia-
tion in DN by evaluating urine albumin and creatinine
concentrations taken from mice at 5 months of age across
28 inbred strains.
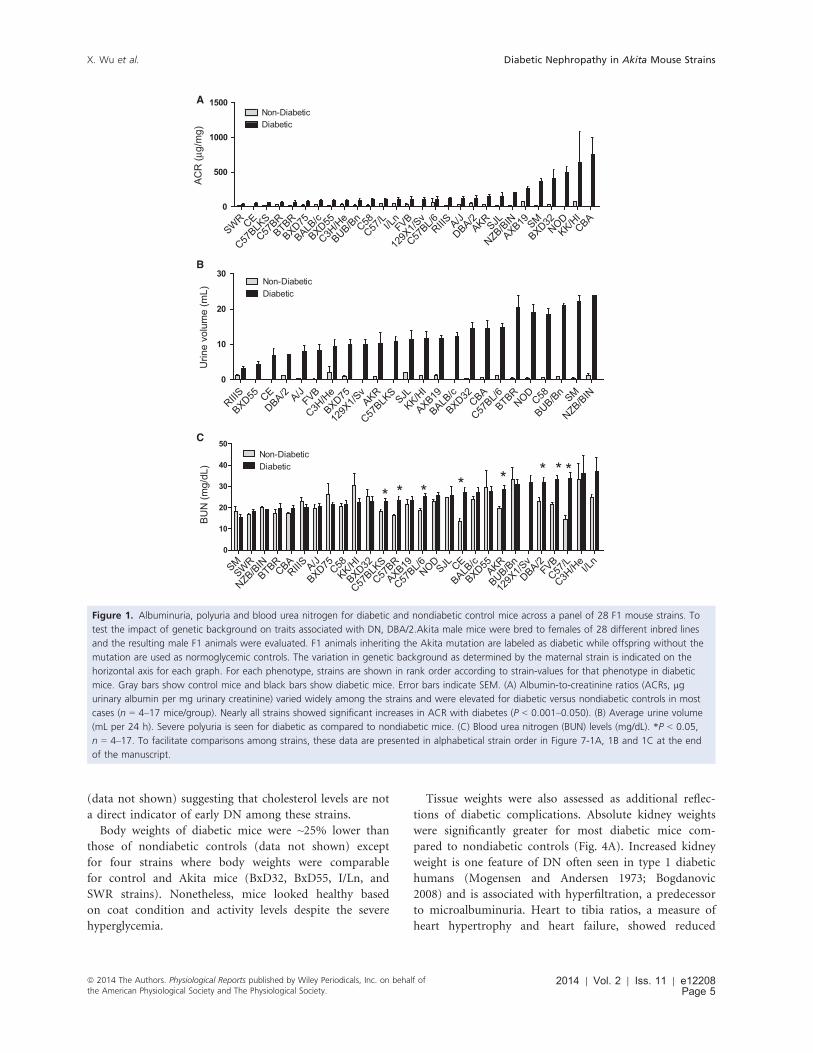
Albumin-to-creatinine ratios (ACR) were calculated for
diabetic mice and nondiabetic controls (Fig. 1A). Among
the nondiabetic mice, ACRs varied 80-fold with KK/HI
showing the highest levels. Among diabetic mice, ACR
values varied widely with mean ACRs ranging from 42 to
750 lg/mg (Fig. 1A). Strains KK/Hl, CBA and NOD/
ShiLt were highly sensitive to the early development and
progression of diabetic nephropathy with robust increases
in ACR for diabetic versus nondiabetic controls. For
instance, ACRs for diabetic CBA and NOD/ShiLt
increased 83-fold and 50-fold, respectively, over nondia-
betic controls. These increases are greater than the sug-
gested increases in ACR of 10-fold set as a standard to
validate, in part, a progressive mouse model of DN (Bro-
sius et al. 2009). Thus, these strains can be considered
potential models for DN. More moderate changes in ACR
were seen for strains SM (17-fold), BXD32/Ty (13-fold),
and AXB19/Pgn (4-fold). Strains SWR, C57BLKS, C57BR/
cd, BTBR, BXD75/Rww, C57L, BXD55/Rww, C3H/He,
BUB/Bn, and BALB/c were relatively resistant to albumin-
uria showing modest increases for diabetic mice (2- to 5-
fold).
Of note were the marked differences in the extent of
polyuria across the Akita strains (Fig. 1B). For nondiabet-
ic mice, values ranged 20-fold (0.10 mL/day for BALB/c
and CE to 2.20 mL/day for C3H/He) and increased
robustly and significantly with diabetes for each strain.
Daily urine volumes ranged 8-fold (3.1 mL/day for RIIIS
to 24 mL/day for NZB/BIN). ACR and polyuria traits did
not correlate significantly across the strains (Fig. 2). For
instance, BUB/Bn showed severe polyuria but reduced
ACR levels as compared to NOD/ShiLt that had both
polyuria and elevated ACR.
Blood urea nitrogen (BUN) levels are also a conventional
assessment of renal function. Among the F1 mice, BUN val-
ues for diabetic mice ranged from 15 to 37 mg/dL and five
strains showed significant elevations in BUN values as com-
pared to nondiabetic counterparts (Fig. 1C). Diabetic BUN
values did not correlate significantly with ACRs (Fig. 2).
Metabolic traits did not correlate with ACRlevels
The Akita mutation causes beta-cell failure as a result of
protein aggregate-induced endoplasmic reticulum stress
due to improper folding of proinsulin resulting in
reduced insulin production and hyperglycemia (Ron
2002). As expected, Akita mice exhibited severe hypergly-
cemia at necropsy (~5 months of age) with plasma glu-
cose levels ranging from 465 to 873 mg/dL as compared
to values for nondiabetic mice (129 to 264 mg/dL)
(Fig. 3A). Of note was that across all of the diabetic
strains studied here, there was no significant correlation
between plasma glucose levels and ACR (Fig. 2).
Plasma insulin levels varied among the mouse strains
(Fig. 3B). For nondiabetic mice, 4-h fasting levels varied
5-fold from 782 to 3676 pg/mL. For diabetic mice, insulin
levels were markedly reduced and ranged from 60 to
485 pg/mL and correlated negatively with plasma glucose
levels (Fig. 2; P = 0.006).
Because diabetes is often associated with alterations in
lipid levels (Bogdanovic 2008), total plasma cholesterol
(TC), triglyceride (TG), and high density lipoprotein
(HDL) levels were evaluated across the 28 strains. TG lev-
els (Fig. 3C) for most strains were significantly elevated
for diabetic versus nondiabetic mice and for diabetic
mice, were significantly correlated to plasma glucose levels
(Fig. 2; P = 0.001). Plasma TC levels remained compara-
ble between diabetic and nondiabetic cohorts except for a
few strains for which TC was significantly reduced (C3H/
He, FVB, KK/Hl) or elevated by diabetes (C58, AKR).
Variable responses to diabetes were seen among the 28
strains for HDL levels with many strains showing
decreases, increases and no change with diabetes. No cor-
relations were seen between TC or HDL and ACR values
2014 | Vol. 2 | Iss. 11 | e12208Page 4
ª 2014 The Authors. Physiological Reports published by Wiley Periodicals, Inc. on behalf of
the American Physiological Society and The Physiological Society.
Diabetic Nephropathy in Akita Mouse Strains X. Wu et al.
(data not shown) suggesting that cholesterol levels are not
a direct indicator of early DN among these strains.
Body weights of diabetic mice were ~25% lower than
those of nondiabetic controls (data not shown) except
for four strains where body weights were comparable
for control and Akita mice (BxD32, BxD55, I/Ln, and
SWR strains). Nonetheless, mice looked healthy based
on coat condition and activity levels despite the severe
hyperglycemia.
Tissue weights were also assessed as additional reflec-
tions of diabetic complications. Absolute kidney weights
were significantly greater for most diabetic mice com-
pared to nondiabetic controls (Fig. 4A). Increased kidney
weight is one feature of DN often seen in type 1 diabetic
humans (Mogensen and Andersen 1973; Bogdanovic
2008) and is associated with hyperfiltration, a predecessor
to microalbuminuria. Heart to tibia ratios, a measure of
heart hypertrophy and heart failure, showed reduced
SWR CE
C57BLK
S
C57BRBTBR
BXD75
BALB/c
BXD55
C3H/H
e
BUB/BnC58
C57/L I/L
nFVB
129X
1/Sv
C57BL/6RIIIS A/J
DBA/2AKR
SJL
NZB/BIN
AXB19 SMBXD32
NODKK/H
ICBA
0
500
1000
1500Non-DiabeticDiabetic
ACR
(µg/
mg)
RIIIS
BXD55 CEDBA/2 A/J
FVB
C3H/H
e
BXD75
129X
1/SvAKR
C57BLK
SSJL
KK/HI
AXB19
BALB/c
BXD32CBA
C57BL/6
BTBRNOD
C58
BUB/Bn SM
NZB/BIN
0
10
20
30Non-DiabeticDiabetic
Urin
e vo
lum
e (m
L)
SMSW
R
NZB/BINBTBR
CBARIIIS A/J
BXD75C58KK/H
I
BXD32
C57BLK
S
C57BR
AXB19
C57BL/6NOD
SJL CE
BALB/c
BXD55AKR
BUB/Bn
129X
1/Sv
DBA/2FVB
C57/L
C3H/H
eI/L
n0
10
20
30
40
50Non-DiabeticDiabetic
BU
N (m
g/dL
)
A
B
C
* * * * * ** *
Figure 1. Albuminuria, polyuria and blood urea nitrogen for diabetic and nondiabetic control mice across a panel of 28 F1 mouse strains. To
test the impact of genetic background on traits associated with DN, DBA/2.Akita male mice were bred to females of 28 different inbred lines
and the resulting male F1 animals were evaluated. F1 animals inheriting the Akita mutation are labeled as diabetic while offspring without the
mutation are used as normoglycemic controls. The variation in genetic background as determined by the maternal strain is indicated on the
horizontal axis for each graph. For each phenotype, strains are shown in rank order according to strain-values for that phenotype in diabetic
mice. Gray bars show control mice and black bars show diabetic mice. Error bars indicate SEM. (A) Albumin-to-creatinine ratios (ACRs, lg
urinary albumin per mg urinary creatinine) varied widely among the strains and were elevated for diabetic versus nondiabetic controls in most
cases (n = 4–17 mice/group). Nearly all strains showed significant increases in ACR with diabetes (P < 0.001–0.050). (B) Average urine volume
(mL per 24 h). Severe polyuria is seen for diabetic as compared to nondiabetic mice. (C) Blood urea nitrogen (BUN) levels (mg/dL). *P < 0.05,
n = 4–17. To facilitate comparisons among strains, these data are presented in alphabetical strain order in Figure 7-1A, 1B and 1C at the end
of the manuscript.
ª 2014 The Authors. Physiological Reports published by Wiley Periodicals, Inc. on behalf ofthe American Physiological Society and The Physiological Society.
2014 | Vol. 2 | Iss. 11 | e12208Page 5
X. Wu et al. Diabetic Nephropathy in Akita Mouse Strains

values for diabetic as compared to nondiabetic mice (data
not shown).
Urinary cystatin C and nephrin levels areelevated in diabetic mice
Cystatin C is a small molecular weight protein with
potent inhibitory activity toward lysosomal proteinases
and is a marker of tubulus damage (Tan et al. 2002; Kim
et al. 2013). In humans, cystatin C levels increase with
diabetes, reflecting increased glomerular filtration rates
(GFR) during early renal function decline (Tan et al.
2002; Perkins and Krolewski 2009; Vlasakova et al. 2014).
Cystatin C was normalized with respect to urine creati-
nine levels (CCR) in mouse urines in order to evaluate
kidney damage due to hyperglycemia.
A main finding here is that CCR levels showed robust
increases due to diabetes for most of the strains, increas-
ing 10-fold for several strains (Fig. 4B). CCR levels were
strongly correlated with ACR (P = 0.0286). CCR also cor-
related significantly with plasma TG (P = 0.0043) and
urine volume (P = 0.0455). Thus, urinary CCR may serve
as a robust biomarker for kidney damage in mice as is
seen in humans.
Nephrin is a transmembrane protein on podocytes
located in conjunction with the slit diaphragm. Urinary
nephrin is a biomarker specific for podocytes as evidenced
by its appearance in urine of diabetic patients but not
healthy individuals (Patari et al. 2003). Nephrinuria is seen
in FVB/N Akita mice, appearing prior to albuminuria
onset (Chang et al. 2012). For strains studied here,
enhancement of nephrin was seen among several strains of
diabetic mice, but significance was reached for only two
strains, BUB/Bn and SJL (Fig. 4C).
Moderate kidney pathology among Akitamouse strains
A primary marker of kidney damage and dysfunction is
glomerular hypertrophy. Among the nondiabetic strains,
areas ranged from 1931 to 4163 lm2 (Fig. 5A). With dia-
betes, six strains showed no change while most of the
remaining strains showed modest increases of ~25% and
C3H/HeJ showed a 2-fold increase. Thus, there appear to
be genetic factors contributing to glomerular area in both
nondiabetic and diabetic mice. Glomerular hypertrophy
did not correlate with ACR or with kidney weight,
another trait associated with glomerular hypertrophy. In
addition, based on visual inspection of H&E stained kid-
ney sections, no major changes in gross structure of the
tubulointerstitium were seen for any of the strains.
Since changes in glomerular areas were relatively small,
we decided not to pursue formal studies of mesangial
expansion (e.g. Periodic acid-Schiff) but did assess levels of
the most abundant glomerular matrix protein, collagen IV
(Fig. 5B and C). This protein is a main constituent of base-
ment membranes of glomeruli and tubules and accumula-
tion of type IV collagen is associated with mesangial
expansion and tubulointerstitial and glomerular injury in
humans (Okonogi et al. 2001). There were two findings
from morphological analyses of glomerular collagen IV
immunostaining. First, glomerular collagen IV levels were
comparable between nondiabetic and diabetic mice within
each strain (Fig. 5B and illustrated in Fig. 5C; nondiabetic
values not shown). Second, type IV collagen immunostain-
ing varied nearly 2-fold across the strains and was signifi-
cantly correlated with ACR values (P = 0.020). Thus,
collagen IV may provide a predictive trait for albuminuria.
We also examined the tubulointerstitium architecture
for several mouse strains with high and low ACR values
(Fig. 6). Significant tubular changes were not seen. No
signs of tubular dilation, extensive tubular proliferation of
epithelial cells, or macrophage invasion were found. Thus,
diabetes under conditions rendered here did not provoke
extensive interstitial tubule pathology.
Discussion
The overall goal of this study was to use the Ins2 Akita
mutation to develop new mouse models of DN and to
Urine volume
TG
bicor1.00.5
0.0
–0.5–1.0
Kidney Wt
Insulin
Glucose
Glomerular area
Collagen IV
CCR
BUN
ACR
AC
R
BU
N
CC
R
Col
lage
n IV
Glo
mer
ular
are
a
Glu
cose
Insu
lin
Kid
ney
Wt
TG
Urin
e vo
lum
e
0.017 0.046 0.039 0.003
0.004 0.001
0.0090.006
0.009
0.020
0.029
Figure 2. Correlation of nephropathy-related phenotypes among
diabetic mice across a panel of 28 F1 mouse strains using BiWeight
Midcorrelation (Langfelder and Horvath 2012). Color indicates
positive (blue) or negative (red) correlation (Vlasakova et al. 2014).
Intensity of color indicates strength of correlation as shown on the
scale. For statistically significant correlations, P-value is given within
the color square.
2014 | Vol. 2 | Iss. 11 | e12208Page 6
ª 2014 The Authors. Physiological Reports published by Wiley Periodicals, Inc. on behalf of
the American Physiological Society and The Physiological Society.
Diabetic Nephropathy in Akita Mouse Strains X. Wu et al.

identify genetically diverse mouse strains with which to
identify genes and gene pathways controlling DN. The
Akita mutation had been introgressed into five inbred
mouse lines with DBA/2 mice showing the greatest
response in terms of albuminuria and glomerulopathy
(Brosius et al. 2009; Gurley et al. 2010; Yu et al. 2012).
Thus, we used DBA/2.Akita mice as donors in breeding
the Akita gene onto 28 inbred mouse strains, generating
F1 hybrids carrying the Akita mutation as well as euglyce-
mic littermates. We assessed parameters associated with
DN. We found that traits associated with kidney structure
and function, and plasma lipid levels, varied widely
among the strains. A primary finding was the extensive
and significant strain variation in ACR values seen with
diabetes ranging from no change to macroalbuminuria.
ACR did not correlate with glomerular hypertrophy but
did correlate significantly with urine cystatin C-to-creati-
nine levels supporting clinical reports using this protein
as an early biomarker for kidney dysfunction (Macisaac
et al. 2007; Perkins and Krolewski 2009).
In humans, albuminuria is an important indicator of
nephropathological abnormities of DN (Fioretto et al.
1992, 2008; Badal and Danesh 2014). For mouse models of
DN, an increase in albuminuria of >10-fold for diabetic as
compared with euglycemic controls is one criterion of the
National Institutes of Health sponsored AMDCC (www.
SWR
I/Ln
DBA/2
BXD55
C57BR
C3H/H
e CE A/JRIIIS
BALB/c
BXD32FVBC57
/LC58
129X
1/SvAKR
NOD
C57BLK
S
C57BL/6
BTBRCBA SMSJL
BXD75KK/H
I
AXB19/
BUB/Bn
NZB/BIN
0
200
400
600
800
1000 Non-DiabeticDiabetic
Glu
cose
(mg/
dL)
NZB/BINAKR
BTBRDBA/2
C57/LC58SJL
C57BRSWRSM
NOD/ShiL
t
C57BLK
S
BUB/Bn
BXD75/R
ww
129X
1/Sv
AXB19/P
gnJ
C57BL/6FVB CE
KK/HI
BALB/c
C3H/H
eJRIIIS I/L
CBA
BXD55/R
wwA/J
BXD32/Ty
0
2000
4000
6000
8000
10,000Non-DiabeticDiabetic
Insu
lin (p
g/m
L)
CE
C57BRBTBR
I/LnSW
RDBA/2
C57BL/6C58
C57/LFVB
C57BLK
SNOD
RIIIS
BALB/c A/J
AXB19
C3H/H
e
BXD55
BXD32 SMBXD75
129X
1/SvCBA
NZB/BINKK/H
ISJL
BUB/BnAKR
0
100
200
300
400
500Non-DiabeticDiabetic
TG (m
g/dL
)
A
B
C
** * *
**
*
*
Figure 3. Plasma glucose, insulin, and triglyceride (TG) levels for diabetic and nondiabetic F1 males from a cross between DBA Akita males and
a panel of females from various inbred strains. For each graph, the maternal strain is indicated on the horizontal axis and strains are in rank
order based on the strain-average level observed in diabetic mice. (A) Impact of genetic background on plasma glucose levels (mg/dL) is
relatively modest among mice of the 28 strains carrying the Akita mutation. There is less than a 2-fold difference across all strains. (B) As
expected, plasma insulin levels (pg/mL) are markedly suppressed in all diabetic F1 males compared to nondiabetic F1 males derived from the
same maternal strain. Moreover, insulin levels in diabetic mice were unrelated to levels seen in nondiabetic controls for the same strain. (C)
Impact of genetic background on plasma TG levels (mg/dL). *P < 0.05 (n = 3–17 mice/group). To facilitate comparisons among strains, these
data are presented in alphabetical strain order in Figure 7-3A, 3B and 3C at the end of the manuscript.
ª 2014 The Authors. Physiological Reports published by Wiley Periodicals, Inc. on behalf ofthe American Physiological Society and The Physiological Society.
2014 | Vol. 2 | Iss. 11 | e12208Page 7
X. Wu et al. Diabetic Nephropathy in Akita Mouse Strains

mmpc.org) (Brosius et al. 2009). Among the 28 strains
studied here, most showed 2- to 4-fold increases in ACR
with diabetes. These findings agree with other background
strains commonly used to study murine DN (Breyer et al.
2008; Gurley et al. 2010). However, three strains surpassed
this criterion (12- to 16-fold) (NZB/BIN, SM, BXD32/Ty)
and two strains showed robust relative increases in ACRs
of 50-fold (NOD/ShiLt) and 83-fold (CBA). Another
strain, KK/Hl studied by others for DN traits (Shike et al.
2005; Aoki et al. 2012) approached the AMDCC cut-off
(8-fold). Thus, this survey has identified new murine
models in which to study structural features causative for
elevated ACR levels. Moreover, genetic crosses between
high and low ACR responders can be used to map key
genes and gene pathways causative for changes in kidney
function that are related to DN.
Information as to the molecular mediators of early kid-
ney disease leading to onset of clinical albuminuria is not
known. One recent report suggests that podocyte loss due
to ROS-induced apoptosis may be such a mechanism
(Susztak et al. 2006). Interestingly, podocyte apoptosis
was initiated by the onset of hyperglycemia in humans
and mice (Steffes et al. 2001). In the mouse, podocyte
loss remained stable following an initial loss of podocytes
with onset of HG suggesting that this mechanism alone is
not sufficient to provoke severe pathology in this species.
Although robust changes in albuminuria were seen for
some of the strains, none exhibited severe kidney pathol-
ogy. The largest increase in glomerular area due to diabe-
tes, a trait used to access glomerular hypertrophy, was
exhibited by C3H/He for which a 2-fold increase in glo-
merular expansion was seen. However, changes in ACR
SWR
AKRC58
RIIIS A/J
C57BR
I/Ln
BXD55BTBR
C57BL/6
BXD32
C57BLK
SDBA/2
FVBSJL
129X
1/Sv
BUB/Bn CE
BALB/c
BXD75
AXB19
C3H/H
eC57
/LKK/H
I0.0
0.1
0.2
0.3
0.4
0.5Non-DiabeticDiabetic
Non-DiabeticDiabetic
Non-DiabeticDiabetic
Left
kidn
ey W
t (g)
C57BR
FVBBTBR A/J
C58C57
/L
BXD55 I/LnSWR CE
AKR
C57BLK
S
AXB19
C57BL/6RIIIS
BXD32
BALB/c
DBA/2
129X
1/SvKK/H
I
C3H/H
eJ
BUB/Bn
BXD75
NZB/BINSJL SMNOD
CBA0
10
20
30
40
50
Cys
tatin
C/C
reat
inin
e
BTBRI/L
n CERIIISSW
R
C57BL/6FVB
BXD75
BALB/cC58
C57/L A/J
C3H/H
e
129X
1/Sv
C57BR
C57BLK
SDBA/2
AKR
AXB19
BUB/Bn
BXD55 SMSJLKK/H
I
NZB/BINNOD
CBA
BXD320
100
200
300
400
500
Nep
hrin
/Cre
atin
ine
A
B
C
*
* * * * **
*
* *
* * * *
*
Figure 4. Impact of genetic background on (A) Left kidney weight (g) among nondiabetic and diabetic mice. *P < 0.05 (n = 3–17 mice/group).
(B) Urine cystatin C to creatinine ratio (CCR; Cystatin C (lg/mL)/Creatinine (lg/mL)) and (C) urine nephrin to creatinine ratio among mice
carrying the Akita mutation. *P < 0.05 for (n = 3–4 mice/group). For each graph, the maternal strain is indicated on the horizontal axis and
strains are in rank order based on the average level observed in diabetic mice. To facilitate comparisons among strains, these data are
presented in alphabetical strain order in Figure 7-4A, 4B, and 4C at the end of the manuscript.
2014 | Vol. 2 | Iss. 11 | e12208Page 8
ª 2014 The Authors. Physiological Reports published by Wiley Periodicals, Inc. on behalf of
the American Physiological Society and The Physiological Society.
Diabetic Nephropathy in Akita Mouse Strains X. Wu et al.

for this strain were small (Fig. 1). In fact, no correlation
was seen between ACR and glomerular hypertrophy
across the 28 strains suggesting that mechanisms other
than mesangial expansion contributed to albuminuria.
Although not quantified among these strains, substruc-
tural features of renal damage including glomerular base-
ment membrane expansion and/or loss of podocytes
could have contributed to extensive albuminuria in some
cases. In addition, there was no evidence of tubular injury
based on light microscope histopathological analysis of
kidneys.
Features of mild kidney pathologies were noted among
the mouse strains. For instance, collagen IV accumulation
varied 2-fold among Akita strains and correlated signifi-
cantly and positively with ACR levels. Nephropathological
abnormalities of DN in humans include accumulation
of collagen IV, the most abundant extracellular matrix
component in the glomerulus (Zent et al. 2006). For
mice, excessive fibrillar collagen deposition is seen partic-
ularly in mice deficient in integrin a1, a collagen IV
receptor and negative regulator of glomerulosclerosis (Yu
et al. 2012) supporting a role for this matrix protein in
promoting renal damage. Of note, collagen IV levels did
not correlate with glomerular area suggesting that colla-
gen IV was unlikely to be responsible for glomerular
hypertrophy as seen among these strains.
Another feature seen for T1D individuals with risk for
DN are enlarged kidneys (Bogdanovic 2008). We also
observed significant increases in kidney weight relative to
body weight among some, but not all, mouse strains.
These results, coupled with the variable outcomes seen
for ACR, collagen IV deposition and urine CCR among
the strains support reports of the “pathological diversity”
of DN within human populations (Valk et al. 2011).
I/Ln
NZB/BINCBA
NOD SMC58
SWR
C57BR
BXD55 A/J
129X
1/SvC57
/L
C57BLK
SBTBR
BUB/BnRIIISFVB CE
C3H/H
e
BXD32SJL
BALB/c
DBA/2
C57BL/6
AXB19KK/H
IAKR
BXD750
1000
2000
3000
4000
5000
Non-DiabeticDiabetic
Glo
mer
ular
are
a (µ
m2 )
FVB
BXD75SJLRIIIS
BXD55KK/H
I
C57BLK
S
129X
1/Sv
BALB/c CE
AXB19
C57BL/6
BUB/BnAKR
BXD32DBA/2
NODBTBR A/J
C3H/H
e
C57BR SM
C57/L
C58 I/LnCBA
SWR
NZB/BIN
0
10
20
30
Col
lage
n IV
(%)
A
B
C CBA FVB FVB (no primary)
*
* **
***
Diabetic
Figure 5. Impact of genetic background on diabetic kidney pathology as measured by (A) Glomerular area (lm2) and (B) Percent glomerular
area staining for collagen IV. Genetic background variation is determined by the maternal strain, indicated on the horizontal axis. Strains are in
rank order based on the average level observed in diabetic mice. (C) Example of collagen IV immunostaining for two mouse strains, CBA and
FVB, with one control shown lacking treatment with primary antibody. To facilitate comparisons among strains, these data are presented in
alphabetical strain order in Figure 7-5A, and 5B at the end of the manuscript.
ª 2014 The Authors. Physiological Reports published by Wiley Periodicals, Inc. on behalf ofthe American Physiological Society and The Physiological Society.
2014 | Vol. 2 | Iss. 11 | e12208Page 9
X. Wu et al. Diabetic Nephropathy in Akita Mouse Strains

Cystatin C is a small “housekeeping” protein
(13,250 Daltons) synthesized by all nucleated cells. Cysta-
tin C is reabsorbed the tubulus cells and rapidly degraded.
But with tubulus dysfunction, reabsorption is impaired
and cystatin C is eliminated with urine. Thus, cystatin C
has been used as a function of tubulus dysfunction and
hyperfiltration (Tan et al. 2002; Kim et al. 2013). Among
the 28 mouse strains, CCR levels varied 3-fold among
Akita mice and levels correlated significantly and posi-
tively with ACR. These data are in agreement with human
studies and suggest early changes in hyperfiltration occur
in many of these mouse strains. The mouse strains identi-
fied here may provide important tools for examination of
early modifications of interstitial tubule structure and
function with diabetes.
Given the genetic diversity available among inbred
mouse strains, we were somewhat surprised in the mild
pathology observed in this study, although lack of severe
pathology has been noted for several mouse strains previ-
ously (Breyer et al. 2008). It is now known that mice are
able to develop advanced features of human diabetic
nephropathy under conditions for which hyperglycemia is
induced on top of genetically modified gene deficiencies.
For instance, several groups have demonstrated that loss
of eNOS (Nos3) results in robust albuminuria and glom-
erulosclerosis as well as reduced GFR although the extent
of changes are background strain dependent (eNOS defi-
cient; Breyer et al. 2008; Zhao et al. 2006). Other cases
have been reviewed (Breyer et al. 2008; Brosius et al.
2009). Of note are mice lacking brandykinin studied on
the C57BL/6 background (Kakoki et al. 2010), OVE26
mice on the FVB background (Xu et al. 2010) and inte-
grin a1 deficient mice on the BALB/c background (Yu
et al. 2012). With introgression of the Akita mutation, all
these strains exhibit features of more advanced DN
including hypertension, albuminuria, mesangial matrix
expansion, and podocyte loss. Thus, our study identifies
additional genetic backgrounds that may provide further
insight to DN following the incorporation of these gene
deficiencies.
More extensive kidney pathology has been seen for
type 2 mouse models. Kidney pathology is much worse
for eNOS deficient mice when crossed into diabetic and
obese leptin deficient strains than wild-type strains
(Zhao et al. 2006; Alpers and Hudkins 2011). An argu-
ment can be made that altering plasma lipid levels con-
tributes to worsening DN. For instance, BALB/c mice
made diabetic following STZ treatment show an
enhancement of glomerulosclerosis when also deficient
for the LDL receptor, presumably due to the extensive
hyperlipidemia (Wen et al. 2002). Also, proteomic analy-
sis of plasma samples taken from a cohort of type 1 dia-
betic patients versus matched euglycemic individuals
showed that levels of apolipoprotein A1 and C1 as well
as 16 other proteins were associated with extent of albu-
minuria (Nielsen et al. 2010). Finally, among our 28 dia-
betic strains, levels of plasma triglyceride were
significantly and positively correlated with urine volumes
A
D
B
C
FVB AXB19
**
*
*
Figure 6. Genetic background does not result in marked changes to tubulointerstitium. Representative tubulointerstitial areas stained with
markers for macrophages (F4/80) (A,B) and cellular proliferation (Ki67) (C,D) for FVB and AxB19 mouse strains. Overall tubulointerstitial
architecture shows lack of dilation and associated proliferation of tubular epithelial cells. FVB mice show only occasional positivity for
macrophages. Although immunostaining for macrophages is somewhat more frequent for AXB19, across six strains examined (AXB19, A/J,
KK/HI, C57BL/6, C3H/He, FVB), there was no correlation between the numbers of macrophages and ACR values (data not shown). Thus,
macrophage number is unlikely to contribute to diabetic pathology among these mice.
2014 | Vol. 2 | Iss. 11 | e12208Page 10
ª 2014 The Authors. Physiological Reports published by Wiley Periodicals, Inc. on behalf of
the American Physiological Society and The Physiological Society.
Diabetic Nephropathy in Akita Mouse Strains X. Wu et al.

129X
1/SvA/J
AKRAXB19
BALB/cBTBR
BUB/Bn
BXD32
BXD55
BXD75
C3H/H
eC57
/L
C57BL/6
C57BLK
S
C57BR
C58CBA CEDBA/2
FVBI/L
nKK/H
INOD
NZB/BINRIIISSJL SM
SWR0
500
1000
1500 Non-DiabeticDiabetic
ACR
(µg/
mg)
129X
1/SvA/J
AKRAXB19
BALB/cBTBR
BUB/Bn
BXD32
BXD55
BXD75
C3H/H
eC57
/L
C57BL/6
C57BLK
S
C57BR
C58CBA CEDBA/2
FVBI/L
nKK/H
INOD
NZB/BINRIIISSJL SM
0
10
20
30 Non-DiabeticDiabetic
Urin
e vo
lum
e (m
L)
129X
1/SvA/J
AKRAXB19
BALB/cBTBR
BUB/Bn
BXD32
BXD55
BXD75
C3H/H
eC57
/L
C57BL/6
C57BLK
S
C57BR
C58CBA CEDBA/2
FVBI/L
nKK/H
INOD
NZB/BINRIIISSJL SM
SWR0
10
20
30
40
50 Non-DiabeticDiabetic
BU
N (m
g/dL
)1A
1B
1C
129X
1/SvA/J
AKR
AXB19/
BALB/cBTBR
BUB/Bn
BXD32
BXD55
BXD75
C3H/H
eC57
/L
C57BL/6
C57BLK
S
C57BR
C58CBA CEDBA/2
FVBI/L
nKK/H
INOD
NZB/BINRIIISSJL SM
SWR
0
200
400
600
800
1000 Non-DiabeticDiabetic
Glu
cose
(mg/
dL)
129X
1/SvA/J
AKR
AXB19/P
gnJ
BALB/cBTBR
BUB/Bn
BXD32/Ty
BXD55/R
ww
BXD75/R
ww
C3H/H
eJC57
/L
C57BL/6
C57BLK
S
C57BR
C58CBA CEDBA/2
FVB I/LKK/H
I
NOD/ShiL
t
NZB/BINRIIISSJL SM
SWR
0
2000
4000
6000
8000
10,000 Non-DiabeticDiabetic
Insu
lin (p
g/m
L)
129X
1/SvA/J
AKRAXB19
BALB/cBTBR
BUB/Bn
BXD32
BXD55
BXD75
C3H/H
eC57
/L
C57BL/6
C57BLK
S
C57BR
C58CBA CEDBA/2
FVBI/L
nKK/H
INOD
NZB/BINRIIISSJL SM
SWR
0
100
200
300
400
500 Non-DiabeticDiabetic
TG (m
g/dL
)
3A
3B
3C
129X
1/Sv A/J
AKR
AXB19
BALB/cBTBR
BUB/Bn
BXD32
BXD55
BXD75
C3H/H
eC57
/L
C57BL/6
C57BLK
S
C57BR
C58 CEDBA/2
FVBI/L
nKK/H
IRIIIS SJL
SWR0.0
0.1
0.2
0.3
0.4
0.5 Non-DiabeticDiabetic
Left
kidn
ey W
t (g)
129X
1/SvA/J
AKRAXB19
BALB/cBTBR
BUB/Bn
BXD32
BXD55
BXD75
C3H/H
eJC57
/L
C57BL/6
C57BLK
S
C57BR
C58CBA CEDBA/2
FVBI/L
nKK/H
INOD
NZB/BINRIIISSJLSM
SWR
0
10
20
30
40
50 Non-DiabeticDiabetic
Cys
tatin
C/C
reat
inin
e
129X
1/SvA/J
AKRAXB19
BALB/cBTBR
BUB/Bn
BXD32
BXD55
BXD75
C3H/H
eC57
/L
C57BL/6
C57BLK
S
C57BR
C58CBA CEDBA/2
FVBI/L
nKK/H
INOD
NZB/BINRIIISSJLSM
SWR
0
200
400
600 Non-DiabeticDiabetic
Nep
hrin
/Cre
atin
ine
4A
4B
4C
129X
1/SvA/J
AKRAXB19
BALB/cBTBR
BUB/Bn
BXD32
BXD55
BXD75
C3H/H
eC57
/L
C57BL/6
C57BLK
S
C57BR
C58CBA CEDBA/2
FVBI/L
nKK/H
INOD
NZB/BINRIIISSJL SM
SWR0
1000
2000
3000
4000
5000Non-DiabeticDiabetic
Glo
mer
ular
are
a (µ
m2 )
129X
1/SvA/J
AKRAXB19
BALB/cBTBR
BUB/Bn
BXD32
BXD55
BXD75
C3H/H
eC57
/L
C57BL/6
C57BLK
S
C57BR
C58CBA CEDBA/2
FVBI/L
nKK/H
INOD
NZB/BINRIIISSJL SM
SWR0
10
20
30
40 Non-DiabeticDiabetic
Col
lage
n IV
(%)
5A
5B
Figure 7. Albuminuria (1A), polyuria (1B), blood urea nitrogen (1C), plasma glucose (3A), plasma insulin (3B), plasma triglycerides (3C), left
kidney weight (4A), urine cystatin-C to creatinine ratio (CCR) (4B), urine nephrin to creatinine ratio (4C), glomerular area (5A), and percent
glomerular area staining for collagen IV (5B) for diabetic and nondiabetic control mice across a panel of 28 F1 mouse strains. Panel labels show
correspondence with panels in Figures 1, 3–5. For each phenotype, strains are shown in alphabetical order by strain in order to facilitate trait-
trait comparisons across strains. Gray bars show control mice and black bars show diabetic mice. Error bars indicate SEM.
ª 2014 The Authors. Physiological Reports published by Wiley Periodicals, Inc. on behalf ofthe American Physiological Society and The Physiological Society.
2014 | Vol. 2 | Iss. 11 | e12208Page 11
X. Wu et al. Diabetic Nephropathy in Akita Mouse Strains

and CCR levels. Further work to alter plasma lipid levels
among these 28 Akita mouse strains may be worthwhile
to test the hypothesis that high fat feeding would
enhance DN among these strains.
In summary, this study contributes significantly to
broadening our knowledge concerning genetic variations
among mouse strains for clinical traits relevant to DN.
In particular, we identified multiple strains with robust
increases in ACR. Elevated ACR levels are associated
with a marked increase in risk of progression to overt
proteinuria and eventual ESRD (Caramori et al. 2000;
Drummond and Mauer 2002; Mauer and Drummond
2002). However, the course of renal dysfunction and
pathological change differ markedly among individuals
(Mauer and Drummond 2002; Skupien et al. 2014).
Thus, it may be useful to transfer genes potentially caus-
ative for DN onto mouse strains exhibiting robust
changes in ACR for a better presentation of DN compa-
rable to humans.
Acknowledgments
We would like to thank Calvin Pan (Division of Cardiol-
ogy, Department of Medicine, David Geffen School of
Medicine, UCLA) for performing correlations studies sup-
porting Figure 2.
Conflict of Interest
None declared.
References
2003. USRDS: the United States Renal Data System. Am.
J. Kidney Dis. 42:1–230.
Alpers, C. E., and K. L. Hudkins. 2011. Mouse models of
diabetic nephropathy. Curr. Opin. Nephrol. Hypertens.
20:278–284.
Aoki, T., S. Kaneko, M. Tanimoto, T. Gohda, S. Hagiwara,
M. Murakoshi, et al. 2012. Identification of quantitative
trait loci for diabetic nephropathy in KK-Ay/Ta mice. J.
Nephrol. 25:127–136.
Arora, M. K., and U. K. Singh. 2013. Molecular mechanisms
in the pathogenesis of diabetic nephropathy: an update.
Vascul. Pharmacol. 58:259–271.
Badal, S. S., and F. R. Danesh. 2014. New insights into
molecular mechanisms of diabetic kidney disease. Am.
J. Kidney Dis. 63:S63–S83.
Bennett, B. J., C. R. Farber, L. Orozco, H. M. Kang,
A. Ghazalpour, N. Siemers, et al. 2010. A high-resolution
association mapping panel for the dissection of complex
traits in mice. Genome Res. 20:281–290.
Bennett, B. J., L. Orozco, E. Kostem, A. Erbilgin, M. Dallinga,
I. Neuhaus, et al. 2012. High-resolution association
mapping of atherosclerosis loci in mice. Arterioscler.
Thromb. Vasc. Biol. 32:1790–1798.
Bogdanovic, R. 2008. Diabetic nephropathy in children and
adolescents. Pediatr. Nephrol. 23:507–525.
Brennan, E., C. McEvoy, D. Sadlier, C. Godson, and F. Martin.
2013. The genetics of diabetic nephropathy. Genes (Basel)
4:596–619.
Breyer, M. D., Z. Qi, E. E. Tchekneva, and R. C. Harris. 2008.
Insight into the genetics of diabetic nephropathy through the
study of mice. Curr. Opin. Nephrol. Hypertens. 17:82–86.
Brosius, F. C. 3rd, C. E. Alpers, E. P. Bottinger, M. D. Breyer,
T. M. Coffman, S. B. Gurley, et al. 2009. Mouse models of
diabetic nephropathy. J. Am. Soc. Nephrol. 20:2503–2512.
Caramori, M. L., P. Fioretto, and M. Mauer. 2000. The need
for early predictors of diabetic nephropathy risk: is albumin
excretion rate sufficient? Diabetes 49:1399–1408.
Chang, J. H., and S. B. Gurley. 2012. Assessment of diabetic
nephropathy in the Akita mouse. Methods Mol. Biol.
933:17–29.
Chang, J. H., S. Y. Paik, L. Mao, W. Eisner, P. J. Flannery,
L. Wang, et al. 2012. Diabetic kidney disease in FVB/NJ
Akita mice: temporal pattern of kidney injury and urinary
nephrin excretion. PLoS ONE 7:e33942.
Drummond, K., M. Mauer, and International Diabetic
Nephropathy Study G. 2002. The early natural history of
nephropathy in type 1 diabetes: II. Early renal structural
changes in type 1 diabetes. Diabetes 51:1580–1587.
Fagerholm, E., E. Ahlqvist, C. Forsblom, N. Sandholm,
A. Syreeni, M. Parkkonen, et al. 2012. SNP in the
genome-wide association study hotspot on chromosome
9p21 confers susceptibility to diabetic nephropathy in type 1
diabetes. Diabetologia 55:2386–2393.
Fioretto, P., M. W. Steffes, D. M. Brown, and S. M. Mauer.
1992. An overview of renal pathology in insulin-dependent
diabetes mellitus in relationship to altered glomerular
hemodynamics. Am. J. Kidney Dis. 20:549–558.
Fioretto, P., M. L. Caramori, and M. Mauer. 2008. The kidney
in diabetes: dynamic pathways of injury and repair. The
Camillo Golgi Lecture 2007. Diabetologia 51:1347–1355.
Ghazalpour, A., C. D. Rau, C. R. Farber, B. J. Bennett,
L. D. Orozco, A. van Nas, et al. 2012. Hybrid mouse
diversity panel: a panel of inbred mouse strains suitable for
analysis of complex genetic traits. Mamm. Genome 23:680–
692.
Gurley, S. B., C. L. Mach, J. Stegbauer, J. Yang, K. P. Snow,
A. Hu, et al. 2010. Influence of genetic background on
albuminuria and kidney injury in Ins2(+/C96Y) (Akita)mice. Am. J. Physiol. Renal. Physiol. 298:F788–F795.
Hedrick, C. C., L. W. Castellani, C. H. Warden, D. L.
Puppione, and A. J. Lusis. 1993. Influence of mouse
apolipoprotein A-II on plasma lipoproteins in transgenic
mice. J. Biol. Chem. 268:20676–20682.
Himmelfarb, J., and K. R. Tuttle. 2013. New therapies for
diabetic kidney disease. N. Engl. J. Med. 369:2549–2550.
2014 | Vol. 2 | Iss. 11 | e12208Page 12
ª 2014 The Authors. Physiological Reports published by Wiley Periodicals, Inc. on behalf of
the American Physiological Society and The Physiological Society.
Diabetic Nephropathy in Akita Mouse Strains X. Wu et al.

Kakoki, M., K. A. Sullivan, C. Backus, J. M. Hayes, S. S. Oh,
K. Hua, et al. 2010. Lack of both bradykinin B1 and B2
receptors enhances nephropathy, neuropathy, and bone
mineral loss in Akita diabetic mice. Proc. Natl Acad. Sci.
USA 107:10190–10195.
Kim, S. S., S. H. Song, I. J. Kim, Y. K. Jeon, B. H. Kim,
I. S. Kwak, et al. 2013. Urinary cystatin C and tubular
proteinuria predict progression of diabetic nephropathy.
Diabetes Care 36:656–661.
King, G. L. 2008. The role of inflammatory cytokines in
diabetes and its complications. J. Periodontol. 79:1527–1534.
Langfelder, P., and S. Horvath. 2012. Fast R functions for
robust correlations and hierarchical clustering. J. Stat. Softw.
46:i11.
Long, D. A., M. Kolatsi-Joannou, K. L. Price, C.
Dessapt-Baradez, J. L. Huang, E. Papakrivopoulou, et al.
2013. Albuminuria is associated with too few glomeruli and
too much testosterone. Kidney Int. 83:1118–1129.
Macisaac, R. J., C. Tsalamandris, M. C. Thomas, E.
Premaratne, S. Panagiotopoulos, T. J. Smith, et al. 2007.
The accuracy of cystatin C and commonly used
creatinine-based methods for detecting moderate and
mild chronic kidney disease in diabetes. Diabet. Med.
24:443–448.
Mauer, M., and K. Drummond. 2002. The early natural
history of nephropathy in type 1 diabetes: I. Study design
and baseline characteristics of the study participants.
Diabetes 51:1572–1579.
Mauer, M., B. Zinman, R. Gardiner, S. Suissa, A. Sinaiko,
T. Strand, et al. 2009. Renal and retinal effects of enalapril
and losartan in type 1 diabetes. N. Engl. J. Med. 361:40–51.
Mehrabian, M., J. H. Qiao, R. Hyman, D. Ruddle, C.
Laughton, and A. J. Lusis. 1993. Influence of the apoA-II
gene locus on HDL levels and fatty streak development in
mice. Arterioscler. Thromb. 13:1–10.
Mogensen, C. E., and M. J. Andersen. 1973. Increased kidney
size and glomerular filtration rate in early juvenile diabetes.
Diabetes 22:706–712.
Nielsen, S. E., K. J. Schjoedt, A. S. Astrup, L. Tarnow, M.
Lajer, P. R. Hansen, et al. 2010. Neutrophil
Gelatinase-Associated Lipocalin (NGAL) and Kidney Injury
Molecule 1 (KIM1) in patients with diabetic nephropathy: a
cross-sectional study and the effects of lisinopril. Diabet.
Med. 27:1144–1150.
Okonogi, H., M. Nishimura, Y. Utsunomiya, K. Hamaguchi,
H. Tsuchida, Y. Miura, et al. 2001. Urinary type IV collagen
excretion reflects renal morphological alterations and type
IV collagen expression in patients with type 2 diabetes
mellitus. Clin. Nephrol. 55:357–364.
Pagtalunan, M. E., P. L. Miller, S. Jumping-Eagle,
R. G. Nelson, B. D. Myers, H. G. Rennke, et al. 1997.
Podocyte loss and progressive glomerular injury in type II
diabetes. J. Clin. Invest. 99:342–348.
Patari, A., C. Forsblom, M. Havana, H. Taipale, P. H. Groop,
and H. Holthofer. 2003. Nephrinuria in diabetic
nephropathy of type 1 diabetes. Diabetes 52:
2969–2974.
Perkins, B. A., and A. S. Krolewski. 2009. Early nephropathy in
type 1 diabetes: the importance of early renal function
decline. Curr. Opin. Nephrol. Hypertens. 18:233–240.
Pezzolesi, M. G., G. D. Poznik, J. C. Mychaleckyj, A. D.
Paterson, M. T. Barati, J. B. Klein, et al. 2009. Genome-wide
association scan for diabetic nephropathy susceptibility
genes in type 1 diabetes. Diabetes 58:1403–1410.
Puppione, D. L., and S. Charugundla. 1994. A
microprecipitation technique suitable for measuring
alpha-lipoprotein cholesterol. Lipids 29:595–597.
Ron, D. 2002. Proteotoxicity in the endoplasmic reticulum:
lessons from the Akita diabetic mouse. J. Clin. Invest.
109:443–445.
Rossing, P., K. Rossing, P. Jacobsen, and H. H. Parving. 1995.
Unchanged incidence of diabetic nephropathy in IDDM
patients. Diabetes 44:739–743.
Sandholm, N., R. M. Salem, A. J. McKnight, E. P. Brennan,
C. Forsblom, T. Isakova, et al. 2012. New susceptibility loci
associated with kidney disease in type 1 diabetes. PLoS
Genet. 8:e1002921.
Sarnak, M. J., A. S. Levey, A. C. Schoolwerth, J. Coresh, B.
Culleton, L. L. Hamm, et al. 2003. Kidney disease as a risk
factor for development of cardiovascular disease: a
statement from the American Heart Association Councils on
Kidney in Cardiovascular Disease, High Blood Pressure
Research, Clinical Cardiology, and Epidemiology and
Prevention. Circulation 108:2154–2169.
Schmid, H., A. Boucherot, Y. Yasuda, A. Henger, B. Brunner,
F. Eichinger, et al. 2006. Modular activation of nuclear
factor-kappaB transcriptional programs in human diabetic
nephropathy. Diabetes 55:2993–3003.
Shike, T., T. Gohda, M. Tanimoto, M. Kobayashi, Y. Makita,
K. Funabiki, et al. 2005. Chromosomal mapping of a
quantitative trait locus for the development of albuminuria in
diabetic KK/Ta mice. Nephrol. Dial. Transplant. 20:879–885.
Skupien, J., J. H. Warram, M. A. Niewczas, T. Gohda,
M. Malecki, J. C. Mychaleckyj, et al. 2014. Synergism
between circulating tumor necrosis factor receptor 2 and
HbA1c in determining renal decline during 5–18 years of
follow-up in patients with type 1 diabetes and proteinuria.
Diabetes Care 37:2601–2608.
Steffes, M. W., D. Schmidt, R. McCrery, J. M. Basgen, and
International Diabetic Nephropathy Study G. 2001.
Glomerular cell number in normal subjects and in type 1
diabetic patients. Kidney Int. 59:2104–2113.
Susztak, K., A. C. Raff, M. Schiffer, and E. P. Bottinger. 2006.
Glucose-induced reactive oxygen species cause apoptosis of
podocytes and podocyte depletion at the onset of diabetic
nephropathy. Diabetes 55:225–233.
ª 2014 The Authors. Physiological Reports published by Wiley Periodicals, Inc. on behalf ofthe American Physiological Society and The Physiological Society.
2014 | Vol. 2 | Iss. 11 | e12208Page 13
X. Wu et al. Diabetic Nephropathy in Akita Mouse Strains

Tan, G. D., A. V. Lewis, T. J. James, P. Altmann, R. P. Taylor,
and J. C. Levy. 2002. Clinical usefulness of cystatin C for the
estimation of glomerular filtration rate in type 1 diabetes:
reproducibility and accuracy compared with standard
measures and iohexol clearance. Diabetes Care 25:2004–2009.
Valk, E. J., J. A. Bruijn, and I. M. Bajema. 2011. Diabetic
nephropathy in humans: pathologic diversity. Curr. Opin.
Nephrol. Hypertens. 20:285–289.
Vlasakova, K., Z. Erdos, S. P. Troth, K. McNulty, V.
Chapeau-Campredon, N. Mokrzycki, et al. 2014. Evaluation
of the relative performance of 12 urinary biomarkers for
renal safety across 22 rat sensitivity and specificity studies.
Toxicol. Sci. 138:3–20.
Wen, M., S. Segerer, M. Dantas, P. A. Brown, K. L. Hudkins,
T. Goodpaster, et al. 2002. Renal injury in apolipoprotein
E-deficient mice. Lab. Invest. 82:999–1006.
Wiseman, M. J., A. J. Saunders, H. Keen, and G. Viberti. 1985.
Effect of blood glucose control on increased glomerular
filtration rate and kidney size in insulin-dependent diabetes.
N. Engl. J. Med. 312:617–621.
Xu, J., Y. Huang, F. Li, S. Zheng, and P. N. Epstein. 2010.
FVB mouse genotype confers susceptibility to OVE26
diabetic albuminuria. Am. J. Physiol. Renal. Physiol. 299:
F487–F494.
Yu, L., Y. Su, P. Paueksakon, H. Cheng, X. Chen, H. Wang,
et al. 2012. Integrin alpha1/Akita double-knockout mice on
a Balb/c background develop advanced features of human
diabetic nephropathy. Kidney Int. 81:1086–1097.
Zent, R., X. Yan, Y. Su, B. G. Hudson, D. B. Borza,
G. W. Moeckel, et al. 2006. Glomerular injury is exacerbated
in diabetic integrin alpha1-null mice. Kidney Int. 70:460–
470.
Zhao, H. J., S. Wang, H. Cheng, M. Z. Zhang, T. Takahashi,
A. B. Fogo, et al. 2006. Endothelial nitric oxide synthase
deficiency produces accelerated nephropathy in diabetic
mice. J. Am. Soc. Nephrol. 17:2664–2669.
2014 | Vol. 2 | Iss. 11 | e12208Page 14
ª 2014 The Authors. Physiological Reports published by Wiley Periodicals, Inc. on behalf of
the American Physiological Society and The Physiological Society.
Diabetic Nephropathy in Akita Mouse Strains X. Wu et al.
Copyright © 2022 FDOKUMEN