Genetic diversity, spatial genetic structure and realised seed and pollen dispersal of Himatanthus...
11
RESEARCH ARTICLE Genetic diversity, spatial genetic structure and realised seed and pollen dispersal of Himatanthus drasticus (Apocynaceae) in the Brazilian savanna Cristina Baldauf • Maı ´sa Ciampi-Guillardi • Thaı ´sa Jacinto Aguirra • Christiane Erondina Corre ˆa • Flavio Antonio Mae ¨s dos Santos • Anete Pereira de Souza • Alexandre Magno Sebbenn Received: 25 January 2013 / Accepted: 24 March 2014 Ó Springer Science+Business Media Dordrecht 2014 Abstract We assessed the pollen and seed dispersal patterns, genetic diversity, inbreeding and spatial genetic structure of Himatanthus drasticus (Apocynaceae), a tree native to the Brazilian Savanna (Cerrado) that is heavily exploited for its medicinal latex. The study was conducted in the Araripe National Forest, Ceara ´ State, Brazil. Within a one-hectare plot, samples were collected from all adult trees, adult trees located in the immediate vicinity of the plot, and seedlings. All sampled individuals were mapped and genotyped using microsatellite markers. High levels of polymorphism and significant levels of inbreeding were found, which indicates that self-fertilisation and mating among relatives occur in this population. Both the adults and seedlings had significant spatial genetic structure up to *40 m and our results confirmed the occurrence of iso- lation by distance. Pollen and seeds were dispersed over short distances and immigration of pollen and seeds into the plot was estimated at 13 and 9 %, respectively. Taking into consideration the degree of inbreeding, relatedness, intrapopulation spatial genetic structure and pollen dis- persal distance, we recommend collecting seeds from a large number of trees spaced at least 150 m apart to avoid collecting seeds from related individuals and an overlap of pollen pools among seed trees. Keywords Sustainable management Non-timber forest products SGS Gene flow Janaguba Introduction Gene flow is considered a fundamental factor in the evo- lutionary biology of plants that affects the dynamics of populations, communities and ecosystems (Connell and Slatyer 1977; Hardy et al. 2006). More specifically, factors such as the type of pollination, diversity of the breeding systems, seasonality of pollination at the community level, and longevity of flowers may influence gene flow patterns in tropical tree populations (Bawa 1990). Anthropogenic pressure can also alter gene flow patterns in plant populations. Deforestation, urbanisation, intensive agriculture and fragmentation can affect pollination and seed dispersal (Bennett et al. 2006; Jump and Pen ˜uelas 2006; Lander et al. 2010; Rosas et al. 2011). Forest logging can also affect gene flow and spatial genetic structure (SGS) in a population (Kanashiro et al. 2002) by reducing the density of reproductive trees in a population (Lacerda C. Baldauf F. A. M. dos Santos A. P. de Souza Department of Plant Biology, State University of Campinas (UNICAMP), CP 6109, Campinas, SP CEP 13083-970, Brazil C. Baldauf M. Ciampi-Guillardi T. J. Aguirra A. P. de Souza Genetic Engineering and Molecular Biology Centre, State University of Campinas (UNICAMP), CP 6010, Campinas, SP CEP 13083-875, Brazil C. Baldauf (&) Department of Animal Sciences, Federal Rural University of Semiarid Region (UFERSA), Avenida Francisco Mota, 572 – Costa e Silva, Mossoro ´, RN CEP 59625-900, Brazil e-mail: [email protected] M. Ciampi-Guillardi Department of Plant Pathology, University of Sa ˜o Paulo (ESALQ-USP), Piracicaba, SP CEP 13418-900, Brazil C. E. Corre ˆa Institute of Biology, Federal University of Minas Gerais, Belo Horizonte, MG CEP 31270-901, Brazil A. M. Sebbenn Sa ˜o Paulo Forestry Institute, CP 1322, Sa ˜o Paulo, SP CEP 01059-970, Brazil 123 Conserv Genet DOI 10.1007/s10592-014-0600-5
Transcript of Genetic diversity, spatial genetic structure and realised seed and pollen dispersal of Himatanthus...
RESEARCH ARTICLE
Genetic diversity, spatial genetic structure and realised seedand pollen dispersal of Himatanthus drasticus (Apocynaceae)in the Brazilian savanna
Cristina Baldauf • Maısa Ciampi-Guillardi • Thaısa Jacinto Aguirra •
Christiane Erondina Correa • Flavio Antonio Maes dos Santos •
Anete Pereira de Souza • Alexandre Magno Sebbenn
Received: 25 January 2013 / Accepted: 24 March 2014
� Springer Science+Business Media Dordrecht 2014
Abstract We assessed the pollen and seed dispersal
patterns, genetic diversity, inbreeding and spatial genetic
structure of Himatanthus drasticus (Apocynaceae), a tree
native to the Brazilian Savanna (Cerrado) that is heavily
exploited for its medicinal latex. The study was conducted
in the Araripe National Forest, Ceara State, Brazil. Within
a one-hectare plot, samples were collected from all adult
trees, adult trees located in the immediate vicinity of the
plot, and seedlings. All sampled individuals were mapped
and genotyped using microsatellite markers. High levels of
polymorphism and significant levels of inbreeding were
found, which indicates that self-fertilisation and mating
among relatives occur in this population. Both the adults
and seedlings had significant spatial genetic structure up to
*40 m and our results confirmed the occurrence of iso-
lation by distance. Pollen and seeds were dispersed over
short distances and immigration of pollen and seeds into
the plot was estimated at 13 and 9 %, respectively. Taking
into consideration the degree of inbreeding, relatedness,
intrapopulation spatial genetic structure and pollen dis-
persal distance, we recommend collecting seeds from a
large number of trees spaced at least 150 m apart to avoid
collecting seeds from related individuals and an overlap of
pollen pools among seed trees.
Keywords Sustainable management � Non-timber forest
products � SGS � Gene flow � Janaguba
Introduction
Gene flow is considered a fundamental factor in the evo-
lutionary biology of plants that affects the dynamics of
populations, communities and ecosystems (Connell and
Slatyer 1977; Hardy et al. 2006). More specifically, factors
such as the type of pollination, diversity of the breeding
systems, seasonality of pollination at the community level,
and longevity of flowers may influence gene flow patterns
in tropical tree populations (Bawa 1990).
Anthropogenic pressure can also alter gene flow patterns
in plant populations. Deforestation, urbanisation, intensive
agriculture and fragmentation can affect pollination and
seed dispersal (Bennett et al. 2006; Jump and Penuelas
2006; Lander et al. 2010; Rosas et al. 2011). Forest logging
can also affect gene flow and spatial genetic structure
(SGS) in a population (Kanashiro et al. 2002) by reducing
the density of reproductive trees in a population (Lacerda
C. Baldauf � F. A. M. dos Santos � A. P. de Souza
Department of Plant Biology, State University of Campinas
(UNICAMP), CP 6109, Campinas, SP CEP 13083-970, Brazil
C. Baldauf � M. Ciampi-Guillardi � T. J. Aguirra �A. P. de Souza
Genetic Engineering and Molecular Biology Centre, State
University of Campinas (UNICAMP), CP 6010, Campinas,
SP CEP 13083-875, Brazil
C. Baldauf (&)
Department of Animal Sciences, Federal Rural University
of Semiarid Region (UFERSA), Avenida Francisco Mota,
572 – Costa e Silva, Mossoro, RN CEP 59625-900, Brazil
e-mail: [email protected]
M. Ciampi-Guillardi
Department of Plant Pathology, University of Sao Paulo
(ESALQ-USP), Piracicaba, SP CEP 13418-900, Brazil
C. E. Correa
Institute of Biology, Federal University of Minas Gerais,
Belo Horizonte, MG CEP 31270-901, Brazil
A. M. Sebbenn
Sao Paulo Forestry Institute, CP 1322, Sao Paulo,
SP CEP 01059-970, Brazil
123
Conserv Genet
DOI 10.1007/s10592-014-0600-5

et al. 2008). In cases where non-timber forest products
(NTFP) are exploited, the overharvesting of plant struc-
tures, such as bark and exudates, can negatively impact
gene flow by reducing quantity and viability of seeds
(Rijkers et al. 2006; Stewart 2009), which could have a
negative impact on gene flow.
Restricted gene flow frequently results in intrapopula-
tion SGS, which is defined as the non-random spatial dis-
tribution of genotypes (Vekemans and Hardy 2004). The
results obtained from fine-scale SGS and contemporary
gene flow studies are being used to reveal patterns of gene
flow and support strategies for the in situ and ex situ
conservation of timber and non-timber forest products
(Rathmacher et al. 2010; Manoel et al. 2011; Gaino et al.
2010; Sant’Anna et al. 2013).
In the Brazilian savanna (Cerrado), the exploitation of
marketable medicinal plants has caused a decline in the
natural populations of several species (Felfili and Silva-
Junior 1988; Zardo and Henriques 2011). In this context,
studies on the gene flow of species that have been over-
harvested can be very helpful in order to guide future
management and genetic conservation planning. Hima-
tanthus drasticus (Apocynaceae), commonly known as
janaguba, is one of the most heavily harvested tree species
in the Cerrado biome. The medicinal importance of the
tree’s latex in cancer treatments has been recently recog-
nised in pharmacological studies (Mousinho et al. 2011;
Reboucas et al. 2011). This attention has caused an
increase in trade, which could have negative impacts on
natural populations of the species.
The aim of this study was to assess the genetic diversity,
SGS, and pollen and seed dispersal patterns of H. drasticus
populations so that strategies for its sustainable manage-
ment could be developed. We addressed the following
three questions: (i) Are there differences in the levels of
genetic diversity and inbreeding between adults and seed-
lings? (ii) Is there SGS among adults and seedlings? (iii) Is
there seed and pollen immigration into the sampled plot?
Materials and methods
The species H. drasticus (Mart.) Plumel
Himathantus drasticus (Apocynaceae) is a tree species
found in the Brazilian savanna that has a mean height
below 7 m and dense foliage on the terminal ends of
branches. The leaves are obovate, shiny and glabrous and
the plant has terminal inflorescences with sympodial
growth. The insect-pollinated flowers are small, white and
fragrant and they are arranged in a thyrsoid inflorescence,
typical of the Apocynaceae family (Liede and Weberling
1995). The fruit are horn-shaped follicles measuring
15–20 cm in length and 2.5 cm wide that contain many
concentric winged-seeds dispersed by wind. The bark is
rough and exudes a white latex when removed (Plumel
1991; Lorenzi and de Abreu Matos 2002).
Study area and experimental design
The study area is located on a plateau situated in the Cariri
region, Ceara State (Chapada do Araripe), northeastern
Brazil. The study was conducted in the Araripe National
Forest (078110S, 398130W, altitude of 938 m), a protected
area of Chapada do Araripe, which is considered the only
preserved Cerrado area in Ceara State (Oliveira and Mar-
quis 2002). The area is covered by the ‘‘cerrado sensu
stricto’’, defined as ‘‘a vegetation dominated by 3–8 m-tall
trees and shrubs with more than 30 % crown cover but with
still a fair amount of herbaceous vegetation between them’’
(Oliveira and Marquis 2002, p 8). The soil is a red-yellow
dystrophic latosol (Cavalcanti and Lopes 1994) and the
climate is tropical wet and dry, or savanna (Aw) according
to the Koppen classification system (Koppen 1948). Most
of the rainfall in this area occurs between November and
May.
In the study area, all populations of H. drasticus are
exploited; therefore, we selected one natural population
that has been subjected to low levels of harvesting (less
than 20 % of adult trees were debarked) to assess the
genetic diversity, inbreeding, SGS and seed and pollen
dispersal patterns of the species. In order to have a sample
that is consistent with the demographic and spatial patterns
of H. drasticus, we considered Milfont’s (2011) study on
the population and spatial structure of the species across 12
areas. Based on this study, we selected a population that
represents the most common distribution pattern of the
species. In the selected population, we established a 1 ha
(200 9 50 m2) rectangular plot divided into 100 subplots
of 10 9 10 m2 (Fig. 1). Despite the fact that the 1 ha plot
is a sample of a much larger population, the density of
adult plants and seedlings in the chosen area is suitable for
the purpose of this study (183 adult plant individuals and
*10,325 seedlings) (Milfont 2011). Samples were col-
lected from all of the adult trees within the plot (183
individuals) and from several trees in the area immediately
surrounding the plot (26 individuals) that could be releas-
ing seeds into the plot. The limit of the sampling around the
plot was arbitrarily defined based on the assumption that
the trees located closest to the plot (within *10 meters) are
most likely to be dispersing their seeds into the plot. The
definition of ‘‘adult trees’’ was based on the presence of
reproductive structures obtained from demographic and
phenological surveys conducted in the area (Baldauf et al.
unpublished data). The diameter at breast height (dbh)
of the sampled adults ranged from 6.2 to 24.5 cm
Conserv Genet
123

(mean ± SD: 10.69 ± 2.65 cm, median of 10.5 cm). It
was impossible to process all seedlings owing to their high
density within the study area. Hence, we created sub-
samples using 2 9 2 m2 plots located within each
10 9 10 m2 subplot. Seedling samples were taken from
throughout the 1-hectare plot; however, due to the uneven
distribution of the species (Milfont 2011), some of the
2 9 2 m2 subplots have no seedlings while in others
several seedlings were sampled. Additionally, we also
sampled all seedlings within a 10 9 10 m subplot (bottom
left corner, Fig. 1) aiming to detect SGS at a reduced
spatial scale. The total number of sampled seedlings was
149 individuals. All 358 sampled plants were mapped with
a laser distance meter and the coordinates for each indi-
vidual were obtained using MAPA software (Santos 2001).
DNA extraction and microsatellite genotyping
We collected two leaves per individual that were stored at -
808 C until DNA extraction. For each sample, the DNA
was isolated from *25 ng of fresh leaves ground with
liquid nitrogen using the DNeasy kit (Qiagen, Valencia,
California, USA). DNA quantification was accomplished
by comparing samples with a standard DNA (DNA k) of
known concentration in a 0.8 % agarose gel stained with
ethidium bromide. Samples were then diluted to obtain a
solution of 5.0 ng/mL. The microsatellite markers used in
this study were previously developed by Baldauf et al.
(2011) and included the following markers: HD1, HD3,
HD7, HD9, HD11, HD18, HD19 and HD21. Two loci
(HD1 and HD7), however, had a high frequency of null
alleles and were therefore excluded from SGS and par-
entage analysis. All loci used contain dinucleotide repeat
motifs except for HD18, which is a trinucleotide. Micro-
satellite loci were amplified by PCR in a 15 lL total vol-
ume containing 5.0 ng of template DNA, 0.8 mM each of
forward and reverse primers, 20 mM Tris–HCl (pH 8.4),
50 mM KCl, 1.5 mM MgCl, and 0.15 mM of each dNTP
and 1 U of Taq DNA polymerase. PCR was performed
using a PTC-100 thermal cycler (MJ Research, Waltham,
Massachusetts, USA) with the following sequence: 96� C
for 1 min, followed by 30 cycles of denaturation at 94� C
for 1 min, 1 min at a specific annealing temperature (Ta),
1 min at 72� C and a final extension of 72� C for 5 min.
Amplified PCR products were verified by electrophoresis
on 3 % agarose gels containing 0.1 mg ethidium bromide
per mL in 19 TBE buffer (89 mM Tris–borate, 2 mM
EDTA, pH 8.0). Fluorescent amplicons were genotyped on
6 % denaturing polyacrylamide gels in an ABI 377 auto-
mated sequencer (Applied Biosystems, Foster City, CA,
USA) using the GS500 TAMRA marker as the standard
size (Applied Biosystems). Fragment size and allele iden-
tification were determined using Genescan v. 3.1.2 and
Genotyper v. 2.5.2 software (Applied Biosystems).
Analysis of genetic diversity and fixation index
The genotypic disequilibrium test was carried out for adults
and seedlings using the FSTAT program (Goudet 1995).
In order to avoid false positives, we used a Bonferroni
correction for 95 % probability (a = 0.05). The genetic
Fig. 1 Map of Himatanthus drasticus adults and seedlings in the plot
Conserv Genet
123
diversity of adults, seedlings and the total sample
(adults ? seedlings) was estimated by the number of
alleles (A), observed heterozygosity (Ho) and expected
heterozygosity at Hardy–Weinberg equilibrium (He) for
each locus and for the average across all loci. Because the
sample size for the adults and seedlings was different, we
also calculated the allelic richness (R) using a rarefaction
method (El Mousadik and Petit 1996). The levels of
inbreeding for the adult and seedling populations were
estimated using the fixation index (F). In seedlings, the
intra-individual fixation index was calculated using refer-
ence allele frequencies from the adult trees with the
SPAGEDI 1.3 program (Hardy and Vekemans 2002). The
significance of the F values was calculated using the per-
mutations of the alleles among individuals (1,000 repeti-
tions) and a sequential Bonferroni correction for multiple
comparisons (95 %, a = 0.05). Except for the intra-indi-
vidual fixation indexes in seedlings, all other analyses were
also run using the FSTAT program, version 2.9.3.2 (Goudet
1995). To investigate if the average values of A, R, Ho, He
and F were significantly different between the adult trees
and seedlings, a paired t test (Sokal and Rohlf 1995) was
used.
Analysis of the intrapopulation SGS
The SGS was determined using an estimation of the
average coancestry coefficient (hxy) between pairs of adult
trees, pairs of seedlings and pairs from the total sample
(adults ? seedlings). These analyses were conducted using
the SPAGEDI 1.3 program (Hardy and Vekemans 2002). For
the analysis of the seedlings, we used the reference allele
frequencies calculated for the adult cohort (Sebbenn et al.
2011). To visualise the SGS, hxy values were averaged over
a set of ten 10 m distance classes (0–10, 10–20, 20–30,
30–40, 40–50, 50–60, 60–70, 70–80, 80–90 and 90–100 m)
and then plotted against the distances. The number of pairs
of individuals averaged within these distance classes ran-
ged from 858 to 1,972 for adult trees and from 432 to 1,320
for seedlings. To test whether there was significant devia-
tion from a random structure, the 95 % CI was calculated
for each observed value and each distance class from 1,000
permutations of individuals within the distance class. To
compare the SGS between the adults and seedlings, the
statistic Sp (Vekemans and Hardy 2004) was calculated as
Sp = -bk/(1 - h1), where h1 is the average coancestry
coefficient calculated between all pairwise individuals
within the first distance class (0–10 m), and bk is the slope
of the regression of coancestry coefficient on the logarithm
of spatial distance (0–100 m). To test for SGS, the spatial
position of each individual was permutated (1,000 times) to
obtain the frequency distribution of bk under the null
hypothesis that h1 and ln (dxy) are not correlated.
Analysis of the historical gene dispersal from SGS
The historical gene dispersal for the adults, seedlings and
the total sample (adults ? seedlings) was estimated from
the SGS with the assumption that the observed SGS was in
isolation-by-distance equilibrium (Hardy et al. 2006). The
historical gene dispersal in terms of neighbourhood size
(Nb) was estimated as Nb = -(1 - h1)/bk (Vekemans and
Hardy 2004), where bk is the regression slope within the
distance class of rg \ dij \ 20rg. The lower and upper
boundaries for the 95 % confidence interval (CI) of Nb
were estimated as Nb(lower) = (h1 - 1)/(bk - 2SEb) and
Nb(upper) = (h1 - 1)/(bk ? 2SEb), where SEb is the stan-
dard error of bk calculated by jackknifing data over each
loci (Hardy et al. 2006). The 95 % CI of rg was estimated
as rg ¼ffiffiffiffiffiffiffiffiffiffiffiffiffiffiffiffiffiffi
Nb=4pDe
p
using the lower and upper Nb
boundaries (Hardy et al. 2006). When bk \ SEb, the upper
boundary was reported as infinite, ? (Hardy et al. 2006).
Parentage analysis
The combined non-exclusion probability of the parent pair
and combined non-exclusion probability of genetic identity
were calculated using the CERVUS 3.0 program (Marshall
et al. 1998; Kalinowski et al. 2007). Parentage analysis was
conducted by maximum-likelihood maternity and paternity
assignment (Meagher 1986) based on the multilocus
genotypes of the 149 seedlings and all 209 adult trees from
within and outside the plot. The most likely parents and
parent pairs were determined by the D statistic (Marshall
et al. 1998) using the reference allele frequencies calcu-
lated for the adult population (Meagher and Thompson
1987). For this analysis, we considered all 209 adult trees
to be parent candidates when assigning the mother and
father of the seedling. Significance for D was determined
using maternity and paternity tests simulated by the soft-
ware (critical D), which used a confidence level of 80 %,
genotyping error ratio of 0.01, mean proportion of typed
individuals of 0.93, and 10,000 repetitions. The calculation
of critical D values was based on the assumption that 80 %
of the candidates sampled were located within the plot. If a
mother or father candidate or parent pair had a D value
higher than the critical D value calculated by simulations, it
was considered to be the true parent or true parent pair. If
the same individual was found to be both the maternal and
paternal parent, the seedling was considered selfed. Thus,
the estimate of the realised selfing rate (s) was calculated as
the number of selfed seedlings (nselfed) divided by the total
number of seedlings: s = nselfed/ntotal_seeds. If a single
parent was identified, it was assumed to be the maternal
parent. If two parents were identified inside the plot, we
used two approaches to determine parentage: (a) the
Conserv Genet
123

near-neighbour parent was assumed to be the seed parent;
and (b) the more distant parent was assumed to be the seed
parent. The cryptic gene flow, or the probability of
assigning a candidate mother or father inside the popula-
tion when the true father is outside of the population, was
calculated as described in Dow and Ashley (1996).
The seed and pollen immigration rate (m) was calculated as
the proportion of seedlings that had either no parents
(nimmigrant (seed)) or only one parent (nimmigrant (pollen)) inside
the population area relative to the total number of sampled
seedlings m = nimmigrant/ntotal (Burczyk et al. 1996). As all
sampled individuals had a known spatial position, the
realised seed dispersal distance was calculated based on the
position of the seedlings relative to their likely mothers and
the distance of pollen dispersal was based on the position
of the putative mothers in relation to fathers.
Results
Genetic diversity and fixation index
After Bonferroni correction, the results showed signifi-
cant evidence of genotypic disequilibrium between pair-
wise loci HD3 9 HD9 and HD11 9 HD18 in the adults
and HD9 9 HD11, HD9 9 HD18, and HD19 9 HD21
in both adults and seedlings (Table 1). This genotypic
disequilibrium can be the result of self-pollination, cor-
related mating, mating among relatives, genetic bottle-
neck effect, founder effect, and genetic linkage between
pairs of loci. However, in order to ensure that the high
levels of inbreeding observed were not a consequence of
genotypic disequilibrium, we recalculated the genetic
diversity and fixation indexes excluding the locus HD9
(Table 2), but no significant change was observed in the
mentioned parameters. Also, no differences in the genetic
indexes were observed between adults and seedlings
(Table 2).
Table 1 Results of the genotypic linkage disequilibrium for samples
of adults and seedlings (Bonferroni correction for multiple tests:
a = 0.05 = 0.001667)
Pairwise loci Adults Seedlings
HD3 9 HD9 0.00167 0.00500
HD3 9 HD11 0.16333 0.10667
HD3 9 HD18 0.00500 0.03833
HD3 9 HD19 0.16667 0.01333
HD3 9 HD21 0.21833 0.42500
HD9 9 HD11 0.00167 0.00167
HD9 9 HD18 0.00167 0.00167
HD9 9 HD19 0.12500 0.24000
HD9 9 HD21 0.75667 0.12500
HD11 9 HD18 0.00167 0.01333
HD11 9 HD19 0.15000 0.00667
HD11 9 HD21 0.78667 0.25167
HD18 9 HD19 0.01833 0.30833
HD18 9 HD21 0.02833 0.67500
HD19 9 HD21 0.00167 0.00167
Table 2 Genetic diversity and fixation indexes of adult trees and seedlings in a population of Himatanthus drasticus
Locus Adults (N = 209) Seedlings (N = 149)
A R136 Ho He F PPair Pidentity A R136 Ho He F1
HD3 15 14.6 0.634 0.882 0.281* 0.089 0.026 12 12.0 0.683 0.858 0.245*
HD9 7 7 0.426 0.661 0.356* 0.346 0.147 8 7.9 0.514 0.552 0.392*
HD11 26 24.1 0.554 0.876 0.368* 0.095 0.029 16 16.0 0.662 0.870 0.213*
HD18 12 11.8 0.537 0.676 0.205* 0.368 0.154 10 10.0 0.570 0.526 0.341*
HD19 10 9.2 0.287 0.491 0.416* 0.513 0.284 12 12.0 0.338 0.524 -0.026
HD21 14 13.7 0.487 0.790 0.384* 0.208 0.073 17 16.9 0.471 0.779 0.095
Mean 1 14.0 13.4 0.487 0.729 0.332* – – 12.5 12.5 0.540 0.685 0.222*
SD 1 6.54 5.96 0.120 0.150 0.078 – – 3.45 3.47 0.128 0.168 0.179
Mean 2 15.4 14.5 0.500 0.743 0.327* – – 13.4 13.3 0.545 0.711 0.234*
SD 2 6.22 5.67 0.130 0.164 0.086 – – 2.97 2.95 0.143 0.173 0.187
Total 84 – – – – 0.00012 3.5-7 75 – – – –
A is the number of alleles, R136 is the allelic richness, Ho is the observed heterozygosity, He is the expected heterozygosity, F is the fixation index,
PPair is the combined non-excluding probability of the parent pair, and Pidentity is the combined non-excluding probability of identity. SD is the
standard deviation. * P \ 0.05. 1: Intra-individual fixation index calculated with reference allele frequencies from the adult trees using the
SPAGEDI program. Using paired t test, the mean values of all parameters are not significant different between adults and seedlings (A: P = 0.633;
df = 10; R136: P = 0.749, df = 10; Ho: P = 0.484, df = 10; He: P = 0.639, df = 10; F: P = 0.113, df = 10). Mean 1 and SD 1 were
calculated using all loci, while Mean 2 and SD 2 were calculated excluding locus HD9
Conserv Genet
123
Intrapopulation SGS
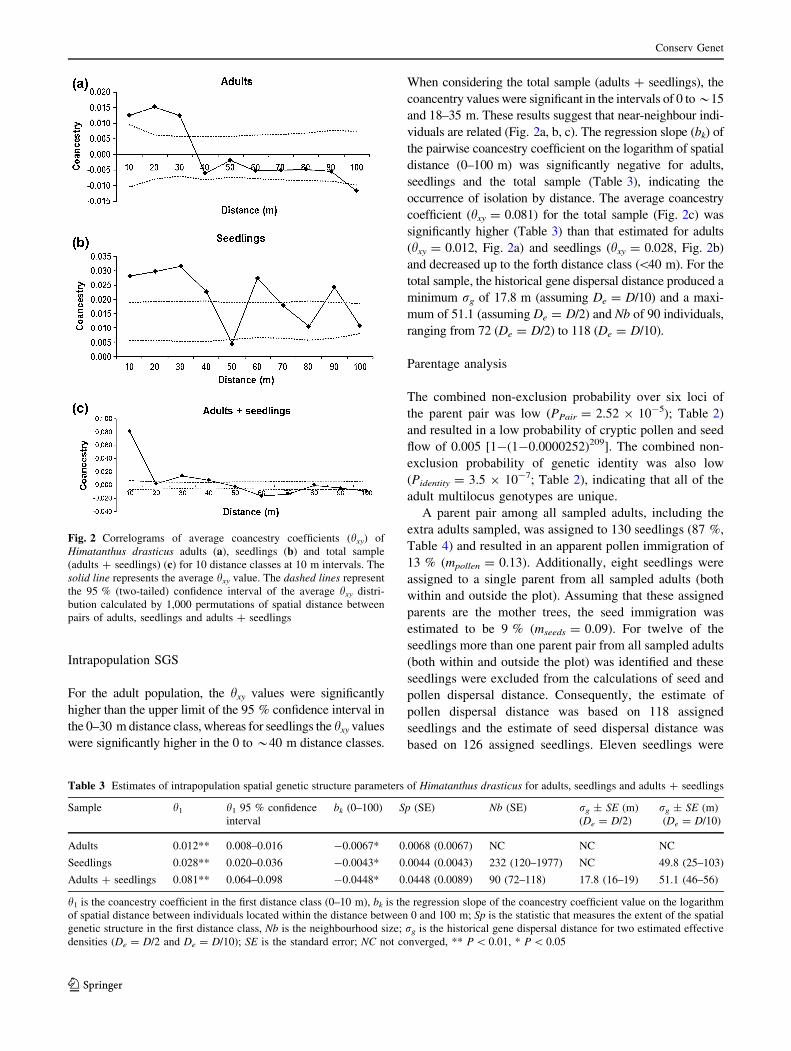
For the adult population, the hxy values were significantly
higher than the upper limit of the 95 % confidence interval in
the 0–30 m distance class, whereas for seedlings the hxy values
were significantly higher in the 0 to *40 m distance classes.
When considering the total sample (adults ? seedlings), the
coancentry values were significant in the intervals of 0 to*15
and 18–35 m. These results suggest that near-neighbour indi-
viduals are related (Fig. 2a, b, c). The regression slope (bk) of
the pairwise coancestry coefficient on the logarithm of spatial
distance (0–100 m) was significantly negative for adults,
seedlings and the total sample (Table 3), indicating the
occurrence of isolation by distance. The average coancestry
coefficient (hxy = 0.081) for the total sample (Fig. 2c) was
significantly higher (Table 3) than that estimated for adults
(hxy = 0.012, Fig. 2a) and seedlings (hxy = 0.028, Fig. 2b)
and decreased up to the forth distance class (\40 m). For the
total sample, the historical gene dispersal distance produced a
minimum rg of 17.8 m (assuming De = D/10) and a maxi-
mum of 51.1 (assuming De = D/2) and Nb of 90 individuals,
ranging from 72 (De = D/2) to 118 (De = D/10).
Parentage analysis
The combined non-exclusion probability over six loci of
the parent pair was low (PPair = 2.52 9 10-5); Table 2)
and resulted in a low probability of cryptic pollen and seed
flow of 0.005 [1-(1-0.0000252)209]. The combined non-
exclusion probability of genetic identity was also low
(Pidentity = 3.5 9 10-7; Table 2), indicating that all of the
adult multilocus genotypes are unique.
A parent pair among all sampled adults, including the
extra adults sampled, was assigned to 130 seedlings (87 %,
Table 4) and resulted in an apparent pollen immigration of
13 % (mpollen = 0.13). Additionally, eight seedlings were
assigned to a single parent from all sampled adults (both
within and outside the plot). Assuming that these assigned
parents are the mother trees, the seed immigration was
estimated to be 9 % (mseeds = 0.09). For twelve of the
seedlings more than one parent pair from all sampled adults
(both within and outside the plot) was identified and these
seedlings were excluded from the calculations of seed and
pollen dispersal distance. Consequently, the estimate of
pollen dispersal distance was based on 118 assigned
seedlings and the estimate of seed dispersal distance was
based on 126 assigned seedlings. Eleven seedlings were
Fig. 2 Correlograms of average coancestry coefficients (hxy) of
Himatanthus drasticus adults (a), seedlings (b) and total sample
(adults ? seedlings) (c) for 10 distance classes at 10 m intervals. The
solid line represents the average hxy value. The dashed lines represent
the 95 % (two-tailed) confidence interval of the average hxy distri-
bution calculated by 1,000 permutations of spatial distance between
pairs of adults, seedlings and adults ? seedlings
Table 3 Estimates of intrapopulation spatial genetic structure parameters of Himatanthus drasticus for adults, seedlings and adults ? seedlings
Sample h1 h1 95 % confidence
interval
bk (0–100) Sp (SE) Nb (SE) rg ± SE (m)
(De = D/2)
rg ± SE (m)
(De = D/10)
Adults 0.012** 0.008–0.016 -0.0067* 0.0068 (0.0067) NC NC NC
Seedlings 0.028** 0.020–0.036 -0.0043* 0.0044 (0.0043) 232 (120–1977) NC 49.8 (25–103)
Adults ? seedlings 0.081** 0.064–0.098 -0.0448* 0.0448 (0.0089) 90 (72–118) 17.8 (16–19) 51.1 (46–56)
h1 is the coancestry coefficient in the first distance class (0–10 m), bk is the regression slope of the coancestry coefficient value on the logarithm
of spatial distance between individuals located within the distance between 0 and 100 m; Sp is the statistic that measures the extent of the spatial
genetic structure in the first distance class, Nb is the neighbourhood size; rg is the historical gene dispersal distance for two estimated effective
densities (De = D/2 and De = D/10); SE is the standard error; NC not converged, ** P \ 0.01, * P \ 0.05
Conserv Genet
123

mothered and fathered by the same individual, suggesting a
realised selfing rate of 11 %.
The pollen dispersal distance ranged from 2.1 to 194 m,
with a mean of 65 m and median of 49 m (Table 4, Fig. 3a),
and*81 % of the pollen travelled less than 100 m (Fig. 3a).
The distance between the parents explains 81 % of the
assigned matings (R2 = 0.81, df = 18, p \ 0.01) and sug-
gests that isolation occurs as a result of distance.
When the near-neighbour parent was assumed to be the
seed parent (case a), our estimates for the minimum seed
dispersal distance within the plot ranged from 2.1 to
188 m, with a mean of 63 m and median of 53 m (Table 4;
Fig. 3b). In this case, *81 % of the seedlings were found
within 100 m of the seed tree (Fig. 3b). A significant
association was found between the number of seedlings
within a distance class (R2 = 0.53, df = 19, p \ 0.01) and
the distance between the mother tree and seedling, which
suggests short-distance seed dispersal. When the more
distant parent was assumed to be the seed parent (case b),
our estimates for the maximum seed dispersal distance
within the plot ranged from 16 to 202 m, with a mean of
86 m and median of 82 m (Table 4; Fig. 3b). In this case,
*48 % of the seedlings were dispersed within 100 m of
the seed tree (Fig. 3b). A non-significant association was
found between the number of seedlings within a distance
class (R2 = 0.07, df = 19, p [ 0.05) and the distance
between the mother tree and seedling.
Discussion
Genetic diversity and inbreeding
The estimated genetic diversity indexes averaged across all
loci were comparable to the values reported for other
Cerrado tree species studied using SSR markers. We found
a mean of 13.9 alleles per locus in H. drasticus while for
Eugenia dysenterica, Zucchi et al. (2003) reported an
average of 10.4 alleles per locus, with a range from three to
22 alleles. Similar values of alleles per locus were also
observed for Caryocar brasiliense (Collevatti et al. 2001)
and Hymenaea stigonocarpa (Moraes and Sebbenn 2010).
The highest reported average is for Copaifera langsdorffii
with a genetic diversity index of 16 alleles per locus
(Tarazi et al. 2013). Among the reported values for heter-
ozygosity in Cerrado species, the lowest value was found
for Dipterix alata (Ho = 0.342) and the highest value was
found for Copaifera langsdorffii (Ho = 0.720) (Tarazi
et al. 2013). Again, the results obtained for H. drasticus
(Ho = 0.447) were within the range typical of Cerrado
species.
Despite the high level of polymorphism found for
H. drasticus, a significant amount of inbreeding exists in
both adult and seedling groups. This may indicate that
either self-fertilisation and/or mating among relatives have
occurred, or that substantial inbreeding is a consequence of
a decrease in heterozigosity owing to subpopulation
structuring (Wahlund effect) which are themselves a
Table 4 Realised pollen and seed dispersal in a Himatanthus drasticus population
Sample Dispersal (absolute number) Dispersal distance without selfing (m)
N Within Outside s (%) Neffective Mean Median Min/max
Pollen 149 87 % (130) 13 % (19) 0.07 (11) 118 65 ± 41 49 2.1/194
Seeds—case a 149 91 % (138) 9 % (11) – 126 63 ± 46 53 2.1/188
Seeds—case b 149 91 % (138) 9 % (11) – 126 86 ± 53 82 16/202
Min/max is the minimum and maximum dispersal distance, respectively. N is the sample size, and s is the selfing rate, Neffective is the effective
sample size used for the analysis. Case a the near-neighbour parent was considered the seed parent; Case b the more distant parent was
considered the seed parent
Fig. 3 Frequency distributions of (a) realised pollen dispersal
distances (black bars) and (b) seed dispersal distances
Conserv Genet
123
representative mixture of various cohorts. Therefore, the
higher fixation index might be a reflection of cohort mix-
ing, rather than an actual increased level of inbreeding.
Spatial genetic structure
The two sampled groups (adults and seedlings) displayed
significant SGS, which confirms the isolation by distance
pattern commonly reported for tree species (see Vekemans
and Hardy 2004, for a review). The correlograms for each
group presented variations in SGS patterns. The average
coancestry coefficient for the adult trees dramatically
decreased up to the third distance class (\30 m, Fig. 2a)
and the decline in SGS was non-significant in all other
distance classes. The seedlings had a significant SGS up to
40 m (Fig. 2b), followed by two successive decreases and
increases in the coancestry coefficient until the final dis-
tance class ([100 m). The average coancestry coefficient
(hxy = 0.081) for the total sample (adults ? seedlings,
Fig. 2c) was significantly higher (Table 4) than that
estimated for adults (hxy = 0.012, Fig. 2a) and seedlings
(hxy = 0.028, Fig. 2b). It also decreased dramatically up to
the forth distance class (\40 m), indicating that there are
many related individuals among near neighbours.
The more intensive SGS and the higher coancestry
coefficient estimated in the first distance classes for the
total sample (adults ? seedlings) reflect the large number
of near neighbour individuals that are pairwise sibs. In the
case of seedlings, the coancestry coefficient estimated in
the first distance classes probably reflects the large number
of pairwise sibs; however, this value is expected to
decrease as the plants develop due to deterministic factors,
such as natural selection, and stochastic factors, such as
random mortality, predation, disease, and pest attacks
(Augspurger and Kelly 1984; Hutchings 1997; Fonseca
et al. 2004).
The plant breeding system and life-history have been
recognised as factors that significantly influence patterns of
SGS (Vekemans and Hardy 2004). In the Brazilian Cer-
rado, however, there is evidence that the seed dispersal
syndrome is a decisive factor in determining the degree of
SGS and it is even more influential than pollination or the
breeding system (Collevatti et al. 2010). Collevatti et al.
(2010) compared the SGS patterns for three Cerrado spe-
cies and observed that species with wind-dispersed seeds
had weaker SGS, with coancestry values close to zero for
all of the analysed distance classes. Since H. drasticus also
presents anemochoric seeds (Amaro et al. 2006), our results
of low but significant SGS found for H. drasticus support
the observations described by Collevatti et al. (2010).
Finally, the density of H. drasticus in the study area was
very high. In the sampled plot, the adult density is 183
individuals/ha and the seedling density was estimated to be
10,325 individuals/ha (Baldauf et al., unpublished data).
According to Vekemans and Hardy (2004), the Sp statistic
is expected to be lower in high-density populations and our
results support this assumption. Thus, density is likely a
major determining factor in the SGS patterns of H. dras-
ticus populations.
Realized pollen dispersal
Flowers of the Apocynaceae family are pollinated by either
butterflies or moths (Schlindwein et al. 2004). The Hima-
tanthus genus has developed flowers that are adapted for
hawkmoth pollination (Schlindwein et al. 2004) but no
specific information about H. drasticus pollinators is cur-
rently available. Nevertheless, it is highly probable that this
species is pollinated by hawkmoths of the genus Isognathus
(Sphingidea), the only species whose larvae feed on the
leaves (Baldauf pers. obs.). The same specificity between
Isognathus and a sphingophylous Himatathus (H. obova-
tus) was observed by Diniz et al. (1999) in the Brazilian
Cerrado. Sphingidae are known to have the capability of
long-distance flight (Amorim et al. 2009). However, the
movement of pollinators is primarily determined by for-
aging economy (Levin and Kerster 1974). In our study, we
found a high density of reproductive H. drasticus trees in
the plot, which means that pollen vectors can visit several
flowers in a small area, thus limiting the pollen dispersal
distance. Therefore, pollinator behaviour may explain why
the most of the assigned pollen (81 %) travelled less than
100 m. Pollen vector behaviour and tree density of
H. drasticus also provide a likely explanation for the low
levels of pollen immigration (mpollen = 0.13).
Realized seed dispersal
In most cases, pollen flow is considered to be more
extensive than seed flow (Petit et al. 2005). In this study we
observed the same pattern, although the difference is
minimal (the apparent pollen immigration was 13 %, and
the seed immigration was estimated at 9 %). The values
observed for seed immigration were lower than the values
reported for other species with wind-dispersed seeds (Jones
et al. 2005; Bacles et al. 2006; Iwaizumi et al. 2009).
When we assumed the near-neighbour parent as the seed
parent (case a), we identified a significant isolation by
distance (IBD) (Wright 1943). However, when we assumed
case b (the more distant parent as the seed parent), the
pattern of IBD was not found. The two cases used in our
study represent extreme conditions. The most probable
situation in the studied population is that neighbouring
individuals are more likely to share alleles than distant
individuals but mating between distant individuals may
occur. Notably, in both of the simulated situations, the
Conserv Genet
123
maximum dispersal distance was similar, which indicates
that most of H. drasticus seeds are dispersed over short-
distances (188 m for case ‘‘a’’ and 202 m for case ‘‘b’’).
The height of the seed tree is fundamental in promoting
long-distance dispersal. Seeds released from lower bran-
ches are generally dispersed over shorter distances (Soons
et al. 2004). This situation most likely occurs in H. dras-
ticus trees because a large number of the reproductive
individuals are less than 4 m in height. Furthermore, the
Cerrado sensu stricto has more than 30 % crown cover,
which can constrain seed dispersal of shorter trees.
Implications for harvesting and conservation genetics
The importance of genetic diversity in the maintenance of
biological diversity and evolutionary processes is well
established, especially considering the predictions of
climate change (Frankel and Soule 1981; Lande 1988;
Frankham 2004; Laikre et al. 2009; Konnert et al. 2011).
Conservation strategies based on genetic analysis, how-
ever, are still limited for tropical trees (Assogbadjo et al.
2006; Laikre 2010). The species studied herein appears to
have a high level of genetic diversity, which suggests that
conservation in situ is a suitable strategy for H. drasticus
genetic conservation. We also observed, however, a mod-
erate SGS as a result of restricted pollen and seed dispersal.
Plant populations with SGS are more likely to suffer from a
loss of alleles because aggregated populations in a small
area are likely to be eliminated by human activity or
natural phenomena (Tarazi et al. 2010). In this study, we
found no difference in the number of alleles in the sampled
groups, which suggests that the current levels of gene flow
are sufficient to avoid the potential effects of genetic drift.
Therefore, short-distance pollen and seed dispersal may be
a natural aspect in the life-history of H. drasticus.
Because of the levels of inbreeding, the relatedness
among adults associated with non-random mating, the
SGS, and the short-distance pollen dispersal found in this
study, we recommend collecting seeds from a large number
of individuals to increase the genetic diversity and variance
effective size of the sampled progeny for ex situ conser-
vation and tree breeding. Furthermore, seeds should be
collected from trees spaced at least 150 m apart to avoid
collecting seeds from related individuals and also to
decrease the probability of an overlap of pollen pools. The
results presented in this paper have been integrated in other
study, which assessed the effects of harvesting on the
genetic diversity of H. drasticus populations (Baldauf et al.
2013), in order to establish a conservation plan for the
species to ensure the long-term viability of its populations.
Acknowledgments The authors thank D. Pessoa and the staff of
FLONA Araripe for their support during fieldwork. We are also
grateful to T. Eugenio and P. Zambon for technical support in the
laboratory. This work was supported by the National Counsel of
Technological and Scientific Development through a research grant
[grant number 472127/2008-0], a PhD fellowship granted to C.B. and
research productivity fellowships granted to A.M.S., A.P.S. and
F.A.M.S. and by the Sao Paulo Research Foundation through a
research grant [grant number 2008/08737-4], an undergraduate
scholarship to T.J.A. and a post-doctoral fellowship to M.B.C. We
would also like to thank A. G. Young and two anonymous reviewers
for their important suggestions in the manuscript.
References
Amaro MS, Medeiros Filho S, Guimaraes RM, Teofilo EM (2006)
Morfologia de frutos, sementes e de plantulas de janaguba
(Himatanthus drasticus (Mart.) Plumel.—Apocynaceae). Revista
Brasileira de Sementes 28:63–71
Amorim FW, DeAvila RS Jr, Camargo AJA, Vieira AL, Oliveira PE
(2009) A hawkmoth crossroads? Species richness, seasonality
and biogeographical affinities of Sphingidae in a Brazilian
Cerrado. J Biogeogr 36:662–674
Assogbadjo AE, Kyndt T, Sinsin B, Gheysen G, Van Damme P
(2006) Patterns of genetic and morphometric diversity in baobab
(Adansonia digitata) populations across different climatic zones
of Benin (West Africa). Ann Bot 97:819–830
Augspurger CK, Kelly CK (1984) Pathogen mortality of tropical tree
seedlings: experimental studies of the effects of dispersal distance,
seedling density, and light conditions. Oecologia 61:211–217
Bacles CFE, Lowe AJ, Ennos RA (2006) Effective seed dispersal
across a fragmented landscape. Science 311:628–700
Baldauf C, Ciampi MB, Vigna BBZ, Mori GM, Guedes JPP, Souza
AP, Santos FAM (2011) Characterization of microsatellite loci
in Himatanthus drasticus (Apocynaceae), a medicinal plant from
the Brazilian savanna. Am J Bot 98:e244–e246
Baldauf C, Ciampi-Guillardi M, Sebbenn AM, Santos FAM, Souza
AP (2013) Tapping latex and alleles? The impacts of bark and
latex harvesting on the genetic diversity of Himatanthus
drasticus (Apocynaceae). For Ecol Manage 310:434–441
Bawa KS (1990) Plant–pollinator interactions in tropical rain forests.
Annu Rev Ecol Syst 21:399–422
Bennett AF, Radford JQ, Haslem A (2006) Properties of land
mosaics: implications for nature conservation in agricultural
environments. Biol Conserv 133:250–264
Burczyk J, Adams WT, Shimizu JY (1996) Mating patterns and
pollen dispersal in a natural knobcone pine (Pinus attenuate
Lemmon.) stand. Heredity 77:251–260
Cavalcanti AC, Lopes OF (1994) Condicoes edafoclimaticas da
Chapada do Araripe e viabilidade de producao sustentavel de
culturas. EMBRAPA-SPI, Brasilia
Collevatti RG, Grattapaglia D, Hay JD (2001) Population genetic
structure of the endangered tropical tree species Caryocar
brasiliense, based on variability at microsatellite loci. Mol Ecol
10:349–356
Collevatti RG, Lima JS, Soares TN, Telles MPC (2010) Spatial
genetic structure and life history traits in Cerrado tree species:
inferences for conservation. Braz J Nat Conserv 8:54–59
Connell JH, Slatyer RO (1977) Mechanisms of succession in natural
communities and their role in community stability and organi-
zation. Am Nat 111:1119–1144
Diniz IR, Morais HC, Botelho AMF, Venturoli F, Cabral BC (1999)
Lepidopteran caterpillar fauna on lactiferous host plants in the
central Brazilian cerrado. Rev Bras Biol 59:627–635
Dow BD, Ashley MV (1996) Microsatellite analysis of seed dispersal
and parentage of sampling in bur oak, Quercus macrocarpa. Mol
Ecol 5:615–627
Conserv Genet
123
El Mousadik A, Petit RJ (1996) High level of genetic differentiation
for allelic richness among populations of the argan tree [Arginia
spinosa (L.) Skeels] endemic to Morroco. Theor Appl Genet
92:832–839
Felfili JM, Silva-Junior MC (1988) Distribuicao dos diametros numa
faixa de cerrado na Fazenda Agua Limpa (FAL) em Brasilia-DF.
Acta Botanica Brasilica 2:85–104
Fonseca MG, Martini AMZ, Santos FAM (2004) Spatial structure of
Aspidosperma polyneuron in two semi-deciduous forests in
southeast Brazil. J Veg Sci 15:41–48
Frankel OH, Soule ME (1981) Conservation and evolution. Cam-
bridge University Press, Cambridge
Frankham R (2004) Resolving the genetic paradox in invasive
species. Heredity 94:385–400
Gaino APSC, Silva AM, Moraes MA, Alves PF, Moraes MLT, Freitas
MLM, Sebbenn AM (2010) Understanding the effects of
isolation on seed and pollen flow, spatial genetic structure and
effective population size of the dioecious tropical tree species
Myracrodruon urundeuva. Conserv Genet 11:1631–1643
Goudet J (1995) FSTAT (version 1.2): a computer program to
calculate F-statistics. J Hered 86:485–486
Hardy OJ, Vekemans X (2002) SPAGeDi: a versatile computer
program to analyse spatial genetic structure at the individual or
population levels. Mol Ecol Notes 2(4):618–620
Hardy OJ, Maggia L, Bandou E, Breyne P, Caron J, Chevallier MH,
Doligez A, Dutech C, Kremer A, Latouche-Halle C, Troispoux
V, Veron V, Degen B (2006) Fine-scale genetic structure and
gene dispersal inferences in 10 Neotropical tree species. Mol
Ecol 15:559–571
Hutchings MJ (1997) The Structure of Plant Populations. In: Crawley
MJ (ed) Plant ecology. Blackwell, Oxford, pp 325–358
Iwaizumi MG, Takahashi M, Watanabe A, Ubukata M (2009)
Simultaneous evaluation of paternal and maternal immigrant
gene flow and the implications for the overall genetic compo-
sition of Pinus densiflora Dispersed Seeds. J Hered 101:144–153
Jones FA, Chen J, Weng GJ, Hubbell SP (2005) A genetic evaluation
of seed dispersal in the neotropical tree Jacaranda copaia
(Bignoniaceae). Am Nat 166:543–555
Jump AS, Penuelas J (2006) Genetic effects of chronic habitat
fragmentation in a wind-pollinated tree. Proc Natl Acad Sci USA
103:8096–8100
Kalinowski ST, Taper ML, Marshall TC (2007) Revising how the
computer program CERVUS accommodates genotyping
error increases success in paternity assignment. Mol Ecol
16:1099–1106
Kanashiro M, Thompson IS, Yared JAG, Loveless MD, Coventry P,
Martins-da-Silva RCV, Degen B, Amaral W (2002) Improving
conservation values of managed forests: the Dendrogene Project
in the Brazilian Amazon. Unasylva 209:25–33
Konnert M, Maurer W, Degen B, Katzel R (2011) Genetic monitoring
in forests—early warning and controlling system for ecosystemic
changes. iForest Biogeosci For 4:77–81
Koppen W (1948) Climatologia: con un estudio de los climas de la
tierra. Fondo de Cultura Economica: 479
Lacerda AEB, Kanashiro M, Sebbenn AM (2008) Effects of Reduced
Impact Logging on genetic diversity and spatial genetic structure
of a Hymenaea courbaril population in the Brazilian Amazon
Forest. For Ecol Manage 255:1034–1043
Laikre L (2010) Genetic diversity is overlooked in international
conservation policy implementation. Conserv Genet 11:349–354
Laikre L, Nilsson T, Primmer CR, Ryman N, Allendorf FW (2009)
Importance of genetics in the interpretation of favourable
conservation status. Conserv Biol 23:1378–1381
Lande R (1988) Genetics and demography in biological conservation.
Science 241:1455–1460
Lander TA, Boshier DH, Harris SA (2010) Fragmented but not
isolated: contribution of single trees, small patches and long-
distance pollen flow to genetic connectivity for Gomortega
keule, an endangered Chilean tree. Biol Conserv 143:2583–2590
Levin DA, Kerster HW (1974) Gene flow in seed plants. Evol Biol
7:r220
Liede S, Weberling F (1995) On the inflorescence structure of the
Asclepiadaceae. Plant Syst Evol 197:99–109
Lorenzi H, de Abreu Matos FJ (2002) Plantas medicinais no Brasil:
nativas e exoticas, 2nd edn. Instituto Plantarum, Nova Odessa
Manoel R, Alves P, Dourado C, Gaino A, Freitas M, Moraes M,
Sebbenn A (2011) Contemporary pollen flow, mating patternsand effective population size inferred from paternity analysis in a
small fragmented population of the Neotropical tree Copaifera
langsdorffii Desf. (Leguminosae-Caesalpinioideae). Conserv
Genet 13:613–623
Marshall TC, Slate J, Kruuk LEB, Pemberton JM (1998) Statistical
confidence for likelihood based paternity inference in natural
populations. Mol Ecol 7:639–655
Meagher TR (1986) Analysis of paternity within a natural population
of Chamaelirium luteum. I. Identification of most-likely male
parents. Am Nat 128:199–215
Meagher TR, Thompson E (1987) Analysis of parentage for naturally
established seedlings of Chamaelirim luteum (Liliaceae). Ecol-
ogy 68:803–812
Milfont CID (2011) Estrutura espacial de populacoes de janaguba
(Himatanthus drasticus (Mart) Plumel) na Chapada do Araripe,
Ceara. Monography (Bach). Universidade Regional do Cariri,
Brazil
Moraes MLT, Sebbenn AM (2010) Pollen dispersal between isolated
trees in the Brazilian savannah: a case study of the Neotropical
tree Hymenaea stigonocarpa. Biotropica 43:192–199
Mousinho KC, Oliveira CC, Ferreira JRO, Carvalho AA, Magalhaes
HIF, Bezerra DP, Alves APNN, Costa-Lotufo LV, Pessoa C, De
Matos MPV (2011) Antitumor effect of laticifer proteins of
Himatanthus drasticus (Mart.) Plumel-Apocynaceae. J Ethno-
pharmacol 137:421–426
Oliveira PS, Marquis RJ (2002) The cerrados of Brazil: ecology and
natural history of a neotropical savanna. Columbia Univ Press,
New York
Pandey M, Rajora OP (2012) Higher fine-scale genetic structure in
peripheral than core populations of a long-lived and mixed-
mating conifer-eastern white cedar (Thuja occidentalis L.).
Biochem Syst 12:48
Petit RJ, Duminil J, Fineschi S, Hampe A, Salvini D, Vendramin GG
(2005) Invited review: comparative organization of chloroplast,
mitochondrial and nuclear diversity in plant populations. Mol
Ecol 14:689–701
Plumel MM (1991) Le genre Himatanthus (Apocynaceae) revision
taxonomique: Bradea
Rathmacher G, Niggemann M, Kohnen M, Ziegenhagen B, Bialozyt
R (2010) Short-distance gene flow in Populus nigra L. accounts
for small-scale spatial genetic structures: implications for in situ
conservation measures. Conserv Genet 11:1327–1338
Reboucas SO, Grivicich I, Santos MS, Rodriguez P, Gomes MD,
Oliveira SQ, da Silva J, Ferraz ABF (2011) Antiproliferative
effect of a traditional remedy, Himatanthus articulatus bark, on
human cancer cell lines. J Ethnopharmacol 137:926–929
Rijkers T, Ogbazghi W, Wessel M, Bongers F (2006) The effect of
tapping for frankincense on sexual reproduction in Boswellia
papyrifera. J Appl Ecol 43:1188–1195
Rosas F, Quesada M, Lobo JA, Sork VL (2011) Effects of habitat
fragmentation on pollen flow and genetic diversity of the
endangered tropical tree Swietenia humilis (Meliaceae). Biol
Conserv 144:3082–3088
Conserv Genet
123

Sant’Anna CS, Sebbenn AM, Klabunde GHF, Bittencourt R, Nodari
RO, Mantovani A, Reis MS (2013) Realized pollen and seed
dispersal within a continuous population of the dioecious
coniferous Brazilian pine [Araucaria angustifolia (Bertol.)
Kuntze]. Conserv Genet 14:601–613
Santos FAM (2001) MAPA. UNICAMP, Campinas
Schlindwein C, Darrault RO, Grisi T (2004) Reproductive strategies
in two sphingophilous apocynaceous trees attracting pollinators
through nectar or deceit. In: Proceedings of the 2nd Symposium
of the A. F. W. Schimper-Foundation, Stuttgart, pp 215–227
Sebbenn AM, Carvalho ACM, Freitas MLM, Moraes SMB, Gaino
APSC, Silva JM, Jolivet C, Moraes MLT (2011) Low levels of
realized seed and pollen gene flow and strong spatial genetic
structure in a small, isolated and fragmented population of the
tropical tree Copaifera langsdorffii Desf. Heredity 106:134–145
Sokal RR, Rohlf FJ (1995) Biometry: the principles and practice of
statistics in biological research. Freeman, New York
Soons MB, Heil GW, Nathan R, Katul GG (2004) Determinants of
long-distance seed dispersal by wind in grasslands. Ecology
85:3056–3068
Stewart K (2009) Effects of bark harvest and other human activity on
populations of the African cherry (Prunus africana) on Mount
Oku, Cameroon. For Ecol Manage 258:1121–1128
Tarazi R, Mantovani A, Reis MS (2010) Fine-scale spatial genetic
structure and allozymic diversity in natural populations of Ocotea
catharinensis Mez. (Lauraceae). Conserv Genet 11:965–976
Tarazi R, Sebbenn AM, Kageyama PY, Vencovsky R (2013) Edge
effects enhance selfing and seed harvesting efforts in the insect-
pollinated Neotropical tree Copaifera langsdorffii (Fabaceae).
Heredity 110:578–585
Vekemans X, Hardy OJ (2004) New insights from fine-scale spatial
genetic structure analyses in plant populations. Mol Ecol 13:921–935
Wright S (1943) Isolation by distance. Genetics 28:114
Zardo R, Henriques R (2011) Growth and fruit production of the tree
Caryocar brasiliense in the Cerrado of central Brazil. Agrofor
Syst 82:15–23
Zucchi MI, Brondani RPV, Pinheiro JB, Chaves LJ, Coelho ASG,
Vencovsky R (2003) Genetic structure and gene flow in Eugenia
dysenterica DC in the Brazilian Cerrado utilizing SSR markers.
Genet Mol Biol 26:449–457
Conserv Genet
123