Genetic correlations of psychiatric traits with body ... - Nature
12
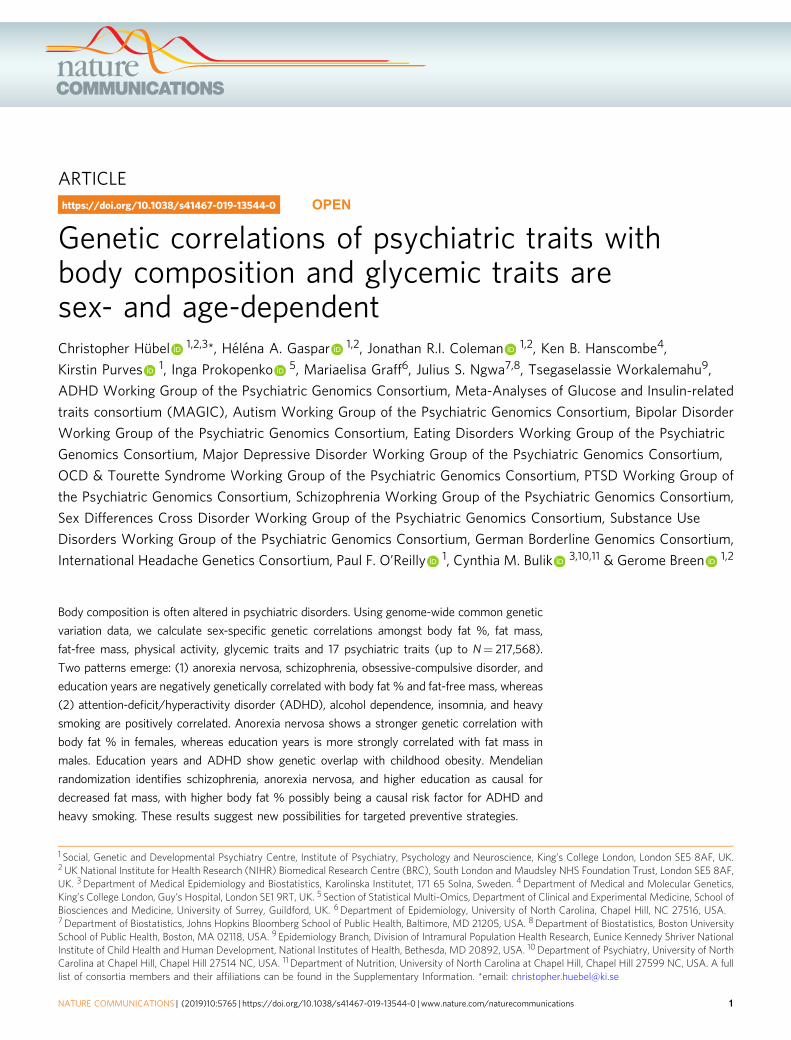
ARTICLE Genetic correlations of psychiatric traits with body composition and glycemic traits are sex- and age-dependent Christopher Hü bel 1,2,3 *, Hé lé na A. Gaspar 1,2 , Jonathan R.I. Coleman 1,2 , Ken B. Hanscombe 4 , Kirstin Purves 1 , Inga Prokopenko 5 , Mariaelisa Graff 6 , Julius S. Ngwa 7,8 , Tsegaselassie Workalemahu 9 , ADHD Working Group of the Psychiatric Genomics Consortium, Meta-Analyses of Glucose and Insulin-related traits consortium (MAGIC), Autism Working Group of the Psychiatric Genomics Consortium, Bipolar Disorder Working Group of the Psychiatric Genomics Consortium, Eating Disorders Working Group of the Psychiatric Genomics Consortium, Major Depressive Disorder Working Group of the Psychiatric Genomics Consortium, OCD & Tourette Syndrome Working Group of the Psychiatric Genomics Consortium, PTSD Working Group of the Psychiatric Genomics Consortium, Schizophrenia Working Group of the Psychiatric Genomics Consortium, Sex Differences Cross Disorder Working Group of the Psychiatric Genomics Consortium, Substance Use Disorders Working Group of the Psychiatric Genomics Consortium, German Borderline Genomics Consortium, International Headache Genetics Consortium, Paul F. O’Reilly 1 , Cynthia M. Bulik 3,10,11 & Gerome Breen 1,2 Body composition is often altered in psychiatric disorders. Using genome-wide common genetic variation data, we calculate sex-specific genetic correlations amongst body fat %, fat mass, fat-free mass, physical activity, glycemic traits and 17 psychiatric traits (up to N = 217,568). Two patterns emerge: (1) anorexia nervosa, schizophrenia, obsessive-compulsive disorder, and education years are negatively genetically correlated with body fat % and fat-free mass, whereas (2) attention-deficit/hyperactivity disorder (ADHD), alcohol dependence, insomnia, and heavy smoking are positively correlated. Anorexia nervosa shows a stronger genetic correlation with body fat % in females, whereas education years is more strongly correlated with fat mass in males. Education years and ADHD show genetic overlap with childhood obesity. Mendelian randomization identifies schizophrenia, anorexia nervosa, and higher education as causal for decreased fat mass, with higher body fat % possibly being a causal risk factor for ADHD and heavy smoking. These results suggest new possibilities for targeted preventive strategies. https://doi.org/10.1038/s41467-019-13544-0 OPEN 1 Social, Genetic and Developmental Psychiatry Centre, Institute of Psychiatry, Psychology and Neuroscience, King’s College London, London SE5 8AF, UK. 2 UK National Institute for Health Research (NIHR) Biomedical Research Centre (BRC), South London and Maudsley NHS Foundation Trust, London SE5 8AF, UK. 3 Department of Medical Epidemiology and Biostatistics, Karolinska Institutet, 171 65 Solna, Sweden. 4 Department of Medical and Molecular Genetics, King’s College London, Guy’s Hospital, London SE1 9RT, UK. 5 Section of Statistical Multi-Omics, Department of Clinical and Experimental Medicine, School of Biosciences and Medicine, University of Surrey, Guildford, UK. 6 Department of Epidemiology, University of North Carolina, Chapel Hill, NC 27516, USA. 7 Department of Biostatistics, Johns Hopkins Bloomberg School of Public Health, Baltimore, MD 21205, USA. 8 Department of Biostatistics, Boston University School of Public Health, Boston, MA 02118, USA. 9 Epidemiology Branch, Division of Intramural Population Health Research, Eunice Kennedy Shriver National Institute of Child Health and Human Development, National Institutes of Health, Bethesda, MD 20892, USA. 10 Department of Psychiatry, University of North Carolina at Chapel Hill, Chapel Hill 27514 NC, USA. 11 Department of Nutrition, University of North Carolina at Chapel Hill, Chapel Hill 27599 NC, USA. A full list of consortia members and their affiliations can be found in the Supplementary Information. *email: [email protected] NATURE COMMUNICATIONS | (2019)10:5765 | https://doi.org/10.1038/s41467-019-13544-0 | www.nature.com/naturecommunications 1 1234567890():,;
-
Upload
khangminh22 -
Category
Documents
-
view
1 -
download
0
Transcript of Genetic correlations of psychiatric traits with body ... - Nature
ARTICLE
Genetic correlations of psychiatric traits withbody composition and glycemic traits aresex- and age-dependentChristopher Hubel 1,2,3*, Helena A. Gaspar 1,2, Jonathan R.I. Coleman 1,2, Ken B. Hanscombe4,
Kirstin Purves 1, Inga Prokopenko 5, Mariaelisa Graff6, Julius S. Ngwa7,8, Tsegaselassie Workalemahu9,
ADHD Working Group of the Psychiatric Genomics Consortium, Meta-Analyses of Glucose and Insulin-related
traits consortium (MAGIC), Autism Working Group of the Psychiatric Genomics Consortium, Bipolar Disorder
Working Group of the Psychiatric Genomics Consortium, Eating Disorders Working Group of the Psychiatric
Genomics Consortium, Major Depressive Disorder Working Group of the Psychiatric Genomics Consortium,
OCD & Tourette Syndrome Working Group of the Psychiatric Genomics Consortium, PTSD Working Group of
the Psychiatric Genomics Consortium, Schizophrenia Working Group of the Psychiatric Genomics Consortium,
Sex Differences Cross Disorder Working Group of the Psychiatric Genomics Consortium, Substance Use
Disorders Working Group of the Psychiatric Genomics Consortium, German Borderline Genomics Consortium,
International Headache Genetics Consortium, Paul F. O’Reilly 1, Cynthia M. Bulik 3,10,11 & Gerome Breen 1,2
Body composition is often altered in psychiatric disorders. Using genome-wide common genetic
variation data, we calculate sex-specific genetic correlations amongst body fat %, fat mass,
fat-free mass, physical activity, glycemic traits and 17 psychiatric traits (up to N= 217,568).
Two patterns emerge: (1) anorexia nervosa, schizophrenia, obsessive-compulsive disorder, and
education years are negatively genetically correlated with body fat % and fat-free mass, whereas
(2) attention-deficit/hyperactivity disorder (ADHD), alcohol dependence, insomnia, and heavy
smoking are positively correlated. Anorexia nervosa shows a stronger genetic correlation with
body fat % in females, whereas education years is more strongly correlated with fat mass in
males. Education years and ADHD show genetic overlap with childhood obesity. Mendelian
randomization identifies schizophrenia, anorexia nervosa, and higher education as causal for
decreased fat mass, with higher body fat % possibly being a causal risk factor for ADHD and
heavy smoking. These results suggest new possibilities for targeted preventive strategies.
https://doi.org/10.1038/s41467-019-13544-0 OPEN
1 Social, Genetic and Developmental Psychiatry Centre, Institute of Psychiatry, Psychology and Neuroscience, King’s College London, London SE5 8AF, UK.2 UK National Institute for Health Research (NIHR) Biomedical Research Centre (BRC), South London and Maudsley NHS Foundation Trust, London SE5 8AF,UK. 3 Department of Medical Epidemiology and Biostatistics, Karolinska Institutet, 171 65 Solna, Sweden. 4Department of Medical and Molecular Genetics,King’s College London, Guy’s Hospital, London SE1 9RT, UK. 5 Section of Statistical Multi-Omics, Department of Clinical and Experimental Medicine, School ofBiosciences and Medicine, University of Surrey, Guildford, UK. 6 Department of Epidemiology, University of North Carolina, Chapel Hill, NC 27516, USA.7Department of Biostatistics, Johns Hopkins Bloomberg School of Public Health, Baltimore, MD 21205, USA. 8Department of Biostatistics, Boston UniversitySchool of Public Health, Boston, MA 02118, USA. 9 Epidemiology Branch, Division of Intramural Population Health Research, Eunice Kennedy Shriver NationalInstitute of Child Health and Human Development, National Institutes of Health, Bethesda, MD 20892, USA. 10 Department of Psychiatry, University of NorthCarolina at Chapel Hill, Chapel Hill 27514 NC, USA. 11 Department of Nutrition, University of North Carolina at Chapel Hill, Chapel Hill 27599 NC, USA. A fulllist of consortia members and their affiliations can be found in the Supplementary Information. *email: [email protected]
NATURE COMMUNICATIONS | (2019) 10:5765 | https://doi.org/10.1038/s41467-019-13544-0 |www.nature.com/naturecommunications 1
1234
5678
90():,;
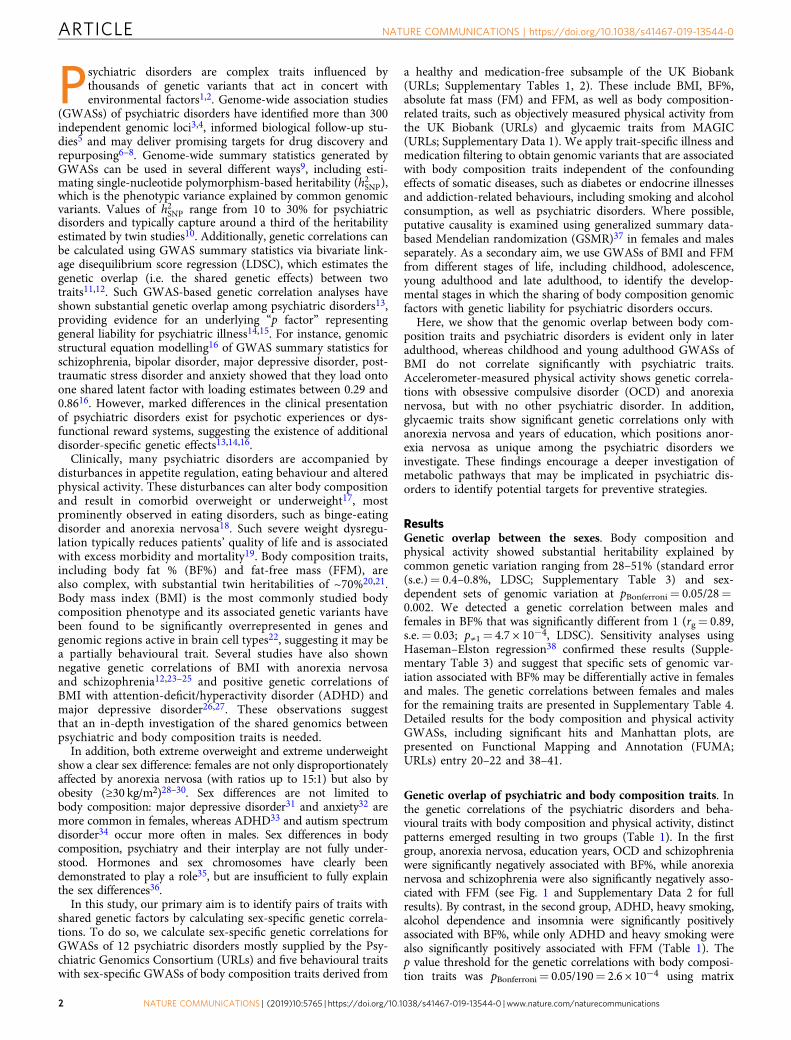
Psychiatric disorders are complex traits influenced bythousands of genetic variants that act in concert withenvironmental factors1,2. Genome-wide association studies
(GWASs) of psychiatric disorders have identified more than 300independent genomic loci3,4, informed biological follow-up stu-dies5 and may deliver promising targets for drug discovery andrepurposing6–8. Genome-wide summary statistics generated byGWASs can be used in several different ways9, including esti-mating single-nucleotide polymorphism-based heritability (h2SNP),which is the phenotypic variance explained by common genomicvariants. Values of h2SNP range from 10 to 30% for psychiatricdisorders and typically capture around a third of the heritabilityestimated by twin studies10. Additionally, genetic correlations canbe calculated using GWAS summary statistics via bivariate link-age disequilibrium score regression (LDSC), which estimates thegenetic overlap (i.e. the shared genetic effects) between twotraits11,12. Such GWAS-based genetic correlation analyses haveshown substantial genetic overlap among psychiatric disorders13,providing evidence for an underlying “p factor” representinggeneral liability for psychiatric illness14,15. For instance, genomicstructural equation modelling16 of GWAS summary statistics forschizophrenia, bipolar disorder, major depressive disorder, post-traumatic stress disorder and anxiety showed that they load ontoone shared latent factor with loading estimates between 0.29 and0.8616. However, marked differences in the clinical presentationof psychiatric disorders exist for psychotic experiences or dys-functional reward systems, suggesting the existence of additionaldisorder-specific genetic effects13,14,16.
Clinically, many psychiatric disorders are accompanied bydisturbances in appetite regulation, eating behaviour and alteredphysical activity. These disturbances can alter body compositionand result in comorbid overweight or underweight17, mostprominently observed in eating disorders, such as binge-eatingdisorder and anorexia nervosa18. Such severe weight dysregu-lation typically reduces patients’ quality of life and is associatedwith excess morbidity and mortality19. Body composition traits,including body fat % (BF%) and fat-free mass (FFM), arealso complex, with substantial twin heritabilities of ~70%20,21.Body mass index (BMI) is the most commonly studied bodycomposition phenotype and its associated genetic variants havebeen found to be significantly overrepresented in genes andgenomic regions active in brain cell types22, suggesting it may bea partially behavioural trait. Several studies have also shownnegative genetic correlations of BMI with anorexia nervosaand schizophrenia12,23–25 and positive genetic correlations ofBMI with attention-deficit/hyperactivity disorder (ADHD) andmajor depressive disorder26,27. These observations suggestthat an in-depth investigation of the shared genomics betweenpsychiatric and body composition traits is needed.
In addition, both extreme overweight and extreme underweightshow a clear sex difference: females are not only disproportionatelyaffected by anorexia nervosa (with ratios up to 15:1) but also byobesity (≥30 kg/m2)28–30. Sex differences are not limited tobody composition: major depressive disorder31 and anxiety32 aremore common in females, whereas ADHD33 and autism spectrumdisorder34 occur more often in males. Sex differences in bodycomposition, psychiatry and their interplay are not fully under-stood. Hormones and sex chromosomes have clearly beendemonstrated to play a role35, but are insufficient to fully explainthe sex differences36.
In this study, our primary aim is to identify pairs of traits withshared genetic factors by calculating sex-specific genetic correla-tions. To do so, we calculate sex-specific genetic correlations forGWASs of 12 psychiatric disorders mostly supplied by the Psy-chiatric Genomics Consortium (URLs) and five behavioural traitswith sex-specific GWASs of body composition traits derived from
a healthy and medication-free subsample of the UK Biobank(URLs; Supplementary Tables 1, 2). These include BMI, BF%,absolute fat mass (FM) and FFM, as well as body composition-related traits, such as objectively measured physical activity fromthe UK Biobank (URLs) and glycaemic traits from MAGIC(URLs; Supplementary Data 1). We apply trait-specific illness andmedication filtering to obtain genomic variants that are associatedwith body composition traits independent of the confoundingeffects of somatic diseases, such as diabetes or endocrine illnessesand addiction-related behaviours, including smoking and alcoholconsumption, as well as psychiatric disorders. Where possible,putative causality is examined using generalized summary data-based Mendelian randomization (GSMR)37 in females and malesseparately. As a secondary aim, we use GWASs of BMI and FFMfrom different stages of life, including childhood, adolescence,young adulthood and late adulthood, to identify the develop-mental stages in which the sharing of body composition genomicfactors with genetic liability for psychiatric disorders occurs.
Here, we show that the genomic overlap between body com-position traits and psychiatric disorders is evident only in lateradulthood, whereas childhood and young adulthood GWASs ofBMI do not correlate significantly with psychiatric traits.Accelerometer-measured physical activity shows genetic correla-tions with obsessive compulsive disorder (OCD) and anorexianervosa, but with no other psychiatric disorder. In addition,glycaemic traits show significant genetic correlations only withanorexia nervosa and years of education, which positions anor-exia nervosa as unique among the psychiatric disorders weinvestigate. These findings encourage a deeper investigation ofmetabolic pathways that may be implicated in psychiatric dis-orders to identify potential targets for preventive strategies.
ResultsGenetic overlap between the sexes. Body composition andphysical activity showed substantial heritability explained bycommon genetic variation ranging from 28–51% (standard error(s.e.)= 0.4–0.8%, LDSC; Supplementary Table 3) and sex-dependent sets of genomic variation at pBonferroni= 0.05/28=0.002. We detected a genetic correlation between males andfemales in BF% that was significantly different from 1 (rg= 0.89,s.e.= 0.03; p≠1= 4.7 × 10⁻⁴, LDSC). Sensitivity analyses usingHaseman–Elston regression38 confirmed these results (Supple-mentary Table 3) and suggest that specific sets of genomic var-iation associated with BF% may be differentially active in femalesand males. The genetic correlations between females and malesfor the remaining traits are presented in Supplementary Table 4.Detailed results for the body composition and physical activityGWASs, including significant hits and Manhattan plots, arepresented on Functional Mapping and Annotation (FUMA;URLs) entry 20–22 and 38–41.
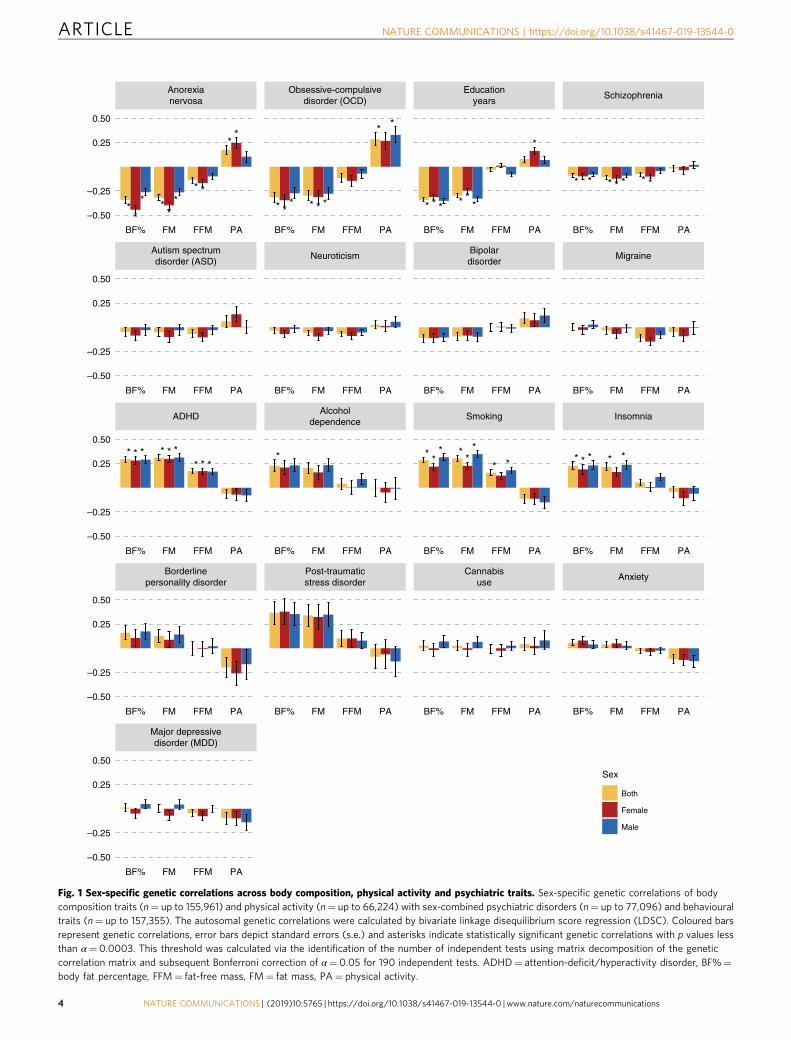
Genetic overlap of psychiatric and body composition traits. Inthe genetic correlations of the psychiatric disorders and beha-vioural traits with body composition and physical activity, distinctpatterns emerged resulting in two groups (Table 1). In the firstgroup, anorexia nervosa, education years, OCD and schizophreniawere significantly negatively associated with BF%, while anorexianervosa and schizophrenia were also significantly negatively asso-ciated with FFM (see Fig. 1 and Supplementary Data 2 for fullresults). By contrast, in the second group, ADHD, heavy smoking,alcohol dependence and insomnia were significantly positivelyassociated with BF%, while only ADHD and heavy smoking werealso significantly positively associated with FFM (Table 1). Thep value threshold for the genetic correlations with body composi-tion traits was pBonferroni= 0.05/190= 2.6 × 10⁻⁴ using matrix
ARTICLE NATURE COMMUNICATIONS | https://doi.org/10.1038/s41467-019-13544-0
2 NATURE COMMUNICATIONS | (2019) 10:5765 | https://doi.org/10.1038/s41467-019-13544-0 | www.nature.com/naturecommunications
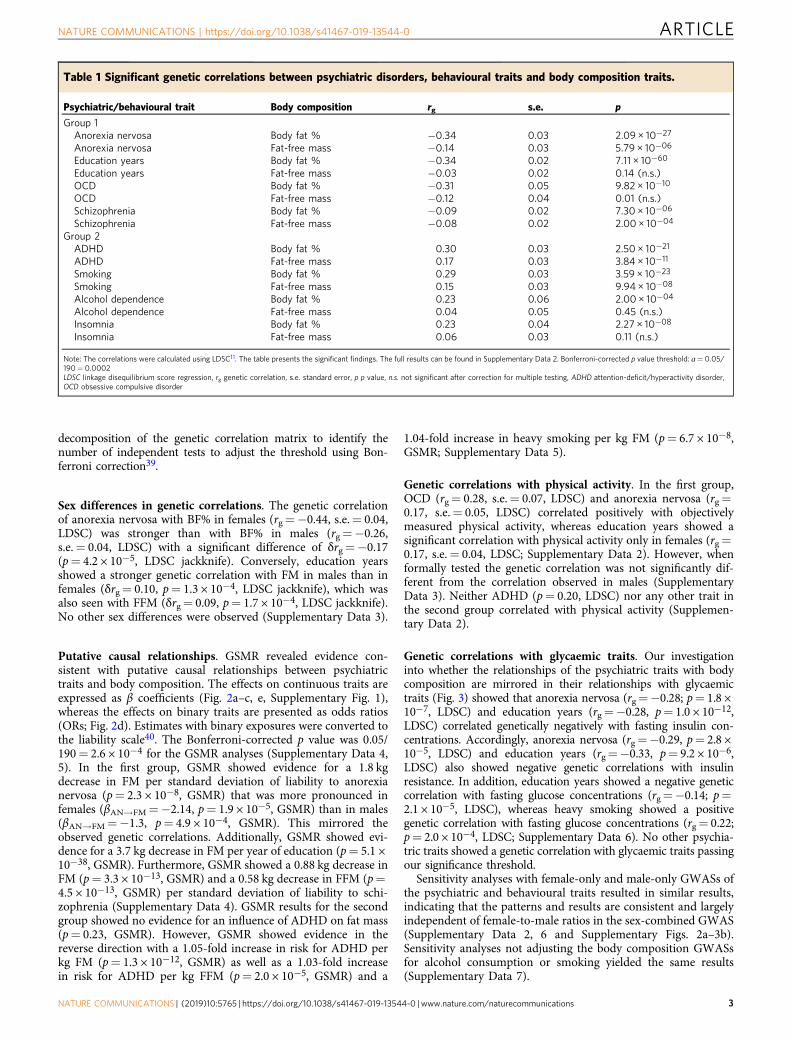
decomposition of the genetic correlation matrix to identify thenumber of independent tests to adjust the threshold using Bon-ferroni correction39.
Sex differences in genetic correlations. The genetic correlationof anorexia nervosa with BF% in females (rg=−0.44, s.e.= 0.04,LDSC) was stronger than with BF% in males (rg=−0.26,s.e.= 0.04, LDSC) with a significant difference of δrg=−0.17(p= 4.2 × 10⁻⁵, LDSC jackknife). Conversely, education yearsshowed a stronger genetic correlation with FM in males than infemales (δrg= 0.10, p= 1.3 × 10⁻⁴, LDSC jackknife), which wasalso seen with FFM (δrg= 0.09, p= 1.7 × 10⁻⁴, LDSC jackknife).No other sex differences were observed (Supplementary Data 3).
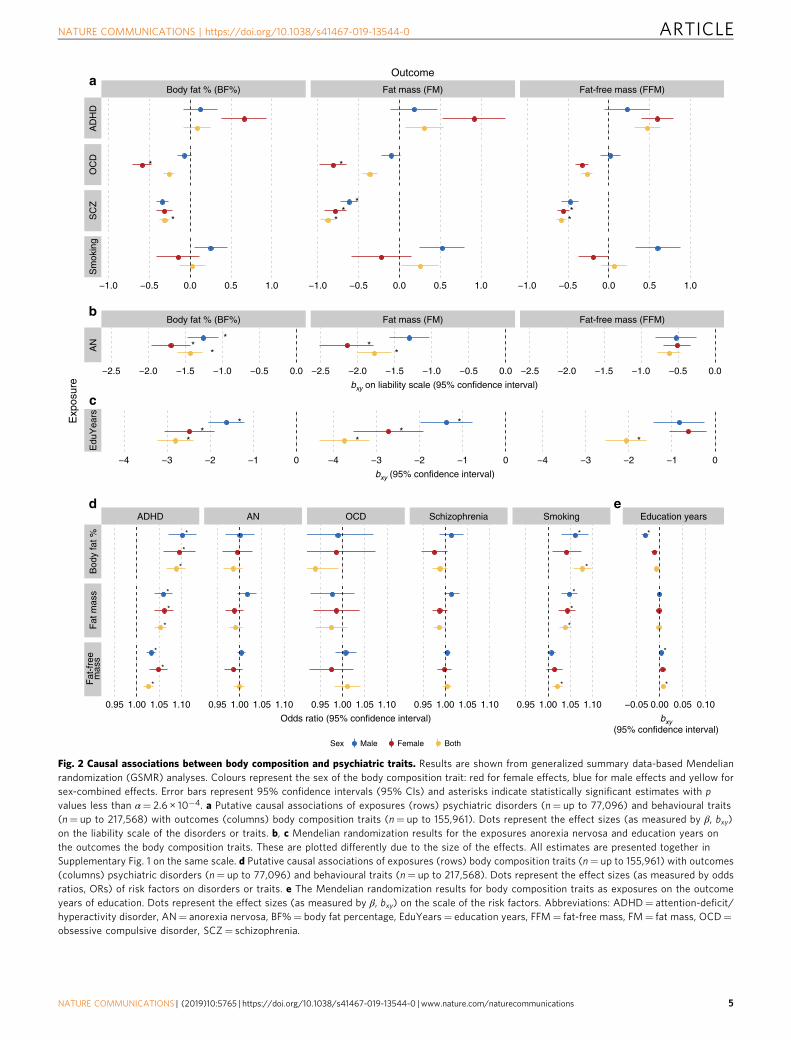
Putative causal relationships. GSMR revealed evidence con-sistent with putative causal relationships between psychiatrictraits and body composition. The effects on continuous traits areexpressed as β coefficients (Fig. 2a–c, e, Supplementary Fig. 1),whereas the effects on binary traits are presented as odds ratios(ORs; Fig. 2d). Estimates with binary exposures were converted tothe liability scale40. The Bonferroni-corrected p value was 0.05/190= 2.6 × 10⁻⁴ for the GSMR analyses (Supplementary Data 4,5). In the first group, GSMR showed evidence for a 1.8 kgdecrease in FM per standard deviation of liability to anorexianervosa (p= 2.3 × 10⁻⁸, GSMR) that was more pronounced infemales (βAN→FM=−2.14, p= 1.9 × 10⁻⁵, GSMR) than in males(βAN→FM=−1.3, p= 4.9 × 10⁻⁴, GSMR). This mirrored theobserved genetic correlations. Additionally, GSMR showed evi-dence for a 3.7 kg decrease in FM per year of education (p= 5.1 ×10−38, GSMR). Furthermore, GSMR showed a 0.88 kg decrease inFM (p= 3.3 × 10⁻¹³, GSMR) and a 0.58 kg decrease in FFM (p=4.5 × 10⁻¹³, GSMR) per standard deviation of liability to schi-zophrenia (Supplementary Data 4). GSMR results for the secondgroup showed no evidence for an influence of ADHD on fat mass(p= 0.23, GSMR). However, GSMR showed evidence in thereverse direction with a 1.05-fold increase in risk for ADHD perkg FM (p= 1.3 × 10⁻¹², GSMR) as well as a 1.03-fold increasein risk for ADHD per kg FFM (p= 2.0 × 10⁻⁵, GSMR) and a
1.04-fold increase in heavy smoking per kg FM (p= 6.7 × 10⁻⁸,GSMR; Supplementary Data 5).
Genetic correlations with physical activity. In the first group,OCD (rg= 0.28, s.e.= 0.07, LDSC) and anorexia nervosa (rg=0.17, s.e.= 0.05, LDSC) correlated positively with objectivelymeasured physical activity, whereas education years showed asignificant correlation with physical activity only in females (rg=0.17, s.e.= 0.04, LDSC; Supplementary Data 2). However, whenformally tested the genetic correlation was not significantly dif-ferent from the correlation observed in males (SupplementaryData 3). Neither ADHD (p= 0.20, LDSC) nor any other trait inthe second group correlated with physical activity (Supplemen-tary Data 2).
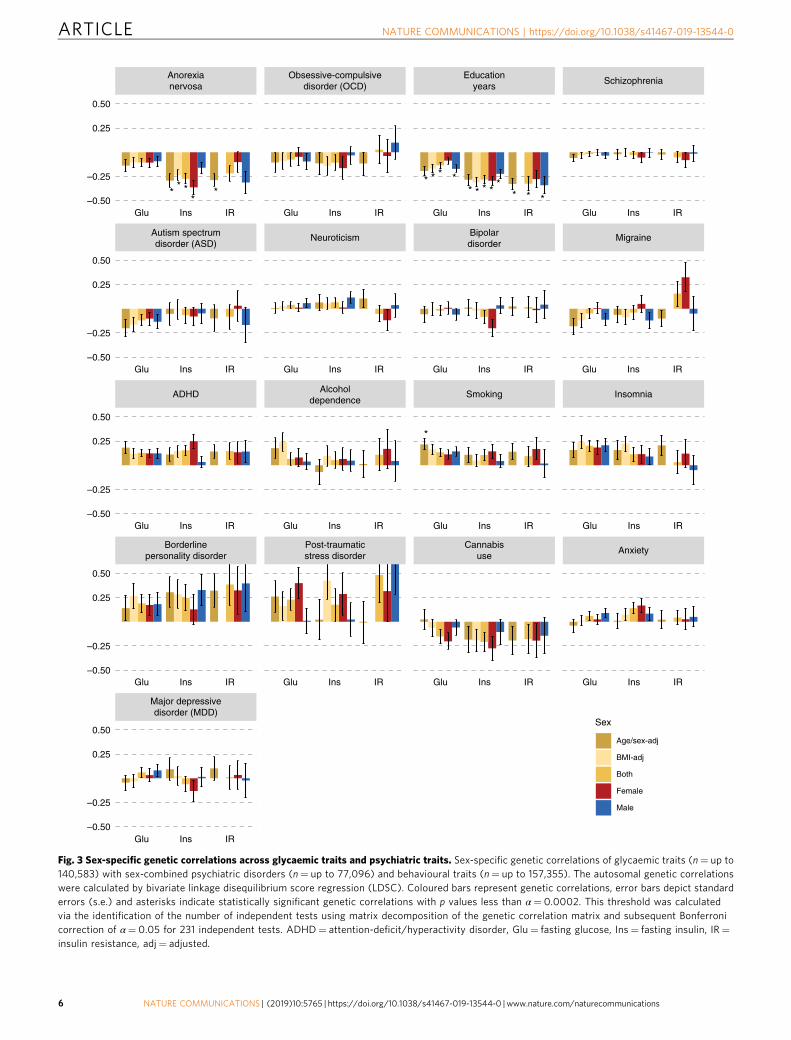
Genetic correlations with glycaemic traits. Our investigationinto whether the relationships of the psychiatric traits with bodycomposition are mirrored in their relationships with glycaemictraits (Fig. 3) showed that anorexia nervosa (rg=−0.28; p= 1.8 ×10⁻⁷, LDSC) and education years (rg=−0.28, p= 1.0 × 10⁻¹²,LDSC) correlated genetically negatively with fasting insulin con-centrations. Accordingly, anorexia nervosa (rg=−0.29, p= 2.8 ×10⁻⁵, LDSC) and education years (rg=−0.33, p= 9.2 × 10⁻⁶,LDSC) also showed negative genetic correlations with insulinresistance. In addition, education years showed a negative geneticcorrelation with fasting glucose concentrations (rg=−0.14; p=2.1 × 10⁻⁵, LDSC), whereas heavy smoking showed a positivegenetic correlation with fasting glucose concentrations (rg= 0.22;p= 2.0 × 10⁻⁴, LDSC; Supplementary Data 6). No other psychia-tric traits showed a genetic correlation with glycaemic traits passingour significance threshold.
Sensitivity analyses with female-only and male-only GWASs ofthe psychiatric and behavioural traits resulted in similar results,indicating that the patterns and results are consistent and largelyindependent of female-to-male ratios in the sex-combined GWAS(Supplementary Data 2, 6 and Supplementary Figs. 2a–3b).Sensitivity analyses not adjusting the body composition GWASsfor alcohol consumption or smoking yielded the same results(Supplementary Data 7).
Table 1 Significant genetic correlations between psychiatric disorders, behavioural traits and body composition traits.
Psychiatric/behavioural trait Body composition rg s.e. p
Group 1Anorexia nervosa Body fat % −0.34 0.03 2.09 × 10⁻²⁷
Anorexia nervosa Fat-free mass −0.14 0.03 5.79 × 10−06
Education years Body fat % −0.34 0.02 7.11 × 10−60
Education years Fat-free mass −0.03 0.02 0.14 (n.s.)OCD Body fat % −0.31 0.05 9.82 × 10⁻¹⁰
OCD Fat-free mass −0.12 0.04 0.01 (n.s.)Schizophrenia Body fat % −0.09 0.02 7.30 × 10−06
Schizophrenia Fat-free mass −0.08 0.02 2.00 × 10−04
Group 2ADHD Body fat % 0.30 0.03 2.50 × 10⁻²¹
ADHD Fat-free mass 0.17 0.03 3.84 × 10⁻¹¹
Smoking Body fat % 0.29 0.03 3.59 × 10⁻²³
Smoking Fat-free mass 0.15 0.03 9.94 × 10−08
Alcohol dependence Body fat % 0.23 0.06 2.00 × 10−04
Alcohol dependence Fat-free mass 0.04 0.05 0.45 (n.s.)Insomnia Body fat % 0.23 0.04 2.27 × 10−08
Insomnia Fat-free mass 0.06 0.03 0.11 (n.s.)
Note: The correlations were calculated using LDSC11. The table presents the significant findings. The full results can be found in Supplementary Data 2. Bonferroni-corrected p value threshold: ɑ= 0.05/190= 0.0002LDSC linkage disequilibrium score regression, rg genetic correlation, s.e. standard error, p p value, n.s. not significant after correction for multiple testing, ADHD attention-deficit/hyperactivity disorder,OCD obsessive compulsive disorder
NATURE COMMUNICATIONS | https://doi.org/10.1038/s41467-019-13544-0 ARTICLE
NATURE COMMUNICATIONS | (2019) 10:5765 | https://doi.org/10.1038/s41467-019-13544-0 |www.nature.com/naturecommunications 3
*
**
**
***
**
*** ******
*** ***
**
*
*** ***
*
***
**
***
** *** **
*** **
Major depressivedisorder (MDD)
Borderlinepersonality disorder
Post-traumaticstress disorder
Cannabisuse
Anxiety
ADHDAlcohol
dependenceSmoking Insomnia
Autism spectrumdisorder (ASD)
NeuroticismBipolardisorder
Migraine
Anorexianervosa
Obsessive-compulsivedisorder (OCD)
Educationyears
Schizophrenia
BF% FM FFM PA
BF% FM FFM PA BF% FM FFM PA BF% FM FFM PA BF% FM FFM PA
BF% FM FFM PA BF% FM FFM PA BF% FM FFM PA BF% FM FFM PA
BF% FM FFM PA BF% FM FFM PA BF% FM FFM PA BF% FM FFM PA
BF% FM FFM PA BF% FM FFM PA BF% FM FFM PA BF% FM FFM PA
–0.25
–0.50
0.25
0.50
–0.25
–0.50
0.25
0.50
–0.25
–0.50
0.25
0.50
–0.25
–0.50
0.25
0.50
–0.25
–0.50
0.25
0.50
Sex
Both
Female
Male
Fig. 1 Sex-specific genetic correlations across body composition, physical activity and psychiatric traits. Sex-specific genetic correlations of bodycomposition traits (n= up to 155,961) and physical activity (n= up to 66,224) with sex-combined psychiatric disorders (n= up to 77,096) and behaviouraltraits (n= up to 157,355). The autosomal genetic correlations were calculated by bivariate linkage disequilibrium score regression (LDSC). Coloured barsrepresent genetic correlations, error bars depict standard errors (s.e.) and asterisks indicate statistically significant genetic correlations with p values lessthan α= 0.0003. This threshold was calculated via the identification of the number of independent tests using matrix decomposition of the geneticcorrelation matrix and subsequent Bonferroni correction of α= 0.05 for 190 independent tests. ADHD= attention-deficit/hyperactivity disorder, BF%=body fat percentage, FFM= fat-free mass, FM= fat mass, PA= physical activity.
ARTICLE NATURE COMMUNICATIONS | https://doi.org/10.1038/s41467-019-13544-0
4 NATURE COMMUNICATIONS | (2019) 10:5765 | https://doi.org/10.1038/s41467-019-13544-0 | www.nature.com/naturecommunications
Outcome
*
*
*
**
*
**
Body fat % (BF%) Fat mass (FM) Fat-free mass (FFM)A
DH
DO
CD
SC
ZS
mok
ing
−1.0 −0.5 0.0 0.5 1.0 −1.0 −0.5 0.0 0.5 1.0 −1.0 −0.5 0.0 0.5 1.0
a
**
*
**
Body fat % (BF%) Fat mass (FM) Fat-free mass (FFM)
AN
−2.5 −2.0 −1.5 −1.0 −0.5 0.0 −2.5 −2.0 −1.5 −1.0 −0.5 0.0 −2.5 −2.0 −1.5 −1.0 −0.5 0.0
bxy on liability scale (95% confidence interval)
b
**
*
**
*
*
Edu
Yea
rs
−4 −3 −2 −1 0 −4 −3 −2 −1 0 −4 −3 −2 −1 0
bxy (95% confidence interval)
c
*
*
*
*
*
*
*
*
*
*
*
*
*
*
*
ADHD AN OCD Schizophrenia Smoking
Bod
y fa
t %F
at m
ass
Fat
-fre
em
ass
0.95 1.00 1.05 1.10 0.95 1.00 1.05 1.10 0.95 1.00 1.05 1.10 0.95 1.00 1.05 1.10 0.95 1.00 1.05 1.10
Odds ratio (95% confidence interval)
d
*
*
*
Education years
−0.05 0.00 0.05 0.10
bxy (95% confidence interval)
e
Exp
osur
e
Sex Male Female Both
Fig. 2 Causal associations between body composition and psychiatric traits. Results are shown from generalized summary data-based Mendelianrandomization (GSMR) analyses. Colours represent the sex of the body composition trait: red for female effects, blue for male effects and yellow forsex-combined effects. Error bars represent 95% confidence intervals (95% CIs) and asterisks indicate statistically significant estimates with pvalues less than α= 2.6 × 10⁻⁴. a Putative causal associations of exposures (rows) psychiatric disorders (n= up to 77,096) and behavioural traits(n= up to 217,568) with outcomes (columns) body composition traits (n= up to 155,961). Dots represent the effect sizes (as measured by β, bxy)on the liability scale of the disorders or traits. b, c Mendelian randomization results for the exposures anorexia nervosa and education years onthe outcomes the body composition traits. These are plotted differently due to the size of the effects. All estimates are presented together inSupplementary Fig. 1 on the same scale. d Putative causal associations of exposures (rows) body composition traits (n= up to 155,961) with outcomes(columns) psychiatric disorders (n= up to 77,096) and behavioural traits (n= up to 217,568). Dots represent the effect sizes (as measured by oddsratios, ORs) of risk factors on disorders or traits. e The Mendelian randomization results for body composition traits as exposures on the outcomeyears of education. Dots represent the effect sizes (as measured by β, bxy) on the scale of the risk factors. Abbreviations: ADHD= attention-deficit/hyperactivity disorder, AN= anorexia nervosa, BF%= body fat percentage, EduYears= education years, FFM= fat-free mass, FM= fat mass, OCD=obsessive compulsive disorder, SCZ= schizophrenia.
NATURE COMMUNICATIONS | https://doi.org/10.1038/s41467-019-13544-0 ARTICLE
NATURE COMMUNICATIONS | (2019) 10:5765 | https://doi.org/10.1038/s41467-019-13544-0 |www.nature.com/naturecommunications 5
***
* ***** *
*******
*
Major depressivedisorder (MDD)
Borderlinepersonality disorder
Post-traumaticstress disorder
Cannabisuse
Anxiety
ADHD Alcoholdependence
Smoking Insomnia
Autism spectrumdisorder (ASD)
Neuroticism Bipolardisorder
Migraine
Anorexianervosa
Obsessive-compulsivedisorder (OCD)
Educationyears
Schizophrenia
Glu Ins IR Glu Ins IR Glu Ins IR Glu Ins IR
Glu Ins IR
Glu Ins IR
Glu Ins IR Glu Ins IR Glu Ins IR
Glu Ins IR Glu Ins IR Glu Ins IR Glu Ins IR
Glu Ins IR Glu Ins IR Glu Ins IR Glu Ins IR
–0.25
–0.50
0.25
0.50
–0.25
–0.50
0.25
0.50
–0.25
–0.50
0.25
0.50
–0.25
–0.50
0.25
0.50
–0.25
–0.50
0.25
0.50Sex
Age/sex-adj
BMI-adj
Both
Female
Male
Fig. 3 Sex-specific genetic correlations across glycaemic traits and psychiatric traits. Sex-specific genetic correlations of glycaemic traits (n= up to140,583) with sex-combined psychiatric disorders (n= up to 77,096) and behavioural traits (n= up to 157,355). The autosomal genetic correlationswere calculated by bivariate linkage disequilibrium score regression (LDSC). Coloured bars represent genetic correlations, error bars depict standarderrors (s.e.) and asterisks indicate statistically significant genetic correlations with p values less than α= 0.0002. This threshold was calculatedvia the identification of the number of independent tests using matrix decomposition of the genetic correlation matrix and subsequent Bonferronicorrection of α= 0.05 for 231 independent tests. ADHD= attention-deficit/hyperactivity disorder, Glu= fasting glucose, Ins= fasting insulin, IR=insulin resistance, adj= adjusted.
ARTICLE NATURE COMMUNICATIONS | https://doi.org/10.1038/s41467-019-13544-0
6 NATURE COMMUNICATIONS | (2019) 10:5765 | https://doi.org/10.1038/s41467-019-13544-0 | www.nature.com/naturecommunications
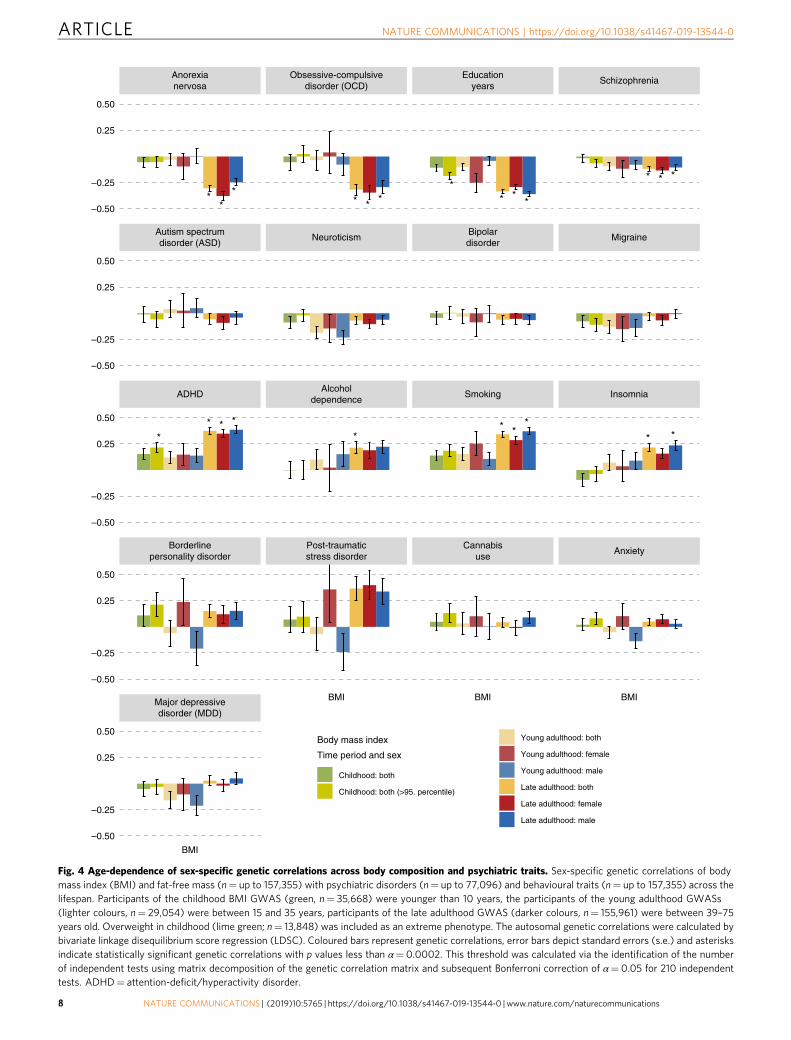
Age-dependent genetic correlations. As a secondary aim, weexplored the developmental dependence of genetic correlations ofBMI and FFM at different ages with psychiatric disorders andbehavioural traits (Fig. 4). We used BMI as a proxy measure ofBF% as no GWAS of BF% in childhood or adolescence wereavailable. To test if the sets of genetic variants affecting bodycomposition at different stages of life differentially correlate withpsychiatric disorders and behavioural traits, we estimated thefollowing genetic BMI correlations and tested if they were sig-nificantly different from one41: between childhood and adoles-cence/young adulthood (rg= 1.00, s.e.= 0.07, LDSC), betweenchildhood and later adulthood (rg= 0.66, s.e.= 0.04, LDSC) andbetween adolescence and later adulthood (rg= 0.80, s.e.= 0.05,LDSC). The genetic correlation of FFM between childhood andadulthood was also significantly different from one (rg= 0.30,s.e.= 0.04, LDSC). As above, multiple psychiatric disorders andtraits showed significant positive and negative genetic correlationswith adult BMI and FFM. However, neither BMI in childhood,adolescence or young adulthood, nor FFM in childhood,showed significant genetic correlations with any of the psychiatricdisorders or behavioural traits (Supplementary Data 8). Toadditionally test an extreme phenotype, we calculated geneticcorrelations between psychiatric traits and obesity in childhood.Within the first group, only education years (rg=−0.19, s.e.=0.03, LDSC) correlated negatively with obesity in childhood.In the second group, ADHD was the only psychiatric disorderthat showed a significant positive genetic correlation with obesityin childhood (rg= 0.22, s.e.= 0.05, LDSC). GSMR analyses gaveevidence for a 1.42-fold increase for ADHD per kg/m2 increase inchildhood BMI (p= 1.26 × 10⁻⁸, GSMR).
DiscussionSymptomatically, psychiatric disorders are often accompanied byalterations in energy intake, energy expenditure and body com-position. Recent genetic analyses of BMI found an important rolefor genes expressed in the brain and specific brain cell types22,suggesting that BMI may be a metabo-behavioural trait. Thisspurred our in-depth investigation of the shared genetics ofpsychiatric traits and body composition. We were able to showthat five psychiatric disorders—anorexia nervosa, OCD, schizo-phrenia, ADHD and alcohol dependence—as well as threebehavioural traits—education years, insomnia and heavy smoking—show significant genetic correlations (i.e. shared genetics) withbody composition in two distinct patterns.
The first group of psychiatric disorders and behavioural traitsincluded anorexia nervosa, OCD, schizophrenia and educationyears, and was characterized by genetic correlations with genomicvariants predisposing to lower BF% and FFM. The second groupcomprised ADHD, alcohol dependence, heavy smoking andinsomnia, and had genetic correlations with genomic variantspredisposing to higher BF% and FFM. Our Mendelian rando-mization analyses used significant genetic variants as instru-mental variables and found that anorexia nervosa, schizophreniaand education years showed evidence consistent with a negativecausal effect on FM and, in the reverse direction, higher BF%appeared to be a risk factor for both ADHD and heavy smoking.Our results also suggested that the overweight seen in individualswith schizophrenia in epidemiological studies42 is likely torepresent medication effects43 given our observations of a puta-tive causal effect of schizophrenia on lower FM and FFM. Thisfinding reiterates the pressing need for the development of newantipsychotic medications with more favourable weight-relatedside effect profiles.
In our analysis, anorexia nervosa showed a stronger correlationwith BF% in females than in males. This phenomenon was not
observed for other traits genetically associated with anorexianervosa, such as neuroticism, anxiety, major depressive disorder,OCD or schizophrenia41. These findings suggest that anorexianervosa and BF% may share a sex-dependent set of genomicvariants potentially contributing to the marked sex bias in theprevalence of anorexia nervosa. Education years showed astronger genetic correlation with FM in males than in females.However, the GSMR analysis showed a more pronounced pro-tective effect of education years on FM in females than in males inline with a large epidemiological study44. This suggests that thestronger genetic association between education years and FM inmales may be driven by a set of pleiotropic variants.
From a developmental perspective, it is striking that GWASs ofbody composition across ages do not genetically correlate per-fectly with each other. These varying genetic effects across thelifespan41,45 have been termed “genetic innovation”46 andrepresent the effects of partially different, age-dependent sets ofgenomic variants on body composition regulation at certainperiods of life41,45. Some of the psychiatric disorders, such asADHD and anorexia nervosa, typically have their onset inchildhood or adolescence with preceding symptoms or beha-viours that implicate neurodevelopmental components. We usedthe available life-stage GWASs of body composition and did notfind genetic overlap between childhood or adolescence/youngadulthood BMI with psychiatric disorders, but instead foundsignificant genetic correlations of psychiatric disorders with lateradult BMI and BF%. Our analyses also show that genetic variantsassociated with obesity before the age of ten were positivelycorrelated only with ADHD and negatively only with educationyears. The relatively specific positive genetic correlation ofchildhood obesity with ADHD recapitulates a large body ofclinical evidence of high phenotypic comorbidity47, also shown infamily studies48. Overweight may represent a difficult butpotentially intervenable risk factor at a young age.
Our finding of a genetic overlap between ADHD and obesity inchildhood may implicate shared biological pathways betweenboth traits. Given our other results, it appears that this sharedcomponent is unlikely to be related to physical activity or gly-caemic traits. Instead, speculatively, a central nervous systempathway that is dysregulated by increased body mass in childhoodmay increase the liability to develop ADHD.
We also investigated body composition-related traits, includingphysical activity, fasting insulin and fasting glucose concentra-tions. Physical activity showed a positive genetic correlation withanorexia nervosa and OCD, which themselves were negativelygenetically correlated with BF%. Carrying genetic variants thatpredispose to higher physical activity may be associated with therelationship between lower BF% and psychiatric traits. Higherphysical activity, therefore, should be carefully assessed in thetreatment of patients with compulsive psychiatric disorders likeanorexia nervosa and OCD as it may be a genetically mediatedbehaviour, as indicated by our analysis.
Contrary to our expectations, ADHD did not show a geneticcorrelation with physical activity. This suggests that hyperactivityin ADHD may not originate from biological liability for higheraccelerometer-measured physical activity49 and is likely to havean alternative cause, such as insufficient inhibitory control asobserved in paediatric clinical samples with ADHD50, healthyadult population samples51, and in a large longitudinal develop-mental cohort study52.
Our analyses showed that anorexia nervosa and educationyears have a negative genetic correlation with fasting insulinconcentrations and insulin resistance, positioning anorexia ner-vosa as a special case within the psychiatric disorders andpotentially differentiating it from OCD. These negative correla-tions with fasting insulin concentrations mirrored the negative
NATURE COMMUNICATIONS | https://doi.org/10.1038/s41467-019-13544-0 ARTICLE
NATURE COMMUNICATIONS | (2019) 10:5765 | https://doi.org/10.1038/s41467-019-13544-0 |www.nature.com/naturecommunications 7
**
*
****
***
*
***
*
***
***
**
Major depressivedisorder (MDD)
Borderlinepersonality disorder
Post-traumaticstress disorder
Cannabisuse
Anxiety
ADHDAlcohol
dependenceSmoking Insomnia
Autism spectrumdisorder (ASD)
NeuroticismBipolardisorder
Migraine
Anorexianervosa
Obsessive-compulsivedisorder (OCD)
Educationyears
Schizophrenia
BMI
BMI BMI BMI
–0.25
–0.50
0.25
0.50
–0.25
–0.50
0.25
0.50
–0.25
–0.50
0.25
0.50
–0.25
–0.50
0.25
0.50
–0.25
–0.50
0.25
0.50Body mass index
Time period and sex
Childhood: both
Childhood: both (>95. percentile)
Young adulthood: both
Young adulthood: female
Young adulthood: male
Late adulthood: both
Late adulthood: female
Late adulthood: male
Fig. 4 Age-dependence of sex-specific genetic correlations across body composition and psychiatric traits. Sex-specific genetic correlations of bodymass index (BMI) and fat-free mass (n= up to 157,355) with psychiatric disorders (n= up to 77,096) and behavioural traits (n= up to 157,355) across thelifespan. Participants of the childhood BMI GWAS (green, n= 35,668) were younger than 10 years, the participants of the young adulthood GWASs(lighter colours, n= 29,054) were between 15 and 35 years, participants of the late adulthood GWAS (darker colours, n= 155,961) were between 39–75years old. Overweight in childhood (lime green; n= 13,848) was included as an extreme phenotype. The autosomal genetic correlations were calculated bybivariate linkage disequilibrium score regression (LDSC). Coloured bars represent genetic correlations, error bars depict standard errors (s.e.) and asterisksindicate statistically significant genetic correlations with p values less than α= 0.0002. This threshold was calculated via the identification of the numberof independent tests using matrix decomposition of the genetic correlation matrix and subsequent Bonferroni correction of α= 0.05 for 210 independenttests. ADHD= attention-deficit/hyperactivity disorder.
ARTICLE NATURE COMMUNICATIONS | https://doi.org/10.1038/s41467-019-13544-0
8 NATURE COMMUNICATIONS | (2019) 10:5765 | https://doi.org/10.1038/s41467-019-13544-0 | www.nature.com/naturecommunications
genetic correlations between anorexia nervosa, education yearsand BF%. The potential involvement of metabolic hormones likeinsulin in anorexia nervosa underscores the relationship of brainand body and their reciprocal regulation53, opening an avenue fordeeper investigation of metabolic components in psychiatricdisorders. The genetic correlations of ADHD with glycaemictraits were not significant, implying that these traits play a smallerrole in ADHD than in anorexia nervosa, given the comparablesample size of the GWASs on both psychiatric disorders25,26.Genetic associations of physical activity and glycaemic traits withbody composition and psychiatric traits in plausible directionsrender them interesting candidates for formal mediation analysesas they may be actionable targets54.
Our study represents the largest investigation of sex- and age-dependent effects in the genomic overlap of body compositionand psychiatric traits. Although our analyses drew on the largestavailable GWASs, some phenotypes still had relatively smallsample sizes for genomic investigations of common variants incomplex traits, especially for our sex-specific analyses. Theseshould be repeated when sample sizes have increased, especiallyfor OCD as its currently available GWAS sample size is parti-cularly modest. All Mendelian randomization analyses, usingGSMR37, with body composition or glycaemic traits, ADHD,education years, schizophrenia or heavy smoking as exposurewere sufficiently powered; however, the analyses with anorexianervosa, insomnia or OCD as exposures should be regarded asexploratory in nature because p value thresholds were lowered toinclude at least 10 single-nucleotide polymorphisms (SNPs) in theinstrument variable.
Finally, the age-dependent genetic influences we observedbetween psychiatric traits and body composition suggests thatfuture research could focus on a developmental approach toGWAS analyses of body composition, to capture age- and sex-dependent differences. These differences have already been sug-gested by larger twin studies55,56 and two molecular geneticstudies41,45, which enabled our examination of their relationshipwith psychiatric traits. Most importantly, shared biologicalpathways and common environmental factors influencing bothbody composition and behavioural traits should be studied aspotential targets for interventions.
MethodsUK Biobank subsample. We performed GWASs on an unrelated (KING relat-edness metric >0.044, equivalent to a relatedness value of 0.088; nrelated= 7765)European subsample (defined by 4-means clustering of the genetic principalcomponents)57 of the genotyped UK Biobank participants (n= 155,961, 45%female, 32% of the genotyped participants, Supplementary Table 1)58,59. The UKBiobank (URLs) is a prospective cohort sampled from the general populationbetween 2006 and 2010. All participants were between 40 and 69 years old, wereregistered with a general practitioner through the United Kingdom’s NationalHealth Service, and lived within travelling distance of one of the assessmentcentres.
Ethics. The UK Biobank is approved by the North West Multi-centre ResearchEthics Committee. All procedures performed in studies involving human partici-pants were in accordance with the ethical standards of the North West Multi-centreResearch Ethics Committee and with the 1964 Declaration of Helsinki and its lateramendments or comparable ethical standards. All participants provided writteninformed consent to participate in the study. This study has been completed underUK Biobank approved study application 27546.
Power calculations of the GWASs. We conducted power calculations for thefemale and male GWASs using the Genetic Power Calculator60. A minimum of39,580 individuals is required to detect a SNP that accounts for 0.1% of traitvariance at 80% power at a genome-wide significance threshold of p ≤ 5 × 10⁻⁸ anda minor allele frequency of 0.20. According to these results, the female and the maleGWASs were sufficiently powered to detect genome-wide significant loci with70,700 females and 85,261 males. With these parameters, the female GWAS had apower of 99.8% and the male GWAS of 99.9%.
GWASs on body composition traits in the UK Biobank. The continuous bodycomposition traits—BF%, FM, FFM and BMI—were measured using the validatedbioelectrical impedance analyser Tanita BC-418 MA (Tanita Corporation,Arlington Height, IL) at every assessment centre61,62 for every participant acrossthe UK. We applied trait-specific medication and illness filtering to exclude par-ticipants with compromised hydration status and medications or illnesses knownto affect body composition to identify genetic variation associated with bodycomposition phenotypes that is not confounded by illnesses and their downstreameffects or metabolism-changing medication. We applied stringent exclusion criteriaand covaried for addictive behaviour-related phenotypes, including smoking andalcohol consumption (for exclusion criteria, see Supplementary Table 2). Weregressed the body composition traits on factors related to assessment centre,genotyping batch, smoking status, alcohol consumption, menopause and con-tinuous measures of age, and socioeconomic status (SES) measured by theTownsend Deprivation Index63 as independent variables. We took the residualsfrom these regressions as our phenotypes for the GWASs. We included 7,794,483SNPs and insertion–deletion variants (hereafter referred to as SNPs) with a minorallele frequency >1%, imputation quality scores >0.8, and that were genotyped, orpresent in the HRC reference panel64 and used an additive model on the imputeddosage data provided by UK Biobank, using BGENIE v1.265. We accounted forunderlying population stratification by including the first six principal components,calculated on the genotypes of our European subsample using FlashPCA266. Weperformed GWASs including incremental numbers of principal components andchecked each GWAS for inflation by calculating its LDSC intercept. We identifiedsix principal components as the optimal number to adjust for population stratifi-cation within the European subsample and to not overcorrect the analysis retainingthe greatest signal. Additionally, we included assessment centre as a covariate toadjust for population stratification. We then meta-analysed the sex-specific GWASsusing METAL67 (URLs) applying an inverse variance-weighted model with a fixedeffect, to obtain sex-combined results.
Clumping and genome-wide significant loci. Significantly associated SNPs (p <5 × 10⁻⁸) were considered as potential index SNPs. SNPs in LD (r2 > 0.2) with amore strongly associated SNP within 3000 kb were assigned to the same locus usingFUMA (URLs)68. Overlapping clumps were merged with a second clumpingprocedure in FUMA, merging all lead SNPs with r2= 0.1 to genomic loci. Afterclumping, independent genome-wide significant loci (5 × 10⁻⁸) were comparedwith entries in the NHGRI-EBI GWAS catalogue69, using FUMA68.
Heritability estimation and investigation of sex differences. To ensure therobustness of our results, we applied multiple approaches to calculate heritabilityestimates and genetic correlations. We used BOLT-LMM70, LDSC11 and GREML71
implemented in GCTA72 to calculate common variant h2SNP (URLs). Additionally,we calculated the genetic correlation between females and males using LDSC11 andHaseman–Elston regression38 implemented in GCTA72 to estimate sex differencesin the genetic architecture of the body composition, glycaemic traits and physicalactivity. Haseman–Elston regression uses the cross-product of phenotypes forpairwise individuals and a genetic relatedness matrix to calculate heritability andgenetic correlations73. All other statistics were calculated in R 3.4.1 if not otherwisestated (URLs).
GWASs of psychiatric disorders and behavioural traits. All of the followingtraits were used for the sex-specific and age-dependent analyses (SupplementaryData 1). The sex-specific summary statistics for the psychiatric disorders, includingmajor depressive disorder27, schizophrenia3, anorexia nervosa25, bipolardisorder74,75, ADHD26,76, alcohol dependence77, autism spectrum disorder78 andPTSD79, were provided by the PGC (URLs), for OCD80,81 by InternationalObsessive Compulsive Disorder Foundation Genetics Collaborative (IOCDF-GC)and OCD Collaborative Genetics Association Studies (OCGAS), for borderlinepersonality disorder82 by the German Borderline Genomics Consortium, forcannabis use by the International Cannabis Consortium83, for anxiety84 by ourown group, for insomnia85 by the Complex Trait Genetics group at VU UniversityAmsterdam (URLs), for heavy smoking86 by University of Leicester available fromthe UK Biobank (URLs), for the behavioural traits years of education87 by theSocial Science Genetic Association Consortium (SSGAC) (URLs), for neuroticism41
by our own group (Supplementary Data 1) and for migraine88,89 by InternationalHeadache Genetics Consortium (IHGC). Glycaemic traits’90 summary statisticswere provided by the Meta-Analyses of Glucose and Insulin-related traits Con-sortium (MAGIC), whereas childhood obesity91 results were provided by the EarlyGrowth Genetics (EGG, URLs) Consortium, BMI in young adulthood by Graffet al.92 and physical activity by our group41.
Genetic correlations. Using an analytic extension of LDSC11, we calculated SNP-based bivariate genetic correlations (rg) to examine the genetic overlap of bodycomposition and glycaemic traits with psychiatric and behavioural traits and dis-orders in a sex-specific manner. Differences in genetic correlations were calculatedand their s.e.’s were calculated using a block jackknife approach as previouslydescribed41.
NATURE COMMUNICATIONS | https://doi.org/10.1038/s41467-019-13544-0 ARTICLE
NATURE COMMUNICATIONS | (2019) 10:5765 | https://doi.org/10.1038/s41467-019-13544-0 |www.nature.com/naturecommunications 9

Generalized summary data-based Mendelian randomization. We investigatedputative causal bidirectional relationships between these traits using GSMR37.Mendelian randomization is a method that uses genetic variants as instrumentalvariables, which are expected to be independent of confounding factors, to test forcausative associations between an exposure and an outcome93. Mendelian rando-mization can be used to infer credible causal associations when randomized-controlled trials are not feasible or are unethical93. GSMR performs a multi-SNPMendelian randomization analysis using summary statistics. Let z be a geneticvariant (e.g. SNP), x be the exposure (e.g. psychiatric disorder) and y be theoutcome (e.g. body composition trait). First, GSMR is based on the premise thatseveral nearly independent SNPs (z) are associated with the exposure (x). Second, itassumes that the exposure (x) has an causal effect on y. If both assumptions holdtrue, the SNPs that are associated with the exposure (x) will exert an effect on theoutcome (y) via the exposure (x). If in this instance no pleiotropy is present, theestimate (bxy) at any of the SNPs that are associated with the exposure (x) shouldbe highly similar, because each effect of all SNPs on the outcome (y) will bemediated through the exposure (x). With the help of a generalized least squares(GLS) model, the estimates of bxy of each SNP that is associated with the exposure(x) can be combined, resulting in higher statistical power37,94. The GSMR methodessentially implements summary data-based Mendelian randomization analysis foreach SNP instrument individually, and integrates the bxy estimates of all the SNPinstruments by GLS, accounting for the sampling variance in both bzx and byz foreach SNP and the LD among SNPs. We used individual-level genotype data from asubsample of the anorexia nervosa GWAS to approximate the underlying LDstructure to account for LD between the variants in the multi-SNP instrument.Pleiotropy is an important potential confounding factor that could bias the esti-mate and often results in an inflated test statistic in Mendelian randomizationanalysis. We also removed potentially pleiotropic SNPs (i.e. SNPs that have effectson both risk factor and outcome) from this analysis using the heterogeneity independent instruments outlier method37,95 that detects pleiotropic SNPs at whichthe estimates of bxy are significantly different from expected under a causal model.The power of detecting a pleiotropic SNP depends on the sample sizes of theGWAS data sets and the deviation of bxy estimated at the pleiotropic SNP from thecausal model. Based on this, the overall bxy can be estimated from all the instru-ments remaining using a GLS approach that takes the LD between the variants andthe correlations between their effect sizes into account by modelling them in acovariance matrix. Additionally, GSMR uses the intercept of the bivariate LD scoreregression to account for potential sample overlap between the GWASs used asinstruments for the exposure or outcome12. Estimates with binary exposures wereconverted to the liability scale40. Some of these analyses are exploratory because afew utilised GWASs were underpowered (i.e. did not detect ≥10 genome-widesignificant independent loci at a p value level of 5 × 10⁻⁸) and we therefore loweredthe p value threshold for inclusion, in order to include at least 10 independent SNPinstruments as previously recommended37.
Correction for multiple testing. We calculated the number of independent traitsby matrix decomposition (i.e. number of principal components accounting for99.5% of variance explained) and adjusted our p value threshold accordingly. Thefirst matrix of the main analysis contained all 17 psychiatric traits, all four bodycomposition traits, physical activity and childhood obesity (Supplementary Data 2).All sex-specific correlations were entered when available. The second matrixcomprised all 17 psychiatric traits and all glycaemic traits listed in SupplementaryData 6, including their sex-specific correlations. The family-wise Bonferroni-cor-rected p value threshold for the main analysis, including the genetic correlationswith body composition traits and physical activity, was pBonferroni= 0.05/190=2.6 × 10−4 and the family-wise p value threshold for the genetic correlations withglycaemic traits was pBonferroni= 0.05/231= 2.2 × 10⁻⁴.
URLs. For METAL, see http://csg.sph.umich.edu/abecasis/metal/; for FUMA, seehttp://fuma.ctglab.nl/; for SSGAC, see https://www.thessgac.org/; for ComplexTraits Genetics lab, see https://ctg.cncr.nl; for International Headache GeneticsConsortium, see http://www.headachegenetics.org/; for the MAGIC, see https://www.magicinvestigators.org/; for UK Biobank, see https://www.ukbiobank.ac.uk/;for the PTSD working group of the Psychiatric Genomics Consortium, see https://pgc-ptsd.com/; for the Psychiatric Genomics Consortium, see http://www.med.unc.edu/pgc; for the R project, see https://www.r-project.org/; for the EGG Consortium,see https://egg-consortium.org/.
Reporting summary. Further information on research design is available inthe Nature Research Reporting Summary linked to this article.
Data availabilitySupplementary Data 1 contains all information on data availability, including downloadlinks for summary statistics. Summary statistics for the body composition GWASs areavailable at www.topherhuebel.com/GWAS and the GWAS catalogue (www.ebi.ac.uk/gwas/). All sex-combined summary statistics for the psychiatric disorders are available atwww.med.unc.edu/pgc/results-and-downloads/ and for glycaemic traits at https://www.magicinvestigators.org/. Sex-specific summary statistics of the psychiatric disorders canbe requested from each working group of the Psychiatric Genomics Consortium by
submitting a secondary analysis proposal. The data that support the findings of this studyare available from UK Biobank (www.ukbiobank.ac.uk). Restrictions apply to theavailability of these data, which were used under license for the current study (Project ID:27546). Data are available for bona fide researchers upon application to the UK Biobank.
Code availabilityAnalysis code can be accessed on github.com/topherhuebel/ukbgwas. Software can beaccessed for BGENIE, at https://jmarchini.org/bgenie/; for BOLT-LMM v2.3.2, at https://data.broadinstitute.org/alkesgroup/BOLT-LMM/; for LDSC, at v1 https://github.com/bulik/ldsc; for METAL, at http://csg.sph.umich.edu/abecasis/metal/; for, at R 3.4 https://www.r-project.org/; for GSMR, at https://cnsgenomics.com/software/gcta/
Received: 5 April 2019; Accepted: 8 November 2019;
References1. Geschwind, D. H. Evolving views of human genetic variation and its
relationship to neurologic and psychiatric disease. Handb. Clin. Neurol. 147,37–42 (2018).
2. Polderman, T. J. C. et al. Meta-analysis of the heritability of human traitsbased on fifty years of twin studies. Nat. Genet. 47, 702–709 (2015).
3. Schizophrenia Working Group of the Psychiatric Genomics Consortium. et al.Biological insights from 108 schizophrenia-associated genetic loci. Nature 511,421–427 (2014).
4. Howard, D. M. et al. Genome-wide meta-analysis of depression identifies 102independent variants and highlights the importance of the prefrontal brainregions. Nat. Neurosci. https://doi.org/10.1038/s41593-018-0326-7 (2019).
5. Visscher, P. M. et al. 10 Years of GWAS discovery: biology, function, andtranslation. Am. J. Hum. Genet. 101, 5–22 (2017).
6. Breen, G. et al. Translating genome-wide association findings into newtherapeutics for psychiatry. Nat. Neurosci. 19, 1392–1396 (2016).
7. Gaspar, H. A. & Breen, G. Drug enrichment and discovery from schizophreniagenome-wide association results: an analysis and visualisation approach. Sci.Rep. 7, 12460 (2017).
8. Gaspar, H. A. et al. Using genetic drug-target networks to develop new drughypotheses for major depressive disorder. Transl. Psychiatry 9, 117 (2019).
9. Maier, R. M., Visscher, P. M., Robinson, M. R. & Wray, N. R. Embracingpolygenicity: a review of methods and tools for psychiatric genetics research.Psychol. Med. 48, 1–19 (2017).
10. Sullivan, P. F. et al. Psychiatric genomics: an update and an agenda. Am. J.Psychiatry 175, 15–27 (2018).
11. Bulik-Sullivan, B. K. et al. LD Score regression distinguishes confoundingfrom polygenicity in genome-wide association studies. Nat. Genet. 47,291–295 (2015).
12. Bulik-Sullivan, B. K. et al. An atlas of genetic correlations across humandiseases and traits. Nat. Genet. 47, 1236–1241 (2015).
13. Brainstorm Consortium et al. Analysis of shared heritability in commondisorders of the brain. Science 360, https://doi.org/10.1126/science.aap8757(2018).
14. Selzam, S., Coleman, J. R. I., Caspi, A., Moffitt, T. E. & Plomin, R. Apolygenic p factor for major psychiatric disorders. Transl. Psychiatry 8, 205(2018).
15. Pettersson, E., Larsson, H. & Lichtenstein, P. Common psychiatric disordersshare the same genetic origin: a multivariate sibling study of the Swedishpopulation. Mol. Psychiatry 21, 717–721 (2016).
16. Grotzinger, A. D. et al. Genomic structural equation modelling providesinsights into the multivariate genetic architecture of complex traits. Nat. Hum.Behav. 1, 513–525 (2019).
17. Kahl, K. G., Deuschle, M., Stubbs, B. & Schweiger, U. Visceral adipose tissue inpatients with severe mental illness. Horm. Mol. Biol. Clin. Investig. 33, 1–7(2018).
18. Schaumberg, K. et al. The science behind the academy for eating disorders’nine truths about eating disorders. Eur. Eat. Disord. Rev. 25, 432–450 (2017).
19. Correll, C. U. et al. Prevalence, incidence and mortality from cardiovasculardisease in patients with pooled and specific severe mental illness: a large-scalemeta-analysis of 3,211,768 patients and 113,383,368 controls. WorldPsychiatry 16, 163–180 (2017).
20. Tarnoki, A. D. et al. Bioimpedance analysis of body composition in aninternational twin cohort. Obes. Res. Clin. Pract. 8, e201–98 (2014).
21. Schousboe, K. et al. Twin study of genetic and environmental influences onadult body size, shape, and composition. Int. J. Obes. Relat. Metab. Disord. 28,39–48 (2004).
22. Finucane, H. K. et al. Heritability enrichment of specifically expressed genesidentifies disease-relevant tissues and cell types. Nat. Genet. 50, 621–629(2018).
ARTICLE NATURE COMMUNICATIONS | https://doi.org/10.1038/s41467-019-13544-0
10 NATURE COMMUNICATIONS | (2019) 10:5765 | https://doi.org/10.1038/s41467-019-13544-0 | www.nature.com/naturecommunications
23. Ikeda, M. et al. Re-evaluating classical body type theories: genetic correlationbetween psychiatric disorders and body mass index. Psychol. Med. 48,1745–1748 (2018).
24. Duncan, L. et al. Significant locus and metabolic genetic correlations revealedin genome-wide association study of anorexia nervosa. Am. J. Psychiatry 174,850–858 (2017).
25. Watson, H. J. et al. Anorexia nervosa genome-wide association study identifieseight loci and implicates metabo-psychiatric origins. Nat. Genet. 51,1207–1214 (2019).
26. Demontis, D. et al. Discovery of the first genome-wide significant risk loci forattention deficit/hyperactivity disorder. Nat. Genet. 51, 63–75 (2019).
27. Wray, N. R. et al. Genome-wide association analyses identify 44 risk variantsand refine the genetic architecture of major depression. Nat. Genet. 50,668–681 (2018).
28. Kelly, T., Yang, W., Chen, C.-S., Reynolds, K. & He, J. Global burden ofobesity in 2005 and projections to 2030. Int. J. Obes. 32, 1431–1437 (2008).
29. Mauvais-Jarvis, F. Sex differences in metabolic homeostasis, diabetes, andobesity. Biol. Sex. Differ. 6, 14 (2015).
30. Yao, S. et al. Familial liability for eating disorders and suicide attempts:evidence from a population registry in Sweden. JAMA Psychiatry 73, 284–291(2016).
31. Fernandez-Pujals, A. M. et al. Epidemiology and heritability of majordepressive disorder, stratified by age of onset, sex, and illness course inGeneration Scotland: Scottish Family Health Study (GS:SFHS). PLoS ONE 10,e0142197 (2015).
32. Bandelow, B. & Michaelis, S. Epidemiology of anxiety disorders in the 21stcentury. Dial. Clin. Neurosci. 17, 327–335 (2015).
33. Fayyad, J. et al. The descriptive epidemiology of DSM-IV Adult ADHD in theWorld Health Organization World Mental Health Surveys. Atten. Defic.Hyperact. Disord. 9, 47–65 (2017).
34. Loomes, R., Hull, L. & Mandy, W. P. L. What is the male-to-female ratio inautism spectrum disorder? A systematic review and meta-analysis. J. Am.Acad. Child Adolesc. Psychiatry 56, 466–474 (2017).
35. Papathanasiou, A., Nolen-Doerr, E., Farr, O. & Mantzoros, C. S. GeoffreyHarris Prize 2018: novel pathways regulating neuroendocrine function, energyhomeostasis and metabolism in humans. Eur. J. Endocrinol. https://doi.org/10.1530/EJE-18-0847 (2018).
36. McCarthy, M. M., Nugent, B. M. & Lenz, K. M. Neuroimmunology andneuroepigenetics in the establishment of sex differences in the brain. Nat. Rev.Neurosci. https://doi.org/10.1038/nrn.2017.61 (2017).
37. Zhu, Z. et al. Causal associations between risk factors and common diseasesinferred from GWAS summary data. Nat. Commun. 9, 224 (2018).
38. Yang, J., Zeng, J., Goddard, M. E., Wray, N. R. & Visscher, P. M. Concepts,estimation and interpretation of SNP-based heritability. Nat. Genet. 49,1304–1310 (2017).
39. Nyholt, D. R. A simple correction for multiple testing for single-nucleotidepolymorphisms in linkage disequilibrium with each other. Am. J. Hum. Genet.74, 765–769 (2004).
40. Byrne, E. M. et al. Conditional GWAS analysis identifies putative disorder-specific SNPs for psychiatric disorders. bioRxiv https://doi.org/10.1101/592899 (2019).
41. Hübel, C. et al. Genomics of body fat percentage may contribute to sex bias inanorexia nervosa. Am. J. Med. Genet. B. https://doi.org/10.1002/ajmg.b.32709(2018).
42. Manu, P. et al. Weight gain and obesity in schizophrenia: epidemiology,pathobiology, and management. Acta Psychiatr. Scand. 132, 97–108 (2015).
43. Raben, A. T. et al. The complex relationship between antipsychotic-inducedweight gain and therapeutic benefits: a systematic review and implications fortreatment. Front. Neurosci. 11, 741 (2017).
44. Hermann, S. et al. The association of education with body mass index andwaist circumference in the EPIC-PANACEA study. BMC Public Health 11,169 (2011).
45. Helgeland, Ø. et al. Genome-wide association study reveals a dynamic role ofcommon genetic variation in infant and early childhood growth. bioRxivhttps://doi.org/10.1101/478255 (2018).
46. Kendler, K. S., Gardner, C. O. & Lichtenstein, P. A developmental twin studyof symptoms of anxiety and depression: evidence for genetic innovation andattenuation. Psychol. Med. 38, 1567–1575 (2008).
47. Cortese, S. et al. Association between ADHD and obesity: a systematic reviewand meta-analysis. Am. J. Psychiatry 173, 34–43 (2016).
48. Chen, Q. et al. Shared familial risk factors between attention-deficit/hyperactivity disorder and overweight/obesity—a population-based familialcoaggregation study in Sweden. J. Child Psychol. Psychiatry 58, 711–718(2017).
49. Quesada, D., Ahmed, N. U., Fennie, K. P., Gollub, E. L. & Ibrahimou, B. Areview: associations between attention-deficit/hyperactivity disorder, physicalactivity, medication use, eating behaviors and obesity in children andadolescents. Arch. Psychiatr. Nurs. 32, 495–504 (2018).
50. Graziano, P. A. et al. Co-occurring weight problems among children withattention deficit/hyperactivity disorder: the role of executive functioning. Int.J. Obes. 36, 567 (2011).
51. Cournot, M. et al. Relation between body mass index and cognitive function inhealthy middle-aged men and women. Neurology 67, 1208–1214 (2006).
52. Khalife, N. et al. Childhood attention-deficit/hyperactivity disorder symptomsare risk factors for obesity and physical inactivity in adolescence. J. Am. Acad.Child Adolesc. Psychiatry 53, 425–436 (2014).
53. Kleinridders, A., Ferris, H. A., Cai, W. & Kahn, C. R. Insulin action in brainregulates systemic metabolism and brain function. Diabetes 63, 2232–2243(2014).
54. Schuch, F. B. et al. Exercise improves physical and psychological quality of lifein people with depression: a meta-analysis including the evaluation of controlgroup response. Psychiatry Res. 241, 47–54 (2016).
55. Silventoinen, K. et al. Genetic and environmental effects on body mass indexfrom infancy to the onset of adulthood: an individual-based pooled analysis of45 twin cohorts participating in the COllaborative project of Development ofAnthropometrical measures in Twins (CODATwins) study. Am. J. Clin. Nutr.104, 371–379 (2016).
56. Silventoinen, K. et al. Differences in genetic and environmental variation inadult BMI by sex, age, time period, and region: an individual-based pooledanalysis of 40 twin cohorts. Am. J. Clin. Nutr. 106, 457–466 (2017).
57. Warren, H. R. et al. Genome-wide association analysis identifies novel bloodpressure loci and offers biological insights into cardiovascular risk. Nat. Genet.49, 403–415 (2017).
58. Allen, N. E., Sudlow, C., Peakman, T., Collins, R. & Biobank, U. K. UKbiobank data: come and get it. Sci. Transl. Med. 6, 224ed4 (2014).
59. Sudlow, C. et al. UK biobank: an open access resource for identifying thecauses of a wide range of complex diseases of middle and old age. PLoS Med.12, e1001779 (2015).
60. Purcell, S., Cherny, S. S. & Sham, P. C. Genetic Power Calculator: design oflinkage and association genetic mapping studies of complex traits.Bioinformatics 19, 149–150 (2003).
61. Kyle, U. G. et al. Bioelectrical impedance analysis—part I: review of principlesand methods. Clin. Nutr. 23, 1226–1243 (2004).
62. Lu, Y. et al. New loci for body fat percentage reveal link between adiposity andcardiometabolic disease risk. Nat. Commun. 7, 10495 (2016).
63. Townsend, P. Deprivation. J. Soc. Policy 16, 125 (1987).64. McCarthy, S. et al. A reference panel of 64,976 haplotypes for genotype
imputation. Nat. Genet. 48, 1279–1283 (2016).65. Bycroft, C. et al. The UK Biobank resource with deep phenotyping and
genomic data. Nature 562, 203–209 (2018).66. Abraham, G., Qiu, Y. & Inouye, M. FlashPCA2: principal component analysis
of Biobank-scale genotype datasets. Bioinformatics 33, 2776–2778 (2017).67. Willer, C. J., Li, Y. & Abecasis, G. R. METAL: fast and efficient meta-analysis
of genomewide association scans. Bioinformatics 26, 2190–2191 (2010).68. Watanabe, K., Taskesen, E., van Bochoven, A. & Posthuma, D. Functional
mapping and annotation of genetic associations with FUMA. Nat. Commun.8, 1826 (2017).
69. MacArthur, J. et al. The new NHGRI-EBI Catalog of published genome-wideassociation studies (GWAS Catalog). Nucleic Acids Res. 45, D896–D901(2017).
70. Loh, P.-R., Kichaev, G., Gazal, S., Schoech, A. P. & Price, A. L. Mixed-modelassociation for biobank-scale datasets. Nat. Genet. 50, 906–908 (2018).
71. Yang, J., Lee, S. H., Wray, N. R., Goddard, M. E. & Visscher, P. M. GCTA-GREML accounts for linkage disequilibrium when estimating geneticvariance from genome-wide SNPs. Proc. Natl Acad. Sci. USA 113,E4579–E4580 (2016).
72. Yang, J., Lee, S. H., Goddard, M. E. & Visscher, P. M. GCTA: a tool forgenome-wide complex trait analysis. Am. J. Hum. Genet. 88, 76–82 (2011).
73. Chen, G.-B. Estimating heritability of complex traits from genome-wideassociation studies using IBS-based Haseman–Elston regression. Front. Genet.5, 107 (2014).
74. Psychiatric GWAS Consortium Bipolar Disorder Working Group. Large-scalegenome-wide association analysis of bipolar disorder identifies a newsusceptibility locus near ODZ4. Nat. Genet. 43, 977–983 (2011).
75. Stahl, E. A. et al. Genome-wide association study identifies 30 loci associatedwith bipolar disorder. Nat. Genet. 51, 793–803 (2019).
76. Martin, J. et al. A genetic investigation of sex bias in the prevalence ofattention-deficit/hyperactivity disorder. Biol. Psychiatry. https://doi.org/10.1016/j.biopsych.2017.11.026 (2017).
77. Walters, R. K. et al. Transancestral GWAS of alcohol dependence revealscommon genetic underpinnings with psychiatric disorders. Nat. Neurosci. 21,1656–1669 (2018).
78. Autism Spectrum Disorders Working Group of The Psychiatric GenomicsConsortium. Meta-analysis of GWAS of over 16,000 individuals with autismspectrum disorder highlights a novel locus at 10q24.32 and a significantoverlap with schizophrenia. Mol. Autism 8, 21 (2017).
NATURE COMMUNICATIONS | https://doi.org/10.1038/s41467-019-13544-0 ARTICLE
NATURE COMMUNICATIONS | (2019) 10:5765 | https://doi.org/10.1038/s41467-019-13544-0 |www.nature.com/naturecommunications 11
79. Duncan, L. E. et al. Largest GWAS of PTSD (N = 20 070) yields geneticoverlap with schizophrenia and sex differences in heritability. Mol. Psychiatry.https://doi.org/10.1038/mp.2017.77 (2017).
80. Mattheisen, M. et al. Genome-wide association study in obsessive-compulsivedisorder: results from the OCGAS. Mol. Psychiatry 20, 337–344 (2015).
81. Khramtsova, E. A. et al. Sex differences in the genetic architecture ofobsessive-compulsive disorder. Am. J. Med. Genet. B. https://doi.org/10.1002/ajmg.b.32687 (2018).
82. Witt, S. H. et al. Genome-wide association study of borderline personalitydisorder reveals genetic overlap with bipolar disorder, major depression andschizophrenia. Transl. Psychiatry 7, e1155 (2017).
83. Stringer, S. et al. Genome-wide association study of lifetime cannabis usebased on a large meta-analytic sample of 32 330 subjects from theInternational Cannabis Consortium. Transl. Psychiatry 6, e769 (2016).
84. Purves, K. L. et al. The common genetic architecture of anxiety disorders. Mol.Psychiatry (2019). https://doi.org/10.1038/s41380-019-0559-1.
85. Hammerschlag, A. R. et al. Genome-wide association analysis of insomniacomplaints identifies risk genes and genetic overlap with psychiatric andmetabolic traits. Nat. Genet. https://doi.org/10.1038/ng.3888 (2017).
86. Wain, L. V. et al. Novel insights into the genetics of smoking behaviour,lung function, and chronic obstructive pulmonary disease (UK BiLEVE):a genetic association study in UK Biobank. Lancet Respir. Med. 3, 769–781(2015).
87. Okbay, A. et al. Genome-wide association study identifies 74 loci associatedwith educational attainment. Nature 533, 539–542 (2016).
88. Gormley, P. et al. Meta-analysis of 375,000 individuals identifies38 susceptibility loci for migraine. Nat. Genet. 48, 856–866 (2016).
89. Anttila, V. et al. Genome-wide meta-analysis identifies new susceptibility locifor migraine. Nat. Genet. 45, 912–917 (2013).
90. Dupuis, J. et al. New genetic loci implicated in fasting glucose homeostasis andtheir impact on type 2 diabetes risk. Nat. Genet. 42, 105–116 (2010).
91. Bradfield, J. P. et al. A genome-wide association meta-analysis identifies newchildhood obesity loci. Nat. Genet. 44, 526–531 (2012).
92. Graff, M. et al. Genome-wide analysis of BMI in adolescents and young adultsreveals additional insight into the effects of genetic loci over the life course.Hum. Mol. Genet. 22, 3597–3607 (2013).
93. Davey Smith, G. & Ebrahim, S. ‘Mendelian randomization’: can geneticepidemiology contribute to understanding environmental determinants ofdisease? Int. J. Epidemiol. 32, 1–22 (2003).
94. Wooldridge, J. M. Introductory Econometrics: A Modern Approach (NelsonEducation, 2015).
95. Zhu, Z. et al. Integration of summary data from GWAS and eQTL studiespredicts complex trait gene targets. Nat. Genet. 48, 481–487 (2016).
AcknowledgementsThis study represents independent research part funded by the UK National Institute forHealth Research (NIHR) Biomedical Research Centre at South London and MaudsleyNHS Foundation Trust and King’s College London. The views expressed are those of theauthor(s) and not necessarily those of the UK NHS, the NIHR or the Department ofHealth and Social Care. High-performance computing facilities were funded with capitalequipment grants from the GSTT Charity (TR130505) and Maudsley Charity (980).Research reported in this publication was supported by the USA National Institute ofMental Health of the National Institutes of Health (NIMH) under Award Number U01MH109514, U01 MH109528, U01 MH109514 and U01 MH109536. The PGC SubstanceUse Disorders group acknowledges support from MH109532. The content is solely theresponsibility of the authors and does not necessarily represent the official views of theNational Institutes of Health. Prof. Bulik acknowledges funding from the SwedishResearch Council (VR Dnr: 538-2013-8864) and the Klarman Family Foundation (theAnorexia Nervosa Genetics Initiative is an initiative of the Klarman Family Foundation).Profs. Bulik and Micali are supported by NIMH R21 MH115397. PFO receives funding
from the UK Medical Research Council (MR/N015746/1) and the Wellcome Trust(109863/Z/15/Z). Dr. Graff acknowledges funding from the National Institutes of Health(R01HD057194). Dr. Workalemahu acknowledges funding by the Intramural ResearchProgramme of the Eunice Kennedy Shriver National Institute of Child Health andHuman Development, National Institutes of Health. Dr. Prokopenko was funded by theEuropean Union’s Horizon 2020 research, and innovation programme (LONGITOOLS,H2020-SC1-2019-874739; DYNAhealth, H2020-PHC-2014-633595); and the WellcomeTrust (WT205915). Data on glycaemic traits have been contributed by MAGIC inves-tigators and have been downloaded from www.magicinvestigators.org. Data on thechildhood BMI trait has been contributed by the EGG Consortium and has beendownloaded from www.egg-consortium.org. This study was completed as part ofapproved UK Biobank study application 27546 to Dr. Breen. Open access fundingprovided by Karolinska Institute.
Authors contributionsC.H., C.M.B. and G.B. designed research; C.H., H.A.G., J.R.I.C., K.B.H., K.P., I.P., M.G.,J.S.N. and T.W. provided essential materials; C.H., H.A.G., J.R.I.C., K.B.H. and K.P.analysed data or performed statistical analysis; C.H., H.A.G., J.R.I.C. and G.B. wrotepaper; C.H. and G.B. had primary responsibility for final content. All authors read andapproved the final manuscript.
Competing interestsDr. Breen has received grant funding from and served as a consultant to Eli Lilly, hasreceived honoraria from Illumina and has served on advisory boards for Otsuka.Dr. Bulik is a grant recipient from and has served on advisory boards for Shire. Shereceives royalties from Pearson. All interests are unrelated to this work. Dr. Coleman,Dr. Gaspar, Ms. Purves, Dr. Hübel, Dr. Hanscombe, Dr. Prokopenko, Dr. Graff,Dr. Ngwa, Dr. Workalemahu and Dr. O'Reilly declare no competing interests.
Additional informationSupplementary information is available for this paper at https://doi.org/10.1038/s41467-019-13544-0.
Correspondence and requests for materials should be addressed to C.H.
Peer review information Nature Communications thanks Ryan Bogdan, Oleksandr Freiand Xiong-Jian Luo for their contribution to the peer review of this work. Peer reviewerreports are available.
Reprints and permission information is available at http://www.nature.com/reprints
Publisher’s note Springer Nature remains neutral with regard to jurisdictional claims inpublished maps and institutional affiliations.
Open Access This article is licensed under a Creative CommonsAttribution 4.0 International License, which permits use, sharing,
adaptation, distribution and reproduction in any medium or format, as long as you giveappropriate credit to the original author(s) and the source, provide a link to the CreativeCommons license, and indicate if changes were made. The images or other third partymaterial in this article are included in the article’s Creative Commons license, unlessindicated otherwise in a credit line to the material. If material is not included in thearticle’s Creative Commons license and your intended use is not permitted by statutoryregulation or exceeds the permitted use, you will need to obtain permission directly fromthe copyright holder. To view a copy of this license, visit http://creativecommons.org/licenses/by/4.0/.
© The Author(s) 2019
ARTICLE NATURE COMMUNICATIONS | https://doi.org/10.1038/s41467-019-13544-0
12 NATURE COMMUNICATIONS | (2019) 10:5765 | https://doi.org/10.1038/s41467-019-13544-0 | www.nature.com/naturecommunications