The genetic structure of northeastern populations of ... - CORE
Upload
khangminh22Category
view
0download
0
Genetic comparison of trumpeter swan populations (Olor buccinator)by Victoria Ann Barrett
A thesis submitted in partial fulfillment of the requirements for the degree of MASTER OF SCIENCEin ZoologyMontana State University© Copyright by Victoria Ann Barrett (1980)
Abstract:Three populations of trumpeter swans (Olor buccinator) (Alaska, Grande Prairie, Red Rock) werecompared by starch-gel electrophoresis at 20 presumptive genetic loci. No significant differences werefound among the populations in terms of mean heterozygosity (H) or occurrence of rare alleles.Trumpeter swans have a low level of genetic variability compared to other vertebrate groups in general,a finding similar to that of other avian taxa.
STATEMENT OF PERMISSION TO COPY
In presenting this thesis in partial fulfillment of the require
ments for an advanced degree at Montana State University, I agree that
the Library shall make it.freely available for inspection. I further
agree that permission for extensive copying of this thesis for scholarly
purposes may be granted, by my major professor, or, in his absence, by
the Director of Libraries. It is understood that any copying or publi
cation of this thesis for financial gain shall not be allowed without
my written permission.
Signature
DateT T / ‘ ~
GENETIC COMPARISON OF TRUMPETER SWAN
POPULATIONS (OUJR BJCCJNAiCfR)
by
VICTORIA ANN BARRETT
A thesis submitted in partial fulfillment of the requirements for the degree
of
MASTER OF SCIENCE
in
Zoology
Approved:
Graduate Dean
MONTANA STATE UNIVERSITY Bozeman, Montana
April, 1980
iii
ACKNOWLEDGMENTS
I gratefully acknowledge the assistance of the following people
and agencies in the collection of trumpeter swan samples: G. Bucaria,
U . S . Forest Service, Alaska; W. Gossweiler and W. Quirk, U . S . Army,
Alaska; G. Holton, University of Calgary, Alberta; W. Ladd, J . King,
and R. King, U. S . Fish and Wildlife Service, Alaska; B. Turner and P.
Pryor, Canadian Wildlife Service Alberta;. Dr. W. J . L. Sladen, Johns
Hopkins University, Maryland; R . Sjostrom, Red Rock Lakes Refuge, Mon
tana. This research was funded by the United States Fish and Wildlife
Service.
The assistance and encouragement of Dr. E . R. Vyse was invalu
able during my study. Thanks also to Dr. D . G. Cameron for his con
structive review of this manuscript.
iv
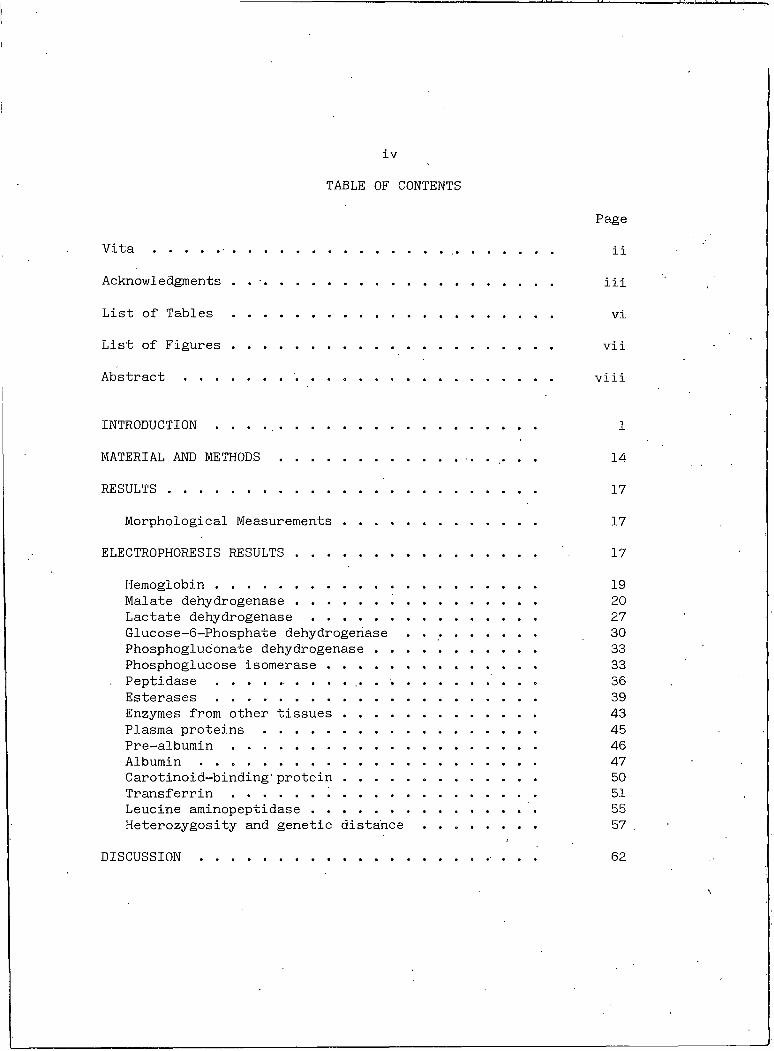
TABLE OF CONTENTS
V i t a ........
Acknowledgments
List of Tables
List of Figures
Abstract . . .
ii
iii
vi
vii
viii
Page
INTRODUCTION ........................................... I
MATERIAL AND METHODS ............................. 14
RESULTS................................................ 17
Morphological Measurements . . ..................... 17
ELECTROPHORESIS RESULTS ............................... 17
Hemoglobin.......................................... 19Malate dehydrogenase ............................... 20Lactate dehydrogenase ............................. 27Glucose-6-Phosphate dehydrogenase . ............... 30Phosphogluconate dehydrogenase ..................... 33Phosphoglucose isomerase ............... . ........ 33Peptidase .......... 36E s t e r a s e s .......................................... 39Enzymes from other tissues ......................... 43Plasma proteins .................................... 45Pre-albumin........................................ 46A l b u m i n ............................................ 47Carotinoid-binding' protein.......... 50Transferrin........................................ 51Leucine aminopeptidase ................... . . . . . 55Heterozygosity and genetic distance .............. 57 .
DISCUSSION 62
TABLE OF CONTENTS (Con't)Page
APPENDICES . . . . ......................'.............. 74
Appendix A ................................. . . . . . 75Appendix B .......................................... 78Appendix C ......................... 81Appendix D .......................................... 83
V
LITERATURE CITED 88

LIST OF TABLES
Table I. TAXONOMIC CLASSIFICATION OF SWANS................ 11
Table 2. MORPHOLOGICAL MEASUREMENT OF ADULT TRUMPETER SWAN. • 18
Table 3. ALLELE FREQUENCIES . 59
Table 4. CASTLE-HARDY-WEINBERG............................. 60
Table 5. MEAN HETEROZYGOSITY AND SAMPLING VARIANCE........ 61
Table 6. ESTIMATES OF HETEROZYGOSITY................. . . . 65
Table 7. GENETIC IDENTITIES (I) AMONG DIFFERENT TAXONOMICLEVELS OF BIRDS............................... 70
Table 8. GENETIC IDENTITIES (I) BETWEEN DIFFERENTTAXONOMIC LEVELS OF ANIMALS....................... 71
vi
Page
vii
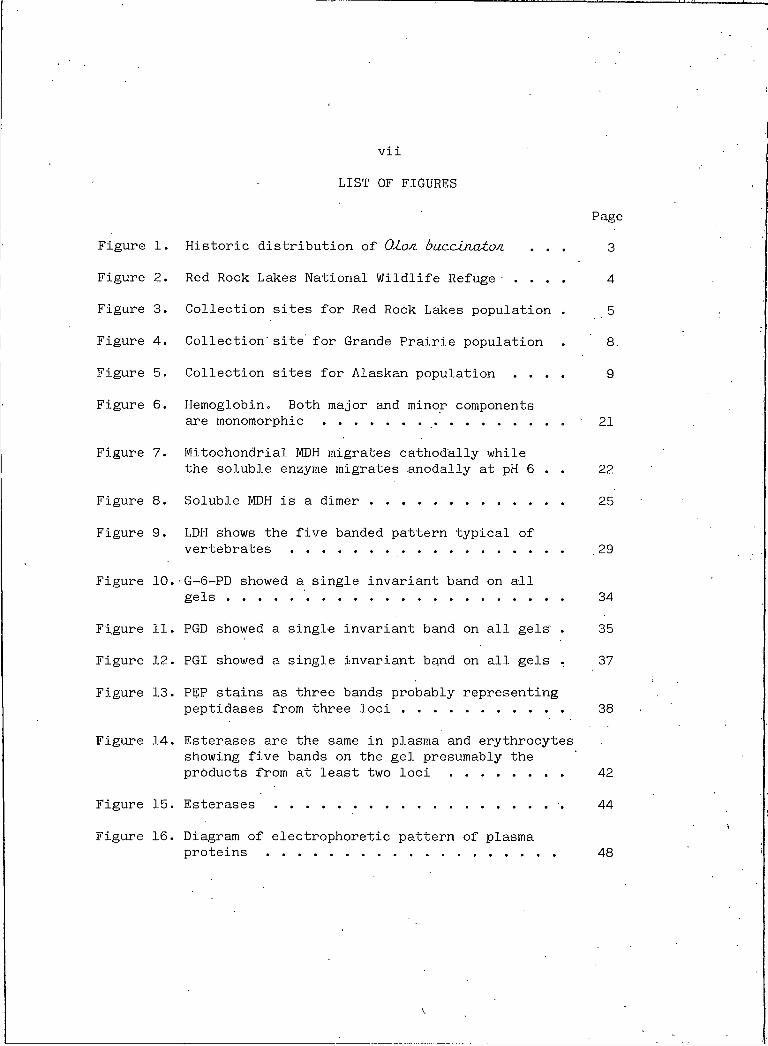
LIST OF FIGURES
Figure I. Historic distribution of O Lon. buacJjiatoA . . . 3
Figure 2. Red Rock Lakes National Wildlife Refuge . . . . 4
Figure 3. Collection sites for Red Rock Lakes population . 5
Figure 4. Collection site for Grande Prairie population . 8.
Figure 5. Collection sites for Alaskan population . . . . 9
Figure 6. Hemoglobin. Both major and minor componentsare monomorphic ................................ 21
Figure 7. Mitochondrial MDH migrates cathodalIy whilethe soluble enzyme migrates anodally at pH 6 . . 22
Figure 8. Soluble MDH is a dimer......................... 25
Figure 9. LDH shows the five banded pattern typical ofvertebrates.................................... .29
Figure 10. G-6-PD showed a single invariant band on allg e l s ............................................ 34
Figure 11. PGD showed a single invariant band on all gels' . 35
Figure 12. PGI showed a single invariant band on all gels , 37
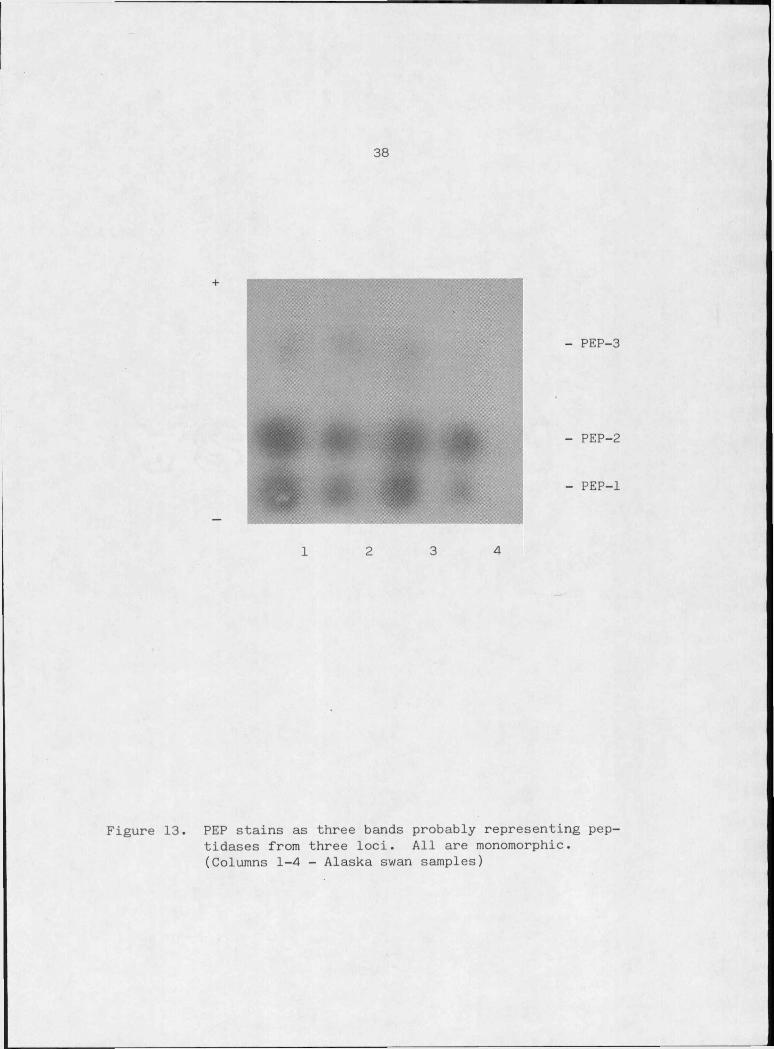
Figure 13. PEP stains as three bands probably representingpeptidases from three l o c i .................. 38
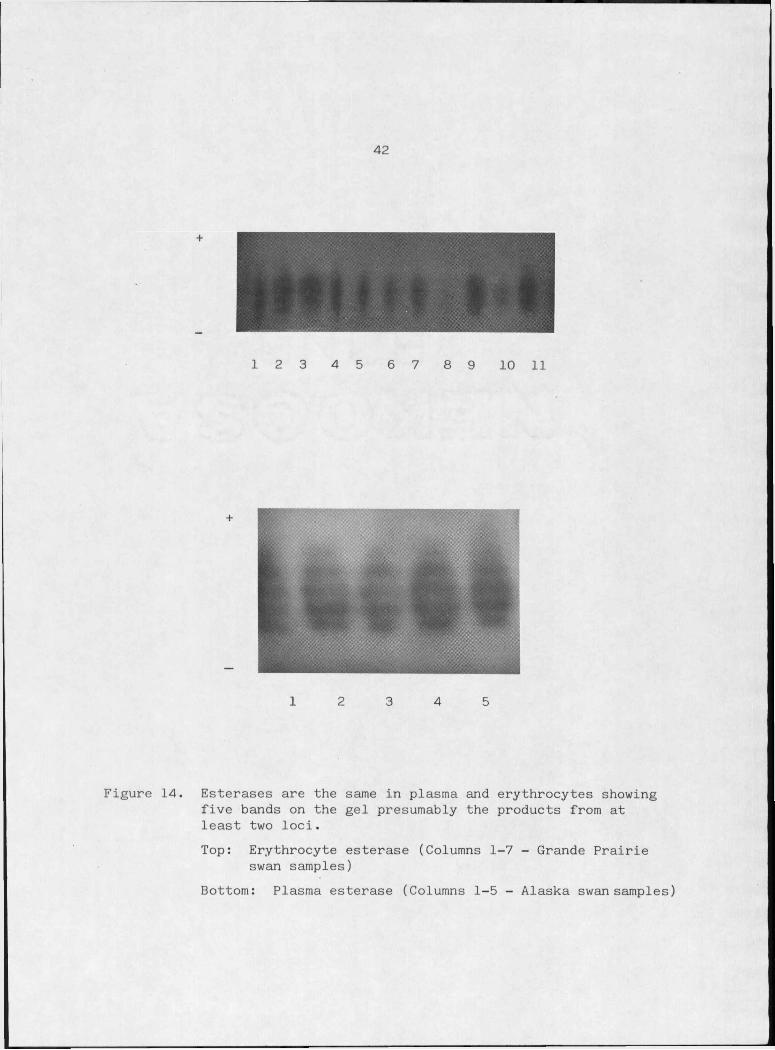
Figure 14. Esterases are the same in plasma and erythrocytes showing five bands on the gel presumably the products from at least two l o c i ............... 42
Figure 15. E s t e r a s e s .................................... 44
Figure 16. Diagram of electrophoretic pattern of plasmap r o t e i n s ...................................... 48
\
Page
viii
ABSTRACT
Three populations of trumpeter swans {O*lo/i buc.cJjiatoA.) (Alaska, Grande Prairie, Red Rock) were compared by starch-gel electrophoresis at 20 presumptive genetic loci. No significant differences were found among the populations in terms of mean heterozygosity (H) or occurrence of rare alleles. Trumpeter swans have a low level of genetic variability compared to other vertebrate groups in general, a finding similar to that of other avian taxa.

INTRODUCTION
Populations are the basic units of evolution harboring a wealth
of genetic variation (Hubby and Lewontin, 1966). Any change in the gene
pool associated with this variation is the mechanism by which evolution
proceeds. Speciation, the cladogenic process in which one species splits
into two or more species (Ayala Q± aM, 1974) is an important event which
has led to the great diversity of life. The definition of the biologi
cal species as a reproductive unit (Mayr, 1963) means that the genetic
diversity accumulated by an individual or a population is accessible to
all descendents of the species, but not to any other species. Thus dif- ■
ferences in the genetic variation among groups of organisms can be in
dicative of species classification.
Ayala cU. (1974) have discussed speciation in sexually reproduc
ing organisms as primarily a two stage process involving geographic iso
lation. First, allopatric populations develop genetic differences pri
marily as a result of-adaptation to different sets of environmental
conditions. Populations separated, with little or no gene flow, develop
genetic variation which may be amplified or maintained by drift and
selection. The second stage of speciation involves subsequent sympatry
of the populations with opportunity for interpopulation matings, the
progeny of which have reduced fitness. Alleles favoring intrapopulation
crosses will then be favored by natural selection enhancing, the genetic
differences between the groups. If species formation continues, the
results will be separate species.
'2
In this study, the amount of genetic variation present within
trumpeter swan populations was examined to determine if the process of
speciation might, be occurring between allopatric populations.
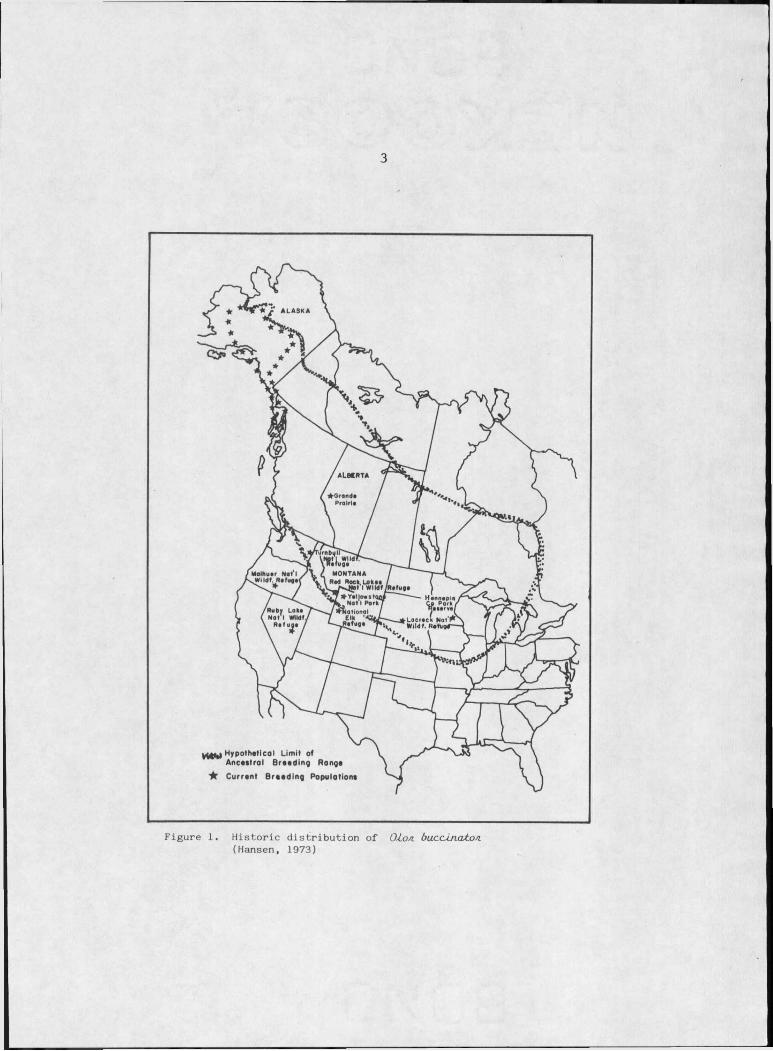
The historic range of the trumpeter swan (O-Lon. buc.cJin.atoa.) ex
tended across most of the North American continent from Alaska south
to wintering grounds along the Gulf of Mexico (Walker, 1968) and east
to Hudson's Bay (Alison, 1975) (Figure I). The expansion of civiliza
tion had disturbed or destroyed trumpeter swan habitat to the extent
that the species was considered to be nearly extinct early in this
century. Today the species is contained in three populations, a large
Alaskan population of about 3,000 birds and 2 remnant populations in
the interior of the continent, one localized around Red Rock Lakes
National Wildlife Refuge and one in the vicinity of Grande Prairie,
Alberta.
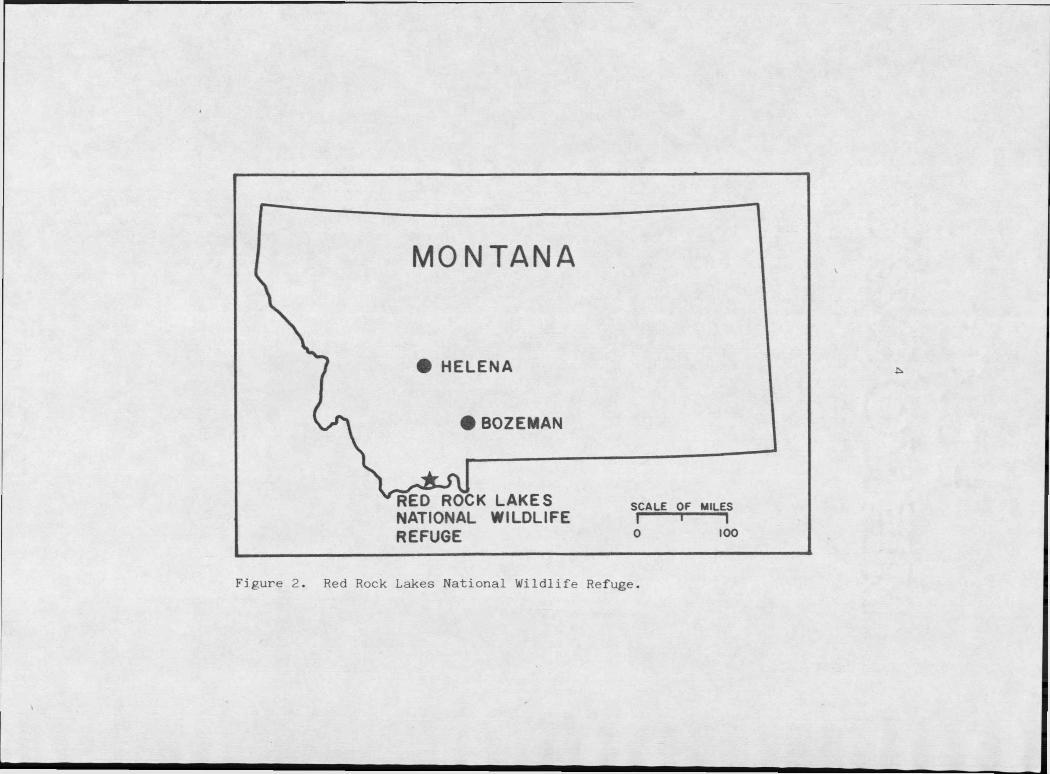
The Red Rock Lakes population was founded by birds existent in
the area (Hansen, 1973) surviving because of the relative isolation of
the Centennial Mountains, a range of the Rocky Mountains in the area
where the states of Montana, Idaho, and Wyoming meet (Figures 2 and 3).
Estimated at 69 birds in 1932 (Hansen, 1973) the population has ex
panded to about 300 birds under the management of the United States
Fish and Wildlife Service who have restricted hunting in the area and
maintained habitat as well as continued a winter, feeding program.
The Refuge was founded in 1935 under the provisions of the 1929
3
yfgm Hypothetical Lim it ofAncestral Breeding Range
'A' Current Breed ing Populations
Figure I. Historic distribution of Q to s i b u c c tn c u to s i (Hansen, 1973)
MONTANA
• HELENA
• BOZEMAN
RED ROCK LAKES NATIONAL WILDLIFE REFUGE
SCALE OF MILES
Figure 2. Red Rock Lakes National Wildlife Refuge.
5
YELLOWSTONE NATIONAL PARK
MONTANA
RED ROCK LAKES -x REFUGEE
Lim e
IDAHO
* COLLECTION SITES
SCALE OF MILES 20 4 WYOMING
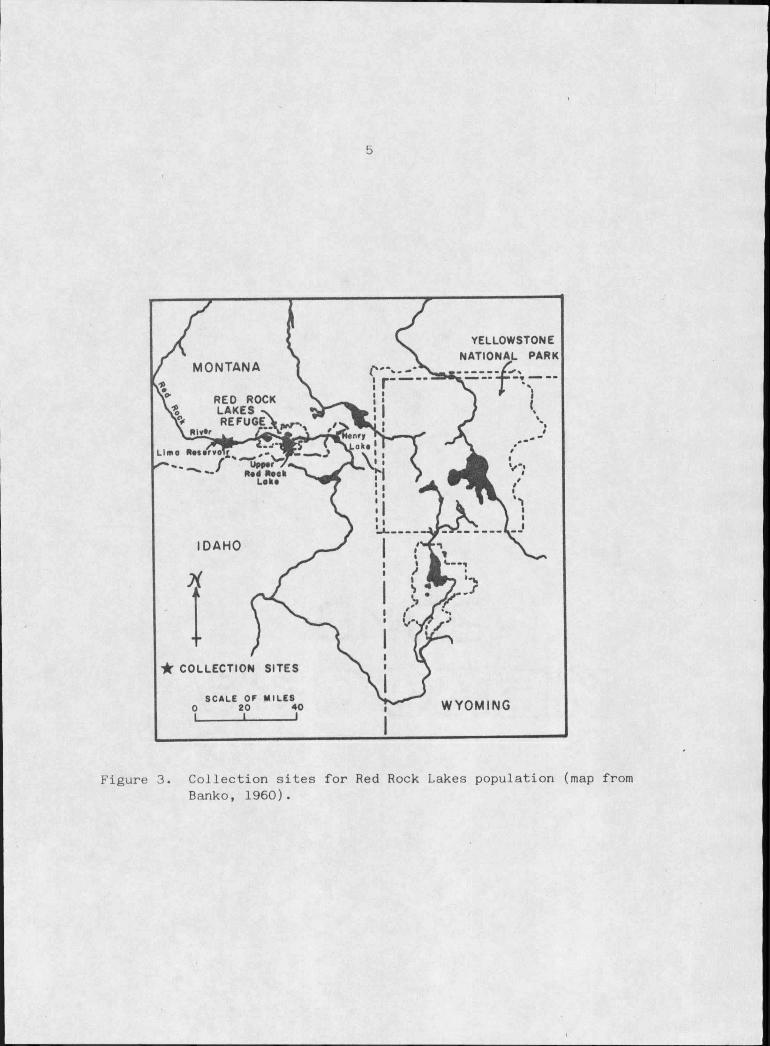
Figure 3 Collection sites for Red Rock Lakes population (map from Banko, 1960).
6
Migratory Bird Act and is primarily dedicated to the preservation of
the trumpeter swan-. The swans at Red Rock have provided the stock,
cygnets and eggs as well as adult birds, for a transplant program which
has been under way since 1938 (Fjetland, 1974). Establishment of breed
ing colonies has been an arduous process, often requiring more than a
decade to achieve success, but today nine wildlife refuges in the west
ern United States have successful transplant colonies of trumpeter swans
(Fjetland, 1974). Transplant success is greatest using cygnets moved
before they can fly (Fjetland, 1974). Red Rock Lakes swans and trans
planted swans do not show seasonal migration. The swans move in winter
only to open waters nearby.
The Red Rock Lakes population is now stable after periods of
rapid growth in the 1940's and 50's. The limiting factor of the popu
lation size appears to be the availability of suitable breeding habitat
(Page, 1976). Winter food is supplemented with grain fed by the Red
Rock Lakes managers, an essential addition required for winter sur
vival (Page, 1976).
Contact between the Red Rock Lakes and Grande Prairie popula
tions occurs at Red Rock Lakes and the surrounding area when the Cana
dian swans migrate south to share wintering grounds. Swans, which are
monogamous, form pair bonds at the wintering grounds like most water-
fowl but limited banding studies have failed to show exchange of indi
viduals between these two populations (R. Shea, pers. comm.).
7
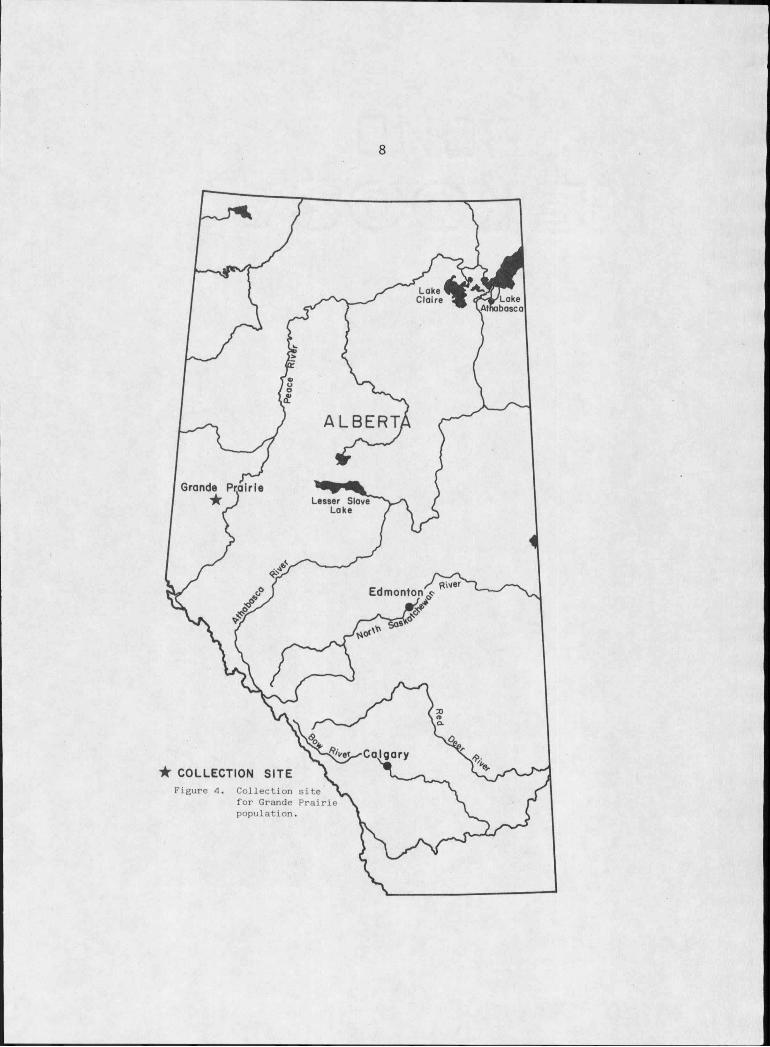
The Grande Prairie population contains some 200 trumpeter swans
breeding in the area of northwestern Alberta and isolated parts of '
Saskatchewan (P. Pryor, pers. comm.) (Figure 4). These birds are
native to the area but represent a remnant population occupying only a
fraction of their former range.'
The preservation of the species was insured by the discovery in
1955 of a large breeding population of trumpeter swans in Alaska in
habiting primarily the area of the Copper River delta, a diverse water-
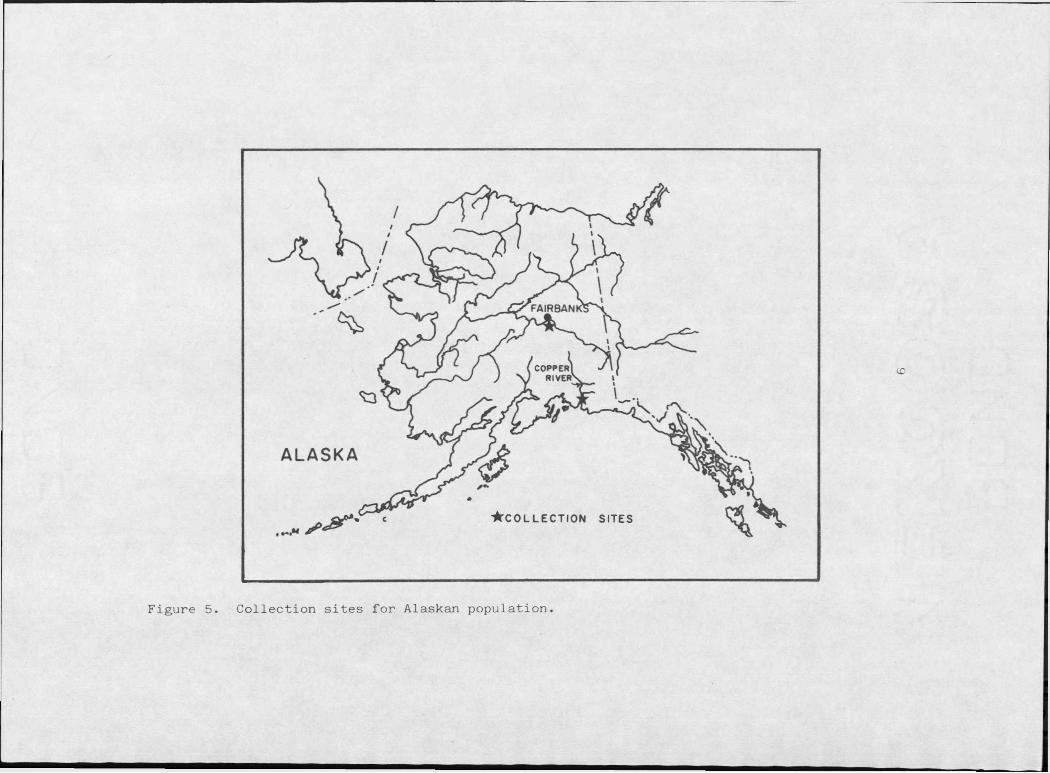
fowl region (Monson, 1956) (Figure 5). The population contains more
than 3,000 swans which breed in Alaska and migrate south along the
coast to British Columbia and Washington. The great distance and impos
ing mountains probably prohibit migration between the Alaskan and the
two interior populations.
Hansen (1973) observed physical differences between the Red Rock
Lakes swans and Alaskan swans, primarily that Alaskan swans were gener
ally larger throughout development beginning with the egg. He sug
gested that these differences might be due to basic genetic differences
and recommended that managers refrain from manipulation of the popula
tions until the foundations of these physical differences were exam- ■
ined.
Genetic variation may be manifest in morphological, cytological
or molecular differences. Classic taxonomy relies on morphological
features of organisms. Based on physical traits and their distinctive
8
Lake 1 Claire Ci/Lake
.Athabasca
ALBERT,
Grande PrairieLesser Slave
Lake
Edmonton^
^W/Calgary★ COLLECTION SITE \
Figure 4. Collection site ' for Grande Prairie population.
FAIRBAN K1
ALASKA
★ c o l l e c t i o n s i t e s
Figure 5. Collection sites for Alaskan population.
10sound trumpeter swans are distinguished from other species of swans ■.«
(Table I). Cytological variation has been studied extensively in
Drosophila (Mayr, 1963) and has been used as an aid to more exact
classification. Since Hubby and Lewontin (1966) demonstrated large
amounts of genetic variation in natural populations, population geneti
cists have delved into variation at the molecular level to help clarify
taxonomic relationships. This information is particularly valuable at
the species level for the definition of species is fundamentally
biological while classification at higher levels is an artificial
construct of man based on convenience (Mayr, 1963).
Biochemical techniques to detect and examine genetic variation
at the molecular level must be traced ultimately to the gene, the
nucleotide sequences of the DNA of the organism. Ideally genetic dif
ferences will be resolved by nucleotide sequencing but until such
techniques are easily available and practical, less direct methods may
be used. Amino acid sequencing is useful because it represents the
product of the nucleotide sequence but it is an expensive and tedious
task.Nonetheless, valuable information on evolution has been garnered
from the sequencing of the polypeptides of hemoglobin (Uzzell and Cor
bin, 1972), and other;proteins especially cytochrome C and triosphos-
phate dehydrogenase (Kimura, 1968).
The practical examination of large numbers of proteins from
even larger numbers of individuals was facilitated by the improvement
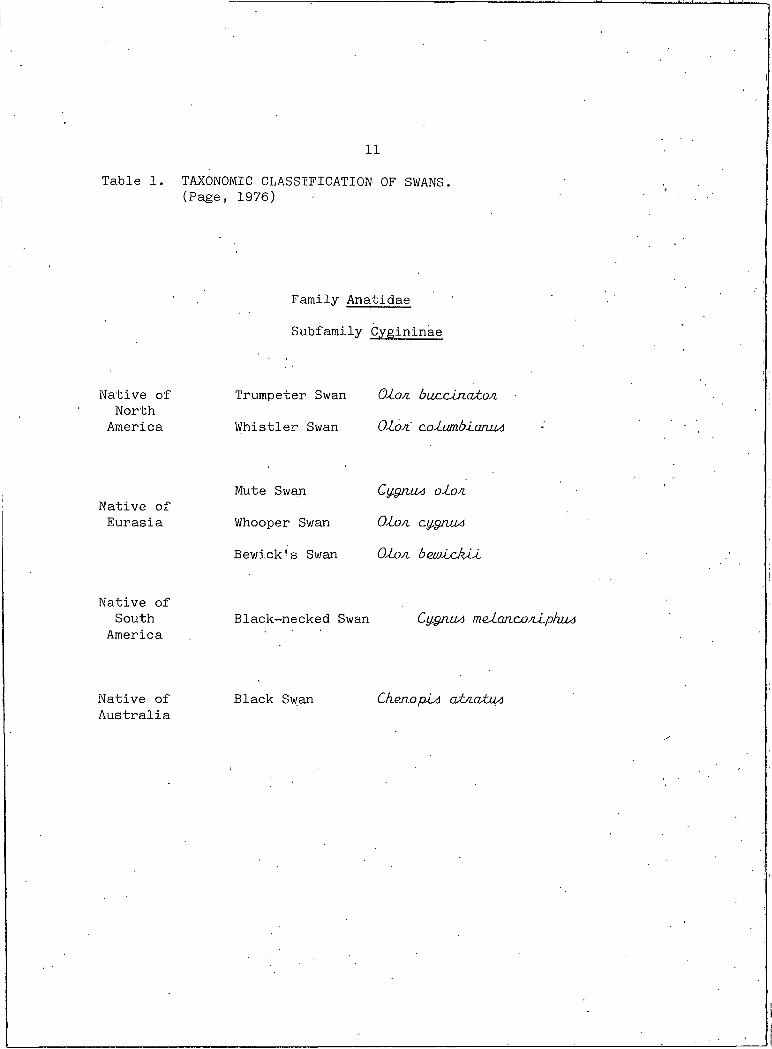
11Table I. TAXONOMIC CLASSIFICATION OF SWANS.
(Page, 1976)
Family Anatidae
Subfamily Cygininae
Native of North
Trumpeter Swan OX.0/1 bucclnaton.
America Whistler Swan O-io/i co.lumbi.an.Uyi
Native ofMute Swan Cy.§nu4 oi.o/i
Eurasia Whooper Swan Olo/i cy.gn.UA
Bewick!s Swan Oi.oa. bowickii
Native ofSouth Black-necked Swan Cygn.uA meianconiphuA
America
Native of Australia
Black Swan CkcnopiA aiyiaiuA
12
of electrophoretic techniques especially development of horizontal
starch gel electrophoresis (Smithies, 1955). Population geneticists
have made use of this relatively inexpensive, convenient biochemical
technique to examine and compare populations at the molecular "1Ievel.
Electrophoresis is possible because proteins carry a net elec
trical charge conferred by i;he component amino acids. Starch gel
electrophoresis uses a partially hydrolyzed potato starch matrix with
variable pH values depending on the buffer system used. Proteins can
be separated both on the basis of their net charge which is influenced
by the background pH and to a lesser extent by the size and conforma
tion of the molecule due to the sieving action of the gel.
Proteins are the products of genes and variation in proteins
can be directly extrapolated to the genome. Electrophoresis has re
vealed protein differences within single individuals and in popula
tions. Isozymes are structurally distinct forms of the the same cata
lytic activity and can be detected by differences in electrophoretic
separation. Allozyme may be a more functional term to describe vari
able forms of the same protein whether it is an enzyme or some other
type of protein. Genetically allozymes are the result of different
alleles present in individuals and populations. If every individual
carries an identical allele for a particular locus, that locus can be
described as monomorphic. But as revealed in early electrophoretic
studies (Smithies, 1955) not all gene products occur in a single form
13
and are thus polymorphic. The existence of allozymes is detectable
evidence of genetic differences among individuals and populations.
Electrophoretic data can be extended to calculate gene frequencies
and to study subunit composition of proteins.
The null hypothesis in this study is that there .are no differ--
ences in the genetic structure of the three populations of trumpeter
swans. To test the hypothesis 13 protein systems assumed to represent
20 genetic loci were examined by electrophoresis and gene frequencies
for each population compared. Major differences in the gene frequencies
could be indicative of the first stage of a spe’ciation process (Ayala
al, 1974) considering the geographic isolation of the Alaskan and
interior populations of trumpeter swans.
14
MATERIAL AND METHODS
Swans were captured on the water with a float-plane, motorboat,.
or airboat during the summer molt of adults and before flight of the
cygnets. In Alaska and at Red Rock Lakes some swans were marked with
color coded plastic neck collars and tarsal bands- in conjunction with
a regional identification program. At all locations swans were banded
with standard U. S. Fish and Wildlife Service or Canadian Wildlife
Service stainless steel lock-on tarsal bands.
Three-five milliliters of blood were drawn from the tarsal vein
using a 22-gauge 1%" needle on a heparinzed syripge. The sample was
immediately transferred to a 5 ml evacuated container (Vacutainer *
Becton and Dickinson) with either sodium citrate or heparin as the
anticoagulant, and the tube placed on ice. While in hand the birds
were' also weighed and sexed and the bill length was measured. Weights
were taken while the bird was suspended in a bag from a hand scale.
The length of the bill from the anterior edge of the nare to the tip
of the nail was measured using calipers or a ruler (Banko, 1960; Han
sen e£ cut, 1971). The swans were all extremely docile upon capture .
and could be easily processed and released with no damage to the bird
and apparently little trauma.
At the end of the day's collecting samples were centrifuged to
separate the cells from the plasma. Cells, with very little lipid
present, were washed once in 0.85% sodium chloride and stored in a
15
glycol-citrate solution, pH 8.4 (VandeBerg and Johnston, 1977). All
samples were frozen and stored at -60° C for several weeks to 8 months.
Horizontal starch gel electrophoresis was performed after
Brewer (1970) and Selander ot clL (1971). Gels were prepared using
12.5% (w/v) hydrolyzed potato starch (Electrostarch or"Sigma Chemical)
cooked in an appropriate buffer (Appendix A). A frame for the gel was
constructed using a 0.5 cm thick glass plate (25 cm x 18 cm) with 1.3
cm thick plexiglass sides to contain the molten gel when poured into
the frame. The gel was cooled for 30-45 minutes and covered with
plastic wrap and refrigerated until the next day.
The gel was slit across the long side 3 cm from the edge. Wicks
of No.3 Watman filter paper were dipped in the sample, blotted to re
move excess fluid and inserted into the gel with space between adjacent
wicks. A wick with the marker dye bromphenol blue was placed at each
of the outer edges. The gel was then secured with rubber bands to
close the slit and placed on electrode trays using disposable cloths
(Handi-Wipes) as electrode sponges. Current across the.gel varied
with the buffer system. The gel was cooled by a pan of ice placed on
top. Wicks were removed after 15-20 minutes and electrophoresis con
tinued until the marker dye had migrated to the anodal end of the gel,
usually in 3-5 hours, depending on the buffer system.
At the end of the run, the gel was cut into 2 mm thick horizontal
slices using a steel blade. Five slices could be made from each gel
16 ’
discarding the top slice because of distortion in the surface. The cut
surface of each gel was stained with a specific histochemical stain
(Appendix B) to identify the enzymes or with a general protein stain
to visualize the plasma proteins. The slices were incubated overnight
at.room temperature and then fixed in methanol-water-acetic acid
(5:5:1). Plasma protein gels had to be destained with the fixer solu
tion until the background appeared pale against the stained proteins.
The zymograms were then scored and photographed. Many gel
slices were wrapped in plastic film and saved in the refrigerator for
comparison with the photographs or to be referred to later.
17
RESULTS
Morphological Measurements
Hansen (1973) observed a size difference between Alaskan trum
peter swans and the swans of Red Rock Lakes. Comparison of the weight
and bill length of adult swans in this study shows no difference in •
' the size of the birds of these two populations (Table 2). Measurements
of Grande Prairie swans are not included in this table because all but
one bird captured there were cygnets.
ELECTROPHORESIS RESULTS
The patterns of proteins on starch gels after electrophoresis
depends on the subunit structure of the molecule. When the subunit
composition is known the results may be interpreted in light of this
information, but when the structure has not been determined by other
methods, electrophoretic data may help to elucidate it. Subunits may
be identical, that is products of the same gene, or coded for by dif
ferent loci. Thus a single invariant band for all individuals may be
the product of one monomorphic locus or may represent several loci with
a common allele (Allendorf ai aL, 1977). The interpretation of the
genetic basis of protein bands on a gel must be made with the considera
tion of the physical and chemical properties of the molecule to infer
the underlying genetic basis.
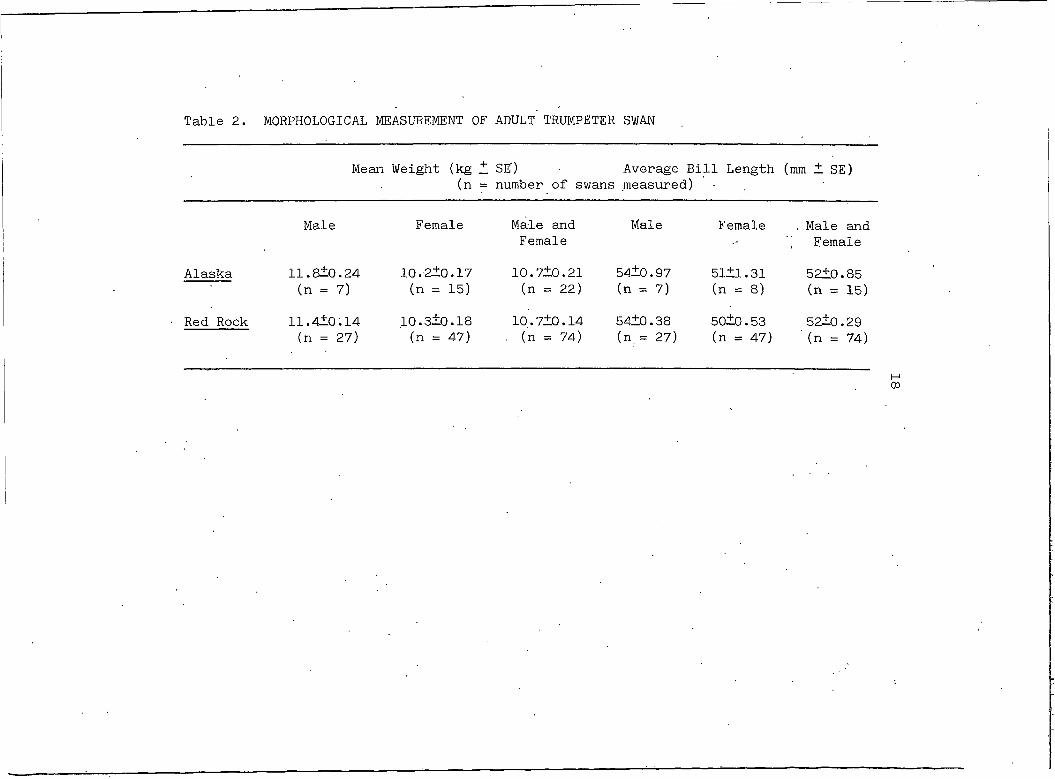
Table 2. MORPHOLOGICAL MEASUREMENT OF ADULT TRUMPETER SWAN
Mean Weight (kg + SE') Average Bill Length (mm ± SE)(n = number of swans measured)
Male Female Male and Female
Male Female . Male and Female
Alaska 11.8±0.24 (n = 7)
10.2+0.17 (n = 15)
10.7+0.21 (n = 22)
54+0.97 (n = 7)
51+1.31 (n = 8)
52+0.85 (n = 15)
Red Rock 11.4+0.14 (n = 27)
10.3+0.18 (n = 47)
10.7+0.14 . (n = 74)
54±0.38 (n = 27)
50+0.53 (n = 47)
52±0.29 '(n = 74)
H
19
Hemoglobin
. Hemoglobin, a tetrameric molecule composed of two types, of sub
units , is the oxygen transport protein in vertebrate blood. Electro
phoresis of trumpeter swan samples shows a major band and a slower,
streaked minor hemoglobin. Examination of chicken {QclUm a qoU m a )
hemoglobin shows that the major (80%) and minor hemoglobins interact
with each other but have different amino acid composition and may not
have a common polypeptide chain (Huisman et. cuL, 1964). Manwell at,
(1966) has found one polypeptide chain to be common to both the major
and minor chicken hemoglobins. The minor hemoglobin is more sensitive
to environmental salt concentrations and is less stable in its binding
with phosphate than the major component which is evidence for different
physical properties (Huisman at, 1964). Penguins, geese, and
pheasants also have distinct major and minor hemoglobins demonstrable
by starch gel electrophoresis (Shaughnessy, 1970; Baker and Hanson,
1966; Baker ei aL, 1966)..
Both adult and juvenile swans were sampled and the hemoglobins
were identical. In chickens and penguins the distinct embryonic hemo
globin gradually declines and has disappeared from the bird by hatching
in the chicken (Huisman and Van Veen, 1964) and by the fledging stage
in the penguin (Shaughnessy, 1970) but embryonic hemoglobin may persist
in small amounts until the IOth week after hatching in the duckling
(Borgese and Bertles, 1965). In the chicken embryonic and adult hemo-
20
globing share a polypeptide chain with the production of adult hemo
globin beginning by day 6 of incubation (Manwell <zt <zZ, 1966).
Baker and Manwell (1975) report spurious variability of avian
hemoglobin as a consequence of binding different amounts of organic
phosphates and Muller (1960) reports aggregation of single chains
which alters electrophoretic mobility. Some non-repeatable variation
is seen in trumpeter swan hemoglobin which is visible at different '
levels within a single gel. Discounting the apparent artifacts which
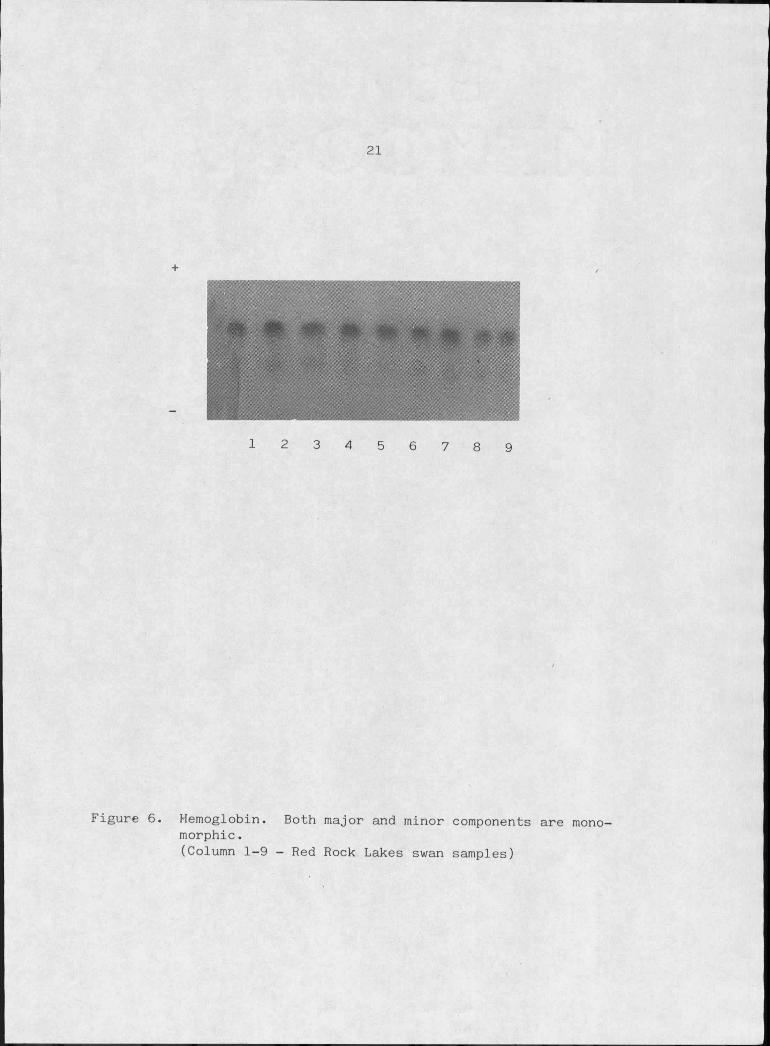
affected virtually all samples, trumpeter swan hemoglobin is monomor-
phic (Figure 6). A great deal of variation has. been identified in
human hemoglobin but many other species possess monomorphic hemoglobins
(Desborbugh and Irwin, 1966, dove; Baker and Hanson, 1966, geese;
Baker clZ, 1966, pheasant; Manwell and Baker, 1969, quail; Smith and
Zimmerman, 1976, blackbirds).
Malate dehydrogenase (MDH 1.1.1.37)
L-malate + NAD oxaloacetate + NADH
The soluble form of this enzyme (s-MDH) is found in all tissues
and may function in several metabolic pathways (Karig and Wilson, 1971).
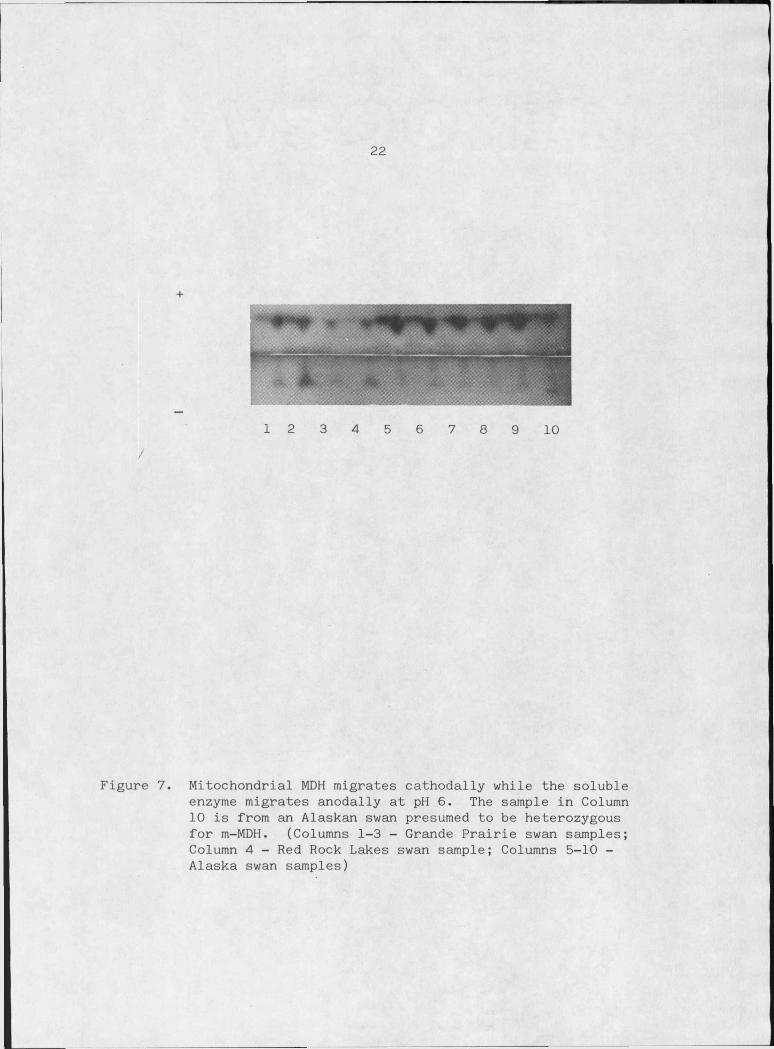
The mitochondrial form (m-MDH) is limited to the tricarboxylic acid
cycle and conventionally- seen in all tissues except mammalian red blood
cells (Harris and Hopkinson, 1976), but it is present in the nucleated
red cells of trumpeter swans (Figure 7). Campbell (1967) has observed
21
1 2 3 4 5 6 7 8 9
Figure 6. Hemoglobin. Both major and minor components are mono- morphic.(Column 1-9 - Red Rock Lakes swan samples)
22
Figure 7. Mitochondrial MDH migrates cathodally while the soluble enzyme migrates anodally at pH 6. The sample in Column 10 is from an Alaskan swan presumed to be heterozygous for m-MDH. (Columns 1-3 - Grande Prairie swan samples; Column 4 - Red Rock Lakes swan sample; Columns 5-10 - Alaska swan samples)
/
mitochondria in mature avian erythrocytes. ' Samples centrifuged (9000xg,
20 minutes) to remove cell debris including mitochondria have lost the
cathodal band of m-MDH when electrophoresed.
Purified forms of the two enzymes show very different amino acid
composition, immunological properties and kinetics (Kitto and Wilson,
1966) and are presumed to be coded by two separate autosomal genes.
Both enzymes are dimeric in man (Harris and Hopkinson, 1976) and in
many reptiles and birds (Karig and Wilson, 1971).
In studies of 100 species of birds Kitto and Wilson (1966) found
s-MDH to be very conservative as measured by electrophoretic mobility
with little interspecific .variation and less intraspecific variation
(Karig and Wilson, 1971), an observation which is interesting in light
of the fact that some birds are products of evolutionary lines separated
for up to 100 million years (Kitto and Wilson, 1966). For species whose
taxonomic relationship is poorly known examination of many proteins by
electrophoresis may help to clarify the situation as Kitto and Wilson
(1966) were able to do so on the basis of the s-MDH electrophoretic
mobility. The order Apodiformes (swifts) has a unique s-MDH (based on
comparison with standard chicken MDH) which demonstrates the unit of
this order. Similar studies were done on Gharadiiformes (shore-birds)
and Galliformes (chicken-like land birds) (Kitto and Wilson, 1966).
Malate dehydrogenase of trumpeter swans showed variation of the
23 ■ ■
24
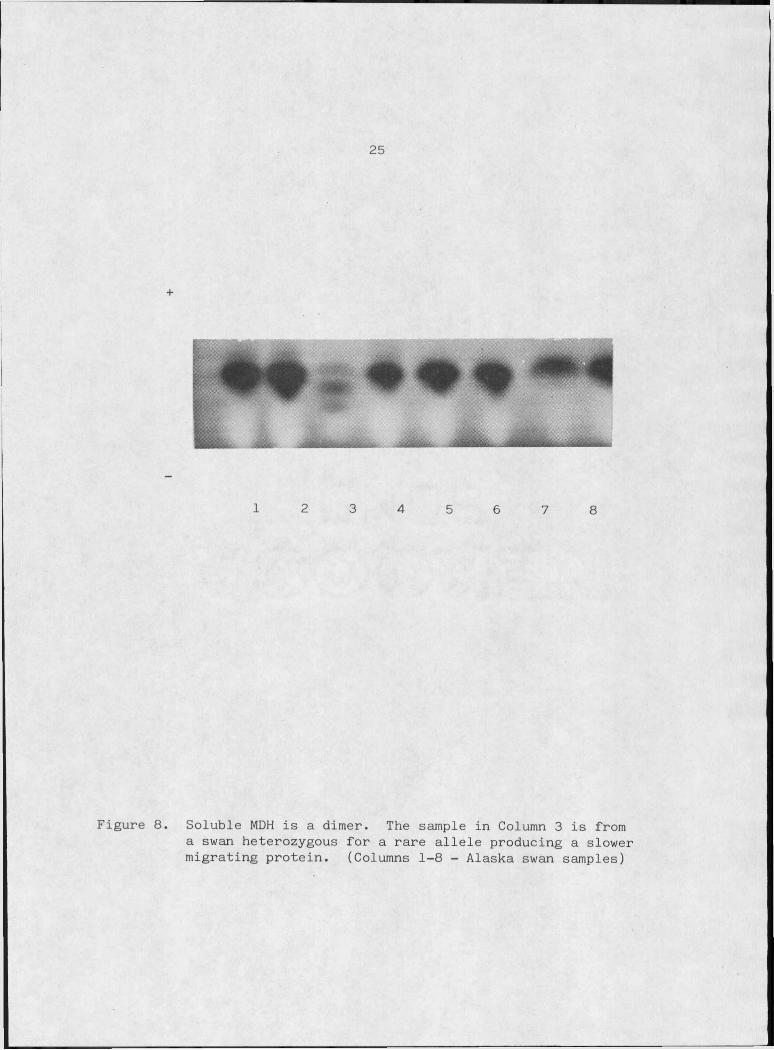
soluble enzyme in only one bird whose zymogram showed the three dis
tinct bands expected from a heterozygote with a dimeric enzyme (Figure
8) .The mitochondrial enzyme is perhaps, less conservative in its
electrophoretic mobility .(Karig and W i l s o n 1971; Kitto and Wilson,
1-966). Several species of animals have shown multiple electrophoretic
forms (Kitto ei at, 1970). Yet there is evidences that much of this
variation is post-translational as opposed to variation in primary
sequence. Porcine m-MDH variants differ little in catalytic activity
and show a single elution peak with chromatography ruling out aggrega
tion products (Kitto e£ at, 1970). Nor do the forms show differences
in amino acid composition in peptide mapping which.indicates two very
similar or identical subunits (Kitto at, 1970). The multiple forms
of chicken m-MDH appear to be conformers (different only in molecular
conformation) (Kitto at at, 1966). The crystalline enzymes show dif
ferences in optical rotation but not catalytic activity (substrate in
hibition or coenzyme reactivity) and some slight differences in immuno
logical reactivity (Kitto at at, 1966). Structurally bound enzymes,
those closely associated with cell membranes are capable of different
stable conformations (Van Thqai and Roche, 1968). Thus the m-MDH may
be in a more stable conformation when bound to the mitochondrion. Pre
cedence for active conformers can be found in mushroom tyrosinase and
penicillinase (Kitto at at, 1966). The screening of. 65 families of
25
+
1 2 3 4 5 6 7 8
Figure 8. Soluble MDH is a dimer. The sample in Column 3 is from a swan heterozygous for a rare allele producing a slower migrating protein. (Columns 1-8 - Alaska swan samples)
26
birds by Kitto. <xl, (1966) supports conformational differences as
the source of variation in ,
Resolution of m-MDH of trumpeter swans was not always clear,
but some slight differences in m-MDH have been seen which are not
generally repeatable and may be considered conformational changes of
the enzyme. Only one sample showed two bands consistently and is con
sidered to be that of a heterozygote with no active heterodimer forma
tion (Figure 7).
Malate serves as a hydrogen carrier between extra- and intra-
mi tochondrial regions mediated by s-MDH and m-MDH (Van Thoai and Roche,
1968). The soluble form has a lower for malate and the mitochon
drial form has a lower for. oxaloacetate to establish an essentially
unidirectional flow of electrons from malate into the mitochondria
where they enter the respiratory chain (Henderson, 1965). Thus dif
ferent forms of the enzyme are specifically suited for their intracel
lular location. Mature red blood cells of mammals are not involved in'
aerobic respiration (Van Thoai and Roche, 1968) and have no use for the
shunt to transfer electrons from the cytoplasm to the mitochondria.
The erythrocytes of birds are nucleated and presumably more metaboli-
cally active as seen by the retention of mitochondria and m-MDH.
27
Lactate dehydrogenase (LDH 1.1.1.27)
L-Iactate + NAD pyruvate + NADH
Lactate dehydrogenase is involved in glycolysis to provide a
source of NAD during transient anaerobiosis. Protists, bacteria, in
vertebrates and vertebrates have a wide range of LDHs which vary in
molecular weight from 70,000-140,000 daltons (Markert ai., 1975).
The LDHs of vertebrates compose an homologous family postulated to
have arisen from a single LDH gene early in vertebrate evolution (Mar-
kert &t al, 1975). Two similar genes, designated A and B , code for the
basic polypeptides which suggests duplication and divergence. The
lamprey has only one A-Iike gene which can be considered to exemplify
an ancestral state (Markert et aM, 1975). The active enzyme of higher
vertebrates is a tetramer resulting from association of subunits from
both genes (Harris and Hopkinson, 1976). The possible tetramers are
observed as five distinct isozymic electrophoretic bands in birds and
mammals. Other•vertebrates have two LDH genes but unrestricted poly
merization of subunits does not always occur (Markert e£ aL, 1975).
A third autosomal locus, LDH-C, exists in most vertebrates pro
ducing the tetrameric enzyme LDH-X of four identical subunits which is
found only in post-pubertal testis tissue and sperm of mammals and
birds (Harris and Hopkinson, 1976; Markert &£ &L, 1975). The LDH-C
subunit is kinetically and.immunologically more closely related to the
LDH-B subunit than to the subunit of LDH-A and C is likely a duplica
28
tion of the B locus ( M a r k e r * . aL, 1975).
If originally identical, as the result- of a gene duplication,
the A and B subunits are now very different but retain homologies
evidenced by interaction of subunits to form active tetramers. On
vJJyio experiments have induced association of subunits even from dif
ferent vertebrate classes which indicates a strong conservation of sub
unit binding sites (Marker* al, 1975). Divergence though is indi
cated by a general lack, of immunological cross reactivity of the A and
B subunits and differences in Kjyf, substrate concentration optima and
binding and elution properties (Marker* et al, 1975).
There is general uniformity among vertebrates in that the A
subunit predominates in white skeletal muscle which may be anaerobic
under stress. Selection has favored increased lactate when pyruvate
increases to allow a quick source, of energy from glycolysis mediated
by the A subunits. The B form has a higher to prevent the formation
of lactate, under most conditions and thus predominates in aerobic tis
sues where pyruvate is more efficiently used in the tricarboxylic acid
cycle (Marker* &£ aO, 1975). This tissue specificity is readily demon
strated in the electrophoretically detectable isozymes.
Five bands can be resolved for LDH in erythrocytes of trumpeter
swans (Figure 9). The B4 enzyme (Baker aO, 1966) stains more
heavily than the other isozymes but no quantitative determination was
done. No genetic variation was detected which is consistent with the
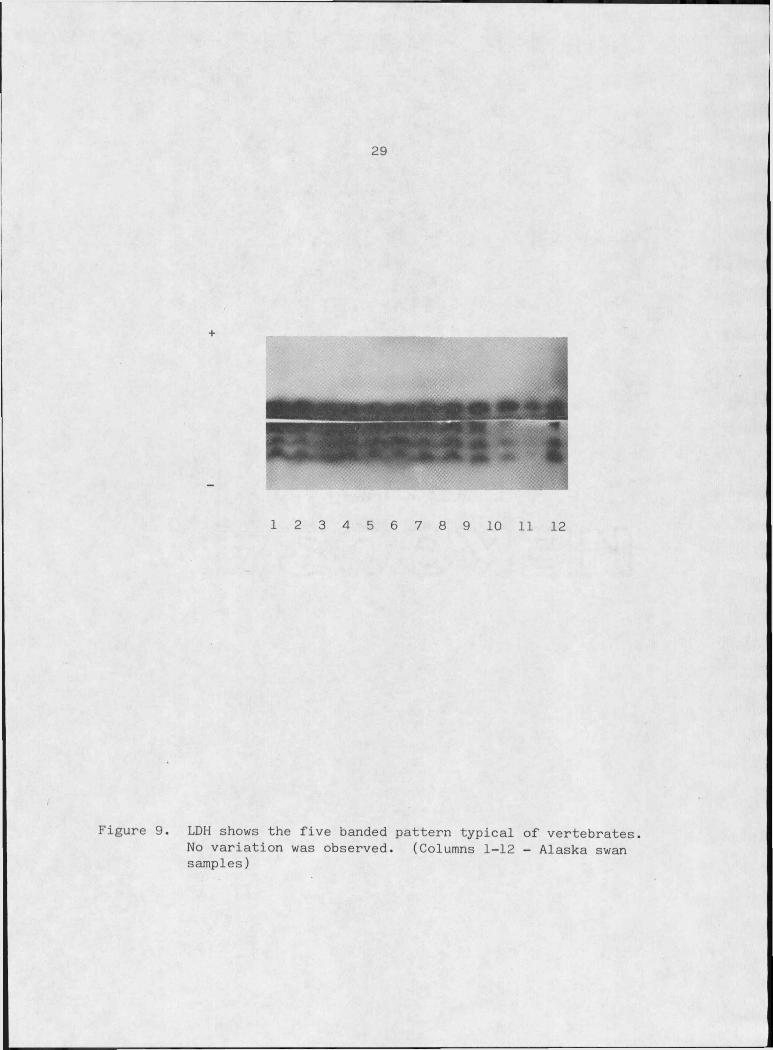
29
Figure 9. LDH shows the five banded pattern typical of vertebrates.No variation was observed. (Columns 1-12 - Alaska swan samples)
30
conservation of this enzyme system.. Variants are rare in man and mouse
but are more common in some poikilotherms (Corbin at at, 1974). Alle
lic variations of LDH-A and LDH-B have been reported in human popula
tions primarily as heterozygotes resulting in a complex pattern of
isozymes dependent on whether it is the A or B locus which is hetero
zygous (Harris and Hopkinson, 1976).
Glucose - 6 - phosphate dehydrogenase (G-6-PD 1.1.1.49)
Glucose-6-Phosphate + NADP 6-Phosphogluconate + NADPH
The subunit structure of G-6-PD has been studied in diverse
groups of animals revealing active dimers and tetramers. The enzyme is
primarily tetrameric in trout and grayling (Lynch and Vyse, 1979; Yamau-
chi and Goldberg, 1975; Yoshida, 1973) possibly reflecting the phe
nomenon of gene duplication in salmonid fishes which has resulted in
two autosomal loci responsible for G-6-PD. Conflicting evidence from
Cederbaum and Yoshida (1976) indicates the enzyme is dimeric and coded
by a single autosomal locus in three species of trout.
Many studies have shown G-6-PD to be dimeric in humans (Harris
and Hopkinson, 1976; Harris, 1975; Bonsignore et at, 1970; Rattazzi,
1968; Beutler and Collins, 1966) as well as in rats (Yoshida, 1975;
Rattazzi, 1968; Beutler and Collins, 1966) and in two species of mice
(Yoshida, 1975; Shaw and Barto, 1965). The locus is X-Iinked in many mammals including man (Harris and Hopkinson, 1976), horse (Mathai et at,

31
1966), hare (Ohno'&£ at, 1965), and mouse (Shaw and Barto, 1965).
Although Beutler and Collins (1966) recognized two closely linked X-
chromosome loci for the dimeric human enzyme.
Several avian species have been shown to have autosomal linkage
of the G-6-PD locus. Erythrocyte G-6-PDs are tet'rameric in pheasants
and chickens and the products of autosomal loci in doves, pheasants
and chickens (Bhatnagar, 1969; Cooper at at, 1969a; Cooper and Irwin,
1968).
The molecular form of the enzyme is likely not static in most
organisms. It has been shown to be dependent on pH (Wrigley at at,
1972) with maximal activity about pH 8.0 (Turner o£. .at, 1975). Yoshida
(1973) has shown the oligomeric form to be dependent on protein concen
tration, ionic strength and pH, with the dimer favored at optimal pH
(8-9) (Bonsignore aJ~, 1971a; Cohen and Rosemeyer, 1969) and the
tetrameric form more stable at lower pH. There may even be an active
mixture of the two forms, dimer and tetramer, with an equilibrium dic
tated by a regulatory enzyme (Bonsignore et aX, 1971b).
The binding of coenzyme, NADP, also has a strong influence on
the molecular form of G-6-PD. Bonsignore at (1970) suggest a struc
tural role for NADP to stablize the enzyme. Their studies have indi- ■
cated that each dimer has two catalytic and one structural.sites for
binding NADP (Bonsignore <z£ at, 1970). Yoshida (1975) and Cohen and
Rosemeyer (1969) recognize the stringent requirement for coenzyme, but
32
both studies revealed only one NADP bound per dimer.. Binding of coen
zyme may alter the conformational state of the enzyme (Turner &t aJL, 1975).
In,addition to genetic variation, G-6-PD has been reported to
show non-genetic variation. The NADPase of erythbcyte stroma may
cause partial inactivation of the enzyme (Turner and Cederbaum, 1975)
which may involve change in the molecular charge and/or shape and be
responsible for the increased anodal migration observed by Hopkinson
(1975) with prolonged storage of tissue or the extract, Turner aL
(1975) suggest that the possibility of post-transcriptional variation
of the enzyme should be considered especially in studies of erythrocyte
G-6-PD as the mature red cells of many organisms are enucleated and
thus show no protein synthesis. Post-transcriptiohal modification of
liver G-6-PD has been shown to be due to NADPH binding (Cederbaum and
Yoshida, 1976).
The' intracellular location of the enzyme may be a factor in non-
genetic variability because conformational changes may be associated
with binding of an enzyme to a membrane. But, G-6-PD is a soluble
enzyme (Stegeman and Yamauchi, 1975) not to be confused with a similar
enzyme with a broader substrate specificity, hexose-6-phosphate dehy
drogenase, which is microsomal (Stegeman and Yamauchi, 1975; Metzger
e± at, 1965). G-6-PD may also complex with hemoglobin causing distor
tion of electrophoretic mobility (Metzger <zt at, 1965) .
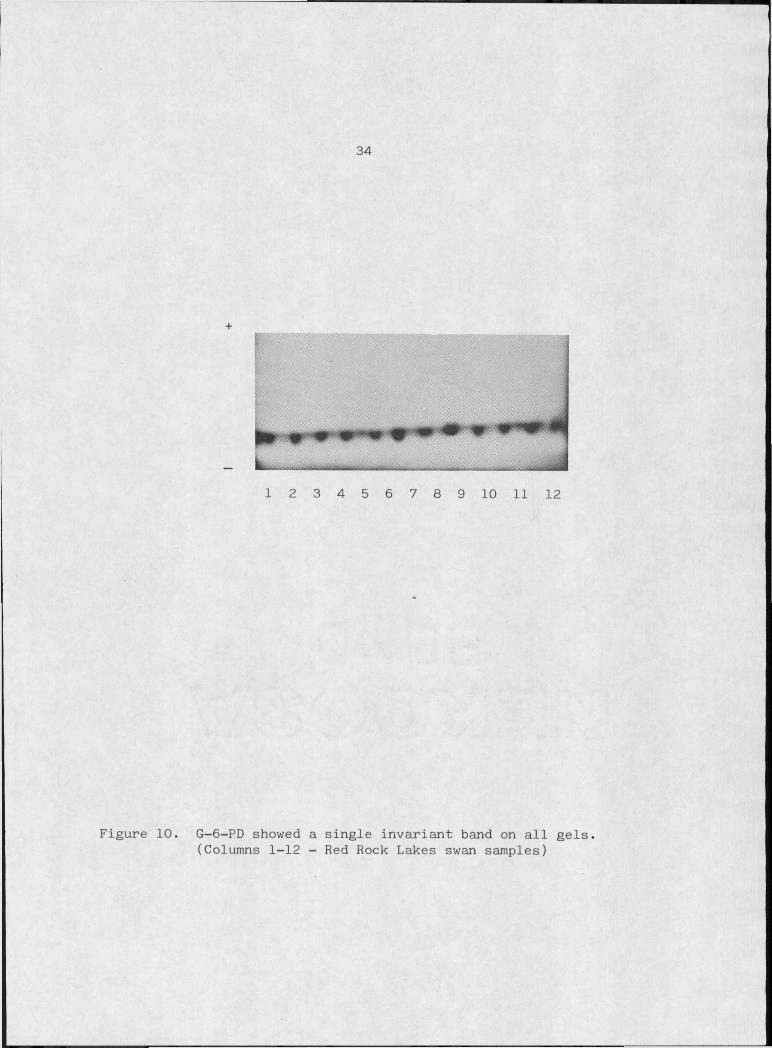
33The staining reaction for trumpeter swan erythrocyte G-6-PD'
after electrophoresis was highly dependent on the presence of NADP,
especially in the gel. Repeated freezing and thawing of the sample
caused moderate to severe degradation of the enzyme so that resolution
on the gel was often difficult. Ignoring variation due to degradation,
all samples showed identical electrophoretic migration (Figure 10).
Phosphogluconate dehydrogenase (PGD 1.1.1.44)
6-phospho-D-gluconate + NADP D-ribulose-5-phosphate +
COg + NADPH
Most vertebrates have a single autosomal locus for PGD found in
all tissues (Ohno et aX, 1968). Japanese quail have at least four
alleles at this locus and the functional enzyme is dimeric (Ohno ei aX,
1968). Pigeons, doves, humans and cats also produce dimeric PGD1s
(Cooper e£ <zL, 1969b; Young, 1966). The trumpeter swans examined for
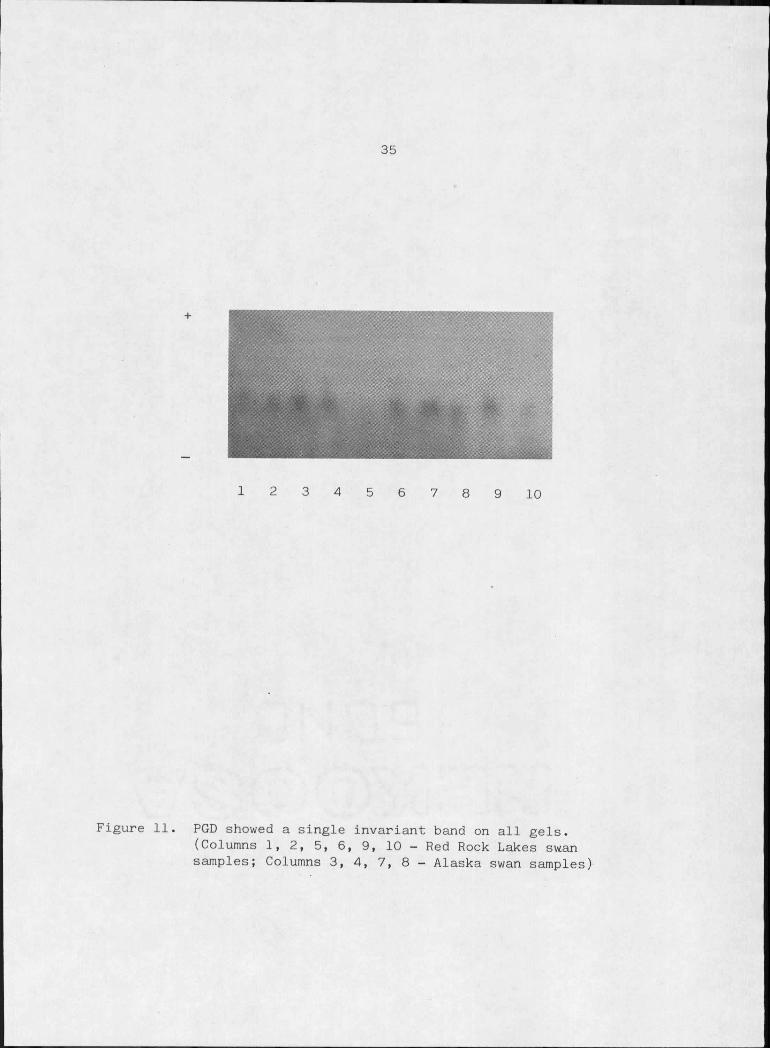
PGD show only one form of this enzyme (Figure 11).
Phosphoglucose isomerase (PGI 5.3.I.9)
Glucose-6-Phosphate + NADP fructose-6-phosphate + NADPH
All tetrapods appear to possess a single PGI locus (Avise,1975).
The enzyme is shown to be dimeric in humans (Ward, 1977; Klebe, 1975)
and in mice (DeLorenzo and Ruddle, 1969). Variation of this enzyme is
34
+
1 2 3 4 5 6 7 8 9 10 11 12
Figure 10. G-6-PD showed a single invariant band on all gels.(Columns 1-12 - Red Rock Lakes swan samples)
35
1 2 3 4 5 6 7 8 9 10
Figure 11. PGD showed a single invariant band on all gels.(Columns I, 2, 5, 6, 9, 1 0 - Red Rock Lakes swansamples; Columns 3, 4, 7, 8 - Alaska swan samples)
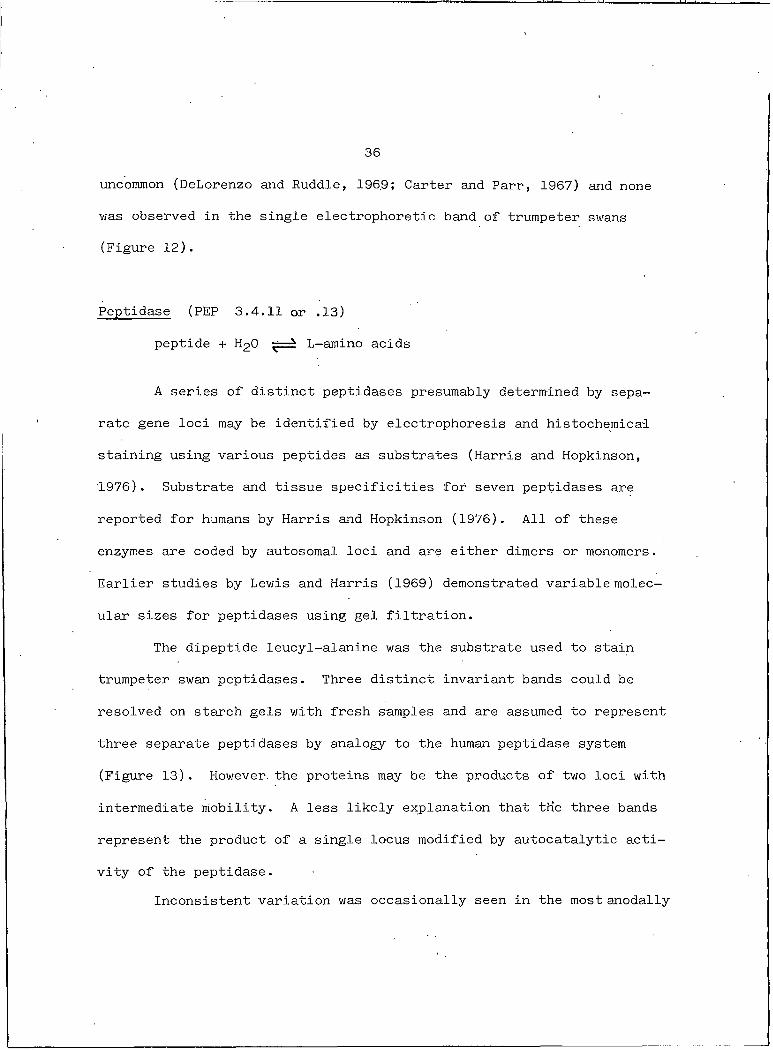
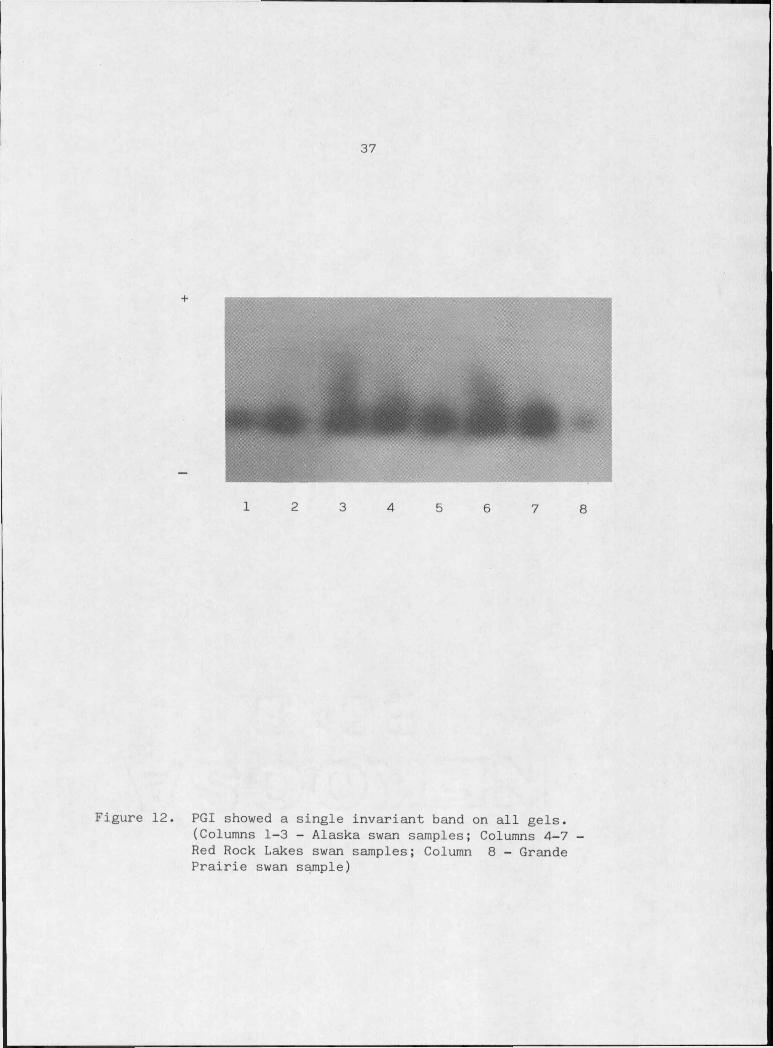
36uncommon (DeLorenzo and Ruddle, 196.9; Carter and Parr, 1967) and none
was observed in the single electrophoretic band of trumpeter swans
(Figure 12);
Peptidase (PEP 3.4.11 or .13)
peptide + H2O -— > L-amino acids
A series of distinct peptidases presumably determined by sepa
rate gene loci may be identified by electrophoresis and histochemical
staining using various peptides as substrates (Harris and Hopkinson,
1976). Substrate and tissue specificities for seven peptidases are
reported for humans by Harris and Hopkinson (1976). All of these
enzymes are coded by autosomal loci and are either dimers or monomers.
Earlier studies by Lewis and Harris (1969) demonstrated variable molec
ular sizes for peptidases using gel filtration.
The dipeptide leucyl-alanine was the substrate used to stain
trumpeter swan peptidases. Three distinct invariant bands could be
resolved on starch gels with fresh samples and are assumed to represent
three separate peptidases by analogy to the human peptidase system
(Figure 13). However, the proteins may be the products of two loci with
intermediate mobility. A less likely explanation that the three bands
represent the product of a single locus modified by autocatalytic acti
vity of the peptidase.
Inconsistent variation was occasionally seen in the most anodally
37
1 2 3 4 5 6 7 8
Figure 12. PGI showed a single invariant band on all gels.(Columns 1-3 - Alaska swan samples; Columns 4-7 -Red Rock Lakes swan samples; Column 8 - GrandePrairie swan sample)
38
PEP-3
PEP-2
PEP-I
Figure 13. PEP stains as three bands probably representing peptidases from three loci. All are monomorphic. (Columns 1-4 - Alaska swan samples)
39
migrating protein and was probably due to breakdown as a result of
storage of the samples. An artifact of storage observed with human
tissue samples is the weakening of staining intensity mainly from the
oxidation of reactive sulfhydryls with oxidized glutathione (Harris
and Hopkinson, 1976). The peptidases of trumpeter swan erythrocytes
became increasingly difficult to stain as the age of samples increased.
Separation of the three peptidases was only efficient at pH 6.0.
Higher pH gels resulted in a single band of peptidase activity. No
peptidase was detected in plasma other than leucine aminopeptidase.
Addition of other substrates (alanyl-glycine, leucyl-naphthylamide)
failed to reveal any other peptidase.
Esterases (EST 3.I.I.I)
Carboxylic ester + HgO alcohol + carboxylic acid anion
Esterases are a nonspecific class of enzymes defined as being
demonstrable -in V-Ujlo with certain synthetic substrates. The enzyme
acts on the substrate to release naphthol from an ester linkage which
couples with diazonium salt to form an insoluble dye (Shaw, 1965). The
natural substance on which these enzymes act is unknown (Shaw, 1965).
Most tissues contain a complex mixture of esterases with over
lapping substrate specificities (Van Thoai and Roche, 1968). Their
classification is based on substrate specificity, electrophoretic mobil
ity, and tissue distribution, inhibition properties and physical char
40
acteristics (Harris and Hopkinson, 1976). Esterases are divided into
two major groups, carboxyesterases (acetylesterases) which act pri
marily on acetates, and butyrylesterases which are active on butyrate
substrates (Harris and Hopkinson, 1976; Hunter and Markert, 1957).
Carboxyesterases are the most common type in the plasma of
lower vertebrates and are the dominant esterases in the duck (Van Thoai
and Roche, 1968). A type of carboxyesterase, propionylesterase, is the
most primitive esterase and probably a precursor.of the esterases found
in higher vertebrates (Van Thoai and Roche, 1968). Evolution of enzymes
with no cofactor requirements and/or broad substrate specificity such
as the esterases may be expected to show relatively rapid evolution
because of fewer constraints to the enzyme function (Van Thoai and
Roche, 1968). The evolutionary aspect, ease of detection and generally
high degree of variability have made esterases popular for electro
phoretic analyses in many different animals.
In a study of the plasma esterases of doves, Boehm and Irwin
(1970) observed nine different phenotypes in one species with indivi
dual birds always showing only one type. Orv vjjyio mixing of plasma
of different esterase types resulted in overlapping electrophoretic
bands which are never seen in individual birds. This led the authors
to postulate nine esterase alleles with complete dominance. A closely
related dove species showed only one esterase type in the same study.
The esterases from the plasma or erythrocytes of trumpeter
41
swans were detected using' o<- or /3- naphthyl proprionate or acetate as
substrates. The pattern on the gel was independent of the substrate
as predicted by the results of a survey of avian serum esterases
(Kaminski, 1964) in which the enzymes of several species demonstrated
identical reaction to c<- and naphthyl acetates. Conversely mam
malian carboxyesterases exhibit a high degree of substrate specificity.
The swan esterases are represented on starch gels as five bands
with staining intensity varying among individuals and are the same in
plasma and erythrocytes (Figure 14). A similar five band complex was
reported for the esterases of the cricket frog {AcjlLa dp. ) which was
postulated to represent a tetrameric molecule composed of subunits
from two loci (Dessaur and Nevo, 1969). The extensively studied
esterases described for humans are monomers or dimers (Ward, 1977;
Harris and Hopkinson, 1976) so there is little precedence to assume a
tetrameric structure for swan esterases without further evidence from
sources other than electrophoresis.
Examination of serum esterases in eighteen species of birds and
their hybrids (Beckman and Nilson, 1965) revealed extensive variability
in staining intensity as well as distinct intraspecific variation. The
esterases of eleven species of geese also show considerable quantita
tive and qualitative variation with electrophoresis (Baker and Hanson,
1966). The differences in geese are primarily individual and less
species specific with no one variant unique to a species or genus. The
42
1 2 3 4 5 6 7 8 9 10 11
Figure 14. Esterases are the same in plasma and erythrocytes showing five bands on the gel presumably the products from at least two loci.Top: Erythrocyte esterase (Columns 1-7 - Grande Prairie
swan samples)Bottom: Plasma esterase (Columns 1-5 - Alaska swan samples)
43
pattern of esterases of trumpeter swans shows quantitative variation
among individuals and among repetitions of gels for a particular bird.
Variation in staining of esterases has also been directly correlated
with the physiological state of some birds (Bush, 1967) where a weakened
condition was manifest in a loss of activity of the esterase. None of
the trumpeter swans sampled were obviously ill, but more subtle physio
logical differences cannot be discounted. The stress of the capture
ordeal and fatigue may be a source of temporal physiological weakness.
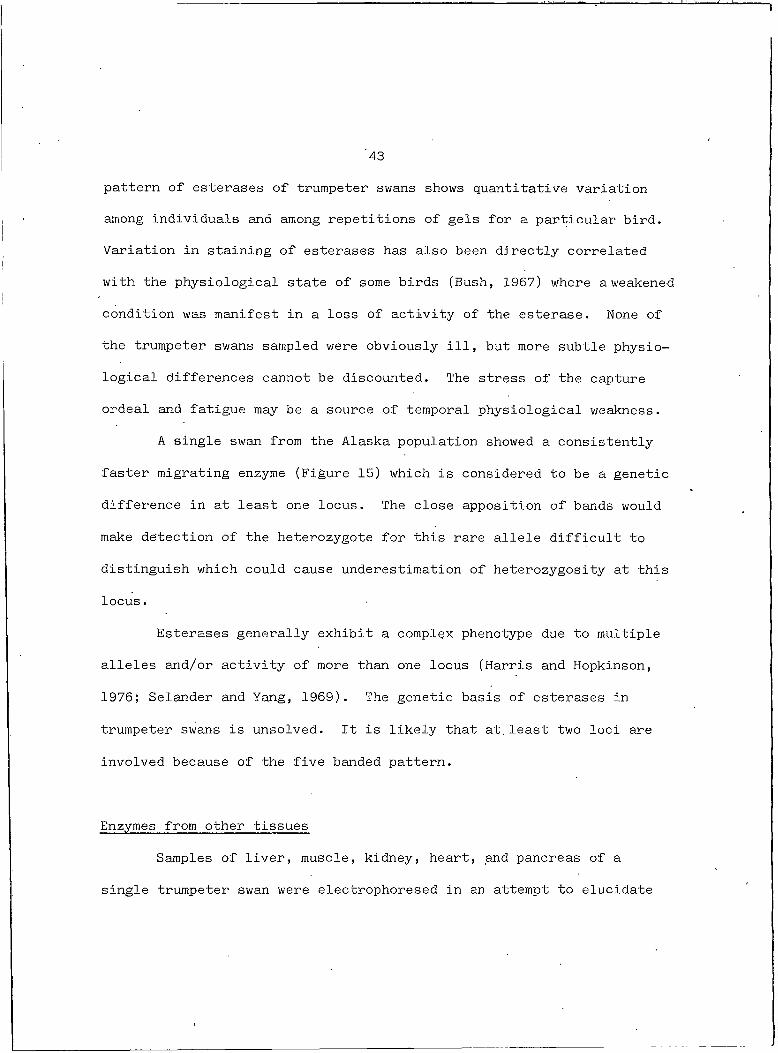
A single swan from the Alaska population showed a consistently
faster migrating enzyme (Figure 15) which is considered to be a genetic
difference in at least one locus. The close apposition of bands would
make detection of the heterozygote for this rare allele difficult to
distinguish which could cause underestimation of heterozygosity at this
locus.
Esterases generally exhibit a complex phenotype due to multiple
alleles and/or activity of more than one locus (Harris and Hopkinson,
1976; Selander and Yang, 1969). The genetic basis of esterases in
trumpeter swans is unsolved. It is likely that at. least two loci are
involved because of the five banded pattern.
Enzymes from other tissues
Samples of liver, muscle, kidney, heart, and pancreas of a
single trumpeter swan were electrophoresed in an attempt to elucidate
I 2 3 4 5 6 7 8 9 10 11 12 13 14 15 16 • 17 18 19
Figure 15. Esterases. The sample in Column 6 is from a swan with variation at onelocus. A mute swan is represented in Column 19 and a whistling swan sample is in Column 18. (Columns I, 3, 5, 7, 9, 11, 13, 15, 17 - Red Rock Lakes swan samples; Columns 2, 4, 6, 8, 10, 12, 14, 16 - Alaska swan samples)

45subunit structure and loci relationships of any of the enzymes with
differential tissue specificity. The specimen was a cygnet that died
at the Veterinary Research Laboratory at Montana State University but
whether it was a Red Rock Lakes swan or a wintering Grande Prairie
swan was unknown. No variation was revealed. ■ ■ .
Plasma Proteins
Plasma proteins have been examined for genetic variation in
many species of animals. Many studies report serum proteins but when
compared, the pattern of proteins resolved in electrophoresis is the
same for plasma and serum (Boehm and Irwin, 1970; Wall and Schlum-
berger,. 1957), the only difference being the absence of fibrinogen in
serum. Differences in the serum proteins of male and female chickens
have been reported (Moore, 1945) and are especially evident’ in laying
females particularly in terms of albumin and total protein (Common
at, 1953; Brandt e£ aL, 1951).
The plasma proteins have been used to clarify taxonomic rela
tionships of birds (Sibley and Johnsgard, 1959) with the recommendation
that samples be separated according to age, sex and reproductive status
and that the sample size be large.
Baker and Hanson (1966) have shown the pattern of serum proteins
of eleven species of geese to be similar to that of chicken and of
pheasants and provides biochemical evidence of the close relationship
46
of the genera Byianta and Anyieyi with little distinction between species
and subspecies. Yet two species of pheasant are distinguishable on
the basis of their serum proteins (Baker. &t aA., 1966). The serum pro
teins of mallard ducks show no allelic variation (Owen and Bennett,
1972).
Pre-albumin
This plasma protein is operationally defined as the protein
fraction with.a greater anodal mobility than albumin. Eight pre-albumin
types have been detected in horses as the product of at least four
alleles demonstrated by electrophoresis and confirmed by inheritance
data (Gahne, 1966). Three alleles are responsible for the five pos
sible patterns observed in human serum, a result.which also correlates
with family studies (Fagerhol and Braend, 1965).
The pre-albumins of the serum and egg yolk of chicken are
identical (Stratil, 1972). In this case pre-albumin shows five bands
on a starch gel but much of the heterogeneity is removed by addition
of neuraminidase which removes sialic acid residues. The author
(Stratil, 1972) concluded that the pre-albumin of chickens is a glyco
protein with one to five sialic acid residues and ahexose attached to
the protein portion which can be produced by two codominant autosomal
alleles.
In studies of Proceilariiform birds, (sea birds) (Brown and
47
Fisher, 1966) the fraction migrating anodal to albumin is a lipoprotein
which may be present only in laying females with slight variation due"
to the stage of the nesting cycle. The pre-albumin of mallard serum is
also a lipoprotein highly dependent on diet (Owen and Bennett, 1972)
as the pre-albumin is most obvious in ducks being fed corn.
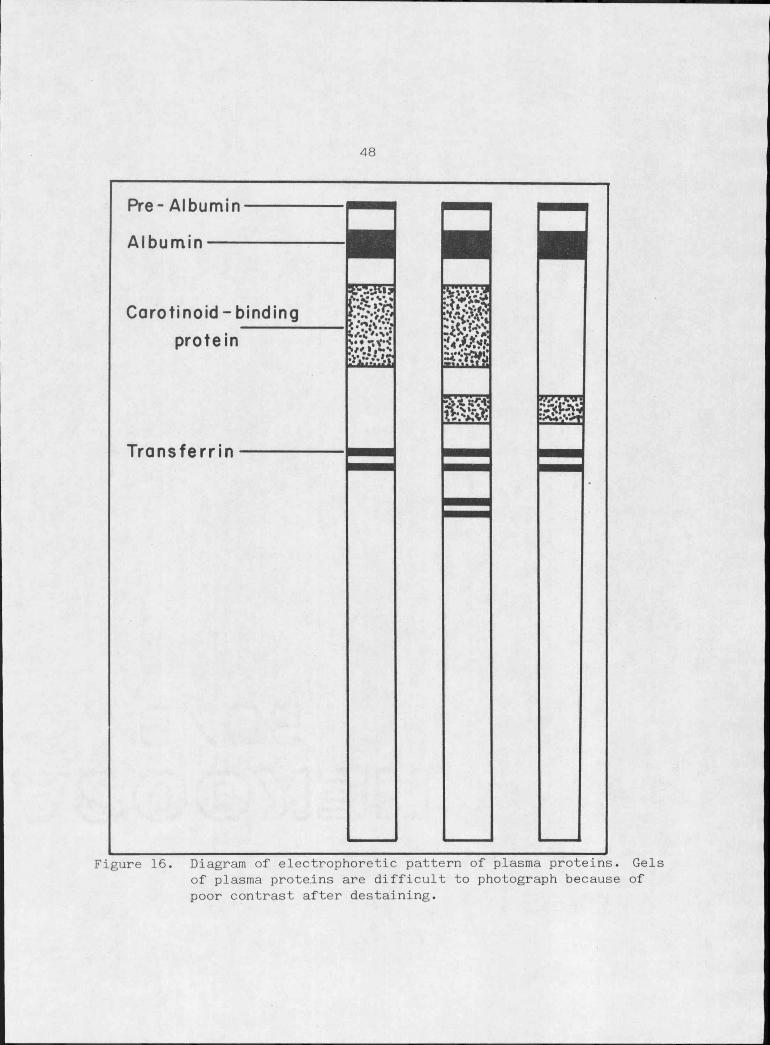
The appearance of pre-albumin in the plasma of trumpeter swans
is highly dependent on the buffer system used and the pH with resolu
tion difficult even under optimal conditions. Fagerhol and Braend
(1965) found banding of human pre-albumin varied with technique. No
describable variation was found for trumpeter swan pre-albumin (Figure
16). '
Albumin
The major protein component of human, bird and other animal
plasma is albumin (Haley, 1965; Foster, 1960). The protein has no
enzymatic or hormonal .-.activity (Foster, 1960) but functions to main
tain colloid pressure in the blood because of its large molecular size
(human albumin MW 69,000) (Sibley and Hendrickson, 1970), its globular
conformation, and high net charge under physiological conditions (Day-
hoff, 1972). It has been extensively studied because it is easy to
prepare and is commercially available (Foster, 1960.). The albumins of
most species are very similar in amino acid composition"and physical
properties (Foster, 1960).
48
Pre- AlbuminAlbumin
Carotinoid -binding protein
Transferrin
Figure 16. Diagram of electrophoretic pattern of plasma proteins. Gels of plasma proteins are difficult to photograph because of poor contrast after destaining.

49
The best resolution of albumin is achieved in the pH range near
8. The protein displays various anomolies at low pH (pH 4) such as
aggregation, isomerization, and altered solubility (Foster, 1960) which
may confuse the pattern on starch gels. This.protein also shows strong
affinity for ions, particularly anions, as a function of ionic strength
and pH of the solution (Foster, 1960). Albumin may serve to reduce the
concentration of a variety of low molecular weight ionic substances, and
to transport desirable ions to sites of need (Dayhoff, 1972). This
anion affinity also contributes to the high net charge of the molecule.
Another factor which may affect the electrophoretic mobility of albumin
is its tendency to associate with fatty acids, the transport of which
may be another biological function of albumin (Foster, 1960). . Albumin
also provides a major mobile reserve of amino acids which may account
for the importance of ovalbumin in avian eggs (Foster, 1960).
Variation has been reported in the albumin of chickens (McIndoe,
1962) but the pH used was 5.4 so the low pH affects described above may
artificially produce variations. Allelic variation was found in the
albumins of wild and domestic turkeys (Quinteros <zt clL, 1964) and con
firmed by breeding studies. Pheasants of two species showed identical
albumins' (Baker <zt at, 1966) and eleven species of geese showed no
albumin variation (Baker and Hanson, 1966). Ovalbumin of redwing black
birds has also been shown to be monomorphic (Brush and Scott, 1972).
The identical electrophoretic mobility of albumins in the plasma
50
of trumpeter swans is therefore not a surprising result (Figure 16)'. •
Occasionally the heavy band of albumin may appear as two bands which
has been described by Selander al, (1971) as the effect of storage
or poor separation from pre-albumin. As this two banded phenotype is
inconsistent in subsequent gels, Selander1s explanation is applicable.
Dilution of the plasma (1:1 with water) also results in a two banded
albumin pattern without revealing any variation. The high concentra
tion of albumin in the undiluted plasma resulting in a heavy band may
be covering another protein of similar'electrophoretic mobility which is
revealed by dilution of the sample.
Carotinoid-binding protein
A diffuse protein band which stains in the post-albumin region
of the gel has been identified as a carotinoid-binding protein (Car)
(Baker at, 1966; Bush, 1967) because it has been observed as a
yellow pigmented region on the unstained gel due to combination with
xanthophyll and may also be associated with lipid (Common at aL, 1953).
The intensity and position on the gel of this protein varies among
individual pheasants {fh.aAi.anuA) Baker at at, 1966). Some subtle varia
tion has also been seen in the ruff {fliLLomachuA) (Segre at at, 1970).
Baker at at, (1966) found that serum from an occasional pheasant had a
carotinoid-binding zone considerably cathodal to the normal position.
These differences may be due to the carotinoid or to the protein por-
51
tidn of the molecule.
The protein from plasma of trumpeter swans which migrates in the
post-albumin region shows variation similar to that described for
pheasants (Figure 16). Two protein bands in this region have, been
observed which suggests a genetic basis for this variation with the
slow band representing an individual homozygous for a rare allele and
the heterozygote showing two bands. The unstained gel does not show
the descriptive yellow pigment after electrophoresis of trumpeter swan
plasma thus the post-albumin region is considered to be carotinoid-
binding protein because of its position and similarity to the descrip
tion in the literature (Baker &£ clL, 1966; Segre Lt at, 1970).
Transferrin'
Transferrin (Tf) is a /Q- globulin (non-heme) transport molecule
which carries iron from the site of absorption in the intestine to
storage in hematopoetic areas of the bone marrow and picks up splenic
iron from the breakdown of hemoglobin (Fletcher and Huehns, 1968). It
has been extensively studied in the serum of many animals especially
0cattle where polymorphism has been related to fitness and milk produc
tion (Ashton, 1965).
Transferrin is a globular glycoprotein with a molecular weight
of 70-90,000 daltons. (Greene and Feeney, 1968) with two equivalent,
non-interacting binding sites for ferric iron. Analysis has shown only
52
one amino-terminal so that the appearance of two "subunits" (Baker
al, 1968) is due to two polypeptide halves each with one iron bind
ing ■site (Greene and Feeney, 1968). The carbohydrate portion of the
molecule consists of four sialic acid residues, four galactose and
eight N-acetylglucosamine residues (Chen and Sutton, 1967).
The presence of transferrin on a gel can be demonstrated by
autoradiography with Fe^®, but this technique is out of the realm of
the present study so presumptive transferrin was assigned to bands on
the gels stained with the general protein stain amido-black by compari
son with description in the literature (particularly Baker and Hanson,
1966). Typically transferrin shows two bands differing in sialic acid
composition. Removal of one sialic acid residue has been shown to in
volve the loss of one carboxyl group (COO-), thus .decreasing the elec
trophoretic mobility of the molecule (Canham and Cameron, 1972). A
heterozygote for transferrin will show four bands with electrophoresis.
There have been at least thirteen different transferrins recog
nized in the serum of the human population (Parker and Bearn, 1962)
with no clinical abnormalities associated with any of the variants.
Neither is transferrin correlated with blood group types (Smithies and
Hiller, 1959).
Transferrin variation has been used to study gene flow among
species of the genus Macaaa which show at least 34 transferrin pheno
types attributable to 11 alleles (Goodman at at, 1965). From the study
53
of transferrin, macaques are considered to be a monophyletic collection
of semispecies rather than distinct species which illustrates the use
of protein data in taxonomy.
The serum transferrins of cattle have been studied in relation
to fitness. At least 9 alleles have been postulated (Chen and Sutton,
1967). Ashton (1965) found differential fertility in matings of cattle
with different serum transferrin types and postulated the existence
of a balance polymorphism with superiority of the heterozygote In Ltteno
with mother-fetus incompatability and differences in fertility in homo
zygous and heterozygous cows and bulls as secondary causes to explain
his results. In a subsequent study of incomplete family data (IFD) by
Cooper .and Rendel (1968) heterosis could not be proven, It was also
pointed out that maternal-fetal incompatability implies immunological
differences not yet demonstrated for transferrin. But IFD is usually
performed on sire groups so it is difficult to detect mother-fetus
incompatability.
Ashton (1965) has suggested that artificial selection for trans
ferrin is associated with selection for milk yield where heterozygotes
for the TfD allele have a milk production intermediate between the
homozygotes considering two of the three alleles commonly found in
cattle (Ashton, 1965).
There are three types of transferrin, ovotransferrin (conalbumin)
in the egg-white of birds, lactotransferrin in mammal milk, and serum
I
54
transferrin, differing only in the carbohydrate portion of the mole
cules. The milk and serum transferrins of rabbit are identical except
for .the sialic acid content (Baker e£ al, 1968). Tryptic and chymo-
tryptic digests of chicken serum transferrin and ovotransferrin give
identical, fingerprints (Williams, 1962) and the molecules show the same
amino acid sequence (Ogden .&£ aA, 1962). Variation in serum transfer
rins parallels that of ovotransferrins (Ogden clL, 1962, chicken;
Baker aL, 1966, pheasant).
Avian transferrins have been shown to be polymorphic in four
teen species (ref. Lush, 1967; Mueller e£ aX, 1962, pigeon; Baker cut,
1966, pheasant; Baker and Hanson, 1966, pigeon, pheasant, chicken, ■
goose;.Vohns and Carr, 1969, pheasant). The variation is considered to
be due to codominant autosomal alleles.
Non-genetic variation of transferrin exists in the attachment
of the carbohydrate moieties. Chen and Sutton (1967) have suggested
that the carbohydrate, may be responsible for all the observed varia
tion, but no work has been.done to determine differences in enzyme
systems responsible for controlling carbohydrate attachment to the
transferrin peptide.
Electrophoretic behavior of transferrins is affected by the pH
and the buffer system. ' The binding of iron and other metals (copper
and zinc) does not confer conformational changes on the protein accord
ing to Baker (1967) but other authors have reported differences in
55
mobility with the degree of saturation of iron (ref. Baker, 1967; Can-
ham and C a m e r o n 1972). Dosage effects have also been reported (Beck^
man ei aL, 1962) as have' changes in transferrin with bacterial con
tamination of the sample (McDougall and Lowe, 1968).
Polymorphism in transferrin of several .species of doves show no
evidence of balancing selection (Ferguson, 1971), but the iron-chelat
ing ability of transferrin gives the molecule the potential to inhibit
microbial growth (Dayhoff, 1972), bacteria and fungi (Frelinger, 1972).
In pigeons the ovotransferrin polymorphism was maintained by selection
against offspring of homozygous females because of their greater sus-
ceptability to infection (Frelinger, 1972). The conclusion was sup
ported by -Lri vJutsio inhibition of microbial growth (iron-dependent or
ganisms) and -Ui vLvo hatchability.
Plasma of trumpeter swans was examined for transferrin revealing
two phenotypes (Figure 16). There is discrepancy due to overlap of
transferrin bands with other globulins which migrate to the same
region of the gel (Niece and Kracht, 1967). The homozygotes 'have two
bands while the heterozygotes show four, accountable as products of two
alleles. The homozygote for the rare allele was never observed.
Leucine aminopeptidase (LAP)
This plasma peptidase hydrolyzes leucyl-/3 -naphthyl amide in
viMio. Hubby and Lewontin (1966) noted at least eight sites of activity

56
with different electrophoretic mobility in inbred lines of DA-O ophLLLa
which were characteristic of a particular strain. Plasma of chickens
shows two bands for LAP,, a leading band which always appears the same
and a slower, variable band (Law, 1967). In breeding studies, Law
(1967) found that heterozygotes showed the fast homozygote phenotype.
This led him to suggest dominance at this locus. Dominance is rare at
the enzyme level because most alleles function independently of each
other (Lush, 1967). With further analysis of the chicken enzymes, Law
(1967) also found variation in LAP to segregate with variation in alka
line phosphatase, implying close linkage of these two loci, common poly
peptide chains or similar mechanisms of post-translational modifica
tion. .By the use of neuraminidase which cleaves sialic acid residues,
the mobilities of both LAP and alkaline phosphatase were retarded.
Thus- dominance may be explained by variation in. a locus controlling
attachment of sialic acid to both LAP and alkaline phosphatase (Law,
1967).
The enzyme belongs to the broad class of enzymes which hydrolyze
peptide bonds, LAP being specific for N-terminal amino acids. In a
table summarizing the subunit composition of various proteins (Darnall
and Klotz, 1972) LAP is listed as a 255,000 dalton molecular weight pro
tein with four subunits. But it has been reported more recently to
behave as a monomer (Ward, 1977). Detection of LAP on gels of trum
peter swan plasma was difficult and the staining procedure needed to be
57
modified to aid resolution. The enzyme still always appeared as along
streak with the anodal edge of the stained region relatively consistent
among different individuals but the degree of streaking was highly vari
able. Because of this ambiguity a conservative estimate of one locus
is made considering the protein monomorphic with variability due to
quantitative staining differences and possibly sialic acid content.
From these results no subunit structure can be suggested for the swan
enzyme. Even the number of loci involved is unknown.
Heterozygosity and Genetic Distance
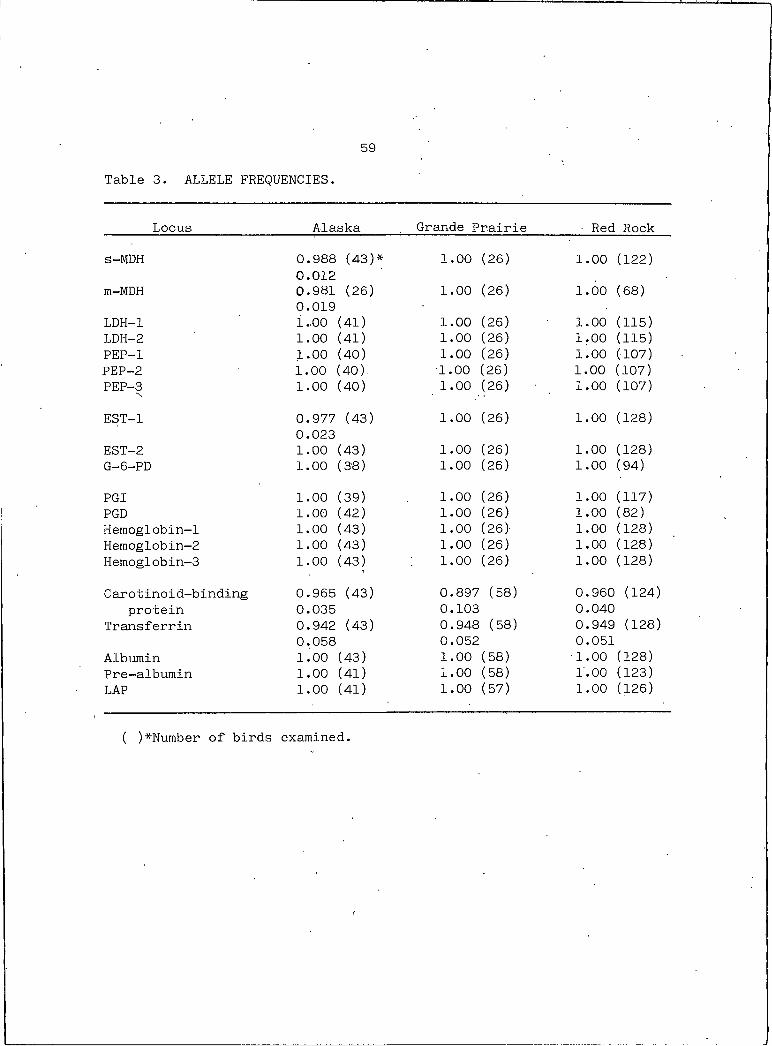
The allele frequencies for the twenty loci examined in all three
populations of trumpeter swans are shown in Table 3. All populations
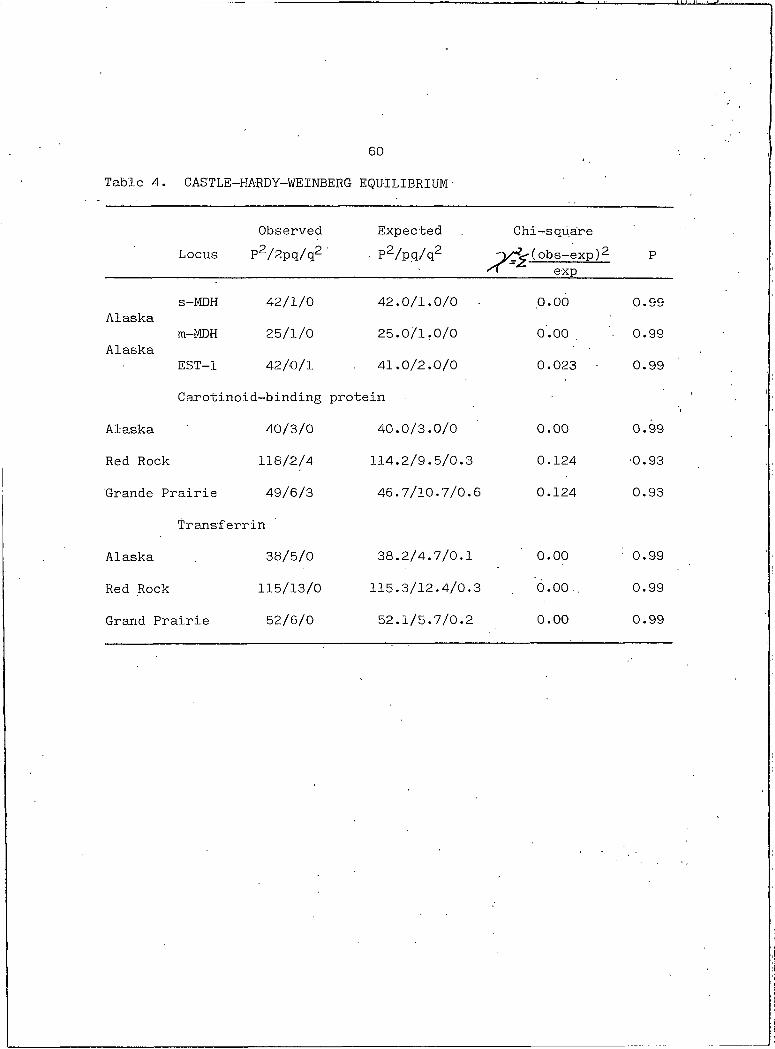
share the same common allele. The loci which have shown an alternate
allele are in Castle-Hardy-Weinberg equilibrium (Table 4). ' The heter
ozygosity (h) per locus and the mean heterozygosity (H) for each popu
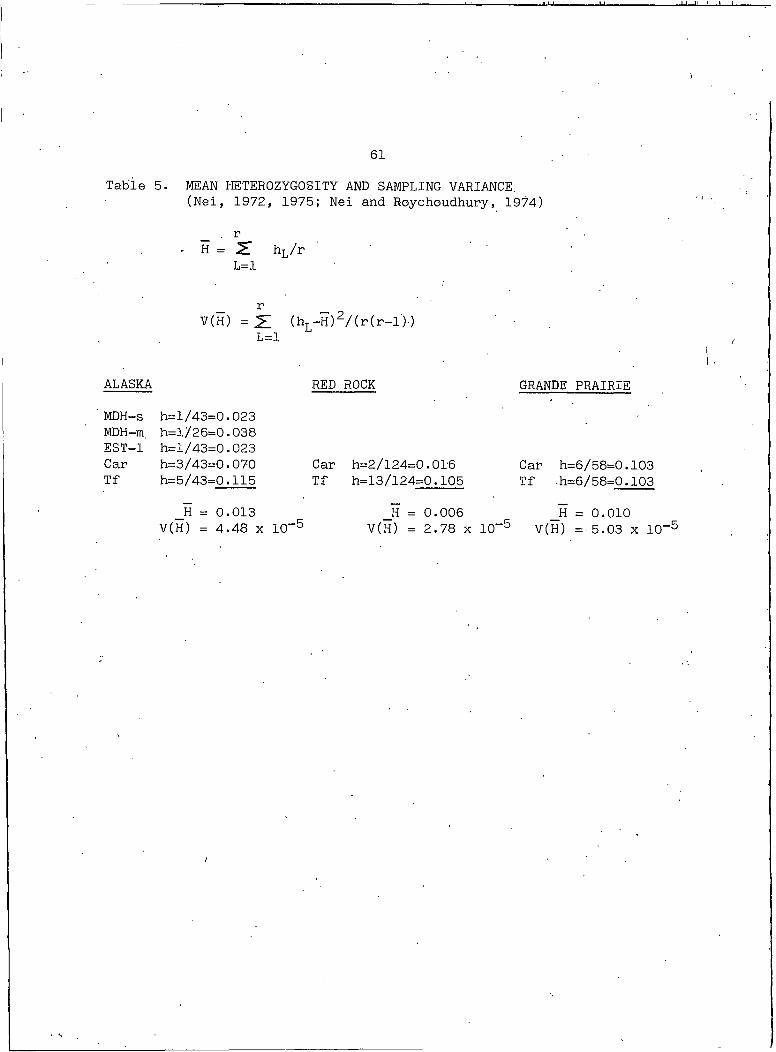
lation are shown in Table 5.
There are no significant differences among the populations, but
the presence of alternate alleles for s-MDH, m-MDH, and EST-I in the
Alaska population not found in the Red Rock and Grande Prairie popula
tions may indicate that the Alaskan population Contains some genetic
variability not present in the other two populations.
The genetic similarity (I) between the populations was calcu
lated as described by Nei (1975, 1972). The results presented here
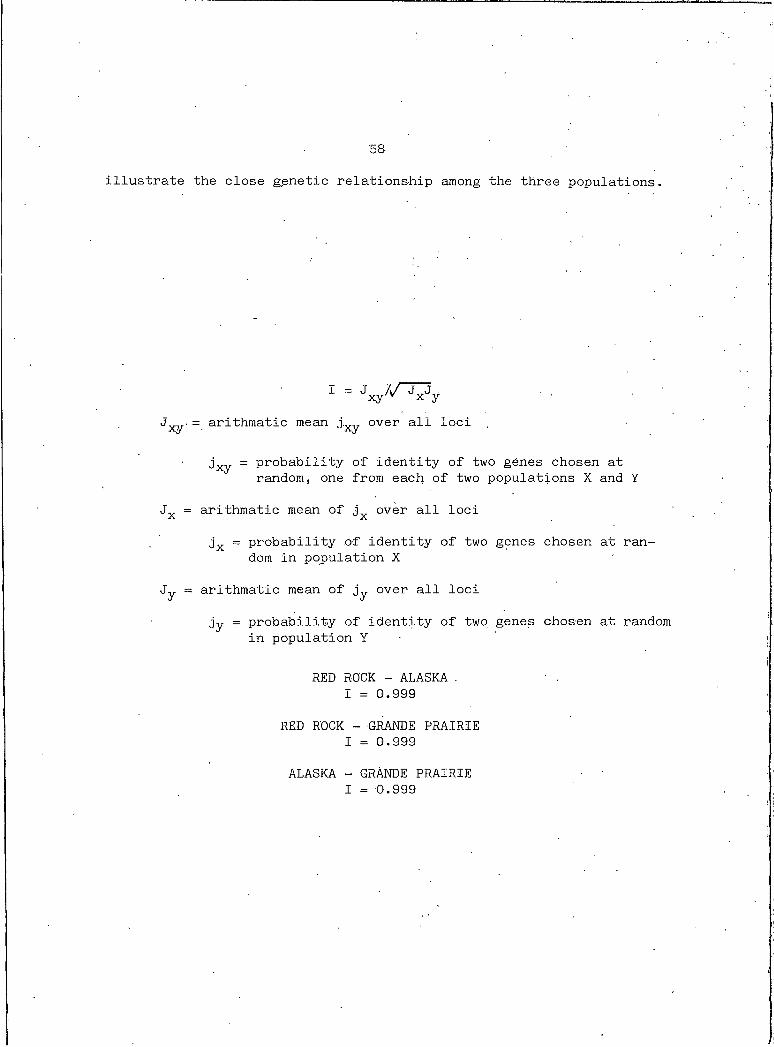
58illustrate the close g.enetic relationship among the three populations.
i - V Z j p yJv..- = arithmatic mean j over all locix.y Ay
jXy = probability of identity of two genes chosen atrandom, one from each of two populations X and Y
Jx = arithmatic mean of j over all loci
jx = probability of identity of two genes chosen at random in population X
Jy = arithmatic mean of j'y over all loci
jy = probability of identity of two genes chosen at random in population Y
RED ROCK - ALASKA .I = 0.999
RED ROCK - GRANDE PRAIRIE I = 0.999
ALASKA - GRANDE PRAIRIE I = 0.999
59
Table 3. ALLELE FREQUENCIES.
Locus Alaska Grande Prairie ■ Red Rock
s-MDH 0.988 (43)* 1.00 (26) ' 1.00 (122)0.012
m-MDH 0.981 (26) 1.00 (26) 1.00 (68)0.019
LDH-I 1.00 (41) 1.00 (26) 1.00 (115)LDH-2 1.00 (41) 1.00 (26) 1.00 (115)PEP-I 1.00 (40) 1.00 (26) 1.00 (107)PEP-2 1.00 (40). ■1.00 (26) 1.00 (107)PEP-3 1.00 (40) 1.00 (26) 1.00 (107)
EST-I 0.977 (43) 1.00 (26) 1.00 (128)0.023
EST-2 1.00 (43) 1.00 (26) 1.00 (128)G-6-PD 1.00 (38) 1.00 (26) 1.00 (94)
PGI 1.00 (39) 1.00 (26) 1.00 (117)PGD 1.00 (42) 1.00 (26) 1.00 (82)Hemoglobin-1 1.00 (43) 1.00 (26) 1.00 (128)Hemoglobin-2 1.00 (43) 1.00 (26) 1.00 (128)Hemoglobin-3 1.00 (43) 1.00 (26) 1.00 (128)
Carotinoid-binding 0.965 (43) 0.897 (58) 0.960 (124)protein 0.035 0.103 0.040
Transferrin 0.942 (43) 0.948 (58) 0.949 (128)0.058 0.052 0.051
Albumin 1.00 (43) 1.00 (58) 1.00 (128)Pre-albumin 1.00 (41) 1.00 (58) 1.00 (123)LAP 1.00 (41) 1.00 (57) 1.00 (126)
( )*Number of birds examined.
60
Table 4. CASTLE-HARDY-WEINBERG EQUILIBRIUM■
Observed Expected Chi-squareLocus P2/2pq/q2 • P2ZpqZq2 (obs-exp)2
expP
s-MDH 42/1/0 42.0/1.0/0 .0.00 0.99Alaska
m-MDH 25/1/0 25.0/1.0/0 0.00 0.99Alaska
EST-I 42/0/1 41.0/2.0/0 0.023 • 0.99
Carotinoid-binding protein ■■
Alaska 40/3/0 40.0/3.0/0 0.00 0.99
Red Rock 118/2/4 114.2/9.5/0.3 0.124 ■0.93
Grande Prairie 49/6/3 46.7/10.7/0.6 0.124 0.93
Transferrin
Alaska 38/5/0 38.2/4.7/0.1 0.00 ' 0.99
Red Rock 115/13/0 115.3/12.4/0.3 o.oo.. 0.99
Grand Prairie 52/6/0 52.1/5.7/0.2 0.00 0.99
61
Table 5. MEAN HETEROZYGOSITY AND SAMPLING VARIANCE.(Nei, 1972, 1975; Nei and Roychoudhury, 1974)
_ . r- H = 2T hL/r '
L=I
__ r _V(H) = (hL-H)2/(r(r-l))
ALASKA RED ROCK GRANDE
MDH-s h=l/43=0.023MDH-m. h=l/26=0.038EST-I h=l/43=0.023Car h=3/43=0.070 Car h=2/l24=0.016 Car h:Tf h=5/43=0.115 Tf h=13/124=0.105 Tf b
H = 0.013 H = 0.006 HV(H) = 4.48 x 10⁻⁵ V(H) = 2.78 x 10⁻⁵ v (h )
PRAIRIE
:6/58=0.103:6/58=0.103
= 0.010 =5.03 x 10⁻⁵
62
DISCUSSION
Electrophoresis has allowed examination of large numbers of dif
ferent proteins in many individuals to analyze genetic variability and
population structure (Avise, 1975). The high levels of genetic varia
bility disclosed by initial studies (Hubby and Lewontin, 1966) contra
dicted the classic theory of balanced genetic load (Avise, 1975) and an
investigation of the maintenance and source of this variability was
begun.
. Advantages of population data from electrophoresis (Avise, 1975)
include objectivity because of the mobility of the proteins on the gels
is the basis of enumeration of alleles and estimation of their fre
quencies. Most loci routinely examined show no variation with age or
sex and the genetic basis of enzymes and proteins is simple compared
to morphological, behavioral or physical traits. Another favorable
aspect is that common function of enzymes implies common origin allow
ing examination of relatedness of very different organisms.
There are also numerous disadvantages to using electrophoresis
including the restriction to examination of living organisms, chance
identity of mobility of non-identical proteins and the need of some
expertise required for generating data (techniques of electrophoresis)
and for scoring gels which may vary among individual researchers (Avise,
1975). Many changes in nucleotide sequence may not alter the amino
acid sequence as a result of degeneracy and wobble in the genetic code
63
or may not change the charge, and hence the mobility, of the protein.
Shaw (1970, 1965) has estimated that less than thirty percent of single
nucleotide substitutions result in a change in the protein detectable
by electrophoresis. Amino acid substitutions may result in other types
of changes such as inactivation of an enzyme (Shaw, 1965). ■ These fac
tors cause an underestimation of protein differences between individuals
of populations.
Another bias of the technique is the limitation to detection of
primarily water-soluble proteins, many involved in metabolism and coded
by structural genes which may not be representative of the entire
genome. "Non-glucose metabolizing" enzymes show a greater variability
than enzymes involved in glucose metabolism (Johnson, 1974). One
reason may be the broader specificity of substrate of these non-glucose
enzymes.
Metabolic pathways are stringently regulated and although regu
latory enzymes cannot be directly detected by electrophoresis their role
in the causation of polymorphism should not be ignored. Greater poly
morphism in enzymes catalyzing irreversible reactions might be expected
if selective forces are acting compared to the variability in enzymes
of reversible reactions (Johnson, 1971). In fact Johnson (1971) finds
greater polymorphisms for enzymes of reactions with equilibrium con
stants far to the right (i.e., irreversible).
Johnson's arguments (1974, 1971) are dependent on selection as
64the primary factor maintaining polymorphism. The evidence is extensive
in support of selection (Johnson, 1974; Gillespie and Langley, 1974;
Ayala aL, 1974) ; Clarke,' 1969) , but there is also a substantial case for
selective neutrality of enzyme polymorphisms (Kimura and Ohta, 1973;
King and Jukes, 1969). Mechanisms other than selection which can
effect incorporation of mutant forms into the population include random
genetic drift, variable mutation rates for different genetic sites,
linkage to genes which do have selective values, or the sharing of sub
units from different loci between two or more enzymes, one of which is
selected (Shaw, 1965).
The rate of evolution is ultimately limited by the amount of
genetic variation in the evolving population (Hubby and Lewontin, 1966)/
regardless of whether this variation is subject to natural selection or
is neutral in this regard. The description of genetic variation in a
population is the fundamental basis of the study of evolution (Hubby
and Lewontin, 1966).
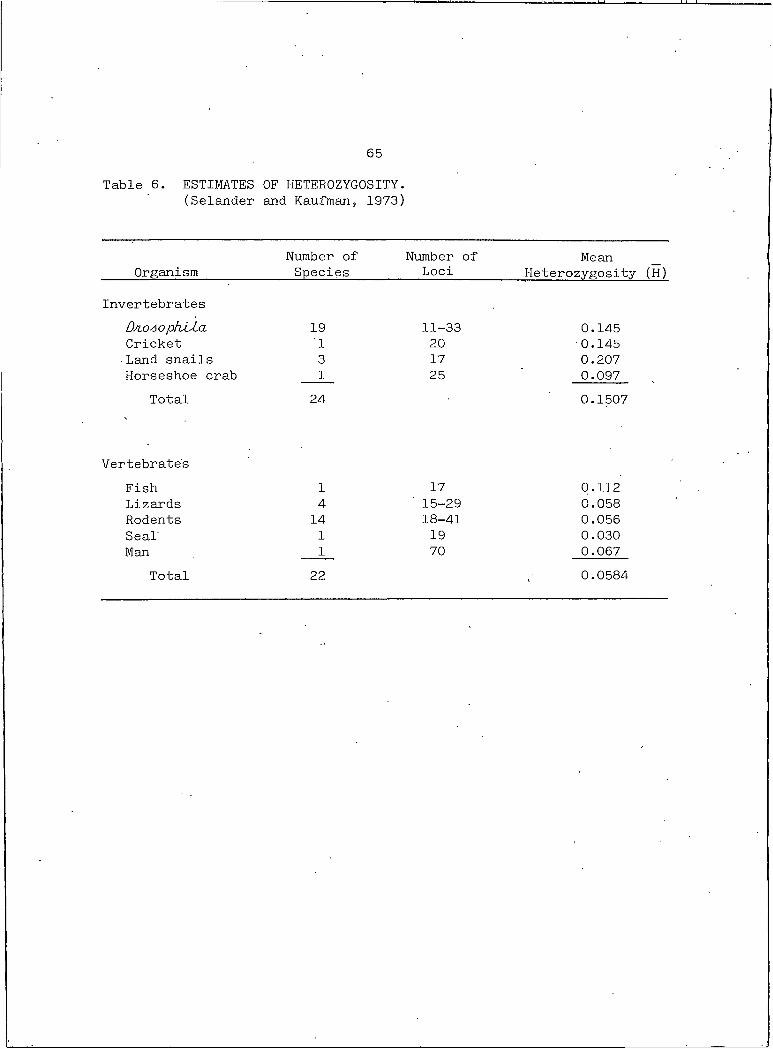
Mean heterozygosity (H), the proportion of individuals heterozy
gous at a locus averaged for all loci is a reflection of the genetic
variability of a population. H values range from zero for several species
of vertebrates to .242 for D/io4ophJLLa bXf OAcXata (Powell, 1975) (Table
6). These estimates are low by probably a factor of three, therefore,
on the average animals' are heterozygous at about 28% of their struc
tural loci (Powell, 1975).
65
Table 6. ESTIMATES OF HETEROZYGOSITY.(Selander and Kaufman, 1973)
OrganismNumber of Species
Number of Loci
MeanHeterozygosity (H)
InvertebratesD/loao phAAa 19 11-33 0.145Cricket I 20 0.145■ Land snails 3 17 0.207Horseshoe crab I 25 0.097
Total 24 0.1507
Vertebrate'sFish I 17 0.112Lizards 4 ' 15-29 0.058Rodents 14 18-41 0.056Seal I 19 0.030Man I 70 0.067
Total 22 0.0584
66Polymorphism is the presence of alternate alleles in frequencies
greater than attributable to mutation (Ford, 1940). A frequency of
5% for a rare allele is often arbitrarily chosen to consider a locus
polymorphic (Richmond, 1970). The extent of polymorphism within a ■
population reflects the reserve of genetic variability accessible to
the population for adaptation to changing environments or exploitation
of new niches.
Birds have played a major role in the' development of ecological
and evolutionary theory, but relatively little is known about the
genetic structure of avian populations (Baker and Fox, 1978). Analysis
of the population genetics may help in the understanding of the diverse
social and behavioral patterns of birds such as courtship displays and
navigation.
Aves is the easiest vertebrate class to define because of its
narrow monophyletic origin from reptiles. The split from reptiles of
the separate phyletic lines leading to birds and mammals is ancient,
occurring some 250 million years ago (Bock, 1969). Any feature common
to birds and mammals, may have evolved independently in each group.
Ohno at (1965) and Mathai at at (1966) have analyzed G-6-PD
and postulated the persistence of an entire primitive X-chromosome com
mon to placental mammals since their origin from a common proinsectivor
ancestor with divergence due to rearrangement of linkage groups and
mutation of individual genes on other chromosomes leaving the X-chromo-
67
some essentially unchanged. Avian species would not be expected to
share this X-chromosome evolution since birds have followed a separate
line of evolution since their divergence from reptiles. The autosomal
position of the G-6-PD locus in fish, birds and reptiles support this ■
divergence. -
Avian cladogenic evolution was apparently.faster than mammalian,
associated with the exacting demands of flight imposed on morphology
(Bock, 1969). Yet for similar reasons, genetic divergence (anagenesis)
is slower in birds than in other taxa (Barrowelough and Corbin, 1978).
Few studies of protein polymorphisms have been done on avian
populations to categorize and determine the extent of genetic diver
sity (Corbin, 1977). Other approaches have been made such as clarifi
cation of taxonomic relationships (Rylander, 1967; Baker and Hanson,
1966; Sibley and Johnsgard, 1959), correlation of morphological and
genetic variability (Segre et cui, 1970; Hanford and Nottebohm, 1976),
study of vocal dialects (Nottebohm and Selander, 1972), or quantifica
tion of breeding structure (Redfield, 1973; Baker, 1971; Brush, 1968).
Furthermore, study of domestic birds has outweighed that.of natural
populations. Many of the studies done are severely limited by the
small number of loci-and/or individuals examined which does not yield
much information about the heterozygosity in the natural populations.
The first step to understanding evolutionary phenomena in
natural populations is to determine the magnitude of genetic divergence

68
between populations which- is primarily influenced by the population
size, migration rate,' and selection intensity (Prakash &£ al, 1969).
Knowledge of the causes of the origin and mechanisms of the mainten
ance of this variation is necessary to predict the evolutionary conse
quences in the population (Hubby and Lewontin, 1966), for genetic change
is the prerequisite of evolution.
Birds are typically less heterozygous than other vertebrates
(Baker and Fox 1978; Powell, 1975) (Table 6). The overall heterozy
gosity compiled by Barrowclough and Corbin (1978) from all avian genetic
surveys in the literature has a value of 0.043 ^ 0.005 which is at the
low end of the range for other vertebrate species and less than for in
vertebrates. The precision of homeothermy as a source of heat for
brooding may be a constraint on the amount of polymorphism avian taxa
can carry (Baker and Fox, 1978; Bock, 1969) as well .as the possible
selective restriction of flight which has imposed morphological uniform
ity on birds. Members of morphologically uniform groups possess simi
lar genetic.potential (Bock, 1963). Genetic differences- correspond to
phenotypic differences which are small in these groups relative to
differences within groups of less uniform animals. Genetic change is
restricted because it must act in harmony with the entire genotype and
similarity of genotypes means changes within individuals or populations'
must be along the same lines (Bock, 1963). The circularity of this
argument is obvious.
69This evidence of decreased genetic variability in avian species
may be significant when considering endangered species of birds or the
practicability of reintroducing a species to an area following local
extinction. The degree of genetic difference among individuals of a
species that are members of different local populations should be
determined. Presumably each local population is■ at or approaching an
adaptive peak for the genes in its pool. But if the genes carried by
an individual chosen at random from a given local population of the
species are likely to be identical to the genes of individuals from
other local populations then a reintroduction will probably be success
ful (Corbin, 1977).
The probability of identity of any two sets of genes drawn at
random from different population is reflected in Nei's index of normal
ized genetic identity (I) (Nei, 1975; 1972). The value of I falls be
tween 1.0, for complete identity of two genomes, and 0.0 for non
identity. Genetic identity of species and genera, of birds (Table 7) is
considerably greater than for non-avian taxa (Table 8) (Barrowclough
and Corbin, 1978). Compared with mammals, salamanders, and fish, local
populations of birds are nearly an order of magnitude more similar to
each other (Corbin, 1977) and avian subspecies are about one hundred
times more similar to each other than are subspecies of other animals.
This makes genera of birds as close genetically as subspecies of other
vertebrates (Corbin, 1977), or sibling species of DaoziophLLa (Barrow-
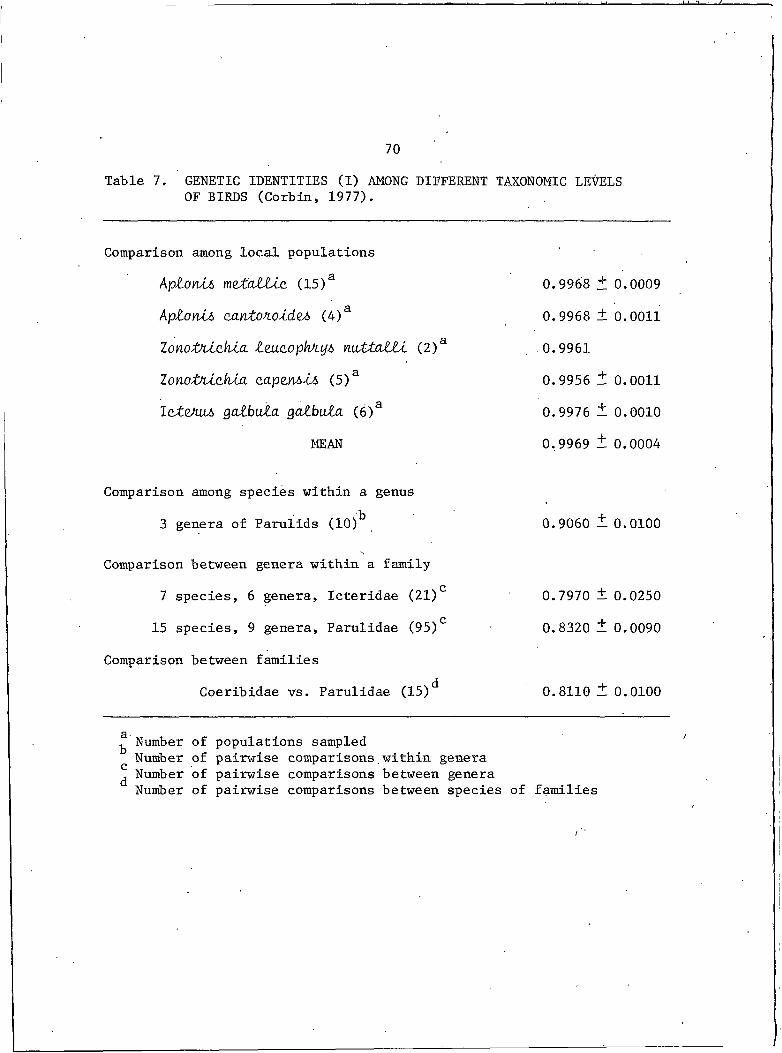
70Table 7. GENETIC IDENTITIES (I) AMONG DIFFERENT TAXONOMIC LEVELS
OF BIRDS (Corbin, 1977).
Comparison among local populationsh p to n u , moAaLLLc. (15)a 0.9968 + 0.0009k p lo v i i t , aaviZ ofio ideA (4)a 0.9968 ± 0.0011I o n o frv ia k L a IeucophAyA nafrtcUULi (2)a .0.9961Io n o frvL d vL a aapeMAlA (5)a 0.9956 ± 0.0011IcteAuA g a tb u Z a gaZ bu Z a (6)a 0.9976 ± 0.0010
MEAN 0,9969 ± 0.0004
Comparison among species within a genusb3 genera of Parulids (10) 0.9060 ± 0.0100
Comparison between genera within a family7 species, 6 genera, Icteridae (21)C 0.7970 ± 0.0250
15 species, 9 genera, Parulidae (95)C 0.8320 ± 0.0090Comparison between families
Coeribidae vs. Parulidae (15)^ 0.8110 ± 0.0100
^ Number of populations sampledNumber of pairwise comparisons.within genera
^ Number of pairwise comparisons between generaNumber of pairwise comparisons between species of families
/
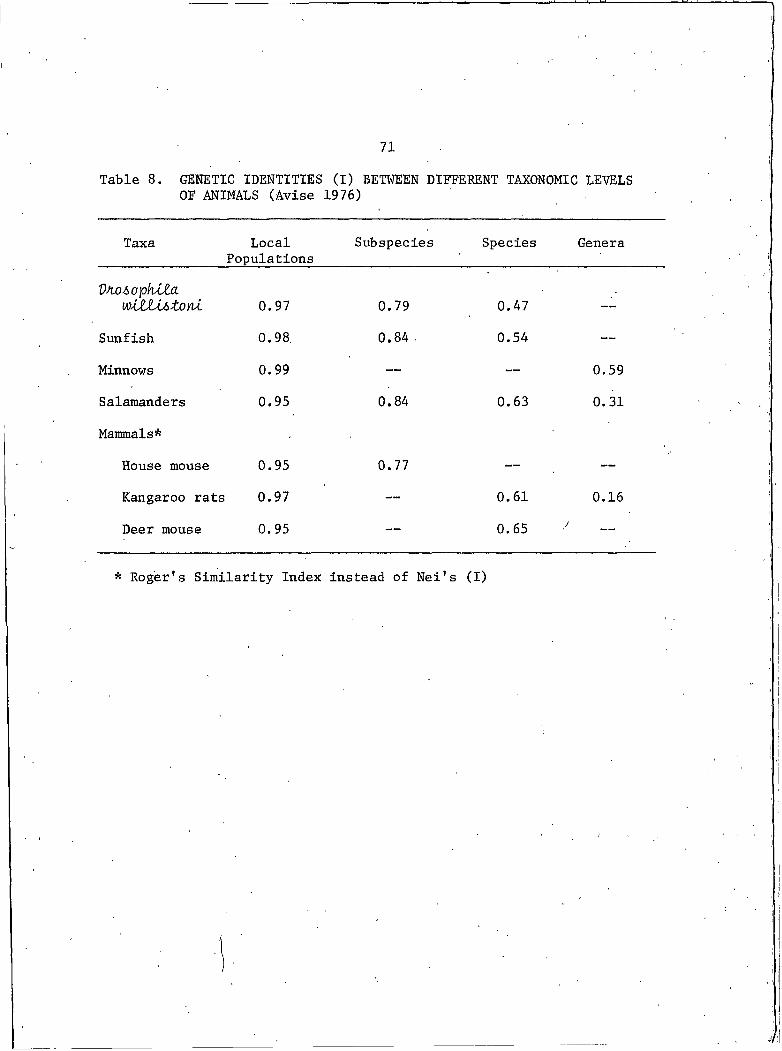
71Table 8. GENETIC IDENTITIES (I) BETWEEN DIFFERENT TAXONOMIC LEVELS
OF ANIMALS (Avise 1976)
Taxa LocalPopulations
Subspecies Species Genera
Vtio&ophllawWLUttonl 0.97 0.79 0.47 •— we
Sunfish 0.98 0.84 0.54
Minnows 0.99 — — 0.59Salamanders 0.95 0.84 0.63 0.31Mammals*
House mouse 0.95 0.77 — —
Kangaroo rats 0.97 — 0.61 0.16
Deer mouse 0.95 — 0.65
* Roger's Similarity Index instead of Nei's (I)
72
dough and Corbin, 1978). . Trumpeter swan populations are virtually
identical-based on this- index of similarity.
The genetic identity data presented by Corbin (1977) are based
primarily on studies of Passeriformes, the order which comprises approx
imately half of the avian-species of the world and, he warns, may not
be representative of the class Aves. Data accumulating on the other
families of other orders are in support of the close genetic related
ness of birds (Corbin, 1977).
Despite their genetic similarity, some birds, such as the Balti-'
more and Bullock's Orioles are sufficiently distinct to-maintain sym
pathy in some areas (Corbin and Sibley, 1977). Birds collected during
migration show a greater heterozygosity then when sampled locally sug
gesting that individuals from different local populations have different
constellations of alleles (Corbin, 1977) pointing to some uniqueness of
structure for separate populations.
The present study was limited to a single species but the find
ings are consistent with the findings of low genetic diversity in birds.
Trumpeter swans are even less heterozygous than vertebrates in general
(Table 5). The monbmorphism cannot be attributed to the bottleneck
experienced by the Red Rock Lakes population because there is no reason,
to assume that the other two populations, Alaska and Grande Prairie,
have undergone similar severe population reductions yet the genetic
structure of each population shows the same lack of diversity.
73
The genetic identity data suggest that for management purposes
the origin of individuals used to repopulate areas after local extinc
tion is not critical (Corbin, 1977). Consideration of ecological re
semblance of the transplant area to the source area may be a more cru
cial factor especially in-the case of trumpeter swans which are notori
ously delicate with respect to habitat. The lack of diverse genetic
resources from which to draw may well be responsible for the sensitivity
to change of this species causing an inherent inability to adapt. The
decimation of the population from encroachment of humans and the slow,
tedious establishment of trumpeter swans in transplant colonies demon
strates the species' inability to pioneer new areas and is possibly re
lated to the lack of plasticity of their genome'.

APPENDICES
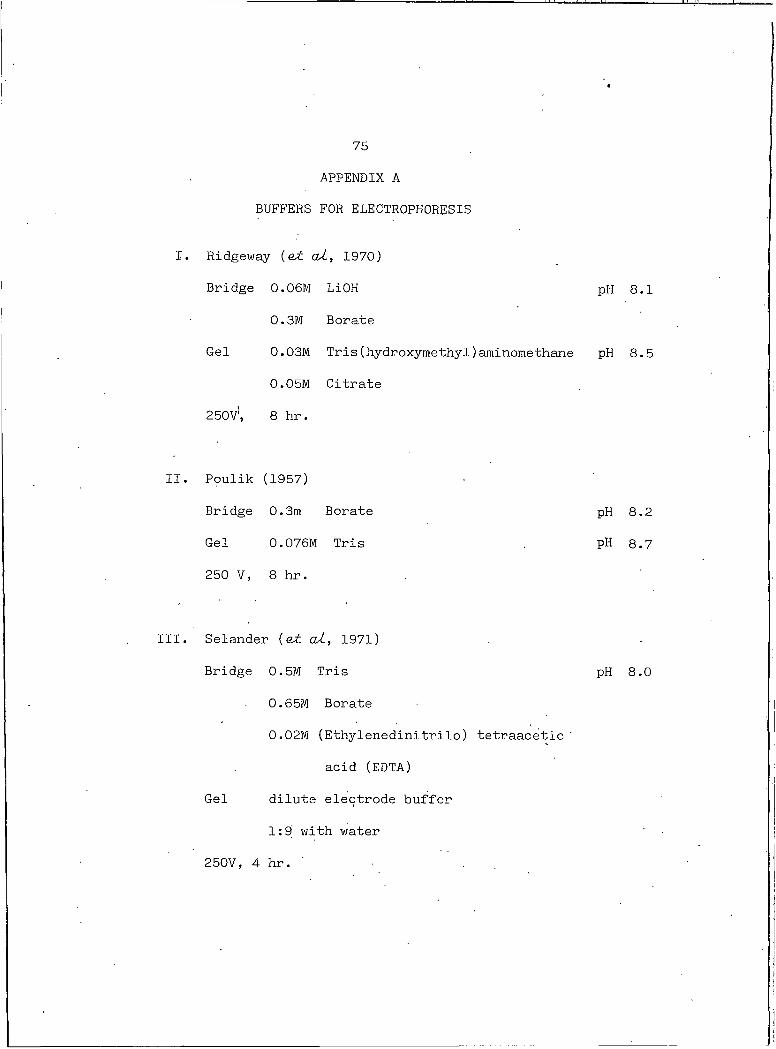
75
BUFFERS FOR ELECTROPHORESIS
I. Ridgeway (e£ aX, 1970)
APPENDIX A
Bridge 0.06M LiOH pH 8.1
0.3M Borate
Gel 0.03M Tris(hydroxymethyl)aminomethane pH 8.5
0.05M Citrate
250V1, 8 hr.
Poulik (1957)
Bridge 0.3m Borate pH 8.2
Gel O .076M Tris pH 8.7
250 V, 8 hr.
III. Selander (eX aX, 1971)
Bridge 0.5M Tris pH 8.0
0.65M Borate
0.02M (Ethylenedinitrilo) tetraacetic
acid (EDTA)
Gel dilute electrode buffer
1:9 with water
250V, 4 hr.
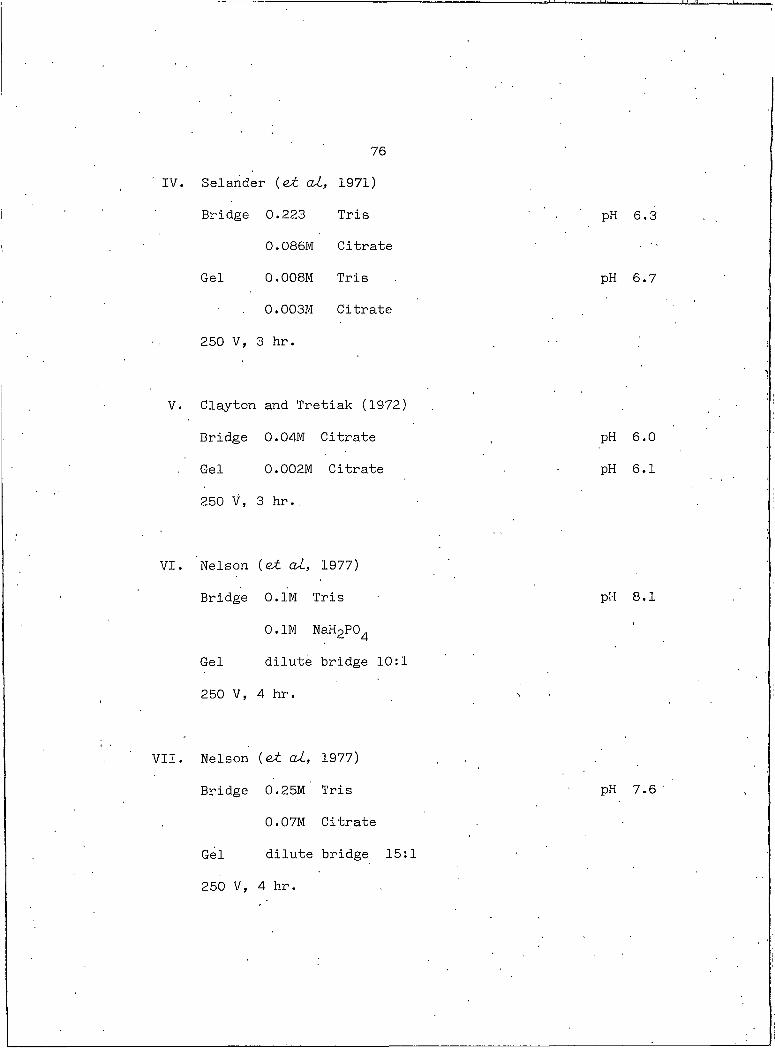
76Selander (ei at, 1971)
Bridge 0.223 Tris
0.086M Citrate
Gel 0.008M Tris
0.003M Citrate
250 V, 3 hr.
V. Clayton and Tretiak (1972)
Bridge 0.04M Citrate
Gel 0.002M Citrate
250 V , 3 hr..
VI. Nelson (et aL, 1977)
Bridge 0.1M Tris
0.1M NaH2PO4
Gel dilute bridge 10:1
250 V, 4 hr.
VII. Nelson (et <xl, 1977)
Bridge 0.25M Tris
0.07M Citrate
Gel dilute bridge 15:1
250 V, 4 hr.
pH 6.3'
pH 6.7
pH 6.0 pH 6.1
pH 8.1
pH 7.6
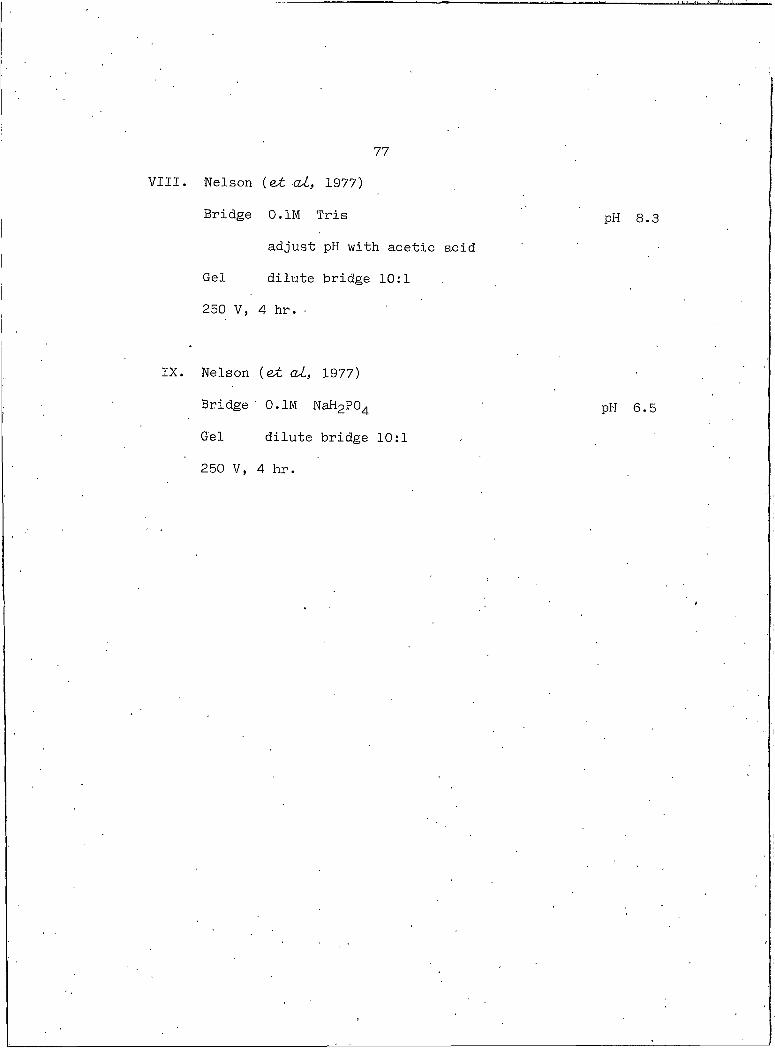
77
VIII. Nelson ( ai, 1977)
Bridge 0.1M Tris
adjust pH with acetic acid
Gel dilute bridge 10:1
250 V, 4 hr. ■
IX. Nelson (&t clL, 1977)
Bridge 0.1M NaH2PO4
Gel dilute bridge 10:1
pH 8.3
pH 6.5
250 V, 4 hr.
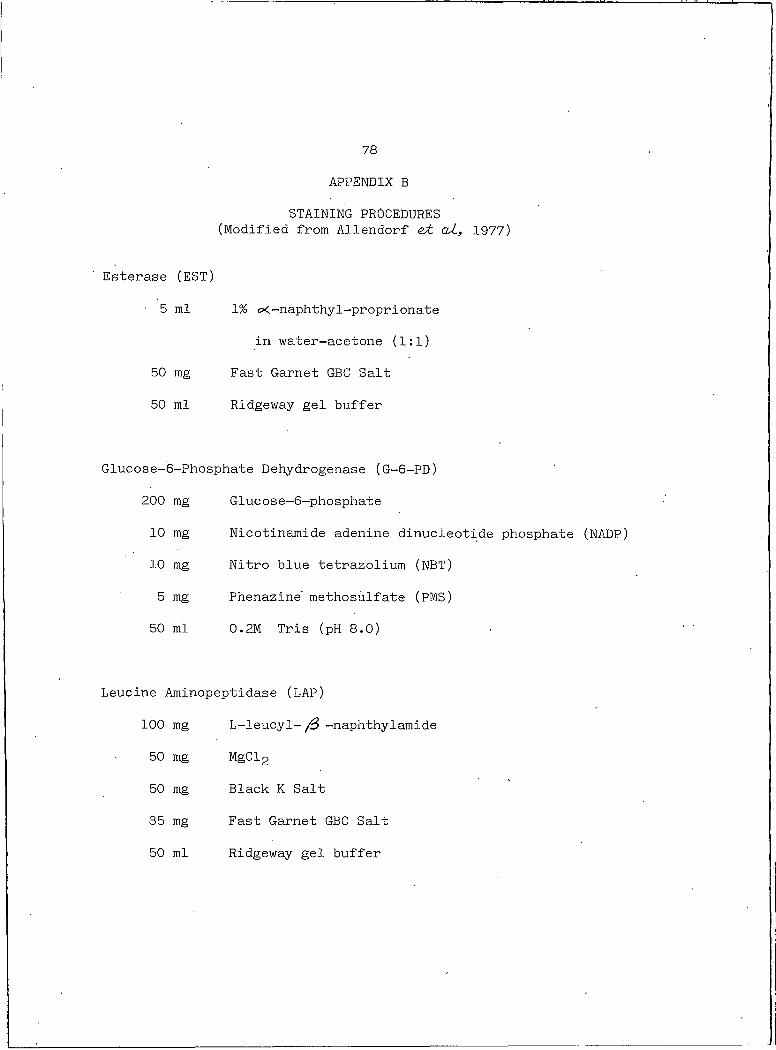
78
STAINING PROCEDURES (Modified from Allendorf eJ: aul, 1977)
APPENDIX B
Esterase (EST)
■ 5 ml 1% eK-naphthyl-proprionate
in water-acetone (1:1)
50 mg Fast Garnet GBC Salt
50 ml Ridgeway gel buffer
Glucose-6-Phosphate Dehydrogenase (G-6-PD)
200 mg Glucose-6-phosphate
10 mg Nicotinamide adenine dinucleotide phosphate (NADP)
10 mg Nitro blue tetrazolium (NBT)
5 mg Phenazine methosulfate (PMS)
50 ml 0.2M Tris (pH 8.0)
Leucine Aminopeptidase (LAP)
100 mg L-Ieucyl- /3 -naphthylamide
50 mg MgCl2
50 mg Black K Salt
35 mg Fast Garnet GBC Salt
50 ml Ridgeway gel buffer
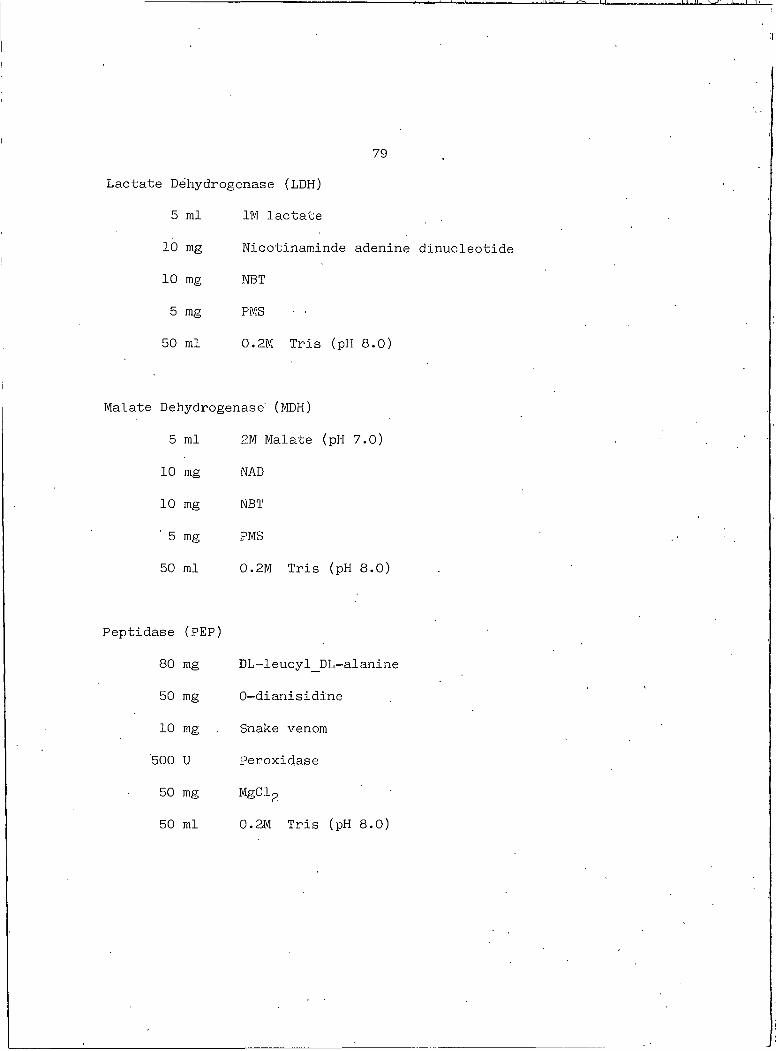
79
Lactate Dehydrogenase (LDH)
5 ml IM lactate
10 mg Nicotinaminde adenin
10 mg NBT
5 mg PMS ■ ■
50 ml 0.2M Tris (pH 8.0)
Malate Dehydrogenase' (MDH)
5 ml 2M Malate (pH 7.0)
10 mg NAD
10 mg NBT
' 5 mg PMS
50 ml 0.2M Tris (pH 8.0)
Peptidase
80
(PEP)
mg DL-Ieucyl DL-alanine
50 mg 0-dianisidine
10 mg . Snake venom
500 U Peroxidase
50 mg MgCl2
50 ml 0.2M Tris (pH 8.0)
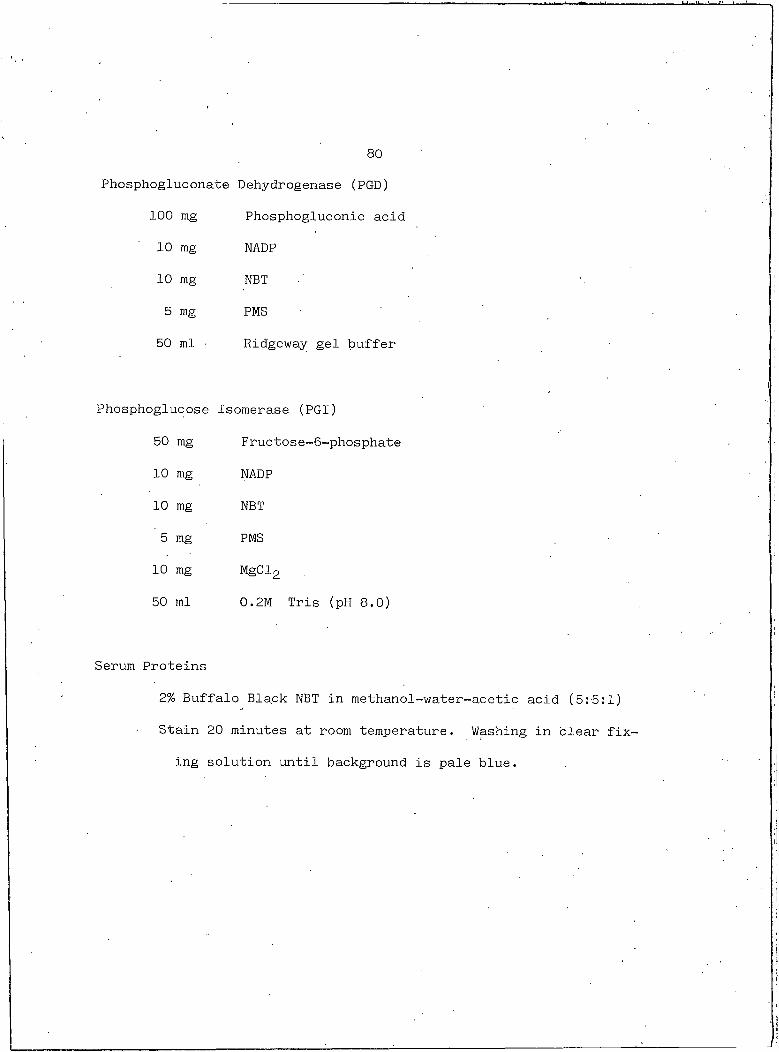
80Phosphogluconate Dehydrogenase (PGD)
100 mg Phosphogluconic acid
10 mg NADP
10 mg NBT
5 mg PMS
50 ml • Ridgeway gel buffer
Phosphoglucose Isomerase (PGI)
50 mg Fructose-6-phosphate
10 mg NADP
10 mg NBT
5 mg PMS
10 mg MgCl2 .
50 ml 0.2M Tris (pH 8.0)
Serum Proteins
2% Buffalo Black NBT in methanol-water-acetic acid (5:5:1)
Stain 20 minutes at room temperature. Washing in clear fix
ing solution until background is pale blue.
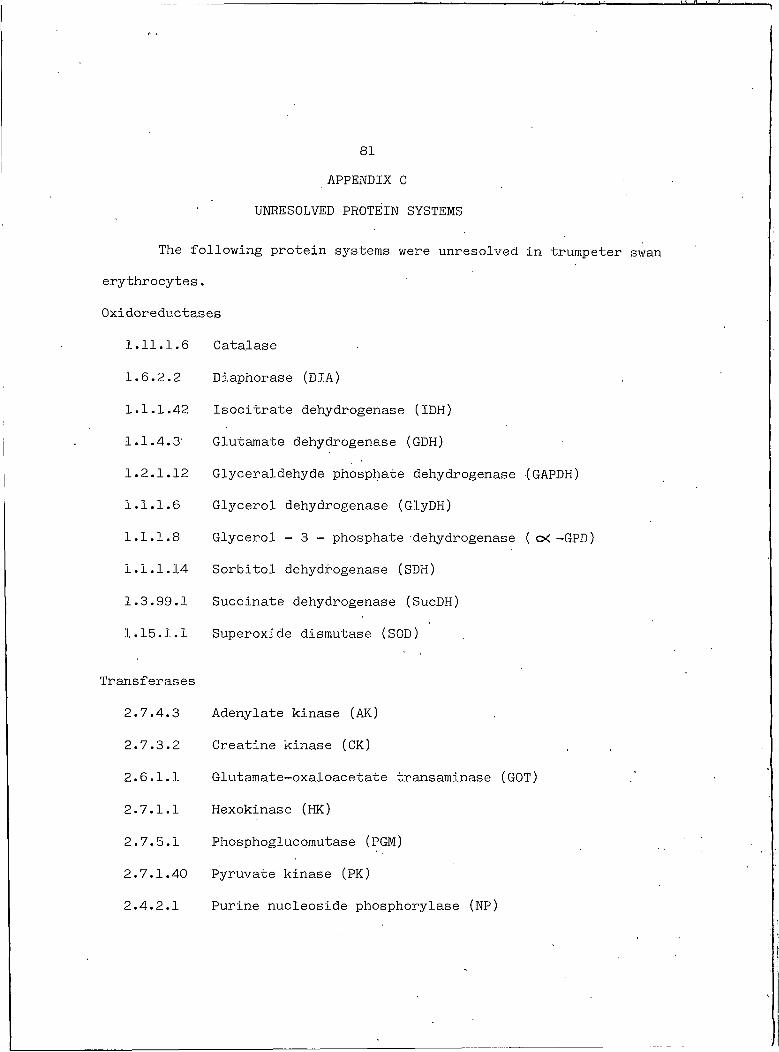
SI
UNRESOLVED PROTEIN SYSTEMS
The following protein systems were unresolved in trumpeter swan
erythrocytes.
Oxidoreductases
APPENDIX C
1.11.1.6 Catalase
I.6.2.2 Diaphorase (DIA)
1.1.1.42 Isocitrate dehydrogenase (IDH)
I .,1.4.3' Glutamate dehydrogenase (GDH)
1.2.1.12 Glyceraldehyde phosphate dehydrogenase (GAPDH)
I.I.I.6 Glycerol dehydrogenase (GlyDH)
1.1.1.8 Glycerol - 3 - phosphate dehydrogenase ( <X -GPD)
1.1.1.14 Sorbitol dehydrogenase (SDH)HO)CDcoI—I Succinate dehydrogenase (SucDH)
I—I I—ImI—i t—I Superoxide dismutase (SOD)
Transferases
2.7.4.3 Adenylate kinase (AK)
2.7.3.2 Creatine kinase (CK)
2.6.1.1 Glutamate-oxaloacetate transaminase (GOT)
2.7.I.I Hexokinase (HK)
2.7.5.1 Phosphoglucomutase (PGM)
2.7.1.40 Pyruvate kinase (PK)
2.4.2.I Purine nucleoside phosphorylase (NP)
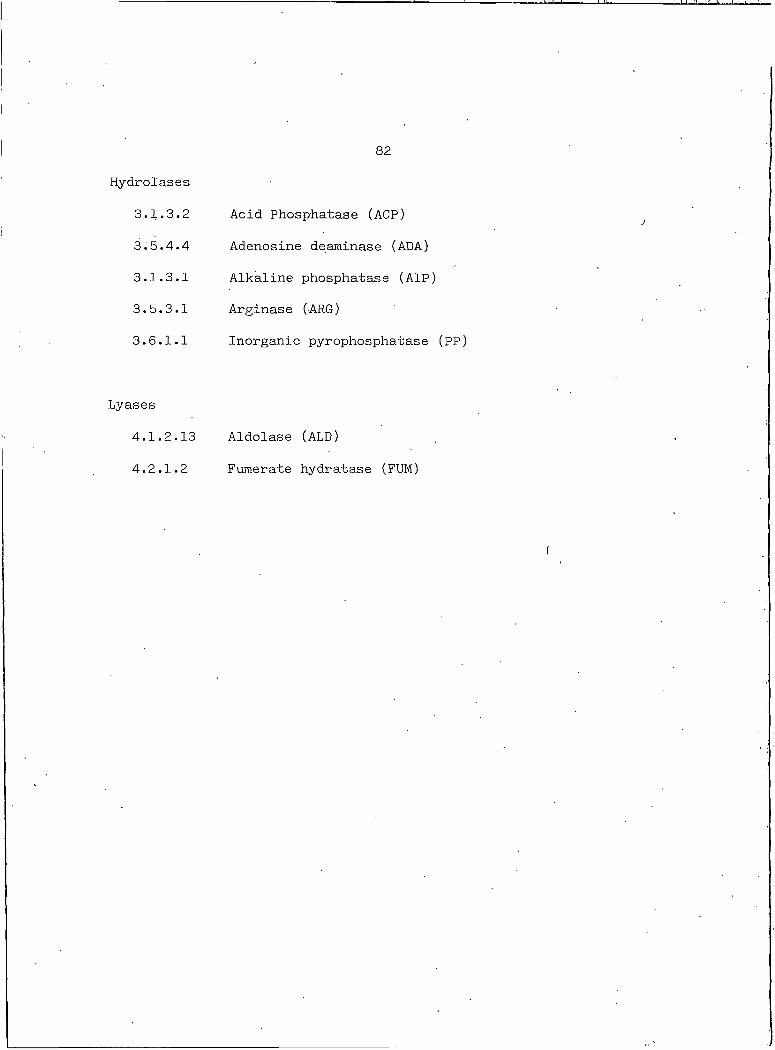
Hydrolases
3.1.3.2
3.5.4.4
3.1.3.1
3.5.3.1
3.6.I.I
Acid Phosphatase (AGP)
Adenosine deaminase (ADA)
Alkaline phosphatase (AIP)
Arginase (ARG)
Inorganic pyrophosphatase (PP)
82
Lyases
4.1.2.13 Aldolase (ALD)
4.2.I.2 Fumerate hydratase (FUM)
83
CLASSIFICATION OF TRUMPETER SWANS AND THEIR
RELATIONSHIP TO OTHER SWANS
The 1979 American Ornithologists Union Checklist places trum
peter swans in the genus OMoa. along with whistling, whooper, and Be
wick's swans and places Hiutei swans in the genus Cy.gn.Uyi. The separation
is due to the presence of the small knob-like protruberance on the fore
head of the mute swan which is lacking in the swans of the genus O-Lo/t.
Black-necked swans are the other member of the Cygncui and have this
knob, but as their name describes, these swans have black heads and
necks rather than the all white adult plummage of the mute, whooper,
whistling, Betwick's and trumpeter swans.
Originally described in 1831 by Dr. John Richardson (Coale, 1915)
as a species distinct from whistling swans, the trumpeter swan was
originally referred to as O-Loa. but by 1880 CygnuA was the preferred name.
Since then both names appear frequently in the literature. The exten
sive study of trumpeter swans in Alaska by. Hansen eut cU. (1971) desig
nated the swans as 0-Lo/i but this changed to CygnuA in a later paper
(Hansen, 1973), Similarly Johnsgard (1974) uses Cygnuyi in a paper dis
cussing the taxonomy of northern swans.
, Johnsgard (1974) deals with the question of how many species of
northern swans are recognized and how. they are related evolutionarily. "Northern swans" are the knobless (smooth culmen) white swans which
breed in the area of the Arctic distinct from the mute swan. Four
APPENDIX D
84
species are generally recognized: whooper, trumpeter, whistling, and
Bewick's swans, yet some argument has been made for the merger of the
Eurasian Bewick's swan and the North American whistling swan. The
tracheal anatomy of the trumpeter swan is convincing evidence for the
separation of this species from the closely related Eurasian whooper
swan and the other two smaller species. A fifth swan CygnuA ankowAk-LL
is now believed to be an invalid classification (Johnsgard, 1974).
Reproductive isolation of populations in natural conditions is
the primary criterion for species designation. Fulfillment of this
requirement is hypothetical when the breeding ranges of populations are
allopatric. Contact in wintering areas may be significant if pairs are
formed for breeding during this time. Obviously the North American and
Eurasian swans are geographically isolated and only rare instances of
sympatry occur between the two species of swans of North America and
between the two swans of Eurasia. In western Alaska the breeding area
of the trumpeter extends into the tundra range of the whistling swan
(Hansen ei aU., 1971) but contact is marginal at most (King, 1973). A
small area of common wintering ground may be in coastal British Columbia
and Washington for these species.
In Eurasia the Bewick's swan is limited to the tundra regions
while the whooper swan breeds in forested areas, but the wintering
grounds of these swans do overlap to some degree (Johnsgard, 1974).
Wild hybrids are not known but similarity of physical traits
85
would make recognition of hybrids virtually impossible. In captivity
at least four of the six possible hybrid combinations have been reported
(Johnsgard, 1974).
Anatomical and behavioral traits of these four species differ
in predictable quantitative ways related to basic size differences prob
ably the result of adaptation to different ecological habitats. Two
general hypotheses for the evolution of these four species have been
proposed by Johnsgard (1974). A single ancestral northern swan could
have been separated into arctic-tundra and temperate breeding zone popu
lations in either North America or Eurasia. Spread into comparable
habitats in the other hemisphere would have been relatively easy for a
tundra-breeding swan because of the virtual lack of transhemispheric
barriers that once existed. A temperate-breeding form (now considered
the whooper and trumpeter swans) would have been more restricted.
The alternate hypothesis (Johnsgard, 1974) considers the possi
bility of an initial split into Eurasian and North American swans from
a single ancestor with subsequent adaptation to tundra and arboreal
habitats. Johnsgard (1974) cites evidence supporting both hypotheses.
Blood samples from a single mute swan collected at Red Rock Lakes,
a whistling swan from Alaska, and four captive trumpeter-whistling swan
hybrids were compared by electrophoresis with samples from trumpeter
swans. The hybrids were the progeny of the whistling swan sampled and
a female trumpeter, also sampled, kept by James King of the'U.S. Fish
86and Wildlife Service in Juneau, Alaska.
The proteins of the whistling swan and of the hybrids were elec-
trophoretically indistinguishable from those of the trumpeter swans,
supporting the close relationship between these species. The similarity
of the twenty loci is more than coincidence but the extremely small
sample size makes definitive conclusions impossible.
The mute swan exhibits a distinctly different esterase with an
electrophoretic mobility greater than the trumpeter swan esterase and
unlike the single variant found for this enzyme among the trumpeter swans
sampled (Figure 15). The difference is considered to be in one locus
because two of the bands seen on the gel are identical between the mute
swan esterase and the trumpeter swan esterase. The mute swan also pro
duces a glucose-6-phosphate dehydrogenase which'migrates faster than the
trumpeter swan enzyme.
Conclusions from these data are premature, but it is safe to
assume that these swans are closely related. In Montana concern has
been expressed about mute swans invading the habitat of the trumpeters
(Shea, 1979). A captive flock of mute swans near Livingston, Montana
has shown limited expansion in the area. A mute-trumpeter pair has
nested on the Henry's Fork River for two successive years and has not
yet produced a brood (Shea, 1979). The mute swan sampled at Red Rock
Lakes was found among a large group of non-breeding trumpeter swans and
was presumably from the Livingston flock (over 150 miles away). Gene
flow between these two species is aesthetically undesirable because of
the aim to restore the trumpeter swan population in the area and elimi
nation of. regional mute swans has been proposed (Shea, 1979).
87
LITERATURE CITED
89LITERATURE CITED
Alison, R. M., 1975 Some previously unpublished historical records of trumpeter swans in Ontario. Can. Field-Nat. 89-311-313.
Allendorf, F. W., N. Mitchell, N. Ryman and G. Stahl, 1977 Isozymicloci in brown trout (S&tmo t/nitto. L.): Detection and interpretation from population data. Hereditas 86:179-190.
American Ornithologist's Union Checklist of North American Birds, 1979 Published by the American Ornithologists' Union.
Ashton, G. C., 1965 Cattle serum transferrin: A balanced polymorphism?Genetics 52:983-997.
Avise, John C., 1975 Systematic value of electrophoretic data. Sys. Zool. 23:465-481.
Avise, J. C., 1976 Genetic differentiation during speciation. pp. 106-122 in Molecular Evolution, F. J. Ayala, ed. Sinauer Assoc. Sunderland, Mass.
Ayala, Francisco J., Martin L. Tracey, Dennis Hedgecock and Rollin C. Richmond, 1974 Genetic differentiation during the speciation process in VtLOAopfliZci. Evolution 28:576-592.
Baker, C. M. Ann and Clyde Manwell, 1975 Molecular biology of avianproteins XII. Protein polymorphism in the stubble quail CoXJu UyiLx. pzcXofultZA and a brief note on the induction of egg white protein synthesis in wild birds by hormones. Comp. Biochem. Physiol. 50B: 471-477.
Baker, C. M. Ann, 1967 Molecular genetics of avian proteins VII.Chemical and genetic polymorphism of conalbumin and transferrin in a number of species. Comp. Biochem. Physiol. 20:949-973.
Baker, C. M. Ann and H. C. Hanson, 1966 Molecular genetics of avian proteins VI. Evolutionary implications of blood proteins of eleven species of geese. Comp. Biochem. Physiol. 17:997-1006.
Baker, C. M. Ann, Clyde Manwell, Ronald F. Labisky and James A. Harper, 1966 Molecular genetics of avian proteins V. Egg, blood, and tissue proteins of the ring-necked pheasant, PhdiZaniLi coZchdUiLi Comp. Biochem. Physiol. 17:467-499.

90
Baker, Erica, D. C. Shaw and E. H. Morgan, 1968 Isolation and characterization of rabbit serum and milk transferrins. Biochemistry 7:1371-1378.
Baker, Myron Charles and Stanley F. Fox, 1978 Dominance, survival and enzyme polymorphism in dark-eyed j uncos JunCO hymciZAJ,. Evolution 32:697-711.
Baker, Myron Charles, 1971 Song dialects and genetic differences in white-crowned sparrows (Zono&u*c.hMl ZtachophAyi). Evolution 29: 226-241.
y' Banko, W. E., 1960 The trumpeter swan. North American Fauna No. 63 Fish and Wildlife Service, Washington, D.C. 214 pp.
Barrowclough, George F. and Kendall W. Corbin, 1978 Genetic variation and differentiation in the Parulidae. Auk 95:691-702.
Beckman, L., and L. R. Nilson, 1965 Variation of serum enzymes in bird species and hybrids. Hereditas 53:221-230.
Beckman, Lois, Fraco Conterio arid Danilo Mainardi, 1962 Protein synthesis in species hybrids of birds. Nature 196:92-93.
Beutler, E. and Z. Collins, 1966 Hybridization studies in the further characterization of erythrocyte glucose-6-phosphate dehydrogenase. Experentig 22;827v828.
Bhatnagar, M. K., 1969 Autosomal determination of erythrocyte glucose- 6-phosphate dehydrogenase in domestic chickens and ring-necked pheasants. Biochem. Gen. 3:85-90.
Bock, Walter J., 1969 The origin and radiation of birds. Ann. N.Y. Acad. Sci. 167:147-155.
Bock, Walter J., 1963 Evolution and phylogeny in morphologically uniform groups. Amer. Nat. 97:265-285.
Boehm, Larry G. arid M. R. Irwin, 1970 Genetic polymorphism of esterase isozymes of the plasma in two species of doves, their hybrids, and backcross hybrids, and in other species of Columbidae.Comp. Biochem. Physiol. 32:377-386.
Bonsignore, A., R. Concedda, A. Nicolini, G. Damiani, and G. DeFlora, 1971a Metabolism of human erythrocyte glucose-6-phosphate dehydrogenase VI Interconversion of multiple molecular forms. Arch. Biochem. Biophys. 147:493-501.
91
Bonsignore, A., R . Concedda, I. Lorenzoni, N. E. Cosulick and A. De-' Flora, 1971b Human erythrocyte glucose-6-phosphat'e dehydrogenase. Physical properties. Biochem. Biophys. Res. Comm. 43:94-101.
Bonsignore, A., I . Lorenzoni, R. Concedda and A. DeFlora, 1970 Distinctive patterns of NADP binding to dimeric and tetrameric glucose-6-phosphate dehydrogenase from human red cells. Biochem. Biophys. Res. Comm. 39:142-148.
Borgese, Thomas A. and John F . Bertles, 1965 Hemoglobin heterogeneity: Embryonic hemoglobin in the duckling and its ,disappearance in the adult. Science 148:509-511.
Brandt, L . W., Robert E . Clegg and A. C . Andrews, 1951 The effect of the age and degree of maturity on the serum proteins of the chicken. J . Biol. Chem. 19:105-111.
Brewer, G. J., 1970 An introduction to isozyme techniques. Academic Press, 186 pp.
Brown, Lauren E . and Harvey I . Fisher, 1966 Electrophoretic study of blood proteins of some Procellaciiform birds. Auk 83:111-116.
Brush, Alan H., 1968 Conalbumin variation in populations of the redwinged blackbird A .eJ,cuMA ph.oefiLc.LUi. Comp. Biochem. Physiol. 25: 159-168.
Brush, Alan H. and Alan F . Scott, 1972 Development of protein polymorphisms, in redwing blackbirds. J . Embry. Exp. Morph. 28:481-489.
Bush, Francis M., 1967 Developmental and populational variation inelectrophoretic properties of dehydrogenases, hydrolases and other blood proteins of the house sparrow, foA ieft dom&iLLcim. Comp. Biochem. Physiol. 22:273-287.
Campbell, Ferrell, 1967 Fine structure of the bone marrow of the chicken and pigeon. J . Morph. 123:405-440.
Canham, Raymond P . and David G. Cameron, 1972 Variation in serum proteins of the red-backed mice CLeuthnLonomyd jiuLUm a and C. g.appeAh. and its taxonomic significance. Can. J . Zool. 50:217-227.
Carter, N. D . and C . W. Parr, 1967 Isoenzymes of phosphoglucose . isomerase in mice. Nature 216:511.
92
Cederbaum, Stephen D . and Akira Yoshida, 1976 Glucose-6-phosphate dehydrogenase in rainbow trout. Biochem. Gen. 14:245-258.
Chen, Shi-han and H. Eldon Sutton, 1967 Bovine transferrin: Sialic acid and the complex phenotype. Genetics 56:425-430.
Clarke, Bryan, 1969 Darwinian evolution of proteins. Science 168: 1009-1011.
Clayton, J . W. and D . N. Tretiak, 1972 Amine-citrate buffers for pH control in starch gel electrophoresis. J . Fish. Res. Bd. Can.
' 29:1169-1172.
Coale, Henry K., 1915 The present status of the trumpeter swan O-Lon. buc.cJjncuto/L. Auk 32:82-90.
Cohen, P . and M. A. Rosemeyer, 1969 Subunit interactions of glucose- 6-phosphate dehydrogenase from human erythrocytes. Eur. J. Bio- chem. 8:8-15.
Common, R. H., W. P . McKinley and W. A. Maw, 1953 F1Ilter paper electrophoresis of avian serum proteins. Science 118:86-89.
Cooper, D . W., M. R . Irwin and W. H. Stone, 1969a Inherited variation in the dehydrogenases of doves {St/Le.ptop&H.a) II. Autosomal inheritance of glucose-6^phosphate dehydrogenase. Genetics .62:607- 617. • ■
Cooper, D . W., M. R. Irwin and W. H. Stone, 1969b Inherited variation in the dehydrogenases of doves (S&ie.p£.op&LLa) I . Studies on 6- phosphogluconate dehydrogenase. Genetics 62:597-606.
Cooper, D . W.. and M. R. Irwin, 1968 Glucose-6-phosphate dehydrogenase Evidence for tetrameric structure in dove {SJyLe.p£.opeJJSa) . Proc. Nat. Acad. Sci. USA 61:979-981.
Cooper, D . W. and J . Rendel, 1968 Incomplete family data, selection, and population studies of transferrin and blood groups in cattle. Heredity 23:49-66.
Corbin, Kendall W., 1977 Genetic diversity in avian populations. In Endangered Birds, Stanley A. Temple, Ed., University of Wisconsin Madison, 466 pp.
Corbin, K. W. and C . G. Sibley, 1977 Rapid evolution in orioles of the genus 3c£eA.UA. Condor 76:307-318.
93
Corbin, Kendall W., Charles G. Sibley, Andrew Ferguson, Allan C . Wilson, Jon E . Ahlquist and Alan H . Brush, 1974 Genetic polymorphism in New Guinea starlings of the genus AptonLsi. Condor 76:', 307-318.
Darnall, Dennis W. and Irving M. Klotz, 1972 Protein Subunits: ATable (revised edition). Arch. Biochem. Biophys. 149:1-14.•
Dayhoff, Margaret 0., 1972 Atlas of Protein Sequence and Structure,Vol. 5. National Biomedical Research Foundation.
De- Lorenzo, Robert J . and Frank H . Ruddle, 1969 Genetic control of two electrophoretic variants of glucose-phosphate isomerase in the mouse {ftluA miuicuLusi). Biochem. Gen. 3:151-162.
I
Desborough, Sharon and M. R . Irwin, 1966 Additional variation in serum proteins of Columbidae. Physiol. Zool. 39:66-69.
Dessaur*, Herbert C . and Eviatar Nevo, 1969 Geographic variation ofblood and liver proteins in Cricket Frogs. Biochem. Gen. 3:171- 188.
Fagerhdl, Magne K. and Mikael Braend, 1965 Serum prealbumin: Polymorphism in man. Science 149:986-987.
Ferguson, Andrew, 1971 Geographic arid species variation in transferrin and ovotransferrin polymorphism in the Columbidae. Comp. Biochem. Physiol. 386:477-486.
v// Fjetland, Conrad A., 1974 Trumpeter swan management in the National Wildlife Refuge system. Trans. 39th N. A. Wildl. Nat. Resc.Conf., pg. 136-141.
Fletcher, J . and E . R. Huehns, 1968 Function of transferrin. Nature 218:1211-1214.
Ford, E . G., 1940 The New Systematics, pp. 493-513, ed. Julian Huxley, Claredon Press. .
Foster, Joseph F., 1960 Plasma Albumin. The Plasma Proteins, Vol. I, Frank W. Putnam, ed., Academic Press.
Frelinger, Jeffrey A., 1972 The maintainance of transferrin polymorphisms in pigeons. Proc. Nat. Acad. Sci. USA 69:326-329.
94
Gahne, Bo, 1966 ' Studies on the inheritance of electrophoretic forms of transferrins, albumins, pre-albumins, and plasma esterases of horses. Genetics 53:681-693.
Gillespie, John H. and Charles H. Langley, 1974 A general model to account for enzyme variation in natural populations. Genetics 76:873-848.
Goodman, Morris, Aravind Kulkarni, Emily Poulik and Evardas Reklys,1965 Species and geographic differences in the transferrin polymorphism of Macaques. Science 147:884-886.
Greene, Frank C. and Robert E . Feeney, 1968 Physical evidence fortransferrins as single polypeptide chains. Biochem. .7:1366-1370.
Haley, Leslie E., 1965 Serum albumin polymorphism in quail and chicken- quail hybrids. Genetics 54:983-986.
Hanford, Paul and Fernando Nottebohm, 1976 Allozymic and morphological variation in population, samples of rufous-collared sparrow, Zono&LLchLa caperuilsi, in relation to vocal dialects. Evolution 30:802-817.
//'"'Hansen,' Henry A., 1973 Trumpeter swan management. Wildfowl 24:27-32.
^,Hansen, Henry A., Peter E . K. Shepherd, James G. King and Willard A..Troyer, 1971 The trumpeter swan in Alaska. Wildlife Monographs .No. 26, 83 pp.
Harris, Harry, 1975 Multiple allelism and isozyme diversity in humanpopulations, pp. 131-147 in Isozymes Vol. IV, .Clement L . M'arkert, ed. Academic Press.
Harris, Harry and D . A. Hopkinson, 1976 Handbook of enzyme electrophoresis in human genetics. North-Holland. Publ. Co.
Henderson, Nanine S., 1965 Isozymes of isocitrate dehydrogenase. J .Exp. Zool. 158:263-274.
Hopkinson, D . A., 1975 The use of thiol reagents in the analysis of isozyme patterns, pp. 489-508 in Isozymes Vol. I, Clement L .Markert, ed. Academic Press.
Hubby, J . L . and R . C . Lewontin, 1966 A molecular approach to thestudy of genic heterozygosity in natural populations I . The number of alleles at different loci in D/io ophLla p4<zu.doob’-4cuA.a. Genetics 54:577-594.
95
Huisman, T . H . J . and J . M. Schillhorn Van Veen, 1964 Studies onanimal hemoglobins III. The possible role of intracellular inorganic phosphate on the oxygen equilibrium of the hemoglobin in the developing chicken. Biochem. Biophys. Acta 88:367-374.
Huisman, T . H. J., J . M. Schillhorn Van Veen, A. M. Dozy and C . M.Nechtman, 1964 Studies on animal hemoglobins II. the influence of inorganic phosphate on the physio-chemical and physiological properties of the hemoglobin of the adult chicken. Biochem.Biophys. Acta 88:352-366.
Hunter, R . L . and C . L . Markert, 1957 Histochemical demonstration of enzymes separated by zone electrophoresis in starch gels. Science 125:1294-1295.
Johnsgard,' Paul A., 1974 The taxonomy and relationships of the northern ' swans. Wildfowl 25:155-162.
Johnson, George B., 1974 Enzyme polymorphism and metabolism. Science 184:28-37.
Johnson, George B., 1971 Metabolic implications of polymorphism as. an adaptive strategy. Nature 232:347..
Kaminski, Marie, 1964 Esterases in avian sera: Species specific pattern and individual variation. Experentia 20:286-287.
Karig, Lynda M. and Allan C . Wilson, 1971 Gentic-variation in supernatant malate dehydrogenase of birds and reptiles. Biochem. Gen. 5:211-221.
Kimura, Motoo, 1968 Evolutionary rate at the molecular level. Nature 217:624-626.
Kimura, Motoo and Tomoko Ohta, 1973 Mutation and evolution at the molecular level. Genetics 73(s):19-35.
King, Jack Lester and. Thomas H. Jukes, 1969 Non-Darwinian evolution. Science 164:788-798.
King, James G., 1973 The use' of small- airplanes to gather swan data in Alaska. Wildfowl 24:15-20.
Kitto, G. B., F . E . Stolzenbach and N . 0. Kaplan, 1970 Mitochondrial malate dehydrogenase: Further studies ,on multiple molecular forms .Biochem. Biophys. Res. Comm. 38:31-39.
96Kitto, G . B . and A. C . Wilson, 1966 Evolution of malate dehydrogenase
in birds. Science 153:1408-1409.
Kitto, G . Barrie, Paul M. Wasserman and 0. Nathan, 1966 Enzymatically active conformers of mitochondrial malate dehydrogenase. Proc. Nat. Acad. Sci. USA 56:578-585.
Klebe, Robert J., 1975 A simple method for the- quantitation of isozyme patterns. Biochem. Gen. 13:805-812.
Law, G. R . J., 1967 Alkaline phosphatase and leucine aminopeptidase association in plasma of the chicken. Science 156:1106-1107.
Lewis, W. H. P . and Harry Harris, 1969 Molecular size estimates ofhuman peptidases determined by separate gene loci. Ann. Hum. Gen. 33:89-92.
Lush, I. E., 1967' The Biochemical Genetics of Vertebrates except Man,• 118 pp-., North-Holland Publishing Co.
Lynch, J. 0. and E . R . Vyse, 1979 Genetic variability and divergence in grayling IhymaLLuA o/lcLLcua . Genetics 92:263-278.
Manwell, Clyde and C . M. Ann Baker, 1969 Hybrid proteins, heterosis and the origin of species I. Unusual variation of polychaete HyaLLrLO&cLa "nothing dehydrogenases" and of quail CoJttunnLx. erythrocyte enzymes. Comp. Biochem. Physiol. 28:1007-1028.
Manwell, Clyde, C . M. Ann Baker and T . W. Betz, 1966 Ontogeny of hemoglobin in the chicken.- J. Emb. Exp. Morp. 16:65-81.
Markert, Clement L , James B . Shaklee and Gregory S . Whitt, 1975 Evolution of a gene. Science 189:102-113.
Mathai, C . K., Susumu Ohno and Ernest Beutler, 1966 .Sex-linkage ofglucose-6-phosphate dehydrogenase in Equidae. Nature 210:115-116.
Mayr, Ernst, 1963 Animal Species and Evolution, Belknap Press, Harvard University, 797 pp.
McDougall, E . .I. and V. P . W. Lowe, 1968 Transferrin polymorphism and serum proteins of some British deer. J . Zool. 155:131-140.
Mclndoe, W. M., 1962 Occurrence of two plasma albumins in the domestic fowl. Nature 195:353-354.
97
Metzger, Robert P., Sue S. Wilcox and Anne N. Wick, 1965 Subcellular distribution and properties of hepatic glucose dehydrogenases of selected vertebrates. J . Biol. Chem. 240:2761-2767.
!/"Monson, Melvin A., 1956 Nesting of trumpeter swan in the lower Copper River Basin, Alaska. Condor 58:444-445.
Moore, Dan H., 1945 Species differences in serum protein patterns.. .J. Biol. Chem. 161:21-32.
.■ Mueller, Joan O., Oliver Smithies and M. R . Irwin, 1962 Transferrin variation in Columbidae. Genetics 47:1385-1392.
Muller, C . J., 1960 Separation of the c<- and /5- chains of globins by means of starch gel electrophoresis.. Nature 186:643.
Nei, Masotoshi, 1975 Molecular population genetics and Evolution, North-Holland Publishing Co.
Nei, Masatoshi, 1972 Genetic distance between populations. Amer. Nat. 106:283-292.
Nei, Masatoshi and A. K. Roychoudhury, 1974 Sampling variances of heterozygosity and genetic distance. Genetics 76':379-390.
Nelson, R . L., S . Povey, D . A. Hopkinson and H. Harris, 1977 Detection • after electrophoresis of enzymes involved in ammonia metabolism
using L -glutamate dehydrogenase as a linking enzyme. Biochem. Gen. 15:1023-1035.
Niece, R. L . and D . W . Kracht, 1967 Genetics of transferrins in burros ((LqsUUA OAUZUA) . Genetics 57:837-41.
Nottebohm, Fernando and Robert K. Selander, 1972 Vocal dialetcs and gene frequencies in the Chingolo Sparrow (ZoizoiytLchLa eap&ZALA). Condor 74:137-143.
Ogden, A. L., J . R . Morton and E . M. McDermid, 1962 Inherited variants in the transferrins and conalbumins of the chicken: Nature 195:1026-1028.
Ohno, E., C . Stenius, L . C . Christian and C . Harris, 1968 Synchronous activation of both parental alleles at the 6-phosphogluconate dehydrogenase locus of Japanese quail embryos. Biochem. Gen. 2: 197-204.
98Ohno, Susumu, Jackie Poole and Ingemar Gustavsson, 1965 Sex-linkage
of erythrocyte glucose-6-phosphate dehydrogenase in two species of wild hares. Science 150:1737-1738.
Owen, Richard C . and Jack Bennett, 1972 Electrophoretic study of mallard serum proteins. Auk 89:660-663.
Page, Roger D., 1976 The ecology of trumpeter swans on Red Rock Lakes National Wildlife Refuge, Montana.. Ph.D. dissertation, University of Montana, Missoula, 143 pp.
Parker, W. Carey and Alexander G. Bearn, 1962 Additional genetic variation of human serum transferrin.. Science 137:854-856.
Poulik, M. D ., 1957 Starch gel electrophoresis in a discontinuous system of buffers. Nature 180:1477-1479.
Powell, Jeffrey R., 1975 Protein variation in natural populations of animals. Evolutionary Biology, Vol. 8 , Plenum Press, pp. 79-119.
Prakash, Satya, R . C . Lewontin and J . L . Hubby, 1969 A molecularapproach to the study of genic heterozygosity in natural populations IV. Patterns of genic variation in central and marginal and isolated populations of Dn-OdopkLla pde.adoobdc.iLna. Genetics 61:844-858.
Quinteros, Indalecio R., R. W. C . Stevens, C. Stormont and V. S . Asmund- son, 1964 Albumin phenotypes in turkeys. Genetics 50:579-582.
Rattazzi, Mario C., 1968 Glucose-6-phosphate dehydrogenase from human erythrocytes: Molecular weight determination by gel filtration.Biochem. Biophys. Res. Comm. 31:16-24.
Redfield, J . A., 1973 Demography and genetics in colonizing populations of blue grouse. Evolution 27:576-592.
Richmond, Rollin C., 1970 Non-Darwinian evolution: A critique.Nature 225:1025-1028.
Ridgeway, G. J., S . W. Sherburne and R. D . Lewis, 1970 Polymorphismin the esterases of Atlantic herring. Trans. Amer. Fish Soc.99:147-151.
99Rylander, Michael Kent, 1967 The electrophoretic patterns of the
serum proteins of the genera 8/LoJJ a and E/uzunoJieA (Family Scolo- padidae). Murrelet 48:39-40.
Segre, Amelia, Rollin C . Richmond and R. Haven Wiley, 1970 Isozyme polymorphism in the ruff (Aves, ftiLLomaduiA pugnax.) a species with polymorphic pIummage. Comp. Biochem. Physiol. 36:589-595.
Selander, Robert K. and Donald W . Kaufman, 1973 Genic variability and strategies of adaptation in ,animals. Proc. Nat. Acad. Sci. USA 70:1875-1877.
Selander, Robert K., Michael H. Smith, Suh Y. Yang, Walter E . Johnsonand John B . Gentry, 1971 Biochemical polymorphism and systematics in the genus feA.omys4c.u4 I . Variation in the old-field mouse {feA.omys4cus4 po<LLonot.uA) . Studies in Genetics VI, University of Texas Publication 7103.
Selander, Robert K . and Suh Y Yang, 1969 Protein polymorphism and genic heterozygosity in a wild population of the house mouse • muACJJsLua ) . Genetics 63:653-667.
Shaughnessy, P . D., 1970 Ontogeny of hemoglobin in the royal penguin EudypteA ctuiyAotaphuA 4ch.eg.edt. J. Emb. Exp. Morph. 24:225-228.
Shaw, Charles R., 1970 How many genes evolve? ■Biochem. Gen. 4:275-283.
Shaw, Charles R., 1965 Electrophoretic variation in enzymes. Science 149:936-943.
Shaw, Charles R. and Elizabeth Barto, 1965 Autosomally determinedpolymorphism of glucose-6-phosphate dehydrogenase in Peromyscus. Science 148:1099-1100. .
"Shea, Ruth E., 1979 The ecology of trumpeter swan in YellowstoneNational Park and vicinity. Master thesis, University of Montana, Missoula, 132 pp.
Sibley, Charles G. and Herbert T. Hendrickson, 1970 A comparativeelectrophoretic study of avian plasma proteins. Condor 72:43-49.
Sibley, Charles G. and Paul A. Johnsgard, 1959 Variability in theelectrophoretic patterns of avian serum proteins. Condor 61:85-95
100
Smith, Jackson K. and Earl G. Zimmerman, 1976 Biochemical genetics and evolution of North American blackbirds, Family Icteridae. Comp. Biochem. Physiol. 538:319-324.
Smithies, G., 1955 Zone electrophoresis in starch gels: group variations in the serum proteins of normal adults. Biochem. J . 61:629- 641.
Smithies, 0. and 0. Hiller, 1959 The genetic control of transferrins in humans. Biochem. J . 72:121-126.
Stegeman, John J . and Toshio Yamauchi, 1975 Enzymatic and immunochemical homologies of hexose-6-phosphate dehydrogenase in fish, pp. 477-489 in Isozymes, Vol. IV, Clement L . Markert, ed., Academic Press.
Stratil, A., 1972 Isolation and partial characterization of polymorphic prealbumins from chicken egg yolk and serum. Animal Bid. Groups Biochem. Gen. 3:63-75.
Turner, Bruce J . and Stephen D . Cederbaum, 1975 Gel isoelectric focusing and the microheterogeneity of human glucose-6-phosphate dehydrogenase, pp. 653-660 in Isozymes, Vol. I , Clement L . Markert, ed.
Turner, Bryan M., Rachel A. Fisher and Harry Harris, 1975 - Post-trans- lational alterations of human erythrocyte enzymes, pp. 781-795 in Isozymes, Vol. I , Clement L . Markert, ed. Academic Press.
Uzzell, Thomas and Kendall W.. Corbin, 1972 Evolutionary rates in cis- ' trons specifying mammalian hemoglobin c and /5-chains: Pheneticversus patristic measurements. Amer. Nat. 106:555-573.
Van Thoai, Ngu Yen, Jean Roche, Ed., 1968 Homologous Enzymes and Biochemical Evolution, pp. 436, Gordon and Breach Publishers.
VandeBerg, J . L . and P . 'G. Johnston, 1977 A simple technique for longterm storage of erythrocytes for enzyme electrophoresis. Biochem. Gen. 15:213-215.
Vohs, Paul A. and Larry R. Carr, 1969 Genetic and population studies of transferrin polymorphism in ring-necked pheasant. Condor 747: 434-447.
Walker, Michael J., 1968 Back from the brink. Amer. For. 74:20-23.
101Wall, Robert L. and Hans G. Schlumberger, 1957 Electrophoresis of
plasma proteins in the parakeet. Science 125:993-994.
Ward, Robert D.j 1977 Relationship between enzyme heterogeneity and quaternary structure. Biochem. Gen. 15:123-135.
Williams, J., 1962 A comparison of conalbumin and transferrin in the domestic fowl. ' Biochem. J . 83:355-364.
Wrigley, N . G., J . V. Heather, A. Bonsignore and A. DeFlora, 1972Human erythrocyte glucose-6-phosphate dehydrogenase: Electrophoretic mobility studies on structure and interconversion of tetramers, dimers, and monomers. J . Mol. Biol. 68:485-499.
Yamauchi, T . and E . Goldberg, 1975 Glucose—6—phosphate dehydrogenase in brook, lake, and splake trout: An isozymic and developmentalstudy, pp. 403-416 in Isozymes, Vol. Ill, Clement L . Markert, ed
Yoshida, Akira, 1975 Evolution of glucose-6-phosphate dehydrogenase and hexose-6-phosphate dehydrogenase, pp. 853-866 in Isozymes,Vol. IV, Clement L. Markert, ed., Academic Press.
Yoshida, Akira, 1973 Hemolytic anemia and glucose-6-phosphate dehydro genase deficiency. Science 179:532-537.
Young, William J., 1966 X-Iinked electrophoretic variation in 6-phos- phogluco'nate dehydrogenase. J . Heredity 57:58-60.
MONTANA STATE UNIVERSITY LIBRARIES
3 762 10012814 7
N378 B2755 cop. 2
Barrett, Victoria A Genetic comparison of
trumpeter swan populations
D A T E I S S U E D T O
,ow
vJU4afi24 ,b?
Copyright © 2022 FDOKUMEN