Genetic and morphometric diversity in the Lark Sparrow (Chondestes grammacus) suggest discontinuous...
16
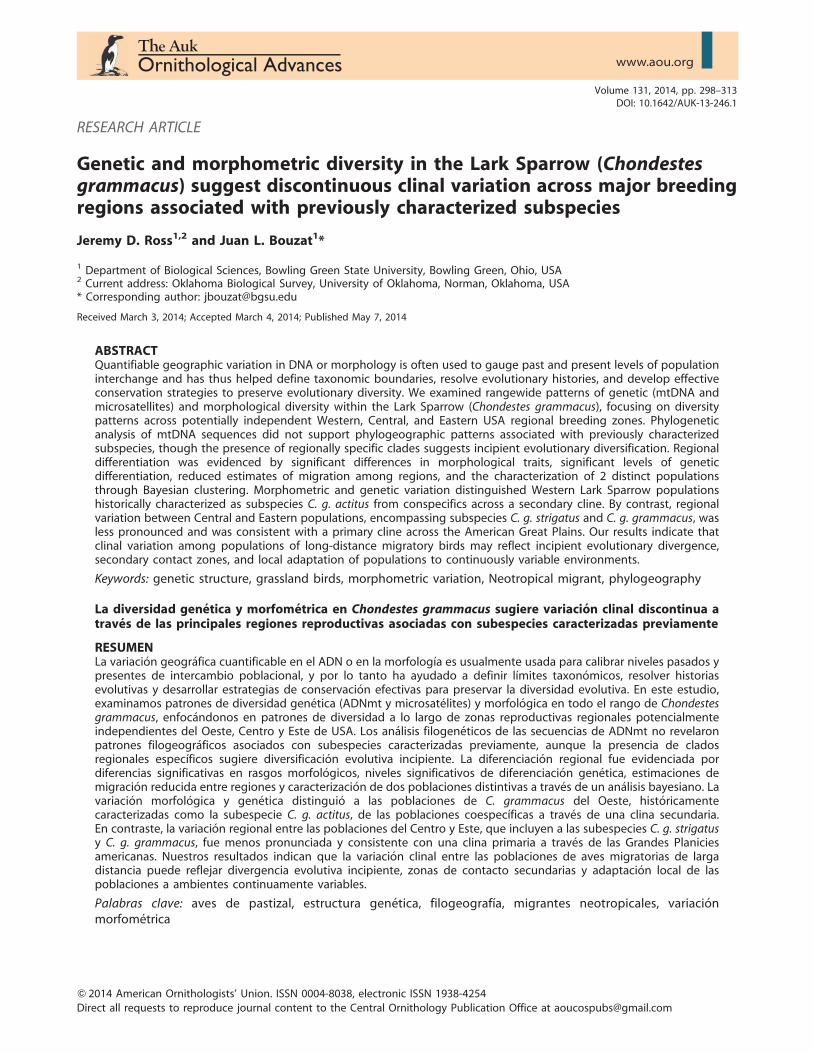
Volume 131, 2014, pp. 298–313 DOI: 10.1642/AUK-13-246.1 RESEARCH ARTICLE Genetic and morphometric diversity in the Lark Sparrow (Chondestes grammacus) suggest discontinuous clinal variation across major breeding regions associated with previously characterized subspecies Jeremy D. Ross 1,2 and Juan L. Bouzat 1 * 1 Department of Biological Sciences, Bowling Green State University, Bowling Green, Ohio, USA 2 Current address: Oklahoma Biological Survey, University of Oklahoma, Norman, Oklahoma, USA * Corresponding author: [email protected] Received March 3, 2014; Accepted March 4, 2014; Published May 7, 2014 ABSTRACT Quantifiable geographic variation in DNA or morphology is often used to gauge past and present levels of population interchange and has thus helped define taxonomic boundaries, resolve evolutionary histories, and develop effective conservation strategies to preserve evolutionary diversity. We examined rangewide patterns of genetic (mtDNA and microsatellites) and morphological diversity within the Lark Sparrow (Chondestes grammacus), focusing on diversity patterns across potentially independent Western, Central, and Eastern USA regional breeding zones. Phylogenetic analysis of mtDNA sequences did not support phylogeographic patterns associated with previously characterized subspecies, though the presence of regionally specific clades suggests incipient evolutionary diversification. Regional differentiation was evidenced by significant differences in morphological traits, significant levels of genetic differentiation, reduced estimates of migration among regions, and the characterization of 2 distinct populations through Bayesian clustering. Morphometric and genetic variation distinguished Western Lark Sparrow populations historically characterized as subspecies C. g. actitus from conspecifics across a secondary cline. By contrast, regional variation between Central and Eastern populations, encompassing subspecies C. g. strigatus and C. g. grammacus, was less pronounced and was consistent with a primary cline across the American Great Plains. Our results indicate that clinal variation among populations of long-distance migratory birds may reflect incipient evolutionary divergence, secondary contact zones, and local adaptation of populations to continuously variable environments. Keywords: genetic structure, grassland birds, morphometric variation, Neotropical migrant, phylogeography La diversidad gen ´ etica y morfom´ etrica en Chondestes grammacus sugiere variaci ´ on clinal discontinua a trav ´ es de las principales regiones reproductivas asociadas con subespecies caracterizadas previamente RESUMEN La variaci ´ on geogra ´fica cuantificable en el ADN o en la morfolog´ ıa es usualmente usada para calibrar niveles pasados y presentes de intercambio poblacional, y por lo tanto ha ayudado a definir l´ ımites taxon ´ omicos, resolver historias evolutivas y desarrollar estrategias de conservaci ´ on efectivas para preservar la diversidad evolutiva. En este estudio, examinamos patrones de diversidad gen ´ etica (ADNmt y microsat ´ elites) y morfol ´ ogica en todo el rango de Chondestes grammacus, enfoca ´ ndonos en patrones de diversidad a lo largo de zonas reproductivas regionales potencialmente independientes del Oeste, Centro y Este de USA. Los ana ´ lisis filogen ´ eticos de las secuencias de ADNmt no revelaron patrones filogeogra ´ ficos asociados con subespecies caracterizadas previamente, aunque la presencia de clados regionales espec´ ıficos sugiere diversificaci ´ on evolutiva incipiente. La diferenciaci ´ on regional fue evidenciada por diferencias significativas en rasgos morfol ´ ogicos, niveles significativos de diferenciaci ´ on gen´ etica, estimaciones de migraci ´ on reducida entre regiones y caracterizaci ´ on de dos poblaciones distintivas a trav ´ es de un ana ´ lisis bayesiano. La variaci ´ on morfol ´ ogica y gen ´ etica distingui ´ o a las poblaciones de C. grammacus del Oeste, hist ´ oricamente caracterizadas como la subespecie C. g. actitus, de las poblaciones coespec´ ıficas a trav ´ es de una clina secundaria. En contraste, la variaci ´ on regional entre las poblaciones del Centro y Este, que incluyen a las subespecies C. g. strigatus y C. g. grammacus, fue menos pronunciada y consistente con una clina primaria a trav ´ es de las Grandes Planicies americanas. Nuestros resultados indican que la variaci ´ on clinal entre las poblaciones de aves migratorias de larga distancia puede reflejar divergencia evolutiva incipiente, zonas de contacto secundarias y adaptaci ´ on local de las poblaciones a ambientes continuamente variables. Palabras clave: aves de pastizal, estructura gen ´ etica, filogeograf´ ıa, migrantes neotropicales, variaci ´ on morfom ´ etrica Q 2014 American Ornithologists’ Union. ISSN 0004-8038, electronic ISSN 1938-4254 Direct all requests to reproduce journal content to the Central Ornithology Publication Office at [email protected]
Transcript of Genetic and morphometric diversity in the Lark Sparrow (Chondestes grammacus) suggest discontinuous...
Volume 131, 2014, pp. 298–313DOI: 10.1642/AUK-13-246.1
RESEARCH ARTICLE
Genetic and morphometric diversity in the Lark Sparrow (Chondestesgrammacus) suggest discontinuous clinal variation across major breedingregions associated with previously characterized subspecies
Jeremy D. Ross1,2 and Juan L. Bouzat1*
1 Department of Biological Sciences, Bowling Green State University, Bowling Green, Ohio, USA2 Current address: Oklahoma Biological Survey, University of Oklahoma, Norman, Oklahoma, USA* Corresponding author: [email protected]
Received March 3, 2014; Accepted March 4, 2014; Published May 7, 2014
ABSTRACTQuantifiable geographic variation in DNA or morphology is often used to gauge past and present levels of populationinterchange and has thus helped define taxonomic boundaries, resolve evolutionary histories, and develop effectiveconservation strategies to preserve evolutionary diversity. We examined rangewide patterns of genetic (mtDNA andmicrosatellites) and morphological diversity within the Lark Sparrow (Chondestes grammacus), focusing on diversitypatterns across potentially independent Western, Central, and Eastern USA regional breeding zones. Phylogeneticanalysis of mtDNA sequences did not support phylogeographic patterns associated with previously characterizedsubspecies, though the presence of regionally specific clades suggests incipient evolutionary diversification. Regionaldifferentiation was evidenced by significant differences in morphological traits, significant levels of geneticdifferentiation, reduced estimates of migration among regions, and the characterization of 2 distinct populationsthrough Bayesian clustering. Morphometric and genetic variation distinguished Western Lark Sparrow populationshistorically characterized as subspecies C. g. actitus from conspecifics across a secondary cline. By contrast, regionalvariation between Central and Eastern populations, encompassing subspecies C. g. strigatus and C. g. grammacus, wasless pronounced and was consistent with a primary cline across the American Great Plains. Our results indicate thatclinal variation among populations of long-distance migratory birds may reflect incipient evolutionary divergence,secondary contact zones, and local adaptation of populations to continuously variable environments.
Keywords: genetic structure, grassland birds, morphometric variation, Neotropical migrant, phylogeography
La diversidad genetica y morfometrica en Chondestes grammacus sugiere variacion clinal discontinua atraves de las principales regiones reproductivas asociadas con subespecies caracterizadas previamente
RESUMENLa variacion geografica cuantificable en el ADN o en la morfologıa es usualmente usada para calibrar niveles pasados ypresentes de intercambio poblacional, y por lo tanto ha ayudado a definir lımites taxonomicos, resolver historiasevolutivas y desarrollar estrategias de conservacion efectivas para preservar la diversidad evolutiva. En este estudio,examinamos patrones de diversidad genetica (ADNmt y microsatelites) y morfologica en todo el rango de Chondestesgrammacus, enfocandonos en patrones de diversidad a lo largo de zonas reproductivas regionales potencialmenteindependientes del Oeste, Centro y Este de USA. Los analisis filogeneticos de las secuencias de ADNmt no revelaronpatrones filogeograficos asociados con subespecies caracterizadas previamente, aunque la presencia de cladosregionales especıficos sugiere diversificacion evolutiva incipiente. La diferenciacion regional fue evidenciada pordiferencias significativas en rasgos morfologicos, niveles significativos de diferenciacion genetica, estimaciones demigracion reducida entre regiones y caracterizacion de dos poblaciones distintivas a traves de un analisis bayesiano. Lavariacion morfologica y genetica distinguio a las poblaciones de C. grammacus del Oeste, historicamentecaracterizadas como la subespecie C. g. actitus, de las poblaciones coespecıficas a traves de una clina secundaria.En contraste, la variacion regional entre las poblaciones del Centro y Este, que incluyen a las subespecies C. g. strigatusy C. g. grammacus, fue menos pronunciada y consistente con una clina primaria a traves de las Grandes Planiciesamericanas. Nuestros resultados indican que la variacion clinal entre las poblaciones de aves migratorias de largadistancia puede reflejar divergencia evolutiva incipiente, zonas de contacto secundarias y adaptacion local de laspoblaciones a ambientes continuamente variables.
Palabras clave: aves de pastizal, estructura genetica, filogeografıa, migrantes neotropicales, variacionmorfometrica
Q 2014 American Ornithologists’ Union. ISSN 0004-8038, electronic ISSN 1938-4254Direct all requests to reproduce journal content to the Central Ornithology Publication Office at [email protected]
INTRODUCTION
Regional diversifications form the leading edge of taxo-
nomic splits within species and, thus, are central to the
evolutionary process. In most cases, diversification begins
when gene flow becomes limited, predominantly tied to
physical barriers separating populations (Slatkin 1987,
Avise and Walker 1998, Avise 2000). The process of
regional diversification is usually initiated by changes in
the genetic composition of populations, with concurrent
changes in morphological or behavioral variation promot-
ing local adaptations. When population connectivity is
restricted over long evolutionary time, these changes may
lead to the emergence of independent evolutionary
lineages (i.e. reciprocally monophyletic clades) differenti-
ating subspecies, and, eventually, to potential speciation
events (Barton and Hewitt 1989, Wakeley 2000). Evidence
is mounting that, in spite of limited boundaries to gene
flow, widely distributed migratory birds may experience
regionally specific selective pressures across varied breed-
ing environments, which can lead to clinal variation rather
than discrete population units based on morphological,
behavioral, and genetic traits (James 1991, Webster et al.
2002).
The concept of ‘‘subspecies’’ has long been debated,
particularly with regard to its scientific validity and
methods to objectively classify intraspecific variation (Zink
2004, Winker 2010). Subspecies have commonly been
defined as locally adapted populations representingindependent evolutionary lineages. Delineating subspecies,
however, has been a subject of debate, with one camp
demanding reciprocal monophyly (Avise 2000, Zink 2004,
Phillimore and Owens 2006) while the other suggests a
‘‘75% rule’’ for the assignment of individuals to proposed
subspecies (Amadon 1949, Patten and Unitt 2002).
Recently, additional debate has emerged regarding whether
subspecies are ‘‘geographic populations diagnosable by
one or more phenotypic traits’’ (Remsen 2010) or simply a
‘‘tool of art’’ or ‘‘convenience’’ that delineate arbitrary
parcels of a species’ natural variation (Fitzpatrick 2010).
Subspecies delineation, under any definition, requires that
there be natural breaks in the distribution of measurable
characters that are geographically concordant (Patten
2010). Such breaks may be readily apparent among
allopatric conspecifics, such as forest birds of Eastern
versus Western North America (e.g., Ball and Avise 1992,
Boulet and Gibbs 2006). Species distributed across broad
geographic regions, on the other hand, may have less cause
to differ because they encounter fewer overt barriers to
genetic connectivity. In these cases, intraspecific variation
may exist simply as clines driven by gradual changes in
environmental factors.
Evidence that populations of migratory birds are
regionally differentiated has become increasingly report-
ed using various techniques, including phylogenetics,
population genetics, multivariate morphometrics, and
stable isotope analysis. For example, researchers have
used such techniques to map subdivisions at various
points throughout the annual migratory cycle in song-
birds such as Black-throated Blue Warblers (Setophaga
caerulescens; Rubenstein et al. 2002, Davis et al. 2006),
Yellow Warblers (S. petechia; Boulet and Gibbs 2006), and
Eurasian Blackcaps (Sylvia atricapilla; Berthold et al.
1992, Perez-Tris et al. 2004). However, these species
represent primarily woodland or marshland bird species
that inhabit discrete habitats and, therefore, may be more
prone to become geographically differentiated (Newton
2003). By contrast, populations from a large number of
widespread, migratory passerine species are commonly
described as distinct subspecies, too often without fully
evaluating local adaptations or evolutionary indepen-
dence (Ball and Avise 1992, Zink 2004, Phillimore and
Owens 2006, Fitpatrick 2010, Remsen 2010). Intraspecific
variation in many of these cases may better represent
examples of clinal variation. Gradual changes in pheno-
typic and genetic traits are commonly labeled ‘‘primary
clines’’ and are considered to be largely driven by
ecological factors associated with current environmental
gradients. Alternatively, abrupt and discontinuous chang-
es often represent ‘‘secondary clines’’ and likely reflect
historical factors associated with secondary contact of
differentiated populations (Mayr 1942, Endler 1982). In
the present study, we have examined breeding popula-
tions of a wide-ranging Neotropical migrant, the LarkSparrow (Chondestes grammacus), to assess whether
regional divergence among subspecies is evident within
multiple quantitative markers that vary in mode of
inheritance and rate of evolution.
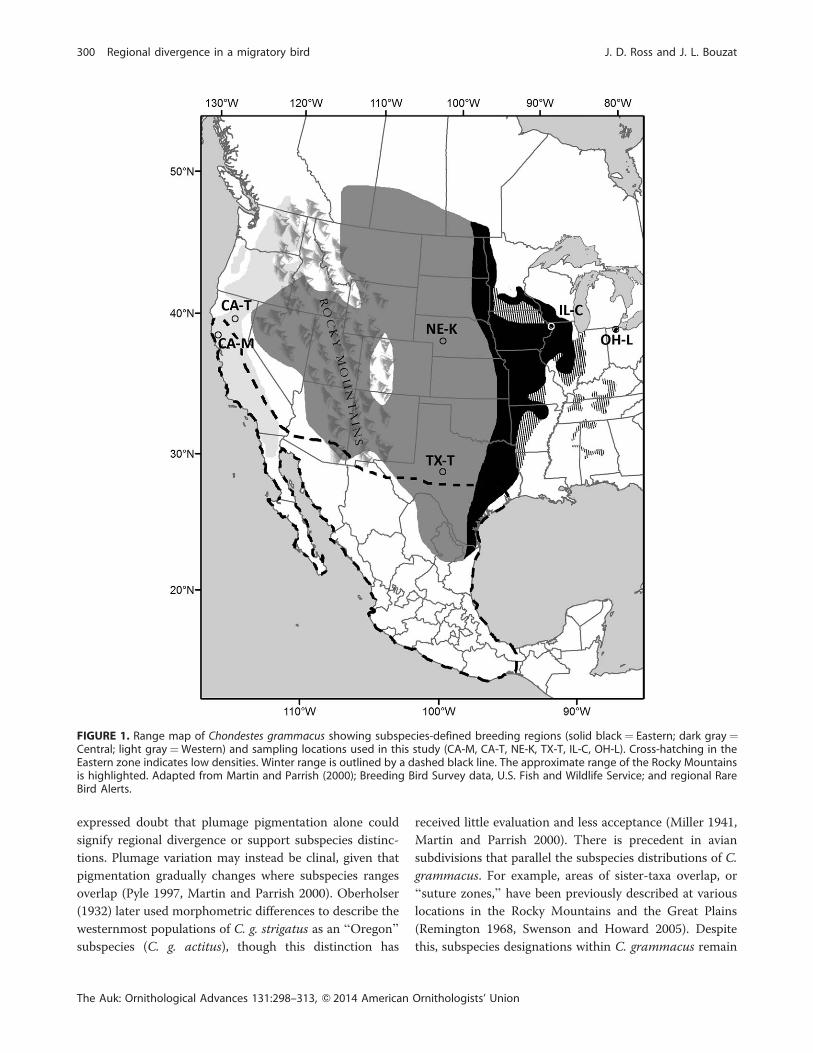
Lark Sparrows breed across a wide distribution range(258N–528N, 848W–1258W) in North America and occupy
diverse but interconnected habitats, including mesic
savannas in the East, xeric scrublands in the American
Southwest, and Mediterranean-like savannas in California
(Martin and Parrish 2000; Figure 1). Breeding across this
range requires that populations of Lark Sparrows must
tolerate regionally unique stressors (e.g., extreme heat,
drought, spring snow) and, potentially, adapt to different
environmental conditions. Populations from across this
range, however, overwinter in comparatively smaller and
narrower areas of California and the American Southwest
through southern Mexico (Figure 1) and so could overlap
during the nonbreeding season. Regional variation within
the Lark Sparrow has been previously described at the
morphological level. In 1827, Swainson distinguished a
Western subspecies (C. g. strigatus) from Eastern conspe-
cifics (C. g. grammacus) on the basis of the former’s
lighter-pigmented head and body plumage (Martin and
Parrish 2000). However, Martin and Parrish (2000)
The Auk: Ornithological Advances 131:298–313, Q 2014 American Ornithologists’ Union
J. D. Ross and J. L. Bouzat Regional divergence in a migratory bird 299
expressed doubt that plumage pigmentation alone could
signify regional divergence or support subspecies distinc-
tions. Plumage variation may instead be clinal, given that
pigmentation gradually changes where subspecies ranges
overlap (Pyle 1997, Martin and Parrish 2000). Oberholser
(1932) later used morphometric differences to describe the
westernmost populations of C. g. strigatus as an ‘‘Oregon’’
subspecies (C. g. actitus), though this distinction has
received little evaluation and less acceptance (Miller 1941,
Martin and Parrish 2000). There is precedent in avian
subdivisions that parallel the subspecies distributions of C.
grammacus. For example, areas of sister-taxa overlap, or
‘‘suture zones,’’ have been previously described at various
locations in the Rocky Mountains and the Great Plains
(Remington 1968, Swenson and Howard 2005). Despite
this, subspecies designations within C. grammacus remain
FIGURE 1. Range map of Chondestes grammacus showing subspecies-defined breeding regions (solid black¼ Eastern; dark gray¼Central; light gray¼Western) and sampling locations used in this study (CA-M, CA-T, NE-K, TX-T, IL-C, OH-L). Cross-hatching in theEastern zone indicates low densities. Winter range is outlined by a dashed black line. The approximate range of the Rocky Mountainsis highlighted. Adapted from Martin and Parrish (2000); Breeding Bird Survey data, U.S. Fish and Wildlife Service; and regional RareBird Alerts.
The Auk: Ornithological Advances 131:298–313, Q 2014 American Ornithologists’ Union
300 Regional divergence in a migratory bird J. D. Ross and J. L. Bouzat
arbitrary, as geographic variation in quantitative traits (e.g.,
morphological or genetic) within this species has not been
systematically evaluated.
The present study builds on past observations of
plumage and morphological variation within Lark Spar-
rows, seeking to determine whether breeding populations
display evidence of regional divergence consistent with
current subspecies characterizations. Phylogenetic analysis
of mitochondrial DNA sequences, population genetic
analyses of nuclear DNA markers, and variation in
morphometric traits were used to gauge patterns of
geographic variation and thus assess the validity and
degree of subspecies differentiation in the Lark Sparrow.
During the past few years, there has been extensive debate
about the use of the term ‘‘subspecies’’ in avian biology
and the problem of diagnosing distinct population
segments (James 2010). This study explores the potential
relevance of continuous (primary) and abrupt (secondary)
clines in delimiting subspecies and discusses the evolu-
tionary and conservation significance of regional variation
in migratory bird species. Extending this approach to other
avian species would help reveal historical and evolutionary
processes, however subtle, that may shape the intraspecific
geographic variation of birds into discrete population
units.
METHODS
SamplingThe entire range of C. grammacus was classified a priori
into 3 regional breeding zones: Eastern, Central, and
Western (Figure 1), delineated on the basis of previously
described subspecies ranges (Oberholser 1932, Martin and
Parrish 2000). Within each zone, we sampled 2 sites for a
total of 6 populations studied (Figure 1). Western sites
included Dye Creek Preserve, Tehama County, California
(CA-T), and Hopland Research and Extension Center,
Mendocino County, California (CA-M). Central sites
included Brown and Duncan ranches, Tom Green County,
Texas (TX-T), and Cedar Point Biological Station, Keith
County, Nebraska (NE-K). Eastern sites were located at
Lost Mound field station, Jo Daviess and Carroll Counties,
Illinois (IL-C), and Kitty Todd Nature Preserve, Lucas
County, Ohio (OH-L). Intensive surveys of the OH-L
population were conducted during the 3-yr study period
(2005–2007), owing to the species’ endangered status in
the state. Sampling at the other locations occurred in
2005–2007 at TX-T and IL-C, in 2005–2006 at CA-T, in
2006 at CA-M, and in 2007 at NE-K.
Adult and volant juvenile Lark Sparrows were captured
during mornings of the breeding period (May–July) using
mist nets passively deployed around favored perching sites
within known breeding territories. Captured individuals
were banded with a numbered leg band and, in some
populations, marked with a unique color leg-band
combination (100% color banded in OH-L; 87% in IL-C;
36% in TX-T). Each individual was measured across 6
morphological characters: wing chord (WC) and tail length
(TL) were measured to the nearest 0.5 mm; tarsus length
(TR), beak depth at nares (BD), and exposed culmen (XC)
to the nearest 0.1 mm; and total weight (WT) to the
nearest 0.1 g. A blood sample (10–50 lL) was drawn from
the ulnar vein and stored in 1 mL of Longmire’s lysis buffer
(Longmire et al. 1997) for subsequent genetic analyses.
Adults were sexed by examination of the cloacal region.
This technique was proven successful through genetic
sexing by polymerase chain reaction (PCR; 97% match,
personal observation). During the study period (2005–
2007), a total of 467 Lark Sparrows were captured. Most
samples were from Ohio (197 samples: 36 females [F], 43
males [M], 118 juveniles [J]), followed by Texas (149
samples: 43F, 50M, 56J), California (CA-T 38 samples: 6F,
10M, 22J; CA-M 12 samples: 4F, 5M, 3J), Illinois (37
samples: 9F, 13M, 15J), and Nebraska (34 samples: 11F,
14M, 9J).
Morphometric traits of adult specimens from the
ornithological collections of the University of Michigan
Museum of Zoology (Ann Arbor, Michigan, USA) and
Field Museum of Natural History (Chicago, Illinois, USA)
were also measured and analyzed separately from con-
temporary samples to improve our geographic represen-
tation and ability to identify primary and secondary clines.
We measured WC, TL, BD, and XC, along with beak width
at nares (BW) and nares to beak tip (N2T) to the nearest
0.1 mm. The museum specimens examined included 39
Western (14F, 25M), 38 Central (10F, 28M), 84 Eastern
(32F, 50M, 2 unknown), and 25 (4F, 21M) from the Rocky
Mountains (New Mexico to Idaho; Figure 1).
Morphometric AnalysisMorphometric data from live-captured and museum adult
Lark Sparrows were analyzed separately using JMP version
8.0.2 (SAS Institute, Cary, North Carolina, USA). All
measures were natural log transformed prior to analysis
(WT of live-captured birds first linearized using a cube-
root function). Following Butler et al. (2007), we calculated
each individual’s overall size (SIZE) as the arithmetic mean
of all log-transformed measures. Transformed morpho-
metric data were analyzed using multivariate analyses of
variance (MANOVA), testing population and sex as main
model effects, and the interaction effect (population3 sex).
Age (i.e. years since collection) was also incorporated as a
main effect in the morphometric analysis of museum
specimens, because preserved skins may shrink over time
(Winker 1993). The significance of variation explained by
specimens’ age and between-sex differences was assessed
using an exact F-test, whereas Wilks’s lambda was used to
gauge variation explained by differences between popula-
The Auk: Ornithological Advances 131:298–313, Q 2014 American Ornithologists’ Union
J. D. Ross and J. L. Bouzat Regional divergence in a migratory bird 301
tions and population 3 sex interactions. The minimal
number of canonical correlation axes to maximally
differentiate populations was assessed from the MANO-
VA. The canonical scores along each axis were saved for
each individual and these, plus SIZE measures, were
independently tested for significant differences between
populations using an analysis of variance (ANOVA) with a
Tukey-Kramer HSD post hoc test.
Mitochondrial DNA AnalysisDNA was extracted from blood samples by proteinase-K
digestion, sodium acetate protein precipitation, and
ethanol precipitation of DNA (Sambrook et al. 1989).
DNA samples were resuspended in TE buffer to a
concentration of ~50 ng lL�1 for further analysis. Primer
set L16743 (Tarr 1995) and H920 (50-GTC CGG CAA
CCA TTA CAC TA-30; lab designed) was used to amplify
823 base pairs (bp) of the mitochondrial control region (D-
loop). The PCR reactions were run in 25 lL containing
~50 ng DNA, 1.5 mM MgCl2, 0.08 mM dNTPs, 0.4 lMeach primer, and 1 unit of Taq DNA polymerase. The PCRprofile used was as follows: denaturation at 948C (3 min);
10 cycles of 948C (30 s), 568C (30 s; �0.58C cycle�1), and
728C (45 s); 25 cycles of 948C (30 s), 518C (30 s), and 728C
(45 s); a final extension at 758C (10 min); and held at 48C.
The PCR products were ethanol-precipitated and direct-
sequenced using primers L16743, H920, and 2 nested
primers (H598 [50-TTC AAC CGA CCA CTT GTA TCT
G-30; lab designed] and L437 [Tarr 1995]) with ABI BigDye
Terminator chemistry (Applied Biosystems, Foster City,
California, USA). Sequences were visually checked for
scoring accuracy and then aligned using BioEdit (Hall
1999) to generate a consensus sequence.
Control-region DNA was sequenced from 176 Lark
Sparrows across the 6 populations. These sequences
included the following numbers from each population:
CA-T¼33 samples (10 males, 6 females, 17 juveniles); CA-
M¼ 12 (5M, 4F, 3J); NE-K¼ 27 (14M, 11F, 2J); TX-T¼ 37
(19M, 18F); IL-C¼ 28 (13M, 9F, 6J); and OH-L¼ 39 (22M,
17M). To minimize representation from parent–offspring
pairs or siblings, juveniles incorporated into the analysis
were either associated with an unmarked mother or
captured independently of an adult female or another
juvenile of the same haplotype (i.e. a potential sibling).
Indices of haplotype (h) and nucleotide diversity (p) weregenerated for each population and species-wide using
Arlequin version 3.1 (Excoffier et al. 2005). A hierarchical
analysis of molecular variance (AMOVA) was performed
using haplotype frequencies and sequence divergence (hstatistics). Fixation indices (FCT, FSC, FST) generated through
the AMOVA indicated levels of variation partitioned among
breeding regions, differences between populations within
regions, and differences among individuals within popula-
tions, respectively. Significance values for each index were
calculated using 1,000 random permutations of haplotypes
among populations. Arlequin was also used to test whether
DNA mismatch distributions from populations and regions
significantly violated Rogers and Harpending’s (1992) model
of historical sudden population expansion. This analysis
generated tau, a measure of time since expansion, and a
raggedness index, useful for identifying recent bottleneck
events.
Probabilities that populations or regions shared poly-
morphisms due to contemporary gene flow or incomplete
lineage sorting were calculated by coalescent analysis in
MDIV (Nielsen and Wakeley 2001). The MDIV settings
included the Hasegawa-Kishino-Yano (HKY) model of
evolution, with Mmax ¼ 30 or 50, and Tmax ¼ 1 or 2. We
assumed a mutation rate of 1.423 10�7 substitutions site�1
year�1 extrapolated from a fossil-calibrated Tetraonidae
phylogeny (Johnson et al. 2007). Outputs included (1) scaled
effective population sizes, h ¼ 2Nef 3 l, where Nef is the
effective female population size and l is the mutation rate
over the entire sequence (i.e. 823 bp) per year; (2) scaled
migration rate, M¼Nef 3m, where m is the migration rate
per generation; (3) divergence time, T ¼ t1/Nef, where t1 is
years since population divergence; and (4) time to most
recent common ancestor, TMRCA¼ t2/Nef, where t2 is yearssince genetic coalescence. Confidence intervals were
extrapolated from distributions of h and M, but not T,
because these distributions did not approach zero.
The best-fit nucleotide mutation model for our mtDNAsequence data, the Hasegawa-Kishino-Yano plus gamma
model (HKYþG), was selected from 28 potential models
using Modeltest (Posada and Crandall 1998). This model
was incorporated into a Bayesian phylogenetic reconstruc-
tion implemented within MrBayes version 3.0 (Huelsen-
beck and Ronquist 2001). This analysis consisted of 2
Markov chain Monte Carlo simulations with 4 chains each,
1 swap was attempted per run every 10 generations, chains
were heated using a temperature setting of T ¼ 0.25, and
the gamma value was allowed to vary. Trees were rooted by
2 outgroup taxa from the subfamily Emberizinae for which
comparable D-loop sequences were available, Camarhyn-
chus psittaculamito and Tiaris canora (GenBank accession
nos. AF110424 and AF310072, respectively). Chains were
sampled every 103 generations, resulting in 104 samples
taken, of which the first 25% were excluded from the run
convergence analysis. Only clades with credibility values
.0.50 were treated as likely phylogenetic splits.
Microsatellite AnalysisThe same 176 Lark Sparrows used for mtDNA sequencing
were also used in microsatellite analysis. A total of 12
microsatellite primer sets developed for other passerine
species were screened for successful PCR amplification of
Lark Sparrow DNA. These included Asl09, Asl15, andAsl18 (Delany et al. 2000), Cul02 (Gibbs et al. 1999),
The Auk: Ornithological Advances 131:298–313, Q 2014 American Ornithologists’ Union
302 Regional divergence in a migratory bird J. D. Ross and J. L. Bouzat
Dpl16 (Dawson et al. 1997), Escl1 (Hanotte et al. 1994),
Gf01b (Rasner et al. 2004), Gf05 (Petren 1998), Mal23(Alderson et al. 1999), Mme1 and Mme12 (Jeffery et al.
2001), and Pdol3 (Griffith et al. 1999). Of these, only
Mme1 could not successfully amplify Lark Sparrow DNA.
Microsatellite PCRs were conducted in 20-lL volumes
containing ~50 ng DNA, 1.5 mMMgCl2, 0.08 mM dNTPs,
0.4 lM each primer, and 1 unit of Taq DNA polymerase.
The PCR profiles included a denaturation step at 948C (3
min); 10 cycles of 948C (30 s), either 578C (Asl09, Asl15,Escl1, Gf01b, Gf05, and Pdol3) or 608C (Asl18, Cul02,Dpl16, Mal23, and Mme12) annealing temperature (30 s;
�0.58C cycle�1), and 728C (45 s); 25 cycles of 948C (30 s),
518C, or 558C annealing temperature (30 s) and 728C (45
s); and a final extension at 758C (10 min). Microsatellite
amplifications were then held at 48C until transferred to an
ABI377 genetic analyzer (Applied Biosystems) for DNA
fragment analysis.
Initial analysis indicated that Mme12 was fixed for 1
allele across all samples and was therefore omitted from
further analysis. The remaining 10 polymorphic loci were
first analyzed for evidence of null alleles using Cervus
version 3.0.3 (Kalinowski et al. 2007). Two loci revealed
significantly high predicted frequencies of null alleles
(Pdol3 ¼ 0.1379; Gf01b ¼ 0.1042) and were therefore
excluded from subsequent analyses. The remaining 8
microsatellite loci were used to estimate population levelsof genetic diversity (allelic richness and observed [Ho] and
expected [He] heterozygosities). Heterozygote deficits in
relation to Hardy-Weinberg expectations were tested using
GenePop version 4.0 (Rousset 2008) with a sequential
Bonferroni correction for significance thresholds. Gene-
Pop was also used to calculate allelic differentiation
between paired populations using exact G-tests.
The partitioning of genetic variance among breeding
regions and populations was tested using a hierarchical
AMOVA within Arlequin. Fixation indices of variation
among breeding regions (FCT), among populations within
regions (FSC), among individuals within populations (FIS),
and within individuals (FIT) were calculated as weighted
averages over all loci using allelic frequencies (FST-like
method). An AMOVA using a stepwise model of microsat-
ellite evolution (RST method; Slatkin 1995) was not used,
because the requisite assumption of normally distributed
allelic frequencies was violated by most loci (personal
observation). Significance values for F-statistics generated
by the AMOVA were calculated in relation to 2 3 104
permutations of alleles among breeding zones, populations,
and individuals.
Geographic patterning of microsatellite genotypes was
further examined using a Bayesian clustering method
implemented within Structure version 2.3.1 (Hubisz et al.
2009). We allowed for admixture of populations and
informed the simulated assignment by sampling location
(LocPrior model). This approach increases the power of
assignment for recently isolated groups without causing
spurious clustering (Hubisz et al. 2009). Following a burn-
in period of 106 iterations, an additional 106 iterations were
used to estimate log probabilities for each possible number
of population clusters (K ¼ 1–6). For each value of K, we
conducted 10 independent runs and then calculated the
mean (6 SE) log probability, changes in log probability
between successive K values (DK; Evanno et al. 2005), and
individuals’ assignment probabilities to each cluster. To
evaluate whether the LocPrior model employed might have
biased the outcome of the Structure assignments, we
conducted a series of LocPrior-informed simulations
whereby individuals were randomly assigned to 6 popula-
tions of sizes equivalent to the actual dataset. These
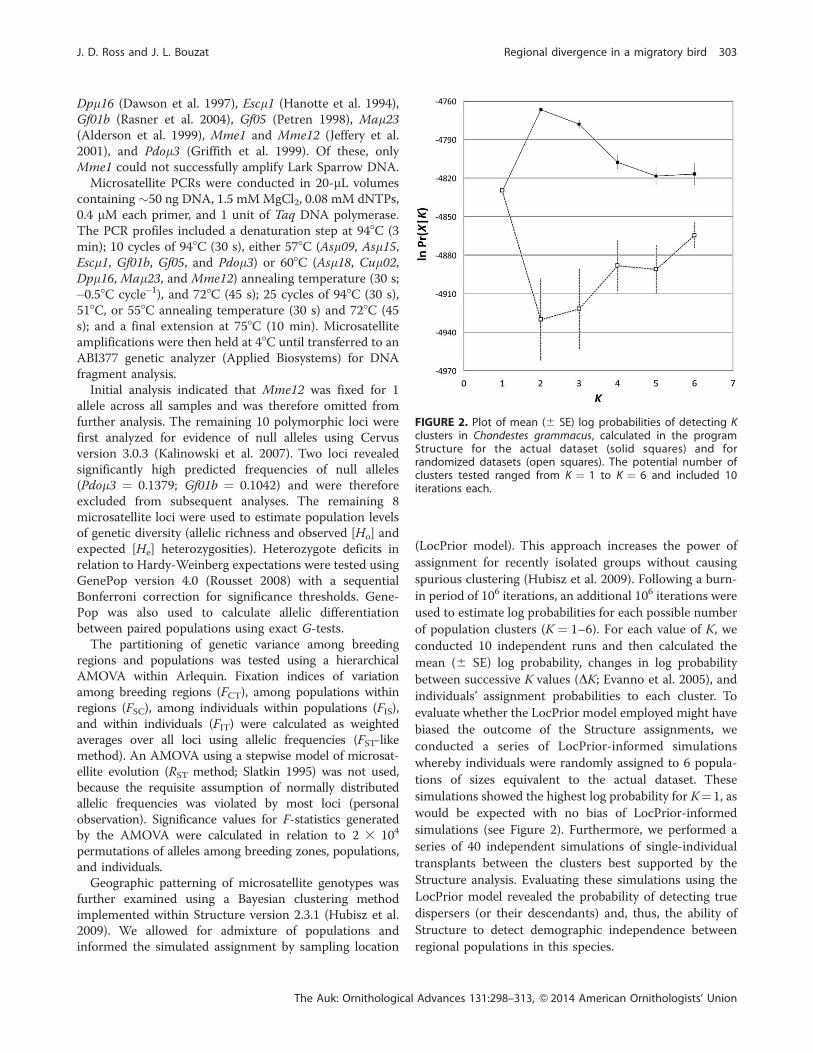
simulations showed the highest log probability for K¼1, as
would be expected with no bias of LocPrior-informed
simulations (see Figure 2). Furthermore, we performed a
series of 40 independent simulations of single-individual
transplants between the clusters best supported by the
Structure analysis. Evaluating these simulations using the
LocPrior model revealed the probability of detecting true
dispersers (or their descendants) and, thus, the ability of
Structure to detect demographic independence between
regional populations in this species.
FIGURE 2. Plot of mean (6 SE) log probabilities of detecting Kclusters in Chondestes grammacus, calculated in the programStructure for the actual dataset (solid squares) and forrandomized datasets (open squares). The potential number ofclusters tested ranged from K ¼ 1 to K ¼ 6 and included 10iterations each.
The Auk: Ornithological Advances 131:298–313, Q 2014 American Ornithologists’ Union
J. D. Ross and J. L. Bouzat Regional divergence in a migratory bird 303
RESULTS
Morphometric AnalysisAmong live-captured specimens, a MANOVA of log-
transformed measures indicated significant differences
between sexes, populations, and regional breeding zones.
Males differed significantly from females (F ¼ 26.5, P ,
0.001) in having longer wing chords (means:M¼87.1 mm,
F ¼ 82.6 mm; eigenvector [k] ¼ 2.80), lighter weights
(means: M ¼ 28.0 g, F ¼ 28.2 g; k ¼�1.19), and deeper
beaks (means: M¼ 7.14 mm, F¼ 7.02 mm; k¼ 0.28). Sex3
population interactions showed no significant effect
(Wilks’s k ¼ 0.863, approximate F ¼ 1.06, P ¼ 0.38),
meaning that patterns of sexual dimorphism were
consistent across populations. Morphological differences
among populations were significant (Wilks’s k ¼ 0.336,
approximate F ¼ 8.88, P , 0.001), with 3 canonical axes
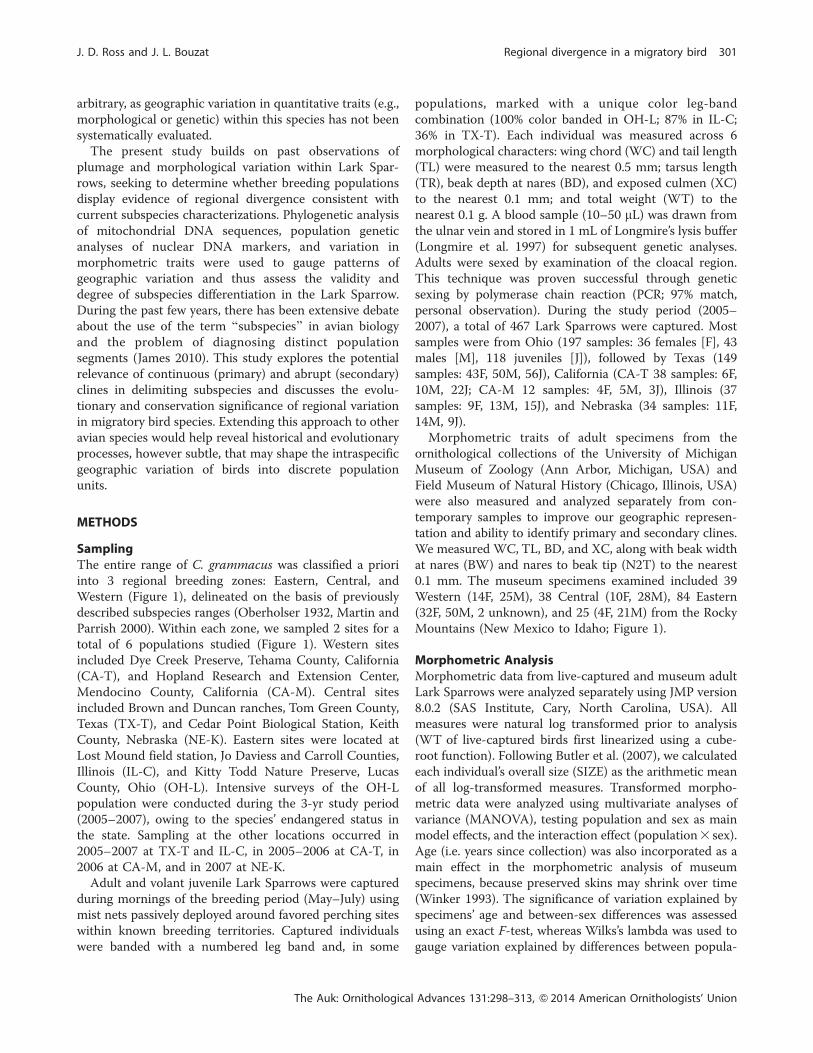
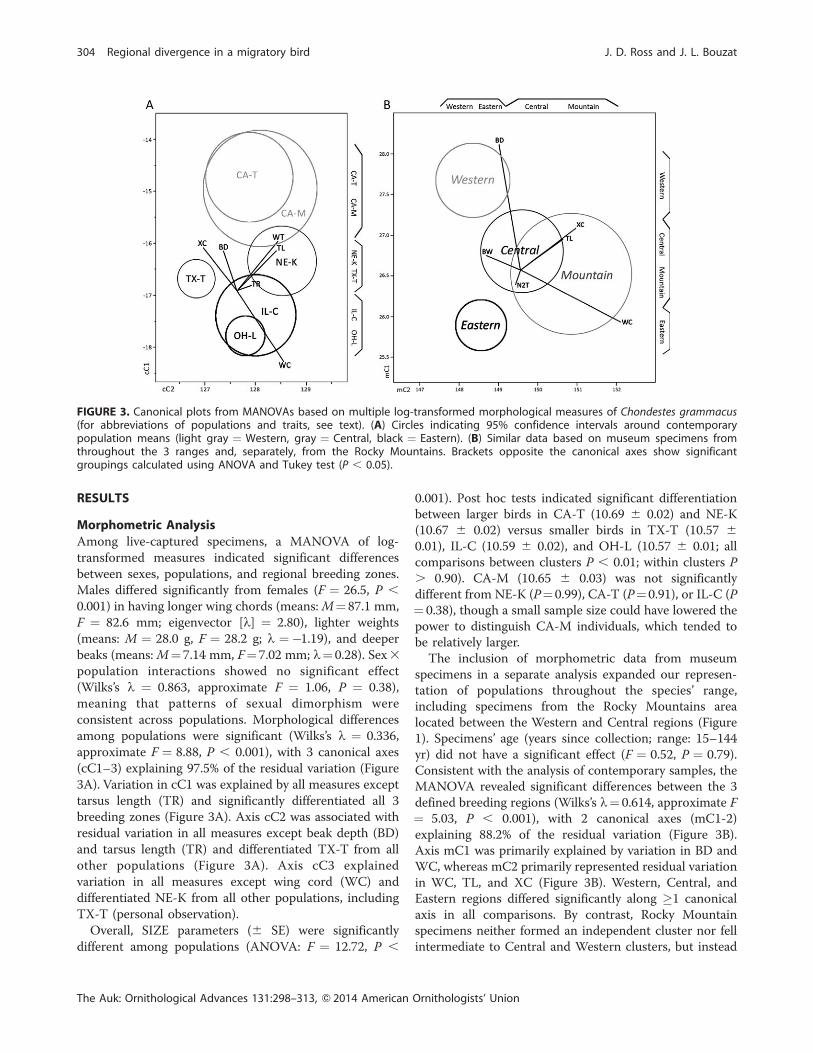
(cC1–3) explaining 97.5% of the residual variation (Figure
3A). Variation in cC1 was explained by all measures except
tarsus length (TR) and significantly differentiated all 3
breeding zones (Figure 3A). Axis cC2 was associated with
residual variation in all measures except beak depth (BD)
and tarsus length (TR) and differentiated TX-T from all
other populations (Figure 3A). Axis cC3 explained
variation in all measures except wing cord (WC) and
differentiated NE-K from all other populations, including
TX-T (personal observation).
Overall, SIZE parameters (6 SE) were significantly
different among populations (ANOVA: F ¼ 12.72, P ,
0.001). Post hoc tests indicated significant differentiation
between larger birds in CA-T (10.69 6 0.02) and NE-K
(10.67 6 0.02) versus smaller birds in TX-T (10.57 6
0.01), IL-C (10.59 6 0.02), and OH-L (10.57 6 0.01; all
comparisons between clusters P , 0.01; within clusters P
. 0.90). CA-M (10.65 6 0.03) was not significantly
different from NE-K (P¼0.99), CA-T (P¼0.91), or IL-C (P
¼ 0.38), though a small sample size could have lowered the
power to distinguish CA-M individuals, which tended to
be relatively larger.
The inclusion of morphometric data from museum
specimens in a separate analysis expanded our represen-
tation of populations throughout the species’ range,
including specimens from the Rocky Mountains area
located between the Western and Central regions (Figure
1). Specimens’ age (years since collection; range: 15–144
yr) did not have a significant effect (F ¼ 0.52, P ¼ 0.79).
Consistent with the analysis of contemporary samples, the
MANOVA revealed significant differences between the 3
defined breeding regions (Wilks’s k¼ 0.614, approximate F
¼ 5.03, P , 0.001), with 2 canonical axes (mC1-2)
explaining 88.2% of the residual variation (Figure 3B).
Axis mC1 was primarily explained by variation in BD and
WC, whereas mC2 primarily represented residual variation
in WC, TL, and XC (Figure 3B). Western, Central, and
Eastern regions differed significantly along �1 canonical
axis in all comparisons. By contrast, Rocky Mountain
specimens neither formed an independent cluster nor fell
intermediate to Central and Western clusters, but instead
FIGURE 3. Canonical plots from MANOVAs based on multiple log-transformed morphological measures of Chondestes grammacus(for abbreviations of populations and traits, see text). (A) Circles indicating 95% confidence intervals around contemporarypopulation means (light gray ¼ Western, gray ¼ Central, black ¼ Eastern). (B) Similar data based on museum specimens fromthroughout the 3 ranges and, separately, from the Rocky Mountains. Brackets opposite the canonical axes show significantgroupings calculated using ANOVA and Tukey test (P , 0.05).
The Auk: Ornithological Advances 131:298–313, Q 2014 American Ornithologists’ Union
304 Regional divergence in a migratory bird J. D. Ross and J. L. Bouzat
overlapped with samples from the Central region (Figure
3B).
Mitochondrial DNA AnalysisSequences from 179 Lark Sparrows revealed variable sites
at 66 of the 823 nucleotides analyzed and comprised 102
distinct haplotypes (GenBank accession nos. HQ290164–
HQ290265). Populations showed high levels of haplotype
diversity (h), ranging from 0.909 in CA-M to 0.980 in NE-
K (Table 1), driven primarily by relatively large numbers of
unique haplotypes (n ¼ 78). Nucleotide diversity (p) waslow and similar across populations, ranging from 0.006 in
CA-M to 0.009 in both NE-K and TX-T (Table 1).
The AMOVA for the mitochondrial control region
revealed modest, though not significant, variation among
breeding zones (4.4%, P ¼ 0.063), significant variation
between populations within regions (2.7%, P ¼ 0.03), and
significant variation among individuals within populations
(92.9%, P , 0.001; Table 2). Pairwise FST estimates between
populations were consistently nonsignificant between
populations of the same breeding region but were
significant in 7 of 12 comparisons of populations from
different breeding regions (Table 3). After a sequential
Bonferroni correction (a0 ¼ 0.0036), the pairwise FST value
of CA-T versus OH-L remained significantly high (P ,
0.0001), whereas 2 other pairings that also happened to
include CA and Eastern populations showed near-signif-
icant differences (CA-M vs. OH-L, P ¼ 0.0039; CA-T vs.
IL-C, P¼ 0.0039; Table 3). When samples were pooled by
region (W ¼Western, C ¼ Central, and E ¼ Eastern), all
pairwise FST values between regions were highly significant
(W vs. C: FST¼ 0.013, P¼ 0.009; W vs. E: FST¼ 0.021, P ,
0.001; C vs. E: FST ¼ 0.008, P ¼ 0.009).
As expected, MDIV-estimated migration rates were
generally highest between populations within regions,
though also elevated across Central/Eastern and, to a
lesser degree, NE-K/Western pairings (Table 4). Estimates
of time since divergence varied across paired populations
but showed low divergence estimates for populations
within regions (5.0–12.3 3 103 yr) and much older
estimates (.23 3103 yr BP) for most other comparisons
(Table 4). Paired evolutionarily effective female population
sizes ranged from 6.73 104 for CA-M/TX-T to 12.93 104
for NE-K/IL-C, with considerably overlapping 95% confi-
dence intervals (see Table 5) and did not indicate past
population bottlenecks. At the regional level, estimates of
evolutionarily effective female population sizes were
consistently ~14 3 104. Bayesian phylogenetic analysis of
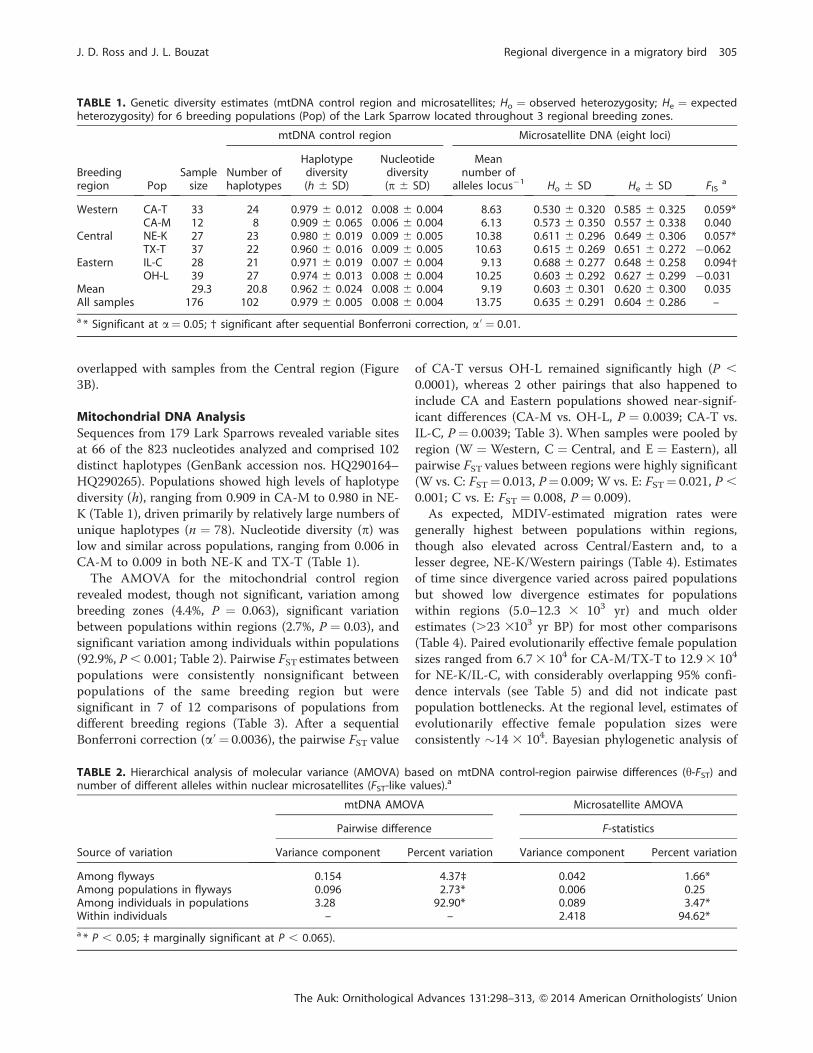
TABLE 1. Genetic diversity estimates (mtDNA control region and microsatellites; Ho ¼ observed heterozygosity; He ¼ expectedheterozygosity) for 6 breeding populations (Pop) of the Lark Sparrow located throughout 3 regional breeding zones.
Breedingregion Pop
Samplesize
mtDNA control region Microsatellite DNA (eight loci)
Number ofhaplotypes
Haplotypediversity(h 6 SD)
Nucleotidediversity(p 6 SD)
Meannumber of
alleles locus�1 Ho 6 SD He 6 SD FISa
Western CA-T 33 24 0.979 6 0.012 0.008 6 0.004 8.63 0.530 6 0.320 0.585 6 0.325 0.059*CA-M 12 8 0.909 6 0.065 0.006 6 0.004 6.13 0.573 6 0.350 0.557 6 0.338 0.040
Central NE-K 27 23 0.980 6 0.019 0.009 6 0.005 10.38 0.611 6 0.296 0.649 6 0.306 0.057*TX-T 37 22 0.960 6 0.016 0.009 6 0.005 10.63 0.615 6 0.269 0.651 6 0.272 �0.062
Eastern IL-C 28 21 0.971 6 0.019 0.007 6 0.004 9.13 0.688 6 0.277 0.648 6 0.258 0.094†OH-L 39 27 0.974 6 0.013 0.008 6 0.004 10.25 0.603 6 0.292 0.627 6 0.299 �0.031
Mean 29.3 20.8 0.962 6 0.024 0.008 6 0.004 9.19 0.603 6 0.301 0.620 6 0.300 0.035All samples 176 102 0.979 6 0.005 0.008 6 0.004 13.75 0.635 6 0.291 0.604 6 0.286 –
a * Significant at a ¼ 0.05; † significant after sequential Bonferroni correction, a0 ¼ 0.01.
TABLE 2. Hierarchical analysis of molecular variance (AMOVA) based on mtDNA control-region pairwise differences (h-FST) andnumber of different alleles within nuclear microsatellites (FST-like values).a
Source of variation
mtDNA AMOVA Microsatellite AMOVA
Pairwise difference F-statistics
Variance component Percent variation Variance component Percent variation
Among flyways 0.154 4.37‡ 0.042 1.66*Among populations in flyways 0.096 2.73* 0.006 0.25Among individuals in populations 3.28 92.90* 0.089 3.47*Within individuals – – 2.418 94.62*
a * P , 0.05; ‡ marginally significant at P , 0.065).
The Auk: Ornithological Advances 131:298–313, Q 2014 American Ornithologists’ Union
J. D. Ross and J. L. Bouzat Regional divergence in a migratory bird 305
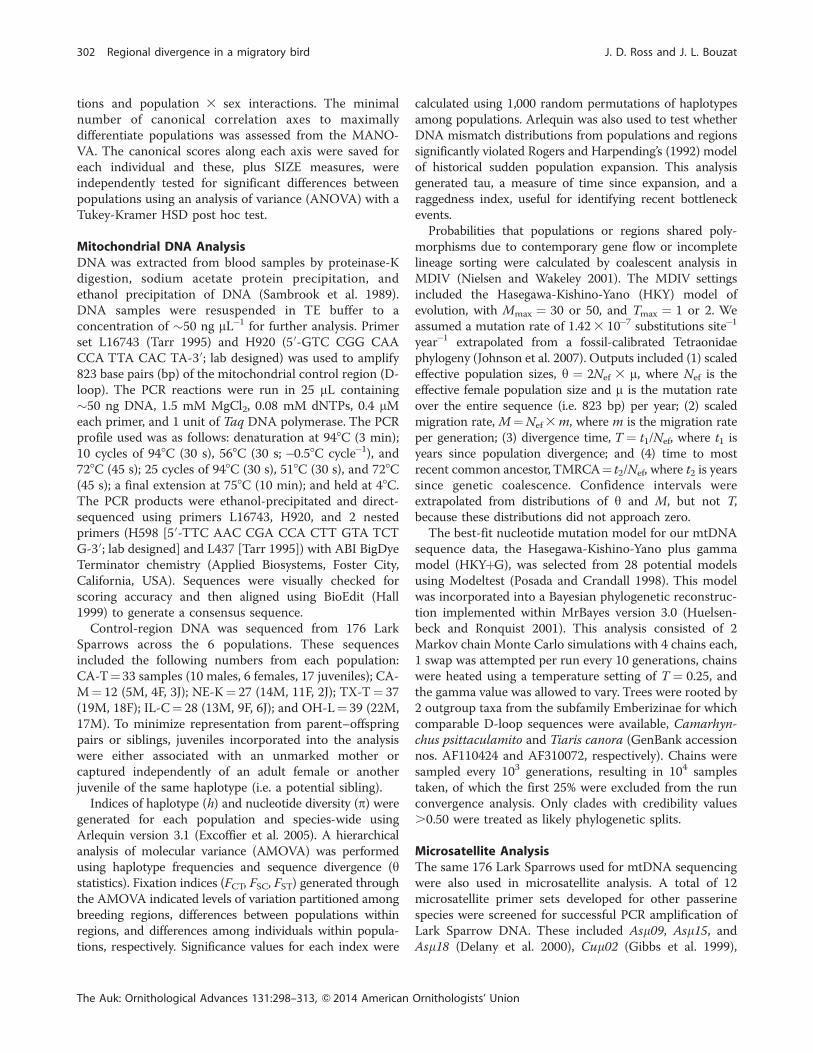
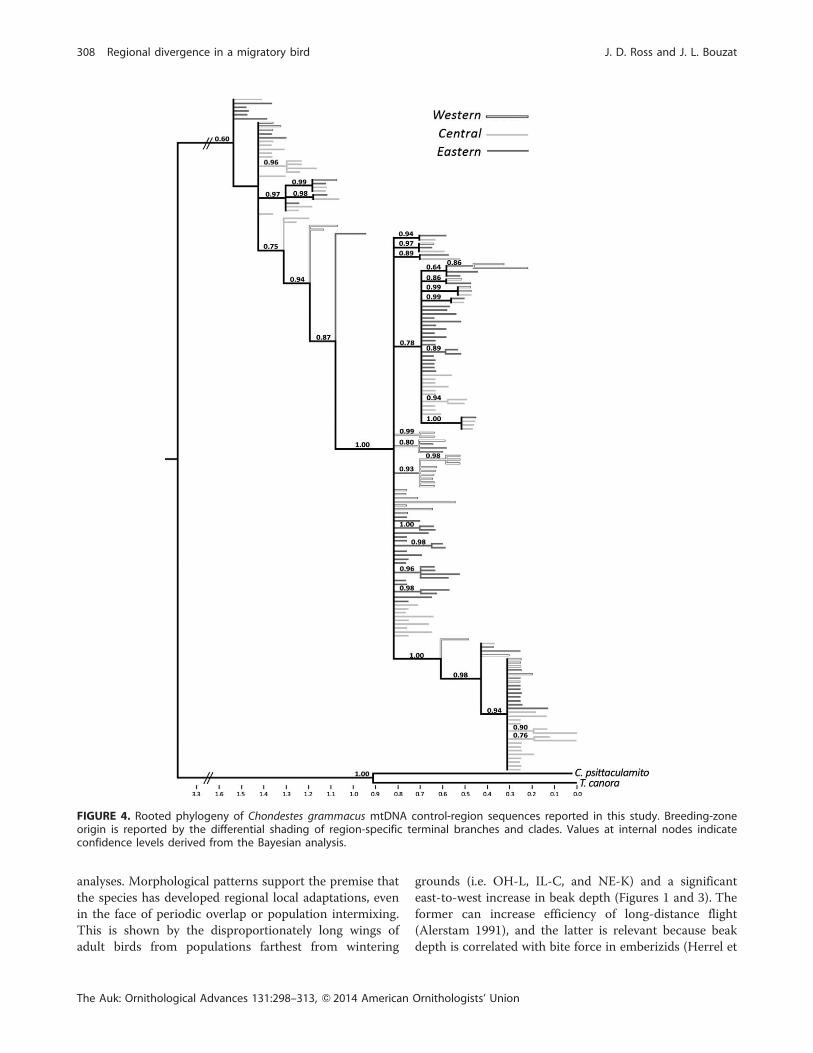
the mtDNA sequences did not support monophyletic
groupings of previously described subspecies and indicated
no apparent phylogeographic patterning (Figure 4). A large
percentage of sequences clustered in nonresolved polyto-
mies with representatives from each of the 3 breeding
regions. That said, 14 of the 33 nodes with clade credibility
scores .0.50 were region-specific (with 5, 4, and 5 nodes
for the Western, Central, and Eastern breeding zones,
respectively). Although most nodes grouped only 2
sequences, there were 2 entirely Western clades of 9 and
4 sequences and an Eastern clade of 4 sequences (Figure 4).
DNA mismatch distributions for populations and
regions, and species-wide, showed neither departures from
a sudden expansion model nor significant raggedness
indices (Table 6). Tau values within populations ranged
from 3.85 in OH-L to 9.75 in NE-K, and tau values within
regions ranged from 5.90 in Eastern to 9.66 in Central.
Assuming a mutation rate of 0.142 mutations site�1 Ma�1
for the mtDNA hypervariable region (Johnson et al. 2007),
the range of estimated times since expansion for regional
populations was 25–41 3 103 yr (Table 6).
Microsatellite Genotyping
Genetic diversity at microsatellite loci, in terms of both
allelic richness and heterozygosity, did not vary widely
across Lark Sparrow populations. Allelic richness per locus
ranged from a low of 6.13 at CA-M to 10.63 at TX-T, with
a mean (6 SD) across all populations of 9.19 6 6.09 and a
mean across all samples of 13.75 6 8.50 (Table 1). Means
for observed and expected heterozygosities across all
populations were 0.603 and 0.620, respectively (Table 1).
Fewer alleles and lower levels of observed and expected
heterozygosity were generally found in the Western
populations, both of which showed 1 allele fixed at the
Mal23 microsatellite locus (i.e. all individuals were
homozygotes). Inbreeding coefficients (FIS) calculated
across all loci for each population were significantly higher
than zero in CA-T (0.094; P ¼ 0.004), NE-K (0.059; P ¼0.04), and TX-T (0.057; P ¼ 0.02; Table 1). GenePop
analysis on a locus-by-locus basis showed that, after a
sequential Bonferroni correction, heterozygote deficit was
significant only in 1 population CA-T for 1 locus (Gf05; FIS
¼ 0.205; P , 0.001).
Allele frequencies revealed significant differences be-
tween populations from different breeding zones (all
pairwise P , 0.01 following sequential Bonferroni
correction except TX-T vs. OH-L). The AMOVA results
from microsatellite loci indicated lower, though significant,
regional differences (1.66%; P , 0.001) compared to those
reported from mtDNA sequences (4.37%; P ¼ 0.06).
Decreased levels of differentiation may potentially be due
to the fourfold difference in the effective size of
mitochondrial versus nuclear DNA (Nei 1987). In contrast
to mtDNA, variation between populations of the same
region (0.25%) was nonsignificant across these markers (P
¼ 0.15; Table 2). Pairwise population estimates of h (FST-
like) also indicated significant differences between popu-
lations of different breeding zones but no significant
differences between populations of the same zone (Table
3). After a sequential Bonferroni correction, Western
populations remained significantly distinct from all other
populations (P , 0.007), but only TX-T versus IL-C
remained significant (P ¼ 0.004) among Central/Eastern
comparisons.
Bayesian simulations conducted using Structure indi-
cated that mean log probability scores (6 SE) were higher
when K was 2 (�4,766.6 6 1.6) or 3 (�4,777.9 6 3.1), in
relation to K values of 1 (�4,829.9 6 0.3), 4 (�4,807.4 6
5.5), 5 (�4,818.3 6 7.1), and 6 (�4,817.1 6 7.2) (see Figure
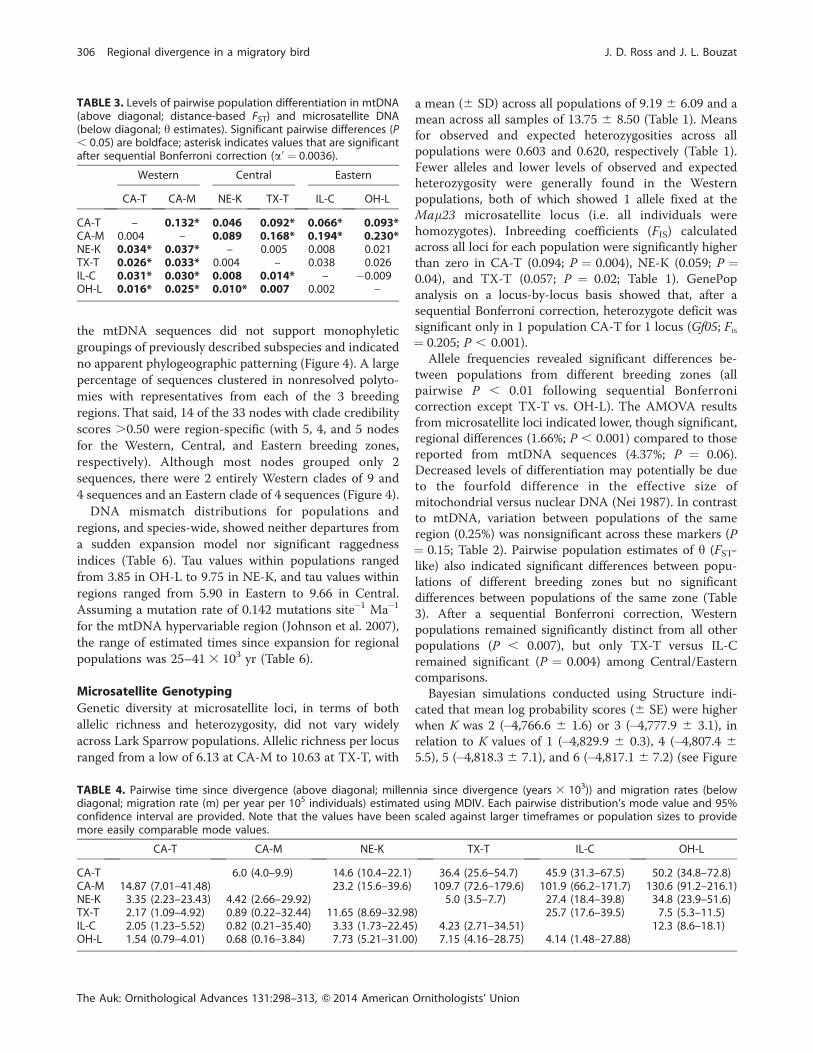
TABLE 3. Levels of pairwise population differentiation in mtDNA(above diagonal; distance-based FST) and microsatellite DNA(below diagonal; h estimates). Significant pairwise differences (P, 0.05) are boldface; asterisk indicates values that are significantafter sequential Bonferroni correction (a0 ¼ 0.0036).
Western Central Eastern
CA-T CA-M NE-K TX-T IL-C OH-L
CA-T – 0.132* 0.046 0.092* 0.066* 0.093*CA-M 0.004 – 0.089 0.168* 0.194* 0.230*NE-K 0.034* 0.037* – 0.005 0.008 0.021TX-T 0.026* 0.033* 0.004 – 0.038 0.026IL-C 0.031* 0.030* 0.008 0.014* – �0.009OH-L 0.016* 0.025* 0.010* 0.007 0.002 –
TABLE 4. Pairwise time since divergence (above diagonal; millennia since divergence (years 3 103)) and migration rates (belowdiagonal; migration rate (m) per year per 105 individuals) estimated using MDIV. Each pairwise distribution’s mode value and 95%confidence interval are provided. Note that the values have been scaled against larger timeframes or population sizes to providemore easily comparable mode values.
CA-T CA-M NE-K TX-T IL-C OH-L
CA-T 6.0 (4.0–9.9) 14.6 (10.4–22.1) 36.4 (25.6–54.7) 45.9 (31.3–67.5) 50.2 (34.8–72.8)CA-M 14.87 (7.01–41.48) 23.2 (15.6–39.6) 109.7 (72.6–179.6) 101.9 (66.2–171.7) 130.6 (91.2–216.1)NE-K 3.35 (2.23–23.43) 4.42 (2.66–29.92) 5.0 (3.5–7.7) 27.4 (18.4–39.8) 34.8 (23.9–51.6)TX-T 2.17 (1.09–4.92) 0.89 (0.22–32.44) 11.65 (8.69–32.98) 25.7 (17.6–39.5) 7.5 (5.3–11.5)IL-C 2.05 (1.23–5.52) 0.82 (0.21–35.40) 3.33 (1.73–22.45) 4.23 (2.71–34.51) 12.3 (8.6–18.1)OH-L 1.54 (0.79–4.01) 0.68 (0.16–3.84) 7.73 (5.21–31.00) 7.15 (4.16–28.75) 4.14 (1.48–27.88)
The Auk: Ornithological Advances 131:298–313, Q 2014 American Ornithologists’ Union
306 Regional divergence in a migratory bird J. D. Ross and J. L. Bouzat
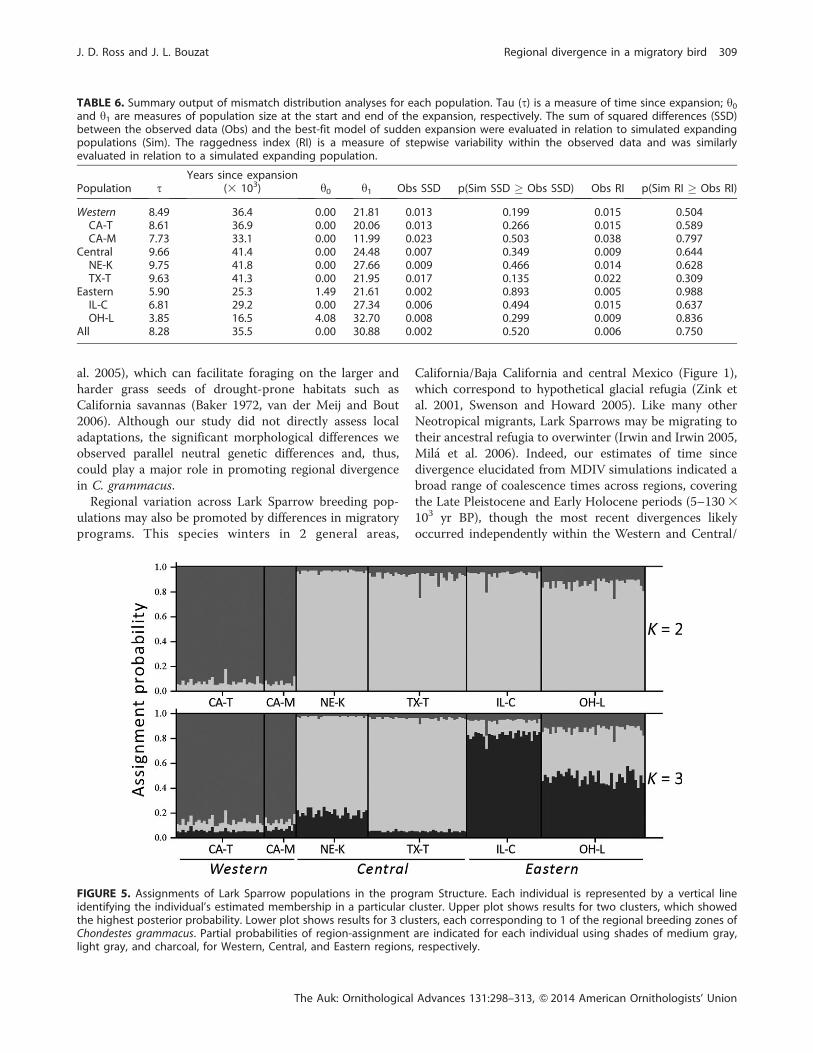
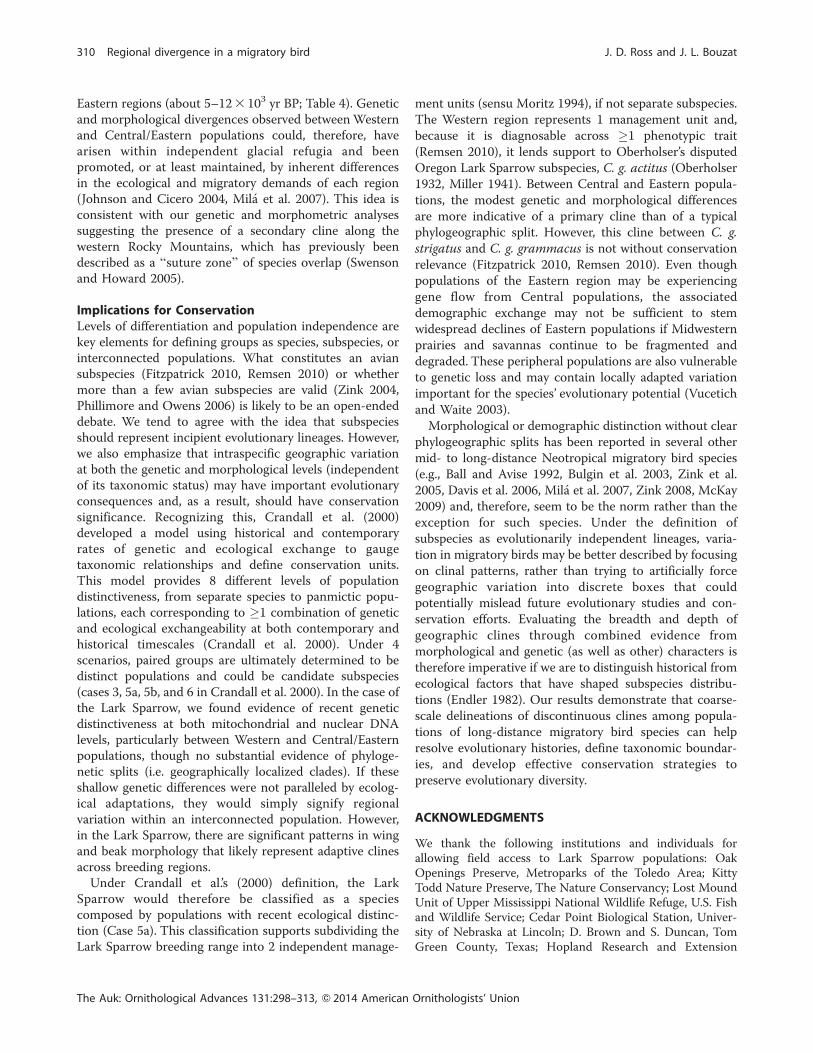
2). Estimates of DK (Evanno et al. 2005) likewise indicated
that K¼ 2 represented the most likely number of clusters,
with samples divided into aWestern cluster and a Central/
Eastern cluster (Figure 5). Although the mean log
probability for K ¼ 3 was significantly lower than K ¼ 2
(t-test, P ¼ 0.007), partitioning the samples into 3 groups
hinted at some modest differences emerging between
Central and Eastern populations (Figure 5). Structure
analysis of simulated dispersal events produced assign-
ments back to ‘‘origin’’ clusters exceeding P¼ 0.50 in 20%
of Central/Eastern to Western and 7.5% of Western to
Central/Eastern transplants. In fact, immigrant probabil-
ities exceeded P ¼ 0.33, a value never reached by any
individual in the true analysis, in 17 of 40 (42.5%) Central/
Eastern to Western and 8 of 40 (20.0%) Western to
Central/Eastern transplants.
DISCUSSION
Our results show that geographically disparate populations
of Lark Sparrows differ, to varying degrees, across multiple
genetic and morphometric traits and suggest the presence
of both primary and secondary clines across putative
boundaries of previously defined subspecies. The phylo-
genetic analysis of mtDNA sequences did not support the
characterization of Lark Sparrow subspecies as indepen-
dent evolutionary lineages. Neotropical migratory passer-
ines generally tend to have shallow and unresolved
mtDNA phylogenies on account of their relatively recent
diversification (Avise and Walker 1998, McKay and Zink
2010). Many of these species, including C. grammacus,
may have also retained ancient variation in neutral DNA
markers because they remained relatively large following
isolation, thus limiting lineage sorting through genetic drift
(Edwards et al. 2005, Zink et al. 2005, Mila et al. 2007, Zink
2008). For instance, Pruett et al. (2008) showed levels of
genetic diversity among different Song Sparrow subspecies
(Melospiza melodia) in the Pacific coast region similar to
those we found throughout the Lark Sparrow. Despite little
phylogenetic differentiation among subspecies of C.
grammacus, there appears to be incipient genetic diver-
gence within the species manifested as regionally specific
clades, repeated patterns of pairwise population FST
significance, reduced estimates of migration among
regions, and the characterization of 2 distinct clusters in
the Structure analysis.
Emerging genetic structure among Lark Sparrow
breeding regions was consistent across analyses of nuclear
microsatellite loci and mtDNA, indicating the greatest
pairwise genetic differences between breeding regions,
particularly Western versus all other populations. The
relatively small percentage of variation explained by FSTvalues and the limited sampling in the number of
populations surveyed may instill doubt regarding the
biological relevance of these estimates (see Whitlock and
McCauley 1999, Waples and Gaggiotti 2006). However,
coalescent analyses in Structure likewise revealed a
pronounced separation of Western from Central/Eastern
breeding populations (Figure 5). Furthermore, 1 microsat-
ellite locus (Mal23) was fixed in the California popula-
tions, reinforcing the assertion that Western populations
represent an independent unit. Although inferring demo-
graphic independence solely on the basis of genetic data
has been deemed speculative (see Lowe and Allendorf
2010), the Structure analysis, coalescent estimates of
widely varied evolutionarily effective population sizes
within and among regions, and estimates of migration
rates suggest that some demographic independence exists
among Western and Central/Eastern Lark Sparrow breed-
ing populations. This is not unexpected, given that the
Rocky Mountains run between these groups. The demo-
graphic independence of Eastern and Central populations
is not so clear, with less support for genetic divergence
among these populations (see pairwise FST, Structure
results at K ¼ 3, and migration rate estimates).
Regional demographic independence itself has biological
relevance, but in the context of the present study, we
sought evidence for such diversifications representing
either incipient evolutionary lineages consistent with
subspecies classifications or clinal variation associated
with locally adapted populations. Although the mitochon-
drial phylogeographic patterns did not support subspecies
categorizations based on reciprocal monophyly, our
examination of morphological traits showed significant
regional diversification consistent with results from
mitochondrial and nuclear DNA population genetic
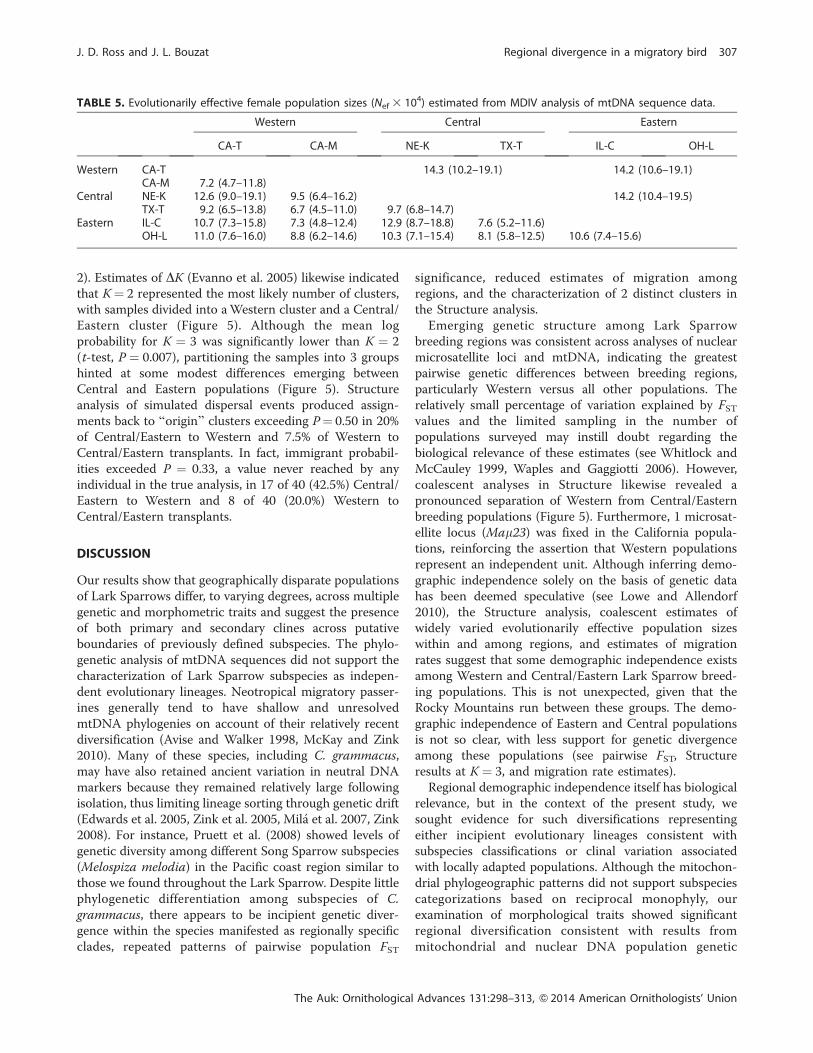
TABLE 5. Evolutionarily effective female population sizes (Nef 3 104) estimated from MDIV analysis of mtDNA sequence data.
Western Central Eastern
CA-T CA-M NE-K TX-T IL-C OH-L
Western CA-T 14.3 (10.2–19.1) 14.2 (10.6–19.1)CA-M 7.2 (4.7–11.8)
Central NE-K 12.6 (9.0–19.1) 9.5 (6.4–16.2) 14.2 (10.4–19.5)TX-T 9.2 (6.5–13.8) 6.7 (4.5–11.0) 9.7 (6.8–14.7)
Eastern IL-C 10.7 (7.3–15.8) 7.3 (4.8–12.4) 12.9 (8.7–18.8) 7.6 (5.2–11.6)OH-L 11.0 (7.6–16.0) 8.8 (6.2–14.6) 10.3 (7.1–15.4) 8.1 (5.8–12.5) 10.6 (7.4–15.6)
The Auk: Ornithological Advances 131:298–313, Q 2014 American Ornithologists’ Union
J. D. Ross and J. L. Bouzat Regional divergence in a migratory bird 307
analyses. Morphological patterns support the premise that
the species has developed regional local adaptations, even
in the face of periodic overlap or population intermixing.
This is shown by the disproportionately long wings of
adult birds from populations farthest from wintering
grounds (i.e. OH-L, IL-C, and NE-K) and a significant
east-to-west increase in beak depth (Figures 1 and 3). The
former can increase efficiency of long-distance flight
(Alerstam 1991), and the latter is relevant because beak
depth is correlated with bite force in emberizids (Herrel et
FIGURE 4. Rooted phylogeny of Chondestes grammacus mtDNA control-region sequences reported in this study. Breeding-zoneorigin is reported by the differential shading of region-specific terminal branches and clades. Values at internal nodes indicateconfidence levels derived from the Bayesian analysis.
The Auk: Ornithological Advances 131:298–313, Q 2014 American Ornithologists’ Union
308 Regional divergence in a migratory bird J. D. Ross and J. L. Bouzat
al. 2005), which can facilitate foraging on the larger and
harder grass seeds of drought-prone habitats such as
California savannas (Baker 1972, van der Meij and Bout
2006). Although our study did not directly assess local
adaptations, the significant morphological differences we
observed parallel neutral genetic differences and, thus,
could play a major role in promoting regional divergence
in C. grammacus.
Regional variation across Lark Sparrow breeding pop-
ulations may also be promoted by differences in migratory
programs. This species winters in 2 general areas,
California/Baja California and central Mexico (Figure 1),
which correspond to hypothetical glacial refugia (Zink et
al. 2001, Swenson and Howard 2005). Like many other
Neotropical migrants, Lark Sparrows may be migrating to
their ancestral refugia to overwinter (Irwin and Irwin 2005,
Mila et al. 2006). Indeed, our estimates of time since
divergence elucidated from MDIV simulations indicated a
broad range of coalescence times across regions, covering
the Late Pleistocene and Early Holocene periods (5–130 3
103 yr BP), though the most recent divergences likely
occurred independently within the Western and Central/
FIGURE 5. Assignments of Lark Sparrow populations in the program Structure. Each individual is represented by a vertical lineidentifying the individual’s estimated membership in a particular cluster. Upper plot shows results for two clusters, which showedthe highest posterior probability. Lower plot shows results for 3 clusters, each corresponding to 1 of the regional breeding zones ofChondestes grammacus. Partial probabilities of region-assignment are indicated for each individual using shades of medium gray,light gray, and charcoal, for Western, Central, and Eastern regions, respectively.
TABLE 6. Summary output of mismatch distribution analyses for each population. Tau (s) is a measure of time since expansion; h0
and h1 are measures of population size at the start and end of the expansion, respectively. The sum of squared differences (SSD)between the observed data (Obs) and the best-fit model of sudden expansion were evaluated in relation to simulated expandingpopulations (Sim). The raggedness index (RI) is a measure of stepwise variability within the observed data and was similarlyevaluated in relation to a simulated expanding population.
Population sYears since expansion
(3 103) h0 h1 Obs SSD p(Sim SSD � Obs SSD) Obs RI p(Sim RI � Obs RI)
Western 8.49 36.4 0.00 21.81 0.013 0.199 0.015 0.504CA-T 8.61 36.9 0.00 20.06 0.013 0.266 0.015 0.589CA-M 7.73 33.1 0.00 11.99 0.023 0.503 0.038 0.797
Central 9.66 41.4 0.00 24.48 0.007 0.349 0.009 0.644NE-K 9.75 41.8 0.00 27.66 0.009 0.466 0.014 0.628TX-T 9.63 41.3 0.00 21.95 0.017 0.135 0.022 0.309
Eastern 5.90 25.3 1.49 21.61 0.002 0.893 0.005 0.988IL-C 6.81 29.2 0.00 27.34 0.006 0.494 0.015 0.637OH-L 3.85 16.5 4.08 32.70 0.008 0.299 0.009 0.836
All 8.28 35.5 0.00 30.88 0.002 0.520 0.006 0.750
The Auk: Ornithological Advances 131:298–313, Q 2014 American Ornithologists’ Union
J. D. Ross and J. L. Bouzat Regional divergence in a migratory bird 309
Eastern regions (about 5–123 103 yr BP; Table 4). Genetic
and morphological divergences observed betweenWestern
and Central/Eastern populations could, therefore, have
arisen within independent glacial refugia and been
promoted, or at least maintained, by inherent differences
in the ecological and migratory demands of each region
(Johnson and Cicero 2004, Mila et al. 2007). This idea is
consistent with our genetic and morphometric analyses
suggesting the presence of a secondary cline along the
western Rocky Mountains, which has previously been
described as a ‘‘suture zone’’ of species overlap (Swenson
and Howard 2005).
Implications for ConservationLevels of differentiation and population independence are
key elements for defining groups as species, subspecies, or
interconnected populations. What constitutes an avian
subspecies (Fitzpatrick 2010, Remsen 2010) or whether
more than a few avian subspecies are valid (Zink 2004,
Phillimore and Owens 2006) is likely to be an open-ended
debate. We tend to agree with the idea that subspecies
should represent incipient evolutionary lineages. However,
we also emphasize that intraspecific geographic variation
at both the genetic and morphological levels (independent
of its taxonomic status) may have important evolutionary
consequences and, as a result, should have conservation
significance. Recognizing this, Crandall et al. (2000)
developed a model using historical and contemporary
rates of genetic and ecological exchange to gaugetaxonomic relationships and define conservation units.
This model provides 8 different levels of population
distinctiveness, from separate species to panmictic popu-
lations, each corresponding to �1 combination of genetic
and ecological exchangeability at both contemporary and
historical timescales (Crandall et al. 2000). Under 4
scenarios, paired groups are ultimately determined to be
distinct populations and could be candidate subspecies
(cases 3, 5a, 5b, and 6 in Crandall et al. 2000). In the case of
the Lark Sparrow, we found evidence of recent genetic
distinctiveness at both mitochondrial and nuclear DNA
levels, particularly between Western and Central/Eastern
populations, though no substantial evidence of phyloge-
netic splits (i.e. geographically localized clades). If these
shallow genetic differences were not paralleled by ecolog-
ical adaptations, they would simply signify regional
variation within an interconnected population. However,
in the Lark Sparrow, there are significant patterns in wing
and beak morphology that likely represent adaptive clines
across breeding regions.
Under Crandall et al.’s (2000) definition, the Lark
Sparrow would therefore be classified as a species
composed by populations with recent ecological distinc-
tion (Case 5a). This classification supports subdividing the
Lark Sparrow breeding range into 2 independent manage-
ment units (sensu Moritz 1994), if not separate subspecies.
The Western region represents 1 management unit and,
because it is diagnosable across �1 phenotypic trait
(Remsen 2010), it lends support to Oberholser’s disputed
Oregon Lark Sparrow subspecies, C. g. actitus (Oberholser
1932, Miller 1941). Between Central and Eastern popula-
tions, the modest genetic and morphological differences
are more indicative of a primary cline than of a typical
phylogeographic split. However, this cline between C. g.
strigatus and C. g. grammacus is not without conservation
relevance (Fitzpatrick 2010, Remsen 2010). Even though
populations of the Eastern region may be experiencing
gene flow from Central populations, the associated
demographic exchange may not be sufficient to stem
widespread declines of Eastern populations if Midwestern
prairies and savannas continue to be fragmented and
degraded. These peripheral populations are also vulnerable
to genetic loss and may contain locally adapted variation
important for the species’ evolutionary potential (Vucetich
and Waite 2003).
Morphological or demographic distinction without clear
phylogeographic splits has been reported in several other
mid- to long-distance Neotropical migratory bird species
(e.g., Ball and Avise 1992, Bulgin et al. 2003, Zink et al.
2005, Davis et al. 2006, Mila et al. 2007, Zink 2008, McKay
2009) and, therefore, seem to be the norm rather than the
exception for such species. Under the definition of
subspecies as evolutionarily independent lineages, varia-
tion in migratory birds may be better described by focusing
on clinal patterns, rather than trying to artificially force
geographic variation into discrete boxes that could
potentially mislead future evolutionary studies and con-
servation efforts. Evaluating the breadth and depth of
geographic clines through combined evidence from
morphological and genetic (as well as other) characters is
therefore imperative if we are to distinguish historical from
ecological factors that have shaped subspecies distribu-
tions (Endler 1982). Our results demonstrate that coarse-
scale delineations of discontinuous clines among popula-
tions of long-distance migratory bird species can help
resolve evolutionary histories, define taxonomic boundar-
ies, and develop effective conservation strategies to
preserve evolutionary diversity.
ACKNOWLEDGMENTS
We thank the following institutions and individuals forallowing field access to Lark Sparrow populations: OakOpenings Preserve, Metroparks of the Toledo Area; KittyTodd Nature Preserve, The Nature Conservancy; Lost MoundUnit of Upper Mississippi National Wildlife Refuge, U.S. Fishand Wildlife Service; Cedar Point Biological Station, Univer-sity of Nebraska at Lincoln; D. Brown and S. Duncan, TomGreen County, Texas; Hopland Research and Extension
The Auk: Ornithological Advances 131:298–313, Q 2014 American Ornithologists’ Union
310 Regional divergence in a migratory bird J. D. Ross and J. L. Bouzat
Center, University of California–Davis; and Dye CreekPreserve, The Nature Conservancy. The University ofMichigan Museum of Zoology (Ann Arbor) and the FieldMuseum of Natural History (Chicago) allowed access to theirLark Sparrow collections. Birds were banded under permits ofR. Dawkins, Angelo State University; D. Wenny, IllinoisNatural History Survey; and M. Shieldcastle, Ohio Depart-ment of Natural Resources.We thank V. Bingman, T. Herman,E. Keller, J. Noland, E. Ross, and B. Swanson for field andlaboratory assistance. R. Huber provided statistical assistance.We also thank M. Hauber, K. Scribner, and two anonymousreviewers for their constructive suggestions. This project wasfunded through State Wildlife Grants (FFY 2005 and FFY2006) from the Ohio Department of Natural ResourcesDivision of Wildlife, in-kind contributions from The NatureConservancy, and the Department of Biological Sciences atBowling Green State University.
LITERATURE CITED
Alderson, G. W., H. L. Gibbs, and S. G. Sealy (1999). Parentage andkinship studies in an obligate brood parasitic bird, the Brown-headed Cowbird (Molothrus ater), using microsatellite DNAmarkers. Journal of Heredity 90:182–190.
Alerstam, T. (1991). Bird flight and optimal migration. Trends inEcology & Evolution 6:210–215.
Amadon, D. (1949). The seventy-five per cent rule for subspecies.The Condor 51:250–258.
Avise, J. C. (2000). Phylogeography: The History and Formationof Species. Harvard University Press, Cambridge, MA, USA.
Avise, J. C., and D. Walker (1998). Pleistocene phylogeographiceffects on avian populations and the speciation process.Proceedings of the Royal Society of London B BiologicalSciences 265:457–463.
Baker, H. G. (1972). Seed weight in relation to environmentalconditions in California. Ecology 53:997–1010.
Ball, R. M., Jr., and J. C. Avise (1992). Mitochondrial DNAphylogeographic differentiation among avian populationsand the evolutionary significance of subspecies. The Auk 109:626–636.
Barton, N. H., and G. M. Hewitt (1989). Adaptation, speciationand hybrid zones. Nature 341:497–503.
Berthold, P., A. J. Helbig, G. Mohr, and U. Querner (1992). Rapidmicroevolution of migratory behaviour in a wild bird species.Nature 360:668–670.
Boulet, M., and H. L. Gibbs (2006). Lineage origin and expansionof a Neotropical migrant songbird after recent glaciationevents. Molecular Ecology 15:2505–2525.
Bulgin, N. L., H. L. Gibbs, P. Vickery, and A. J. Baker (2003).Ancestral polymorphisms in genetic markers obscure detec-tion of evolutionarily distinct populations in the endangeredFlorida Grasshopper Sparrow (Ammodramus savannarumfloridanus). Molecular Ecology 12:831–844.
Butler, M. A., S. A. Sawyer, and J. B. Losos (2007). Sexualdimorphism and adaptive radiation in Anolis lizards. Nature447:202–205.
Crandall, K. A., O. R. P. Bininda-Emonds, G. M. Mace, and R. K.Wayne (2000). Considering evolutionary processes in conser-vation biology. Trends in Ecology & Evolution 15:290–295.
Davis, L. A., E. H. Roalson, K. L. Cornell, K. D. McClanahan, and M.S. Webster (2006). Genetic divergence and migration patternsin a North American passerine bird: Implications for evolutionand conservation. Molecular Ecology 15:2141–2152.
Dawson, R. J. G., H. L. Gibbs, K. A. Hobson, and S. M. Yezerinac(1997). Isolation of microsatellite DNA markers from apasserine bird, Dendroica petechia (the Yellow Warbler), andtheir use in population studies. Heredity 79:506–514.
Delany, M. F., J. T. Giesel, and D. A. Brazeau (2000). Geneticvariability among populations of the Florida GrasshopperSparrow. Journal of Wildlife Management 64:631–636.
Edwards, S. V., S. B. Kingan, J. D. Calkins, C. N. Balakrishnan, W. B.Jennings, W. J. Swanson, and M. D. Sorenson (2005).Speciation in birds: Genes, geography, and sexual selection.Proceedings of the National Academy of Sciences USA 102:6550–6557.
Endler, J. A. (1982). Problems in distinguishing historical fromecological factors in biogeography. American Zoologist 22:441–452.
Evanno, G., S. Regnaut, and J. Goudet (2005). Detecting thenumber of clusters of individuals using the softwareStructure: A simulation study. Molecular Ecology 14:2611–2620.
Excoffier, L., G. Laval, and S. Schneider (2005). Arlequin (version3.0): An integrated software package for population geneticsdata analysis. Evolutionary Bioinformatics 1:47–50.
Fitzpatrick, J. W. (2010). Subspecies are for convenience.Ornithological Monographs 67:54–61.
Gibbs, H. L., L. M. Tabak, and K. Hobson (1999). Characterizationof microsatellite DNA loci for a Neotropical migrant songbird,the Swainson’s Thrush (Catharus ustulatus). Molecular Ecol-ogy 8:1551–1552.
Griffith, S. C., I. R. K. Stewart, D. A. Dawson, I. P. F. Owens, and T.Burke (1999). Contrasting levels of extra-pair paternity inmainland and island populations of the House Sparrow(Passer domesticus): Is there an ‘island effect’? BiologicalJournal of the Linnean Society 68:303–316.
Hall, T. A. (1999). BioEdit: A user-friendly biological sequencealignment editor and analysis program for Windows 95/98/NT. Nucleic Acids Symposium Series 41:95–98.
Hanotte, O., C. Zanon, A. Pugh, C. Greig, A. Dixon, and T. Burke(1994). Isolation and characterization of microsatellite loci ina passerine bird: The Reed Bunting Emberiza schoeniclus.Molecular Ecology 3:529–530.
Herrel, A., J. Podos, S. K. Huber, and A. P. Hendry (2005). Biteperformance and morphology in a population of Darwin’sfinches: Implications for the evolution of beak shape.Functional Ecology 19:43–48.
Hubisz, M. J., D. Falush, M. Stephens, and J. K. Pritchard (2009).Inferring weak population structure with the assistance ofsample group information. Molecular Ecology Resources 9:1322–1332.
Huelsenbeck, J. P., and F. Ronquist (2001). MRBAYES: Bayesianinference of phylogenetic trees. Bioinformatics 17:754–755.
Irwin, D. E., and J. H. Irwin (2005). Siberian migratory divides: Therole of seasonal migration in speciation. In Birds of TwoWorlds: The Ecology and Evolution of Migration (R. Green-berg and P. P. Marra, Editors). Johns Hopkins University Press,Baltimore, MD, USA. pp. 27–40.
The Auk: Ornithological Advances 131:298–313, Q 2014 American Ornithologists’ Union
J. D. Ross and J. L. Bouzat Regional divergence in a migratory bird 311
James, F. C. (1991). Complementary descriptive and experimen-tal studies of clinal variation in birds. American Zoologist 31:694–706.
James, F. C. (2010). Avian subspecies: Introduction. Ornitholog-ical Monographs 67:1–5.
Jeffery, K. J., L. F. Keller, P. Arcese, and M. W. Bruford (2001). Thedevelopment of microsatellite loci in the Song Sparrow,Melospiza melodia (Aves) and genotyping errors associatedwith good quality DNA. Molecular Ecology Notes 1:11–13.
Johnson, J. A., P. O. Dunn, and J. L. Bouzat (2007). Effects ofrecent population bottlenecks on reconstructing the demo-graphic history of prairie-chickens. Molecular Ecology 16:2203–2222.
Johnson, N. K., and C. Cicero (2004). New mitochondrial DNAdata affirm the importance of Pleistocene speciation in NorthAmerican birds. Evolution 58:1122–1130.
Kalinowski, S. T., M. L. Taper, and T. C. Marshall (2007). Revisinghow the computer program CERVUS accommodates geno-typing error increases success in paternity assignment.Molecular Ecology 16:1099–1106.
Longmire, J. L., M. Maltbie, and R. J. Baker (1997). Use of ‘‘lysisbuffer’’ in DNA isolation and its implication for museumcollections. Occasional Papers of the Museum of Texas TechUniversity 163:1–3.
Lowe, W. H., and F. W. Allendorf (2010). What can genetics tell usabout population connectivity? Molecular Ecology 19:3038–3051.
Martin, J. W., and J. R. Parrish (2000). Lark Sparrow (Chondestesgrammacus). In The Birds of North America, no. 488 (F. B. Gilland A. Poole, Editors). Birds of North America, Philadelphia,PA, USA.
Mayr, E. (1942). Systematics and the Origin of Species from theViewpoint of a Zoologist. Columbia University Press, NewYork, NY, USA.
McKay, B. D. (2009). Evolutionary history suggests rapiddifferentiation in the Yellow-throated Warbler Dendroicadominica. Journal of Avian Biology 40:181–190.
McKay, B. D., and R. M. Zink (2010). The causes of mitochondrialDNA gene tree paraphyly in birds. Molecular Phylogeneticsand Evolution 54:647–650.
Mila, B., J. E. McCormack, G. Castaneda, R. K. Wayne, and T. B.Smith (2007). Recent postglacial range expansion drives therapid diversification of a songbird lineage in the genus Junco.Proceedings of the Royal Society of London, Series B 274:2653–2660.
Mila, B., T. B. Smith, and R. K. Wayne (2006). Postglacialpopulation expansion drives the evolution of long-distancemigration in a songbird. Evolution 60:2403–2409.
Miller, A. H. (1941). A review of centers of differentiation for birdsin the western Great Basin region. The Condor 43:257–267.
Moritz, C. (1994). Defining ‘evolutionarily significant units’ forconservation. Trends in Ecology & Evolution 9:373–375.
Nei, M. (1987). Molecular Evolutionary Genetics. ColumbiaUniversity Press, New York, NY, USA.
Newton, I. (2003). Speciation and Biogeography of Birds.Academic Press, London, UK.
Nielsen, R., and J. Wakeley (2001). Distinguishing migration fromisolation: A Markov chain Monte Carlo approach. Genetics158:885–896.
Oberholser, H. C. (1932). Descriptions of new birds from Oregon,chiefly from the Warner Valley region. Scientific Publicationsof the Cleveland Museum of Natural History 4:1–12.
Patten, M. A. (2010). Null expectations in subspecies diagnosis.Ornithological Monographs 67:35–41.
Patten, M. A., and P. Unitt (2002). Diagnosability versus meandifferences of Sage Sparrow subspecies. The Auk 119:26–35.
Perez-Tris, J., S. Bensch, R. Carbonell, A. J. Helbig, and J. L. Telleria(2004). Historical diversification of migration patterns in apasserine bird. Evolution 58:1819–1832.
Petren, K. (1998). Microsatellite primers from Geospiza fortis andcross-species amplification in Darwin’s finches. MolecularEcology 7:1782–1784.
Phillimore, A. B., and I. P. F. Owens (2006). Are subspecies usefulin evolutionary and conservation biology? Proceedings of theRoyal Society of London, Series B 273:1049–1053.
Posada, D., and K. A. Crandall (1998). MODELTEST: Testing themodel of DNA substitution. Bioinformatics 14:817–818.
Pruett, C. L., P. Arcese, Y. L. Chan, A. G. Wilson, M. A. Patten, L. F.Keller, and K. Winker (2008). Concordant and discordantsignals between genetic data and described subspecies ofPacific Coast Song Sparrows. The Condor 110:359–364.
Pyle, P. (1997). Identification Guide to North American Birds, part1. Slate Creek Press, Bolinas, CA, USA.
Rasner, C. A., P. Yeh, L. S. Eggert, K. E. Hunt, D. S. Woodruff, and T.D. Price (2004). Genetic and morphological evolutionfollowing a founder event in the Dark-eyed Junco, Juncohyemalis thurberi. Molecular Ecology 13:671–681.
Remington, C. L. (1968). Suture-zones of hybrid interactionbetween recently joined biotas. In Evolutionary Biology, vol. 2(T. Dobzhansky, M. K. Hecht, and W. C. Steere, Editors).Appleton-Century-Crofts, New York, NY, USA. pp. 321–428.
Remsen, J. V., Jr. (2010). Subspecies as a meaningful taxonomicrank in avian classification. Ornithological Monographs 67:62–78.
Rogers, A. R., and H. Harpending (1992). Population growthmakes waves in the distribution of pairwise geneticdifferences. Molecular Biology and Evolution 9:552–569.
Rousset, F. (2008). GENEPOP0007: A complete re-implementationof the GENEPOP software for Windows and Linux. MolecularEcology Resources 8:103–106.
Rubenstein, D. R., C. P. Chamberlain, R. T. Holmes, M. P. Ayres, J.R. Waldbauer, G. R. Graves, and N. C. Tuross (2002). Linkingbreeding and wintering ranges of a migratory songbird usingstable isotopes. Science 295:1062–1065.
Sambrook, J., E. F. Fritsch, and T. Maniatis (1989). MolecularCloning: A Laboratory Manual, 2nd ed. Cold Spring HarborLaboratory Press, Cold Spring Harbor, NY, USA.
Slatkin, M. (1987). Gene flow and the geographic structure ofnatural populations. Science 236:787–792.
Slatkin, M. (1995). A measure of population subdivision based onmicrosatellite allele frequencies. Genetics 139:457–462.
Swenson, N. G., and D. J. Howard (2005). Clustering of contactzones, hybrid zones, and phylogeographic breaks in NorthAmerica. American Naturalist 166:581–591.
Tarr, C. L. (1995). Primers for amplification and determination ofmitochondrial control-region sequences in oscine passerines.Molecular Ecology 4:527–530.
van der Meij, M. A. A., and R. G. Bout (2006). Seed husking timeand maximal bite force in finches. Journal of ExperimentalBiology 209:3329–3335.
The Auk: Ornithological Advances 131:298–313, Q 2014 American Ornithologists’ Union
312 Regional divergence in a migratory bird J. D. Ross and J. L. Bouzat
Vucetich, J. A., and T. A. Waite (2003). Spatial patterns ofdemography and genetic processes across the species’range: Null hypotheses for landscape conservation genetics.Conservation Genetics 4:639–645.
Wakeley, J. (2000). The effects of subdivision on the geneticdivergence of populations and species. Evolution 54:1092–1101.
Waples, R. S., and O. Gaggiotti (2006). What is a population? Anempirical evaluation of some genetic methods for identifyingthe number of gene pools and their degree of connectivity.Molecular Ecology 15:1419–1439.
Webster, M. S., P. P. Marra, S. M. Haig, S. Bensch, and R. T. Holmes(2002). Links between worlds: Unraveling migratory connec-tivity. Trends in Ecology & Evolution 17:76–83.
Whitlock, M. C., and D. E. McCauley (1999). Indirect measures ofgene flow and migration: FST„1/(4Nmþ1). Heredity 82:117–125.
Winker, K. (1993). Specimen shrinkage in Tennessee Warblersand ‘‘Traill’s’’ Flycatchers. Journal of Field Ornithology 64:331–336.
Winker, K. (2010). Subspecies represent geographically parti-
tioned variation, a gold mine of evolutionary biology, and a
challenge for conservation. Ornithological Monographs 67:2–
23.
Zink, R. M. (2004). The role of subspecies in obscuring avian
biological diversity and misleading conservation policy.
Proceedings of the Royal Society of London, Series B 271:
561–564.
Zink, R. M. (2008). Microsatellite and mitochondrial DNA
differentiation in the Fox Sparrow. The Condor 110:482–492.
Zink, R. M., A. E. Kessen, T. V. Line, and R. C. Blackwell-Rago
(2001). Comparative phylogeography of some aridland bird
species. The Condor 103:1–10.
Zink, R. M., J. D. Rising, S. Mockford, A. G. Horn, J. M. Wright, M.
Leonard, and M. C. Westberg (2005). Mitochondrial DNA
variation, species limits, and rapid evolution of plumage
coloration and size in the Savannah Sparrow. The Condor
107:21–28.
The Auk: Ornithological Advances 131:298–313, Q 2014 American Ornithologists’ Union
J. D. Ross and J. L. Bouzat Regional divergence in a migratory bird 313