Poikilothermic animals as a previously unrecognized source ...
37
1 Poikilothermic animals as a previously unrecognized source of fecal indicator 1 bacteria in a backwater ecosystem of a large river 2 3 Christina Frick a,b , Julia Vierheilig b,c,ǂ *, Rita Linke c,ǂ , Domenico Savio d,ǂ , Horst Zornig e , 4 Roswitha Antensteiner f , Christian Baumgartner g , Christian Bucher h,i , Alfred P. Blaschke j,ǂ , 5 Julia Derx j,ǂ , Alexander K.T. Kirschner d,kǂ , Gabriela Ryzinska-Paier a,c , René Mayer c,ǂ , 6 Dagmar Seidl a , Theodossia Nadiotis-Tsaka a , Regina Sommer k,ǂ , Andreas H. 7 Farnleitner c,d,ǂ # 8 9 Vienna City Administration, Municipal Department 39, Vienna, Austria a ; Centre for Water 10 Resource Systems (CWRS), Vienna University of Technology, Vienna, Austria b ; Institute 11 of Chemical Engineering, Research Group Environmental Microbiology and Molecular 12 Ecology, Vienna University of Technology, Vienna, Austria c ; Karl Landsteiner University of 13 Health Sciences, Krems, Austria d ; Pro Fisch OG, Vienna, Austria e ; Vienna, Austria f ; 14 Nationalpark Donau-Auen GmbH, Orth/Donau, Austria g ; Institute of Hydraulic Engineering 15 and Water Resources Management, Vienna University of Technology, Vienna, Austria h ; 16 Institute of Building Construction and Technology, Vienna University of Technology, 17 Austria i ; Institute of Hydraulic Engineering and Water Resources Management, Vienna 18 University of Technology, Austria j ; Unit of Water Hygiene, Institute for Hygiene and Applied 19 Immunology, Medical University of Vienna, Vienna, Austria k 20 21 Running Head: Poikilothermic animals as a source of fecal indicators 22 23 # Address correspondence to Andreas H. Farnleitner, [email protected] 24 *Present address: Department of Microbiology and Ecosystem Science, Division of 25 Microbial Ecology, University of Vienna, Austria 26 AEM Accepted Manuscript Posted Online 8 June 2018 Appl. Environ. Microbiol. doi:10.1128/AEM.00715-18 Copyright © 2018 American Society for Microbiology. All Rights Reserved. on December 12, 2018 by guest http://aem.asm.org/ Downloaded from
-
Upload
khangminh22 -
Category
Documents
-
view
3 -
download
0
Transcript of Poikilothermic animals as a previously unrecognized source ...

1
Poikilothermic animals as a previously unrecognized source of fecal indicator 1
bacteria in a backwater ecosystem of a large river 2
3
Christina Fricka,b, Julia Vierheiligb,c,ǂ*, Rita Linke c,ǂ, Domenico Saviod,ǂ, Horst Zornige, 4
Roswitha Antensteinerf, Christian Baumgartnerg, Christian Bucherh,i, Alfred P. Blaschkej,ǂ, 5
Julia Derxj,ǂ, Alexander K.T. Kirschnerd,kǂ, Gabriela Ryzinska-Paiera,c, René Mayerc,ǂ, 6
Dagmar Seidla, Theodossia Nadiotis-Tsakaa, Regina Sommerk,ǂ, Andreas H. 7
Farnleitnerc,d,ǂ# 8
9
Vienna City Administration, Municipal Department 39, Vienna, Austriaa; Centre for Water 10
Resource Systems (CWRS), Vienna University of Technology, Vienna, Austriab; Institute 11
of Chemical Engineering, Research Group Environmental Microbiology and Molecular 12
Ecology, Vienna University of Technology, Vienna, Austriac; Karl Landsteiner University of 13
Health Sciences, Krems, Austriad; Pro Fisch OG, Vienna, Austriae; Vienna, Austriaf; 14
Nationalpark Donau-Auen GmbH, Orth/Donau, Austriag; Institute of Hydraulic Engineering 15
and Water Resources Management, Vienna University of Technology, Vienna, Austriah; 16
Institute of Building Construction and Technology, Vienna University of Technology, 17
Austriai; Institute of Hydraulic Engineering and Water Resources Management, Vienna 18
University of Technology, Austriaj; Unit of Water Hygiene, Institute for Hygiene and Applied 19
Immunology, Medical University of Vienna, Vienna, Austriak 20
21
Running Head: Poikilothermic animals as a source of fecal indicators 22
23
# Address correspondence to Andreas H. Farnleitner, [email protected] 24
*Present address: Department of Microbiology and Ecosystem Science, Division of 25
Microbial Ecology, University of Vienna, Austria 26
AEM Accepted Manuscript Posted Online 8 June 2018Appl. Environ. Microbiol. doi:10.1128/AEM.00715-18Copyright © 2018 American Society for Microbiology. All Rights Reserved.
on Decem
ber 12, 2018 by guesthttp://aem
.asm.org/
Dow
nloaded from

2
ǂ Interuniversity Cooperation Centre for Water and Health www.waterandhealth.at. 27
28
Abstract 29
Quantitative information regarding the presence of Escherichia coli, intestinal enterococci 30
and Clostridium perfringens in poikilotherms is notably scarce. Therefore, this study was 31
designed to allow a systematic comparison of the occurrence of these standard fecal 32
indicator bacteria (SFIB) in the excreta of wild homeothermic (ruminants, boars, 33
carnivores, birds) and poikilothermic animals (earthworms, gastropods, frogs, and fish) 34
inhabiting an alluvial backwater area in eastern Austria. With the exception of earthworms, 35
the average concentrations of E. coli and enterococci in the excreta of poikilotherms were 36
equal to or only slightly lower than those observed in homeothermic excreta and were 1-4 37
orders of magnitude higher than the levels observed in the ambient soils and sediments. 38
Enterococci reached extraordinarily high concentrations in gastropods. Additional 39
estimates of the daily excreted E. coli and enterococci loads further supported the 40
importance of poikilotherms as potential pollution sources. In agreement with its biological 41
characteristics, the highest concentrations of C. perfringens were observed in carnivores. 42
In conclusion, the long-standing hypothesis that only humans and homeothermic animals 43
are primary sources of SFIB is challenged by the results of this study. It may be necessary 44
to extend the fecal indicator concept by additionally considering poikilotherms as potential 45
important primary habitats of SFIB. Further studies in other geographical areas are needed 46
to evaluate the general significance of our results. We hypothesize that the importance of 47
poikilotherms as sources of SFIB is strongly correlated with the ambient temperature and 48
would therefore be of increased significance in sub-tropical and tropical habitats and water 49
resources. 50
51
on Decem
ber 12, 2018 by guesthttp://aem
.asm.org/
Dow
nloaded from

3
Importance of the Study 52
The current fecal indicator concept is based on the assumption that the standard fecal 53
indicator bacteria (SFIB) Escherichia coli, intestinal enterococci and Clostridium 54
perfringens only multiply in the guts of humans and other homeothermic animals and can 55
therefore indicate fecal pollution and the potential presence of pathogens from those 56
groups. The findings of the present study showed that SFIB can also occur in high 57
concentrations in poikilothermic animals (i.e., animals with body temperatures that vary 58
with the ambient environmental temperature, such as fish, frogs and snails) in an alluvial 59
backwater area in a temperate region, indicating that a reconsideration of this long-60
standing indicator paradigm is needed. This study suggests that poikilotherms must be 61
considered to be potential primary sources of SFIB in future studies. 62
63
Introduction 64
Microbiological water quality monitoring is strongly dependent on investigations of 65
standard fecal indicator bacteria (SFIB). Escherichia coli (E. coli) and intestinal enterococci 66
have been considered the most important SFIB for more than 100 years (1, 2), since the 67
introduction of the fecal indicator concept (3). Furthermore, Clostridium perfringens (C. 68
perfringens) has also been used as a fecal indicator since the beginning of water quality 69
testing (1, 4). SFIB are considered sensitive indicators of the extent of fecal contamination 70
in water resources, and the monitoring of SFIB is an essential tool for water safety 71
management. SFIB can easily be detected by standardized cultivation-based methods, 72
e.g., ISO 16649-2 (5) for E. coli, ISO 7899-2 (6) for intestinal enterococci and ISO 14189 73
(7) for C. perfringens. Their occurrence at high concentrations in the excreta of humans 74
and other homeothermic animals and their inability to replicate in the non-intestinal 75
environment are the most basic requirements for microbial fecal indicators. However, the 76
usefulness of SFIB as fecal indicators has been increasingly questioned following the 77
on Decem
ber 12, 2018 by guesthttp://aem
.asm.org/
Dow
nloaded from
4
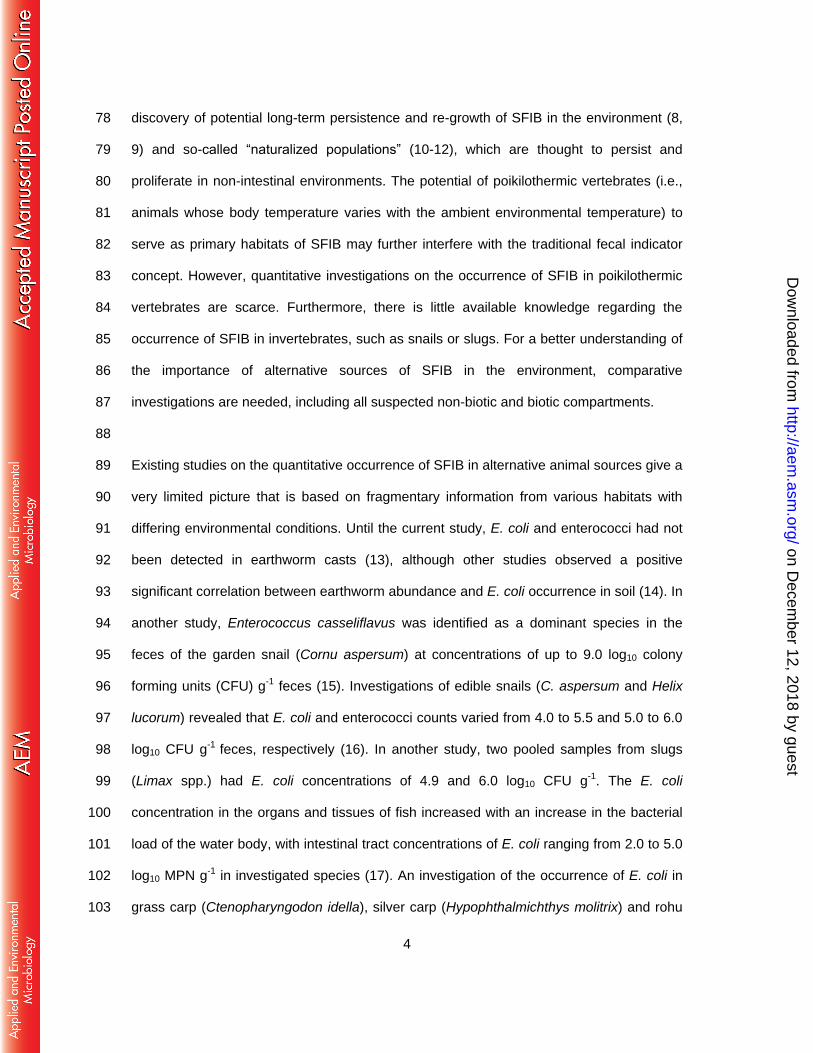
discovery of potential long-term persistence and re-growth of SFIB in the environment (8, 78
9) and so-called “naturalized populations” (10-12), which are thought to persist and 79
proliferate in non-intestinal environments. The potential of poikilothermic vertebrates (i.e., 80
animals whose body temperature varies with the ambient environmental temperature) to 81
serve as primary habitats of SFIB may further interfere with the traditional fecal indicator 82
concept. However, quantitative investigations on the occurrence of SFIB in poikilothermic 83
vertebrates are scarce. Furthermore, there is little available knowledge regarding the 84
occurrence of SFIB in invertebrates, such as snails or slugs. For a better understanding of 85
the importance of alternative sources of SFIB in the environment, comparative 86
investigations are needed, including all suspected non-biotic and biotic compartments. 87
88
Existing studies on the quantitative occurrence of SFIB in alternative animal sources give a 89
very limited picture that is based on fragmentary information from various habitats with 90
differing environmental conditions. Until the current study, E. coli and enterococci had not 91
been detected in earthworm casts (13), although other studies observed a positive 92
significant correlation between earthworm abundance and E. coli occurrence in soil (14). In 93
another study, Enterococcus casseliflavus was identified as a dominant species in the 94
feces of the garden snail (Cornu aspersum) at concentrations of up to 9.0 log10 colony 95
forming units (CFU) g-1 feces (15). Investigations of edible snails (C. aspersum and Helix 96
lucorum) revealed that E. coli and enterococci counts varied from 4.0 to 5.5 and 5.0 to 6.0 97
log10 CFU g-1 feces, respectively (16). In another study, two pooled samples from slugs 98
(Limax spp.) had E. coli concentrations of 4.9 and 6.0 log10 CFU g-1. The E. coli 99
concentration in the organs and tissues of fish increased with an increase in the bacterial 100
load of the water body, with intestinal tract concentrations of E. coli ranging from 2.0 to 5.0 101
log10 MPN g-1 in investigated species (17). An investigation of the occurrence of E. coli in 102
grass carp (Ctenopharyngodon idella), silver carp (Hypophthalmichthys molitrix) and rohu 103
on Decem
ber 12, 2018 by guesthttp://aem
.asm.org/
Dow
nloaded from

5
(Labeo rohita) from aquaculture facilities in which animal manure was directly discharged 104
into fish ponds revealed mean intestinal tract E. coli concentrations of 5.0 ± 0.5 log10 CFU 105
g-1 feces, compared to 3.0 ± 0.7 log10 CFU g-1 feces from control ponds without manure 106
(18). In Japanese tree frogs (Hyla japonica) maintained in a laboratory, the observed 107
concentrations of E. coli, enterococci and Clostridium spp. were 8.3 to 9.9 log10 CFU g-1, 108
6.9 ± 1.3 log10 CFU g-1, and 6.1 to 7.1 log10 CFU g-1 wet intestinal content, respectively 109
(19). The concentration of E. coli in bullfrogs (Rana catesbeiana) maintained in a 110
laboratory was 7.1 to 8.4 log10 CFU g-1 feces (20). Except for the abovementioned studies 111
on individual species, comparative studies on the quantitative occurrence of SFIB in 112
poikilothermic and invertebrate animals within or across habitats were lacking until the 113
current study. 114
115
The aim of this study was to assess the abundance of SFIB in the excreta of various wild 116
animals living in a typical Central European riverine wetland located on the north side of 117
the Danube River at the south-eastern border of Vienna, Austria to support quantitative 118
cross-comparisons of potential sources of SFIB. Groups of animals that can reach high 119
biomass, including homeothermic vertebrates (deer, wild boars, carnivores, and birds), 120
poikilothermic vertebrates (fish and amphibians), and invertebrates (lumbricid fauna and 121
mollusks) were considered in this study. Standardized ISO enumeration methods were 122
chosen to investigate the abundances of E. coli, intestinal enterococci and C. perfringens 123
in excreta of the examined animal groups and in soil and sediment samples of the 12 km² 124
wide study area (porous aquifer backwater area = PA area). To further support an 125
interpretation of the results, SFIB concentrations in the excreta of the evaluated animal 126
groups were converted into estimated daily excreted SFIB loads (DESL). The groups´ 127
DESL values were compared to each other and to the standing stock of SFIB in the 128
on Decem
ber 12, 2018 by guesthttp://aem
.asm.org/
Dow
nloaded from

6
sediment and soil from the investigated area. This facilitated an estimation of each groups´ 129
contribution to the total SFIB load in the study area. 130
131
Results 132
Occurrence and abundance of Escherichia coli and intestinal enterococci in animal 133
feces and excreta. The occurrence and abundance of E. coli and intestinal enterococci 134
was evaluated in 98 and 91 fecal samples from poikilothermic and homoeothermic 135
animals, respectively (Table 1a and 1b). E. coli and enterococci (except one sample) were 136
not detected in any of the earthworm samples. In the gastropod, frog, fish, bird and 137
ruminant fecal samples, the occurrence rate of E. coli was similar and ranged from 77 to 138
93% (Table 1a). The occurrence of enterococci in frogs and fish was 68 and 85%, 139
respectively. The high occurrence of enterococci in gastropods (96%) was comparable to 140
that observed in birds and ruminants (93 and 97%, respectively). E. coli and enterococci 141
were detected in 100% of samples from wild boar and carnivores. Median vs. mean values 142
for E. coli and enterococci concentrations revealed a high level of agreement for all the 143
groups of fecal samples (Table 1a and 1b). Mean E. coli concentrations ranged from 4.2. 144
to 4.6 and from 5.0 to 5.2 log10 CFU g-1 feces in gastropod and fish samples and in bird, 145
ruminant, and frog samples, respectively (Table 1a). The mean enterococci concentrations 146
ranged from 3.3 to 4.7 log10 CFU g-1 feces in the frog, fish and ruminant samples (Table 147
1b). The mean concentration of enterococci in gastropod fecal samples (5.1 log10 CFU g-1) 148
was comparable to those observed in samples from wild boar and carnivores (5.0 and 5.1 149
log10 CFU g-1, respectively) (Table 1b). The average E. coli concentrations were highest in 150
the wild boar and carnivore fecal samples, with 6.6 to 7.0 log10 CFU g-1 feces observed, 151
whereas the highest enterococci concentrations were found in bird fecal samples with 6.1 152
log10 CFU g-1 feces. The variation in the observed E. coli and enterococci concentrations in 153
fecal samples was extremely high for both groups of animals, spanning many orders of 154
on Decem
ber 12, 2018 by guesthttp://aem
.asm.org/
Dow
nloaded from

7
magnitude. In this respect, the distances of the 95th vs. the 5th percentiles for the 155
poikilothermic and homoeothermic animal samples were 5.3 (8.3 - 3.0) and 7.1 (9.4 - 2.3) 156
log10 CFU g-1 feces for E. coli, and 5.1 (7.1 - 2.0) and 6.7 (9.0 - 2.3) log10 CFU g-1 feces for 157
enterococci, respectively (Table 1a and 1b). The highest E. coli concentrations measured 158
in the excreta of the poikilothermic and homeothermic animals evaluated in this study were 159
observed for frogs (8.5 log10 CFU g-1 feces) and carnivores (9.5 log10 CFU g-1 feces), 160
respectively (Table 1a). The highest enterococci concentrations were found in the excreta 161
of gastropods (7.4 log10 CFU g-1 feces) and birds (9.2 log10 CFU g-1 feces) (Table 1b). 162
163
Occurrence and abundance of Clostridium perfringens in animal feces. The number 164
of fecal samples analyzed for C. perfringens included 98 poikilothermic and 91 165
homeothermic animal samples (Table 1c). The occurrence of C. perfringens in fecal 166
material ranged from 39 to 54% in poikilotherms and from 50 to 60% in birds, wild boars 167
and carnivores (Table 1c), whereas only 9% of ruminant fecal samples contained C. 168
perfringens. As was observed for E. coli and enterococci, the median and mean values for 169
C. perfringens concentrations exhibited a high level of agreement for all examined animal 170
groups (Table 1c). Mean concentrations ranged from 2.6 to 2.9 and from 3.4 to 3.7 log10 171
CFU g-1 feces in the earthworm, gastropod and fish samples and in the frog, bird, 172
ruminant, and wild boar samples, respectively (Table 1c). The average concentrations 173
were highest in the carnivore fecal samples (5.6 log10 CFU g-1 feces). The variation in C. 174
perfringens concentrations in fecal samples was lower in poikilotherms compared to 175
homeothermic animals. The distances of the 95th vs. the 5th percentiles were 3.5 (5.5 – 176
2.0) and 5.4 (7.4 - 2.0) log10 CFU g-1 feces for poikilothermic and homoeothermic animals, 177
respectively (Table 1c). The highest C. perfringens concentrations in poikilotherms were 178
observed for frogs (6.1 log10 CFU g-1 feces) (Table 1c). Among the homeothermic animals 179
on Decem
ber 12, 2018 by guesthttp://aem
.asm.org/
Dow
nloaded from

8
assayed, the highest concentrations of C. perfringens were detected in fecal samples of 180
birds and carnivores (7.5 and 7.4 log10 CFU g-1 feces, respectively) (Table 1c). 181
182
Occurrence and abundance of SFIB in soils and sediments. The occurrence of E. coli 183
in sediment from the three investigated layers ranged from 32 to 94% (cf. supplemental 184
material, Table S3a). The mean E. coli concentrations in the three investigated sediment 185
layers of the side ditches were slightly higher (1.5 to 1.8 log10 CFU g-1) than those 186
observed in the backwater (1.2 to 1.5 log10 CFU g-1). The highest concentrations were 187
observed in the upper layer of the backwater (3.1 log10 CFU g-1) and in the upper layer of 188
the side ditches (3.2 log10 CFU g-1). E. coli was present in 14 to 57% of soil samples from 189
the four different porous aquifer backwater area (= PA area) sampling sites, with values 190
ranging from 0.5 to 1.8 log10 CFU g-1 and maximum values ranging from 0.7 to 2.7 log10 191
CFU g-1 (cf. supplemental material, Table S3a). 192
In 18 to 61% of the investigated sediment samples intestinal enterococci were observed, 193
and the occurrence decreased in the deeper sediment layers (cf. supplemental material, 194
Table S3b). The mean enterococci concentrations in the three layers ranged from 1.1 to 195
1.6 log10 CFU g-1 in the backwater and from 1.4 to 2.0 log10 CFU g-1 in the side ditches. 196
The highest concentrations were detected in the two upper layers of the backwater (2.3 197
log10 CFU g-1) and in the upper layer of the side ditches (3.7 log10 CFU g-1). The 198
occurrence of enterococci in soil samples at the four investigated areas varied from 38 to 199
60%, with mean concentrations ranging from 1.2 to 1.6 log10 CFU g-1 (cf. supplemental 200
material, Table S3b). The highest concentration measured in soil was 2.2 log10 CFU g-1. 201
The occurrence of C. perfringens in all three investigated sediment layers was high and 202
ranged from 78 to 100% (cf. supplemental material, Table S3c). The mean C. perfringens 203
concentrations in the three sediment layers of the backwater ranged from 1.7 to 2.0 log10 204
CFU g-1 and from 2.0 to 2.1 log10 CFU g-1 in the side ditches. The highest values observed 205
on Decem
ber 12, 2018 by guesthttp://aem
.asm.org/
Dow
nloaded from
9
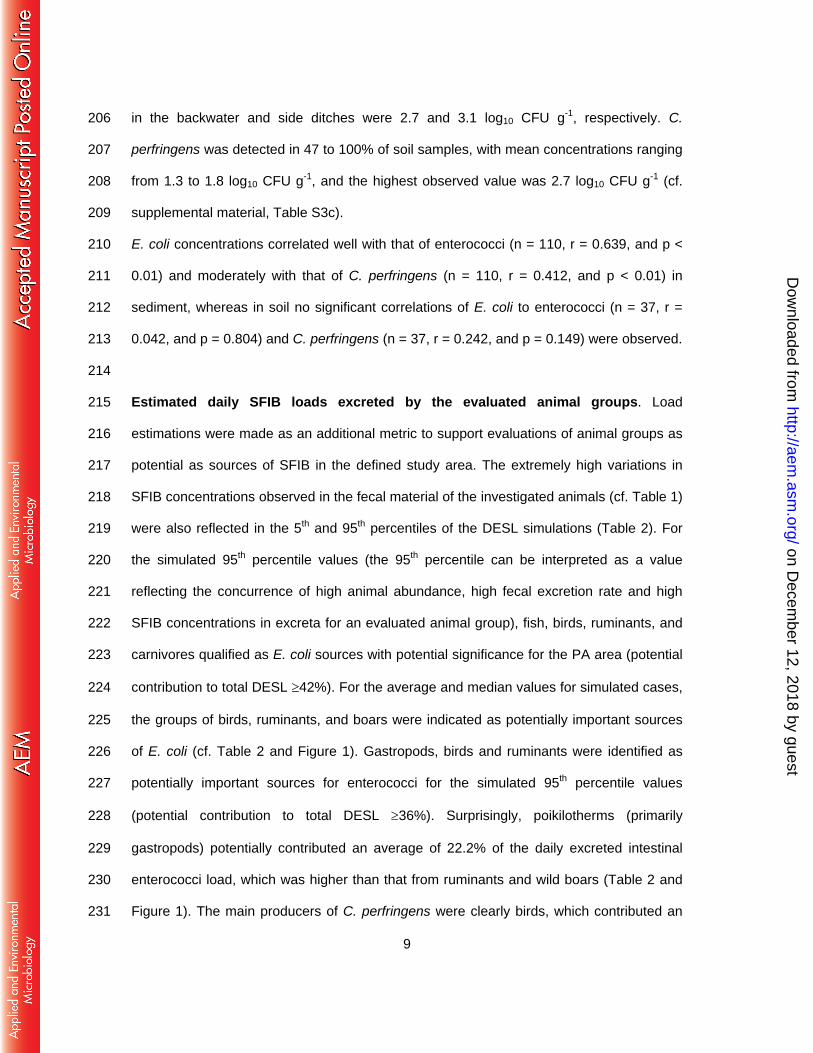
in the backwater and side ditches were 2.7 and 3.1 log10 CFU g-1, respectively. C. 206
perfringens was detected in 47 to 100% of soil samples, with mean concentrations ranging 207
from 1.3 to 1.8 log10 CFU g-1, and the highest observed value was 2.7 log10 CFU g-1 (cf. 208
supplemental material, Table S3c). 209
E. coli concentrations correlated well with that of enterococci (n = 110, r = 0.639, and p < 210
0.01) and moderately with that of C. perfringens (n = 110, r = 0.412, and p < 0.01) in 211
sediment, whereas in soil no significant correlations of E. coli to enterococci (n = 37, r = 212
0.042, and p = 0.804) and C. perfringens (n = 37, r = 0.242, and p = 0.149) were observed. 213
214
Estimated daily SFIB loads excreted by the evaluated animal groups. Load 215
estimations were made as an additional metric to support evaluations of animal groups as 216
potential as sources of SFIB in the defined study area. The extremely high variations in 217
SFIB concentrations observed in the fecal material of the investigated animals (cf. Table 1) 218
were also reflected in the 5th and 95th percentiles of the DESL simulations (Table 2). For 219
the simulated 95th percentile values (the 95th percentile can be interpreted as a value 220
reflecting the concurrence of high animal abundance, high fecal excretion rate and high 221
SFIB concentrations in excreta for an evaluated animal group), fish, birds, ruminants, and 222
carnivores qualified as E. coli sources with potential significance for the PA area (potential 223
contribution to total DESL 42%). For the average and median values for simulated cases, 224
the groups of birds, ruminants, and boars were indicated as potentially important sources 225
of E. coli (cf. Table 2 and Figure 1). Gastropods, birds and ruminants were identified as 226
potentially important sources for enterococci for the simulated 95th percentile values 227
(potential contribution to total DESL 36%). Surprisingly, poikilotherms (primarily 228
gastropods) potentially contributed an average of 22.2% of the daily excreted intestinal 229
enterococci load, which was higher than that from ruminants and wild boars (Table 2 and 230
Figure 1). The main producers of C. perfringens were clearly birds, which contributed an 231
on Decem
ber 12, 2018 by guesthttp://aem
.asm.org/
Dow
nloaded from

10
estimated daily average of 70.7% of these SFIB, followed by carnivores (14.8%) and wild 232
boars (6.1%). The potential importance of poikilotherms as sources for C. perfringens was 233
low compared to homeothermic animals (Table 2 and Figure 1). Humans did not play a 234
significant role as potential sources of SFIB within the considered area. 235
236
Comparison of daily SFIB loads from excreta with the standing stock in sediments 237
and soils. The total estimated standing stock of E. coli in the soil and sediment for the 238
whole PA area ranged from 12.5 to 14.1 log10 CFU (5 to 95% percentiles) (Figure 1). 239
Interestingly, the estimates for the daily excreted E. coli loads for the sum of all animal 240
fecal sources was in the same range as the total sediment and soil stock (Figure 1). For 241
enterococci, the situation was comparable to E. coli, except that the 5 to 95% range of the 242
estimated standing stock was somewhat higher (11.9 to 14.7 log10 CFU). In contrast to E. 243
coli and enterococci, the daily load estimate for C. perfringens for the sum of all animal 244
excreta was, on average, more than two orders of magnitude lower than the standing C. 245
perfringens stock in the sediment and soil of the PA area (Figure 1, cf. supplemental 246
material table S4) 247
248
Discussion 249
High potential of poikilothermic animals to serve as a primary habitat for E. coli. The 250
results of the presented study provide evidence that E. coli is a natural inhabitant of a large 251
fraction of the investigated poikilothermic animals. The high occurrence (i.e., 68 - 85%, 252
Table 1a) and abundance of E. coli in the investigated fecal excreta from the PA study 253
area, which was comparable to homeothermic species, contradict previous findings and 254
conclusions that gastropods (21), fish (22-24) and frogs are only vectors that shed E. coli 255
after ingesting contaminated food, soil or sediment. The observed E. coli concentrations in 256
the fecal material of poikilotherms (4.2 to 5.2 log10 CFU g-1, Table 1) were at least 2 to 4 257
on Decem
ber 12, 2018 by guesthttp://aem
.asm.org/
Dow
nloaded from

11
orders of magnitude higher than the mean E. coli concentrations in ambient sediments and 258
soils (ranging from 0.5 to 1.8 log10 CFU g-1, Table S3, Mann-Whitney U test, p < 0.001 and 259
n = 110). These huge differences in detected concentrations clearly falsify the hypothesis 260
of a vector-based spread of E. coli from sediments or soils in the PA area by poikilothermic 261
animals. Recently performed 16S rRNA gene sequencing of intestinal microbiota also 262
supports these findings, for example, the fish gut microbiota much more closely resembled 263
the gut of mammals than that of environmental communities (25), and the gut microbiota of 264
frogs consisted of a community that was more similar to communities of terrestrial 265
vertebrates than to fish (26). It should be mentioned that extremely large variations of E. 266
coli concentrations in the excreta were observed (from not detectable to 8.5 CFU log10 267
CFU g-1 feces), indicating that E. coli was not a constant member of the microbiota of 268
poikilotherms in the PA area. The occurrence and abundance of E. coli in poikilothermic 269
animals probably depended on many factors, likely including the type and status of the 270
host species, the availability and range of food resources, as well as the season and 271
temperature conditions (21-23, 27-29). One remarkable exception were earthworms, as E. 272
coli was not detected in the recovered casts of these poikilotherms (Table 1). This finding 273
is in agreement with previous studies (13, 30). Moreover, there is some evidence for a 274
selective reduction of coliform bacteria (including E. coli) and intestinal enterococci in 275
earthworms (31, 32). 276
277
E. coli occurrence in the excreta of homeothermic animals agrees with previous 278
findings. The results of this study confirm that E. coli is an abundant member in a very 279
large portion of the investigated homeothermic animals (Table 1a), that was even 280
ubiquitously present in the wild boars and carnivores tested throughout the investigation. 281
The extremely large variation in E. coli concentrations observed in the excreta was 282
comparable with that observed for poikilothermic animals (Table 1a). The average E. coli 283
on Decem
ber 12, 2018 by guesthttp://aem
.asm.org/
Dow
nloaded from
12
concentrations in birds from the study area were comparable to reported values for geese 284
(33, 34). Other studies observed slightly lower (3.6 CFU g-1 to 4.4 log10 MPN g-1) 285
concentrations in geese and cranes (35, 36). Higher average values were also reported for 286
geese (6.9 CFU log10 g-1) and other bird species (up to 8.1 log10 CFU g-1 in ducks, gulls, 287
and swan) by several studies (34, 35, 37, 38). The mean E. coli concentrations in 288
ruminants from an Austrian alpine region and from French deer were two and one log 289
higher compared to the results of the present study, respectively (39, 40). The mean E. 290
coli concentration in deer excreta was 5.7 log10 CFU g-1 feces (calculated from 5.06 log10 291
CFU 100 ml-1 slurry, containing 21.8 mg 100 ml-1 fecal material, on average) (41). E. coli 292
concentrations of 105 to 108 CFU g-1 were observed in domesticated ruminants (beef) (42, 293
43), higher than those obtained from the current study site. In wild boar from the study 294
area, the mean E. coli concentration in stool was comparable to values reported from a 295
French study (7.09 log10 CFU g-1) (40) and values in swine (7.1 CFU log10 g-1) (44). A 296
mean E. coli concentration of 7.0 log10 CFU g-1 was reported for dogs (calculated from 6.31 297
log10 CFU 100 ml-1 slurry, containing 19.8 mg 100 ml-1 fecal material, on average) (41), 298
which is comparable to the results from the PA area. Other studies detected lower mean 299
E. coli concentrations of 4.4 (45) and 5.4 log10 CFU g-1 (46). 300
301
Gastropods qualify as primary habitats for intestinal enterococci. The occurrence 302
(96%) and abundance (median of 5.7 log10 CFU g-1 excreta) of intestinal enterococci in 303
gastropods were comparable to the levels observed in homeothermic feces in the PA area 304
(Table 1b). These results also agree with previous reports of extraordinarily high and 305
permanent levels of Enterococcus in the gastropod C. aspersum (15). Both results provide 306
strong evidence that gastropods must be considered as a primary habitat for intestinal 307
enterococci. Intestinal enterococci were also present in a large fraction of frogs and fish 308
(68-85%), with observed concentrations of at least 1 to 3 orders of magnitude higher than 309
on Decem
ber 12, 2018 by guesthttp://aem
.asm.org/
Dow
nloaded from

13
those measured in ambient soil and sediment samples (Table 2 and S3, cf. vector 310
hypothesis as discussed above, Mann-Whitney U test, p < 0.001 and n = 110). The results 311
of the occurrence of enterococci in frogs and fish also largely agreed with former studies 312
on individual populations from different habitats (19, 22, 47). As already highlighted for E. 313
coli, an extremely large variation in the concentration of enterococci was observed in the 314
excreta of poikilotherms (from not detectable to 6.9 log10 CFU g-1 feces from fish), 315
indicating that intestinal enterococci, with the notable exception of gastropods, were not a 316
constant member of the microbiota of poikilotherms in the PA area but showed a distinct 317
distribution and pronounced population dynamics. Further investigations are needed to 318
understand the factors that affect the occurrence and dynamics of intestinal enterococci in 319
poikilothermic animals (see also discussion for E. coli above). 320
For earthworms, our results contradicted those of a previous study. Picon et al. (48) 321
detected Enterococcus sp. in the intestinal content of earthworms and considered it to be 322
endogenous because it could not be detected in the surrounding soil. In the PA area, 323
enterococci were detected in only one earthworm sample, but were absent in the rest of 324
the casts of the worms assayed (i.e., 96%, Table 1b). 325
326
Enterococci concentrations in feces of homeothermic animals support existing 327
knowledge. The concentrations of enterococci in feces observed in this study strongly 328
indicate that intestinal enterococci are ubiquitous members of the microbiota of 329
homoeothermic animals (93-100%, Table 1). Mean enterococci concentrations for excreta 330
of geese and other species were previously reported to be somewhat lower (2.7 to 5.5 331
log10 CFU g-1) (34, 35, 49) than those observed in this study, and average values in duck, 332
gull and crane were reported as being between 6.7 and 8.0 log10 CFU g-1 (34-36, 38). The 333
mean concentrations of enterococci observed in the excreta of ruminants from an Austrian 334
alpine region were slightly higher (6.0 to 6.4 log10 CFU g-1 in individual samples) (39) 335
on Decem
ber 12, 2018 by guesthttp://aem
.asm.org/
Dow
nloaded from

14
compared to the current study area. The mean enterococci concentration for deer was 4.3 336
log10 CFU g-1 (calculated from 3.56 log10 CFU 100 ml-1 slurry, containing 21.8 mg 100 ml-1 337
fecal material on average) (41), which was comparable to results from the PA area. The 338
concentration of enterococci and lactobacilli in swine was previously reported as 339
approximately 8.0 log10 CFU g-1 (50) and 5.5 log10 CFU g-1 (51), respectively, somewhat 340
higher than what was observed in the present study area. In addition, the enterococci 341
concentration in dogs was assessed in multiple studies, and was reported to be 6.7 log10 342
CFU g-1 (49), 6.9 log10 CFU g-1 (calculated from a slurry containing 19.8 mg 100 ml-1) (41) 343
and 4.05 log10 CFU g-1 (52). The reported enterococci concentration in cats (5.6 log10 CFU 344
g-1) was comparable to the mean value determined for carnivores in the present study 345
(53). 346
347
Clostridium perfringens exhibited a very distinct distribution in animal excreta. 348
Genomic analysis predicts C. perfringens as an anaerobic, fastidious, pathogenic 349
organism, with the essential requirement of various amino acids satisfied by active 350
degradation and import of various materials from tissues, coupled with the ability to 351
produce very persistent spores (54). Based on this information, the primary intestinal 352
habitats with actively reproducing C. perfringens are expected to especially occur in 353
carnivores but also in mixed-diet animals, where its particular nutritional requirements are 354
met (55). Additionally, the long-term persistence of C. perfringens spores is expected to 355
support its distribution in the environment, contributing to a specific background level of 356
spores in soils and sediments. Both theoretical expectations were met by the C. 357
perfringens data set from the PA area (Table 1c and S3). The highest C. perfringens 358
concentrations were observed in carnivores (mean of 5.6 log10 CFU g-1 feces), which were 359
two orders of magnitude higher than those observed in mixed-diet animals (wild boars) 360
(Table 1c). Also in line with expectations, concentrations of C. perfringens in poikilothermic 361
on Decem
ber 12, 2018 by guesthttp://aem
.asm.org/
Dow
nloaded from

15
animals (including earthworms) were not significantly different than those observed in 362
ambient sediments (Mann-Whitney U test, p=0.044 and n=136) and soils (Mann-Whitney 363
U test, p=0.835 and n=136). The detection of C. perfringens or members of the genus 364
Clostridium has already been reported from gastropods (56-58) and diverse fish and frog 365
species (19, 20, 47, 59) and do not contradict the results from this study. Earthworms 366
apparently take up spores during food consumption and shed them with the casts, 367
because their abundance is not reduced during the gut passage (31). These reported 368
results are in good agreement with our findings, where 54% of the investigated casts 369
contained detectable concentrations of C. perfringens (mean concentrations of 2.8 log10 370
CFU g-1 excreta). 371
372
Are poikilotherms relevant sources of E. coli and enterococci in the PA area? 373
Determinations of the occurrence of SFIB in the excreta of animals do not necessarily 374
inform on their relevance as potential pollution sources. To investigate the potential 375
relevance of the studied animal groups to pollute the PA area, we followed a new strategy 376
by estimating the DESL. Estimates on the DESL provided clear evidence that both 377
homeothermic and poikilothermic animals must be regarded as potential sources of E. coli 378
and intestinal enterococci in the studied area (Table 2). In addition, the estimated DESL for 379
E. coli and enterococci accounted for the determined background concentrations within a 380
period of a single day on average (Table 3). However, it must be stated that the DESL 381
metric does not provide any information with respect to the actual level of water pollution. 382
Such estimates would need to consider additional information, such as the transport and 383
persistence of SFIB in the catchment area. The DESL estimate provides a novel metric to 384
evaluate the capacity of a group of animals to contribute to the overall amount of SFIB 385
produced within a defined area and time, it does not predict the actual SFIB load for a 386
specific single day. 387
on Decem
ber 12, 2018 by guesthttp://aem
.asm.org/
Dow
nloaded from

16
Cleary, the results of this study are restricted to backwater environments in the Central 388
European region. Additionally, the investigation period spanned the warm season, from 389
March to November. For such regions, it seems likely that poikilothermic animals play only 390
a minor role during the cold period of the year (from November to February). However, an 391
investigation of the whole seasonal cycle was beyond the aim of this study. Because 392
bacterial growth conditions in poikilothermic animals strongly depend on the temperature, 393
it seems likely that Mediterranean, sub-tropical and tropical climates may support SFIB 394
production in poikilotherms far better than the PA area. We speculate that temperature 395
effects are stronger in the intestine of these animals as compared to the ambient soil, 396
because the digestive tract functions like a “bio-reactor” with increased nutrient availability 397
due to mechanical maceration and digestive processes. Further studies are needed to 398
examine this hypothesis. It would also be interesting to elucidate whether a relationship 399
between previously reported “naturalized” SFIB populations in soils or sediments (8, 11, 400
65) correlate with the abundance and activity of poikilothermic animals, especially when 401
the biomass of poikilotherms is high. 402
403
Is there a need to re-define the fecal indicator paradigm for E. coli and intestinal 404
enterococci? E. coli and intestinal enterococci have been thought to indicate fecal 405
pollution from homeothermic mammals and birds and therefore signal the potential 406
occurrence of pathogens from these groups of animals (60). The results of this study 407
strongly indicate that these fecal indicators also occur commonly in poikilothermic 408
invertebrates and vertebrates at the PA area and have the capacity to contribute to fecal 409
pollution levels. It is clear that further investigations in other areas are needed to 410
substantiate these findings. If so, there would be a need to re-evaluate the current fecal 411
indicator paradigm. Depending on the biotic and abiotic characteristics of the habitat, we 412
hypothesize that E. coli and intestinal enterococci may originate, to a variable extent, from 413
on Decem
ber 12, 2018 by guesthttp://aem
.asm.org/
Dow
nloaded from

17
animals other than homeothermic animals living in and around water resources, soils and 414
sediments. These results do not suggest that E. coli and intestinal enterococci should not 415
be used as indicators for fecal pollution. However, our results suggest that interpretation of 416
these data, especially at low contamination levels, is more complex than previously 417
believed, and strategies to properly apply and interpret the results of these water quality 418
monitoring tools must be adapted accordingly. 419
420
Materials and Methods 421
Investigation area. The investigated porous aquifer (PA) backwater area is a typical 422
Central European riverine wetland located on the north side of the Danube River at the 423
south-eastern border of Vienna, Austria, covering an area of approximately 12 km². The 424
PA area is an important resource for drinking water and is also part of a national park. The 425
Viennese national park area plays a strategic role as a wilderness and recreation area 426
(61). Forestry and sports fishing are of minor importance due to national park regulations 427
(62). Within the PA area, the City of Vienna has designated hunting grounds that are 428
managed by the Forestry Administration Office. Detailed information on the limnologic and 429
hydrological characteristics of the PA area is available elsewhere (63, 64). 430
431
Sampling strategy. Fecal samples were collected directly from the investigation area 432
between 2010 and 2013 from homeothermic animals (cats, dogs, deer, wild boars and 433
birds), poikilothermic vertebrates (fish and amphibians) and invertebrates (lumbricid fauna, 434
mollusks). The species or groups of species were chosen on the basis of their occurrence 435
at the area and because they present the genera with the highest abundances and 436
biomasses. Detailed knowledge on the species distribution is available for the considered 437
national park area (65). Samples were recovered as individual fecal samples from 438
individual animals. The only exception to this sampling strategy was a fraction of the fish 439
on Decem
ber 12, 2018 by guesthttp://aem
.asm.org/
Dow
nloaded from

18
fecal samples, which had to be pooled because of the very low accessible fecal material 440
per animal to enable microbiological analysis. To ensure that sampling was representative, 441
samples for each group were taken on several dates within a two to three year time frame. 442
As poikilotherms are only active during warm, frost-free periods, the investigation and 443
sampling was limited to the frost-free season of the year (March to November). Fecal 444
samples were taken directly from each individual. The intestinal content was obtained by 445
softly squeezing the collected animals (earthworms and fish), briefly trapping individuals 446
and collecting the droppings (birds, mollusks and some of the frogs), or from the intestines 447
of dissected animals (frogs, ruminants, and wild boars). Cormorant samples were taken 448
directly beneath trees in which animals were asleep, where identification of the excreta 449
was assured. All samples were aseptically collected in sterile plastic vials and stored at 5 ± 450
3°C in the dark until analysis. Sampling permission had been granted according to national 451
park regulations (MA22-229/2011, MA22-13854/2013). 452
Vierheilig et al. (55) previously reported on C. perfringens concentrations in wild 453
homeothermic vertebrates partially using the same ruminant, carnivore, birds and wild 454
boar fecal samples. To facilitate comparisons between the study of Vierheilig et al. 455
(Copyright © American Society for Microbiology, Applied and Environmental Microbiology, 456
volume 79(16), 2013, pp 5089-92, doi: 10.1128/AEM.01396-13) with the present study, all 457
samples where a full SFIB dataset was available were also included in the present 458
analysis. No fecal samples from livestock were included, since such animal groups are not 459
allowed in the PA national park area. The wildlife in the PA environment can be considered 460
representative of wildlife in riverine backwater environments. 461
462
Investigated homeothermic vertebrates. The total number of recovered vertebrate 463
samples was 91. Ruminant samples (n = 43, all from the PA area) included Cervus 464
elaphus (red deer), Capreolus capreolus (roe deer), Ovis orientalis musimon (European 465
on Decem
ber 12, 2018 by guesthttp://aem
.asm.org/
Dow
nloaded from

19
mouflon) and Dama dama dama (European fallow deer). Sus scrofa (wild boar, n = 16, all 466
from the PA area) was included as a mixed-diet animal. Sample collection from 467
vertebrates is described in detail by Vierheilig et al. (55). Avian fecal matter from the 468
piscivorous Phalacrocorax carbo sinensis (great cormorant, n = 2) was collected in the PA 469
area. Samples from the other avian species (Anas platyrhynchos (wild duck) and other 470
Anatidae (n = 6), Sterna hirundo (common tern, n = 3), and Charadriiformes (waders, n = 471
4), were obtained from the closely associated Neusiedler See – Seewinkel national park 472
and an alluvial forest in Lower Austria (Neubach). Sampling in the PA area had to be 473
waived for avian species to minimize the disturbance within this area. For domesticated 474
animals (n = 17), feces from dogs (Canis lupus familiaris) and cats (Felis catus) were 475
collected by pet owners or from trails where individuals walk their dogs. The abundance of 476
small vertebrates (mice) was negligible for the experimental period (see supplemental 477
material). 478
479
Investigated poikilothermic vertebrates and poikilothermic invertebrates. The total 480
number of recovered fecal samples from poikilothermic vertebrates and poikilothermic 481
invertebrates was 98. The fish species Esox lucius (pike, n = 2), Silurus glanis (wels 482
catfish, n = 1), Sander lucioperca (pikeperch, n = 1), Abramis brama (bream, n = 8), 483
Aspius aspius (asp, n = 1), Cyprinus carpio morpha hungaricus (carp, n = 4), Perca 484
fluviatilis (redfin perch, n = 6), Rutilus rutilus (roach, n = 4), Carassius gibelio (Prussian 485
carp, n = 1), Abramis ballerus (blue bream, n = 3), Lepomis gibbosus (pumpkin seed, n = 486
1) and Scardinius erythrophthalmus (rudd, n = 1) were directly trapped by electrical fishing 487
at the PA area. The fecal material was primarily investigated as individual samples (n = 488
14). Only in cases where the accessible amount of fecal material per fish was lower than 489
0.25 g we pooled 2 to 4 samples (n = 6). Because fishermen routinely plant fish from a fish 490
farm in Lower Austria into the PA area, fish fecal samples were also obtained from that fish 491
on Decem
ber 12, 2018 by guesthttp://aem
.asm.org/
Dow
nloaded from

20
farm (n = 7, Cyprinus carpio morpha hungaricus). Amphibians were caught using a hand 492
net (n = 15, Bombina bombina and Pelophylax ridibundus, all from the PA area) and were 493
briefly caged or decapitated. In addition, freshly killed amphibians from streets were also 494
collected (n = 4, Bufo bufo, from Lower Austria). Fecal samples from gastropods (n = 26, 495
Arion sp., Helix pomatia, Lymnaea stagnalis, and Viviparus sp., all from the PA area) were 496
retrieved from living, briefly caged individuals. Earthworms (n = 26, Allolobophora rosea 497
rosea, Helodrilus deficiens, Lumbricus rubellus, Octolasion lacteum, Octodrilus 498
transpadanus, Proctodrilus tuberculatus, Octodrilus sp., and Lumbricus sp., all from the PA 499
area) were collected by digging (66), and species were identified in the lab by comparisons 500
made with formalin-preserved individuals. Reptiles were omitted from the study due to 501
their low abundance. 502
503
Investigated soil and sediment samples. To support comparisons of SFIB 504
concentrations in fecal samples with those in the ambient environment, soil and sediment 505
samples were analyzed from July 2010 to May 2011 (monthly, except from December to 506
February). The PA investigation area (12 km²) was categorized into the water area (1.4 507
km2) and the different terrestrial habitat types (alluvial forest protected by a dam 7.3 km2, 508
alluvial forest outside of the dam-protected area 0.1 km2, bank and reef 2.3 km2, marsh 509
0.09 km2, and “Heißlände” 1.7 km2, as described elsewhere) (67) The water area was 510
further categorized into several sections depending on the hydrologic conditions 511
(backwater and side ditches) (63). Seven representative locations in the PA area were 512
chosen for sediment sampling. Three sampling sites with different connectivity to the river 513
were located at the primary backwater (n = 65) as well as four sites at side ditches and 514
small ponds (n = 45). Three of the latter sampling sites were chosen due to the expected 515
high frequency (high abundance) and fecal contamination potential of ruminants and wild 516
boars at the sites, as determined from the tracks of the animals and the presence of a 517
on Decem
ber 12, 2018 by guesthttp://aem
.asm.org/
Dow
nloaded from

21
nearby feeding area for game. Sediments were sampled in the backwaters at a water 518
depth of approximately 20 to 100 cm with a sediment corer. Each sample contained three 519
subsamples taken within 10 m², and the materials (separated into three layers: from the 520
upper first centimeter, the layer from 1 to 5 cm, and the layer from 5 to 10 cm) were 521
thoroughly mixed (68). Seven locations were chosen for soil sampling, one representing 522
the bank and reef zone (n=8), four representing alluvial forest soil (n=22), one representing 523
the so called “Heißlände”, a dry, sandy and brush-covered habitat that is not connected to 524
the groundwater (n=4), and one for a marsh zone at a small side ditch (n=7). Soil samples 525
(three subsamples within a defined 10 m² area marked by stakes) were taken from the 526
upper 10 cm (one layer) with a corer. Subsamples were thoroughly mixed and examined 527
as previously described (68). One milliliter of all fresh sediment and soil samples was 528
weighted to allow the results to be converted from CFU g-1 to CFU ml-1 (equal to cm3). 529
530
Microbiological analysis. Bacteriological analysis of fecal samples was performed as 531
previously described (39), including counts of C. perfringens, E. coli and intestinal 532
enterococci according to established ISO standards. Cultivation-based ISO standard 533
methods were chosen to ensure comparability and interpretation of the results with respect 534
to routine water quality monitoring programs. In brief, E. coli was quantified with TBX agar 535
(44°C, 48 h) according to ISO 16649-2 (5). Enterococci were enumerated on Slanetz and 536
Bartley agar (36°C, 48 h) following ISO 7899-2 (6). C. perfringens was quantified in 537
accordance with ISO 14189 (7) on TSC agar (44°C, 24 h). In the fecal samples, vegetative 538
cells and spores were investigated (without pasteurization of the sample), whereas soil 539
and sediment samples were pasteurized (15 min, 60°C) such that only spores were 540
detected. For quality control, the following type strains were used: E. coli, NCTC 9001; 541
Enterococcus faecalis, NCTC 775; and Clostridium perfringens, NCTC 8237. Exactly 542
weighed fecal samples (approx. 1 g or less if fecal material was limited) were suspended 543
on Decem
ber 12, 2018 by guesthttp://aem
.asm.org/
Dow
nloaded from
22
in 100 ml (or less if fecal material was limited) peptone saline diluent (250 ml distilled 544
water, 2.5 g peptone, 1.25 g NaCl, 0.87 g di-sodium hydrogen phosphate, and 0.37 g di-545
potassium hydrogen phosphate) as described previously (39). After 30 min of suspension 546
time, samples were shaken and allowed to settle for 15 min. Sediment and soil samples 547
were prepared by mixing approximately 1 g of sample in 100 ml peptone saline diluent and 548
slowly shaking for 30 min on a shaker (Lab Tec MS30A), after which the suspension was 549
allowed to settle for 1 h (69, 70). 550
One milliliter aliquots of suspensions and prepared dilutions (10-2 up to 10-6) were 551
analyzed by the membrane filtration method (using 0.45-µm cellulose-nitrate membrane 552
filters). The detection limit (DL) depends on the mass of sample material used and is 553
calculated by the following formula 554
𝐷𝐿 =𝑉
𝐺
555
where DL is the limit of detection of target bacteria (given in CFU per g sample), V is the 556
volume of diluent (in ml) used for the suspension of the sample material, and G is the 557
mass of sample material in g (55). For most of the fecal samples (84%), the detection limit 558
was lower than 120 CFU g-1. For 8% of samples, the detection limit was between 120 and 559
499 CFU g-1. For a few samples (7%), the detection limit was between 500 and 1,000 CFU 560
g-1 (in cases where very little material was available). The detection limits for soil and 561
sediment were as high as 10 CFU g-1 fresh material. The results are given in log10 colony-562
forming units (CFU) g-1 wet material unless otherwise specified. 563
564
Estimating daily SFIB loads excreted by the evaluated groups of animals. Although 565
the primary focus of the study was to establish quantitative data on the occurrence of SFIB 566
in the feces of homoeothermic and poikilothermic animals, the determined concentrations 567
on Decem
ber 12, 2018 by guesthttp://aem
.asm.org/
Dow
nloaded from
23
were also converted into estimates of SFIB loads from the daily excreted animal fecal 568
emissions. Load estimates were made to further evaluate the significance of the evaluated 569
groups of animals as potential sources of SFIB and to compare them with the standing 570
stock of SFIB in the soil and sediment of the PA area. The load estimation was based on 571
the pollution source profile (PSP) method, previously established and applied for an alpine 572
karstic watershed in the Northern Calcareous Alps of Austria (71). The PSP method 573
described in Farnleitner et al. (72) was extended with a Monte Carlo simulation. Briefly, the 574
PSP principle is based on two steps: i) the estimation of expected fecal emission rates of 575
the animal groups selected (i.e., the amount of fecal mass excreted per area over a given 576
time), and ii) multiplication of the determined fecal emission rates by the determined SFIB 577
concentrations in the excreta (73). The estimated loads of SFIB for the considered groups 578
of animals were expressed per the 12 km² PA area and per day. A detailed description of 579
the study area (specification of surface and water volume) is given as supplemental 580
material (section 1.1). Finally, to support comparisons, the estimated daily excreted SFIB 581
loads (DESL) were expressed as percentages with respect to the total DESL (sum of all 582
partial animal loads). Expected fecal emission rates for the animal groups (animal fecal 583
masses produced per day and PA area) were determined by the best available data on 584
animal population sizes or animal standing stocks (given as biomasses or individual 585
numbers in the study area) multiplied by the specific excretion rate of an animal group 586
(given as the expected amount of fecal material produced per considered type of organism 587
and day (73)). All multiplications were performed by the SPSS Monte Carlo simulation tool 588
to estimate average, median, 5% and 95% values. Estimated population sizes or standing 589
stock numbers were obtained from literature on the PA area and from information provided 590
by local national park authorities. Specific fecal excretion rate estimates (i.e., the mass of 591
feces excreted per animal or animal biomass per day) were obtained from the literature (if 592
available) or estimated by expert judgment. A detailed overview of the types and ranges of 593
on Decem
ber 12, 2018 by guesthttp://aem
.asm.org/
Dow
nloaded from

24
values used and the corresponding information sources is given in the supplemental 594
material (section 1.2. and table S1). It should be mentioned that hibernation and reduced 595
activity due to cold temperatures were not considered, as the investigation was restricted 596
to the warm season (see sampling design). Thus, the established estimates represent 597
conditions of active poikilotherms during warm and humid periods (cf. sampling design). 598
Human visitors of the national park area were also included as potential fecal sources in 599
the comparisons (cf. supplemental material). 600
601
Estimating the standing stock of SFIB in sediment and soil. For this estimation, the 12 602
km² of the PA area was categorized into the water area and the different terrestrial habitat 603
types as described above. Corresponding volumes of the bottom sediment (i.e., 4 selected 604
layers: 0-1, 1-5, 5-10, and below 10 cm) and soil (i.e., 2 selected layers: 0-10 cm and 605
below 10 cm) were calculated from a digital terrain model (5 m × 5 m grids) as described 606
elsewhere (67), including the complete sediment or soil layer above the gravel layer (cf. 607
supplemental material, Table S2). Standing stock values for SFIB (i.e., SFIB numbers per 608
PA area) were estimated by multiplying the calculated volumes of sediment or soil with the 609
SFIB concentrations observed in sediment and soil samples from the corresponding 610
sections of the study area (cf. supplemental material, Table S2). For the sediment and soil 611
layer below 10 cm, no measured SFIB data were available from the study area. To 612
calculate the standing stock in this bottom layer, the SFIB concentration from the layers 613
above were used but were reduced by one log order. This assumption is based on 614
literature, which reports a strong decrease in SFIB concentrations with increased depth in 615
riverine soils and sediments (74-76). As all SFIB concentrations in samples from 616
“Heißlände” (n=4) were below the detection limit, the area for “Heißlände” was not 617
considered for the calculation. All multiplications were made using the SPSS Monte Carlo 618
simulation tool to estimate average, median, 5% and 95% standing stock values. 619
on Decem
ber 12, 2018 by guesthttp://aem
.asm.org/
Dow
nloaded from

25
620
Statistical analysis. The analysis of SFIB data was performed using Microsoft Excel 2010 621
and IBM SPSS statistics (version 23). Microbiological data were log10 (x+1) transformed 622
for presentations in tables and figures. For the comparison of group means, the Mann-623
Whitney U test was used (nonparametric). Correlation analysis was performed with the 624
nonparametric Spearman´s correlation. For the applied Monte Carlo simulations with 625
SPSS (cf. SFIB fecal loads and standing stock estimates, see paragraph above) the 626
number of simulated cases of random multiplications was set to 100,000 with a stop 627
criterion (confidence interval of the mean was within 1%) and using individual values for 628
simulations. A sensitivity analysis for the DESL estimation is presented as supplemental 629
material. 630
631
Acknowledgments 632
This paper was supported by the Austrian Science Fund (FWF) as part of the “Vienna 633
Doctoral Program on Water Resource Systems” (W1219-N22), the FWF single project 634
Unify (P23900-B22) and the research project “Groundwater Resource Systems Vienna,” in 635
cooperation with Vienna Water as part of the “(New) Danube-Lower Lobau Network 636
Project” [Gewässervernetzung (Neue) Donau-Untere Lobau (Nationalpark Donau-Auen)] 637
funded by the Government of Austria (Federal Ministry of Agriculture, Forestry, 638
Environment & Water Management), the Government of Vienna, and the European 639
Agricultural Fund for Rural Development (project LE 07-13). 640
641
We acknowledge the laboratory teams at Vienna municipal department 39 (Doris Ruzic 642
and Marian Huth) and at the Medical University of Vienna (Sonja Knetsch and Andrea 643
Lettl) for the laboratory assistance. We thank the Vienna municipal department 22 for 644
granting of sampling permission MA 22 – 229/2011 and MA22-13854/2013 and 645
on Decem
ber 12, 2018 by guesthttp://aem
.asm.org/
Dow
nloaded from

26
consultation. Special thanks to Vienna municipal department 49 (Dipl-Ing. Alexander 646
Faltjesek and Ing. Günter Walzer) for supplying us with fecal material from hunted animals 647
from the PA area. We acknowledge assistance during sampling of gastropods by Vienna 648
municipal department 45 (Dipl.-Ing. Dr. Thomas Ofenböck), during sampling of fish by Dr. 649
Thomas Spindler, Fischzucht Machacek and Martin Genser (Verband der 650
Österreichischen Arbeiter-Fischerei-Vereine), during sampling of bird fecal material by 651
Prof. Rosemarie Parz-Gollner and during sampling of cat and dog fecal material by Dipl.-652
Ing. Dr. Georg Reischer. Thanks to Gruppe Wasser® and DonauConsult Ingenieurbüro 653
GmbH for providing data on water quantity in the PA area. 654
655
Literature Cited 656
1. Council of the EU. 1998. COUNCIL DIRECTIVE 98/83/EC of 3 November 1998 on the 657 quality of water intended for human consumption. Official Journal of the European 658 Community L330/32. http://eur-lex.europa.eu/legal-659 content/EN/TXT/PDF/?uri=CELEX:31998L0083&from=en. 660
2. United States Environmental Protection Agency. 2012. Recreational water quality 661 criteria. 820-F-12-058. U.S. EPA Office of Water, 662 http://www.epa.gov/sites/production/files/2015-10/documents/rwqc2012.pdf. 663
3. Cabral JPS. 2010. Water Microbiology. Bacterial Pathogens and Water. International 664 Journal of Environmental Research and Public Health 7:3657-3703. 665
4. Klein E. 1895. Ueber einen pathogenen aneroben Darmbacillus Bacillus enteritidis 666 sporogenes. Zentralblatt für Bakteriologie Mikrobiologie und Hygiene: I Abt 18:737-743. 667
5. International Organisation for Standardisation. 2001. ISO 16649-2 Microbiology of food 668 and animal feeding stuffs - Horizontal method for the enumeration of beta-glucuronidase-669 positive Escherichia coli - Part 2: Colony-count technique at 44 degrees C using 5-bromo-4-670 chloro-3-indolyl beta-D-glucuronide, Geneva, Switzerland. 671
6. International Organisation for Standardisation. 2000. ISO 7899-2 Water quality - 672 Detection and enumeration of intestinal enterococci - Part 2: Membrane filtration method, 673 Geneva, Switzerland. 674
7. International Organisation for Standardisation. 2013. ISO 14189 Water quality - 675 Enumeration of Clostridium perfringens - Method using membrane filtration, Geneva, 676 Switzerland. 677
8. Derry C, Attwater R. 2014. Regrowth of enterococci indicator in an open recycled-water 678 impoundment. The Science of the total environment 468-469:63-67. 679
9. Brennan FP, Abram F, Chinalia FA, Richards KG, O'Flaherty V. 2010. Characterization 680 of environmentally persistent Escherichia coli isolates leached from an Irish soil. Applied 681 and Environmental Microbiology 76:2175-2180. 682
10. Ishii S, Sadowsky MJ. 2008. Escherichia coli in the environment: Implications for water 683 quality and human health. Microbes and Environments 23:101-108. 684
11. Byappanahalli MN, Nevers MB, Korajkic A, Staley ZR, Harwood VJ. 2012. Enterococci 685 in the Environment. Microbiology and Molecular Biology Reviews 76:685-706. 686
12. Jang J, Hur HG, Sadowsky MJ, Byappanahalli MN, Yan T, Ishii S. 2017. Environmental 687 Escherichia coli: ecology and public health implications—a review. Journal of Applied 688 Microbiology 123:570-581. 689
on Decem
ber 12, 2018 by guesthttp://aem
.asm.org/
Dow
nloaded from

27
13. Parthasarathi K, Ranganathan LS, Anandi V, Zeyer J. 2007. Diversity of microflora in the 690 gut and casts of tropical composting earthworms reared on different substrates. Journal of 691 Environmental Biology 28:87-97. 692
14. Mainoo N-OK, Whalen JK, Barrington S. 2008. Earthworm abundance related to soil 693 physicochemical and microbial properties in Accra, Ghana. African Journal of Agricultural 694 Research 3:186-194. 695
15. Charrier M, Combet-Blanc Y, Ollivier B. 1998. Bacterial flora in the gut of Helix aspersa 696 (Gastropoda Pulmonata): evidence for a permanent population with a dominant homolactic 697 intestinal bacterium, Enterococcus casseliflavus. Canadian Journal of Microbiology 44:20-698 27. 699
16. Parlapani FF, Neofitou C, Boziaris IS. 2014. Microbiological quality of raw and processed 700 wild and cultured edible snails. Journal of the Science of Food and Agriculture 94:768-772. 701
17. Guzman MC, Bistoni MD, Tamagnini LM, Gonzalez RD. 2004. Recovery of Escherichia 702 coli in fresh water fish, Jenynsia multidentata and Bryconamericus iheringi. Water research 703 38:2368-2374. 704
18. Son TTD, Dalsgaard A. 2012. Escherichia coli contamination of fish raised in integrated 705 pig-fish aquaculture systems in Vietnam. Journal of Food Protection 75:1317-1319. 706
19. Benno Y, Izumi-Kurotani A, Yamashita M. 1992. Isolation and identification of intestinal 707 bacteria from Japanese tree frog (Hlya japonica) with the special reference to anaerobic 708 bacteria. The Journal of Veterinary Medical Science 54(4):699-702. 709
20. Sugita H, Nakajima T, Deguchi Y. 1984. The intestinal microflora of bullfrog Rana 710 catesbeiana at different stages of its development. Nippon Suisan Gakkaishi 51:295-300. 711
21. Sproston EL, Macrae M, Ogden ID, Wilson MJ, Strachan NJC. 2006. Slugs: Potential 712 novel vectors of Escherichia coli O157. Applied and Environmental Microbiology 72:144-713 149. 714
22. Austin B. 2006. The bacterial microflora of fish, revised. The Scientific World Journal 715 6:931-945. 716
23. Del Rio-Rodriguez RE, Inglis V, Millar SD. 1997. Survival of Escherichia coli in the 717 intestine of fish. Aquaculture Research 28:257-264. 718
24. Hansen DL, Clark JJ, Ishii S, Sadowsky MJ, Hicks RE. 2008. Sources and sinks of 719 Escherichia coli in benthic and pelagic fish. Journal of Great Lakes Research 34:228-234. 720
25. Clements KD, Angert ER, Montgomery WL, Choat JH. 2014. Intestinal microbiota in 721 fishes: what's known and what's not. Molecular Ecology 23:1891-1898. 722
26. Kohl KD, Cary TL, Karasov WH, Dearing MD. 2013. Restructuring of the amphibian gut 723 microbiota through metamorphosis. Environmental Microbiology Reports 5:899-903. 724
27. Cardoso AM, Cavalcante JJV, Vieira RP, Lima JL, Grieco MAB, Clementino MM, 725 Vasconcelos ATR, Garcia ES, de Souza W, Albano RM, Martins OB. 2012. Gut 726 Bacterial Communities in the Giant Land Snail Achatina fulica and Their Modification by 727 Sugarcane-Based Diet. Plos One 7. 728
28. Bolnick DI, Snowberg LK, Hirsch PE, Lauber CL, Knight R, Caporaso JG, Svanback 729 R. 2014. Individuals' diet diversity influences gut microbial diversity in two freshwater fish 730 (threespine stickleback and Eurasian perch). Ecology Letters 17:979-987. 731
29. Picos CA, Marinescu GA. 1965. Nitrogen excretion in the carp in different periods of the 732 year Russ. and Fr. sum. An Univ Bucuresti Ser Stint Natur 14:205-210. 733
30. Hong SW, Kim IS, Lee JS, Chung KS. 2011. Culture-Based and Denaturing Gradient Gel 734 Electrophoresis Analysis of the Bacterial Community Structure from the Intestinal Tracts of 735 Earthworms (Eisenia fetida). Journal of Microbiology and Biotechnology 21:885-892. 736
31. Gomez-Brandon M, Dominguez J. 2014. Recycling of solid organic wastes through 737 vermicomposting: microbial community changes throughout the process and use of 738 vermicompost as a soil amendment. Critical Reviews in Environmental Science and 739 Technology 44:1289-1312. 740
32. Monroy F, Aira M, Dominguez J. 2008. Changes in density of nematodes, protozoa and 741 total coliforms after transit through the gut of four epigeic earthworms (Oligochaeta). 742 Applied Soil Ecology 39:127-132. 743
33. Middleton JH, Ambrose A. 2005. Enumeration and antibiotic resistance patterns of feca 744 indicator organisms isolated from migratory canada geese (Branta canadenis). Journal of 745 Wildlife Diseases 41:334-341. 746
on Decem
ber 12, 2018 by guesthttp://aem
.asm.org/
Dow
nloaded from

28
34. Moriarty EM, Karki N, Mackenzie M, Sinton LW, Wood DR, Gilpin BJ. 2011. Faecal 747 indicators and pathogens in selected New Zealand waterfowl. New Zealand Journal of 748 Marine and Freshwater Research 45:679-688. 749
35. Haack SK, Fogarty LR, Wright C. 2003. Escherichia coli and enterococci at beaches in 750 the Grand Traverse Bay, Lake Michigan: sources, characteristics, and environmental 751 pathways. Environmental Science and Technology 37:3275-3282. 752
36. Vogel J, Griffin D, Ip H, Ashbolt N, Moser M, Lu J, Beitz M, Ryu H, Domingo JS. 2013. 753 Impacts of migratory sandhill cranes (Grus canadensis) on microbial water quality in the 754 Central Platte River, Nebraska, USA. Water, Air, & Soil Pollution 224:1-16. 755
37. Meerburg BG, Koene MG, Kleijn D. 2011. Escherichia coli concentrations in feces of 756 geese, coots, and gulls residing on recreational water in The Netherlands. Vector Borne 757 Zoonotic Diseases 11:601-603. 758
38. Fogarty LR, Haack SK, Wolcott MJ, Whitman RL. 2003. Abundance and characteristics 759 of the recreational water quality indicator bacteria Escherichia coli and enterococci in gull 760 faeces. Journal of Applied Microbiology 94:865-878. 761
39. Farnleitner AH, Ryzinska-Paier G, Reischer GH, Burtscher MM, Knetsch S, Kirschner 762 AKT, Dirnboeck T, Kuschnig G, Mach RL, Sommer R. 2010. Escherichia coli and 763 enterococci are sensitive and reliable indicators for human, livestock and wildlife faecal 764 pollution in alpine mountainous water resources. Journal of Applied Microbiology 109:1599-765 1608. 766
40. Smati M, Clermont O, Bleibtreu A, Fourreau F, David A, Daubié A-S, Hignard C, 767 Loison O, Picard B, Denamur E. 2015. Quantitative analysis of commensal Escherichia 768 coli populations reveals host-specific enterotypes at the intra-species level. 769 MicrobiologyOpen 4:604-615. 770
41. Ervin JS, Russell TL, Layton BA, Yamahara KM, Wang D, Sassoubre LM, Cao Y, Kelty 771 CA, Sivaganesan M, Boehm AB, Holden PA, Weisberg SB, Shanks OC. 2013. 772 Characterization of fecal concentrations in human and other animal sources by physical, 773 culture-based, and quantitative real-time PCR methods. Water research 47:6873-6882. 774
42. Lefebvre B, Malouin F, Roy G, Giguere K, Diarra MS. 2006. Growth performance and 775 shedding of some pathogenic bacteria in feedlot cattle treated with different growth-776 promoting agents. Journal of Food Protection 69:1256-1264. 777
43. Anderson RC, Callaway TR, Anderson TJ, Kubena LF, Keith NK, Nisbet DJ. 2002. 778 Bactericidal Effect of Sodium Chlorate on Escherichia coli Concentrations in Bovine 779 Ruminal and Fecal Contents In Vivo. Microbial Ecology in Health and Disease 14:24-39. 780
44. Duriez P, Topp E. 2007. Temporal dynamics and impact of manure storage on antibiotic 781 resistance patterns and population structure of Escherichia coli isolates from a commercial 782 swine farm. Applied and Environmental Microbiology 73:5486-5493. 783
45. Stercova E, Kumprechtova D, Auclair E, Novakova J. 2016. Effects of live yeast dietary 784 supplementation on nutrient digestibility and fecal microflora in beagle dogs. Journal of 785 Animal Science 94:2909-2918. 786
46. Chen MS, Yong XL, Nsor-Atindana J, Masamba KG, Ma JG, Zhong F. 2016. 787 Quantitative optimization and assessments of supplemented fructooligosaccharides in dry 788 dog food. Rsc Advances 6:110047-110052. 789
47. Banas JA, Loesche WJ, Nace GW. 1988. Classification and distribution of large intestinal 790 bacteria in nonhibernating and hibernating leopard frogs (Rana pipiens). Applied and 791 Environmental Microbiology 54:2305-2310. 792
48. Picon CM, Susana Teisaire SE. 2012. Identification of the intestinal microbial community 793 of Glossoscolecidae earthworms (Annelida: Oligochaeta). Munis Entomology & Zoology 794 7:1035-1043. 795
49. Wright ME, Solo-Gabriele HM, Elmir S, Fleming LE. 2009. Microbial load from animal 796 feces at a recreational beach. Marine Pollution Bulletin 58:1649-1656. 797
50. Fava F, Makivuokko H, Siljander-Rasi H, Putaala H, Tiihonen K, Stowell J, Tuohy K, 798 Gibson G, Rautonen N. 2007. Effect of polydextrose on intestinal microbes and immune 799 functions in pigs. Br J Nutr 98:123-133. 800
51. Ahmad A, Ghosh A, Schal C, Zurek L. 2011. Insects in confined swine operations carry a 801 large antibiotic resistant and potentially virulent enterococcal community. Bmc Microbiology 802 11. 803
52. Anderson SA, Turner SJ, Lewis GD. 1997. Enterococci in the New Zealand environment: 804 Implications for water quality monitoring. Water Science and Technology 35:325-331. 805
on Decem
ber 12, 2018 by guesthttp://aem
.asm.org/
Dow
nloaded from
29
53. Seyfried PL, Harris E. 1990. Bacteriological characterisation of feces and source 806 differentiation. Water Resources Branch, Ontario Ministry of the Environment, Ontario. 807
54. Shimizu T, Ohtani K, Hirakawa H, Ohshima K, Yamashita A, Shiba T, Ogasawara N, 808 Hattori M, Kuhara S, Hayashi H. 2002. Complete genome sequence of Clostridium 809 perfringens, an anaerobic flesh-eater. Proceedings of the National Academy of Sciences of 810 the United States of America 99:996-1001. 811
55. Vierheilig J, Frick C, Mayer RE, Kirschner AK, Reischer GH, Derx J, Mach RL, 812 Sommer R, Farnleitner AH. 2013. Clostridium perfringens is not suitable for the indication 813 of fecal pollution from ruminant wildlife but is associated with excreta from nonherbivorous 814 animals and human sewage. Applied and Environmental Microbiology 79:5089-5092. 815
56. Charrier M, Fonty G, Gaillard-Martinie B, Ainouche K, Andant G. 2006. Isolation and 816 characterization of cultivable fermentative bacteria from the intestine of two edible snails, 817 Helix pomatia and Cornu aspersum (Gastropoda : Pulmonata). Biological Research 818 39:669-681. 819
57. Li KJ. 2012. Molecular analysis of intestinal bacterial communities in Cipangopaludina 820 chinensis used in aquatic ecological restorations. Ecological Engineering 39:36-39. 821
58. Elliott LP. 1970. Certain bacteria, some of medical interest, associated with slug Limax 822 maximus. Journal of Invertebrate Pathology 15:306-&. 823
59. Izvekova GI, Izvekov EI, Plotnikov AO. 2007. Symbiotic microflora in fishes of different 824 ecological groups. Biology Bulletin 34:610-618. 825
60. Stalder GL, Farnleitner A, Sommer R, Beiglbock C, Walzer C. 2011. Hazard- and risk 826 based concepts for the assessment of microbiological water quality - part 2. Wiener 827 Tierarztliche Monatsschrift 98:54-65. 828
61. Arnberger A, Frey-Roos F, Eder R, Muralt G, Nopp-Mayr U, Tomek H, Zohmann M. 829 2009. Ökologische und soziale Tragfähigkeiten als Managementherausforderungen für 830 suburbane Biosphärenparke am Beispiel Untere Lobau (Ecological and Social Carrying 831 Capacities as Management Challenges for Peri-Urban Biosphere Reserves). Final report. 832 University of Natural Resources and Life Sciences, Vienna, 833
62. Hein T, Blaschke AP, Haidvogl G, Hohensinner S, Kucera-Hirzinger V, Preiner S, 834 Reiter K, Schuh B, Weigelhofer G, Zsuffa I. 2006. Optimised management strategies for 835 the Biosphere reserve Lobau, Austria - based on a multi criteria decision support system. 836 Ecohydrology & Hydrobiology 6:25-36. 837
63. Reckendorfer W, Funk A, Gschoepf C, Hein T, Schiemer F. 2013. Aquatic ecosystem 838 functions of an isolated floodplain and their implications for flood retention and 839 management. Journal of Applied Ecology 50:119-128. 840
64. Funk A, Gschopf C, Blaschke AP, Weigelhofer G, Reckendorfer W. 2013. Ecological 841 niche models for the evaluation of management options in an urban floodplain-conservation 842 vs. restoration purposes. Environmental Science & Policy 34:79-91. 843
65. Rabitsch W. 2005. Zoologische Artenlisten für den Nationalpark Donau-Auen (Zoological 844 species list for the national park Donau-Auen). Nationalpark Donauauen, Orth, Austria. 845
66. Bauer R. 1998. Characterization of the lumbricid fauna in alluvial soils in the Danube River 846 floodplain area east of Vienna. Linzer biologische Beiträge 30:11-20. 847
67. Taschke R, Blaschke AP, Gabriel H, Mayr E. 2014. Water connection (New) Danube - 848 Lower Lobau (Nationalpark Donauauen). Water quantity report for groundwater. Municipal 849 Department 45, Vienna, Austria. 850
68. Byamukama D, Mach RL, Kansiime F, Manafi M, Farnleitner AH. 2005. Discrimination 851 efficacy of fecal pollution detection in different aquatic habitats of a high-altitude tropical 852 country, using presumptive coliforms, Escherichia coli, and Clostridium perfringens spores. 853 Applied and Environmental Microbiology 71:65-71. 854
69. Boehm AB, Griffith J, McGee C, Edge TA, Solo-Gabriele HM, Whitman R, Cao Y, 855 Getrich M, Jay JA, Ferguson D, Goodwin KD, Lee CM, Madison M, Weisberg SB. 856 2009. Faecal indicator bacteria enumeration in beach sand: a comparison study of 857 extraction methods in medium to coarse sands. Journal of Applied Microbiology 107:1740-858 1750. 859
70. Grimes DJ. 1980. Bacteriological water-quality effects of hydraulically dredging 860 contaminated upper Mississippi River bottom sediment. Applied and Environmental 861 Microbiology 39:782-789. 862
on Decem
ber 12, 2018 by guesthttp://aem
.asm.org/
Dow
nloaded from

30
71. Reischer GH, Kollanur D, Vierheilig J, Wehrspaun C, Mach RL, Sommer R, Stadler H, 863 Farnleitner AH. 2011. Hypothesis-driven approach for the identification of fecal pollution 864 sources in water resources. Environmental Science & Technology 45:4038-4045. 865
72. Farnleitner AH, Reischer GH, Stadler H, Kollanur D, Sommer R, Zerobin W, Blöschl G, 866 Barrella KM, Truesdale JA, Casarez EA, Di Giovanni GD. 2011. Agricultural and Rural 867 Watersheds, p 399-431. In Hagedorn C, Blanch AR, Harwood VJ (ed), Microbial Source 868 Tracking: Methods, Applications, and Case Studies. Springer, New York. 869
73. Farnleitner AH, Reischer GH, Stadler H, Kollanur D, Sommer R, Zerobin W, Blöschl G, 870 Barella KM, Truesdale JA, Casarez EA, di Giovanni GD. 2011. Agricultural and Rural 871 Watersheds, p 399-431. In Hagedorn C, Blanch AR, Harwood VJ (ed), Microbial Source 872 Tracking: Methods, Applications, and Case Studies. Springer, New York, Dordrecht, 873 Heidelberg, London. 874
74. Tallon LK, Si BC, Korber D, Guo X. 2007. Soil wetting state and preferential transport of 875 Escherichia coli in clay soils. Canadian Journal of Soil Science 87:61-72. 876
75. Haller L, Pote J, Loizeau J-L, Wildi W. 2009. Distribution and survival of faecal indicator 877 bacteria in the sediments of the Bay of Vidy, Lake Geneva, Switzerland. Ecological 878 Indicators 9:540-547. 879
76. Brinkmeyer R, Amon RMW, Schwarz JR, Saxton T, Roberts D, Harrison S, Ellis N, Fox 880 J, DiGuardi K, Hochman M, Duan S, Stein R, Elliott C. 2015. Distribution and 881 persistence of Escherichia coli and Enterococci in stream bed and bank sediments from 882 two urban streams in Houston, TX. Science of the Total Environment 502:650-658. 883
884 885
886
on Decem
ber 12, 2018 by guesthttp://aem
.asm.org/
Dow
nloaded from
31
TABLE 1 Occurrence (%) and abundance (log10 CFU g-1 feces) of the standard fecal 887
indicator bacteria Escherichia coli (a), intestinal enterococci (b) and Clostridium 888
perfringens (c) in diverse animal groups from an alluvial backwater (2010- 2013). 889
890
TABLE 2 Daily production of Escherichia coli , intestinal enterococci and Clostridium 891
perfringens at the study area. The relative distributions (including the median, 5th and 95th 892
percentiles) of shed fecal indicator bacteria were estimated by a Monte Carlo simulation 893
and are given as percentages. 894
895
FIGURE 1 a) Daily SFIB production (DESL) of animals in an alluvial backwater area 896
compared to the standing stock of Escherichia coli (EC), intestinal enterococci (ENT) and 897
Clostridium perfringens (CP) in sediment and soil of the investigation area. Values are 898
given in CFU for the whole study area. Box plots indicate the median, the 25% and 75%-899
percentile (box), minimum and maximum values (whiskers), outliers (dots) and extreme 900
values (stars). b) Relative distribution of animal sources for the mean DESL. 901
on Decem
ber 12, 2018 by guesthttp://aem
.asm.org/
Dow
nloaded from

32
Table 1
a) E. coli
occur- abundancea
Fecal source N rence mean median 5% 95% max
earthworm 26 0 n.d. n.d. n.d. n.d. n.d.
gastropod 26 77 4.2 4.2 3.0 5.5 6.8
Σ poikilothermic
invertebrates 52 38 4.2 4.2 3.0 5.5 6.8
frog 19 68 5.2 5.0 3.2 8.3 8.5
fish 27 85 4.6 4.6 3.0 6.8 8.1
Σ poikilothermic
vertebrates 46 78 4.8 4.7 3.0 8.1 8.5
bird 15 73 5.0 4.8 2.3 8.5 9.2
ruminant 43 93 5.0 4.6 2.7 7.4 9.1
wild boar 16 100 6.6 6.2 5.2 8.4 9.0
carnivore 17 100 7.0 7.0 4.6 9.4 9.5
Σ homeothermic
vertebrates 91 91 5.7 5.9 2.7 8.9 9.5
902
on Decem
ber 12, 2018 by guesthttp://aem
.asm.org/
Dow
nloaded from

33
b) enterococci
occur- abundancea percentiles
Fecal source N rence mean median 5% 95% max
earthworm 26 4 3.3b 3.3b - - 3.3b
gastropod 26 96 5.1 5.7 2.8 7.1 7.4
Σ poikilothermic
invertebrates 52 50 5.1 5.6 2.8 7.1 7.4
frog 19 68 4.7 4.4 3.5 6.6 6.6
fish 27 85 3.3 3.3 2.0 5.4 6.9
Σ poikilothermic
vertebrates 46 78 3.8 3.6 2.0 6.5 6.9
bird 15 93 6.1 6.4 2.8 9.0 9.2
ruminant 43 97 4.6 4.5 2.6 6.4 8.3
wild boar 16 100 5.0 4.9 3.6 6.7 7.3
carnivore 17 100 5.1 4.6 2.3 8.9 8.9
Σ homeothermic
vertebrates 91 97 5.0 4.6 2.4 8.8 9.2
903
on Decem
ber 12, 2018 by guesthttp://aem
.asm.org/
Dow
nloaded from
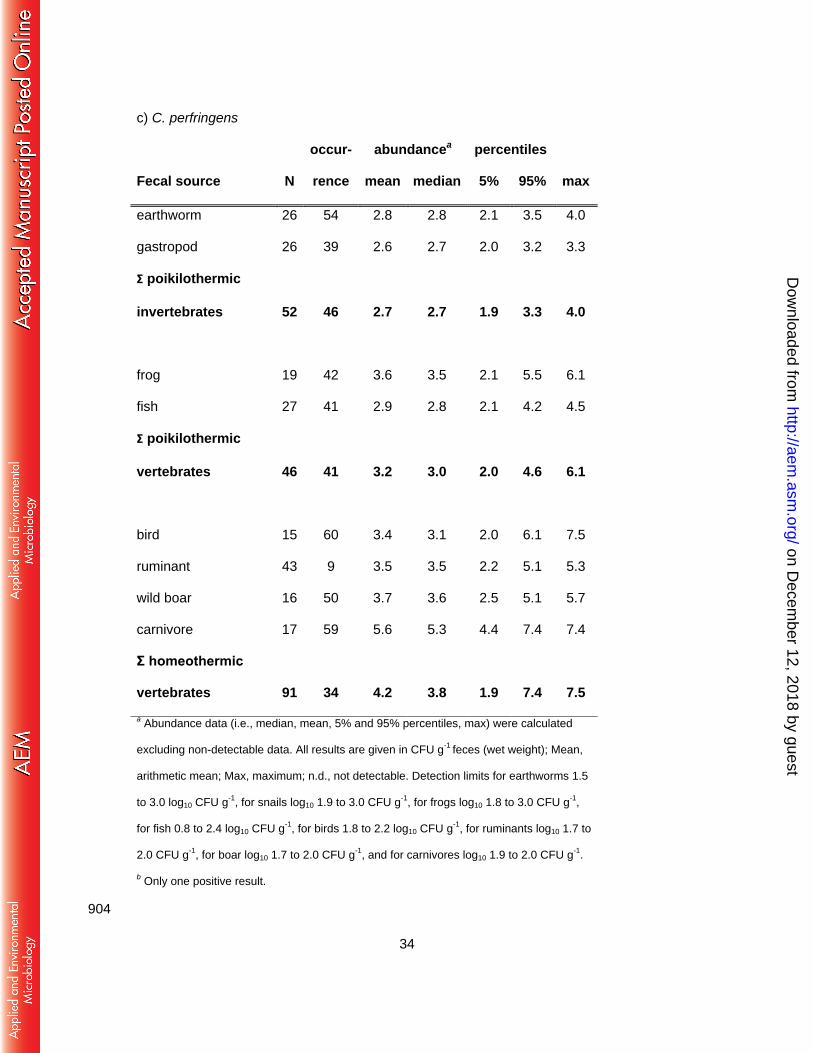
34
c) C. perfringens
occur- abundancea percentiles
Fecal source N rence mean median 5% 95% max
earthworm 26 54 2.8 2.8 2.1 3.5 4.0
gastropod 26 39 2.6 2.7 2.0 3.2 3.3
Σ poikilothermic
invertebrates 52 46 2.7 2.7 1.9 3.3 4.0
frog 19 42 3.6 3.5 2.1 5.5 6.1
fish 27 41 2.9 2.8 2.1 4.2 4.5
Σ poikilothermic
vertebrates 46 41 3.2 3.0 2.0 4.6 6.1
bird 15 60 3.4 3.1 2.0 6.1 7.5
ruminant 43 9 3.5 3.5 2.2 5.1 5.3
wild boar 16 50 3.7 3.6 2.5 5.1 5.7
carnivore 17 59 5.6 5.3 4.4 7.4 7.4
Σ homeothermic
vertebrates 91 34 4.2 3.8 1.9 7.4 7.5
a Abundance data (i.e., median, mean, 5% and 95% percentiles, max) were calculated
excluding non-detectable data. All results are given in CFU g-1
feces (wet weight); Mean,
arithmetic mean; Max, maximum; n.d., not detectable. Detection limits for earthworms 1.5
to 3.0 log10 CFU g-1
, for snails log10 1.9 to 3.0 CFU g-1
, for frogs log10 1.8 to 3.0 CFU g-1
,
for fish 0.8 to 2.4 log10 CFU g-1
, for birds 1.8 to 2.2 log10 CFU g-1
, for ruminants log10 1.7 to
2.0 CFU g-1
, for boar log10 1.7 to 2.0 CFU g-1
, and for carnivores log10 1.9 to 2.0 CFU g-1
.
b Only one positive result.
904
on Decem
ber 12, 2018 by guesthttp://aem
.asm.org/
Dow
nloaded from

35
Table 2 905
906
E. coli Enterococci C. perfringens
Median
Percentiles
Median
Percentiles
Median
Percentiles
Mean 5% 95% Mean 5% 95% Mean 5% 95%
Gastropod 0.8 2.4 < 0.1 5.8 13.6 22.2 0.2 81.5 0.1 0.7 < 0.1 2.6
Fish 4.5 9.8 0.1 41.6 0.4 2.4 < 0.1 5.6 0.4 2.1 < 0.1 9.9
Frog 0.8 1.3 < 0.1 4.8 0.0 0.2 < 0.1 1.2 0.8 2.6 < 0.1 13.9
Bird 15.6 24.3 0.5 88.7 60.2 57.4 3.4 99.3 85.0 70.7 10.4 99.5
Ruminant 21.9 25.7 1.1 62.0 7.0 11.3 0.2 36.5 0.8 2.4 < 0.1 8.0
Boar 20.7 28.6 0.8 86.5 0.8 4.2 < 0.1 19.2 1.6 6.1 < 0.1 40.3
Carnivore 2.3 7.6 0.1 43.5 0.8 2.6 < 0.1 13.1 4.0 14.8 0.1 76.5
Human 0.3 0.3 < 0.1 0.7 0.0 0.0 < 0.1 0.1 0.6 1.2 < 0.1 5.2
907
908
on Decem
ber 12, 2018 by guesthttp://aem
.asm.org/
Dow
nloaded from

36
Figure 1 909
on Decem
ber 12, 2018 by guesthttp://aem
.asm.org/
Dow
nloaded from