
Genes Proximal and Distal to MYCN Are Highly Expressed in Human Neuroblastoma as Visualized by...
12
Tumorigenesis and Neoplastic Progression Genes Proximal and Distal to MYCN Are Highly Expressed in Human Neuroblastoma as Visualized by Comparative Expressed Sequence Hybridization Cornelia Stock, Eva Bozsaky, Franz Watzinger, Ulrike Poetschger, Lukas Orel, Thomas Lion, Agata Kowalska, and Peter F. Ambros From CCRI, the Children’s Cancer Research Institute, St. Anna Kinderkrebsforschung, Vienna, Austria MYCN amplification is associated with poor prognosis in neuroblastoma disease. To improve our understand- ing of the influence of the MYCN amplicon and its cor- responding expression , we investigated the 2p expres- sion pattern of MYCN amplified (n 13) and nonamplified (n 4) cell lines and corresponding pri- mary tumors (n 3) using the comparative expressed sequence hybridization technique. All but one MYCN amplified cell line displayed overexpression at 2p. Ex- pression peaks were observed frequently at 2pter and less frequently at 2p24 (MYCN locus) , 2p23.3–23.2 , and/or 2p23.1. Importantly , cell lines and two corre- sponding primary tumors displayed expression peaks at similar loci. No significant 2p24 expression level was observed for those cell lines displaying a low amplifica- tion rate (n 3) by comparative genomic hybridization. Only the cell lines with an enhanced peak at 2p23.2– 23.3 displayed coamplification of the ALK gene (2p23.2) , reported to be associated with unfavorable prognosis. Finally , two of four cell lines without MYCN amplification , both derived from patients with poor outcome , also showed an expression peak at 2p23.2. These data indicate that , besides MYCN , other genes proximal and distal to MYCN are highly expressed in neuroblastoma. The prognostic significance of expres- sion peaks at 2p23.2–23.3 , independent of MYCN and ALK status , remains to be investigated. (Am J Pathol 2008, 172:203–214; DOI: 10.2353/ajpath.2008.061263) Neuroblastoma (NB) represents the most common ex- tracranial solid tumor in children. As amplification of the MYCN gene (germ line position 2p24.3) readily identifies high-risk patients, the status of the MYCN gene is used for therapy stratification. 1,2 Although MYCN status is used to guide therapy, the underlying biological mechanism resulting in aggressive cell behavior is still under discus- sion. One reason might rely on the composition and/or the organization of the amplicon, which can frequently be complex and not be restricted to the MYCN locus, but involve flanking and/or physically unrelated regions con- tributing to the aggressive phenotype of the disease. Finally, the correlation between MYCN copy number and MYCN expression has been rarely addressed. The amplified MYCN sequences can be present in the form of double minutes or homogeneously staining re- gions (hsr). The size of the MYCN amplicon can extend anywhere from 350 kb to 8 Mb in length, 3–5 demonstrat- ing the great variability of amplicon sizes and the number of coamplified genes in NB. A frequently coamplified gene is DDXI (mapping position 2p24), belonging to a family of genes that encode DEAD (Asp-Glu-Ala-Asp) box proteins, implicated in a number of cellular pro- cesses, eg, in posttranscriptional and translational gene regulation. Thus, high levels of DDXI expression resulting from genomic amplification may trigger distinct path- ways. A number of studies focused on the copy number and/or expression of this gene to determine its prognostic implication. However, controversial findings were found on this subject. 6 –10 Moreover, contradictory publications were reported for the prognostic value of ID2 (inhibitor of DNA-binding/differentiation) (germ line position 2p25.1) expression. 11–13 The function of NAG (neuroblastoma amplified gene), coamplified in 20 to 56%, 8,14 –16 is not known. Finally, coamplification of the ALK (anaplastic lymphoma kinase) gene is reported to occur rarely and is observed only in cases with poor outcome. 17 In the last 2 years, array comparative genomic hybrid- ization (CGH) 5,18,19 and expression profiling 20 –24 have in- creasingly been used to identify new genes involved in NB disease. However, published data are difficult to compare with each other for two main reasons. The var- ious platforms contain non-equally distributed genes. A Supported by St. Anna Kinderkrebsforschung. Accepted for publication September 27, 2007. Address reprint requests to Peter F. Ambros, Ph.D., Assoc. Prof., Chil- dren’s Cancer Research Institute, St. Anna Kinderkrebsforschung, Kinder- spitalgasse 6, A-1090 Vienna, Austria. E-mail: [email protected]. The American Journal of Pathology, Vol. 172, No. 1, January 2008 Copyright © American Society for Investigative Pathology DOI: 10.2353/ajpath.2008.061263 203
-
Upload
independent -
Category
Documents
-
view
1 -
download
0
Transcript of Genes Proximal and Distal to MYCN Are Highly Expressed in Human Neuroblastoma as Visualized by...

Tumorigenesis and Neoplastic Progression
Genes Proximal and Distal to MYCN Are HighlyExpressed in Human Neuroblastoma as Visualizedby Comparative Expressed Sequence Hybridization
Cornelia Stock, Eva Bozsaky, Franz Watzinger,Ulrike Poetschger, Lukas Orel, Thomas Lion,Agata Kowalska, and Peter F. AmbrosFrom CCRI, the Children’s Cancer Research Institute, St. Anna
Kinderkrebsforschung, Vienna, Austria
MYCN amplification is associated with poor prognosisin neuroblastoma disease. To improve our understand-ing of the influence of the MYCN amplicon and its cor-responding expression, we investigated the 2p expres-sion pattern of MYCN amplified (n � 13) andnonamplified (n � 4) cell lines and corresponding pri-mary tumors (n � 3) using the comparative expressedsequence hybridization technique. All but one MYCNamplified cell line displayed overexpression at 2p. Ex-pression peaks were observed frequently at 2pter andless frequently at 2p24 (MYCN locus), 2p23.3–23.2,and/or 2p23.1. Importantly, cell lines and two corre-sponding primary tumors displayed expression peaksat similar loci. No significant 2p24 expression level wasobserved for those cell lines displaying a low amplifica-tion rate (n � 3) by comparative genomic hybridization.Only the cell lines with an enhanced peak at 2p23.2–23.3 displayed coamplification of the ALK gene(2p23.2), reported to be associated with unfavorableprognosis. Finally, two of four cell lines without MYCNamplification, both derived from patients with pooroutcome, also showed an expression peak at 2p23.2.These data indicate that, besides MYCN, other genesproximal and distal to MYCN are highly expressed inneuroblastoma. The prognostic significance of expres-sion peaks at 2p23.2–23.3, independent of MYCN andALK status, remains to be investigated. (Am J Pathol2008, 172:203–214; DOI: 10.2353/ajpath.2008.061263)
Neuroblastoma (NB) represents the most common ex-tracranial solid tumor in children. As amplification of theMYCN gene (germ line position 2p24.3) readily identifieshigh-risk patients, the status of the MYCN gene is usedfor therapy stratification.1,2 Although MYCN status is usedto guide therapy, the underlying biological mechanism
resulting in aggressive cell behavior is still under discus-sion. One reason might rely on the composition and/orthe organization of the amplicon, which can frequently becomplex and not be restricted to the MYCN locus, butinvolve flanking and/or physically unrelated regions con-tributing to the aggressive phenotype of the disease.Finally, the correlation between MYCN copy number andMYCN expression has been rarely addressed.
The amplified MYCN sequences can be present in theform of double minutes or homogeneously staining re-gions (hsr). The size of the MYCN amplicon can extendanywhere from 350 kb to 8 Mb in length,3–5 demonstrat-ing the great variability of amplicon sizes and the numberof coamplified genes in NB. A frequently coamplifiedgene is DDXI (mapping position 2p24), belonging to afamily of genes that encode DEAD (Asp-Glu-Ala-Asp)box proteins, implicated in a number of cellular pro-cesses, eg, in posttranscriptional and translational generegulation. Thus, high levels of DDXI expression resultingfrom genomic amplification may trigger distinct path-ways. A number of studies focused on the copy numberand/or expression of this gene to determine its prognosticimplication. However, controversial findings were foundon this subject.6–10 Moreover, contradictory publicationswere reported for the prognostic value of ID2 (inhibitor ofDNA-binding/differentiation) (germ line position 2p25.1)expression.11–13 The function of NAG (neuroblastomaamplified gene), coamplified in 20 to 56%,8,14–16 is notknown. Finally, coamplification of the ALK (anaplasticlymphoma kinase) gene is reported to occur rarely and isobserved only in cases with poor outcome.17
In the last 2 years, array comparative genomic hybrid-ization (CGH)5,18,19 and expression profiling20–24have in-creasingly been used to identify new genes involved inNB disease. However, published data are difficult tocompare with each other for two main reasons. The var-ious platforms contain non-equally distributed genes. A
Supported by St. Anna Kinderkrebsforschung.
Accepted for publication September 27, 2007.
Address reprint requests to Peter F. Ambros, Ph.D., Assoc. Prof., Chil-dren’s Cancer Research Institute, St. Anna Kinderkrebsforschung, Kinder-spitalgasse 6, A-1090 Vienna, Austria. E-mail: [email protected].
The American Journal of Pathology, Vol. 172, No. 1, January 2008
Copyright © American Society for Investigative Pathology
DOI: 10.2353/ajpath.2008.061263
203

good demonstration has been given by Michels and col-leagues dissecting the 2p amplicon of the cell lineIMR-32 by the use of four different platforms consisting ofAffymetrix 10K SNP chip, bacterial artificial chromosomearray CGH, combined subtractive cDNA cloning, andAgilent Human Genome CGH MicroArray 44A oligonu-cleotide chips.18 The data generated illustrated that onlythe combination of various platforms identified all genesinvolved in the amplicon formation. Mosse and coau-thors, using bacterial artificial chromosome clones with�1 Mb resolution, even claimed that the dissection of theMYCN amplicon was not feasible due to the low clonedensity in the 2p region.25 Moreover, recently used oli-gonucleotide arrays (eg, Affymetrix U95Av2), with a res-olution at the kilobase level, have been shown to coveronly 36% of the genes mapping at 2p24–25.26 Finally,the application of different software programs used forthe complex microarray expression data analyses mayadditionally affect the output of the results.27 Anothertechnique to assess the expression of genes can beperformed by comparative expressed sequence hybrid-ization (CESH), a simple, fast, and inexpensive assay thatallows the identification of transcriptional activity at cyto-genetically defined locations.28 Analogous to the CGHassay, differentially labeled amplified cDNAs derivedfrom a test and a reference sample are cohybridized tonormal human metaphase spreads. As normal chromo-somes are used as targets to visualize the comparativelyhybridized cDNAs, it can be assumed that all genes arerepresented in a nonbiased form. Included are miRNAgene loci and repeat sequences, which are usually miss-
ing on microarrays. One restriction of the CGH technique islimited resolution. Deletions need to be at least 10 to 12 Mbto fall within the detection limits of CGHwhen fixed thresholdvalues of 0.8 are applied.29 However, the sensitivity of thetechnique is improved for detection of amplified regions.Although the current opinion states that the detection limit ofamplified regions is 2 Mb, Joos and coworkers showed thatCGH can detect an amplified region as small as 100 kb aslong as the copy number has increased by at least 20.30
Concordant results were found by simulation analysis.31
Moreover, the sensitivity of the CGH is related to the size ofthe amplicon, decreasing with decreasing size.32 Finally,the sensitivity of the CGH technique can be improved byapplying statistical thresholds.33 The amount of the datagenerated by CESH is much smaller than that generated bymicroarray analyses and the evaluation of the CESH datacan be performed in one day. Moreover, CESH requiresonly nanogram quantities of RNA, and the method wasalready successfully applied to small biopsy samples, asreported by Lu and coauthors.34 CESH has also been ap-plied successfully in different studies and shown to besuitable for tumor classification of rhabdomyosarcoma,leiomyosarcoma, prostate cancer, and Wilms’ tumors withfavorable histology.34 Furthermore, CESH analysis revealeddifferential gene expression in morphological breast cancersubtypes.35 Finally, the technique was used to predict theclinical behavior of patients with Wilms’ tumor.36 Therefore,we took advantage of this novel analytical tool to investigatethe chromosomal 2p expression profiles of NB-derived celllines and corresponding primary tumors to improve ourunderstanding of NB with (MNA) and without (non-MNA)
Table 1. Clinical, FISH, CGH, and CESH Data of 17 Human Neuroblastoma Cell Lines and Corresponding Primary Tumors
Samples Sex Age* StageClinicalstatus
FISH CGH
MYCNamplified
ALKamplified
Losses��3�
Over-representedregions ��3�
MNASTA-NB-1.1 F 3,5 y 3 DOD � �† 2p21-pterPT STA-NB-3 F 13 m 2 DOD � n.d. 2p14-pter,2q34–37STA-NB-3 � � 2p13–16.1,2p16.3-
pter, 2q36–37PT STA-NB-4 M 6 m 4 NED � n.d. 2p21-pter, 2q33–34STA-NB-4 � � 2p22-pterSTA-NB-5 M 6 m 4s/4 DOD � � 2p21-pterPT STA-NB-7 M 18 m 3 NED � n.d. 2p22-pterSTA-NB-7 � n.d. 2p23-pterSTA-NB-8 F 28 m 4 DOD � � 2p22-pterSTA-NB-9 F 3 m 4 NED � � 2p22-pterSTA-NB-10 M 18 m 3 DOD � � 2p16-pterPT STA-NB-11 M 36 m 4 NED � n.d. 2p22-pter, 2q22STA-NB-11 � � 2p21-pterSTA-NB-13 M 6 m 4s/4 NED � � 2p12-2q14 2p14-pter,2q24–34,
2q36PT STA-NB-15 M 11 m 4 DOD � � 2p21–24STA-NB-15 � � 2p16-pter,2q11–14LAN-1 M ? 4 � � 2p13-pter,2q24-q37Vi-856 F ? 4 DOD � � 2p12-pter,2q12-q37
Non-MNASTA-NB-2 M 18 m 4 NED � � noSTA-NB-6 M 4 m 3 NED � � noSTA-NB-12 M 8,5 y 4 DOD � � noSK-N-SH F 4 y 4 DOD �† �† 2p16-pter
(table continues)
204 Stock et alAJP January 2008, Vol. 172, No. 1

MYCN amplification and the resulting changes in affectedcells. Furthermore, we correlated the 2p chromosomal ex-pression with the corresponding genetic status of the celllines, verified by CGH.
Materials and Methods
Cell Lines and Patient Samples
In total, we investigated 17 well characterized NB cell linesthat were derived from 17 patients. We included also fiveprimary NB tumors samples from which the cell lines STA-NB-3, -4, -7, -11, and -15 were generated. Clinical param-eters and fluorescence in situ hybridization (FISH) data arepresented in Table 1. The MYCN and/or 1p status of the celllines STA-NB-3, -7, -8, -9, -10, -11, -12, -13, -15, and Vi-856had been described previously.37,38 Moreover, the relativeexpression level and status of MYCN, NAG, DDX1, TEM8,and MEIS1 for three STA-NB cell lines were reported.15
Finally, we tested cell lines other than NB, including Ewing’stumor (STA-ET-6), Wilms’ tumor (STA-WT-3), osteosarcoma(STA-OS-2), and breast carcinoma (ZR-75.1) cell lines. Theclinical and cytogenetic data of these cell lines have beenreported previously.39–41 STA-NB, STA-ET, STA-WT, andSTA-OS cell lines were established in the laboratory of Dr.Ambros. The NB cell lines Vi-856 and LAN-1 and the breastcarcinoma cell line ZR-75.1 were kindly provided by Dr. O.Majdic (Institute of Immunology, Vienna, Austria), by Dr. R.Seeger (Children’s Hospital, Los Angeles, CA) and by Dr. J.Moscow (National Cancer Institute, Bethesda, MD), respec-
tively. SK-N-SH was obtained from the American Type Cul-ture Collection. All cell lines were grown in RPMI 1640medium supplemented with 10% fetal bovine serum andpenicillin/streptomycin to 70 to 80% confluence for RNA,DNA, and protein extractions. As it is very difficult to obtainsufficient RNA from NB precursor cells, we used total RNAfrom pooled leukocytes from healthy donors as a referencesample.
FISH
The status of MYCN, ALK, 2pter, and/or D2Z in the variouscell lines and one primary tumor sample was investigatedby double-color FISH on interphase nuclei and/or meta-phase spreads. The bacterial artificial chromosome clonesRP11–355H10, RP11–1299G23, 08–103-1, and RP11–328L16 were purchased from Dr. M. Rocchi (Resources forMolecular Cytogenetics, University of Bari, Italy), and D2Zwas obtained from Qbiogene (Heidelberg, Germany). De-tection of digoxigenin- or biotin-labeled hybridized probeswas visualized with two antibody steps as already de-scribed using mouse anti-biotin and sheep anti-dig fluores-cein isothiocyanate-conjugated primary antibodies andrabbit anti-sheep fluorescein isothiocyanate and rabbit anti-mouse tetramethylrhodamine B isothiocyanate-conjugatedsecondary antibodies (DAKO, Denmark).42 Moreover, weperformed FISH with the indicated probes on normal meta-phase spreads to designate their chromosomal loci onchromosomes with 400 to 500 banding resolutions.
Table 1. Continued
CGH CESH
CGH peakOverexpressedregions��3�
CESHpeak��3�
Underexpressed regions(CESH ratio ��3�)
2p24.3–24.2 2pter 2pter 2p22–2q14.1,2q23–242p25.1 n.d. n.d. n.d.2p25.2–25.1 2p23-pter 2pter 2p13–16,2q12–14.1,2q22–24,2q31–33
2p24.1 2p23-pter 2p24.3 2p13–16,2q21–23,2q32–332p24.3–24.2 2p23-pter 2p24.3 2q12–14.1,2q32–332p24.2–2p24.1 2p22-pter2p24 n.d. n.d. n.d.2p24.3–24.2 2p22-pter 2pter, 2p23.1 2p13–15,2q13–14,2q22–24,2q32–332p24.3–24.2 2pter 2pter 2q12–132p24.3–24.2 2p13,2q14–24,2q32–332p25.2–25.1 2p23-pter 2pter-2p24 2q11.2–14.22p24.3–25.1 2p23–25 2p25.12p25.1 2p22-pter 2p24 2p11.2,2p13–21,2q11.2–372p24.3–24.2 2p24-pter 2pter 2p13–2q14,2q36
2p22.3 2p22.3–23 2p23.2 2p13–14, 2q22–24,2q31–33,2q35–362p23 2p22-pter 2p23.2 2q22–24,2q32.3–332p24.3–24.2 2p23–25.2 2p24.3 none2p24.3-24.2 2p16-pter 2q22–24
no no no 2q11.2,2q13–14,2q21.3–34no no no 2p12–16,2q22–24,2q32no 2pter, 2p23 2pter, 2p23.2 2p14–15,2q12–13,2q36–37
2p23 2p23.2 2q32–33
F, female; M, male; DOD, disease-associated death; NED, no evidence of disease; PT, primary tumor.*Age in months (m) or years (y).†Gain.
2p Expression Profiles of Neuroblastomas 205AJP January 2008, Vol. 172, No. 1
CGH
To determine the genomic status of chromosome 2, weperformed CGH experiments as described previously.43
DNA extraction was performed according standard pro-tocols. Digoxigenin- (tumor DNA) and biotin-labeled (ref-erence DNA) hybridized DNA were detected as de-scribed for FISH.
CGH profiles were calculated through the ISIS soft-ware developed for DNA copy number evaluation (Meta-Systems Hard & Software Gmbh, Altlussheim, Germany).Amplifications or gains were scored if the average greento red ratio value was above a �3� threshold level. Chro-mosomal regions showing ratio values below �3� wereinterpreted as losses. To determine the level of DNAamplification in NB cell lines, we imported the normalizedCGH data into the Excel spreadsheet (see Figure 2A).
RNA Extraction
Total RNA was isolated by phenol-chloroform extraction(Trizol, Invitrogen, Life Technologies, CA) or by using theRNeasy Mini Kit (Qiagen, GmbH, Hilden, Germany).DNase treatment was performed using either RNase-freeDNase I (Ambion, Austin, TX) after Trizol RNA extractionor RNase-free DNase Set (Qiagen GmbH) during RNAisolation step. RNA quality and integrity was controlled byagarose gel electrophoresis (1%).
CESH
The CESH technique was performed mainly as de-scribed.28 2.5 to 5 �g of total RNA was reverse-tran-scribed by the use of anchored oligo(dT) primer (Amer-sham Pharmacia Biotech, UK) and M-MLV reversetranscriptase (Invitrogen Life Technologies). cDNA wasamplified by DOP-PCR (Roche, Mannheim, Germany)according to the manufacturers recommendations. Theamplified cDNA products of test samples were labeledwith Spectrum Green-dUTP (Vysis, Invitrogen) or dig-11-dUTP (Roche Diagnostics, Mannheim, Germany), andreference cDNA with Alexa Fluor 568–5-dUTP (MolecularProbes, Invitrogen) or bio-16-dUTP (Roche Diagnostics).The nick translation procedure was optimized to obtainfragments 200 to 600 bp long. Differentially labeled testand control probes were cohybridized in the presence ofCot-1 DNA (Roche Diagnostics) to normal metaphasespreads for 24 to 48 hours. Detection of hybridized dig-or bio-dUTP cDNAs was visualized as for FISH. Counter-staining was performed by applying mounting mediumVectashield with 4,6-diamidino-2-phenylindole (VectorLaboratories, Burlingame, CA).
Digitized images were acquired with a fluorescencemicroscope (Axioplan 2, Zeiss, Germany) equipped withan Imac CCD S30 camera. For each metaphase all threefluorochrome images were taken by using the appropri-ate fluorescence filter sets. Image processing was per-formed using ISIS CGH software with slight modifications(MetaSystems Hard & Software Gmbh, Altlussheim, Ger-many). Chromosomes were identified by using the band-
ing pattern of 4,6-diamidino-2-phenylindole-stained chro-mosomes. Spectrum Green or fluorescein isothiocyanateand Alexa Fluor or tetramethylrhodamine B isothiocya-nate (tumor and normal cDNA, respectively) fluores-cence intensities were measured for each defined locus.For each sample, the mean fluorescence ratios wereobtained from at least eight metaphases. Mean fluores-cence ratios exceeding �3� were indicative of overex-pression and below �3� of low or absent expression ofthe respective chromosomal region of the test sample.Self-self hybridization assay pairing differentially labeledcDNA from a single donor did not show differential ex-pression using these limits (data not shown). To comparethe data of different CESH experiments, average profileswere calculated through the ISIS software using internsymmetric ratio values, according to the formula: RN �R � 1 for R � 1 and RN � 1 � 1/R for r � 1 (R � directratio values, RN � normalized ratio values). The obtainedvalues were termed transformed ratio values.
CESH Data Presentation
The software distinguished 163 chromosomal regions forwhole chromosome 2, 64 chromosomal regions for theshort, and 99 regions for the long arm. For each definedlocus, a mean normalized value (ratio between NB cDNAversus leukocyte cDNA) was obtained. In a first step wepresented the over- and underexpressed 2p regions onan ideogram similarly to the widely used CGH ideogramsshowing gained/amplified and lost chromosomal regions,using �3� as threshold limits (see Figure 1). In a secondstep, we imported the transformed ratio values into thespreadsheet to visualize the differential expression levelsobtained from the various samples (see Figures 2 and 5).
Real-Time Quantitative PCR (RQ-PCR)
To validate CESH data, we quantified MYCN and ALK ex-pression levels of NB cell lines by RQ-PCR. Singleplex PCRreactions were prepared in a total volume of 25 �l contain-ing 6 �l of cDNA with 100 ng of deoxynucleotide triphos-phate. Additionally, 12.5 �l of TaqMan Universal Master Mix(2X concentration, including ROX-reference dye; AppliedBiosystems, Foster City, CA), primers and hydrolysis probe(as indicated in Table 2) were added to the PCR reactions.Amplification was performed for a total of 50 cycles usingthe ABI Prism 7700 Sequence Detector System (AppliedBiosystems). After an initial denaturation step at 95°C for 10minutes, each cycle consisted of denaturation at 95°C for15 seconds and annealing and primer extension at 60°C for60 seconds. Each sample was analyzed in duplicate, andappropriate negative controls were included in each assay.Strict precautions were undertaken to prevent contamina-tion of PCR reactions with exogenous products. Moreover, adigestion step with uracil-DNA-glycosylase was performedto eliminate any potential contaminating PCR product. Toassess differences in the extent of RNA degradation andvariations in the efficiency of RNA extraction and reversetranscription, an endogenous sequence (�2 microglobulin)was quantified in parallel by real-time PCR.
206 Stock et alAJP January 2008, Vol. 172, No. 1

Western Blot Analyses
MYCN protein expression from whole-cell extracts wasassessed by Western blot analysis according to the man-ufacture’s instructions (LI-COR, Biosciences). Visualiza-tion and quantification of the protein extracts were doneusing the Odyssey infrared imaging system. The primaryantibodies used were mouse monoclonal anti-N-MYC(NCM II 100, ab16898, Abcam) and anti-glyceraldehyde-3-phosphate dehydrogenase (Santa Cruz). Secondaryantibodies were purchased from the company.
Statistical Analysis
The Spearman correlation test was used to assess thecorrelation between RQ-PCR and CESH data. Linear re-gression analysis was used to analyze the correlationbetween the normalized CESH and CGH ratios, and un-adjusted P values were calculated for each region. Be-cause of the high number of multiple comparisons (a totalof 1196 regions) a high number of false significant resultswere expected. The multivariate permutation method wasused to control the type I error rate at 5%. The referencedistribution of the smallest P value was obtained by ran-domization of the sample labels in the DNA copy numberdata set and was used to calculate P values that wereadjusted for multiple comparisons.
Results
CGH Results of NB Cell Lines andCorresponding Primary Tumors
The CGH results from 17 NB cell lines focusing on chro-mosome 2 are summarized in Table 1 and Figures 1 and2, A and B. All MYCN-amplified (MNA) cell lines (n � 13)displayed fluorescence levels above �3� at 2p23–25(Figure 1A, left). Gain of 2q material was found in four celllines, and loss of 2p12–2q12 sequences was observedonly in one cell line (STA-NB-13). Gain of 2p material wasfound in one of four non-MYCN-amplified (non-MNA) NBcell lines (SK-N-SH) (Figure 1B, left).
A detailed presentation of the positions and the heights ofthe CGH peaks obtained in the 13 MNA NB cell lines are
given in Figure 2A. A simple amplification pattern restrictedto 2p24 can be noted for eight of 13 NB cell lines. Threeother cell lines exhibited a simple amplification pattern at2p25.1, and two cell lines (STA-NB-15 and Vi-856) showeda more complex amplification pattern encompassing re-gions proximal to the MYCN locus (Figure 2A).
To confirm that the 2p CGH profiles of the cell linesreflect the genomic status of the primary tumors and arenot derived from an atypical subclone arising during cellculture condition, we further investigated the 2p CGHpattern of five corresponding primary tumors. All fivetumors displayed CGH peaks similar to those obtained inthe corresponding cell lines, as illustrated in Figure 2B.CGH peaks centered near or at the MYCN locus wereobserved in only two tumors. Both corresponding celllines STA-NB-4 and STA-NB-7 exhibited, similar to theprimary tumors, a CGH peak at 2p24 (a slight shift can benoted for the corresponding primary tumor of the cell lineSTA-NB-4). CGH peaks distal to MYCN were observed
Table 2. Primer and Probe Combinations for RQ-PCR Detection of the Targeted Genes
TargetAmpliconlength Oligonucleotide sequences
Concentration(nmol/L)
Nucleotideposition
GenBankAcc. No.
MYCN 144 bp F: 5-ACCACAAGGCCCTCAGTACCT-3 (exon2) 900 2368–2388 M13241(RNA)1 P: 5-ACTGTGGAGAAGCGGCGTTCCTCCT-3 (exon3) 200 5095–5119
R: 5-GTGGTGACAGCCTTGGTGTTG-3 (exon3) 900 5121–5140ALK 164 bp F: 5-ATGACCGACTACAACCCCAACTAC-3 900 4176–4199 U62540(RNA) P: 5-TGGCAAGACCTCCTCCATCAGTG-3 200 4208–4230
R: 5-CTTGGGTCGTTGGGGATTC-3 900 4321–4339B2MG 82 bp F: 5-TGAGTATGCCTGCCGTGTGA-3 (exon2) 300 343–362 M17987(RNA)2 P: 5-CCATGTGACTTTGTCACAGCCCAAGATAGTT-3 (exon2) 200 364–394
R: 5-TGATGCTGCTTACATGTCTCGAT-3 (exon3) 300 1018–1040
F, forward primer; R, reverse primer; P, probe*MYCN RNA primers span two exons and an intermediate intron of 2628 bp in length.†B2MG RNA primers span two exons and an intermediate intron of 616 bp in length.
BA C
CGH CESHCGH CESH
NonMNAcell lines
(n=4)NB cell lines with
MNA (n=13)non NB cell lines
(n=4)
CESH
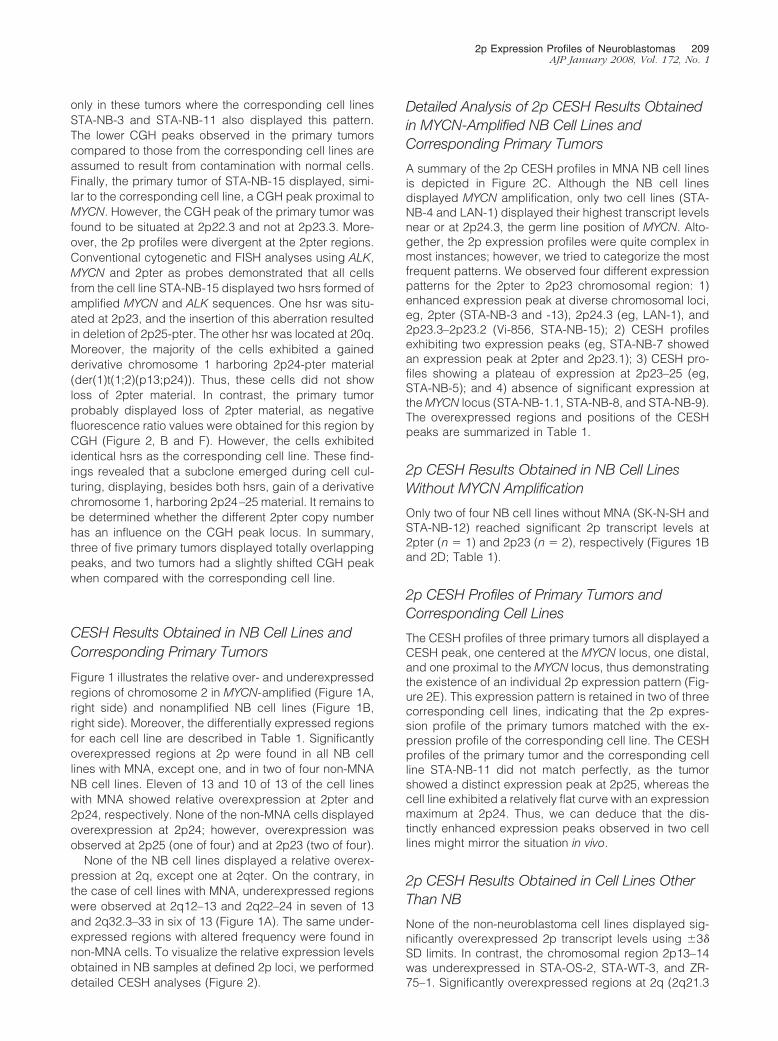
Figure 1. A and B: Summary of CGH and CESH results on 2p. A: CGH resultsof 13 NB cell lines with MYCN amplification (left) and the corresponding 2pexpression profiles (right). B: Four NB cell lines without MYCN amplification(left) and corresponding 2p expression profiles (right). C: Summary of CESHresults in four non-NB cell lines: Ewing’s tumor, Wilms’ tumor, osteosarcoma,and breast carcinoma cell lines. Bars on the right side of the ideogram representsignificant gained or overexpressed regions (normalized ratio values �3�). Barson the left side of the ideogram represent significant under-represented orunderexpressed chromosomal regions (normalized ratio values ��3�).
2p Expression Profiles of Neuroblastomas 207AJP January 2008, Vol. 172, No. 1
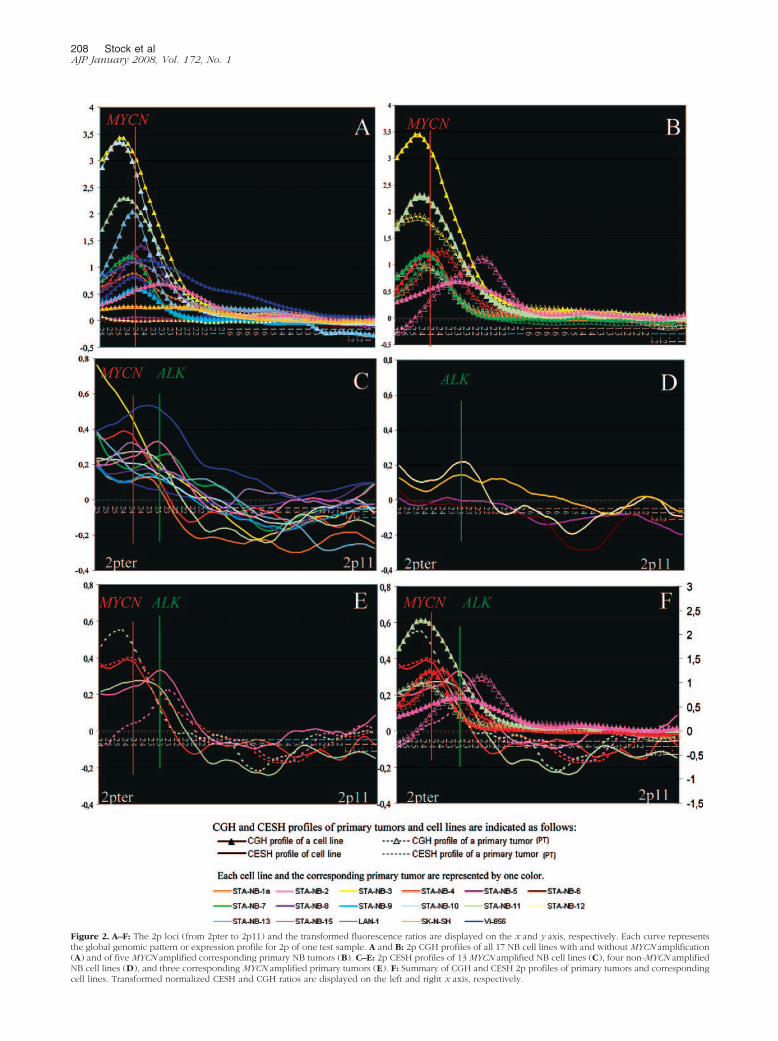
Figure 2. A–F: The 2p loci (from 2pter to 2p11) and the transformed fluorescence ratios are displayed on the x and y axis, respectively. Each curve representsthe global genomic pattern or expression profile for 2p of one test sample. A and B: 2p CGH profiles of all 17 NB cell lines with and without MYCN amplification(A) and of five MYCN amplified corresponding primary NB tumors (B). C–E: 2p CESH profiles of 13 MYCN amplified NB cell lines (C), four non-MYCN amplifiedNB cell lines (D), and three corresponding MYCN amplified primary tumors (E). F: Summary of CGH and CESH 2p profiles of primary tumors and correspondingcell lines. Transformed normalized CESH and CGH ratios are displayed on the left and right x axis, respectively.
208 Stock et alAJP January 2008, Vol. 172, No. 1
only in these tumors where the corresponding cell linesSTA-NB-3 and STA-NB-11 also displayed this pattern.The lower CGH peaks observed in the primary tumorscompared to those from the corresponding cell lines areassumed to result from contamination with normal cells.Finally, the primary tumor of STA-NB-15 displayed, simi-lar to the corresponding cell line, a CGH peak proximal toMYCN. However, the CGH peak of the primary tumor wasfound to be situated at 2p22.3 and not at 2p23.3. More-over, the 2p profiles were divergent at the 2pter regions.Conventional cytogenetic and FISH analyses using ALK,MYCN and 2pter as probes demonstrated that all cellsfrom the cell line STA-NB-15 displayed two hsrs formed ofamplified MYCN and ALK sequences. One hsr was situ-ated at 2p23, and the insertion of this aberration resultedin deletion of 2p25-pter. The other hsr was located at 20q.Moreover, the majority of the cells exhibited a gainedderivative chromosome 1 harboring 2p24-pter material(der(1)t(1;2)(p13;p24)). Thus, these cells did not showloss of 2pter material. In contrast, the primary tumorprobably displayed loss of 2pter material, as negativefluorescence ratio values were obtained for this region byCGH (Figure 2, B and F). However, the cells exhibitedidentical hsrs as the corresponding cell line. These find-ings revealed that a subclone emerged during cell cul-turing, displaying, besides both hsrs, gain of a derivativechromosome 1, harboring 2p24–25 material. It remains tobe determined whether the different 2pter copy numberhas an influence on the CGH peak locus. In summary,three of five primary tumors displayed totally overlappingpeaks, and two tumors had a slightly shifted CGH peakwhen compared with the corresponding cell line.
CESH Results Obtained in NB Cell Lines andCorresponding Primary Tumors
Figure 1 illustrates the relative over- and underexpressedregions of chromosome 2 in MYCN-amplified (Figure 1A,right side) and nonamplified NB cell lines (Figure 1B,right side). Moreover, the differentially expressed regionsfor each cell line are described in Table 1. Significantlyoverexpressed regions at 2p were found in all NB celllines with MNA, except one, and in two of four non-MNANB cell lines. Eleven of 13 and 10 of 13 of the cell lineswith MNA showed relative overexpression at 2pter and2p24, respectively. None of the non-MNA cells displayedoverexpression at 2p24; however, overexpression wasobserved at 2p25 (one of four) and at 2p23 (two of four).
None of the NB cell lines displayed a relative overex-pression at 2q, except one at 2qter. On the contrary, inthe case of cell lines with MNA, underexpressed regionswere observed at 2q12–13 and 2q22–24 in seven of 13and 2q32.3–33 in six of 13 (Figure 1A). The same under-expressed regions with altered frequency were found innon-MNA cells. To visualize the relative expression levelsobtained in NB samples at defined 2p loci, we performeddetailed CESH analyses (Figure 2).
Detailed Analysis of 2p CESH Results Obtainedin MYCN-Amplified NB Cell Lines andCorresponding Primary Tumors
A summary of the 2p CESH profiles in MNA NB cell linesis depicted in Figure 2C. Although the NB cell linesdisplayed MYCN amplification, only two cell lines (STA-NB-4 and LAN-1) displayed their highest transcript levelsnear or at 2p24.3, the germ line position of MYCN. Alto-gether, the 2p expression profiles were quite complex inmost instances; however, we tried to categorize the mostfrequent patterns. We observed four different expressionpatterns for the 2pter to 2p23 chromosomal region: 1)enhanced expression peak at diverse chromosomal loci,eg, 2pter (STA-NB-3 and -13), 2p24.3 (eg, LAN-1), and2p23.3–2p23.2 (Vi-856, STA-NB-15); 2) CESH profilesexhibiting two expression peaks (eg, STA-NB-7 showedan expression peak at 2pter and 2p23.1); 3) CESH pro-files showing a plateau of expression at 2p23–25 (eg,STA-NB-5); and 4) absence of significant expression atthe MYCN locus (STA-NB-1.1, STA-NB-8, and STA-NB-9).The overexpressed regions and positions of the CESHpeaks are summarized in Table 1.
2p CESH Results Obtained in NB Cell LinesWithout MYCN Amplification
Only two of four NB cell lines without MNA (SK-N-SH andSTA-NB-12) reached significant 2p transcript levels at2pter (n � 1) and 2p23 (n � 2), respectively (Figures 1Band 2D; Table 1).
2p CESH Profiles of Primary Tumors andCorresponding Cell Lines
The CESH profiles of three primary tumors all displayed aCESH peak, one centered at the MYCN locus, one distal,and one proximal to the MYCN locus, thus demonstratingthe existence of an individual 2p expression pattern (Fig-ure 2E). This expression pattern is retained in two of threecorresponding cell lines, indicating that the 2p expres-sion profile of the primary tumors matched with the ex-pression profile of the corresponding cell line. The CESHprofiles of the primary tumor and the corresponding cellline STA-NB-11 did not match perfectly, as the tumorshowed a distinct expression peak at 2p25, whereas thecell line exhibited a relatively flat curve with an expressionmaximum at 2p24. Thus, we can deduce that the dis-tinctly enhanced expression peaks observed in two celllines might mirror the situation in vivo.
2p CESH Results Obtained in Cell Lines OtherThan NB
None of the non-neuroblastoma cell lines displayed sig-nificantly overexpressed 2p transcript levels using �3�SD limits. In contrast, the chromosomal region 2p13–14was underexpressed in STA-OS-2, STA-WT-3, and ZR-75–1. Significantly overexpressed regions at 2q (2q21.3
2p Expression Profiles of Neuroblastomas 209AJP January 2008, Vol. 172, No. 1

and 2q35–36) were noted only in STA-ET-6. Moreover,STA-ET-6, STA-WT-3, and ZR-75–1 displayed underex-pression at the chromosomal region 2q13 (Figure 1C).
FISH
Gene amplifications often result in an increased expressionlevel of the corresponding amplified gene. Therefore, wechecked the genomic status of the ALK gene (germ lineposition 2p23.2) in all NB cell lines. FISH results are pre-sented in Table 1. Interestingly, only the two cell lines withhighest transcript levels at 2p23.2–23.3, STA-NB-15 andVi-856, showed coamplification of the ALK gene. Two othercell lines, STA-NB-1 and SK-N-SH, had gain of the ALKgene (three ALK copies in a diploid cell with only two longarms of chromosome 2). The remaining 13 NB cell linesdisplayed normal ALK copy numbers in relation to the ploidylevel and chromosome 2q copy number, as we found two,three, and four ALK copies in di-, tri-, and tetraploid cells,respectively. Moreover, we tested whether the correspond-ing primary tumor of the cell line STA-NB-15 displayed ALKamplification. FISH confirmed the presence of ALK-ampli-fied sequences.We assume that all other primary tumors donot harbor ALK amplification, as their CGH profiles did notdisplay a peak at the ALK locus. To independently confirmthe results obtained with CESH, we used three differentapproaches.
Validation of CESH Data by Real-TimeQuantitative PCR
The first approach to validate our results was to quantify theMYCN and ALK expression levels by the use of RQ-PCR.Figure 3 illustrates the correlation between RQ-PCR expres-
sion levels of MYCN and ALK and the CESH fluorescenceratios at 2p24.3 and 2p23.2. All four NB cell lines lackingMYCN amplification displayed low MYCN expression levelsby RQ-PCR and lowCESH ratios at 2p24 in CESH. (It shouldbe noted that smaller RQ-PCR values indicate relativelyhigh expression levels.) STA-NB-12 reached a higher ex-pression level (0.113) than all other non-MNA cell lines,presumably because of the CESH peak at 2p23 (Figure2D). More or less uniform RQ-PCR values were observedwithin the MNA group. In CESH, the majority of the MNAsamples exhibited similar values as well. Only three celllines (STA-NB-3, -4 and Vi-856) displayed high CESH val-ues, and in one case (Vi-856) the enhanced values resultedprobably from the expression peak situated proximal to theMYCN locus. Thus, it is absolutely necessary to look at thecurve of the expression profile, to interpret a value at adefined locus. Finally, three cell lines did not reach signifi-cant expression levels in CESH, although RQ-PCR revealedhigh to medium MYCN transcript levels. Whereas the high-est relative ALK expression levels were observed in celllines displaying ALK amplification, the differential expres-sion level was marginal for one cell line in comparison tonon-ALK-amplified cell lines.
In summary, RQ-PCR confirmed the CESH data, as forMYCN and ALK the relative expression levels reachedgood correlation coefficients for both methods (P �0.0371 and P � 0.0243, respectively). An even highercorrelation coefficient was observed including CESH andRQ-PCR data for non-NB cell lines (P � 0.0025 and P �0.0054, respectively).
Western Blot Analysis
We investigated the MYCN protein expression levels in anumber of cell lines (Figure 4). As expected, all three non-MNA cell lines expressed very low MYCN protein levels.Moreover, lower protein expression levels in comparison toother MNA cell lines were observed in those cell lines dis-
MYCN0
10
20
30
40
50-0,2 -0,1 0 0,1 0,2 0,3 0,4 0,5 0,6
ALK0
10 20 30 40 50
-0,2 -0,1 0 0,1 0,2 0,3 0,4 0,5 0,6
r=-0,6375p= 0,0025
r=-0,5845 p= 0,0054
Figure 3. Correlation between RQ-PCR with CESH data. x axis, transformedfluorescence ratios (CESH data); y axis, normalized Ct values (RQ-PCR data).�, MNA NB cell lines; �, non-MNA NB cell lines; Œ, coamplified ALK NBcell lines; f, non-NB cell lines.
1.1-B
N-A
TS
2-B
N-A
TS
3-B
N-A
TS
4-B
N-A
TS
8-B
N-A
TS
9-B
N-A
TS
01-B
N-A
TS
11-B
N-A
TS
21-B
N-A
TS
31-B
N-A
TS
51-B
N-A
TS
HS-N-
KS
658-iV
1-N
AL
MYCN
GAPDH
0
20
40
60
80
100
1 2 3 4 5 6 7 8 9 10 11 12 13 14
noisserpxe dlof
Figure 4. Immunoblot of expression of MYCN and glyceraldehyde-3-phos-phate dehydrogenase in the NB cell lines and protein quantification. Allvalues normalized to glyceraldehyde-3-phosphate dehydrogenase are pre-sented as fold expression in relation to SK-N-SH (arrow).
210 Stock et alAJP January 2008, Vol. 172, No. 1

playing no significant expression levels at 2p24 in CESH.Interestingly, STA-NB-3 and STA-NB-4 displayed the high-est levels, in accordance with the CESH data. Only one cellline showed low protein expression, although displayingMYCN transcript levels in RQ-PCR and CESH.
Validation of CESH Data by Using NB Cell Linesas Reference
The NB cell lines displayed differential expression levelsat 2p23-pter using cDNA from leukocytes as a reference.Focusing on the 2pter region, for instance, we observedthree distinct expression levels (Figure 2C). To prove thatthese differential expression levels can be reproduced,we performed further CESH assays using NB cell lines asreference instead of leukocytes. This is important be-cause terminal chromosomal regions are not included inCGH analyses. Chromosome 2p expression profiles ofthese experiments are presented in Table 3 and Figure 5.The 2p CESH profiles using the NB cell line STA-NB-13as reference showed 1) the appearance of significantunderexpressed regions at 2p23-pter and 2p13–21 in thenon-MNA cell line STA-NB-12 (used as test sample) (Fig-ure 5A, black arrows) as well as underexpressed regionsat 2p23.3-pter in STA-NB-15 (used as test sample) (Fig-ure 5B, black arrow) and 2) the appearance of significantoverexpressed regions. STA-NB-12 and STA-NB-15 celllines did not show significant transcript levels at 2p11and 2p12, respectively, when paired with cDNA fromleukocytes. However, when cDNA from STA-NB-13 wasused as a reference (the cell line displayed loss or under-representation of 2p12–2q12 chromosomal material, Ta-ble 1), both cell lines reached significant transcript levelsat these regions (black arrowheads, Figure 5, A and B).The disappearance of significant overexpressed regionswas also observed. Pairing NB cell lines exhibiting similar2pter expression levels (STA-NB-1.1, -7, -9, and -10)resulted in loss of differential expression of this region(Figure 5, C and D, white arrow), indicating that the 2pterexpression levels observed in CESH experiments usingcDNA from leukocytes are indeed specific. Remarkably,STA-NB-10 (used as test sample) still showed significanttranscript levels at 2p22-p25.1 when paired with STA-NB-9 (used as reference sample).
In fact, the hybridization pattern obtained in the cellline STA-NB-12 paired with leukocytes looks, at firstglance, quite divergent from the expression profile whenpaired with the cell line STA-NB-13 (Figure 5A). As al-ready mentioned, STA-NB-12 displays higher CESHvalues at 2p24, most likely due to the enhanced tran-
scription activity at 2p23. Moreover, comparing the hy-bridization pattern of the three experiments, we observedthat the labeling was not optimal in the assay pairingSTA-NB-13 with leukocytes. The RQ-PCR and Westernblot data support the interpretation that STA-NB-13should display a higher value. Finally, the use of twoantibody steps in the CESH experiment of pairing the celllines dramatically increased their differential expressionlevels at 2p24. In summary, the results of these experi-ments, pairing various NB cell lines, confirmed the tran-script levels at 2p obtained from CESH assays usingleukocyte cDNA as a reference (Figure 2, C and D),indicating that the 2pter expression levels have to beincluded in CESH analyses.
Correlation of CGH with CESH Data
We compared the CGH and CESH peaks to identifywhether they overlapped. We indicated the loci in boldwhere the CGH and CESH peaks matched (Table 1).Only four of 17 NB cell lines and one primary tumordisplayed a CGH and CESH peak at the same locus.Figure 2F illustrates the CGH and CESH profiles of threeprimary tumors and their corresponding cell lines. Allthree tumors displayed a distinct expression peak, onepeak centered at the MYCN locus (red curves), one distal(green curves), and one proximal to the MYCN locus(pink curves). However, the CGH peaks of the primarytumors, from which the cell lines STA-NB-4 and STA-NB-15 were generated, showed a slight shift from theother CGH and CESH curves.
Linear regression analysis, performed exclusively on celllines, revealed a positive correlation between CESH andCGH data in all 2p regions, even though this correlation didnot reach statistical significance (adjusted P value �5%).One may argue that, due to the small sample size and thelarge number of multiple comparisons, the power to findsignificant correlations is limited. On the other hand the lackof significant correlation may indicate the presence of non-equally transcribed genes composing the amplicon.
Discussion
Interestingly, only two of 13 MNA cell lines (STA-NB-4and LAN-1) displayed a CESH peak at 2p24, the germline position of MYCN. The other cell lines with MNAshowed either distinct expression peaks proximal or dis-tal to the MYCN locus, or an expression plateau in thisregion. In contrast, the CGH peaks were clustered fre-
Table 3. Chromosome 2p Expression Profiles Pairing Various NB Cell Lines
Reference sample Test sampleOverexpressed regions
(CESH ratio��3�)Underexpressed regions
(CESH ratio��3�)
STA-NB-13 STA-NB-12 2p11,2q13–21.1 2p13–21,2p23-pter,2q34–36STA-NB-13 STA-NB-15 2p11.2–12 2p23.3-pterSTA-NB-9 STA-NB-10 2p22.3–25.1STA-NB-7 STA-NB-1 2p16,2q11–12,2q31,2q33
2p Expression Profiles of Neuroblastomas 211AJP January 2008, Vol. 172, No. 1

quently at 2p24 and less frequently at 2p25.1, and twocell lines displayed complex CGH profiles. Thus, we haveevidence that not all genes constituting the MYCN ampli-con are equally transcribed and that genes other thanMYCN reach even higher transcript levels in some cases.
The prognostic impact of MNA, which is associated withpoor prognosis, has been valid for more than two decades.In contrast, controversial findings have been reported forthe prognostic value of MYCN expression and/or proteinlevel.44–48 Tumors with amplified MYCN sequences usuallyshow increased MYCN transcript or protein levels. How-ever, some MNA tumors and cell lines reported and in thisstudy were shown to express low MYCN transcript and/orprotein levels.15,26,49–51 We cannot exclude that the MYCNexpression levels in some MNA tumors are directly attrib-uted to the corresponding copy number. In fact, the termi-nus MNA is usually applied to tumors harboring at least fourtimes the reference copy on the same chromosome.52Thus,tumors displaying low (10 to 20) or high (�100) MYCN copynumber are equally considered. Moreover, the assessmentof the correct copy number in cells measured by interphaseFISH may be in some instances difficult, due to variablecopy numbers. In our study all NB cell lines reaching notsignificant expression levels at 2p24 in CESH (STA-NB-1.1,-8, -9, Figure 2C) harbored a low amplification rate as indi-cated by CGH (Figure 2A) and lower MYCN protein expres-sion levels in comparison to mostly all other MNA cell lines.Conversely, elevated MYCN expression levels were ob-served also in NB tumors lacking MYCN amplification andwere found to be associated with favorable outcome.48 Thisphenomenon was explained by experiments showing thatforced MYCN expression reduced the viability of non-MNANB cells by inducing apoptosis and enhancing favorableNB gene expression. Interestingly, comparing the MYCNprotein levels of non-MNA cell lines, the highest level wasreached in the cell line derived from a patient with favorableoutcome. Therefore, the transcription regulator MYCN mayhave distinct roles in different subsets of NB, driving eithercellular proliferation or apoptosis. The question remains asto whether coamplified or gained genes have regulatoryeffects on the MYCN transcript or protein levels.
Only a few studies performed a detailed analysis of the2p amplicon constitution using high resolution arrayCGH.4,5,14,53 A number of highly coamplified regions thatwere discontinuous regarding the MYCN locus and locatedat varying distances from MYCN were described, demon-strating the unique constitution of the MYCN ampli-con.4,5,14,53 Interestingly, only one group of researchersfound high-level amplification of two genes (SNTG2 andTPO) situated at 936 kb and 1.4 Mb, respectively, from2pter, occurring in one of 10 MNA samples.5 In contrast,array expression studies from two independent groups re-ported the frequent occurrence of elevated expression lev-els of the genes SH3YL1,26 ACP1,49 and RPS726,49 situatedat 208 kb, 250 kb, and 3.6Mb, respectively, from 2pter, thusconfirming our data. Finally, RPS7 and SH3YL1 were notonly found to be frequently highly expressed in MNA tu-mors, but elevated expression levels were observed, al-though less frequently, in non-MNA NB samples.26
The report combining genomic and expression mi-croarray data of the 2p amplicon rarely detected highly
-1
-0,8
-0,6
-0,4
-0,2
0
0,2
0,4
0,6
52 52 52 42 42 42 32 32 32 22 22 22 22 12 12 61 61 61 61 61 51 41 41 31 31 31 21 21 212.
112 .
111.
11-1
-0,8
-0,6
-0,4
-0,2
0
0,2
0,4
0,6
52 52 52 42 42 42 32 32 32 22 22 22 22 12 12 61 61 61 61 61 51 41 41 31 31 31 21 21 212.
112.
111.
11
B
A
-0,4
-0,3
-0,2
-0,1
0
0,1
0,2
0,3
0,4
52 52 52 42 42 42 32 32 32 22 22 22 22 1 2 12 61 61 61 61 61 51 41 41 31 31 31 21 21 212.
112.
111.
11
C
-0,4
-0,3
-0,2
-0,1
0
0,1
0,2
0,3
0,4
52 52 52 42 42 42 32 32 32 22 22 22 22 12 1 2 6 1 61 61 61 61 51 41 41 31 31 3 1 2 1 2 1 212.
112.
111.
11
D
Figure 5. 2p CESH profiles pairing NB cell lines. On the x axes are displayedthe 2p loci (from 2pter to 2p11) and on the y axes the transformed fluores-cence ratios. A: f, STA-NB-13 versus leukocytes; Œ, STA-NB-12 versusleukocytes; —, STA-NB-12 versus STA-NB-13. B: f, STA-NB-13 versus leu-kocytes; Œ, STA-NB-15 versus leukocytes; —, STA-NB-15 versus STA-NB-13.C: f, STA-NB-9 versus leukocytes; Œ, STA-NB-10 versus leukocytes; —,STA-NB-10 versus STA-NB-9. D: f, STA-NB-7 versus leukocytes; Œ, STA-NB-1.1 versus leukocytes; —, STA-NB-1.1 versus STA-NB-7. We used directlylabeled (Spectrum Green-dUTP and Alexa Fluor-dUTP) cDNAs in all CESHexperiments except two. The CESH experiments pairing the NB cell lineSTA-NB-13 with STA-NB-12 (A) or STA-NB-15 (B), respectively, were per-formed with indirectly labeled (bio-16-dUTP and dig-11 dUTP) cDNAs (Aand B).
212 Stock et alAJP January 2008, Vol. 172, No. 1

expressed genes at 2pter (the coamplified genes in vi-cinity of 2pter were also found to be overexpressed).5
However, concordant results were observed concerningthe regions mostly involved in amplicon formation encom-passed 2pter-2p23.1 and the elevated expression ofgenes other than MYCN in eight of 10 MNA tumors.Interestingly, the expression levels of the coamplifiedgenes were even higher than the MYCN gene itself inseven of 10 cases. ALK amplification was also observedin one of 10 MNA tumors.
Lamant and coworkers54 consistently found ALK tran-scripts and ALK protein in all primary NB samples investi-gated. However, the authors did not observe a correlationbetween prognosis and the level of ALK expression in acohort of 24 NBs, probably because of missing ALK ampli-fied samples in their study.54 Other groups demonstratedthat amplification of the ALK gene leads to overexpressionof the ALK protein and to constitutively activated ALK ki-nase.17,55 The suppression of activated ALK in NB-39-nuALK amplified cells by RNA interference significantly re-duced the phosphorylation of ShcC, mitogen-activated pro-tein kinases, and Akt, inducing rapid apoptosis of thecells.17 Recent data revealed that in every cohort at leastone of 10 MNA samples displayed coamplification of theALK gene.5,14,56 Moreover, ALK amplification was identifiedin samples derived from patients with poor prognosis,17,55
which is in line with our data (Table 1).Two non-MNA NB cell lines, SK-N-SH and STA-NB-12,
reached significant expression levels at 2pter and/or2p23. SK-N-SH displays gain of the ALK gene; thus it islikely that this aberration resulted in an elevated 2p23expression level. STA-NB-12 presents no gain of the ALKgene, but it remains to be determined whether gainedgenes other than ALK, below the resolution of the CGHtechnique, are responsible for the 2p expression pattern.In fact, gained 2p regions were frequently found in non-MNA tumors by SNP array analysis.56 On the other hand,enhanced expression of a gene that is independent ofcopy number could also occur. Interestingly, SLC30A3,situated at 2 Mb distal from the ALK gene, was observedto be highly expressed, although none was amplified orgained, in two of 10 MNA tumors.5
We are aware that it is unacceptable to draw conclusionson the prognostic impact of the expression patterns ob-tained from cell lines. However, we have shown that theCESH peaks of cell lines substantially overlapped withthose obtained in primary tumors. Therefore, we assumethat enhanced expression peaks obtained from cell linescan be extrapolated to the in vivo situation. Considering theCESH expression peaks and clinical data, we observe thatall samples with expression peaks at 2p23.2 derived frompatients with unfavorable outcome.
The combination of CGH and CESH data presented forthe first time in this form enabled us to visualize chromo-somal regions with increased transcription activity, in-cluding the 2pter region; to determine the expressionlevels of different regions; and to speculate whetherCESH peaks at 2p23.2–23.3 may have prognostic impli-cations in high-risk neuroblastoma patients.
Acknowledgments
We thank Renate Panzer, Stephan Grunert, and HeinrichKovar for helpful discussions, and Marion Zavadil forproofreading.
References
1. Seeger RC, Brodeur GM, Sather H, Dalton A, Siegel SE, Wong KY,Hammond D: Association of multiple copies of the N-myc oncogenewith rapid progression of neuroblastomas. N Engl J Med 1985,313:1111–1116
2. Brodeur GM, Seeger RC, Schwab M, Varmus HE, Bishop JM: Ampli-fication of N-myc in untreated human neuroblastomas correlates withadvanced disease stage. Science 1984, 224:1121–1124
3. Akiyama K, Kanda N, Yamada M, Tadokoro K, Matsunaga T, Nishi Y:Megabase-scale analysis of the origin of N-myc amplicons in humanneuroblastomas. Nucleic Acids Res 1994, 22:187–193
4. Beheshti B, Braude I, Marrano P, Thorner P, Zielenska M, Squire JA:Chromosomal localization of DNA amplifications in neuroblastomatumors using cDNA microarray comparative genomic hybridization.Neoplasia 2003, 5:53–62
5. Lastowska M, Viprey V, Santibanez-Koref M, Wappler I, Peters H,Cullinane C, Roberts P, Hall AG, Tweddle DA, Pearson ADJ, Lewis I,Burchill SA, Jackson MS: Identification of candidate genes involved inneuroblastoma progression by combining genomic and expressionmicroarrays with survival data. Oncogene 2007, 26:7432–7444
6. De Preter K, Speleman F, Combaret V, Lunec J, Board J, Pearson A,De Paepe A, Van Roy N, Laureys G, Vandesompele J: No evidencefor correlation of DDX1 gene amplification with improved survivalprobability in patients with MYCN-amplified neuroblastomas. J ClinOncol 2005, 23:3167–3170
7. George RE, Kenyon R, McGuckin AG, Kohl N, Kogner P, ChristiansenH, Pearson ADJ, Lunec J: Analysis of candidate gene co-amplifica-tion with MYCN in neuroblastoma. Eur J Cancer 1997, 33:2037–2042
8. Kaneko S, Ohira M, Nakamura Y, Isogai E, Nakagawara A, Kaneko M:Relationship of DDX1 and NAG gene amplification/overexpression tothe prognosis of patients with MYCN-amplified neuroblastoma. J Can-cer Res Clin Oncol 2007, 133:185–192
9. Squire JA, Thorner PS, Weitzman S, Maggi JD, Dirks P, Doyle J, HaleM, Godbout R: Co-amplification of MYCN and a DEAD box gene(DDX1) in primary neuroblastoma. Oncogene 1995, 10:1417–1422
10. Weber A, Imisch P, Bergmann E, Christiansen H: Coamplification ofDDX1 correlates with an improved survival probability in children withMYCN-amplified human neuroblastoma. J Clin Oncol 2004,22:2681–2690
11. Lasorella A, Boldrini R, Dominici C, Donfrancesco A, Yokota Y, In-serra A, Iavarone A: Id2 is critical for cellular proliferation and is theoncogenic effector of N-myc in human neuroblastoma. Cancer Res2002, 62:301–306
12. Vandesompele J, Edsjo A, De Preter K, Axelson H, Speleman F, Pahl-man S: ID2 expression in neuroblastoma does not correlate to MYCNlevels and lacks prognostic value. Oncogene 2003, 22:456–460
13. Gebauer S, Yu AL, Omura-Minamisawa M, Batova A, Diccianni MB:Expression profiles and clinical relationships of ID2. CDKN1B, andCDKN2A in primary neuroblastoma. Genes Chromosomes Cancer2004, 41:297–308
14. Chen QR, Bilke S, Wei JS, Whiteford CC, Cenacchi N, KrasnoselskyAL, Greer BT, Son CG, Westermann F, Berthold F, Schwab M, Catch-poole D, Khan J: cDNA array-CGH profiling identifies genomic alter-ations specific to stage and MYCN-amplification in neuroblastoma.BMC Genomics 2004, 5:70
15. De Preter K, Pattyn F, Berx G, Strumane K, Menten B, Van Roy F, DePaepe A, Speleman F, Vandesompele J: Combined subtractive cDNAcloning and array CGH: an efficient approach for identification of over-expressed genes in DNA amplicons. BMC Genomics 2004, 5:11
16. Scott DK, Board JR, Lu X, Pearson ADJ, Kenyon RM, Lunec J: Theneuroblastoma amplified gene. NAG: genomic structure and charac-terisation of the 73 kb transcript predominantly expressed in neuro-blastoma. Gene 2003, 307:1–11
17. Osajima-Hakomori Y, Miyake I, Ohira M, Nakagawara A, NakagawaA, Sakai R: Biological role of anaplastic lymphoma kinase in neuro-blastoma. Am J Pathol 2005, 167:213–222
2p Expression Profiles of Neuroblastomas 213AJP January 2008, Vol. 172, No. 1

18. Michels E, Vandesompele J, Hoebeeck J, Menten B, De Preter K,LaureysG, Van Roy N, Speleman F: Genomewidemeasurement of DNAcopy number changes in neuroblastoma: dissecting amplicons andmapping losses, gains and breakpoints. Cytogenet Genome Res 2006,115:273–282
19. Mosse YP, Greshock J, Weber BL, Maris JM: Measurement andrelevance of neuroblastoma DNA copy number changes in the post-genome era. Cancer Lett 2005, 228:83–90
20. De Preter K, Vandesompele J, Heimann P, Yigit N, Beckman S,Schramm A, Eggert A, Stallings R, Benoit Y, Renard M, Paepe A,Laureys G, Pahlman S, Speleman F: Human fetal neuroblast and neu-roblastoma transcriptome analysis confirms neuroblast origin and high-lights neuroblastoma candidate genes. Genome Biology 2006, 7:R84
21. Schramm A, Schulte JH, Klein-Hitpass L, Havers W, Sieverts H, Ber-wanger B, Christiansen H, Warnat P, Brors B, Eils J, Eils R, Eggert A:Prediction of clinical outcome and biological characterization of neuro-blastoma by expression profiling. Oncogene 2005, 24:7902–7912
22. Schulte JH, Schramm A, Klein-Hitpass L, Klenk M, Wessels H, HauffaBP, Eils J, Eils R, BrodeurGM, Schweigerer L, HaversW, Eggert A:Microar-ray analysis reveals differential gene expression patterns and regulation ofsingle target genes contributing to the opposing phenotype of TrkA- andTrkB-expressing neuroblastomas. Oncogene 2005, 24:165–177
23. Takita J, Ishii M, Tsutsumi S, Tanaka Y, Kato K, Toyoda Y, Hanada R,Yamamoto K, Hayashi Y, Aburatani H: Gene expression profiling andidentification of novel prognostic marker genes in neuroblastoma.Genes Chromosomes Cancer 2004, 40:120–132
24. Wei JS, Greer BT, Westermann F, Steinberg SM, Son CG, Chen QR,Whiteford CC, Bilke S, Krasnoselsky AL, Cenacchi N, Catchpoole D,Berthold F, Schwab M, Khan J: Prediction of clinical outcome usinggene expression profiling and artificial neural networks for patientswith neuroblastoma. Cancer Res 2004, 64:6883–6891
25. Mosse YP, Greshock J, Margolin A, Naylor T, Cole K, Khazi D, Hii G,Winter C, Shahzad S, Asziz MU, Biegel JA, Weber BL, Maris JM:High-resolution detection and mapping of genomic DNA alterations inneuroblastoma. Genes Chromosomes Cancer 2005, 43:390–403
26. Wang Q, Diskin S, Rappaport E, Attiyeh E, Mosse Y, Shue D, SeiserE, Jagannathan J, Shusterman S, Bansal M, Khazi D, Winter C,Okawa E, Grant G, Cnaan A, Zhao H, Cheung N-K, Gerald W, LondonW, Matthay KK, Brodeur GM, Maris JM: Integrative genomics identi-fies distinct molecular classes of neuroblastoma and shows thatmultiple genes are targeted by regional alterations in DNA copynumber. Cancer Res 2006, 62:6050–6062
27. Gentleman R, Carey V, Huber W; Irizarry R, Dudoit S: Bioinformaticsand Computational Biology Solutions Using R and Bioconductor.Statistics for Biology and Health 2005, 19:1–473 Springer, 2005
28. Lu YJ, Williamson D, Clark J, Wang R, Tiffin N, Skelton L, Gordon T,Williams R, Allan B, Jackman A, Cooper C, Pritchard-Jones K, Shipley J:Comparative expressed sequence hybridization to chromosomes fortumor classification and identification of genomic regions of differentialgene expression. Proc Natl Acad Sci USA 2001, 98:9197–9202
29. Bentz M, Plesch A, Stilgenbauer S, Dohner H, Lichter P: Minimal sizesof deletions detected by comparative genomic hybridization. GenesChromosomes Cancer 1998, 21:172–175
30. Joos S, Scherthan H, Speicher MR, Schlegel J, Cremer T, Lichter P:Detection of amplified DNA sequences by reverse chromosome paintingusing genomic tumor DNA as probe. Hum Genet 1993, 90:584–589
31. Piper J, Rutovitz D, Sudar D, Kallioniemi A, Kallioniemi OP, WaldmanFM, Gray JW, Pinkel D: Computer image analysis of comparativegenomic hybridization. Cytometry 1995, 19:10–26
32. Parente F, Gaudray P, Carle GF, Turc-Carel C: Experimental assess-ment of the detection limit of genomic amplification by comparativegenomic hybridization CGH. Cytogenet Cell Genet 1997, 78:65–68
33. Kirchhoff M, Gerdes T, Maahr J, Rose H, Bentz M, Dohner H, Lund-steen C: Deletions below 10 megabasepairs are detected in compar-ative genomic hybridization by standard reference intervals. GenesChromosomes Cancer 1999, 25:410–413
34. Lu YJ, Williamson D, Wang R, Summersgill B, Rodriguez S, Rogers S,Pritchard-Jones K, Campbell C, Shipley J: Expression profiling tar-geting chromosomes for tumor classification and prediction of clinicalbehavior. Genes Chromosomes Cancer 2003, 38:207–214
35. Vanden Bempt I, Vanhentenrijk V, Drijkoningen M, Wolf-Peeters CD:Comparative expressed sequence hybridization reveals differentialgene expression in morphological breast cancer subtypes. J Pathol2006, 208:486–494
36. Lu YJ, Hing S, Williams R, Pinkerton R, Shipley J, Pritchard-Jones K:Chromosome 1q expression profiling and relapse in Wilms’ tumour.Lancet 2002, 360:385–386
37. Ambros IM, Rumpler S, Luegmayr A, Hattinger CM, Strehl S, Kovar H,Gadner H, Ambros PF: Neuroblastoma cells can actively eliminatesupernumerary MYCN gene copies by micronucleus formation: signof tumour cell revertance? Eur J Cancer 1997, 33:2043–2049
38. Narath R, Ambros IM, Kowalska A, Bozsaky E, Boukamp P, AmbrosPF: Induction of senescence in MYCN amplified neuroblastoma celllines by hydroxyurea. Genes Chromosomes Cancer 2006
39. Hattinger CM, Rumpler S, Strehl S, Ambros IM, Zoubek A, PotschgerU, Gadner H, Ambros PF: Prognostic impact of deletions at 1p36 andnumerical aberrations in Ewing tumors. Genes Chromosomes Cancer1999, 24:243–254
40. Stock C, Kager L, Fink FM, Gadner H, Ambros PF: Chromosomalregions involved in the pathogenesis of osteosarcomas. Genes Chro-mosomes Cancer 2000, 28:329–336
41. Stock C, Ambros IM, Lion T, Zoubek A, Amann G, Gadner H, AmbrosPF: Genetic changes of two Wilms tumors with anaplasia and a reviewof the literature suggesting a marker profile for therapy resistance.Cancer Genet Cytogenet 2002, 135:128–138
42. Stock C, Ambros IM, Lion T, Haas OA, Zoubek A, Gadner H, AmbrosPF: Detection of numerical and structural chromosome abnormalitiesin pediatric germ cell tumors by means of interphase cytogenetics.Genes Chromosomes Cancer 1994, 11:40–50
43. Kallioniemi OP, Kallioniemi A, Piper J, Isola J, Waldman FM, Gray JW,Pinkel D: Optimizing comparative genomic hybridization for analysisof DNA sequence copy number changes in solid tumors. GenesChromosomes Cancer 1994, 10:231–243
44. Bordow SB, Norris MD, Haber PS, Marshall GM, Haber M: Prognosticsignificance of MYCN oncogene expression in childhood neuroblas-toma. J Clin Oncol 1998, 16:3286–3294
45. Chan HL, Gallie BL, DeBoer G, Haddad G, Ikegaki N, DimitroulakosJ, Yeger H, Ling V: MYCN protein expression as a predictor ofneuroblastoma prognosis. Clin Cancer Res 1997, 3:1699–1706
46. Cohn SL, London WB, Huang D, Katzenstein HM, Salwen HR, ReinhartT, Madafiglio J, Marshall GM, Norris MD, Haber M: MYCN expression isnot prognostic of adverse outcome in advanced-stage neuroblastomawith nonamplified MYCN. J Clin Oncol 2000, 18:3604–3613
47. Hiyama E, Hiyama K, Yokoyama T, Ishii T: Immunohistochemicalanalysis of N-myc protein expression in neuroblastoma: correlationwith prognosis of patients. J Pediatr Surg 1991, 26:838–843
48. Tang XX, Zhao H, Kung B, Kim DY, Hicks SL, Cohn SL, Cheung N-K,Seeger RC, Evans AE, Ikegaki N: The MYCN enigma: significance ofMYCN expression in neuroblastoma. Cancer Res 2006, 66:2826–2833
49. Alaminos M, Mora J, Cheung N-KV, Smith A, Qin J, Chen L, GeraldWL: Genome-wide analysis of gene expression associated withMYCN in human neuroblastoma. Cancer Res 2003, 63:4538–4546
50. Matsunaga T, Shirasawa H, Hishiki T, Yoshida H, Kouchi K, OhtsukaY, Kawamura K, Etoh T, Ohnuma N: Enhanced expression of N-mycmessenger RNA in neuroblastomas found by mass screening. ClinCancer Res 2000, 6:3199–3204
51. Teitz T, Wei T, Valentine MB, Vanin EF, Grenet J, Valentine VA, BehmFG, Look AT, Lahti JM, Kidd VJ: Caspase 8 is deleted or silencedpreferentially in childhood neuroblastomas with amplification ofMYCN. Nat Med 2000, 6:529–535
52. Ambros PF, Ambros IM: Pathology and biology guidelines for resect-able and unresectable neuroblastic tumors and bone marrow exam-ination guidelines. Med Pediatr Oncol 2001, 37:492–504
53. Stallings RL, Nair P, Maris JM, Catchpoole D, McDermott M, O’MearaA, Breatnach F: High-resolution analysis of chromosomal breakpointsand genomic instability identifies PTPRD as a candidate tumor sup-pressor gene in neuroblastoma. Cancer Res 2006, 66:3673–3680
54. Lamant L, Pulford K, Bischof D, Morris SW, Mason DY, Delsol G,Mariame B: Expression of the ALK tyrosine kinase gene in neuroblas-toma. Am J Pathol 2000, 156:1711–1721
55. Miyake I, Hakomori Y, Shinohara A, Gamou T, Saito M, Iwamatsu A,Sakai R: Activation of anaplastic lymphoma kinase is responsible forhyperphosphorylation of ShcC in neuroblastoma cell lines. Oncogene2002, 21:5823–5834
56. George RE, Attiyeh EF, Li S, Moreau LA, Neuberg D, Li C, Fox EA,Meyerson M, Diller L, Fortina P, Look AT, Maris JM: Genome-wideanalysis of neuroblastomas using high-density single nucleotide poly-morphism arrays. PLoS ONE 2007, 2:e255
214 Stock et alAJP January 2008, Vol. 172, No. 1