
Direct regulation of the minichromosome maintenance complex by MYCN in neuroblastoma
Genetic study of high-stageneuroblastomas and normalneuroblastoma progenitors
Katleen De Preter
Genetic study of high-stage neuroblastomas and normal neuroblastoma progenitors Katleen D
e Preter
Faculty of Medicine and Health SciencesCentre for Medical Genetics
Ghent University Hospital (1K5)De Pintelaan 185 9000 Ghent Belgium

Genetic study of high-stageneuroblastomas and normalneuroblastoma progenitors
Katleen De Preter


Ghent University, Faculty of Medicine and Health Sciences Centre for Medical Genetics
Genetic study of high-stage neuroblastomas and normal neuroblastoma progenitors
this thesis is submitted as fulfilment of the requirements for the degree of Ph.D. in Medical Sciences by ir. Katleen De Preter, 2004
promotors
prof. dr. Frank Speleman prof. dr. Anne De Paepe
Centre for Medical Genetics Ghent University Hospital, 1K5, De Pintelaan 185, B-9000 Gent, Belgium
+32-9-2405533 (phone) +32-9-2404970 (fax)
Thesis submitted to fulfil the requirements for the degree of Ph.D. in Medical Sciences
October 2004
Promotors: prof. dr. Frank Speleman
Ghent University, Belgium
prof. dr. Anne De Paepe
Ghent University, Belgium
Members of the jury:
prof. dr. Johan Vande Walle
Ghent University, Belgium
prof. dr. Geneviève Laureys
Ghent University, Belgium
prof. dr. Yves Benoit
Ghent University, Belgium
prof. dr. Jo Lambert
Ghent University, Belgium
prof. dr. Sven Pählman
Lund University, Sweden
prof. dr. Miikka Vikkula
Catholic University of Louvain, Belgium
dr. Pierre Heimann
Free University of Brussels, Belgium
The research described in this thesis was conducted in the Centre for Medical Genetics, Ghent University
Hospital, Gent, Belgium
ir. Katleen De Preter is an aspirant of the FWO-Flanders.
Table of contents CHAPTER 1 INTRODUCTION AND RESEARCH OBJECTIVES 4 1 The genetic basis of cancer 5
1.1 Cancer genetics 5 1.2 Cancer and development: the stem-cell model 7
2 Neuroblastoma 10 2.1 Introduction 10 2.2 Genetics and prognosis 13 2.3 Developmental origin of neuroblastoma 18
3 New methodologies in cancer research 29 4 Research objectives 34
CHAPTER 2 ISOLATION AND EXPRESSION PROFILING OF NORMAL FOETAL NEUROBLASTS 36 1 Introduction 37 2 Results 38
2.1 PAPER 1: Application of laser capture microdissection in genetic analysis of
neuroblastoma and neuroblastoma precursor cells. De Preter K et al. Cancer Lett 2003. 38 2.2 PAPER 2: Expression profiling of foetal adrenal neuroblasts: a resource for the study of
sympathoadrenal biogenesis and neuroblastoma pathogenesis. De Preter K et al. In preparation. 48 3 Discussion 76
CHAPTER 3 INVESTIGATION OF THE 2P AMPLICON IN NEUROBLASTOMA 78 1 Introduction 79 2 Results 80
2.1 PAPER 3: Quantification of MYCN, DDX1, and NAG gene copy number in neuroblastoma
using a real-time quantitative PCR assay. De Preter K et al. Mod Pathol 2002. 80 2.2 PAPER 4: Combined subtractive cDNA cloning and array CGH: an efficient approach for
identification of overexpressed genes in DNA amplicons. De Preter K et al. BMC Genomics
2004. 90 3 Discussion 105
1
CHAPTER 4 INVESTIGATION OF CANDIDATE NEUROBLASTOMA GENES ON CHROMOSOME 11 108 1 Introduction 109 2 Results 110
2.1 PAPER 5: No evidence for involvement of SDHD in neuroblastoma pathogenesis. De
Preter K et al. BMC Cancer 2004. 110 2.2 PAPER 6: Positional and functional mapping of a neuroblastoma differentiation gene on
chromosome 11. De Preter K et al. In preparation. 126 3 Discussion 141
CHAPTER 5 CONCLUSION AND FUTURE PERSPECTIVES 144
REFERENCES 148
SUMMARY 161
RESUME 163
SAMENVATTING 165
ABBREVIATIONS 167
ACKNOWLEDGEMENTS / DANKWOORD 168
CURRICULUM VITAE 170
2

CHAPTER 1 Introductionand research objectives
Chapter 1 Introduction and research objectives
1 The genetic basis of cancer 5
1.1 Cancer genetics 5 1.2 Cancer and development: the stem-cell model 7
2 Neuroblastoma 10 2.1 Introduction 10
2.1.1 Incidence and clinical features 10 2.1.2 Diagnosis and staging 10 2.1.3 Pathology and histology 11 2.1.4 Treatment 12
2.2 Genetics and prognosis 13 2.2.1 Introduction 13 2.2.2 Prognostic subgroups 13 2.2.3 MYCN amplification 14 2.2.4 Chromosome 11q-deletion 16 2.2.5 Familial neuroblastoma 16
2.3 Developmental origin of neuroblastoma 18 2.3.1 Sympathetic nervous system and neuroblastoma histogenesis 18 2.3.2 Gene directed view on neural crest and neuroblastoma development and
differentiation 20 3 New methodologies in cancer research 29 4 Research objectives 34
Chapter 1: Introduction and research objectives 4
1 The genetic basis of cancer
1.1 Cancer genetics The idea that tumours arise from somatic genetic changes originated in the early 1900s. In 1914,
Theodor Boveri postulated that tumour growth is based on chromosomal defects [1]. This idea was,
albeit decades later, strongly revitalised by the discovery of the Philadelphia chromosome in chronic
myeloid leukaemia (CML) in 1960 [2]. Introduction of chromosome banding techniques allowed the
identification of the Philadelphia chromosome which results from a translocation between
chromosomes 9 and 22 [3]. With the improvement of cytogenetic techniques, many other recurrent
chromosomal abnormalities have been identified in different cancer types
(http://cgap.nci.nih.gov/Chromosomes/Mitelman) [4].
The mechanistic link between genetic aberrations and cancer development was provided with the
discovery of oncogenes that are activated (gain-of-function event) and tumour suppressor genes that
are inactivated in cancer (loss-of-function event). The first cellular proto-oncogenes were discovered in
the 1970s as relatives of transforming retroviral genes [5] that contribute to tumour formation when
mutationally activated or abnormally overexpressed. Experiments involving somatic cell fusion and
chromosome segregation pointed to the existence of another class of genes that can suppress
tumourigenicity [6, 7]. Depending on their normal cellular function and specific role in cancer,
gatekeeper, caretaker and landscaper tumour suppressor genes are distinguished (reviewed in [8]).
Gatekeeper genes include all direct inhibitors of cell growth, caretaker genes act indirectly to suppress
growth through effective repair of DNA damage or prevention of genomic instability, and landscaper
genes act by modulating the microenvironment in which tumour cells grow.
Recurrent genetic aberrations are suggestive for the presence of genes that are important for tumour
development. These aberrations involve the above-mentioned oncogenes or tumour suppressor
genes whose activities are altered by the genetic changes. Typical genetic changes leading to
unscheduled proto-oncogene overexpression are increased copy number due to amplifications or
juxtaposition near active promoters of e.g. immunoglobulin genes. A peculiar but common type of
gain-of-function genetic defect in leukaemia’s, lymphomas and mesenchymal tumours is reciprocal
translocation yielding a fusion or hybrid gene with new oncogenic properties. Inactivation of tumour
suppressor genes results from deletions, inactivating point mutations, exon deletions or epigenetic
modifications such as promoter hypermethylation. A central aim of cancer research has been to
identify the genes that are the central players in the process of oncogenesis. The identification of
these genes and insights into their role in normal and malignant cells has been pivotal in the
unravelling of basic biology of normal cell functions that control cell growth, apoptosis, differentiation,
cell senescence, angiogenesis, invasion and metastasis (Hanahan and Weinberg [9], see also below).
In addition, it turned out to be the case that many of these genetic defects were clinically relevant as
they could be used for early cancer detection, improved prediction of cancer risk and disease course,
identification of possible therapeutic targets and follow-up and monitoring of therapy response and
Chapter 1: Introduction and research objectives 5
minimal residual disease. So far, mutations in more than 1% of all human genes are known to be
involved in cancer pathogenesis [10]. The diverse range of cancer genes and pathways involved in
carcinogenesis and the enormous catalogue of cancer types demonstrate that cancer is a
heterogeneous disease. In the future, the continuous search for cancer genes and pathways, now
supported by technical improvements (see also section 3), will add further layers of complexity to our
knowledge that was gathered in the past decades. Powerful tools for this search are the availability of
the complete genetic sequence of human and model organisms [11, 12] and the development of bio-
informatics for handling vast amounts of biological data. These new tools provide a formidable
armoury of weapons that will help to unravel the principles of cancer development and progression
and will provide new means for cancer diagnosis, classification, prognosis and treatment (discussed in
section 3).
There are more than 100 distinct types of cancer, each with its own subtypes. However, it is proposed
that six hallmarks that collectively dictate malignant growth are shared in common by most and
perhaps all types of human tumours, i.e. self-sufficiency in growth signals, insensitivity to growth-
inhibitory (antigrowth) signals, evasion of programmed cell death (apoptosis), limitless replicative
potential (through telomere maintenance), sustained angiogenesis, and tissue invasion and
metastasis [9]. The cancer phenotype is believed to be a manifestation of these six essential
alterations in cell physiology that are acquired in a multi-step process of tumour development. This
process involves a succession of genetic events that may occur over several decades, during which
mutations are acquired in tumour suppressor genes, oncogenes and other genes. Studies revealed
that a single gene mutation is rarely, if ever, sufficient to accomplish the entire process of
transformation. In humans, at least four to six mutations are required to reach the neoplastic state
(reviewed in [13]). So, the risk of cancer development depends on several changes in multiple genes,
not only mutations initiating tumourigenesis, but also subsequent genetic or epigenetic changes
driving tumour progression, invasion and metastasis. Most cancers develop from a single somatic cell
that acquires a mutation leading to growth advantage. One of the cells in the proliferating clone is then
likely to accumulate other (epi)genetic changes that lead to altered phenotype which is subjected to
selection, finally resulting in the accumulation of immortalised tumour cells with unregulated growth
[14]. In this model of cancer development, the cancer phenotype is attributed to a serial acquisition of
(epi)genetic events that result in the turning on or off of genes that control the rate of cell birth or death
leading to the progressive conversion of differentiated normal human cells into cancer cells. However,
at least for some tumours it is believed that tumour cells originate from stem-cells by disruption of
genes involved in the regulation of stem-cell self-renewal and that only a minor part of the tumour
cells, i.e. the tumour stem-cells, contribute to the proliferative potential. The past few years, this stem-
cell model for cancer development regained interest, thanks to the confirmation in different tumour
types.
Chapter 1: Introduction and research objectives 6

1.2 Cancer and development: the stem-cell model Parallels have long been drawn between somatic stem-cells and cancer cells. Biological activities that
are physiological for normal stem-cells, such as tissue remodelling and cellular migration, resemble
features in cancer cells, such as tumour invasion and metastasis. On the cellular level, it is known that
both stem-cells and cancer cells have the potential to self-renew and differentiate. For obvious
reasons, the unlimited proliferative capacity of somatic stem-cells is strictly controlled and responding
to the needs of the developing organism, while cancer cells proliferate in an uncontrolled manner.
The existence of cancer stem-cells was first proven in the context of acute myeloid leukaemia (AML),
a decade ago [15]. In this study, it was observed that AML constitutes a heterogeneous population of
tumour cells of which a minor fraction (between 1/1000 and 1/5000 cells [16]), representing the stem-
cell subset, has the potential to self-renew and differentiate [17]. These cells self-renew to generate
phenotypically similar tumourigenic daughter cells, but also differentiate into phenotypically diverse
daughter cells with limited proliferative potential ( ). Only the cancer stem-cell subset has the
ability to proliferate extensively and form new tumour cells. More recently, similar stem-cells were also
observed in breast cancer [18] and glioblastoma [19], which caused the cancer stem-cell model to
regain interest in the study field of cancer.
Figure 1
Figure 1: Parallels between (A) normal stem-cells and (B) cancer stem-cells that can originate from two different cell types (adapted from Pardal et al. [20])
The cancer stem-cell model could lead to the assumption that similar proteins and signalling networks
that govern and control self-renewal of normal stem-cells might be implicated in proliferation of cancer
cells. Indeed several pathways implicated in carcinogenesis also play a role in normal stem-cell self-
renewal decisions, i.e. WNT (wingless-type gene family) [21, 22], SHH (sonic hedgehog) [23], NOTCH
(notch gene homolog) [24], PTEN (phosphatase and tensin homolog) [25] and BMI1 (B lymphoma Mo-
Chapter 1: Introduction and research objectives 7
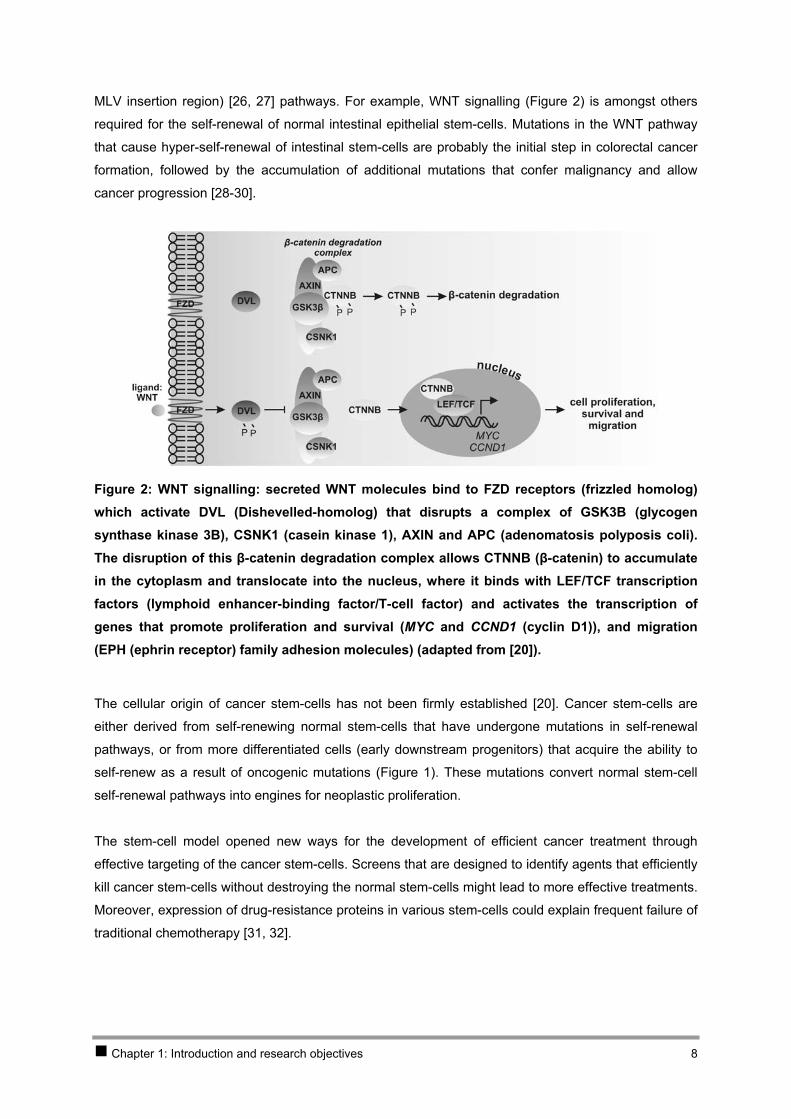
MLV insertion region) [26, 27] pathways. For example, WNT signalling ( ) is amongst others
required for the self-renewal of normal intestinal epithelial stem-cells. Mutations in the WNT pathway
that cause hyper-self-renewal of intestinal stem-cells are probably the initial step in colorectal cancer
formation, followed by the accumulation of additional mutations that confer malignancy and allow
cancer progression [28-30].
Figure 2
Figure 2: WNT signalling: secreted WNT molecules bind to FZD receptors (frizzled homolog) which activate DVL (Dishevelled-homolog) that disrupts a complex of GSK3B (glycogen synthase kinase 3B), CSNK1 (casein kinase 1), AXIN and APC (adenomatosis polyposis coli). The disruption of this β-catenin degradation complex allows CTNNB (β-catenin) to accumulate in the cytoplasm and translocate into the nucleus, where it binds with LEF/TCF transcription factors (lymphoid enhancer-binding factor/T-cell factor) and activates the transcription of genes that promote proliferation and survival (MYC and CCND1 (cyclin D1)), and migration (EPH (ephrin receptor) family adhesion molecules) (adapted from [20]).
The cellular origin of cancer stem-cells has not been firmly established [20]. Cancer stem-cells are
either derived from self-renewing normal stem-cells that have undergone mutations in self-renewal
pathways, or from more differentiated cells (early downstream progenitors) that acquire the ability to
self-renew as a result of oncogenic mutations ( ). These mutations convert normal stem-cell
self-renewal pathways into engines for neoplastic proliferation.
Figure 1
The stem-cell model opened new ways for the development of efficient cancer treatment through
effective targeting of the cancer stem-cells. Screens that are designed to identify agents that efficiently
kill cancer stem-cells without destroying the normal stem-cells might lead to more effective treatments.
Moreover, expression of drug-resistance proteins in various stem-cells could explain frequent failure of
traditional chemotherapy [31, 32].
Chapter 1: Introduction and research objectives 8

The stem-cell origin of cancer will also have major implications on the way we study cancer. Most
microarray expression studies in tumours to date have failed to account for the cellular heterogeneity
as well as for differences in the proliferative potential of cancer cell populations. Enrichment of stem
cells has been achieved, amongst others, on the basis of expression of specific cell-surface markers
using flow cytometry followed by cell sorting or sorting by magnetic beads. Directing expression
analyses to these enriched populations of proliferative cancer stem-cells may prove more effective in
future searches for genes and pathways involved in carcinogenesis.
Chapter 1: Introduction and research objectives 9
2 Neuroblastoma
2.1 Introduction
2.1.1 Incidence and clinical features
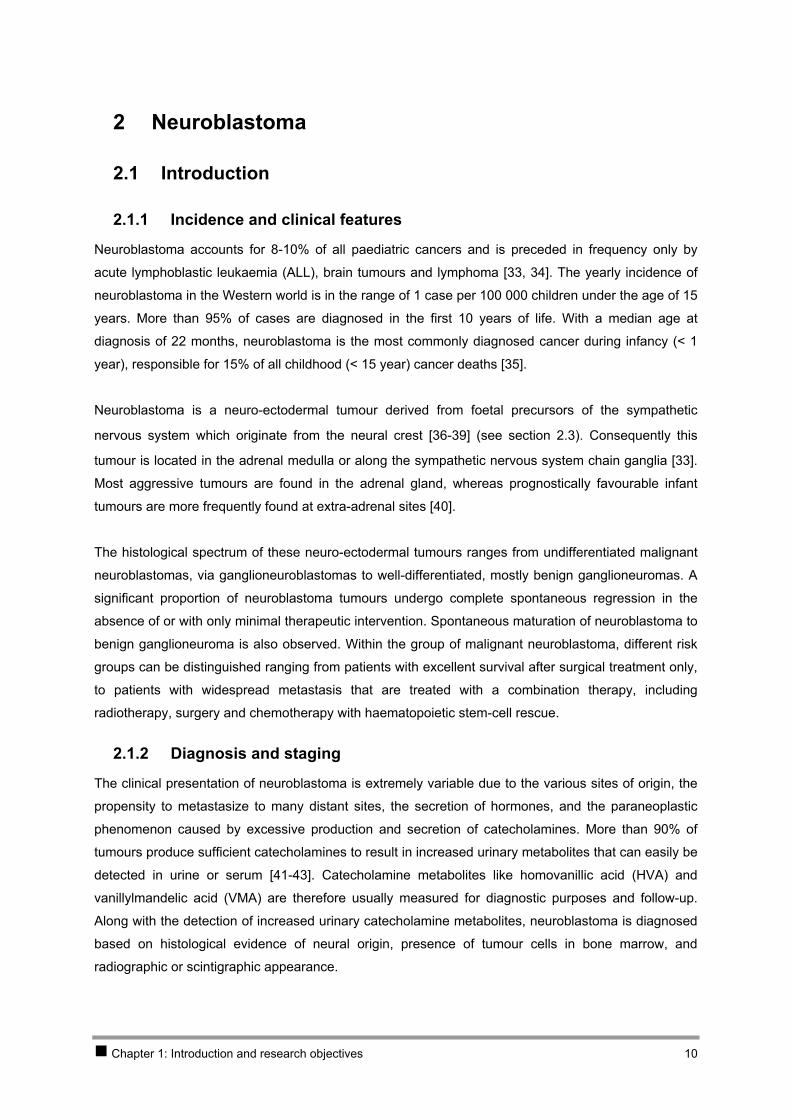
Neuroblastoma accounts for 8-10% of all paediatric cancers and is preceded in frequency only by
acute lymphoblastic leukaemia (ALL), brain tumours and lymphoma [33, 34]. The yearly incidence of
neuroblastoma in the Western world is in the range of 1 case per 100 000 children under the age of 15
years. More than 95% of cases are diagnosed in the first 10 years of life. With a median age at
diagnosis of 22 months, neuroblastoma is the most commonly diagnosed cancer during infancy (< 1
year), responsible for 15% of all childhood (< 15 year) cancer deaths [35].
Neuroblastoma is a neuro-ectodermal tumour derived from foetal precursors of the sympathetic
nervous system which originate from the neural crest [36-39] (see section 2.3). Consequently this
tumour is located in the adrenal medulla or along the sympathetic nervous system chain ganglia [33].
Most aggressive tumours are found in the adrenal gland, whereas prognostically favourable infant
tumours are more frequently found at extra-adrenal sites [40].
The histological spectrum of these neuro-ectodermal tumours ranges from undifferentiated malignant
neuroblastomas, via ganglioneuroblastomas to well-differentiated, mostly benign ganglioneuromas. A
significant proportion of neuroblastoma tumours undergo complete spontaneous regression in the
absence of or with only minimal therapeutic intervention. Spontaneous maturation of neuroblastoma to
benign ganglioneuroma is also observed. Within the group of malignant neuroblastoma, different risk
groups can be distinguished ranging from patients with excellent survival after surgical treatment only,
to patients with widespread metastasis that are treated with a combination therapy, including
radiotherapy, surgery and chemotherapy with haematopoietic stem-cell rescue.
2.1.2 Diagnosis and staging
The clinical presentation of neuroblastoma is extremely variable due to the various sites of origin, the
propensity to metastasize to many distant sites, the secretion of hormones, and the paraneoplastic
phenomenon caused by excessive production and secretion of catecholamines. More than 90% of
tumours produce sufficient catecholamines to result in increased urinary metabolites that can easily be
detected in urine or serum [41-43]. Catecholamine metabolites like homovanillic acid (HVA) and
vanillylmandelic acid (VMA) are therefore usually measured for diagnostic purposes and follow-up.
Along with the detection of increased urinary catecholamine metabolites, neuroblastoma is diagnosed
based on histological evidence of neural origin, presence of tumour cells in bone marrow, and
radiographic or scintigraphic appearance.
Chapter 1: Introduction and research objectives 10
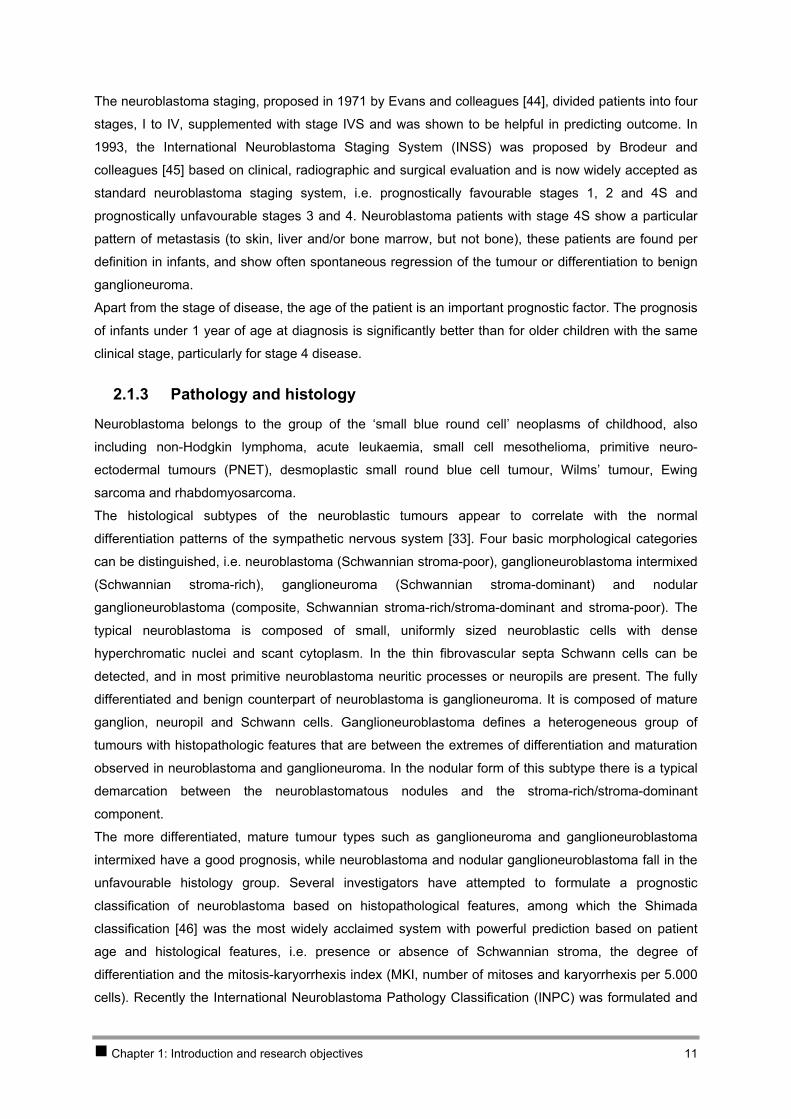
The neuroblastoma staging, proposed in 1971 by Evans and colleagues [44], divided patients into four
stages, I to IV, supplemented with stage IVS and was shown to be helpful in predicting outcome. In
1993, the International Neuroblastoma Staging System (INSS) was proposed by Brodeur and
colleagues [45] based on clinical, radiographic and surgical evaluation and is now widely accepted as
standard neuroblastoma staging system, i.e. prognostically favourable stages 1, 2 and 4S and
prognostically unfavourable stages 3 and 4. Neuroblastoma patients with stage 4S show a particular
pattern of metastasis (to skin, liver and/or bone marrow, but not bone), these patients are found per
definition in infants, and show often spontaneous regression of the tumour or differentiation to benign
ganglioneuroma.
Apart from the stage of disease, the age of the patient is an important prognostic factor. The prognosis
of infants under 1 year of age at diagnosis is significantly better than for older children with the same
clinical stage, particularly for stage 4 disease.
2.1.3 Pathology and histology
Neuroblastoma belongs to the group of the ‘small blue round cell’ neoplasms of childhood, also
including non-Hodgkin lymphoma, acute leukaemia, small cell mesothelioma, primitive neuro-
ectodermal tumours (PNET), desmoplastic small round blue cell tumour, Wilms’ tumour, Ewing
sarcoma and rhabdomyosarcoma.
The histological subtypes of the neuroblastic tumours appear to correlate with the normal
differentiation patterns of the sympathetic nervous system [33]. Four basic morphological categories
can be distinguished, i.e. neuroblastoma (Schwannian stroma-poor), ganglioneuroblastoma intermixed
(Schwannian stroma-rich), ganglioneuroma (Schwannian stroma-dominant) and nodular
ganglioneuroblastoma (composite, Schwannian stroma-rich/stroma-dominant and stroma-poor). The
typical neuroblastoma is composed of small, uniformly sized neuroblastic cells with dense
hyperchromatic nuclei and scant cytoplasm. In the thin fibrovascular septa Schwann cells can be
detected, and in most primitive neuroblastoma neuritic processes or neuropils are present. The fully
differentiated and benign counterpart of neuroblastoma is ganglioneuroma. It is composed of mature
ganglion, neuropil and Schwann cells. Ganglioneuroblastoma defines a heterogeneous group of
tumours with histopathologic features that are between the extremes of differentiation and maturation
observed in neuroblastoma and ganglioneuroma. In the nodular form of this subtype there is a typical
demarcation between the neuroblastomatous nodules and the stroma-rich/stroma-dominant
component.
The more differentiated, mature tumour types such as ganglioneuroma and ganglioneuroblastoma
intermixed have a good prognosis, while neuroblastoma and nodular ganglioneuroblastoma fall in the
unfavourable histology group. Several investigators have attempted to formulate a prognostic
classification of neuroblastoma based on histopathological features, among which the Shimada
classification [46] was the most widely acclaimed system with powerful prediction based on patient
age and histological features, i.e. presence or absence of Schwannian stroma, the degree of
differentiation and the mitosis-karyorrhexis index (MKI, number of mitoses and karyorrhexis per 5.000
cells). Recently the International Neuroblastoma Pathology Classification (INPC) was formulated and
Chapter 1: Introduction and research objectives 11
has become the international standard for histopathological risk classification with powerful prognostic
value [47, 48].
2.1.4 Treatment
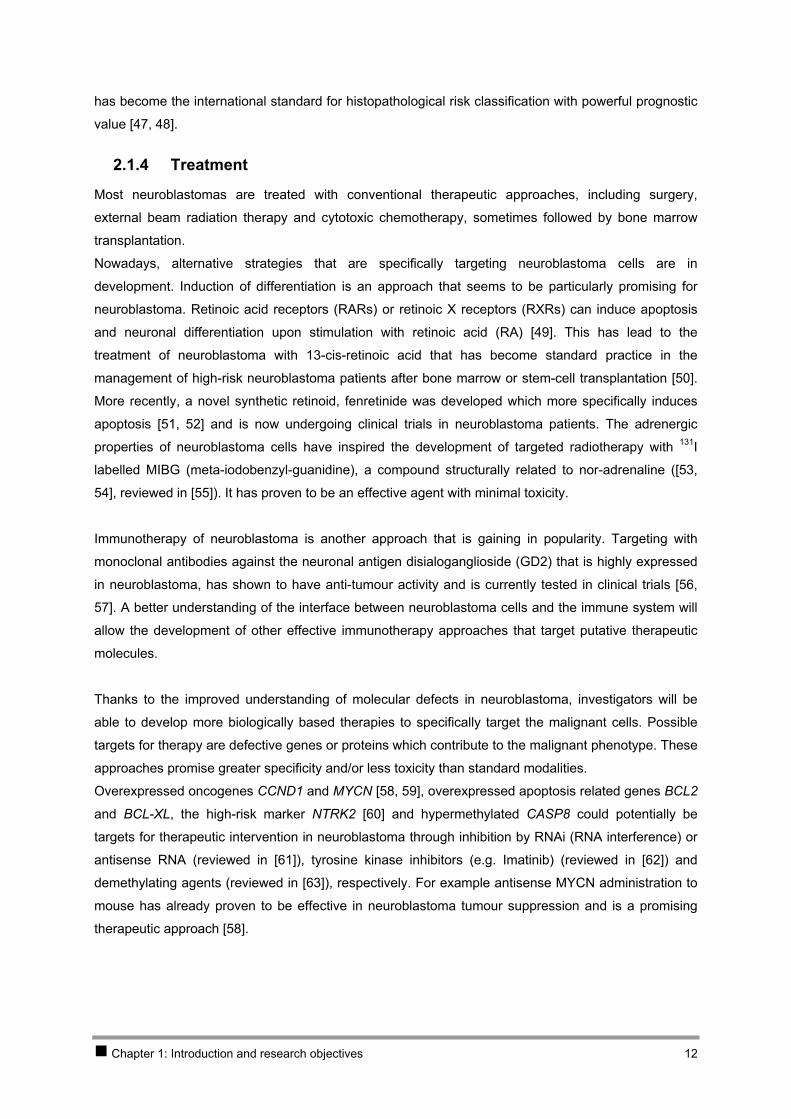
Most neuroblastomas are treated with conventional therapeutic approaches, including surgery,
external beam radiation therapy and cytotoxic chemotherapy, sometimes followed by bone marrow
transplantation.
Nowadays, alternative strategies that are specifically targeting neuroblastoma cells are in
development. Induction of differentiation is an approach that seems to be particularly promising for
neuroblastoma. Retinoic acid receptors (RARs) or retinoic X receptors (RXRs) can induce apoptosis
and neuronal differentiation upon stimulation with retinoic acid (RA) [49]. This has lead to the
treatment of neuroblastoma with 13-cis-retinoic acid that has become standard practice in the
management of high-risk neuroblastoma patients after bone marrow or stem-cell transplantation [50].
More recently, a novel synthetic retinoid, fenretinide was developed which more specifically induces
apoptosis [51, 52] and is now undergoing clinical trials in neuroblastoma patients. The adrenergic
properties of neuroblastoma cells have inspired the development of targeted radiotherapy with 131I
labelled MIBG (meta-iodobenzyl-guanidine), a compound structurally related to nor-adrenaline ([53,
54], reviewed in [55]). It has proven to be an effective agent with minimal toxicity.
Immunotherapy of neuroblastoma is another approach that is gaining in popularity. Targeting with
monoclonal antibodies against the neuronal antigen disialoganglioside (GD2) that is highly expressed
in neuroblastoma, has shown to have anti-tumour activity and is currently tested in clinical trials [56,
57]. A better understanding of the interface between neuroblastoma cells and the immune system will
allow the development of other effective immunotherapy approaches that target putative therapeutic
molecules.
Thanks to the improved understanding of molecular defects in neuroblastoma, investigators will be
able to develop more biologically based therapies to specifically target the malignant cells. Possible
targets for therapy are defective genes or proteins which contribute to the malignant phenotype. These
approaches promise greater specificity and/or less toxicity than standard modalities.
Overexpressed oncogenes CCND1 and MYCN [58, 59], overexpressed apoptosis related genes BCL2
and BCL-XL, the high-risk marker NTRK2 [60] and hypermethylated CASP8 could potentially be
targets for therapeutic intervention in neuroblastoma through inhibition by RNAi (RNA interference) or
antisense RNA (reviewed in [61]), tyrosine kinase inhibitors (e.g. Imatinib) (reviewed in [62]) and
demethylating agents (reviewed in [63]), respectively. For example antisense MYCN administration to
mouse has already proven to be effective in neuroblastoma tumour suppression and is a promising
therapeutic approach [58].
Chapter 1: Introduction and research objectives 12
2.2 Genetics and prognosis
2.2.1 Introduction
As indicated earlier, clinical behaviour of neuroblastomas is highly variable with some tumours
demonstrating spontaneous regression after little or no therapy, while other tumours have
metastasised at presentation and have a poor prognosis. For this reason, many clinical and biological
parameters have been evaluated for prognostic significance (reviewed in [35, 64, 65]). The most
powerful prognostic parameters thus far were age at diagnosis, stage, NTRK expression and genetic
abnormalities such as MYCN amplification, 1p- and 11q-deletion and unbalanced 17q-gain. Moreover,
these genetic defects are used for a better stratification of patients for therapy, in particular MYCN
amplification.
2.2.2 Prognostic subgroups
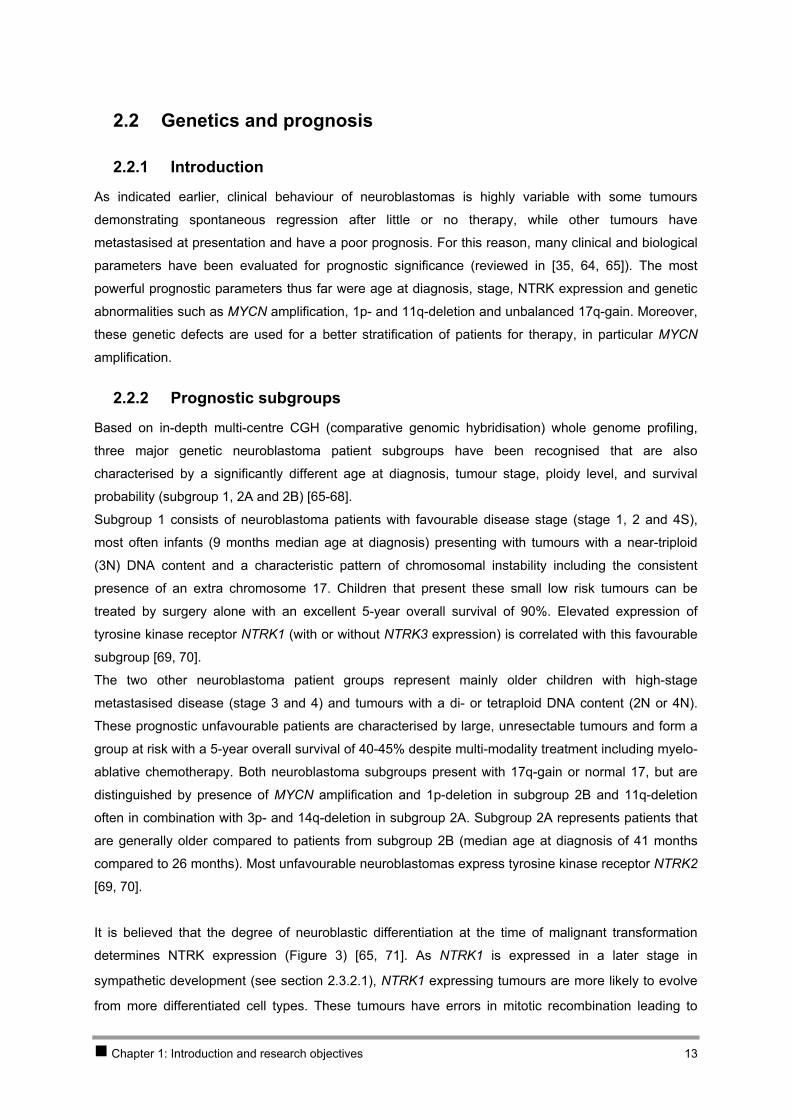
Based on in-depth multi-centre CGH (comparative genomic hybridisation) whole genome profiling,
three major genetic neuroblastoma patient subgroups have been recognised that are also
characterised by a significantly different age at diagnosis, tumour stage, ploidy level, and survival
probability (subgroup 1, 2A and 2B) [65-68].
Subgroup 1 consists of neuroblastoma patients with favourable disease stage (stage 1, 2 and 4S),
most often infants (9 months median age at diagnosis) presenting with tumours with a near-triploid
(3N) DNA content and a characteristic pattern of chromosomal instability including the consistent
presence of an extra chromosome 17. Children that present these small low risk tumours can be
treated by surgery alone with an excellent 5-year overall survival of 90%. Elevated expression of
tyrosine kinase receptor NTRK1 (with or without NTRK3 expression) is correlated with this favourable
subgroup [69, 70].
The two other neuroblastoma patient groups represent mainly older children with high-stage
metastasised disease (stage 3 and 4) and tumours with a di- or tetraploid DNA content (2N or 4N).
These prognostic unfavourable patients are characterised by large, unresectable tumours and form a
group at risk with a 5-year overall survival of 40-45% despite multi-modality treatment including myelo-
ablative chemotherapy. Both neuroblastoma subgroups present with 17q-gain or normal 17, but are
distinguished by presence of MYCN amplification and 1p-deletion in subgroup 2B and 11q-deletion
often in combination with 3p- and 14q-deletion in subgroup 2A. Subgroup 2A represents patients that
are generally older compared to patients from subgroup 2B (median age at diagnosis of 41 months
compared to 26 months). Most unfavourable neuroblastomas express tyrosine kinase receptor NTRK2
[69, 70].
Chapter 1: Introduction and research objectives 13
It is believed that the degree of neuroblastic differentiation at the time of malignant transformation
determines NTRK expression (Figure 3) [65, 71]. As NTRK1 is expressed in a later stage in
sympathetic development (see section 2.3.2.1), NTRK1 expressing tumours are more likely to evolve
from more differentiated cell types. These tumours have errors in mitotic recombination leading to
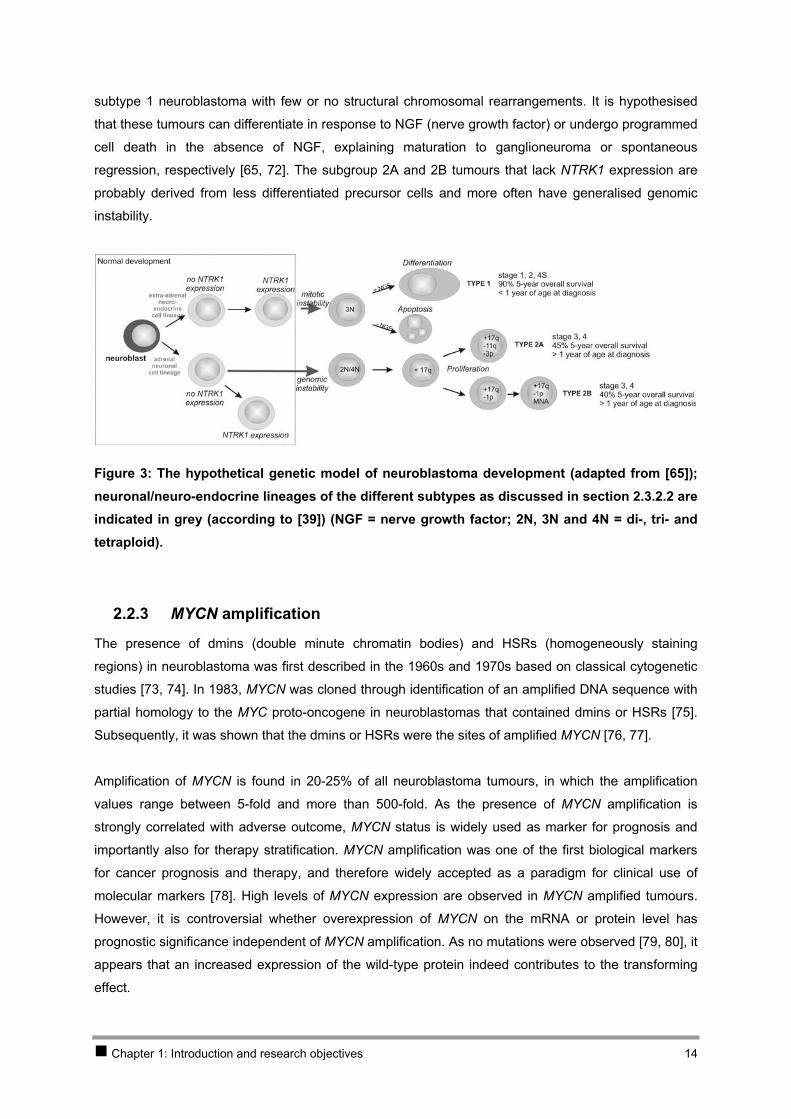
subtype 1 neuroblastoma with few or no structural chromosomal rearrangements. It is hypothesised
that these tumours can differentiate in response to NGF (nerve growth factor) or undergo programmed
cell death in the absence of NGF, explaining maturation to ganglioneuroma or spontaneous
regression, respectively [65, 72]. The subgroup 2A and 2B tumours that lack NTRK1 expression are
probably derived from less differentiated precursor cells and more often have generalised genomic
instability.
Figure 3: The hypothetical genetic model of neuroblastoma development (adapted from [65]); neuronal/neuro-endocrine lineages of the different subtypes as discussed in section 2.3.2.2 are indicated in grey (according to [39]) (NGF = nerve growth factor; 2N, 3N and 4N = di-, tri- and tetraploid).
2.2.3 MYCN amplification
The presence of dmins (double minute chromatin bodies) and HSRs (homogeneously staining
regions) in neuroblastoma was first described in the 1960s and 1970s based on classical cytogenetic
studies [73, 74]. In 1983, MYCN was cloned through identification of an amplified DNA sequence with
partial homology to the MYC proto-oncogene in neuroblastomas that contained dmins or HSRs [75].
Subsequently, it was shown that the dmins or HSRs were the sites of amplified MYCN [76, 77].
Amplification of MYCN is found in 20-25% of all neuroblastoma tumours, in which the amplification
values range between 5-fold and more than 500-fold. As the presence of MYCN amplification is
strongly correlated with adverse outcome, MYCN status is widely used as marker for prognosis and
importantly also for therapy stratification. MYCN amplification was one of the first biological markers
for cancer prognosis and therapy, and therefore widely accepted as a paradigm for clinical use of
molecular markers [78]. High levels of MYCN expression are observed in MYCN amplified tumours.
However, it is controversial whether overexpression of MYCN on the mRNA or protein level has
prognostic significance independent of MYCN amplification. As no mutations were observed [79, 80], it
appears that an increased expression of the wild-type protein indeed contributes to the transforming
effect.
Chapter 1: Introduction and research objectives 14
MYCN is normally expressed in the developing nervous system and some other tissues (see section
2.3.2.1). Transfection studies showed that overexpression of MYCN in cultured mammalian cells
strongly increases proliferation rates and is able to induce cellular transformation [81]. Moreover,
targeted expression of MYCN in central nervous system cells in mouse lead to the development of
neuroblastoma like tumours [82]. These findings clearly demonstrate that MYCN is an oncogene
involved in development of a subgroup of neuroblastomas. In addition to neuroblastoma, MYCN
overexpression has been described in a significant proportion of small cell lung cancers as well as in
some cases of medullary thyroid carcinoma, retinoblastoma, alveolar rhabdomyosarcoma, and breast
cancer [83-87].
Together, MYC, MYCN and MYCL, comprise the MYC family of proto-oncogenes [88], which are
basic-helix-loop-helix-zipper (bHLHZ) transcription factors. These proteins promote proliferation and
growth, inhibit terminal differentiation, and as such are involved in the genesis of a wide range of
cancers. The MYCN product is a 64 kDa nuclear phosphoprotein with an N-terminal transactivation
domain and a C-terminal bHLHZ motif that mediates DNA binding as well as interactions with other
nuclear bHLHZ proteins such as MAX and MAD [89]. At steady state in G0 cells, MAX expression is
constant and favours the formation of MAX/MAX homodimers that are transcriptionally repressive.
When MYCN is present, it forms MYCN/MAX heterodimers that function as transcriptional activators
through binding of DNA sequences termed E-boxes that are present in the promoter region of target
genes. Only a few targets of MYCN are known at this moment, i.e. ODC1 [90], MCM7 [91] and MRP1
[92]. In addition, several other potential targets of MYCN were identified using oligonucleotide
expression microarrays [93] and real-time quantitative PCR profiling [94]. A SAGE (serial analysis of
gene expression) study of MYCN transfected neuroblastoma cell lines revealed that MYCN functions
as regulator of the protein synthesis machinery as it up-regulates the expression of genes that have a
role in ribosome assembly and activity [95]. Also ID2 was proposed as a down-stream target of MYCN
[96, 97]. However, these data were not in agreement with findings from our laboratory and others [98,
99].
MYCN amplification is never found at the 2p24 resident site itself, but is cytogenetically apparent as
HSRs inserted in other chromosomes or as extrachromosomal dmins, in which they are present in an
ordered direct repeat head-to-tail tandem arrangement [100-102]. Therefore, the most accepted model
for the extra-chromosomal MYCN amplification process in neuroblastoma involves repair replication
either at a fragile site or at any other DNA sequence leading to duplication of a DNA region
encompassing the MYCN locus. Subsequent excision of the duplicated DNA, unscheduled replication
and recombination produces circular extrachromosomal structures (dmins) that may integrate in other
chromosomes, and a process of secondary amplification then results in HSRs [102].
The amplicon size is heterogeneous in different neuroblastomas and can vary between 100 kb and 1
Mb. This implicates that the amplicon may contain also other sequences that are coamplified. The
most frequently coamplified gene is the DEAD-box gene DDX1 that is located within 400 kb from
MYCN [103, 104]. Another gene that is found to be coamplified is the more proximally located NAG
Chapter 1: Introduction and research objectives 15
gene (neuroblastoma amplified gene) [105]. Despite the fact that MYCN has emerged as the only
consistently amplified gene in neuroblastoma, co-amplified genes may contribute to tumour phenotype
and behaviour, as demonstrated in some other cancers [106-110].
2.2.4 Chromosome 11q-deletion
A subgroup of high-risk neuroblastomas is characterised by the presence of partial 11q-deletion, and
represents approximately 15-22% of neuroblastoma cases [66-68, 111]. The first evidence for the
occurrence of 11q-deletions in neuroblastoma was obtained in 1991 through molecular genetic
analysis [112]. Functional evidence for a tumour suppressing effect of chromosome 11 in
neuroblastoma came from the serendipitous observation that transfer of an intact chromosome 11 into
a neuroblastoma cell line with 11q-loss induces differentiation [113]. The importance of 11q-loss in
neuroblastoma is further emphasised by rare cases of constitutional 11q abnormalities in children who
developed neuroblastoma, including a deletion of 11q23-qter, an interstitial deletion 11q14-q23
(described in 2 patients), a balanced translocation involving 11q21 and 11q22, and an inversion
11q21-23 (reviewed in [114]).
These findings suggest the presence of a tumour suppressor gene residing on the long arm of
chromosome 11 that is inactivated in the malignant progression of high-risk, MYCN single copy
tumours. Both CGH and LOH (loss of heterozygosity) studies indicate that the majority of the 11q-
deletions are distal losses encompassing a large portion of the long arm of chromosome 11,
hampering the search for positional candidate genes. The detection of rare small or interstitial
deletions using microsatellite markers allowed the provisional localisation of an SRO (shortest region
of overlap) at 11q23.3, encompassing a distance of approximately 3 Mb [115]. Recently, a
constitutional interstitial 11q-deletion was delineated by arrayCGH that did not overlap with this SRO
[116]. This observation may indicate the existence of a second SRO, but probably indicates the
misannotation of the SRO on 11q23.3 due to inherent problems of the LOH approach. Accurate
mapping of LOH events in a series of tumours to define a common LOH region may be greatly
confounded by deficient LOH detection by microsatellite markers, genetic instability and inter-tumour
heterogeneity as discussed by Devilee and colleagues [117]. Despite the efforts of mapping the
consensus region of 11q-loss, strong candidate neuroblastoma suppressor genes on 11q have not yet
been identified.
2.2.5 Familial neuroblastoma
A subset of patients with neuroblastoma shows a predisposition to develop the disease with an
autosomal-dominant pattern of inheritance with incomplete penetrance (reviewed in [118]). These
patients usually have multi-focal primary tumours that arise at an early age.
Linkage analyses of retinoblastoma and Wilms’ tumour families have lead to the identification of
tumour suppressor genes RB1 and WT1 [119, 120]. In contrast, identification of neuroblastoma genes
through linkage analysis is hampered by the small percentage (1-1.5%) of patients with a family
history and tumour variability. Using genome-wide genetic-linkage analysis, a predisposition locus was
mapped to the short arm of chromosome 16 [121, 122]. At present, it is unclear whether this is the only
Chapter 1: Introduction and research objectives 16
predisposition locus, or whether multiple loci are involved such as 4p [123]. Recently, germline
mutations in the PHOX2B gene on 4p12 (paired-like homeobox 2B) were reported in both a familial
case of neuroblastoma and a patient with the Hirschsprung disease-neuroblastoma association [124,
125]. Interestingly, this gene is involved in the differentiation of neuroblastoma precursor cells (see
section 2.3.2.1).
Chapter 1: Introduction and research objectives 17
2.3 Developmental origin of neuroblastoma So far, studies of recurrent genetic aberrations in neuroblastoma only provided evidence for the
involvement of the proto-oncogene MYCN as a direct mediator for neuroblastoma development. It is
our firm belief that a better understanding of the cellular and molecular pathways governing migration
and differentiation of neuroblastoma progenitor cells will be pivotal in the search for other genes
directly involved in the pathogenesis of this tumour.
The explicit presence of neuroblastoma in young children, its primary localisation at sites along the
sympathetic nervous system, its catecholamine production and several histological and marker gene
expression data indicate that neuroblastoma is an embryonic tumour that originates from neural crest
cells that normally give rise to the sympathetic nervous system.
2.3.1 Sympathetic nervous system and neuroblastoma histogenesis
2.3.1.1 Sympathetic nervous system precursor cells
The sympathetic nervous system is part of the peripheral autonomic nervous system ( A) and
is responsible for control of stress responses (called the ‘Fight or Flight’ response). Two branches of
the sympathetic nervous system can be distinguished, i.e. the non-adrenal sympathetic nervous
system located along the spinal cord consisting of sympathetic ganglia and paraganglia, and the
adrenal system constituting the adrenal medulla. The major neuronal cell types that constitute the
sympathetic nervous system are the neurons of the sympathetic ganglia and the primitive foetal
neuroblastic cells of the adrenal medulla. The other cell types of the sympathetic nervous system, i.e.
the ganglionic cells of the paraganglia (e.g. the organ of Zuckerkandl), the small intensely fluorescent
cells (SIF) of the sympathetic ganglia and the chromaffin cells of the adrenal medulla are neuro-
endocrine cell types (also called the sympathoadrenal cells) (Figure 4B). These three cell types
produce catecholamine metabolites, such as epinephrine, nor-epinephrine and dopamine (Figure 4C).
Figure 4
Figure 4
During pre- and early post-natal life, several cell types are present in the developing sympathetic
nervous system that regress or mature in a later stage or sometimes completely disappear in the adult
organism ( B), such as the extra-adrenal chromaffin cells, the nests of primitive adrenal
medullary neuroblastic cells and the adrenal chromaffin cells (reviewed in [126]).
During the neurulation process, neural crest cells are induced at the border between the primitive
neural tube and the non-neural ectoderm. The neural crest is a transient population of multi-potent
precursor cells that populate diverse regions throughout the embryo where they give rise to a various
number of differentiated cell types such as pigment-containing cells of the epidermis, the skeletal and
connective tissue components of the head, the neurons and supporting glial cells (Schwann cells) of
the sensory, sympathetic and parasympathetic nervous system, and the neuro-endocrine cells of the
adrenal medulla and the extra-adrenal sympathetic nervous system.
Chapter 1: Introduction and research objectives 18
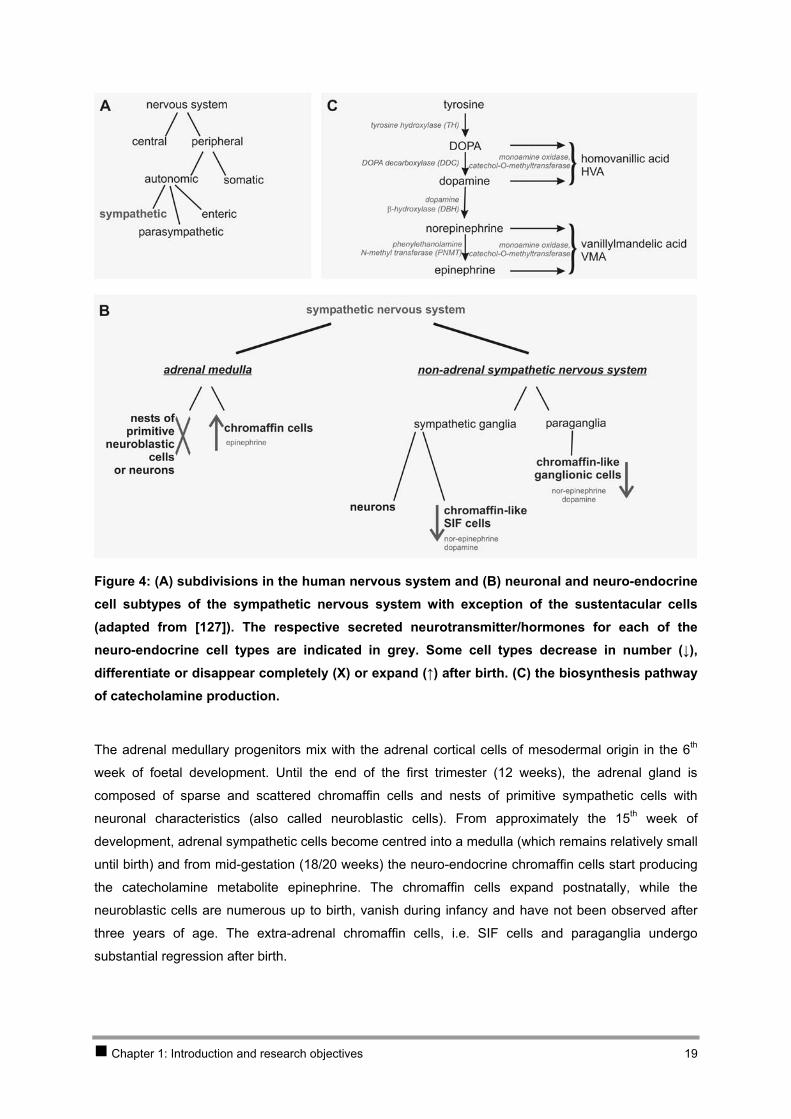
Figure 4: (A) subdivisions in the human nervous system and (B) neuronal and neuro-endocrine cell subtypes of the sympathetic nervous system with exception of the sustentacular cells (adapted from [127]). The respective secreted neurotransmitter/hormones for each of the neuro-endocrine cell types are indicated in grey. Some cell types decrease in number (↓), differentiate or disappear completely (X) or expand (↑) after birth. (C) the biosynthesis pathway of catecholamine production.
The adrenal medullary progenitors mix with the adrenal cortical cells of mesodermal origin in the 6th
week of foetal development. Until the end of the first trimester (12 weeks), the adrenal gland is
composed of sparse and scattered chromaffin cells and nests of primitive sympathetic cells with
neuronal characteristics (also called neuroblastic cells). From approximately the 15th week of
development, adrenal sympathetic cells become centred into a medulla (which remains relatively small
until birth) and from mid-gestation (18/20 weeks) the neuro-endocrine chromaffin cells start producing
the catecholamine metabolite epinephrine. The chromaffin cells expand postnatally, while the
neuroblastic cells are numerous up to birth, vanish during infancy and have not been observed after
three years of age. The extra-adrenal chromaffin cells, i.e. SIF cells and paraganglia undergo
substantial regression after birth.
Chapter 1: Introduction and research objectives 19
2.3.1.2 Neuroblastoma precursor cells
The assumption that neuroblastoma originates from a neuronal or neuro-endocrine cell type or from a
pluripotent precursor cell is based on the presence of cells with neuronal and/or chromaffin properties
in the tumour as well as the anatomical localisation of neuroblastoma, either in the adrenal medulla or
at the same position of the sympathetic chain along the spinal cord [128]. It is considered that
neuroblastoma originates from these cells as the result of a defect during the normal differentiation
from multi-potent progenitor neural crest cells to mature adrenal medulla or sympathetic ganglia.
A putative stem-cell developmental model for neuroblastoma is supported by the observation that the
tumours contain cancer cells with heterogeneous phenotypes. Three different cancer cell phenotypes
are identified, termed N for neuroblastic, S for non-neuronal, substrate-adherent and I for the cell type
that is intermediate in morphology between N and S (reviewed in [129]). All three cell types are multi-
potent, representing precursor cells able to differentiate further along neural crest differentiation
pathways. N-type cells represent immature sympathoblasts that can further differentiate to neuronal
cells and in some cases to cells with a chromaffin-like phenotype [128]. The S-cell phenotype is similar
to that of a Schwann/glial precursor cell. In contrast to the N- and S-cell types, the I-cell type is
significantly more malignant demonstrating the highest proliferative and tumourigenic potential. I-type
cells express both N- and S-cell marker proteins in the same cell, suggesting that this cell type is a
precursor cell that can self-renew as well as differentiate to N- and S-cell types. It is believed that I-cell
types have a major role in the aetiology and outcome of neuroblastoma [130].
2.3.2 Gene directed view on neural crest and neuroblastoma development and differentiation
2.3.2.1 Genes involved in neural crest induction and differentiation to sympathetic nervous
system cells
The formation of neural crest precursors at the neural plate border involves several signalling events
with various growth factors and cell-autonomous and non-autonomous signals that are strictly
regulated. Also, subsequent neuronal cell fate specification is determined by positional information,
cell-cell interaction, extracellular and intracellular signalling events, transcription factor cascades, and
differential expression of neuronal genes. Understanding of the mechanisms and genes that regulate
the normal sympathetic development is of particular interest to understand the genesis of
neuroblastoma. Most information that is currently available on the early development of the
sympathetic nervous system is based on animal models (chicken, zebrafish, frog and mouse) and may
not necessarily be imposable on the developmental process in man. The ability to isolate enriched
populations of neural crest cells on the basis of antigen expression has provided a wealth of
information about how specific environmental cues direct their cell fate decisions and differentiation.
Gain of function studies performed in frog or chicken embryos and loss of function studies carried out
in mice have provided insight into the role of different transcription factor families.
The genes that are involved in early neural crest specification as reviewed in [131] are summarised in
Table 1 and Figure 6. Even at the onset of migration, the neural crest is composed of a heterogeneous
Chapter 1: Introduction and research objectives 20
population of cells endowed with different proliferation and differentiation potentials. Regulatory genes
and cell-cell interactions that cooperate to control commitment and differentiation of neural crest cells
to melanocytes, glia or neuron subtypes, such as sensory neurons, and sympathetic neuronal and
neuro-endocrine cells are also represented in Table 1 and Figure 6 [132-140].
The proneural proteins encode transcription factors of the bHLH class and are both necessary and
sufficient, in the context of the ectoderm, to initiate the development of neural lineages and to promote
the generation of progenitors that are committed to differentiation (reviewed in [139, 141, 142]). The
bHLH domain is shared by these proteins and is responsible for their DNA-binding of DNA sequences
that contain a core motif, CANNTG, known as the E-box. These proteins promote neural precursor cell
formation by forming heterodimers with ubiquitously expressed bHLH proteins, or E-proteins. The
proneural-E heterodimer regulates transcription of target genes by binding DNA sequences that
contain an E-box. ID (inhibitor of differentiation) genes have a HLH domain, but lack an adjacent basic
motif for DNA binding. These proteins have a high affinity for E-proteins, so that they can compete with
proneural proteins by forming heterodimers with E-proteins which cannot bind DNA. bHLH HES
transcription factors (hairy enhancer of split factor) constitute another group of proneural gene
inhibitors that act as classical DNA binding repressors or by interfering with proneural-E-protein
complex formation.
ASCL1 (a human homolog of Drosophila Acaete-Scute proneural gene) and NGNs (neurogenines) are
the most well known early proneural genes that activate both generic and subtype specific neural-
differentiation programmes. NGNs with codeterminant are required for sensory neuron development,
while ASCL1 is, conversely, required for autonomic neuron development. ASCL1, induced by a
member of the BMP family (BMP2), is an early sympathetic marker that is required for sympathetic
differentiation. One important regulator of ASCL1 is the bHLH protein HES1 (hairy/enhancer of split
homologue-1). This protein represses the ASCL1 expression through binding to the N-box in the
ASCL1 promoter. A precise regulation of HES1 during embryogenesis is vital for proper neurogenesis,
in particular for the timing of neuronal differentiation. The expression of HES1 is at least in part
positively controlled by the NOTCH pathway, but also by the negative auto-regulation component
present in the HES1 promoter (Figure 5). In addition, NOTCH regulates ASCL1 in a HES-independent
manner by enhancing ubiquitinylation, targeting ASCL1 to a degradation process in a proteasome-
dependent pathway [143] (Figure 5). This NOTCH signalling is required to maintain neural progenitors
in an undifferentiated state. Zic1 acts upstream from NOTCH and in this way controls the expansion of
neural precursors by inhibiting the progression of neural differentiation [144]. The Bmi-1 gene is
required for self-renewal of stem-cells in the peripheral and central nervous system, but not for their
survival or differentiation [145].
Chapter 1: Introduction and research objectives 21
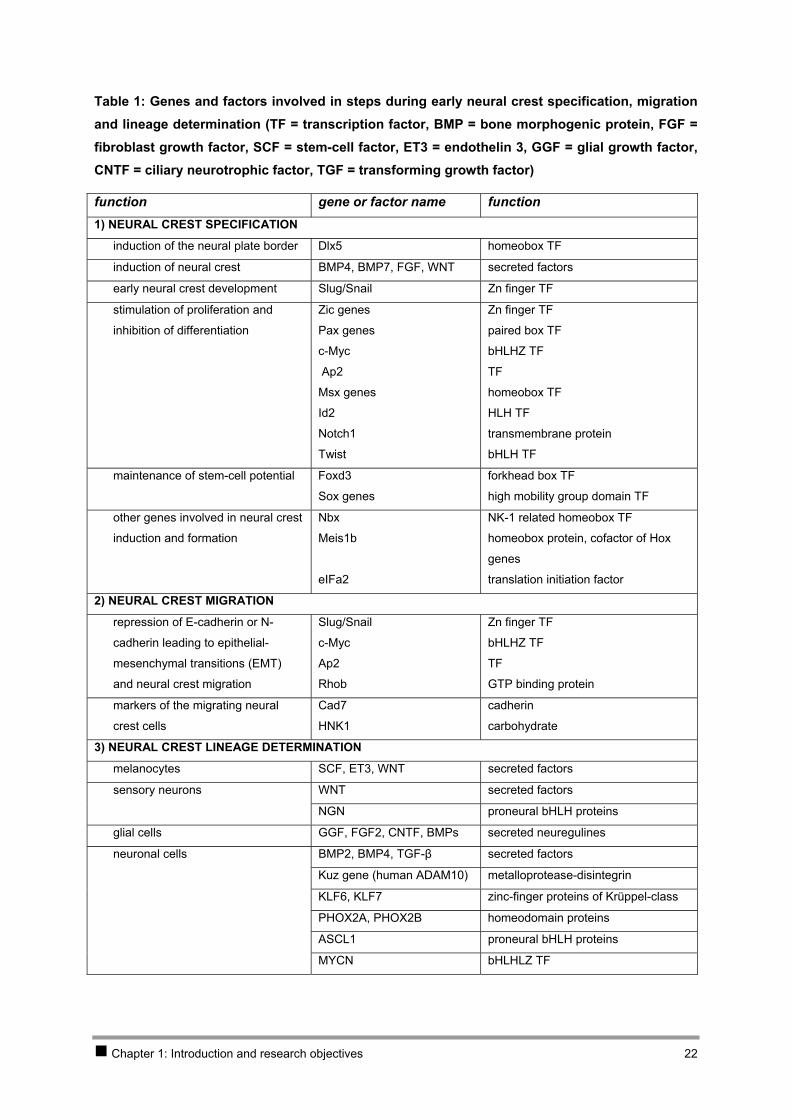
Table 1: Genes and factors involved in steps during early neural crest specification, migration and lineage determination (TF = transcription factor, BMP = bone morphogenic protein, FGF = fibroblast growth factor, SCF = stem-cell factor, ET3 = endothelin 3, GGF = glial growth factor, CNTF = ciliary neurotrophic factor, TGF = transforming growth factor)
function gene or factor name function 1) NEURAL CREST SPECIFICATION
induction of the neural plate border Dlx5 homeobox TF
induction of neural crest BMP4, BMP7, FGF, WNT secreted factors
early neural crest development Slug/Snail Zn finger TF
stimulation of proliferation and
inhibition of differentiation
Zic genes
Pax genes
c-Myc
Ap2
Msx genes
Id2
Notch1
Twist
Zn finger TF
paired box TF
bHLHZ TF
TF
homeobox TF
HLH TF
transmembrane protein
bHLH TF
maintenance of stem-cell potential Foxd3
Sox genes
forkhead box TF
high mobility group domain TF
other genes involved in neural crest
induction and formation
Nbx
Meis1b
eIFa2
NK-1 related homeobox TF
homeobox protein, cofactor of Hox
genes
translation initiation factor
2) NEURAL CREST MIGRATION
repression of E-cadherin or N-
cadherin leading to epithelial-
mesenchymal transitions (EMT)
and neural crest migration
Slug/Snail
c-Myc
Ap2
Rhob
Zn finger TF
bHLHZ TF
TF
GTP binding protein
markers of the migrating neural
crest cells
Cad7
HNK1
cadherin
carbohydrate
3) NEURAL CREST LINEAGE DETERMINATION
melanocytes SCF, ET3, WNT secreted factors
sensory neurons WNT secreted factors
NGN proneural bHLH proteins
glial cells GGF, FGF2, CNTF, BMPs secreted neuregulines
neuronal cells BMP2, BMP4, TGF-β secreted factors
Kuz gene (human ADAM10) metalloprotease-disintegrin
KLF6, KLF7 zinc-finger proteins of Krüppel-class
PHOX2A, PHOX2B homeodomain proteins
ASCL1 proneural bHLH proteins
MYCN bHLHLZ TF
Chapter 1: Introduction and research objectives 22
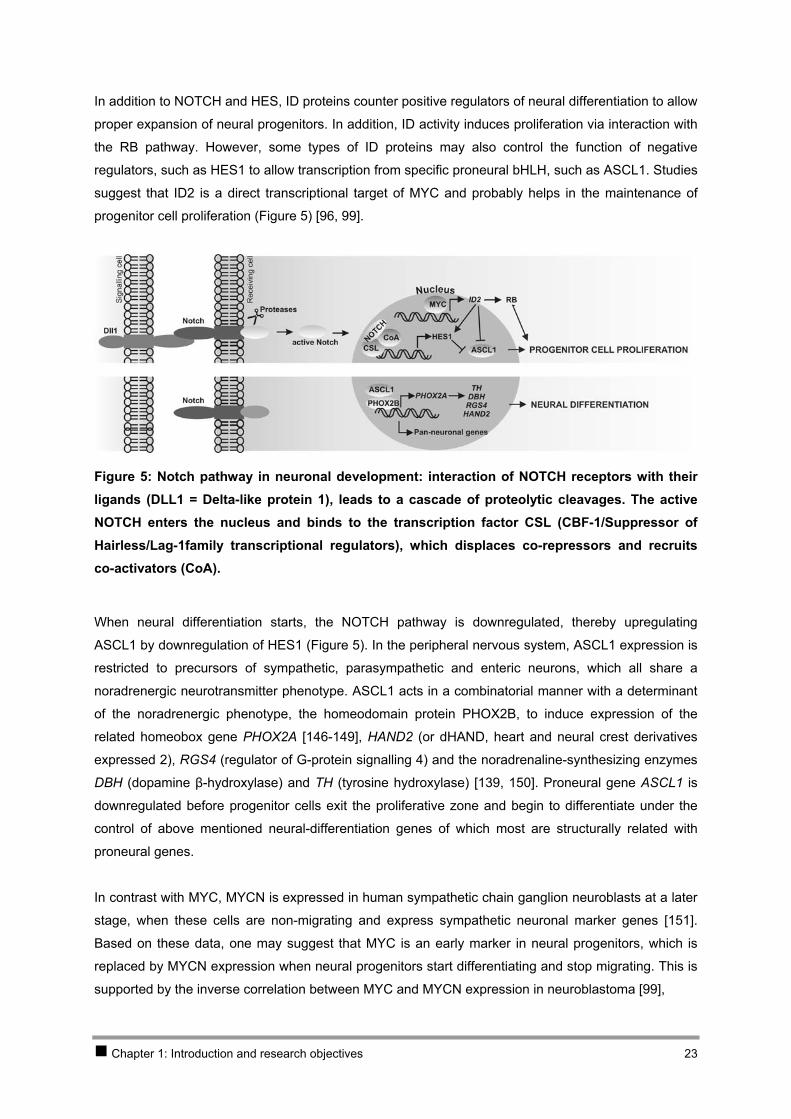
In addition to NOTCH and HES, ID proteins counter positive regulators of neural differentiation to allow
proper expansion of neural progenitors. In addition, ID activity induces proliferation via interaction with
the RB pathway. However, some types of ID proteins may also control the function of negative
regulators, such as HES1 to allow transcription from specific proneural bHLH, such as ASCL1. Studies
suggest that ID2 is a direct transcriptional target of MYC and probably helps in the maintenance of
progenitor cell proliferation (Figure 5) [96, 99].
Figure 5: Notch pathway in neuronal development: interaction of NOTCH receptors with their ligands (DLL1 = Delta-like protein 1), leads to a cascade of proteolytic cleavages. The active NOTCH enters the nucleus and binds to the transcription factor CSL (CBF-1/Suppressor of Hairless/Lag-1family transcriptional regulators), which displaces co-repressors and recruits co-activators (CoA).
When neural differentiation starts, the NOTCH pathway is downregulated, thereby upregulating
ASCL1 by downregulation of HES1 (Figure 5). In the peripheral nervous system, ASCL1 expression is
restricted to precursors of sympathetic, parasympathetic and enteric neurons, which all share a
noradrenergic neurotransmitter phenotype. ASCL1 acts in a combinatorial manner with a determinant
of the noradrenergic phenotype, the homeodomain protein PHOX2B, to induce expression of the
related homeobox gene PHOX2A [146-149], HAND2 (or dHAND, heart and neural crest derivatives
expressed 2), RGS4 (regulator of G-protein signalling 4) and the noradrenaline-synthesizing enzymes
DBH (dopamine β-hydroxylase) and TH (tyrosine hydroxylase) [139, 150]. Proneural gene ASCL1 is
downregulated before progenitor cells exit the proliferative zone and begin to differentiate under the
control of above mentioned neural-differentiation genes of which most are structurally related with
proneural genes.
In contrast with MYC, MYCN is expressed in human sympathetic chain ganglion neuroblasts at a later
stage, when these cells are non-migrating and express sympathetic neuronal marker genes [151].
Based on these data, one may suggest that MYC is an early marker in neural progenitors, which is
replaced by MYCN expression when neural progenitors start differentiating and stop migrating. This is
supported by the inverse correlation between MYC and MYCN expression in neuroblastoma [99],
Chapter 1: Introduction and research objectives 23
In a later phase of neurogenesis, neurotrophin signalling is responsible for the regulation of growth,
development, survival and repair of the nervous system cells. These factors use two classes of
receptors for their activity, i.e. the tyrosine kinase (transmembrane) receptors of which three, i.e.
NTRK1 (TRKA), NTRK2 (TRKB) and NTRK3 (TRKC), are involved in neuroblastoma, and the p75
neurotrophin receptor (NGFR = p75NTR) which is a member of the TNF-receptor superfamily. The best
studied neurotrophin receptor, NTRK1 is a homodimeric transmembrane protein of which expression
is regulated by multiple cis elements [152] and activates autophosphorylation by binding with NGF and
subsequently leads to docking of signalling proteins, signal transduction through the RAS/MAPK and
the PI3K pathway and induction of gene transcription. In the absence of NGF, NTRK1 expression will
lead to apoptosis, while binding of NGF and subsequent activation of the pathways leads to survival
and differentiation [153]. In normal sympathetic ganglia, most of the mature neurons at the perinatal
stage express NTRK1 at high concentrations. In tissues of the developing sympathetic nervous
system, NTRK1 expression increases with increasing gestational ages. Soon after NTRK1 expression
a massive physiological neuronal apoptosis occurs. This is explained by NTRK1 expression in the
absence of NGF which makes cells unable to survive. Some NTRK1 expressing cells, however,
encounter NGF in their environment, leading to survival and neuronal differentiation. So, the fate of a
neuronal progenitor cell during ontogenesis to differentiate into highly specialised neurons or to be
removed by an apoptotic process is mediated by a highly balanced expression of neurotrophin
receptors and their ligands [154].
For many of the genes discussed in this section, there are indications for their involvement in cancer.
Several chromosomal translocations involving members of the Pax gene family have been described
in various human cancers, suggesting that altered regulation or transcriptional activity of Pax gene
products can promote cellular transformation (reviewed in [155]). MYC is a well-known tumour
oncogene (reviewed in [156]). ID proteins have been implicated in regulating neoplastic transformation
(reviewed in [157, 158]). ADAM10 (kuz homolog) is overexpressed in tumours of sympathoadrenal
origin, such as pheochromocytomas and neuroblastomas [135]. KLF6 and KLF7 have been identified
as putative tumour suppressor genes in prostate and colorectal cancer, respectively [159, 160].
Aberrant NOTCH signalling promotes tumourigenesis through an oncogenic or tumour suppressive
function (reviewed in [24]). Also for genes MSX, MEIS and BMI1 there are hints for their involvement
in cancers [161-164].
2.3.2.2 Neuroblastoma sympathetic lineage determination
As some neuroblastoma tumours have undifferentiated histopathological features whereas others
appear to be more differentiated, it is believed that this maturational spectrum mimics stages
identifiable during histogenesis of the developing sympathetic nervous system. Differentiation state
and aggressiveness are clearly negatively correlated in neuroblastoma [46], as shown in highly
malignant tumours that express low levels of neuronal differentiation marker genes. Neurotrophin
Chapter 1: Introduction and research objectives 24

receptor expression is believed to reflect the level of differentiation at the time of developmental arrest
of the neuroblast from which a neuroblastoma tumour originates (see section 2.2.2).
Interesting in this context is the report of neuroblastoma cells exposed to hypoxia that induce genes
associated with growth, survival and aggressive behaviour leading to dedifferentiation. Induced
hypoxia in neuroblastoma cell lines decreases the expression of several neuronal/neuro-endocrine
marker genes, and induces genes associated with early neural crest development suggesting that
dedifferentiation of neuroblastoma cells in hypoxic tumour regions contribute to the malignancy of the
tumour [165-169].
Using expression analysis of marker genes, investigators have tried to define putative progenitor cell
types of neuroblastoma and their inherent cellular differentiation to better understand their origin and
biologic capacity. Most of the published data were obtained using immunohistochemistry and in situ
hybridisations performed by two research groups. As most of these data have not been confirmed in
other studies, data must be interpreted with care.
Based on the expression levels of six marker genes, i.e. TH (tyrosine hydroxylase), CGHA
(chromogranin A), pG2, B2M (β-2-microglobulin), S100 and HNK-1 in foetal and neonatal adrenal
glands and neuroblastoma specimens, Cooper and colleagues suggested that neuroblastoma
corresponds to the arrested differentiation of chromaffin adrenal medullary neuroblasts [36, 170, 171].
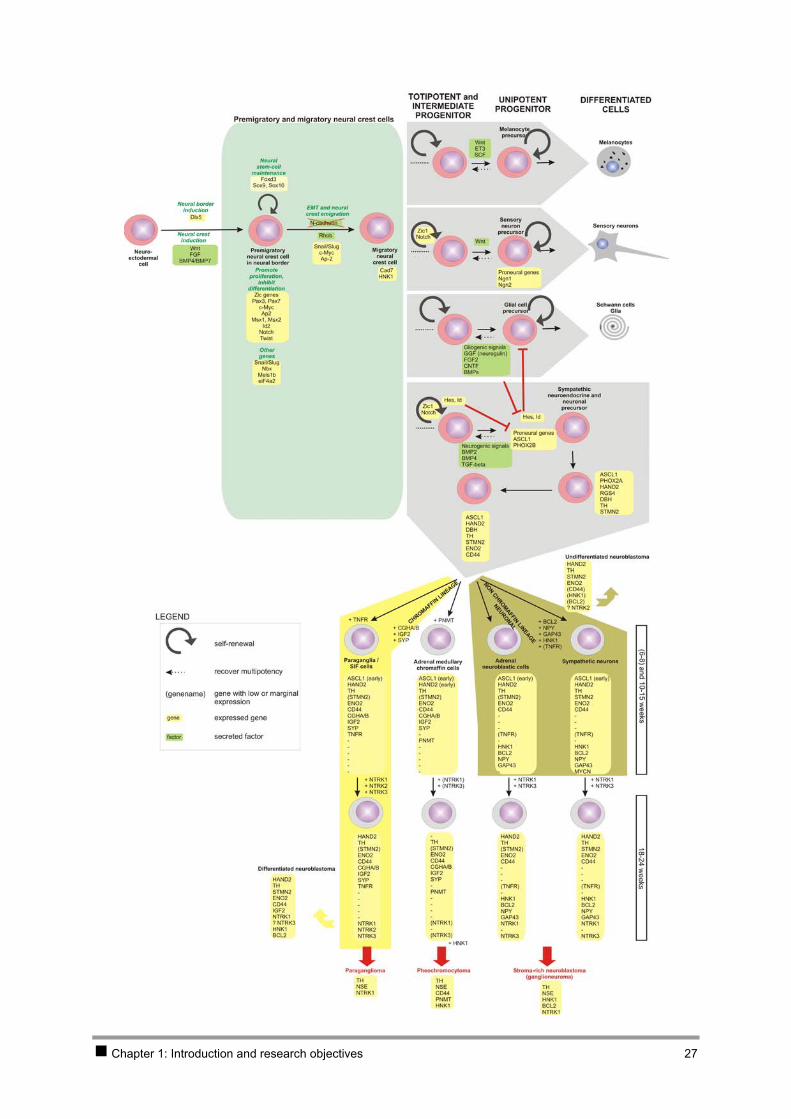
Pählman and colleagues tested more genes (summarised in Table 2 and represented in Figure 6) on a
wider range of tissues, including neuroblastoma tumours and cells of the developing sympathetic
nervous system, i.e. sympathetic neurons, paraganglia, adrenal chromaffin cells and neuroblastic
cells, and also ganglioneuroma, paraganglioma and pheochromocytoma tumours [37, 39, 127].
Comparison of histology and gene expression profiles of neuroblastomas with those of the different
cell types of the embryonic sympathetic nervous system suggested a different cell of origin for the
different tumour types: 1) poor prognosis, undifferentiated neuroblastomas are proposed to arise from
neuronally differentiated, adrenally located cell progenitors (also called neuroblastic cells), 2)
favourable prognosis tumours from either neuroblasts, paraganglia or SIF cells and 3) stroma-rich
tumours (ganglioneuroma) from more differentiated sympathetic neuronal precursors. These
hypotheses are in concordance with several reports indicating that tumours arising at the adrenal
gland are often more aggressive, with even worse outcome, than tumours that arise at extra-adrenal
locations [40].
Chapter 1: Introduction and research objectives 25

Table 2: Marker genes of which the expression levels were tested in developing sympathetic nervous system cells and neuroblastoma; expression of some of these genes was also tested in ganglioneuroma, paraganglioma and pheochromocytoma.
Gene Symbol Gene name Function ASCL1
HAND2
achaete-scute complex-like 1
heart and neural crest derivatives
expressed 2
bHLH proneural gene
bHLH neural differentiation gene
TH
PNMT
tyrosine hydroxylase
phenylethanolamine N-methyltransferase
enzymes involved in catecholamine biosynthesis
CHGA and CHGB chromogranin A and chromogranin B components of the neurosecretory granule
IGF2 insulin-like growth factor 2 chromaffin cell marker [127]
BCL2 B-cell CLL/lymphoma 2 proto-oncogene BCL2 associated with survival
extension (BCL2 mediates induction of neural
differentiation [172])
SYP synaptophysin an integral membrane protein of small synaptic
vesicles in brain and endocrine cells
CD44 CD44 antigen a glycoprotein antigen expressed on a variety of
haematological cell types, adhesion molecule
with role in cascade of metastasis and
progression of human malignant tumours
ENO2 (NSE) neuron specific enolase neuronal/neuro-endocrine marker
NTRK1
NTRK2
TNFR (p75NTR)
neurotrophic receptors see section 2.3.2.1
HNK1 carbohydrate antibody recognising migratory neural crest cells
NPY neuropeptide Y neuronal marker
GAP43 growth associated protein 43 neuronal marker
MYCN v-myc myelocytomatosis viral related
oncogene, neuroblastoma derived (avian)
proto-oncogene
STMN2 (SCG10) stathmin-like 2 panneuronal gene
S100 S100 calcium binding protein Schwann/ sustentacular cell marker
Chapter 1: Introduction and research objectives 26
Chapter 1: Introduction and research objectives 27
Figure 6: Schematic representation of genes involved in neural crest formation, migration and lineage determination (based on review articles [131, 139-142]) and neuroblastoma histogenesis (based on immunohistochemistry and in situ hybridisation studies on tumour sections and normal developing sympathetic nervous system cells [37-39, 127, 128, 173, 174]). [This scheme does not aim for completeness.]
Chapter 1: Introduction and research objectives 28
3 New methodologies in cancer research The progression of normal cells to cancer cells is driven by the accumulation of genetic alterations and
consequently gene expression pattern changes on mRNA and protein level. The identification of the
genes and pathways that are involved, not only improves the understanding of the biology of
carcinogenesis, it also provides new targets for early diagnosis and treatment. Recently, new methods
for quantitative high-throughput analysis of whole genome, transcriptome and proteome have been
introduced and applied in the field of cancer genetics. Most of the methodological breakthroughs were
possible due to the availability of the human genome sequence (June 2000) [11, 12].
The laboratories for cancer research at the Centre for Medical Genetics in Ghent have been at the
forefront for implementation of those new technologies in cancer research and this thesis also reflects
great efforts that were done in order to optimise and apply these in the fields of neuroblastoma
research.
Genome analysis For decades, chromosomal karyotyping (through G-banding of metaphase chromosomes) has been
the golden standard for screening of the tumour genome for chromosomal alterations and imbalances
such as ploidy changes, gain or loss of whole or partial chromosomes and translocations. Most of
these data are reviewed in the Mitelman Database of Chromosome Aberrations in Cancer
(http://cgap.nci.nih.gov/Chromosomes/Mitelman) [4]. The introduction of FISH (fluorescence in situ
hybridisation) [175, 176] added a powerful and unique molecular dimension to standard cytogenetics
and provided a significant new source of data on genetic defects occurring in cancer cells. The
technique of FISH offers a powerful approach to identify entire or specific regions of human
chromosomes, and analysis of complex rearrangements. Various FISH methods emerged leading to
new analytical opportunities and applications, i.e. M-FISH (multiplex FISH) [177] [178, 179] and SKY
(spectral karyotyping) [180] for multicolour approaches, and CGH (comparative genomic hybridisation)
for detection of chromosomal imbalances in the absence of metaphases [181] [66, 67, 111] [182] (see
Box). Recently, high-throughput methods were introduced that allow the identification and localisation
of DNA copy number aberrations with a significant increase in resolution; i.e. digital karyotyping, SNP
(single nucleotide polymorphisms) oligonucleotide chips and arrayCGH. Digital karyotyping is a SAGE
(serial analysis of gene expression) based method to enumerate genomic DNA tags [183, 184], but is
cumbersome and labour-intensive. Recently, oligonucleotide arrays, originally designed to detect
single-nucleotide polymorphisms, have been evaluated to be effective to assess DNA copy number in
combination with heterozygosity state with high resolution [185, 186]. BAC (bacterial artificial
chromosome) based arrayCGH combines the features of classical CGH with those of cDNA
microarrays (see Box), allowing a 10 to 100 fold increased resolution compared to classical CGH,
depending on the size and density of the spotted sequences. However, in the future, it is likely that
oligonucleotide-based arrays (50-100mers) will largely replace the BAC-based microarrays, enabling a
significant improvement in resolution and coverage [187]. It is expected that both arrayCGH and SNP
Chapter 1: Introduction and research objectives 29
oligonucleotide chips will become standard methods for fast and sensitive screening of genomic
imbalances in cancer [185].
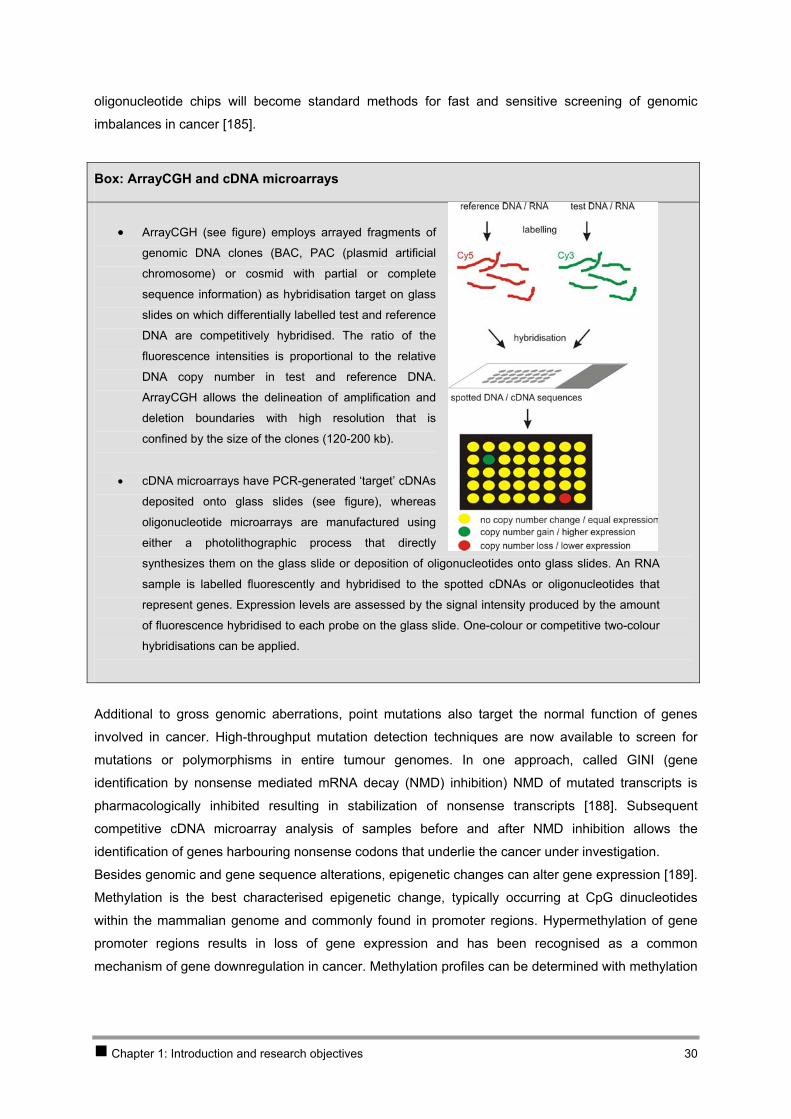
Box: ArrayCGH and cDNA microarrays
• ArrayCGH (see figure) employs arrayed fragments of
genomic DNA clones (BAC, PAC (plasmid artificial
chromosome) or cosmid with partial or complete
sequence information) as hybridisation target on glass
slides on which differentially labelled test and reference
DNA are competitively hybridised. The ratio of the
fluorescence intensities is proportional to the relative
DNA copy number in test and reference DNA.
ArrayCGH allows the delineation of amplification and
deletion boundaries with high resolution that is
confined by the size of the clones (120-200 kb).
• cDNA microarrays have PCR-generated ‘target’ cDNAs
deposited onto glass slides (see figure), whereas
oligonucleotide microarrays are manufactured using
either a photolithographic process that directly
synthesizes them on the glass slide or deposition of oligonucleotides onto glass slides. An RNA
sample is labelled fluorescently and hybridised to the spotted cDNAs or oligonucleotides that
represent genes. Expression levels are assessed by the signal intensity produced by the amount
of fluorescence hybridised to each probe on the glass slide. One-colour or competitive two-colour
hybridisations can be applied.
Additional to gross genomic aberrations, point mutations also target the normal function of genes
involved in cancer. High-throughput mutation detection techniques are now available to screen for
mutations or polymorphisms in entire tumour genomes. In one approach, called GINI (gene
identification by nonsense mediated mRNA decay (NMD) inhibition) NMD of mutated transcripts is
pharmacologically inhibited resulting in stabilization of nonsense transcripts [188]. Subsequent
competitive cDNA microarray analysis of samples before and after NMD inhibition allows the
identification of genes harbouring nonsense codons that underlie the cancer under investigation.
Besides genomic and gene sequence alterations, epigenetic changes can alter gene expression [189].
Methylation is the best characterised epigenetic change, typically occurring at CpG dinucleotides
within the mammalian genome and commonly found in promoter regions. Hypermethylation of gene
promoter regions results in loss of gene expression and has been recognised as a common
mechanism of gene downregulation in cancer. Methylation profiles can be determined with methylation
Chapter 1: Introduction and research objectives 30
sensitive restriction enzyme digestion [190], methylation-specific PCR [191], bisulphite sequencing
[192] and last but not least high-throughput methylation target arrays [193].
Transcriptome analysis Expression profiling of cancer cells allows the detection of genes that are altered by genetic
aberrations, as well as the downstream effects of those alterations. Many techniques have been
developed for isolation and detection of transcripts in cancer cells with differential expression
compared to reference samples, e.g. subtractive hybridisation and differential display (reviewed in
[194]).
A major breakthrough in this field was transcriptome profiling using cDNA and oligonucleotide
microarrays allowing simultaneous analysis of thousands of genes (see Box). Approximately a quarter
of microarray-related literature pertains to cancer, with tumour and cell line transcriptome profiling
providing numerous insights into disease. The development of specific cDNA and oligonucleotide
microarrays has led to the identification of prognostic biomarkers and has allowed improved sub-
classification of many disease types including common cancer such as lymphoma, leukaemia, breast
and lung cancer and also rare tumour types such as Merkel cell carcinoma [195-203].
An alterative method for whole transcriptome gene expression profiling is SAGE (serial analysis of
gene expression), a sequencing-based technology that provides quantitative assessment of gene
expression [204]. SAGE provides absolute quantities of the expression levels by counting the
transcripts and thus makes cumulative data sets useful and direct comparisons between independent
experiments valid. SAGE based research to identify cancer markers has been conducted for a variety
of primary cancers and cell lines, including breast, kidney, prostate, liver, lung, gastric, colorectal and
pancreatic cancer. The NIH Cancer Genome Project (CGAP) now maintains a comprehensive SAGE
database for various normal and cancer cell lines and tissues with a web interface known as SAGE
Genie which allows a quick review of the expression pattern for a gene of interest [205, 206].
Whole genome profiling approaches yield candidate genes that require verification that was achieved
through labour intensive Northern blot analysis. Almost a decade ago, real-time quantitative PCR (Q-
PCR) was developed allowing a precise, reproducible, accurate and rapid quantification of the gene
expression levels using only small amounts of RNA [207]. This technique is widely used to validate
expression profiles, and recent introduction of more miniaturized approaches now allows high-
throughput screening.
Proteome and functional analysis
Further validation of expression data on the protein level is possible through immunohistochemical
techniques that, when applied to tissue microarrays, allow for high-throughput analysis of multiple
tissues [208].
In parallel with the (epi)genomic and transcriptomic research areas, proteomics is coming to the
forefront of cancer research as a result of new and powerful analytical methods such as high-
resolution 2D-PAGE (2D-polyacrylamide gel electrophoresis) combined with MALDI-TOF MS (matrix-
assisted laser desorption/ionisation – time of flight mass spectrometry) [209], ICAT (isotope-coded
Chapter 1: Introduction and research objectives 31
affinity tags) in combination with tandem MS [210], and protein or antibody arrays [211]. With these
new tools, protein analysis (of proteins before and after post-transcriptional modification) will become
increasingly important, as proteins are the molecules that exert the biological function of the encoding
genes and transcripts and are the direct targets of treatment.
Finally, functional evidence for the involvement of candidate genes in carcinogenesis can be obtained
through functional genetic approaches (reviewed in [212]). Recently, several new technologies have
become available to identify gene function in mammalian cells using high-throughput genetic screens.
Gain-of-function genetic screens use techniques that introduce foreign genetic material into
mammalian cells through DNA transfection with plasmids or viral vectors. Genetic screens that aim to
identify gene function through inactivation of a gene are referred to as loss-of-function screens.
Various technologies have been developed to study the effects of gene suppression in mammalian
cells, of which RNAi (RNA interference) (reviewed in [213]) is, at the moment, the most promising. This
elegant method targets specific genes by way of post-transcriptional gene silencing. Very recently, a
large-scale RNAi screen in human cells revealed new components of the p53 pathway [214].
Above mentioned whole (epi)genome, transcriptome and proteome analyses allow the identification of
patterns of (epi)genetic changes and the generation of gene-expression profiles, that would provide a
more complete picture of each individual tumour. Obviously, these new methods offer great promise
for further studies in cancer genetics, but at the same time create new challenges.
Molecular genetic techniques such as arrayCGH, cDNA or oligonucleotide microarrays and protein
arrays in cancer research are challenged by the heterogeneity of the tumour tissue. Laser capture
microdissection (LCM) [215] followed by established DNA and RNA amplification protocols allows
investigation of the cancer cells of interest present in a heterogeneous mixture of tumour cells and is
nowadays implemented in many experimental settings.
Another challenge is the large data sets obtained from high-throughput (epi)genome, transcriptome
and proteome profiling that require specialised tools for effective handling and analysis. For example,
the Microarray Gene Expression Data Society (MGED) formulated the MIAME standard in order to get
more standardised data handling in gene expression microarray experiments [216]. MIAME describes
the Minimum Information About a Microarray Experiment that is needed to enable the interpretation of
the results of the experiment unambiguously and to reproduce the experiment. It is at the moment a
widely accepted standard for expression microarray data handling. In addition to standardisation of
data storage, the challenge is to integrate all these data with information on clinical behaviour,
pathology, drug response, deregulated pathways and processes and with comparable information
from the mouse, which is for example aimed in the Cancer Genome Anatomy Project
(http://cgap.nci.nih.gov/). Several integration efforts are now underway and will provide a more complete
picture of the genes deregulated in specific tumour phenotypes and give an answer on how this
information can be used to improve cancer diagnosis and treatment [217].
Chapter 1: Introduction and research objectives 32

All in all, the above described breakthroughs are now dramatically changing the face of contemporary
cancer research and are fuelling hope that our understanding of cancer biology will exponentially
grow, leading to improved diagnosis, prognostic assessment and last but not least the identification of
new targets for molecular therapy.
Chapter 1: Introduction and research objectives 33
4 Research objectives Presently, for only one gene, i.e. the MYCN proto-oncogene, direct involvement in neuroblastoma has
been demonstrated. In order to further improve prognostic classification of neuroblastoma and to
develop molecular targeted therapies, this thesis aimed at identification of other genes and pathways
that are involved in the pathogenesis of aggressive neuroblastoma.
1. Isolation and expression profiling of normal foetal neuroblasts This first research objective was put forward assuming that normal developmental pathways are
disturbed in neuroblastoma oncogenesis and in order to obtain normal reference material for the study
of altered gene expression profiles in neuroblastoma. To this purpose we aimed to (1) isolate normal
neuroblastic cells from foetal adrenal glands using LCM (with optimised protocols for tissue handling in
order to preserve RNA integrity during the process of LCM and RNA isolation), (2) amplify the small
amounts of RNA obtained by LCM and finally (3) perform whole transcriptome gene expression
analysis on HG-U133A Affymetrix chips. The results of these analyses are reported in Chapter 2.
2. Investigation of the 2p amplicon in neuroblastoma A second goal of the thesis was to develop methods for accurate assessment of copy number of
amplified genes and efficient dissection of amplicons. To achieve this, we aimed to develop a real-time
quantitative PCR based technique for determining MYCN copy number in primary neuroblastoma
tumours. In addition, we developed a strategy for isolation and identification of MYCN co-amplified and
overexpressed genes using a methodology that combines subtractive cloning with cDNA microarray
analysis. Chapter 3 reports the results of this study.
3. Investigation of candidate neuroblastoma genes on chromosome 11 A third goal of this thesis was to contribute to the understanding of the role of genes located on
chromosome 11 in neuroblastoma development. First, we investigated a functional and positional
candidate tumour suppressor gene, SDHD, by genomic, transcriptomic and functional assays.
Secondly, we re-assessed the available model system for identification of chromosome 11 tumour
suppressor genes, i.e. an 11q-deleted neuroblastoma cell line into which chromosome 11 was inserted
leading to initiation of differentiation. The results of these studies are described in Chapter 4.
Chapter 1: Introduction and research objectives 34
CHAPTER 2 Isolation andexpression profiling of normal foetal neuroblasts
Chapter 2 Isolation and expression profiling of normal foetal neuroblasts
1 Introduction 37 2 Results 38
2.1 PAPER 1 38 2.2 PAPER 2 48
3 Discussion 76
Chapter 2: Isolation and expression profiling of normal foetal neuroblasts 36
1 Introduction In most expression profiling studies of human tumours, the normal cells from which tumours are
assumed to arise are used as a reference for data mining, i.e. the search for genes contributing to
cancer development and malignant phenotype. Neuroblastomas originate from undifferentiated
sympathetic nervous system precursor cells. During development, these precursor cells are either
located in the embryonic adrenal medulla or elsewhere in the body (see 2.3.2.2 of Chapter 1) where
they either differentiate to mature neuronal or neuro-endocrine cells or regress. As a consequence,
neuroblastoma progenitor cells are not readily available. The adrenal medullary neuroblastic cells can
clearly be recognised as dense clusters of small round cells with few cytoplasm only in foetal adrenals
between 16 and 26 weeks of gestational age. In order to increase our understanding of the complex
biology of normal development of neuroblastoma progenitors and neuroblastoma oncogenesis, we set
up an ambitious project to microdissect these neuroblastoma precursor cells from foetal adrenal cryo-
sections for subsequent high-density oligonucleotide chip analysis.
Introduction of LCM for expression profiling studies involved two major technical challenges, described
in PAPER 1. First, expression profiling with oligonucleotide chips demands high-quality full-length
RNA. However, staining of cryosections implicates a variety of steps that are prone to induce RNA
degradation. Therefore, an adapted haematoxylin-eosin staining protocol with minimal staining and
washing times was carefully designed guaranteeing good RNA quality. A second requirement is that a
sufficient amount of RNA is obtained for down-stream assays. Although several publications reported
linear RNA amplification yielding sufficient RNA for high-density oligonucleotide arrays without
disturbing the expression pattern, these protocols typically use input of larger RNA amounts (100 ng)
than could be obtained from our starting material (5 to 15 ng) [218-224]. We were able to trace a
protocol that matched our needs with proven robustness in conjunction with the Affymetrix platform for
gene expression analysis (described in [225]).
PAPER 2 describes the results of expression profiling of normal foetal neuroblasts using high-density
oligonucleotide chip analysis. This study provides, for the first time, the complete catalogue of
expressed genes in human neuroblastoma progenitor cells. Data-mining was performed by (1)
comparing expression profiles for known neuronal genes with data obtained from model organisms
and limited data from man, and (2) comparing the data with neuroblastoma tumour gene expression
profiles.
Chapter 2: Isolation and expression profiling of normal foetal neuroblasts 37
2 Results
2.1 PAPER 1
Application of laser capture microdissection in genetic analysis of neuroblastoma and neuroblastoma precursor cells.
De Preter Katleen, Vandesompele Jo, Heimann Pierre, Kockx Mark, Van Gele Mireille, Hoebeeck
Jasmien, De Smet Els, Demarche Martine, Laureys Geneviève, Van Roy Nadine, De Paepe Anne,
Speleman Frank
Cancer Lett 2003 Jul 18;197(1-2):53-61
Chapter 2: Isolation and expression profiling of normal foetal neuroblasts 38
Application of laser capture microdissection in genetic analysis of
neuroblastoma and neuroblastoma precursor cells
Katleen De Pretera, Jo Vandesompelea, Pierre Heimannb, Mark M. Kockxc, Mireille VanGelea, Jasmien Hoebeecka, Els De Smeta, Martine Demarched, Genevieve Laureyse,
Nadine Van Roya, Anne De Paepea, Frank Spelemana,*
aDepartment of Medical Genetics, Ghent University Hospital, 1K5, De Pintelaan 185, B-9000 Ghent, BelgiumbDepartment of Medical Genetics, University Hospital Erasme, Route de Lennik 808, B-1070 Brussels, Belgium
cDepartment of Pathology, Middelheim Hospital, Lindendreef 1, B-2020 Antwerp, BelgiumdDepartment of Pediatric Surgery, Centre Hospitalier Regional de la Citadelle, Boulevard du 12eme Ligne 1, B-4000 Liege, Belgium
eDepartment of Pediatric Oncology, Ghent University Hospital, De Pintelaan 185, B-9000 Ghent, Belgium
Received 7 November 2002; accepted 21 November 2002
Abstract
Recently developed quantitative and high-throughput technologies that allow automated and rapid screening of the whole
genome, transcriptome and proteome have revolutionized the field of cancer genetics. At the same time, new challenges are
met, e.g. the need for improved data analysis and standardization of tumor sample handling. Even if these issues are resolved, an
‘old’ problem in genetic tumor analysis remains, i.e. contamination of tumor samples by stromal and surrounding normal cells.
To overcome this obstacle, laser capture microdissection (LCM) has been developed in order to procure the cells of interest
from stained tissue sections with retention of morphology. In this review we describe the possible down-stream applications of
LCM in the genetic analysis of neuroblastoma (NB). Special focus is given to MYCN copy number determination using real-
time quantitative polymerase chain reaction (Q-PCR), analysis of 1p-, 3p- and 11q-deletions using loss of heterozygosity
analysis and Q-PCR expression analysis of microdissected normal neuroblast cells and NB cells.
q 2003 Elsevier Science Ireland Ltd. All rights reserved.
Keywords: Neuroblastoma; Neuroblast; Amplification; Real-time quantitative polymerase chain reaction; Loss of heterozygosity; Microarray;
Comparative genomic hybridization; Microdissection; Intratumoral heterogeneity; MYCN; 1p; 3p; 11q; Deletion
1. Introduction
In the past decade, new methods for quantitative
high-throughput analysis of genes, transcripts and
proteins have been introduced and applied in the field
of cancer genetics. It has been demonstrated that
genome wide detection of DNA low copy number
changes is feasible using comparative genomic
hybridization (CGH) arrays [1,2]. At the mRNA
level, gene expression profiling has become feasible
through the introduction of cDNA [3] and oligonu-
cleotide microarrays [4], which allow simultaneous
0304-3835/03/$ - see front matter q 2003 Elsevier Science Ireland Ltd. All rights reserved.
doi:10.1016/S0304-3835(03)00084-3
Cancer Letters 197 (2003) 53–61
www.elsevier.com/locate/canlet
* Corresponding author. Tel.: þ32-9-2402451; fax: þ32-9-
2404970.
E-mail address: [email protected] (F. Speleman).
Paper 1 39
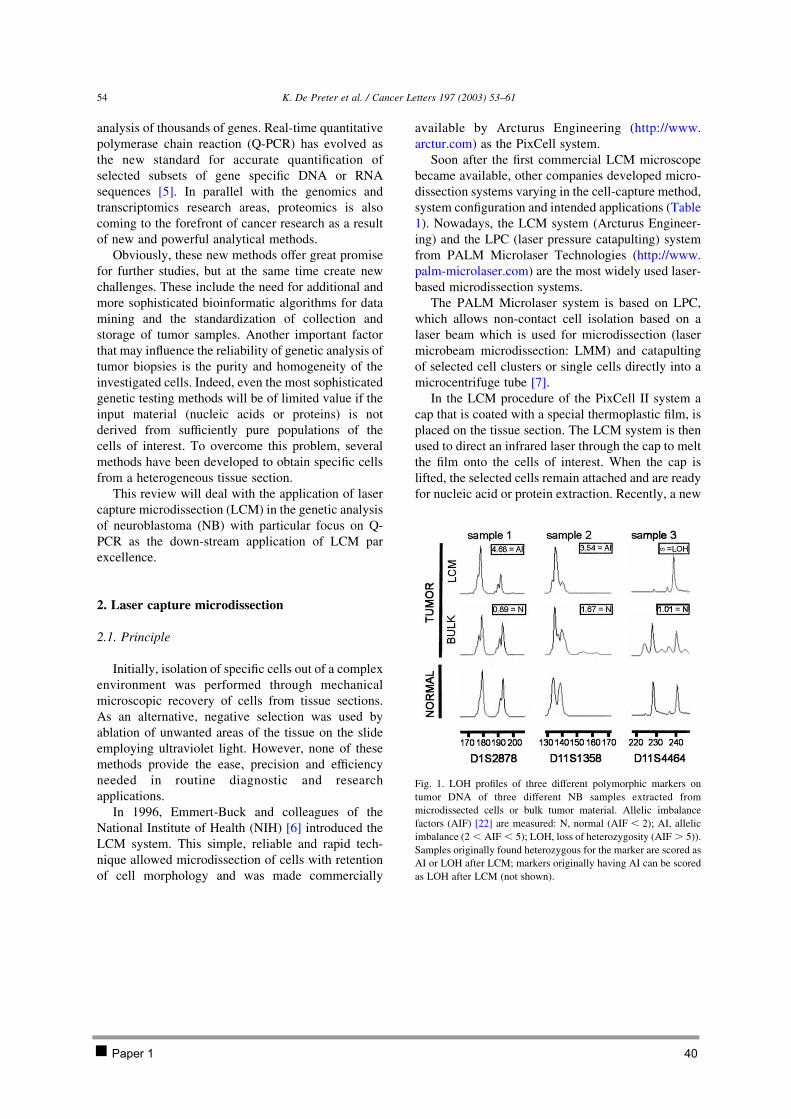
analysis of thousands of genes. Real-time quantitative
polymerase chain reaction (Q-PCR) has evolved as
the new standard for accurate quantification of
selected subsets of gene specific DNA or RNA
sequences [5]. In parallel with the genomics and
transcriptomics research areas, proteomics is also
coming to the forefront of cancer research as a result
of new and powerful analytical methods.
Obviously, these new methods offer great promise
for further studies, but at the same time create new
challenges. These include the need for additional and
more sophisticated bioinformatic algorithms for data
mining and the standardization of collection and
storage of tumor samples. Another important factor
that may influence the reliability of genetic analysis of
tumor biopsies is the purity and homogeneity of the
investigated cells. Indeed, even the most sophisticated
genetic testing methods will be of limited value if the
input material (nucleic acids or proteins) is not
derived from sufficiently pure populations of the
cells of interest. To overcome this problem, several
methods have been developed to obtain specific cells
from a heterogeneous tissue section.
This review will deal with the application of laser
capture microdissection (LCM) in the genetic analysis
of neuroblastoma (NB) with particular focus on Q-
PCR as the down-stream application of LCM par
excellence.
2. Laser capture microdissection
2.1. Principle
Initially, isolation of specific cells out of a complex
environment was performed through mechanical
microscopic recovery of cells from tissue sections.
As an alternative, negative selection was used by
ablation of unwanted areas of the tissue on the slide
employing ultraviolet light. However, none of these
methods provide the ease, precision and efficiency
needed in routine diagnostic and research
applications.
In 1996, Emmert-Buck and colleagues of the
National Institute of Health (NIH) [6] introduced the
LCM system. This simple, reliable and rapid tech-
nique allowed microdissection of cells with retention
of cell morphology and was made commercially
available by Arcturus Engineering (http://www.
arctur.com) as the PixCell system.
Soon after the first commercial LCM microscope
became available, other companies developed micro-
dissection systems varying in the cell-capture method,
system configuration and intended applications (Table
1). Nowadays, the LCM system (Arcturus Engineer-
ing) and the LPC (laser pressure catapulting) system
from PALM Microlaser Technologies (http://www.
palm-microlaser.com) are the most widely used laser-
based microdissection systems.
The PALM Microlaser system is based on LPC,
which allows non-contact cell isolation based on a
laser beam which is used for microdissection (laser
microbeam microdissection: LMM) and catapulting
of selected cell clusters or single cells directly into a
microcentrifuge tube [7].
In the LCM procedure of the PixCell II system a
cap that is coated with a special thermoplastic film, is
placed on the tissue section. The LCM system is then
used to direct an infrared laser through the cap to melt
the film onto the cells of interest. When the cap is
lifted, the selected cells remain attached and are ready
for nucleic acid or protein extraction. Recently, a new
Fig. 1. LOH profiles of three different polymorphic markers on
tumor DNA of three different NB samples extracted from
microdissected cells or bulk tumor material. Allelic imbalance
factors (AIF) [22] are measured: N, normal (AIF , 2); AI, allelic
imbalance (2 , AIF , 5); LOH, loss of heterozygosity (AIF . 5)).
Samples originally found heterozygous for the marker are scored as
AI or LOH after LCM; markers originally having AI can be scored
as LOH after LCM (not shown).
K. De Preter et al. / Cancer Letters 197 (2003) 53–6154
Paper 1 40
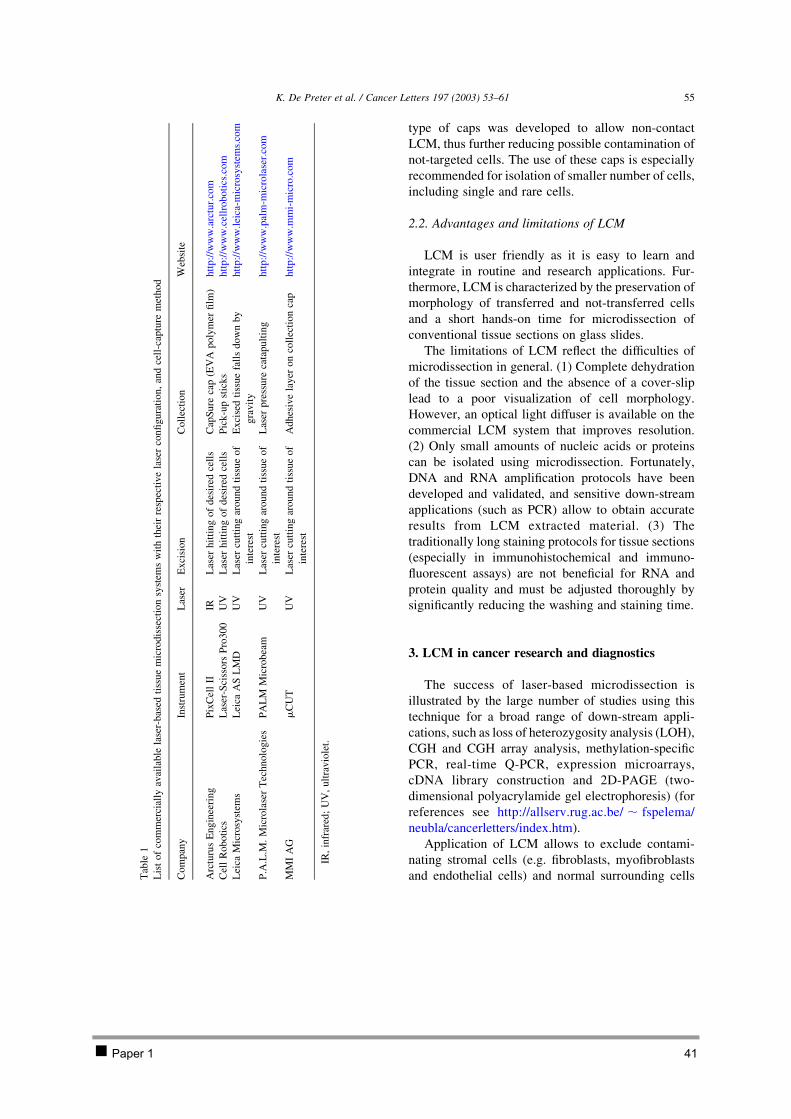
type of caps was developed to allow non-contact
LCM, thus further reducing possible contamination of
not-targeted cells. The use of these caps is especially
recommended for isolation of smaller number of cells,
including single and rare cells.
2.2. Advantages and limitations of LCM
LCM is user friendly as it is easy to learn and
integrate in routine and research applications. Fur-
thermore, LCM is characterized by the preservation of
morphology of transferred and not-transferred cells
and a short hands-on time for microdissection of
conventional tissue sections on glass slides.
The limitations of LCM reflect the difficulties of
microdissection in general. (1) Complete dehydration
of the tissue section and the absence of a cover-slip
lead to a poor visualization of cell morphology.
However, an optical light diffuser is available on the
commercial LCM system that improves resolution.
(2) Only small amounts of nucleic acids or proteins
can be isolated using microdissection. Fortunately,
DNA and RNA amplification protocols have been
developed and validated, and sensitive down-stream
applications (such as PCR) allow to obtain accurate
results from LCM extracted material. (3) The
traditionally long staining protocols for tissue sections
(especially in immunohistochemical and immuno-
fluorescent assays) are not beneficial for RNA and
protein quality and must be adjusted thoroughly by
significantly reducing the washing and staining time.
3. LCM in cancer research and diagnostics
The success of laser-based microdissection is
illustrated by the large number of studies using this
technique for a broad range of down-stream appli-
cations, such as loss of heterozygosity analysis (LOH),
CGH and CGH array analysis, methylation-specific
PCR, real-time Q-PCR, expression microarrays,
cDNA library construction and 2D-PAGE (two-
dimensional polyacrylamide gel electrophoresis) (for
references see http://allserv.rug.ac.be/ , fspelema/
neubla/cancerletters/index.htm).
Application of LCM allows to exclude contami-
nating stromal cells (e.g. fibroblasts, myofibroblasts
and endothelial cells) and normal surrounding cellsTab
le1
Lis
to
fco
mm
erci
ally
avai
lab
lela
ser-
bas
edti
ssu
em
icro
dis
sect
ion
syst
ems
wit
hth
eir
resp
ecti
ve
lase
rco
nfi
gura
tion,
and
cell
-cap
ture
met
hod
Com
pan
yIn
stru
men
tL
aser
Exci
sion
Coll
ecti
on
Web
site
Arc
turu
sE
ng
inee
rin
gP
ixC
ell
IIIR
Las
erh
itti
ng
of
des
ired
cell
sC
apS
ure
cap
(EV
Ap
oly
mer
film
)htt
p:/
/ww
w.a
rctu
r.co
m
Cel
lR
ob
oti
csL
aser
-Sci
sso
rsP
ro30
0U
VL
aser
hit
tin
go
fd
esir
edce
lls
Pic
k-u
pst
ick
shtt
p:/
/ww
w.c
ellr
oboti
cs.c
om
Lei
caM
icro
syst
ems
Lei
caA
SL
MD
UV
Las
ercu
ttin
gar
ound
tiss
ue
of
inte
rest
Ex
cise
dti
ssu
efa
lls
do
wn
by
gra
vit
y
htt
p:/
/ww
w.l
eica
-mic
rosy
stem
s.co
m
P.A
.L.M
.M
icro
lase
rT
ech
nolo
gie
sP
AL
MM
icro
bea
mU
VL
aser
cutt
ing
aro
un
dti
ssu
eo
f
inte
rest
Las
erp
ress
ure
cata
pu
ltin
gh
ttp
://w
ww
.pal
m-m
icro
lase
r.co
m
MM
IA
Gm
CU
TU
VL
aser
cutt
ing
aro
un
dti
ssu
eo
f
inte
rest
Ad
hes
ive
lay
ero
nco
llec
tio
nca
ph
ttp
://w
ww
.mm
i-m
icro
.co
m
IR,
infr
ared
;U
V,
ult
rav
iole
t.
K. De Preter et al. / Cancer Letters 197 (2003) 53–61 55
Paper 1 41
from the analysis. In addition, intratumoral hetero-
geneity can be studied.
3.1. Gene copy number changes in neuroblastoma
It is well known that the clinical course of NB is
highly variable ranging from disseminated disease to
spontaneous regression. Consequently, many studies
aimed at identification of the clinical and biological
parameters, which accurately predict outcome in NB
patients. Currently, age at diagnosis, tumor stage,
DNA-index, amplification of the proto-oncogene
MYCN and 17q-gain are the most important risk
indicators [8]. Depending on the status of the genetic
parameters, different treatment modalities are chosen.
In view of the importance of accurate assessment of
these biological parameters, a recent quality control
study of the SIOP Europe Neuroblastoma Biology
Group recommended to investigate MYCN amplifica-
tion and 1p-deletion using a second independent
technique in parallel with fluorescence in situ
hybridization (FISH) (Ambros et al., submitted).
3.1.1. PCR-based down-stream applications
3.1.1.1. Quantification of MYCN copy number. In
parallel with FISH analysis, our group developed a Q-
PCR assay as an alternative for Southern blot analysis
(SB) [9]. Q-PCR offers major advantages compared to
conventional methods such as SB and former PCR-
based quantification strategies, such as a large
dynamic range of quantification, the exclusion of
post-PCR manipulations, the possibility to perform
the assay on only minimal amounts of tumor material
(such as needle biopsies), the speed and the high-
throughput capacity (e.g. for retrospective studies on
many samples). We have developed a Q-PCR assay
based on two different detection chemistries (i.e.
SYBR Green I and TaqMan hydrolysis probe). The
high accuracy of our assay for the detection of MYCN
copy numbers was illustrated by the possibility to
detect MYCN single gene copy changes as demon-
strated in DNA samples from patients with a
constitutional 2p-deletion or duplication. For this
purpose, choice of primers and control genes (BCMA
and SDC4, on chromosomal regions 16p and 20q
rarely showing genetic abnormalities in NB [10]) was
shown to be critical. Subsequent analysis of 175 NB
samples with known MYCN status yielded highly
concordant results with previous FISH and SB data.
The sensitivity of the Q-PCR assay for detection of
MYCN amplification was illustrated by the finding of a
positive result in a tumor, which was assessed as a
case with MYCN single copy by initial FISH analysis.
Upon re-evaluation of the FISH slide, a few cells with
MYCN amplification restricted to one particular area
of the slide were detected. However, the Q-PCR
results for this sample were near the threshold value
for amplification. Therefore, DNA extracted from
multiple samples of microdissected material is pre-
ferably used in the Q-PCR assay for detection of
MYCN copy number changes in tumors containing a
mixture of cells or revealing intratumoral heterogen-
eity [11,12].
An ordinary haematoxylin and eosin (H&E) stain-
ing of archival paraffin sections or cryo-sections of NB
tumors with subsequent dehydration steps is sufficient
to recognize the NB cells to be microdissected. The
need for only minimal amounts of input DNA (no more
than 100 pg) makes the Q-PCR assay particularly
compatible with LCM. A detailed protocol can be
found on our website (allserv.rug.ac.be/, fspelema/
neubla/cancerletters/index.htm). Starting from archi-
val paraffin or freshly prepared cryo-sections of NB
samples, we were able to perform accurate and
sensitive MYCN copy number determination on the
microdissected material (unpublished data).
3.1.1.2. Detection of 1p-, 3p- and 11q-deletion. Loss
of 1p, 3p and 11q are important recurrent changes in
NB and the status of these chromosome regions may
be relevant for clinical study protocols or for the
genetic classification of tumor samples, e.g. in the
context of gene expression profiling studies. Although
detection of deletions is straightforward by FISH,
combination with LOH analysis may be required in
order to determine if one of both parental alleles is
effectively deleted. This may be the case when for a
given chromosome three copies are present of which
one is partly deleted. In contrast to FISH, however,
LOH studies may be hampered by the presence of
contaminating cells or clonal variation. Previous
studies [13] and results presented here show that
LCM improves the LOH sensitivity. Measuring the
intensity of the allelic decrease, it was shown that the
mean decrease of the lost allele is 34% using whole
K. De Preter et al. / Cancer Letters 197 (2003) 53–6156
Paper 1 42
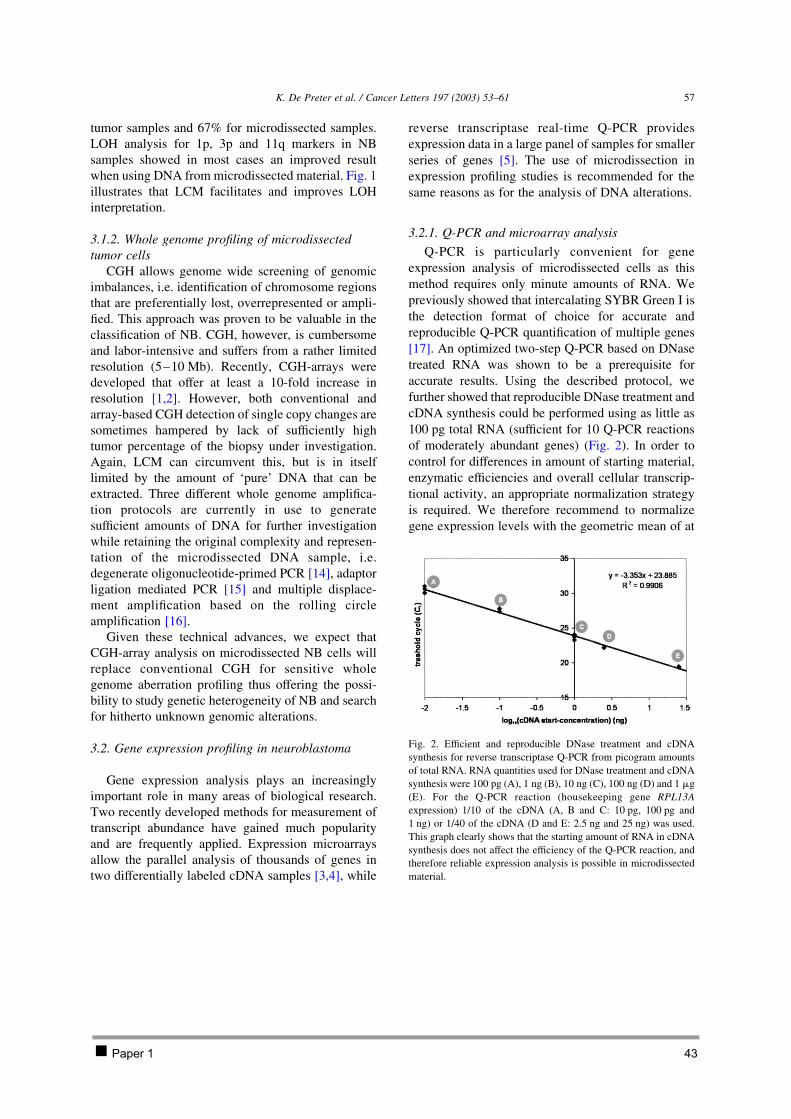
tumor samples and 67% for microdissected samples.
LOH analysis for 1p, 3p and 11q markers in NB
samples showed in most cases an improved result
when using DNA from microdissected material. Fig. 1
illustrates that LCM facilitates and improves LOH
interpretation.
3.1.2. Whole genome profiling of microdissected
tumor cells
CGH allows genome wide screening of genomic
imbalances, i.e. identification of chromosome regions
that are preferentially lost, overrepresented or ampli-
fied. This approach was proven to be valuable in the
classification of NB. CGH, however, is cumbersome
and labor-intensive and suffers from a rather limited
resolution (5–10 Mb). Recently, CGH-arrays were
developed that offer at least a 10-fold increase in
resolution [1,2]. However, both conventional and
array-based CGH detection of single copy changes are
sometimes hampered by lack of sufficiently high
tumor percentage of the biopsy under investigation.
Again, LCM can circumvent this, but is in itself
limited by the amount of ‘pure’ DNA that can be
extracted. Three different whole genome amplifica-
tion protocols are currently in use to generate
sufficient amounts of DNA for further investigation
while retaining the original complexity and represen-
tation of the microdissected DNA sample, i.e.
degenerate oligonucleotide-primed PCR [14], adaptor
ligation mediated PCR [15] and multiple displace-
ment amplification based on the rolling circle
amplification [16].
Given these technical advances, we expect that
CGH-array analysis on microdissected NB cells will
replace conventional CGH for sensitive whole
genome aberration profiling thus offering the possi-
bility to study genetic heterogeneity of NB and search
for hitherto unknown genomic alterations.
3.2. Gene expression profiling in neuroblastoma
Gene expression analysis plays an increasingly
important role in many areas of biological research.
Two recently developed methods for measurement of
transcript abundance have gained much popularity
and are frequently applied. Expression microarrays
allow the parallel analysis of thousands of genes in
two differentially labeled cDNA samples [3,4], while
reverse transcriptase real-time Q-PCR provides
expression data in a large panel of samples for smaller
series of genes [5]. The use of microdissection in
expression profiling studies is recommended for the
same reasons as for the analysis of DNA alterations.
3.2.1. Q-PCR and microarray analysis
Q-PCR is particularly convenient for gene
expression analysis of microdissected cells as this
method requires only minute amounts of RNA. We
previously showed that intercalating SYBR Green I is
the detection format of choice for accurate and
reproducible Q-PCR quantification of multiple genes
[17]. An optimized two-step Q-PCR based on DNase
treated RNA was shown to be a prerequisite for
accurate results. Using the described protocol, we
further showed that reproducible DNase treatment and
cDNA synthesis could be performed using as little as
100 pg total RNA (sufficient for 10 Q-PCR reactions
of moderately abundant genes) (Fig. 2). In order to
control for differences in amount of starting material,
enzymatic efficiencies and overall cellular transcrip-
tional activity, an appropriate normalization strategy
is required. We therefore recommend to normalize
gene expression levels with the geometric mean of at
Fig. 2. Efficient and reproducible DNase treatment and cDNA
synthesis for reverse transcriptase Q-PCR from picogram amounts
of total RNA. RNA quantities used for DNase treatment and cDNA
synthesis were 100 pg (A), 1 ng (B), 10 ng (C), 100 ng (D) and 1 mg
(E). For the Q-PCR reaction (housekeeping gene RPL13A
expression) 1/10 of the cDNA (A, B and C: 10 pg, 100 pg and
1 ng) or 1/40 of the cDNA (D and E: 2.5 ng and 25 ng) was used.
This graph clearly shows that the starting amount of RNA in cDNA
synthesis does not affect the efficiency of the Q-PCR reaction, and
therefore reliable expression analysis is possible in microdissected
material.
K. De Preter et al. / Cancer Letters 197 (2003) 53–61 57
Paper 1 43
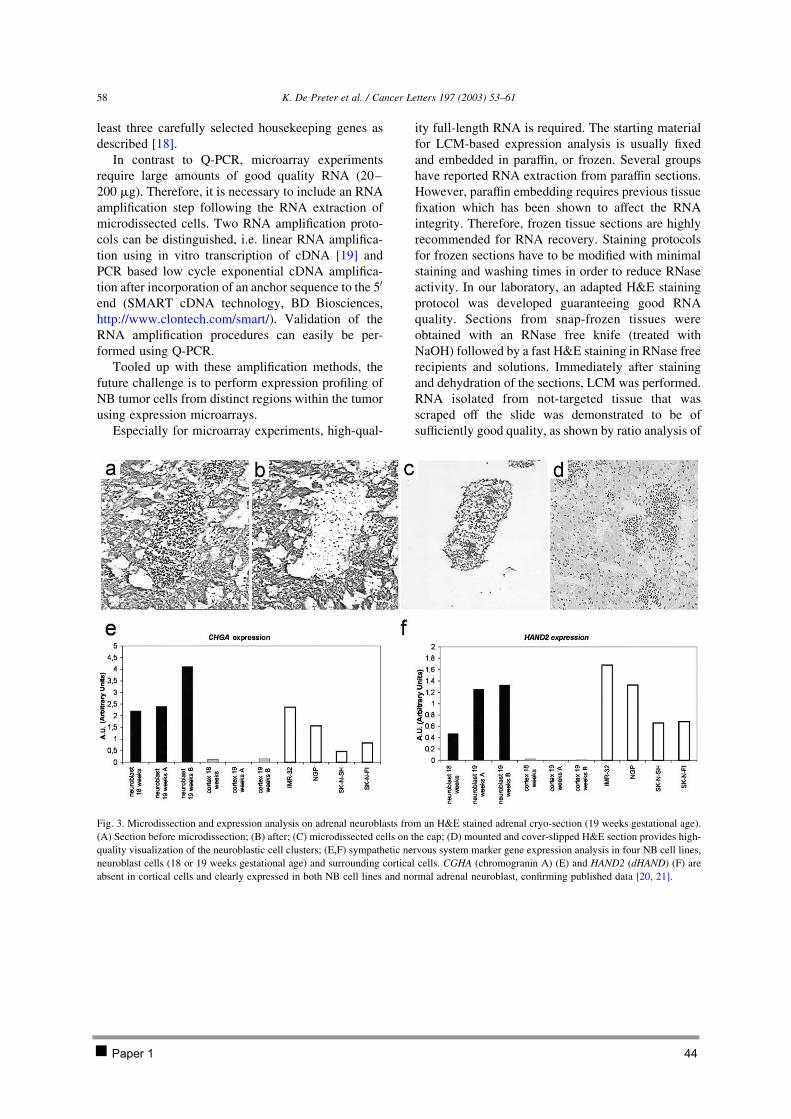
least three carefully selected housekeeping genes as
described [18].
In contrast to Q-PCR, microarray experiments
require large amounts of good quality RNA (20–
200 mg). Therefore, it is necessary to include an RNA
amplification step following the RNA extraction of
microdissected cells. Two RNA amplification proto-
cols can be distinguished, i.e. linear RNA amplifica-
tion using in vitro transcription of cDNA [19] and
PCR based low cycle exponential cDNA amplifica-
tion after incorporation of an anchor sequence to the 50
end (SMART cDNA technology, BD Biosciences,
http://www.clontech.com/smart/). Validation of the
RNA amplification procedures can easily be per-
formed using Q-PCR.
Tooled up with these amplification methods, the
future challenge is to perform expression profiling of
NB tumor cells from distinct regions within the tumor
using expression microarrays.
Especially for microarray experiments, high-qual-
ity full-length RNA is required. The starting material
for LCM-based expression analysis is usually fixed
and embedded in paraffin, or frozen. Several groups
have reported RNA extraction from paraffin sections.
However, paraffin embedding requires previous tissue
fixation which has been shown to affect the RNA
integrity. Therefore, frozen tissue sections are highly
recommended for RNA recovery. Staining protocols
for frozen sections have to be modified with minimal
staining and washing times in order to reduce RNase
activity. In our laboratory, an adapted H&E staining
protocol was developed guaranteeing good RNA
quality. Sections from snap-frozen tissues were
obtained with an RNase free knife (treated with
NaOH) followed by a fast H&E staining in RNase free
recipients and solutions. Immediately after staining
and dehydration of the sections, LCM was performed.
RNA isolated from not-targeted tissue that was
scraped off the slide was demonstrated to be of
sufficiently good quality, as shown by ratio analysis of
Fig. 3. Microdissection and expression analysis on adrenal neuroblasts from an H&E stained adrenal cryo-section (19 weeks gestational age).
(A) Section before microdissection; (B) after; (C) microdissected cells on the cap; (D) mounted and cover-slipped H&E section provides high-
quality visualization of the neuroblastic cell clusters; (E,F) sympathetic nervous system marker gene expression analysis in four NB cell lines,
neuroblast cells (18 or 19 weeks gestational age) and surrounding cortical cells. CGHA (chromogranin A) (E) and HAND2 (dHAND) (F) are
absent in cortical cells and clearly expressed in both NB cell lines and normal adrenal neuroblast, confirming published data [20, 21].
K. De Preter et al. / Cancer Letters 197 (2003) 53–6158
Paper 1 44
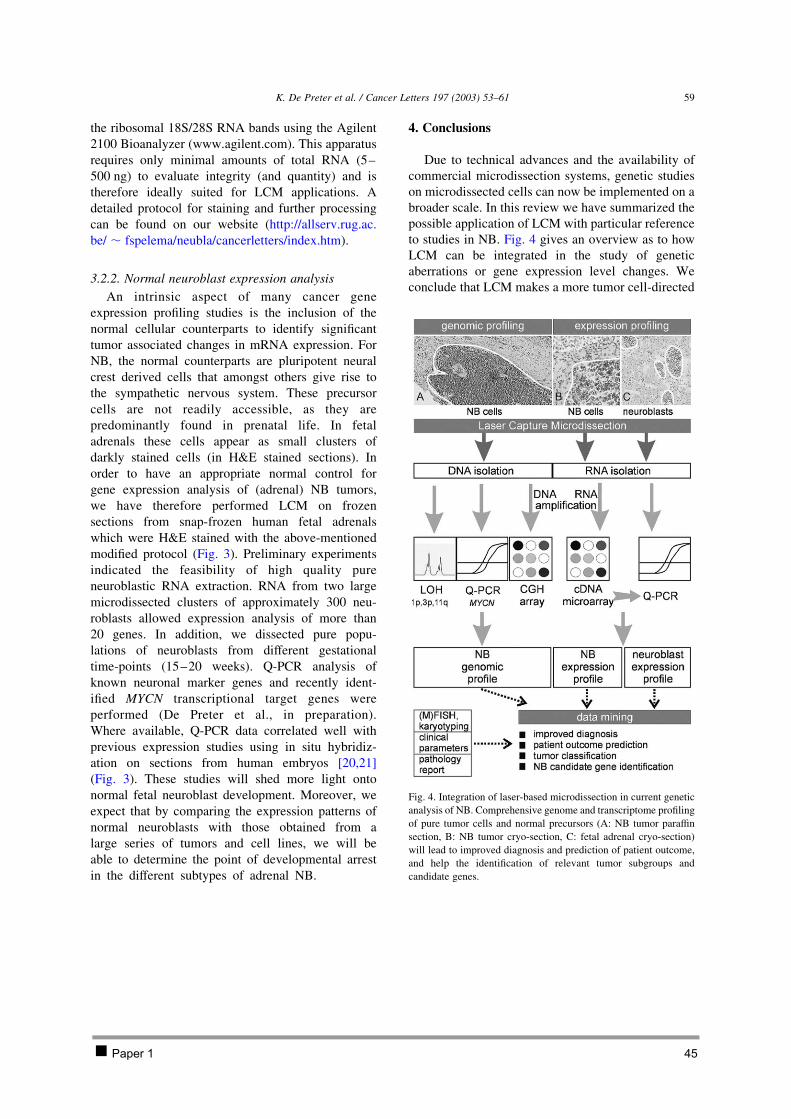
the ribosomal 18S/28S RNA bands using the Agilent
2100 Bioanalyzer (www.agilent.com). This apparatus
requires only minimal amounts of total RNA (5–
500 ng) to evaluate integrity (and quantity) and is
therefore ideally suited for LCM applications. A
detailed protocol for staining and further processing
can be found on our website (http://allserv.rug.ac.
be/ , fspelema/neubla/cancerletters/index.htm).
3.2.2. Normal neuroblast expression analysis
An intrinsic aspect of many cancer gene
expression profiling studies is the inclusion of the
normal cellular counterparts to identify significant
tumor associated changes in mRNA expression. For
NB, the normal counterparts are pluripotent neural
crest derived cells that amongst others give rise to
the sympathetic nervous system. These precursor
cells are not readily accessible, as they are
predominantly found in prenatal life. In fetal
adrenals these cells appear as small clusters of
darkly stained cells (in H&E stained sections). In
order to have an appropriate normal control for
gene expression analysis of (adrenal) NB tumors,
we have therefore performed LCM on frozen
sections from snap-frozen human fetal adrenals
which were H&E stained with the above-mentioned
modified protocol (Fig. 3). Preliminary experiments
indicated the feasibility of high quality pure
neuroblastic RNA extraction. RNA from two large
microdissected clusters of approximately 300 neu-
roblasts allowed expression analysis of more than
20 genes. In addition, we dissected pure popu-
lations of neuroblasts from different gestational
time-points (15–20 weeks). Q-PCR analysis of
known neuronal marker genes and recently ident-
ified MYCN transcriptional target genes were
performed (De Preter et al., in preparation).
Where available, Q-PCR data correlated well with
previous expression studies using in situ hybridiz-
ation on sections from human embryos [20,21]
(Fig. 3). These studies will shed more light onto
normal fetal neuroblast development. Moreover, we
expect that by comparing the expression patterns of
normal neuroblasts with those obtained from a
large series of tumors and cell lines, we will be
able to determine the point of developmental arrest
in the different subtypes of adrenal NB.
4. Conclusions
Due to technical advances and the availability of
commercial microdissection systems, genetic studies
on microdissected cells can now be implemented on a
broader scale. In this review we have summarized the
possible application of LCM with particular reference
to studies in NB. Fig. 4 gives an overview as to how
LCM can be integrated in the study of genetic
aberrations or gene expression level changes. We
conclude that LCM makes a more tumor cell-directed
Fig. 4. Integration of laser-based microdissection in current genetic
analysis of NB. Comprehensive genome and transcriptome profiling
of pure tumor cells and normal precursors (A: NB tumor paraffin
section, B: NB tumor cryo-section, C: fetal adrenal cryo-section)
will lead to improved diagnosis and prediction of patient outcome,
and help the identification of relevant tumor subgroups and
candidate genes.
K. De Preter et al. / Cancer Letters 197 (2003) 53–61 59
Paper 1 45
approach possible in cancer research, in addition to
the frequent use of relatively homogeneous tumor cell
lines.
Acknowledgements
We would like to thank the members of the BENG
group (Belgian Neuroblastoma Group) for providing
us with NB tumor material, Vera Schelfhout and Bart
Lelie (Pathology Department, Ghent University
Hospital, Belgium) for helping us with tumor cell
recognition on H&E stained sections, Ann Neesen and
Indra Deborle (Pneumology Department, Ghent
University Hospital, Belgium) for help with the
preparation of the paraffin, and cryo-sections and
Steven Verberckmoes for help with the LOH analysis.
Katleen De Preter is an aspirant with the Fund for
Scientific Research, Flanders (FWO-Vlaanderen).
Nadine Van Roy is a postdoctoral researcher with
the FWO. The work was also supported by VEO-grant
011V1302, BOF-grant 011F1200 and 011B4300,
GOA-grant 12051203 and FWO-grant G.0028.00.
References
[1] S. Solinas-Toldo, S. Lampel, S. Stilgenbauer, J. Nickolenko,
A. Benner, H. Dohner, T. Cremer, P. Lichter, Matrix-based
comparative genomic hybridization: biochips to screen for
genomic imbalances, Genes Chromosomes Cancer 20 (1997)
399–407.
[2] D. Pinkel, R. Segraves, D. Sudar, S. Clark, I. Poole, D.
Kowbel, C. Collins, W.L. Kuo, C. Chen, Y. Zhai, S.H.
Dairkee, B.M. Ljung, J.W. Gray, D.G. Albertson, High
resolution analysis of DNA copy number variation using
comparative genomic hybridization to microarrays, Nat.
Genet. 20 (1998) 207–211.
[3] M. Schena, D. Shalon, R.W. Davis, P.O. Brown, Quantitative
monitoring of gene expression patterns with a complementary
DNA microarray, Science 270 (1995) 467–470.
[4] D.J. Lockhart, H. Dong, M.C. Byrne, M.T. Follettie, M.V.
Gallo, M.S. Chee, M. Mittmann, C. Wang, M. Kobayashi, H.
Horton, E.L. Brown, Expression monitoring by hybridization
to high-density oligonucleotide arrays, Nat. Biotechnol. 14
(1996) 1675–1680.
[5] S.A. Bustin, Absolute quantification of mRNA using real-time
reverse transcription polymerase chain reaction assays, J. Mol.
Endocrinol. 25 (2000) 169–193.
[6] M.R. Emmert-Buck, R.F. Bonner, P.D. Smith, R.F. Chuaqui,
Z. Zhuang, S.R. Goldstein, R.A. Weiss, L.A. Liotta, Laser
capture microdissection, Science 274 (1996) 998–1001.
[7] K. Schutze, I. Becker, K.F. Becker, S. Thalhammer, R. Stark,
W.M. Heckl, M. Bohm, H. Posl, Cut out or poke in – the key
to the world of single genes: laser micromanipulation as a
valuable tool on the look-out for the origin of disease, Genet.
Anal. 14 (1997) 1–8.
[8] J.M. Maris, K.K. Matthay, Molecular biology of neuroblas-
toma, J. Clin. Oncol. 17 (1999) 2264–2279.
[9] K. De Preter, F. Speleman, V. Combaret, J. Lunec, G. Laureys,
B.H. Eussen, N. Francotte, J. Board, A.D. Pearson, A. De
Paepe, N. Van Roy, J. Vandesompele, Quantification of
MYCN, DDX1, and NAG gene copy number in neuroblas-
toma using a real-time quantitative PCR assay, Mod. Pathol.
15 (2002) 159–166.
[10] J. Vandesompele, F. Speleman, N. Van Roy, G. Laureys, C.
Brinskchmidt, H. Christiansen, F. Lampert, M. Lastowska, N.
Bown, A. Pearson, J.C. Nicholson, F. Ross, V. Combaret, O.
Delattre, B.G. Feuerstein, D. Plantaz, Multicentre analysis of
patterns of DNA gains and losses in 204 neuroblastoma
tumors: how many genetic subgroups are there?, Med. Pediatr.
Oncol. 36 (2001) 5–10.
[11] P.F. Ambros, I.M. Ambros, R. Kerbl, A. Luegmayr, S.
Rumpler, R. Ladenstein, G. Amann, H. Kovar, E. Horcher, B.
De Bernardi, J. Michon, H. Gadner, Intratumoural heterogen-
eity of 1p deletions and MYCN amplification in neuroblas-
tomas, Med. Pediatr. Oncol. 36 (2001) 1–4.
[12] T. Gotoh, H. Sugihara, T. Matsumura, K. Katsura, T.
Takamatsu, T. Sawada, Human neuroblastoma demonstrating
clonal evolution in vivo, Genes Chromosomes Cancer 22
(1998) 42–49.
[13] P. Bertheau, L.F. Plassa, F. Lerebours, A. de Roquancourt, E.
Turpin, R. Lidereau, H. de The, A. Janin, Allelic loss detection
in inflammatory breast cancer: improvement with laser
microdissection, Lab. Invest. 81 (2001) 1397–1402.
[14] H. Telenius, A.H. Pelmear, A. Tunnacliffe, N.P. Carter, A.
Behmel, M.A. Ferguson-Smith, M. Nordenskjold, R. Pfragner,
B.A. Ponder, Cytogenetic analysis by chromosome painting
using DOP-PCR amplified flow-sorted chromosomes, Genes
Chromosomes Cancer 4 (1992) 257–263.
[15] C.A. Klein, O. Schmidt-Kittler, J.A. Schardt, K. Pantel, M.R.
Speicher, G. Riethmuller, Comparative genomic hybridiz-
ation, loss of heterozygosity, and DNA sequence analysis of
single cells, Proc. Natl Acad. Sci. USA 96 (1999) 4494–4499.
[16] F.B. Dean, S. Hosono, L. Fang, X. Wu, A.F. Faruqi, P. Bray-
Ward, Z. Sun, Q. Zong, Y. Du, J. Du, M. Driscoll, W. Song,
S.F. Kingsmore, M. Egholm, R.S. Lasken, Comprehensive
human genome amplification using multiple displacement
amplification, Proc. Natl Acad. Sci. USA 99 (2002)
5261–5266.
[17] J. Vandesompele, A. De Paepe, F. Speleman, Elimination of
primer–dimer artifacts and genomic coamplification using a
two-step SYBR green I real-time RT-PCR, Anal. Biochem.
303 (2002) 95–98.
[18] J. Vandesompele, K. De Preter, F. Pattyn, B. Poppe, N. Van
Roy, A. De Paepe, F. Speleman, Accurate normalization of
real-time quantitative RT-PCR data by geometric averaging of
multiple internal control genes, Genome Biol. 3 (2002)
RESEARCH0034. 1–11.
K. De Preter et al. / Cancer Letters 197 (2003) 53–6160
Paper 1 46

[19] R.N. Van Gelder, M.E. von Zastrow, A. Yool, W.C. Dement,
J.D. Barchas, J.H. Eberwine, Amplified RNA synthesized
from limited quantities of heterogeneous cDNA, Proc. Natl
Acad. Sci. USA 87 (1990) 1663–1667.
[20] M.J. Cooper, G.M. Hutchins, P.S. Cohen, L.J. Helman, R.J.
Mennie, M.A. Israel, Human neuroblastoma tumor cell lines
correspond to the arrested differentiation of chromaffin adrenal
medullary neuroblasts, Cell Growth Differ. 1 (1990) 149–159.
[21] C. Gestblom, A. Grynfeld, I. Ora, E. Ortoft, C. Larsson, H.
Axelson, B. Sandstedt, P. Cserjesi, E.N. Olson, S. Pahlman,
The basic helix– loop–helix transcription factor dHAND, a
marker gene for the developing human sympathetic nervous
system, is expressed in both high- and low-stage neuroblas-
tomas, Lab. Invest. 79 (1999) 67–79.
[22] P. Devilee, A.M. Cleton-Jansen, C.J. Cornelisse, Ever since
Knudson, Trends Genet. 17 (2001) 569–573.
K. De Preter et al. / Cancer Letters 197 (2003) 53–61 61
Paper 1 47
2.2 PAPER 2
Expression profiling of foetal adrenal neuroblasts: a resource for the study of sympathoadrenal biogenesis and neuroblastoma pathogenesis
De Preter Katleen, Vandesompele Jo, Heimann Pierre, Yigit Nurten, Benoit Yves, De Paepe Anne,
Laureys Geneviève, Speleman Frank
In preparation
Chapter 2: Isolation and expression profiling of normal foetal neuroblasts 48
Expression profiling of foetal adrenal neuroblasts: a resource for the study of sympathoadrenal biogenesis and neuroblastoma pathogenesis
De Preter Katleen, Vandesompele Jo, Heimann Pierre, Yigit Nurten, Benoit Yves, De Paepe Anne,
Laureys Geneviève, Speleman Frank
In preparation
Abstract
Gene expression studies on normal neuroblast cells in the human developing foetus have been
performed for only a limited number of genes. Although these observations are in line with studies
performed in model organisms, our understanding of the transcriptional program of these human cells
has remained largely unexplored. As part of our expression profiling studies on neuroblastoma, a
paediatric embryonic tumour originating from neuroblasts, we set up a strategy in order to perform
whole transcriptome profiling of these progenitor cells. To this purpose we applied an optimised
protocol for collecting foetal neuroblasts yielding sufficient amounts of high quality RNA for subsequent
two-round amplification and expression analysis on whole genome oligonucleotide chips. Analysis of
selected technical and biological parameters allowed to validate the gene expression signature of
neuroblast cells as reliable, accurate and representative. We anticipate that the neuroblast
transcriptome profile will serve as an extremely valuable resource for the study of sympathoadrenal
biogenesis and neuroblastoma pathogenesis.
Paper 2 49
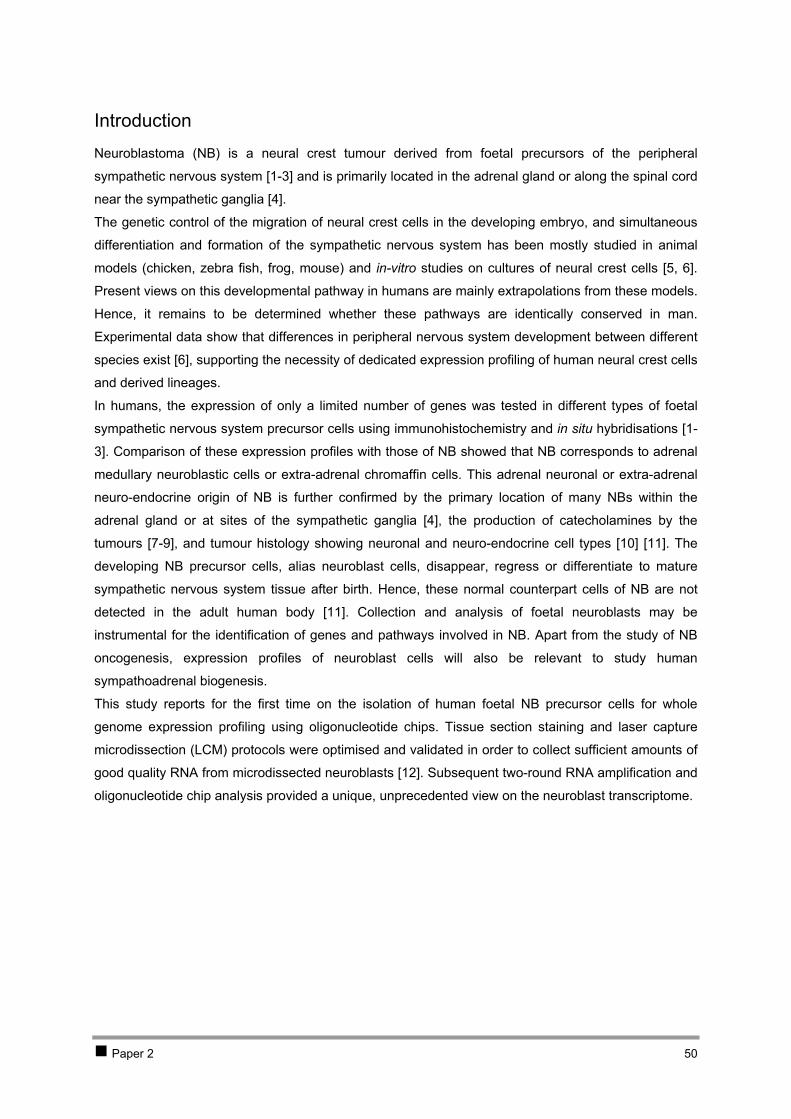
Introduction
Neuroblastoma (NB) is a neural crest tumour derived from foetal precursors of the peripheral
sympathetic nervous system [1-3] and is primarily located in the adrenal gland or along the spinal cord
near the sympathetic ganglia [4].
The genetic control of the migration of neural crest cells in the developing embryo, and simultaneous
differentiation and formation of the sympathetic nervous system has been mostly studied in animal
models (chicken, zebra fish, frog, mouse) and in-vitro studies on cultures of neural crest cells [5, 6].
Present views on this developmental pathway in humans are mainly extrapolations from these models.
Hence, it remains to be determined whether these pathways are identically conserved in man.
Experimental data show that differences in peripheral nervous system development between different
species exist [6], supporting the necessity of dedicated expression profiling of human neural crest cells
and derived lineages.
In humans, the expression of only a limited number of genes was tested in different types of foetal
sympathetic nervous system precursor cells using immunohistochemistry and in situ hybridisations [1-
3]. Comparison of these expression profiles with those of NB showed that NB corresponds to adrenal
medullary neuroblastic cells or extra-adrenal chromaffin cells. This adrenal neuronal or extra-adrenal
neuro-endocrine origin of NB is further confirmed by the primary location of many NBs within the
adrenal gland or at sites of the sympathetic ganglia [4], the production of catecholamines by the
tumours [7-9], and tumour histology showing neuronal and neuro-endocrine cell types [10] [11]. The
developing NB precursor cells, alias neuroblast cells, disappear, regress or differentiate to mature
sympathetic nervous system tissue after birth. Hence, these normal counterpart cells of NB are not
detected in the adult human body [11]. Collection and analysis of foetal neuroblasts may be
instrumental for the identification of genes and pathways involved in NB. Apart from the study of NB
oncogenesis, expression profiles of neuroblast cells will also be relevant to study human
sympathoadrenal biogenesis.
This study reports for the first time on the isolation of human foetal NB precursor cells for whole
genome expression profiling using oligonucleotide chips. Tissue section staining and laser capture
microdissection (LCM) protocols were optimised and validated in order to collect sufficient amounts of
good quality RNA from microdissected neuroblasts [12]. Subsequent two-round RNA amplification and
oligonucleotide chip analysis provided a unique, unprecedented view on the neuroblast transcriptome.
Paper 2 50
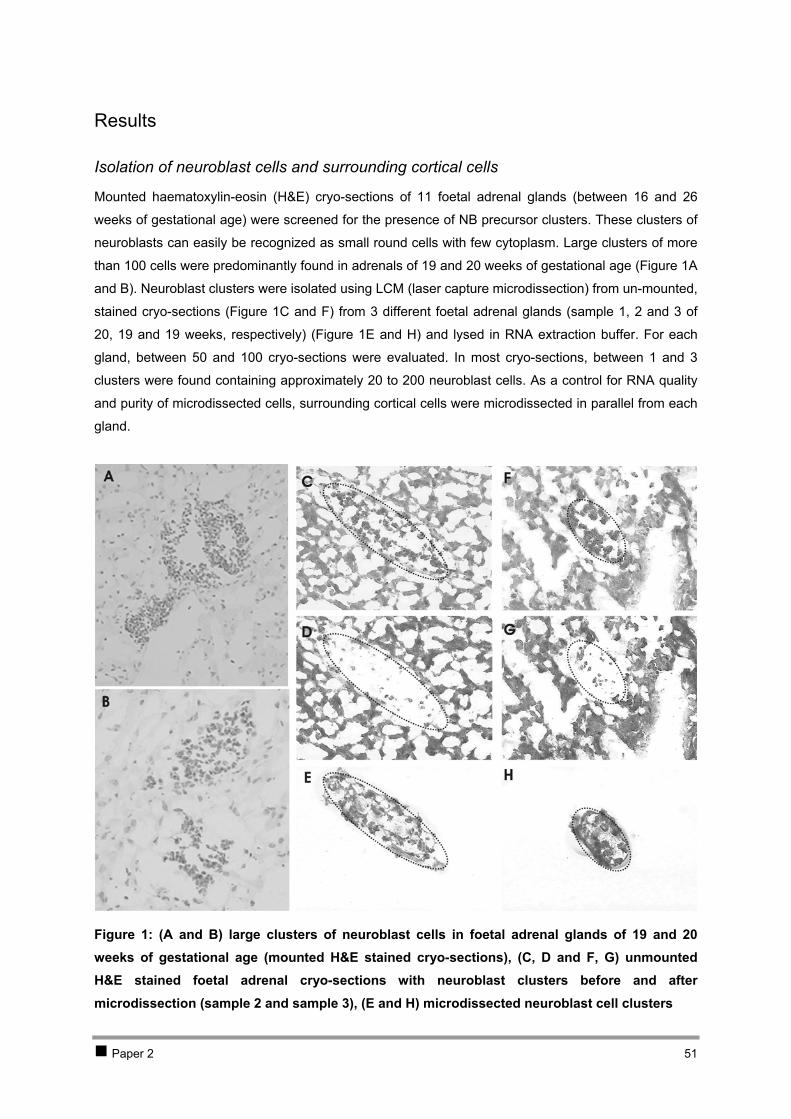
Results
Isolation of neuroblast cells and surrounding cortical cells
Mounted haematoxylin-eosin (H&E) cryo-sections of 11 foetal adrenal glands (between 16 and 26
weeks of gestational age) were screened for the presence of NB precursor clusters. These clusters of
neuroblasts can easily be recognized as small round cells with few cytoplasm. Large clusters of more
than 100 cells were predominantly found in adrenals of 19 and 20 weeks of gestational age (Figure 1A
and B). Neuroblast clusters were isolated using LCM (laser capture microdissection) from un-mounted,
stained cryo-sections (Figure 1C and F) from 3 different foetal adrenal glands (sample 1, 2 and 3 of
20, 19 and 19 weeks, respectively) (Figure 1E and H) and lysed in RNA extraction buffer. For each
gland, between 50 and 100 cryo-sections were evaluated. In most cryo-sections, between 1 and 3
clusters were found containing approximately 20 to 200 neuroblast cells. As a control for RNA quality
and purity of microdissected cells, surrounding cortical cells were microdissected in parallel from each
gland.
Figure 1: (A and B) large clusters of neuroblast cells in foetal adrenal glands of 19 and 20 weeks of gestational age (mounted H&E stained cryo-sections), (C, D and F, G) unmounted H&E stained foetal adrenal cryo-sections with neuroblast clusters before and after microdissection (sample 2 and sample 3), (E and H) microdissected neuroblast cell clusters
Paper 2 51
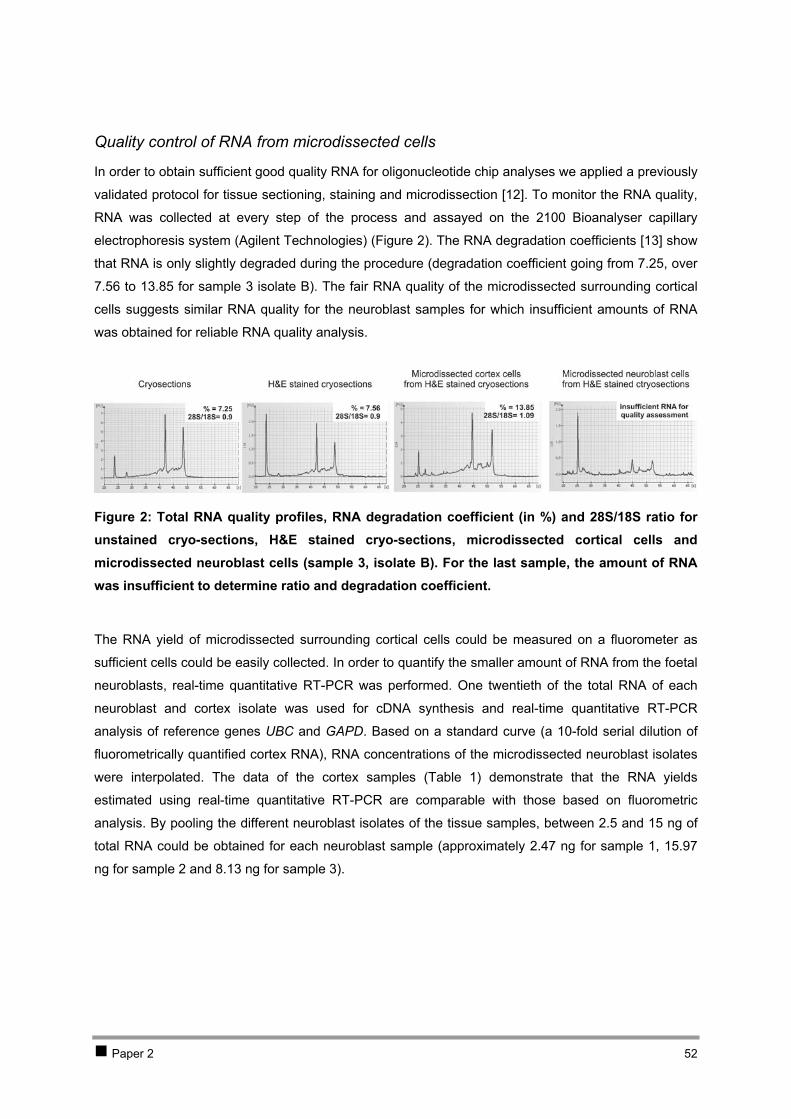
Quality control of RNA from microdissected cells
In order to obtain sufficient good quality RNA for oligonucleotide chip analyses we applied a previously
validated protocol for tissue sectioning, staining and microdissection [12]. To monitor the RNA quality,
RNA was collected at every step of the process and assayed on the 2100 Bioanalyser capillary
electrophoresis system (Agilent Technologies) (Figure 2). The RNA degradation coefficients [13] show
that RNA is only slightly degraded during the procedure (degradation coefficient going from 7.25, over
7.56 to 13.85 for sample 3 isolate B). The fair RNA quality of the microdissected surrounding cortical
cells suggests similar RNA quality for the neuroblast samples for which insufficient amounts of RNA
was obtained for reliable RNA quality analysis.
Figure 2: Total RNA quality profiles, RNA degradation coefficient (in %) and 28S/18S ratio for unstained cryo-sections, H&E stained cryo-sections, microdissected cortical cells and microdissected neuroblast cells (sample 3, isolate B). For the last sample, the amount of RNA was insufficient to determine ratio and degradation coefficient.
The RNA yield of microdissected surrounding cortical cells could be measured on a fluorometer as
sufficient cells could be easily collected. In order to quantify the smaller amount of RNA from the foetal
neuroblasts, real-time quantitative RT-PCR was performed. One twentieth of the total RNA of each
neuroblast and cortex isolate was used for cDNA synthesis and real-time quantitative RT-PCR
analysis of reference genes UBC and GAPD. Based on a standard curve (a 10-fold serial dilution of
fluorometrically quantified cortex RNA), RNA concentrations of the microdissected neuroblast isolates
were interpolated. The data of the cortex samples (Table 1) demonstrate that the RNA yields
estimated using real-time quantitative RT-PCR are comparable with those based on fluorometric
analysis. By pooling the different neuroblast isolates of the tissue samples, between 2.5 and 15 ng of
total RNA could be obtained for each neuroblast sample (approximately 2.47 ng for sample 1, 15.97
ng for sample 2 and 8.13 ng for sample 3).
Paper 2 52
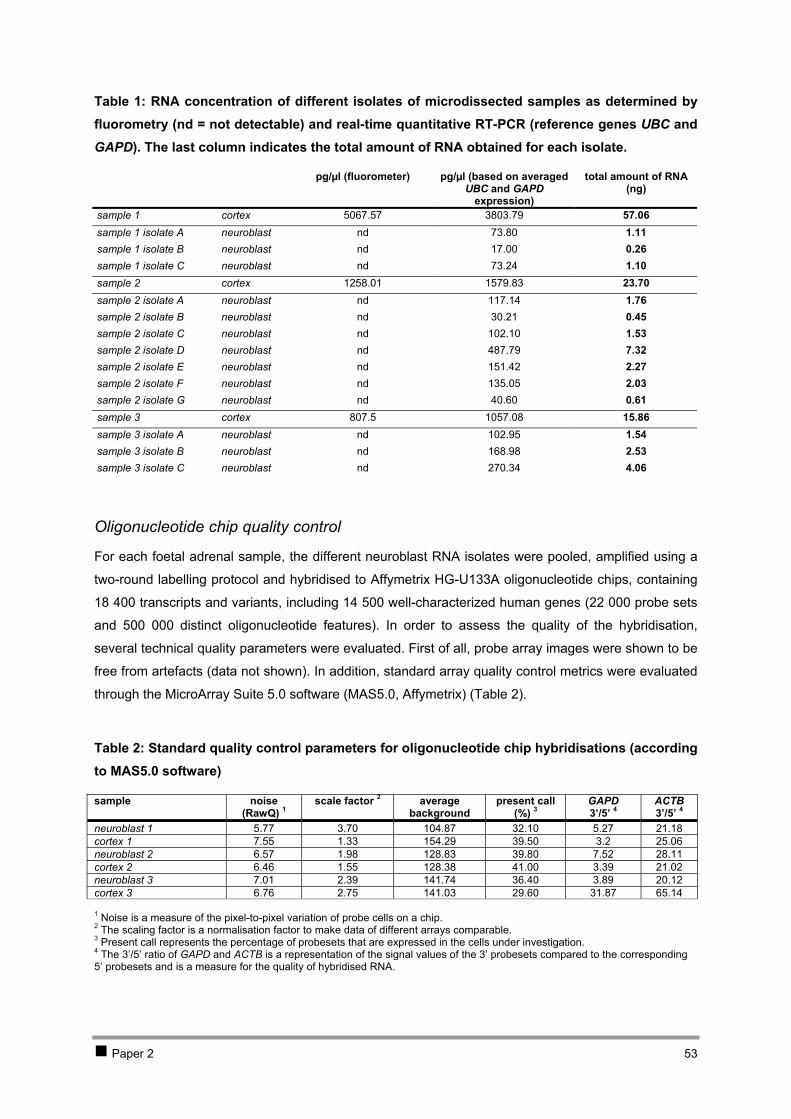
Table 1: RNA concentration of different isolates of microdissected samples as determined by fluorometry (nd = not detectable) and real-time quantitative RT-PCR (reference genes UBC and GAPD). The last column indicates the total amount of RNA obtained for each isolate.
pg/µl (fluorometer) pg/µl (based on averaged UBC and GAPD
expression)
total amount of RNA (ng)
sample 1 cortex 5067.57 3803.79 57.06 sample 1 isolate A neuroblast nd 73.80 1.11 sample 1 isolate B neuroblast nd 17.00 0.26 sample 1 isolate C neuroblast nd 73.24 1.10 sample 2 cortex 1258.01 1579.83 23.70 sample 2 isolate A neuroblast nd 117.14 1.76 sample 2 isolate B neuroblast nd 30.21 0.45 sample 2 isolate C neuroblast nd 102.10 1.53 sample 2 isolate D neuroblast nd 487.79 7.32 sample 2 isolate E neuroblast nd 151.42 2.27 sample 2 isolate F neuroblast nd 135.05 2.03 sample 2 isolate G neuroblast nd 40.60 0.61 sample 3 cortex 807.5 1057.08 15.86 sample 3 isolate A neuroblast nd 102.95 1.54 sample 3 isolate B neuroblast nd 168.98 2.53 sample 3 isolate C neuroblast nd 270.34 4.06
Oligonucleotide chip quality control
For each foetal adrenal sample, the different neuroblast RNA isolates were pooled, amplified using a
two-round labelling protocol and hybridised to Affymetrix HG-U133A oligonucleotide chips, containing
18 400 transcripts and variants, including 14 500 well-characterized human genes (22 000 probe sets
and 500 000 distinct oligonucleotide features). In order to assess the quality of the hybridisation,
several technical quality parameters were evaluated. First of all, probe array images were shown to be
free from artefacts (data not shown). In addition, standard array quality control metrics were evaluated
through the MicroArray Suite 5.0 software (MAS5.0, Affymetrix) (Table 2).
Table 2: Standard quality control parameters for oligonucleotide chip hybridisations (according to MAS5.0 software)
sample noise (RawQ) 1
scale factor 2 average background
present call (%) 3
GAPD 3’/5’ 4
ACTB 3’/5’ 4
neuroblast 1 5.77 3.70 104.87 32.10 5.27 21.18 cortex 1 7.55 1.33 154.29 39.50 3.2 25.06 neuroblast 2 6.57 1.98 128.83 39.80 7.52 28.11 cortex 2 6.46 1.55 128.38 41.00 3.39 21.02 neuroblast 3 7.01 2.39 141.74 36.40 3.89 20.12 cortex 3 6.76 2.75 141.03 29.60 31.87 65.14
1 Noise is a measure of the pixel-to-pixel variation of probe cells on a chip. 2 The scaling factor is a normalisation factor to make data of different arrays comparable. 3 Present call represents the percentage of probesets that are expressed in the cells under investigation. 4 The 3’/5’ ratio of GAPD and ACTB is a representation of the signal values of the 3’ probesets compared to the corresponding 5’ probesets and is a measure for the quality of hybridised RNA.
Paper 2 53

As shown in Table 2, comparable values were obtained for noise, scale factor, average background
and present call among the different chips. The scale factors were within the 3-fold range. However,
the relatively large scale factor for neuroblast 1 may indicate assay variability or sample degradation
leading to data with more noise. The average background values of all arrays were not within the 60-
100 range, but are typically higher after application of the two-round labelling protocol. The relatively
low percentage of present calls and the high 3’/5’ GAPD and ACTB ratios in cortex 3 is a possible
indication of poor sample quality.
Histogram plots generated with the BioConductor (BioC) affy-package [14] (www.bioconductor.org)
indicate that there are no saturated signal intensities, illustrated by the absence of an additional peak
with high intensity (Figure 3A).
Figure 3: Oligonucleotide chip quality control graphs: (A) RNA degradation plot, (B) histogram of the raw logarithmic (base 2) intensity data, (C) boxplot of the raw logarithmic intensity data, and (D) boxplot of the RMA normalised intensity values (BioC affy-package)
Paper 2 54
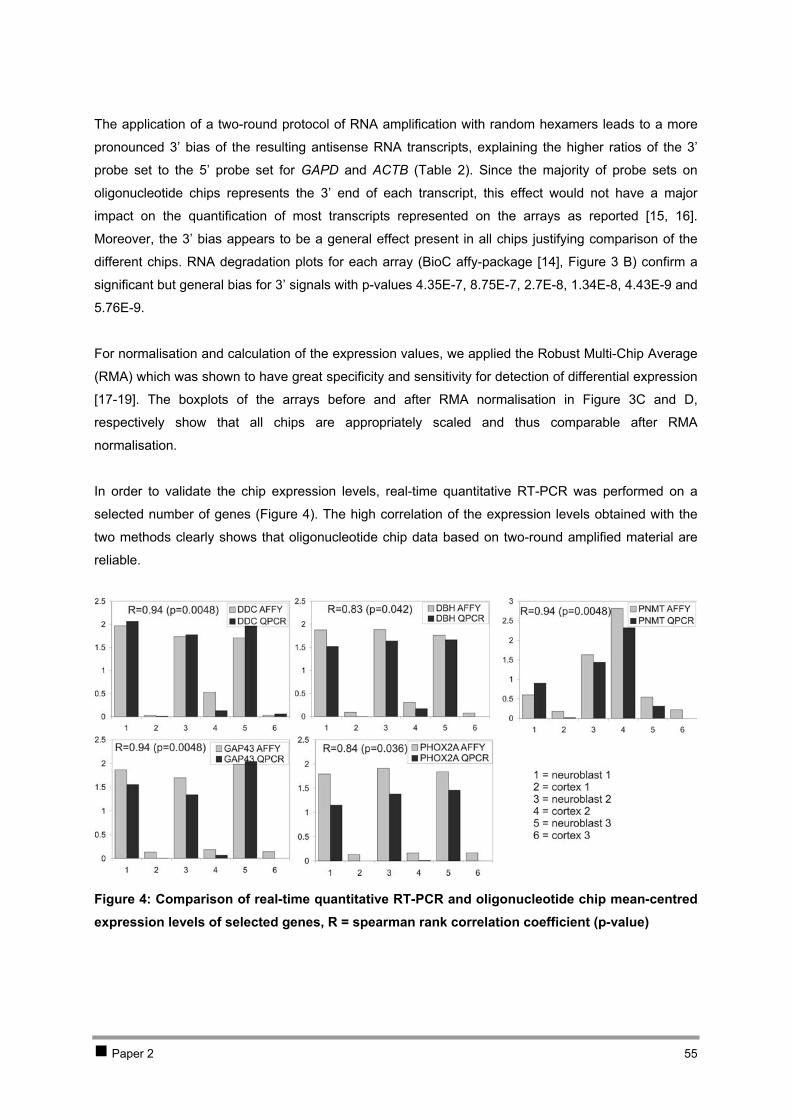
The application of a two-round protocol of RNA amplification with random hexamers leads to a more
pronounced 3’ bias of the resulting antisense RNA transcripts, explaining the higher ratios of the 3’
probe set to the 5’ probe set for GAPD and ACTB ( ). Since the majority of probe sets on
oligonucleotide chips represents the 3’ end of each transcript, this effect would not have a major
impact on the quantification of most transcripts represented on the arrays as reported [15, 16].
Moreover, the 3’ bias appears to be a general effect present in all chips justifying comparison of the
different chips. RNA degradation plots for each array (BioC affy-package [14], Figure 3 B) confirm a
significant but general bias for 3’ signals with p-values 4.35E-7, 8.75E-7, 2.7E-8, 1.34E-8, 4.43E-9 and
5.76E-9.
Table 2
For normalisation and calculation of the expression values, we applied the Robust Multi-Chip Average
(RMA) which was shown to have great specificity and sensitivity for detection of differential expression
[17-19]. The boxplots of the arrays before and after RMA normalisation in Figure 3C and D,
respectively show that all chips are appropriately scaled and thus comparable after RMA
normalisation.
In order to validate the chip expression levels, real-time quantitative RT-PCR was performed on a
selected number of genes (Figure 4). The high correlation of the expression levels obtained with the
two methods clearly shows that oligonucleotide chip data based on two-round amplified material are
reliable.
Figure 4: Comparison of real-time quantitative RT-PCR and oligonucleotide chip mean-centred expression levels of selected genes, R = spearman rank correlation coefficient (p-value)
Paper 2 55
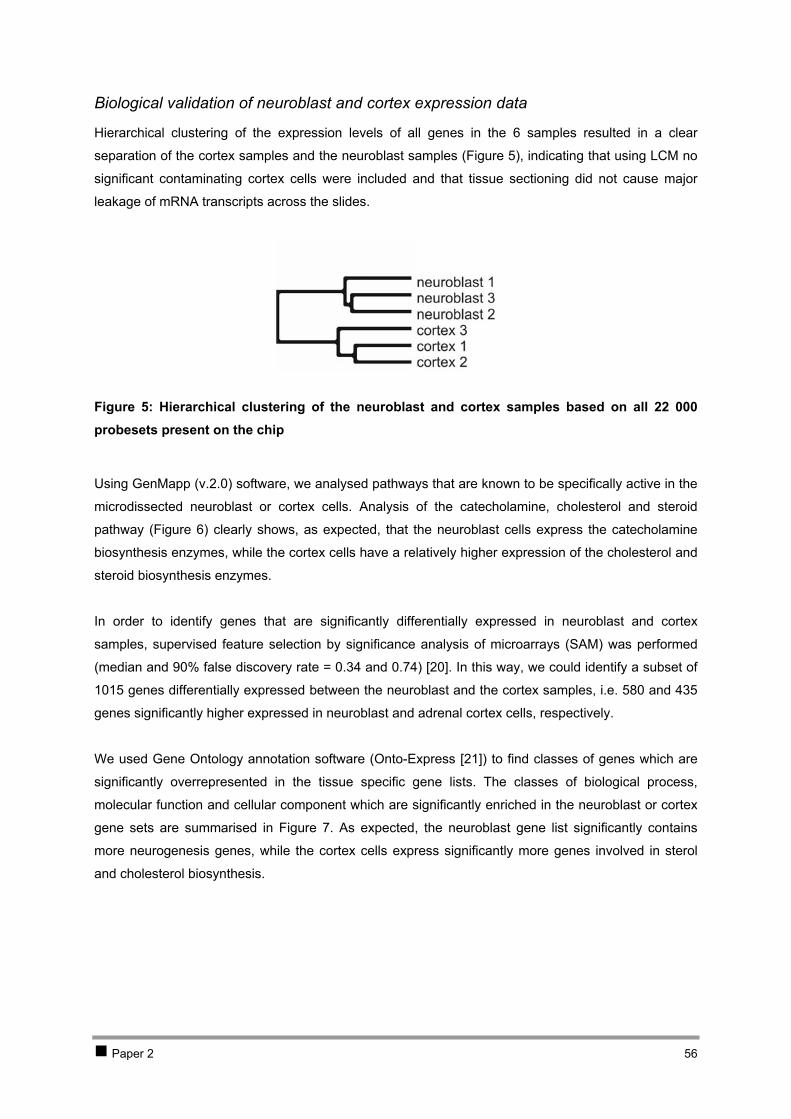
Biological validation of neuroblast and cortex expression data
Hierarchical clustering of the expression levels of all genes in the 6 samples resulted in a clear
separation of the cortex samples and the neuroblast samples ( ), indicating that using LCM no
significant contaminating cortex cells were included and that tissue sectioning did not cause major
leakage of mRNA transcripts across the slides.
Figure 5
Figure 5: Hierarchical clustering of the neuroblast and cortex samples based on all 22 000 probesets present on the chip
Using GenMapp (v.2.0) software, we analysed pathways that are known to be specifically active in the
microdissected neuroblast or cortex cells. Analysis of the catecholamine, cholesterol and steroid
pathway ( ) clearly shows, as expected, that the neuroblast cells express the catecholamine
biosynthesis enzymes, while the cortex cells have a relatively higher expression of the cholesterol and
steroid biosynthesis enzymes.
Figure 6
In order to identify genes that are significantly differentially expressed in neuroblast and cortex
samples, supervised feature selection by significance analysis of microarrays (SAM) was performed
(median and 90% false discovery rate = 0.34 and 0.74) [20]. In this way, we could identify a subset of
1015 genes differentially expressed between the neuroblast and the cortex samples, i.e. 580 and 435
genes significantly higher expressed in neuroblast and adrenal cortex cells, respectively.
We used Gene Ontology annotation software (Onto-Express [21]) to find classes of genes which are
significantly overrepresented in the tissue specific gene lists. The classes of biological process,
molecular function and cellular component which are significantly enriched in the neuroblast or cortex
gene sets are summarised in . As expected, the neuroblast gene list significantly contains
more neurogenesis genes, while the cortex cells express significantly more genes involved in sterol
and cholesterol biosynthesis.
Figure 7
Paper 2 56
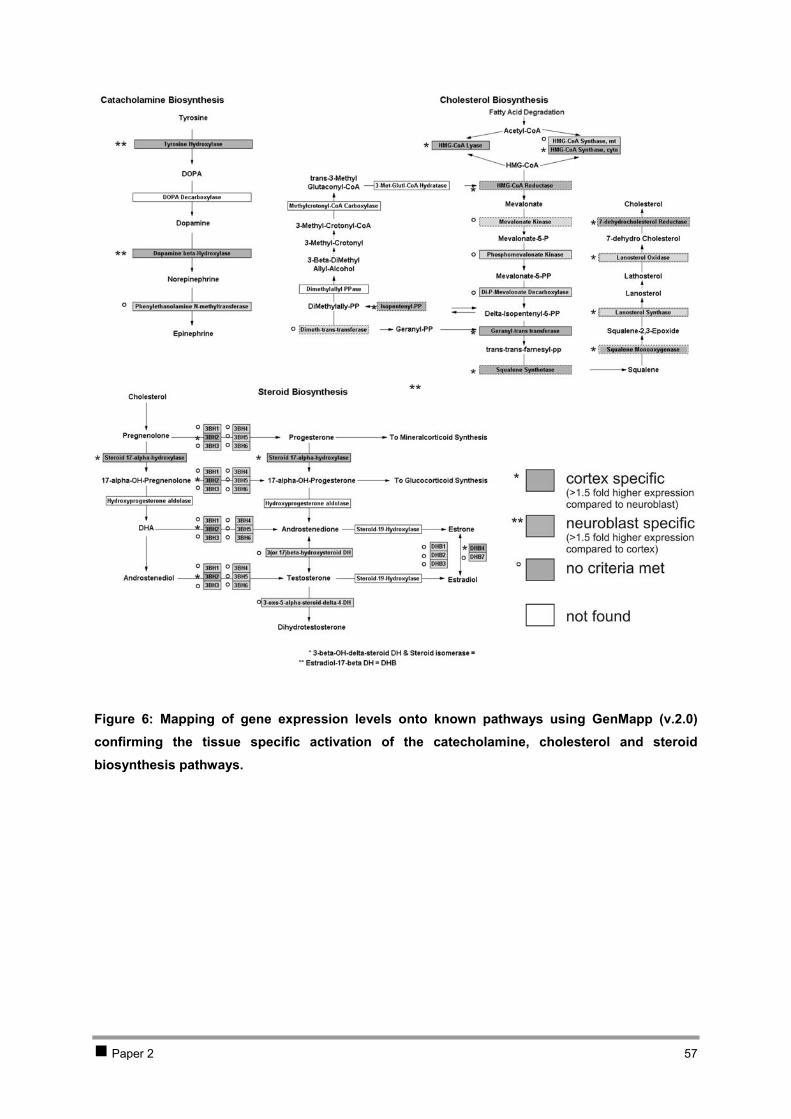
Figure 6: Mapping of gene expression levels onto known pathways using GenMapp (v.2.0) confirming the tissue specific activation of the catecholamine, cholesterol and steroid biosynthesis pathways.
Paper 2 57

Figure 7: Gene Ontology data-mining of 580 neuroblast specific (A, B, C) and 435 cortex specific genes (D, E, F) (determined by SAM analysis) for the biological process (A and D), molecular function (B and E) and cellular component categories (C and F) (with p-value, sidak corrected p-value and the total number of genes). Only categories with corrected p-values smaller than 0.05 are represented in this table. The neurogenesis genes (panel A) are summarised in Table 3.
Paper 2 58
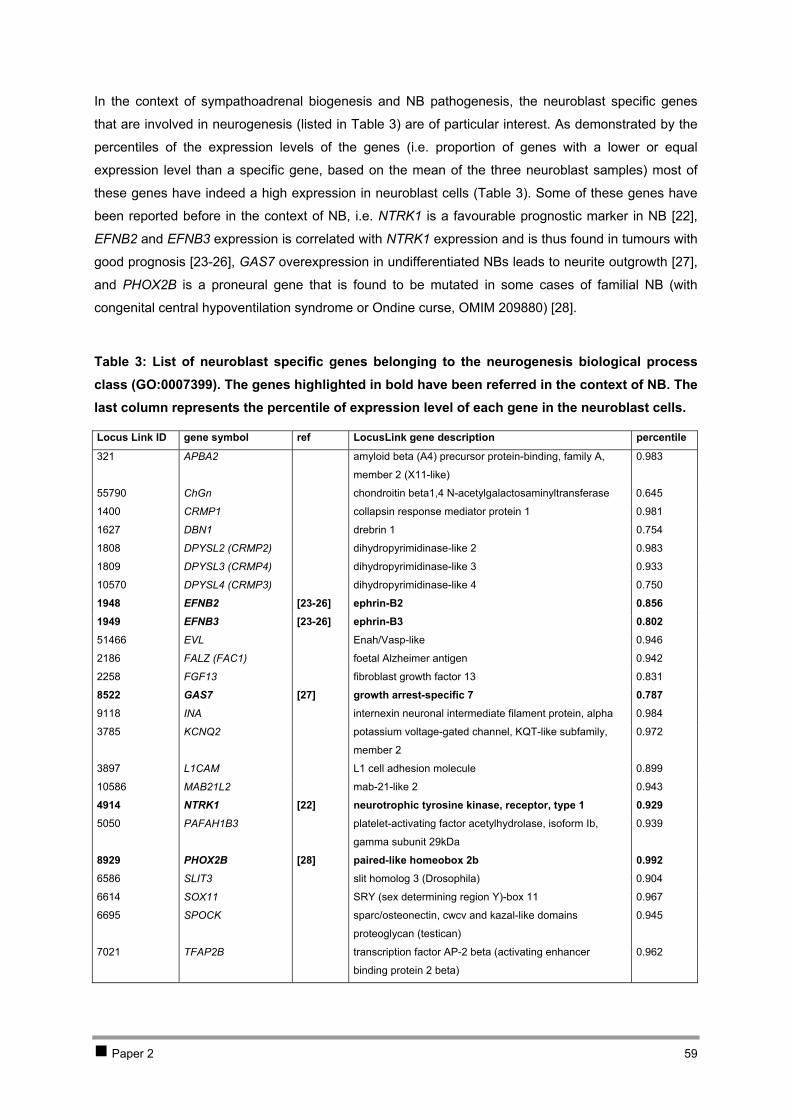
In the context of sympathoadrenal biogenesis and NB pathogenesis, the neuroblast specific genes
that are involved in neurogenesis (listed in Table 3) are of particular interest. As demonstrated by the
percentiles of the expression levels of the genes (i.e. proportion of genes with a lower or equal
expression level than a specific gene, based on the mean of the three neuroblast samples) most of
these genes have indeed a high expression in neuroblast cells (Table 3). Some of these genes have
been reported before in the context of NB, i.e. NTRK1 is a favourable prognostic marker in NB [22],
EFNB2 and EFNB3 expression is correlated with NTRK1 expression and is thus found in tumours with
good prognosis [23-26], GAS7 overexpression in undifferentiated NBs leads to neurite outgrowth [27],
and PHOX2B is a proneural gene that is found to be mutated in some cases of familial NB (with
congenital central hypoventilation syndrome or Ondine curse, OMIM 209880) [28].
Table 3: List of neuroblast specific genes belonging to the neurogenesis biological process class (GO:0007399). The genes highlighted in bold have been referred in the context of NB. The last column represents the percentile of expression level of each gene in the neuroblast cells.
Locus Link ID gene symbol ref LocusLink gene description percentile
321 APBA2 amyloid beta (A4) precursor protein-binding, family A,
member 2 (X11-like)
0.983
55790 ChGn chondroitin beta1,4 N-acetylgalactosaminyltransferase 0.645
1400 CRMP1 collapsin response mediator protein 1 0.981
1627 DBN1 drebrin 1 0.754
1808 DPYSL2 (CRMP2) dihydropyrimidinase-like 2 0.983
1809 DPYSL3 (CRMP4) dihydropyrimidinase-like 3 0.933
10570 DPYSL4 (CRMP3) dihydropyrimidinase-like 4 0.750
1948 EFNB2 [23-26] ephrin-B2 0.856 1949 EFNB3 [23-26] ephrin-B3 0.802 51466 EVL Enah/Vasp-like 0.946
2186 FALZ (FAC1) foetal Alzheimer antigen 0.942
2258 FGF13 fibroblast growth factor 13 0.831
8522 GAS7 [27] growth arrest-specific 7 0.787 9118 INA internexin neuronal intermediate filament protein, alpha 0.984
3785 KCNQ2 potassium voltage-gated channel, KQT-like subfamily,
member 2
0.972
3897 L1CAM L1 cell adhesion molecule 0.899
10586 MAB21L2 mab-21-like 2 0.943
4914 NTRK1 [22] neurotrophic tyrosine kinase, receptor, type 1 0.929 5050 PAFAH1B3 platelet-activating factor acetylhydrolase, isoform Ib,
gamma subunit 29kDa
0.939
8929 PHOX2B [28] paired-like homeobox 2b 0.992 6586 SLIT3 slit homolog 3 (Drosophila) 0.904
6614 SOX11 SRY (sex determining region Y)-box 11 0.967
6695 SPOCK sparc/osteonectin, cwcv and kazal-like domains
proteoglycan (testican)
0.945
7021 TFAP2B transcription factor AP-2 beta (activating enhancer
binding protein 2 beta)
0.962
Paper 2 59
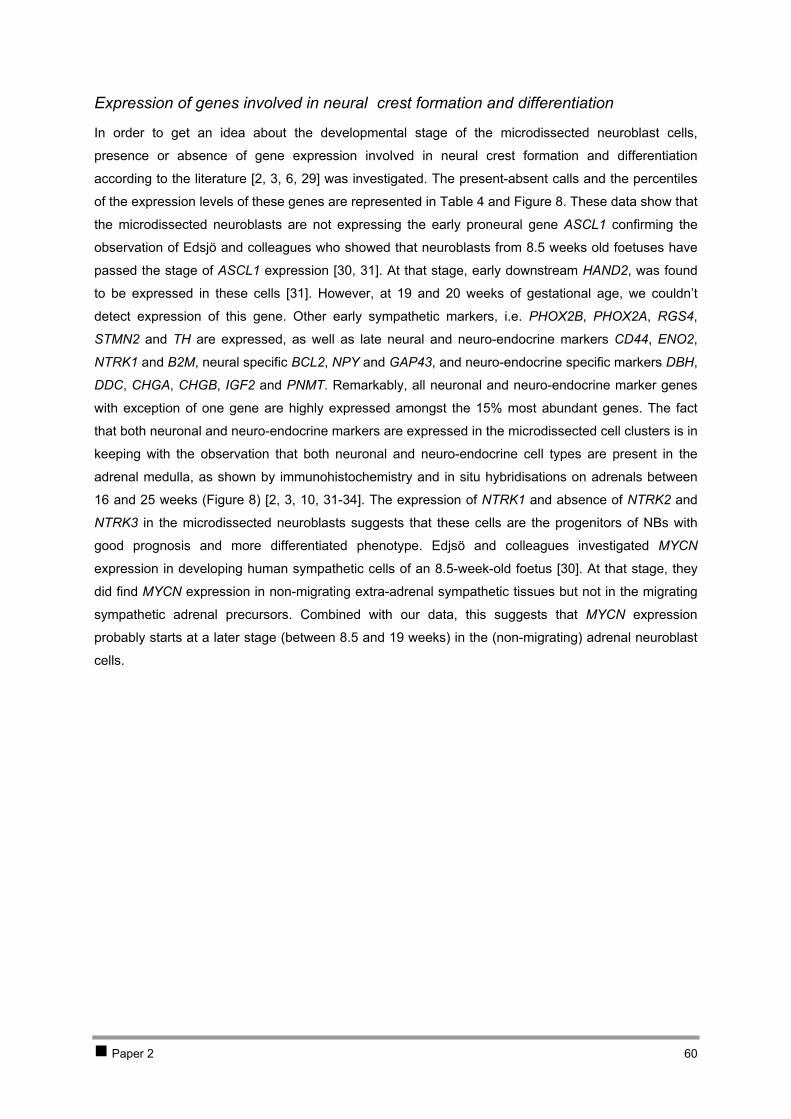
Expression of genes involved in neural crest formation and differentiation
In order to get an idea about the developmental stage of the microdissected neuroblast cells,
presence or absence of gene expression involved in neural crest formation and differentiation
according to the literature [2, 3, 6, 29] was investigated. The present-absent calls and the percentiles
of the expression levels of these genes are represented in Table 4 and . These data show that
the microdissected neuroblasts are not expressing the early proneural gene ASCL1 confirming the
observation of Edsjö and colleagues who showed that neuroblasts from 8.5 weeks old foetuses have
passed the stage of ASCL1 expression [30, 31]. At that stage, early downstream HAND2, was found
to be expressed in these cells [31]. However, at 19 and 20 weeks of gestational age, we couldn’t
detect expression of this gene. Other early sympathetic markers, i.e. PHOX2B, PHOX2A, RGS4,
STMN2 and TH are expressed, as well as late neural and neuro-endocrine markers CD44, ENO2,
NTRK1 and B2M, neural specific BCL2, NPY and GAP43, and neuro-endocrine specific markers DBH,
DDC, CHGA, CHGB, IGF2 and PNMT. Remarkably, all neuronal and neuro-endocrine marker genes
with exception of one gene are highly expressed amongst the 15% most abundant genes. The fact
that both neuronal and neuro-endocrine markers are expressed in the microdissected cell clusters is in
keeping with the observation that both neuronal and neuro-endocrine cell types are present in the
adrenal medulla, as shown by immunohistochemistry and in situ hybridisations on adrenals between
16 and 25 weeks ( ) [2, 3, 10, 31-34]. The expression of NTRK1 and absence of NTRK2 and
NTRK3 in the microdissected neuroblasts suggests that these cells are the progenitors of NBs with
good prognosis and more differentiated phenotype. Edjsö and colleagues investigated MYCN
expression in developing human sympathetic cells of an 8.5-week-old foetus [30]. At that stage, they
did find MYCN expression in non-migrating extra-adrenal sympathetic tissues but not in the migrating
sympathetic adrenal precursors. Combined with our data, this suggests that MYCN expression
probably starts at a later stage (between 8.5 and 19 weeks) in the (non-migrating) adrenal neuroblast
cells.
Figure 8
Figure 8
Paper 2 60
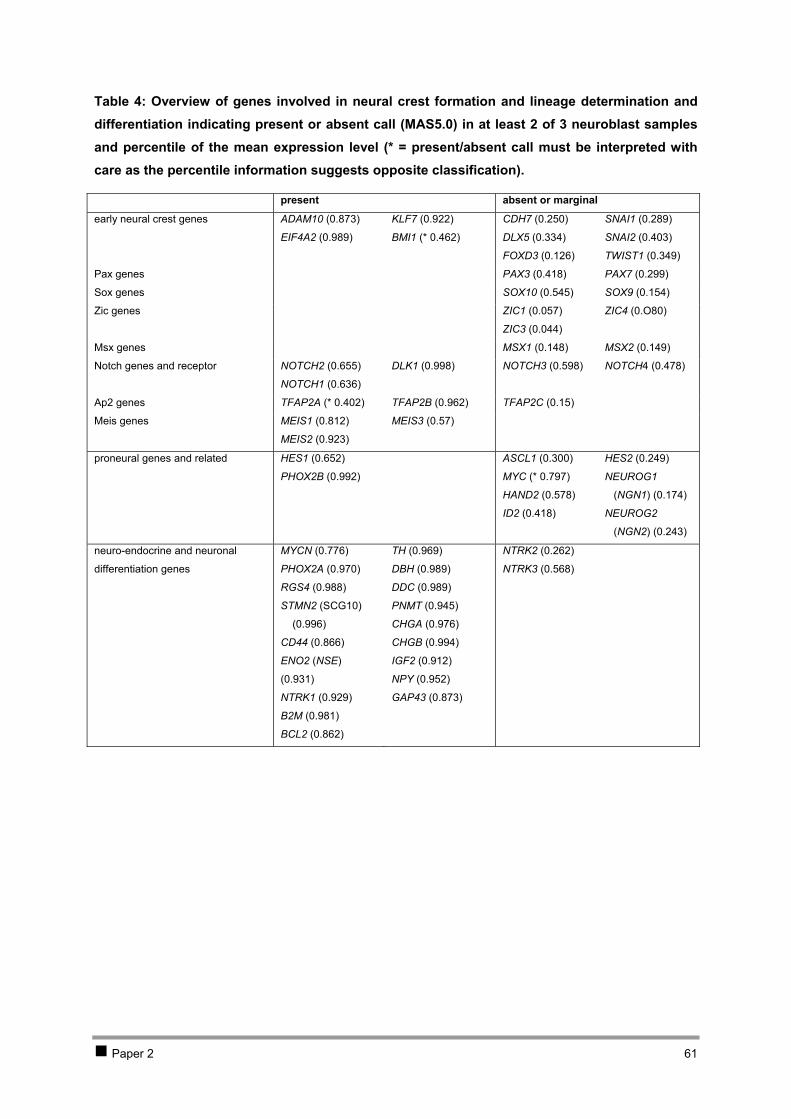
Table 4: Overview of genes involved in neural crest formation and lineage determination and differentiation indicating present or absent call (MAS5.0) in at least 2 of 3 neuroblast samples and percentile of the mean expression level (* = present/absent call must be interpreted with care as the percentile information suggests opposite classification).
present absent or marginal
early neural crest genes ADAM10 (0.873)
EIF4A2 (0.989)
KLF7 (0.922)
BMI1 (* 0.462)
CDH7 (0.250)
DLX5 (0.334)
FOXD3 (0.126)
SNAI1 (0.289)
SNAI2 (0.403)
TWIST1 (0.349)
Pax genes PAX3 (0.418) PAX7 (0.299)
Sox genes SOX10 (0.545) SOX9 (0.154)
Zic genes ZIC1 (0.057)
ZIC3 (0.044)
ZIC4 (0.O80)
Msx genes MSX1 (0.148) MSX2 (0.149)
Notch genes and receptor NOTCH2 (0.655)
NOTCH1 (0.636)
DLK1 (0.998) NOTCH3 (0.598)
NOTCH4 (0.478)
Ap2 genes TFAP2A (* 0.402) TFAP2B (0.962) TFAP2C (0.15)
Meis genes MEIS1 (0.812)
MEIS2 (0.923)
MEIS3 (0.57)
proneural genes and related HES1 (0.652)
PHOX2B (0.992)
ASCL1 (0.300)
MYC (* 0.797)
HAND2 (0.578)
ID2 (0.418)
HES2 (0.249)
NEUROG1
(NGN1) (0.174)
NEUROG2
(NGN2) (0.243)
neuro-endocrine and neuronal
differentiation genes
MYCN (0.776)
PHOX2A (0.970)
RGS4 (0.988)
STMN2 (SCG10)
(0.996)
CD44 (0.866)
ENO2 (NSE)
(0.931)
NTRK1 (0.929)
B2M (0.981)
BCL2 (0.862)
TH (0.969)
DBH (0.989)
DDC (0.989)
PNMT (0.945)
CHGA (0.976)
CHGB (0.994)
IGF2 (0.912)
NPY (0.952)
GAP43 (0.873)
NTRK2 (0.262)
NTRK3 (0.568)
Paper 2 61

Figure 8: Human sympathetic nervous system developmental pathways with indication of marker genes (according to [2, 3, 10, 31-34]) and their expression level (percentile heat map) in the microdissected foetal adrenal neuroblast cell clusters, indicating a clear sympathetic nervous system and adrenal neuronal/neuro-endocrine expression pattern (- = no expression or not reported in the literature, ( ) = marginal expression).
Paper 2 62
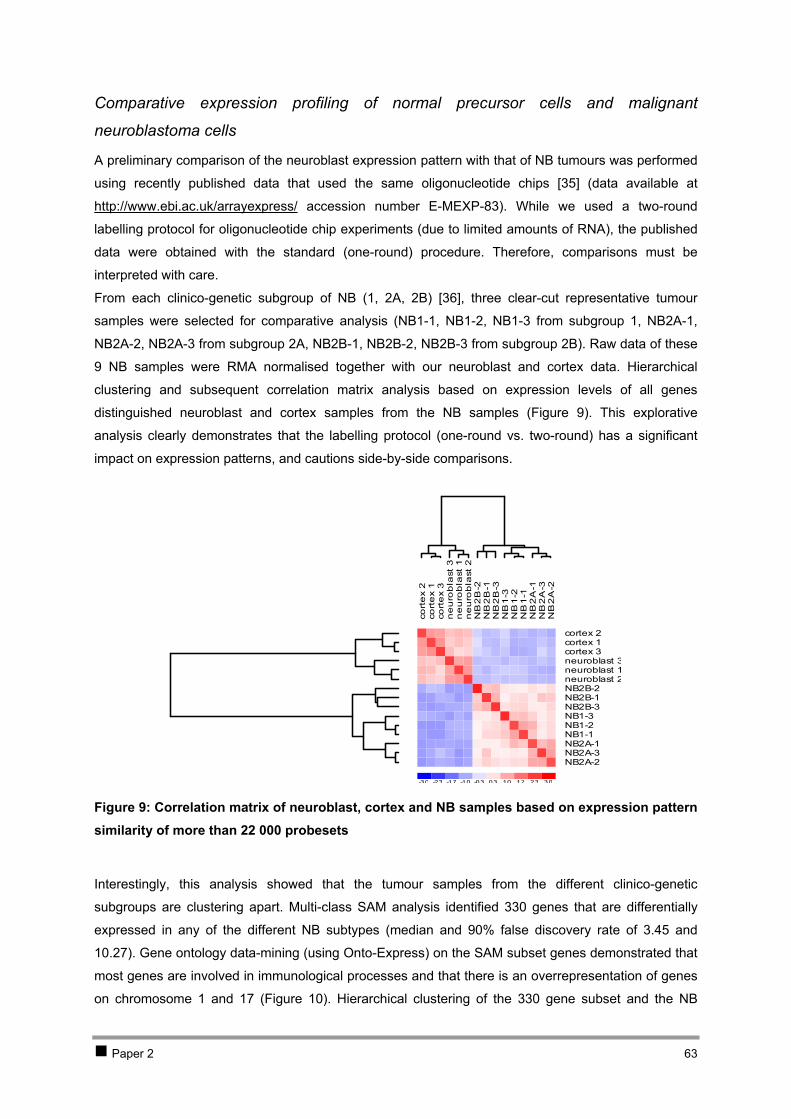
Comparative expression profiling of normal precursor cells and malignant
neuroblastoma cells
A preliminary comparison of the neuroblast expression pattern with that of NB tumours was performed
using recently published data that used the same oligonucleotide chips [35] (data available at
http://www.ebi.ac.uk/arrayexpress/ accession number E-MEXP-83). While we used a two-round
labelling protocol for oligonucleotide chip experiments (due to limited amounts of RNA), the published
data were obtained with the standard (one-round) procedure. Therefore, comparisons must be
interpreted with care.
From each clinico-genetic subgroup of NB (1, 2A, 2B) [36], three clear-cut representative tumour
samples were selected for comparative analysis (NB1-1, NB1-2, NB1-3 from subgroup 1, NB2A-1,
NB2A-2, NB2A-3 from subgroup 2A, NB2B-1, NB2B-2, NB2B-3 from subgroup 2B). Raw data of these
9 NB samples were RMA normalised together with our neuroblast and cortex data. Hierarchical
clustering and subsequent correlation matrix analysis based on expression levels of all genes
distinguished neuroblast and cortex samples from the NB samples ( ). This explorative
analysis clearly demonstrates that the labelling protocol (one-round vs. two-round) has a significant
impact on expression patterns, and cautions side-by-side comparisons.
Figure 9
Figure 9: Correlation matrix of neuroblast, cortex and NB samples based on expression pattern similarity of more than 22 000 probesets
cort
ex
2co
rte
x 1
cort
ex
3n
eu
rob
last
3n
eu
rob
last
1n
eu
rob
last
2N
B2
B-2
NB
2B
-1N
B2
B-3
NB
1-3
NB
1-2
NB
1-1
NB
2A
-1N
B2
A-3
NB
2A
-2
-3.0 -2.3 -1.7 -1.0 -0.3 0.3 1.0 1.7 2.3 3.0
cortex 2cortex 1cortex 3neuroblast 3neuroblast 1neuroblast 2NB2B-2NB2B-1NB2B-3NB1-3NB1-2NB1-1NB2A-1NB2A-3NB2A-2
Interestingly, this analysis showed that the tumour samples from the different clinico-genetic
subgroups are clustering apart. Multi-class SAM analysis identified 330 genes that are differentially
expressed in any of the different NB subtypes (median and 90% false discovery rate of 3.45 and
10.27). Gene ontology data-mining (using Onto-Express) on the SAM subset genes demonstrated that
most genes are involved in immunological processes and that there is an overrepresentation of genes
on chromosome 1 and 17 ( ). Hierarchical clustering of the 330 gene subset and the NB Figure 10
Paper 2 63
samples of the different clinico-genetic subgroups followed by gene ontology data-mining of the three
major gene clusters demonstrated that the genes involved in immunological processes are specifically
expressed in subgroup 2A (cluster 2), including chemokine ligands and receptors (CCL15, CLL19,
CCL21, CCR7), MHC class II genes and CD4 ( , ). Figure 11 Figure 12
Further analyses are needed to understand the importance of the biological process and molecular
function categories that are overrepresented in the other two gene clusters. A first glimpse on the
genes in the other clusters shows that cluster 1, containing genes that are higher expressed in
subtype 2B tumours (typically with MYCN amplification), indeed harbours MYCN, five other genes on
2p, i.e. NCYM, ALK, MTHFD2, DDEF2 and JMJD1A, as well as known downstream genes of MYCN,
i.e. ABCC1 (MRP1) [37] and NME1 [38]. Further in-depth analysis of these profiles will probably reveal
more MYCN downstream genes. Genes on chromosome 9 and 1 are significantly overrepresented in
cluster 3 that contains genes that are expressed in subgroup 1 NB and (at lower level) in subgroup 2A
NB but absent in subgroup 2B NB. As deletion of distal 1p is typical for subgroup 2B tumours, genes
on 1p36, i.e. PINK1 (PTEN induced putative kinase 1) and BACH (brain acyl-CoA hydrolase) may be
of interest.
Paper 2 64

Figure 10: Onto-express gene ontology data-mining analysis of a SAM subset of genes that distinguish the three NB subgroups: (A) biological processes, (B) molecular functions, (C) cellular components (only categories with corrected p-values smaller than 0.05 are represented in this table), and (D) chromosomal location
Paper 2 65
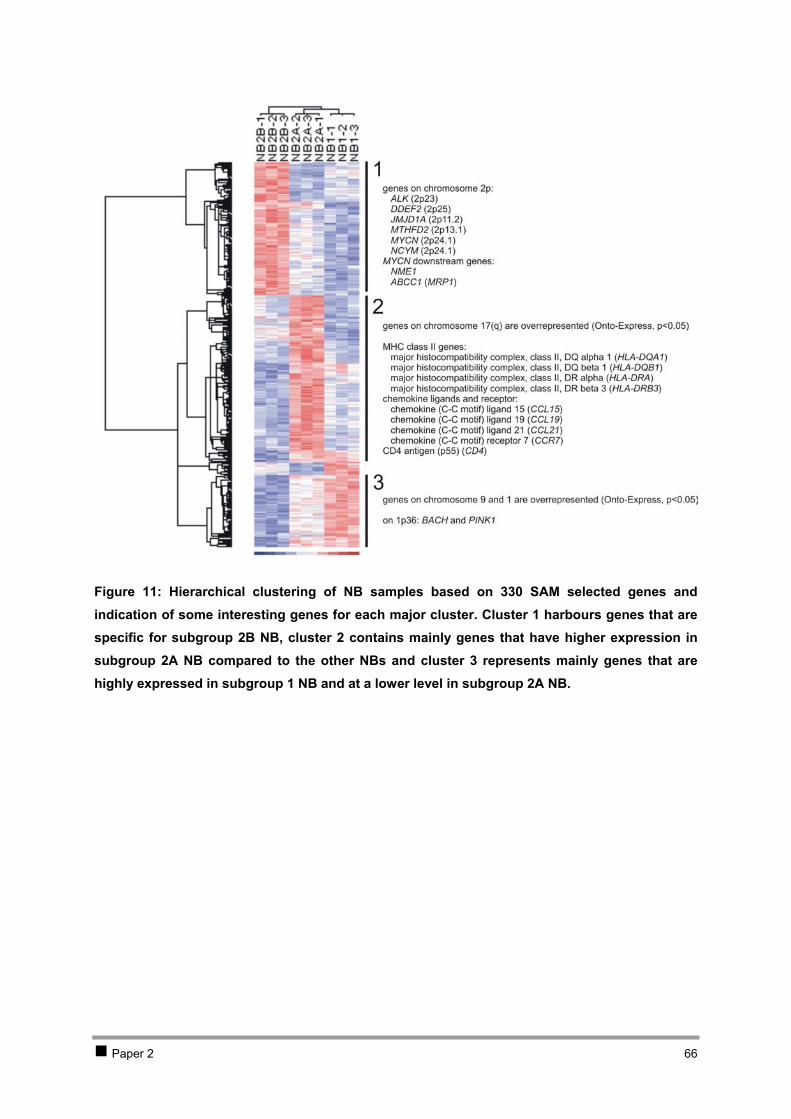
Figure 11: Hierarchical clustering of NB samples based on 330 SAM selected genes and indication of some interesting genes for each major cluster. Cluster 1 harbours genes that are specific for subgroup 2B NB, cluster 2 contains mainly genes that have higher expression in subgroup 2A NB compared to the other NBs and cluster 3 represents mainly genes that are highly expressed in subgroup 1 NB and at a lower level in subgroup 2A NB.
Paper 2 66
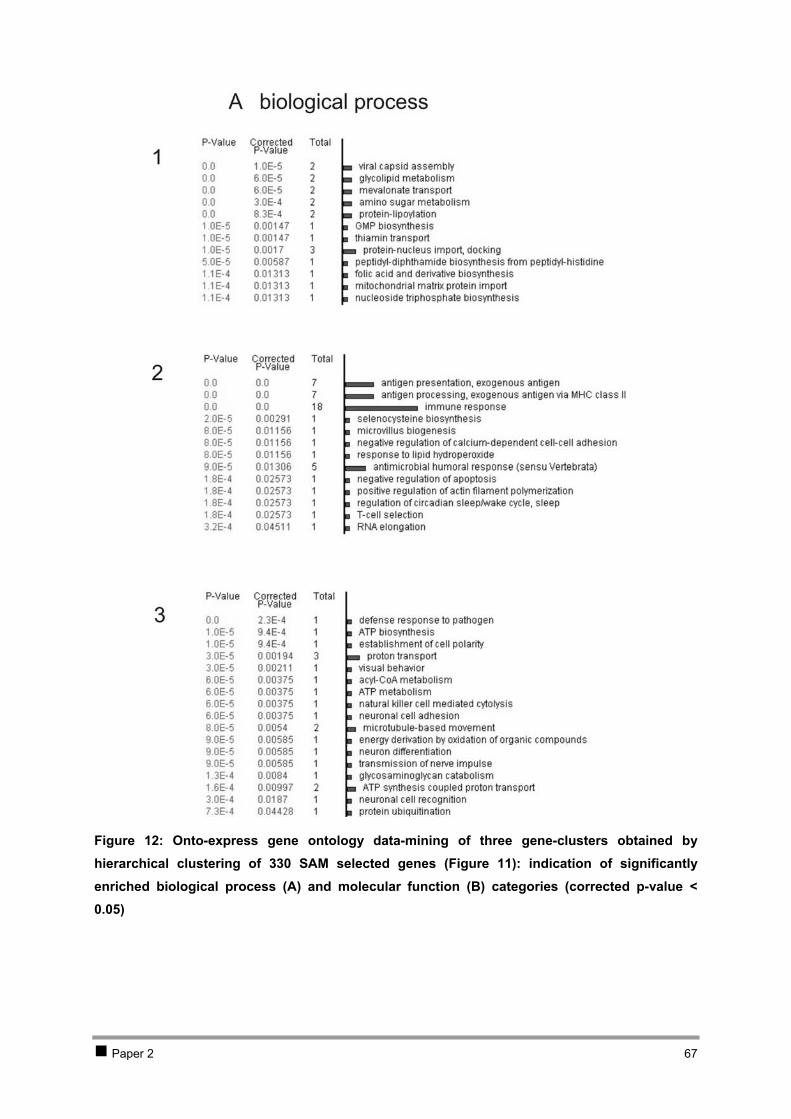
Figure 12: Onto-express gene ontology data-mining of three gene-clusters obtained by hierarchical clustering of 330 SAM selected genes ( ): indication of significantly enriched biological process (A) and molecular function (B) categories (corrected p-value < 0.05)
Figure 11
Paper 2 67
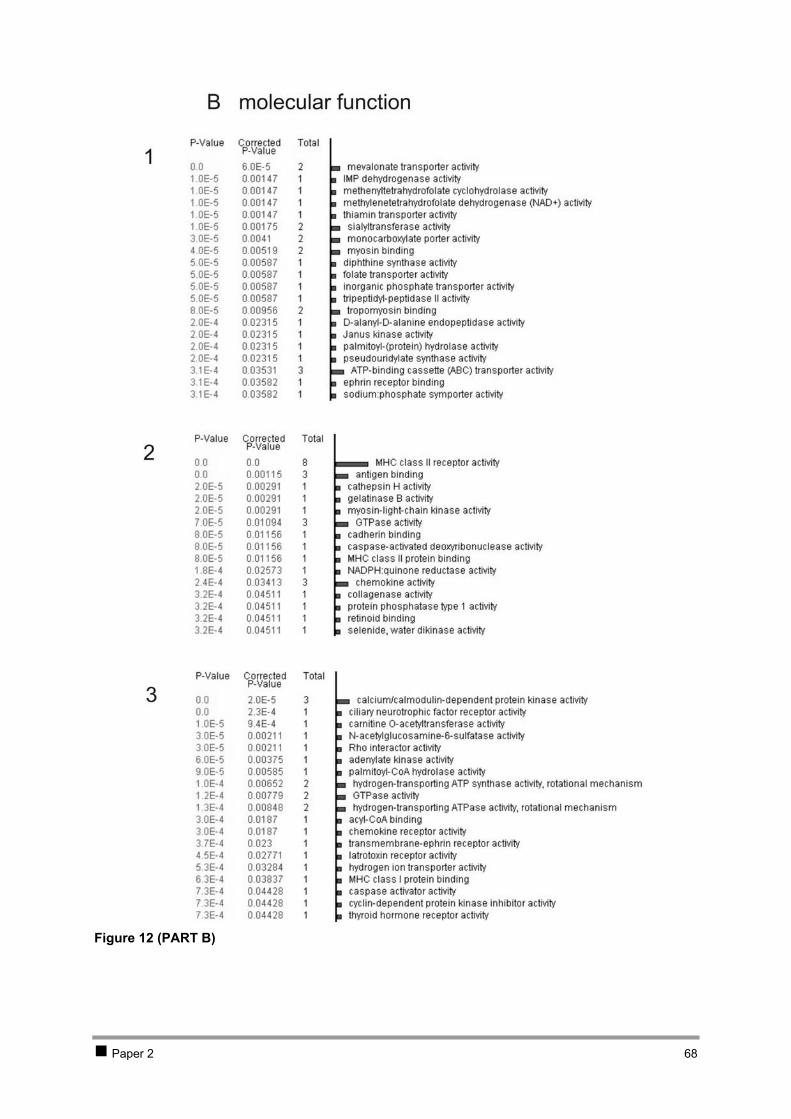
Figure 12 (PART B)
Paper 2 68
Discussion
In order to acquire a better understanding of the underlying molecular mechanisms of NB
development, NB progenitor cells (alias neuroblast cells) were isolated from the foetal adrenal medulla
and used for comparative gene expression profiling. To this purpose, we used a previously optimised
histological staining and laser capture microdissection (LCM) protocol for isolation of high-quality
neuroblast RNA from foetal adrenal cryo-sections [12]. RNA quality control along each step in the
protocol revealed that RNA was only minimally degraded, thus yielding RNA of sufficient quality for
gene chip analysis. RNA yields were estimated using real-time quantitative RT-PCR (between 2.5 and
15 ng of each sample). After pooling of the different RNA isolates from each sample, a two-round
labelling protocol and hybridisation to U133A arrays, containing 14 500 well-characterised genes, was
performed. Oligonucleotide chip analysis of the neuroblast cells provided us with a unique and
unprecedented view on the transcriptome of NB progenitor cells. Standard chip quality metrics and
comparison of oligonucleotide chip expression levels with real-time quantitative RT-PCR data of
selected genes rendered confidence and reliability to the obtained expression patterns. Mapping of the
expression data to pathways confirmed the notion that neuroblast cells express enzymes involved in
the catecholamine pathway, while adrenal cortex cells express steroid and cholesterol biosynthesis
enzymes. With supervised feature selection comparing the neuroblast and cortex cells, 580 neuroblast
specific genes were identified. Gene ontology data-mining of this subset indicated -as expected- a
significant overrepresentation of genes with a function in neurogenesis, further confirming the reliability
of the oligonucleotide chip data.
Gene directed expression analysis of specific genes shows that the microdissected neuroblasts no
longer express the early proneural gene ASCL1, but express both neuronal and neuro-endocrine
differentiation marker genes, indicating that cells with neuronal lineage features (BCL2, NPY, GAP43)
as well as some cells with chromaffin (neuro-endocrine) lineage features (CHGA, CHGB, IGF2,
PNMT) were microdissected. In addition, the microdissected neuroblasts show a similar expression
pattern with favourable NBs belonging to subgroup 1 as demonstrated by the high expression of
NTRK1, EFNB2 and EFNB3 and absence of NTRK2 (and NTRK3) expression. Further detailed
analysis of specific genes present on the chip will certainly provide more information about human
sympathoadrenal biogenesis and about the time point of developmental arrest of the different genetic
subgroups of NB.
Comparison between neuroblasts and primary NB of different subtypes analysed in a publicly
available gene chip expression study [35] suggests that data obtained with the 2-round labelling
protocol may not be directly compared with those obtained after the standard (1-round) labelling
protocol. Despite the fact that these NB expression patterns could not be compared with our
neuroblast expression patterns, we performed preliminary data analysis on the available tumour
expression data. Analysis of the NB expression profiles clearly showed that the three clinico-genetic
subgroups have significant expression differences. Using supervised selection of significant
differentially expressed genes, we identified 330 genes that clearly distinguish these three major
clinico-genetic subgroups. Interestingly, genes on 1p and 17q are overrepresented in this subset, two
Paper 2 69
regions that are frequently altered in high-stage NB. Hierarchical clustering and gene ontology data-
mining showed that genes involved in immunological processes are significantly overrepresented in
NB subgroup 2A (high stage NBs with 17q-gain and 11q-deletion, without MYCN amplification). The
presence of CD4, chemokine receptor CCR7 and MHC class II mRNAs in subgroup 2A NB samples
indicates that this clinico-genetic subgroup is characterised by the presence of infiltrating natural killer
T-cells expressing chemokine receptors and CD4+ T-cells expressing MHC class II genes and CD4.
The chemokine ligands (CCL15, CCL19 and CCL21) expressing tumours of subgroup 2A most likely
attract these natural killer T-cells. This is in agreement with a recent study of primary untreated NBs
from patients with metastatic disease (stage 4) that reports migration of natural killer T-cells towards
NB cells in a CCL2 dependent manner, preferentially infiltrating MYCN non-amplified tumours
(typically type 2A NB) that express CCL2 [39]. Although not present in our SAM subset of genes,
CCL2 shows indeed a higher expression in the NB of subtype 2A compared to the other NBs (p =
0.010, Mann Whitney U test). The presence of infiltrating natural killer T-cells in the tumour
microenvironment was also reported in human melanoma, lung adenocarcinoma and lung squamous
cell carcinomas [40, 41], and a study on brain tumours reported the presence of CD4+ MHC class II
restricted helper lymphocytes in 86% of the tumours [42].
A first glimpse on the genes that are specifically expressed in the other NB subgroups shows that
MYCN is higher expressed in subtype 2B NB as expected, as well as some known MYCN downstream
genes. These data indicate that further analysis could lead to the identification of more MYCN
downstream genes. Interestingly, the tyrosine kinase receptor gene ALK (anaplastic lymphoma
kinase) located on 2p is also found to be expressed in NBs of subgroup 2B. Previous studies showed
that this gene is exclusively expressed in the developing embryonic nervous system and also in
neuronal derived malignancies including NB [43-46]. In two NB cell lines, ALK was found to be co-
amplified with MYCN resulting in the overexpression of the ALK protein [45].
Conclusion
The neuroblast expression profile generated in this study is the first of its kind on human
sympathoadrenal cells. This expression pattern will be valuable (1) to study sympathoadrenal
biogenesis and (2) as a normal reference in future NB expression profile studies, and it will help us to
determine (3) the genes that are involved in the pathogenesis of NB, (4) the time point of
developmental arrest of the different NB subgroups and (5) possible ontogenetic differences between
the three NB subgroups.
Paper 2 70
Material and methods
Foetal and tumour material
Ethical approval was obtained for the collection of foetal adrenal glands from foetuses aborted for
clinical reasons. The induced abortion was performed by a prostaglandin instillation to the patient. The
adrenals were removed during necropsy and snap-frozen in liquid nitrogen within 3 hours after
delivery.
Laser capture microdissection and H&E staining
Foetal adrenal glands were embedded in Tissue-Tek OCT compound (Sakura). In a first step, 7-8 µm
cryo-sections were H&E stained and mounted in order to scan for neuroblast clusters. When
neuroblast clusters were found, stained but un-mounted cryo-sections were prepared for LCM.
Embedding, sectioning, staining and LCM was performed as described [12]. A detailed protocol can be
obtained at http://allserv.ugent.be/~fspelema/neubla/cancerletters/.
RNA isolation, quantity and quality assessment
Directly after microdissection, cells were caught in RNA extraction buffer of the RNeasy Mini kit
(Qiagen), followed by RNA extraction and DNase treatment on column (Qiagen).
Depending on the amount of cells, RNA concentration was determined by real-time quantitative RT-
PCR or fluorometric analysis with PicoGreen according to the manufacturer’s protocol for low RNA
concentration. For the real-time quantitative RT-PCR approach, a standard curve of cDNA with known
concentration was run together with test cDNA for two reference genes, i.e. GAPD and UBC. The
mean of GAPD and UBC results was a good estimate for the RNA concentration of the isolates.
RNA quality was measured with the RNA Nano LabChip kit or the RNA 6000 Pico LabChip kit on the
2100 Bioanalyser (Agilent Technologies) using 1 µl of the RNA isolates.
Marker gene expression analysis using real-time quantitative RT-PCR
Primer pairs were constructed using Primer Express (Applied Biosystems). Primer sequences are
available in the public RTPrimerDB database (http://medgen.UGent.be/rtprimerdb/): GAP43 (97),
PHOX2A (1085), DBH (1086), PNMT (1087) and DDC (365) [47].
The relative expression levels of genes were determined in the neuroblast and surrounding cortical
cells using an optimized two-step real-time SYBR Green I RT-PCR assay [48] on the ABI5700
(Applied Biosystems). The gene expression levels were normalised using the geometric mean of two
stable reference genes in NB (GAPD and UBC) as described previously [49].
Oligonucleotide chip analysis and data-mining
In order to get enough material, neuroblast RNA isolates were pooled for each sample. A two-round
labelling protocol was applied on the neuroblast and cortex RNA, followed by hybridisation on HG-
Paper 2 71
U133A oligonucleotide chips (Affymetrix) in the Array Facility of the German Research Centre for
Biotechnology (GBF, Germany) (protocol described in [50]).
Publicly available oligonucleotide chip data on NB were included in this study with approval of the
authors [35] (NB1-1 = 36, NB1-2= 45, NB1-3= 30, NB2A-1= 31, NB2A-2= 37, NB2A-3= 45, NB2B-1=
42, NB2B-2= 53, NB2B-3= 55).
Oligonucleotide arrays were first analysed with the Microarray Suite 5.0 (MAS5.0) software
(Affymetrix), providing standard quality control measures and present/absent calls. CEL files were
loaded in the BioConductor (BioC) software. The affy-package [14] was used for drawing histograms,
boxplots and RNA degradation graphs and to obtain expression level data by the Robust Multi Chip
Average (RMA) method [17] (rma in BioC affy-package: probe specific correction of the PM probes
using a model based on observed intensity being the sum of signal and noise; complete data
normalisation method = quantile normalisation; median polish expression measure).
Percentiles of the RMA normalised data were calculated in Excel based on a non-redundant gene list
(selection of probesets with highest mean expression in neuroblasts of redundant gene). The Excel
Add-In Applet for Significance Analysis of Microarrays (SAM) [20] was used to identify differentially
expressed genes between subgroups of samples (two-class unpaired or multiclass, 100 permutations,
K-nearest neighbour imputer, 10 neighbours). Online Onto-Express allowed Gene Ontology analysis
of a gene annotation list (binomial distribution, sidak correction) [21]. RMA normalised data were
loaded in the dCHIP software [51] to perform hierarchical clustering and correlation matrix analysis of
the samples (standardise rows, pre-calculate distances, distance metric=1-rank correlation, linkage
method=centroid, p-value threshold for calling significant clusters for genes=0.001 and samples=0.05).
GenMapp (v.2.0) software was used for mapping of expression data on biological pathways [52].
Acknowledgements
We would like to thank Sven Pählman for helpful discussions, Ann Neesen and Indra Deborle
(Pneumology Department, Ghent University Hospital, Belgium) for help with the preparation of the
cryo-sections.
Katleen De Preter is an aspirant with the Fund for Scientific Research Flanders (FWO-Vlaanderen). Jo
Vandesompele is supported by a post-doctoral grant from the Institute for the Promotion of Innovation
by Science and Technology in Flanders (IWT). This work was supported by the ‘kinderkankerfonds’,
the Fund for Scientific Research Flanders (Krediet aan Navorsers J.V. 1.5.243.05), FWO-grant
G.0028.00, VEO-grant 011V1302, BOF-grant 011F1200 and 011B4300, and GOA-grant 12051203.
Paper 2 72
References
1. MJ Cooper, GM Hutchins, PS Cohen, LJ Helman, RJ Mennie, MA Israel: Human neuroblastoma tumor cell lines correspond to the arrested differentiation of chromaffin adrenal medullary neuroblasts. Cell Growth Differ 1990, 1:149-59.
2. JC Hoehner, C Gestblom, F Hedborg, B Sandstedt, L Olsen, S Pahlman: A developmental model of neuroblastoma: differentiating stroma-poor tumors' progress along an extra-adrenal chromaffin lineage. Lab Invest 1996, 75:659-75.
3. JC Hoehner, F Hedborg, L Eriksson, B Sandstedt, L Grimelius, L Olsen, S Pahlman: Developmental gene expression of sympathetic nervous system tumors reflects their histogenesis. Lab Invest 1998, 78:29-45.
4. GM Brodeur, RP Castleberry: Neuroblastoma. In: Principles and practice of pediatric oncology Edited by PA Pizzo, DG Poplack, Third ed. pp. 761-797. Philadelphia: Lippincott Raven; 1997: 761-797.
5. AK Knecht, M Bronner-Fraser: Induction of the neural crest: a multigene process. Nat Rev Genet 2002, 3:453-61.
6. LS Gammill, M Bronner-Fraser: Neural crest specification: migrating into genomics. Nat Rev Neurosci 2003, 4:795-805.
7. EH LaBrosse, C Com-Nougue, JM Zucker, E Comoy, C Bohuon, J Lemerle, O Schweisguth: Urinary excretion of 3-methoxy-4-hydroxymandelic acid and 3-methoxy-4-hydroxyphenylacetic acid by 288 patients with neuroblastoma and related neural crest tumors. Cancer Res 1980, 40:1995-2001.
8. EH LaBrosse, E Comoy, C Bohuon, JM Zucker, O Schweisguth: Catecholamine metabolism in neuroblastoma. J Natl Cancer Inst 1976, 57:633-8.
9. WE Laug, SE Siegel, KN Shaw, B Landing, J Baptista, M Gutenstein: Initial urinary catecholamine metabolite concentrations and prognosis in neuroblastoma. Pediatrics 1978, 62:77-83.
10. C Gestblom, JC Hoehner, F Hedborg, B Sandstedt, S Pahlman: In vivo spontaneous neuronal to neuroendocrine lineage conversion in a subset of neuroblastomas. Am J Pathol 1997, 150:107-17.
11. S Pahlman, F Hedborg: Development of the neural crest and sympathetic nervous system. In: Neuroblastoma Edited by GM Brodeur, T Sawada, Y Tsuchida, PA Voute, First ed. Amsterdam: Elsevier; 2000.
12. K De Preter, J Vandesompele, P Heimann, MM Kockx, M Van Gele, J Hoebeeck, E De Smet, M Demarche, G Laureys, N Van Roy, et al: Application of laser capture microdissection in genetic analysis of neuroblastoma and neuroblastoma precursor cells. Cancer Lett 2003, 197:53-61.
13. H Auer, S Lyianarachchi, D Newsom, MI Klisovic, G Marcucci, K Kornacker, U Marcucci: Chipping away at the chip bias: RNA degradation in microarray analysis. Nat Genet 2003, 35:292-3.
14. L Gautier, L Cope, BM Bolstad, RA Irizarry: affy--analysis of Affymetrix GeneChip data at the probe level. Bioinformatics 2004, 20:307-15.
15. V Luzzi, M Mahadevappa, R Raja, JA Warrington, MA Watson: Accurate and reproducible gene expression profiles from laser capture microdissection, transcript amplification, and high density oligonucleotide microarray analysis. J Mol Diagn 2003, 5:9-14.
16. O Schoor, T Weinschenk, J Hennenlotter, S Corvin, A Stenzl, HG Rammensee, S Stevanovic: Moderate degradation does not preclude microarray analysis of small amounts of RNA. Biotechniques 2003, 35:1192-6, 1198-201.
17. BM Bolstad, RA Irizarry, M Astrand, TP Speed: A comparison of normalization methods for high density oligonucleotide array data based on variance and bias. Bioinformatics 2003, 19:185-93.
18. RA Irizarry, BM Bolstad, F Collin, LM Cope, B Hobbs, TP Speed: Summaries of Affymetrix GeneChip probe level data. Nucleic Acids Res 2003, 31:e15.
19. RA Irizarry, B Hobbs, F Collin, YD Beazer-Barclay, KJ Antonellis, U Scherf, TP Speed: Exploration, normalization, and summaries of high density oligonucleotide array probe level data. Biostatistics 2003, 4:249-64.
20. VG Tusher, R Tibshirani, G Chu: Significance analysis of microarrays applied to the ionizing radiation response. Proc Natl Acad Sci U S A 2001, 98:5116-21.
Paper 2 73
21. P Khatri, S Draghici, GC Ostermeier, SA Krawetz: Profiling gene expression using onto-express. Genomics 2002, 79:266-70.
22. GM Brodeur: Neuroblastoma: biological insights into a clinical enigma. Nat Rev Cancer 2003, 3:203-16.
23. XX Tang, AE Evans, H Zhao, A Cnaan, GM Brodeur, N Ikegaki: Association among EPHB2, TrkA, and MYCN expression in low-stage neuroblastomas. Med Pediatr Oncol 2001, 36:80-2.
24. XX Tang, H Zhao, ME Robinson, A Cnaan, W London, SL Cohn, NK Cheung, GM Brodeur, AE Evans, N Ikegaki: Prognostic significance of EPHB6, EFNB2, and EFNB3 expressions in neuroblastoma. Med Pediatr Oncol 2000, 35:656-8.
25. XX Tang, H Zhao, ME Robinson, B Cohen, A Cnaan, W London, SL Cohn, NK Cheung, GM Brodeur, AE Evans, et al: Implications of EPHB6, EFNB2, and EFNB3 expressions in human neuroblastoma. Proc Natl Acad Sci U S A 2000, 97:10936-41.
26. XX Tang, AE Evans, H Zhao, A Cnaan, W London, SL Cohn, GM Brodeur, N Ikegaki: High-level expression of EPHB6, EFNB2, and EFNB3 is associated with low tumor stage and high TrkA expression in human neuroblastomas. Clin Cancer Res 1999, 5:1491-6.
27. YT Ju, AC Chang, BR She, ML Tsaur, HM Hwang, CC Chao, SN Cohen, S Lin-Chao: gas7: A gene expressed preferentially in growth-arrested fibroblasts and terminally differentiated Purkinje neurons affects neurite formation. Proc Natl Acad Sci U S A 1998, 95:11423-8.
28. D Trochet, F Bourdeaut, I Janoueix-Lerosey, A Deville, L de Pontual, G Schleiermacher, C Coze, N Philip, T Frebourg, A Munnich, et al: Germline mutations of the paired-like homeobox 2B (PHOX2B) gene in neuroblastoma. Am J Hum Genet 2004, 74:761-4.
29. N Bertrand, DS Castro, F Guillemot: Proneural genes and the specification of neural cell types. Nat Rev Neurosci 2002, 3:517-30.
30. A Edsjo, H Nilsson, J Vandesompele, J Karlsson, F Pattyn, LA Culp, F Speleman, S Pahlman: Neuroblastoma cells with overexpressed MYCN retain their capacity to undergo neuronal differentiation. Lab Invest 2004, 84:406-17.
31. C Gestblom, A Grynfeld, I Ora, E Ortoft, C Larsson, H Axelson, B Sandstedt, P Cserjesi, EN Olson, S Pahlman: The basic helix-loop-helix transcription factor dHAND, a marker gene for the developing human sympathetic nervous system, is expressed in both high- and low-stage neuroblastomas. Lab Invest 1999, 79:67-79.
32. F Hedborg, R Ohlsson, B Sandstedt, L Grimelius, JC Hoehner, S Pahlman: IGF2 expression is a marker for paraganglionic/SIF cell differentiation in neuroblastoma. Am J Pathol 1995, 146:833-47.
33. JC Hoehner, F Hedborg, HJ Wiklund, L Olsen, S Pahlman: Cellular death in neuroblastoma: in situ correlation of apoptosis and bcl-2 expression. Int J Cancer 1995, 62:19-24.
34. JC Hoehner, L Olsen, B Sandstedt, DR Kaplan, S Pahlman: Association of neurotrophin receptor expression and differentiation in human neuroblastoma. Am J Pathol 1995, 147:102-13.
35. L McArdle, M McDermott, R Purcell, D Grehan, A O'Meara, F Breatnach, D Catchpoole, AC Culhane, I Jeffery, WM Gallagher, et al: Oligonucleotide microarray analysis of gene expression in neuroblastoma displaying loss of chromosome 11q. Carcinogenesis 2004.
36. J Vandesompele, M Baudis, K De Preter, N Van Roy, P Ambros, N Bown, C Brinkschmidt, H Christiansen, V Combaret, M Lastowska, et al: Unequivocal delineation of clinico-genetic subgroups and development of a new model for outcome prediction in neuroblastoma. J Clin Oncol submitted.
37. MD Norris, SB Bordow, PS Haber, GM Marshall, M Kavallaris, J Madafiglio, SL Cohn, H Salwen, ML Schmidt, DR Hipfner, et al: Evidence that the MYCN oncogene regulates MRP gene expression in neuroblastoma. Eur J Cancer 1997, 33:1911-6.
38. MB Godfried, M Veenstra, P v Sluis, K Boon, R v Asperen, MC Hermus, BD v Schaik, TP Voute, M Schwab, R Versteeg, et al: The N-myc and c-myc downstream pathways include the chromosome 17q genes nm23-H1 and nm23-H2. Oncogene 2002, 21:2097-101.
39. LS Metelitsa, HW Wu, H Wang, Y Yang, Z Warsi, S Asgharzadeh, S Groshen, SB Wilson, RC Seeger: Natural Killer T Cells Infiltrate Neuroblastomas Expressing the Chemokine CCL2. J Exp Med 2004, 199:1213-21.
40. S Motohashi, S Kobayashi, T Ito, KK Magara, O Mikuni, N Kamada, T Iizasa, T Nakayama, T Fujisawa, M Taniguchi: Preserved IFN-alpha production of circulating Valpha24 NKT cells in primary lung cancer patients. Int J Cancer 2002, 102:159-65.
Paper 2 74
Paper 2 75
41. MV Dhodapkar, MD Geller, DH Chang, K Shimizu, S Fujii, KM Dhodapkar, J Krasovsky: A reversible defect in natural killer T cell function characterizes the progression of premalignant to malignant multiple myeloma. J Exp Med 2003, 197:1667-76.
42. B Bodey, B Bodey, Jr., SE Siegel, HE Kaiser: Controversies on the prognostic significance of tumor infiltrating leukocytes in solid human tumors. Anticancer Res 2000, 20:1759-68.
43. T Iwahara, J Fujimoto, D Wen, R Cupples, N Bucay, T Arakawa, S Mori, B Ratzkin, T Yamamoto: Molecular characterization of ALK, a receptor tyrosine kinase expressed specifically in the nervous system. Oncogene 1997, 14:439-49.
44. WG Dirks, S Fahnrich, Y Lis, E Becker, RA MacLeod, HG Drexler: Expression and functional analysis of the anaplastic lymphoma kinase (ALK) gene in tumor cell lines. Int J Cancer 2002, 100:49-56.
45. I Miyake, Y Hakomori, A Shinohara, T Gamou, M Saito, A Iwamatsu, R Sakai: Activation of anaplastic lymphoma kinase is responsible for hyperphosphorylation of ShcC in neuroblastoma cell lines. Oncogene 2002, 21:5823-34.
46. L Lamant, K Pulford, D Bischof, SW Morris, DY Mason, G Delsol, B Mariame: Expression of the ALK tyrosine kinase gene in neuroblastoma. Am J Pathol 2000, 156:1711-21.
47. F Pattyn, F Speleman, A De Paepe, J Vandesompele: RTPrimerDB: the real-time PCR primer and probe database. Nucleic Acids Res 2003, 31:122-3.
48. J Vandesompele, A De Paepe, F Speleman: Elimination of primer-dimer artifacts and genomic coamplification using a two-step SYBR green I real-time RT-PCR. Anal Biochem 2002, 303:95-8.
49. J Vandesompele, K De Preter, F Pattyn, B Poppe, N Van Roy, A De Paepe, F Speleman: Accurate normalization of real-time quantitative RT-PCR data by geometric averaging of multiple internal control genes. Genome Biol 2002, 3:RESEARCH0034.
50. D Bruder, M Probst-Kepper, AM Westendorf, R Geffers, S Beissert, K Loser, H von Boehmer, J Buer, W Hansen: Neuropilin-1: a surface marker of regulatory T cells. Eur J Immunol 2004, 34:623-30.
51. C Li, W Hung Wong: Model-based analysis of oligonucleotide arrays: model validation, design issues and standard error application. Genome Biol 2001, 2:RESEARCH0032.
52. KD Dahlquist, N Salomonis, K Vranizan, SC Lawlor, BR Conklin: GenMAPP, a new tool for viewing and analyzing microarray data on biological pathways. Nat Genet 2002, 31:19-20.
3 Discussion A transcriptome wide expression profile of the progenitor cells of neuroblastoma was successfully
obtained. Thus far, no other research groups have been able to achieve this goal due to several
technical hurdles. First of all, the cells can only be obtained from foetal material which is, for obvious
reasons, not easily accessible for research purposes. Secondly, the number of cells in the foetal
adrenal medulla is limited and can only be obtained by microdissection. We were able to put together
a modified protocol for the collection of cells and RNA isolation which yielded high quality RNA. The
major critical steps in this procedure are the use of an RNase free knife (treated with NaOH) for
making sections of snap-frozen tissues and the development of a fast haematoxylin-eosin staining
protocol with RNase free recipients and solutions. RNA quality measures at each step during the
procedure, clearly demonstrated that RNA quality is only minimally reduced at the end of the process.
Finally, the successful application of a two-round labelling protocol followed by hybridisation to high-
density oligonucleotide chips provided us with a normal neuroblast transcriptome profile. Comparison
of these expression data with real-time quantitative RT-PCR expression levels for selected genes
convincingly showed that the developed procedure provided a reliable expression profile.
We anticipate that the neuroblast transcription profile, which will be made publicly available, will serve
as an important normal reference for future neuroblastoma transcriptome analyses, and in this way will
rapidly increase our knowledge about the genes and pathways that are deregulated and involved in
the genesis of neuroblastoma. A preliminary data-mining on published neuroblastoma expression
profiles obtained with the same oligonucleotide chips showed [226], for the first time, that tumours
belonging to the 3 different clinico-genetic subgroups have indeed different expression profiles [68]. In
the near future, neuroblastomas selected from different clinico-genetic subgroups will be analysed
using the same two-round labelling protocol. In this way, we will be able to compare normal neuroblast
and neuroblastoma transcriptomes, and gain insights into the pathways that are deregulated in
neuroblastomas of the different clinico-genetic subgroups.
As our study clearly illustrates the feasibility of isolation of high quality RNA from microdissected cells
and subsequent amplification with preservation of the differential gene expression pattern, other
researchers might be stimulated to embark on similar endeavour within their specific areas of
research. For example, this strategy opens up possibilities for transcriptome profiling of different cell
populations within heterogeneous tumours.
Considering the clinical and genetic variety of neuroblastomas, we can not guarantee that the
microdissected neuroblasts are appropriate reference cells for all types of neuroblastoma. As the
microdissected neuroblasts reflect only a small time frame, it is possible that some neuroblastomas
originate from a slightly more or less differentiated cell type. Future experiments might also lead to
microdissected neuroblasts from other gestational time points. However, expression studies reveal
that many neuroblastoma marker genes are expressed in the normal neuroblast cells, thus
emphasising their close relationship.
Chapter 2: Isolation and expression profiling of normal foetal neuroblasts 76

Chapter 2: Isolation and expression profiling of normal foetal neuroblasts 77

Chapter 3 Investigation of the 2p amplicon in neuroblastoma
1 Introduction 79 2 Results 80
2.1 PAPER 3 80 2.2 PAPER 4 90
3 Discussion 105
Chapter 3: Investigation of the 2p amplicon in neuroblastoma 78
1 Introduction Proto-oncogene amplification has often been recognised as a prognostically unfavourable parameter
and occurs in various tumour types. Notorious examples are amplification of EGFR (epidermal growth
factor receptor) in glioblastoma, ERBB2 (HER-2/neu) in breast cancer and MYCN in neuroblastoma. In
fact, MYCN amplification was the first genetic parameter that was widely used as marker for therapy
stratification (see 2.2.3 of Chapter 1). Until recently, detection of MYCN amplification was done by
Southern blot analysis. However, this technique has intrinsic limitations as it is labour-intensive and
demands large amounts of DNA. More recently, FISH was introduced as an alternative method. FISH
analysis has a very high sensitivity and specificity for the detection of MYCN amplification, but is not
completely devoid of errors. Errors can be obtained due to several reasons, including unrepresentative
sampling of heterogeneous tumours, presence of normal cells or necrotic cells, technical problems
and human errors. Therefore, a second independent technique has been used to assess this
important prognostic factor in parallel with FISH [227]. The introduction of real-time quantitative PCR
offered a valuable alternative for copy number assessment of target genes by FISH or Southern blot
[207]. Advantages are high sensitivity, lack of post-PCR manipulations and need of only nanogram
quantities of input DNA [228]. PAPER 3 describes the development and evaluation of a relatively
simple and high-throughput method based on real-time quantitative PCR to assess MYCN
amplification or gain in neuroblastoma specimens.
In addition to the introduction and validation of a sensitive PCR-based method for determination of
MYCN gene copy number, we also describe in this chapter a new approach for identification of other
putative proto-oncogenes within the MYCN amplicon. This investigation was based on a new
methodology combining (1) subtractive cDNA cloning of a neuroblastoma cell line with and without
MYCN amplification [94] and (2) subsequent CGH on cDNA microarrays of the subtracted clones.
PAPER 4 reports the introduction of cDNA microarrays and the application of CGH, leading to the
identification of known and new amplified and overexpressed genes located on chromosome arm 2p.
At the same time, this study clearly demonstrates the usefulness of this methodology for the molecular
dissection of amplified regions in tumours. As the SRO of amplification on 2p only harbours the MYCN
gene, the role of most MYCN co-amplified genes in neuroblastoma might be questioned. However,
more and more observations indicate that co-amplified genes may contribute to the tumour phenotype
and behaviour [106-110]. Therefore, further dissection of amplicons is assumed to be of importance in
order to understand the sometimes unpredictable tumour behaviour and response to current therapy
schemes.
Chapter 3: Investigation of the 2p amplicon in neuroblastoma 79
2 Results
2.1 PAPER 3
Quantification of MYCN, DDX1, and NAG gene copy number in neuroblastoma using a real-time quantitative PCR assay
De Preter Katleen, Speleman Frank, Combaret Valérie, Lunec John, Laureys Geneviève, Eussen Bert
HJ, Francotte Nadine, Board Julian, Pearson Andy DJ, De Paepe Anne, Van Roy Nadine,
Vandesompele Jo
Mod Pathol 2002 Feb;15(2):159-66
Chapter 3: Investigation of the 2p amplicon in neuroblastoma 80
Quantification of MYCN, DDX1, and NAG Gene CopyNumber in Neuroblastoma Using a Real-TimeQuantitative PCR AssayKatleen De Preter, M.Sc.,Frank Speleman, Ph.S.Valérie Combaret, Ph.D., John Lunec, Ph.D.,Geneviève Laureys, M.D., Ph.D., Bert H.J. Eussen, Nadine Francotte, M.D.,Julian Board, Andy D.J. Pearson, M.D., Anne De Paepe, M.D., Ph.D., Nadine Van Roy, Ph.D.,Jo Vandesompele, M.Sc.
Center for Medical Genetics (KDP, FS, ADP, NVR, JV), and Department of Pediatric Hemato-Oncology(GL), Ghent University Hospital, Ghent, Belgium; Molecular Oncology Unit (VC), Centre Léon Bérard,Lyon, France; Cancer Research Unit (JL, JB), Department of Child Health (AP), University of Newcastle,Newcastle upon Tyne, United Kingdom; Department of Clinical Genetics (BE), Erasmus University,Rotterdam, The Netherlands; and Department of Pediatrics (Hemato-Oncology section) (NF), CliniquesSaint-Joseph Espérance, Montegnée, Belgium
Amplification of the proto-oncogene MYCN is astrong adverse prognostic factor in neuroblastomapatients in all tumor stages. The status of the MYCNgene has become an important factor in clinicaldecision making and therapy stratification. Conse-quently, fast and accurate assessment of MYCNgene copy number is of the utmost importance andthe use of two independent methods to determineMYCN status is recommended. For these reasons wehave developed and evaluated a real-time quantita-tive PCR (Q-PCR) assay as an alternative for time-consuming Southern blot analysis (SB), and as asecond independent technique in parallel with flu-orescence in situ hybridization (FISH) analysis. Ad-vantages of Q-PCR are a large dynamic range ofquantification, no requirement for post-PCR sam-ple handling and the need for very small amounts ofstarting material. The accuracy of the assay wasillustrated by measurement of MYCN single genecopy changes in DNA samples of two patients with2p deletion and duplication, respectively. Two dif-ferent detection chemistries i.e., a sequence specificTaqMan probe and a generic DNA binding dye SYBRGreen I were evaluated and shown to yield similar
results. Also, two different calculation methods forcopy number determination were used i.e., the ki-netic method and the comparative CT method, andshown to be equivalent. In total, 175 neuroblastomasamples with known MYCN status, as determinedby FISH and/or SB, were examined. Q-PCR datawere highly concordant with FISH and SB data. Inaddition to MYCN copy number evaluation, DDX1and NAG gene copy numbers were determined us-ing a similar Q-PCR strategy. Survival analysispointed out that DDX1 and/or NAG amplificationhas no additional adverse effect on prognosis.
KEY WORDS: DDX1 amplification, MYCN amplifica-tion, NAG amplification, Neuroblastoma, Real-timequantitative PCR, SYBR Green I, Survival.
Mod Pathol 2002;15(2):159–166
Neuroblastoma (NB) is the most frequent extra-cranial solid tumor in children below the age of 5years. NB shows a wide clinical and genetic het-erogeneity (1): most patients with localized dis-ease (stages 1 and 2) are infants (less than 1 year)with excellent survival after surgical treatmentonly, whereas most older children (�1 year) havewidespread metastasis (stages 3 and 4) and needadditional chemotherapy and hematopoieticstem cell rescue. Stage 4S tumors predominantlyoccur in infants and may regress and disappearwithout treatment. Age and clinical stage are twoimportant clinical parameters in prediction oftreatment outcome and survival. In addition,many biological parameters have been tested fortheir prognostic power to further improve theselection of patients, which require intensive
Copyright © 2002 by The United States and Canadian Academy ofPathology, Inc.VOL. 15, NO. 2, P. 159, 2002 Printed in the U.S.A.Date of acceptance: December 11, 2001.Katleen De Preter is an aspirant with the Fund for Scientific Research,Flanders (FWO-Vlaanderen). Nadine Van Roy is a postdoctoral researcherwith the FWO. The work was also supported by the Flemish Institute forthe Promotion of Scientific Technological Research in Industry (IWT),BOF-grant 011F1200 and 011B4300, GOA-grant 12051397 and FWO-grantG.0028.00.Address reprint requests to: Frank Speleman, Center for Medical Genetics,Ghent University Hospital 1K5, De Pintelaan 185, 9000 Ghent, Belgium;e-mail: [email protected]; fax: 32-(0)9-2404970.
159
Paper 3 81
treatment (2). Amplification of the MYCN proto-oncogene was recognized as a strong indepen-dent adverse prognostic factor (in particular inpatients with 1, 2, and 4S disease stage) (3) andhas been widely used in treatment stratification.More recently, 17q gain was shown to be the mostpowerful predictive factor and for this reason 17qstatus is also being increasingly analyzed in clin-ical samples (4).
For detection of MYCN amplification (MNA)both fluorescence in situ hybridization (FISH)and Southern blot analysis (SB) have been ap-plied. FISH allows rapid and accurate determina-tion of MYCN copy number, allows MYCN copynumber evaluation at the single cell level (5) andcan be performed on tumor imprints of biopsiesthat can be evaluated for tumor cell morphologyand content by combination with immunohisto-chemical staining (6). Despite the high sensitivityand specificity of FISH for detection of MNA,errors in assessment of MYCN copy number, al-beit rare, may occur. Consequently application oftwo independent methods for analysis of MYCNgene copy number has been proposed (Ambros etal., submitted).
In most laboratories SB was the standard methodfor the assessment of MYCN gene copy number.Unfortunately, SB is laborious, time-consumingand requires considerable amounts of DNA fromfresh or frozen samples. To circumvent these prob-lems a competitive or semi-quantitative PCR assayhas been introduced (7, 8), but both methods offeronly semi-quantitative analysis of gene amplifica-tion in a small dynamic range and are prone tocross contamination due to post-PCR handling.
These problems were recently overcome by theintroduction of real-time quantitative PCR (Q-PCR).This technique offers major advantages comparedwith conventional methods and former PCR basedstrategies, including the large dynamic range ofquantification, the exclusion of post-PCR manipu-lations, thus greatly reducing the risk of carry-overcontamination, the possibility to perform the assayon only minimal amounts of tumor material andthe high-throughput capacity (9, 10).
The major aim of this study was to design andvalidate a Q-PCR assay for fast and accurate detec-tion of MNA in surgical NB samples. To this pur-pose, MYCN copy numbers were determined in 141primary NB tumors, 34 NB cell lines, two patientswith a constitutional deletion or duplication involv-ing the MYCN locus, and normal leukocyte DNAsamples. These results were compared with previ-ous FISH and/or SB results. In addition we deter-mined the copy number of DDX1 and NAG. Bothgenes are known to be co-amplified in subsets ofMYCN amplified tumors (11–14). The copy num-bers of the two latter genes were used to determine
a possible correlation of co-amplification with sur-vival and risk to relapse of the patient.
MATERIALS AND METHODS
Tumor Samples and DNA IsolationNB tumor samples were collected at the Ghent
University Hospital (Ghent, Belgium) (n-20), in theMolecular Oncology Unit (Lyon, France) (n-74),and in the Cancer Research Unit (Newcastle,United Kingdom) (n-47). In addition 34 NB celllines were included in the analysis as well as leu-kocyte DNA from normal individuals and two sam-ples from patients with a distal 2p24 deletion orduplication, respectively. Tumor DNA was ex-tracted using either the Easy DNA kit following theinstructions of the manufacturer (Invitrogen, Carls-bad, CA), a standard proteinase K/SDS procedureusing a Phase-lock tube (Eppendorf, Hamburg,Germany) or the Nucleon method (Scotlab, Paisley,Scotland). Leukocyte DNA was extracted from pe-ripheral blood samples using the Blood and CellCulture DNA mini kit following the instructions ofthe manufacturer (Qiagen, Hilden, Germany). AllDNA samples were stored at �20°C.
The MYCN copy number of all tumor samplesand cell lines was previously determined usingFISH and/or SB. Q-PCR quantifications were per-formed on 20 tumor DNA samples from Ghent and74 from France, in total 63 non-MNA samples and31 MNA samples. To increase the number of pri-mary tumors in the different amplification classesfor the survival analysis, 47 additional samples fromthe UK were analyzed (3 of the 47 cases were non-MNA). In addition, 34 NB cell lines were examined.
Real-Time Quantitative PCR Methodology
Detection Chemistries and NormalizationCopy numbers for MYCN were determined using
both TaqMan and SYBR Green I detection chemis-try, whereas DDX1 and NAG copy numbers wereonly determined by the generic dsDNA binding dyeSYBR Green I. To account for possible variationrelated to DNA input amounts or the presence ofPCR inhibitors, two reference genes BCMA andSDC4 were simultaneously quantified in separatetubes for each tumor sample.
QuantificationQuantification was performed using both the
standard curve method and the comparative CT
method. Standard curves were constructed in eachPCR run and the copy numbers of the genes in eachsample were interpolated using these standardcurves. For the test genes MYCN, DDX1 and NAG,serial dilutions of NB cell line LA-N-1 DNA was
160 Modern Pathology
Paper 3 82

used as template for the standard curve. For thereference genes, a standard curve was constructedusing normal human genomic DNA (Roche AppliedScience, Basel, Switzerland). Because these two dif-ferent DNA samples were used for the constructionof the standard curves for either the test and refer-ence genes, the copy numbers of all genes werenormalized against a calibrator DNA sample with adisomic copy number of all genes (normal humanDNA, Roche).
After normalization to the calibrator, the haploidcopy number of MYCN, DDX1 and NAG was calcu-lated by dividing these normalized values by thegeometric mean copy number of the two referencegenes (BCMA and SDC4).
Instead of interpolating unknown samples from astandard curve, it is also possible to calculate thehaploid copy number solely based on the observedCT values:
2���CT �(1 � E)��CTgene
(1 � E)��CTreferencegene
,with
E � efficiency of the PCR reaction (setat default value 0.95),
�CTgene� difference in threshold cycle value
between test sample and calibratorsample for the gene under investi-gation (test gene) and
�CTreferencegene� difference in threshold cycle value
between test sample and calibratorsamle for reference gene.
PCR ConditionsAll primers and probes were designed with
Primer Express 1.0 software (Applied BiosystemsFoster City, CA) using default TaqMan parameters,with modified minimum amplicon length require-ments (85 bp). An additional requirement consistedof a maximum GC content of 40% for the five last 3'end nucleotides. The sequence of the primers forthe target genes are MYCN F 5' CGCAAAAGCCAC-CTCTCATTA 3' and MYCN R 5' TCCAGCAGATGCCA-CATAAGG 3', DDX1 F 5' CCCAACTGATATCCAGGCT-GAA 3' and DDX1 R 5' AGTGTGTCCCCAGCTA-CCAATC 3', NAG F 5' AACATGGACTCGAGAAAC-CAATTT 3' and NAG R 5' TTACTCACTTCCGGC-CAGTGT 3'. The primer sequences for the referencegenes are BCMA F 5' CGACTCTGACCATTGCTTTCC3' and BCMA R 5' AAGCAGCTGGCAGGCTCTT 3',SDC4 F 5' CAGGGTCTGGGAGCCAAGT 3' and SDC4 R5' GCACAGTGCTGGACATTGACA 3'. The sequencesof the TaqMan probes are MYCN TET–TTCTGT-AAATACCATTGACACATCCGCCTTTTGT-TAMRA,BCMA TET-CAACCATTCTTGTCACCACGAAAACGAA-TAMRA and SDC4 FAM-CCCACCGAACCCAAG-AAACTAGAGGAGAAT-TAMRA.
PCR reactions were performed on an ABI Prism7700 Sequence Detection System and an ABI Prism5700 SDS (Applied Biosystems), which yielded sim-ilar results (data not shown). Amplification mix-tures (25 �l) for MYCN, DDX1, NAG, BCMA andSDC4 quantification contained template DNA, 1 �SYBR Green I Master Mix buffer (Applied Biosys-tems) (3 mM MgCl2) and 300 nM of each primer.Amplification mixtures (25 �l) for MYCN, BCMAand SDC4 copy number determination with theTaqMan chemistry consisted of template DNA, 1 �TaqMan buffer A (Applied Biosystems), 500 nM ofeach primer, 200 nM of the probe, 1.25 U Ampli-TaqGold DNA polymerase (Applied Biosystems),200 �M of each dNTP and 5 mM MgCl2; or 1 �TaqMan Universal PCR Master Mix (Applied Bio-systems), 500 nM of each primer and 200 nM of theprobe. The cycling conditions comprised 10 min-utes polymerase activation at 95°C, 40 cycles at95°C for 15 seconds and 60°C for 1 minute.
Each test gene assay included: 1) a standardcurve of five serial 10-fold dilution points of LA-N-1DNA (ranging from 100 ng to 10 pg) (in duplicate),2) a no-template control (in duplicate), 3) 10 ng ofcalibrator human genomic DNA (Roche) (quadru-plicated), and 4) approximately 10 ng of tumor DNA(in duplicate).
Each reference gene assay included: 1) a standardcurve of four serial 10-fold dilution points of humangenomic DNA (Roche) (ranging from 200 ng to 0.2ng) (in duplicate), 2) a no-template control (in du-plicate), 3) 10 ng of calibrator human genomic DNA(Roche) (quadruplicated), and 4) about 10 ng oftumor DNA (in duplicate). For all duplicated tubesa coefficient of variation (CV) was determined oncalculated copy numbers. Samples with a CV higherthan 20% were re-tested.
Primer Concentration OptimizationA 3-by-3-primer matrix (combinations of 100, 300
and 900 nM of each forward and reverse primer) wasanalyzed to determine the optimal concentrationsof both forward and reverse primer. The combina-tion of primer concentrations that resulted in thelowest CT-value (Threshold Cycle), the highest flu-orescent signal (�Rn) and lack of primer dimer for-mation or nonspecific amplification was chosen asoptimal pair.
Melting Curve Analysis of SYBR Green I AssaysFor each PCR run with SYBR Green I detection, a
melting curve analysis was performed to guaranteethe specificity in each reaction tube (absence ofprimer dimers and other nonspecific products).The SDS software supplied with the ABI 5700 allowsautomatic melting curve analysis for all tested sam-
Q-PCR Detection of MYCN Amplification (De Preter et al.) 161
Paper 3 83
ples in a given run. On the ABI 7700, an additionalrun must be performed after PCR amplification,where SYBR Green I fluorescence of generatedproducts is continuously monitored throughouttemperature ramp from 65°C to 90°C for 14 min-utes. After data recording, a Sequence DetectionSoftware (version 1.7. Applied Biosystems) multi-component file is exported and imported in a betaversion of Dissociation Curves (Applied Biosys-tems) to display the melting curves and first deriv-ative melting peaks.
FISH Analysis of MYCN, DDX1, NAG, and SDC4and SB Analysis of MYCN
FISH was performed using the LSI N-myc Spec-trumOrange probe (Vysis, Downers Grove, IL) orthe MYCN digoxigenin labeled probe (Oncor Appli-gene, Gaithersburg, MD) for the MYCN gene andselected BAC or PAC clones for DDX1 (RP11–422A6), NAG (RP11–516B14), and SDC4 (RP3–453C12). Labeling and FISH was performed as de-scribed (15). SB was performed following describedprotocols (16 –18). The MYCN status in 42 NB tumorsamples was determined with both FISH and SB, 79NB tumor samples were examined with SB only,and 20 NB tumor samples and all NB cell lines wereexamined with FISH only.
Statistical AnalysisAll data were stored and processed in an Excel
sheet. Statistical tests were performed using SPSS10.0. Overall survival was evaluated from the date ofdiagnosis to the date of last follow-up or until deathoccurred. Event free survival was evaluated fromthe date of diagnosis to the date of last follow up oruntil relapse or death occurred. Survival analysiswas performed using Kaplan Meier graphs and log-rank statistics to evaluate the significance of thedifferences.
RESULTS
Choice and Evaluation of Reference GenesBased on comparative genomic hybridization re-
sults of 204 primary NB tumors (19), two genes(BCMA and SDC4) were selected as reference genes.BCMA and SDC4 are located in chromosomal re-gions that rarely show genetic abnormalities in NB(16p13 and 20q13, respectively). To assess the va-lidity of the genes as appropriate reference genes,we determined the copy number ratio BCMA/SDC4in 24 normal leukocyte DNA samples and 175 NBtumors and cell lines. The observed ratio measuredfor normal (1.06 � 0.21 SD) and tumor DNA (1.02 �0.41 SD) were similar (P � 0.457�0.05) and bothsignificantly equal to 1 (P � 0.190�0.05 and P �
0.552�0.05), thus confirming their validity as ap-propriate disomic reference genes in NB.
Comparison of SYBR Green I andTaqMan Chemistries
For all samples, MYCN copy numbers were deter-mined using SYBR Green I and TaqMan chemistries.A paired sample t test showed that the obtained re-sults by both chemistries were significantly similar(P � 0.872�0.05). In addition, the Spearman corre-lation coefficient of 0.963 (P � 1E-6 �0.01) demon-strated the equivalence of both chemistries. Theadditional specificity associated with the use of aTaqMan probe compared with the generic DNAbinding dye SYBR Green I is compensated by meltingcurve analysis of the generated PCR products (20).Reactions for all genes and samples were shown tohave only one melting peak, which guarantees spe-cific amplification and accurate quantification.
Comparison of Quantification MethodsTwo methods for determination of the haploid
copy number (i.e., the MYCN copy number normal-ized to the disomic copy number of the referencegenes) from the raw data of a real-time Q-PCRreaction are available. The relative kinetic methodis based on interpolated data from a standardcurve, whereas the comparative CT method trans-forms a difference in CT values (between the testsample and the calibrator sample) into a copy num-ber ratio.
The relative kinetic method takes the actual effi-ciency of the reaction into account. For construc-tion of the standard curves of the target genesMYCN, DDX1 and NAG, serial dilutions of NB cellline LA-N-1 DNA were used. Preliminary Q-PCRanalysis showed that LA-N-1 contained multiplecopies of MYCN, DDX1 and NAG.
The comparative CT method is less laborious, asno standard curves are required. We used 0.95 asdefault amplification efficiency in our comparativeCT quantification. For all 175 samples the haploidcopy number of MYCN, DDX1 and NAG was calcu-lated using both methods. Measurements obtainedwith both methods were virtually identical (Spear-man correlation coefficient � 0.992, P � 1E-6).
Evaluation of Q-PCR AccuracyThe accuracy of the assay was tested on DNA
from two patients with a constitutional distal 2pdeletion and duplication, respectively. The samplewith 2p deletion showed a haploid copy number ofapproximately 0.5 and the sample with 2p duplica-tion showed a haploid copy number of approxi-mately 1.5 (Fig. 1). In addition, the haploid MYCNcopy number was measured in 20 normal leukocyte
162 Modern Pathology
Paper 3 84
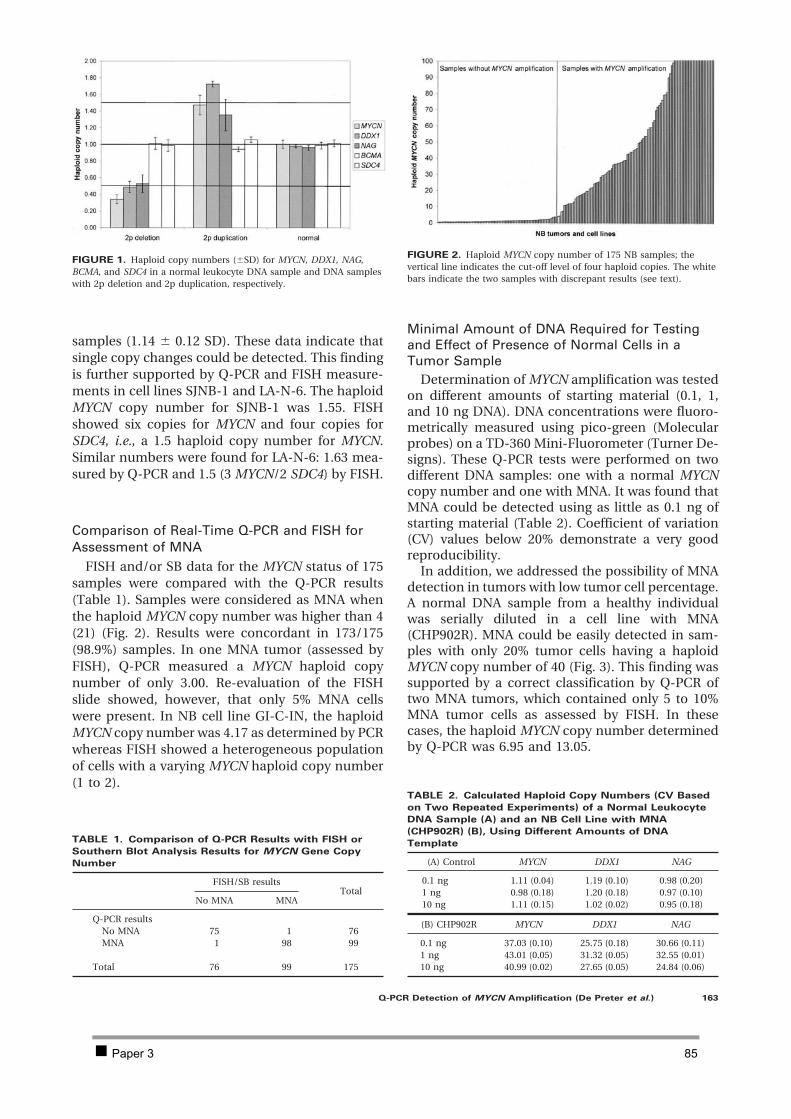
samples (1.14 � 0.12 SD). These data indicate thatsingle copy changes could be detected. This findingis further supported by Q-PCR and FISH measure-ments in cell lines SJNB-1 and LA-N-6. The haploidMYCN copy number for SJNB-1 was 1.55. FISHshowed six copies for MYCN and four copies forSDC4, i.e., a 1.5 haploid copy number for MYCN.Similar numbers were found for LA-N-6: 1.63 mea-sured by Q-PCR and 1.5 (3 MYCN/2 SDC4) by FISH.
Comparison of Real-Time Q-PCR and FISH forAssessment of MNA
FISH and/or SB data for the MYCN status of 175samples were compared with the Q-PCR results(Table 1). Samples were considered as MNA whenthe haploid MYCN copy number was higher than 4(21) (Fig. 2). Results were concordant in 173/175(98.9%) samples. In one MNA tumor (assessed byFISH), Q-PCR measured a MYCN haploid copynumber of only 3.00. Re-evaluation of the FISHslide showed, however, that only 5% MNA cellswere present. In NB cell line GI-C-IN, the haploidMYCN copy number was 4.17 as determined by PCRwhereas FISH showed a heterogeneous populationof cells with a varying MYCN haploid copy number(1 to 2).
Minimal Amount of DNA Required for Testingand Effect of Presence of Normal Cells in aTumor Sample
Determination of MYCN amplification was testedon different amounts of starting material (0.1, 1,and 10 ng DNA). DNA concentrations were fluoro-metrically measured using pico-green (Molecularprobes) on a TD-360 Mini-Fluorometer (Turner De-signs). These Q-PCR tests were performed on twodifferent DNA samples: one with a normal MYCNcopy number and one with MNA. It was found thatMNA could be detected using as little as 0.1 ng ofstarting material (Table 2). Coefficient of variation(CV) values below 20% demonstrate a very goodreproducibility.
In addition, we addressed the possibility of MNAdetection in tumors with low tumor cell percentage.A normal DNA sample from a healthy individualwas serially diluted in a cell line with MNA(CHP902R). MNA could be easily detected in sam-ples with only 20% tumor cells having a haploidMYCN copy number of 40 (Fig. 3). This finding wassupported by a correct classification by Q-PCR oftwo MNA tumors, which contained only 5 to 10%MNA tumor cells as assessed by FISH. In thesecases, the haploid MYCN copy number determinedby Q-PCR was 6.95 and 13.05.
FIGURE 1. Haploid copy numbers (�SD) for MYCN, DDX1, NAG,BCMA, and SDC4 in a normal leukocyte DNA sample and DNA sampleswith 2p deletion and 2p duplication, respectively.
TABLE 1. Comparison of Q-PCR Results with FISH or
Southern Blot Analysis Results for MYCN Gene Copy
Number
FISH/SB resultsTotal
No MNA MNA
Q-PCR resultsNo MNA 75 1 76MNA 1 98 99
Total 76 99 175
FIGURE 2. Haploid MYCN copy number of 175 NB samples; thevertical line indicates the cut-off level of four haploid copies. The whitebars indicate the two samples with discrepant results (see text).
TABLE 2. Calculated Haploid Copy Numbers (CV Based
on Two Repeated Experiments) of a Normal Leukocyte
DNA Sample (A) and an NB Cell Line with MNA
(CHP902R) (B), Using Different Amounts of DNA
Template
(A) Control MYCN DDX1 NAG
0.1 ng 1.11 (0.04) 1.19 (0.10) 0.98 (0.20)1 ng 0.98 (0.18) 1.20 (0.18) 0.97 (0.10)10 ng 1.11 (0.15) 1.02 (0.02) 0.95 (0.18)
(B) CHP902R MYCN DDX1 NAG
0.1 ng 37.03 (0.10) 25.75 (0.18) 30.66 (0.11)1 ng 43.01 (0.05) 31.32 (0.05) 32.55 (0.01)10 ng 40.99 (0.02) 27.65 (0.05) 24.84 (0.06)
Q-PCR Detection of MYCN Amplification (De Preter et al.) 163
Paper 3 85
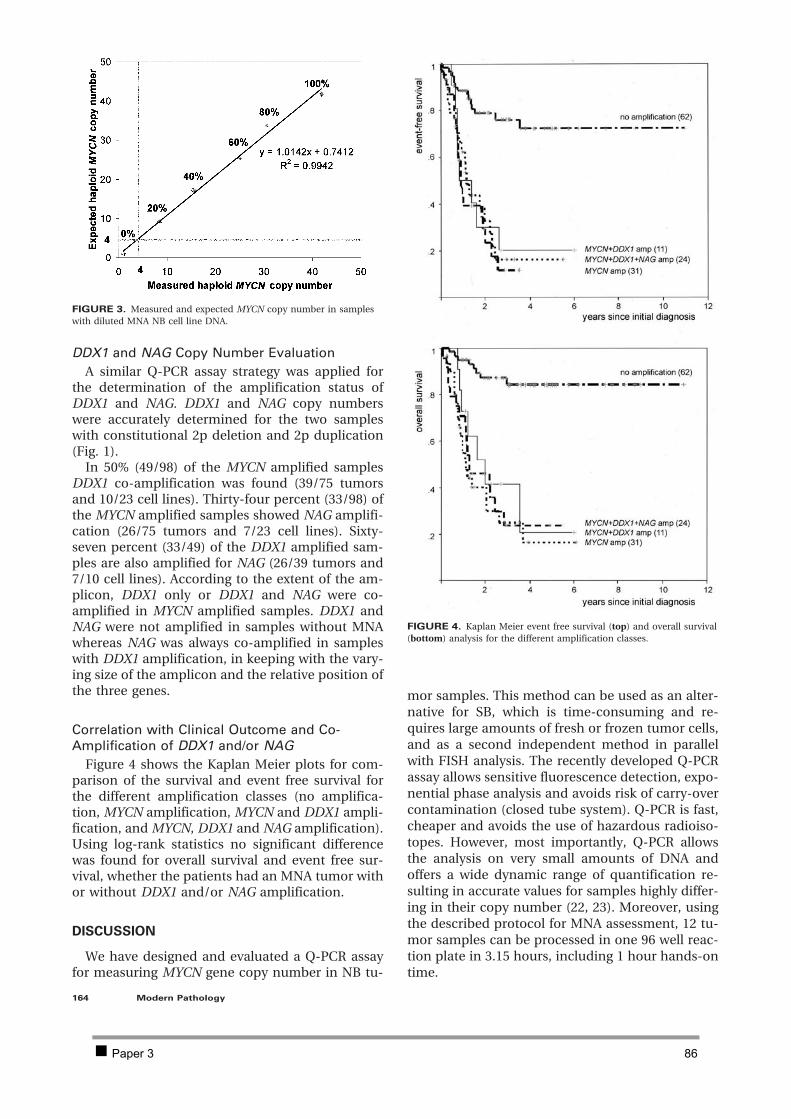
DDX1 and NAG Copy Number EvaluationA similar Q-PCR assay strategy was applied for
the determination of the amplification status ofDDX1 and NAG. DDX1 and NAG copy numberswere accurately determined for the two sampleswith constitutional 2p deletion and 2p duplication(Fig. 1).
In 50% (49/98) of the MYCN amplified samplesDDX1 co-amplification was found (39/75 tumorsand 10/23 cell lines). Thirty-four percent (33/98) ofthe MYCN amplified samples showed NAG amplifi-cation (26/75 tumors and 7/23 cell lines). Sixty-seven percent (33/49) of the DDX1 amplified sam-ples are also amplified for NAG (26/39 tumors and7/10 cell lines). According to the extent of the am-plicon, DDX1 only or DDX1 and NAG were co-amplified in MYCN amplified samples. DDX1 andNAG were not amplified in samples without MNAwhereas NAG was always co-amplified in sampleswith DDX1 amplification, in keeping with the vary-ing size of the amplicon and the relative position ofthe three genes.
Correlation with Clinical Outcome and Co-Amplification of DDX1 and/or NAG
Figure 4 shows the Kaplan Meier plots for com-parison of the survival and event free survival forthe different amplification classes (no amplifica-tion, MYCN amplification, MYCN and DDX1 ampli-fication, and MYCN, DDX1 and NAG amplification).Using log-rank statistics no significant differencewas found for overall survival and event free sur-vival, whether the patients had an MNA tumor withor without DDX1 and/or NAG amplification.
DISCUSSION
We have designed and evaluated a Q-PCR assayfor measuring MYCN gene copy number in NB tu-
mor samples. This method can be used as an alter-native for SB, which is time-consuming and re-quires large amounts of fresh or frozen tumor cells,and as a second independent method in parallelwith FISH analysis. The recently developed Q-PCRassay allows sensitive fluorescence detection, expo-nential phase analysis and avoids risk of carry-overcontamination (closed tube system). Q-PCR is fast,cheaper and avoids the use of hazardous radioiso-topes. However, most importantly, Q-PCR allowsthe analysis on very small amounts of DNA andoffers a wide dynamic range of quantification re-sulting in accurate values for samples highly differ-ing in their copy number (22, 23). Moreover, usingthe described protocol for MNA assessment, 12 tu-mor samples can be processed in one 96 well reac-tion plate in 3.15 hours, including 1 hour hands-ontime.
FIGURE 3. Measured and expected MYCN copy number in sampleswith diluted MNA NB cell line DNA.
FIGURE 4. Kaplan Meier event free survival (top) and overall survival(bottom) analysis for the different amplification classes.
164 Modern Pathology
Paper 3 86
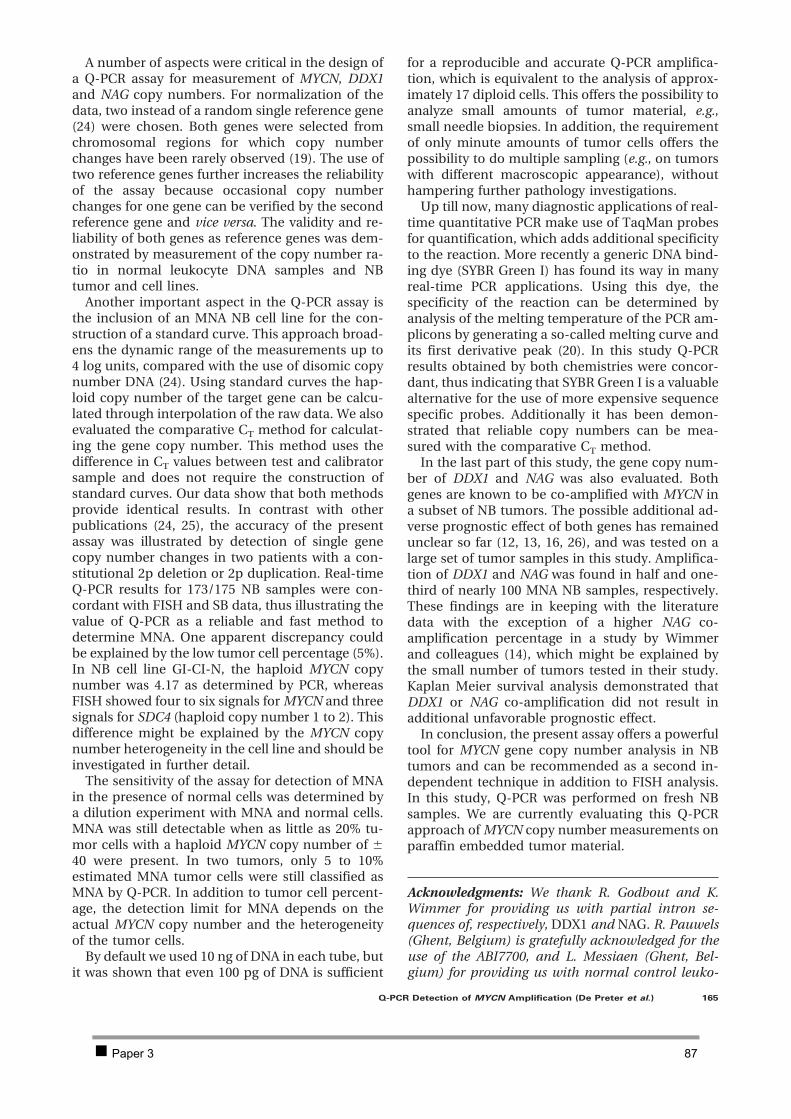
A number of aspects were critical in the design ofa Q-PCR assay for measurement of MYCN, DDX1and NAG copy numbers. For normalization of thedata, two instead of a random single reference gene(24) were chosen. Both genes were selected fromchromosomal regions for which copy numberchanges have been rarely observed (19). The use oftwo reference genes further increases the reliabilityof the assay because occasional copy numberchanges for one gene can be verified by the secondreference gene and vice versa. The validity and re-liability of both genes as reference genes was dem-onstrated by measurement of the copy number ra-tio in normal leukocyte DNA samples and NBtumor and cell lines.
Another important aspect in the Q-PCR assay isthe inclusion of an MNA NB cell line for the con-struction of a standard curve. This approach broad-ens the dynamic range of the measurements up to4 log units, compared with the use of disomic copynumber DNA (24). Using standard curves the hap-loid copy number of the target gene can be calcu-lated through interpolation of the raw data. We alsoevaluated the comparative CT method for calculat-ing the gene copy number. This method uses thedifference in CT values between test and calibratorsample and does not require the construction ofstandard curves. Our data show that both methodsprovide identical results. In contrast with otherpublications (24, 25), the accuracy of the presentassay was illustrated by detection of single genecopy number changes in two patients with a con-stitutional 2p deletion or 2p duplication. Real-timeQ-PCR results for 173/175 NB samples were con-cordant with FISH and SB data, thus illustrating thevalue of Q-PCR as a reliable and fast method todetermine MNA. One apparent discrepancy couldbe explained by the low tumor cell percentage (5%).In NB cell line GI-CI-N, the haploid MYCN copynumber was 4.17 as determined by PCR, whereasFISH showed four to six signals for MYCN and threesignals for SDC4 (haploid copy number 1 to 2). Thisdifference might be explained by the MYCN copynumber heterogeneity in the cell line and should beinvestigated in further detail.
The sensitivity of the assay for detection of MNAin the presence of normal cells was determined bya dilution experiment with MNA and normal cells.MNA was still detectable when as little as 20% tu-mor cells with a haploid MYCN copy number of �40 were present. In two tumors, only 5 to 10%estimated MNA tumor cells were still classified asMNA by Q-PCR. In addition to tumor cell percent-age, the detection limit for MNA depends on theactual MYCN copy number and the heterogeneityof the tumor cells.
By default we used 10 ng of DNA in each tube, butit was shown that even 100 pg of DNA is sufficient
for a reproducible and accurate Q-PCR amplifica-tion, which is equivalent to the analysis of approx-imately 17 diploid cells. This offers the possibility toanalyze small amounts of tumor material, e.g.,small needle biopsies. In addition, the requirementof only minute amounts of tumor cells offers thepossibility to do multiple sampling (e.g., on tumorswith different macroscopic appearance), withouthampering further pathology investigations.
Up till now, many diagnostic applications of real-time quantitative PCR make use of TaqMan probesfor quantification, which adds additional specificityto the reaction. More recently a generic DNA bind-ing dye (SYBR Green I) has found its way in manyreal-time PCR applications. Using this dye, thespecificity of the reaction can be determined byanalysis of the melting temperature of the PCR am-plicons by generating a so-called melting curve andits first derivative peak (20). In this study Q-PCRresults obtained by both chemistries were concor-dant, thus indicating that SYBR Green I is a valuablealternative for the use of more expensive sequencespecific probes. Additionally it has been demon-strated that reliable copy numbers can be mea-sured with the comparative CT method.
In the last part of this study, the gene copy num-ber of DDX1 and NAG was also evaluated. Bothgenes are known to be co-amplified with MYCN ina subset of NB tumors. The possible additional ad-verse prognostic effect of both genes has remainedunclear so far (12, 13, 16, 26), and was tested on alarge set of tumor samples in this study. Amplifica-tion of DDX1 and NAG was found in half and one-third of nearly 100 MNA NB samples, respectively.These findings are in keeping with the literaturedata with the exception of a higher NAG co-amplification percentage in a study by Wimmerand colleagues (14), which might be explained bythe small number of tumors tested in their study.Kaplan Meier survival analysis demonstrated thatDDX1 or NAG co-amplification did not result inadditional unfavorable prognostic effect.
In conclusion, the present assay offers a powerfultool for MYCN gene copy number analysis in NBtumors and can be recommended as a second in-dependent technique in addition to FISH analysis.In this study, Q-PCR was performed on fresh NBsamples. We are currently evaluating this Q-PCRapproach of MYCN copy number measurements onparaffin embedded tumor material.
Acknowledgments: We thank R. Godbout and K.Wimmer for providing us with partial intron se-quences of, respectively, DDX1 and NAG. R. Pauwels(Ghent, Belgium) is gratefully acknowledged for theuse of the ABI7700, and L. Messiaen (Ghent, Bel-gium) for providing us with normal control leuko-
Q-PCR Detection of MYCN Amplification (De Preter et al.) 165
Paper 3 87
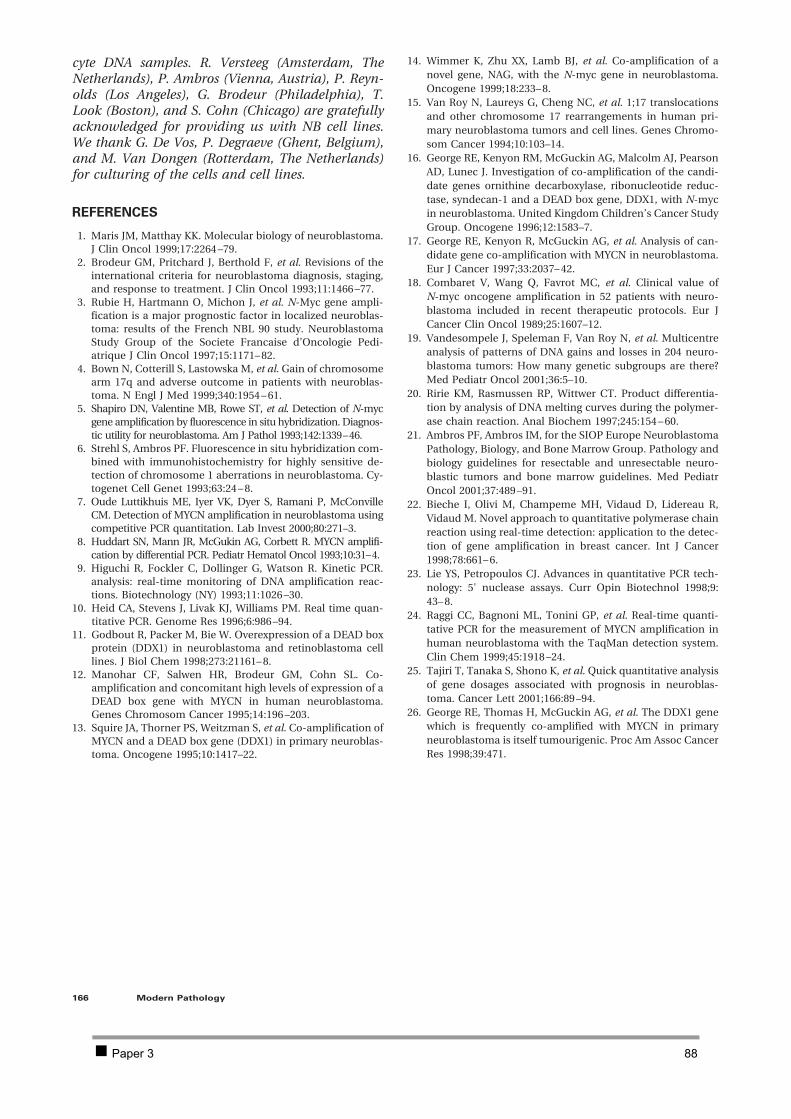
cyte DNA samples. R. Versteeg (Amsterdam, TheNetherlands), P. Ambros (Vienna, Austria), P. Reyn-olds (Los Angeles), G. Brodeur (Philadelphia), T.Look (Boston), and S. Cohn (Chicago) are gratefullyacknowledged for providing us with NB cell lines.We thank G. De Vos, P. Degraeve (Ghent, Belgium),and M. Van Dongen (Rotterdam, The Netherlands)for culturing of the cells and cell lines.
REFERENCES
1. Maris JM, Matthay KK. Molecular biology of neuroblastoma.J Clin Oncol 1999;17:2264 –79.
2. Brodeur GM, Pritchard J, Berthold F, et al. Revisions of theinternational criteria for neuroblastoma diagnosis, staging,and response to treatment. J Clin Oncol 1993;11:1466 –77.
3. Rubie H, Hartmann O, Michon J, et al. N-Myc gene ampli-fication is a major prognostic factor in localized neuroblas-toma: results of the French NBL 90 study. NeuroblastomaStudy Group of the Societe Francaise d’Oncologie Pedi-atrique J Clin Oncol 1997;15:1171– 82.
4. Bown N, Cotterill S, Lastowska M, et al. Gain of chromosomearm 17q and adverse outcome in patients with neuroblas-toma. N Engl J Med 1999;340:1954 – 61.
5. Shapiro DN, Valentine MB, Rowe ST, et al. Detection of N-mycgene amplification by fluorescence in situ hybridization. Diagnos-tic utility for neuroblastoma. Am J Pathol 1993;142:1339–46.
6. Strehl S, Ambros PF. Fluorescence in situ hybridization com-bined with immunohistochemistry for highly sensitive de-tection of chromosome 1 aberrations in neuroblastoma. Cy-togenet Cell Genet 1993;63:24 – 8.
7. Oude Luttikhuis ME, Iyer VK, Dyer S, Ramani P, McConvilleCM. Detection of MYCN amplification in neuroblastoma usingcompetitive PCR quantitation. Lab Invest 2000;80:271–3.
8. Huddart SN, Mann JR, McGukin AG, Corbett R. MYCN amplifi-cation by differential PCR. Pediatr Hematol Oncol 1993;10:31–4.
9. Higuchi R, Fockler C, Dollinger G, Watson R. Kinetic PCR.analysis: real-time monitoring of DNA amplification reac-tions. Biotechnology (NY) 1993;11:1026 –30.
10. Heid CA, Stevens J, Livak KJ, Williams PM. Real time quan-titative PCR. Genome Res 1996;6:986 –94.
11. Godbout R, Packer M, Bie W. Overexpression of a DEAD boxprotein (DDX1) in neuroblastoma and retinoblastoma celllines. J Biol Chem 1998;273:21161– 8.
12. Manohar CF, Salwen HR, Brodeur GM, Cohn SL. Co-amplification and concomitant high levels of expression of aDEAD box gene with MYCN in human neuroblastoma.Genes Chromosom Cancer 1995;14:196 –203.
13. Squire JA, Thorner PS, Weitzman S, et al. Co-amplification ofMYCN and a DEAD box gene (DDX1) in primary neuroblas-toma. Oncogene 1995;10:1417–22.
14. Wimmer K, Zhu XX, Lamb BJ, et al. Co-amplification of anovel gene, NAG, with the N-myc gene in neuroblastoma.Oncogene 1999;18:233– 8.
15. Van Roy N, Laureys G, Cheng NC, et al. 1;17 translocationsand other chromosome 17 rearrangements in human pri-mary neuroblastoma tumors and cell lines. Genes Chromo-som Cancer 1994;10:103–14.
16. George RE, Kenyon RM, McGuckin AG, Malcolm AJ, PearsonAD, Lunec J. Investigation of co-amplification of the candi-date genes ornithine decarboxylase, ribonucleotide reduc-tase, syndecan-1 and a DEAD box gene, DDX1, with N-mycin neuroblastoma. United Kingdom Children’s Cancer StudyGroup. Oncogene 1996;12:1583–7.
17. George RE, Kenyon R, McGuckin AG, et al. Analysis of can-didate gene co-amplification with MYCN in neuroblastoma.Eur J Cancer 1997;33:2037– 42.
18. Combaret V, Wang Q, Favrot MC, et al. Clinical value ofN-myc oncogene amplification in 52 patients with neuro-blastoma included in recent therapeutic protocols. Eur JCancer Clin Oncol 1989;25:1607–12.
19. Vandesompele J, Speleman F, Van Roy N, et al. Multicentreanalysis of patterns of DNA gains and losses in 204 neuro-blastoma tumors: How many genetic subgroups are there?Med Pediatr Oncol 2001;36:5–10.
20. Ririe KM, Rasmussen RP, Wittwer CT. Product differentia-tion by analysis of DNA melting curves during the polymer-ase chain reaction. Anal Biochem 1997;245:154 – 60.
21. Ambros PF, Ambros IM, for the SIOP Europe NeuroblastomaPathology, Biology, and Bone Marrow Group. Pathology andbiology guidelines for resectable and unresectable neuro-blastic tumors and bone marrow guidelines. Med PediatrOncol 2001;37:489 –91.
22. Bieche I, Olivi M, Champeme MH, Vidaud D, Lidereau R,Vidaud M. Novel approach to quantitative polymerase chainreaction using real-time detection: application to the detec-tion of gene amplification in breast cancer. Int J Cancer1998;78:661– 6.
23. Lie YS, Petropoulos CJ. Advances in quantitative PCR tech-nology: 5' nuclease assays. Curr Opin Biotechnol 1998;9:43– 8.
24. Raggi CC, Bagnoni ML, Tonini GP, et al. Real-time quanti-tative PCR for the measurement of MYCN amplification inhuman neuroblastoma with the TaqMan detection system.Clin Chem 1999;45:1918 –24.
25. Tajiri T, Tanaka S, Shono K, et al. Quick quantitative analysisof gene dosages associated with prognosis in neuroblas-toma. Cancer Lett 2001;166:89 –94.
26. George RE, Thomas H, McGuckin AG, et al. The DDX1 genewhich is frequently co-amplified with MYCN in primaryneuroblastoma is itself tumourigenic. Proc Am Assoc CancerRes 1998;39:471.
166 Modern Pathology
Paper 3 88

Chapter 3: Investigation of the 2p amplicon in neuroblastoma 89
2.2 PAPER 4
Combined subtractive cDNA cloning and array CGH: an efficient approach for identification of overexpressed genes in DNA amplicons.
De Preter Katleen, Pattyn Filip, Berx Geert, Strumane Katrien, Menten Björn, Van Roy Frans, De
Paepe Anne, Speleman Frank, Vandesompele Jo
BMC Genomics 2004 Feb 3;5(1):11
Chapter 3: Investigation of the 2p amplicon in neuroblastoma 90
BioMed Central
Page 1 of 14(page number not for citation purposes)
BMC Genomics
Open AccessResearch articleCombined subtractive cDNA cloning and array CGH: an efficient approach for identification of overexpressed genes in DNA ampliconsKatleen De Preter1, Filip Pattyn1, Geert Berx2, Kristin Strumane2, Björn Menten1, Frans Van Roy2, Anne De Paepe1, Frank Speleman1 and Jo Vandesompele*
Address: 1Center for Medical Genetics, Ghent University Hospital 1K5, De Pintelaan 185, 9000 Gent, Belgium and 2Department for Molecular Biomedical Research, Flemish Interuniversity Institute for Biotechnology (VIB), Ghent University, Technologiepark 927, 9052 Zwijnaarde, Belgium
Email: Katleen De Preter - [email protected]; Filip Pattyn - [email protected]; Geert Berx - [email protected]; Kristin Strumane - [email protected]; Björn Menten - [email protected]; Frans Van Roy - [email protected]; Anne De Paepe - [email protected]; Frank Speleman - [email protected]; Jo Vandesompele* - [email protected]
* Corresponding author
AmplificationOverexpressionOncogeneSSHArray CGHNeuroblastoma
AbstractBackground: Activation of proto-oncogenes by DNA amplification is an important mechanism inthe development and maintenance of cancer cells. Until recently, identification of the targetedgenes relied on labour intensive and time consuming positional cloning methods. In this study, weoutline a straightforward and efficient strategy for fast and comprehensive cloning of amplified andoverexpressed genes.
Results: As a proof of principle, we analyzed neuroblastoma cell line IMR-32, with at least twoamplification sites along the short arm of chromosome 2. In a first step, overexpressed cDNAclones were isolated using a PCR based subtractive cloning method. Subsequent deposition of theseclones on a custom microarray and hybridization with IMR-32 DNA, resulted in the identificationof clones that were overexpressed due to gene amplification. Using this approach, amplification ofall previously reported amplified genes in this cell line was detected. Furthermore, four additionalclones were found to be amplified, including the TEM8 gene on 2p13.3, two anonymous transcripts,and a fusion transcript, resulting from 2p13.3 and 2p24.3 fused sequences.
Conclusions: The combinatorial strategy of subtractive cDNA cloning and array CGH analysisallows comprehensive amplicon dissection, which opens perspectives for improved identificationof hitherto unknown targeted oncogenes in cancer cells.
Published: 03 February 2004
BMC Genomics 2004, 5:11
Received: 03 October 2003Accepted: 03 February 2004
This article is available from: http://www.biomedcentral.com/1471-2164/5/11
© 2004 De Preter et al; licensee BioMed Central Ltd. This is an Open Access article: verbatim copying and redistribution of this article are permitted in all media for any purpose, provided this notice is preserved along with the article's original URL.
Paper 4 91
BMC Genomics 2004, 5 http://www.biomedcentral.com/1471-2164/5/11
Page 2 of 14(page number not for citation purposes)
BackgroundHuman cancers frequently manifest amplification of largestretches of DNA, cytogenetically detectable as homoge-neously staining regions (HSR) or double minute chro-matin bodies (dmin). DNA amplification is considered tobe a consequence of the intrinsic genomic instability ofcancer cells, and it is presumed that overexpression of asingle or few amplified genes confers a selective advantageon these HSR or dmin bearing clones. Consequently, acti-vation of proto-oncogenes by amplification is thought toplay an important role in the development and mainte-nance of many human solid tumours [1-3]. Detection ofamplification of many different chromosomal regions invarious tumour types has lead to the identification of thetargeted oncogenes and greatly contributed to our currentunderstanding of the genetic basis of cancer. Furthermore,amplified genes often act as markers of tumour behaviour,drug response, patient outcome, and may represent tar-gets for future molecular cancer therapy.
In the past, various strategies have been used for the detec-tion of amplified chromosomal regions and DNAsequences in cancer. Comparative genomic hybridization(CGH) [4] has been particularly useful for detection ofamplified sequences and assignment of the chromosomalposition [5]. This approach allows whole genome screen-ing for chromosomal imbalances up to 5–10 Mb and geneamplification of sufficiently large amplicons and/orhighly overrepresented regions. Due to this limited reso-lution, a time consuming mapping is required followingamplicon identification in order to pinpoint the putativetarget genes. Recently, two methods were introduced thatallow mapping of the genomic content of amplicons witha 10–100 fold increased resolution. Array CGH employsarrayed fragments of genomic DNA clones (with partial orcomplete sequence information) instead of metaphasechromosomes [6,7]. Digital karyotyping is a SAGE (serialanalysis of gene expression) based method to enumerategenomic DNA tags [8]. This method allows identificationof specific amplifications and deletions that were not pre-viously detected by conventional CGH or other methods.An important limitation of both methods is the inabilityto directly identify the overexpressed genes that are tar-geted by the amplification. This limitation was overcomeby another variant on the classic CGH approach in whichthe normal metaphase chromosomes were replaced by alarge number of microarrayed cDNA clones [9]. Thisapproach has the advantage that losses and gains aremapped by their gene position rather than chromosomalband (as with conventional CGH) or genomic position(as with array CGH and digital karyotyping). The analysisimmediately provides a list of candidate genes that occurwithin the region of interest. Another advantage is theability to perform expression profiling on the same slidesusing the cDNA microarray approach, which enables the
investigator to correlate copy number and gene expres-sion, in order to identify candidate oncogenes that areboth amplified and overexpressed. Moreover, the smallsize and large number of the arrayed cDNA clones providea higher resolution in contrast to current PAC and BACarrays for which the resolution is limited because of therelatively large size of the clones (120–200 kb). Two lim-itations of the cDNA array CGH approach are the con-fined analysis of genes that are present on the array andthe analytical challenges in terms of sensitivity by thecomplexity of the probe and the small sizes of the arrayedtarget cDNAs (0.5–2 kb) (signal intensities in genomichybridizations being proportional to the length of the tar-get DNA).
In this paper, we propose a fast and straightforwardapproach to identify overexpressed genes in amplifiedregions, enabling direct identification of the relevant tar-geted oncogene(s). The approach is based on the above-mentioned cDNA array CGH method, but includes a pre-ceding selection of differentially expressed genes. In a firststep, subtractive cDNA cloning is performed on an ampli-fied tumour sample to isolate cDNA clones that are over-expressed. Subsequent CGH analysis on a cDNAmicroarray containing the subtracted clones allows detec-tion of differentially expressed genes which are amplifiedat the DNA level. As a proof of principle, neuroblastomacell line IMR-32 with at least two amplification sites alongthe short arm of chromosome 2 (including the MYCNlocus) was used as a model system [10,11].
In this study, the combinatorial power and efficacy of sub-tractive cDNA cloning and high-throughput DNA copynumber determination using array CGH was demon-strated for identification of amplified and overexpressedgenes. In addition to those genes which were alreadyknown to be amplified and overexpressed in IMR-32, wealso detected hitherto unknown genes, which were notpreviously described to be amplified in neuroblastoma.
ResultsIdentification of differentially expressed genes by suppression subtractive hybridisation (SSH)In a first step, overexpressed genes in neuroblastoma cellline IMR-32 were isolated (of which some have increasedexpression due to amplification) through a PCR selectcDNA subtraction with IMR-32 as tester and SK-N-SH asdriver (the latter being a neuroblastoma cell line withoutDNA amplification [12]). This yielded a cDNA library of960 clones. By comparing the unsubtracted and sub-tracted cDNA library for the abundance of an internal con-trol gene GAPD, the enrichment was estimated to be 100fold. Upon hybridization of the subtracted and reversesubtracted probe on nylon filters containing all subtractedclones (i.e. differential screening according to the
Paper 4 92
BMC Genomics 2004, 5 http://www.biomedcentral.com/1471-2164/5/11
Page 3 of 14(page number not for citation purposes)
manufacturer), false positive clones (non-differentiallyexpressed genes) could be identified, resulting in theretention of 281 IMR-32 overexpressed clones. Aftersequencing, alignment, EST contig building and UniGenedatabase search, a non-redundant list was obtained con-taining 126 known genes, 22 UniGene clusters, and 10anonymous ESTs. For each unique gene, transcript or ESTcontig, at least one representative clone was selected forre-arraying, insert amplification and spotting on a custommicroarray.
CGH on cDNA microarray and characterization of the clonesIn order to determine which of the overexpressed cDNAclones were amplified in IMR-32, array CGH analysis wasperformed on a custom cDNA microarray using DNA ofIMR-32 as test probe and DNA of a normal male lym-phoblastoid cell line as normal control probe. All clonesthat were found to be amplified, were located on one ofthe two known amplified regions on the short arm ofchromosome 2 (2p13-14 and 2p24) (Figures 1 and 2). Inaddition to the 3 known genes on 2p24 that are frequentlyco-amplified in neuroblastoma (i.e. MYCN, DDX1 andNAG), ten other partial cDNA clones on the microarraywere shown to be amplified in cell line IMR-32. One clone(g6f6) was part of the MEIS1 homeobox gene (2p14) thatwas recently shown also to be amplified in IMR-32[13,14]. Two other clones (g1h7 and g8f10) belonged tothe TEM8 gene on 2p13.3. A fourth clone (g4d5) islocated between the MEIS1 and the TEM8 gene and is partof an as yet not characterized gene. RT-PCR analysisrevealed that this clone is not part of the neighbouring(not yet fully annotated) ETAA16 gene. No homology wasfound for g4d5 with other EST sequences or known genes.Another clone (g10d12) is located 500 kb telomeric toNAG and also displayed no homology to any knownsequence. Two other transcripts (g9d9 and g10e3) areprobably part of the NSE1 gene as demonstrated by align-ment of the clones to NSE1 transcript variants (Figure 2)and RT-PCR assays using a forward primer in the sub-tracted clone and a reverse primer in the NSE1 gene. Twoclones (g1c2, g6d4) were located in the large 150 kbintron of the 4.5 kb NAG sequence reported by Wimmeret al. [15] (acc. no. AF056195) between exon 4 and 5.BLAST analysis of the human EST database with exon 4and 5 of the NAG gene as a query sequence failed to iden-tify an EST clone that contained both exons. Furthermore,RT-PCR with a forward primer in exon 4 and a reverseprimer in exon 7 failed to yield the expected band of 341bp in IMR-32 and SK-N-SH. In contrast, a sharp and singleband of approximately 3.5 kb was amplified. Further-more, Northern blot analysis estimated the NAG tran-script size to be approximately 2.5 kb longer compared tothe published sequence (data not shown). These data fur-ther support the recent observation that the published
NAG gene (acc. no. AF056195) is misannotated andshould contain 21 more exons between former exon 4and 5 [16]. Hence, clones g1c2 and g6d4 (present on ourcDNA array) and clone g3e7 are in fact part of the newlyannotated NAG gene (acc. no. AF388385).
The tenth amplified clone (g2h10a) is of particular inter-est because one part of the sequence aligns to the TEM8gene on 2p13.3 and the other part aligns to a sequence inband 2p24.3 (Figure 2). The fusion nature of this clonewas confirmed by RT-PCR on cell line IMR-32 using aprimer in the first part of the transcript on 2p13.3 and aprimer in the other part of the transcript on 2p24.3. Clon-ing and sequencing of the PCR product revealed that IMR-32 contains at least two different splice variants of thefusion transcript, i.e. g2h10b (acc. no. CD664535) andg2h10c (acc. no. CF384614) (splice variants are detectedin the part that aligns to 2p24.3). Most splicing sites aresurrounded by consensus splice site sequences (data notshown).
Confirmation of amplification statusReal-time quantitative PCR on IMR-32 was performed inorder to validate the amplification status of all sequencesthat were catalogued as amplified by array CGH analysis:five genes that were previously reported to be amplified inIMR-32 (MYCN, DDX1, NAG, NSE1 and MEIS1), onenewly amplified gene (TEM8), 2 anonymous expressedsequences (g10d12 and g4d5) and 1 fusion transcript.Amplification of all these genes and clones was confirmedin IMR-32 (Table 2).
Using FISH analysis, it was demonstrated that the MYCN,DDX1, NAG, MEIS1, NSE1 and TEM8 genes and theg10d12 clone are present as multiple copies on all 3known HSRs in IMR-32 (Figure 3). This suggests that the3 HSRs originate from the same complex amplicon.
To verify whether the subtracted clones that were shownto be amplified are indeed overexpressed at the mRNAlevel in IMR-32, real-time quantitative RT-PCR was per-formed and demonstrated that all genes were highly over-expressed (range 101–104 fold overexpression) (Table 2).The fusion transcript was only expressed in cell line IMR-32.
Three genes were shown to be amplified in the 2p13.3-14amplicon (of which only MEIS1 was previously reported).To our surprise, more known genes are located betweenamplified clone g4d5 and TEM8, but those were notpresent in our subtracted cDNA library. To test whetherour approach failed to identify these genes or whetherthese genes were indeed not amplified in IMR-32, we ran-domly selected 3 genes (PPP3R1, PLEK and BMP10) and
Paper 4 93
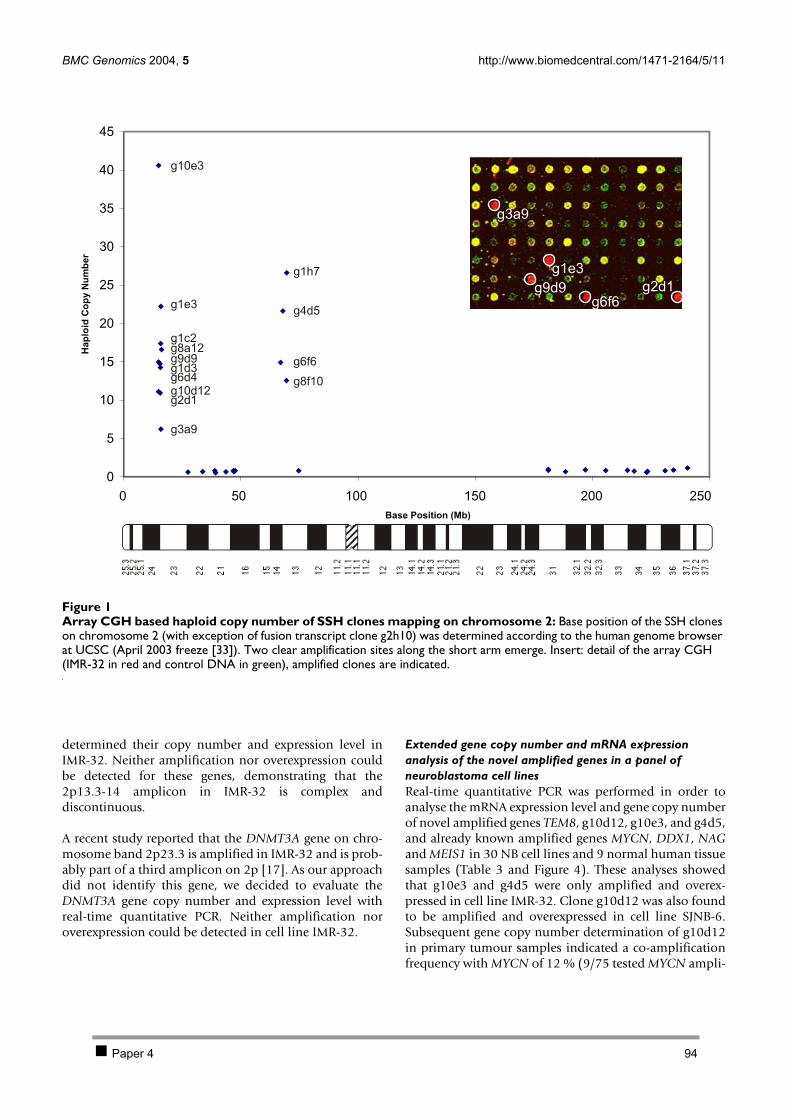
BMC Genomics 2004, 5 http://www.biomedcentral.com/1471-2164/5/11
Page 4 of 14(page number not for citation purposes)
determined their copy number and expression level inIMR-32. Neither amplification nor overexpression couldbe detected for these genes, demonstrating that the2p13.3-14 amplicon in IMR-32 is complex anddiscontinuous.
A recent study reported that the DNMT3A gene on chro-mosome band 2p23.3 is amplified in IMR-32 and is prob-ably part of a third amplicon on 2p [17]. As our approachdid not identify this gene, we decided to evaluate theDNMT3A gene copy number and expression level withreal-time quantitative PCR. Neither amplification noroverexpression could be detected in cell line IMR-32.
Extended gene copy number and mRNA expression analysis of the novel amplified genes in a panel of neuroblastoma cell linesReal-time quantitative PCR was performed in order toanalyse the mRNA expression level and gene copy numberof novel amplified genes TEM8, g10d12, g10e3, and g4d5,and already known amplified genes MYCN, DDX1, NAGand MEIS1 in 30 NB cell lines and 9 normal human tissuesamples (Table 3 and Figure 4). These analyses showedthat g10e3 and g4d5 were only amplified and overex-pressed in cell line IMR-32. Clone g10d12 was also foundto be amplified and overexpressed in cell line SJNB-6.Subsequent gene copy number determination of g10d12in primary tumour samples indicated a co-amplificationfrequency with MYCN of 12 % (9/75 tested MYCN ampli-
Array CGH based haploid copy number of SSH clones mapping on chromosome 2Figure 1Array CGH based haploid copy number of SSH clones mapping on chromosome 2: Base position of the SSH clones on chromosome 2 (with exception of fusion transcript clone g2h10) was determined according to the human genome browser at UCSC (April 2003 freeze [33]). Two clear amplification sites along the short arm emerge. Insert: detail of the array CGH (IMR-32 in red and control DNA in green), amplified clones are indicated.
0
5
10
15
20
25
30
35
40
45
0 50 100 150 200 250
Base Position (Mb)
Hap
loid
Co
py
Nu
mb
er
g10e3
g1e3
g1c2
g6d4
g2d1
g3a9
g8a12
g1d3g9d9
g10d12
g1h7
g8f10
g6f6
g4d5
g2d1g6f6
g9d9
g1e3
g3a9
Paper 4 94
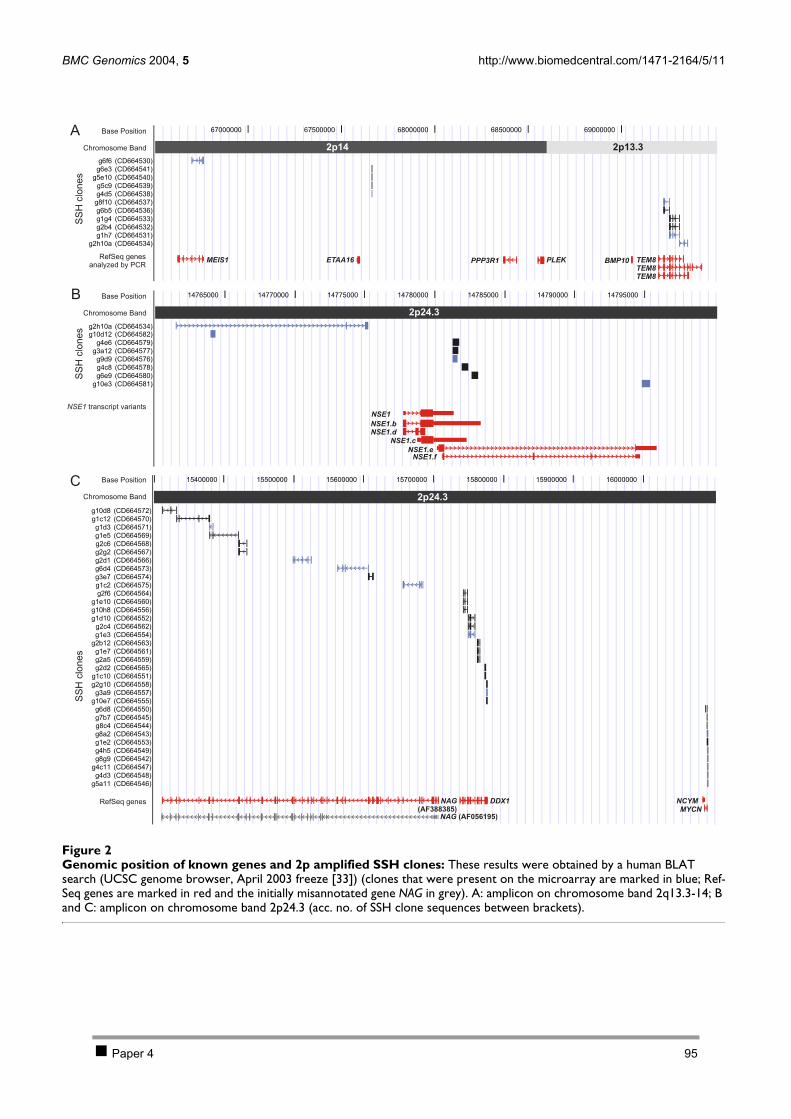
BMC Genomics 2004, 5 http://www.biomedcentral.com/1471-2164/5/11
Page 5 of 14(page number not for citation purposes)
Genomic position of known genes and 2p amplified SSH clonesFigure 2Genomic position of known genes and 2p amplified SSH clones: These results were obtained by a human BLAT search (UCSC genome browser, April 2003 freeze [33]) (clones that were present on the microarray are marked in blue; Ref-Seq genes are marked in red and the initially misannotated gene NAG in grey). A: amplicon on chromosome band 2q13.3-14; B and C: amplicon on chromosome band 2p24.3 (acc. no. of SSH clone sequences between brackets).
RefSeq genesanalyzed by PCR
2p13.32p14
Base Position
Chromosome Band
SS
Hclo
ne
s
MEIS1 ETAA16 PPP3R1 PLEK BMP10 TEM8
TEM8
TEM8
2p24.3
Base Position
Chromosome Band
SS
Hclo
ne
s
NSE1.b
NSE1.d
NSE1.c
NSE1.e
NSE1.f
NSE1
NSE1 transcript variants
NCYM
MYCN
DDX1NAG
(AF388385)
2p24.3
Base Position
Chromosome Band
SS
Hclo
ne
s
RefSeq genes
A
B
C
NAG (AF056195)
Paper 4 95
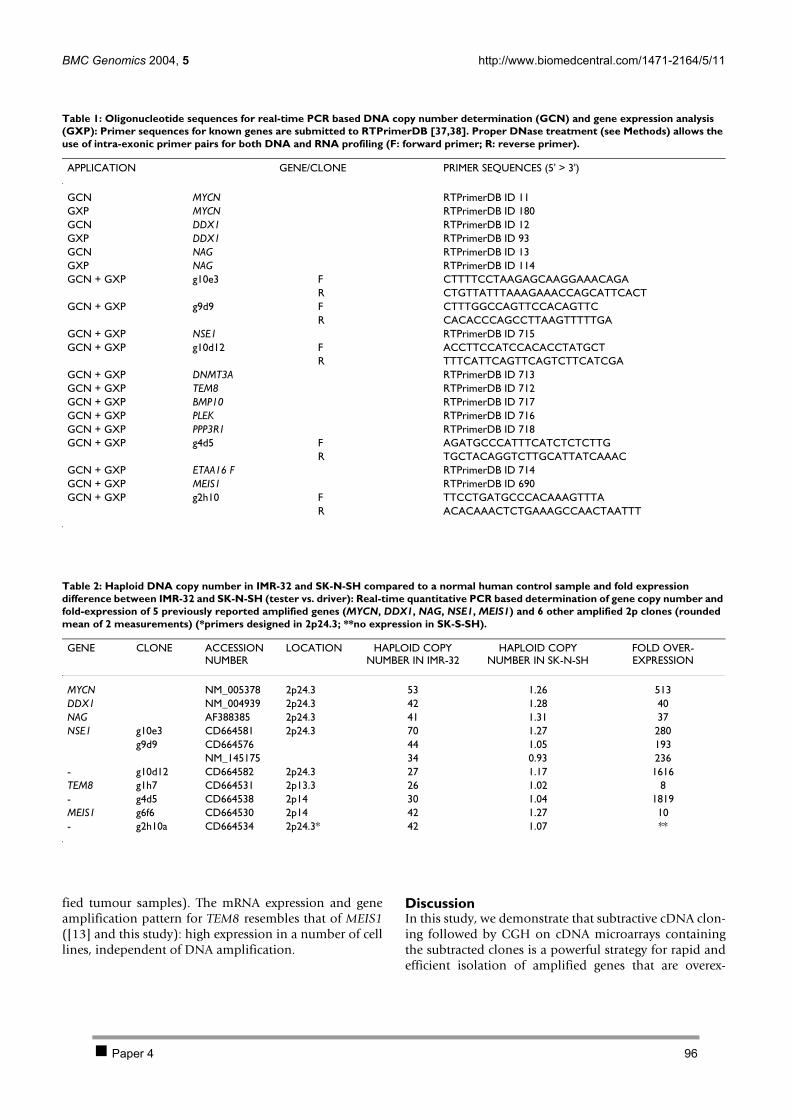
BMC Genomics 2004, 5 http://www.biomedcentral.com/1471-2164/5/11
Page 6 of 14(page number not for citation purposes)
fied tumour samples). The mRNA expression and geneamplification pattern for TEM8 resembles that of MEIS1([13] and this study): high expression in a number of celllines, independent of DNA amplification.
DiscussionIn this study, we demonstrate that subtractive cDNA clon-ing followed by CGH on cDNA microarrays containingthe subtracted clones is a powerful strategy for rapid andefficient isolation of amplified genes that are overex-
Table 1: Oligonucleotide sequences for real-time PCR based DNA copy number determination (GCN) and gene expression analysis (GXP): Primer sequences for known genes are submitted to RTPrimerDB [37,38]. Proper DNase treatment (see Methods) allows the use of intra-exonic primer pairs for both DNA and RNA profiling (F: forward primer; R: reverse primer).
APPLICATION GENE/CLONE PRIMER SEQUENCES (5' > 3')
GCN MYCN RTPrimerDB ID 11GXP MYCN RTPrimerDB ID 180GCN DDX1 RTPrimerDB ID 12GXP DDX1 RTPrimerDB ID 93GCN NAG RTPrimerDB ID 13GXP NAG RTPrimerDB ID 114GCN + GXP g10e3 F CTTTTCCTAAGAGCAAGGAAACAGA
R CTGTTATTTAAAGAAACCAGCATTCACTGCN + GXP g9d9 F CTTTGGCCAGTTCCACAGTTC
R CACACCCAGCCTTAAGTTTTTGAGCN + GXP NSE1 RTPrimerDB ID 715GCN + GXP g10d12 F ACCTTCCATCCACACCTATGCT
R TTTCATTCAGTTCAGTCTTCATCGAGCN + GXP DNMT3A RTPrimerDB ID 713GCN + GXP TEM8 RTPrimerDB ID 712GCN + GXP BMP10 RTPrimerDB ID 717GCN + GXP PLEK RTPrimerDB ID 716GCN + GXP PPP3R1 RTPrimerDB ID 718GCN + GXP g4d5 F AGATGCCCATTTCATCTCTCTTG
R TGCTACAGGTCTTGCATTATCAAACGCN + GXP ETAA16 F RTPrimerDB ID 714GCN + GXP MEIS1 RTPrimerDB ID 690GCN + GXP g2h10 F TTCCTGATGCCCACAAAGTTTA
R ACACAAACTCTGAAAGCCAACTAATTT
Table 2: Haploid DNA copy number in IMR-32 and SK-N-SH compared to a normal human control sample and fold expression difference between IMR-32 and SK-N-SH (tester vs. driver): Real-time quantitative PCR based determination of gene copy number and fold-expression of 5 previously reported amplified genes (MYCN, DDX1, NAG, NSE1, MEIS1) and 6 other amplified 2p clones (rounded mean of 2 measurements) (*primers designed in 2p24.3; **no expression in SK-S-SH).
GENE CLONE ACCESSION NUMBER
LOCATION HAPLOID COPY NUMBER IN IMR-32
HAPLOID COPY NUMBER IN SK-N-SH
FOLD OVER-EXPRESSION
MYCN NM_005378 2p24.3 53 1.26 513DDX1 NM_004939 2p24.3 42 1.28 40NAG AF388385 2p24.3 41 1.31 37NSE1 g10e3 CD664581 2p24.3 70 1.27 280
g9d9 CD664576 44 1.05 193NM_145175 34 0.93 236
- g10d12 CD664582 2p24.3 27 1.17 1616TEM8 g1h7 CD664531 2p13.3 26 1.02 8- g4d5 CD664538 2p14 30 1.04 1819MEIS1 g6f6 CD664530 2p14 42 1.27 10- g2h10a CD664534 2p24.3* 42 1.07 **
Paper 4 96
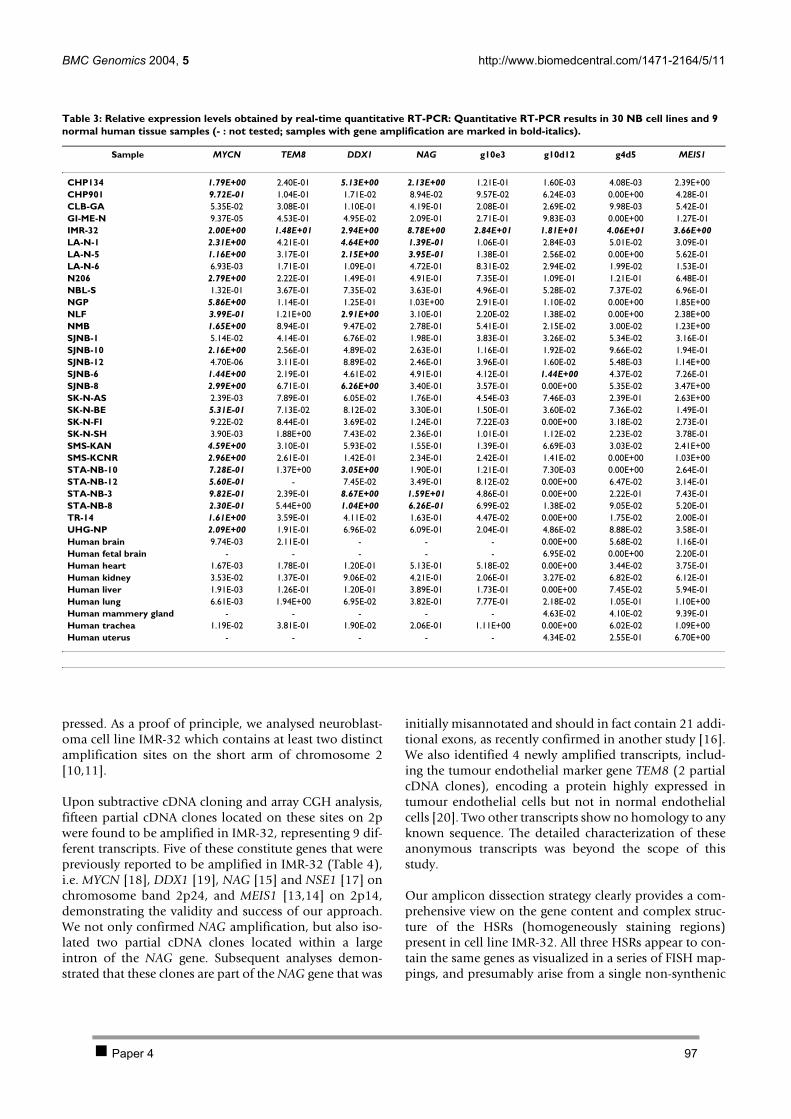
BMC Genomics 2004, 5 http://www.biomedcentral.com/1471-2164/5/11
Page 7 of 14(page number not for citation purposes)
pressed. As a proof of principle, we analysed neuroblast-oma cell line IMR-32 which contains at least two distinctamplification sites on the short arm of chromosome 2[10,11].
Upon subtractive cDNA cloning and array CGH analysis,fifteen partial cDNA clones located on these sites on 2pwere found to be amplified in IMR-32, representing 9 dif-ferent transcripts. Five of these constitute genes that werepreviously reported to be amplified in IMR-32 (Table 4),i.e. MYCN [18], DDX1 [19], NAG [15] and NSE1 [17] onchromosome band 2p24, and MEIS1 [13,14] on 2p14,demonstrating the validity and success of our approach.We not only confirmed NAG amplification, but also iso-lated two partial cDNA clones located within a largeintron of the NAG gene. Subsequent analyses demon-strated that these clones are part of the NAG gene that was
initially misannotated and should in fact contain 21 addi-tional exons, as recently confirmed in another study [16].We also identified 4 newly amplified transcripts, includ-ing the tumour endothelial marker gene TEM8 (2 partialcDNA clones), encoding a protein highly expressed intumour endothelial cells but not in normal endothelialcells [20]. Two other transcripts show no homology to anyknown sequence. The detailed characterization of theseanonymous transcripts was beyond the scope of thisstudy.
Our amplicon dissection strategy clearly provides a com-prehensive view on the gene content and complex struc-ture of the HSRs (homogeneously staining regions)present in cell line IMR-32. All three HSRs appear to con-tain the same genes as visualized in a series of FISH map-pings, and presumably arise from a single non-synthenic
Table 3: Relative expression levels obtained by real-time quantitative RT-PCR: Quantitative RT-PCR results in 30 NB cell lines and 9 normal human tissue samples (- : not tested; samples with gene amplification are marked in bold-italics).
Sample MYCN TEM8 DDX1 NAG g10e3 g10d12 g4d5 MEIS1
CHP134 1.79E+00 2.40E-01 5.13E+00 2.13E+00 1.21E-01 1.60E-03 4.08E-03 2.39E+00CHP901 9.72E-01 1.04E-01 1.71E-02 8.94E-02 9.57E-02 6.24E-03 0.00E+00 4.28E-01CLB-GA 5.35E-02 3.08E-01 1.10E-01 4.19E-01 2.08E-01 2.69E-02 9.98E-03 5.42E-01GI-ME-N 9.37E-05 4.53E-01 4.95E-02 2.09E-01 2.71E-01 9.83E-03 0.00E+00 1.27E-01IMR-32 2.00E+00 1.48E+01 2.94E+00 8.78E+00 2.84E+01 1.81E+01 4.06E+01 3.66E+00LA-N-1 2.31E+00 4.21E-01 4.64E+00 1.39E-01 1.06E-01 2.84E-03 5.01E-02 3.09E-01LA-N-5 1.16E+00 3.17E-01 2.15E+00 3.95E-01 1.38E-01 2.56E-02 0.00E+00 5.62E-01LA-N-6 6.93E-03 1.71E-01 1.09E-01 4.72E-01 8.31E-02 2.94E-02 1.99E-02 1.53E-01N206 2.79E+00 2.22E-01 1.49E-01 4.91E-01 7.35E-01 1.09E-01 1.21E-01 6.48E-01NBL-S 1.32E-01 3.67E-01 7.35E-02 3.63E-01 4.96E-01 5.28E-02 7.37E-02 6.96E-01NGP 5.86E+00 1.14E-01 1.25E-01 1.03E+00 2.91E-01 1.10E-02 0.00E+00 1.85E+00NLF 3.99E-01 1.21E+00 2.91E+00 3.10E-01 2.20E-02 1.38E-02 0.00E+00 2.38E+00NMB 1.65E+00 8.94E-01 9.47E-02 2.78E-01 5.41E-01 2.15E-02 3.00E-02 1.23E+00SJNB-1 5.14E-02 4.14E-01 6.76E-02 1.98E-01 3.83E-01 3.26E-02 5.34E-02 3.16E-01SJNB-10 2.16E+00 2.56E-01 4.89E-02 2.63E-01 1.16E-01 1.92E-02 9.66E-02 1.94E-01SJNB-12 4.70E-06 3.11E-01 8.89E-02 2.46E-01 3.96E-01 1.60E-02 5.48E-03 1.14E+00SJNB-6 1.44E+00 2.19E-01 4.61E-02 4.91E-01 4.12E-01 1.44E+00 4.37E-02 7.26E-01SJNB-8 2.99E+00 6.71E-01 6.26E+00 3.40E-01 3.57E-01 0.00E+00 5.35E-02 3.47E+00SK-N-AS 2.39E-03 7.89E-01 6.05E-02 1.76E-01 4.54E-03 7.46E-03 2.39E-01 2.63E+00SK-N-BE 5.31E-01 7.13E-02 8.12E-02 3.30E-01 1.50E-01 3.60E-02 7.36E-02 1.49E-01SK-N-FI 9.22E-02 8.44E-01 3.69E-02 1.24E-01 7.22E-03 0.00E+00 3.18E-02 2.73E-01SK-N-SH 3.90E-03 1.88E+00 7.43E-02 2.36E-01 1.01E-01 1.12E-02 2.23E-02 3.78E-01SMS-KAN 4.59E+00 3.10E-01 5.93E-02 1.55E-01 1.39E-01 6.69E-03 3.03E-02 2.41E+00SMS-KCNR 2.96E+00 2.61E-01 1.42E-01 2.34E-01 2.42E-01 1.41E-02 0.00E+00 1.03E+00STA-NB-10 7.28E-01 1.37E+00 3.05E+00 1.90E-01 1.21E-01 7.30E-03 0.00E+00 2.64E-01STA-NB-12 5.60E-01 - 7.45E-02 3.49E-01 8.12E-02 0.00E+00 6.47E-02 3.14E-01STA-NB-3 9.82E-01 2.39E-01 8.67E+00 1.59E+01 4.86E-01 0.00E+00 2.22E-01 7.43E-01STA-NB-8 2.30E-01 5.44E+00 1.04E+00 6.26E-01 6.99E-02 1.38E-02 9.05E-02 5.20E-01TR-14 1.61E+00 3.59E-01 4.11E-02 1.63E-01 4.47E-02 0.00E+00 1.75E-02 2.00E-01UHG-NP 2.09E+00 1.91E-01 6.96E-02 6.09E-01 2.04E-01 4.86E-02 8.88E-02 3.58E-01Human brain 9.74E-03 2.11E-01 - - - 0.00E+00 5.68E-02 1.16E-01Human fetal brain - - - - - 6.95E-02 0.00E+00 2.20E-01Human heart 1.67E-03 1.78E-01 1.20E-01 5.13E-01 5.18E-02 0.00E+00 3.44E-02 3.75E-01Human kidney 3.53E-02 1.37E-01 9.06E-02 4.21E-01 2.06E-01 3.27E-02 6.82E-02 6.12E-01Human liver 1.91E-03 1.26E-01 1.20E-01 3.89E-01 1.73E-01 0.00E+00 7.45E-02 5.94E-01Human lung 6.61E-03 1.94E+00 6.95E-02 3.82E-01 7.77E-01 2.18E-02 1.05E-01 1.10E+00Human mammery gland - - - - - 4.63E-02 4.10E-02 9.39E-01Human trachea 1.19E-02 3.81E-01 1.90E-02 2.06E-01 1.11E+00 0.00E+00 6.02E-02 1.09E+00Human uterus - - - - - 4.34E-02 2.55E-01 6.70E+00
Paper 4 97

BMC Genomics 2004, 5 http://www.biomedcentral.com/1471-2164/5/11
Page 8 of 14(page number not for citation purposes)
amplification event. The amplified genes are located ontwo different regions, of which the 2p24 region appears tobe amplified contiguously, while the other region isamplified in a discontinuous manner as demonstrated bythe presence of a single copy region on 2p13-14, flankedon both sides by amplified sequences. The non-synthenicamplification and inherent fusion of the 2 amplificationsites may have caused the formation of a fusion transcript,with activation of cryptic exons, which are not transcribedunder normal circumstances. This amplified and highlyexpressed fusion transcript contains part of the TEM8 geneon 2p13.3, fused to anonymous spliced sequences locatedin BAC clone RP11-314E10 on band 2p24.3. The occur-rence of a fusion transcript as a result of ampliconformation has been described in a breast cancer cell lineMCF7 (caused by non-synthenic co-amplification of twocommon amplification sites in breast cancer, i.e. 17q23and 20q13) [21]. However, the significance of thesefusion transcripts is at present unclear as no similar fusiontranscripts have been detected in other neuroblastoma orbreast cancer cells.
Our study clearly demonstrates the power, speed and effi-cacy of combined subtractive cDNA cloning and DNAcopy number determination using array CGH for theidentification of clones that are overexpressed and part of
the amplicon, within 4 weeks time. Moreover, the proce-dure results in the infinite availability of the subtractedcDNA clones, suitable for downstream analyses, such asNorthern blot, in situ hybridization or RNA interferenceusing diced double stranded RNA. As a further improve-ment and simplification of the proposed strategy, we rec-ommend to sequence only the amplified genes detectedon the array, instead of sequencing all subtracted clones asperformed in this proof-of-principle study. The proposedstrategy will not allow isolation of genes which areamplified but not overexpressed. However, one can ques-tion the relevance of these genes, as these will most prob-ably not have any biological effect. To our knowledge,such amplification events have not been reported yet.
Oncogene identification consisting of prior selection ofdifferentially expressed genes has already been reported inother cancer cell lines, but -unlike our strategy- wasseverely hampered by a rate-limiting step for the verifica-tion of amplification by radiation hybrid mapping of thesubtracted clones [22]. Table 4 summarizes the differentstrategies used in the past for the identification ofamplified genes in neuroblastoma cells. Some of thesereports employed a laborious and/or technically challeng-ing method to identify or clone only one single amplifiedgene. In contrast, a recent study provided a global genecontent analysis of the observed amplicons in IMR-32cells, using CGH on cDNA microarrays [17]. However,this approach was restricted to the identification of genesthat were present on the microarray and consequentlymissed some genes as compared to our strategy (such asthe known amplified DDX1 gene, previously unannotatedNAG exons, the TEM8 gene and fusion transcript). Ampli-fication of DNMT3A located at 2p23.3, was also reportedin above referenced CGH on cDNA microarray study. Asthe subtractive cDNA cloning procedure did not yield aclone for this gene we performed real-time quantitativePCR analyses which clearly showed that no DNMT3Aamplification nor overexpression was present in theinvestigated IMR-32 cells in this study. An explanation forthis discrepancy may be cell heterogeneity, as it has beenreported that a third amplification site was only present ina minor portion of IMR-32 cells [10].
Investigation of the amplification status of IMR-32 ampli-fied genes in other NB cell lines revealed that three of thenine genes were also amplified in other samples, albeitalways co-amplified with MYCN. However, it remains anunsolved question whether co-amplified genes representsilent passengers, or co-determinants of phenotype [23].The frequently co-amplified gene DDX1 is a nice example,as no correlation between amplification and patientoutcome could be established [24], but nevertheless, thegene appears to have oncogenic properties [23]. Six of thenine identified genes, were only amplified in cell line
FISH based visualisation of MYCN co-amplification with other genes on 2p in neuroblastoma cell line IMR-32Figure 3FISH based visualisation of MYCN co-amplification with other genes on 2p in neuroblastoma cell line IMR-32: Amplification is present under the form of homoge-neously staining regions. MYCN (in red) in combination with BAC clone RP11-85D18 (TEM8) (in green). Similar results (data not shown) were obtained with clone RP11-444B4 (MEIS1), clone RP11-314E10 (NSE1 and g10d12), clone RP11-422A6 (DDX1) and clone RP11-516B14 (NAG).
Paper 4 98
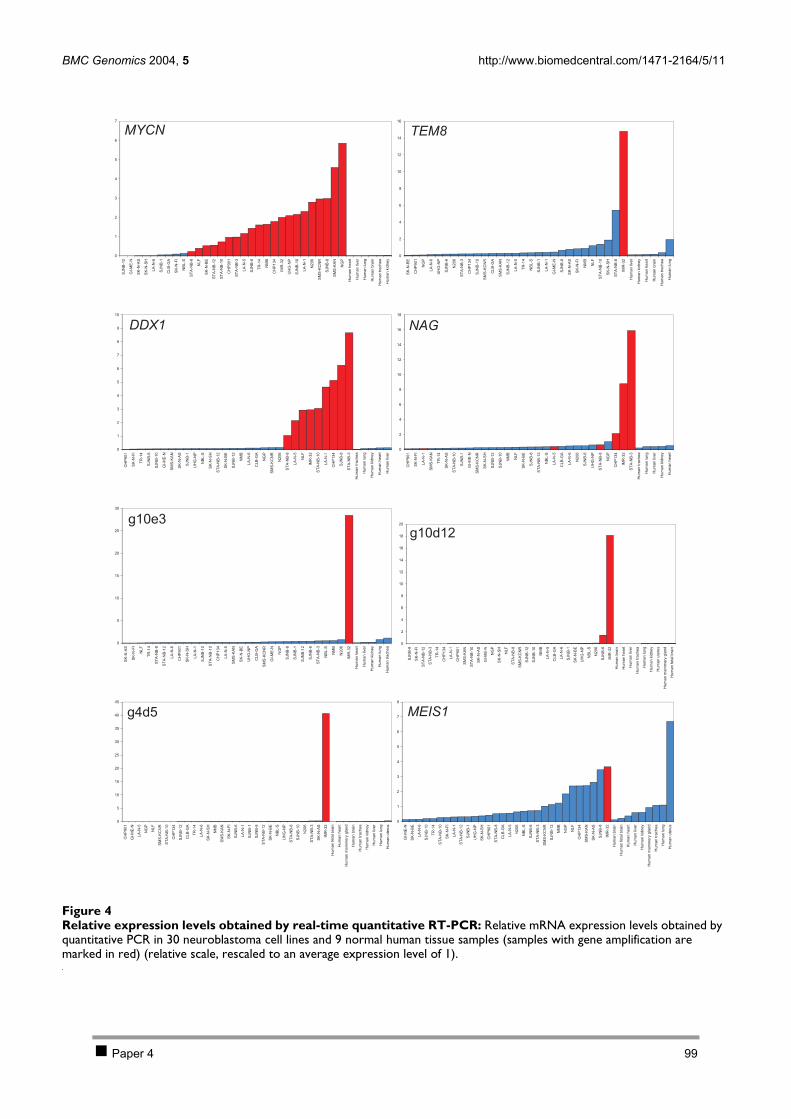
BMC Genomics 2004, 5 http://www.biomedcentral.com/1471-2164/5/11
Page 9 of 14(page number not for citation purposes)
Relative expression levels obtained by real-time quantitative RT-PCRFigure 4Relative expression levels obtained by real-time quantitative RT-PCR: Relative mRNA expression levels obtained by quantitative PCR in 30 neuroblastoma cell lines and 9 normal human tissue samples (samples with gene amplification are marked in red) (relative scale, rescaled to an average expression level of 1).
0
1
2
3
4
5
6
7S
JN
B-1
2
GI-
ME
-N
SK
-N-A
S
SK
-N-S
H
LA
-N-6
SJN
B-1
CL
B-G
A
SK
-N-F
I
NB
L-S
ST
A-N
B-8
NL
F
SK
-N-B
E
ST
A-N
B-1
2
ST
A-N
B-1
0
CH
P9
01
ST
A-N
B-3
LA
-N-5
SJN
B-6
TR
-14
NM
B
CH
P1
34
IMR
-32
UH
G-N
P
SJN
B-1
0
LA
-N-1
N2
06
SM
S-K
CN
R
SJN
B-8
SM
S-K
AN
NG
P
Hu
ma
nh
ea
rt
Hu
ma
nliv
er
Hu
ma
nlu
ng
Hu
ma
nb
rain
Hu
ma
ntr
ach
ea
Hu
ma
nkid
ne
y
0
2
4
6
8
10
12
14
16
SK
-N-B
E
CH
P9
01
NG
P
LA
-N-6
UH
G-N
P
SJN
B-6
N2
06
ST
A-N
B-3
CH
P1
34
SJN
B-1
0
SM
S-K
CN
R
CL
B-G
A
SM
S-K
AN
SJN
B-1
2
LA
-N-5
TR
-14
NB
L-S
SJN
B-1
LA
-N-1
GI-
ME
-N
SJN
B-8
SK
-N-A
S
SK
-N-F
I
NM
B
NL
F
ST
A-N
B-1
0
SK
-N-S
H
ST
A-N
B-8
IMR
-32
Hu
ma
nliv
er
Hu
ma
nkid
ne
y
Hu
ma
nh
ea
rt
Hu
ma
nb
rain
Hu
ma
ntr
ach
ea
Hu
ma
nlu
ng
0
1
2
3
4
5
6
7
8
9
10
CH
P9
01
SK
-N-F
I
TR
-14
SJN
B-6
SJN
B-1
0
GI-
ME
-N
SM
S-K
AN
SK
-N-A
S
SJN
B-1
UH
G-N
P
NB
L-S
SK
-N-S
H
ST
A-N
B-1
2
SK
-N-B
E
SJN
B-1
2
NM
B
LA
-N-6
CL
B-G
A
NG
P
SM
S-K
CN
R
N2
06
ST
A-N
B-8
LA
-N-5
NL
F
IMR
-32
ST
A-N
B-1
0
LA
-N-1
CH
P1
34
SJN
B-8
ST
A-N
B-3
Hu
ma
ntr
ach
ea
Hu
ma
nlu
ng
Hu
ma
nkid
ne
y
Hu
ma
nh
ea
rt
Hu
ma
nliv
er
0
2
4
6
8
10
12
14
16
18
CH
P9
01
SK
-N-F
I
LA
-N-1
SM
S-K
AN
TR
-14
SK
-N-A
S
ST
A-N
B-1
0
SJN
B-1
GI-
ME
-N
SM
S-K
CN
R
SK
-N-S
H
SJN
B-1
2
SJN
B-1
0
NM
B
NL
F
SK
-N-B
E
SJN
B-8
ST
A-N
B-1
2
NB
L-S
LA
-N-5
CL
B-G
A
LA
-N-6
N2
06
SJN
B-6
UH
G-N
P
ST
A-N
B-8
NG
P
CH
P1
34
IMR
-32
ST
A-N
B-3
Hu
ma
ntr
ach
ea
Hu
ma
nlu
ng
Hu
ma
nliv
er
Hu
ma
nkid
ne
y
Hu
ma
nh
ea
rt
0
5
10
15
20
25
30
SK
-N-A
S
SK
-N-F
I
NL
F
TR
-14
ST
A-N
B-8
ST
A-N
B-1
2
LA
-N-6
CH
P9
01
SK
-N-S
H
LA
-N-1
SJN
B-1
0
ST
A-N
B-1
0
CH
P1
34
LA
-N-5
SM
S-K
AN
SK
-N-B
E
UH
G-N
P
CL
B-G
A
SM
S-K
CN
R
GI-
ME
-N
NG
P
SJN
B-8
SJN
B-1
SJN
B-1
2
SJN
B-6
ST
A-N
B-3
NB
L-S
NM
B
N2
06
IMR
-32
Hu
ma
nh
ea
rt
Hu
ma
nliv
er
Hu
ma
nkid
ne
y
Hu
ma
nlu
ng
Hu
ma
ntr
ach
ea
0
2
4
6
8
10
12
14
16
18
20
SJN
B-8
SK
-N-F
I
ST
A-N
B-1
2
ST
A-N
B-3
TR
-14
CH
P1
34
LA
-N-1
CH
P9
01
SM
S-K
AN
ST
A-N
B-1
0
SK
-N-A
S
GI-
ME
-N
NG
P
SK
-N-S
H
NL
F
ST
A-N
B-8
SM
S-K
CN
R
SJN
B-1
2
SJN
B-1
0
NM
B
LA
-N-5
CL
B-G
A
LA
-N-6
SJN
B-1
SK
-N-B
E
UH
G-N
P
NB
L-S
N2
06
SJN
B-6
IMR
-32
Hu
ma
nb
rain
Hu
ma
nh
ea
rt
Hu
ma
nliv
er
Hu
ma
ntr
ach
ea
Hu
ma
nlu
ng
Hu
ma
nkid
ne
y
Hu
ma
nu
teru
s
Hu
ma
nm
am
me
ryg
lan
d
Hu
ma
nfe
talb
rain
0
5
10
15
20
25
30
35
40
45
CH
P9
01
GI-
ME
-N
LA
-N-5
NG
P
NL
F
SM
S-K
CN
R
ST
A-N
B-1
0
CH
P1
34
SJN
B-1
2
CL
B-G
A
TR
-14
LA
-N-6
SK
-N-S
H
NM
B
SM
S-K
AN
SK
-N-F
I
SJN
B-6
LA
-N-1
SJN
B-1
SJN
B-8
ST
A-N
B-1
2
SK
-N-B
E
NB
L-S
UH
G-N
P
ST
A-N
B-8
SJN
B-1
0
N2
06
ST
A-N
B-3
SK
-N-A
S
IMR
-32
Hu
ma
nfe
talb
rain
Hu
ma
nh
ea
rt
Hu
ma
nm
am
me
ryg
lan
d
Hu
ma
nb
rain
Hu
ma
ntr
ach
ea
Hu
ma
nkid
ne
y
Hu
ma
nliv
er
Hu
ma
nlu
ng
Hu
ma
nu
teru
s
0
1
2
3
4
5
6
7
8
GI-
ME
-N
SK
-N-B
E
LA
-N-6
SJN
B-1
0
TR
-14
ST
A-N
B-1
0
SK
-N-F
I
LA
-N-1
ST
A-N
B-1
2
SJN
B-1
UH
G-N
P
SK
-N-S
H
CH
P9
01
ST
A-N
B-8
CL
B-G
A
LA
-N-5
N2
06
NB
L-S
SJN
B-6
ST
A-N
B-3
SM
S-K
CN
R
SJN
B-1
2
NM
B
NG
P
NL
F
CH
P1
34
SM
S-K
AN
SK
-N-A
S
SJN
B-8
IMR
-32
Hu
ma
nb
rain
Hu
ma
nfe
talb
rain
Hu
ma
nh
ea
rt
Hu
ma
nliv
er
Hu
ma
nkid
ne
y
Hu
ma
nm
am
me
ryg
lan
d
Hu
ma
ntr
ach
ea
Hu
ma
nlu
ng
Hu
ma
nu
teru
s
MYCN
DDX1
g10e3
g4d5
TEM8
NAG
g10d12
MEIS1
Paper 4 99

BMC Genomics 2004, 5 http://www.biomedcentral.com/1471-2164/5/11
Page 10 of 14(page number not for citation purposes)
IMR-32. However, the amplification of a gene in only asingle sample does not preclude in advance its possiblerole in tumour biology. An interesting example is theMEIS1 oncogene, with proven oncogenic properties(reviewed in [25]). Albeit amplified in only one neurob-lastoma sample, the gene is overexpressed in about onequarter of other tested neuroblastoma tumour samples([13] and this study). A similar situation occurs for TEM8,a tumour-specific endothelial marker that has been impli-cated in colorectal cancer [26]. Besides amplification andoverexpression in IMR-32, high TEM8 expression inde-pendent of gene amplification is observed, suggestingalternative pathways for gene activation and a possiblerole in neuroblastoma pathogenesis. Further evidencethat one or more genes in the 2p13-14 amplicon plays arole in neuroblastoma comes from the observation ofgenomic amplification at chromosome bands 2p13-14 in3 primary tumour samples, from a large European multi-centre CGH study of 204 cases [27]. Unfortunately, nomaterial was available for further investigation of thesesamples. Clearly, more detailed analyses of the amplifiedgenes (amongst others in a large cohort of uniformlytreated primary tumour samples) and functional studiesare required to establish a possible role of one of the newgenes in tumourigenesis.
ConclusionsThe present study shows that the combinatorial methodof subtractive cDNA cloning followed by array CGHallows straightforward and efficient isolation of overex-pressed genes located in amplification sites. The validityof our approach is clearly illustrated by the detection of allgenes that were previously found to be amplified in neu-roblastoma cell line IMR-32; the identification of 3 newlyamplified genes and a fusion transcript and the generationof new data on gene content and structure of theamplicon.
MethodsDNA and RNA isolationDNA from cultured neuroblastoma cells and 75 MYCNamplified DNA tumours was extracted using the EasyDNA kit following the instructions of the manufacturer(Invitrogen). Total RNA of cultured cell lines was isolatedusing the RNeasy Midi kit (Qiagen), and mRNA wasextracted from SK-N-SH and IMR-32 with the FastTrack kit(Invitrogen), both according to the manufacturer'sinstructions.
RNA and DNA concentration was determined using thePicogreen and Ribogreen reagent, respectively (MolecularProbes) on a TD-360 fluorometer (Turner Designs).
Suppression subtractive hybridization (SSH)Starting from 2 µg of mRNA from cell lines SK-N-SH(driver) and IMR-32 (tester), SSH was performed with thePCR-Select cDNA Subtraction kit (BD Biosciences, Clon-tech) as described by the manufacturer. The PCR productmixture of putative differentially expressed genes was sub-cloned into the pGEM-T Easy vector (Promega) and prop-agated in DH5α E. coli. 960 clones were picked, grown in96-well plates and stored as glycerol stocks at -80°C forfurther analysis. Differential screening was performed toeliminate possible false positive clones according to theguidelines described in the Differential Screening kit (BDBiosciences, Clontech).
DNA sequencing and analysisSSH clones were PCR amplified using SP6 and T7 vectorspecific sequences flanking the cloning site. PCR productswere exonuclease and phosphatase treated and cyclesequenced using BigDyeTerminator chemistry on anABI377 (Applied Biosystems) with primers that annealedto the SP6 or T7 sequences. Similarity searches were per-formed using the BLAST algorithm [28] after removingvector and masking repeat sequences using RepeatMasker[29]. Sequence alignment and EST contig building wereperformed using the freely available BioEdit package [30].
Microarray slide productionFrom selected SSH clones, plasmid DNA was preparedusing the Montage Plasmid Miniprep96 Kit (Millipore)according to the manufacturer. The plasmid insert wasamplified on a PTC-200 DNA engine (MJ Research) in atotal volume of 100 µl containing 1 µl of 1/100 dilutedplasmid DNA (1–2 ng), 1 × PCR Gold buffer (AppliedBiosystems), 5 mM MgCl2, 400 µmol of each dNTP, 5 UAmpliTaq Gold DNA polymerase (Applied Biosystems)and 1 µmol of each primer (amino-linked SP6 and T7primers). The cycling conditions comprised 5 minpolymerase activation at 95°C, 40 cycles with denatura-tion at 94°C for 15 sec, annealing at 55°C for 15 sec andextension at 72°C for 2 min, and a final extension for 5min at 72°C. PCR products were run on a 1.5% TBE-aga-rose gel. After vacuum centrifugation, dried PCR productswere dissolved in 20 µl spotting buffer (200 mM sodiumphosphate buffer pH 8.5, 0.2% sarcosyl) and rearrayed ina 384 well plate. The PCR products were then arrayed intriplicate on CodeLink Activated Slides (Amersham Bio-sciences) using a GMS417 spotter (MWG Biotech). After48 hour incubation in a NaCl humidified chamber, slideswere transferred to 1% ammonium hydroxide solutionfor 5 min, rinsed in Milli-Q ddH2O (Millipore) at roomtemperature and then placed in 95°C Milli-Q ddH2O for2 min to completely denature the bound DNA molecules.After transfer to ice-cold Milli-Q ddH2O, slides werebriefly rinsed twice in room temperature Milli-Q ddH2O
Paper 4 100
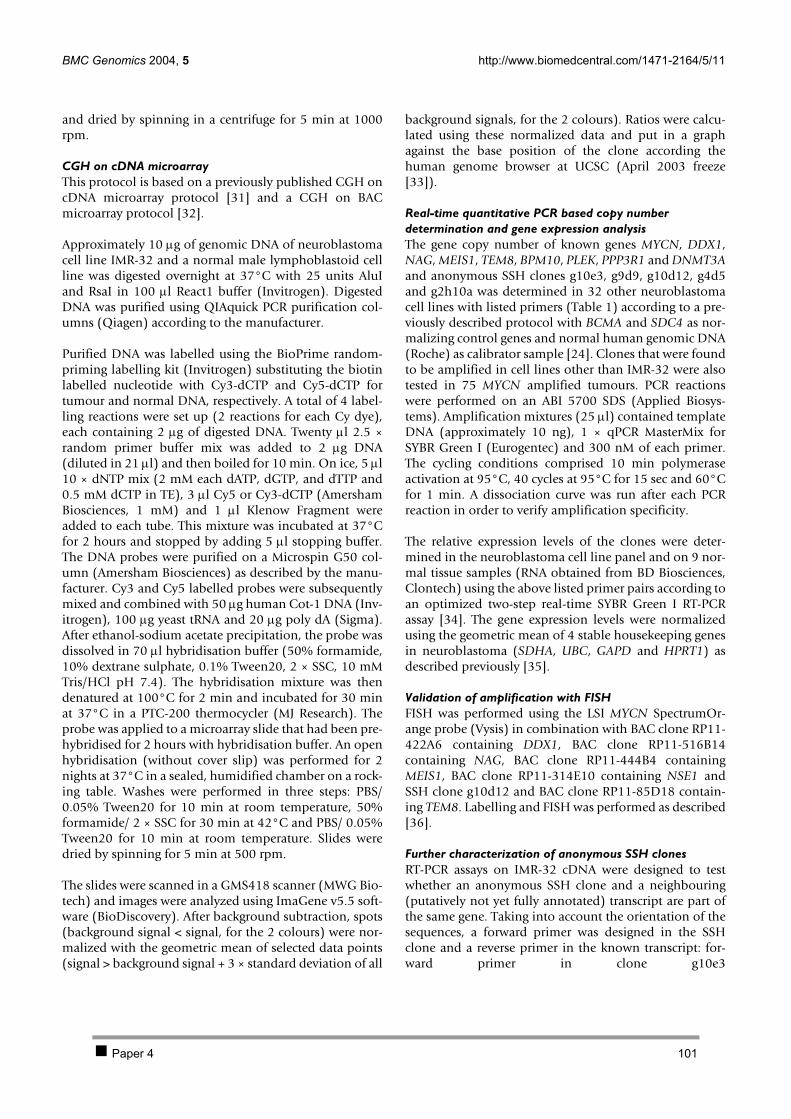
BMC Genomics 2004, 5 http://www.biomedcentral.com/1471-2164/5/11
Page 11 of 14(page number not for citation purposes)
and dried by spinning in a centrifuge for 5 min at 1000rpm.
CGH on cDNA microarrayThis protocol is based on a previously published CGH oncDNA microarray protocol [31] and a CGH on BACmicroarray protocol [32].
Approximately 10 µg of genomic DNA of neuroblastomacell line IMR-32 and a normal male lymphoblastoid cellline was digested overnight at 37°C with 25 units AluIand RsaI in 100 µl React1 buffer (Invitrogen). DigestedDNA was purified using QIAquick PCR purification col-umns (Qiagen) according to the manufacturer.
Purified DNA was labelled using the BioPrime random-priming labelling kit (Invitrogen) substituting the biotinlabelled nucleotide with Cy3-dCTP and Cy5-dCTP fortumour and normal DNA, respectively. A total of 4 label-ling reactions were set up (2 reactions for each Cy dye),each containing 2 µg of digested DNA. Twenty µl 2.5 ×random primer buffer mix was added to 2 µg DNA(diluted in 21 µl) and then boiled for 10 min. On ice, 5 µl10 × dNTP mix (2 mM each dATP, dGTP, and dTTP and0.5 mM dCTP in TE), 3 µl Cy5 or Cy3-dCTP (AmershamBiosciences, 1 mM) and 1 µl Klenow Fragment wereadded to each tube. This mixture was incubated at 37°Cfor 2 hours and stopped by adding 5 µl stopping buffer.The DNA probes were purified on a Microspin G50 col-umn (Amersham Biosciences) as described by the manu-facturer. Cy3 and Cy5 labelled probes were subsequentlymixed and combined with 50 µg human Cot-1 DNA (Inv-itrogen), 100 µg yeast tRNA and 20 µg poly dA (Sigma).After ethanol-sodium acetate precipitation, the probe wasdissolved in 70 µl hybridisation buffer (50% formamide,10% dextrane sulphate, 0.1% Tween20, 2 × SSC, 10 mMTris/HCl pH 7.4). The hybridisation mixture was thendenatured at 100°C for 2 min and incubated for 30 minat 37°C in a PTC-200 thermocycler (MJ Research). Theprobe was applied to a microarray slide that had been pre-hybridised for 2 hours with hybridisation buffer. An openhybridisation (without cover slip) was performed for 2nights at 37°C in a sealed, humidified chamber on a rock-ing table. Washes were performed in three steps: PBS/0.05% Tween20 for 10 min at room temperature, 50%formamide/ 2 × SSC for 30 min at 42°C and PBS/ 0.05%Tween20 for 10 min at room temperature. Slides weredried by spinning for 5 min at 500 rpm.
The slides were scanned in a GMS418 scanner (MWG Bio-tech) and images were analyzed using ImaGene v5.5 soft-ware (BioDiscovery). After background subtraction, spots(background signal < signal, for the 2 colours) were nor-malized with the geometric mean of selected data points(signal > background signal + 3 × standard deviation of all
background signals, for the 2 colours). Ratios were calcu-lated using these normalized data and put in a graphagainst the base position of the clone according thehuman genome browser at UCSC (April 2003 freeze[33]).
Real-time quantitative PCR based copy number determination and gene expression analysisThe gene copy number of known genes MYCN, DDX1,NAG, MEIS1, TEM8, BPM10, PLEK, PPP3R1 and DNMT3Aand anonymous SSH clones g10e3, g9d9, g10d12, g4d5and g2h10a was determined in 32 other neuroblastomacell lines with listed primers (Table 1) according to a pre-viously described protocol with BCMA and SDC4 as nor-malizing control genes and normal human genomic DNA(Roche) as calibrator sample [24]. Clones that were foundto be amplified in cell lines other than IMR-32 were alsotested in 75 MYCN amplified tumours. PCR reactionswere performed on an ABI 5700 SDS (Applied Biosys-tems). Amplification mixtures (25 µl) contained templateDNA (approximately 10 ng), 1 × qPCR MasterMix forSYBR Green I (Eurogentec) and 300 nM of each primer.The cycling conditions comprised 10 min polymeraseactivation at 95°C, 40 cycles at 95°C for 15 sec and 60°Cfor 1 min. A dissociation curve was run after each PCRreaction in order to verify amplification specificity.
The relative expression levels of the clones were deter-mined in the neuroblastoma cell line panel and on 9 nor-mal tissue samples (RNA obtained from BD Biosciences,Clontech) using the above listed primer pairs according toan optimized two-step real-time SYBR Green I RT-PCRassay [34]. The gene expression levels were normalizedusing the geometric mean of 4 stable housekeeping genesin neuroblastoma (SDHA, UBC, GAPD and HPRT1) asdescribed previously [35].
Validation of amplification with FISHFISH was performed using the LSI MYCN SpectrumOr-ange probe (Vysis) in combination with BAC clone RP11-422A6 containing DDX1, BAC clone RP11-516B14containing NAG, BAC clone RP11-444B4 containingMEIS1, BAC clone RP11-314E10 containing NSE1 andSSH clone g10d12 and BAC clone RP11-85D18 contain-ing TEM8. Labelling and FISH was performed as described[36].
Further characterization of anonymous SSH clonesRT-PCR assays on IMR-32 cDNA were designed to testwhether an anonymous SSH clone and a neighbouring(putatively not yet fully annotated) transcript are part ofthe same gene. Taking into account the orientation of thesequences, a forward primer was designed in the SSHclone and a reverse primer in the known transcript: for-ward primer in clone g10e3
Paper 4 101
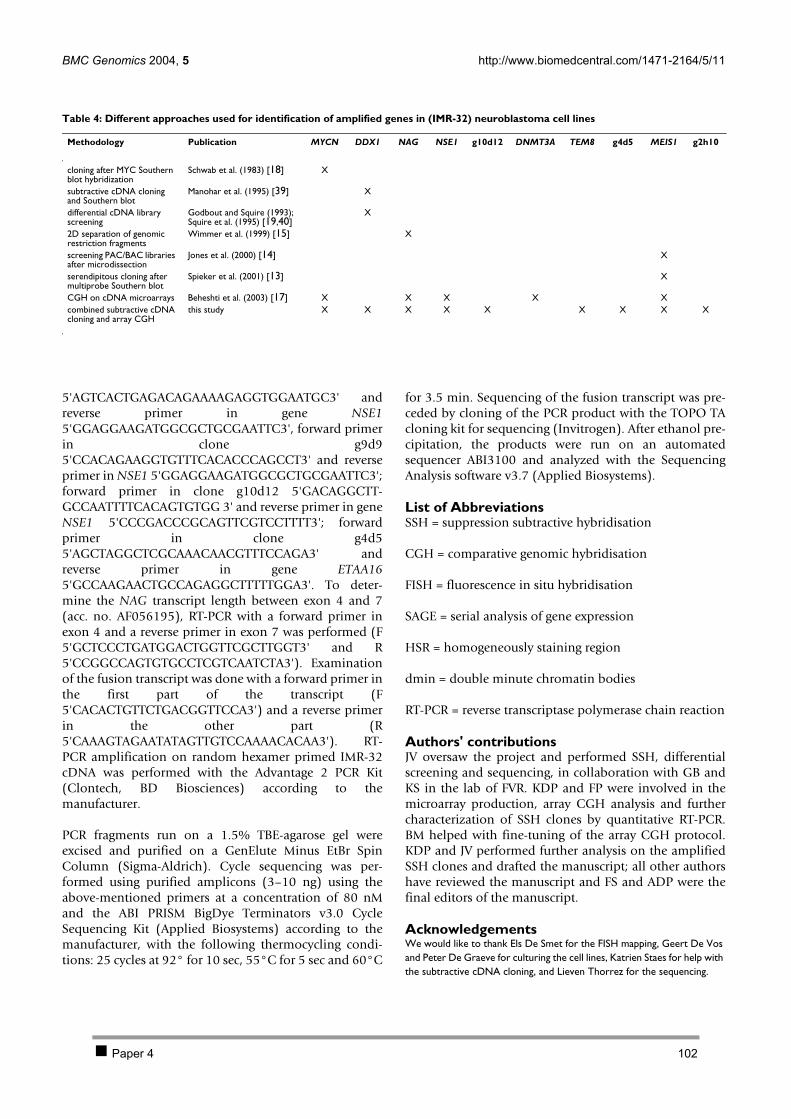
BMC Genomics 2004, 5 http://www.biomedcentral.com/1471-2164/5/11
Page 12 of 14(page number not for citation purposes)
5'AGTCACTGAGACAGAAAAGAGGTGGAATGC3' andreverse primer in gene NSE15'GGAGGAAGATGGCGCTGCGAATTC3', forward primerin clone g9d95'CCACAGAAGGTGTTTCACACCCAGCCT3' and reverseprimer in NSE1 5'GGAGGAAGATGGCGCTGCGAATTC3';forward primer in clone g10d12 5'GACAGGCTT-GCCAATTTTCACAGTGTGG 3' and reverse primer in geneNSE1 5'CCCGACCCGCAGTTCGTCCTTTT3'; forwardprimer in clone g4d55'AGCTAGGCTCGCAAACAACGTTTCCAGA3' andreverse primer in gene ETAA165'GCCAAGAACTGCCAGAGGCTTTTTGGA3'. To deter-mine the NAG transcript length between exon 4 and 7(acc. no. AF056195), RT-PCR with a forward primer inexon 4 and a reverse primer in exon 7 was performed (F5'GCTCCCTGATGGACTGGTTCGCTTGGT3' and R5'CCGGCCAGTGTGCCTCGTCAATCTA3'). Examinationof the fusion transcript was done with a forward primer inthe first part of the transcript (F5'CACACTGTTCTGACGGTTCCA3') and a reverse primerin the other part (R5'CAAAGTAGAATATAGTTGTCCAAAACACAA3'). RT-PCR amplification on random hexamer primed IMR-32cDNA was performed with the Advantage 2 PCR Kit(Clontech, BD Biosciences) according to themanufacturer.
PCR fragments run on a 1.5% TBE-agarose gel wereexcised and purified on a GenElute Minus EtBr SpinColumn (Sigma-Aldrich). Cycle sequencing was per-formed using purified amplicons (3–10 ng) using theabove-mentioned primers at a concentration of 80 nMand the ABI PRISM BigDye Terminators v3.0 CycleSequencing Kit (Applied Biosystems) according to themanufacturer, with the following thermocycling condi-tions: 25 cycles at 92° for 10 sec, 55°C for 5 sec and 60°C
for 3.5 min. Sequencing of the fusion transcript was pre-ceded by cloning of the PCR product with the TOPO TAcloning kit for sequencing (Invitrogen). After ethanol pre-cipitation, the products were run on an automatedsequencer ABI3100 and analyzed with the SequencingAnalysis software v3.7 (Applied Biosystems).
List of AbbreviationsSSH = suppression subtractive hybridisation
CGH = comparative genomic hybridisation
FISH = fluorescence in situ hybridisation
SAGE = serial analysis of gene expression
HSR = homogeneously staining region
dmin = double minute chromatin bodies
RT-PCR = reverse transcriptase polymerase chain reaction
Authors' contributionsJV oversaw the project and performed SSH, differentialscreening and sequencing, in collaboration with GB andKS in the lab of FVR. KDP and FP were involved in themicroarray production, array CGH analysis and furthercharacterization of SSH clones by quantitative RT-PCR.BM helped with fine-tuning of the array CGH protocol.KDP and JV performed further analysis on the amplifiedSSH clones and drafted the manuscript; all other authorshave reviewed the manuscript and FS and ADP were thefinal editors of the manuscript.
AcknowledgementsWe would like to thank Els De Smet for the FISH mapping, Geert De Vos and Peter De Graeve for culturing the cell lines, Katrien Staes for help with the subtractive cDNA cloning, and Lieven Thorrez for the sequencing.
Table 4: Different approaches used for identification of amplified genes in (IMR-32) neuroblastoma cell lines
Methodology Publication MYCN DDX1 NAG NSE1 g10d12 DNMT3A TEM8 g4d5 MEIS1 g2h10
cloning after MYC Southern blot hybridization
Schwab et al. (1983) [18] X
subtractive cDNA cloning and Southern blot
Manohar et al. (1995) [39] X
differential cDNA library screening
Godbout and Squire (1993); Squire et al. (1995) [19,40]
X
2D separation of genomic restriction fragments
Wimmer et al. (1999) [15] X
screening PAC/BAC libraries after microdissection
Jones et al. (2000) [14] X
serendipitous cloning after multiprobe Southern blot
Spieker et al. (2001) [13] X
CGH on cDNA microarrays Beheshti et al. (2003) [17] X X X X Xcombined subtractive cDNA cloning and array CGH
this study X X X X X X X X X
Paper 4 102
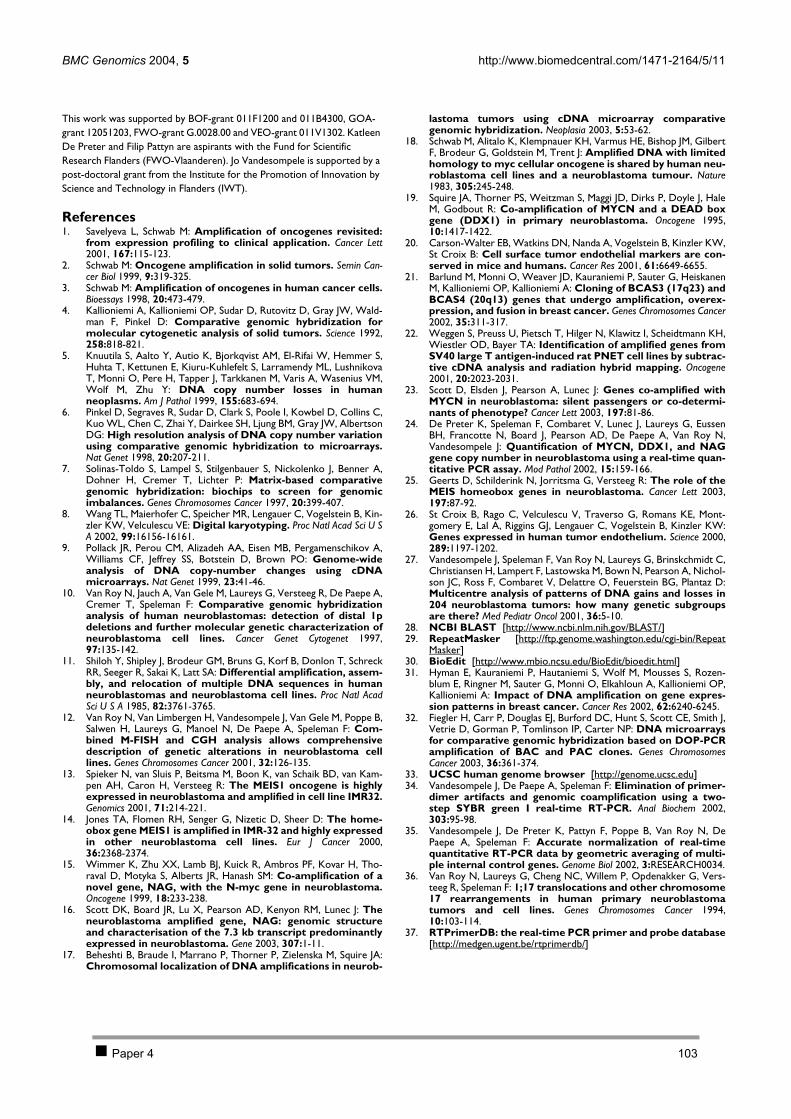
BMC Genomics 2004, 5 http://www.biomedcentral.com/1471-2164/5/11
Page 13 of 14(page number not for citation purposes)
This work was supported by BOF-grant 011F1200 and 011B4300, GOA-grant 12051203, FWO-grant G.0028.00 and VEO-grant 011V1302. Katleen De Preter and Filip Pattyn are aspirants with the Fund for Scientific Research Flanders (FWO-Vlaanderen). Jo Vandesompele is supported by a post-doctoral grant from the Institute for the Promotion of Innovation by Science and Technology in Flanders (IWT).
References1. Savelyeva L, Schwab M: Amplification of oncogenes revisited:
from expression profiling to clinical application. Cancer Lett2001, 167:115-123.
2. Schwab M: Oncogene amplification in solid tumors. Semin Can-cer Biol 1999, 9:319-325.
3. Schwab M: Amplification of oncogenes in human cancer cells.Bioessays 1998, 20:473-479.
4. Kallioniemi A, Kallioniemi OP, Sudar D, Rutovitz D, Gray JW, Wald-man F, Pinkel D: Comparative genomic hybridization formolecular cytogenetic analysis of solid tumors. Science 1992,258:818-821.
5. Knuutila S, Aalto Y, Autio K, Bjorkqvist AM, El-Rifai W, Hemmer S,Huhta T, Kettunen E, Kiuru-Kuhlefelt S, Larramendy ML, LushnikovaT, Monni O, Pere H, Tapper J, Tarkkanen M, Varis A, Wasenius VM,Wolf M, Zhu Y: DNA copy number losses in humanneoplasms. Am J Pathol 1999, 155:683-694.
6. Pinkel D, Segraves R, Sudar D, Clark S, Poole I, Kowbel D, Collins C,Kuo WL, Chen C, Zhai Y, Dairkee SH, Ljung BM, Gray JW, AlbertsonDG: High resolution analysis of DNA copy number variationusing comparative genomic hybridization to microarrays.Nat Genet 1998, 20:207-211.
7. Solinas-Toldo S, Lampel S, Stilgenbauer S, Nickolenko J, Benner A,Dohner H, Cremer T, Lichter P: Matrix-based comparativegenomic hybridization: biochips to screen for genomicimbalances. Genes Chromosomes Cancer 1997, 20:399-407.
8. Wang TL, Maierhofer C, Speicher MR, Lengauer C, Vogelstein B, Kin-zler KW, Velculescu VE: Digital karyotyping. Proc Natl Acad Sci U SA 2002, 99:16156-16161.
9. Pollack JR, Perou CM, Alizadeh AA, Eisen MB, Pergamenschikov A,Williams CF, Jeffrey SS, Botstein D, Brown PO: Genome-wideanalysis of DNA copy-number changes using cDNAmicroarrays. Nat Genet 1999, 23:41-46.
10. Van Roy N, Jauch A, Van Gele M, Laureys G, Versteeg R, De Paepe A,Cremer T, Speleman F: Comparative genomic hybridizationanalysis of human neuroblastomas: detection of distal 1pdeletions and further molecular genetic characterization ofneuroblastoma cell lines. Cancer Genet Cytogenet 1997,97:135-142.
11. Shiloh Y, Shipley J, Brodeur GM, Bruns G, Korf B, Donlon T, SchreckRR, Seeger R, Sakai K, Latt SA: Differential amplification, assem-bly, and relocation of multiple DNA sequences in humanneuroblastomas and neuroblastoma cell lines. Proc Natl AcadSci U S A 1985, 82:3761-3765.
12. Van Roy N, Van Limbergen H, Vandesompele J, Van Gele M, Poppe B,Salwen H, Laureys G, Manoel N, De Paepe A, Speleman F: Com-bined M-FISH and CGH analysis allows comprehensivedescription of genetic alterations in neuroblastoma celllines. Genes Chromosomes Cancer 2001, 32:126-135.
13. Spieker N, van Sluis P, Beitsma M, Boon K, van Schaik BD, van Kam-pen AH, Caron H, Versteeg R: The MEIS1 oncogene is highlyexpressed in neuroblastoma and amplified in cell line IMR32.Genomics 2001, 71:214-221.
14. Jones TA, Flomen RH, Senger G, Nizetic D, Sheer D: The home-obox gene MEIS1 is amplified in IMR-32 and highly expressedin other neuroblastoma cell lines. Eur J Cancer 2000,36:2368-2374.
15. Wimmer K, Zhu XX, Lamb BJ, Kuick R, Ambros PF, Kovar H, Tho-raval D, Motyka S, Alberts JR, Hanash SM: Co-amplification of anovel gene, NAG, with the N-myc gene in neuroblastoma.Oncogene 1999, 18:233-238.
16. Scott DK, Board JR, Lu X, Pearson AD, Kenyon RM, Lunec J: Theneuroblastoma amplified gene, NAG: genomic structureand characterisation of the 7.3 kb transcript predominantlyexpressed in neuroblastoma. Gene 2003, 307:1-11.
17. Beheshti B, Braude I, Marrano P, Thorner P, Zielenska M, Squire JA:Chromosomal localization of DNA amplifications in neurob-
lastoma tumors using cDNA microarray comparativegenomic hybridization. Neoplasia 2003, 5:53-62.
18. Schwab M, Alitalo K, Klempnauer KH, Varmus HE, Bishop JM, GilbertF, Brodeur G, Goldstein M, Trent J: Amplified DNA with limitedhomology to myc cellular oncogene is shared by human neu-roblastoma cell lines and a neuroblastoma tumour. Nature1983, 305:245-248.
19. Squire JA, Thorner PS, Weitzman S, Maggi JD, Dirks P, Doyle J, HaleM, Godbout R: Co-amplification of MYCN and a DEAD boxgene (DDX1) in primary neuroblastoma. Oncogene 1995,10:1417-1422.
20. Carson-Walter EB, Watkins DN, Nanda A, Vogelstein B, Kinzler KW,St Croix B: Cell surface tumor endothelial markers are con-served in mice and humans. Cancer Res 2001, 61:6649-6655.
21. Barlund M, Monni O, Weaver JD, Kauraniemi P, Sauter G, HeiskanenM, Kallioniemi OP, Kallioniemi A: Cloning of BCAS3 (17q23) andBCAS4 (20q13) genes that undergo amplification, overex-pression, and fusion in breast cancer. Genes Chromosomes Cancer2002, 35:311-317.
22. Weggen S, Preuss U, Pietsch T, Hilger N, Klawitz I, Scheidtmann KH,Wiestler OD, Bayer TA: Identification of amplified genes fromSV40 large T antigen-induced rat PNET cell lines by subtrac-tive cDNA analysis and radiation hybrid mapping. Oncogene2001, 20:2023-2031.
23. Scott D, Elsden J, Pearson A, Lunec J: Genes co-amplified withMYCN in neuroblastoma: silent passengers or co-determi-nants of phenotype? Cancer Lett 2003, 197:81-86.
24. De Preter K, Speleman F, Combaret V, Lunec J, Laureys G, EussenBH, Francotte N, Board J, Pearson AD, De Paepe A, Van Roy N,Vandesompele J: Quantification of MYCN, DDX1, and NAGgene copy number in neuroblastoma using a real-time quan-titative PCR assay. Mod Pathol 2002, 15:159-166.
25. Geerts D, Schilderink N, Jorritsma G, Versteeg R: The role of theMEIS homeobox genes in neuroblastoma. Cancer Lett 2003,197:87-92.
26. St Croix B, Rago C, Velculescu V, Traverso G, Romans KE, Mont-gomery E, Lal A, Riggins GJ, Lengauer C, Vogelstein B, Kinzler KW:Genes expressed in human tumor endothelium. Science 2000,289:1197-1202.
27. Vandesompele J, Speleman F, Van Roy N, Laureys G, Brinskchmidt C,Christiansen H, Lampert F, Lastowska M, Bown N, Pearson A, Nichol-son JC, Ross F, Combaret V, Delattre O, Feuerstein BG, Plantaz D:Multicentre analysis of patterns of DNA gains and losses in204 neuroblastoma tumors: how many genetic subgroupsare there? Med Pediatr Oncol 2001, 36:5-10.
28. NCBI BLAST [http://www.ncbi.nlm.nih.gov/BLAST/]29. RepeatMasker [http://ftp.genome.washington.edu/cgi-bin/Repeat
Masker]30. BioEdit [http://www.mbio.ncsu.edu/BioEdit/bioedit.html]31. Hyman E, Kauraniemi P, Hautaniemi S, Wolf M, Mousses S, Rozen-
blum E, Ringner M, Sauter G, Monni O, Elkahloun A, Kallioniemi OP,Kallioniemi A: Impact of DNA amplification on gene expres-sion patterns in breast cancer. Cancer Res 2002, 62:6240-6245.
32. Fiegler H, Carr P, Douglas EJ, Burford DC, Hunt S, Scott CE, Smith J,Vetrie D, Gorman P, Tomlinson IP, Carter NP: DNA microarraysfor comparative genomic hybridization based on DOP-PCRamplification of BAC and PAC clones. Genes ChromosomesCancer 2003, 36:361-374.
33. UCSC human genome browser [http://genome.ucsc.edu]34. Vandesompele J, De Paepe A, Speleman F: Elimination of primer-
dimer artifacts and genomic coamplification using a two-step SYBR green I real-time RT-PCR. Anal Biochem 2002,303:95-98.
35. Vandesompele J, De Preter K, Pattyn F, Poppe B, Van Roy N, DePaepe A, Speleman F: Accurate normalization of real-timequantitative RT-PCR data by geometric averaging of multi-ple internal control genes. Genome Biol 2002, 3:RESEARCH0034.
36. Van Roy N, Laureys G, Cheng NC, Willem P, Opdenakker G, Vers-teeg R, Speleman F: 1;17 translocations and other chromosome17 rearrangements in human primary neuroblastomatumors and cell lines. Genes Chromosomes Cancer 1994,10:103-114.
37. RTPrimerDB: the real-time PCR primer and probe database[http://medgen.ugent.be/rtprimerdb/]
Paper 4 103

Publish with BioMed Central and every scientist can read your work free of charge
"BioMed Central will be the most significant development for disseminating the results of biomedical research in our lifetime."
Sir Paul Nurse, Cancer Research UK
Your research papers will be:
available free of charge to the entire biomedical community
peer reviewed and published immediately upon acceptance
cited in PubMed and archived on PubMed Central
yours — you keep the copyright
Submit your manuscript here:http://www.biomedcentral.com/info/publishing_adv.asp
BioMedcentral
BMC Genomics 2004, 5 http://www.biomedcentral.com/1471-2164/5/11
Page 14 of 14(page number not for citation purposes)
38. Pattyn F, Speleman F, De Paepe A, Vandesompele J: RTPrimerDB:the real-time PCR primer and probe database. Nucleic AcidsRes 2003, 31:122-123 [http://medgen.ugent.be/rtprimerdb].
39. Manohar CF, Salwen HR, Brodeur GM, Cohn SL: Co-amplificationand concomitant high levels of expression of a DEAD boxgene with MYCN in human neuroblastoma. Genes Chromo-somes Cancer 1995, 14:196-203.
40. Godbout R, Squire J: Amplification of a DEAD box protein genein retinoblastoma cell lines. Proc Natl Acad Sci U S A 1993,90:7578-7582.
Paper 4 104
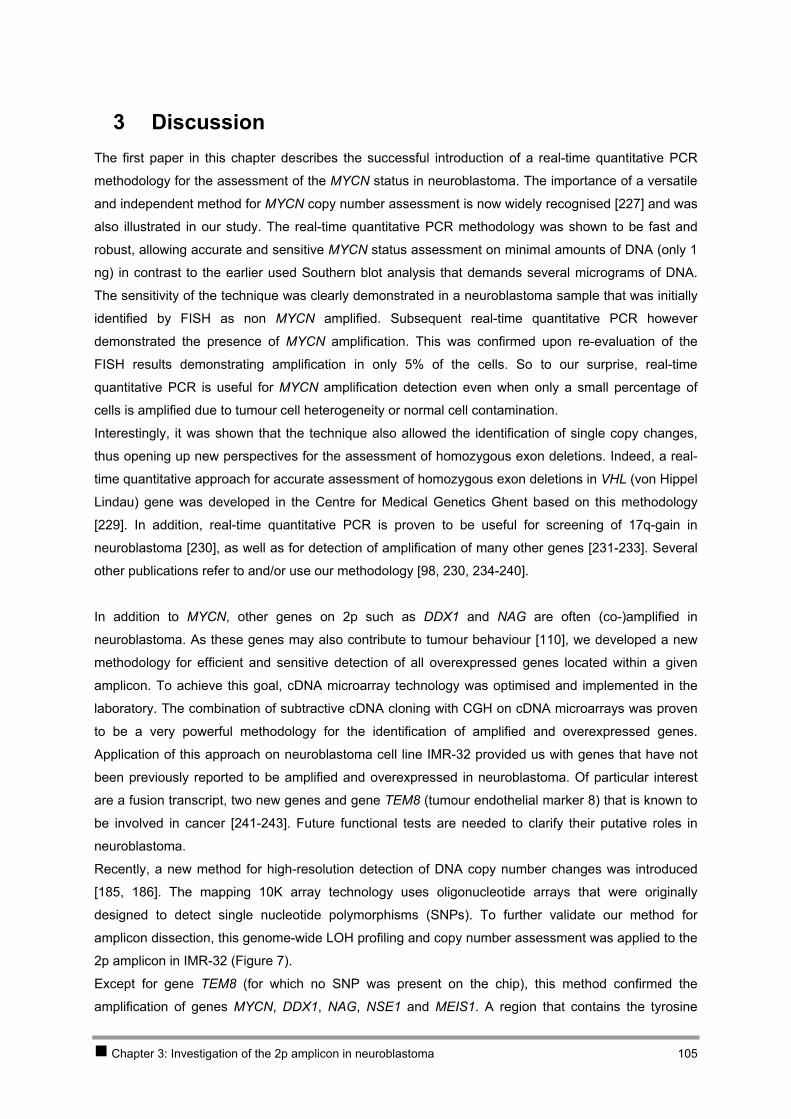
Chapter 3: Investigation of the 2p amplicon in neuroblastoma 105
3 Discussion The first paper in this chapter describes the successful introduction of a real-time quantitative PCR
methodology for the assessment of the MYCN status in neuroblastoma. The importance of a versatile
and independent method for MYCN copy number assessment is now widely recognised [227] and was
also illustrated in our study. The real-time quantitative PCR methodology was shown to be fast and
robust, allowing accurate and sensitive MYCN status assessment on minimal amounts of DNA (only 1
ng) in contrast to the earlier used Southern blot analysis that demands several micrograms of DNA.
The sensitivity of the technique was clearly demonstrated in a neuroblastoma sample that was initially
identified by FISH as non MYCN amplified. Subsequent real-time quantitative PCR however
demonstrated the presence of MYCN amplification. This was confirmed upon re-evaluation of the
FISH results demonstrating amplification in only 5% of the cells. So to our surprise, real-time
quantitative PCR is useful for MYCN amplification detection even when only a small percentage of
cells is amplified due to tumour cell heterogeneity or normal cell contamination.
Interestingly, it was shown that the technique also allowed the identification of single copy changes,
thus opening up new perspectives for the assessment of homozygous exon deletions. Indeed, a real-
time quantitative approach for accurate assessment of homozygous exon deletions in VHL (von Hippel
Lindau) gene was developed in the Centre for Medical Genetics Ghent based on this methodology
[229]. In addition, real-time quantitative PCR is proven to be useful for screening of 17q-gain in
neuroblastoma [230], as well as for detection of amplification of many other genes [231-233]. Several
other publications refer to and/or use our methodology [98, 230, 234-240].
In addition to MYCN, other genes on 2p such as DDX1 and NAG are often (co-)amplified in
neuroblastoma. As these genes may also contribute to tumour behaviour [110], we developed a new
methodology for efficient and sensitive detection of all overexpressed genes located within a given
amplicon. To achieve this goal, cDNA microarray technology was optimised and implemented in the
laboratory. The combination of subtractive cDNA cloning with CGH on cDNA microarrays was proven
to be a very powerful methodology for the identification of amplified and overexpressed genes.
Application of this approach on neuroblastoma cell line IMR-32 provided us with genes that have not
been previously reported to be amplified and overexpressed in neuroblastoma. Of particular interest
are a fusion transcript, two new genes and gene TEM8 (tumour endothelial marker 8) that is known to
be involved in cancer [241-243]. Future functional tests are needed to clarify their putative roles in
neuroblastoma.
Recently, a new method for high-resolution detection of DNA copy number changes was introduced
[185, 186]. The mapping 10K array technology uses oligonucleotide arrays that were originally
designed to detect single nucleotide polymorphisms (SNPs). To further validate our method for
amplicon dissection, this genome-wide LOH profiling and copy number assessment was applied to the
2p amplicon in IMR-32 (Figure 7).
Except for gene TEM8 (for which no SNP was present on the chip), this method confirmed the
amplification of genes MYCN, DDX1, NAG, NSE1 and MEIS1. A region that contains the tyrosine
Chapter 3: Investigation of the 2p amplicon in neuroblastoma 106
kinase receptor gene ALK (anaplastic lymphoma kinase) not detected by arrayCGH on SSH clones
was also found to be amplified by mapping 10K array technology. FISH and real-time quantitative PCR
confirmed these results. Subsequent expression analysis of this gene in cell lines IMR-32 and SK-N-
SH showed a lower expression in IMR-32 compared to SK-N-SH which explains why ALK was not
isolated with our methodology. Interestingly, ALK is exclusively expressed in the developing embryonic
nervous system [244]. Further studies showed ALK expression in neuronal derived malignancies
including neuroblastoma [245-247]. In two neuroblastoma cell lines, i.e. NB39nu, and Nagai, ALK was
found to be amplified resulting in the overexpression of the ALK protein [247]. In addition, the mapping
10K array technology could demonstrate the complex structure of the HSR of IMR32. Detection of non
amplified SNPs lying in between the amplified genes was suggestive for co-amplification of non
contiguous segments.
Figure 7: Copy number for SNPs on the distal end of 2p determined by the mapping 10K array technology (linear scale); this method confirmed the co-amplification of NSE1, NAG, DDX1, MEIS1, but not TEM8, and identified ALK amplification.
These results show that the mapping 10K array technology is of utmost value for amplicon dissections.
In the near future, a 500K array will be released and will allow an even more sensitive amplicon
investigation. A drawback of this technology is the high costs and the fact that this analysis does not
provide information on the transcriptional level, thus not directly pinpointing genes which drive
amplicon formation. Interestingly, our methodology also resulted in the infinite availability of the
subtracted cDNA clones as well as cDNA microarrays that are now being applied in the Centre for
Medical Genetics Ghent to identify MYCN downstream genes using MYCN transferred cell lines. In
expectation of the complete annotation of the human genome, our methodology in combination with
the mapping 10K array technology is an extremely valuable approach for the in-depth study of specific
amplicons and for the identification of the involved genes. For example, both methodologies may be
useful for the investigation of the complex 17q-amplicon in breast cancer that contains the ERBB2
gene, as well as several other genes that are activated and may contribute to breast cancer
development and progression [108, 109].

CHAPTER 4 Investigationof candidate neuroblastomagenes on chromosome 11
Chapter 4 Investigation of candidate neuroblastoma genes on chromosome 11
1 Introduction 109 2 Results 110
2.1 PAPER 5 110 2.2 PAPER 6 126
3 Discussion 141
Chapter 4: Investigation of candidate neuroblastoma genes on chromosome 11 108
1 Introduction In a collaborative study, we were the first to describe 11q-deletion as a characteristic chromosomal
aberration present in a subgroup of high-stage neuroblastomas with 17q-gain, but without MYCN
amplification (see 2.2.2 Chapter 1) [66-68, 111]. At this moment, the molecular pathogenesis of this
neuroblastoma subgroup is still unknown. The search for a neuroblastoma suppressor gene on
chromosome 11q may lead to the identification of a new target for treatment of unfavourable tumours
of this subgroup, comparable to MYCN that is now being investigated as target gene for treatment of
tumours of the other unfavourable subgroup [59].
The identification of genes implicated in neuroblastoma on 11q may be achieved following two
approaches, i.e. the candidate gene approach and through expression profiling of model-systems or
neuroblastoma tumours and normal neuroblasts. First, as described in PAPER 5, SDHD was
investigated as a strong positional and functional candidate tumour suppressor gene on 11q23 in
neuroblastoma. Second, PAPER 6 describes a functional approach which has been used in order to
prove the presence of a tumour suppressor gene on a given chromosome or chromosome segment,
i.e. the transfer of chromosomes into tumour cell lines using microcell mediated chromosome transfer
(MMCT). We specifically aimed at investigating available 11q-deleted neuroblastoma cell lines before
and after chromosome 11 transfer [113]. Interestingly, most of these microcell hybrid subclones
showed a differentiated phenotype, and we therefore used them as model system to search for the
targeted regions and genes on chromosome 11.
Chapter 4: Investigation of candidate neuroblastoma genes on chromosome 11 109
2 Results
2.1 PAPER 5
No evidence for involvement of SDHD in neuroblastoma pathogenesis
De Preter Katleen, Vandesompele Jo, Hoebeeck Jasmien, Vandenbroecke Caroline, Smet Jöel, Nuyts
Annick, Laureys Geneviève, Combaret Valérie, Van Roy Nadine, Roels Frank, Van Coster Rudy,
Praet Marleen, De Paepe Anne, Speleman Frank
BMC Cancer 2004 Aug 24;4(1):55
Chapter 4: Investigation of candidate neuroblastoma genes on chromosome 11 110
BioMed Central
Page 1 of 15(page number not for citation purposes)
BMC Cancer
Open AccessResearch articleNo evidence for involvement of SDHD in neuroblastoma pathogenesisKatleen De Preter1, Jo Vandesompele1, Jasmien Hoebeeck1, Caroline Vandenbroecke2, Jöel Smet3, Annick Nuyts2, Geneviève Laureys3, Valérie Combaret4, Nadine Van Roy1, Frank Roels2, Rudy Van Coster3, Marleen Praet2, Anne De Paepe1 and Frank Speleman*1
Address: 1Center for Medical Genetics, Ghent University Hospital, K5, De Pintelaan 185, B-9000 Ghent, Belgium, 2Department of Pathological Anatomy, Ghent University Hospital, BLOK A, De Pintelaan 185, B-9000 Ghent, Belgium, 3Department of Paediatrics, Ghent University Hospital, K6, De Pintelaan 185, B-9000 Ghent, Belgium and 4Molecular Oncology Unit, Centre Léon Bérard, 28 rue Laennec, F-69373 Lyon, France
Email: Katleen De Preter - [email protected]; Jo Vandesompele - [email protected]; Jasmien Hoebeeck - [email protected]; Caroline Vandenbroecke - [email protected]; Jöel Smet - [email protected]; Annick Nuyts - [email protected]; Geneviève Laureys - [email protected]; Valérie Combaret - [email protected]; Nadine Van Roy - [email protected]; Frank Roels - [email protected]; Rudy Van Coster - [email protected]; Marleen Praet - [email protected]; Anne De Paepe - [email protected]; Frank Speleman* - [email protected]
* Corresponding author
AbstractBackground: Deletions in the long arm of chromosome 11 are observed in a subgroup of advanced stageneuroblastomas with poor outcome. The deleted region harbours the tumour suppressor gene SDHD that isfrequently mutated in paraganglioma and pheochromocytoma, which are, like neuroblastoma, tumours originatingfrom the neural crest. In this study, we sought for evidence for involvement of SDHD in neuroblastoma.
Methods: SDHD was investigated on the genome, transcriptome and proteome level using mutation screening,methylation specific PCR, real-time quantitative PCR based homozygous deletion screening and mRNAexpression profiling, immunoblotting, functional protein analysis and ultrastructural imaging of the mitochondria.
Results: Analysis at the genomic level of 67 tumour samples and 37 cell lines revealed at least 2 bona-fidemutations in cell lines without allelic loss at 11q23: a 4bp-deletion causing skip of exon 3 resulting in a prematurestop codon in cell line N206, and a Y93C mutation in cell line NMB located in a region affected by germline SDHDmutations causing hereditary paraganglioma. No evidence for hypermethylation of the SDHD promotor regionwas observed, nor could we detect homozygous deletions. Interestingly, SDHD mRNA expression wassignificantly reduced in SDHD mutated cell lines and cell lines with 11q allelic loss as compared to both cell lineswithout 11q allelic loss and normal foetal neuroblast cells. However, protein analyses and assessment ofmitochondrial morphology presently do not provide clues as to the possible effect of reduced SDHD expressionon the neuroblastoma tumour phenotype.
Conclusions: Our study provides no indications for 2-hit involvement of SDHD in the pathogenesis ofneuroblastoma. Also, although a haplo-insufficient mechanism for SDHD involvement in advanced stageneuroblastoma could be considered, the present data do not provide consistent evidence for this hypothesis.
Published: 24 August 2004
BMC Cancer 2004, 4:55 doi:10.1186/1471-2407-4-55
Received: 29 April 2004Accepted: 24 August 2004
This article is available from: http://www.biomedcentral.com/1471-2407/4/55
© 2004 Katleen et al; licensee BioMed Central Ltd. This is an open-access article distributed under the terms of the Creative Commons Attribution License (http://creativecommons.org/licenses/by/2.0), which permits unrestricted use, distribution, and reproduction in any medium, provided the original work is properly cited.
Paper 5 111

BMC Cancer 2004, 4:55 http://www.biomedcentral.com/1471-2407/4/55
Page 2 of 15(page number not for citation purposes)
BackgroundNeuroblastoma (NB) is the most frequent extra-cranialsolid tumour in children, originating from immature neu-ral crest cells of the sympathetic nervous system [1]. Thetumours show remarkable differences in clinical presenta-tion ranging from localized to highly metastatic. Althoughage and clinical stage are strong prognostic indicators, par-ticular genetic aberrations, i.e. MYCN amplification and17q gain, also have a profound predictive power [2,3].Presently, three major clinico-genetic NB patient sub-groups have been recognized (subgroup 1, 2A and 2B) [4].Subgroup 1 consists of NB patients with favourable dis-ease stage (stage 1, 2 and 4S), most often infants youngerthan one year of age presenting with tumours with a neartriploid DNA content and a characteristic pattern of chro-mosomal instability including the consistent presence ofan extra chromosome 17. The two other NB patientgroups represent mainly older children with high-stagedisease (stage 3 and 4) and poor prognosis. Both NB sub-groups present with 17q-gain, but are distinguished bypresence of MYCN amplification and 1p-deletion in sub-group 2B and 11q-deletion often in combination with 3p-deletion in subgroup 2A [3,5-9].
The first evidence for the occurrence of 11q-deletions inNB was obtained in 1991 [10]. However, it was not untilrecently that a specific patient subgroup with this particu-lar genetic defect was recognized, representing approxi-mately 20% of cases [5-9,11-13]. The recurrent finding of11q-deletions in NB suggests the presence of a tumoursuppressor gene residing on the long arm of chromosome11. Additional functional evidence for this hypothesiscame from the observation that differentiation of NB cellscan be induced by transfer of an intact chromosome 11into a NB cell line [14]. Although both comparativegenomic hybridization (CGH) and loss of heterozygosity(LOH) studies indicate that the majority of the 11q-dele-tions are distal losses encompassing a large portion of thelong arm [5-9,12,13,15,16], detection of rare small orinterstitial deletions allowed the provisional localizationof an SRO (shortest region of overlap) at 11q23.3 betweenmarkers D11S1340 and D11S1299, encompassing a dis-tance of approximately 3 Mb [16]. When a single tumourwith two small interstitial deletions is not taken into con-sideration, the SRO is defined by a small subset oftumours and spans 18 Mb between markers D11S898 andD11S1299 (according to UCSC Genome Browser, freezeversion July 2003). This region harbours SDHD, whichencodes the small subunit D (cybS, cytochrome b558) ofthe mitochondrial respiratory chain complex II (succi-nate-ubiquinone oxidoreductase) [17,18] and wasrecently recognized as a prototype tumour suppressorgene [19].
The first evidence for a role of SDHD in tumour develop-ment was obtained by the discovery of germline muta-tions in this gene as the cause for familial paraganglioma(PGL) [19]. Somatic and occult germline SDHD muta-tions were also detected in patients with apparently spo-radic pheochromocytoma (PC) [20,21]. It seems thatmost of the individuals with PC possess SDHD mutationsin the 5' portion of the gene causing complete disassem-bly of complex II, whereas PGL are associated with muta-tions in the 3' region of the gene causing partialinactivation of its catalytic activity [19-28]. PGL and PCare histologically related to NB as they are all neural crestderived. NBs consist of immature neuroblasts, whereasPGL and PC contain mature chromaffin cells. Of furtherinterest is the fact that, in addition to the well establishedrole of SDHD in oxidative phosphorylation, SDHD hasalso been presumed to contribute to the function of themitochondria as oxygen sensors. It was shown that SDHDinactivation leads to a pseudo-hypoxic state and upregula-tion of hypoxia responsive genes, possibly throughincreased production of reactive oxygen species (ROS)[23]. A hypoxia-induced shift toward a neural crest-likephenotype has been shown to result in more aggressiveNB cells with increased potential to metastasize [29].Consequently, inactivating SDHD mutations or reducedactivity of SDHD might lead to impaired oxidative phos-phorylation and hypoxia and thus contribute to NBoncogenesis.
In view of the above, we considered SDHD as a positionaland functional candidate for the presumed NB tumoursuppressor gene on 11q23. In order to search for evidencefor involvement of SDHD in NB development, an exten-sive series of investigations was performed on the DNA,RNA and protein level.
MethodsNB patient and cell line samplesNeuroblastoma (NB) tumour samples (at least 70%tumour cells) were collected at the Ghent University Hos-pital (Ghent, Belgium) (n = 32) and in the MolecularOncology Unit (Lyon, France) (n = 35). Ethical approvalwas obtained for the collection of the tumour samples.The latter group includes selected patients with stage 3 or4 NB without MYCN amplification. For all NB patientsconstitutional leukocyte DNA was available. In addition,31 NB cell lines were included in the analysis of whichkaryotypes were available. For 20 of these cell lines, com-parative genomic hybridization (CGH) data and/or M-FISH (multicolour fluorescence in situ hybridization)results have been published [30-32]. For screening ofsequence variants in a normal population, leukocyte DNAfrom 135 unrelated healthy individuals was used. DNAwas extracted as previously described [33].
Paper 5 112
BMC Cancer 2004, 4:55 http://www.biomedcentral.com/1471-2407/4/55
Page 3 of 15(page number not for citation purposes)
Cultures of NB cell lines N206, SK-N-AS, SK-N-SH, NMB,SK-N-FI, CLB-GA, LA-N-2 and NGP were treated withpuromycine (100 µg/ml) during 6 hours in order to pre-vent possible nonsense mediated RNA decay of variantSDHD transcripts. RNA of the cell line pellets (treated anduntreated) was extracted with the RNeasy Mini kit (Qia-gen) according to the manufacturer, followed by RNasefree DNase treatment on column (Qiagen). A fraction ofthe untreated NB cell line cultures was also used for func-tional enzyme assays.
11q23 status of samplesDetermination of the 11q23 status in NB cell lines and tumours with LOH or FISHThe 11q status of the cell lines was evaluated using FISH.FISH was performed using the LSI MLL (11q23.3) Spec-trumOrange probe (Vysis) and BAC clone RP11-93E4 forthe CRTAM gene (11q24.1) in combination with a centro-meric probe for chromosome 11. Labelling and FISH wasperformed as described [34]. For each case at least twentymetaphase chromosomes and 100 interphase nuclei werescreened.
All NB patients were analyzed with 4 microsatellite mark-ers on 11q23: D11S1986 (11q23.1), D11S1998(11q23.3), D11S1356 (11q23.3) and D11S1299(11q23.3), of which D11S1986 and D11S1998 are imme-diately flanking the SDHD gene. In order to discriminatebetween whole chromosome loss, and unbalanced 11qloss (= partial 11q loss), two microsatellite markers on11p (D11S922 on 11p15.5 and D11S1324 on 11p14.1)were analyzed in patients that showed allelic imbalancefor all 11q markers (positions of the markers are accord-ing to the UCSC Genome Browser, freeze version July2003). Scoring of loss of heterozygosity (LOH) was per-formed by calculation of the allelic imbalance factor (AIF)[35], whereby AIF > 2 denotes allelic imbalance, and AIF> 5 denotes LOH. Experimental conditions for the fluores-cent based LOH screening can be obtained from theauthors upon request.
Homozygous deletion screening in NB cell linesReal-time quantitative PCR primers were designed in thefour exons of SDHD using Primer Express v2.0 (AppliedBiosystems) (Table 1). Exon 1 was too small for primerdesign in the exonic region; therefore primers flanking theexonic region were designed. Real-time quantitative PCRand quantification was performed as described [33].
MSPOn the 31 NB cell lines and on another series of 50 NBtumours of which 15 were included in the mutation anal-ysis, methylation-specific PCR (MSP) was performed asdescribed, with minor modifications [36]. MSP primerswere designed using the web-based MSP design software
MethPrimer http://www.urogene.org/methprimer/[37]and checked for specificity using the methBLAST softwarehttp://medgen.ugent.be/methblast/ (Pattyn et al., in prep-aration). Primers were designed in a CpG island close tothe start of the gene (putative SDHD promotor) (chr11:111495002–111495330: UCSC Genome Browser freezeversion July 2003) (methylated forward5'GTAGTCGGGATCGAGTATTAGTGAGTC3', methylatedreverse 5'AATAAACCGAAAATCGAAAAACGAT3',unmethylated forward5'AGTTGGGATTGAGTATTAGTGAGTTGT3', unmethyl-ated reverse5'ACTAAATAAACCAAAAATCAAAAAACAAT3'). Amplifi-cation mixtures (50 µl) for the PCR reaction contained 50ng template DNA, 1× Platinum Taq PCR reaction buffer(Invitrogen), 6 mM MgCl2, 200 µM of each dNTP, 1.25 UPlatinum Taq polymerase (Invitrogen), 3% DMSO and300 nM of each primer. The cycling conditions comprised4 min polymerase activation at 93°C, 40 cycles with dena-turation at 93°C for 30 sec, annealing at 64°C (methyl-ated primers) or 65°C (unmethylated primers) for 30 secand extension at 72°C for 30 sec, and a final extension for5 min at 72°C. SssI methylase (New England Biolabs)treated DNA, following the manufacturer's instructionsand normal human genomic DNA were used as a positiveand negative control respectively after bisulfitemodification.
Mutation analysisDHPLC analysisIntronic primers flanking the SDHD exons were designedusing Primer Express v2.0 (Applied Biosystems), based onthe publicly available SDHD genomic sequence (acces-sion number AB026906) (Table 2). PCR reactions wereperformed on a PTC-200 DNA engine (MJ Research).Amplification mixtures (25 µl) contained 10 ng templateDNA, 1× Platinum Taq PCR reaction buffer (Invitrogen),2.5 mM MgCl2, 200 µM of each dNTP, 1 U Platinum Taqpolymerase (Invitrogen) and 500 nM of each primer. Thecycling conditions comprised 3 min polymerase activa-tion at 94°C, 35 cycles with denaturation at 92°C for 20sec, annealing at 60°C for 20 sec and extension at 72°Cfor 2 min, a final extension for 5 min at 72°C and a slowdecrease in temperature to 25°C over 30 minutes. One µlof the PCR products was analyzed on a Ready-To-RunAgarose Gel (1.2%) (Amersham Biosciences).
Denaturing high-pressure liquid chromatography(DHPLC) was performed using the Wave system (Transg-enomic). The melting profile of each fragment was deter-mined using the Wavemaker software v4.1(Transgenomic). Crude PCR product was injected into apreheated, fully equilibrated chromatographic column forthe DHPLC analysis. Exon 1 fragments were eluted at atemperature of Tm(= 62.1°C)+0.7°C and Tm+1.5°C. Exon
Paper 5 113
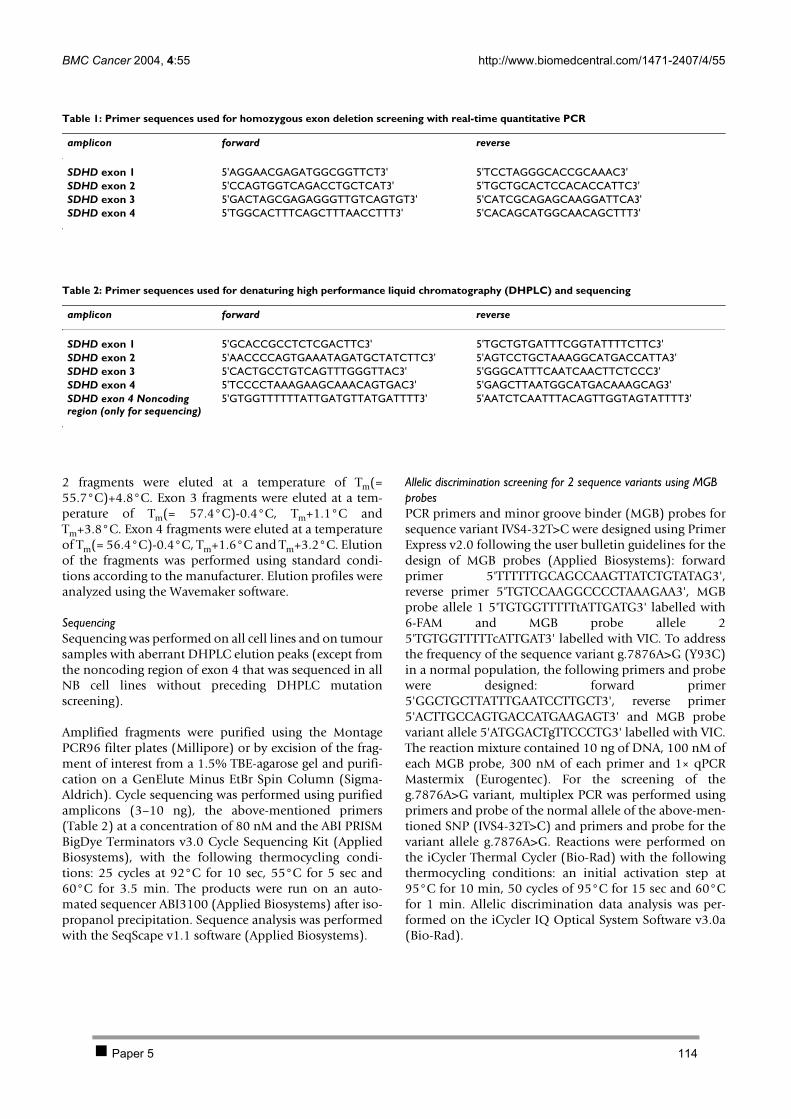
BMC Cancer 2004, 4:55 http://www.biomedcentral.com/1471-2407/4/55
Page 4 of 15(page number not for citation purposes)
2 fragments were eluted at a temperature of Tm(=55.7°C)+4.8°C. Exon 3 fragments were eluted at a tem-perature of Tm(= 57.4°C)-0.4°C, Tm+1.1°C andTm+3.8°C. Exon 4 fragments were eluted at a temperatureof Tm(= 56.4°C)-0.4°C, Tm+1.6°C and Tm+3.2°C. Elutionof the fragments was performed using standard condi-tions according to the manufacturer. Elution profiles wereanalyzed using the Wavemaker software.
SequencingSequencing was performed on all cell lines and on tumoursamples with aberrant DHPLC elution peaks (except fromthe noncoding region of exon 4 that was sequenced in allNB cell lines without preceding DHPLC mutationscreening).
Amplified fragments were purified using the MontagePCR96 filter plates (Millipore) or by excision of the frag-ment of interest from a 1.5% TBE-agarose gel and purifi-cation on a GenElute Minus EtBr Spin Column (Sigma-Aldrich). Cycle sequencing was performed using purifiedamplicons (3–10 ng), the above-mentioned primers(Table 2) at a concentration of 80 nM and the ABI PRISMBigDye Terminators v3.0 Cycle Sequencing Kit (AppliedBiosystems), with the following thermocycling condi-tions: 25 cycles at 92°C for 10 sec, 55°C for 5 sec and60°C for 3.5 min. The products were run on an auto-mated sequencer ABI3100 (Applied Biosystems) after iso-propanol precipitation. Sequence analysis was performedwith the SeqScape v1.1 software (Applied Biosystems).
Allelic discrimination screening for 2 sequence variants using MGB probesPCR primers and minor groove binder (MGB) probes forsequence variant IVS4-32T>C were designed using PrimerExpress v2.0 following the user bulletin guidelines for thedesign of MGB probes (Applied Biosystems): forwardprimer 5'TTTTTTGCAGCCAAGTTATCTGTATAG3',reverse primer 5'TGTCCAAGGCCCCTAAAGAA3', MGBprobe allele 1 5'TGTGGTTTTTtATTGATG3' labelled with6-FAM and MGB probe allele 25'TGTGGTTTTTcATTGAT3' labelled with VIC. To addressthe frequency of the sequence variant g.7876A>G (Y93C)in a normal population, the following primers and probewere designed: forward primer5'GGCTGCTTATTTGAATCCTTGCT3', reverse primer5'ACTTGCCAGTGACCATGAAGAGT3' and MGB probevariant allele 5'ATGGACTgTTCCCTG3' labelled with VIC.The reaction mixture contained 10 ng of DNA, 100 nM ofeach MGB probe, 300 nM of each primer and 1× qPCRMastermix (Eurogentec). For the screening of theg.7876A>G variant, multiplex PCR was performed usingprimers and probe of the normal allele of the above-men-tioned SNP (IVS4-32T>C) and primers and probe for thevariant allele g.7876A>G. Reactions were performed onthe iCycler Thermal Cycler (Bio-Rad) with the followingthermocycling conditions: an initial activation step at95°C for 10 min, 50 cycles of 95°C for 15 sec and 60°Cfor 1 min. Allelic discrimination data analysis was per-formed on the iCycler IQ Optical System Software v3.0a(Bio-Rad).
Table 1: Primer sequences used for homozygous exon deletion screening with real-time quantitative PCR
amplicon forward reverse
SDHD exon 1 5'AGGAACGAGATGGCGGTTCT3' 5'TCCTAGGGCACCGCAAAC3'SDHD exon 2 5'CCAGTGGTCAGACCTGCTCAT3' 5'TGCTGCACTCCACACCATTC3'SDHD exon 3 5'GACTAGCGAGAGGGTTGTCAGTGT3' 5'CATCGCAGAGCAAGGATTCA3'SDHD exon 4 5'TGGCACTTTCAGCTTTAACCTTT3' 5'CACAGCATGGCAACAGCTTT3'
Table 2: Primer sequences used for denaturing high performance liquid chromatography (DHPLC) and sequencing
amplicon forward reverse
SDHD exon 1 5'GCACCGCCTCTCGACTTC3' 5'TGCTGTGATTTCGGTATTTTCTTC3'SDHD exon 2 5'AACCCCAGTGAAATAGATGCTATCTTC3' 5'AGTCCTGCTAAAGGCATGACCATTA3'SDHD exon 3 5'CACTGCCTGTCAGTTTGGGTTAC3' 5'GGGCATTTCAATCAACTTCTCCC3'SDHD exon 4 5'TCCCCTAAAGAAGCAAACAGTGAC3' 5'GAGCTTAATGGCATGACAAAGCAG3'SDHD exon 4 Noncoding region (only for sequencing)
5'GTGGTTTTTTATTGATGTTATGATTTT3' 5'AATCTCAATTTACAGTTGGTAGTATTTT3'
Paper 5 114

BMC Cancer 2004, 4:55 http://www.biomedcentral.com/1471-2407/4/55
Page 5 of 15(page number not for citation purposes)
The SNP info for the IVS4-32T>C variant was submitted toNCBI's SNP database (sn#5606973, SDHD_IVS4-32).
Full-length SDHD mRNA amplificationIn order to investigate predicted or putative splice variantscaused by the 4 bp-deletion in NB cell line N206 andSDHD sequence variants present in other cell lines, thecoding region of the full-length SDHD mRNA was ampli-fied for cell lines N206, SK-N-AS, SK-N-SH, NMB, SK-N-FI, CLB-GA, LA-N-2 and NGP, before and after puromycintreatment. RNA extraction, DNase treatment and cDNAsynthesis were performed as described [38]. SubsequentPCR was performed with forward primer5'AGGAACGAGATGGCGGTTCTC3' (exon 1) and reverseprimer 5'GCTTCCACAGCATGGCAACA3' (exon 4). PCRproducts were run on an agarose gel, purified andsequenced using the above-mentioned protocol. Thesequence information also provided evidence on theallelic mRNA expression status of SDHD.
Quantification of SDHD expression using real-time quantitative RT-PCRRelative SDHD expression levels were determined usingan optimized two-step SYBR Green I RT-PCR assay [38]with minor modifications in 31 cell lines, 7 normal con-trol samples (human brain, trachea, lung, heart, breast,kidney, liver) and in laser capture microdissected foetalneuroblast cells [39]. The comparative CT method wasused for quantification. PCR reagents were obtained fromEurogentec as SYBR Green I mastermixes and used accord-ing to the manufacturer's instructions. Primers in exon 3were designed using Primer Express (see Primers Exon 3 inTable 1). Reactions were run on an ABI5700 (Applied Bio-systems). Gene expression levels were normalized usingthe geometric mean of the 4 most stable internal controlgenes in NB (i.e. UBC, HPRT1, SDHA and GAPD) asreported previously [40].
Complex II activity and protein assaysEnzyme activities were determined spectrophotometri-cally as previously described [41].
Protein amount was determined with immunoblot analy-sis of complex II Fp fragment as previously described [42].Relative protein amounts of complex II compared to com-plex IV were measured using the TotalLab software (Amer-sham Biosciences).
Ultrastructural analysis of mitochondria in NB cell linesMitochondria of NB cell lines LA-N-2, SK-N-AS, CLB-GA,NGP, CHP-901, SK-N-SH, SK-N-FI, N206, SJNB-12, SJNB-8, NMB, SJNB-10 and IMR-32, breast carcinoma cell lineMCF-7 and, Ewing sarcoma cell line SK-N-MC were ana-lysed by electron microscopy. Monolayers from these celllines were briefly rinsed twice in PBS and then immersed
at room temperature in 3 % glutaraldehyde buffered withNa-cacodylate at pH 7.3 for 1 h. After rinses in this bufferwith 1 % bovine serum albumin, cells were scraped offwith a rubber policeman, and centrifuged with 3 % glutar-aldehyde. After washing, the pellets were postfixed in 2 %buffered OsO4 for 1 h at 4°C. Block staining in uranylac-etate (UAc) in 70 % ethanol was followed by dehydrationin ethanol and propylene oxide, and embedding in Epon.Ultrathin sections were counterstained with UAc and lead.At least 2 cells in each culture were photographed at amagnification of 20,000 in a Zeiss electron microscopeoperating at 50 KV. Per culture, 25–63 mitochondria wereexamined. Their projected length (largest straight dis-tance) was measured and matrix electron density wascompared to the surrounding cytosol.
Electron microscopic files were made on 11 archived neu-roblastic tumours. In addition, previously published caseswere examined for mitochondria morphology.
ResultsSDHD deletion, mutation and methylation analysis11q23-deletion screeningPrevious karyotyping, comparative genomic hybridiza-tion (CGH) and/or M-FISH revealed 11q-deletions in 9out of 31 neuroblastoma (NB) cell lines (CLB-GA, GI-ME-N, IMR-32, LA-N-6, NBL-S, NGP, SK-N-AS, NMB, N206)[30-32]. In this study, the presence of 11q23-deletionswas confirmed by FISH in all these cell lines except N206for which the deletion was located distal to the MLL locus(11q23.23) (not shown) (Table 3). Sequencing analysisof SDHD on 11q23 demonstrated that the allelic imbal-ance in NMB does not cause loss of heterozygosity (seelater). No previously unnoticed submicroscopic 11q23-deletions were detected. Screening for homozygous dele-tions in all SDHD exons was negative for the 31 NB celllines.
In 20 of the 67 NB tumour samples, loss of heterozygosity(LOH) or allelic imbalance (AI) (AIF > 2) in the 11q23region was found (Table 3): unbalanced 11q LOH (i.e.partial allelic loss of the long arm of chromosome 11) in2/32 patients of the Ghent University Hospital (Ghent,Belgium) and in 7/35 patients of the Molecular OncologyUnit (Lyon, France) and loss of markers on both chromo-some arms (indicating whole chromosome 11 loss, or co-occurrence of 11q and 11p allelic loss) in 3/32 patients ofthe Ghent University Hospital and 8/35 patients of theMolecular Oncology Unit (Table 3). The higher frequencyof chromosome 11 LOH in the patient subgroup of theMolecular Oncology Unit can be explained by theselection for patient samples of high stage without MYCNamplification, in contrast to the other patient subgroupfor which samples were unselected.
Paper 5 115
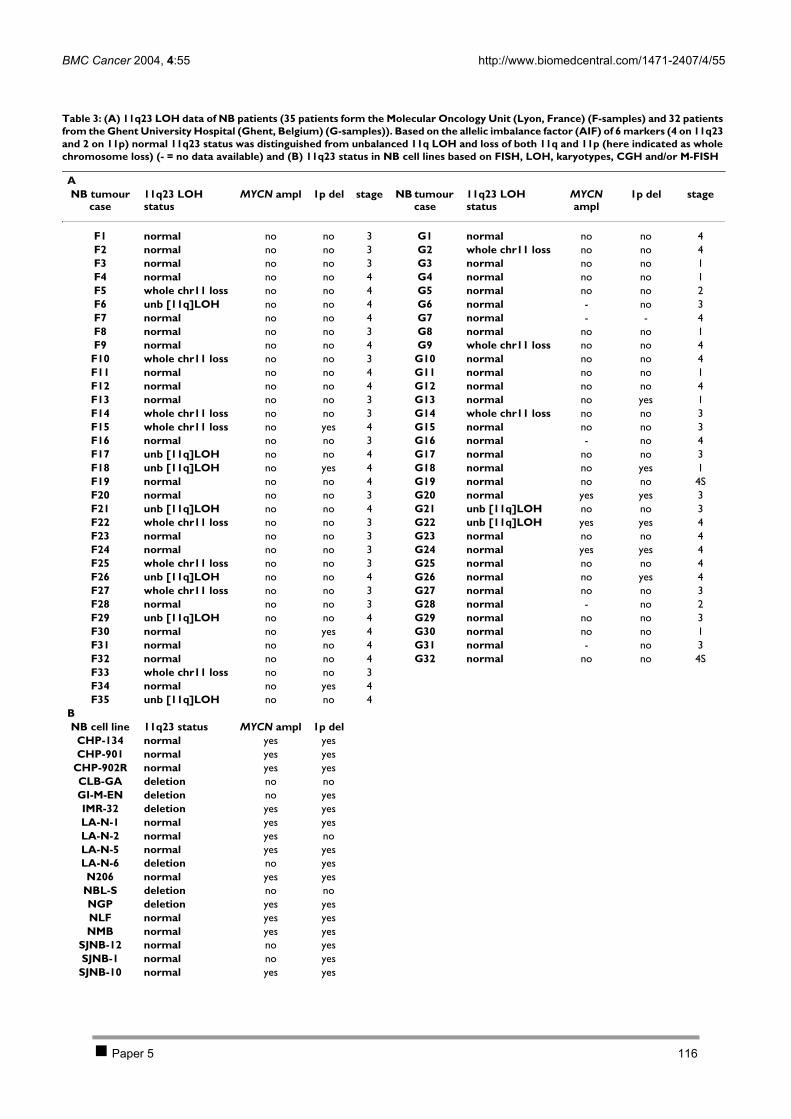
BMC Cancer 2004, 4:55 http://www.biomedcentral.com/1471-2407/4/55
Page 6 of 15(page number not for citation purposes)
Table 3: (A) 11q23 LOH data of NB patients (35 patients form the Molecular Oncology Unit (Lyon, France) (F-samples) and 32 patients from the Ghent University Hospital (Ghent, Belgium) (G-samples)). Based on the allelic imbalance factor (AIF) of 6 markers (4 on 11q23 and 2 on 11p) normal 11q23 status was distinguished from unbalanced 11q LOH and loss of both 11q and 11p (here indicated as whole chromosome loss) (- = no data available) and (B) 11q23 status in NB cell lines based on FISH, LOH, karyotypes, CGH and/or M-FISH
ANB tumour
case11q23 LOH status
MYCN ampl 1p del stage NB tumour case
11q23 LOH status
MYCN ampl
1p del stage
F1 normal no no 3 G1 normal no no 4F2 normal no no 3 G2 whole chr11 loss no no 4F3 normal no no 3 G3 normal no no 1F4 normal no no 4 G4 normal no no 1F5 whole chr11 loss no no 4 G5 normal no no 2F6 unb [11q]LOH no no 4 G6 normal - no 3F7 normal no no 4 G7 normal - - 4F8 normal no no 3 G8 normal no no 1F9 normal no no 4 G9 whole chr11 loss no no 4F10 whole chr11 loss no no 3 G10 normal no no 4F11 normal no no 4 G11 normal no no 1F12 normal no no 4 G12 normal no no 4F13 normal no no 3 G13 normal no yes 1F14 whole chr11 loss no no 3 G14 whole chr11 loss no no 3F15 whole chr11 loss no yes 4 G15 normal no no 3F16 normal no no 3 G16 normal - no 4F17 unb [11q]LOH no no 4 G17 normal no no 3F18 unb [11q]LOH no yes 4 G18 normal no yes 1F19 normal no no 4 G19 normal no no 4SF20 normal no no 3 G20 normal yes yes 3F21 unb [11q]LOH no no 4 G21 unb [11q]LOH no no 3F22 whole chr11 loss no no 3 G22 unb [11q]LOH yes yes 4F23 normal no no 3 G23 normal no no 4F24 normal no no 3 G24 normal yes yes 4F25 whole chr11 loss no no 3 G25 normal no no 4F26 unb [11q]LOH no no 4 G26 normal no yes 4F27 whole chr11 loss no no 3 G27 normal no no 3F28 normal no no 3 G28 normal - no 2F29 unb [11q]LOH no no 4 G29 normal no no 3F30 normal no yes 4 G30 normal no no 1F31 normal no no 4 G31 normal - no 3F32 normal no no 4 G32 normal no no 4SF33 whole chr11 loss no no 3F34 normal no yes 4F35 unb [11q]LOH no no 4
BNB cell line 11q23 status MYCN ampl 1p del
CHP-134 normal yes yesCHP-901 normal yes yes
CHP-902R normal yes yesCLB-GA deletion no noGI-M-EN deletion no yesIMR-32 deletion yes yesLA-N-1 normal yes yesLA-N-2 normal yes noLA-N-5 normal yes yesLA-N-6 deletion no yesN206 normal yes yes
NBL-S deletion no noNGP deletion yes yesNLF normal yes yesNMB normal yes yes
SJNB-12 normal no yesSJNB-1 normal no yesSJNB-10 normal yes yes
Paper 5 116
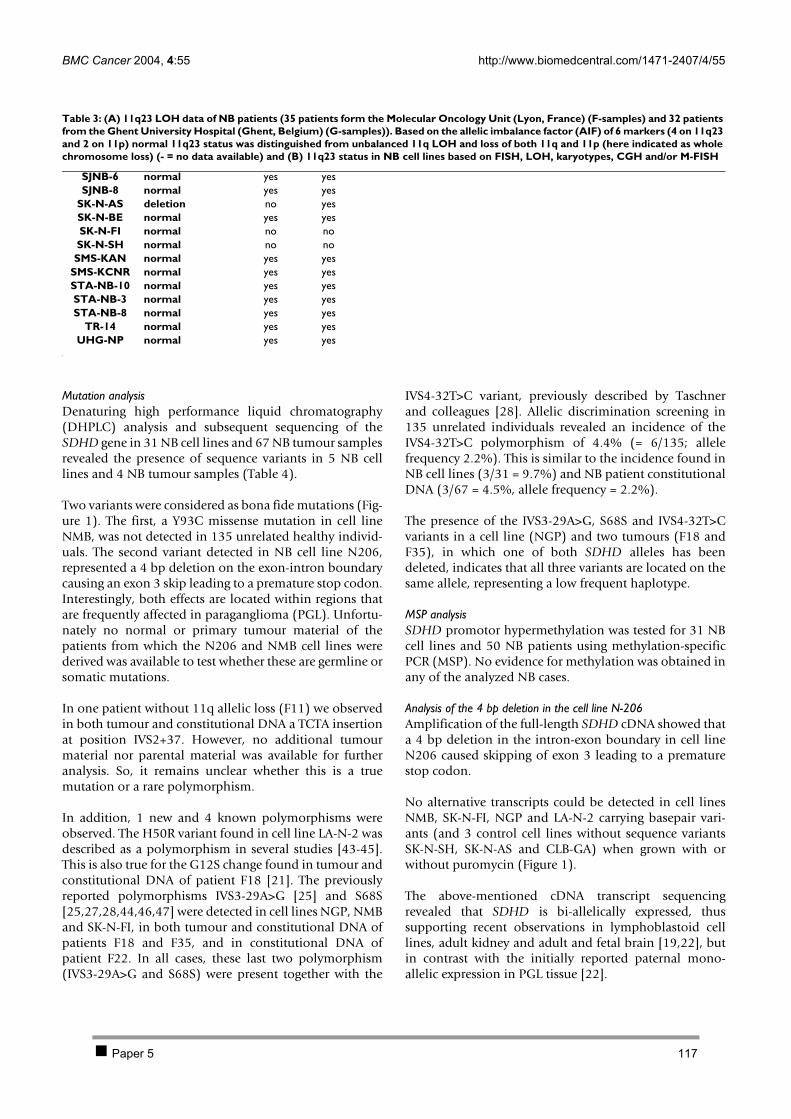
BMC Cancer 2004, 4:55 http://www.biomedcentral.com/1471-2407/4/55
Page 7 of 15(page number not for citation purposes)
Mutation analysisDenaturing high performance liquid chromatography(DHPLC) analysis and subsequent sequencing of theSDHD gene in 31 NB cell lines and 67 NB tumour samplesrevealed the presence of sequence variants in 5 NB celllines and 4 NB tumour samples (Table 4).
Two variants were considered as bona fide mutations (Fig-ure 1). The first, a Y93C missense mutation in cell lineNMB, was not detected in 135 unrelated healthy individ-uals. The second variant detected in NB cell line N206,represented a 4 bp deletion on the exon-intron boundarycausing an exon 3 skip leading to a premature stop codon.Interestingly, both effects are located within regions thatare frequently affected in paraganglioma (PGL). Unfortu-nately no normal or primary tumour material of thepatients from which the N206 and NMB cell lines werederived was available to test whether these are germline orsomatic mutations.
In one patient without 11q allelic loss (F11) we observedin both tumour and constitutional DNA a TCTA insertionat position IVS2+37. However, no additional tumourmaterial nor parental material was available for furtheranalysis. So, it remains unclear whether this is a truemutation or a rare polymorphism.
In addition, 1 new and 4 known polymorphisms wereobserved. The H50R variant found in cell line LA-N-2 wasdescribed as a polymorphism in several studies [43-45].This is also true for the G12S change found in tumour andconstitutional DNA of patient F18 [21]. The previouslyreported polymorphisms IVS3-29A>G [25] and S68S[25,27,28,44,46,47] were detected in cell lines NGP, NMBand SK-N-FI, in both tumour and constitutional DNA ofpatients F18 and F35, and in constitutional DNA ofpatient F22. In all cases, these last two polymorphism(IVS3-29A>G and S68S) were present together with the
IVS4-32T>C variant, previously described by Taschnerand colleagues [28]. Allelic discrimination screening in135 unrelated individuals revealed an incidence of theIVS4-32T>C polymorphism of 4.4% (= 6/135; allelefrequency 2.2%). This is similar to the incidence found inNB cell lines (3/31 = 9.7%) and NB patient constitutionalDNA (3/67 = 4.5%, allele frequency = 2.2%).
The presence of the IVS3-29A>G, S68S and IVS4-32T>Cvariants in a cell line (NGP) and two tumours (F18 andF35), in which one of both SDHD alleles has beendeleted, indicates that all three variants are located on thesame allele, representing a low frequent haplotype.
MSP analysisSDHD promotor hypermethylation was tested for 31 NBcell lines and 50 NB patients using methylation-specificPCR (MSP). No evidence for methylation was obtained inany of the analyzed NB cases.
Analysis of the 4 bp deletion in the cell line N-206Amplification of the full-length SDHD cDNA showed thata 4 bp deletion in the intron-exon boundary in cell lineN206 caused skipping of exon 3 leading to a prematurestop codon.
No alternative transcripts could be detected in cell linesNMB, SK-N-FI, NGP and LA-N-2 carrying basepair vari-ants (and 3 control cell lines without sequence variantsSK-N-SH, SK-N-AS and CLB-GA) when grown with orwithout puromycin (Figure 1).
The above-mentioned cDNA transcript sequencingrevealed that SDHD is bi-allelically expressed, thussupporting recent observations in lymphoblastoid celllines, adult kidney and adult and fetal brain [19,22], butin contrast with the initially reported paternal mono-allelic expression in PGL tissue [22].
SJNB-6 normal yes yesSJNB-8 normal yes yes
SK-N-AS deletion no yesSK-N-BE normal yes yesSK-N-FI normal no noSK-N-SH normal no noSMS-KAN normal yes yes
SMS-KCNR normal yes yesSTA-NB-10 normal yes yesSTA-NB-3 normal yes yesSTA-NB-8 normal yes yes
TR-14 normal yes yesUHG-NP normal yes yes
Table 3: (A) 11q23 LOH data of NB patients (35 patients form the Molecular Oncology Unit (Lyon, France) (F-samples) and 32 patients from the Ghent University Hospital (Ghent, Belgium) (G-samples)). Based on the allelic imbalance factor (AIF) of 6 markers (4 on 11q23 and 2 on 11p) normal 11q23 status was distinguished from unbalanced 11q LOH and loss of both 11q and 11p (here indicated as whole chromosome loss) (- = no data available) and (B) 11q23 status in NB cell lines based on FISH, LOH, karyotypes, CGH and/or M-FISH
Paper 5 117
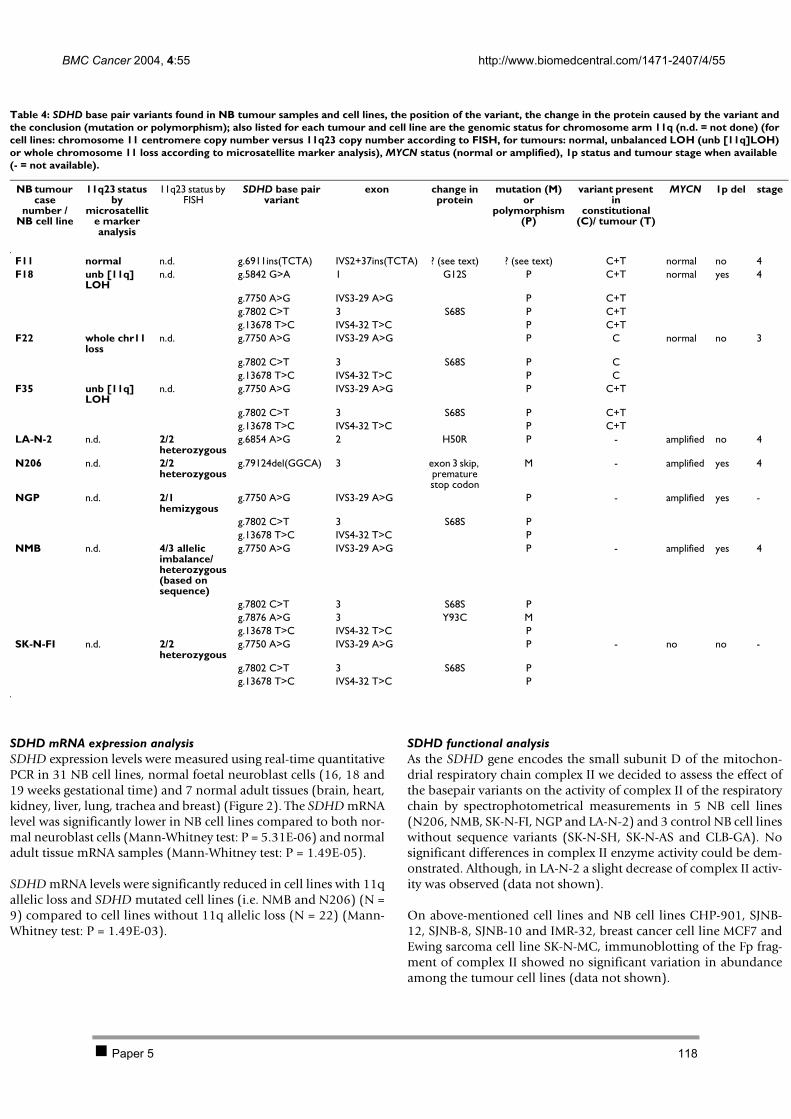
BMC Cancer 2004, 4:55 http://www.biomedcentral.com/1471-2407/4/55
Page 8 of 15(page number not for citation purposes)
SDHD mRNA expression analysisSDHD expression levels were measured using real-time quantitativePCR in 31 NB cell lines, normal foetal neuroblast cells (16, 18 and19 weeks gestational time) and 7 normal adult tissues (brain, heart,kidney, liver, lung, trachea and breast) (Figure 2). The SDHD mRNAlevel was significantly lower in NB cell lines compared to both nor-mal neuroblast cells (Mann-Whitney test: P = 5.31E-06) and normaladult tissue mRNA samples (Mann-Whitney test: P = 1.49E-05).
SDHD mRNA levels were significantly reduced in cell lines with 11qallelic loss and SDHD mutated cell lines (i.e. NMB and N206) (N =9) compared to cell lines without 11q allelic loss (N = 22) (Mann-Whitney test: P = 1.49E-03).
SDHD functional analysisAs the SDHD gene encodes the small subunit D of the mitochon-drial respiratory chain complex II we decided to assess the effect ofthe basepair variants on the activity of complex II of the respiratorychain by spectrophotometrical measurements in 5 NB cell lines(N206, NMB, SK-N-FI, NGP and LA-N-2) and 3 control NB cell lineswithout sequence variants (SK-N-SH, SK-N-AS and CLB-GA). Nosignificant differences in complex II enzyme activity could be dem-onstrated. Although, in LA-N-2 a slight decrease of complex II activ-ity was observed (data not shown).
On above-mentioned cell lines and NB cell lines CHP-901, SJNB-12, SJNB-8, SJNB-10 and IMR-32, breast cancer cell line MCF7 andEwing sarcoma cell line SK-N-MC, immunoblotting of the Fp frag-ment of complex II showed no significant variation in abundanceamong the tumour cell lines (data not shown).
Table 4: SDHD base pair variants found in NB tumour samples and cell lines, the position of the variant, the change in the protein caused by the variant and the conclusion (mutation or polymorphism); also listed for each tumour and cell line are the genomic status for chromosome arm 11q (n.d. = not done) (for cell lines: chromosome 11 centromere copy number versus 11q23 copy number according to FISH, for tumours: normal, unbalanced LOH (unb [11q]LOH) or whole chromosome 11 loss according to microsatellite marker analysis), MYCN status (normal or amplified), 1p status and tumour stage when available (- = not available).
NB tumour case
number / NB cell line
11q23 status by
microsatellite marker analysis
11q23 status by FISH
SDHD base pair variant
exon change in protein
mutation (M) or
polymorphism (P)
variant present in
constitutional (C)/ tumour (T)
MYCN 1p del stage
F11 normal n.d. g.6911ins(TCTA) IVS2+37ins(TCTA) ? (see text) ? (see text) C+T normal no 4F18 unb [11q]
LOHn.d. g.5842 G>A 1 G12S P C+T normal yes 4
g.7750 A>G IVS3-29 A>G P C+Tg.7802 C>T 3 S68S P C+Tg.13678 T>C IVS4-32 T>C P C+T
F22 whole chr11 loss
n.d. g.7750 A>G IVS3-29 A>G P C normal no 3
g.7802 C>T 3 S68S P Cg.13678 T>C IVS4-32 T>C P C
F35 unb [11q] LOH
n.d. g.7750 A>G IVS3-29 A>G P C+T
g.7802 C>T 3 S68S P C+Tg.13678 T>C IVS4-32 T>C P C+T
LA-N-2 n.d. 2/2 heterozygous
g.6854 A>G 2 H50R P - amplified no 4
N206 n.d. 2/2 heterozygous
g.79124del(GGCA) 3 exon 3 skip, premature stop codon
M - amplified yes 4
NGP n.d. 2/1 hemizygous
g.7750 A>G IVS3-29 A>G P - amplified yes -
g.7802 C>T 3 S68S Pg.13678 T>C IVS4-32 T>C P
NMB n.d. 4/3 allelic imbalance/ heterozygous (based on sequence)
g.7750 A>G IVS3-29 A>G P - amplified yes 4
g.7802 C>T 3 S68S Pg.7876 A>G 3 Y93C Mg.13678 T>C IVS4-32 T>C P
SK-N-FI n.d. 2/2 heterozygous
g.7750 A>G IVS3-29 A>G P - no no -
g.7802 C>T 3 S68S Pg.13678 T>C IVS4-32 T>C P
Paper 5 118
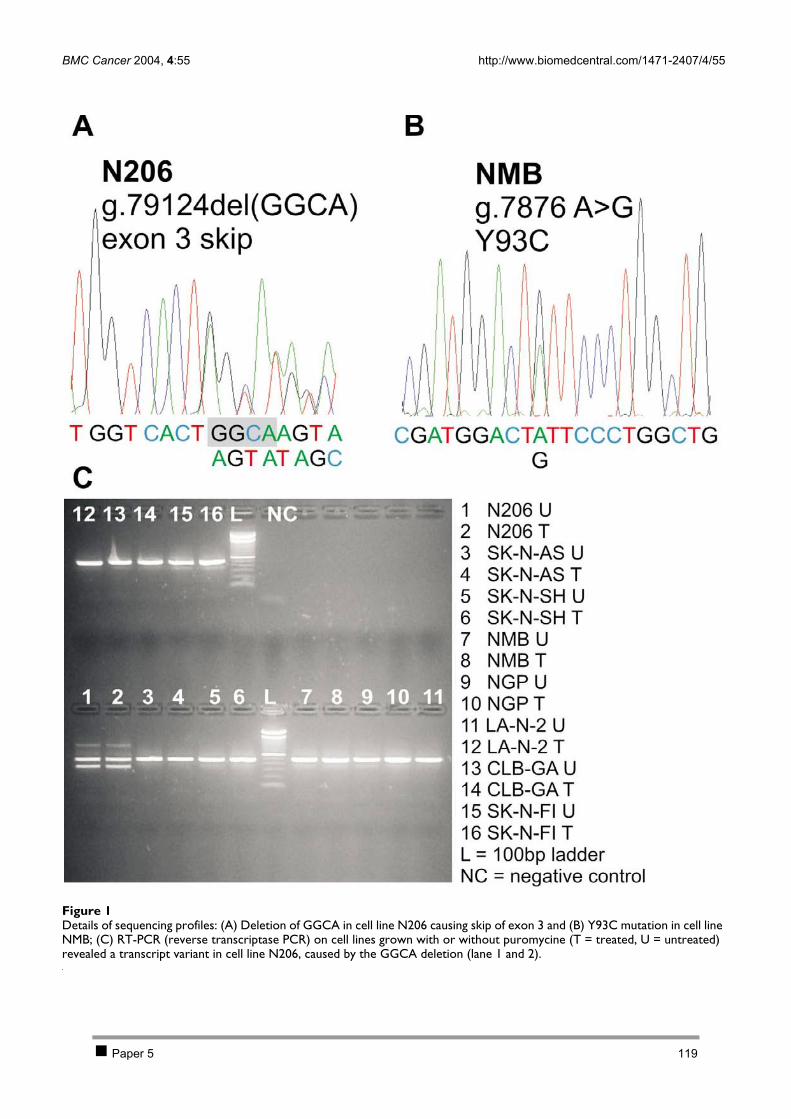
BMC Cancer 2004, 4:55 http://www.biomedcentral.com/1471-2407/4/55
Page 9 of 15(page number not for citation purposes)
Details of sequencing profilesFigure 1Details of sequencing profiles: (A) Deletion of GGCA in cell line N206 causing skip of exon 3 and (B) Y93C mutation in cell line NMB; (C) RT-PCR (reverse transcriptase PCR) on cell lines grown with or without puromycine (T = treated, U = untreated) revealed a transcript variant in cell line N206, caused by the GGCA deletion (lane 1 and 2).
Paper 5 119

BMC Cancer 2004, 4:55 http://www.biomedcentral.com/1471-2407/4/55
Page 10 of 15(page number not for citation purposes)
Ultrastructural morphology of mitochondria in NB cell linesElectron microscopic analysis of NB cell lines revealedthat the morphology of the mitochondria is heterogene-ous between the different cell lines, with respect to length,dilated intracrista spaces and condensation of the matrix(Table 5 and Figure 3). In most of the cell lines the elec-tron dense matrix granules are absent. A striking observa-tion are dilations of the mitochondrial intracrista spacesin most of the NB cell lines including N206 (Figure 3A),but not NMB (Figure 3B). Cell line LA-N-2 shows verylarge mitochondria (Figure 3D). However, theseobservations are not the same as described for PGL, whereswollen mitochondria are seen with an empty matrix andshort or absent cristae [48].
In order to examine whether dilated mitochondrial cristaeare a feature of many, or all NBs, we studied themitochondria in electron micrographs from 11 archived
and 22 previously published neuroblastic tumours [49-53]. Dilated cristae were seen in 11 tumours but they werelimited to a minority of the mitochondria (2–23%), incontrast to several of the cell lines of which most mito-chondria are altered. In several of the analyzed NBtumours, partially vacuolated matrices were occasionallyobserved.
DiscussionIn this study, we investigated the possible involvement ofSDHD in neuroblastoma (NB) tumourigenesis. In a firststep, mutation and methylation analyses were performedon a large panel of NB cell lines and tumours. A total ofseven sequence variants (in nine different samples) weredetected of which two could represent bona fidemutations, i.e. missense mutation Y93C in cell line NMBand a 4 bp deletion in cell line N206.
SDHD mRNA levels in NB cell lines (light gray), neuroblast cells (gray) and human normal control samples (white)Figure 2SDHD mRNA levels in NB cell lines (light gray), neuroblast cells (gray) and human normal control samples (white). Significantly reduced SDHD mRNA expression levels in NB cell lines with 11q23 allelic loss compared to 11q23 intact NB cell lines (P = 5.31E-06) and normal tissue samples (P = 1.49E-05).
Paper 5 120
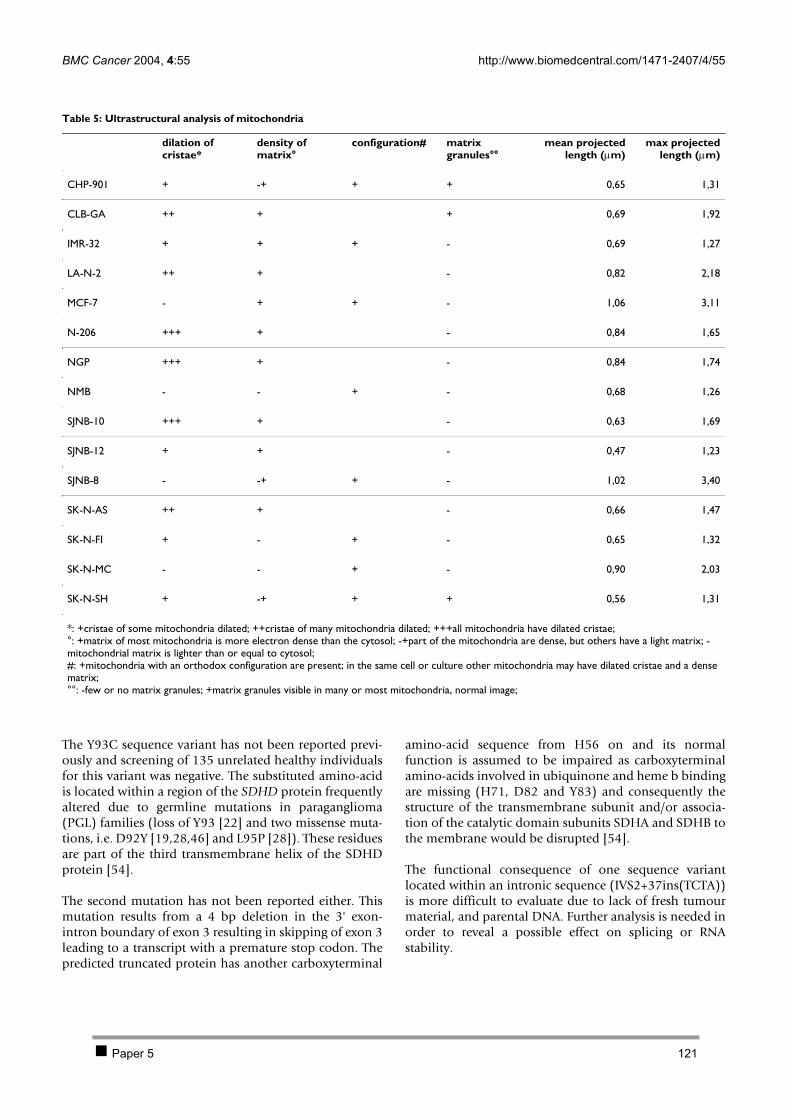
BMC Cancer 2004, 4:55 http://www.biomedcentral.com/1471-2407/4/55
Page 11 of 15(page number not for citation purposes)
The Y93C sequence variant has not been reported previ-ously and screening of 135 unrelated healthy individualsfor this variant was negative. The substituted amino-acidis located within a region of the SDHD protein frequentlyaltered due to germline mutations in paraganglioma(PGL) families (loss of Y93 [22] and two missense muta-tions, i.e. D92Y [19,28,46] and L95P [28]). These residuesare part of the third transmembrane helix of the SDHDprotein [54].
The second mutation has not been reported either. Thismutation results from a 4 bp deletion in the 3' exon-intron boundary of exon 3 resulting in skipping of exon 3leading to a transcript with a premature stop codon. Thepredicted truncated protein has another carboxyterminal
amino-acid sequence from H56 on and its normalfunction is assumed to be impaired as carboxyterminalamino-acids involved in ubiquinone and heme b bindingare missing (H71, D82 and Y83) and consequently thestructure of the transmembrane subunit and/or associa-tion of the catalytic domain subunits SDHA and SDHB tothe membrane would be disrupted [54].
The functional consequence of one sequence variantlocated within an intronic sequence (IVS2+37ins(TCTA))is more difficult to evaluate due to lack of fresh tumourmaterial, and parental DNA. Further analysis is needed inorder to reveal a possible effect on splicing or RNAstability.
Table 5: Ultrastructural analysis of mitochondria
dilation of cristae*
density of matrix°
configuration# matrix granules°°
mean projectedlength (µm)
max projectedlength (µm)
CHP-901 + -+ + + 0,65 1,31
CLB-GA ++ + + 0,69 1,92
IMR-32 + + + - 0,69 1,27
LA-N-2 ++ + - 0,82 2,18
MCF-7 - + + - 1,06 3,11
N-206 +++ + - 0,84 1,65
NGP +++ + - 0,84 1,74
NMB - - + - 0,68 1,26
SJNB-10 +++ + - 0,63 1,69
SJNB-12 + + - 0,47 1,23
SJNB-8 - -+ + - 1,02 3,40
SK-N-AS ++ + - 0,66 1,47
SK-N-FI + - + - 0,65 1,32
SK-N-MC - - + - 0,90 2,03
SK-N-SH + -+ + + 0,56 1,31
*: +cristae of some mitochondria dilated; ++cristae of many mitochondria dilated; +++all mitochondria have dilated cristae;°: +matrix of most mitochondria is more electron dense than the cytosol; -+part of the mitochondria are dense, but others have a light matrix; -mitochondrial matrix is lighter than or equal to cytosol;#: +mitochondria with an orthodox configuration are present; in the same cell or culture other mitochondria may have dilated cristae and a dense matrix;°°: -few or no matrix granules; +matrix granules visible in many or most mitochondria, normal image;
Paper 5 121

BMC Cancer 2004, 4:55 http://www.biomedcentral.com/1471-2407/4/55
Page 12 of 15(page number not for citation purposes)
Finally, one new and 4 known polymorphisms weredetected in 5 NB cell lines and 3 tumour samples. Addi-tional screening for homozygous deletions in all cell linesand methylation in cell lines and tumours were negative.
Based upon these results, we can exclude a role for SDHDas a classical tumour suppressor gene in NB. However, thefinding of two apparently bona fide SDHD mutations inNB without allelic loss of distal 11q leaves the possibilityopen that the gene contributes to NB oncogenesis due tohaplo-insufficiency, rather than functional inactivation ofboth alleles. In order to investigate this possibility, wedecided to perform further studies at transcript and pro-tein level. Interestingly, SDHD expression was shown tobe consistently lower in cell lines with 11q allelic loss ver-
sus NB cell lines without loss and also significantlydecreased in NB cell lines as compared to normal foetaladrenal neuroblast cells of 16, 18 and 19 weeks gesta-tional time with a mean fold difference of 3.61 betweenneuroblast cells and NB cell lines. A similar correlationbetween 11q LOH and reduced SDHD expression wasrecently described in colorectal and gastric cancer [55].Our findings at mRNA transcript level, however, did notmatch with results obtained from further analysis at pro-tein level. Complex II activity and quantitative proteinanalysis revealed no significant difference between celllines with or without 11q allelic loss or SDHD mutation.However, measurement of complex II activity might onlyreflect part of the functional properties of SDHD. Also,measurement of differences in protein quantity is far lesssensitive than Q-PCR at transcript levels. Therefore, theseobservations at present do not fully exclude SDHDinvolvement in NB. Finally, we also looked at the mor-phologic characteristics of the mitochondria as a possibleclue to SDHD dysfunction. In keeping with, at best, partialloss of function of SDHD, we did not observe similar grossmorphologic changes as reported for PGL with SDHDmutations (swelling with loss of matrix density and gen-eralized rarefaction of cristae), the latter being character-ized by destabilization of complex II with loss ofenzymatic activity [48]. However, most of the cell linesshowed dilated mitochondrial cristae. It has been demon-strated that this is a reversible phenomenon, and parallelsarise in intracellular ADP/ATP ratio or low energy state[56]. Subsequent combined ultrastructural and biochem-ical studies from several authors indicated that dilation ofcristae follows a decrease in mitochondrial membranepotential that can be provoked by various experimentalprocedures [57,58]. This configuration was detected inonly a small percentage of mitochondria in archived sec-tions of NB tumours and in sections published earlier.Morphologic analysis of mitochondria in NB thus farreceived little attention. The true significance of theobserved mitochondrial morphological changes in NB isintriguing, but does not appear to be related to the muta-tions we have found.
ConclusionsIn contrast to previous findings in PGL and PC, this studyexcludes a classical two hit Knudson model for SDHDinvolvement in NB. However, the finding of, albeit rare,bona fide mutations and reduced expression of SDHD inNB with 11q allelic loss hints at a possible haplo-insuffi-cient contribution to tumour development. A betterunderstanding of the different functions of SDHD, in par-ticular its possible contribution to energy independentapoptosis involving the release of cytochrome c and pro-caspases, will allow further functional assays to asses howthis gene contributes to tumour development in general,and the high stage NB phenotype in particular [59,60].
Mitochondrial ultrastructure shows heterogeneity between cell lines (same final magnification for the 4 images, marker = 0.5 µm)Figure 3Mitochondrial ultrastructure shows heterogeneity between cell lines (same final magnification for the 4 images, marker = 0.5 µm): (A) NB cell line N206: dilated crista spaces in small mitochondria with a dense matrix; (B) NB cell line NMB: small mitochondria with narrow cristae and light matrix, so-called orthodox configuration, (C) NB cell line SJNB-8: unu-sually large mitochondria in orthodox configuration (narrow cristae), some areas in the matrix are cleared and lack cris-tae; (D) NB cell line LA-N-2: very large mitochondria with dilated cristae and dense matrix.
Paper 5 122

BMC Cancer 2004, 4:55 http://www.biomedcentral.com/1471-2407/4/55
Page 13 of 15(page number not for citation purposes)
Evidence for contribution to a cancer phenotype throughhaplo-insufficiency has recently been obtained for anumber of loci, including CDKN1B (p27Kip1) [61,62],TP53 (p53) [63], DMP1 [64], PTEN [65], APC [66] andNKX3.1 [67]. In mouse models for some of these genes,loss or mutation of one allele increased tumour suscepti-bility despite expression of the remaining wild-type allele[68]. Although the present data on protein and functionallevel do not provide consistent evidence for the haplo-insufficient involvement of SDHD in NB, a bipartitemechanism as tumour suppressor gene for the SDHDgene, as described for the APC gene can at present not befully excluded. Following this hypothesis, germline muta-tions in SDHD would predispose to PGL or PC develop-ment. Rare somatic mutations and more typically loss ofone allele could contribute to the metastasizing NBtumour phenotype (and possible also other tumourtypes), not as an initiating step but rather as later event intumour development. However, further evidence isneeded to support the haplo-insufficient involvement ofSDHD in cancer. Ultimately, knockout mice for the SDHDgene leading to haplo-insufficiency for SDHD inneuroblast progenitor cells, would be the appropriate testto evaluate this hypothesis.
List of abbreviationsAIF = allelic imbalance factor
CGH = comparative genomic hybridization
DHPLC = denaturing high performance liquidchromatography
LOH = loss of heterozygosity
MGB = minor groove binder
MSP = methylation specific PCR
NB = neuroblastoma
PC = pheochromocytoma
PGL = paraganglioma
ROS = reactive oxygen species
SDHD = succinate dehydrogenase, subunit D
SNP = single nucleotide polymorphism
SRO = shortest region of overlap
Competing interestsThe authors declare that they have no competing interests.
Author's contributionsKDP carried out the genomic and transcriptomic studies,and drafted the manuscript. JH performed the methyla-tion studies. JS carried out the immunoblottings and spec-trophotometric analysis that was evaluated by RVC. ANperformed the ultrastructural analysis that was screenedand discussed by CV, FR and MP. GL and NVR collectedthe tumour material. JV and FS participated in the study'sdesign and coordination. All authors have reviewed themanuscript and FS and ADP were the final editors of themanuscript.
AcknowledgementsWe would like to thank E. George for the spectrophotometrical assays, G. De Vos and P. Degraeve for the cell cultures and Petra Van Acker and Inge Vereecke for their help with the DHPLC analyses.
This text presents research results of the Belgian program of Interuniver-sity Poles of attraction initiated by the Belgian State, Prime Minister's Office, Science Policy Programming. The scientific responsibility is assumed by the authors. This work was supported by BOF-grant 011F1200 and 011B4300, GOA-grant 12051203 and FWO-grant G.0028.00. Katleen De Preter is an aspirant with the Fund for Scientific Research, Flanders (FWO-Vlaanderen). JV is supported by a post-doctoral grant from the Institute for the Promo-tion of Innovation by Science and Technology in Flanders (IWT). Nadine Van Roy is a postdoctoral researcher with the FWO.
References1. Cooper MJ, Hutchins GM, Cohen PS, Helman LJ, Mennie RJ, Israel
MA: Human neuroblastoma tumor cell lines correspond tothe arrested differentiation of chromaffin adrenal medullaryneuroblasts. Cell Growth Differ 1990, 1:149-59.
2. Bown N, Cotterill S, Lastowska M, O'Neill S, Pearson AD, Plantaz D,Meddeb M, Danglot G, Brinkschmidt C, Christiansen H, et al.: Gainof chromosome arm 17q and adverse outcome in patientswith neuroblastoma. N Engl J Med 1999, 340:1954-61.
3. Maris JM, Matthay KK: Molecular biology of neuroblastoma. JClin Oncol 1999, 17:2264-79.
4. Brodeur GM: Neuroblastoma: biological insights into a clinicalenigma. Nat Rev Cancer 2003, 3:203-16.
5. Plantaz D, Vandesompele J, Van Roy N, Lastowska M, Bown N, Com-baret V, Favrot MC, Delattre O, Michon J, Benard J, et al.: Compar-ative genomic hybridization (CGH) analysis of stage 4neuroblastoma reveals high frequency of 11q deletion intumors lacking MYCN amplification. Int J Cancer 2001, 91:680-6.
6. Vandesompele J, Van Roy N, Van Gele M, Laureys G, Ambros P, Hei-mann P, Devalck C, Schuuring E, Brock P, Otten J, et al.: Geneticheterogeneity of neuroblastoma studied by comparativegenomic hybridization. Genes Chromosomes Cancer 1998,23:141-52.
7. Vandesompele J, Speleman F, Van Roy N, Laureys G, Brinskchmidt C,Christiansen H, Lampert F, Lastowska M, Bown N, Pearson A, et al.:Multicentre analysis of patterns of DNA gains and losses in204 neuroblastoma tumors: how many genetic subgroupsare there? Med Pediatr Oncol 2001, 36:5-10.
8. Luttikhuis ME, Powell JE, Rees SA, Genus T, Chughtai S, Ramani P,Mann JR, McConville CM: Neuroblastomas with chromosome11q loss and single copy MYCN comprise a biologically dis-tinct group of tumours with adverse prognosis. Br J Cancer2001, 85:531-7.
9. Breen CJ, O'Meara A, McDermott M, Mullarkey M, Stallings RL:Coordinate deletion of chromosome 3p and 11q in neurob-lastoma detected by comparative genomic hybridization.Cancer Genet Cytogenet 2000, 120:44-9.
10. Srivatsan ES, Murali V, Seeger RC: Loss of heterozygosity for alle-les on chromosomes 11q and 14q in neuroblastoma. Prog ClinBiol Res 1991, 366:91-8.
Paper 5 123

BMC Cancer 2004, 4:55 http://www.biomedcentral.com/1471-2407/4/55
Page 14 of 15(page number not for citation purposes)
11. Maris JM, Guo C, White PS, Hogarty MD, Thompson PM, Stram DO,Gerbing R, Matthay KK, Seeger RC, Brodeur GM: Allelic deletionat chromosome bands 11q14-23 is common inneuroblastoma. Med Pediatr Oncol 2001, 36:24-7.
12. Vandesompele J, Baudis M, De Preter K, Van Roy N, Ambros P, BownN, Combaret V, Lastowska M, Nicholson JC, O'Meara A, et al.: Une-quivocal delineation of clinico-genetic subgroups and identi-fication of a long term survivor signature for neuroblastoma.J Clin Oncol in press.
13. Spitz R, Hero B, Ernestus K, Berthold F: Deletions in chromo-some arms 3p and 11q are new prognostic markers in local-ized and 4s neuroblastoma. Clin Cancer Res 2003, 9:52-8.
14. Bader SA, Fasching C, Brodeur GM, Stanbridge EJ: Dissociation ofsuppression of tumorigenicity and differentiation in vitroeffected by transfer of single human chromosomes intohuman neuroblastoma cells. Cell Growth Differ 1991, 2:245-55.
15. Guo C, White PS, Hogarty MD, Brodeur GM, Gerbing R, Stram DO,Maris JM: Deletion of 11q23 is a frequent event in the evolu-tion of MYCN single-copy high-risk neuroblastomas. Med Pedi-atr Oncol 2000, 35:544-6.
16. Guo C, White PS, Weiss MJ, Hogarty MD, Thompson PM, Stram DO,Gerbing R, Matthay KK, Seeger RC, Brodeur GM, et al.: Allelic dele-tion at 11q23 is common in MYCN single copyneuroblastomas. Oncogene 1999, 18:4948-57.
17. Hirawake H, Taniwaki M, Tamura A, Amino H, Tomitsuka E, Kita K:Characterization of the human SDHD gene encoding thesmall subunit of cytochrome b (cybS) in mitochondrial suc-cinate-ubiquinone oxidoreductase. Biochim Biophys Acta 1999,1412:295-300.
18. Hirawake H, Taniwaki M, Tamura A, Kojima S, Kita K: Cytochromeb in human complex II (succinate-ubiquinone oxidoreduct-ase): cDNA cloning of the components in liver mitochondriaand chromosome assignment of the genes for the large(SDHC) and small (SDHD) subunits to 1q21 and 11q23.Cytogenet Cell Genet 1997, 79:132-8.
19. Baysal BE, Ferrell RE, Willett-Brozick JE, Lawrence EC, Myssiorek D,Bosch A, van der Mey A, Taschner PE, Rubinstein WS, Myers EN, etal.: Mutations in SDHD, a mitochondrial complex II gene, inhereditary paraganglioma. Science 2000, 287:848-51.
20. Neumann HP, Bausch B, McWhinney SR, Bender BU, Gimm O,Franke G, Schipper J, Klisch J, Altehoefer C, Zerres K, et al.: Germ-line mutations in nonsyndromic pheochromocytoma. N EnglJ Med 2002, 346:1459-66.
21. Gimm O, Armanios M, Dziema H, Neumann HP, Eng C: Somaticand occult germ-line mutations in SDHD, a mitochondrialcomplex II gene, in nonfamilial pheochromocytoma. CancerRes 2000, 60:6822-5.
22. Badenhop RF, Cherian S, Lord RS, Baysal BE, Taschner PE, SchofieldPR: Novel mutations in the SDHD gene in pedigrees withfamilial carotid body paraganglioma and sensorineural hear-ing loss. Genes Chromosomes Cancer 2001, 31:255-63.
23. Gimenez-Roqueplo AP, Favier J, Rustin P, Mourad JJ, Plouin PF, Cor-vol P, Rotig A, Jeunemaitre X: The R22X mutation of the SDHDgene in hereditary paraganglioma abolishes the enzymaticactivity of complex II in the mitochondrial respiratory chainand activates the hypoxia pathway. Am J Hum Genet 2001,69:1186-97.
24. Baysal BE, Willett-Brozick JE, Lawrence EC, Drovdlic CM, Savul SA,McLeod DR, Yee HA, Brackmann DE, Slattery WH 3rd, Myers EN, etal.: Prevalence of SDHB, SDHC, and SDHD germline muta-tions in clinic patients with head and neck paragangliomas. JMed Genet 2002, 39:178-83.
25. Aguiar RC, Cox G, Pomeroy SL, Dahia PL: Analysis of the SDHDgene, the susceptibility gene for familial paraganglioma syn-drome (PGL1), in pheochromocytomas. J Clin Endocrinol Metab2001, 86:2890-4.
26. Masuoka J, Brandner S, Paulus W, Soffer D, Vital A, Chimelli L, JouvetA, Yonekawa Y, Kleihues P, Ohgaki H: Germline SDHD mutationin paraganglioma of the spinal cord. Oncogene 2001, 20:5084-6.
27. Kytola S, Nord B, Elder EE, Carling T, Kjellman M, Cedermark B, Juh-lin C, Hoog A, Isola J, Larsson C: Alterations of the SDHD genelocus in midgut carcinoids, Merkel cell carcinomas, pheo-chromocytomas, and abdominal paragangliomas. Genes Chro-mosomes Cancer 2002, 34:325-32.
28. Taschner PE, Jansen JC, Baysal BE, Bosch A, Rosenberg EH, Brocker-Vriends AH, van Der Mey AG, van Ommen GJ, Cornelisse CJ, Devilee
P: Nearly all hereditary paragangliomas in the Netherlandsare caused by two founder mutations in the SDHD gene.Genes Chromosomes Cancer 2001, 31:274-81.
29. Jogi A, Ora I, Nilsson H, Lindeheim A, Makino Y, Poellinger L, AxelsonH, Pahlman S: Hypoxia alters gene expression in human neu-roblastoma cells toward an immature and neural crest-likephenotype. Proc Natl Acad Sci U S A 2002, 99:7021-6.
30. Schleiermacher G, Janoueix-Lerosey I, Combaret V, Derre J, Coutu-rier J, Aurias A, Delattre O: Combined 24-color karyotyping andcomparative genomic hybridization analysis indicates pre-dominant rearrangements of early replicating chromosomeregions in neuroblastoma. Cancer Genet Cytogenet 2003,141:32-42.
31. Van Roy N, Van Limbergen H, Vandesompele J, Van Gele M, Poppe B,Salwen H, Laureys G, Manoel N, De Paepe A, Speleman F: Com-bined M-FISH and CGH analysis allows comprehensivedescription of genetic alterations in neuroblastoma celllines. Genes Chromosomes Cancer 2001, 32:126-35.
32. Van Roy N, Jauch A, Van Gele M, Laureys G, Versteeg R, De Paepe A,Cremer T, Speleman F: Comparative genomic hybridizationanalysis of human neuroblastomas: detection of distal 1pdeletions and further molecular genetic characterization ofneuroblastoma cell lines. Cancer Genet Cytogenet 1997, 97:135-42.
33. De Preter K, Speleman F, Combaret V, Lunec J, Laureys G, EussenBH, Francotte N, Board J, Pearson AD, De Paepe A, et al.: Quantifi-cation of MYCN, DDX1, and NAG gene copy number in neu-roblastoma using a real-time quantitative PCR assay. ModPathol 2002, 15:159-66.
34. Van Roy N, Laureys G, Cheng NC, Willem P, Opdenakker G, Vers-teeg R, Speleman F: 1;17 translocations and other chromosome17 rearrangements in human primary neuroblastomatumors and cell lines. Genes Chromosomes Cancer 1994, 10:103-14.
35. Devilee P, Cleton-Jansen AM, Cornelisse CJ: Ever since Knudson.Trends Genet 2001, 17:569-73.
36. Herman JG, Graff JR, Myohanen S, Nelkin BD, Baylin SB: Methyla-tion-specific PCR: a novel PCR assay for methylation statusof CpG islands. Proc Natl Acad Sci U S A 1996, 93:9821-6.
37. Li LC, Dahiya R: MethPrimer: designing primers for methyla-tion PCRs. Bioinformatics 2002, 18:1427-31.
38. Vandesompele J, De Paepe A, Speleman F: Elimination of primer-dimer artifacts and genomic coamplification using a two-step SYBR green I real-time RT-PCR. Anal Biochem 2002,303:95-8.
39. De Preter K, Vandesompele J, Heimann P, Kockx MM, Van Gele M,Hoebeeck J, De Smet E, Demarche M, Laureys G, Van Roy N, et al.:Application of laser capture microdissection in genetic anal-ysis of neuroblastoma and neuroblastoma precursor cells.Cancer Lett 2003, 197:53-61.
40. Vandesompele J, De Preter K, Pattyn F, Poppe B, Van Roy N, DePaepe A, Speleman F: Accurate normalization of real-timequantitative RT-PCR data by geometric averaging of multi-ple internal control genes. Genome Biol 2002,3:RESEARCH0034:1-11.
41. Rustin P, Chretien D, Bourgeron T, Gerard B, Rotig A, Saudubray JM,Munnich A: Biochemical and molecular investigations in respi-ratory chain deficiencies. Clin Chim Acta 1994, 228:35-51.
42. Van Coster R, Smet J, George E, De Meirleir L, Seneca S, Van Hove J,Sebire G, Verhelst H, De Bleecker J, Van Vlem B, et al.: Blue nativepolyacrylamide gel electrophoresis: a powerful tool in diag-nosis of oxidative phosphorylation defects. Pediatr Res 2001,50:658-65.
43. Cascon A, Ruiz-Llorente S, Cebrian A, Leton R, Telleria D, Benitez J,Robledo M: G12S and H50R variations are polymorphisms inthe SDHD gene. Genes Chromosomes Cancer 2003, 37:220-221.
44. Cascon A, Ruiz-Llorente S, Cebrian A, Telleria D, Rivero JC, Diez JJ,Lopez-Ibarra PJ, Jaunsolo MA, Benitez J, Robledo M: Identificationof novel SDHD mutations in patients with phaeochromocy-toma and/or paraganglioma. Eur J Hum Genet 2002, 10:457-61.
45. Lima J, Maximo V, Soares P, Sobrinho-Simoes M: Alterations of theSDHD gene locus in midgut carcinoids. Genes ChromosomesCancer 2003, 36:424.
46. Dannenberg H, Dinjens WN, Abbou M, Van Urk H, Pauw BK, Mou-wen D, Mooi WJ, de Krijger RR: Frequent germ-line succinatedehydrogenase subunit D gene mutations in patients withapparently sporadic parasympathetic paraganglioma. ClinCancer Res 2002, 8:2061-6.
Paper 5 124
Publish with BioMed Central and every scientist can read your work free of charge
"BioMed Central will be the most significant development for disseminating the results of biomedical research in our lifetime."
Sir Paul Nurse, Cancer Research UK
Your research papers will be:
available free of charge to the entire biomedical community
peer reviewed and published immediately upon acceptance
cited in PubMed and archived on PubMed Central
yours — you keep the copyright
Submit your manuscript here:http://www.biomedcentral.com/info/publishing_adv.asp
BioMedcentral
BMC Cancer 2004, 4:55 http://www.biomedcentral.com/1471-2407/4/55
Page 15 of 15(page number not for citation purposes)
47. Hui AB, Lo KW, Chan SY, Kwong J, Chan AS, Huang DP: Absenceof SDHD mutations in primary nasopharyngeal carcinomas.Int J Cancer 2002, 97:875-7.
48. Douwes Dekker PB, Hogendoorn PC, Kuipers-Dijkshoorn N, PrinsFA, van Duinen SG, Taschner PE, van der Mey AG, Cornelisse CJ:SDHD mutations in head and neck paragangliomas result indestabilization of complex II in the mitochondrial respira-tory chain with loss of enzymatic activity and abnormalmitochondrial morphology. J Pathol 2003, 201:480-6.
49. Takahashi H, Ikuta F, Tsuchida T, Tanaka R: Ultrastructural alter-ations of neuronal cells in a brain stem ganglioglioma. ActaNeuropathol (Berl) 1987, 74:307-12.
50. Taxy JB: Electron microscopy in the diagnosis ofneuroblastoma. Arch Pathol Lab Med 1980, 104:355-60.
51. Staley NA, Poleksy HF, Bensch KG: Fine structural and biochem-ical studies on the malignant ganglioneuroma. J NeuropatholExp Neurol 1967, 26:634-53.
52. Mackay B, Masse SR, King OY, Butler J: Diagnosis of neuroblast-oma by electron microscopy of bone marrow aspirates. Pedi-atrics 1975, 56:1045-9.
53. Misugi K, Misugi N, Newton WA Jr: Fine structural study of neu-roblastoma, ganglioneuroblastoma, andpheochromocytoma. Arch Pathol 1968, 86:160-70.
54. Yankovskaya V, Horsefield R, Tornroth S, Luna-Chavez C, Miyoshi H,Leger C, Byrne B, Cecchini G, Iwata S: Architecture of succinatedehydrogenase and reactive oxygen species generation. Sci-ence 2003, 299:700-4.
55. Habano W, Sugai T, Nakamura S, Uesugi N, Higuchi T, Terashima M,Horiuchi S: Reduced expression and loss of heterozygosity ofthe SDHD gene in colorectal and gastric cancer. Oncol Rep2003, 10:1375-80.
56. Hackenbrock CR, Rehn TG, Weinbach EC, Lemasters JJ: Oxidativephosphorylation and ultrastructural transformation in mito-chondria in the intact ascites tumor cell. J Cell Biol 1971,51:123-37.
57. Ord MJ, Smith RA: Correlation of mitochondrial form andfunction in vivo: microinjection of substrate and nucleotides.Cell Tissue Res 1982, 227:129-37.
58. Gottlieb E, Armour SM, Harris MH, Thompson CB: Mitochondrialmembrane potential regulates matrix configuration andcytochrome c release during apoptosis. Cell Death Differ 2003,10:709-17.
59. van Loo G, Saelens X, van Gurp M, MacFarlane M, Martin SJ, Vanden-abeele P: The role of mitochondrial factors in apoptosis: aRussian roulette with more than one bullet. Cell Death Differ2002, 9:1031-42.
60. Ravagnan L, Roumier T, Kroemer G: Mitochondria, the killerorganelles and their weapons. J Cell Physiol 2002, 192:131-7.
61. Pietenpol JA, Bohlander SK, Sato Y, Papadopoulos N, Liu B, FriedmanC, Trask BJ, Roberts JM, Kinzler KW, Rowley JD, et al.: Assignmentof the human p27Kip1 gene to 12p13 and its analysis inleukemias. Cancer Res 1995, 55:1206-10.
62. Fero ML, Randel E, Gurley KE, Roberts JM, Kemp CJ: The murinegene p27Kip1 is haplo-insufficient for tumour suppression.Nature 1998, 396:177-80.
63. Venkatachalam S, Shi YP, Jones SN, Vogel H, Bradley A, Pinkel D,Donehower LA: Retention of wild-type p53 in tumors fromp53 heterozygous mice: reduction of p53 dosage can pro-mote cancer formation. Embo J 1998, 17:4657-67.
64. Inoue K, Zindy F, Randle DH, Rehg JE, Sherr CJ: Dmp1 is haplo-insufficient for tumor suppression and modifies the frequen-cies of Arf and p53 mutations in Myc-induced lymphomas.Genes Dev 2001, 15:2934-9.
65. Kwabi-Addo B, Giri D, Schmidt K, Podsypanina K, Parsons R, Green-berg N, Ittmann M: Haploinsufficiency of the Pten tumor sup-pressor gene promotes prostate cancer progression. Proc NatlAcad Sci U S A 2001, 98:11563-8.
66. Yan H, Dobbie Z, Gruber SB, Markowitz S, Romans K, Giardiello FM,Kinzler KW, Vogelstein B: Small changes in expression affectpredisposition to tumorigenesis. Nat Genet 2002, 30:25-6.
67. Magee JA, Abdulkadir SA, Milbrandt J: Haploinsufficiency at theNkx3.1 locus. A paradigm for stochastic, dosage-sensitivegene regulation during tumor initiation. Cancer Cell 2003,3:273-83.
68. Quon KC, Berns A: Haplo-insufficiency? Let me count theways. Genes Dev 2001, 15:2917-21.
Pre-publication historyThe pre-publication history for this paper can be accessedhere:
http://www.biomedcentral.com/1471-2407/4/55/prepub
Paper 5 125

2.2 PAPER 6
Positional and functional mapping of a neuroblastoma differentiation gene on chromosome 11
De Preter Katleen, Vandesompele Jo, Menten Björn, Fiegler Heike, Carter Nigel, Bader Scott, Van
Roy Nadine, Speleman Frank
In preparation
Chapter 4: Investigation of candidate neuroblastoma genes on chromosome 11 126
Positional and functional mapping of a neuroblastoma differentiation gene on chromosome 11
De Preter Katleen, Speleman Frank, Menten Björn, Carr Philippa, Yigit Nurten, Fiegler Heike, Carter
Nigel, Van Roy Nadine, Bader Scott, Vandesompele Jo
In preparation
Abstract
Loss of chromosome 11q defines a subset of high-stage aggressive neuroblastomas. Deletions are
typically large and mapping efforts have not lead to a well defined consensus region thus hampering
the identification of positional candidate tumour suppressor genes. In a previous study, functional
evidence for a neuroblastoma suppressor gene on chromosome 11 was obtained through microcell
mediated chromosome transfer, indicated by differentiation of neuroblastoma cells with varying
phenotype upon introduction of chromosome 11. Interestingly, some microcell hybrid clones were
shown to harbour deletions in the transferred chromosome 11. We decided to further exploit this
model system as a means to identify candidate tumour suppressor or differentiation genes located on
chromosome 11. In a first step, we performed high-resolution arrayCGH copy-number analysis in
order to evaluate the chromosome 11 status in the hybrids. This method identified the presence of
several deletions in the microcell hybrids, both in parental and transferred chromosomes. Correlation
of these deletion events with the observed morphological changes lead to the delineation of a region
on 11q25 and 11p15.3 that may harbour the responsible genes. Additional studies will be required to
clarify the putative role of these genes in the observed differentiation phenotype specifically and in
neuroblastoma in general.
Paper 6 127
Introduction
Recent studies have indicated the existence of a new genetic subset of aggressive neuroblastomas
(NBs). In contrast to the well known group of high stage NB with MYCN amplification and 1p-deletion,
this second high-stage subgroup is characterised by the presence of 11q-deletions, often in
association with 3p-deletions [1-5]. Both subgroups typically present with 17q-gain or normal
chromosome 17 copy number, which are the strongest independent genetic indicators of poor
prognosis [6]. Deletions of 11q mostly affect a large distal part of the long arm. Only a few small
deletions have been identified which delineated a tentative SRO (shortest region of overlap) at 11q23
between markers D11S1340 and D11S1299, encompassing a region of approximately 3 Mb [7].
Recently however, a NB patient with a constitutional 11q14.1-11q23.3 deletion was reported which did
not overlap with the proposed SRO [8]. Consequently, the presumed localisation of the 11q NB tumour
suppressor gene(s) remains ill defined thus hampering the selection of positional candidates. For the
11q23 region we proposed SDHD as a putative candidate NB tumour suppressor, but only two bona
fide mutations could be identified [9].
In addition to the observed losses of 11q in NB, the existence of a tumour suppressor gene on 11q
has also been supported by functional evidence obtained by microcell mediated chromosome 11
transfer (MMCT) experiments [10]. Although these studies were initially aimed at investigating the role
of chromosome 1p in tumour suppression, the control chromosome 11 transfer experiment
unexpectedly produced clones with morphological features of differentiation. Introduction of
chromosome 11 induced a more flattened and adherent morphology, with some short neuritic
processes, similar to the changes seen after a few days of growth in the presence of retinoic acid.
Interestingly, two subclones were reported that showed losses of 11p and 11q of the transferred
chromosome, respectively, one with the parental cell phenotype and one with signs of differentiation.
As these microcell hybrids could be powerful models for the identification of candidate NB suppressor
or differentiation genes, we decided first to determine the genetic status of the chromosome 11 in the
hybrid subclones prior to further experiments. To this purpose, the parental NGP cell line and the
microcell hybrids after chromosome 11 transfer were analysed using high-resolution arrayCGH
(microarray based comparative genomic hybridisation), FISH (fluorescence in situ hybridisation) and
microsatellite heterozygosity mapping. In addition, the expression levels of neuronal differentiation
marker genes were measured in an attempt to find altered expression of genes related to neurite
outgrowth and differentiation.
Paper 6 128
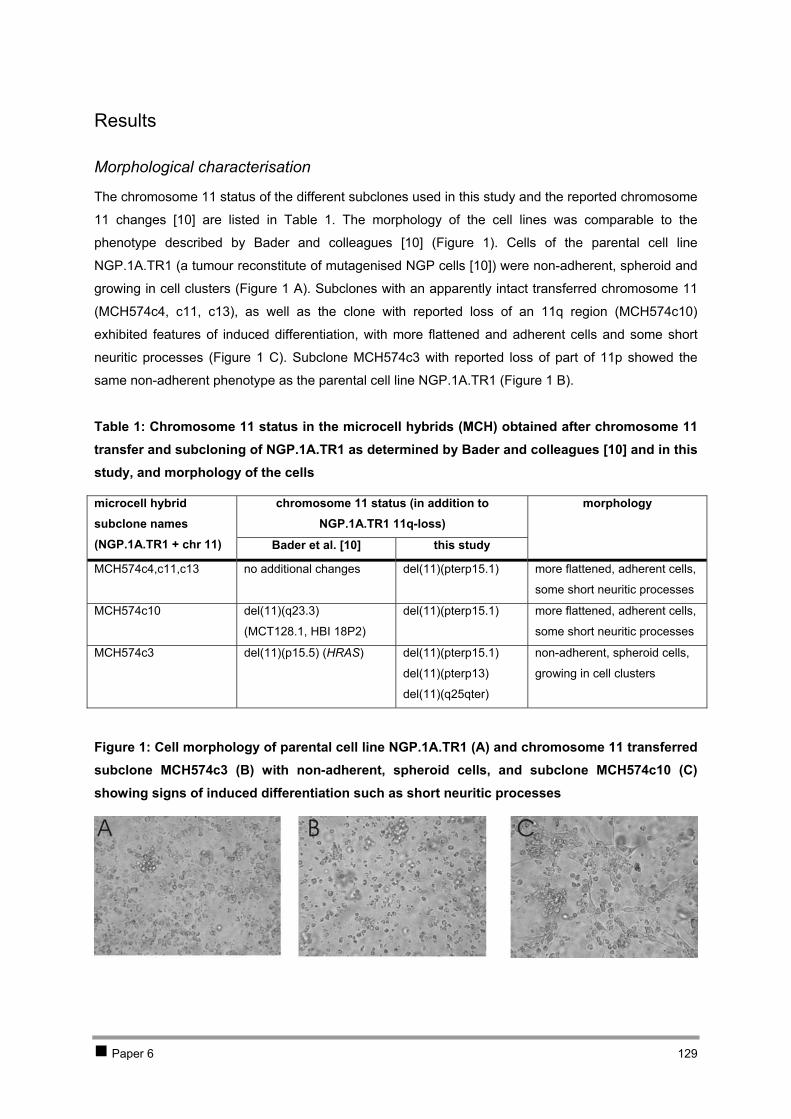
Results
Morphological characterisation
The chromosome 11 status of the different subclones used in this study and the reported chromosome
11 changes [10] are listed in . The morphology of the cell lines was comparable to the
phenotype described by Bader and colleagues [10] ( ). Cells of the parental cell line
NGP.1A.TR1 (a tumour reconstitute of mutagenised NGP cells [10]) were non-adherent, spheroid and
growing in cell clusters ( A). Subclones with an apparently intact transferred chromosome 11
(MCH574c4, c11, c13), as well as the clone with reported loss of an 11q region (MCH574c10)
exhibited features of induced differentiation, with more flattened and adherent cells and some short
neuritic processes ( C). Subclone MCH574c3 with reported loss of part of 11p showed the
same non-adherent phenotype as the parental cell line NGP.1A.TR1 ( B).
Table 1
Table 1: Chromosome 11 status in the microcell hybrids (MCH) obtained after chromosome 11 transfer and subcloning of NGP.1A.TR1 as determined by Bader and colleagues [10] and in this study, and morphology of the cells
Figure 1
Figure 1
Figure 1
Figure 1
Figure 1: Cell morphology of parental cell line NGP.1A.TR1 (A) and chromosome 11 transferred subclone MCH574c3 (B) with non-adherent, spheroid cells, and subclone MCH574c10 (C) showing signs of induced differentiation such as short neuritic processes
chromosome 11 status (in addition to NGP.1A.TR1 11q-loss)
microcell hybrid subclone names (NGP.1A.TR1 + chr 11) Bader et al. [10] this study
morphology
MCH574c4,c11,c13 no additional changes del(11)(pterp15.1) more flattened, adherent cells,
some short neuritic processes
MCH574c10 del(11)(q23.3)
(MCT128.1, HBI 18P2)
del(11)(pterp15.1) more flattened, adherent cells,
some short neuritic processes
MCH574c3 del(11)(p15.5) (HRAS) del(11)(pterp15.1)
del(11)(pterp13)
del(11)(q25qter)
non-adherent, spheroid cells,
growing in cell clusters
Paper 6 129

ArrayCGH analysis
ArrayCGH failed to provide evidence for the reported 11q-deletion in the transferred chromosome of
microcell hybrid MCH574c10 ( ). Unexpectedly, the distal region of the short arm of one of the
chromosomes 11 (11pter->11p15.1) was deleted in both MCH574c3 and MCH574c10. Microcell
hybrid MCH574c3 presented with an additional larger deletion of 11pter->11p13, as well as a third
deletion involving the most distal band (11q25->11qter) in one of the chromosomes 11. Deletion of a
single BAC clone RP11-51B23 on 11p15.3 was detected in NGP.1A.TR1 ( B). Deletions
observed by arrayCGH were confirmed by FISH analysis (see next section).
Figure 3
Figure 3
FISH analysis with a BAC clone selected in each observed deleted region (RP11-734D5 on 11p15.3,
RP11-48O9 on 11p13, RP11-545G16 on 11q25) demonstrated that the 11pter->11p15.1 deletion was
present in all other subclones as well, i.e. MCH574c4, c11 and c13.
To determine which of the chromosomes 11 exhibited loss of the 11pter->11p15.1, 11pter->11p13 and
11q25->11qter region, microsatellite heterozygosity mapping in conjunction with FISH analysis of
metaphase spreads was performed. Microsatellite markers D11S861 (on 11p15.2) and D11S1324 (on
11p14.1) were tested on NGP.1A.TR1, MCH574c3 and MCH574c10 ( ). These data showed
that one of the two parental chromosomes 11 had lost the 11pter->11p15.1 region, while the
11pter->11p13 segment was lost in the transferred chromosome. FISH on metaphase spreads (clone
RP11-545G16 on 11q25 in combination with clone RP11-206C1 on 11p15.1; clone RP11-709M17 on
11q25 in combination with clone RP11-4B7 on 11p15.2) demonstrated that the 11q25->11qter deletion
occurred in the transferred chromosome 11 whereas the 11pter->11p15.1 deletion occurred in the
normal parental chromosome 11 (and not in the parental der(11)t(2;11)) (Figure 3).
Figure 2
Further alterations on other chromosomes were only noted for chromosomes 1 and 10. ArrayCGH
profiles showed that one of the extra copies of chromosome 1q present in NGP.1A.TR1 was lost in the
microcell hybrids (data not shown). From the four 1q copies, only three are left after transfer of
chromosome 11. Also the chromosome 10q-gain observed in the parental cell line was not present
anymore in the microcell hybrids. As these changes for chromosomes 1 and 10 were detected in all
microcell hybrid subclones irrespective of the observed phenotype, we assume that these changes
were not responsible for the observed morphological changes.
Paper 6 130
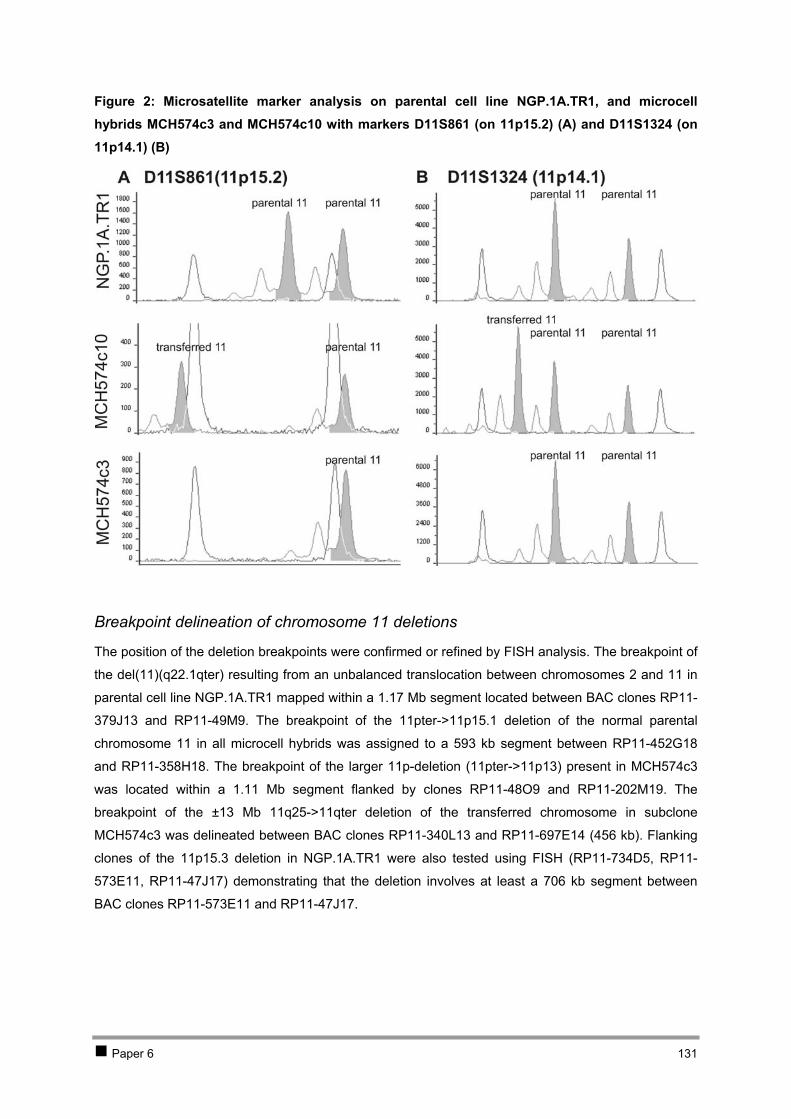
Figure 2: Microsatellite marker analysis on parental cell line NGP.1A.TR1, and microcell hybrids MCH574c3 and MCH574c10 with markers D11S861 (on 11p15.2) (A) and D11S1324 (on 11p14.1) (B)
Breakpoint delineation of chromosome 11 deletions
The position of the deletion breakpoints were confirmed or refined by FISH analysis. The breakpoint of
the del(11)(q22.1qter) resulting from an unbalanced translocation between chromosomes 2 and 11 in
parental cell line NGP.1A.TR1 mapped within a 1.17 Mb segment located between BAC clones RP11-
379J13 and RP11-49M9. The breakpoint of the 11pter->11p15.1 deletion of the normal parental
chromosome 11 in all microcell hybrids was assigned to a 593 kb segment between RP11-452G18
and RP11-358H18. The breakpoint of the larger 11p-deletion (11pter->11p13) present in MCH574c3
was located within a 1.11 Mb segment flanked by clones RP11-48O9 and RP11-202M19. The
breakpoint of the ±13 Mb 11q25->11qter deletion of the transferred chromosome in subclone
MCH574c3 was delineated between BAC clones RP11-340L13 and RP11-697E14 (456 kb). Flanking
clones of the 11p15.3 deletion in NGP.1A.TR1 were also tested using FISH (RP11-734D5, RP11-
573E11, RP11-47J17) demonstrating that the deletion involves at least a 706 kb segment between
BAC clones RP11-573E11 and RP11-47J17.
Paper 6 131
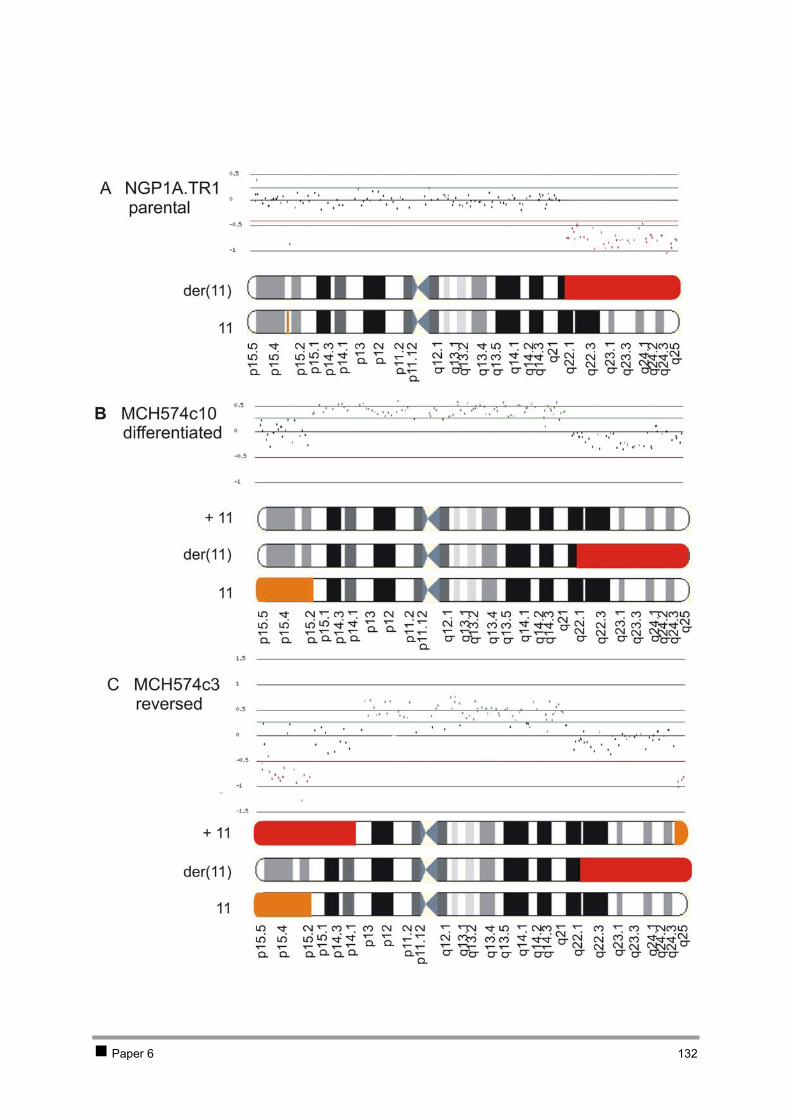
Paper 6 132
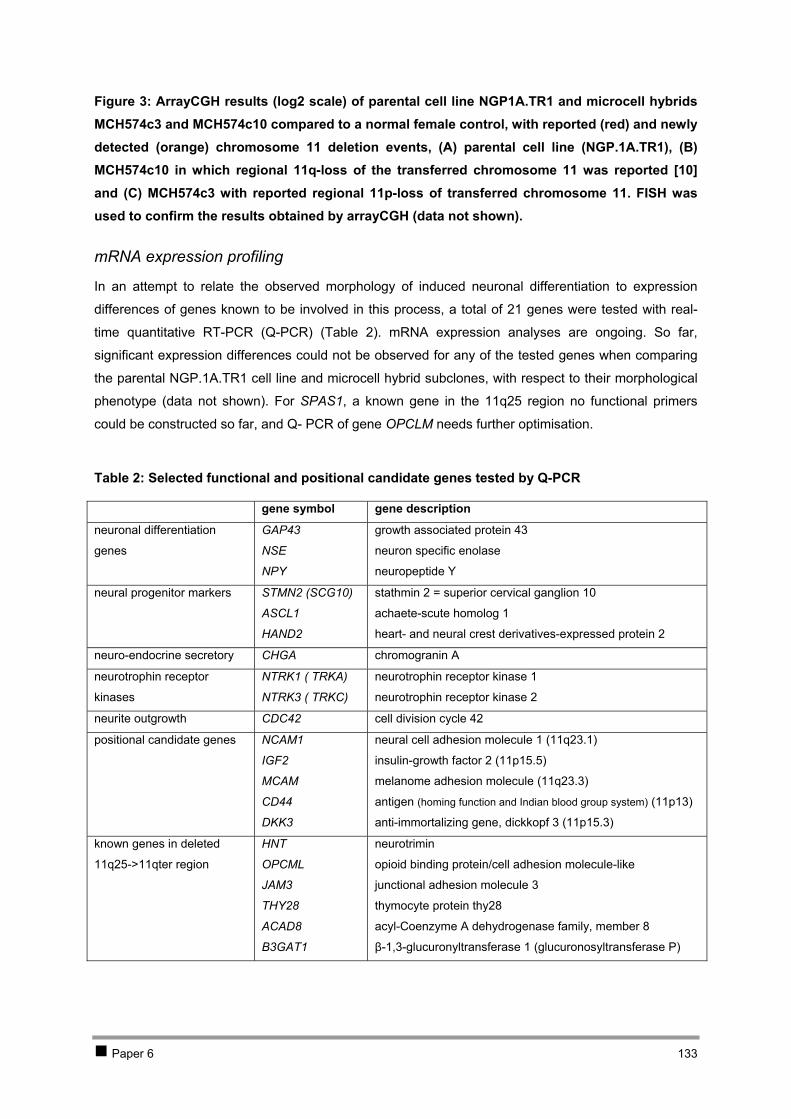
Figure 3: ArrayCGH results (log2 scale) of parental cell line NGP1A.TR1 and microcell hybrids MCH574c3 and MCH574c10 compared to a normal female control, with reported (red) and newly detected (orange) chromosome 11 deletion events, (A) parental cell line (NGP.1A.TR1), (B) MCH574c10 in which regional 11q-loss of the transferred chromosome 11 was reported [10] and (C) MCH574c3 with reported regional 11p-loss of transferred chromosome 11. FISH was used to confirm the results obtained by arrayCGH (data not shown).
mRNA expression profiling
In an attempt to relate the observed morphology of induced neuronal differentiation to expression
differences of genes known to be involved in this process, a total of 21 genes were tested with real-
time quantitative RT-PCR (Q-PCR) ( ). mRNA expression analyses are ongoing. So far,
significant expression differences could not be observed for any of the tested genes when comparing
the parental NGP.1A.TR1 cell line and microcell hybrid subclones, with respect to their morphological
phenotype (data not shown). For SPAS1, a known gene in the 11q25 region no functional primers
could be constructed so far, and Q- PCR of gene OPCLM needs further optimisation.
Table 2
Table 2: Selected functional and positional candidate genes tested by Q-PCR
gene symbol gene description
neuronal differentiation
genes
GAP43
NSE
NPY
growth associated protein 43
neuron specific enolase
neuropeptide Y
neural progenitor markers STMN2 (SCG10)
ASCL1
HAND2
stathmin 2 = superior cervical ganglion 10
achaete-scute homolog 1
heart- and neural crest derivatives-expressed protein 2
neuro-endocrine secretory CHGA chromogranin A
neurotrophin receptor
kinases
NTRK1 ( TRKA)
NTRK3 ( TRKC)
neurotrophin receptor kinase 1
neurotrophin receptor kinase 2
neurite outgrowth CDC42 cell division cycle 42
positional candidate genes NCAM1
IGF2
MCAM
CD44
DKK3
neural cell adhesion molecule 1 (11q23.1)
insulin-growth factor 2 (11p15.5)
melanome adhesion molecule (11q23.3)
antigen (homing function and Indian blood group system) (11p13)
anti-immortalizing gene, dickkopf 3 (11p15.3)
known genes in deleted
11q25->11qter region
HNT
OPCML
JAM3
THY28
ACAD8
B3GAT1
neurotrimin
opioid binding protein/cell adhesion molecule-like
junctional adhesion molecule 3
thymocyte protein thy28
acyl-Coenzyme A dehydrogenase family, member 8
β-1,3-glucuronyltransferase 1 (glucuronosyltransferase P)
Paper 6 133
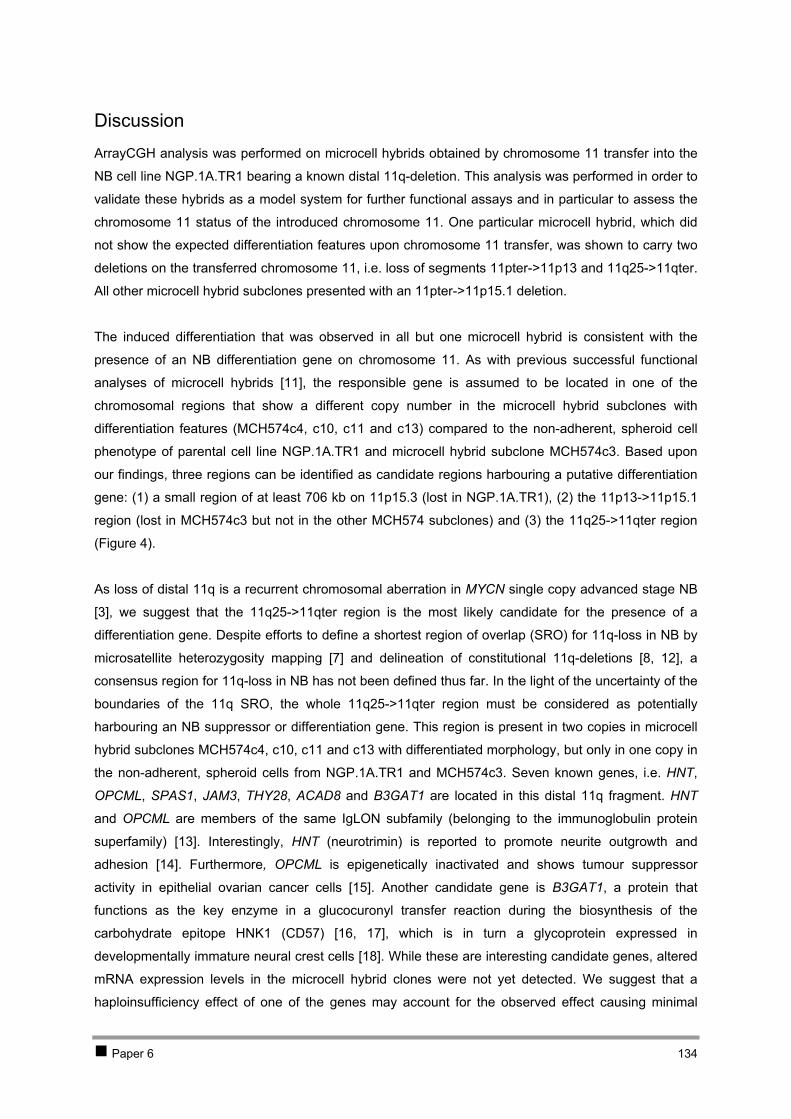
Discussion
ArrayCGH analysis was performed on microcell hybrids obtained by chromosome 11 transfer into the
NB cell line NGP.1A.TR1 bearing a known distal 11q-deletion. This analysis was performed in order to
validate these hybrids as a model system for further functional assays and in particular to assess the
chromosome 11 status of the introduced chromosome 11. One particular microcell hybrid, which did
not show the expected differentiation features upon chromosome 11 transfer, was shown to carry two
deletions on the transferred chromosome 11, i.e. loss of segments 11pter->11p13 and 11q25->11qter.
All other microcell hybrid subclones presented with an 11pter->11p15.1 deletion.
The induced differentiation that was observed in all but one microcell hybrid is consistent with the
presence of an NB differentiation gene on chromosome 11. As with previous successful functional
analyses of microcell hybrids [11], the responsible gene is assumed to be located in one of the
chromosomal regions that show a different copy number in the microcell hybrid subclones with
differentiation features (MCH574c4, c10, c11 and c13) compared to the non-adherent, spheroid cell
phenotype of parental cell line NGP.1A.TR1 and microcell hybrid subclone MCH574c3. Based upon
our findings, three regions can be identified as candidate regions harbouring a putative differentiation
gene: (1) a small region of at least 706 kb on 11p15.3 (lost in NGP.1A.TR1), (2) the 11p13->11p15.1
region (lost in MCH574c3 but not in the other MCH574 subclones) and (3) the 11q25->11qter region
(F ). igure 4
As loss of distal 11q is a recurrent chromosomal aberration in MYCN single copy advanced stage NB
[3], we suggest that the 11q25->11qter region is the most likely candidate for the presence of a
differentiation gene. Despite efforts to define a shortest region of overlap (SRO) for 11q-loss in NB by
microsatellite heterozygosity mapping [7] and delineation of constitutional 11q-deletions [8, 12], a
consensus region for 11q-loss in NB has not been defined thus far. In the light of the uncertainty of the
boundaries of the 11q SRO, the whole 11q25->11qter region must be considered as potentially
harbouring an NB suppressor or differentiation gene. This region is present in two copies in microcell
hybrid subclones MCH574c4, c10, c11 and c13 with differentiated morphology, but only in one copy in
the non-adherent, spheroid cells from NGP.1A.TR1 and MCH574c3. Seven known genes, i.e. HNT,
OPCML, SPAS1, JAM3, THY28, ACAD8 and B3GAT1 are located in this distal 11q fragment. HNT
and OPCML are members of the same IgLON subfamily (belonging to the immunoglobulin protein
superfamily) [13]. Interestingly, HNT (neurotrimin) is reported to promote neurite outgrowth and
adhesion [14]. Furthermore, OPCML is epigenetically inactivated and shows tumour suppressor
activity in epithelial ovarian cancer cells [15]. Another candidate gene is B3GAT1, a protein that
functions as the key enzyme in a glucocuronyl transfer reaction during the biosynthesis of the
carbohydrate epitope HNK1 (CD57) [16, 17], which is in turn a glycoprotein expressed in
developmentally immature neural crest cells [18]. While these are interesting candidate genes, altered
mRNA expression levels in the microcell hybrid clones were not yet detected. We suggest that a
haploinsufficiency effect of one of the genes may account for the observed effect causing minimal
Paper 6 134
changes in expression level that are not observable by Q-PCR. An alternative explanation is that the
normal parental chromosome 11 harbours a mutated allele that is normally expressed on the mRNA
level (Figure 4). Reintroduction of a wild type allele by chromosome transfer could repair the defect,
leading to differentiation. In contrast, one microcell hybrid has lost the 11q25->11qter region of the
transferred chromosome, causing reversal to the non-adherent, spheroid morphology of the parental
cells. Additional mutation, promoter hypermethylation and gene directed functional assays are needed
to clarify which of the genes located within the deleted 11q25->11qter region are responsible for the
differentiated phenotype. Finally, we cannot exclude that unknown genes not assayed in this study but
located in the 11q25>11qter region may be involved in the observed phenotypic changes.
As already mentioned, the observed deletions on the short arm of chromosome 11 may also account
for the differentiated morphology, as indicated by the presence of two independent deletion events
along the distal part of chromosome arm 11p. In particular, it is striking that all microcell hybrids
contained a parental chromosome 11 harbouring a 11pter->11p15.1 deletion. This may either be the
result of an early coincidental event during the transfer process, or indicative for a selection process
against the presence of three copies of this region, due to the presence of an anti-immortalizing or
growth suppressive gene. The last hypothesis is further supported by the report of unbalanced 11p-
deletions in 4% of NBs (14/394) [19, 20]. Of interest is that the 11pter->11p15.1 region contains the
DKK3 gene (dickkopf homolog 3), a WNT modulating tumour suppressor that is shown to be
downregulated in immortalized tumour cells, in part by hypermethylation [21-25]. Moreover, this gene
was recently found to be downregulated in MYCN amplified NBs and proposed to be a putative MYCN
downstream gene (Vandesompele et al., in preparation). As such, this gene might be either
transcriptionally deregulated in MYCN amplified cells or deleted, mutated or hypermethylated in MYCN
single copy cells.
This study clearly shows that it is important to monitor the transfer of the desired chromosome, as well
as the genetic background of the cell line before and after the transfer experiment. Selective pressure
processes may occur during or after transfer of a chromosome, e.g. by chromosomal losses in order to
maintain the viability of the microcell hybrids. Hence, detailed information on the genome-wide copy
number status before and after transfer is required in order to correlate phenotypic changes with
chromosomal alteration. ArrayCGH has been proven to be a valuable screening method for evaluation
of the chromosome alterations and for delineation of possible deletion events, allowing fine-mapping
of the candidate regions that harbour candidate suppressor genes.
Paper 6 135
Figure 4: Regional copy numbers in cells with non-adherent, spheroid (parental) cell phenotype compared to cells with induced differentiation, demonstrating the three regions on chromosome 11 that may be involved in the phenotypic difference, i.e. a small region on 11p15.3 encompassing BAC clone RP11-51B23 (lost in NGP.1A.TR1) (A region), the 11p13->11p15.1 region (lost in MCH574c3 but not in the other MCH574 microcell hybrids) (B region) and the 11q25->11qter region (lost in MCH574c3) (C region) (* indicates the putative presence of a mutated gene).
Conclusion
Microsatellite marker loss analysis, FISH and (array)CGH based copy number in tumour specimens
and patients with constitutional deletions have thus far not identified a consensus SRO for 11q-
deletion. Here, we present a unique, alternative strategy to pinpoint chromosomal regions or genes
that may be important in NB tumour biology. Chromosome 11 transfer, followed by phenotype scoring
and high-resolution copy number analysis delineated putative regions on chromosome 11 involved in
tumour anti-immortalisation and differentiation. Future mutation and functional analyses are required to
clarify the potential role of genes localised in these regions.
Paper 6 136

Materials and Methods
Cell lines
The parental cell line NGP.1A.TR1 and the chromosome 11 microcell transfer derived subclones
MCH574c3, c4, c10, c11 and c13 used in this study have been described previously [10]. Cell lines
were cultured following standard procedures and were digitally photographed under an inverted
(phase-contrast) microscope, pelleted, snap-frozen and stored at -80°C for further processing. DNA
was isolated using the QIAamp DNA mini kit (Qiagen). RNA was isolated from the snap-frozen cell
pellets using the RNeasy Mini kit (Qiagen) according to the manufacturer’s guidelines, followed by
RNase free DNase treatment on column (Qiagen).
ArrayCGH
Hybridisation of cell line DNA to a 1Mb BAC array was performed as described [26]. Using our in-
house developed analysis and visualisation software, arrayCGHbase, data were normalised to the
median ratio and replicate median ratio profiles visualised (medgen.ugent.be/arrayCGHbase) (Menten
et al., in preparation).
FISH and microsatellite marker analysis
BAC clones and microsatellite markers were selected based on their chromosomal position using the
Ensembl genome browser (www.ensembl.org), the UCSC human genome browser (July 2003 freeze,
genome.ucsc.edu) or the Genome Database (www.hgd.org). Labelling and FISH (fluorescence in situ
hybridisation) was performed as described [27]. Experimental conditions for the fluorescent based
microsatellite screening can be obtained from the authors upon request.
Real-time quantitative RT-PCR based mRNA expression profiling
Primers were designed using Primer Express v2.0 (Applied Biosystems). Primer sequences are
available in the public RTPrimerDB database (medgen.UGent.be/rtprimerdb/): GAP43 (97), NSE
(367), NPY (117), STMN2 (SCG10) (129), ASCL1 (373), HAND2 (98), CHGA (474), NTRK1 (TRKA)
(118), NTRK3 (TRKC) (372), CDC42 (89), NCAM1 (1076), IGF2 (103), MCAM (1077), CD44 (88),
DKK3 (94), HNT (1078), OPCML (1079), JAM3 (1080), THY28 (1084), ACAD8 (1081), B3GAT1
(1082), GAPD (3), HPRT1 (5) and UBC (8) [28]. Relative expression levels were determined using an
optimized two-step SYBR Green I RT-PCR assay [29]. PCR reagents were obtained from Eurogentec
as SYBR Green I core reagents, prepared as 2x mastermixes, stored at -20°C and used according to
the manufacturer’s instructions. Reactions were run on an ABI5700 (Applied Biosystems). The
comparative CT method was used for quantification. Gene expression levels were normalized using
the geometric mean of the 3 most stable internal control genes in NB (i.e. UBC, HPRT1 and GAPD) as
reported previously [30].
Paper 6 137

Acknowledgements
We thank Peter Degrave and Geert De Vos for their efforts in cell culturing.
Katleen De Preter is an aspirant with the Fund for Scientific Research Flanders (FWO-Vlaanderen). Jo
Vandesompele is supported by a post-doctoral grant from the Institute for the Promotion of Innovation
by Science and Technology in Flanders (IWT). Nadine Van Roy is a post-doctoral researcher with the
FWO. This work was supported by FWO-grant G.0028.00, VEO-grant 011V1302, BOF-grant
011F1200 and 011B4300, and GOA-grant 12051203.
Paper 6 138
References
1. J Vandesompele, N Van Roy, M Van Gele, G Laureys, P Ambros, P Heimann, C Devalck, E Schuuring, P Brock, J Otten, et al: Genetic heterogeneity of neuroblastoma studied by comparative genomic hybridization. Genes Chromosomes Cancer 1998, 23:141-52.
2. J Vandesompele, F Speleman, N Van Roy, G Laureys, C Brinskchmidt, H Christiansen, F Lampert, M Lastowska, N Bown, A Pearson, et al: Multicentre analysis of patterns of DNA gains and losses in 204 neuroblastoma tumors: how many genetic subgroups are there? Med Pediatr Oncol 2001, 36:5-10.
3. D Plantaz, J Vandesompele, N Van Roy, M Lastowska, N Bown, V Combaret, MC Favrot, O Delattre, J Michon, J Benard, et al: Comparative genomic hybridization (CGH) analysis of stage 4 neuroblastoma reveals high frequency of 11q deletion in tumors lacking MYCN amplification. Int J Cancer 2001, 91:680-6.
4. ME Luttikhuis, JE Powell, SA Rees, T Genus, S Chughtai, P Ramani, JR Mann, CM McConville: Neuroblastomas with chromosome 11q loss and single copy MYCN comprise a biologically distinct group of tumours with adverse prognosis. Br J Cancer 2001, 85:531-7.
5. CJ Breen, A O'Meara, M McDermott, M Mullarkey, RL Stallings: Coordinate deletion of chromosome 3p and 11q in neuroblastoma detected by comparative genomic hybridization. Cancer Genet Cytogenet 2000, 120:44-9.
6. J Vandesompele, M Baudis, K De Preter, N Van Roy, P Ambros, N Bown, C Brinkschmidt, H Christiansen, V Combaret, M Lastowska, et al: Unequivocal delineation of clinico-genetic subgroups and development of a new model for outcome prediction in neuroblastoma. J Clin Oncol submitted.
7. C Guo, PS White, MJ Weiss, MD Hogarty, PM Thompson, DO Stram, R Gerbing, KK Matthay, RC Seeger, GM Brodeur, et al: Allelic deletion at 11q23 is common in MYCN single copy neuroblastomas. Oncogene 1999, 18:4948-57.
8. Y Mosse, J Greshock, A King, D Khazi, BL Weber, JM Maris: Identification and high-resolution mapping of a constitutional 11q deletion in an infant with multifocal neuroblastoma. Lancet Oncol 2003, 4:769-71.
9. K De Preter, J Vandesompele, J Hoebeeck, C Vandenbroecke, J Smet, A Nuyts, G Laureys, V Combaret, N Van Roy, F Roels, et al: No evidence for involvement of SDHD in neuroblastoma pathogenesis. BMC Cancer 2004, 4:55.
10. SA Bader, C Fasching, GM Brodeur, EJ Stanbridge: Dissociation of suppression of tumorigenicity and differentiation in vitro effected by transfer of single human chromosomes into human neuroblastoma cells. Cell Growth Differ 1991, 2:245-55.
11. AM Doherty, EM Fisher: Microcell-mediated chromosome transfer (MMCT): small cells with huge potential. Mamm Genome 2003, 14:583-92.
12. D Satge, SW Moore, CA Stiller, FK Niggli, K Pritchard-Jones, N Bown, J Benard, D Plantaz: Abnormal constitutional karyotypes in patients with neuroblastoma: a report of four new cases and review of 47 others in the literature. Cancer Genet Cytogenet 2003, 147:89-98.
13. AF Struyk, PD Canoll, MJ Wolfgang, CL Rosen, P D'Eustachio, JL Salzer: Cloning of neurotrimin defines a new subfamily of differentially expressed neural cell adhesion molecules. J Neurosci 1995, 15:2141-56.
14. OD Gil, G Zanazzi, AF Struyk, JL Salzer: Neurotrimin mediates bifunctional effects on neurite outgrowth via homophilic and heterophilic interactions. J Neurosci 1998, 18:9312-25.
15. GC Sellar, KP Watt, GJ Rabiasz, EA Stronach, L Li, EP Miller, CE Massie, J Miller, B Contreras-Moreira, D Scott, et al: OPCML at 11q25 is epigenetically inactivated and has tumor-suppressor function in epithelial ovarian cancer. Nat Genet 2003, 34:337-43.
16. Y Mitsumoto, S Oka, H Sakuma, J Inazawa, T Kawasaki: Cloning and chromosomal mapping of human glucuronyltransferase involved in biosynthesis of the HNK-1 carbohydrate epitope. Genomics 2000, 65:166-73.
17. I Marcos, JJ Galan, S Borrego, G Antinolo: Cloning, characterization, and chromosome mapping of the human GlcAT-S gene. J Hum Genet 2002, 47:677-80.
18. M Bronner-Fraser: Analysis of the early stages of trunk neural crest migration in avian embryos using monoclonal antibody HNK-1. Dev Biol 1986, 115:44-55.
Paper 6 139

Paper 6 140
19. C Guo, PS White, MD Hogarty, GM Brodeur, R Gerbing, DO Stram, JM Maris: Deletion of 11q23 is a frequent event in the evolution of MYCN single-copy high-risk neuroblastomas. Med Pediatr Oncol 2000, 35:544-6.
20. G Schleiermacher, I Janoueix-Lerosey, V Combaret, J Derre, J Couturier, A Aurias, O Delattre: Combined 24-color karyotyping and comparative genomic hybridization analysis indicates predominant rearrangements of early replicating chromosome regions in neuroblastoma. Cancer Genet Cytogenet 2003, 141:32-42.
21. T Tsuji, M Miyazaki, M Sakaguchi, Y Inoue, M Namba: A REIC gene shows down-regulation in human immortalized cells and human tumor-derived cell lines. Biochem Biophys Res Commun 2000, 268:20-4.
22. I Nozaki, T Tsuji, O Iijima, Y Ohmura, A Andou, M Miyazaki, N Shimizu, M Namba: Reduced expression of REIC/Dkk-3 gene in non-small cell lung cancer. Int J Oncol 2001, 19:117-21.
23. T Tsuji, I Nozaki, M Miyazaki, M Sakaguchi, H Pu, Y Hamazaki, O Iijima, M Namba: Antiproliferative activity of REIC/Dkk-3 and its significant down-regulation in non-small-cell lung carcinomas. Biochem Biophys Res Commun 2001, 289:257-63.
24. K Kobayashi, M Ouchida, T Tsuji, H Hanafusa, M Miyazaki, M Namba, N Shimizu, K Shimizu: Reduced expression of the REIC/Dkk-3 gene by promoter-hypermethylation in human tumor cells. Gene 2002, 282:151-8.
25. K Kurose, M Sakaguchi, Y Nasu, S Ebara, H Kaku, R Kariyama, Y Arao, M Miyazaki, T Tsushima, M Namba, et al: Decreased expression of REIC/Dkk-3 in human renal clear cell carcinoma. J Urol 2004, 171:1314-8.
26. H Fiegler, P Carr, EJ Douglas, DC Burford, S Hunt, CE Scott, J Smith, D Vetrie, P Gorman, IP Tomlinson, et al: DNA microarrays for comparative genomic hybridization based on DOP-PCR amplification of BAC and PAC clones. Genes Chromosomes Cancer 2003, 36:361-74.
27. N Van Roy, G Laureys, NC Cheng, P Willem, G Opdenakker, R Versteeg, F Speleman: 1;17 translocations and other chromosome 17 rearrangements in human primary neuroblastoma tumors and cell lines. Genes Chromosomes Cancer 1994, 10:103-14.
28. F Pattyn, F Speleman, A De Paepe, J Vandesompele: RTPrimerDB: the real-time PCR primer and probe database. Nucleic Acids Res 2003, 31:122-3.
29. J Vandesompele, A De Paepe, F Speleman: Elimination of primer-dimer artifacts and genomic coamplification using a two-step SYBR green I real-time RT-PCR. Anal Biochem 2002, 303:95-8.
30. J Vandesompele, K De Preter, F Pattyn, B Poppe, N Van Roy, A De Paepe, F Speleman: Accurate normalization of real-time quantitative RT-PCR data by geometric averaging of multiple internal control genes. Genome Biol 2002, 3:RESEARCH0034.
3 Discussion 11q-deletion was recently recognised as a major genetic defect in the 2A subgroup of aggressive
neuroblastoma. Due to the uncertainty about the exact localisation of the SRO, thus far no candidate
11q tumour suppressor genes have been tested in neuroblastoma (see 2.2.4 of Chapter 1). The
proposed 11q23 critical region [248] harbours various candidate genes that are involved in cancer,
including SDHD known to be involved in paraganglioma and pheochromocytoma [249, 250], MCAM in
melanoma [251, 252], TSLC1 in non-small cell lung cancer [253], NCAM in renal cell carcinoma [254],
pancreatic cancer [255], colon carcinoma [256] and gastrointestinal neoplasms [257], and ATM in
lymphoproliferative disorders [258]. Extensive analysis of SDHD in neuroblastoma tumours and cell
lines yielded no evidence for a two-hit tumour suppressive involvement in neuroblastoma. However,
an effect in the neuroblastoma tumour phenotype due to haploinsufficiency cannot be excluded and
needs further study. In a study by Vandesompele et al. [94], expression levels of gene MCAM
(melanoma cell adhesion molecule) on 11q23.3 was found to be significantly decreased in cell lines
with 11q-deletion. Another adhesion molecule NCAM1 (= CD56, neural cell adhesion molecule 1) on
11q23.1 is also a good positional and functional candidate tumour suppressor gene for
neuroblastoma. Interaction of NCAM with FGFR1 (fibroblast growth factor receptor 1) stimulates
neurite outgrowth through downstream activation of GAP43 gene. In various cancer types, expression
of NCAM shifts from the adult 120 kDa isoform to the embryonic 140 and 180 kDa isoforms together
with a general downregulation of expression (reviewed in [259]). A correlation between reduced NCAM
expression and prognosis has been reported for some cancer types [255-257]. For both MCAM and
NCAM further studies are required to clarify their role in neuroblastoma. TSLC1 (tumour suppressor in
lung cancer-1) on 11q23.2, also known as IGSF4, is a member of the Ig superfamily and its
extracellular domain has significant homology to NCAM1. This gene was identified as a putative
tumour suppressor gene after cloning from a frequently deleted region in non-small cell lung cancer
[253]. In vivo, it was shown that TSLC1 strongly suppresses tumour growth and metastasis [260].
Reduced or lost expression of TSLC1 in several cancer types is known to be caused by
hypermethylation of its promoter region [253, 261-267]. However, methylation-specific PCR of the
TSCL1 promoter could not demonstrate methylation in neuroblastoma (data not shown). Like the
SDHD study, other in-depth candidate gene studies are needed to clarify their putative involvement in
neuroblastoma. In the near future, application of GINI (gene identification by nonsense mediated
mRNA decay (NMD) inhibition) [188], now being implemented in our laboratory, might reveal new
candidate neuroblastoma genes, possibly also on chromosome 11q (see 3 in Chapter 1).
In addition to the candidate gene approach, we used a functionally oriented approach for the
identification of candidate neuroblastoma suppressor genes on chromosome 11. High-resolution
arrayCGH analysis revealed several deletion events that took place after the transfer of a
chromosome 11 in a neuroblastoma cell line with 11q-deletion. Interestingly, these deletion events
were correlated with morphological changes observed in the microcell hybrid subclones and thus were
Chapter 4: Investigation of candidate neuroblastoma genes on chromosome 11 141
assessed to indicate involvement of putative tumour suppressor genes in these particular regions. In
this way, we found strong evidence for the presence of a tumour suppressor or at least a
differentiation gene on a small portion of band 11q25 and a segment on 11p. Additional in-depth
analysis of genes located in these regions will provide further evidence concerning their involvement in
neuroblastoma. Importantly, this study showed that chromosome transfer studies need validation of
the genetic content of the microcell hybrids by using high-resolution arrayCGH. Additional transfer
experiments with a panel of chromosomes 11 with different deletions or region specific BACs are a
conceivable strategy to further study both regions.
Chapter 4: Investigation of candidate neuroblastoma genes on chromosome 11 142

CHAPTER 5 Conclusionsand future perspectives

Chapter 5 Conclusion and future perspectives
Chapter 5: Conclusions and future perspectives 144
Conclusions In spite of early successes (e.g. the discovery of the MYCN proto-oncogene), the process of
unravelling the genetic basis of neuroblastoma has been extremely difficult and often disappointing.
Indeed, many questions remain unanswered and most putatively involved genes remain to be
discovered. In contrast, for many tumour types a wealth of genetic information has been obtained the
last twenty years. In soft tissue sarcomas, leukaemia’s and lymphomas, the occurrence of gene fusion
resulting from recurrent translocations has lead to surprising discoveries and provided insights into the
pathogenetic mechanisms causing these malignancies [10]. Most importantly, as recently illustrated by
the success of Imatinib (Gleevec), insights into the genetic mechanisms governing tumour
development provide opportunities for molecular oriented therapies based upon knowledge of the
deregulated signalling pathways in cancer cells [268]. In parallel, investigation of familial cancers has
lead to the discovery of key tumour suppressor genes such as the RB1 gene in retinoblastoma [120]
and the APC gene in colon cancer [269], findings which have profoundly changed our understanding
of cancer initiation and progression.
All this is in contrast to our limited understanding of the biology of neuroblastoma. A number of
explanations can be put forward for this meagre hold. First, neuroblastoma is a heterogeneous tumour
consisting of at least three distinct entities [66, 67]. Given the relatively infrequent occurrence of this
paediatric tumour, collection of large series for each entity is a great challenge. Secondly, this neuro-
ectodermal tumour does not exhibit recurrent balanced rearrangements (fusion genes) which in
mesenchymal tumours provided a strong basis for further genetic and functional studies. Thirdly, the
number of families with Mendelian inheritance of neuroblastoma predisposition is very limited and
families are typically small, partly because many neuroblastomas are incurable and lead to death
before reproductive age of the affected members. Interestingly, recent studies in familial
neuroblastoma patients with Ondine’s curse (OMIM 209880) revealed mutations in the PHOX2B gene
on 4p12 [124, 125], and further studies have indicated that this gene can also be mutated in a small
subpopulation of primary neuroblastoma tumours (ANR 2004 abstract 323.1). Up till now, the search
for tumour suppressor genes located in typically recurring deleted chromosomal sites (1p, 3p, 11q,
14q) has been particularly disappointing and therefore neuroblastoma remains a major challenge to
the tumour geneticists.
The research group at the Centre for Medical Genetics in Ghent (CMGG) has developed a
multidisciplinary approach to study the genetics of neuroblastoma. The work described in this thesis
represents an important part of some of these new strategies that have been implemented. In a first
step our research group, which now acts as a reference laboratory for genetic tests in neuroblastoma
in Belgium, has collected a large panel of neuroblastoma tumour samples from Belgian paediatric
oncology centres and has built a database containing clinical and genetic data. In addition, tumour
material for particular studies was obtained from other collaborating European centres.
Although not a primary goal of this thesis, several new high-throughput technologies were introduced
and implemented in the cancer research unit of the CMGG in order to provide new platforms for
investigating neuroblastoma genetics. The implementation of laser capture microdissection,
Chapter 5: Conclusions and future perspectives 145
oligonucleotide chip analysis, cDNA microarray technology and microcell mediated chromosome
transfer combined with arrayCGH provided an important technical framework for ongoing and future
research topics. For example, further microcell hybrid experiments on neuroblastoma are currently
ongoing for the identification of neuroblastoma genes on chromosome arms 3p and 17q. In addition,
the developed cDNA microarrays are now being applied in the screening for MYCN downstream
effectors.
We took up the arduous task to microdissect small islets of neuroblastoma progenitor cells from foetal
adrenals. Thanks to the optimisation of an improved laser capture microdissection protocol, we were
the first laboratory worldwide that succeeded in profiling the normal foetal neuroblast transcriptome.
Extensive quality control of the data and preliminary data mining showed that this profile can indeed
be used as a reference for many future neuroblastoma transcriptome profiling studies. The uncovering
of the transcriptome of normal neuroblastoma progenitor cells is a milestone in neuroblastoma
genetics since in-depth analysis of these data will certainly reveal signalling pathways involved in
neuroblastoma oncogenesis.
This thesis contributed to the identification of genes that are targeted by recurrent chromosome
aberrations, especially 11q-deletions and 2p-amplification. Alternative to positional candidate gene
investigations, we approached the search for 11q neuroblastoma suppressor genes with functional
model systems. This analysis lead to unexpected observations through arrayCGH and, in this way,
pinpointed two regions on chromosome 11 which putatively harbour a differentiation gene.
The study of gene amplification was and still is a major focus in cancer research. First, the detailed
dissection and transcriptional analysis of amplicons is needed in order to identify the genes which are
driving amplicon formation. These studies have proven to be difficult and time-consuming in the past,
but as illustrated in this thesis can now be performed using a highly efficient strategy of combined
subtractive cDNA cloning and expression analysis on custom cDNA arrays. Using this approach we
pinpointed several new genes located within the 2p amplicon that have, in addition to the MYCN proto-
oncogene, a putative role in neuroblastoma outcome and phenotype and that need further analysis.
Secondly, the presence of proto-oncogene amplification often implies an unfavourable prognosis for
the patient and therefore fast and sensitive assays for detection of proto-oncogene amplification is of
utmost importance in clinical management and decision making. For this reason, we developed a real-
time quantitative PCR assay for the assessment of MYCN gene copy number. Since two years, this
powerful methodology has been implemented as a second independent technique for MYCN status
assessment in neuroblastoma, in parallel with FISH. Several other laboratories have also adopted this
approach to reliably measure the MYCN status. Furthermore, based upon this experience, a real-time
quantitative PCR assay was successfully designed for the screening of homozygous and
heterozygous deletions in the VHL gene [229]. The use of Q-PCR for measuring DNA copy number
alterations has further contributed to internationally recognised expertise of the CMMG in real-time
quantitative PCR technology.
Chapter 5: Conclusions and future perspectives 146
Future perspectives For obvious reasons our future focus will first of all go to the data-mining of neuroblastoma expression
profiles from carefully selected tumours. Most importantly we hope and expect that the inclusion of
normal neuroblast data described in this thesis will give a significant additional value towards our
efforts in identifying neuroblastoma genes. In-depth data-mining analysis further supported with data
from recently validated neuroblastoma model systems at the CMMG should add more power to the
efforts for pathway identification and selection of candidate neuroblastoma genes. In parallel with
proteome and functional assays such as RNAi, aimed at providing more direct evidence for
involvement of the identified molecular targets in neuroblastoma oncogenesis, further investigations
will be conducted in order to screen for pharmacological (small molecules) and immuno-therapeutical
targets (ideally membrane associated proteins) for therapeutic intervention. In vitro tests and xenograft
mouse models will serve as a first screening platform for the testing of compounds and
immunotherapeutic strategies. In addition, the uncovering of neuroblastoma deregulated genes and
pathways will allow us to construct robust and reliable diagnostic and prognostic neuroblastoma cDNA
microarray tests.
A second important future prospect which emerges from this thesis is the further dissection of the
11q25 candidate region. Given the fact that classical positional mapping approaches have been rather
disappointing in neuroblastoma suppressor gene identification, two important new strategies for
detection of new tumour suppressor genes have been introduced at the CMGG, i.e. the so-called GINI
(gene identification through the study of nonsense mediated decay) and methylation screening.
Possibly, these new screenings methods may yield important new information as to the presence of
putative candidate suppressor genes within the 11q25 segment defined in this thesis.
Finally, this thesis has lead to the introduction of cutting edge technologies which have been swiftly
and firmly integrated within the rapidly developing research platform at the CMMG. Consequently, this
thesis will indirectly contribute to the future successes of genetic research at the CMMG.
Chapter 5: Conclusions and future perspectives 147
References 1. T Boveri: Zur frage der Entstehung Maligner Tumoren. Jena: Gustav Fisher; 1914. 2. PC Nowell, DA Hungerford: Chromosome studies on normal and leukemic human
leukocytes. J Natl Cancer Inst 1960, 25:85-109. 3. JD Rowley: Letter: A new consistent chromosomal abnormality in chronic myelogenous
leukaemia identified by quinacrine fluorescence and Giemsa staining. Nature 1973, 243:290-3.
4. F Mitelman, F Mertens, B Johansson: A breakpoint map of recurrent chromosomal rearrangements in human neoplasia. Nat Genet 1997, 15 Spec No:417-74.
5. D Stehelin, HE Varmus, JM Bishop, PK Vogt: DNA related to the transforming gene(s) of avian sarcoma viruses is present in normal avian DNA. Nature 1976, 260:170-3.
6. H Harris, OJ Miller, G Klein, P Worst, T Tachibana: Suppression of malignancy by cell fusion. Nature 1969, 223:363-8.
7. EJ Stanbridge: Suppression of malignancy in human cells. Nature 1976, 260:17-20. 8. K Macleod: Tumor suppressor genes. Curr Opin Genet Dev 2000, 10:81-93. 9. D Hanahan, RA Weinberg: The hallmarks of cancer. Cell 2000, 100:57-70. 10. PA Futreal, L Coin, M Marshall, T Down, T Hubbard, R Wooster, N Rahman, MR Stratton: A
census of human cancer genes. Nat Rev Cancer 2004, 4:177-83. 11. ES Lander, LM Linton, B Birren, C Nusbaum, MC Zody, J Baldwin, K Devon, K Dewar, M
Doyle, W FitzHugh, et al: Initial sequencing and analysis of the human genome. Nature 2001, 409:860-921.
12. JC Venter, MD Adams, EW Myers, PW Li, RJ Mural, GG Sutton, HO Smith, M Yandell, CA Evans, RA Holt, et al: The sequence of the human genome. Science 2001, 291:1304-51.
13. WC Hahn, RA Weinberg: Modelling the molecular circuitry of cancer. Nat Rev Cancer 2002, 2:331-41.
14. PC Nowell: The clonal evolution of tumor cell populations. Science 1976, 194:23-8. 15. T Lapidot, C Sirard, J Vormoor, B Murdoch, T Hoang, J Caceres-Cortes, M Minden, B
Paterson, MA Caligiuri, JE Dick: A cell initiating human acute myeloid leukaemia after transplantation into SCID mice. Nature 1994, 367:645-8.
16. AW Hamburger, SE Salmon: Primary bioassay of human tumor stem cells. Science 1977, 197:461-3.
17. D Bonnet, JE Dick: Human acute myeloid leukemia is organized as a hierarchy that originates from a primitive hematopoietic cell. Nat Med 1997, 3:730-7.
18. M Al-Hajj, MS Wicha, A Benito-Hernandez, SJ Morrison, MF Clarke: Prospective identification of tumorigenic breast cancer cells. Proc Natl Acad Sci U S A 2003, 100:3983-8.
19. SK Singh, ID Clarke, M Terasaki, VE Bonn, C Hawkins, J Squire, PB Dirks: Identification of a cancer stem cell in human brain tumors. Cancer Res 2003, 63:5821-8.
20. R Pardal, MF Clarke, SJ Morrison: Applying the principles of stem-cell biology to cancer. Nat Rev Cancer 2003, 3:895-902.
21. T Reya, AW Duncan, L Ailles, J Domen, DC Scherer, K Willert, L Hintz, R Nusse, IL Weissman: A role for Wnt signalling in self-renewal of haematopoietic stem cells. Nature 2003, 423:409-14.
22. K Willert, JD Brown, E Danenberg, AW Duncan, IL Weissman, T Reya, JR Yates, 3rd, R Nusse: Wnt proteins are lipid-modified and can act as stem cell growth factors. Nature 2003, 423:448-52.
23. M Pasca di Magliano, M Hebrok: Hedgehog signalling in cancer formation and maintenance. Nat Rev Cancer 2003, 3:903-11.
24. F Radtke, K Raj: The role of Notch in tumorigenesis: oncogene or tumour suppressor? Nat Rev Cancer 2003, 3:756-67.
25. M Groszer, R Erickson, DD Scripture-Adams, R Lesche, A Trumpp, JA Zack, HI Kornblum, X Liu, H Wu: Negative regulation of neural stem/progenitor cell proliferation by the Pten tumor suppressor gene in vivo. Science 2001, 294:2186-9.
26. J Lessard, G Sauvageau: Bmi-1 determines the proliferative capacity of normal and leukaemic stem cells. Nature 2003, 423:255-60.
27. H Ema, H Nakauchi: Self-renewal and lineage restriction of hematopoietic stem cells. Curr Opin Genet Dev 2003, 13:508-12.
References 148
28. M van de Wetering, E Sancho, C Verweij, W de Lau, I Oving, A Hurlstone, K van der Horn, E Batlle, D Coudreuse, AP Haramis, et al: The beta-catenin/TCF-4 complex imposes a crypt progenitor phenotype on colorectal cancer cells. Cell 2002, 111:241-50.
29. E Batlle, JT Henderson, H Beghtel, MM van den Born, E Sancho, G Huls, J Meeldijk, J Robertson, M van de Wetering, T Pawson, et al: Beta-catenin and TCF mediate cell positioning in the intestinal epithelium by controlling the expression of EphB/ephrinB. Cell 2002, 111:251-63.
30. V Korinek, N Barker, P Moerer, E van Donselaar, G Huls, PJ Peters, H Clevers: Depletion of epithelial stem-cell compartments in the small intestine of mice lacking Tcf-4. Nat Genet 1998, 19:379-83.
31. S Zhou, JD Schuetz, KD Bunting, AM Colapietro, J Sampath, JJ Morris, I Lagutina, GC Grosveld, M Osawa, H Nakauchi, et al: The ABC transporter Bcrp1/ABCG2 is expressed in a wide variety of stem cells and is a molecular determinant of the side-population phenotype. Nat Med 2001, 7:1028-34.
32. PM Chaudhary, IB Roninson: Expression and activity of P-glycoprotein, a multidrug efflux pump, in human hematopoietic stem cells. Cell 1991, 66:85-94.
33. GM Brodeur, RP Castleberry: Neuroblastoma. In: Principles and practice of pediatric oncology Edited by PA Pizzo, DG Poplack, Third ed. pp. 761-797. Philadelphia: Lippincott Raven; 1997: 761-797.
34. GM Brodeur, T Sawada, Y Tsuchida, PA Voute: Neuroblastoma, First edn. Amsterdam: Elsevier; 2000.
35. JM Maris, KK Matthay: Molecular biology of neuroblastoma. J Clin Oncol 1999, 17:2264-79.
36. MJ Cooper, GM Hutchins, PS Cohen, LJ Helman, RJ Mennie, MA Israel: Human neuroblastoma tumor cell lines correspond to the arrested differentiation of chromaffin adrenal medullary neuroblasts. Cell Growth Differ 1990, 1:149-59.
37. JC Hoehner, C Gestblom, F Hedborg, B Sandstedt, L Olsen, S Pahlman: A developmental model of neuroblastoma: differentiating stroma-poor tumors' progress along an extra-adrenal chromaffin lineage. Lab Invest 1996, 75:659-75.
38. C Gestblom, A Grynfeld, I Ora, E Ortoft, C Larsson, H Axelson, B Sandstedt, P Cserjesi, EN Olson, S Pahlman: The basic helix-loop-helix transcription factor dHAND, a marker gene for the developing human sympathetic nervous system, is expressed in both high- and low-stage neuroblastomas. Lab Invest 1999, 79:67-79.
39. JC Hoehner, F Hedborg, L Eriksson, B Sandstedt, L Grimelius, L Olsen, S Pahlman: Developmental gene expression of sympathetic nervous system tumors reflects their histogenesis. Lab Invest 1998, 78:29-45.
40. AJ Coldman, CJ Fryer, JM Elwood, MJ Sonley: Neuroblastoma: influence of age at diagnosis, stage, tumor site, and sex on prognosis. Cancer 1980, 46:1896-1901.
41. EH LaBrosse, C Com-Nougue, JM Zucker, E Comoy, C Bohuon, J Lemerle, O Schweisguth: Urinary excretion of 3-methoxy-4-hydroxymandelic acid and 3-methoxy-4-hydroxyphenylacetic acid by 288 patients with neuroblastoma and related neural crest tumors. Cancer Res 1980, 40:1995-2001.
42. EH LaBrosse, E Comoy, C Bohuon, JM Zucker, O Schweisguth: Catecholamine metabolism in neuroblastoma. J Natl Cancer Inst 1976, 57:633-8.
43. WE Laug, SE Siegel, KN Shaw, B Landing, J Baptista, M Gutenstein: Initial urinary catecholamine metabolite concentrations and prognosis in neuroblastoma. Pediatrics 1978, 62:77-83.
44. AE Evans, GJ D'Angio, J Randolph: A proposed staging for children with neuroblastoma. Children's cancer study group A. Cancer 1971, 27:374-8.
45. GM Brodeur, J Pritchard, F Berthold, NL Carlsen, V Castel, RP Castelberry, B De Bernardi, AE Evans, M Favrot, F Hedborg, et al: Revisions of the international criteria for neuroblastoma diagnosis, staging, and response to treatment. J Clin Oncol 1993, 11:1466-77.
46. H Shimada, J Chatten, WA Newton, Jr., N Sachs, AB Hamoudi, T Chiba, HB Marsden, K Misugi: Histopathologic prognostic factors in neuroblastic tumors: definition of subtypes of ganglioneuroblastoma and an age-linked classification of neuroblastomas. J Natl Cancer Inst 1984, 73:405-16.
47. H Shimada, IM Ambros, LP Dehner, J Hata, VV Joshi, B Roald: Terminology and morphologic criteria of neuroblastic tumors: recommendations by the International Neuroblastoma Pathology Committee. Cancer 1999, 86:349-63.
References 149
48. M Lastowska, C Cullinane, S Variend, S Cotterill, N Bown, S O'Neill, K Mazzocco, P Roberts, J Nicholson, C Ellershaw, et al: Comprehensive genetic and histopathologic study reveals three types of neuroblastoma tumors. J Clin Oncol 2001, 19:3080-90.
49. N Sidell, A Altman, MR Haussler, RC Seeger: Effects of retinoic acid (RA) on the growth and phenotypic expression of several human neuroblastoma cell lines. Exp Cell Res 1983, 148:21-30.
50. KK Matthay, JG Villablanca, RC Seeger, DO Stram, RE Harris, NK Ramsay, P Swift, H Shimada, CT Black, GM Brodeur, et al: Treatment of high-risk neuroblastoma with intensive chemotherapy, radiotherapy, autologous bone marrow transplantation, and 13-cis-retinoic acid. Children's Cancer Group. N Engl J Med 1999, 341:1165-73.
51. M Ponzoni, P Bocca, V Chiesa, A Decensi, V Pistoia, L Raffaghello, C Rozzo, PG Montaldo: Differential effects of N-(4-hydroxyphenyl)retinamide and retinoic acid on neuroblastoma cells: apoptosis versus differentiation. Cancer Res 1995, 55:853-61.
52. PE Lovat, M Ranalli, M Annichiarrico-Petruzzelli, F Bernassola, M Piacentini, AJ Malcolm, AD Pearson, G Melino, CP Redfern: Effector mechanisms of fenretinide-induced apoptosis in neuroblastoma. Exp Cell Res 2000, 260:50-60.
53. KK Matthay, K DeSantes, B Hasegawa, J Huberty, RS Hattner, A Ablin, CP Reynolds, RC Seeger, VK Weinberg, D Price: Phase I dose escalation of 131I-metaiodobenzylguanidine with autologous bone marrow support in refractory neuroblastoma. J Clin Oncol 1998, 16:229-36.
54. J De Kraker, CA Hoefnagel, H Caron, RA Valdes Olmos, J Zsiros, HA Heij, PA Voute: First line targeted radiotherapy, a new concept in the treatment of advanced stage neuroblastoma. Eur J Cancer 1995, 31A:600-2.
55. S Tepmongkol, S Heyman: 131I MIBG therapy in neuroblastoma: mechanisms, rationale, and current status. Med Pediatr Oncol 1999, 32:427-31; discussion 432.
56. JD Frost, JA Hank, GH Reaman, S Frierdich, RC Seeger, J Gan, PM Anderson, LJ Ettinger, MS Cairo, BR Blazar, et al: A phase I/IB trial of murine monoclonal anti-GD2 antibody 14.G2a plus interleukin-2 in children with refractory neuroblastoma: a report of the Children's Cancer Group. Cancer 1997, 80:317-33.
57. AL Yu, MM Uttenreuther-Fischer, CS Huang, CC Tsui, SD Gillies, RA Reisfeld, FH Kung: Phase I trial of a human-mouse chimeric anti-disialoganglioside monoclonal antibody ch14.18 in patients with refractory neuroblastoma and osteosarcoma. J Clin Oncol 1998, 16:2169-80.
58. CA Burkhart, AJ Cheng, J Madafiglio, M Kavallaris, M Mili, GM Marshall, WA Weiss, LM Khachigian, MD Norris, M Haber: Effects of MYCN antisense oligonucleotide administration on tumorigenesis in a murine model of neuroblastoma. J Natl Cancer Inst 2003, 95:1394-403.
59. X Lu, A Pearson, J Lunec: The MYCN oncoprotein as a drug development target. Cancer Lett 2003, 197:125-30.
60. AE Evans, KD Kisselbach, DJ Yamashiro, N Ikegaki, AM Camoratto, CA Dionne, GM Brodeur: Antitumor activity of CEP-751 (KT-6587) on human neuroblastoma and medulloblastoma xenografts. Clin Cancer Res 1999, 5:3594-602.
61. A Borkhardt: Blocking oncogenes in malignant cells by RNA interference--new hope for a highly specific cancer treatment? Cancer Cell 2002, 2:167-8.
62. DM Ross, TP Hughes: Cancer treatment with kinase inhibitors: what have we learnt from imatinib? Br J Cancer 2004, 90:12-9.
63. P Marks, RA Rifkind, VM Richon, R Breslow, T Miller, WK Kelly: Histone deacetylases and cancer: causes and therapies. Nat Rev Cancer 2001, 1:194-202.
64. N Bown: Neuroblastoma tumour genetics: clinical and biological aspects. J Clin Pathol 2001, 54:897-910.
65. GM Brodeur: Neuroblastoma: biological insights into a clinical enigma. Nat Rev Cancer 2003, 3:203-16.
66. D Plantaz, J Vandesompele, N Van Roy, M Lastowska, N Bown, V Combaret, MC Favrot, O Delattre, J Michon, J Benard, et al: Comparative genomic hybridization (CGH) analysis of stage 4 neuroblastoma reveals high frequency of 11q deletion in tumors lacking MYCN amplification. Int J Cancer 2001, 91:680-6.
67. J Vandesompele, F Speleman, N Van Roy, G Laureys, C Brinskchmidt, H Christiansen, F Lampert, M Lastowska, N Bown, A Pearson, et al: Multicentre analysis of patterns of DNA gains and losses in 204 neuroblastoma tumors: how many genetic subgroups are there? Med Pediatr Oncol 2001, 36:5-10.
References 150
68. J Vandesompele, M Baudis, K De Preter, N Van Roy, P Ambros, N Bown, C Brinkschmidt, H Christiansen, V Combaret, M Lastowska, et al: Unequivocal delineation of clinico-genetic subgroups and development of a new model for outcome prediction in neuroblastoma. J Clin Oncol submitted.
69. A Nakagawara, M Arima-Nakagawara, NJ Scavarda, CG Azar, AB Cantor, GM Brodeur: Association between high levels of expression of the TRK gene and favorable outcome in human neuroblastoma. N Engl J Med 1993, 328:847-54.
70. DJ Yamashiro, A Nakagawara, N Ikegaki, XG Liu, GM Brodeur: Expression of TrkC in favorable human neuroblastomas. Oncogene 1996, 12:37-41.
71. F Westermann, M Schwab: Genetic parameters of neuroblastomas. Cancer Lett 2002, 184:127-47.
72. MM van Noesel, R Versteeg: Pediatric neuroblastomas: genetic and epigenetic 'danse macabre'. Gene 2004, 325:1-15.
73. D Cox, C Yuncken, AI Spriggs: Minute Chromatin Bodies in Malignant Tumours of Childhood. Lancet 1965, 62:55-8.
74. JL Biedler, BA Spengler: A novel chromosome abnormality in human neuroblastoma and antifolate-resistant Chinese hamster cell lives in culture. J Natl Cancer Inst 1976, 57:683-95.
75. M Schwab, K Alitalo, KH Klempnauer, HE Varmus, JM Bishop, F Gilbert, G Brodeur, M Goldstein, J Trent: Amplified DNA with limited homology to myc cellular oncogene is shared by human neuroblastoma cell lines and a neuroblastoma tumour. Nature 1983, 305:245-8.
76. NE Kohl, N Kanda, RR Schreck, G Bruns, SA Latt, F Gilbert, FW Alt: Transposition and amplification of oncogene-related sequences in human neuroblastomas. Cell 1983, 35:359-67.
77. N Kanda, R Schreck, F Alt, G Bruns, D Baltimore, S Latt: Isolation of amplified DNA sequences from IMR-32 human neuroblastoma cells: facilitation by fluorescence-activated flow sorting of metaphase chromosomes. Proc Natl Acad Sci U S A 1983, 80:4069-73.
78. M Schwab: MYCN Amplification in Neuroblastoma: a Paradigm for the Clinical Use of an Oncogene. Pathol Oncol Res 1997, 3:3-7.
79. JM Ibson, PH Rabbitts: Sequence of a germ-line N-myc gene and amplification as a mechanism of activation. Oncogene 1988, 2:399-402.
80. MD Hogarty, GM Brodeur: Wild-type sequence of MYCN in neuroblastoma cell lines. Int J Cancer 1999, 80:630-1.
81. M Schwab, HE Varmus, JM Bishop: Human N-myc gene contributes to neoplastic transformation of mammalian cells in culture. Nature 1985, 316:160-2.
82. WA Weiss, K Aldape, G Mohapatra, BG Feuerstein, JM Bishop: Targeted expression of MYCN causes neuroblastoma in transgenic mice. Embo J 1997, 16:2985-95.
83. F Doz, M Peter, G Schleiermacher, P Vielh, P Validire, M Putterman, V Blanquet, L Desjardins, JL Dufier, JM Zucker, et al: N-MYC amplification, loss of heterozygosity on the short arm of chromosome 1 and DNA ploidy in retinoblastoma. Eur J Cancer 1996, 32A:645-9.
84. Y Mizukami, A Nonomura, T Takizawa, M Noguchi, T Michigishi, S Nakamura, T Ishizaki: N-myc protein expression in human breast carcinoma: prognostic implications. Anticancer Res 1995, 15:2899-905.
85. M Roncalli, G Viale, L Grimelius, H Johansson, E Wilander, RM Alfano, D Springall, PM Battezzati, JM Polak, G Coggi: Prognostic value of N-myc immunoreactivity in medullary thyroid carcinoma. Cancer 1994, 74:134-41.
86. J Boultwood, FS Wyllie, ED Williams, D Wynford-Thomas: N-myc expression in neoplasia of human thyroid C-cells. Cancer Res 1988, 48:4073-7.
87. D Driman, PS Thorner, ML Greenberg, S Chilton-MacNeill, J Squire: MYCN gene amplification in rhabdomyosarcoma. Cancer 1994, 73:2231-7.
88. CE Nesbit, JM Tersak, EV Prochownik: MYC oncogenes and human neoplastic disease. Oncogene 1999, 18:3004-16.
89. A Wenzel, M Schwab: The mycN/max protein complex in neuroblastoma. Short review. Eur J Cancer 1995, 31A:516-9.
90. PN Tonin, H Yeger, RL Stallings, PR Srinivasan, WH Lewis: Amplification of N-myc and ornithine decarboxylase genes in human neuroblastoma and hydroxyurea-resistant hamster cell lines. Oncogene 1989, 4:1117-21.
References 151
91. JM Shohet, MJ Hicks, SE Plon, SM Burlingame, S Stuart, SY Chen, MK Brenner, JG Nuchtern: Minichromosome maintenance protein MCM7 is a direct target of the MYCN transcription factor in neuroblastoma. Cancer Res 2002, 62:1123-8.
92. MD Norris, SB Bordow, PS Haber, GM Marshall, M Kavallaris, J Madafiglio, SL Cohn, H Salwen, ML Schmidt, DR Hipfner, et al: Evidence that the MYCN oncogene regulates MRP gene expression in neuroblastoma. Eur J Cancer 1997, 33:1911-6.
93. M Alaminos, J Mora, NK Cheung, A Smith, J Qin, L Chen, WL Gerald: Genome-wide analysis of gene expression associated with MYCN in human neuroblastoma. Cancer Res 2003, 63:4538-46.
94. J Vandesompele: Delineation of the heterogeneous pattern of genomic change and identification of differentially expressed genes in neuroblastoma. Ghent: Ghent University; 2002.
95. K Boon, HN Caron, R van Asperen, L Valentijn, MC Hermus, P van Sluis, I Roobeek, I Weis, PA Voute, M Schwab, et al: N-myc enhances the expression of a large set of genes functioning in ribosome biogenesis and protein synthesis. Embo J 2001, 20:1383-93.
96. A Lasorella, M Noseda, M Beyna, Y Yokota, A Iavarone: Id2 is a retinoblastoma protein target and mediates signalling by Myc oncoproteins. Nature 2000, 407:592-8.
97. A Lasorella, R Boldrini, C Dominici, A Donfrancesco, Y Yokota, A Inserra, A Iavarone: Id2 is critical for cellular proliferation and is the oncogenic effector of N-myc in human neuroblastoma. Cancer Res 2002, 62:301-6.
98. Q Wang, G Hii, S Shusterman, Y Mosse, CL Winter, C Guo, H Zhao, E Rappaport, MD Hogarty, JM Maris: ID2 expression is not associated with MYCN amplification or expression in human neuroblastomas. Cancer Res 2003, 63:1631-5.
99. J Vandesompele, A Edsjo, K De Preter, H Axelson, F Speleman, S Pahlman: ID2 expression in neuroblastoma does not correlate to MYCN levels and lacks prognostic value. Oncogene 2003, 22:456-60.
100. LC Amler, Y Shibasaki, L Savelyeva, M Schwab: Amplification of the N-myc gene in human neuroblastomas: tandemly repeated amplicons within homogeneously staining regions on different chromosomes with the retention of single copy gene at the resident site. Mutat Res 1992, 276:291-7.
101. BS Emanuel, G Balaban, JP Boyd, A Grossman, M Negishi, A Parmiter, MC Glick: N-myc amplification in multiple homogeneously staining regions in two human neuroblastomas. Proc Natl Acad Sci U S A 1985, 82:3736-40.
102. R Corvi, LC Amler, L Savelyeva, M Gehring, M Schwab: MYCN is retained in single copy at chromosome 2 band p23-24 during amplification in human neuroblastoma cells. Proc Natl Acad Sci U S A 1994, 91:5523-7.
103. CF Manohar, HR Salwen, GM Brodeur, SL Cohn: Co-amplification and concomitant high levels of expression of a DEAD box gene with MYCN in human neuroblastoma. Genes Chromosomes Cancer 1995, 14:196-203.
104. JA Squire, PS Thorner, S Weitzman, JD Maggi, P Dirks, J Doyle, M Hale, R Godbout: Co-amplification of MYCN and a DEAD box gene (DDX1) in primary neuroblastoma. Oncogene 1995, 10:1417-22.
105. K Wimmer, XX Zhu, BJ Lamb, R Kuick, PF Ambros, H Kovar, D Thoraval, S Motyka, JR Alberts, SM Hanash: Co-amplification of a novel gene, NAG, with the N-myc gene in neuroblastoma. Oncogene 1999, 18:233-8.
106. R Simon, R Atefy, U Wagner, T Forster, A Fijan, J Bruderer, K Wilber, MJ Mihatsch, T Gasser, G Sauter: HER-2 and TOP2A coamplification in urinary bladder cancer. Int J Cancer 2003, 107:764-72.
107. JS Coon, E Marcus, S Gupta-Burt, S Seelig, K Jacobson, S Chen, V Renta, G Fronda, HD Preisler: Amplification and overexpression of topoisomerase IIalpha predict response to anthracycline-based therapy in locally advanced breast cancer. Clin Cancer Res 2002, 8:1061-7.
108. P Kauraniemi, T Kuukasjarvi, G Sauter, A Kallioniemi: Amplification of a 280-kilobase core region at the ERBB2 locus leads to activation of two hypothetical proteins in breast cancer. Am J Pathol 2003, 163:1979-84.
109. P Kauraniemi, M Barlund, O Monni, A Kallioniemi: New amplified and highly expressed genes discovered in the ERBB2 amplicon in breast cancer by cDNA microarrays. Cancer Res 2001, 61:8235-40.
110. D Scott, J Elsden, A Pearson, J Lunec: Genes co-amplified with MYCN in neuroblastoma: silent passengers or co-determinants of phenotype? Cancer Lett 2003, 197:81-6.
References 152
111. J Vandesompele, N Van Roy, M Van Gele, G Laureys, P Ambros, P Heimann, C Devalck, E Schuuring, P Brock, J Otten, et al: Genetic heterogeneity of neuroblastoma studied by comparative genomic hybridization. Genes Chromosomes Cancer 1998, 23:141-52.
112. ES Srivatsan, V Murali, RC Seeger: Loss of heterozygosity for alleles on chromosomes 11q and 14q in neuroblastoma. Prog Clin Biol Res 1991, 366:91-8.
113. SA Bader, C Fasching, GM Brodeur, EJ Stanbridge: Dissociation of suppression of tumorigenicity and differentiation in vitro effected by transfer of single human chromosomes into human neuroblastoma cells. Cell Growth Differ 1991, 2:245-55.
114. D Satge, SW Moore, CA Stiller, FK Niggli, K Pritchard-Jones, N Bown, J Benard, D Plantaz: Abnormal constitutional karyotypes in patients with neuroblastoma: a report of four new cases and review of 47 others in the literature. Cancer Genet Cytogenet 2003, 147:89-98.
115. JM Maris, C Guo, PS White, MD Hogarty, PM Thompson, DO Stram, R Gerbing, KK Matthay, RC Seeger, GM Brodeur: Allelic deletion at chromosome bands 11q14-23 is common in neuroblastoma. Med Pediatr Oncol 2001, 36:24-7.
116. Y Mosse, J Greshock, A King, D Khazi, BL Weber, JM Maris: Identification and high-resolution mapping of a constitutional 11q deletion in an infant with multifocal neuroblastoma. Lancet Oncol 2003, 4:769-71.
117. P Devilee, AM Cleton-Jansen, CJ Cornelisse: Ever since Knudson. Trends Genet 2001, 17:569-73.
118. GP Tonini, L Longo, S Coco, P Perri: Familial neuroblastoma: a complex heritable disease. Cancer Lett 2003, 197:41-5.
119. J Pelletier, W Bruening, FP Li, DA Haber, T Glaser, DE Housman: WT1 mutations contribute to abnormal genital system development and hereditary Wilms' tumour. Nature 1991, 353:431-4.
120. WK Cavenee, MF Hansen, M Nordenskjold, E Kock, I Maumenee, JA Squire, RA Phillips, BL Gallie: Genetic origin of mutations predisposing to retinoblastoma. Science 1985, 228:501-3.
121. JM Maris, MJ Weiss, Y Mosse, G Hii, C Guo, PS White, MD Hogarty, T Mirensky, GM Brodeur, TR Rebbeck, et al: Evidence for a hereditary neuroblastoma predisposition locus at chromosome 16p12-13. Cancer Res 2002, 62:6651-8.
122. MJ Weiss, C Guo, S Shusterman, G Hii, TL Mirensky, PS White, MD Hogarty, TR Rebbeck, D Teare, M Urbanek, et al: Localization of a hereditary neuroblastoma predisposition gene to 16p12-p13. Med Pediatr Oncol 2000, 35:526-30.
123. P Perri, L Longo, R Cusano, CM McConville, SA Rees, M Devoto, M Conte, GB Ferrara, M Seri, G Romeo, et al: Weak linkage at 4p16 to predisposition for human neuroblastoma. Oncogene 2002, 21:8356-60.
124. YP Mosse, M Laudenslager, D Khazi, AJ Carlisle, CL Winter, E Rappaport, JM Maris: Germline PHOX2B Mutation in Hereditary Neuroblastoma. Am J Hum Genet 2004, 75:727-30.
125. D Trochet, F Bourdeaut, I Janoueix-Lerosey, A Deville, L De Pontual, G Schleiermacher, C Coze, N Philip, T Frebourg, A Munnich, et al: Germline Mutations of the Paired-Like Homeobox 2B (PHOX2B) Gene in Neuroblastoma. Am J Hum Genet 2004, 74:761-4.
126. S Pahlman, F Hedborg: Development of the neural crest and sympathetic nervous system. In: Neuroblastoma Edited by GM Brodeur, T Sawada, Y Tsuchida, PA Voute, First ed. Amsterdam: Elsevier; 2000.
127. F Hedborg, R Ohlsson, B Sandstedt, L Grimelius, JC Hoehner, S Pahlman: IGF2 expression is a marker for paraganglionic/SIF cell differentiation in neuroblastoma. Am J Pathol 1995, 146:833-47.
128. C Gestblom, JC Hoehner, F Hedborg, B Sandstedt, S Pahlman: In vivo spontaneous neuronal to neuroendocrine lineage conversion in a subset of neuroblastomas. Am J Pathol 1997, 150:107-17.
129. RA Ross, JL Biedler, BA Spengler: A role for distinct cell types in determining malignancy in human neuroblastoma cell lines and tumors. Cancer Lett 2003, 197:35-9.
130. RA Ross, BA Spengler, C Domenech, M Porubcin, WJ Rettig, JL Biedler: Human neuroblastoma I-type cells are malignant neural crest stem cells. Cell Growth Differ 1995, 6:449-56.
131. LS Gammill, M Bronner-Fraser: Neural crest specification: migrating into genomics. Nat Rev Neurosci 2003, 4:795-805.
References 153
132. HY Lee, M Kleber, L Hari, V Brault, U Suter, MM Taketo, R Kemler, L Sommer: Instructive role of Wnt/beta-catenin in sensory fate specification in neural crest stem cells. Science 2004, 303:1020-3.
133. M Bronner-Fraser: Development. Making sense of the sensory lineage. Science 2004, 303:966-8.
134. KK Johe, TG Hazel, T Muller, MM Dugich-Djordjevic, RD McKay: Single factors direct the differentiation of stem cells from the fetal and adult central nervous system. Genes Dev 1996, 10:3129-40.
135. R Yavari, C Adida, P Bray-Ward, M Brines, T Xu: Human metalloprotease-disintegrin Kuzbanian regulates sympathoadrenal cell fate in development and neoplasia. Hum Mol Genet 1998, 7:1161-7.
136. L Lei, L Ma, S Nef, T Thai, LF Parada: mKlf7, a potential transcriptional regulator of TrkA nerve growth factor receptor expression in sensory and sympathetic neurons. Development 2001, 128:1147-58.
137. F Laub, R Aldabe, V Friedrich, Jr., S Ohnishi, T Yoshida, F Ramirez: Developmental expression of mouse Kruppel-like transcription factor KLF7 suggests a potential role in neurogenesis. Dev Biol 2001, 233:305-18.
138. F Laub, R Aldabe, F Ramirez, S Friedman: Embryonic expression of Kruppel-like factor 6 in neural and non-neural tissues. Mech Dev 2001, 106:167-70.
139. N Bertrand, DS Castro, F Guillemot: Proneural genes and the specification of neural cell types. Nat Rev Neurosci 2002, 3:517-30.
140. AK Knecht, M Bronner-Fraser: Induction of the neural crest: a multigene process. Nat Rev Genet 2002, 3:453-61.
141. NM Le Douarin, E Dupin: Multipotentiality of the neural crest. Curr Opin Genet Dev 2003, 13:529-36.
142. F Guillemot: Vertebrate bHLH genes and the determination of neuronal fates. Exp Cell Res 1999, 253:357-64.
143. V Sriuranpong, MW Borges, CL Strock, EK Nakakura, DN Watkins, CM Blaumueller, BD Nelkin, DW Ball: Notch signaling induces rapid degradation of achaete-scute homolog 1. Mol Cell Biol 2002, 22:3129-39.
144. J Aruga, T Tohmonda, S Homma, K Mikoshiba: Zic1 promotes the expansion of dorsal neural progenitors in spinal cord by inhibiting neuronal differentiation. Dev Biol 2002, 244:329-41.
145. AV Molofsky, R Pardal, T Iwashita, IK Park, MF Clarke, SJ Morrison: Bmi-1 dependence distinguishes neural stem cell self-renewal from progenitor proliferation. Nature 2003, 425:962-7.
146. MR Hirsch, MC Tiveron, F Guillemot, JF Brunet, C Goridis: Control of noradrenergic differentiation and Phox2a expression by MASH1 in the central and peripheral nervous system. Development 1998, 125:599-608.
147. L Lo, MC Tiveron, DJ Anderson: MASH1 activates expression of the paired homeodomain transcription factor Phox2a, and couples pan-neuronal and subtype-specific components of autonomic neuronal identity. Development 1998, 125:609-20.
148. A Flora, H Lucchetti, R Benfante, C Goridis, F Clementi, D Fornasari: Sp proteins and Phox2b regulate the expression of the human Phox2a gene. J Neurosci 2001, 21:7037-45.
149. SJ Hong, CH Kim, KS Kim: Structural and functional characterization of the 5' upstream promoter of the human Phox2a gene: possible direct transactivation by transcription factor Phox2b. J Neurochem 2001, 79:1225-36.
150. N Grillet, V Dubreuil, HD Dufour, JF Brunet: Dynamic expression of RGS4 in the developing nervous system and regulation by the neural type-specific transcription factor Phox2b. J Neurosci 2003, 23:10613-21.
151. A Edsjo, H Nilsson, J Vandesompele, J Karlsson, F Pattyn, LA Culp, F Speleman, S Pahlman: Neuroblastoma cells with overexpressed MYCN retain their capacity to undergo neuronal differentiation. Lab Invest 2004, 84:406-17.
152. L Ma, J Merenmies, LF Parada: Molecular characterization of the TrkA/NGF receptor minimal enhancer reveals regulation by multiple cis elements to drive embryonic neuron expression. Development 2000, 127:3777-88.
153. A Riccio, BA Pierchala, CL Ciarallo, DD Ginty: An NGF-TrkA-mediated retrograde signal to transcription factor CREB in sympathetic neurons. Science 1997, 277:1097-100.
References 154
154. DR Kaplan, FD Miller: Neurotrophin signal transduction in the nervous system. Curr Opin Neurobiol 2000, 10:381-91.
155. FG Barr: Chromosomal translocations involving paired box transcription factors in human cancer. Int J Biochem Cell Biol 1997, 29:1449-61.
156. S Pelengaris, M Khan, G Evan: c-MYC: more than just a matter of life and death. Nat Rev Cancer 2002, 2:764-76.
157. JD Norton: ID helix-loop-helix proteins in cell growth, differentiation and tumorigenesis. J Cell Sci 2000, 113 ( Pt 22):3897-905.
158. HA Sikder, MK Devlin, S Dunlap, B Ryu, RM Alani: Id proteins in cell growth and tumorigenesis. Cancer Cell 2003, 3:525-30.
159. G Narla, KE Heath, HL Reeves, D Li, LE Giono, AC Kimmelman, MJ Glucksman, J Narla, FJ Eng, AM Chan, et al: KLF6, a candidate tumor suppressor gene mutated in prostate cancer. Science 2001, 294:2563-6.
160. W Zhao, IM Hisamuddin, MO Nandan, BA Babbin, NE Lamb, VW Yang: Identification of Kruppel-like factor 4 as a potential tumor suppressor gene in colorectal cancer. Oncogene 2004, 23:395-402.
161. D Geerts, N Schilderink, G Jorritsma, R Versteeg: The role of the MEIS homeobox genes in neuroblastoma. Cancer Lett 2003, 197:87-92.
162. J Park, K Park, S Kim, JH Lee: Msx1 gene overexpression induces G1 phase cell arrest in human ovarian cancer cell line OVCAR3. Biochem Biophys Res Commun 2001, 281:1234-40.
163. C Takahashi, N Akiyama, H Kitayama, S Takai, M Noda: Possible involvement of MSX-2 homeoprotein in v-ras-induced transformation. Leukemia 1997, 11 Suppl 3:340-3.
164. C Leung, M Lingbeek, O Shakhova, J Liu, E Tanger, P Saremaslani, M Van Lohuizen, S Marino: Bmi1 is essential for cerebellar development and is overexpressed in human medulloblastomas. Nature 2004, 428:337-41.
165. A Jogi, I Ora, H Nilsson, A Lindeheim, Y Makino, L Poellinger, H Axelson, S Pahlman: Hypoxia alters gene expression in human neuroblastoma cells toward an immature and neural crest-like phenotype. Proc Natl Acad Sci U S A 2002, 99:7021-6.
166. F Hedborg, G Franklin, J Norrman, L Grimelius, E Wassberg, B Hero, F Schilling, F Berthold, D Harms, B Sandstedt: Evidence of chromaffin oxygen sensing in neuroblastoma. Med Pediatr Oncol 2001, 36:149-53.
167. JC Hoehner, K Prabhakaran: Induced differentiation affords neuroblastoma cells protection from hypoxic injury. J Pediatr Surg 2003, 38:1069-74.
168. A Jogi, I Ora, H Nilsson, L Poellinger, H Axelson, S Pahlman: Hypoxia-induced dedifferentiation in neuroblastoma cells. Cancer Lett 2003, 197:145-50.
169. A Jogi, J Vallon-Christersson, L Holmquist, H Axelson, A Borg, S Pahlman: Human neuroblastoma cells exposed to hypoxia: induction of genes associated with growth, survival, and aggressive behavior. Exp Cell Res 2004, 295:469-87.
170. MJ Cooper, GM Hutchins, MA Israel: Histogenesis of the human adrenal medulla. An evaluation of the ontogeny of chromaffin and nonchromaffin lineages. Am J Pathol 1990, 137:605-15.
171. MJ Cooper, SM Steinberg, J Chatten, AE Evans, MA Israel: Plasticity of neuroblastoma tumor cells to differentiate along a fetal adrenal ganglionic lineage predicts for improved patient survival. J Clin Invest 1992, 90:2402-8.
172. Y Liang, ZK Mirnics, C Yan, KD Nylander, NF Schor: Bcl-2 mediates induction of neural differentiation. Oncogene 2003, 22:5515-8.
173. JC Hoehner, F Hedborg, HJ Wiklund, L Olsen, S Pahlman: Cellular death in neuroblastoma: in situ correlation of apoptosis and bcl-2 expression. Int J Cancer 1995, 62:19-24.
174. JC Hoehner, L Olsen, B Sandstedt, DR Kaplan, S Pahlman: Association of neurotrophin receptor expression and differentiation in human neuroblastoma. Am J Pathol 1995, 147:102-13.
175. PM Nederlof, S van der Flier, J Wiegant, AK Raap, HJ Tanke, JS Ploem, M van der Ploeg: Multiple fluorescence in situ hybridization. Cytometry 1990, 11:126-31.
176. T Cremer, J Landegent, A Bruckner, HP Scholl, M Schardin, HD Hager, P Devilee, P Pearson, M van der Ploeg: Detection of chromosome aberrations in the human interphase nucleus by visualization of specific target DNAs with radioactive and non-radioactive in situ hybridization techniques: diagnosis of trisomy 18 with probe L1.84. Hum Genet 1986, 74:346-52.
References 155
177. MR Speicher, S Gwyn Ballard, DC Ward: Karyotyping human chromosomes by combinatorial multi-fluor FISH. Nat Genet 1996, 12:368-75.
178. N Van Roy, H Van Limbergen, J Vandesompele, M Van Gele, B Poppe, G Laureys, A De Paepe, F Speleman: Chromosome 2 short arm translocations revealed by M-FISH analysis of neuroblastoma cell lines. Med Pediatr Oncol 2000, 35:538-40.
179. H Van Limbergen, HB Beverloo, E van Drunen, A Janssens, K Hahlen, B Poppe, N Van Roy, P Marynen, A De Paepe, R Slater, et al: Molecular cytogenetic and clinical findings in ETV6/ABL1-positive leukemia. Genes Chromosomes Cancer 2001, 30:274-82.
180. E Schrock, S du Manoir, T Veldman, B Schoell, J Wienberg, MA Ferguson-Smith, Y Ning, DH Ledbetter, I Bar-Am, D Soenksen, et al: Multicolor spectral karyotyping of human chromosomes. Science 1996, 273:494-7.
181. A Kallioniemi, OP Kallioniemi, D Sudar, D Rutovitz, JW Gray, F Waldman, D Pinkel: Comparative genomic hybridization for molecular cytogenetic analysis of solid tumors. Science 1992, 258:818-21.
182. S Knuutila, K Autio, Y Aalto: Online access to CGH data of DNA sequence copy number changes. Am J Pathol 2000, 157:689.
183. TL Wang, LA Diaz, Jr., K Romans, A Bardelli, S Saha, G Galizia, M Choti, R Donehower, G Parmigiani, M Shih Ie, et al: Digital karyotyping identifies thymidylate synthase amplification as a mechanism of resistance to 5-fluorouracil in metastatic colorectal cancer patients. Proc Natl Acad Sci U S A 2004, 101:3089-94.
184. TL Wang, C Maierhofer, MR Speicher, C Lengauer, B Vogelstein, KW Kinzler, VE Velculescu: Digital karyotyping. Proc Natl Acad Sci U S A 2002, 99:16156-61.
185. GR Bignell, J Huang, J Greshock, S Watt, A Butler, S West, M Grigorova, KW Jones, W Wei, MR Stratton, et al: High-resolution analysis of DNA copy number using oligonucleotide microarrays. Genome Res 2004, 14:287-95.
186. X Zhou, C Li, SC Mok, Z Chen, DT Wong: Whole genome loss of heterozygosity profiling on oral squamous cell carcinoma by high-density single nucleotide polymorphic allele (SNP) array. Cancer Genet Cytogenet 2004, 151:82-4.
187. R Lucito, J Healy, J Alexander, A Reiner, D Esposito, M Chi, L Rodgers, A Brady, J Sebat, J Troge, et al: Representational oligonucleotide microarray analysis: a high-resolution method to detect genome copy number variation. Genome Res 2003, 13:2291-305.
188. EN Noensie, HC Dietz: A strategy for disease gene identification through nonsense-mediated mRNA decay inhibition. Nat Biotechnol 2001, 19:434-9.
189. PA Jones, SB Baylin: The fundamental role of epigenetic events in cancer. Nat Rev Genet 2002, 3:415-28.
190. H Cedar, A Solage, G Glaser, A Razin: Direct detection of methylated cytosine in DNA by use of the restriction enzyme MspI. Nucleic Acids Res 1979, 6:2125-32.
191. JG Herman, JR Graff, S Myohanen, BD Nelkin, SB Baylin: Methylation-specific PCR: a novel PCR assay for methylation status of CpG islands. Proc Natl Acad Sci U S A 1996, 93:9821-6.
192. SJ Clark, J Harrison, CL Paul, M Frommer: High sensitivity mapping of methylated cytosines. Nucleic Acids Res 1994, 22:2990-7.
193. TH Huang, MR Perry, DE Laux: Methylation profiling of CpG islands in human breast cancer cells. Hum Mol Genet 1999, 8:459-70.
194. P Liang, AB Pardee: Analysing differential gene expression in cancer. Nat Rev Cancer 2003, 3:869-76.
195. LJ van 't Veer, H Dai, MJ van de Vijver, YD He, AA Hart, M Mao, HL Peterse, K van der Kooy, MJ Marton, AT Witteveen, et al: Gene expression profiling predicts clinical outcome of breast cancer. Nature 2002, 415:530-6.
196. SM Dhanasekaran, TR Barrette, D Ghosh, R Shah, S Varambally, K Kurachi, KJ Pienta, MA Rubin, AM Chinnaiyan: Delineation of prognostic biomarkers in prostate cancer. Nature 2001, 412:822-6.
197. T Sorlie, CM Perou, R Tibshirani, T Aas, S Geisler, H Johnsen, T Hastie, MB Eisen, M van de Rijn, SS Jeffrey, et al: Gene expression patterns of breast carcinomas distinguish tumor subclasses with clinical implications. Proc Natl Acad Sci U S A 2001, 98:10869-74.
198. A Bhattacharjee, WG Richards, J Staunton, C Li, S Monti, P Vasa, C Ladd, J Beheshti, R Bueno, M Gillette, et al: Classification of human lung carcinomas by mRNA expression profiling reveals distinct adenocarcinoma subclasses. Proc Natl Acad Sci U S A 2001, 98:13790-5.
References 156
199. ME Garber, OG Troyanskaya, K Schluens, S Petersen, Z Thaesler, M Pacyna-Gengelbach, M van de Rijn, GD Rosen, CM Perou, RI Whyte, et al: Diversity of gene expression in adenocarcinoma of the lung. Proc Natl Acad Sci U S A 2001, 98:13784-9.
200. AA Alizadeh, MB Eisen, RE Davis, C Ma, IS Lossos, A Rosenwald, JC Boldrick, H Sabet, T Tran, X Yu, et al: Distinct types of diffuse large B-cell lymphoma identified by gene expression profiling. Nature 2000, 403:503-11.
201. EJ Yeoh, ME Ross, SA Shurtleff, WK Williams, D Patel, R Mahfouz, FG Behm, SC Raimondi, MV Relling, A Patel, et al: Classification, subtype discovery, and prediction of outcome in pediatric acute lymphoblastic leukemia by gene expression profiling. Cancer Cell 2002, 1:133-43.
202. TR Golub, DK Slonim, P Tamayo, C Huard, M Gaasenbeek, JP Mesirov, H Coller, ML Loh, JR Downing, MA Caligiuri, et al: Molecular classification of cancer: class discovery and class prediction by gene expression monitoring. Science 1999, 286:531-7.
203. M Van Gele, GM Boyle, AL Cook, J Vandesompele, T Boonefaes, P Rottiers, N Van Roy, A De Paepe, PG Parsons, JH Leonard, et al: Gene-expression profiling reveals distinct expression patterns for Classic versus Variant Merkel cell phenotypes and new classifier genes to distinguish Merkel cell from small-cell lung carcinoma. Oncogene 2004, 23:2732-42.
204. VE Velculescu, L Zhang, B Vogelstein, KW Kinzler: Serial analysis of gene expression. Science 1995, 270:484-7.
205. P Liang: SAGE Genie: a suite with panoramic view of gene expression. Proc Natl Acad Sci U S A 2002, 99:11547-8.
206. K Boon, EC Osorio, SF Greenhut, CF Schaefer, J Shoemaker, K Polyak, PJ Morin, KH Buetow, RL Strausberg, SJ De Souza, et al: An anatomy of normal and malignant gene expression. Proc Natl Acad Sci U S A 2002, 99:11287-92.
207. R Higuchi, C Fockler, G Dollinger, R Watson: Kinetic PCR analysis: real-time monitoring of DNA amplification reactions. Biotechnology (N Y) 1993, 11:1026-30.
208. A Hoos, C Cordon-Cardo: Tissue microarray profiling of cancer specimens and cell lines: opportunities and limitations. Lab Invest 2001, 81:1331-8.
209. RJ Simpson, DS Dorow: Cancer proteomics: from signaling networks to tumor markers. Trends Biotechnol 2001, 19:S40-8.
210. SP Gygi, B Rist, SA Gerber, F Turecek, MH Gelb, R Aebersold: Quantitative analysis of complex protein mixtures using isotope-coded affinity tags. Nat Biotechnol 1999, 17:994-9.
211. H Zhou, S Roy, H Schulman, MJ Natan: Solution and chip arrays in protein profiling. Trends Biotechnol 2001, 19:S34-9.
212. TR Brummelkamp, R Bernards: New tools for functional mammalian cancer genetics. Nat Rev Cancer 2003, 3:781-9.
213. DM Dykxhoorn, CD Novina, PA Sharp: Killing the messenger: short RNAs that silence gene expression. Nat Rev Mol Cell Biol 2003, 4:457-67.
214. K Berns, EM Hijmans, J Mullenders, TR Brummelkamp, A Velds, M Heimerikx, RM Kerkhoven, M Madiredjo, W Nijkamp, B Weigelt, et al: A large-scale RNAi screen in human cells identifies new components of the p53 pathway. Nature 2004, 428:431-7.
215. MR Emmert-Buck, RF Bonner, PD Smith, RF Chuaqui, Z Zhuang, SR Goldstein, RA Weiss, LA Liotta: Laser capture microdissection. Science 1996, 274:998-1001.
216. A Brazma, P Hingamp, J Quackenbush, G Sherlock, P Spellman, C Stoeckert, J Aach, W Ansorge, CA Ball, HC Causton, et al: Minimum information about a microarray experiment (MIAME)-toward standards for microarray data. Nat Genet 2001, 29:365-71.
217. L Liotta, E Petricoin: Molecular profiling of human cancer. Nat Rev Genet 2000, 1:48-56. 218. V Luzzi, V Holtschlag, MA Watson: Expression profiling of ductal carcinoma in situ by
laser capture microdissection and high-density oligonucleotide arrays. Am J Pathol 2001, 158:2005-10.
219. H Ohyama, X Zhang, Y Kohno, I Alevizos, M Posner, DT Wong, R Todd: Laser capture microdissection-generated target sample for high-density oligonucleotide array hybridization. Biotechniques 2000, 29:530-6.
220. JN McClintick, RE Jerome, CR Nicholson, DW Crabb, HJ Edenberg: Reproducibility of oligonucleotide arrays using small samples. BMC Genomics 2003, 4:4.
221. K Aoyagi, T Tatsuta, M Nishigaki, S Akimoto, C Tanabe, Y Omoto, S Hayashi, H Sakamoto, M Sakamoto, T Yoshida, et al: A faithful method for PCR-mediated global mRNA
References 157
amplification and its integration into microarray analysis on laser-captured cells. Biochem Biophys Res Commun 2003, 300:915-20.
222. V Luzzi, M Mahadevappa, R Raja, JA Warrington, MA Watson: Accurate and reproducible gene expression profiles from laser capture microdissection, transcript amplification, and high density oligonucleotide microarray analysis. J Mol Diagn 2003, 5:9-14.
223. M Kenzelmann, R Klaren, M Hergenhahn, M Bonrouhi, HJ Grone, W Schmid, G Schutz: High-accuracy amplification of nanogram total RNA amounts for gene profiling. Genomics 2004, 83:550-8.
224. D Gold, K Coombes, D Medhane, A Ramaswamy, Z Ju, L Strong, JS Koo, M Kapoor: A comparative analysis of data generated using two different target preparation methods for hybridization to high-density oligonucleotide microarrays. BMC Genomics 2004, 5:2.
225. D Bruder, M Probst-Kepper, AM Westendorf, R Geffers, S Beissert, K Loser, H von Boehmer, J Buer, W Hansen: Neuropilin-1: a surface marker of regulatory T cells. Eur J Immunol 2004, 34:623-30.
226. L McArdle, M McDermott, R Purcell, D Grehan, A O'Meara, F Breatnach, D Catchpoole, AC Culhane, I Jeffery, WM Gallagher, et al: Oligonucleotide microarray analysis of gene expression in neuroblastoma displaying loss of chromosome 11q. Carcinogenesis 2004.
227. IM Ambros, J Benard, M Boavida, N Bown, H Caron, V Combaret, J Couturier, C Darnfors, O Delattre, J Freeman-Edward, et al: Quality assessment of genetic markers used for therapy stratification. J Clin Oncol 2003, 21:2077-84.
228. I Bieche, M Olivi, MH Champeme, D Vidaud, R Lidereau, M Vidaud: Novel approach to quantitative polymerase chain reaction using real-time detection: application to the detection of gene amplification in breast cancer. Int J Cancer 1998, 78:661-6.
229. J Hoebeeck, R van der Luijt, E De Smet, N Yigit, B Poppe, C Claes, R Zewald, G-J de Jong, A De Paepe, F Speleman, et al: Rapid detection of VHL exon deletions using real-time quantitative PCR. Eur J Hum Genet submitted.
230. M Morowitz, S Shusterman, Y Mosse, G Hii, CL Winter, D Khazi, Q Wang, R King, JM Maris: Detection of single-copy chromosome 17q gain in human neuroblastomas using real-time quantitative polymerase chain reaction. Mod Pathol 2003, 16:1248-56.
231. F Ponchel, C Toomes, K Bransfield, FT Leong, SH Douglas, SL Field, SM Bell, V Combaret, A Puisieux, AJ Mighell, et al: Real-time PCR based on SYBR-Green I fluorescence: An alternative to the TaqMan assay for a relative quantification of gene rearrangements, gene amplifications and micro gene deletions. BMC Biotechnol 2003, 3:18.
232. I Hostein, M Pelmus, A Aurias, F Pedeutour, S Mathoulin-Pelissier, JM Coindre: Evaluation of MDM2 and CDK4 amplification by real-time PCR on paraffin wax-embedded material: a potential tool for the diagnosis of atypical lipomatous tumours/well-differentiated liposarcomas. J Pathol 2004, 202:95-102.
233. V Combaret, C Audoynaud, I Iacono, MC Favrot, M Schell, C Bergeron, A Puisieux: Circulating MYCN DNA as a tumor-specific marker in neuroblastoma patients. Cancer Res 2002, 62:3646-8.
234. CC Yen, YJ Chen, KH Lu, JY Hsia, JT Chen, CP Hu, PM Chen, JH Liu, TJ Chiou, WS Wang, et al: Genotypic analysis of esophageal squamous cell carcinoma by molecular cytogenetics and real-time quantitative polymerase chain reaction. Int J Oncol 2003, 23:871-81.
235. SW Kim, KS Lee, HS Jin, TM Lee, SK Koo, YJ Lee, SC Jung: Rapid detection of duplication/deletion of the PMP22 gene in patients with Charcot-Marie-Tooth disease Type 1A and hereditary neuropathy with liability to pressure palsy by real-time quantitative PCR using SYBR Green I dye. J Korean Med Sci 2003, 18:727-32.
236. J Cai, BK Goodman, AS Patel, JB Mulliken, L Van Maldergem, GE Hoganson, WA Paznekas, Z Ben-Neriah, R Sheffer, ML Cunningham, et al: Increased risk for developmental delay in Saethre-Chotzen syndrome is associated with TWIST deletions: an improved strategy for TWIST mutation screening. Hum Genet 2003, 114:68-76.
237. M Barrois, I Bieche, S Mazoyer, MH Champeme, B Bressac-de Paillerets, R Lidereau: Real-time PCR-based gene dosage assay for detecting BRCA1 rearrangements in breast-ovarian cancer families. Clin Genet 2004, 65:131-6.
238. F Chibon, O Mariani, J Derre, A Mairal, JM Coindre, L Guillou, X Sastre, F Pedeutour, A Aurias: ASK1 (MAP3K5) as a potential therapeutic target in malignant fibrous histiocytomas with 12q14-q15 and 6q23 amplifications. Genes Chromosomes Cancer 2004, 40:32-7.
References 158
239. YS Jin, H Ni, JM Laplaza, TW Jeffries: Optimal growth and ethanol production from xylose by recombinant Saccharomyces cerevisiae require moderate D-xylulokinase activity. Appl Environ Microbiol 2003, 69:495-503.
240. DK Scott, JR Board, X Lu, AD Pearson, RM Kenyon, J Lunec: The neuroblastoma amplified gene, NAG: genomic structure and characterisation of the 7.3 kb transcript predominantly expressed in neuroblastoma. Gene 2003, 307:1-11.
241. S Liu, SH Leppla: Cell surface tumor endothelium marker 8 cytoplasmic tail-independent anthrax toxin binding, proteolytic processing, oligomer formation, and internalization. J Biol Chem 2003, 278:5227-34.
242. EB Carson-Walter, DN Watkins, A Nanda, B Vogelstein, KW Kinzler, B St Croix: Cell surface tumor endothelial markers are conserved in mice and humans. Cancer Res 2001, 61:6649-55.
243. A Nanda, B St Croix: Tumor endothelial markers: new targets for cancer therapy. Curr Opin Oncol 2004, 16:44-9.
244. T Iwahara, J Fujimoto, D Wen, R Cupples, N Bucay, T Arakawa, S Mori, B Ratzkin, T Yamamoto: Molecular characterization of ALK, a receptor tyrosine kinase expressed specifically in the nervous system. Oncogene 1997, 14:439-49.
245. WG Dirks, S Fahnrich, Y Lis, E Becker, RA MacLeod, HG Drexler: Expression and functional analysis of the anaplastic lymphoma kinase (ALK) gene in tumor cell lines. Int J Cancer 2002, 100:49-56.
246. L Lamant, K Pulford, D Bischof, SW Morris, DY Mason, G Delsol, B Mariame: Expression of the ALK tyrosine kinase gene in neuroblastoma. Am J Pathol 2000, 156:1711-21.
247. I Miyake, Y Hakomori, A Shinohara, T Gamou, M Saito, A Iwamatsu, R Sakai: Activation of anaplastic lymphoma kinase is responsible for hyperphosphorylation of ShcC in neuroblastoma cell lines. Oncogene 2002, 21:5823-34.
248. C Guo, PS White, MJ Weiss, MD Hogarty, PM Thompson, DO Stram, R Gerbing, KK Matthay, RC Seeger, GM Brodeur, et al: Allelic deletion at 11q23 is common in MYCN single copy neuroblastomas. Oncogene 1999, 18:4948-57.
249. HP Neumann, B Bausch, SR McWhinney, BU Bender, O Gimm, G Franke, J Schipper, J Klisch, C Altehoefer, K Zerres, et al: Germ-line mutations in nonsyndromic pheochromocytoma. N Engl J Med 2002, 346:1459-66.
250. BE Baysal, RE Ferrell, JE Willett-Brozick, EC Lawrence, D Myssiorek, A Bosch, A van der Mey, PE Taschner, WS Rubinstein, EN Myers, et al: Mutations in SDHD, a mitochondrial complex II gene, in hereditary paraganglioma. Science 2000, 287:848-51.
251. C Sers, K Kirsch, U Rothbacher, G Riethmuller, JP Johnson: Genomic organization of the melanoma-associated glycoprotein MUC18: implications for the evolution of the immunoglobulin domains. Proc Natl Acad Sci U S A 1993, 90:8514-8.
252. C Sers, G Riethmuller, JP Johnson: MUC18, a melanoma-progression associated molecule, and its potential role in tumor vascularization and hematogenous spread. Cancer Res 1994, 54:5689-94.
253. M Kuramochi, H Fukuhara, T Nobukuni, T Kanbe, T Maruyama, HP Ghosh, M Pletcher, M Isomura, M Onizuka, T Kitamura, et al: TSLC1 is a tumor-suppressor gene in human non-small-cell lung cancer. Nat Genet 2001, 27:427-30.
254. L Daniel, C Bouvier, B Chetaille, J Gouvernet, A Luccioni, D Rossi, E Lechevallier, X Muracciole, C Coulange, D Figarella-Branger: Neural cell adhesion molecule expression in renal cell carcinomas: relation to metastatic behavior. Hum Pathol 2003, 34:528-32.
255. E Tezel, Y Kawase, S Takeda, K Oshima, A Nakao: Expression of neural cell adhesion molecule in pancreatic cancer. Pancreas 2001, 22:122-5.
256. J Roesler, E Srivatsan, F Moatamed, J Peters, EH Livingston: Tumor suppressor activity of neural cell adhesion molecule in colon carcinoma. Am J Surg 1997, 174:251-7.
257. P Fogar, D Basso, C Pasquali, M De Paoli, C Sperti, G Roveroni, S Pedrazzoli, M Plebani: Neural cell adhesion molecule (N-CAM) in gastrointestinal neoplasias. Anticancer Res 1997, 17:1227-30.
258. O Monni, S Knuutila: 11q deletions in hematological malignancies. Leuk Lymphoma 2001, 40:259-66.
259. U Cavallaro, G Christofori: Cell adhesion in tumor invasion and metastasis: loss of the glue is not enough. Biochim Biophys Acta 2001, 1552:39-45.
260. Y Murakami: Functional cloning of a tumor suppressor gene, TSLC1, in human non-small cell lung cancer. Oncogene 2002, 21:6936-48.
References 159
261. H Fukuhara, M Kuramochi, T Fukami, K Kasahara, M Furuhata, T Nobukuni, T Maruyama, K Isogai, T Sekiya, T Shuin, et al: Promoter methylation of TSLC1 and tumor suppression by its gene product in human prostate cancer. Jpn J Cancer Res 2002, 93:605-9.
262. M Allinen, L Peri, S Kujala, J Lahti-Domenici, K Outila, SM Karppinen, V Launonen, R Winqvist: Analysis of 11q21-24 loss of heterozygosity candidate target genes in breast cancer: indications of TSLC1 promoter hypermethylation. Genes Chromosomes Cancer 2002, 34:384-9.
263. T Honda, G Tamura, T Waki, Z Jin, K Sato, T Motoyama, S Kawata, W Kimura, S Nishizuka, Y Murakami: Hypermethylation of the TSLC1 gene promoter in primary gastric cancers and gastric cancer cell lines. Jpn J Cancer Res 2002, 93:857-60.
264. T Fukami, H Fukuhara, M Kuramochi, T Maruyama, K Isogai, M Sakamoto, S Takamoto, Y Murakami: Promoter methylation of the TSLC1 gene in advanced lung tumors and various cancer cell lines. Int J Cancer 2003, 107:53-9.
265. AB Hui, KW Lo, J Kwong, EC Lam, SY Chan, LS Chow, AS Chan, PM Teo, DP Huang: Epigenetic inactivation of TSLC1 gene in nasopharyngeal carcinoma. Mol Carcinog 2003, 38:170-8.
266. JC Lindsey, ME Lusher, JA Anderton, S Bailey, RJ Gilbertson, AD Pearson, DW Ellison, SC Clifford: Identification of tumour-specific epigenetic events in medulloblastoma development by hypermethylation profiling. Carcinogenesis 2004, 25:661-668.
267. G Tamura: Promoter methylation status of tumor suppressor and tumor-related genes in neoplastic and non-neoplastic gastric epithelia. Histol Histopathol 2004, 19:221-8.
268. BJ Druker, M Talpaz, DJ Resta, B Peng, E Buchdunger, JM Ford, NB Lydon, H Kantarjian, R Capdeville, S Ohno-Jones, et al: Efficacy and safety of a specific inhibitor of the BCR-ABL tyrosine kinase in chronic myeloid leukemia. N Engl J Med 2001, 344:1031-7.
269. I Nishisho, Y Nakamura, Y Miyoshi, Y Miki, H Ando, A Horii, K Koyama, J Utsunomiya, S Baba, P Hedge: Mutations of chromosome 5q21 genes in FAP and colorectal cancer patients. Science 1991, 253:665-9.
References 160
Summary Neuroblastoma is a tumour that displays a remarkably variable clinical course. This clinical variability
reflects the wide range of genetic aberrations that are observed in this tumour. Genetic subgroup
classification has lead to the identification of three neuroblastoma subtypes with strong predictive
power. Aggressive neuroblastomas can be subdivided in two subgroups, i.e. one characterised by the
presence of 17q-gain, 2p-amplification and 1p-deletion and the other with 17q-gain, 11q- and 3p-
deletion. Presently, for only one gene, i.e. the MYCN proto-oncogene, direct involvement in
neuroblastoma has been demonstrated. In order to further improve prognostic classification of
neuroblastoma and to develop molecular targeted therapies, a thorough understanding of the
described cellular mechanisms and pathways governing these processes is needed. This thesis is part
of a neuroblastoma research platform that aims to contribute to the achievement of this goal.
One of the major goals of this thesis was the collection and expression profiling of normal
neuroblastoma progenitor cells. Analysis of molecular pathways of these progenitor cells will provide
information about the genes that are involved in normal neuroblast and neuroblastoma development.
In order to isolate normal neuroblast cells from foetal adrenal glands, a number of technical hurdles
had to be taken. First, laser capture microdissection was introduced in order to be able to collect the
small islets of neuroblasts in foetal adrenals. Second, optimisation of standard protocols for tissue
handling was necessary in order to preserve RNA integrity during the process of laser capture
microdissection and RNA isolation. This finally culminated in the collection of sufficient RNA of good
quality from microdissected foetal neuroblasts. After a two-round labelling protocol, amplified RNA
could be hybridised to HG-U133A chip arrays and lead to a successful unprecedented whole
transcriptome analysis of the normal neuroblasts. Quality control of the expression data showed that
these data were valid and can be used as standard control for future expression profiling studies.
In the second part of the thesis, we successfully implemented a real-time quantitative PCR approach
for the assessment of MYCN amplification as a second independent method in addition to
fluorescence in situ hybridisation. As the consensus region of 2p-amplification in neuroblastoma
harbours only the MYCN gene, the role of most co-amplified genes in neuroblastoma has been
questioned. However, since co-amplified genes may contribute to tumour phenotype and behaviour,
we developed a methodology based on subtractive cloning and cDNA microarrays to dissect the 2p-
amplicon. This approach was shown to be highly efficient leading to identification of genes known to
be amplified as determined by various other methods, and new genes that are amplified and
overexpressed in neuroblastoma and potentially are involved in the aggressive neuroblastoma
phenotype.
Summary 161
In the third part of the thesis, we describe the results of the study of an 11q candidate tumour
suppressor gene and further attempts to refine the shortest region of overlap for 11q-deletions. In a
first study, positional and functional candidate gene SDHD was investigated using high-throughput
mutation screening through denaturing high-performance liquid chromatography. Additional extensive
analysis on the transcriptional, functional and proteome level did not provide evidence for a two-hit
involvement of tumour suppressor SDHD. However, a contribution to the neuroblastoma phenotype
due to haploinsufficiency is not excluded and needs further study. In the second approach to search
for 11q tumour suppressor genes, we used a model system of a neuroblastoma cell line with 11q-
deletion in which a chromosome 11 was transferred. In-depth analysis of this model system has lead
to the identification of a region on 11q25 and a segment on 11p that may be involved in
(de)differentiation and possibly harbours interesting neuroblastoma genes.
In conclusion, this thesis reports the introduction, optimisation and application of several new cutting
edge high-throughput technologies for the identification of genes involved in aggressive
neuroblastomas. Most interestingly, we have provided a reliable expression profile of neuroblastoma
progenitor cells that will uncover the mechanisms that lead to neuroblastoma oncogenesis and that will
become essential to include in all future neuroblastoma expression profiling studies.
Summary 162
Résumé Le neuroblastome est une tumeur maligne qui se présente avec une clinique très variée. Cette
diversité est en relation avec la présence de certains marqueurs biologiques et moléculaires. La
classification génétique différencie trois sous-groupes précis de neuroblastomes avec valeur
pronostique. Dans le groupe de neuroblastomes agressifs deux sous-groupes se distinguent, le
premier se caractérise par la présence d’une amplification en 2p, d’un gain en 17q et d’une perte en
1p, le second par un gain en 17q et une perte en 11q et en 3p. Actuellement, seul le gène MYCN, un
proto-oncogène, est reconnu pour être impliqué directement dans le neuroblastome. Notre but est
d’améliorer la classification pronostique et de développer des traitements nouveaux avec une cible
moléculaire. A cette fin, une étude des mécanismes d’action permettra de déterminer de façon précise
l’origine des cellules malignes. Le travail fait partie de la recherche expérimentale sur le
neuroblastome du Centre Génétique de l’Hôpital Universitaire de Gand.
Un des objectifs les plus importants de ce travail est de prélever des cellules progeniteur du
neuroblastome et d’analyser le transcriptome. L’analyse moléculaire des mécanismes génétiques et
biologiques de ces cellules peut aboutir à la caractérisation des gènes responsables du
développement des neuroblastes et neuroblastomes. Différentes stratégies techniques ont abouties à
isoler des neuroblastes normaux des glandes surrénales du fœtus. En premier lieu, la microdissection
au système laser permet d’isoler des îles de neuroblastes d’adrenales fœtales. Grâce à
l’optimalisation d’un protocole standard l’intégrité de l’ARN est préservée durant la microdissection et
l’isolation de l’ARN. Ceci résulte en la collection d’ARN de bonne qualité. Un protocole de
démarquage en deux cycles a permis d’hybrider l’ARN amplifié au micropuces HG-U133A et l’analyse
de puces transcriptome de neuroblastes normaux pour la première fois en recherche sur
neuroblastome. Un contrôle de qualité démontre que les résultats sont validés et que ceux-ci peuvent
être utilisés comme matériel de référence pour d’autres études d’expression en neuroblastome.
Dans la seconde partie de ce travail nous développons avec succès une approche PCR quantitative à
temps réel complémentaire à la FISH et cette méthode permet de déterminer l’amplification du MYCN.
Partant du consensus que dans le neuroblastome la région d’amplification en 2p ne concerne que
l’oncogène MYCN, le rôle d’autres gènes impliqués reste a élucider. Sachant que d’autres gènes dans
l’amplicon pourraient être responsables du développement tumoral nous avons mis au point une
approche soustractive de clonage et de micropuces cADN pour dissection de l’amplicon en 2p. Cette
approche s’est prouvée très productive dans l’identification de gènes amplifiés connus, mais aussi
dans la caractérisation de nouveaux gènes qui peuvent être impliqués dans la formation de
neuroblastomes agressifs.
Résumé 163
En troisième lieu nous avons étudié un gène candidat suppresseur de tumeur en 11q et avons
caractérisé la plus petite région des délétions en 11q. Nous avons d’abord étudié le gène candidat
fonctionnel et positionnel SDHD par chromatographie dénaturant en liquide. Ensuite nous avons fait
une étude approfondie de ce gène suppresseur de tumeur au niveau fonctionnel, transcriptionnel et
protéique, mais cette étude ne démontre pas le mécanisme de gène suppresseur de tumeur basé sur

l’hypothèse de Knudson. Pourtant, il est supposé que l’haplo-insuffisance peut influencer le
phénotype, ce qui est encore à étudier. Pour la seconde approche nous avons employé un modèle
pour les gènes suppresseurs en utilisant une lignée cellulaire de neuroblastome avec une perte de
11q en y incorporant un chromosome 11. L’analyse détaillée de ce modèle nous a amené à
l’identification de la région sur 11q25 et 11p probablement impliquée dans la (dé)différentiation et
contenant des gènes intéressants du neuroblastome.
En conclusion, cette thèse rapporte l’introduction, l’optimisation et l’application de nouvelles
technologies pour l’identification de gènes impliqués dans la formation de neuroblastomes agressifs.
L’importance de ce travail est l’élaboration du profil d’expression de cellules progeniteur de
neuroblastome qui élucidera le mécanisme aboutissant à l’oncogenèse du neuroblastome et qui sera
indispensable dans l’analyse du profil d’expression de gènes du neuroblastome dans l’avenir.
Résumé 164

Samenvatting Neuroblastoom is een tumor met een zeer merkwaardig variabel klinisch verloop. Deze variabiliteit
reflecteert zich in het grote aantal genetische afwijkingen die waargenomen worden in deze tumor.
Genetische subgroep classificatie heeft geleid tot de identificatie van drie neuroblastoom subtypes met
een sterke prognostische waarde. Agressieve neuroblastomen kunnen onderverdeeld worden in twee
subgroepen, nl. één gekarakteriseerd door de aanwezigheid van 17q-aanwinst, 2p-amplificatie en 1p-
deletie en de andere door 17q-aanwinst, 11q- en 3p-deletie. Momenteel is er voor één enkel gen, nl.
het MYCN proto-oncogen, directe betrokkenheid in neuroblastoom aangetoond. Om de prognostische
classificatie van neuroblastoom te verbeteren en moleculair gerichte therapieën te ontwikkelen, zijn
inzichten in de beschreven cellulaire mechanismen en signaaltransductiewegen die deze processen
controleren noodzakelijk. Deze thesis maakt deel uit van het neuroblastoom onderzoeksplatform die
deze doelstellingen tracht waar te maken.
Eén van de belangrijkste doelstellingen van deze thesis was de collectie en expressie profilering van
de normale neuroblastoom voorloper cellen. Analyse van de moleculaire signaaltransductiewegen van
deze voorloper cellen zal ons informatie verschaffen over de genen die betrokken zijn in normale
neuroblast en neuroblastoom ontwikkeling. Met het doel de normale neuroblast cellen te isoleren uit
foetale bijnieren, moesten enkele technische problemen omzeild worden. Ten eerste, werd de ‘laser
capture microdissection’ technologie geïntroduceerd om kleine eilanden van neuroblast cellen te
collecteren uit foetale bijnieren. Ten tweede, was optimalisatie van een standaard protocols voor
snijden en kleuren van de weefselcoupes noodzakelijk om de RNA integriteit tijdens het proces van
‘laser capture microdissection’ en RNA isolatie te garanderen. Uiteindelijk leidde dit tot de collectie van
voldoende foetaal neuroblast RNA van goede kwaliteit. Na een twee-ronde labellingsprotocol, werd
het geamplificeerd RNA gehybridiseerd op een HG-U133A chip en leidde voor de eerste keer in het
neuroblastoom onderzoek tot de succesvolle analyse van het volledige transcriptoom van normale
neuroblasten. Kwaliteitscontrole van de expressie data toonde aan dat deze data zeer geschikt zijn en
kunnen gebruikt worden als standaard controle voor toekomstige expressie profileringstudies.
In het tweede deel van de thesis, werd de ‘real-time’ kwantitatieve PCR’ techniek succesvol
geïmplementeerd voor de bepaling van MYCN amplificatie als een tweede onafhankelijke methode in
parallel met FISH (fluorescentie in situ hybridisatie). Omdat de consensus regio voor 2p-amplificatie in
neuroblastoom enkel het MYCN gen omvat, wordt de rol van de meeste gecoamplificeerde genen in
neuroblastoom in vraag gesteld. Omdat gecoamplificeerde genen toch kunnen bijdragen in het tumor
fenotype of gedrag, hebben we een methodologie ontwikkeld gebaseerd op subtractieve klonering
gecombineerd met ‘arrayCGH’ voor de dissectie van amplicons. Deze benadering bleek zeer efficiënt
te zijn en leidde tot de identificatie van reeds gekende geamplificeerde genen (geïdentificeerd met
andere technologieën), alsook nieuwe genen die geamplificeerd en tot overexpressie komen in
neuroblastoom en mogelijk betrokken zijn in het fenotype van agressieve neuroblastomen.
Samenvatting 165

In het derde onderdeel van deze thesis, rapporteren we de resultaten van de studie van een kandidaat
tumor suppressorgen op 11q en verdere pogingen om de kleinste regio van overlap voor 11q-deleties
af te bakenen. In een eerste studie, werd positioneel en functioneel kandidaatgen SDHD onderzocht
gebruik makend van ‘high-throughput’ mutatie-screening met behulp van denaturerende ‘high-
performance’ vloeistof chromatografie. Bijkomende uitgebreide analyses op transcriptioneel,
functioneel en proteoom vlak verschafte geen evidentie voor een ‘two-hit’ betrokkenheid van tumor
suppressorgen SDHD. Nochtans kan een betrokkenheid in neuroblastoom volgens een haplo-
insufficiënt mechanisme niet uitgesloten worden en dit vereist verder onderzoek. In de tweede
benadering voor de zoektocht naar 11q tumor suppressorgenen, gebruikten we een modelsysteem
van een neuroblastoom cellijn met 11q-deletie waarin een chromosoom 11 was getransfereerd.
Uitgebreide analyse van dit modelsysteem leidde tot de identificatie van een regio op 11q25 en 11p
die kan betrokken zijn in de (de)differentiatie en mogelijks interessante neuroblastoom genen bevat.
Tot besluit, deze thesis rapporteert de introductie, optimalisatie en toepassing van verschillende
nieuwe ‘high-throughput’ technologieën voor de identificatie van genen betrokken in agressieve
neuroblastomen. In het bijzonder hebben we een betrouwbare expressie profilering van
neuroblastoom voorloper cellen bekomen die gebruikt kan worden om de mechanismen die tot
neuroblastoom oncogenese leiden te ontrafelen. Bovendien wordt verwacht dat dit profiel essentieel
zal worden in toekomstige neuroblastoom expressie profilering studies.
Samenvatting 166
Abbreviations 2D-PAGE 2D-polyacrylamide gel electrophoresis ALL acute lymphoblastic leukaemia AML acute myeloid leukaemia BAC bacterial artificial chromosome bHLH basic helix-loop-helix bHLHZ basic-helix-loop-helix-zipper cDNA complimentary deoxyribonucleic acid CGH comparative genomic hybridisation CML chronic myeloid leukaemia DHPLC denaturing high-performance liquid chromatography dmin double minute chromatin body DNA deoxyribonucleic acid EMT epithelial-mesenchymal transition FISH fluorescence in situ hybridisation GINI gene identification by NMD inhibition HSR homogeneously staining region HVA homovanillic acid ICAT isotope-coded affinity tags INPC International Neuroblastoma Pathology Classification INSS International Neuroblastoma Staging System LCM laser capture microdissection LOH loss of heterozygosity MALDI-TOF MS matrix-assisted laser desorption/ionisation – time of flight mass spectrometry M-FISH multiplex FISH MGED Microarray Gene Expression Data Society MIAME Minimum Information About a Microarray Experiment MIBG meta-iodobenzyl-guanidine MKI mitosis-karyorrhexis index MMCT microcell mediated chromosome transfer mRNA messenger ribonucleic acid NMD nonsense mediated mRNA decay PNET primitive neuro-ectodermal tumour Q-PCR real-time quantitative PCR RA retinoic acid RAR retinoic acid receptor RNAi RNA interference RXR retinoic X receptor SAGE serial analysis of gene expression SIF small intensely fluorescent cell SKY spectral karyotyping SNP single nucleotide polymorphism SRO shortest region of overlap TF transcription factor VMA vanillylmandelic acid
Abbreviations 167
Acknowledgements 168
Acknowledgements / Dankwoord
Vooraleer dit werk naar de drukker vertrekt, wacht me nog één belangrijke taak. Na het schrijven van
een 167 bladzijden tellende thesis, moet ik nog 1 onmisbare bladzijde neerpennen. Gedurende vijf
jaar heb ik me met overgave en veel plezier in de neuroblastoom onderzoekswereld kunnen storten.
Tijdens deze tocht door het land van de kankergenetica, hebben verschillende mensen mijn
onderzoekspad gekruist en hebben één voor één bijgedragen bij het tot stand komen van dit
doctoraat. Zonder hun hulp was het volbrengen van deze boeiende taak onmogelijk geweest.
In de eerste plaats wil ik mijn promotoren prof. dr. Frank Speleman en prof. dr. Anne De Paepe
bedanken. Zij hebben het mogelijk gemaakt dat ik aan dit onderzoekswerk kon beginnen in het
Centrum voor Medische Genetica en hebben me wegwijs gemaakt in de boeiende wereld van de
kankergenetica. Frank, hartelijk bedankt voor je vertrouwen, onuitputtelijke hulp, geduld en de
boeiende discussies die we samen met dr. ir. Jo Vandesompele hadden. Jo wist me altijd te
overtuigen om te blijven proberen en had steeds vertrouwen in het welslagen van een experiment. Zijn
multi-potentialiteit en grote hulpvaardigheid zijn legendarisch. Ook mijn andere collega’s uit de
neuroblastoom en leukemie onderzoeksgroep ben ik dank verschuldigd voor de schitterende
dynamische samenwerking: dr. Nadine Van Roy, mijn bureau-genote ir. Jasmien Hoebeeck, ir. Filip
Pattyn, ir. Evi Michels, dr. Bruce Poppe, dr. Barbara Cauwelier, Els De Smet en Nurten Yigit. Voor
Nurten wil ik hier een speciaal woordje van dank plaatsen; ze heeft me tijdens de laatste maanden
geholpen bij de finalisering van enkele zeer belangrijke experimenten. Ook Peter Degraeve en Geert
De Vos stonden steeds klaar wanneer er weer eens één of zelfs vele cellijnen moesten worden
opgegroeid.
Bedankt ook aan Sylvia De Bie en de mensen van het secretariaat voor de praktische hulp, alsook
aan al de andere mensen van de dienst Medische Genetica en de mensen die de dienst ondertussen
hebben verlaten, zoals dr. Mireille Van Gele, dr. ir. Heidi Van Limbergen en dr. Stefan Vermeulen.
Samen met hen heb ik de afgelopen 4 jaar een leuke tijd beleefd van hard werken maar ook een tijd
met veel gezellige en ontspannende momenten (cfr. taart en snoep-moment) tijdens de middagpauzes
en ook daarbuiten. Eén van die gelegenheden heeft zelfs geleid tot het totstandkomen van een wel
heel bijzondere relatie…
Bedankt prof. dr. Geneviève Laureys, prof. dr. Yves Benoit en alle andere pediatrische oncologen voor
de hulp, de collectie van data en stalen en de interesse in ons werk. Dank ook aan alle patiënten en
ouders voor deelname aan de studies.
Also many thanks to prof. dr. Valérie Combaret and prof. dr. John Lunec for the collection of data and
samples and the nice collaboration.
Prof. dr. Sven Pählman, I would like to express my gratitude to you for the helpful discussions we have
had when you visited our laboratory. These discussions have certainly helped me in understanding the
cellular origin of neuroblastoma. I also wish to thank dr. Pierre Heimann who has collected the material
for the isolation of neuroblast cells and took time to learn me how to recognize neuroblast cells.
Ook dank aan prof. dr. Rudy Van Coster, prof. dr. Frank Roels, prof. dr. Marleen Praet en dr. Caroline
Vandenbroecke voor de zinvolle discussies en hulp bij de uitwerking van het SDHD verhaal.
Bedankt Ann Neesen en Indra Deborle voor geboden hulp bij het gebruik van de cryotoom, Joël Smet
en Edith George voor de uitvoering van de functionele en eiwit testen.
Marie-Rose Verschraegen Spae en de familie Hoefkens hebben de samenvatting van mijn doctoraat
vertaald naar het Frans; merci beaucoup!
Maria, Michel, Els, Thierry, Hilde, Tom en mijn broer Wim wil ik bedanken voor de steun en de hulp
tijdens de receptie, en al mijn vrienden en familieleden voor het interesse in mijn werk. Bovenal wil ik
mijn ouders en grootouders bedanken voor alle kansen die ze me hebben gegeven en de steun en
aanmoedigingen die ik steeds heb gekregen tijdens mijn studies en tijdens de vervolmaking van mijn
doctoraat. Bedankt ook voor de sponsoring van de receptie!
Dan blijft er nog één heel bijzonder persoon die hier een apart woordje van dank verdient. Björn,
bedankt voor je geduld, begrip, steun en hulp, de bemoedigende woorden en je onuitputtelijke liefde
tijdens het afgelopen, hectische jaar. Net zoals jou wil ik je binnenkort met al mijn liefde steunen als
ook jij aan ‘de zware schrijfklus’ begint!
Gent, September 2004
Acknowledgements 169
Curriculum vitae ir. Katleen De Preter Centre for Medical Genetics Ghent University Hospital 1K5 De Pintelaan 185 9000 Gent Belgium [email protected] 32-9-2405533 (phone) 32-9-2404970 (fax) 32-486-471270 (mobile) Education 1989-1995 Latin-Mathematics (6 h), Sint-Ludgardisschool, Antwerp, Belgium (KVO price) 1995-1997 Diploma of the first cycle bio-engineer (Applied Biological Sciences), RUCA, Antwerp,
Belgium (high distinction) 1997-2000 Bio-engineer in cell and gene biotechnology, UG, Ghent, Belgium (high distinction)
thesis, promoter prof. dr. P. Van Oostveldt, under the supervision of prof. dr. F. Speleman: “Quantification of MYCN copy number and RIZ transcripts with real-time quantitative PCR: Methodological study and analysis in neuroblastoma”
2000-2004 PhD training in the Medical Sciences, UG, Ghent, Belgium 2001-2003 Academic Teacher Training, UG, Ghent, Belgium (distinction) Professional records 2000-2004 Aspirant F.W.O. Flanders: Project title: “Identification of 11q tumour suppressor genes
and determination of the role of MYCN in a genetic subgroup of neuroblastoma without MYCN amplification” Promoter: prof. dr. F. Speleman, co-promoter: prof. dr. Anne De Paepe.
Publications Publications in journals with referee-system 1. K De Preter, J Vandesompele, J Hoebeeck, C Vandenbroecke, J Smet, A Nuyts, G Laureys, V
Combaret, N Van Roy, F Roels, R Van Coster, M Praet, A De Paepe, F Speleman: No evidence for involvement of SDHD in neuroblastoma pathogenesis. BMC Cancer 2004, 4:55.
2. F Roels, JM Saudubray, M Giros, H Mandel, F Eyskens, N Saracibar, B Atares Pueyo, JM Prats, B De Prest, K De Preter, et al: Peroxisome mosaics. Adv Exp Med Biol 2003, 544:97-106.
3. K De Preter, F Pattyn, G Berx, K Strumane, B Menten, F Van Roy, A De Paepe, F Speleman, J Vandesompele: Combined subtractive cDNA cloning and array CGH: an efficient approach for identification of overexpressed genes in DNA amplicons. BMC Genomics 2004, 5:11.
4. J Vandesompele, A Edsjo, K De Preter, H Axelson, F Speleman, S Pahlman: ID2 expression in neuroblastoma does not correlate to MYCN levels and lacks prognostic value. Oncogene 2003, 22:456-60.
5. J Vandesompele, K De Preter, F Pattyn, B Poppe, N Van Roy, A De Paepe, F Speleman: Accurate normalization of real-time quantitative RT-PCR data by geometric averaging of multiple internal control genes. Genome Biol 2002, 3:RESEARCH0034.
6. K De Preter, F Speleman, V Combaret, J Lunec, G Laureys, BH Eussen, N Francotte, J Board, AD Pearson, A De Paepe, N Van Roy, J Vandesompele: Quantification of MYCN, DDX1, and NAG gene copy number in neuroblastoma using a real-time quantitative PCR assay. Mod Pathol 2002, 15:159-66.
Curriculum vitae 170
Publications in journals without referee-system 7. K De Preter, J Vandesompele, P Heimann, MM Kockx, M Van Gele, J Hoebeeck, E De Smet,
M Demarche, G Laureys, N Van Roy, A De Paepe, F Speleman: Application of laser capture microdissection in genetic analysis of neuroblastoma and neuroblastoma precursor cells. Cancer Lett 2003, 197:53-61.
Abstracts of congress reports 8. J Vandesompele, K De Preter, F Pattyn, J Iso-Oja, A De Paepe, F Speleman: Quantification
and normalization of gene expression using SYBR Green I real-time RT-PCR. Oncogenomics, 2001, Tucson, USA and The second Euroconference on Quantitative Molecular Cytogenetics, 2001, Salamanca, Spain.
9. K De Preter, J Vandesompele, P Heimann, M Kockx, F Speleman: Expression analysis on laser capture microdissected neuroblasts. European Laser-Capture-Microdissection Symposium, 2001, Marburg/Lahn, Germany.
10. K De Preter, J Vandesompele, V Combaret, J Lunec, G Laureys, N Van Roy, F Speleman: Improved real-time quantitative PCR assay allows detection of MYCN amplification in small subsets of neuroblastoma cells. BeSHG 2002, Brussels, Belgium and ANR 2002, Paris, France.
11. K De Preter, J Vandesompele, P Heimann, M Kockx, S Pahlman, N Van Roy, F Speleman: Expression analysis on normal neuroblasts isolated from fetal adrenals using laser capture microdissection. Oncogenomics 2002, Dublin, Ireland and ANR 2002, Paris, France.
12. J Vandesompele, F Pattyn, N Van Roy, E De Smet, J Hoebeeck, K De Preter, G Laureys, A De Paepe, F Speleman: Subtractive expression profiling of neuroblastoma: identification of new candidate genes and predictors for clinical outcome. Solid tumor workshop 2002, Barcelona, Spain and BeSHG 2003, Leuven, Belgium.
13. J Vandesompele, M Baudis, K De Preter, N Van Roy, G Laureys, F Speleman: Identification of clinico-genetic subgroups in neuroblastoma by cluster analysis of CGH data. Solid tumour workshop 2002, Barcelona, Spain.
14. J Vandesompele, M Baudis, K De Preter, N Van Roy, G Laureys, F Speleman: Neuroblastoma CGH data revisited: identification of genetic subgroups by cluster analysis. QMC 2002, Stockholm, Sweden and ANR 2002, Paris, France.
15. J Vandesompele, K De Preter, E De Smet, G Laureys, A De Paepe, F Speleman, N Van Roy: Co-amplification of ATBF1 and Myc in neuroblastoma cell line SJNB-12. ANR 2002, Paris, France and BeSHG 2002, Brussels, Belgium.
16. J Vandesompele, K De Preter, N Van Roy, A De Paepe, F Speleman: Identification of three novel amplified and overexpressed transcripts in neuroblastoma. ANR 2002, Paris, France.
17. J Vandesompele, F Pattyn, K De Preter, N Van Roy, K Swerts, J Hoebeeck, G Laureys, A De Paepe, J Philippe, F Speleman: Subtractive expression profiling between two genetic subgroups of neuroblastoma. ANR 2002, Paris, France.
18. F Nollet, K De Preter, J Vandesompele, J Billiet, D Selleslag, A Van Hoof, J Vandroogenbroeck, M Hidajat, F Speleman, A Criel: Feasibility of microarray technology for multiple gene analysis in molecular diagnostics. BHS 2003, Brussels, Belgium.
19. B Menten, J Vandesompele, K De Preter, G Mortier, A De Paepe, F Speleman, S Vermeulen: DNA microarrays for high resolution detection of constitutional submicroscopic chromosomal aberrations in patients with mental retardation and congenital abnormalities. BeSHG 2003, Leuven, Belgium.
20. N Van Roy, K De Preter, J Vandesompele, B Menten, N Carter, H Fiegler, P Carr, A De Paepe, F Speleman: High-resolution detection of genomic imbalances in neuroblastoma cell line NGP by arrayCGH analysis. BeSHG 2003, Leuven, Belgium.
21. K De Preter, J Vandesompele, G Laureys, J Hoebeeck, N Van Roy, V Combaret, A De Paepe, F Speleman: A putative role for SDHD as neuroblastoma tumor suppressor gene. BeSHG 2003, Leuven, Belgium and ANR 2004, Genoa, Italy.
22. J Vandesompele, K De Preter, F Pattyn, B Poppe, N Van Roy, A De Paepe, F Speleman: Accurate normalization of gene expression using multiple internal control genes. 1st International qPCR Symposium & Application Workshop, 2004, Freising-Weihenstephan, Germany.
23. K De Preter, F Pattyn, G Berx, K Strumane, B Menten, F Van Roy, A De Paepe, F Speleman, J Vandesompele: Combined subtractive cDNA cloning and array CGH: an efficient approach for
Curriculum vitae 171
identification of overexpressed genes in DNA amplicons. BeSHG 2004, Ghent, Belgium and ANR 2004, Genoa, Italy.
24. F Pattyn, K De Preter, N Van Roy, E De Smet, A De Paepe, G Laureys, F Speleman, J Vandesompele: Identification of relevant MYCN downstream effectors by a combinatorial multimodal approach. ANR, 2004, Genoa, Italy.
25. K De Preter, J Vandesompele, P Heimann, N Van Roy, F Speleman: Isolation of normal neuroblastoma precursor cells: tools for comparative gene expression profiling. ANR 2004, Genoa, Italy.
Courses
1. ‘Vormingsdagen door het Belgisch EMBnet Knooppunt’, 01/12/2000, 08/12/2000, 15/12/2000, Brussels, Belgium.
2. Bio-informatics and bio-statistics, ICES courses, 20/09-26/09-03/10-2001 and 11/10-18/10-25/10-2001, Het Pand, Ghent, Belgium.
3. 32th Advanced Course: DNA microarrays, 5-15/03/2002, Wellcome Trust Genome Campus, Hinxton, Cambridge, UK.
Congresses, workshops and lectures
1. Applied Bioinformatics, KVIV, 21/11/2000, Ingenieurshuis, Antwerp, Belgium. 2. First Annual Meeting, Belgian Society of Human Genetics (BeSHG), 09/02/2001, Campus
Erasme ULB, Brussels, Belgium. 3. The Belgian Bioinformatics Conference 2001 (BBC conference), 06/04/2001, Ghent,
Belgium. 4. European Laser-Capture-Microdissection Symposium, 21-22/06/2001, Marburg/Lahn,
Germany. 5. 31st Annual Meeting of the European Environmental Mutagen Society, 1-5/09/2001:
Workshop 3: Microarray systems, Het Pand, Ghent, Belgium. 6. Applied Bioinformatics II, KVIV, 06/11/2001, Ingenieurshuis, Antwerp, Belgium. 7. 5th ArrayNL workshop, ArrayNL platform, 22/01/2002, Utrecht, The Netherlands. 8. BeSHG 2002, 22/02/2002, Brussels, Belgium. 9. BBC conference, 12/04/2002, Namen, Belgium. 10. Oncogenomics 2002: Dissecting cancer through genome research, 1-5/05/2002, Dublin,
Ireland. 11. ANR 2002: Advances in Neuroblastoma Research, 17-19/06/2002, Paris, France. 12. 2nd VIB MicroArray Users Group Meeting, 22/11/2002, UZ Gasthuisberg, Leuven,
Belgium. 13. ‘Wetenschapsdag Universitair Ziekenhuis Gent’, 17/01/2003, Ghent, Belgium. 14. BeSHG 2003, 07/02/2002, Leuven, Belgium. 15. ‘Wetenschapsdag Universitair Ziekenhuis Gent’, 22/01/2004, Ghent, Belgium. 16. BeSHG 2004, 19/03/2004, Ghent, Belgium. 17. ANR 2004: Advances in Neuroblastoma Research, 16-19/06/2002, Genoa, Italy.
Curriculum vitae 172


Copyright © 2022 FDOKUMEN


![The "Coptic Gnostic Library of Nag Hammadi" and the Faw Qibli Excavations [2010]](https://static.fdokumen.com/doc/165x107/6319f2b2b41f9c8c6e09fa4d/the-coptic-gnostic-library-of-nag-hammadi-and-the-faw-qibli-excavations-2010.jpg)


![Unique Photographic Evidence for Nag Hammadi Texts [1977–1980]](https://static.fdokumen.com/doc/165x107/6319fd35b41f9c8c6e09fe84/unique-photographic-evidence-for-nag-hammadi-texts-19771980.jpg)