Slot waveguide-based splitters for broadband terahertz radiation
Upload
independentCategory
view
3download
0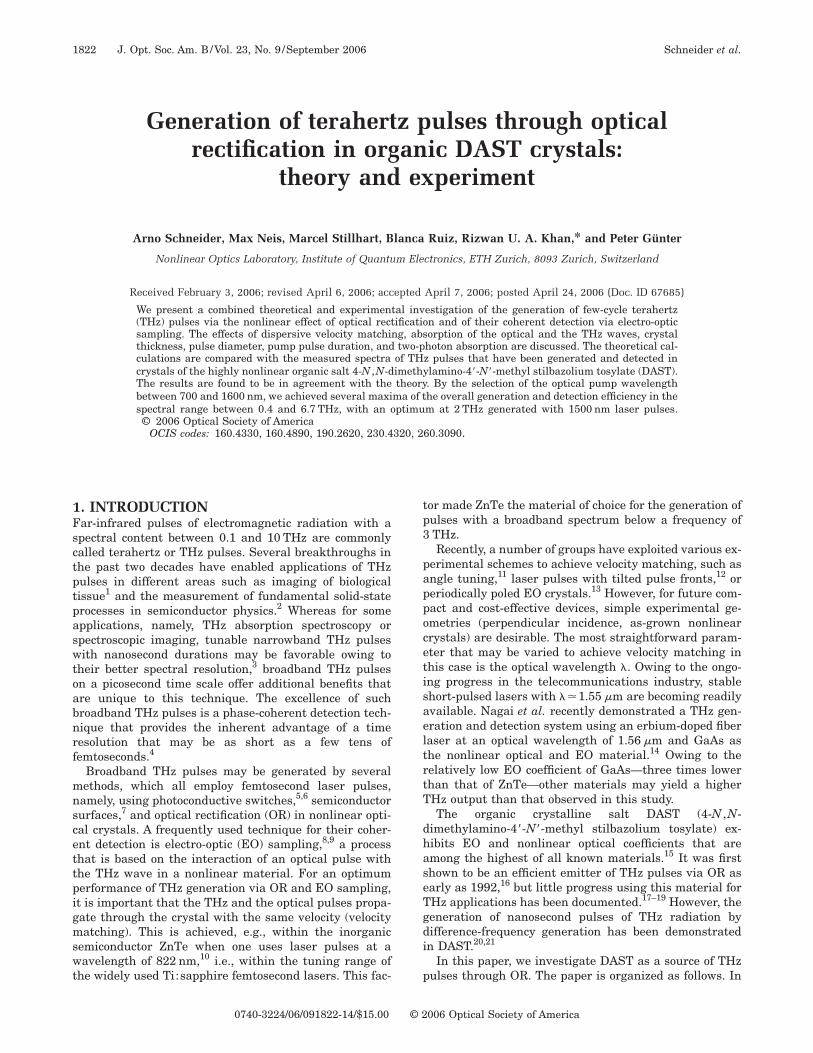
1Fsctptpaswtoabnrf
mnscettpigmswt
1822 J. Opt. Soc. Am. B/Vol. 23, No. 9 /September 2006 Schneider et al.
Generation of terahertz pulses through opticalrectification in organic DAST crystals:
theory and experiment
Arno Schneider, Max Neis, Marcel Stillhart, Blanca Ruiz, Rizwan U. A. Khan,* and Peter Günter
Nonlinear Optics Laboratory, Institute of Quantum Electronics, ETH Zurich, 8093 Zurich, Switzerland
Received February 3, 2006; revised April 6, 2006; accepted April 7, 2006; posted April 24, 2006 (Doc. ID 67685)
We present a combined theoretical and experimental investigation of the generation of few-cycle terahertz(THz) pulses via the nonlinear effect of optical rectification and of their coherent detection via electro-opticsampling. The effects of dispersive velocity matching, absorption of the optical and the THz waves, crystalthickness, pulse diameter, pump pulse duration, and two-photon absorption are discussed. The theoretical cal-culations are compared with the measured spectra of THz pulses that have been generated and detected incrystals of the highly nonlinear organic salt 4-N ,N-dimethylamino-4�-N�-methyl stilbazolium tosylate (DAST).The results are found to be in agreement with the theory. By the selection of the optical pump wavelengthbetween 700 and 1600 nm, we achieved several maxima of the overall generation and detection efficiency in thespectral range between 0.4 and 6.7 THz, with an optimum at 2 THz generated with 1500 nm laser pulses.© 2006 Optical Society of America
OCIS codes: 160.4330, 160.4890, 190.2620, 230.4320, 260.3090.
tp3
pappocetisaeltrtT
dhaseTgdi
p
. INTRODUCTIONar-infrared pulses of electromagnetic radiation with apectral content between 0.1 and 10 THz are commonlyalled terahertz or THz pulses. Several breakthroughs inhe past two decades have enabled applications of THzulses in different areas such as imaging of biologicalissue1 and the measurement of fundamental solid-staterocesses in semiconductor physics.2 Whereas for somepplications, namely, THz absorption spectroscopy orpectroscopic imaging, tunable narrowband THz pulsesith nanosecond durations may be favorable owing to
heir better spectral resolution,3 broadband THz pulsesn a picosecond time scale offer additional benefits thatre unique to this technique. The excellence of suchroadband THz pulses is a phase-coherent detection tech-ique that provides the inherent advantage of a timeesolution that may be as short as a few tens ofemtoseconds.4
Broadband THz pulses may be generated by severalethods, which all employ femtosecond laser pulses,
amely, using photoconductive switches,5,6 semiconductorurfaces,7 and optical rectification (OR) in nonlinear opti-al crystals. A frequently used technique for their coher-nt detection is electro-optic (EO) sampling,8,9 a processhat is based on the interaction of an optical pulse withhe THz wave in a nonlinear material. For an optimumerformance of THz generation via OR and EO sampling,t is important that the THz and the optical pulses propa-ate through the crystal with the same velocity (velocityatching). This is achieved, e.g., within the inorganic
emiconductor ZnTe when one uses laser pulses at aavelength of 822 nm,10 i.e., within the tuning range of
he widely used Ti:sapphire femtosecond lasers. This fac-
0740-3224/06/091822-14/$15.00 © 2
or made ZnTe the material of choice for the generation ofulses with a broadband spectrum below a frequency ofTHz.Recently, a number of groups have exploited various ex-
erimental schemes to achieve velocity matching, such asngle tuning,11 laser pulses with tilted pulse fronts,12 oreriodically poled EO crystals.13 However, for future com-act and cost-effective devices, simple experimental ge-metries (perpendicular incidence, as-grown nonlinearrystals) are desirable. The most straightforward param-ter that may be varied to achieve velocity matching inhis case is the optical wavelength �. Owing to the ongo-ng progress in the telecommunications industry, stablehort-pulsed lasers with ��1.55 �m are becoming readilyvailable. Nagai et al. recently demonstrated a THz gen-ration and detection system using an erbium-doped fiberaser at an optical wavelength of 1.56 �m and GaAs ashe nonlinear optical and EO material.14 Owing to theelatively low EO coefficient of GaAs—three times lowerhan that of ZnTe—other materials may yield a higherHz output than that observed in this study.The organic crystalline salt DAST (4-N ,N-
imethylamino-4�-N�-methyl stilbazolium tosylate) ex-ibits EO and nonlinear optical coefficients that aremong the highest of all known materials.15 It was firsthown to be an efficient emitter of THz pulses via OR asarly as 1992,16 but little progress using this material forHz applications has been documented.17–19 However, theeneration of nanosecond pulses of THz radiation byifference-frequency generation has been demonstratedn DAST.20,21
In this paper, we investigate DAST as a source of THzulses through OR. The paper is organized as follows. In
006 Optical Society of America
Ssamqato4sp
2A
1Im
wtdtf
wpnaa
wFw
ses
2Ttht
wsHbi
tTa(
Fm�wnr
wids
wlT�−ntgOnesitq
W(
Tt=
Ndt
Schneider et al. Vol. 23, No. 9 /September 2006 /J. Opt. Soc. Am. B 1823
ection 2, we provide a theoretical overview of OR andubsequent THz emission as well as of EO sampling. Welso derive quantities, defined as effective lengths, thatay serve as figures of merit as a function of THz fre-
uency and optical wavelength. In Section 3, the linearnd nonlinear optical properties of DAST are presentedhat are relevant for its use in THz applications. More-ver, we calculate the effective lengths for DAST. Sectiondescribes the experimental setup. The results are pre-
ented and discussed in Section 5, where they are com-ared with the predictions from the preceding sections.
. THEORY. Generation of a Terahertz Pulse
. Nonlinear Wave Equationn an optically nonlinear medium, the electric displace-ent vector D in SI units is given by
D = �0E + PL + PNL, �1�
ith PL and PNL as the linear and nonlinear polariza-ions, respectively, and E as the electric field. In the timeomain, PL�t� is coupled to E�t� by a response function,he linear susceptibility tensor ��t−��=��t−��−1. In therequency domain this reads as
PL��� = �0���� � E��� �2�
ÛD��� = �0���� � E��� + PNL���, �3�
here � denotes the tensor multiplication. The nonlinearolarization PNL will be discussed in Subsection 2.A.2. Aonmagnetic ��=1� medium with no free charges ��=0� isssumed. The current density j��� may be written innalogy to Eq. (2):
j��� = ���� � E���, �4�
ith ���� as the frequency-dependent conductivity tensor.rom Maxwell’s equations,22 one can derive the nonlinearave equation in the frequency domain:
E�r,�� − ��� · E�r,��� + �2�0�0���� � E�r,�� − i��0����
� E�r,�� = − �2�0PNL�r,��. �5�
In a linear medium, i.e., in which PNL=0, Eq. (5) de-cribes the propagation, absorption, and diffraction of anlectromagnetic wave. All operators are linear; thus anyuperposition of solutions will solve the equation.
. Nonlinear Polarizationhe nonlinear polarization PNL�t� is induced by the elec-ric field and can be expressed as the quadratic andigher terms of a Taylor expansion of the total polariza-ion in the electric field:
PNL�t� = �0�� �R2
dt1dt2��2��t1,t2� � E�t − t1�E�t − t2���
+�� �R3
dt1dt2dt3��3��t1,t2,t3� � E�t − t1�
E�t − t �E�t − t � + ¯ �, �6�
2 3ith ��2� and ��3� as the second- and third-order nonlinearusceptibilities, which are tensorial response functions.igher-order terms are neglected. Causality requires thatoth ��2� and ��3� vanish if at least one of their argumentss smaller than zero.
In an experimental realization, the nonlinear polariza-ion is induced by the electric field of a short laser pulse.he ��3� term does not contribute to the THz generationnd is therefore neglected. The Fourier transform of Eq.6) then yields
PNL,i��� = �0�R
d���ijk�2���;��,� − ���Ej����Ek�� − ���.
�7�
or simplicity, we assume a laser polarization along aain axis of the crystal (say, m) and only one element
lmm�2� of the nonlinear susceptibility tensor to be active,here l need not be different from m. In this case, theonlinear polarization P is along the l axis, and Eq. (7)educes to a scalar equation.
The field of the laser pulse may be written as
E�t� = 12 �E0�t�exp�i�ot� + c.c.�, �8�
here E0�t� is the time-varying complex amplitude and �os the optical carrier frequency. The complex conjugate isenoted by c.c. A Fourier transform yields the frequencypectrum
E���� = 12 �E0��� − �o� + E0
*��� + �o��, �9�
hich has to be inserted into Eq. (7). For a laser pulseength T that is long compared with one optical cycle,� �2� /�o�, the bandwidth � of E0��� is smaller thano, and the integration in Eq. (7) runs only over �−�o� ,−�o+�� and ��o−� ,�o+��. Therefore PNL��� isonzero only in three distinct spectral ranges. Two ofhem are centered at ±2�o and lead to second-harmoniceneration (SHG). The third lying within ±2� causesR and is the source of the THz radiation. If �o is notear a resonance frequency of the material under consid-ration, the dispersion of ��2��� ;�� ,�−��� is generallymall; i.e., it does not change significantly when �� is var-ed within ±��o−� ,�o+��. Thus we introduce an effec-ive susceptibility �OR that is relevant for OR and, conse-uently, for THz generation:
�OR��;�o� ª ��2���;��,� − ���, �o − �� � �o. �10�
ith this definition we can evaluate the OR term in Eq.7):
POR��� = 12�0�OR��;�o��E0 � E0
*����. �11�
he asterisk denotes the convolution. Using the Fourierransform of the laser intensity I�����0n��o�c� /2�E0*E0
*����, we get
POR��� =�OR��;�o�
n��o�cI���. �12�
ote that this description is equivalent to a calculation ofifference-frequency generation within the spectral con-ent of a finite laser pulse.
3Wti=tanatonompb
wercod
T(
Gite
ws�
tpl
rm
TetsTd
m
1824 J. Opt. Soc. Am. B/Vol. 23, No. 9 /September 2006 Schneider et al.
. Plane-Wave Approximatione consider a pump pulse propagating along the z direc-
ion, perpendicular to the optical and the nonlinear polar-zation, in the plane-wave approximation, i.e., �I /�x�I /�y=0. The nonlinear polarization in Eq. (5) gives rise
o a rectified field at THz frequencies as well as to a fieldt the doubled optical frequency. The latter can safely beeglected, since the phase-matching conditions for SHGre generally not fulfilled.23 Furthermore, we assumehat the generated THz field is weak compared with theptical pump field and does therefore not lead to cascadedonlinear effects. Thus we take the nonlinear source termn the right-hand side of Eq. (5) to be zero for the funda-ental optical frequency �o. The propagation of the pump
ulse is then not affected by nonlinear effects, and it cane treated as in a linear medium:
I�t,z� = I0�t − z/vg�exp�− �oz�, �13�
ith I0�t� as the temporal shape of the input pulse thatffectively entered the crystal at z=0, i.e., after Fresneleflections at the front surface. �o denotes the absorptionoefficient at the frequency �o, and vg��o�=c /ng��o� is theptical group velocity with ng��o� as the optical group in-ex:
ng��o� = n��o� + �o
�n
��
�o
. �14�
he intensity spectrum I��� in Eq. (12) follows from Eq.
13): sgen
ttsEti
s
I��,z� = I0���exp�i��ng/c�z�exp�− �oz�. �15�
roup-velocity dispersion does not play a significant rolen I�� ,z� if pump pulses longer than 100 fs are used as inhis paper. With Eqs. (12) and (15), the nonlinear wavequation (5) becomes
�2E���
�z2 + ��2n2���
c2 − i��0�����E
= − �2�0
�OR��,�o�
n��o�cexp�− i��ng/c�z�exp�− �oz�I0���,
�16�
here we used c2= ��0�0�−1 and n2���=����. The THz ab-orption coefficient �T��� is related to the conductivity��� by
�T��� =�0c
n�������. �17�
In the solution of Eq. (16) we consider only forward-raveling waves, i.e., waves in the same direction as theump pulse. With the boundary condition E�� ,0�=0 andow THz absorption ��T�����nx��� /c�, we find the
olution:E��,z� =�0�OR��;�o��I0���
n��o�� c
���T���
2+ �o� + i�n��� + ng��
exp�− i�n���
cz�exp�−
�T���
2z� − exp − i
�ng
cz�exp�− �oz�
�T���
2− �o + i
�
c�n��� − ng�
. �18�
The second fraction on the right-hand side of Eq. (18) has the unit of a length. Its maximum absolute value of z iseached for zero absorption ��T���=�o=0� and equal propagation velocities of the THz wave and probe pulse [velocityatching, n���=ng]. Therefore we define its absolute value as the effective generation length Lgen�� ,z�:
Lgen��,z� = � exp�− �T���z� + exp�− 2�oz� − 2 exp�− ��T���
2+ �o�z�cos��
c�n��� − ng�z�
��T���
2− �o�2
+ �
c �2
�n��� − ng�2 �1/2
. �19�
he z dependence of the electric field in Eq. (18) is thenxclusively given by Lgen�� ,z�, which depends strongly onhe material’s dispersion through the �n���−ng� terms. Atudy of the length and pump wavelength dependence ofHz generation in ZnTe was recently presented by vaner Valk et al.24
The denominator in the first fraction of Eq. (18) variesore slowly with the dispersion than L , since it con-
ains the sum n���+ng instead of the difference; the con-ribution of �T��� and �o is negligible for moderate ab-orption. Hence the dependence of the emitted field�� ,z� on the linear properties (refractive indices, absorp-
ion coefficients) in both THz and optical spectral rangess essentially contained in Lgen�� ,z�.
The function I0��� of a Gaussian pulse with the inten-ity profile I �t� is given by
0
wam=�(=
4Istm
wtssdwlcmwotdpp
wt
T
tfi�c
ao
wL
oz
Tt��fip
5FtwrmI
wfittftwt�t
B
Schneider et al. Vol. 23, No. 9 /September 2006 /J. Opt. Soc. Am. B 1825
I0�t� = Im exp −t2
2�2� Û I0��� = Im� exp −�2�2
2 � ,
�20�
ith Im as the peak amplitude. The bandwidth � in thengular frequency, where I0��� drops to 1/e2 of its maxi-um value, is given by 2/�. In terms of the frequency � / �2��, we receive for a typical value of=64 fs—equivalent to a full width at half-maximumFWHM) pulse length of 150 fs—a bandwidth of 5.0 THz.
. Finite Pump-Pulse Diametern the following, we discuss the change in the emittedpectrum that arises for a finite pump pulse diameter dueo diffraction. Its profile is assumed to be radially sym-etric with a Gaussian profile:
I��,t� = Ic�t�exp�−�2
2s2�z�� , �21�
ith Ic�t� as the time-dependent intensity in the center ofhe beam, � as the radial coordinate, and s�z� as the beamize parameter. For a crystal length l�s2�z� /�, i.e., muchhorter than the Rayleigh length of the optical beam, itsiffraction is negligible, and s is approximately constantithin the crystal. Typical values ���1 �m, l�0.5 mm�
ead to s�23 �m; i.e., the pump beam must not be fo-used onto the nonlinear crystal. However, diffractionust not be neglected for the THz radiation due to itsavelength that is 2 orders of magnitude longer than thatf the optical pulse. The initial Gaussian distribution ofhe THz field, which is proportional to the pump intensityistribution in Eq. (21), will remain Gaussian after aropagation distance � with a change in beam size andeak amplitude:
E��,�� = E0
W0
W���exp�−
�2
W2���� , �22�
ith W0=�2s as the initial beam waist and the momen-ary beam size as
W��� = W0�1 +�2
z02���
. �23�
he frequency-dependent Rayleigh length is given by
z0��� =�
2cW0
2 =�
cs2. �24�
In the case of velocity matching and negligible absorp-ion in both optical and THz spectral ranges, the totaleld component at the THz frequency � on the beam axis
�=0� at the end of the crystal at z= l is composed of theontributions emitted at all positions z within the crystal:
E��,l� =�0
l �E0���
�z
1
�1 +c2�l − z�2
�2s4
dz
=�E0���
�z
�
cs2 arcsinh cl
s2�� . �25�
The factor �E0 /�z contains the material parameter �OR
nd the pump intensity Ic���. In the limit of a plane wave,r s2→�, we get
E��,l� →�E0���
�zl, �26�
hich has to be identical to the result in Eq. (18) withgen= l; thus
�E0���
�z =�0�OR��;�o�
2n��o�ngI0����. �27�
Combining Eq. (25) with Eq. (27), we get the spectrumf a THz pulse generated by a Gaussian pump beam forero absorption and velocity mismatch:
E��,l� =�0�OR��;�o�
2cn��o�ngs2I0����2 arcsinh cl
s2�� . �28�
he difference between Eq. (28) and the plane-wave solu-ion of Eq. (18) is significant only for low frequencies ��cl /s2�. Assuming an unfocused optical beam �s0.25 mm� and a typical crystal length �l�1 mm�, one
nds that the plane-wave result represents a valid ap-roximation for frequencies above 1 THz.
. Influence of Two-Photon Absorptionor a high conversion efficiency and to prevent damage to
he nonlinear crystal, one usually chooses the pumpavelength � within the transparency range of the mate-
ial, i.e., �o�0. However, the energy of the pump pulseay be decreased through two-photon absorption (TPA).
n the absence of linear absorption, the intensity is
I�t,z� =Ii�t − z/vg�
1 + �2Ii�t − z/vg�z, �29�
here Ii�t� is the intensity at z=0 and �2 is the TPA coef-cient defined by �I /�z=−�2I2. The inhomogeneous rela-ive intensity change in Eq. (29) leads to a flattening ofhe pump pulse intensity and, consequently, to arequency-dependent change in I���. Thus the THz spec-rum in the presence of TPA will be different from thatith linear absorption. For a quantitative estimation of
his effect, we make a Taylor expansion of Eq. (29) in2Iiz. Assuming a Gaussian pulse as in Eq. (20), the firsterms of the intensity change I�t ,z�=Ii�t�−I�t ,z� are
I�t,z� = �2I02 exp�−
�t − z/vg�2
�2 �z − �22I0
3
exp�−3�t − z/vg�2
2�2 �z2. �30�
oth terms in Eq. (30) have a Gaussian shape with dura-
ttwcrtItsw
ititlvtp
it
BFplaplap
deht
Aib
opr
wkq
wimvo
Spi
wfip
D
1826 J. Opt. Soc. Am. B/Vol. 23, No. 9 /September 2006 Schneider et al.
ions that are shorter than the original pulse Ii�t� by fac-ors of �2 and �3. In the frequency domain, their band-idths are consequently widened by the same factor
ompared with Eq. (20). Hence the flattening in timeather suppresses high frequencies. Since the emission ofhe THz field E��� is proportional to the pump intensity���, the total emitted THz spectrum is effectively shiftedoward lower frequencies by TPA. From Eq. (30), one canee that this frequency shift increases with I0 and thusith the energy of the pump pulse.TPA also leads to a spatial flattening of the pump pulse
ntensity. In analogy to the above, the first two correctionerms have diameters of s /�2 and s /�3 if I��� is a Gauss-an as defined in Eq. (21). This affects the THz spectrumhrough changes in diffraction as in Eq. (28), mainly forow frequencies. However, the estimation there is stillalid; thus we expect no significant influence of the spa-ial pump pulse flattening on the emitted THz spectrum,rovided that the pump beam is unfocused.We will show in Section 5 that in DAST crystals the
ntensity-dependent changes in the emitted THz spec-rum due to TPA are small (see Subsection 5.D).
. Propagation Effects during Detectionor the coherent detection of the THz transients, we em-loyed conventional EO sampling9,10 and THz-inducedensing.25 In both methods, the THz electric field induceschange � in the phase of a copropagating optical probeulse (or one of its polarization components) through theinear EO effect (Pockels effect). A measurement of � as
function of the time delay td between the THz and therobe pulse allows the determination of ETHz�t�.The impact of dispersive THz propagation within the
etection crystal on the phase shift has been describedlsewhere.26,27 We resume the results by using a compre-ensive, slightly modified approach, with an emphasis onhe dependence of � on the crystal length.
Consider a probe pulse with the normalized amplitude�t� propagating through the crystal in the same way as
n Eq. (13). The group velocity vg is taken to be unaffectedy the THz field, since the induced relative index changen /no is small. The total phase shift � that is averagedver the probe pulse duration and accumulated over theropagation through the EO detection crystal, which
anges from z=0 to z=L, is given by t��td� = ko�0
L�R
n�z,t�A�t − �ngz/c� − td�dtdz, �31�
here t is the time at which the pulse entered the crystal,o=�o /c is the wavenumber of the probe beam with fre-uency �o, and
n�z,t� = −no
3
2rETHz�z,t�, �32�
ith r as the active Pockels coefficient for the given polar-zations of ETHz and the probe pulse. In the case that
ore than one element of the r tensor is active, the indi-idual phase shifts have to be added. The spectrum ����f the induced phase shift is
���� = − ko
no3
2r�
0
L � �R2
ETHz�z,t�A�t − �ngz/c� − td�
exp�i�td�dtdtddz
= − ko
no3
2rA����
0
L
ETHz�z,��exp − i�ng
cz�dz.
�33�
ince the THz pulse undergoes linear absorption and dis-ersion within the crystal, its spectrum at the position zs given by
ETHz��,z� = Ei���exp�−����
2z�exp�i
�n���
cz� , �34�
here Ei��� is the complex spectrum of the THz electriceld at the crystal entrance after Fresnel reflection. Thehase shift is thus
���� = ko
no3
2rA���
1 − exp�−����
2z�exp�i
�
c�n��� − ng�z�
−����
2− i
�
c�n��� − ng�
Ei���.
�35�
efining an effective detection length Ldet��� in analogy
o the effective generation length Lgen��� in Eq. (19),Ldet��� = �exp�− �T���z� + 1 − 2 exp�−�T���
2z�cos��
c�n��� − ng�z�
��T���
2 �2
+ �
c �2
�n��� − ng�2 �1/2
, �36�
wa
ptstE1s==
ll�phtT
CIctamf
ohwIddl
ah(
lmL
Wbtt
utt0ti�2
dr(tmiiwigilfa
3CAT-nsrtz11pd1cs
BTi−iaor�bwet2l
etc
Schneider et al. Vol. 23, No. 9 /September 2006 /J. Opt. Soc. Am. B 1827
e may write the absolute value of the phase shift ����s
���� = ko
no3
2rA���Ldet���Ei���. �37�
The spectrum that is measured by EO sampling is thusroportional to that of the THz pulse, filtered by two mul-iplicative factors A��� and Ldet���. The function A��� isolely determined by the temporal shape and the length ofhe probe pulse. For a Gaussian pulse with A�t��I�t� as inq. (20) with �=64 fs, corresponding to a pulse length of50 fs (FWHM), the function A��� reduces the detectionensitivity by a factor of 0.13 for a frequency =� /2�5 THz, by 0.02 for =7 THz, and by 310−4 for 10 THz.The second filtering function is the effective detection
ength Ldet. It is identical to the effective generationength Lgen��� in the case of vanishing optical absorptiono. Hence the detection sensitivity does not depend on �o,rovided that the transmitted probe pulse energy remainsigh enough to be measured. In the time domain, the fil-ering effect of Ldet��� corresponds to a distortion of theHz waveform.26
. Optimization of the Crystal Lengthn this subsection we will derive an expression for the cal-ulation of the optimum crystal length lo for the genera-ion and detection of a THz pulse in the presence of THzbsorption. The value Lmax���ªLgen�� ,z= lo� is then aeasure for the highest possible conversion efficiency
rom optical intensity I0��� to the THz electric field E���.In the absence of absorption, the conversion efficiency
f a nonlinear process reaches a maximum after the co-erence length lc=� /k, where k is the difference of theave vectors that are involved in the nonlinear process.
n collinear geometries, k is proportional to the indexifference.23 Likewise, the effective lengths Lgen and Ldetefined in the previous subsections are at maximum after
c,
lo = lc =�c
��n��� − ng���o = �T = 0�, �38�
nd we find Lmax= �2/��lo. Note that in this case the co-erence length depends on the optical group index ng [Eq.
14)] rather than on the optical refractive index n.28
For nonvanishing THz absorption, the optimum lengtho cannot be calculated analytically. However, an approxi-ative solution may be found by a Taylor expansion of
gen�z� up to second order around z= lc:
lo��T,lc� = lc −2
�T��1 + 2
�T2
4�1 + exp�− �Tlc/2��
�
lc�2
−�T
2
4exp�− �Tlc/2�
− 1�1/2
� .
�39�
e assumed �o=0; the approximation is thus valid foroth Lgen and Ldet. We evaluated Eq. (19) also numericallyo find lo and Lmax, and we compared these values withhose from Eq. (39). Although the deviation in l ranges
op to 10% for �T�1/ lc [i.e., if the limitation of the effec-ive length Lgen in Eq. (19) is due to absorption ratherhan due to velocity mismatch], Lmax is correct within.1%, since the function Lgen�z� is flat in the proximity ofhe extremum. Hence Lmax may be found by one’s insert-ng z= lo from Eq. (39) into Eq. (19). For velocity matchingng=n����, lo becomes infinite; however, Lgen converges to/�T.For determining the best thickness of a generation or
etection crystal or both, Lgen ought to be large over theange of frequencies that are emitted locally [see, e.g., Eq.20)]. Therefore we calculate for which crystal lengths zhe effective generation length Lgen�z� is close to its maxi-um value Lmax. In the case of velocity matching, Lgen�z�
s above 0.8Lmax for z�1.61Lmax. For �=0, the 80% limits reached within the interval 0.93Lmax�z�2.21Lmax,ith the maximum at �� /2�Lmax. Generally, i.e., for veloc-
ty mismatch and nonvanishing absorption, one sees thateneration and detection efficiency of more than 80% ofts theoretical maximum is achieved if the crystal lengthies between 1.6 and 2.2 times Lmax, which is calculatedrom absorption and refractive index data with Eqs. (19)nd (39).
. ORGANIC NONLINEAR OPTICALRYSTAL DAST. Crystal Preparationhe molecular crystal DAST (4-N ,N-dimethylamino-4�
N�-methyl stilbazolium tosylate) is known for its largeonlinear and EO coefficients.15,29 For our experiments,ingle crystals were grown in-house from a supersatu-ated solution in methanol. After a growth period of one tohree days at a constant temperature in the metastableone,30 we obtained c plates that were between 0.1 andmm in width and possessed an area of between 4 and0 mm2. The crystals were removed from the solution andolished on both sides, i.e., on the ab planes, using stan-ard techniques to a surface roughness of less than00 nm root-mean-square, measured by atomic force mi-roscopy. Optical microscopy between crossed polarizershowed the crystals to be single crystalline.
. Linear Optical Propertieshe refractive indices of DAST single crystals in the near
nfrared15,31 show extraordinarily high birefringence (n1n2=0.8 at 800 nm, where n1 and n2 correspond to polar-
zations along the dielectric x1 and x2 axes, respectively)s can be expected from the highly aligned arrangementf the chromophores. The dispersion in the transparencyange (700 to 1650 nm29), where the absorption coefficiento is below 2 cm−1 for all three polarizations, is governedy single electronic resonances between 500 and 540 nm,hose absorption has also been observedxperimentally.32 This dispersion leads to a large varia-ion of the optical group index ng,1 from 3.38 at 800 nm to.24 at 1600 nm, which is relevant for the strong wave-ength dependence of THz generation.
By THz time-domain spectroscopy (THz-TDS), Walthert al. observed a strong resonance at 1.1 THz, which is at-ributed to a transverse optical (TO) phonon, the anion–ation vibration. It dominates the linear properties in the
Tofa
3m2ataamsdbitlatSth
ncq�o
Tn(cm
tmtF
sdTt
(tpcossFqm3
CTsnrrr
(r
wemowb
m
FCt3
Fda
1828 J. Opt. Soc. Am. B/Vol. 23, No. 9 /September 2006 Schneider et al.
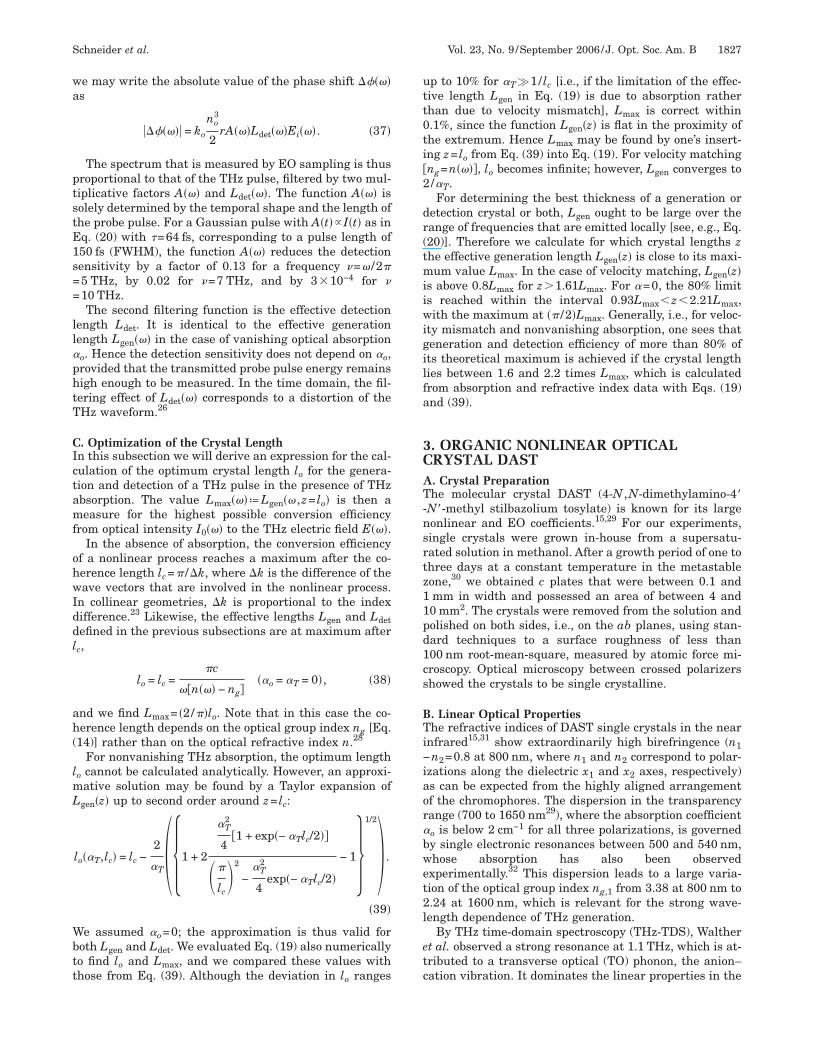
Hz range for x1 polarization,33 resulting in a dispersionf n1 from 2.3 to 3.0 below the resonance frequency androm 1.8 to 2.3 above it and in an absorption constant �1bove 100 cm−1 between 0.9 and 1.3 THz.However, the published data are limited to below
.0 THz. Therefore we also carried out a THz-TDS experi-ent and measured n1 and �1 up to 4.1 THz (Figs. 1 and
). Below the resonance frequency of 1.1 THz, our datagree well with those previously published. However, be-ween 1.4 and 2.8 THz, we measured values n1 that werebout 0.03 higher than those of Walther et al. The system-tic experimental error of n=0.01 is the same in botheasurements and is due to the uncertainty in the
ample thickness (250±2 �m in our experiment); thus theiscrepancy between our and the published data cannote fully explained. An additional feature that manifestedtself as a kink in n1 at 3 THz was observed. We believehat this is due to a second phonon resonance that alsoeads to the absorption line that Taniuchi et al.21 reportedt 3.1 THz. It is indirectly confirmed by the decrease inhe amplitude in a typical THz spectrum from DAST (seeubsection 5.A). The curve plotted in Fig. 1 is the sum ofwo Lorentzian line shapes as it follows from thearmonic-oscillator model:
n��� = n� + �i=1,2
ai��i2 − �2�
��i2 − �2�2 + 4�i
2�2. �40�
�=2.316 is the limit of the refractive index for frequen-ies much higher than the highest-lying oscillator fre-uency. The plotted curve of the absorption coefficient��� in Fig. 2 is composed of the contributions of the samescillators:
ig. 1. Refractive index n1 of DAST between 1.3 and 4.1 THz.ircles, measured data; solid curve, calculation of n1 based on
he harmonic-oscillator model with two oscillators at 1.10 and.05 THz.
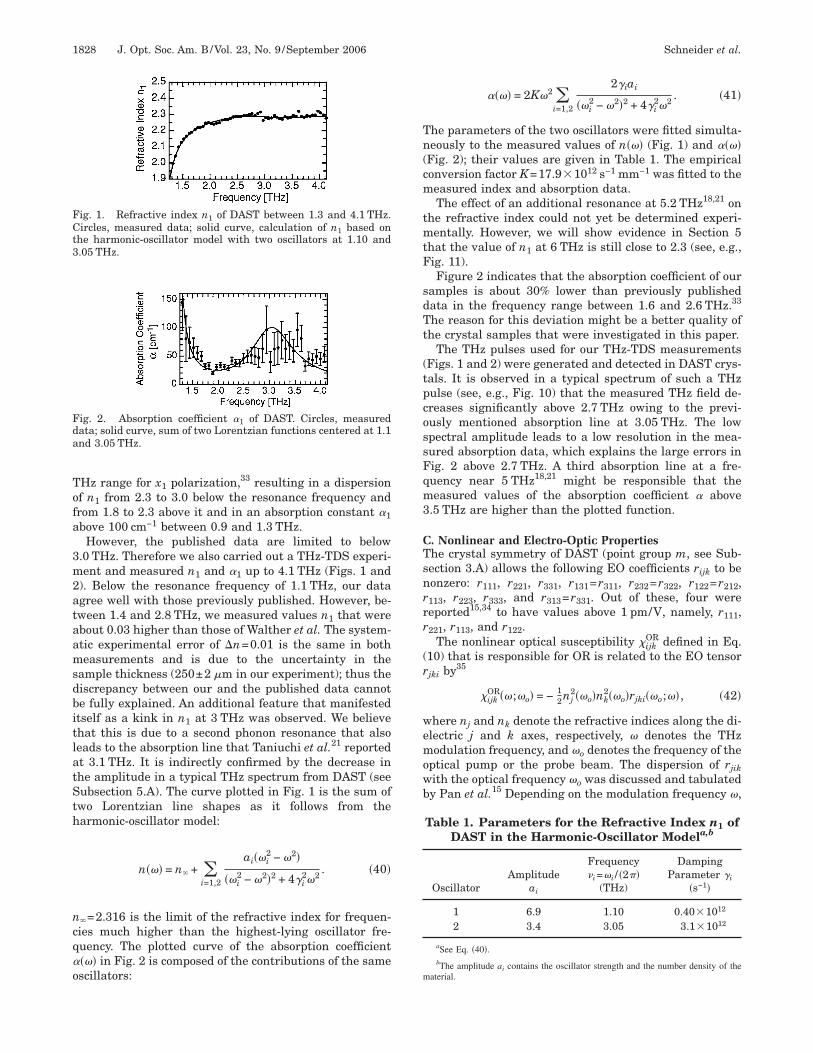
ig. 2. Absorption coefficient �1 of DAST. Circles, measuredata; solid curve, sum of two Lorentzian functions centered at 1.1nd 3.05 THz.
���� = 2K�2 �i=1,2
2�iai
��i2 − �2�2 + 4�i
2�2. �41�
he parameters of the two oscillators were fitted simulta-eously to the measured values of n��� (Fig. 1) and ����
Fig. 2); their values are given in Table 1. The empiricalonversion factor K=17.91012 s−1 mm−1 was fitted to theeasured index and absorption data.The effect of an additional resonance at 5.2 THz18,21 on
he refractive index could not yet be determined experi-entally. However, we will show evidence in Section 5
hat the value of n1 at 6 THz is still close to 2.3 (see, e.g.,ig. 11).Figure 2 indicates that the absorption coefficient of our
amples is about 30% lower than previously publishedata in the frequency range between 1.6 and 2.6 THz.33
he reason for this deviation might be a better quality ofhe crystal samples that were investigated in this paper.
The THz pulses used for our THz-TDS measurementsFigs. 1 and 2) were generated and detected in DAST crys-als. It is observed in a typical spectrum of such a THzulse (see, e.g., Fig. 10) that the measured THz field de-reases significantly above 2.7 THz owing to the previ-usly mentioned absorption line at 3.05 THz. The lowpectral amplitude leads to a low resolution in the mea-ured absorption data, which explains the large errors inig. 2 above 2.7 THz. A third absorption line at a fre-uency near 5 THz18,21 might be responsible that theeasured values of the absorption coefficient � above
.5 THz are higher than the plotted function.
. Nonlinear and Electro-Optic Propertieshe crystal symmetry of DAST (point group m, see Sub-ection 3.A) allows the following EO coefficients rijk to beonzero: r111, r221, r331, r131=r311, r232=r322, r122=r212,113, r223, r333, and r313=r331. Out of these, four wereeported15,34 to have values above 1 pm/V, namely, r111,221, r113, and r122.
The nonlinear optical susceptibility �ijkOR defined in Eq.
10) that is responsible for OR is related to the EO tensorjki by35
�ijkOR��;�o� = − 1
2nj2��o�nk
2��o�rjki��o;��, �42�
here nj and nk denote the refractive indices along the di-lectric j and k axes, respectively, � denotes the THzodulation frequency, and �o denotes the frequency of the
ptical pump or the probe beam. The dispersion of rjikith the optical frequency �o was discussed and tabulatedy Pan et al.15 Depending on the modulation frequency �,
Table 1. Parameters for the Refractive Index n1 ofDAST in the Harmonic-Oscillator Modela,b
OscillatorAmplitude
ai
Frequency i=�i / �2��
(THz)
DampingParameter �i
�s−1�
1 6.9 1.10 0.401012
2 3.4 3.05 3.11012
aSee Eq. �40�.bThe amplitude ai contains the oscillator strength and the number density of the
aterial.
sd
rcttqiRitprfclteontrr
al
DIdtaisaeeldfidomSL
dtcntaWt
1Ddlat�cct
ttTtf�(Tpsp�rlatawf
auqsF�ta
v
FD
Schneider et al. Vol. 23, No. 9 /September 2006 /J. Opt. Soc. Am. B 1829
everal contributions to the r tensor may beistinguished36:
r��� = ra��� + ro��� + re���. �43�
e��� is the electronic response with resonance frequen-ies in the optical spectral range; it remains constanthroughout the THz range. The contribution of the acous-ic phonons, ra, is limited to kilohertz and megahertz fre-uencies; thus it does not play a role in the THz regime. ro
s due to optical phonons that are both infrared active andaman active. Since there is no absorption line observed
n the measurements described in Subsection 3.B belowhe one at 1.1 THz, it may be assumed that there is nohonon contributing to ro��� below 1.1 THz, and thato��� has the same value in the sub-THz range as at radiorequencies. We conclude that the so-called clamped EOoefficient rs���=ro���+re��� has to be used for the calcu-ation of �OR in Eq. (42). Above 1.1 THz it may deviate byhe contribution of the phonon at this frequency, but westimate that this deviation is at most of the order of 20%f ro��� [or 5% of rs���], since there are at least four inter-al vibration modes of the stilbazolium chromophore be-ween 1160 and 1580 cm−1 (35 to 48 THz� that are infra-ed and Raman active and constitute the main part ofo���.36
In Table 2 we present the relevant EO coefficients rijknd nonlinear susceptibilities �kij
OR for two selected wave-engths.
. Velocity-Matching Configurationsn Section 2, we demonstrated from theory that a smalleviation n between the optical group index ng��� andhe THz refractive index n��� has a large impact on themplitude of the emitted THz field (velocity matching). Its important to note that the requirement for n is lesstrict than for other nonlinear conversion processes suchs second-harmonic generation (SHG) because the coher-nce length is proportional to the wavelength of the gen-rated radiation, which is thus 2 orders of magnitudearger for THz generation than for SHG with equal indexifferences. In the following, we investigate which con-gurations of the crystal orientation and the polarizationirection may be used for the velocity-matched generationf THz pulses in DAST, and we compute and plot theaximum effective generation length Lmax defined inubsection 2.C. The material parameters that determine
are the optical group index n ���, the refractive in-
Table 2. Largest Electro-Optic Coefficients rijk andNonlinear Susceptibilities, �kij
OR of DASTa
Wavelength�nm� r111 r221 r113 r122
b
800 77±8 42±4 15±2 17±1.51535 47±8 21±4 5±1 —
�111OR �122
OR �311OR �212
OR
800 1230±130 166±16 239±32 135±121535 490±90 69±13 52±10 —
aValues of r from Pan et al.15 and those of �OR calculated with Eq. �42�. Absolutealues in units of picometers per volt.
bFrom Spreiter.34
max g
ex n��� in the THz spectral range, and the THz absorp-ion ����; �o is negligibly small. The values for ng��� werealculated analytically from the Sellmeier functions for1��� and n2���15; those of the THz refractive indices arehe two-oscillator function shown in Fig. 1 for n1��� andn analogous three-oscillator function fitted to the data ofalther et al.33 for n2���. The absorption function �1��� is
he one plotted in Fig. 2.
. c PlatesAST surfaces with optical quality are most easily pro-uced in the ab plane (see Subsection 3.A). The eigenpo-arizations of both optical and THz beams are thereforelong the a or the b axis, which allows the use of two ofhe four elements of the �OR tensor in Table 2, namely,
111OR and �122
OR , for a beam direction perpendicular to therystal surface. (The small nonzero angle between therystallographic a and the dielectric x1 axes, respectively,he c and the x3 axes, may be neglected.)
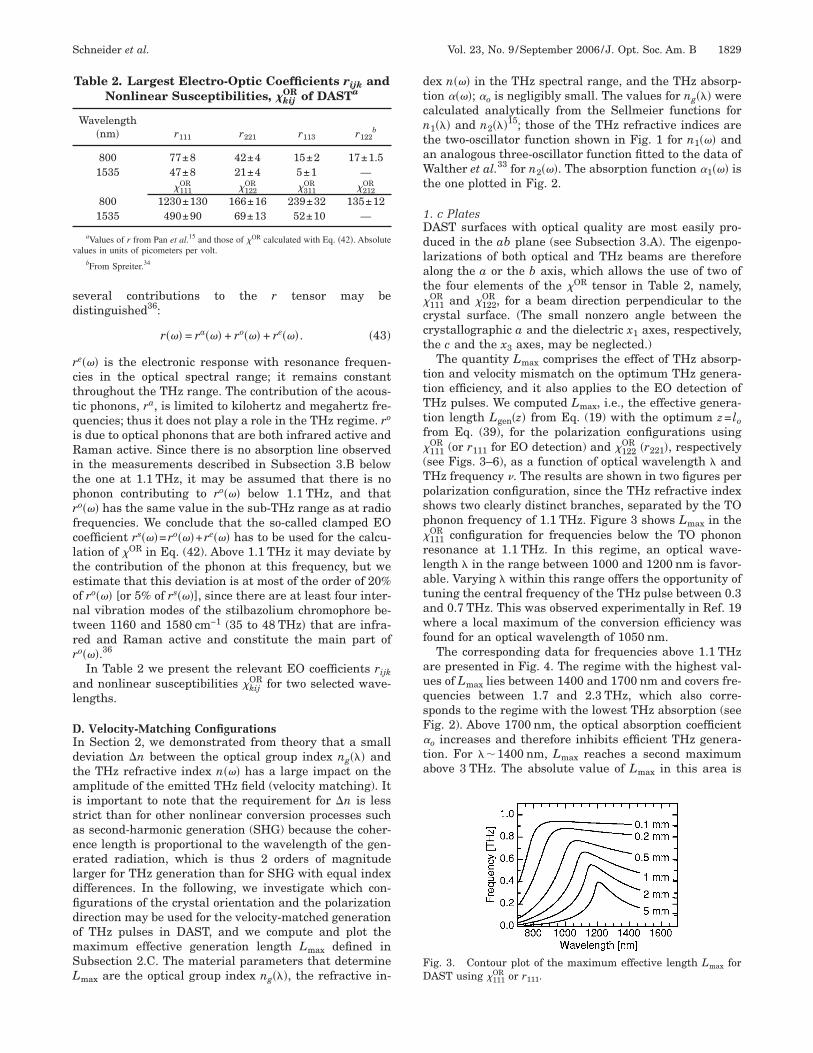
The quantity Lmax comprises the effect of THz absorp-ion and velocity mismatch on the optimum THz genera-ion efficiency, and it also applies to the EO detection ofHz pulses. We computed Lmax, i.e., the effective genera-ion length Lgen�z� from Eq. (19) with the optimum z= lorom Eq. (39), for the polarization configurations using
111OR (or r111 for EO detection) and �122
OR �r221�, respectivelysee Figs. 3–6), as a function of optical wavelength � andHz frequency . The results are shown in two figures perolarization configuration, since the THz refractive indexhows two clearly distinct branches, separated by the TOhonon frequency of 1.1 THz. Figure 3 shows Lmax in the
111OR configuration for frequencies below the TO phononesonance at 1.1 THz. In this regime, an optical wave-ength � in the range between 1000 and 1200 nm is favor-ble. Varying � within this range offers the opportunity ofuning the central frequency of the THz pulse between 0.3nd 0.7 THz. This was observed experimentally in Ref. 19here a local maximum of the conversion efficiency was
ound for an optical wavelength of 1050 nm.The corresponding data for frequencies above 1.1 THz
re presented in Fig. 4. The regime with the highest val-es of Lmax lies between 1400 and 1700 nm and covers fre-uencies between 1.7 and 2.3 THz, which also corre-ponds to the regime with the lowest THz absorption (seeig. 2). Above 1700 nm, the optical absorption coefficiento increases and therefore inhibits efficient THz genera-ion. For ��1400 nm, Lmax reaches a second maximumbove 3 THz. The absolute value of Lmax in this area is
ig. 3. Contour plot of the maximum effective length Lmax forAST using �OR or r .
111 111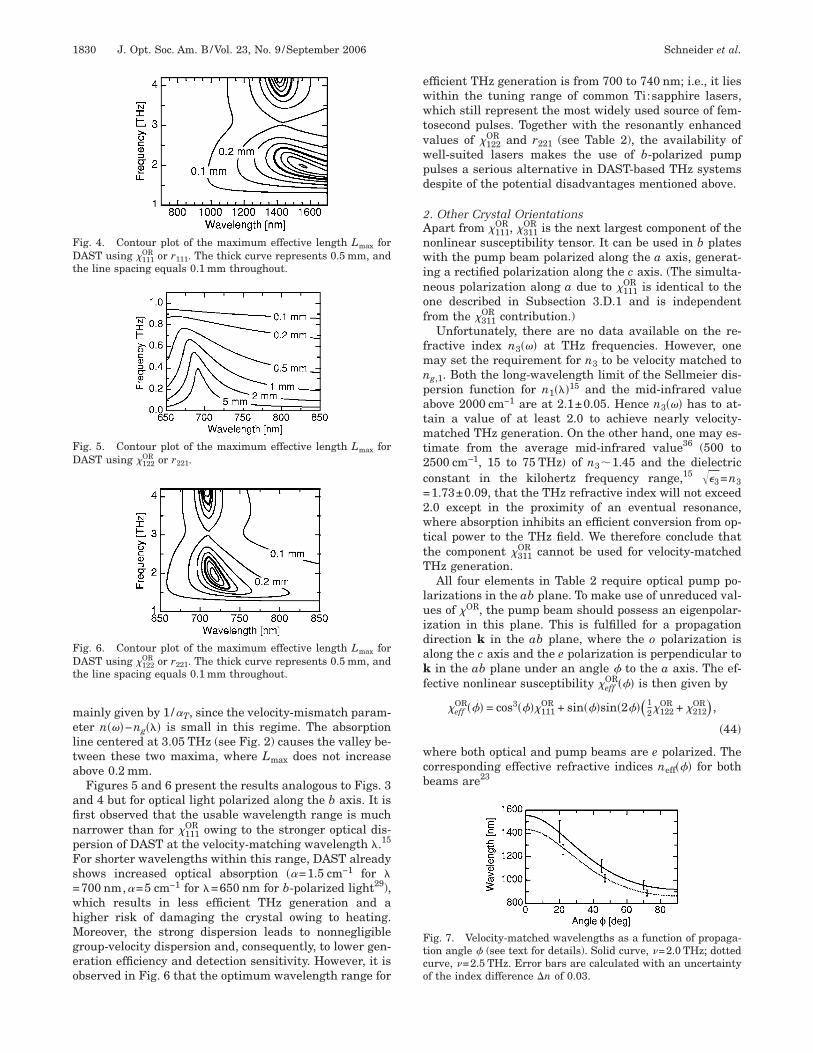
melta
afinpFs=whMgeo
ewwtvwpd
2Anwinof
fmnpatmt2c=2wttT
luidakf
wcb
FDt
FD
FDt
Ftco
1830 J. Opt. Soc. Am. B/Vol. 23, No. 9 /September 2006 Schneider et al.
ainly given by 1/�T, since the velocity-mismatch param-ter n���−ng��� is small in this regime. The absorptionine centered at 3.05 THz (see Fig. 2) causes the valley be-ween these two maxima, where Lmax does not increasebove 0.2 mm.Figures 5 and 6 present the results analogous to Figs. 3
nd 4 but for optical light polarized along the b axis. It isrst observed that the usable wavelength range is mucharrower than for �111
OR owing to the stronger optical dis-ersion of DAST at the velocity-matching wavelength �.15
or shorter wavelengths within this range, DAST alreadyhows increased optical absorption ��=1.5 cm−1 for �700 nm,�=5 cm−1 for �=650 nm for b-polarized light29),hich results in less efficient THz generation and aigher risk of damaging the crystal owing to heating.oreover, the strong dispersion leads to nonnegligible
roup-velocity dispersion and, consequently, to lower gen-ration efficiency and detection sensitivity. However, it isbserved in Fig. 6 that the optimum wavelength range for
ig. 4. Contour plot of the maximum effective length Lmax forAST using �111
OR or r111. The thick curve represents 0.5 mm, andhe line spacing equals 0.1 mm throughout.
ig. 5. Contour plot of the maximum effective length Lmax forAST using �122
OR or r221.
ig. 6. Contour plot of the maximum effective length Lmax forAST using �122
OR or r221. The thick curve represents 0.5 mm, andhe line spacing equals 0.1 mm throughout.
fficient THz generation is from 700 to 740 nm; i.e., it liesithin the tuning range of common Ti:sapphire lasers,hich still represent the most widely used source of fem-
osecond pulses. Together with the resonantly enhancedalues of �122
OR and r221 (see Table 2), the availability ofell-suited lasers makes the use of b-polarized pumpulses a serious alternative in DAST-based THz systemsespite of the potential disadvantages mentioned above.
. Other Crystal Orientationspart from �111
OR , �311OR is the next largest component of the
onlinear susceptibility tensor. It can be used in b platesith the pump beam polarized along the a axis, generat-
ng a rectified polarization along the c axis. (The simulta-eous polarization along a due to �111
OR is identical to thene described in Subsection 3.D.1 and is independentrom the �311
OR contribution.)Unfortunately, there are no data available on the re-
ractive index n3��� at THz frequencies. However, oneay set the requirement for n3 to be velocity matched to
g,1. Both the long-wavelength limit of the Sellmeier dis-ersion function for n1���15 and the mid-infrared valuebove 2000 cm−1 are at 2.1±0.05. Hence n3��� has to at-ain a value of at least 2.0 to achieve nearly velocity-atched THz generation. On the other hand, one may es-
imate from the average mid-infrared value36 (500 to500 cm−1, 15 to 75 THz� of n3�1.45 and the dielectriconstant in the kilohertz frequency range,15 ��3=n31.73±0.09, that the THz refractive index will not exceed.0 except in the proximity of an eventual resonance,here absorption inhibits an efficient conversion from op-
ical power to the THz field. We therefore conclude thathe component �311
OR cannot be used for velocity-matchedHz generation.All four elements in Table 2 require optical pump po-
arizations in the ab plane. To make use of unreduced val-es of �OR, the pump beam should possess an eigenpolar-
zation in this plane. This is fulfilled for a propagationirection k in the ab plane, where the o polarization islong the c axis and the e polarization is perpendicular toin the ab plane under an angle � to the a axis. The ef-
ective nonlinear susceptibility �effOR��� is then given by
�effOR��� = cos3����111
OR + sin���sin�2��� 12�122
OR + �212OR� ,
�44�
here both optical and pump beams are e polarized. Theorresponding effective refractive indices neff��� for botheams are23
ig. 7. Velocity-matched wavelengths as a function of propaga-ion angle � (see text for details). Solid curve, =2.0 THz; dottedurve, =2.5 THz. Error bars are calculated with an uncertaintyf the index difference n of 0.03.
WaTd�
dat(als�fiErftt
4a
4FDawlMetoPtietpt
popscmDpibdr�p
5AWindEsupt(tot�mLtiesvt
qn
FoEpT
Foiuca
Schneider et al. Vol. 23, No. 9 /September 2006 /J. Opt. Soc. Am. B 1831
1
neff2 ���
=cos2���
n12 +
sin2���
n22 . �45�
ith these values, one can calculate the index differencen as a function of optical wavelength �, THz frequency ,nd angle �. We focus on the frequency range between theHz absorption lines at 1.1 and 3.05 THz. The depen-ence of the velocity-matching wavelength � on the anglefor two selected THz frequencies is plotted in Fig. 7.For small angles �, the velocity-matching wavelength
oes not deviate significantly from the one describedbove for c plates using �111
OR . For � close to 90°, the effec-ive nonlinear susceptibility �eff
OR��� drops to zero [Eq.44)]. Thus the area of potential benefit is for anglesround 45° that are matched or nearly matched to wave-engths between 1000 and 1200 nm. This implies the pos-ibility of using neodymium-doped lasers with �1064 nm. Although the exact dispersion of the �OR coef-
cients is not known, one may estimate from Table 2 andq. (44) that �eff
OR �45° � is of the order of 300 pm/V, whichesults in a strong rectified polarization. However, theact that the THz absorption for b polarization is strongerhan for a polarization may lead to a severe attenuation ofhe emitted THz radiation.
Owing to the lack of crystals that were oriented under5° to the a and b axes, we were not able to verify thebove calculations experimentally.
. EXPERIMENTSor the generation of the THz pulses, we used a series ofAST crystals with different thicknesses between 0.16nd 0.69 mm, grown in our laboratory. The laser sourceas an amplified Ti:sapphire laser with a central wave-
ength of 776 nm and a repetition rate of 1 kHz (Clark-XR, CPA 2001). Typical pulse parameters were an en-
rgy of 0.8 mJ and duration of 160 fs FWHM. Theunability of the wavelength was achieved by means of anptical parametric generator–amplifier (Quantronix, TO-AS). The parametric signal wave was tunable from 1100o 1600 nm with pulse energies of the order of 50 �J, vary-ng with wavelength. With optional frequency doubling ofither signal or idler wave, the tuning range was ex-ended down to 550 nm. The FWHM length of the laserulses in the experiment was measured by autocorrela-ion to be between 130 and 140 fs.
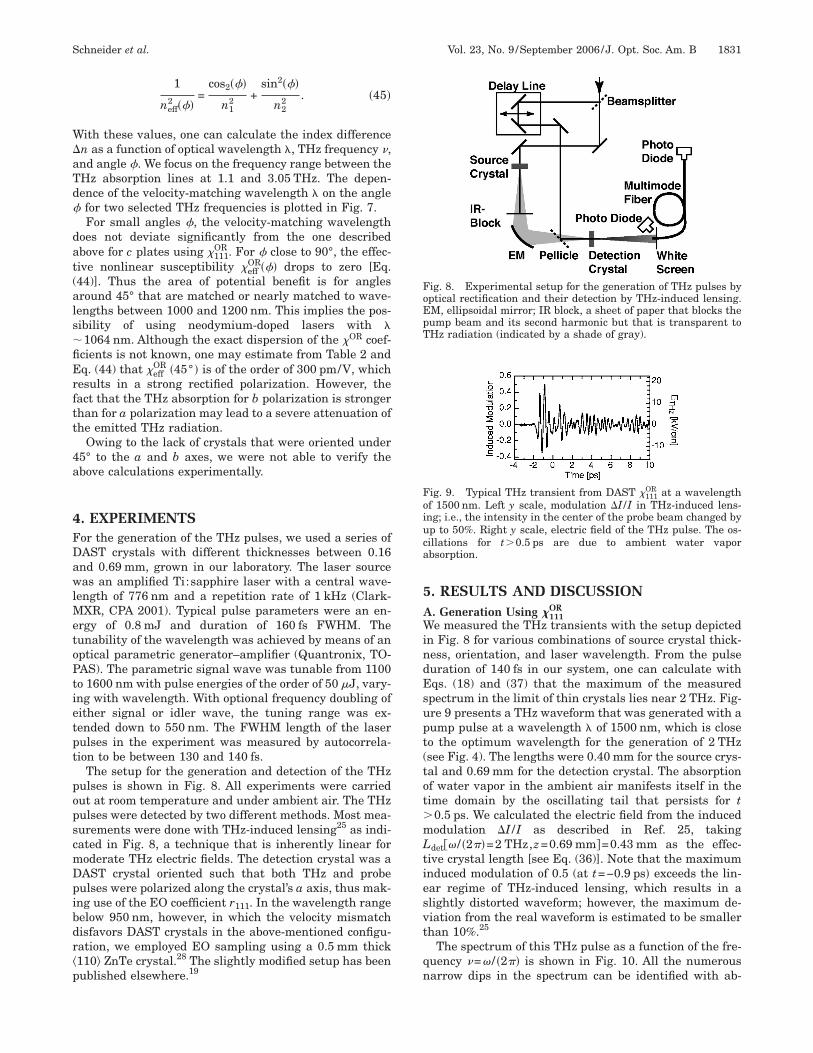
The setup for the generation and detection of the THzulses is shown in Fig. 8. All experiments were carriedut at room temperature and under ambient air. The THzulses were detected by two different methods. Most mea-urements were done with THz-induced lensing25 as indi-ated in Fig. 8, a technique that is inherently linear foroderate THz electric fields. The detection crystal was aAST crystal oriented such that both THz and probeulses were polarized along the crystal’s a axis, thus mak-ng use of the EO coefficient r111. In the wavelength rangeelow 950 nm, however, in which the velocity mismatchisfavors DAST crystals in the above-mentioned configu-ation, we employed EO sampling using a 0.5 mm thick110� ZnTe crystal.28 The slightly modified setup has beenublished elsewhere.19
. RESULTS AND DISCUSSION. Generation Using �111
OR
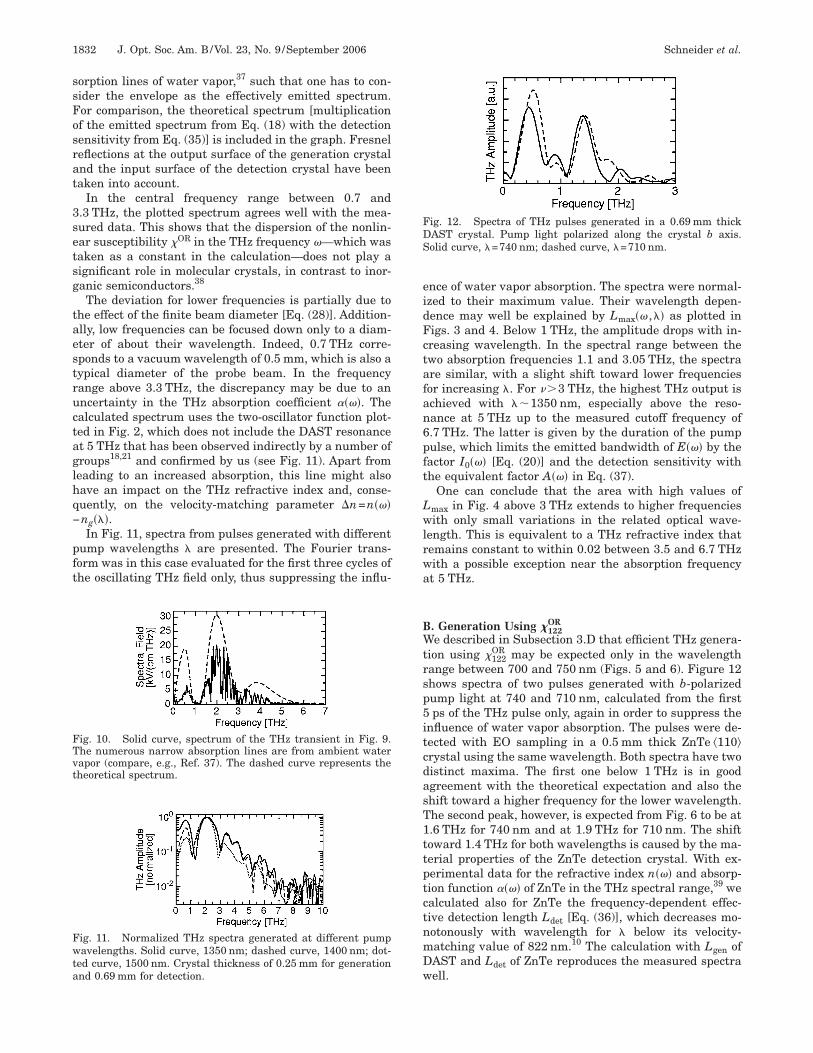
e measured the THz transients with the setup depictedn Fig. 8 for various combinations of source crystal thick-ess, orientation, and laser wavelength. From the pulseuration of 140 fs in our system, one can calculate withqs. (18) and (37) that the maximum of the measuredpectrum in the limit of thin crystals lies near 2 THz. Fig-re 9 presents a THz waveform that was generated with aump pulse at a wavelength � of 1500 nm, which is closeo the optimum wavelength for the generation of 2 THzsee Fig. 4). The lengths were 0.40 mm for the source crys-al and 0.69 mm for the detection crystal. The absorptionf water vapor in the ambient air manifests itself in theime domain by the oscillating tail that persists for t0.5 ps. We calculated the electric field from the inducedodulation I /I as described in Ref. 25, taking
det�� / �2��=2 THz,z=0.69 mm�=0.43 mm as the effec-ive crystal length [see Eq. (36)]. Note that the maximumnduced modulation of 0.5 (at t=−0.9 ps� exceeds the lin-ar regime of THz-induced lensing, which results in alightly distorted waveform; however, the maximum de-iation from the real waveform is estimated to be smallerhan 10%.25
The spectrum of this THz pulse as a function of the fre-uency =� / �2�� is shown in Fig. 10. All the numerousarrow dips in the spectrum can be identified with ab-
ig. 8. Experimental setup for the generation of THz pulses byptical rectification and their detection by THz-induced lensing.M, ellipsoidal mirror; IR block, a sheet of paper that blocks theump beam and its second harmonic but that is transparent toHz radiation (indicated by a shade of gray).
ig. 9. Typical THz transient from DAST �111OR at a wavelength
f 1500 nm. Left y scale, modulation I /I in THz-induced lens-ng; i.e., the intensity in the center of the probe beam changed byp to 50%. Right y scale, electric field of the THz pulse. The os-illations for t�0.5 ps are due to ambient water vaporbsorption.
ssFosrat
3setsg
taestructaglhq−
pft
eidFctafan6pft
Lwlrwa
BWtrsp5itcdasT1ttptctnmDw
FTvt
Fwta
FDS
1832 J. Opt. Soc. Am. B/Vol. 23, No. 9 /September 2006 Schneider et al.
orption lines of water vapor,37 such that one has to con-ider the envelope as the effectively emitted spectrum.or comparison, the theoretical spectrum [multiplicationf the emitted spectrum from Eq. (18) with the detectionensitivity from Eq. (35)] is included in the graph. Fresneleflections at the output surface of the generation crystalnd the input surface of the detection crystal have beenaken into account.
In the central frequency range between 0.7 and.3 THz, the plotted spectrum agrees well with the mea-ured data. This shows that the dispersion of the nonlin-ar susceptibility �OR in the THz frequency �—which wasaken as a constant in the calculation—does not play aignificant role in molecular crystals, in contrast to inor-anic semiconductors.38
The deviation for lower frequencies is partially due tohe effect of the finite beam diameter [Eq. (28)]. Addition-lly, low frequencies can be focused down only to a diam-ter of about their wavelength. Indeed, 0.7 THz corre-ponds to a vacuum wavelength of 0.5 mm, which is also aypical diameter of the probe beam. In the frequencyange above 3.3 THz, the discrepancy may be due to anncertainty in the THz absorption coefficient ����. Thealculated spectrum uses the two-oscillator function plot-ed in Fig. 2, which does not include the DAST resonancet 5 THz that has been observed indirectly by a number ofroups18,21 and confirmed by us (see Fig. 11). Apart fromeading to an increased absorption, this line might alsoave an impact on the THz refractive index and, conse-uently, on the velocity-matching parameter n=n���ng���.In Fig. 11, spectra from pulses generated with different
ump wavelengths � are presented. The Fourier trans-orm was in this case evaluated for the first three cycles ofhe oscillating THz field only, thus suppressing the influ-
ig. 10. Solid curve, spectrum of the THz transient in Fig. 9.he numerous narrow absorption lines are from ambient waterapor (compare, e.g., Ref. 37). The dashed curve represents theheoretical spectrum.
ig. 11. Normalized THz spectra generated at different pumpavelengths. Solid curve, 1350 nm; dashed curve, 1400 nm; dot-
ed curve, 1500 nm. Crystal thickness of 0.25 mm for generationnd 0.69 mm for detection.
nce of water vapor absorption. The spectra were normal-zed to their maximum value. Their wavelength depen-ence may well be explained by Lmax�� ,�� as plotted inigs. 3 and 4. Below 1 THz, the amplitude drops with in-reasing wavelength. In the spectral range between thewo absorption frequencies 1.1 and 3.05 THz, the spectrare similar, with a slight shift toward lower frequenciesor increasing �. For �3 THz, the highest THz output ischieved with ��1350 nm, especially above the reso-ance at 5 THz up to the measured cutoff frequency of.7 THz. The latter is given by the duration of the pumpulse, which limits the emitted bandwidth of E��� by theactor I0��� [Eq. (20)] and the detection sensitivity withhe equivalent factor A��� in Eq. (37).
One can conclude that the area with high values ofmax in Fig. 4 above 3 THz extends to higher frequenciesith only small variations in the related optical wave-
ength. This is equivalent to a THz refractive index thatemains constant to within 0.02 between 3.5 and 6.7 THzith a possible exception near the absorption frequencyt 5 THz.
. Generation Using �122OR
e described in Subsection 3.D that efficient THz genera-ion using �122
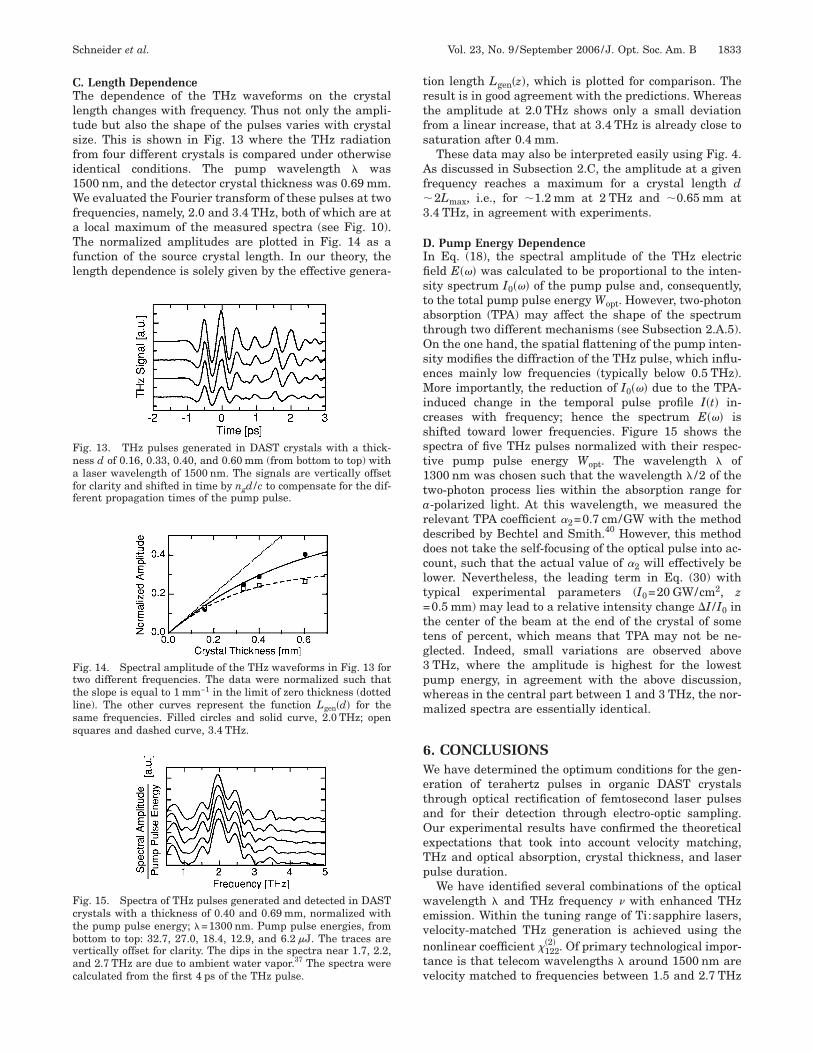
OR may be expected only in the wavelengthange between 700 and 750 nm (Figs. 5 and 6). Figure 12hows spectra of two pulses generated with b-polarizedump light at 740 and 710 nm, calculated from the firstps of the THz pulse only, again in order to suppress the
nfluence of water vapor absorption. The pulses were de-ected with EO sampling in a 0.5 mm thick ZnTe �110�rystal using the same wavelength. Both spectra have twoistinct maxima. The first one below 1 THz is in goodgreement with the theoretical expectation and also thehift toward a higher frequency for the lower wavelength.he second peak, however, is expected from Fig. 6 to be at.6 THz for 740 nm and at 1.9 THz for 710 nm. The shiftoward 1.4 THz for both wavelengths is caused by the ma-erial properties of the ZnTe detection crystal. With ex-erimental data for the refractive index n��� and absorp-ion function ���� of ZnTe in the THz spectral range,39 wealculated also for ZnTe the frequency-dependent effec-ive detection length Ldet [Eq. (36)], which decreases mo-otonously with wavelength for � below its velocity-atching value of 822 nm.10 The calculation with Lgen ofAST and Ldet of ZnTe reproduces the measured spectraell.
ig. 12. Spectra of THz pulses generated in a 0.69 mm thickAST crystal. Pump light polarized along the crystal b axis.olid curve, �=740 nm; dashed curve, �=710 nm.
CTltsfi1WfaTfl
trtfs
Af�3
DIfistatOseMicsst1tarddclt=ttg3pwm
6WetaOeTp
wevntv
Fnaff
Fttlss
Fctbvac
Schneider et al. Vol. 23, No. 9 /September 2006 /J. Opt. Soc. Am. B 1833
. Length Dependencehe dependence of the THz waveforms on the crystal
ength changes with frequency. Thus not only the ampli-ude but also the shape of the pulses varies with crystalize. This is shown in Fig. 13 where the THz radiationrom four different crystals is compared under otherwisedentical conditions. The pump wavelength � was500 nm, and the detector crystal thickness was 0.69 mm.e evaluated the Fourier transform of these pulses at two
requencies, namely, 2.0 and 3.4 THz, both of which are atlocal maximum of the measured spectra (see Fig. 10).
he normalized amplitudes are plotted in Fig. 14 as aunction of the source crystal length. In our theory, theength dependence is solely given by the effective genera-
ig. 13. THz pulses generated in DAST crystals with a thick-ess d of 0.16, 0.33, 0.40, and 0.60 mm (from bottom to top) withlaser wavelength of 1500 nm. The signals are vertically offset
or clarity and shifted in time by ngd /c to compensate for the dif-erent propagation times of the pump pulse.
ig. 14. Spectral amplitude of the THz waveforms in Fig. 13 forwo different frequencies. The data were normalized such thathe slope is equal to 1 mm−1 in the limit of zero thickness (dottedine). The other curves represent the function Lgen�d� for theame frequencies. Filled circles and solid curve, 2.0 THz; openquares and dashed curve, 3.4 THz.
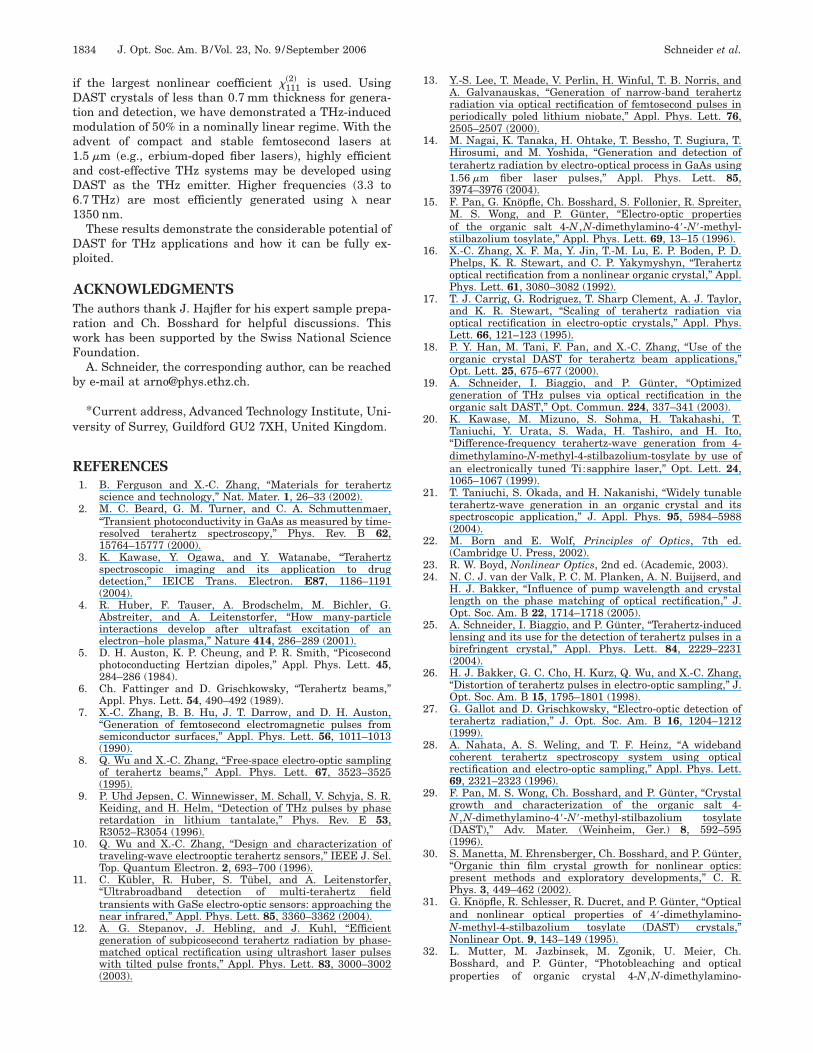
ig. 15. Spectra of THz pulses generated and detected in DASTrystals with a thickness of 0.40 and 0.69 mm, normalized withhe pump pulse energy; �=1300 nm. Pump pulse energies, fromottom to top: 32.7, 27.0, 18.4, 12.9, and 6.2 �J. The traces areertically offset for clarity. The dips in the spectra near 1.7, 2.2,nd 2.7 THz are due to ambient water vapor.37 The spectra werealculated from the first 4 ps of the THz pulse.
ion length Lgen�z�, which is plotted for comparison. Theesult is in good agreement with the predictions. Whereashe amplitude at 2.0 THz shows only a small deviationrom a linear increase, that at 3.4 THz is already close toaturation after 0.4 mm.
These data may also be interpreted easily using Fig. 4.s discussed in Subsection 2.C, the amplitude at a given
requency reaches a maximum for a crystal length d2Lmax, i.e., for �1.2 mm at 2 THz and �0.65 mm at
.4 THz, in agreement with experiments.
. Pump Energy Dependencen Eq. (18), the spectral amplitude of the THz electriceld E��� was calculated to be proportional to the inten-ity spectrum I0��� of the pump pulse and, consequently,o the total pump pulse energy Wopt. However, two-photonbsorption (TPA) may affect the shape of the spectrumhrough two different mechanisms (see Subsection 2.A.5).n the one hand, the spatial flattening of the pump inten-
ity modifies the diffraction of the THz pulse, which influ-nces mainly low frequencies (typically below 0.5 THz).ore importantly, the reduction of I0��� due to the TPA-
nduced change in the temporal pulse profile I�t� in-reases with frequency; hence the spectrum E��� ishifted toward lower frequencies. Figure 15 shows thepectra of five THz pulses normalized with their respec-ive pump pulse energy Wopt. The wavelength � of300 nm was chosen such that the wavelength � /2 of thewo-photon process lies within the absorption range for-polarized light. At this wavelength, we measured theelevant TPA coefficient �2=0.7 cm/GW with the methodescribed by Bechtel and Smith.40 However, this methodoes not take the self-focusing of the optical pulse into ac-ount, such that the actual value of �2 will effectively beower. Nevertheless, the leading term in Eq. (30) withypical experimental parameters (I0=20 GW/cm2, z0.5 mm) may lead to a relative intensity change I /I0 in
he center of the beam at the end of the crystal of someens of percent, which means that TPA may not be ne-lected. Indeed, small variations are observed aboveTHz, where the amplitude is highest for the lowestump energy, in agreement with the above discussion,hereas in the central part between 1 and 3 THz, the nor-alized spectra are essentially identical.
. CONCLUSIONSe have determined the optimum conditions for the gen-
ration of terahertz pulses in organic DAST crystalshrough optical rectification of femtosecond laser pulsesnd for their detection through electro-optic sampling.ur experimental results have confirmed the theoreticalxpectations that took into account velocity matching,Hz and optical absorption, crystal thickness, and laserulse duration.We have identified several combinations of the optical
avelength � and THz frequency with enhanced THzmission. Within the tuning range of Ti:sapphire lasers,elocity-matched THz generation is achieved using theonlinear coefficient �122
�2� . Of primary technological impor-ance is that telecom wavelengths � around 1500 nm areelocity matched to frequencies between 1.5 and 2.7 THz
iDtma1aD61
Dp
ATrwF
b
v
R
1
1
1
1
1
1
1
1
1
1
2
2
2
22
2
2
2
2
2
3
3
3
1834 J. Opt. Soc. Am. B/Vol. 23, No. 9 /September 2006 Schneider et al.
f the largest nonlinear coefficient �111�2� is used. Using
AST crystals of less than 0.7 mm thickness for genera-ion and detection, we have demonstrated a THz-inducedodulation of 50% in a nominally linear regime. With the
dvent of compact and stable femtosecond lasers at.5 �m (e.g., erbium-doped fiber lasers), highly efficientnd cost-effective THz systems may be developed usingAST as the THz emitter. Higher frequencies (3.3 to.7 THz) are most efficiently generated using � near350 nm.These results demonstrate the considerable potential of
AST for THz applications and how it can be fully ex-loited.
CKNOWLEDGMENTShe authors thank J. Hajfler for his expert sample prepa-ation and Ch. Bosshard for helpful discussions. Thisork has been supported by the Swiss National Scienceoundation.A. Schneider, the corresponding author, can be reached
y e-mail at [email protected].
*Current address, Advanced Technology Institute, Uni-ersity of Surrey, Guildford GU2 7XH, United Kingdom.
EFERENCES1. B. Ferguson and X.-C. Zhang, “Materials for terahertz
science and technology,” Nat. Mater. 1, 26–33 (2002).2. M. C. Beard, G. M. Turner, and C. A. Schmuttenmaer,
“Transient photoconductivity in GaAs as measured by time-resolved terahertz spectroscopy,” Phys. Rev. B 62,15764–15777 (2000).
3. K. Kawase, Y. Ogawa, and Y. Watanabe, “Terahertzspectroscopic imaging and its application to drugdetection,” IEICE Trans. Electron. E87, 1186–1191(2004).
4. R. Huber, F. Tauser, A. Brodschelm, M. Bichler, G.Abstreiter, and A. Leitenstorfer, “How many-particleinteractions develop after ultrafast excitation of anelectron–hole plasma,” Nature 414, 286–289 (2001).
5. D. H. Auston, K. P. Cheung, and P. R. Smith, “Picosecondphotoconducting Hertzian dipoles,” Appl. Phys. Lett. 45,284–286 (1984).
6. Ch. Fattinger and D. Grischkowsky, “Terahertz beams,”Appl. Phys. Lett. 54, 490–492 (1989).
7. X.-C. Zhang, B. B. Hu, J. T. Darrow, and D. H. Auston,“Generation of femtosecond electromagnetic pulses fromsemiconductor surfaces,” Appl. Phys. Lett. 56, 1011–1013(1990).
8. Q. Wu and X.-C. Zhang, “Free-space electro-optic samplingof terahertz beams,” Appl. Phys. Lett. 67, 3523–3525(1995).
9. P. Uhd Jepsen, C. Winnewisser, M. Schall, V. Schyja, S. R.Keiding, and H. Helm, “Detection of THz pulses by phaseretardation in lithium tantalate,” Phys. Rev. E 53,R3052–R3054 (1996).
0. Q. Wu and X.-C. Zhang, “Design and characterization oftraveling-wave electrooptic terahertz sensors,” IEEE J. Sel.Top. Quantum Electron. 2, 693–700 (1996).
1. C. Kübler, R. Huber, S. Tübel, and A. Leitenstorfer,“Ultrabroadband detection of multi-terahertz fieldtransients with GaSe electro-optic sensors: approaching thenear infrared,” Appl. Phys. Lett. 85, 3360–3362 (2004).
2. A. G. Stepanov, J. Hebling, and J. Kuhl, “Efficientgeneration of subpicosecond terahertz radiation by phase-matched optical rectification using ultrashort laser pulseswith tilted pulse fronts,” Appl. Phys. Lett. 83, 3000–3002(2003).
3. Y.-S. Lee, T. Meade, V. Perlin, H. Winful, T. B. Norris, andA. Galvanauskas, “Generation of narrow-band terahertzradiation via optical rectification of femtosecond pulses inperiodically poled lithium niobate,” Appl. Phys. Lett. 76,2505–2507 (2000).
4. M. Nagai, K. Tanaka, H. Ohtake, T. Bessho, T. Sugiura, T.Hirosumi, and M. Yoshida, “Generation and detection ofterahertz radiation by electro-optical process in GaAs using1.56 �m fiber laser pulses,” Appl. Phys. Lett. 85,3974–3976 (2004).
5. F. Pan, G. Knöpfle, Ch. Bosshard, S. Follonier, R. Spreiter,M. S. Wong, and P. Günter, “Electro-optic propertiesof the organic salt 4-N ,N-dimethylamino-4�-N�-methyl-stilbazolium tosylate,” Appl. Phys. Lett. 69, 13–15 (1996).
6. X.-C. Zhang, X. F. Ma, Y. Jin, T.-M. Lu, E. P. Boden, P. D.Phelps, K. R. Stewart, and C. P. Yakymyshyn, “Terahertzoptical rectification from a nonlinear organic crystal,” Appl.Phys. Lett. 61, 3080–3082 (1992).
7. T. J. Carrig, G. Rodriguez, T. Sharp Clement, A. J. Taylor,and K. R. Stewart, “Scaling of terahertz radiation viaoptical rectification in electro-optic crystals,” Appl. Phys.Lett. 66, 121–123 (1995).
8. P. Y. Han, M. Tani, F. Pan, and X.-C. Zhang, “Use of theorganic crystal DAST for terahertz beam applications,”Opt. Lett. 25, 675–677 (2000).
9. A. Schneider, I. Biaggio, and P. Günter, “Optimizedgeneration of THz pulses via optical rectification in theorganic salt DAST,” Opt. Commun. 224, 337–341 (2003).
0. K. Kawase, M. Mizuno, S. Sohma, H. Takahashi, T.Taniuchi, Y. Urata, S. Wada, H. Tashiro, and H. Ito,“Difference-frequency terahertz-wave generation from 4-dimethylamino-N-methyl-4-stilbazolium-tosylate by use ofan electronically tuned Ti:sapphire laser,” Opt. Lett. 24,1065–1067 (1999).
1. T. Taniuchi, S. Okada, and H. Nakanishi, “Widely tunableterahertz-wave generation in an organic crystal and itsspectroscopic application,” J. Appl. Phys. 95, 5984–5988(2004).
2. M. Born and E. Wolf, Principles of Optics, 7th ed.(Cambridge U. Press, 2002).
3. R. W. Boyd, Nonlinear Optics, 2nd ed. (Academic, 2003).4. N. C. J. van der Valk, P. C. M. Planken, A. N. Buijserd, and
H. J. Bakker, “Influence of pump wavelength and crystallength on the phase matching of optical rectification,” J.Opt. Soc. Am. B 22, 1714–1718 (2005).
5. A. Schneider, I. Biaggio, and P. Günter, “Terahertz-inducedlensing and its use for the detection of terahertz pulses in abirefringent crystal,” Appl. Phys. Lett. 84, 2229–2231(2004).
6. H. J. Bakker, G. C. Cho, H. Kurz, Q. Wu, and X.-C. Zhang,“Distortion of terahertz pulses in electro-optic sampling,” J.Opt. Soc. Am. B 15, 1795–1801 (1998).
7. G. Gallot and D. Grischkowsky, “Electro-optic detection ofterahertz radiation,” J. Opt. Soc. Am. B 16, 1204–1212(1999).
8. A. Nahata, A. S. Weling, and T. F. Heinz, “A widebandcoherent terahertz spectroscopy system using opticalrectification and electro-optic sampling,” Appl. Phys. Lett.69, 2321–2323 (1996).
9. F. Pan, M. S. Wong, Ch. Bosshard, and P. Günter, “Crystalgrowth and characterization of the organic salt 4-N ,N-dimethylamino-4�-N�-methyl-stilbazolium tosylate(DAST),” Adv. Mater. (Weinheim, Ger.) 8, 592–595(1996).
0. S. Manetta, M. Ehrensberger, Ch. Bosshard, and P. Günter,“Organic thin film crystal growth for nonlinear optics:present methods and exploratory developments,” C. R.Phys. 3, 449–462 (2002).
1. G. Knöpfle, R. Schlesser, R. Ducret, and P. Günter, “Opticaland nonlinear optical properties of 4�-dimethylamino-N-methyl-4-stilbazolium tosylate (DAST) crystals,”Nonlinear Opt. 9, 143–149 (1995).
2. L. Mutter, M. Jazbinsek, M. Zgonik, U. Meier, Ch.Bosshard, and P. Günter, “Photobleaching and opticalproperties of organic crystal 4-N ,N-dimethylamino-
3
3
3
3
33
3
4
Schneider et al. Vol. 23, No. 9 /September 2006 /J. Opt. Soc. Am. B 1835
4�-N�-methyl stilbazolium tosylate,” J. Appl. Phys. 94,1356–1361 (2003).
3. M. Walther, K. Jensby, S. R. Keiding, H. Takahashi, and H.Ito, “Far-infrared properties of DAST,” Opt. Lett. 25,911–913 (2000).
4. R. Spreiter, “Electro-optical effects in organic crystals,”Ph.D. thesis (ETH Zurich, 1999).
5. Ch. Bosshard, K. Sutter, Ph. Prêtre, J. Hulliger, M.Flörsheimer, P. Kaatz, and P. Günter, “Organic nonlinearoptical materials,” in Advances in Nonlinear Optics(Gordon and Breach, 1995), Vol. 1.
6. Ch. Bosshard, R. Spreiter, L. Degiorgi, and P. Günter,“Infrared and Raman spectroscopy of the organic crystalDAST: polarization dependence and contribution of
molecular vibrations to the linear electro-optic effect,”Phys. Rev. B 66, 205107 (2002).
7. See http://spec.jpl.nasa.gov.8. A. Leitenstorfer, S. Hunsche, J. Shah, M. C. Nuss, and W.
H. Knox, “Detectors and sources for ultrabroadbandelectro-optic sampling: experiment and theory,” Appl. Phys.Lett. 74, 1516–1518 (1999).
9. M. Schall, M. Walther, and P. Uhd Jepsen, “Fundamentaland second-order phonon processes in CdTe and ZnTe,”Phys. Rev. B 64, 094301 (2001).
0. J. H. Bechtel and W. L. Smith, “Two-photon absorption insemiconductors with picosecond laser pulses,” Phys. Rev. B13, 3515–3522 (1976).
Copyright © 2022 FDOKUMEN