POETICS Cultural classifications under discussion Latent ...

arX
iv:c
s/06
0706
6v1
[cs
.DL
] 1
3 Ju
l 200
6
Generalized h-index for Disclosing Latent Facts
in Citation Networks
Antonis Sidiropoulos1 Dimitrios Katsaros1,2 Yannis Manolopoulos1
1Informatics Dept., Aristotle University, Thessaloniki, Greece2Computer & Communications Engineering Dept., University of Thessaly, Volos, Greece
{antonis,dimitris,manolopo}@delab.csd.auth.gr
Abstract
What is the value of a scientist and its impact upon the scientific thinking? How can we measure
the prestige of a journal or of a conference? The evaluation of the scientific work of a scientist and
the estimation of the quality of a journal or conference has long attracted significant interest, due to
the benefits from obtaining an unbiased and fair criterion. Although it appears to be simple, defining
a quality metric is not an easy task. To overcome the disadvantages of the present metrics used for
ranking scientists and journals, J. E. Hirsch proposed a pioneering metric, the now famous h-index.
In this article, we demonstrate several inefficiencies of this index and develop a pair of generalizations
and effective variants of it to deal with scientist ranking and with publication forum ranking. The
new citation indices are able to disclose trendsetters in scientific research, as well as researchers that
constantly shape their field with their influential work, no matter how old they are. We exhibit
the effectiveness and the benefits of the new indices to unfold the full potential of the h-index, with
extensive experimental results obtained from DBLP, a widely known on-line digital library.
1 Introduction
The evaluation of the scientific work of a scientist has long attracted significant interest, due to the benefitsfrom obtaining an unbiased and fair criterion. Having defined such a metric we can use it for facultyrecruitment, promotion, prize awarding, funding allocation, comparison of personal scientific merit, etc.Similarly, the estimation of a publication forum’s (journal or conference) quality is of particular interest,since it impacts the scientists’ decisions about where to publish their work, the researchers’ preference inseeking for important articles, and so on.
Although, the issue of ranking a scientist or a journal/conference dates back to the seventies with theseminal work of Eugene Garfield [14] and continued with sparse publications e.g., [15, 17], during thelast five years we have witnessed a blossom of this field [3, 5, 6, 18, 19, 21, 22, 23, 24, 27, 29] due to theproliferation of digital libraries, which made available a huge amount of bibliographic data.
Until present there are two major popular ways for evaluating scientific work, and a hybrid ofthem. The first method is by allowing some contacted experts to perform the ranking and the sec-ond method is based on what is termed citation analysis, which involves examining an “item”’s (scien-tist/journal/conference) referring articles. An amalgamation of them is also possible, although it is moreclose to the latter approach.
The first method adopts an ad hoc approach, which works by collecting the opinion of differentexperts (or not) in a domain. The study reported in [22] focused in the area of Information Systems andperformed an on-line survey for 87 journals with 1000 respondents approximately, whereas the authorsof [21] conducted the most extensive survey to date of IS journal rankings. They collected responsesfrom 2559 respondents (32% of the 8741 targeted faculty members in 414 IS departments worldwide).Instead of using a predetermined journal list, they asked the respondents to freely nominate their top-fourresearch journals. This kind of works is very interesting, because they perform a ranking according toreaders’ (and authors’) perception, which is not always adequately expressed through citation analysis,but they suffer from the fact of being basically “manual” sometimes biased, and not highly computerized(automated) and objective.
On the other hand, the second way of evaluating the scientific work is by defining an objective functionthat calculates some “score” for the “objects” under evaluation, taking into account the graph structure
1

created by the citations among the published articles. Defining a quality and representative metric is notan easy task, since it should account for the productivity of a scientist and the impact of all of his/herwork (analogously for journals/conferences). Most of the existing methods up-to-date are based on someform of (arithmetics upon) the total number of authored papers, the average number of authored papersper year, the total number of citations, the average number of citations per paper, the average numberof citations per year, etc. A comprehensive description of many of them can be found at [30].
Finally, characteristic works implementing the hybrid approach of combining the experts’ judge andcitation analysis are described in [19, 32]. Their rankings are realized by taking some averages upon theresults obtained from the citation analysis and experts’ opinion, thus implementing a post-processingstep of the two major approaches.
1.1 Motivation for new citation indices
Although, there is no clear winner among citation analysis and experts’ assessment, the former methodis usually the preferred method, because it can be performed in a fully automated and computerizedmanner and it is able to exploit the wealth of citation information available in digital libraries.
All the metrics used so far in citation analysis, even those which are based on popular spectraltechniques, like HITS [20], PageRank [25] and its variations for bibliometrics, like [7], present one ormore of the following drawbacks (see also [16]):
• They do not measure the importance or impact of papers, e.g., the metrics based solely on the totalnumber of papers.
• They are affected by a small number of “big hits” articles, which received huge number of citations,whereas the rest of the articles may have negligible total impact, e.g., the metrics based on the totalnumber of citations.
• They can not measure productivity, e.g., the metrics based on the average number of citations perpaper.
• They have difficulty to set administrative parameters, e.g., the metrics based on the number x ofarticles, which have received y citations each, or the metrics based on the number z of the mostcited articles.
To collectively overcome all these disadvantages of the present metrics, last year J. E. Hirsch proposedthe pioneering h-index [16], which, in a short period of time, became extremely popular1. The h-index isdefined as follows:
Definition 1. A researcher has h-index h if h of his/her Np articles have received at least h citationseach, and the rest (Np − h) articles have received no more than h citations [1, 16].
This metric calculates how broad the research work of a scientist is. The h-index accounts for bothproductivity and impact. For some researcher, to have large h-index, s/he must have a lot of “good”articles, and not just a few “good” articles.
The h-index acts as a lower bound on the real number of citations for a scientist. In fact, there isa significant gap between the total number of citations as calculated by h-index and the real number ofcitations of a scientist. Think that the quantity h will always be smaller than or equal to the numberNp of the articles of a researcher; it holds that h2 ≤ Nc,tot, where Nc,tot is the total number of citationsthat the researcher has received. Apparently, the equality holds when all the articles, which contributeto h-index have received exactly h citations each, which is quite improbable. Therefore, in the usual caseit will hold that h2 < Nc,tot. To bridge this gap, J. E. Hirsch defined the index a as follows:
Definition 2. A scientist has a-index a if the following equation holds [16]:
Nc,tot = ah2. (1)
1Notice that the economics literature defines the H-index (the Herfindahl-Hirschman index), which is a way of measuringthe concentration of market share held by particular suppliers in a market. The H index is the sum of squares of thepercentages of the market shares held by the firms in a market. If there is a monopoly, i.e., one firm with all sales, the H
index is 10000. If there is perfect competition, with an infinite number of firms with near-zero market share each, the H
index is approximately zero. Other industry structures will have H indices between zero and 10000.
2

The a-index can be used as a second metric-index for the evaluation and ranking of scientists. Itdescribes the “magnitude” of each scientist’s “hits”. A large a implies that some article(s) have receiveda fairly large number of citations compared to the rest of its articles and with respect to what the h-indexpresents.
The introduction of the h-index was a major breakthrough in citation analysis. Though several aspectsof the inefficiency of the original h-index are apparent; or to state it in its real dimension, significant effortsare needed to unfold the full potential of h-index. Firstly, the original h-index assigns the same importanceto all citations, no matter what their age is, thus refraining from revealing the trendsetters scientists.Secondly, the h-index assigns the same importance to all articles, thus making the young researchers tohave a relatively small h-index, because they did not have enough time either to publish a lot of goodarticles, or time to accumulate large number of citation for their good papers. Thus, the h-index can notreveal the brilliant though young scientists.
1.2 Our contributions
The purpose of our work is to extend and generalize the original h-index in such ways, so as to revealvarious latent though strong facts hidden in citation networks. Our proposals aim to maintain the eleganceand ease of computation of the original h-index, thus we strive for developing relatively simple indexes,since we believe that the simplicity of the h-index is one of its beauties. In this context, the article makesthe following contributions:
• Introduces two generalizations of the h-index, namely the contemporary h-index and the trend h-index, which are appropriate for scientist ranking and are able to reveal brilliant young scientistsand trendsetters, respectively. These two generalizations can also be used for the cases of conferenceand journal ranking.
• Introduces a normalized version of the h-index for scientist ranking, namely the normalized h-index.
• Introduces two variants of the h-index appropriate for journal/conference ranking, namely the yearlyh-index and the normalized yearly h-index.
• Performs an extensive experimental evaluation of the aforementioned citation indices, using realdata from DBLP, an online bibliographic database.
Developing mathematical models and conducting theoretical analysis of the properties of the proposedindexes is the next step in this work, but it is beyond the scope of this paper; here we are interesting inproviding extensive experimental evidence of the power of the generalizations to the h-index.
The rest of this article is organized as follows: In Section 2, we present the novel citation indiceswhich are devised for scientist ranking. Section 3 presents the citation indices extending the h-index forjournal/conference ranking. We present the evaluation of the introduced citation indices in Section 4 andfinally, Section 5 summarizes the paper contributions and concludes the article.
2 Novel Citation Indices for Scientist Ranking
After the introduction of the h-index, a number of other proposals followed, either presenting case studiesusing it [2, 4, 9, 10, 26, 28], or describing a new variation of it [12] (aiming to bridge the gap betweenthe lower bound of total number of citations calculated by h-index and their real number), or studyingits mathematics and its performance [8, 11].
Deviating from their line of research, we develop in this article a pair of generalizations of the h-indexfor ranking scientists, which are novel citation indices, a normalized variant of the h-index and a pair ofvariants of the h-index suitable for journal/conference ranking.
The contemporary h-index.The original h-index does not take into account the “age” of an article. It may be the case that somescientist contributed a number of significant articles that produced a large h-index, but now s/he israther inactive or retired. Therefore, senior scientists, who keep contributing nowadays, or brilliant youngscientists, who are expected to contribute a large number of significant works in the near future but nowthey have only a small number of important articles due to the time constraint, are not distinguished by
3

the original h-index. Thus, arises the need to define a generalization of the h-index, in order to accountfor these facts.
We define a novel score Sc(i) for an article i based on citation counting, as follows:
Sc(i) = γ ∗ (Y (now) − Y (i) + 1)−δ ∗ |C(i)| (2)
where Y (i) is the publication year of article i and C(i) are the articles citing the article i. If we set δ=1,then Sc(i) is the number of citations that the article i has received, divided by the “age” of the article.Since, we divide the number of Citations with the time interval, the quantities Sc(i) will be too small tocreate a meaningful h-index; thus, we use the coefficient γ. In our experiments, reported in Sections 4,we use the value of 4 for the coefficient γ. Thus, for an article published during the current year, itscitations account four times. For an article published 4 year ago, its citations account only one time. Foran article published 6 year ago, its citations account 4
6 times, and so on.This way, an old article gradually loses its “value”, even if it still gets citations. In other words, in
the calculations we mainly take into account the newer articles2. Therefore, we define a novel citationindex for scientist rankings, the contemporary h-index, expressed as follows:
Definition 3. A researcher has contemporary h-index hc, if hc of its Np articles get a score of Sc(i) ≥ hc
each, and the rest (Np − hc) articles get a score of Sc(i) ≤ hc.
The trend h-index.The original h-index does not take into account the year when an article acquired a particular citation, i.e.,the “age” of each citation. For instance, consider a researcher who contributed to the research communitya number of really brilliant articles during the decade of 1960, which, say, got a lot of citations. Thisresearcher will have a large h-index due to the works done in the past. If these articles are not citedanymore, it is an indication of an outdated topic or an outdated solution. On the other hand, if thesearticles continue to be cited, then we have the case of an influential mind, whose contributions continueto shape newer scientists’ minds. There is also a second very important aspect in aging the citations.There is the potential of disclosing trendsetter, i.e., scientists whose work is considered pioneering andsets out a new line of research that currently is hot (“trendy”), thus this scientist’s works are cited veryfrequently.
To handle this, we take the opposite approach than contemporary h-index’s; instead of assigning toeach scientist’s article a decaying weight depending on its age, we assign to each citation of an article anexponentially decaying weight, which is as a function of the “age” of the citation. This way, we aim atestimating the impact of a researcher’s work in a particular time instance. We are not interested in howold the articles of a researcher are, but whether they still get citations. We define an equation similar toEquation 2, which is expressed as follows:
St(i) = γ ∗∑
∀x∈C(i)
(Y (now) − Y (x) + 1)−δ (3)
where γ, δ, Y (i) and S(i) for an article i are as defined earlier. We define a novel citation index forscientist ranking, the trend h-index, expressed as follows:
Definition 4. A researcher has trend h-index ht if ht of its Np articles get a score of St(i) ≥ ht each,and the rest (Np − ht) articles get a score of St(i) ≤ ht each.
Apparently, for γ = δ = 1, the trend h-index coincides with the original h-index.It is straightforward to devise a generalization of both the contemporary h-index and trend h-index,
which takes into account both the age of a scientist’s article and the age of each citation to this article,but such index does not provide many additional insights about the real contributions of a scientist.Therefore, we dot not investigate further this generalization in the present article.
The normalized h-index.Since the scientists do not publish the same number of articles, the original h-index is not the fairermetric; thus, we define a normalized version of h-index, expressed as follows:
2Apparently, if δ is close to zero, then the impact of the time penalty is reduced, and, for δ = 0, this variant coincideswith the original h-index for γ = 1.
4

Definition 5. A researcher has normalized h-index hn = h/Np, if h of its Np articles have received atleast h citations each, and the rest (Np − h) articles received no more than h citations.
In the next section, we define some variants of the h-index family of citation indices for rankingjournals/conferences.
3 New Citation Indices for Journals and Conferences Ranking
Based on the original idea of the h-index and on the aforementioned generalizations and variants, we defineanalogous concepts for ranking journals and conferences. For instance, the h-index of a journal/magazineor of a conference is h, if h of the Np articles it contains, have received at least h citations each, and therest (Np − h) articles received no more than h. The generalizations of contemporary h-index and trendh-index can be defined for conferences and journals as well similarly to the Definitions 3 and 4. Directapplications of the h-index in journal ranking following this definition appeared in [2, 9, 28]. Though, weobserve that the direct application of the index can not guarantee a fair comparison between conferencesor between journals, because a) their lives are different, and b) they publish different numbers of articles.
We deal with the first problem by calculating the h-index on a per year basis. In particular, we definethat:
Definition 6. A conference or a journal has yearly h-index hy for the year y if hy of its articles Np,y
published during the year y have received at least hy citations each, and the rest (Np,y − hy) articlesreceived no more than hy citations.
For instance, the h index for the year 1992, denoted as h1992, of the conference VLDB is computed asthe number of its articles which have received more than h1992 citations. The drawbacks though of theaforementioned metric are the following:
1. The conferences/journals do not publish exactly the same number of articles. Thus, for a conferencewhich published around 50 articles, the upper bound for its h-index is 50. Another conference whichpublished 150 the upper bound for its h-index is 150, and it also has much more stronger probabilityto exceed the limit of 50. The number of articles appearing in a year in a conference or journalreflects the preference of the researchers to this publication forum. If we consider that the forumpublished 50 articles, because it could not attract more valuable articles, then it correctly has asupper bound the number 50 and it is not a problem that it can not overrule forum B. On the otherhand, perhaps we are interested in the average “quality” of the articles published in a forum, nomatter what the number of published articles in a forum is.
2. The hy index constantly changes. Even though we examine a conference which took place in 1970,the hy index that we can calculate today, is possible to change a few year later. Thus, the drawbackof this index is that we can not have a final evaluation for the forums of a year, no matter how oldare they.
The only way to overcome the second drawback, is to add a time window after the organization ofa conference or the publication of a journal (i.e., ten or five years time window). This would add thenotion of the Impact Factor [31] to the metric, which is beyond the scope of our current research.
To address the first drawback, we define a “parallel” index, which is normalized with respect to thenumber of articles published in a forum. Its formal definition is given below:
Definition 7. A conference or journal for the year y has normalized index hny = hy/Np,y, if hy of
its Np,y articles in the year y have received at least hy citations each, and the rest (Np,y − hy) articlesreceived no more than hy citations.
Having defined these generalizations and variants of the original h-index, we will evaluate in thesubsequent sections their success in identifying scientists or forums with extraordinary performance ortheir ability to reveal latent facts in a citation network, such as brilliant young scientists and trendsetters.For the evaluation, we will exploit the on-line database of DBLP 3.
3The DBLP digital library with bibliographic data on “Databases and Logic Programming” is maintained by MichaelLey at the University of Trier, accessible from http://dblp.uni-trier.de/
5

4 Experiments
In this section we will present the ranking results for scientists, conferences and journals by using thebasic h-index definition as well as by using the generalizations and variants developed in the previoussections. Along the lines of [30, 31, 32], our dataset consists of the DBLP collection (DBLP timestamp:Mar/3/2006). The reasons for selecting this source of data instead of ISI or Google Scholar or CiteSeerare the following:
1. DBLP contains data about journal and conference publications as well.
2. DBLP data are focused mostly in the area of Databases.
3. The maintainers of DBLP library put a lot of work into resolving the “names problem” - the sameperson referenced with (many) different names.
4. DBLP’s data format gave us the possibility to eliminate “self-citations”, which is not done byGoogle Schoolar.
5. Google Scholar only takes into account papers it finds on the Web.
6. ISI’s coverage for computer science is not comprehensive.
7. CiteSeer does not eliminate “self-citations” and does not rank author queries by citation numberand also weights them by year.
It is worthwhile noticing that many top conferences of this area are very competitive (with an acceptanceratio stronger than 1:3 and up to 1:7), and occasionally more competitive that the top journals of thearea. In many computer science departments worldwide, publications in these conferences are favored incomparison to journal publications. Therefore, a ranking of conferences on databases is equally importantto the ranking of the journals of the area.
The used database snapshot contains 451694 inproceedings, 266307 articles, 456511 authors, 2024 con-ference series and 504 journals. Also, the number of citations in our dataset is 100205. Although thisnumber is relatively small, it is a satisfactory sample for our purposes. Almost all citations in the databaseare made from publications prior to the year 2001. Thus, we can assume that the results presented herecorrespond to the year 2001. From now on, with the term “now” we actually mean sometime near 2001.Although other bibliographic sources (e.g., ISI, Google Scholar, CiteSeer) are widely available, the usedcollection has the aforementioned desired characteristics and thus it is sufficient for exhibiting the benefitsof our proposed citation indices, without biasing our results.
4.1 Experiments with the h-index for scientists
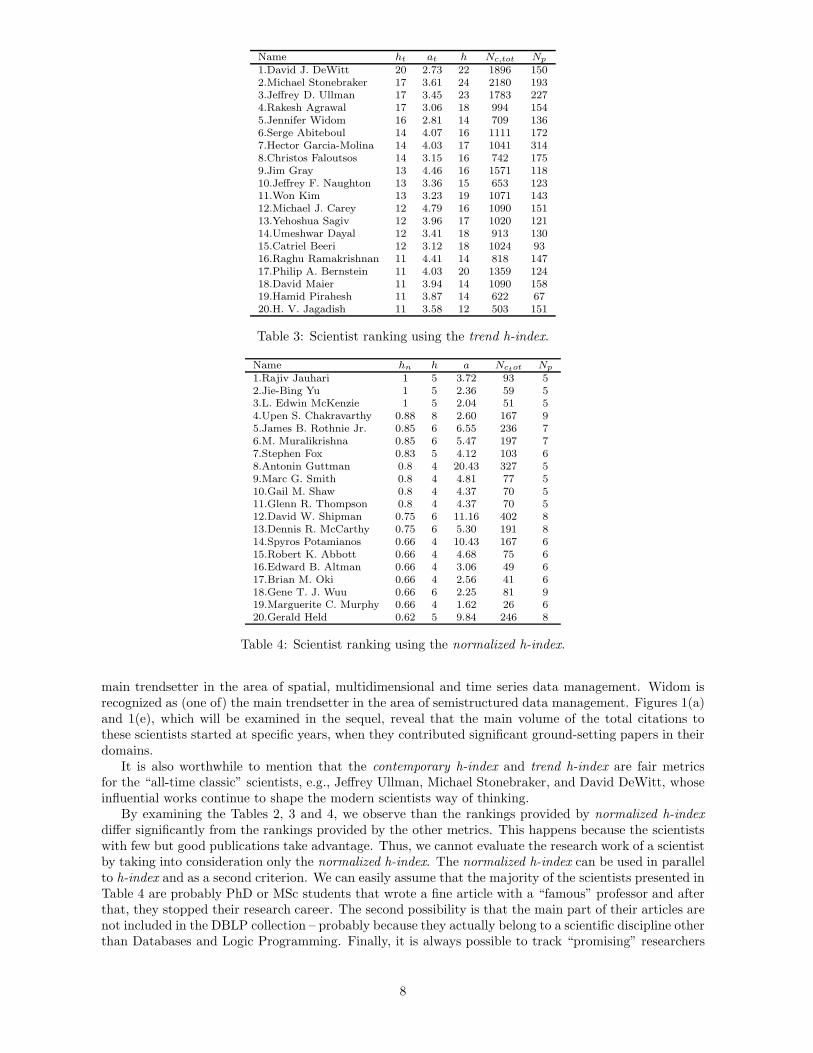
In Tables 1, 2, 3 and 4 we present the resulting ranking using the h-index, as well as its defined general-izations. In these tables columns ac and at stand for the a-index corresponding to contemporary h-indexand trend h-index, respectively. The computation of ac (and at) is analogous to the original a-indexcomputation, but it uses the functions Sc(i) (and St(i)) defined earlier for all publications of each author,rather than using the total number of citations4. This is depicted in Equations 4 and 5 where P is theset of author’s publications. ∑
∀i∈P
Sc(i) = ach2c (4)
∑
∀i∈P
St(i) = ath2t (5)
Based on the contemporary h-index and trend h-index definitions, it is obvious that the conditions∑∀i∈P Sc(i) ≥ h2
c and∑
∀i∈P St(i) ≥ h2t are true. The equality holds only in the unusual case that
every Sc(i) is equal to hc.At a first glance, we see that the values computed for h-index (Table 1) are much lower than the
values presented in [16] for physics scientists due to the non completeness of the source data. Also, we
4Notice here that the equations Nc,tot = ach2c and Nc,tot = ath
2t are not true since
∑∀i∈P Sc(i) and
∑∀i∈P St(i) are
different than Nc,tot.
6

can notice that the values for h,hc and ht are different from each other as well as there are differences inthe ordering of the scientists. This confirms our allegation for the convenience of these indices and willbe discussed in the sequel of the article.
A superficial examination of Tables 2 and 3, does not reveal any major difference between their rankingand the ranking obtained by h-index (in Table 1). With respect to Table 2, the astute reader though, willcatch three important representative cases: the case of Christos Faloutsos, the case of Serge Abitebouland the case of Jennifer Widom. Christos Faloutsos is at the 16th place of h-index table. In contemporaryh-index table he climbs to the 14th position. Serge Abiteboul climbs up from the 13th position to the 5th
position. Similarly, Jennifer Widom appears in the 6th position of the contemporary h-index (Table 2),although she does not have an entry in the h-index (see Table 1). This means that the major amount oftheir good publications is published in the resent years (relatively to the rest of the scientists). In otherwords, they work on now hot topics. Consequently, we would characterize their works as contemporary.
The results appear more impressive in the trend h-index (Table 3). Christos Faloutsos climbs tothe 8th position, and Jennifer Widom in the 5th position. This shows that their publications get citationsduring the very recent years. Consequently, we would characterize the work of Faloutsos and Widom as“trendy”, in the sense that a general interest exists by the rest of the research community for the work ofthe specific scientists during the particular time period. Indeed, Faloutsos is recognized as (one of) the
Name h a Nc,tot Np
1.Michael Stonebraker 24 3.78 2180 1932.Jeffrey D. Ullman 23 3.37 1783 2273.David J. DeWitt 22 3.91 1896 1504.Philip A. Bernstein 20 3.39 1359 1245.Won Kim 19 2.96 1071 1436.Catriel Beeri 18 3.16 1024 937.Rakesh Agrawal 18 3.06 994 1548.Umeshwar Dayal 18 2.81 913 1309.Hector Garcia-Molina 17 3.60 1041 31410.Yehoshua Sagiv 17 3.52 1020 12111.Ronald Fagin 17 2.83 818 12112.Jim Gray 16 6.13 1571 11813.Serge Abiteboul 16 4.33 1111 17214.Michael J. Carey 16 4.25 1090 15115.Nathan Goodman 16 3.37 865 6816.Christos Faloutsos 16 2.89 742 17517.Raymond A. Lorie 15 6.23 1403 3518.Jeffrey F. Naughton 15 2.90 653 12319.Bruce G. Lindsay 15 2.76 623 6020.David Maier 14 5.56 1090 158
Table 1: Scientist ranking using the h-index.
Name hc ac h Nc,tot Np
1.David J. DeWitt 14 3.10 22 1896 1502.Jeffrey D. Ullman 13 3.44 23 1783 2273.Michael Stonebraker 12 3.98 24 2180 1934.Rakesh Agrawal 12 3.24 18 994 1545.Serge Abiteboul 11 4.08 16 1111 1726.Jennifer Widom 11 3.23 14 709 1367.Jim Gray 10 3.93 16 1571 1188.Michael J. Carey 10 3.79 16 1090 1519.Won Kim 10 3.00 19 1071 14310.David Maier 10 2.93 14 1090 15811.Hector Garcia-Molina 9 5.30 17 1041 31412.Jeffrey F. Naughton 9 3.85 15 653 12313.Yehoshua Sagiv 9 3.76 17 1020 12114.Christos Faloutsos 9 3.68 16 742 17515.Catriel Beeri 9 3.59 18 1024 9316.Philip A. Bernstein 9 3.49 20 1359 12417.Umeshwar Dayal 9 3.39 18 913 13018.Hamid Pirahesh 9 3.34 14 622 6719.H. V. Jagadish 9 2.88 12 503 15120.Raghu Ramakrishnan 8 5.05 14 818 147
Table 2: Scientist ranking using the contemporary h-index.
7
Name ht at h Nc,tot Np
1.David J. DeWitt 20 2.73 22 1896 1502.Michael Stonebraker 17 3.61 24 2180 1933.Jeffrey D. Ullman 17 3.45 23 1783 2274.Rakesh Agrawal 17 3.06 18 994 1545.Jennifer Widom 16 2.81 14 709 1366.Serge Abiteboul 14 4.07 16 1111 1727.Hector Garcia-Molina 14 4.03 17 1041 3148.Christos Faloutsos 14 3.15 16 742 1759.Jim Gray 13 4.46 16 1571 11810.Jeffrey F. Naughton 13 3.36 15 653 12311.Won Kim 13 3.23 19 1071 14312.Michael J. Carey 12 4.79 16 1090 15113.Yehoshua Sagiv 12 3.96 17 1020 12114.Umeshwar Dayal 12 3.41 18 913 13015.Catriel Beeri 12 3.12 18 1024 9316.Raghu Ramakrishnan 11 4.41 14 818 14717.Philip A. Bernstein 11 4.03 20 1359 12418.David Maier 11 3.94 14 1090 15819.Hamid Pirahesh 11 3.87 14 622 6720.H. V. Jagadish 11 3.58 12 503 151
Table 3: Scientist ranking using the trend h-index.
Name hn h a Nctot Np
1.Rajiv Jauhari 1 5 3.72 93 52.Jie-Bing Yu 1 5 2.36 59 53.L. Edwin McKenzie 1 5 2.04 51 54.Upen S. Chakravarthy 0.88 8 2.60 167 95.James B. Rothnie Jr. 0.85 6 6.55 236 76.M. Muralikrishna 0.85 6 5.47 197 77.Stephen Fox 0.83 5 4.12 103 68.Antonin Guttman 0.8 4 20.43 327 59.Marc G. Smith 0.8 4 4.81 77 510.Gail M. Shaw 0.8 4 4.37 70 511.Glenn R. Thompson 0.8 4 4.37 70 512.David W. Shipman 0.75 6 11.16 402 813.Dennis R. McCarthy 0.75 6 5.30 191 814.Spyros Potamianos 0.66 4 10.43 167 615.Robert K. Abbott 0.66 4 4.68 75 616.Edward B. Altman 0.66 4 3.06 49 617.Brian M. Oki 0.66 4 2.56 41 618.Gene T. J. Wuu 0.66 6 2.25 81 919.Marguerite C. Murphy 0.66 4 1.62 26 620.Gerald Held 0.62 5 9.84 246 8
Table 4: Scientist ranking using the normalized h-index.
main trendsetter in the area of spatial, multidimensional and time series data management. Widom isrecognized as (one of) the main trendsetter in the area of semistructured data management. Figures 1(a)and 1(e), which will be examined in the sequel, reveal that the main volume of the total citations tothese scientists started at specific years, when they contributed significant ground-setting papers in theirdomains.
It is also worthwhile to mention that the contemporary h-index and trend h-index are fair metricsfor the “all-time classic” scientists, e.g., Jeffrey Ullman, Michael Stonebraker, and David DeWitt, whoseinfluential works continue to shape the modern scientists way of thinking.
By examining the Tables 2, 3 and 4, we observe than the rankings provided by normalized h-indexdiffer significantly from the rankings provided by the other metrics. This happens because the scientistswith few but good publications take advantage. Thus, we cannot evaluate the research work of a scientistby taking into consideration only the normalized h-index. The normalized h-index can be used in parallelto h-index and as a second criterion. We can easily assume that the majority of the scientists presented inTable 4 are probably PhD or MSc students that wrote a fine article with a “famous” professor and afterthat, they stopped their research career. The second possibility is that the main part of their articles arenot included in the DBLP collection – probably because they actually belong to a scientific discipline otherthan Databases and Logic Programming. Finally, it is always possible to track “promising” researchers
8

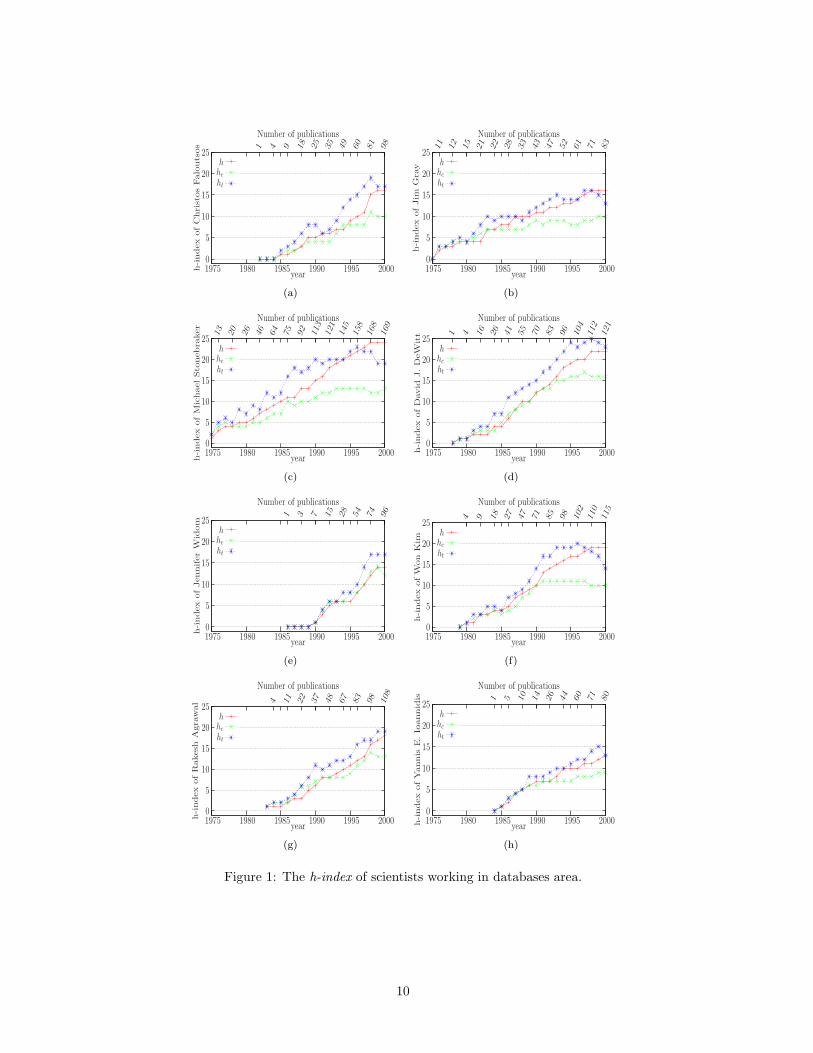
among them, who will continue their significant research work.Motivated by the differences in the above tables, we present the collection of graphs in Figure 1. In
these figures, we can see the history of the h-index for those scientists, who present significant differencesbetween the h-index family of citation indices, and also those who have a rapid upwards slope at theirplot curves5. For each scientist, we provide a justification for the resulting curves related to his/her mainresearch interests. It is the case that these scientists have really broad interests that can not be confinedin a single term. Though, we attempt to characterize the field where they made their most significantcontributions.
Comparing Figures 1(a) and 1(b) regarding Christos Faloutsos and Jim Gray respectively, we can seethat the two scientists have the same h-index now. However, Christos Faloutsos has a more ascendingslope than Jim Gray, since he started being cited on 1984, while Jim Gray on 1976. Also, the trendh-index (ht) curve of Christos Faloutsos stays constantly over the h-index (h) equivalent. This meansthat Christos Faloutsos is getting cited very often at the present and thus, we expect his h-index to gethigher than Jim Gray’s h-index. Finally, Jim Gray’s contemporary h-index (hc) is constantly below hsince 1985 and it diverges with time. This indicates that since 1985 he has not presented exceptionallyseminal papers (relatively to his older ones) and after this point the progress is digressive. Indeed, theTuring Award recipient Jim Gray made ground setting contributions to transaction processing; this topicis considered as a solved problem now and it is not considered as an active research area. On the otherhand, the main contributions of Christos Faloutsos focus in the area of spatial and multidimensional datamanagement, which became very popular roughly since 1995.
Figures 1(c) and 1(d) correspond to Michael Stonebraker and David J. DeWitt. Both of these re-searchers are on the top of our list. We can notice that David J. DeWitt’ contemporary h-index is veryclose to his h-index, which means that he keeps publishing very good papers. On the contrary, MichaelStonebraker has started to deflect since 1985. This helps us understand that Michael Stonebraker’ trendh-index will also decrease after some years, as it is shown in the same figure. Thus, while Michael Stone-braker is in higher position than David J. DeWitt at the h-index ranking, David J. DeWitt comes firstwhen examining the other two variations. This means that, if the productivity level of the two researcherskeeps on the same pace, the second will soon surpass the first one at the h-index as well.
In Figure 1(e), we see the progress rate for Jennifer Widom. While Jennifer Widom is not evenamong the top 20 researchers using the h-index, she is on the 6th and 5th position using the contemporaryh-index and trend h-index, respectively. She is the only researcher from our list that presents such a bigdifference on the timing rates compared to the basic h-index. As we can also see from the diagram, thisdifference is justifiable, since the increase rate of the basic h-index is high. She is also the only researcherthat her contemporary h-index is constantly close to h-index and not below. Finally, although, for allthe researchers that we present, the trend h-index is always lower than the h-index in the year of 2000,the trend h-index stays higher in her case. Jennifer Widom made some ground breaking contributionson building semistructured data management systems, that laid the foundations for the modern XMLmanagement systems.
In Figure 1(f), Won Kim presents an analogous path with Stonebraker. For instance, there is a highascending curve for trend h-index, but contemporary h-index remains low after 1990, and it is finallyobvious that trend h-index will also follow a decreasing path. Therefore, we expect that h-index will notpresent high increase. This is explained by the fact that the main research interests of Won Kim was onobject-oriented database systems, which flourished during the last years of the eighties and in the firstyears of the nineties, but later become a relatively inactive area.
Our observations about Figure 1(g) concerning the work of Rakesh Aggrawal are analogous to thoseon Figure 1(a) concerning Christos Faloutsos, thus we do not go into further details. In Figure 1(h)concerning Yannis Ioannidis, we see an increasing trend that is analogous to that of Jim Gray. Thetrend h-index remains constantly over h-index, which means that there is a remarkable potential. Inaddition, the contemporary h-index presents a small deflection from h-index after 1993, which is completelyanalogous to that of Jim Gray after 1985. Based on the available data, Yannis Ioannidis follows the sameprogress path as Jim Gray, with a time lag of about 10 years.
5Again, we remind that our data set is rather incomplete for the years after 2000, and thus a downwards pitch for allthe researchers appears during the years 1999-2000. However, the results are indicative.
9
ht
hc
h
Number of publications
year
h-index
ofC
hris
tos
Falo
utsos 1 4 9 18
25
35
49
60
81
98
200019951990198519801975
25
20
15
10
5
0
(a)
ht
hc
h
Number of publications
year
h-index
ofJim
Gray
11
12
15
21
22
28
33
43
47
52
61
71
83
200019951990198519801975
25
20
15
10
5
0
(b)
ht
hc
h
Number of publications
yearh-index
ofM
ichaelStonebraker
13
20
26
46
64
75
92
113
121
145
158
168
169
200019951990198519801975
25
20
15
10
5
0
(c)
ht
hc
h
Number of publications
year
h-index
ofD
avid
J.D
eW
itt 1 4 16
26
41
55
70
83
96
104
112
121
200019951990198519801975
25
20
15
10
5
0
(d)
ht
hc
h
Number of publications
year
h-index
ofJennifer
Wid
om
1 3 7 15
28
54
74
96
200019951990198519801975
25
20
15
10
5
0
(e)
ht
hc
h
Number of publications
year
h-index
ofW
on
Kim
4 9 18
27
47
71
85
98
102
110
115
200019951990198519801975
25
20
15
10
5
0
(f)
ht
hc
h
Number of publications
year
h-index
ofR
akesh
Agraw
al 4 11
22
37
48
67
83
98
108
200019951990198519801975
25
20
15
10
5
0
(g)
ht
hc
h
Number of publications
yearh-index
ofY
annis
E.Io
annid
is 1 5 10
14
26
44
60
71
80
200019951990198519801975
25
20
15
10
5
0
(h)
Figure 1: The h-index of scientists working in databases area.
10

4.1.1 Matching the h-index rankings to the awarded scientists
Our next investigation concerns an experiment to test whether the rankings by the h-index and itsgeneralizations are in accordance with the awards for the database scientific domain. In papers [30]and [32] we used the ‘SIGMOD E. F. Codd Innovations Award’ to evaluate some ranking methods. Here,we perform an analogous experiment. The higher an awarded scientist is ranked, the better the rankingmethod is considered to be. We have to note here, that the issue of awarding a scientists a particularaward is not simply a matter of arithmetics (some numerical metrics), but it is much complex. Though,we use this methodology to test whether the citation indices defined in this metric reveal some generaltrends.
Name h hc ht h hc ht year h hc ht
Michael Stonebraker 1 3 2 3 2 1 1992 1 2 1Jim Gray 12 7 9 12 11 10 1993 15 11 8Philip A. Bernstein 4 16 17 2 6 4 1994 2 9 5David J. DeWitt 3 1 1 3 1 1 1995 2 1 1C. Mohan 28 37 31 44 36 35 1996 49 23 19David Maier 20 10 18 11 9 15 1997 15 10 17Serge Abiteboul 13 5 6 17 4 11 1998 16 6 11Hector Garcia-Molina 9 11 7 10 8 4 1999 14 7 5Rakesh Agrawal 7 4 4 9 4 4 2000 7 4 4Rudolf Bayer 145 196 183 142 218 222 2001 145 196 183Patricia G. Selinger 143 144 119 143 144 119 2002 143 144 119Donald D. Chamberlin 44 87 69 44 87 69 2003 44 87 69Ronald Fagin 11 39 32 11 39 32 2004 11 39 32Lowest Ranking Point 145 196 183 143 218 222 145 196 183Sum of Rank points 440 560 498 451 543 539 464 494 469
Table 5: Citations indices of scientists awarded with SIGMOD E. F. Codd Innovations Award.
Table 5 presents the list of the awarded scientists by the ‘SIGMOD E.F.Codd Innovations Award’.In the first group of columns entitled as (h, hc, ht) the current position of each scientist is presented byusing the respective index. The second triplet of (h, hc, ht) shows the scientist positions one year beforethe awarding. Column year shows the year of the awarding, whereas the last triplet of (h, hc, ht) showshis position during (at the end of) the year of the awarding.
Although our data are not complete for the time period after 2000, however, we can make interestingobservations for the years before 2000:
• C. Mohan. Although at this moment he is ranked relatively low by using the trend h-index andcontemporary h-index, during the year of 1996 he was ranked higher according to the trend h-index.This was later depicted on the h-index since from the 49th position where he was ranked during 1996he now climbed up to the 28th position.
• Other similar qualitative cases with obvious difference in the actual ranking are of Hector Garcia-
Molina and Philip A. Bernstein.
• Serge Abiteboul. During the year of the awarding the trend h-index is relatively low (compared tothe contemporary h-index). According to the contemporary h-index, he was ranked in a higher place.This shows that he had presented interesting work during the age of the awarding; he received theaward before his work gets reflected to the trend h-index and h-index. Thus, in some cases, thecontemporary h-index gives information that it cannot be depicted into the other indices.
• For the cases of Michael Stonebraker and David J. DeWitt, we see that they are stable at the top.
4.2 Experiments with conferences and journals ranking
4.2.1 Experiments with conferences ranking
To evaluate our citation indices on conference ranking, we extract only the database conferences (asdefined in [13]) from the data we used in the previous section. In the first part of this section we will
11

make experiments using only the indicators that we fixed for scientists, namely h-index, normalized h-index, contemporary h-index and trend h-index. In Table 6 we present the top-10 conferences using theh-index for the ordering6. Since the quality of the conferences is relatively constant, we observe that inTables 7 and 8 there are no significant differences in the ranking. The ordering changes dramatically inTable 9 due to the fact that complete data exist only for some conferences.
Name h a Nc,tot Np
1.sigmod 45 6.05 12261 20592.vldb 37 7.10 9729 21923.pods 26 5.74 3883 7764.icde 22 6.83 3307 19705.er 16 5.80 1486 13386.edbt 13 3.89 658 4347.eds 12 3.65 527 1018.adbt 12 2.86 412 429.icdt 11 4.79 580 31310.oodbs 11 3.96 480 122
Table 6: Conferences ranking using the h-index.
Name hc ac h Nc,tot Np
1.sigmod 21 9.49 45 12261 20592.vldb 17 11.34 37 9729 21923.pods 12 9.73 26 3883 7764.icde 11 11.88 22 3307 19705.icdt 8 5.04 11 580 3136.edbt 7 6.16 13 658 4347.oodbs 6 3.63 11 480 1228.er 5 16.21 16 1486 13389.kdd 5 6.89 6 243 107410.dood 5 6.57 8 440 171
Table 7: Conferences ranking using the contemporary h-index.
Name ht at h Nc,tot Np
1.sigmod 34 6.67 45 12261 20592.vldb 27 8.00 37 9729 21923.pods 19 6.53 26 3883 7764.icde 16 9.52 22 3307 19705.icdt 12 3.67 11 580 3136.edbt 9 6.02 13 658 4347.er 8 10.35 16 1486 13388.dood 8 4.43 8 440 1719.kdd 7 6.42 6 243 107410.dbpl 7 5.11 8 410 228
Table 8: Conferences ranking using the trend h-index.
Name hn h a Nc,tot Np
1.adbt 0.28 12 2.86 412 422.dpds 0.17 7 2.97 146 393.eds 0.11 12 3.65 527 1014.icod 0.11 6 3 108 525.jcdkb 0.11 8 3.32 213 706.ddb 0.09 4 6.87 110 447.oodbs 0.09 11 3.96 480 1228.tdb 0.08 3 6.44 58 369.berkeley 0.07 10 3.52 352 142
Table 9: Conferences ranking using the normalized h-index.
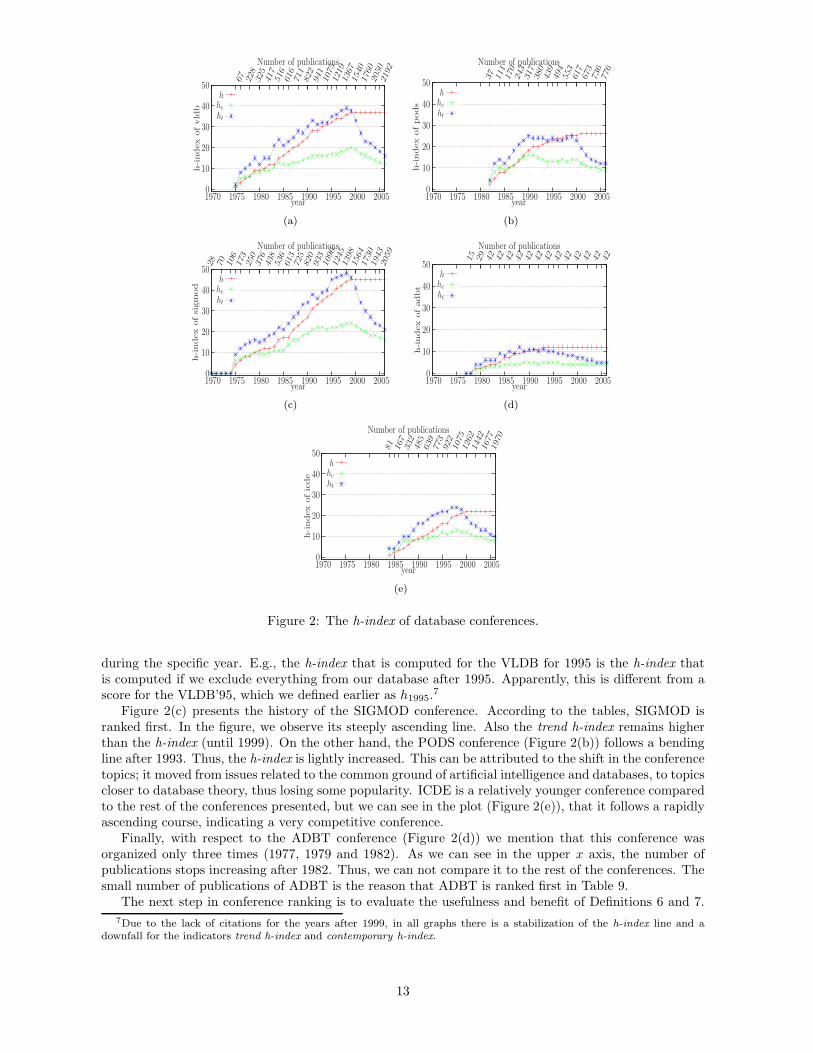
In Figure 2 we present in the same way we used for scientists, the progress of selected conferences.Note here that the h-index is shown per year in the graphs, which means that this is the computed h-index
6The symbol ac in Table 6 and the symbol at in Table 8 correspond to the a-index on Definition 2.
12
ht
hc
h
Number of publications
yearh-index
ofvld
b
67
228
325
417
516
616
711
822
941
1075
1219
1367
1540
1760
2050
2192
20052000199519901985198019751970
50
40
30
20
10
0
(a)
ht
hc
h
Number of publications
year
h-index
ofpods
37
111
170
243
317
380
439
494
553
617
673
736
776
20052000199519901985198019751970
50
40
30
20
10
0
(b)
ht
hc
h
Number of publications
year
h-index
ofsig
mod
28
70
106
173
250
376
438
536
613
725
820
933
1096
1245
1398
1564
1730
1943
2059
20052000199519901985198019751970
50
40
30
20
10
0
(c)
ht
hc
h
Number of publications
year
h-index
ofadbt
15
29
42
42
42
42
42
42
42
42
42
42
42
42
42
20052000199519901985198019751970
50
40
30
20
10
0
(d)
ht
hc
h
Number of publications
year
h-index
ofic
de
81
167
332
485
639
773
922
1075
1262
1442
1677
1970
20052000199519901985198019751970
50
40
30
20
10
0
(e)
Figure 2: The h-index of database conferences.
during the specific year. E.g., the h-index that is computed for the VLDB for 1995 is the h-index thatis computed if we exclude everything from our database after 1995. Apparently, this is different from ascore for the VLDB’95, which we defined earlier as h1995.
7
Figure 2(c) presents the history of the SIGMOD conference. According to the tables, SIGMOD isranked first. In the figure, we observe its steeply ascending line. Also the trend h-index remains higherthan the h-index (until 1999). On the other hand, the PODS conference (Figure 2(b)) follows a bendingline after 1993. Thus, the h-index is lightly increased. This can be attributed to the shift in the conferencetopics; it moved from issues related to the common ground of artificial intelligence and databases, to topicscloser to database theory, thus losing some popularity. ICDE is a relatively younger conference comparedto the rest of the conferences presented, but we can see in the plot (Figure 2(e)), that it follows a rapidlyascending course, indicating a very competitive conference.
Finally, with respect to the ADBT conference (Figure 2(d)) we mention that this conference wasorganized only three times (1977, 1979 and 1982). As we can see in the upper x axis, the number ofpublications stops increasing after 1982. Thus, we can not compare it to the rest of the conferences. Thesmall number of publications of ADBT is the reason that ADBT is ranked first in Table 9.
The next step in conference ranking is to evaluate the usefulness and benefit of Definitions 6 and 7.
7Due to the lack of citations for the years after 1999, in all graphs there is a stabilization of the h-index line and adownfall for the indicators trend h-index and contemporary h-index.
13

This way, we evaluate, for example, VLDB’95 independently from VLDB’94. Obviously, in this case it ismeaningless to add a second time dimension (with indicators contemporary h-index and trend h-index).The contemporary h-index of VLDB’95 will be stable during all the following years, since all papers arepublished during the same year. On the other hand, it is not important to see whether a conferenceorganized in 1980 still gets citations.
Indicatively, we present the Tables 10 and 11 which present the conferences ranking for the years 1995and 1990 respectively. In part (a) of these tables the ordering is performed by using the yearly h-index(hy). Factor a is the second criterion for the ranking. We also present the columns hn
y , which is theh-index divided by the number of publications Np,y. Also, column Nc,1995 is the number of citations topapers published during 1995. In the second part (b) of the tables, the ordering is computed based tothe normalized h-index. Notice here, that although it seems to have equivalences by using hn
y , the realnumbers make such a situation almost unprovable (i.e., 5/24 = 0.20833, 6/29 = 0.206897).
What we observe here, is that there are no important differences in the ranking for the two indicativeyears, neither using the normalized h-index. On the other hand, it is obvious that the use of normalizedh-index gives a small advantage to the conferences that have a small number of publications. For example,the VLDB conference is almost stable in the first place using the yearly h-index, but it is improbable toget the first place using the normalized yearly h-index.
Name h1995 a hn1995
Nc,1995 Np,1995
1.vldb 11 3.57 0.15 432 722.sigmod 9 4.62 0.10 375 853.icde 6 6.63 0.08 239 684.pods 6 4.16 0.20 150 295.ssd 5 2.08 0.20 52 246.kdd 4 3.81 0.07 61 567.cikm 3 6.22 0.05 56 558.dood 3 5.88 0.06 53 469.icdt 3 3.66 0.08 33 3410.er 3 3.33 0.06 30 47
(a)
Name hn1995
h1995 Np,1995
1.ssd 0.20 5 242.pods 0.20 6 293.cdb 0.2 2 104.vldb 0.15 11 725.coopis 0.14 3 216.artdb 0.11 2 177.sdb 0.11 1 98.sigmod 0.10 9 859.ride 0.10 2 1910.tdb 0.1 2 20
(b)
Table 10: Conferences ranking for the year 1995.
Name h1990 a hn1990
Nc,1990 Np,1990
1.vldb 16 2.57 0.26 659 602.sigmod 15 3.44 0.31 776 483.icde 11 2.76 0.16 335 674.pods 11 2.40 0.30 291 365.edbt 7 2.83 0.21 139 326.icdt 5 4.32 0.14 108 347.dpds 4 3.75 0.22 60 188.er 3 4.66 0.08 42 359.ds 3 4.11 0.12 37 2410.ssdbm 3 3 0.16 27 18
(a)
Name hn1995
h1995 Np,1995
1.sigmod 0.31 15 482.pods 0.30 11 363.vldb 0.26 16 604.dpds 0.22 4 185.edbt 0.21 7 326.ssdbm 0.16 3 187.icde 0.16 11 678.icdt 0.14 5 349.ds 0.12 3 2410.ewdw 0.10 3 29
(b)
Table 11: Conferences ranking for the year 1990.
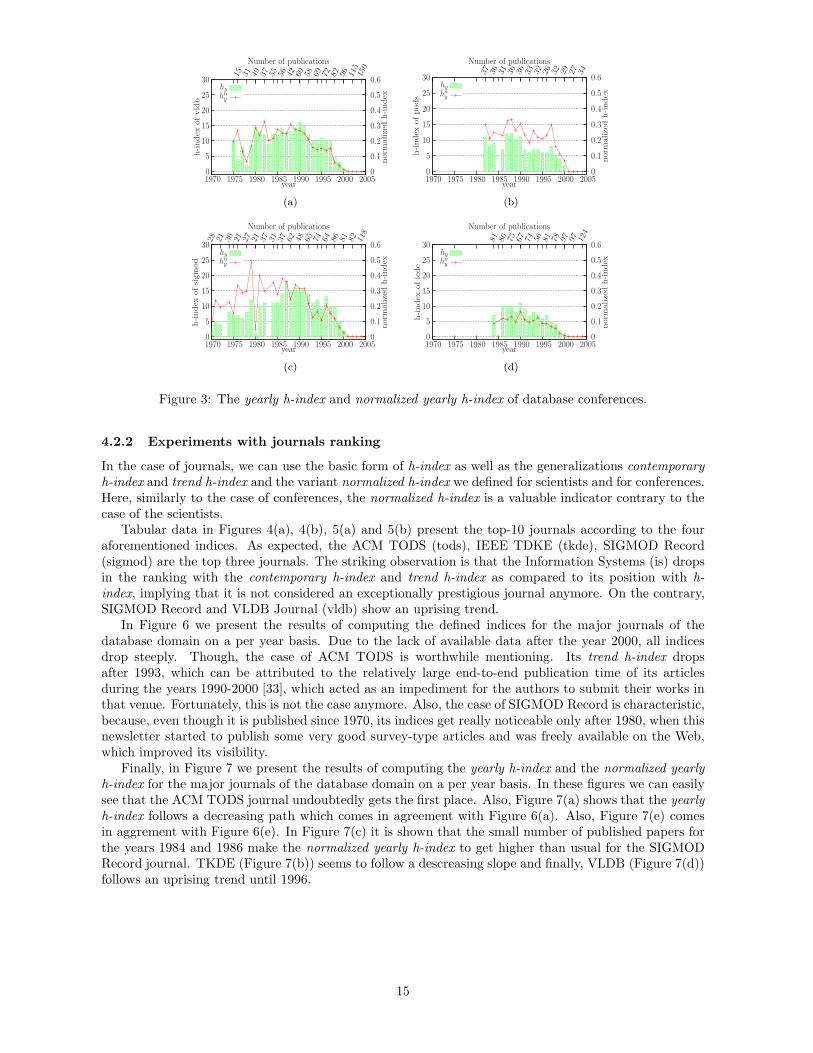
In Figure 3 we present the plots for the values of yearly h-index (hy) and normalized yearly h-index(hn
y ) for the top four conferences VLDB, PODS, SIGMOD and ICDE. The values for hy are drawn usingbars, because each value is independent from the rest ones. The value for hy of a conference has differentupper bound for each year. The upper bound for each year is defined by the number of papers publishedduring this year. This is depicted on the upper x axes. On the other hand, the hn
y values are normalized.So, it is a comparable value for the two years of a conference and it is drawn with the (red) cross pointsline. The values for the hn
y index are presented in axes y2. There is no association of axes y1 to y2, thuswe cannot compare (obviously) the values of hn
y to hy. The only remark that we can make is that theone curve follows approximately the other. This comes in agreement with the conclusions derived fromTables 10 and 11.
14
hny
hy
Number of publications
year
norm
alized
h-index
h-index
ofvld
b
15 31 49 37 55 56 42 60 58 69 72 82 96 115
150
0.6
0.5
0.4
0.3
0.2
0.1
020052000199519901985198019751970
30
25
20
15
10
5
0
(a)
hny
hy
Number of publications
year
norm
alized
h-index
h-index
ofpods
37 36 31 36 36 33 32 26 32 29 27 34
0.6
0.5
0.4
0.3
0.2
0.1
020052000199519901985198019751970
30
25
20
15
10
5
0
(b)
hny
hy
Number of publications
year
norm
alized
h-index
h-index
ofsi
gm
od
28 21 36 21 27 21 37 31 37 62 48 65 74 64 86 81 82 118
0.6
0.5
0.4
0.3
0.2
0.1
020052000199519901985198019751970
30
25
20
15
10
5
0
(c)
hny
hy
Number of publications
year
norm
alized
h-index
h-index
ofic
de
81 86 75 67 74 56 81 78 97 97 124
0.6
0.5
0.4
0.3
0.2
0.1
020052000199519901985198019751970
30
25
20
15
10
5
0
(d)
Figure 3: The yearly h-index and normalized yearly h-index of database conferences.
4.2.2 Experiments with journals ranking
In the case of journals, we can use the basic form of h-index as well as the generalizations contemporaryh-index and trend h-index and the variant normalized h-index we defined for scientists and for conferences.Here, similarly to the case of conferences, the normalized h-index is a valuable indicator contrary to thecase of the scientists.
Tabular data in Figures 4(a), 4(b), 5(a) and 5(b) present the top-10 journals according to the fouraforementioned indices. As expected, the ACM TODS (tods), IEEE TDKE (tkde), SIGMOD Record(sigmod) are the top three journals. The striking observation is that the Information Systems (is) dropsin the ranking with the contemporary h-index and trend h-index as compared to its position with h-index, implying that it is not considered an exceptionally prestigious journal anymore. On the contrary,SIGMOD Record and VLDB Journal (vldb) show an uprising trend.
In Figure 6 we present the results of computing the defined indices for the major journals of thedatabase domain on a per year basis. Due to the lack of available data after the year 2000, all indicesdrop steeply. Though, the case of ACM TODS is worthwhile mentioning. Its trend h-index dropsafter 1993, which can be attributed to the relatively large end-to-end publication time of its articlesduring the years 1990-2000 [33], which acted as an impediment for the authors to submit their works inthat venue. Fortunately, this is not the case anymore. Also, the case of SIGMOD Record is characteristic,because, even though it is published since 1970, its indices get really noticeable only after 1980, when thisnewsletter started to publish some very good survey-type articles and was freely available on the Web,which improved its visibility.
Finally, in Figure 7 we present the results of computing the yearly h-index and the normalized yearlyh-index for the major journals of the database domain on a per year basis. In these figures we can easilysee that the ACM TODS journal undoubtedly gets the first place. Also, Figure 7(a) shows that the yearlyh-index follows a decreasing path which comes in agreement with Figure 6(a). Also, Figure 7(e) comesin aggrement with Figure 6(e). In Figure 7(c) it is shown that the small number of published papers forthe years 1984 and 1986 make the normalized yearly h-index to get higher than usual for the SIGMODRecord journal. TKDE (Figure 7(b)) seems to follow a descreasing slope and finally, VLDB (Figure 7(d))follows an uprising trend until 1996.
15

Name h a Nc,tot Np
1.tods 49 3.88 9329 5982.tkde 18 4.69 1520 13883.is 16 4.71 1208 9344.sigmod 15 5.07 1142 13495.tois 13 4.37 740 3786.debu 11 7.13 863 8777.vldb 9 5.03 408 2818.ipl 8 6.06 388 49399.dke 6 8.77 316 77310.dpd 6 5.25 189 238
(a) Journal ranking using the h-index.
Name hn h a Nc,tot Np
1.tods 0.08 49 3.88 9329 5982.tois 0.03 13 4.37 740 3783.vldb 0.03 9 5.03 408 2814.dpd 0.02 6 5.25 189 2385.jiis 0.01 6 4.33 156 3186.datamine 0.01 3 5.11 46 1627.is 0.01 16 4.71 1208 9348.ijcis 0.01 4 3.12 50 2559.tkde 0.01 18 4.69 1520 138810.debu 0.01 11 7.13 863 877
(b) Journal ranking using the normalized h-index.
Figure 4: Journal ranking using h-index (left) and normalized h-index (right).
Name hc ac h Nc,tot Np
1.tods 18 6.25 49 9329 5982.tkde 10 6.40 18 1520 13883.sigmod 9 6.17 15 1142 13494.debu 6 9.21 11 863 8775.vldb 6 6.47 9 408 2816.tois 6 6.09 13 740 3787.is 5 12.77 16 1208 9348.dpd 5 4.19 6 189 2389.jiis 5 3.79 6 156 31810.dke 4 7.70 6 316 773
(a) Journal ranking using the contemporary h-
index.
Name ht at h Nc,tot Np
1.tods 28 4.93 49 9329 5982.tkde 13 6.64 18 1520 13883.sigmod 12 5.85 15 1142 13494.vldb 10 3.75 9 408 2815.is 9 7.11 16 1208 9346.debu 9 6.98 11 863 8777.tois 9 4.83 13 740 3788.dpd 6 4.88 6 189 2389.jiis 6 4.75 6 156 31810.dke 5 8.18 6 316 773
(b) Journal ranking using the trend h-index.
Figure 5: Journal ranking using contemporary h-index (left) and trend h-index (right).
5 Conclusions
Estimating the significance of a scientist’s work is a very important issue for prize awarding, facultyrecruiting, etc. This issue has received a lot of attention during the last years and a number of metricshave been proposed which are based on arithmetics upon the number of articles published by a scientistand the total number of citations to these articles. The interest on these topics has been renewed and ina path-breaking paper, J. E. Hirsch proposed the h-index to perform fair ranking of scientists, avoidingmany of the drawbacks of the earlier bibliographic ranking methods.
The initial proposal and meaning of the h-index has various shortcomings, mainly of its inability todifferentiate between active and inactive (or retired) scientists and its weakness to differentiate betweensignificant works in the past (but not any more) and the works which are “trendy” or the works whichcontinue to shape the scientific thinking.
Based on the identification of these shortcomings of h-index, we proposed in this article a numberof effective h-index generalizations and some variants. Some of these novel citation indices aim at theranking of scientists by taking into account the age of the published articles, or the age of the citations toeach article. The other citations indices aim at ranking publication venues, i.e., conferences and journals,taking into account the variable number of published articles.
To evaluate the proposed ranking metrics, we conducted extensive experiments on an online biblio-graphic database containing data from journal and conference publications as well, and moreover focusedin the specific area of databases. From the results we obtained, we concluded that h-index is not a generalpurpose indicative metric. Some of the novel indices, namely contemporary h-index and trend h-index,are able to disclose latent facts in citation networks, like trendsetters and brilliant young scientists. Forthe case of conference and journal ranking, the indices normalized h-index, contemporary h-index andtrend h-index give a more fair view for the ranking. Finally, the yearly h-index and the normalized yearlyh-index can be used in order to evaluate separately each conference/journal’s success.
16

ht
hc
h
Number of publications
yearh-index
oftods
21
64
116
176
235
280
321
363
407
443
470
495
520
545
582
598
20052000199519901985198019751970
50
40
30
20
10
0
(a)
ht
hc
h
Number of publications
year
h-index
oftkde
91
210
400
571
722
859
1035
1281
1388
20052000199519901985198019751970
50
40
30
20
10
0
(b)
ht
hc
h
Number of publications
year
h-index
ofsig
mod
27
68
118
154
176
176
265
304
326
380
467
565
665
775
867
965
1117
1298
1349
20052000199519901985198019751970
50
40
30
20
10
0
(c)
ht
hc
h
Number of publications
year
h-index
ofvld
b
9 49
90
130
165
213
259
281
20052000199519901985198019751970
50
40
30
20
10
0
(d)
ht
hc
h
Number of publications
year
h-index
ofis
21
51
102
153
203
263
329
426
497
578
644
697
752
809
893
934
20052000199519901985198019751970
50
40
30
20
10
0
(e)
Figure 6: The h-index, contemporary h-index and trend h-index of major database journals.
References
[1] P. Ball. Index aims for fair ranking of scientists – h-index sums up publication record. Nature,436(7053):900, 2005.
[2] J. Bar-Ilan. h-index for price medalists revisited. ISSI Newsletter, 5, Jan. 2006.
[3] S. J. Barnes. Assessing the value of IS journals. Communications of the ACM, 48(1):110–112, 2005.
[4] P. D. Batista, M. G. Campiteli, O. Kinouchi, and A. S. Martinez. Is it possible to compare researcherswith different scientific interests? Scientometrics, 68(1), 2007. To appear.
[5] P. A. Bernstein, E. Bertino, A. Heuer, C. J. Jensen, H. Meyer, M. Tamer Ozsu, R. T. Snodgrass, andK.-Y. Whang. An apples-to-apples comparison of two database journals. ACM SIGMOD Record,34(4):61–64, 2005.
[6] P. Bharati and P. Tarasewich. Global perceptions of journals publishing e-commerce research. Com-munications of the ACM, 45(5):21–26, 2002.
[7] J. Bollen, M. A. Rodriguez, and H. Van de Sompel. Journal status, May 2006. Preprint available athttp://arxiv.org/abs/cs/0601030.
17

hny
hy
Number of publications
year
norm
alized
h-index
h-index
oftods
21
21
23
31
30
22
17
20
21
17
14
12
12
11
22
0.6
0.5
0.4
0.3
0.2
0.1
020052000199519901985198019751970
30
25
20
15
10
5
0
(a)
hny
hy
Number of publications
year
norm
alized
h-index
h-index
oftkde
38
59
90
90
70
65
97
125
0.6
0.5
0.4
0.3
0.2
0.1
020052000199519901985198019751970
30
25
20
15
10
5
0
(b)
hny
hy
Number of publications
yearnorm
alized
h-index
h-index
ofsig
mod
23
37
12
1 43
16
22
36
46
51
50
54
49
47
92
92
0.6
0.5
0.4
0.3
0.2
0.1
020052000199519901985198019751970
30
25
20
15
10
5
0
(c)
hny
hy
Number of publications
year
norm
alized
h-index
h-index
ofvld
b
9 21
18
20
27
23
23
0.6
0.5
0.4
0.3
0.2
0.1
020052000199519901985198019751970
30
25
20
15
10
5
0
(d)
hny
hy
Number of publications
year
norm
alized
h-index
h-index
ofis
7 22
25
28
20
26
31
53
31
41
32
30
29
25
39
10
0.6
0.5
0.4
0.3
0.2
0.1
020052000199519901985198019751970
30
25
20
15
10
5
0
(e)
Figure 7: The yearly h-index and normalized yearly h-index of major database journals.
[8] L. Bornmann and H.-D. Daniel. Does the h-index for ranking of scientists really work? Scientomet-rics, 65(3):391–392, 2005.
[9] T. Braun, W. Glanzel, and A. Schubert. A Hirsch-type index for journals. The Scientist, 19(22):8–10,2005.
[10] B. Cronin and L. Meho. Using the H-index to rank influential information scsientists. Journal ofthe American Society for Information Science and Technology, 57(9):1275–1278, 2006.
[11] L. Egghe. Dynamic h-index: The Hirsch index in function of time. Scientometrics, 2006. To appear.
[12] L. Egghe. Theory and practise of the g-index. Scientometrics, 2006. To appear.
[13] E. Elmacioglu and D. Lee. On six degrees of separation in DBLP-DB and more. ACM SIGMODRecord, 34(2):33–40, 2005.
[14] E. Garfield. Citation analysis as a tool in journal evaluation. Science, 178:471–479, 1972.
[15] B. C. Hardgrave and K. A. Walstrom. Forums for MIS scholars. Communications of the ACM,40(11):119–124, 1997.
18

[16] J. E. Hirsch. An index to quantify an individual’s scientific research output. Proceedings of theNational Academy of Sciences, 102(46):16569–16572, 2005.
[17] C. W. Holsapple, H. Johnson, L. E.and Manakyan, and J. Tanner. Business computing researchjournals: A normalized citation analysis. Journal of Management Information Systems, 11(1):131–140, 1994.
[18] P. Katerattanakul, B. T. Han, and S. Hong. Objective quality ranking of computing journals.Communications of the ACM, 46(10):111–114, 2003.
[19] R. Kelly Rainer and M. D. Miller. Examining differences across journal rankings. Communicationsof the ACM, 48(2):91–94, 2005.
[20] J. Kleinberg. Authoritative sources in a hyperlinked environment. Journal of the ACM, 46(5):604–632, 1999.
[21] P. Lowry, D. Romans, and A. Curtis. Global journal prestige and supporting disciplines: A sciento-metric study of information systems journals. Journal of the Association for Information Systems,5(2):29–75, 2004.
[22] N. A. Mylonopoulos and V. Theoharakis. Global perception of IS journals. Communications of theACM, 44(9):29–33, 2001.
[23] M.A. Nascimento, J. Sander, and J. Pound. Analysis of SIGMOD’s co-authorship graph. ACMSIGMOD Record, 32(3):8–10, 2003.
[24] S. P. Nerur, R. Sikora, G. Mangalaraj, and V. Balijepally. Assessing the relative influence of journalsin a citation network. Communications of the ACM, 48(11):71–74, 2005.
[25] L. Page, S. Brin, R. Motwani, and T. Winograd. The PageRank citation ranking: Bringing order tothe Web. Technical Report TR-1999-66, Stanford University, 1999.
[26] A. F. J. van Raan. Comparison of the Hirsch-index with standard bibliometric indicators and withpeer judgment for 147 chemistry research groups. Scientometrics, 67(3):491–502, 2006.
[27] E. Rahm and A. Thor. Citation analysis of database publications. ACM SIGMOD Record, 34(4):48–53, 2005.
[28] R. Rousseau. A case study: Evolution of JASIS’ Hirsch index. Library and Information Science,Jan. 2006. Available at http://eprints.rcils.org/archive/00005430.
[29] R. B. Schwartz and M. C. Russo. How to quickly find articles in the top IS journals. Communicationsof the ACM, 47(2):98–101, 2004.
[30] A. Sidiropoulos and Y. Manolopoulos. A citation-based system to assist prize awarding. ACMSIGMOD Record, 34(4):54–60, 2005.
[31] A. Sidiropoulos and Y. Manolopoulos. A new perspective to automatically rank scientific conferencesusing digital libraries. Information Processing & Management, 41(2):289–312, 2005.
[32] A. Sidiropoulos and Y. Manolopoulos. Generalized comparison of graph-based ranking algorithmsfor publications and authors. Journal for Systems and Software, 2006. To appear.
[33] R. Snodgrass. Journal relevance. ACM SIGMOD Record, 32(3):11–15, 2003.
19
Copyright © 2022 FDOKUMEN