Mucopolysaccharidosis I, II, and VI: brief review and guidelines for treatment
Upload
khangminh22Category
view
0download
0
· PRG. 110. A. (N) 700 .
CENSUS OF INDIA 1961
VOLUME VI
JAMMU AND KASHMIR
PART I-A (i)
GENERAL REPORT
M. H. KAMILI Superintendent 01 Census Operations
Jammu and Kashmir
1968 PRINTED IN INDIA AT BROCA'S ARTISTIC PRESS, AMIRAKADAL, SR1NAGAR, KASHMIR
AND PUBLISHED BY THE MANAGER OF PUBLICATIONS, DELHI-8
Price: Rs. 20.50 or 47 Sh. 10 d. or $ 7.38

ft: -~ :I: tI) <C
... ~ C Z <C
II.
UJ >
~ lll)
Z ~ o .«
z
\ ~ V c;,
z 0;t .
-lI! ,
Part I
I-A
I-B
I-C
Part II
II-A
II-B
II-C
Part III
Part IV
Part V
V-A
V-B
Part VI
Part VII
Part VIII
VI II-A VIII-B
Part IX
Part X
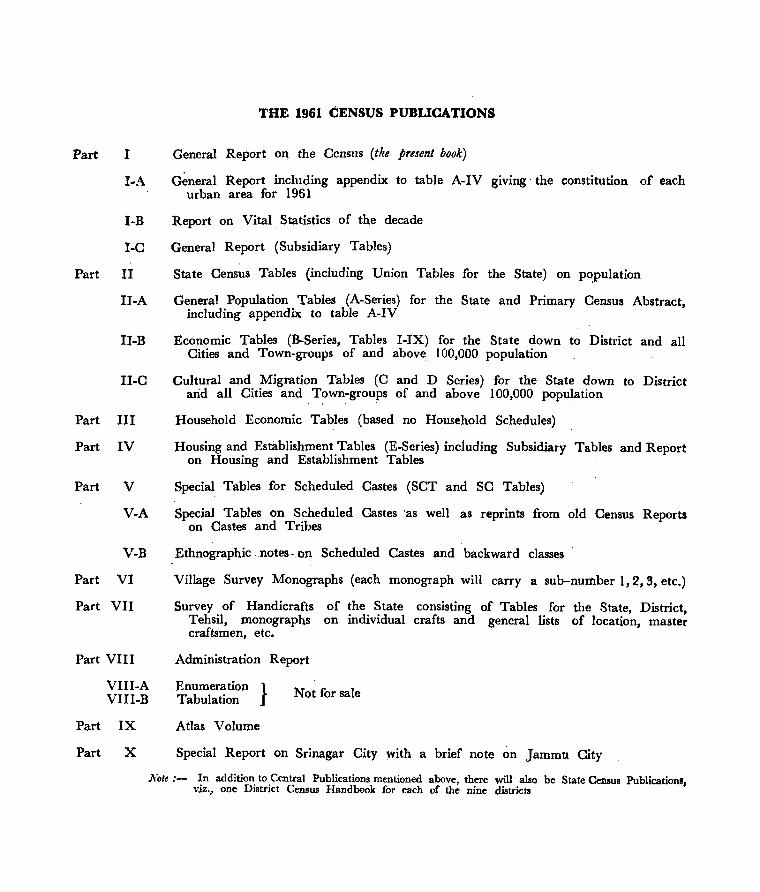
THE 1961 CENSUS PUBUCATIONS
General Report on the Census (the present book)
G~neral Report including appendix to table A-IV giving the constitution of each urban area for 1961
Report on Vital Statistics of the decade
General Report (Subsidiary Tables)
State Census Tables (including Union Tables for the State) on population
General Population Tables (A-Series) for the State and Primary Census Abstract, including appendix to table A-IV
Economic Tables (B-Series, Tables I-IX) for the State down to District and all Cities and Town-groups of and above 100,000 population
Cultural and Migration Tables (C and D Series) for the State down to District arid all Cities and Town-groups of and above 100,000 populatIon
Household Economic Tables (based no Household Schedules)
Housing and Establishment Tables (E-Series) including Subsidiary Tables and Report on Housing and Establishment Tables
Special Tables for Scheduled Castes (SCT and SC Tables)
Special Tables on Scheduled Castes 'as well as reprints from old Census Reports on Castes and Tribes
Ethnographic notes - on Scheduled Castes and backward classes
Village Survey Monographs (each monograph will carry a sub-number 1,2,3, etc.)
Survey of Handicrafts of the State consisting of Tables for the State, District, Tehsil, monographs on individual crafts and general lists of location, master craftsmen, etc.
Administration Report
Enumeration } Tabulation
Atlas Volume
Not for sale
Special Report on Srinagar City with a brief note on Jammu City
}{ote:- In addition to Central Publications mentioned above, there will also be State Census Publications, vjz., one District Census Handbook for each of the nine distl'icts .

PREFACE
The 1961 Census of Jammu and Kashmir is seventh in its series, the first regular Census having been taken in 1891. Historic evidence is however lIvailable to show that a Census was also taken in 1873 though it was designed to collect only the sexwise population of the State and its constituent districts. I:ven the 1891 Census did not go very far as
its scope was limited to the studying of some of the prominent characteristics only. The next Census held in 1901 however was more broad based and designed to collect basic
data on the demographic, socilSl, cultural and economic structure of the people. Regular decennial Censuses were taken thereafter right upto 1961 except in 1951 when due to
abnormal conditions prevailing in the State, it was not Found Feasible to organize the Census.
The 1961 Census was thus taken two decades after the latest census held in 1941. In the meanwhile, the State had been split up by the Cease-fire Line and a number of districts and tehsils had been newly carved out within the territory administered by the
State Government. The realignment of the Census jurisdiction and the reconstitution of districts and tehsils added in no small measure to the already arduous and complex task
assigned to the Census Organization. Further, the large scale movement of population from and into the State territory on this side of the Cease-fire Line which followed the tribal raids equally added to the problems to be tackled to enSure an accurate census count.
Above all, unlike other States, no trained persons who may have worked in the Census of
1941 were available, as they had either already retired from service or passed away or migrated to other areas.
Formidable though these difficulties appeared to be, we were not in the least scared
and were determined to resolve these one by one so as to fall in line with the rest of the country. Our apprehensions were also alllSyed by the patronage we received From the Registrar General's .OfFice and the various Ministries of Central Government as also by the
co-operation extended by the Government of Jammu and Kashmir. Another redeeming feature
was the application of the Census Act of India (No. XXXVII) which though enacted in 1948 excluded the State of Jammu lind Kashmir from its jurisdiction. Two years later, the Act
was melde applicable to this State also vide Adpptation of Laws Order 1950.
The 1961 Census is a landmi!lrk in the history of Censuses taken so far in that the entire structure and the pattern of national count have been remodelled and brought ~t par
with the standards prescribed by the United Nations Organisation. As a sequence to this
change, the scope and coverage of the Census data have been Fairly widened to ensure
collection of comprehensive data so urgently needed for national planning and development.
That is why emphasis has been laid in the various schedules. canvassed at the census to
1
mak~ a thorough probe into the economic cheracteristics. This necessitated the formulation
o"f an exhaustive tabulation programme embodied in the following series of publications :-
Series
A
B
C&D
E
SCT and SC
Description
General Population Tables
Economic Tables
( I) General Economic Tables •••
( II) Household Economic Tables
Cultural and Migration Tables
Tables on Housing and Establishments
Tables on Scheduled Castes .• ~
No. qf Tables
4
23
14
9
17
5
7
In addition to the above publications, another volume designated as subsidiary ti!lbles
which furnish proportionate figures as distinguished from the actuals given in the main tables
have also been published. The work 10i!ld was mi!lde still more heavier· by presenting the
data separately for the rural and urban areas of the State as also for its districts i!lnd
tehsils. It is therefore no wonder th~t the implementation of an elaborate prog~amme of this scale
should have kept the State Census Office and the OFfice of the Registrar General. India busy For severi!ll years aFter the census count was taken. It will be appreciat~d that the inclusion
in the present publication of a very large number of inset tables which will provide most valuable material to research scholars and experts added in no small measure to the heavy
volume of work handled by the staff; Finally, the conFlagration which broke out in 1965 in the Rajgarh Secretariat where the Census and some State Government OFfices were
housed resulted in the destruction of our accounts; records and a number of maps of the
Atlas Volume. The reconstruction' of these rec<?rds and the time taken to establish the
oFFice in its new premises are some of the other factors also which should nob be
overlooked.
I have a feeling that I was perhaps created For the Census. My First appointment
In Government service which dates back to 1930 was made in the Census Department where I served for about two years. Little did I anticipate at that stage that I would also
have to retire From Government service while working in the Census and that my associa
tion with various administrative departments of the State during the interve~ing 28 years or
so would in course of time prove an asset to me For the perFormance of the duties
which would one day be assigned to me as Census Superintendent of Jammu and Kashmir.
The results of 1961 Census are being presented in a series of publications. The
AI'-- India Reports which head the series and are numbered Volume No. I are Followed by
the publications relating to major States and Union Territories which have been - allotted
volume numbers II, III, IV, etc. etc. according to the alphabetical order of their names. The
Census data relating to Jammu and Kashmir has been incorporated in various parts· of volume
11
VI of the series of publications designated Census of India, 1961. This volume consists of ten Pluts, some of which have Further been sub-divided depending upon the quantum of
material relating to each.
The General Census Report which forms Part I-A of Volume VI has been split up into three sub-parfs. The first sub-part entitled sub-part' I-A (i) contains the first four
chapters. Sub-part I-A (iij includes the subsequent four chapters while the last part, namely
sub-part I-A (iii), contains the last three chapters only The pages of each sub-part have
been 'given separate numbers and not carried -over to the next part.
The General Report was designed to cover in the form of narrative comments all
the tables of A, C and D series as also the General I::conomic Tables. A comprehensive
synopsis of the chapters and headings and of the proformae of inset tables',: was made
available by the Registrar General" India in the compilation entitled 'Draft Reporting ProgrBmme '.
This facilitated ZI uniform treatment of the various subjects by all the States Zlnd Union
Territories.
It may be stated here
and the conclusions arrived at
necessarily represent the views
that the statements made in the Report, opInions expressed
are entirely the responsibility of the author and do not
of the Government.
Before concluding, must place on record my profound gratitude for the most
valuable help and guidemce which I received for a long. span of tima extending to about
nine years from Shri A. Mitra, I. C. S. Registrar General, India. I have no hesitation in
acknowledging that but for the scientific planning which he devised for the execution of different proj~cts and the gi.lidZlnce he gave during the Census Conferences, through official
communications and in the course of hi,S tours of the State, it should not have been
possible for me to score whZltever success I have been Zlble to Zlchieve.
I would be failing in my duty if I do not reFer to the help I received From Shree D. Natarajan, Deputy Registrar General who promptly solved the various administrative and technical
problems which I had to face from time to time. I am also indebted to Shri K. D. Bafal, I. A. 5., Central Tabulation Officer for the help he offered me by scrutinizing the vast mass of statistical data on which this Report is based.
Shri V. Ramamoorty, Section OFFicer and other oFficials of the Office of Registrar GenerZlI also extended fullest co-operZltion to me throughout the t""nure of my employment
as Census Superintendent. I avail of this opportunity to thank them for their assistance.
Shri S. p. Arora,
many others. In addition,
tion work was conducted.
Tabulation Officer prepared a number of Inset Tables Zlnd scrutinised
he also supplie'd information regarding the mBnner in which tabula
I thank him for the hard work he had to do.
iii
Finally, I must place on record my appreciation of the excellent work done by Shri Shushan Lal Tiku, Statistical Assistant. He has borne the main brunt of the work connected with the compilation of the General Report and has had to work after office hours as also on gazetted holidays. He is one of the few best hands of this office and was thereFore selected by me for this work. I admire the courage and patience which he displayed in the discharge of his duties.
The names of other members of the staff who h:we rendered valuable IIssistance in the compilation of the Report have been listed on the next page.
Dated: Srin<;lgar, the 26th of January, 1968 M. H. KAMIL!
IV
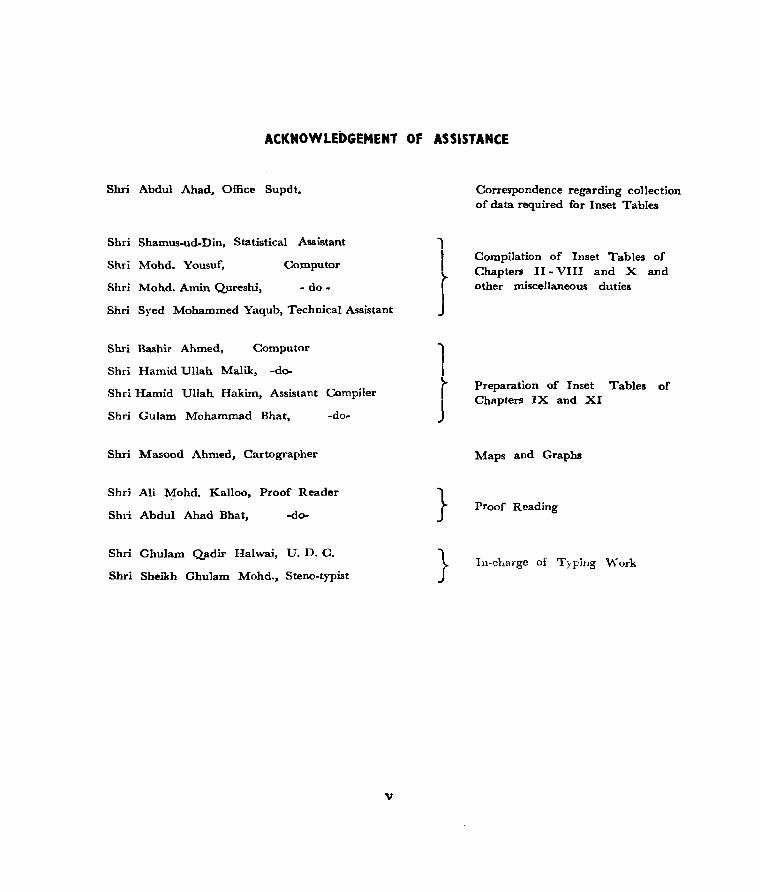
ACKNOWLEDGEMENT OF ASSISTANCE
Shri Abdul Ahad. Office Supdt.
Shri Shamus-ud-Din, Statistical Assistant
Shri Mohd. Yousuf,
Shri Mohd. Amin Qureshi,
Computor
- do-
Shri Syed Mohammed Yaqub, Technical Assistant
Shri Bashir Ahmed, Computor
Shri Hamid Ullah Malik, -do-
Shri Hamid Ullah Hakim, Assistant Compiler
Shd Gulam Mohammad Bhat, -do-
Shri Masood Ahmed, Cartographer
Shd Ali Mohd. Kalloo. Proof Reader
Shri Abdul Ahad Bhat, -do-
Shri Ghulam Qadir Halwai, U. D. C.
Shri Sheikh Ghulam Mohd.. Steno-typist
v
1 I
J 1 J
}
}
Correspondence regarding collection of data required for Inset Tables
Compilation of Inset Tables of Chapters II - Vln and X and other miscellaneous duties
Preparation of Inset Tables of Chapters IX and XI
Maps and Graphs
Proof Reading
In-charge of Typing ""'ork

CONTENTS
(Figures within brackets indicate the number of paragraphs in the Chapter) ,Pages
Preface...... ... ...... ............... ...... ........ .......... ...... ... ... ... ... ... .. ... ........ . ............................................................ i.iv
SectioD
Section.
CHAPl'ER I
GENERAL
I-A Historical Survey (1.1-1.4); Brief Political History of Jammu' (1.5-1.6); Chronicles on Kashmir (1.7-1.8); Evolution of Kashmir (J.9-1.14); The Kashmiri Era (1.15-1.18); Capitals of Ancient Kashmir (1.19-1.27); Political History of Kashmir-Pre-Islamic Period (1.28-1.64); Gonanda dynasty (1.39-1.41); Vikramaditya dynasty (1.42); White Huns dynasty (1.43-1.44); Naga dynasty (1.45-1.49); Utpala dynasty (1.50-1.53); Lohara dynasty (1.54-1.60); SeC?nd Lohara dynasty (1.61); Kalhana and others (1.62-1.64); Muslim Period (1.65-l.l38); Moghul Period (l.l 39-1.1 84); Sikh Period (l.l85-1.194); Dogra rule (1.195-1.231); Tribal raids of 1947 (1.232); The Constitution of Jammu and Kashmir (1.233-1.234); Principal Achievements of Post-independence Period (1.235-1.238);
2-Introductory Note on the Census of 1961·Legal basis (1.248-1.253); Calendar of Census Operations (1.254-1.266); General Village and Town Register (1.267-1.269); Uninhabited Villages (1.270-1.271); Inter-district transfer of territorial Units (1.272-1.274); Location Code (1.275-1.279); Urban Areas (1.280-1.284); Quality of Census Agency (1.285-1.286); Mistakes made during the training Classes and Sample Training Census (1.287); QjJality of Houselists (1.288); Quality of Block Maps (1.289); Quality of Household Schedules (1.290-1.292); Definition of Household Industry (1.293-1.294); Entries to be made in Sub-part-C of the Household Schedule (1.295); Consecutiveness and Comprehensiveness of Questions in the Individual Slip (1.296-1.303); Advantages and Disadvantages of Central Printing and Distribution (1.304-1.310); Quality of sorting Work (1.311-1.314); Problems of Coding (1.315-1.319); Results of Post-Enumeration Check (1.320-1.323); Appendices Appendix-A: Calendar for Census of 1961 (Snow-bound Areas); Appendix--B: Calendar for CensUll of 1961 (Non-snow-bound) Accessible Areas Appendix - C: Circular Appendix-D: (i) List of Districts and Tehsils in the Jammu and Kashmir State with their location Code Numbers Appendix-D : (ii) List of Towns in Jammu and Kashmir with their Location Code Numbers Houselist Household Schedule Individual Slip Instructions for filling up the Houselist Instructions to Enumerators
CHAPTER II
Distribution. aac:I MoveJDeDt of PopulatioD
Section t'-:'Area and Jurisdiction - The Reference Day of 1961 Census (2.1-2.2); Geographical Location of the State (2.3-2.7); Geological Structme (2.8); Area (2.9-2.10); Soil (2.11-2.14); Rainfall (2.15-2.16); Population .(2.17-2.18); Administrative Divisions (2.19-2.28); Definition of village (2.29-2.30); Definition of Town (2.31-2.32); Rural/Urban Population, 1901-61 (2.33-2.35); Census Jurisdiction, 1891-1961 (2.36-2.44); A comparison of HouseH.t and Census Populations (2.45-2.48); Area of the State and its Districrs,
1-36
36-54
57 58 59
60 61
62-65 66-69 70-71 72-82
83-138
~901-61 (2.49-i66); 139-151
Vll

Semon 2 - Distribution and Density of Population - Inter-State Comparison of Population and Area (2.67); InterState comparison of Growth Rate, Density and Sex Ratio (2.68-2.113); Comparison of Population, Growth rate, Sex ratio and Density with Foreign Countries (2.114-2.121); Size of Districts by Area and Population (2.122-2.140); Concentration of population by Size of Villages and Towns (2.141-2.148); Ranking of Districts by Area and Population (2.149-2.152); Growth of Population in Districts, 1901-61 (2.153-2.163); Average Population and Area of Districts (2.164-2.167); Tehsils which aTe above or below the Average Population of a Tehsil in the District (2.168-2.173); Distribution of General Density in the Tehsils of the State (2.174); Tehsils with Higher Densities than that of the State (2.175-2.301); Tehsils with lower Densities than that of the State (2.302-2.308); Comparison of the Density of Entirely Rural, Non-industrial and Industrial Tehsils with the Average Density of their
Pages
respective districts (2.309-2.363): 151-210
SecdOD 3-Density of Census Houses - Definition of Census House (2.364); Definition of a Census Household (2.365); Distribution of Households (2.366-2.373); Census Houses and Census Households (2.374-2.379); Distribution of Households in the most congested Non-Slum City Areas (2.380-2.383); Distribution of 1,000 Households and 1,000 Population in the Slum Areas of the Cities (2.384-2.389); Density of Census Households in the Urban Areas according to Locality (2.390-2.392); Distribution of Households in Urban Areas by number ·of Rooms Occupied (2.393-2.407); Distribution ofCen.us Houses according to their use in Cities and Towns (2.408-2.426); 210-224
SeedoD 4-Growth of Population - Growth of Population in Districts and Tehsils, 1951-61 (2.427-2.'~31); Rural and Urban Components of Tehsils with Higher growth Rates than the State (2.432-2.438);· Increase in Rural Areas due to Immigration (2.439-2.445); Tehsils with Higher Growth Rates than that of the State (2.446-2.455); Tehsils with lower Growth Rates than those of their respective Dist~icts (2.456-2.484); District-wise Growth Rates of Population between 1951--61 (2.485-2.508); 224-243
Sectlcm 5-Natural Growth of Population (2.509-2.511); 243-24!>
CHAPTER. m rhe Urban Popnlation
Section 1-Classification of Towns - Definition of Urban Area (3.1-3.10); 1941 Towns declassified in 1961 (3.11); Number of Towns of each Class in 1901-61 (3.12-3.13); New Town. (3.14-3.20); Areas of Towns (3.21-3.29); Town-group (3.30-3.35); Geographical Distribution of Cities and Town-groups-- (3.36-3.38); Urban Development, 1901-61 (3.39-3.42); 246-254
Section 2-Growth of Conurbation - Clusters of Conurbation (3.43-3.44); Zones of Conurbation, 1901-61 (3.45); 254-257
Section 3--Functional Classification of Towns - Towns Classified by predominant Functional Characteristics (3.46-3.56); Functional Characteristics of constituents of Town-groups (3.57-3.58); 258-260
Section 4-Settlement Pattern of Cities, Towns and Villages-Structure ofsmal! Towns and large Villages (3.59-3.71); Settlement Pattern of Cities (3.72-3.74); 261-267
Semon 5-Trend of Change in Urban Population - Change in the Proportion of UrJ:>an· Population, 1901-61 (3.75-3.78); Distribution of Urban Population among the six class Ranges of Cities and Towns (3.79-3.110); Concentration of Urban Population in Intermediate Class Ranges (3.111-3.114); 267-271;.
Section 6-Growth of Population in Cities and Towns of Different Characteristics (3.115-3.120); Variation in the Population of Residential Towns (3.121-3.128); Variation in the Population of Non-industrial Towns (3.129-3.138); Variation in the population of Industrial Town. (3.139-3.143); 276-282
Section 7-Immigration into Urban Areas - Extent of Immigration (3.144-3.158); Migrants to Cities from other States in India (3.159-3.164); Distribution of Migrants into Cities (a) by age (3.165-3.166); (b) by literacy (3.167-3.171); (c) by occupation (3.172-3.184); (d) by sex (3.185c3.191); (e) by duration of l'esidence in place of enumeration (3.192-3.200); Distribution of Immigrants into cities by workers and Non-workers Srinagar Municipality (3.201-3.226); Jammu Municipality (3.227-3.259); 283-304
Section 8- Sex Ratio in urban areas - Sex ratio in cities and towns with different characteristics (3.260-3.307); Effect of Housing Scarcity on Sex Ratio· in cities (3.308-3.310); Sex Ratio by age (3.311-3.322); ..• 305-318
VUl
Sect-IOD 9-Different Aspects of Urbanisation - Age composItIon by sex in cities (3.323-3.329); Workers in cities classified by Sex and Industrial Categories, 1901-61 (3.330-3.338); Literacy by sex and Age (3.339-3.358); Distribution of workers in different Industrial Categories according to Educational levels (3.359-3.363); ~on-workers (3.364-3.373); Distribution of literate workers in different Industrial Categories (3.374-3.377); Un-employment in the State and iI. Districts (3.378-3.411); Un-employment in cities (3.412-3.435); Mother-tongue and Bilingualism (3.436-3.447); Changes in the composition of Communities inhabiting
Pages
urban Areas (3.448-3.461); Progress of Urbanisation (3.462-3.467); 318-363
CHAPTER IV
The Rural Popalat.ioa
Sect.ioa I-Preliminary Remarks - Clas..ification of Rural Population (4.1); Definition o(Village (4.2-4.12); Uninhabited Village (4.13-4.14); Settlement Pattern of village (4.15-4.16); 364-367
Sectioa 2-Inhabited and Un-inhabited villages - Inhabited and Un-inhabited villages in the States o( India (4.17-4.19); Advantages of adopting the legal village as Territorial Units for purposes of Census (4.20-4.21); Inhabited and Un-inhabited villages between 1901 and 1961 (4.22-4.23); Comparison of villages of the States in India by size classes of population (4.24-4.34); 367-372
Sect.ioa 3-Distribution of Rural Population by size class of villages - Distribution of villages by class range (4.35-4.45); Changing pattern of villages (4.46-4.51); 372-377
Sectioa 4-Factors in Influencing size of villages - Density of Roads (4.52-4.66); Road mileage in India compared with Advanced Countries (4.67-4.69); Road Density in States (4.70-4.72); 377-381
Sectioa 5-Distribution of Rural Population by size of villages, workers, non-workers and literacy - Distribution of villages by size (4.73-4.81); Characteristics of larger villages and smaller towns (4.82-4.129); Industrial category of workers and non-workers (4.130-4.156); Rural literacy among workers (4.157-4.195); Literacy among Non-workers (4.196-4.203); Rural unemployment by sex (4.204-4.247); Extent of Literacy in Rural areas (4.248-4.277); 382-414
Appendix showing dates of Important Events Represented by Chronograms 415-420
Stat_ent II. 1 lI,2 1I.3
II.4 II.S
11.6
1I.7
II.S
II.9
II.lO II.ll
11.12 II.13 11.14 11.15 II.16
II.17
Il.1S
11.19
11.20 11.21 II.22 II.23 11.24 11.25 11.26 II.27 1I.28 II.29 II.3D
II.31
II.32
STATEMENTS
CHAPTER II
Changes in the Jurisdiction of Superintendent of Census Operations, 1891-1961 Area of Districts, 1901-61 Rank of the State among other States and Union Territories of India in terms of
Population and area, 1961 and 1951 Population, annual rate of increase, sex ratio and density per sq. km., 1961 Comparison of population, annual rate of increase, sex ratio and densil)' per square
kilometre with other Countries (a) Most populous, least populous districts and average population of distri~ in each
of the States of India, 1961 (b) The largest, the smallest and average size of districts in each of the States of India,
1961 Number of districts and their total populations which are above or below the average
population of a district for each State, 1961 Number of district and their total areas which are above or below the average area of
Pages
144 147
151-152 153
161-162
164
165
166-167
a district for each State, together with their respective Populations, 1961 168 Persons per 10,000 of population in villages and towns of selected population sizes, 1961 170 Percent of villages and towns among all villages and towns (including cities and town-
groups respectively of selected population sizes), 1961 171 Ranking of districts within the State in terms of population anq area, 196i and 1941 173 Percentage growth of population in each decade during 1901-61 ... 174 Districts which have had higher percent increase than the average for the State, 1901-61 175 Districts which have had lower perc .. nt increase than the average for the State, 1901-61. 175 Districts arranged according as their populations are above or below the average population
of a district for the State, 1961 176 Districts arranged according as their areas are above or below the average area of a.
distric[ for the State, 1961 176 Number of tehsils and· their total populations which are abo"e or below the average
population of tehsils for their respective districts, 1961... 177 Distribution of general density (persons per sq. mile) in the teboils of the State arranged
by districts, 1961 178 Character of teltsils ·whose densitie .. are higher than the average for the State, 1961 179 (a) Entirely rural teboils 180 (b) Non-industrial tehsils each containing at least one Non-industrial town 181 (c) Industrial tehsils each containing at least one industrial town ..• 182 Character of tehsils whose densities are lower than the average for the State, 1961 199 (a) Entirely ·rural tehoil. 200 (b) Non-industrial [eltsils each containing at least one Non-industrial town 201 Character of tehsils whose densities are above or below that of the district concerned 202 Distribution of 1,000 Census households by types. of Census houses 211 Number of Census households per 1,000 Census houses 212 Distribution of 1,000 households in the most congested non-slum City areas by number
of rooms occupied 213 Distribution of 1,000 persons to the most congested non-slum City areas by number of
rooms occupied 214 Distribution 1,000 households and 1,000 population in the slum areas of the Cities by
number of rooms occupied 21 !i
x
StateDlent 11.33
11.34
11.35
11.36
11.37 II.S8
II.39
11040
11.41
11.42
1I.43
11.44
11.45 11.46
IlL 1 III.2 111.3 111.4 111.5 111.6 III.7
III.8 III.9
IlL 10
111.11
III.l2
III.l3
I1I.14
I1I.l5
I1L16
I1I.l7
Average number pcr Census hou.e of Census households and of dwellings of all kinds in the slum areas of the cities
Namber of Census households per acre in cities and towns of the State and according to locality in the City
Households per 1,000 households in Cities and towns classified by number of rooms occupied
Distribution of 1,000 households according to number of rooms occupied in each of the class VI towns of the State· .. _
Distribution of 1,000 Census houses according to use in Cities and towns Percentage decennial increase or decrease of population in districts and tehsils during
1951-61 Percentage decennial increase or decrease of population in districts and tehsils during
1941-61 Rural and urban components of increase in popUlations of tehsils which have shown increases
above the State average
Tehsils showing high increase due to comparatively high increase in rural population during 1951-61
Tehsils showing high increase due to comparatively high increase in urban population
during 1951-61 Tehsils in which the growth of rural population has been comparable with that of urban
population during 1951-61 Tehsils (rural areas only) showing high increase in 1961 classified by the proportion of
immigrants who have lived in the tehsil not more than 10 years Percentage decennial increase in population of districts between 1951 and 1961 Percentage of age-groups 0-14 and 15-59 and of .married women (15-49) to total popula
tion and children (0-4) to married women (15-49) in district 1911-61
CHAPTER m
Towns in 1941 which have been declassified as rural in 1961 Number of towns in each class of town in the .State, 1901-61 New Towns of Classes I-VI with their populations in 1961 Geographical distribution of Cities and town-groups, 1961 Discernible zones of conurbation in the State, 1961 The growth of zones of conurbation, 1901-61 Classification of cities and towns according to their predominant functional characteristics,
1961 Predominant characteristics of constituents of town-groups, 1961 Proportion of urban· population per 1,000 of general population of the State and
districts, 1901-61 Number per 1,000 of total urban population of each district in each Census year found
in Class I towns, 1901-61 (Districts which have no class I towns are omitted) Number per 1,000 of total urban population of each district in each Census year found
in Class II towns, 1901-61 (Districts which have no class II towns are omitted) Number per 1,000 of total urban population of each district in each Census year found
in Class III, towns 1901-61 (Districts which have no class III towns· arc omitted) Numher per 1,000 of total urban population of each district in each Census year found
in Class IV towns, 1901-61 (Districts which have no class IV towns are omitted) Number per 1,000 of total urban population of each district in each Census year found
in Class V towns, 1901-61 (Districts which have no class V towns are omitted) Number per 1,000 of total urban population of each district in each Census year found
in class VI towns, 1901-61 (Districts . which have no class VI towns are omitted) Distribution of population between towns, district by dhtrict, with populations over 20,000
in 1961
Distribution of 'population between towns, district by dhtrict, with populatiOn> over 20,000 in 1951
Xl
Pages
• 216
217
217
220 221
225
226
227
228
228
229
230-231
239
244-245
248 249
249-250
253 255
256-257
259 260
267-268
269
269
269
269
270
270
275
275
Statetn_t IlLI8 III.19 111.20 111.21
III.22
111.23
I1I.24 III.25 I1I.26
I1I.27
111.28
I11.29 I1I.30
111.31 I1I.32
II1.33
IJJ.34 IlI.35
I1I.36
111.37 111.38
111.39
111.40
I1I.41
111.42
III.43
III.44
111.45
lII.46
Progress of population in Cities and towns classified according to character during, 1901-61 ••• Population of Residential towns from 1911 to 1961 Non-industrial towns which declined in population at certain Censuses, 1911-61 Industrial towns whose population fluctuated between 1911-61 Proportion per 1,000 urban population in ea"h district and city or town-group of
population of one lakh and over classified by persons Proportion per 1,000 urban population of each sex in each district and city of population
100,000 and over cIassfied by place of birth of persons born elsewhere in the district of enumeration, in other district. of the State and in other States of India, 1961
Percentage of literate migrants into cities classified by educational levels Distribution of 1,000 workers among migrants to cities by sex and important occupations Migrants classified by place of birth and duration of residence in the place of enumeration
(Sl'inagar Municipality) Migrants classified by place of birth and duration of residence in the place of enumeration
(Jammu Municipality) Emigrant population of Jammu and Kashmir enumerated in various States in India
whose duration of stay in these States did not exceed ten years in 1961 Number of births and deaths during, 1951-60 Percentage of male immigrant non-workers of different age-groups by educational levels
in Srinagar city Percentage of total, male and female immigrants by broad age-groups Percentage of male immigrant non-workers of different age-groups by -educational levels
in Jammu city. Percentage of female immigrant non-workers of different age-groups by educational levels
in Jammu city Females per 1,000 males in different types of cities and towns, 1901-61 Total number of sample households, single member households and percentage of single
member households to total number of households Number of male workers per 1,000 males, number of female workers per 1,000 females,
nurp.ber of female workers - per 1,000 workers of both sexes and sex ratiO! in different
types of cities and towns, 1961 Distribution of 1,000 Census households according tonqmber of rooms occupied in cities Number of persons, males and females per room and persons per household in each
ea tegory of household in cities Sex ratio (females per 1,000 males) in towns of Jammu and Kashmir State by broad
age-groups, 1961 Females per 1,000 males in different age-groups in (a) Administrative, residential and
educational towns, (b) port, trading, commercial including ship-building towns, (c) Transport, storage and communication towns, (d) Manufacturing and industrial towns (e) Mining towns and (f) Railway towns
Age composition of males and females expressed as percentage of male and female
population respectively Number of each sex in each age-group expressed as percent of total of all ages for
each sex in Srinagar and Jammu cities, 1961 Age composition of males and females expressed as percentage of male and female
population repectively in cities of population 100,000 I 200,000 and above Percentage of male and female population in smaller age-groups to total male and
female population in Srinagar and Jammu cities Number per 1,000 of total workers, males per 1,000 of total male workers, females per
1,000 of total female workers in the nine Industrial categories of 1961 compared to their respective proportions in previous Censuses (1901-61) for eities of popUlation
100,000 and above Number per 1,000 of total workers, males per 1,000 of total male workers, females per
1,000 of total female workers in primary, secondary and tertiary sectors of industry, 1961 compared to thtil' respective proportions in previous Censuses (1901-61) for cities
of population 100,000 and above
xu
Pages 276 278 280 282
283
285 288 290
293
294
295-296 296
299 300
302
304 305-306
307
313-314 315
315
316
318
319
319
320
320-321
322
323
Statelllent 111.47
111.48
1II.49
III.50
111.51
111.52
III.53
111.54
111.55
111.56
111.57
IV.I
IV.2 IV.3
IV.4
IV.5
IV.6
IV.7
IV.8
IV.9 lV.IO
IV.II
IV.12
IV.13 IV.14 IV.15 IV.16
Pages Sex-wise literacy percentages of qualified and un-qualified persons by age-groups in the
districts of the State 326-328
Districts in which the proportions of different categories of non-workers are higher or lower than the average of the State by 33%
Number and proportion of literate male workers per 1,000 male workers of each industrial category in the State and districts, 1961
Number and proportion of literate female workers per 1,000 female workers of each
332
333
industrial category in the State and districts, 1961 333-334
(a) Number per 1,000 of population of the age of 15 and above seeking employment for the first time, (b) Number per 1,000 of population of the age of 15 and above who were employt"d before but are now out of employment and seeking wor!$; and (c) = a + b 336-339
Distribution of non-workers and un-employed persons aged 15 and above by age-groups in urban areas
Proportion per 1,000 of male and female non-workers seeking employment for the first time . and thaBe out of employment now and seeking work again. to the total nonworking population of each sex
Distribution of 1,000 males and females who are un-employed in each age-group according to educational levels in Srinagar and Jammu cities
Distribution of I ,000 wo~kers in each occupational division and in each sex by educational level. in urban areas only
Number of 1,000 persons of same_ religion who live in towns, 1921-61
Changes in classification of cities, town-groups and towns, 1901-61
CHAPTER IV
Number of villages (inhabited and uninhabited) and th .. average number inhabited village in each State of India, 1961
Number of villages (inhabited and uninhabited) in the State, 1901-61 Proportion of 10,000 persons in each State raiding in villages classified
population, 1961 Population per 1,000 persons residing in villages in each district classified
population, 1961
of persons per
according to
according to
Changes in the proportion of 1,000 persons residing in villages classified according to population in State and districts, 1921-61
Changes in the population of 1,000 persons residing in villages classified according to population 1901 and 61
Number of linear miles of road per 1,000 square miles oC territory (excluding municipal roads) in the year, 1960-61
Number of linear miles of road (in the year 1960-61) related to 1,000 of rural population of 1961
Percentage of villages connected by roads to total number of villages, 1961 Districts of High and Low Road Densities related to the proportions of workers in
Industrial Categories and to non-workers Road mileage in India and J~mmu and Kashmir compared with advanced countries
of the world Mileage of surfaced and unsurfaced roads in several States of India (year 1961) excluding
Municipal roads Distribution of 1,000 villages of certain population classes, 1961 Changes in the distribution of 1,000 villages of certain population classes, 1931-61 Villages with a population of 2,000 and over and towns of populati:lD under 5,000 Distribution of 1,000 of total population in villages of 2,000 and over and in towns of
population below 20,000
Xlll
3+2-343
344-345
346-347
350-351
358-359
361-362
367 368-369
370
372
375
376
377
377 379
379
380
381 382 383 38+
385
Pag('S
StateDlent IV.17 Distribution of 1,000 persons by each industrial category of worker and by non-worker of the rural population of districts, 1961 392
IV.18 Districts where the distribution of 1,000 persons hy each industrial category of worker, and non-worker of the rural population is distinctly different from that for the State as a whole, 1961 393-394
IV.19 Districts in which the proportions industrial categories and educationl average
of 1,000 male and female work .. rs of different levels are abnormally high or low than the State
397-400 IV.20 Districts in which the proportions per 1,000 persons of different educational levels who
arc not at work are abnormally high or low than the State Jlverage 405
IV.21 Districts in which the proportions of 1,000 unemployed males and females of different educational levels aged 15 and above are abnormally high or low than the State average 406-407
MAPS AND GRAPHS
(i) Maps
Map of Jammu City
Tehsils with densities of population above or below that of the State, 1961
Tehsils with densities of population above or below that of th .. Di3trict, 1961
Tehsils with higher growth rate than that of the State, 1951-61
Geographical location of Srinagar Town-group Growth of urbanism 1901-11,1921-31,1941-51 and 1961 Clusters of Cities and Towns Classified according to size of population, 1961
Notional maps of Udhampur town and villages Mand and Jib, Notional maps of Sopore town and villages Haihama and Kalaruch
Notional 'maps of Pampon: town and villages Awantipora and Ladua, Notional 'maps of Banihal town and villages Duligam and Khari
(ii) Graphs
Tehsils which are within 20% (±) of the average population for the tehsil (districts Anantnag, Srinagar, Baramulla and Ladakh)
Tehsils which are within 20% (±) of the average population for the tehsil (districts Doda, Udhampur, Jammu, Katlrua and Poonch)
Distribution of 1,000 population in Cities (Non-slum areas) by number of rooms occupied (Srinagar City), (wards)
Distribution of 1,000 population in Cities (Non-slum areas) by number of rooms occupied (Mohalla.)
XIV
Pages
Facing Page 44
Facing page 184
Facing page 202
Facing page 232
~Between pages 254-255 J
Between pages 262-263
Between pages 264-265
Facing page
Facing page
Facing page
Facing page
178
179
214
215

CHAPTER J
GENERAL
SECTION I
A Historical Survey
Before attempting an analysis of the data collected at the Census, it is necessary to in~
troduce the State in the context of its physical, geographic, social, cultural and historic back~ grounds which have been collectively operating to shape its present demographic and economic structure. The propriety of dealing with these aspects would be at once evident from the fact that the State is a conglomeration of several geogra~ phic regions inhabited by people of varying ethnic origins, professing different faiths, speaking man y distinct languages and dialects and claiming diverse cultures. It has also witnessed frequent political upheavals which have brought about radical changes in its social and economic complexion.
1.2 Prior to 1947, Jammu and Kashmir was the biggest in point of area among all princely States of India and equal to Mysore, Gwaliar, Baroda and Bikaner put together. The State came to be known as Jammu and Kashmir since 1846 when, as a result of the Treaty of Amritsar, the territory situated to the eastward of river Indus and westward of river Ravi including Chamba and excluding Lahore was made over permanently by the British Government to Maharaja Gulab Singh of Jammu for a ~onsideration of Rs. 75 lakhs. Till then, the Idea of the two provinces and the territory known as the frontier districts of Ladakh and Gilgit etc. being forged into a single State was never conceived.
1.3 The State though constituting at present of all these regions and provinces is still being r~ferred to as Kashmir both within and out~ sl~e the country. This is because of the worldWIde reputation which Ka5hmir enjoys for its
1
exceptional beauty. It looks like an emerald of verdure enclosed in a radiant amphitheatre of virgin snow, gifted with majestic mountains, invigorating climate, lovely rivers, lakes, springs, water-falls and charming flowers and delicious fruits. According to Dr. De Terra, the first evidence of a Himalayan Ice Age has become available from Kashmir. Even Switzerland which is reputed for its combinatiolil. of lake and mountain scenery is not comparable with Kashmir. There are many peaks in Kashmir which claim much greater heights than 1\10nt Blanc. The main valleys of Switzerland are not even as large as some of the side valleys of Kashmir. Younghusband has remarked that Kashmir is more beautiful than Greece as "it has the same blue sky and brilliant sun-shine but its purple hills are on a far grander scale and if it has no sea, it has lake and river and the still more impressive snowy mountains."
1.4 It might be of some interest to compare Kashmir and Kerala which occupy two extreme positions in the Indian peninsula. Both are gifted with a profusion of natural beauty reflected in landscapes, lakes, rivers, stl'eams and valleys. Kerala has a luxuriant growth of waving co· coanut palms while the beauty of Kashmir is f~rther enhanced by long row~ of tall popltrs stationed as sentinels on either side of its roads. Backwaters which constitute a common featuI'e of many parts of Kerala are not found in Kashmir but the latter is interwoven with numerous lakes, some of which are fairly lal'ge and equally charming. In Kerala, houses are generally nestled in the shades of cocoanut trees and are not huddled together. The layout of village settlements in Kashmir is, however, different. Each village consists of a large cluster of houses closely knit together. The prac-

tice of demarcating the compound owned by a household by fencing followed in Kerala is not known in the villages of· Kashmir. One can walk from the compound of one household to any other house without having to leave the premises. Each family knows the boundaries of the area owned by it and no one attempts to make an I"llcroachment on the areas of others.
Brief Political History of JaDlInu
1.5 It may be stated here that while plenty of m<iterial describing the geological evolution, eady history, geographic, political, cultural· and economic changes witnessed in the past by the valley of Kashmir is available, the ancient history of Jammu province is shrouded in mystery' due to the non-availability of even a single chronicle which could throw some light on the haprenings of the period prior to 18th century. It, ho'wever, appears that during the 12th century when Mahmood Ghori invaded India and .over-ran Punjab, Rajputs took refuge in the mountainous tracts of Jammu province and carved out separate estates and principalities, such as, J,!mmu, Kishtwar, Bhaderwah, Bashohli, Reasi etc. which they ruled as independent !overeigus. Except the fact that the city of Jammu was founded by Raja Jamboo Lochan ·who ~i .. -ed in 9th century A.D., very little information is available about the successive regimes which swayed the different regions of
. the province from time to time till Raja Ralliit Dev, son of Dhruv Dev, proclaimed himself as the ruler of the principality of Jammu in 1730 A.D. From all available information, it appears that the fint Raja of Dogra dynasty, nam~
Agnivarna, was a kinsman of Raja of Ayodhya. Agnivarna settled at Parol near Kathua and his son subsequently extended his dominion as far west as Jammu Tawi. Four other Rajas follo\\'ed in succession and two of the sons of the fifth Raja Agnigarbha, named Bahu Lochana and .lamboo Lochana, are said to have founded the Bahu Fort and the Jammu town respectively.
1.6 This independence could not, however, be maintained for long and soon after Moghul
2
ruiers subdued the Rajas of the various principalities and made them pay tributes in recognition of their dependence. After the disintegration orthe l\{oghul kingdom, the Rajas recovered their strength and proclaimed independence once again. -With the installation of Sikh rule in Punjab, however, Jammu and all other adjoining areas were annexed by Maharaja Ranjit Singh with his territories. Mian Kishore Singh who was a direct descendent of Raja Dhrev Dev held a prominent and respectable pOSition in the court of Maharaja Ranjit Singh at Lahore. His son Gulab Singh joined the army of Ranjit Singh while in teens and in course of time distinguished himself as a gallant warrior and became an accredited lieutenant of Ranjit Singh. Gulab Singh was eventually made the Raja of Jammu by the Treaty of Amritsar dated 16-3-1846. Later on, he annexed Kashmir with Jammu as a result of the sale deed executed by the British after the fall of Sikh rule in Punjab.
Chronicles on Kashlllir
1.7 In striking contrast with this scarcity of historical material, the number of chronicles and literature on Kashmir is so large that it is l'lot possible to compile even an exhaustive list of the same. There has been hardly any foreign visitor with a scholastic bent of mind who did not reproduce his observations and impressions by writing extensively on the geography, flora and fauna, beauty spots and the people of the valley . Besides the Moghul rulers, several among whom have written at length on Kashmir and its people, references to the country known as Kasmira are traceable even in the Mahabharta. Kashmiris themselves have made no less contribution in building up this valuable record extending to more than two thousand years. In fact, the first authentic chronicle from which the latter histories have drawn extensively is Nilamata Purana written during the eighth century. This was followed by the famous work of Rajtarangni of Kalhana Pandit (1079-1151 A.D.), although during the interval the valley was also visited by such eminent writers as Al-biruni (973 to 1048 A.C.) whose chronicle is believed

to contain the most authentic and accurate account of the geography and people of Kashmir. The Rajtarangni has been translated in many languages among which the one produced by Mr. M. A. Stein is regarded the best.
1.8 During Muslim rule, there was hardly any regime in which a number of chronicles, some original and others translated versions, were not produced. The first translation of Rajtarangni in Persian was brought out by Mulla Ahmad, a courti~r of Sultan Zain-ul·Abdin, popularly known
as Badshah. Thereafter, a series of histories were written from time to time, almost all of which have been preserved to this day though majority of these are still in manuscript and have not been printed.
Evolution of KaBhlDir
1.9 According to an ancient legend reproduced by Kalhana from Nilamata Purana, the valley was originally a lake, known by the name Satti Sal' or the lake of Satti (Dul'ga). A demon Jalodbhava (water-born) who is said to have l;Jeen residing in the lake caused considerable devastation in the neighbouring areas. Muni Kashyapa, father of Nagas, heard of the excesses of Jalodbhava from his son Nila, the king of Kashmir Nagas and decided to punish the demon. As a result of his prayers, the whole host of Gods took positions on the surrounding mountain peaks but the demon refused to come out of the lake whereupon Vishnu asked his brother Balbhadra to drain the lake. Balbhadra pierced one of the mountains with his ploughshare and water at once floated down the hole making the lake dry. Jalodbhava was attacked by Vishnu and ultimately slain.
1.10 Kashyapa then settled in Kashmir and the Gods as well as the Nagas also decided to reside in the valley permanently. At first the valley was habitable during summer only due to severe cold and the people used to move down for winter to plains. After four yugas, the Brahmin Chandradeva performed a number of rites which- had the effect of slackening the severity of the cold. ThelCafter, seasonal mig-
ration became unnecessary and people settled pel'manently in the valley.
1.11 The legend has been reproduced not only in the chronicles written by Muslim authors but is also said to have been alluded to by Hiuen-Tsiang, the famous Chinese traveller and writer.
1.12 This mythological version is endorsed by geologists also who believe that the basin of Kashmir contained a very large lake which was drained by a cataclysm which rent the sandstone rock at the western corner of the basin. It is pointed out that before the draining operation, the climate in winter' was so cold and snowfalls used to be so heavy that the habitable parts of the valley consisting mostly of mountain peaks could be occupied by nomads only who migrated alongwith their herds of cattle southwards in winter.
1.13 The lacustrine deposits found in the udars or Karewa plateaus (table land) provide ample evidence that the valley was once a lake, Of late, however, this view has a1so been controverted by some geologists who contend that even the presence of true lacustrine deposits does not prove" that the whole of Kashmir lake basin was ever occupied by a lake. Whatever the correct position, the fact remains that the lacustrine deposits of Kashmir are by far older than any monuments of man discovered so far.
1.14 The author of Tareikh·Hassan has given a slightly different version of how the demon Jalodbhava was done to death. He has pointed out that after the lake became dry, water started spouting out again from the place where the demon was hiding himself and spread over the surface of the earth. Kashyapa once more prayed to God and his request was granted. The result was that Sharika Devi appeared in the form of a myna with a lwnp of Samir mountain in its beak which she placed on the head of the demon who was crushed to death. This lump is now identified as hill (mountain of myna) which be the abode of Shal'ika Devi.
Had Parbat is believed to
According to

the author, the first pieCe of land which became
available for habitation was Ardwan (meaning first land), a famous . village of tehsil Kulgam.
The KashlDiri Era
1.15 Before the advent of Muslim rule, the era in use in Kashmir and in relation to which all important events including the accession of individual rulers were being referred to was Laukika or Saptarsi era. I t started on 1 st Chet sudi of the twentyfifth year of Kali sam vat corresponding to 3075-76 B. C. On this basis, Census of 1961 was held in 5036 Laukika year. The era as such has not been quoted by Kalhana in respect of the rulers of Kas_hmir preceding King Cippata Jayapida whom he states to have died in the Laukika, year 3889 corresponding to 7th March 813 A. D. From this date onwards, he gives accurate dates of Laukika era from and to which each succeSliive king ruled Kashmir right upto the year 4225, corresponding to 1149-50 A. D. ~hen he completed Rajtarangni.
1.16 Rinchan Shah alias Sultan Sadr-ud-Din . '
(1320-1323 A. D.), the first Muslim ruler of Kashmir and a contemporary of Edward III of England who was a Ladakhi by birth and was converted to Islam replaced the Laukika year by Hijri era and issued instructions for all official correspondence and executive and judicial notices being dated by Hijri months and year. This did not, however, find favour with the people and no one adopted the new calendar. Later, Sultan Shams-ud-Din, the founder of Shahmir family in Kashmir (1339-42 A. D.), introduced the Kashmiri era which started from the date of accession of Rinchan Shah (725 Hijri). The months of the new year listed below were known by the names familiar to Kashmiris and corresponded to the Persian Yazdjard era.
\Vahik, Jith, Har, Shravan, Badreet, Asht, Kartik, Munjhar, Poh, Magh, Phagan, Chettar.
The 3rd of Chettar (15th March) was declared as the date on which spring sets in
and was named 'sounth' 'by 'whieh it is known to this day.
1.17 It may be stated here that the Kashmiri year, as thus evolved, is eleven days two hours and twentyfive minutes less than the solar year which is estimated to last for 365 days 5 hours and 49 minutes. To make up the deficiency and to ,ensure that agricultural operations are conducted on appropriate; dates in each season, Sultan Shams-ud-Din furt~er ordered that after every two years and nine months, the tenth month should be repeated, thus r,?-ising the number of months in the third year to' thirteen. The dates of vari9us festivals celebrated in Kashmir were _accordingly calculated and are in force to this day. The peas~ntry have neither com· mitted to memory the monthS of Hijri era nor those of Bikrami year, but have evolved a calendar for carrying out various agricultural operations according to the year conceived by Sultan Shams-ud-Din.
1.18 During Sikl;l rule, the Bikrami year was again introduced but it did not gain currency in the rural areas.
Capitals of Ancient KashlDir • 1.19 Mr. Stein has observed (see page 439
Commentary of Kalhan's Rajtarangni Volume II) that the history of Kashmir has always been reflected as it were in that of its capital which has not changed its site for more than 13 centuries. Hiuen-Tsiang, who visited the capital in about 631 A. D. found it already in the position where the present city of Srinagar is situated. He has referred to it as the new city to distinguish it from the old capital which was situated at Pandrethan. a village about 2 miles to the south-east of Srinagar. According to Kalhana, Pandrethan which was then known as Puranadhisthana or Srinagari. was- founded by Ashoka the Great. The name Srinagari. which means the city of Sri or Lakshmi, appears to have been assigned to the capital to commemorate the Buddhist monastery _said to have been built by Ashoka between Pandrethan and the nearby steep hill side.
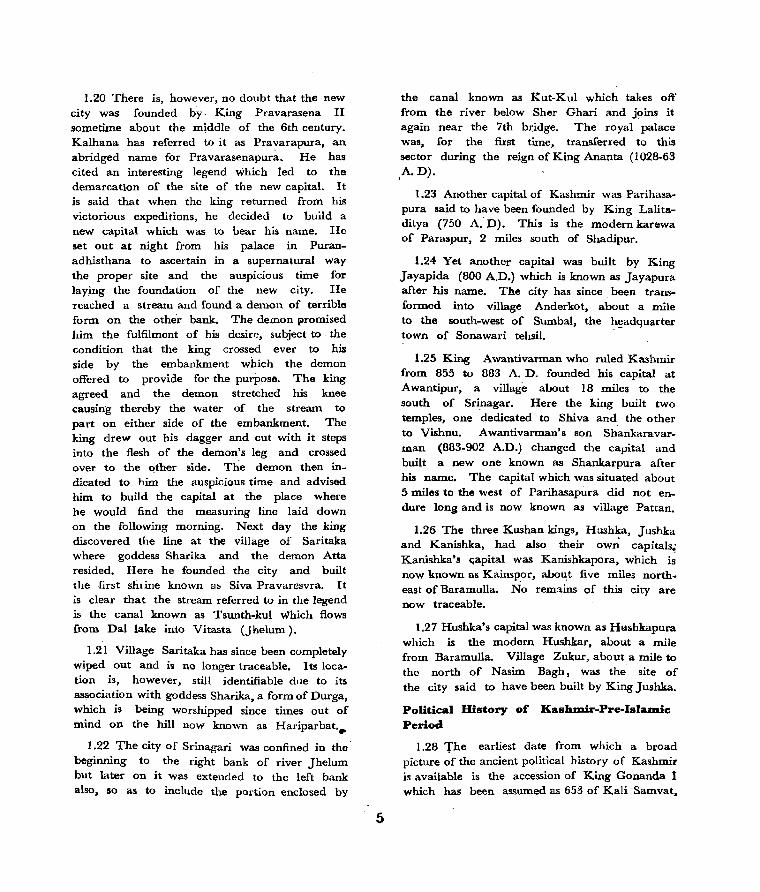
1.20 There is, however, no doubt that the new city was founded by. King Pravarasena II sometime about the middle of the 6th century. Kalhana has referred to it as Pravarapura, an abridged name for Pravarasenapur~. He has cited an interesting legend which led to the demarcation of the site of the new capital. It is said that when the king returned from his victorious expeditions, he decided to build a new capital which was to bear his name. He set out at night from his palace in Pucanadhisthana to ascertain in a supernatural way the proper site and the auspICIOUS time for laying the foundation of the new city. He reached a stream and found a demon of terrible form on the other bank. The demon promised him the fulfilment of his desire, subject to the condition that the king crossed ever to his side by the embankment which the demon offered to provide for the purpose. The king agreed and the demon stretched his knee causing thereby the water of the stream to part on either side of the embankment. The king drew out his dagger and cut with it steps into the flesh of the demon's leg and crossed over to the other side. The demon then indicated to him the auspicious time and advised him to build the capital at the place where he would find the measuring line laid down on the following morning. Next day the king discovered the line at the village of Saritaka where goddess Sharika and the demon Atta resided. Here he founded the city and built the first shrine known as Siva Pravaresvra. It is clear that the stream referred to in the legend is the canal known as Tsunth-kul which flows from Dal lake into Vitasta (Jhelum).
1.21 Village Saritaka has since been completely wiped out and is no longer traceable. Its location is, however, still identifiable due to its association with goddess Sharika, a form of Durga, which is being worshipped since times out of mind on the hill now known as Hariparbat .•
1.22 The city of Srinagari was confined in the· beginning to the right bank of river Jhelum but later on it was extended to the left bank also, so as to include the pOl:tion enclosed by
5
the canal known as Kut-Kul which takes off from the river below Sher Ghari and joins it again near the 7th bridge. The royal palace was, for the first time, transferred to this sector during the reign of King Ananta (1028-63 ,A. D).
1.23 Another capital of Kashmir was Parihasapura said to have been founded by King Lalitaditya (750 A. D). This is the modern karewa of Paraspur, 2 miles south of Shadipur.
1.24 Yet another capital was built by King Jayapida (800 A.D.) which is known as Jayapura after his name. The city has since been transformed into village A nderkot, about a mile to the south-west of Sumbal, the h~adquarter
town of Sonawari tehsil.
1.25 King Awantivarman who ruled Kashmir from 855 to 883 A. D. founded his capital at Awantipur, a village about 18 miles to the south of Srinagar. Here the king built two temples, one dedicated to Shiva and the other to Vishnu. Awantivarman's son Shankaravarman (883-902 A.D.) changed the capital and built a new one known as Shankarpura after his name. The capital which was situated about 5 miles to the west of Parihasapura did not endure long and is now known as village Pattan.
1.26 The three Kushan kings, Hushka, Jushka and Kanishka, had also their ow~ capitals~ Kanishka's <;apital was Kanishkapora, which is now known as Kainspor, about five miles northeast of Baramulla. No remains of this city are now traceable.
1.27 Hushka's capital was known as Hl:lshkapura which is the modern Hushkar, about a mile from Baramulla. Village Zukur, about a mile to the north of Nasim Bagh, was the site of the city said to have been built by King Jushka.
Political mstory of Kashm.ir-Pre-lslaDlie Period
1.28 The earliest date from which a broad picture of the ancient political history of Kashmir is available is the accession of King Gonanda I which has been assumed as 653 of Kali Samvat.
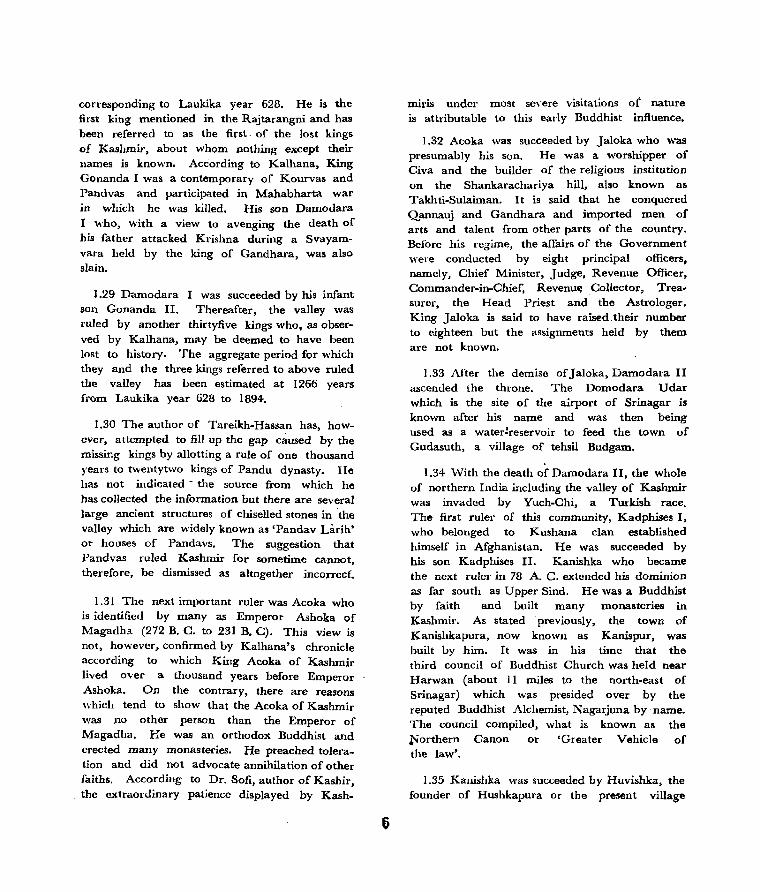
corresponding to Laukika year 628. He is the first king mentioned in the Rajtarangni and has been referred to as the first. of the lost kings of Kashmir, about whom nothing except their names is known. According to Kalhana, King Gonanda I was a contemporary of Kourvas and Pandvas and participated in Mahabharta war in which he was killed. His son Damodara I who, with a view to avenging the death of his father attacked Kl'ishna during a Svayamvara held by the king of Gandhara, was also slain.
J .29 Damodara I was succeeded by his infant son Gonanda II. Thereafter, the valley was ruled by another thirtyfive kings who, as observed by Kalhana, may be deemed to have been lost to history. The aggregate period for which they and the three kings referred to above ruled the valley has Leen estimated at 1266 years from Laukika year 628 to 1894.
1.30 The author of Tareikh-Has~an has, however, attempted to fill up the gap caused by the missing kings by allotting a rUle of one thousand yeal-s to twentytwo kings of Pandu dynasty. He has not indicated - the source from which he has collected the information but there are several large ancient structures of chiselled stones in ·the valley which are widely known as 'Pandav Lilrih' or houses of Pandavs. The suggestion that Pandvas ruled Kashmir for sometime cannot, therefore, be dismissed as altogether incorrect.
1.31 The next important ruler was Acoka who is identified by many as Emperor Ashoka of Magadh.'I. (272 B. C. to 231 B. C). This view is not, however, confirmed by Kalhana's chronicle according to which King Acoka of Kashmir lived over a thousand years befOl·e Emperor Ashoka. On the contrary, there are reasons which tend to show that the Acoka of Kashmir was 110 other person than the Emperor of Magadha. He was an orthodox Buddhist and erected many monasteries. He preached toleration and did not advocate annihilation of other faiths. Accordillg to Dr. Sofi, author of Kashir, the extraOl-dinary patience displayed by Kash-
mu'lS under most se,-ere visitations of nature is attributable to this early Buddhist influence.
1.32 Acoka was succeeded by Jaloka who was presumably his son. He was a worshipper of Civa and the builder of the religious institution on the Shankarachariya hill, also known as Takhti-Sulaiman. It is said that he conquered Qannauj and Gandhara and imported men of arts and talent from other parts of the country. Belore his regime, the affairs of the Government ",-ere conducted by eight principal officers, namely, Chief Minister, Judge, Revenue Officer, Commander-in-Chief, Revenue Collector, Trea~
surer, the Head Priest and the Astrologer. King Jaloka is said to have raised.their number to eighteen but the assignments held by them are not known.
1.33 After the demise ofJaloka, Damodara II ascended the throne. The Domodara Udar which is the site of the airport of Srinagar is known after his name and was then being used as a water!reservoir to feed the town of Gudasuth, a village of tehsil Budgam.
1.34 \Vith the death of Damodara II, the whole of northern India i"lcluding the valley of Kashmir was invaded by Yuch-Chi, a Turkish race. The first ruler of this community, Kadphises I, who belonged to Kushana clan established himself in Afghanistan. He was succeeded by his son Kadphises II. Kanishka who became the next ruler in 78 A. C. extended his dominion as far south as Upper Sind. He was a Buddhist by faith and built many monasteries in Kashmir. As stated previously, the town of Kanishkapura, now known as Kanispur, was built by him. It was in his time that the third council of Buddhist Church was held near Harwan (about II miles to the north-east of Srinagar) which waS presided over by the reputed Buddhist Alchemist, Nagarjuna by name. The council compiled, what is known as the ~orthern Canon or 'Greater Vehicle of the law'.
1.35 Kanishka was succeeded by Huvishka, the founder of Hushkapura or the present village
Ushkara of Baramulla tehsil. It is said that he. ruled the valley from 123 A. C. to 140 A. C.
1.36 The next king Jushka, presumably the son of Huvishka, came to the throne in 140 A. C. and ruled till 178 A. C. With his death, the rule of Kushana dynasty came to an end.
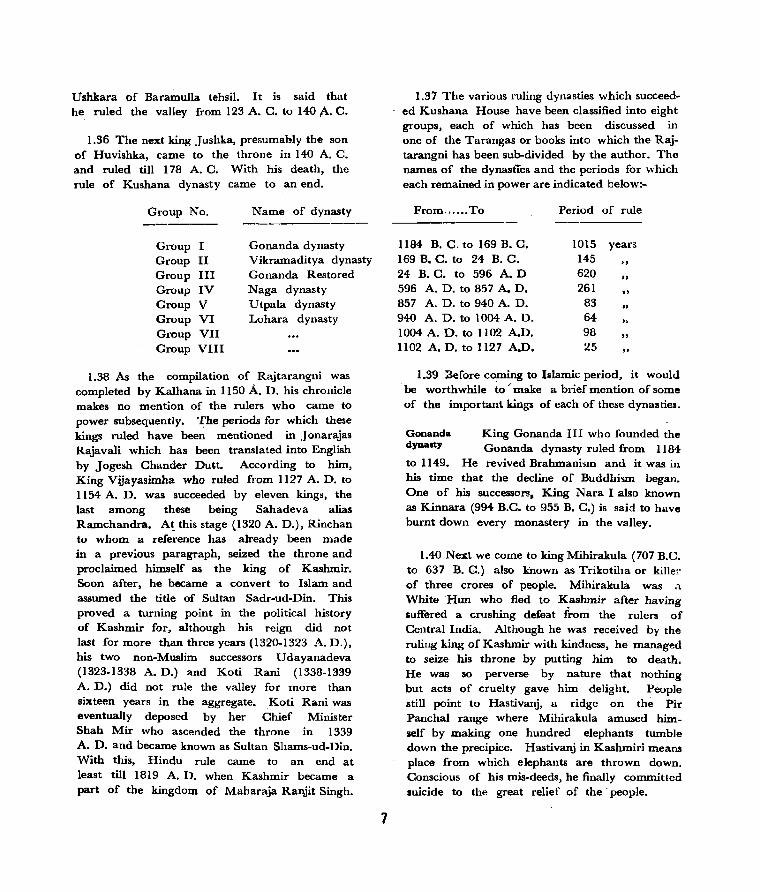
Group No.
Group I Group II Group III Group IV Group V Group VI Group VII Group VIII
Name of dynasty
Gonanda dynasty Vikramaditya dynasty Gonanda Restored Naga dynasty Utpala dynasty Lohara dynasty
1.38 As the compilation of Rajtarangni was completed by Kalhana in 1150 A. D. his chl"Onicle makes no mention of the rulers who came to power subsequently. The periods for which these kings ruled have been mentioned in J onarajas Rajavaii which has been translated into English by Jogesh Chander Dutt. According to him, King Vijayasimha who ruled from 1127 A. D. to 1154 A. D. was succeeded by eleven kings, the last among these being Sahadeva alias Ramchandra. A~ this stage (1320 A. D.), Rinchan to whom a reference has already been made in a previous paragraph, seized the throne and proclaimed himself as the king of Kashmir. Soon after, he became a convert to Islam and assumed the title of Sultan Sadr-ud-Din. This proved a turning point in the political history of Kashmir for. although his reign did not last for more than three years (1320-1323 A. D.), his two non-Muslim successors Udayanadeva (1323.1338 A. D.) and Koti Rani (1338-1339 A. D.) did not rule the valley for more than sixteen years in the aggregate. Koti Rani was eventually deposed by her Chief Minister Shah Mir who ascended the throne in 1339 A. D. and became known as Sultan Shams-ud-Din. With this, Hindu rule came to an end at least till 1819 A. D. when Kashmir became a part of the kingdom of Maharaja Ranjit Singh.
7
1.37 The various ruling dynasties which succeeded Kushana House have been classified into eight groups, each of which has been discussed in one of the Tarangas or books into which the Rajtarangni has been sub-divided by the author. The names of the dynasties and the periods for which each remained in power are indicated below:-
From ...... To Period of rule
1184 B. C. to 169 B. C. 1015 years 169 B. C. to 24 B. C. 145
" 24 B. C. to 596 A. D 620 " 596 A. D. to 857 A. D. 261 .,
857 A. D. to 940 A. D. 83 .. 940 A. D. to 1004 A. D. 64 .. 1004 A. D. to 1102 A.D. 98 .. 1102 A. D. to 1127 A.D. 25 ..
1.39 :3efore coming to Islamic period, it would 'be worthwhile io / make a brief mention of some of the important kings of each of these dynasties.
Gonanda dynasty
King Gonanda III who founded the Gonanda dynasty ruled from 1184
to 1149. He revived Brahmanism and it was ill his time that the decline of Buddhism began. One of his successors. King N ara I also known as Kinnara (994 B.C. to 955 B. C.) is said to have burnt down every monastery in the valley.
1.40 Next we come to king Mihirakula (707 B.C. to 637 B. C.) also known as Trikotiha or kille~'
of three crores of people. Mihirakula was a White Hun who fled to Kashmir after having suffered a crushing defeat from the rulers of Central India. Although he was received by the ruling king of Kashmir with kindness, he managed to seize his throne by putting him to death. He was so perverse by nature that nothing but acts of cruelty gave him delight. People still point to Hastivanj, a ridge on the Pir Panchal range where Mihirakula amused himself by making one hundred elephants tumble down the precipice. Hastivanj in Kashmiri means place from which elephants are thrown down. Conscious of his mis-deeds, he finally c()mmitted suicide to the great relief of the' people.
1.41 It was duriug the regime of Huns that the l'eputed poet Kalidasfl was born in Kashmir. According to Kalhana, Kalidasa left the State due to the repression of Huns and settled in Ujjain. It may be remarked here that the contention that Kalidasa was a Kashmiri by birth is disputed by some writers though there is ample circumstantial evidence to substantiate the claim that he was a Kashmiri.
1.42 Vikntnaditya Yudishthira I, the last king of dyna.ty Gonanda dynasty, was dethroned
by his O'wn people and replaced by Vikramaditya Harsha of Ujjain. The Vikramaditya family ruled for 192 years in all.
1,43 White King Pravanlsena I alias Tunjina Huns dynasty II ruled for thirty years from
88 B. C. to 58 B. C. He is the founder of Srinagar city, then known as Pravarapllra and is also credited for havillg founded Pandrethan, a village in the south-east of Srinagar city. It was in his time, as stated by Kalhana, that the Great Bridge consisting of boats was built.
J.44 The Hun rule ended with the death of King Baladitya who left 'no male issue.
1.45 Na"a dynasty - Baladitya was succeeded by
his son-in-law Durlabhavardhana (627 A. D. to 663 A. D.) who is said to have been the son of a Naga. During Iris time, the famous Chinese traveller and writer, Hiuen. Tsiang, visited Kashmir where he stayed for two years from 631 A. D. to 633 A. D. Hiuen-Tsiang has left behind an accurate description of Kashmir and its people who are said to have been handsome in app~arance but of a frivolous and weak disposition. According to him, the people were not religious minded. He has, however, added that Kashmir was a peaceful country and that the adjacent territories of Rajouri, Poonch, Bhimber etc. formed part of it.
1.46 Durlabhavardhana was succeeded by his son Pratapaditya II, who ruled for fifty years from 663 A. D. to 713 A. D. He was followed one after another .by his three sons, Chandrapida, Tarapida and Lalitaditya Mukta.pida. There is nothing worthwhile reporting
about the first two who ruled in aggregate for about 13 years from 713 A. D. to 725 A. D. The name of Lalitaditya, who l'uled Kashmir for 28 years (725-753 A. D.) is, however, held in very high esteem to this day by every Kashmiri. Historians are unanimous that he ranks among the few monarchs of Kashmir who introduced numerous measures to bring happiness and prosperity to their people. He was at once a . great conqueror, a man of letters, an able administrator and a person of religious disposition. The record of his achievements has earned for him a conspicuous position ill the history of Kashmir.
1.47 The glorious rule of Lalitaditya is also borne out by the ruins of the famous Martand temple, about 5 miles from the town of Islamabad in Anantnag district. The temple measuring 63 feet in length is enclosed by a quadrangle 220 feet long and 142 feet wide. According to Vigne, the kind of architectural r~lic presented by the temple is one of the noblest to be seen in any country.
1.4-8 Lalitadhya also founded the city of Parihasaptira which is situated at a distance of about 14 miles from Srinagar. Under his orders, vast areas were reclaimed and extensive drainage works executed. He raised the number of court officers from eighteen to twenty three, the additional five consisting of Foreign Minister, Treasury Officer, Custodian of Stables, Executive Officer and the Chamberlain.
1.49 The next important king is Jayapida (751-782 A.C.) who was a grand-son of Lalitaditya. Like his grandfather, he also . defeated the king of Qannauj. Jayapida is reputed for his pat .. ronage of men of letters who flocked in large numbers in his court. He also founded the town of J ayapur Anderkot, now a village In tehsil Sonawari of Baramulla district.
1.50 Utpala dynasty King Avantivarman, the
founder of U,tpala dynasty (855-883 A.D), is by and large the most distinguished ruler of pre-Islamic period. Amo~g .his remarkable achievements,
· mention may be made of the various measures he took to guard against the repeated recurrence ·of famines caused by heavy floods. He ordered for an extensive survey being conducted to ascertain the causes which accounted for the frequent submerging of the valley by floods. As a result, one of his engineers, Suyya by name, succeeded in solving what appeared to be a complex problem and reported that the passage of river Jhelum had been blocked by boulders and silt in the gorge at 'Baramulla beyond which water could not flow. With the removal of the boulders and the silt, water at once rushed downwards and wi~hin days huge areas of land became available for cultivation. Suyya did not stop there. He aIm executed several irrigational and drainage schemes which improved the yield rates and enormously increased the produce.
1.51 The town of Sopore also owell its existence to. Suyya. I t was founded by him near the sO)lth-westem bank of Wular lake at the place where river Jhelum leaves the lake to resume its journey to the sea.
1.52 Other achievements of king Avantivarman include the village of Avantipura which was founded by. him. Here he built the temple devoted to Civa which is known as Avanticvara. ACcol'ding to Kalhana, the Brahmarucal architecture in Kashmir is represented by Lalitaditya and Avantivarman. The former is said to have conceived the style and the latter is credited for having given it a refined form subsequently.
1.53 Among the remarkable literary persons of the court of Avantivarman, Civasvamin deserves special mention. He is the author of seven }l1ahakavyas, a number of dramas and other works written in prose of which very little is now available. Other. scholars whom AvantivarmC!-n patronised were Ratnakara, author of Haravijaya and Anandavardhana, author of Dhvanyolaka and Kallata.
1.54 Lohara dynasty
We now come to queen Didda, wife of king Kshemagupta (950
to 958 A. D) who ruled for twentythree years
9
from 980 to 1003 A. D. She was a wom1.n of forceful character and crushed all aspirants to the throne who were either executed or exterminated. Didda was succeeded in 1004 A. D. by Samgramaraja, the founder of Lohara dynasty. During his time, Mahmood Gaznavi invaded Kashmir and defeated the Kashmiri army. l\fahmood could not, however, reach Srinagar because of inclement weather and had to return home.
1.55 Samgramaraja was followed by Hariraja who ruled for twenty two . years. The latter was succeeded by Ananta (1028-1063 A. D) who not only suppressed the revolt of feudal lords but also defeated the army of Raja of Chamba. His expedition to Hazara, however, failed and on the advice of his wife, Suryamati, a pious and vigorous queen, Ananta abdicated in favour 'of his son Kalaca (1063 to 1089 A. D).
1.56 -It is important to refer llere in brief to some of the literary persons of the time of Kalaca whose works have earned wiae reputation. These include Ahhivagupta, the well known Caiva philosopher. He was born in a Brahman family in Qannauj which migrated to Kashmir during the reign of Lalitaditya. Abhivagupta has written extensively on philosophy and rhe-' toric. According to Dr. Kanti Chandra Pandey, Abhivagupta entered the cave at Beru (a village of tehsil Budgam) and was never seen again.
1.57 Another eminent writer of this age is Kshemendra who was born in the close vicinity of Nishat Bagh in Srinagar during the reign of ·King Ananta. He was a scholar in Hindu law, Sanskrit grammar, politics and music. ~is books Darpadalena (Pride has a fall) and Desha Upadsha (introduction of Kashmir to foreign students) are widely known. It is said that of the many books he wrote, thirtyfour ha"e been printed by the Nirnayasagara Press at Bombay.
1.58 Bilhana, a great poet and a contemporary of Kalhana, was an equally important person. It is said that due to the cold treatment accorded to him by King Kalaca. he migratedto Mathura

whence he proceeded to Kashi where he became known as a gl'eat authority on Sanskrit grammar. From Kashi, he went to Kalyana in the Deccan where he cultivated intimate 'relations with the Raja's daughter to whom he was engaged as a tutor. The Raja gave consent to the marriage and after his death was succeeded by Bilhana.
1.59 The most important work of Bilhana is
Vikramankadeva-Charita.
1.60 Resuming the account of Lohara dynasty, we come to King Harsha (1089 to 1101 A. D.) who ascended the throne by deposing Kalaca. He is said to have been a well_built man, courageous and great patron of art and science. He, however, combined in himself good qualities and vices. He was cruel and kind-hearted, greedy and liberal, cunning and unimaginative. He indulged in extravagance and was fond of dress and ornaments. In order to provide himself with enough money to defray his expenses, ,he went to the extent of robbing the treasures of temples and even confiscating the cult images. In his time, Kashmir was visited by several naty-ral _calamities, such as, plague, famine, etc. His nephew Ucchalli and Sussala eventually rose in revolt against him, burnt his palace and assassinated his whole family including the heir-apparent. The king himself was slain in 1I01 A. D. and his body was cremated by a wood-dealer.
1.61 Second Lohara Ucchala who succeeded dynaaty Hanha ruled for ten years
only from llOI to 1111 A. D. He launched a campaign to suppress the feudal lords in which he succeeded in the first instance, but was eventually killed himself also.
Kalhaua and Others
1.62 Before concluding the account of Hindu rule, it will be appropriate to make a brief mention of Kalhana and his other literary contemporaries. Among 'these, mention may be made of Mammata and his two brothers, Jaiyata and Uvvata, all of whom are reputed for their :scholarship. Mammata was the author of Kavy-
10
aprakaca, a work on prosody. NwIierous commen.ries have been written on this book by various critics and at least twentyfive of these are still available.
1.63 Another important writer of this age was Mankha. Raja Sussala (1112 to 1128 A. D.) regarded him, as a philosopher and appointed him as his Foreign Minister. Important among his works is the book Crikanthacharita written in 1039 A. D. and consisting of 2500 couplets.
1.64 Kalhana was the' son of Chanpaka, a Minister of King Harsha (1079.1101 A. D.). He was both a poet and a historian but invariably combined facts with fiction, a normal feature of mediaeval historians. He was a Brahman by caste, a worshipper of Civa and an admirer of Budha.
MusliDJ. Period
1.65 It has already been indicated in a preceding paragraph that with the occupation of tBe throne of Kashmir by Rinchan and his subsequent conversion to Islam along with a number of his courtiers, Hindu rule came to
an end foc a period of at least 500 years. Rinchan was originally the King of Western Tibet or Ladakh and had migrated to Kashmir due to political dissension. Kashmir' was then being ruled by Raja Ramchandra alias Sahadeva (1301-1320 A. D.). During his regime, drunkards and gamblers flourished and the valley was invaded by Dulcha (Zulchu), a nephew of Halaku Khan, son of Changez Khan. He was accompanied by an army of 70,000 cavaliers and afteF carrying out mass killings on his way from Turkistan to Kashmir, he took over the valley without any resistance. Ramchalldra fled to Kishtwar and Dulcha and his army looted the people and set fire to the entire city. He could not, however, stay here for more than eight months due to the non-availability of provisions and accordingly left the valley in early winter along with about 50,000 Kashmiri prisoners consisting of men, women and children. He was, however, overtaken by heavy snow while crossing Devasar mountain and both he and his army· including the prisoners were completely wiped out. Ram-

chandra returned from Kishtwar but was soon after slain by Rinchan in 1320 A.D.
'1.66 The period of rule of Rinchan lasted for three years only. He was succeeded by Simhadeva (1323-1338 A.D.), brother o( Ramchandra. On his death, his queen Kota Rani (1338-1339 A.D.) came to the throne but she was not destined to rule for more than five months.
1.67 This brings us to Shah Mir alias Sultan Shams-ud-Din who stabilised the Muslim rule in Kashmir and founded the Shaluniri dynasty. Shah Mir who was an immigrant and whose origin is obscure tried to heal the wounds inflicted by Dulcha's invasion and introduced a number of reforms to ameliorate the economic condition of the people. He abolished many taxes and repealed laws of repressive nature. With a view to controlling the feudal chiefs, he patronised two families, namely, Magres and Chaks, the former of an indigenous origin and the latter an immigrant household from Dardistan in Ladakh. He eventually died in 1342 A.D. and was succeeded by Jamshed, his eldest son. Jamshed was a good ruler and endeavoured to promote the welfare of the people. He built a bridge over river Jhelum in Sopore and several inns at various places for the use of travellers. While away from Srinagar in connection with an expedition in Kamraj (Baramulla district), his younger brother Ali Sher occupied the throne under the title Sultan Ala-ud-Din (1343-1354 A. D.) and proclaimed himself as the king of Kashmir in 1343 A. D. Jamshed fled and died after about two years.
1.68 Like his brother and father, Ala-ud-Din also concentrated his attention on consolidation work. He brought back the' peasants who had fled due to Dulcha's invasion. He made Ander_ kot (Sonaw-ari tehsil) his capital and founded Ala-ud-Din Pura, now a mohalla of Srinagar city. He promulgated a law by which a childless widow was deprived of her share in her husband's property if there was evidence available to show that she had been leading an immoral life.
11
1.69 Ala-ud-Din was s~cceeded by his son Shahab-ud-Din who ruled from 1354 to 1373 A. D. The latter subdued the surviving feudal chiefs and conquered Multan, Kabul, Gazni, Qandhar, Gilgit, Baltistan, Ladakh, Kishtwar. Jammu and Kangra. He then proceeded to conquer Delhi but before any conflict could take place, a truce was made by which the entire territory from Sirhind to Ka~lunir was recognised as the dominion of Shahab-ud-Din while the area lying to the east was to be retained by Feroz Shah Tughlaq, the ruler of Delhi.
1.70 Shahab-ud-Din was a gallant soldier, an efficient administrator and a great patron of .learned men. Except for the introduction of Begar system (employing labour without payment of wages) by which Hanjis (boatmen) were required to serve the king for severi days in a month. he combined in himself all the good qualities of a custodian of the people. Like his father, he also built a town known as Shahab-ud-Din Pura which now constitutes a mohalla of Srinagar city. During his time, the valley was engulfed in a serious flood which caused heavy loss of life and property. He, therefore. founded a new town at a higher elevation on the slopes of Hari Parbat mountain and named it as Laksminagar, after his queen Laksmi. His prominent courtiers, includeu, among others, V dayasari and Kotabhatta who both enjoyed his great confidence.
1.71 Shahab-ud·Din was succeeded by his younger brother Sultan Qutb-ud-Din (1373-89 h.D.). an efficient administrator,and a patron of learning. He founded the town of Qutb-ud-Din Pora, now a mohalla of Srinagar city.
1.72 The Illost important event connected with the regime of Sultan' Qp.tb-ud-Din was the arrival in Kashmir of Mir Sayyid Ali Hamdani, a great scholar, writer, mystic, poet and tourist. It is said that he went round the whole world three time& conversions Kashmir in
and succeeded in making mass at different places. He visited 1372, 1379 and 1383 A. D. All
these visits had a far reaching and abiding effect
on the social and economic structure of Kashmir which completely changed its complexion as a result of his efforts to ext.ricate the people from the abyss of distress and ignorance. While applauding him for his work in Kashmir, the late Dr. Iqbal observed that Sayyid Ali, also known as Shah Hamdan, endowed the valley gifts of education, industry, culture and religion.
1. 73 Sayyid Ali had perhaps his most stupendous success in Kashmir in converting people to Islam. It is said that as a result of his preachings, about 21 maunds of the sacred thread were consigned to fire in one day only. He presented his cap to Sultan Qutb-udDin who always wore it under his crown. The practice was followed by his successors also until the time of Sultan Fateh Shah, who carried it to his gl"aVe along with him. While
,I'eturning from Kashmir, Sayyid Ali passed away.at Pakhli in January 1385 whence his corpse, was removed to Khatlan, a village in J?:Iodern Tajkista!l.
1.74 Sayyid Ali is said to have been the author of more than 100 books on political, science, logic, ethics, mysticism and philosophy. Among these, . the most important is a pamphlet in Arabic on the unity of God and his omnipotence and known as Avradi-Fathiyya. It has been committed by most of the Kashmiri Muslims to memory and i~ recited in all mosques every day after mor'ning prayers.
1.75 Sultan Qutb-ud-Din was succeeded by his eldest son Sultan Sikandar who ruled from 13&9 to 1413 A. D. As Sikandar was a minor at the time of the death of Sultan Qutb-ud-Din, his mother queen Sura' acted as a Regent. She was a woman of strong character and ruled with a firm hand.
1.76 Sikandar was an orthodox Muslim and abstained not only from drinking but also from listening to music. He was a brave ruler and took considerable pains for the welfare of his subjects. He established schools, founded hospitals and distributed, food, free of cost, in faminestricken areas. He was a patron of learned
12
men and tr~ilted' them with respect. Among the talented personalities who were attracted to his court, were Baba Haji Adham and his disciple Baba Hassan, a famous logician. The most important immigrant who visited the State during his regime was l\·lir Sayyid Mohammed Hamdani, son of Shah Hamdan. He arrived in Kashmir in 1393 A. D. at the age of 22 along with 300 Sayyids, all men of talents. Like his father, he was an author of a number of books and a lVIuslim missionary. The most important man converted by him to Islam was Suhabhatta, the Chief Minister of Sik<lndar who was renamed Saif-ud-Din. Sayyid Mohammed Hamdani stayed in Kashmir for about 12 years and died in 1450 A. D. in Khatan.
1.77 Sikandar is known, as a great builder, a claim to which the Jamia Musjid at .Srinagar, which was founded and built by him,. bears te5timony to this day. The mosque has 372 wooden columns, each 14 yards in height and 6 yards in circumference. He also founded the town of Sikandarpora, now one of the mohallas of Srinagar city. The ld- Gah of Srinagar was also built by him but was completed by his son Sultan Ali Shah. In addition, he built many other mosques at various places including lHjbehara, Tral, Sopore etc; but the most important among these is the mosque known as Khanqah l\.faulla, on the right bank of river Jhelum in Sri nagar city. It was here that ~hah Hamdan had built a small platform on which he ~ffered his prayers five times a day.
1.78 Sikandar is notorious as an iconoclast. It is, however, doubtful whether he is exclusively responsible for pulling. down the temples and breaking the images as some of the historians are of the view that these atrocities were committed due to the religious fanaticism of Saif-ud-Din who was a new convert to Islam.
1.79 Sikandar was succeeded by his eldest son, Mir Khan, who assumed the title of Ali Shah and ruled the valley from 1413 to H2O A.D. Ali Shah was of a religious bent of mind but weak and fickle minded. Like
his father, he allowed him5elf to be dominated by his Chief Minister, Saif-ud-Din.
1.80 Ali Shah was succeeded by his younger brother Shahi Khan who styled himself as Zainul-Abidin and was more popularly known as Badshah. It is unanimously held by· all the historians that Badshah has been the most iIlustl'ious ruler . of Kashmir and that none of his predecessors or successors possessed the numerous good qualities which Badshah combined in himself. He was essentially a man of secular outlook and patronised all faiths and religions alike. He made Kashmir the centre of a great culture and worked hard to promote learning and to build up the economy of the people.
l.81 Badshah was not anxious for the expansion of his dominion. but was equally reluctant to part with the territories which belonged to Kashmir and were of a strategic importance. The Chiefs of Ladakh and Baltistan who had acknowledged their allegiance to Shahab-ud-Din and Sikandar had, however, declared themselves independent during the weak rule of Ali Shah. He, therefore, set out with his army and made aBumlde IV, Raja of Ladakh, to recognise his sovereignty. The ruler of Baltistan also followed suit and surrendered. He next captured the town of Kulu which was till then in the possession of" Ladakhis. After these achievements, Badshah proceeded to subdue the ruler of Ohind who had also declared himself independent .during the reign of Ali Shah. As before, the ruler of Ohind was defeated and agreed to acknowledge the sovereignty of the king of Kashmir.
1.82 Badshah also exchanged embassies with various foreign countries. In particular, he deputed his envoys to Khurasan, Egypt, Mecca, Sind, Bengal, etc. His relations with Mirza Shah Rukh, son of Timur, were most cordial.
1.83 There were two major natural calamities during the reign of Badshah, one in i460 A.D. and the other i'l. 1461 A.D. The former appeared in the form of a severe famine which destroyed the entire rice crop. Many people had to be content on roots and leave; while thousands
13
died of starvation. The price of rice registered an increase of 500% and people had to pawn their belongings to obtain rice. Badshah distributed free rations from his stores and also issued instructions for the debts raised. by the needy being written back and jewellery and other articles mortgaged being returned to the owners. The other tragic incident took the form of an unprecedented flood. Most parts of the valley were submerged under water resulting in the death of thousands of human beings and animals. The rice crop was not, however, affected and the recurrence of a second famine was thus averted. This time Badshah built the town of Zainatilak on the high banks of river Jhelum where people could migrate to save their lives during floods.
1.84 Badshah had three sons, Adham, Haji and Bahram and was dissatisfied with all the three. In his opinion, Adham was a miser and was surrounded by unscrupulous advisers. Haji, he thought, was a great drunkard. Bahram had no respect for laws and regulations nor for cocial customs. He did not, therefore, designate any of them as his successor and died on 12th May._ 1470 at the age of 69 years. He was, however, succeeded by Haji who happened to be by his bedside at the time of his death.
1.85 Badshah was of medium stature, handsome and had flowing beard. He did not possess the physical strength of Shahab-ud-Din nor he distinguished himself as a soldier. He had a mild temperament and got angry very rarely, if ever. Though an orthodox Muslim and regular in his prayers and observing fasts during Ramzan, he meted out equitable treatment to all non-Muslims. He re-called those Hindus who had fled to Kishtwar, Jammu and other places during the regime of Sikandar. He went a step further and permitted such of the Brahmans who had embraced Islam under pressure to revert to their original faith. He baBned cow-slaughter and removed the prohibition on the performance of sati. He got the temples re-built and repaired and even contributed handsomely for their construction. He reduced jizya to nominal rate which also was not in actual effect at all collected~

The tax levied from Hindus for cremating their dead at the confluence of Nalla Mar and riveT Jhelum was withdrawn under his orders.
1.86 Badshah took considerable pains to pro· mote the welfare of his people. He used to roam about in his capital in disguise to ascertain whether his officers were not taking bribes or harassing the people. _ He got his code of laws inscribed on copper plate~ which were exhibited .at prominent places in the rural and urban areas for the information of the people. Likewise, the prices of essential commodities were also inscribed on copper plates so that there may be no occasion for black-marketing.
1.87 In judicial matters, Badshah would not spare anyone guilty of having committed a crime, no matter however great or influential he may be. His two foster brothers, Sher and ]\1asud, quarreled with each other resulting in the death of Masud. Badshah ordered the execution of Sher. Another favourite of the Sultan, Mil' Shah by name, killed his wife and was put to death.
1.88 The people of Kashmir will not forget the work done by Badshah in the fields of agriculture, education, arts and crafts, - architecture, music etc. The famous floating islands of Dal Lake were introduced by him for the first time. Following are a few of the important clUlaIs which he constructed to improve the agricultural production :-
1. Lachman-kul, which carried the water of river Sind to irrigate the al·eas in and around Kowshehra.
2. Kakapora canal.
3. Chakdar canal originating from Nandmarg.
4. Karala canal between Shupiyan and Romuh.
5. Awantipora canal.
6. Shah Kul or Safapora canal.
7. Lal Kul or Pohur canal which was built to irrigate Zainagir at'ea.
8. Martand canal.
9. Kalla Mar. This was built by diverting the
14
water of Dal Lake which previously flowed into river Jhelum.
1.89 .AJ> a result of these works and the re· clamation of vast areas, Kashmir became selfsufficient in food. According to MoorcJ;oft, Kash· mil' prodllced as much as 5.50 lakh tons of rice per year during the time of Badshah.
1.90 Among the men of letters who migrated from distant countries and crlilwded in his court, mention may be made of Sayyid Mohammed Rumi, Sayyid Mohammed Luristani, Qazi Jamal, Sayyid Mohammed Sistani and l\.:laulana Kahlr. MuUa Ahmed was his court poet and both he and another poet MuUa Nadiri wrote histories of Kashmir. Jonaraja and Srivara, well knoWI} historians in Sanskrit, were also .the courtiers of Badshah. Yodhabatta, a great Vedic scholar, had committed the whole of Shah-nama of Firdousi to memory. His work Jainaprakasa on music gave an account of the reign of Badshah. Notthosoma Pandit, a poet, wrote the book Jainacarita. describing the life of Zain-ul·Abidin. It was in his time- that the book Kifayai-Mujahidiaayah was written on medicine by one of his courtiers Mansur Bin Mohammed;
1.91 Badshah also got Persian books translated into Sansklit and vice versa. MuUa' Ahmed who was a great scholar in -Persian and Sanskrit translated the Mahabharta and Rajtarangni into Persian. Srivara translated the Persian romance Yu~uf-Zulaikha into Sanskrit and named it as Katha-Kautuka.
1.92 Badshah set up a number of schools at various places in Kashmir. Of these, mention may be made in particular of the . schools at Nowshehra,· Seer (Anantnag tehsil) and Drugjan. He also contributed handsomely to the large educational institution at Sialkot. Badshah also got a number of hostels built where students were provided with board and lodging free of cost.
1.93 Badshah was himself a scholar and a poet and knew Sanskrit, Persian and Tibetan languages besides Kashmiri which was his own mothertongue. Pandits read out to him from Sastras and recited Vasistha Brahrila Darsana of Val-
moo. He himself" wrote two hooks in Persian, one on the production of fire works and the other named Shikayat in which he dealt on the vanity of world.
1.94 His most important contribution which is remembered to this day by every Kashmiri is the introduction of a number of arts and crafts. . Badshah deputed delegations to various countries to. learn different arts and crafts who. on their return, imparted necessary training to the local inhabitants. First of all, he detailed two persons on Government expenses to Samarqand where they learnt paper making and book binding. The weaving of silk cloth which was unknown before the time of Badshah, was also introduced by him with the help of foreign experts. It was in his time that Kashmir became widely known for the production of shawls. Other arts which were established during his time including papier mache, wood carving and carpet manufacture. He himself invented the device for the production of powder for fire works which was being imported till then from outside.
1.95 Badshah was also a great patron of music. Yudhabatta was a well known musician and entertained the Sultan almost every evening. Mulla U di, another reputed musician from Khurasan, was also one of his courtiers. 'At his request, Mulla Zada, an expert in playing on the lute made of tortoise shell. came from Khurasan and settled in Kashmir.
1.96 As an architect, none of the successors of Zain-ul-Abidin can be equated with him. His magnificient edifice which he constructed of wood in his capital at Nowshehra had 12 storeys, each containing 50 rooms and each room accommodating 500 persons. He also founded the towns of N owshehra, Zainapur, Zainakut and Zainagir. The Jamia Musjid at Srinagar which was started by Sikandar was completed by Badshah. He also built a bridge over river Jhelum which is known to this day by the name Zainakadal.
1.97 Long before the installation of Muslim
15
rule in Kashmir, there was an island in Wular Lake which got submerged later on lmder water. Badshah reclaimed it by pouring stones into the lake and raising the level of land much above water. The new islap.d was named Zaina-Iank. Here he' built a palace with fOur storeys, one made of stones, the other of bricks and the remaining two of timber.
1.98 With the death of Badshah, the Shahmiri dynasty started to decline gradually until it was finally overthrown by the Chaks. Haji, the new Sultan, assumed the title of Haidel' Shah and ascended the throne in 1470 A. D. He was not destined to rule for more than two years due to frequent court intrigues and conspiracies which characterised his regime.
1.~9 As a result of his weak administration, many feudal chiefs, particularly those of Jammu province, declared themselves independent. Hassan, the Sultan's Chief Minister who was depu_ ted with an army to subdue the rebel chief~. however, succeeded without any conflict in securing the allegiance of the rulers of Rajouri, Jammu and the Chief of Gakkhars. Others who refused to surrender were defeated and, after being captured, put to death.
1.100 Though a drunkard,' Haider . Shah was a poet and a patron of art and science. He loved the society of learned Pandits who read out to him passages from various scriptures, including PUranas and Dharamshastras. He had specialised himself in music and according to Srivara, he even taught Professors the art of playing on the lute.
1.101 His main contribution to architecture was the bridge which he built across river Jhelum and named it as Nawakadal by which it is known to this day.
1.102 Haider Shah was succeeded by his son Hasan Shah who ruled Kashmir from 1472 to 1484 A. D. Like his father, he was also a great drunkard though next only to Badshah as a cultured ruler. He evinced considerable interest in the spread of education and set up a number
of schools at various places. He got several Persian books translated into Sanskrit. Being a musician himself, he patronised the development of music a,nd recruited as many as 1200 musicians to his' court. Hasan Shah was also a builder. Tbe most important construction which he undertook was the rebuilding of Khanqah-Mualla and jamia ]I,'lusjid of Srinagar, both of which had been gutted by fire in 1479 A. D.
1.103 Prince Mohammed was only seven year:; old in 1484 A. D. when he was declared succeSior to his father, Hasan Shah. In actual effect, therefore, the powers of the ruler were exercised by his maternal grandfather and Chief Minister Syed. Hasan Baihaqi. The Kashmiri nobles planned a revolt against Syed Hasan with the help of Paras Ram, the ruler of Jammu, who was then living as a refugee in Srinagar due to his dominion. having been attacked by Tatar Khan. They raised a small army of 300 men, mostly consisting of Jammu soldiers and with their assistance, entered the fort at Nowshehra under the cover of darkness. The next morning " ... hen Syed Hasan was holding court, he and 13 others of his family were attacked by the soldiers and slain. On hearing of this tragedy,
. Syed Hasan's son, Syed Mohammed, attacked the Nowshehra fort and occupied it.
1.104· This waS the beginning of a series of conflicts between Sayyids and Kashmiri nobles who alternately came to power or went into exile. As a result of these periodic revolts, Sultan Mohammed Shah lost his throne three times being succeeded on each occasion by Sultan Fateh Shah, son of his uncle Adham Khan who lived in Jullunder. Finally, Mohammed Shah availed of the help of Sikandar Lodi -(1489-1517 A. D.), the emperor of Delhi, who provided him with a force of 3000 men. He was welcomed by the local nobles and with their help defeated Fateh Shah who fled to Punjab where he died in 1517 A. D. In 1528 A. D., Mohammed Shah was deposed and imprisoned by his Chief Minister Kaji Chak and instead, his son Ibrahim was declared as the ruler.
-16
1.105 The rule of Suitan Ibrahim Shah did not last for more than a year. Some- of the Kashmiri nobles headed by Abdal Magre sought the ~elp of Emperor Baber for the installation of Nazuk Shah alias Nadir Shah" the son of Fateh Shah, as the Sultan of Kashmir. The result was that Ibrahim Shah was dePosed and replaced by Nazuk Shah. The new ruler also could not remain in power for more than a year. Mohammed Shah, as we have seen, was still .alive and was confined in prison. The nobles managed to release him and got him enthroned for the fifth time in 1530 A. D. The Mog}J.ul troops returned to Lahore where they informed Kamran, Emperor Himayun's Governor, that owing to the dissensions and discord among the nobles of Kashmir, the valley could be occupied without any resistance.' Kamrant therefore, marched with an army of 3000 men and occupied Srinagar. The Moghul army plundered the city, destroyed houses and killed all Kashmiris resisting them. The Kashmiris meanwhile took refuge on hill-tops and continued to harass the Moghuls who got tired and eventually agreed to leave Kashmir.
1.106 Mohammed Shah died in 1537 A. D. and was succeeded by his son Sultan Shanls-udDin II. The latter ruled in name only and died just aftee a year. Ismail Shah, the secon? son of Mohammed Shah and the son-i'll-law of Kaji Chak, Chief Minister, was, therefore, installed in his place as the new Sultan in 1538 A. D. Kaji Chak was a Shia and he launched an eKten~ive compaign against non-Shias. Ismail Shah wielded no power and was content with one-third revenue of the valley assigned to him by his father-in-law. Like his brother, he was not destined to live long and died in 1540 A. D. He was succeeded by his son Ibrahim Shah I_I who ruled for a period of four months only.
1.107 This brings us to Mirza Haider'Dughlat who was born in Tashkent and descended from Dughlat tribe of Chaghatay Mangols. His father was the Governor of Tashkent and was assassinated at Herat. He remained for two

years with Emperor Baber at Kabul and later joined the service of his cousin Sultan Said ;Khan, the ruler of Mughalistan. Under the orders of his master, Mirza Haider proceeded with ail army to Ladakh and occupied the provinc~ of Nubr~, about 300 miles from Leh. In this campaign, Said Khan's son, prince Sikandar Mirza, also participated. Sikandar took Baltistan while' Mirza Haider crossed Zojila Pass and occupied tne valley after a stiff resistance. During their stay in Kashmir, the Moghuls destroyed every village and town by which they happened to pass; Musli~ns and NonMuslims were executed alike and women and children were made slaves. As a result of these atrocities, there was greater unity among Kashmiris who took a pledge to turn out the invaders. They, therefore, fought pitched battles against the Moghuls and finally compelled them to leave the valley after negotiating a treaty.
1.108 Mirza Haider later on' joined the service of Emperor Hirnayun at Lahore where Abdal Magre, Regi Chak and other disgruntled nobles of Kashmir approached him and sought the help of imperial forces for their restoration to power. Himayun had just then lost his throne and was being pursued by Sher Shah Suri. Mirza Haider accordingly obtained approval of Himayun to invade Kashmir which could be taken over without much difficulty and would provide a strategic position for continuing the campaign against Sher Shah; As Himayun's officers betrayed him, he gave up the idea of going to Kashmir but Mirza Haider did not lose heart and with the help of the army placed at his disposal, captured the valley. Nazuk Shah was made the Sultan and the kingdom was divided into three parts, the revenues of which were to be appropriated by Mirza Haider, Abdal Magre and Regi Chak.
1.109 Mirza Haider next decided to recover the territories which formed part of Kashmir previously but had since declared their independence. He first launched an attack on Kishtwar but sustained a severe defeat in which the Moghul Commander and other nobles lost
17
their lives. The casualities side are said to have bt'en place came to be known (graveyard of Moghuls).
on the Moghul so large that the
as Moghul Mazar
1. I 10 Mirza Haider, however, succeeded in subduing other areas. _ He re-occupied Batlistan and Ladakh and conquered Rajouri and Pakhli.
1.1 II Among other important events of the time of Mirza Haider, mention may be made of the banning of Nur Bakhshiya sect, desecration of the tomb of Shams-ud-Din Iraqi., a prominent Shia leader and the execution of his son Daniyal.
1.112 In 1551 A.D., Mirza Haider proceeded to Wahator where the rebellious Kashmiri chiefs had fortified themselves. While he was trying to enter the fort, he was struck:.by an arrow causing his instantaneous death.
1.113 Mirza Haider had an adventurous spirit and was generous and affectionate. He was very magnanimous and as an act of self-denial never proclaimed himself as the Sultan of Kashmir. He provided many mosques with hamams (hot bath rooms) to protect the devotees from cold in winter. He is also said to have invented new types of windows and doors and reformed the pattern of dress. He was a great lover of music and introduced musical instruments not known in Kaslunir. He was a famous poet in Turkish and a writer in Persian. His work Tarikhi-Rashidi is regarded as one of the most authentic chronicles on the political history of Kashmir.
1.114 After the death of Mirza Haider, Sultan Nazuk Shah was deposed and externed from the State. In his place, Ismail Shah II, son of Ibrahim Shah, was declared Sultari.in 1550 A.D. He, was very much biased in favour of' Shias and directed his energies more to the propagation of Shiaism than to the administration of the State. He founded Hasanabad, a mohalla of Srinagar city which was named after one Baba Hassan Najar, a prominent Shia saint. Two years after his accession, Kashmir experienced a severe earthquake which continued for a week's time and resulted in heavy loss of life and

property. In KamraJ (Sopore tehsil) alone, one of the hills was uprooted resulting in the death of 600 persons.
1.115 Daulat Chak, the Chief Minister of Ismail Shah, had - created many enemies due to his fanaticism for the conversion of people to Shia sect. As a result, there were secret conspiracies and while he was one day recreating in Dal Lake, most of his supporters who were then in Hasanabad were assassinated. He fled to the adjoining hills but was identified by a shepherd who produced him before Gazi Khan. The latter after blinding him put him in a prison.
1.116 Gazi Khan deposed Ismail Shah and installed Habib Shah, son of Ismail Shah I, in his place in 1553 A. D. The latter was not destined tg rule for more than a year and in 1554 A. D. when he made an idiotic observation in his court, Ali Khan, the younger brother of Gazi Khan, snatched away his crown and placed it on the head of his elder brother, Gazi Khan. Habib Shah was turned out of the palace and in this way the rule of Shahmiri dynasty, which had extended to a period of 232 years, came to an end.
1.117 Gazi "Khan belonged to Chak dynasty and had been serving the Shahmiri rulers in different capacities till the time of Badshah. During the regimes of Mohammed Shah and Fateh Shah, however, there were periodic rebellions in which the Chak dynasty strengthened its position and effectively interfered in the affairs of the State. They also entered into matrimonial alliances with the Shahmiri dynasty and claimed equality with them.
1.118 Soon after his accession in 1554' A.D., Gazi Khan recovered the territories of Ladakh, Skardu, Gilgit, Kisht\Var and Pakhli. He believed more in repressive measures and was notorious for awarding extreme punishments, such as cutting of hands and feet and removing the eyes. His zeal for the propagation of Shiaism struck terror not only among the non-Shia Muslims but even in Hindus who were coerced to abandon their faiths and to adopt the Shia creed. He
18
died of consumption in 1563 A. D. and was succeeded by his brother Hussain Khan.
1.119 Notwithstanding' his religious fanaticism, it must be said in fairness to Gazi Khan. that he was strict in administering justice and did not hesitate to punish the guilty, whatever their status or relations with him. When it was reported to him that a servant of Haider Khan, his son, had snatched away some fruit from a person, he got the hands of the miscreant cut-off. Haider Khan got annoyed and decided to revolt against him. He was admonished by his maternal uncle, Malik Mohammed, but he resented the advice and killed the Malik. Gazi got his son arrested and hanged him publicly at Id-gah.
1.120 The new ruler Hussain' Khan was a more broad-minded person ana respected all faiths and creeds alike. It is said that on Fridays he availed of the company of Muslim scholars and priests and had discussions with them. Saturdays were reserved for similar discussions with Brahmans and Pandits. On Sundays, he met saints and mendicants only. Tuesdays were reserved for Maulvis and" Muftis. Oil Wednesdays, he did not receive anyone and engaged himself in hunting. The Militia men wel'e given audience en -Thursdays. Mondays were earmarked for drinks, dances etc. in which people from all communities participated.
-1.121 Hussain Khan died of paralysis after
having ruled for seven years and was succeeded by his brother Ali Khan in 1570 A.D. He_ did not approve of his brother's ways and tried his best to earn the goodwill of the people. He worked hard to bring more comforts to his subjects and associated frequently with scholars and men of lea:ming. He also discontinued the practice of blinding the guilty or cutting their hands or feet. He swore that he would not drink nor he would interfere with the faiths of others nor permit the introduction of repressive measures. He appointed Syed Mubarak Khan Baihaqi who was reputed for wisdom and scholarship, as his Chief Minister.
1.122 One or the hobbies of Ali Khan was to play golf. One day while he was playing at Id-gah, the ball struck him in the stomach causing a serious wound. He fell down from the horse and died on his way to his home.
1.123 Ali Khan was succeeded by his son Yusuf Khan in 1579 A. D. He was given to drinks and dances and did not look after the administration of the . State.
1.124 One day while Yusuf Khan was passing by village Chandhar (11 miles to the south of Srinagar), he happened to see Habba Khatoon, the daughter'· of a' peasant who was working in her field. Habba Khatoon had secured divorce from her first husband who proved to he a vagrant.
1.125 Yusuf Khan was very much fascinated by her beauty and married her with the consent of her parents. He spent most of his time with Habba Khatoon and absented himself from headquarters along with her to live in health resorts and beauty spots, like Gulmarg, Sonamarg, Achhabal etc.
1.126 Having taken note of Yusuf Khan's constant indulgence in drinks and pleasure trips, his nobles, headed by the Chief Minister Baihaqi, rose in revolt against him. In 1580 A. D., they invaded the city and destroyed all the bridges over river Jhelum. There was a fierce battle in which most of the chiefs of Yusuf Khan were killed. Yusuf Khan voluntarily handed over the keys of the treasury and the crown to Baihaqi and fled to India.
1.127 Mubarak Khan Baihaqi was installed as the king of Kashmir in 1579 A.D. He was by nature a God-loving person and despised the luxuriant ways of his predecessors. Immediately after coming to the throne, he removed all the pearls, diamoBds and other precious stones from the crown and distributed their sale proceeds among the needy and poor. He dressed himself as an ordinary citizen and addressed himself to the administration of the State with a sincere mind.
19
1.128 Later on, some of the nobles headed by Abdal Butt etc. revolted against him. He was deposed and replaced by his nephew Luhar Khan in 1580 A. D.
1.129 Luhar Khan appointed Abdal Butt as his Chief Minister but took considerable personal interest in the affairs of the State. He struggled hard to mete an equitable treatment to his people who called him Noushirwan, the famous Persian ruler reputed for administration of justice. Luhar Khan intfOduced several schemes to extend the cultivated areas and to increase food production. It is said that during his time, two maunds of paddy could be had for one pice and a bread weighing more than two pounds and known as Luhar Mandami could be had for half a pice only.
).130 Not before long, Yusuf Khan who was living in exile enlisted the co-operation of local chiefs and invaded the valley. Luhar Khan was defeated and ran away. Yusuf Khan was reinstalled as the Sultan of Kashmir in 1581 A. D.
1.131 Later, Emperor Akbar deputed 50,000 cavaliers under Raja Bhagwan Das and Shah Rukh Mirza etc. to invade Kashmir. YUluf Khan also raised an army of 12,000 cavaliers and 30,000 soldiers to face the imperial army. In the conflict that ensued, Kashmiris fought bravely and succeeded in killing thousands of Moghuls. Before any decisive battle could be fought, there were heavy rains and snowfall and all the rivers, canals and streams were in spate. The imperial forces could not receive any prOVISIOns and had to face a severe famine. Due to this natural calamity, Raja Bhagwan Das sent a message to Yusuf Khan pointing out that even though the present conflict could not, owing to the worseni~g of climatic conditions, yield any fruitful results, he would receive a further reinforcement of a hundred thousand soldiers and the entire valley would then be trampled under the feet of elephants. He, therefore, advised Yusuf Khan to review his attitude and not resist the imperial forces.
1.132 As Yusuf Khan was already anxious to meet Emperor Akbar, he deputed his Chief
Minister Mirza Qasim to negotiate a treaty. The Raja agreed to withdraw on the condition that Yusuf Khan should accompany him to the court of the emperor where he would intercede on his behalf and obtain Akbar's consent to Yusuf Khan being permitted to retain the sovereignty of his territory. YusufKhan therefore accompanied Raja Bhagwan Das in his journey to Attak, where Emperor Akbar was encamping at the time. The local nobles did not, however, approved of Yusuf Khan's action and held that tliere was no prospect of his return to Kashnlir. They, therefore, installed his son, Yaqub Khan, in his place and raised a new army to fight the Moghuls. Raja Bhagwan Das on the advice of Yusuf Khan sent a message to. Yaqub Khan assuring him that his apprehensions were unjustified and that the treaty would. be negotiated in letter and spirit.
1,133 When, however, Jtaja Bhagwan Das presented Yusuf Khan to the emperor and interceded on his behalf, Akbar declined to permit Yusuf Khan to return Kashmir. He was put in chains and placed for two years in . the custody of Raja Todar Mal. Raja Man Singh again pleaded with the emperor and this time Yusuf Khan was' given a suitable assignment and posted to Bengal where he eventually passed away.
1.134 Yaqub Khan became· the ruler of Kashmir in 1585 A. D. and appointed Ali Dar as his Chie~ter. He was a drunkard and did not interest himself in the affairs of the State. In order to appease the nobles, he assigned them jagirs which had al.ready been allotted to others. When the parties in dispute approached him, he disposed them of saying that the areas in question belonged to the State and could not be assigned to anyone.
1.135 Yaqub Khan stole a march over his predecessors in the propagation of Shiaism. He executed Qazi Musa Shahid, an accredited Suni scholar and leader, merely because the latter declined to direct his followers to insert in the Azan the words "Ali (the fourth caliph of the Prophet of Islam) is· a saint".
20
1.136 TIred of the persecution of Sunnis launched by Yaqub Khan, some of the leading Sunnis including saints like Sheikh Yaqub Sarli and Baba Dawud Khaki, called on Emperor ~bar and persuaded him to invade Kashmir. The emperor agreed and eventually a treaty embodying the following terms was exec~ted:-
1. The Moghul rulers should not interfere in religious matters nor with the prices of food articles,
2. The Moghuls shoul" not make Kashmiris their slaves,
3, No Kashmiri should be asked to serve the Moghuls without wages, and
4. The Kashmiri nOQles who were responsible for the present tension in Kashmir should not have any hand in administration.
1.137 In pursuance of this treaty, an army consisting of 40,000 cavaliers and 20,000 soldiers invaded Kashmir under the leadership of Sheikh Yaqub Sarfi.
1.138 Yaqub Khan also raised an army of 30,000 cavaliers and .10,000 gun-IDen to fight the imperial troops. In the conflict which took place at Hirap~r (5 mil~ to' the south of Shupiyan), many Kashmiris who were fed up with the l'egime of Yaqub Khan deserted him and joined the imperial army. The ·result was that Yaqub Khan was defeated and fled away to Kishtwar. The rule of Chak dynasty thus came to an end and the. era of Moghul sovel'eignty was ushered in.
Moghul Period
1.139 Qasim Khan was the first Moghul Governor of Kashmir and came to office in 1585 A. D. Yaqub who was wandering in
'Hirapur and Devasar illaqas of Kashmir invaded Kashmir twice during his regime hut was on each occasion repulsed. Qasim Khan was eventually re-called to Delhi and Syed Yusuf Khan Rizvi appointed as the next Governor. During his time also, Yaqub Khan again revolted but was, as before, defeated.

1.140 Yaqub ~han w,ho was taking refuge in KtsHt:~a~"\va;' 'rid~~cod\finced that lHs stru'g~Ie to' recaver the thrane af' KashrIih· was bonnd ta,:fu.ll. Me,· the,r~1<?.J;e~ ~ame to. t~rms w~th Yusllf Kb~n"wha 'after obtaining the ,orders af Akbar,. acco~~niep. '.iYaq~b .... to . ·_L~hore.· .' and .. prod,-;!ced' him before. the eInperor. yaqub's. life ,was. sparfld, !I.:nd, \l.a ,was . gra~et;l.",a '. jagir .,af Rs .• 20,OOO/~ .. ' P40~ .. ,was order~d,. to. remain in the custody of Raja ,)Man . Singh. In .1593, A.D. Yaqub ·",as poisa'~ed by. his brother and was buried in, .Kishtwfl,r., "
1.141 'pJ"i ther~ were complaints' of leakage 'of Goveimnent . revEinui!s, Akbar deputed some of his' officets to' Kashmir who immediately· plugged. all loop-hales in the systein of callection. The pe6ple were annoyed and felt' very unhappy 0: with''- the measures taken~ They," therefare' blocked ali" the foutes leading to Delhi and Lah~re artd"attacked'the Moghuls. 'H~san, Beg,: a Maghul representative and an expert in . taxa-. tion work' alane managed to save his life by ~nning '., ;i:~ay: . On' hearing.'· of this "incideht, Akbai' a~pu,ted a'large army" tinder. ihe' 'cammand of Z~ Khan Kokaltash; Sadiq Khan and Sheikh' Farid BadakShi. 'Meanwhile; Yadgar : Khan, 'one' af the n~ble~' of Kashmi.r;~proclaimed· hilnself ·as the illier" of Ka~furli'r. 'He pacifi'ed his' nobles by' granting' them titles 'i!J.nd' jagi~s. an& tried
. ; 'A~' !l;~l "f_:? ~ ·:~.6-L~\···b~ ~~)~ ...... .
J; .;i. ~Ii ~ ~,,; fitJi: 6p"';l~)~~;
. ~. ..., .
-. d~~))~L dV ,J) u-..;/' . . ....
~t1.r; .~)Yc English transliltion:-
'O~der the ardets: af 'the king of kitlgs and the Emperor of the world, Akbar-the-Great (~ay God. enhanc.e his: dignity) .. the fou~dation of N agaPDagilf fQrt ha,sJ;~een la~d. The. ~pel"or
to stabilise his position by minting coins in his' name:
-1.142. Akbar, however, decided to follow the artily'. perS()nally to KaShmir which cam!l as' a' great surprise to Yadgar Khan; He deputed ane of his afficers, Darvesh Ali to. block Pir Panchal route b'y which the empe,rar was 'scheduled' to . arrive. 'In the battle that followed, KaShrtiids' we~e touted and Yadgar was' arrested. and· executed. The emp~or was received with great pomp in Srinagar. and illuminatians were organised all over the oity to celebrate the occaaion. '. It ",:as during this visit (1587 A.D.) that .the· city 'af Nagamagar which was provided with shops, streets, markets and magnifident houses was, built under the. orders of Akbar. A huge wall measuring about 25 feet in h~ighf and 5 feet in width, which stands to this day, :was constructed by him around the new dty. The construction of the fort was completed in a period of ten . years and cost the Imperial Exchequer 109 lakhs of rupees, as indicated in' the follMVing verses inscribed on the top"of the huge gate' built ill. the sauthern side ofthe wall; The 'project is said to have been undertaken to. provide employment to _. the inhabitants of Srinagar city who had su~~~e<i heavily as .a result af famine.:- .
.~ fit ~'cL~ _X.L::/ j~ c)~lt ~ ~e.(~~!'~ ':'r;. 'l ~ f.:..,./) <:!? ) I ~ J ,J~f UJ.J~ ~t;( D;JY ~.~,.~").,f ~J ~~~~
who. has not· had and will nat have a ri~a,l in the world sent for this purpos~ 169 lakh rupees from his treasury together with .200 'I~dian'" masier-masons, all of whom' were ~~ployed' an this .praject. In this way, the
~ople of Kashmir were all· provided with employment anc:~ got cash payment from his treasury. This was in the 44th year of the Emperor's accession corresponding to 1006 Hijri.
1.143 Akbar stayed in Kashmir for about two months and appointed in 1593 A. D. Mohammed Quli Khan as Governor of Kashmir in place of Vusuf Khan, who returned with the emperor.
1.144 Mohammed Quli Khan punished all tbose who still harboured hopes of coming to power. In particular, he wiped out mtiDbers of Chak dynasty who had been a source of constant tI'ouble in Kashmir. Those who survived among tbem, seeing no hope of their restoration to power, got themselves engaged as private servants or took to cultivation.
1.145 In 1597 A.D., Akbar paid another visit to Kashmir. He went round the Nagarnagar fort and granted rewards to the artisans and other workers who were employed on this project. During his stay, he deputed a large force to conquer Tibet. The' enterprise was a success and the Raja of Ladakh was taken prisoner.
1.146 Mohammed Quli Khan'. rule which lasted for 15 years was an epoch of great happiness for the people of Kashmir. He was succeeded by Mirza Ali Akbar in 1604 A. D. Like his predecessor, he took keen interest in the well-being of the people but there was an unpreceden'ted famine due to untimely J'ains which resulted in the death by starvation of a large proportion of the population. Having heard of the tragedy, Akbar despatched huge provisions from Lahore and Sialkot which were distributed among the needy.
1.147 In 1606 A. D. Akbar passed away and was succeeded by Jahangir. He paid his first visit to Kashmir in 1621 A. D. but could not stay for long due to trouble in Deq:an. He came again in 1623 A. D. this time via lVIuzaffarabad. As before, information was rcceived that the armies of Kburasan and Iraq had besieged the fort of Qandhar. This time Shan Jahan was deputed with a large army to quell the rebellion. The emperor could not,
however, afford to stay in Kashmir for long and had to return soon after.
1.148 The' Moghul Governors who ruled Kashmir during the reign of Jahangir included among others, Q,lli Khan, Hashim Khan, Safdar Khan, Ahmed Beg Khan, Dilawar Khan, Iradat Khan and Yatiqa,d Khan. Qpli Khan and Hashim Khan ruled Kashmir for six years in all and were followed ill 1612 A. D. by Safdar Khan, whose period of Governorship did not exceed two years. Ahmed Beg Khan took" over in 1615 A. D. During his regime, cholera broke out in epidemic form and took a heavy toll of human lives. It is s~id that the number of dead was so large that no arrangements could be made to cremate or bury them and instead their corpses were thrown into the river. As. a sequence to this, the people abstained from takin~ fish for a: long time.
1.149 Dilawar Khan became the Governor of Kaiihmir in 1617 A. D.- He laid a garden at Brari-numbal in Srinagar: During his regime, the ruler of Kishtwar revolted and declared himself independent. Dilawar Khan deputed a huge army and conquered Kishtwar. The same year, Jahangir paid another visit to Kashmir and during his stay in Srinagar, ordered the construction of the Shalimar garden. While he was still recreating in Srinagar, a huge conflagration broke out burning as many as 12,000 houses including the Jamia Musjid. Jahangir was present on the spot and took all possible measures for the extinction of the fire. He ordered the re-building of Jamia Musjid' which was completed in 1 7 years. He also got the canal known as Lachman kuhl repaired. The mosque of Shias at Zadibal. which had also been consumed by fire earlier, was got erected.
1.150 The emperer stayed in Kashmir this time for six months and returned via Lahore. He appointed Iradat Khan as the next Governor of Kashmir.
1.151 Iradat Kham held the office of Governor for two years only and Was succeed~d by
Yanqad Khan in 1619 A. D. The latteJ;,.combed the surviving members of Chak dynasty who had still been cultivating hopes of coming to power.· He was a Shia by faith and persecuted non-Shias in various ways. In addition, he introduced several repressive laws which caused resentment among the people.
1.152 Jahangir again visited the valley in 1623 A. D. but this time he passed away at Chungu! near Rajouri in 1627 A. D.
1.153 After the death of Jahangir, .his . successor Shah Jahan extended the term of Yatiqad Khan by another seven years and he eventually relinquished his office in 1633 A. D. Shah Jahan visited Kashmir in 1633 A. D. and stayed here for over five months and laid the foundation of Nasim Bagh, Aishabad and a nwnber of other gardens.
1.154 Yatiqad Khan was succeeded by Zafar Khan Asan. At his request, ShahJahan repealed the various repressive laws which had been enforced· by the previous Governor. The proclamation made by the emperor provided that :-
I. The practice of employing forced labour for harvesting the saffron crop in lieu of a small quantity of salt should be discontinued and that every person engaged on this work, whether on Government lands or private estates, should be paid full wages.
2. Before the time of Yatiqad Khan, every cultivator was required to pay a tax of one pice per maund of paddy harvested by him. Yatiqad Khan had doubled this rate and fixed it at 2 pice per maund. The tax was altogether abolished.
3. According to the past practice, every village which had a produce of more than 800 maunds of paddy was requil'ed to supply two sheep per year. Under orders of Yatiqad Khan, every such village was in addition required to pay 66 paise per sheep. It was ordered that lleither
23
any sheep should be obtailled 110r allY cash levy imposed.
4. During autumn, when the fruit crop was ready, Government officials were posted in private gardens so that they may appropriate a portion of the produce. The result was that many owners cut down the fruit trees and replaced them by other plants. The emperor, therefore, ordered that no one should enter any garden and that the owners should be permittea to dispose of the crop as they liked •
1.155 Zafar Khan also laid four gardens, one in mohalla Braivar, the other in Botakadal, the third in Zadibal and the fourth at Hasanabad. In 1635 A. D. he invaded Ladakh under orders of Emperor Shah Jahan and conquered the territory.
1.156 Shah Jahan paid his second visit to Kashmir in 1631 A. D. He stayed here for a few months and returned to Lahore.
1.157 Zafar Khan was succeeded by Prince Murad Baksh who took over as Governor in 1641 A. D. He failed to shoulder the responsi. bilities of his office and was, therefore, replaced by Ali Mardan Khan in 1642 A. D. The latter was a good administrator and took keen interest in the affairs of the State. He relinquished his office in 1643 A. D. wltcn Zafar Khan Ahsan was appointed as Governor for the second time. The author of Tareikh· Hassan has stated that dudng the term of his office which lasted fo·r four years, a huge lump of snow measuring about 70 yards in length and 30 yards in width and a depth of 2-1 yards fell ill village Bidru of Kulgam tehsil. Other historians have not, however, confirmed this incident.
1.158 Tarbiat Khan succeeued Zafar Khan ill 1647 A. D. and remained in office till 1649 A. D. There was a severe famine during his time and many people had to migrate to the plains. Under orders of the' emperor, t~y were provided with food and articles of dress

w"herevei:' :'theychappened" ito" :be~, In .~daition, he also got large consignmerits ,.of-,food·.odespatc:;hed to ,KasJlmir flit;)m: :LallOre and other p}ac~.
, .. " '. ...•. t.: ", \ ' Ll59 The next Gi:n'ertlOr'li:assaIi Beg-Khan
re~ai~ed ~1f; Qffid¢ lot. &i~; 'year ofily' 'and' was suc~e~de~i' in i651 A:'t)~ by AliMa:rt'lari'Khan fo~" the ';~c~lId ':tithe. . He laid;' die Aiiabad g~~de~ ~t' 'Telbal' and .. ilyderabad garden in No~sheh~~ .. Y{xrth'er,' : und~r 'ord-ers of the
e~per?<~~ ~l~O '\)uiit. ~sev.~n 'i{m~ ''fo:C'the use of armed forces and VISItors at dIfferent places inCludi~g H~r~pur~ BehJariigali; Tliiiha', etc. etc.
, 'i
1.160 Ali Mardan was succeeded by Lashkar K.l,l~n. , :Qu.ri~g 'hi;; .' time,'-f6'ml' 'ai\d·
1 C?th~r -'e~~b'les
cp~ld' ,be}iad ~_t v.e/y· c,li~~p' )i~teJ 56 m:u~h' sd tpat paddy weighing two, init,unds was.' a;{iailable
q~l barter" 'yst~,...ror, ~,.c~i<ike~, oo,ly., ,
1.161 This brings us to dl~·time'6f Autartglteb
0/110 t~e<;lan~~t ,l!~ms~ff a;~, "the, ,.~~perp,~;. 9\;. !p:dia
iQ;, 1659."A. ;Q,X,<tti~d \<:h,~n, ~g~,~r~t, G~:-;~~~?;, of Kashmir, "a,ppoJJilted,,, ,by "hi:w,\ t?,ok". 9,ye~,;~n 1661 A. D. He was replaced after three years by'"'lbrahim ·K!han-,"SOIl'; ·of-Ali·-':Miudan .Khan. The" latter"waS"inv&lved. j·n Sunni.Shia, conflict ariH >'was 'replaced' after- eighteen' months.;li1y Isl'li.rtt I Khani· . Tn·, his .'tiJne., :-:A.uol'angzeb" paid.La vi~it to' Kashmir and "sta1ed "hem," forf rthree Itlortths; ,; Islam 'Khan' accOmpanied him to lilellLi ailti waS- succeeded in l666 i A. D,' by Saif :Kihan. Tl1e i neW GoveJlrttir was ai; b-~rong' disoipmuian and'''futrbduced'',several ';mea&U1Je8 to .. chllck<tb.e te~~e '"activities' of" Govemmeitt,· . .officials and to ensui:e-~ tliat; 11.&' 'one indulged dn mal.prac.Mesi He " aIsi:l-' "founded a' garden .'after his name:on the- 'horthern 'bank'<of "Dol ;Lake", After three rem, the '-w.lis :"replaced ,!-by, Mubairiz --Khan! ,a wHlt-behaived and piOlts man. i' In 1668 A. in.. 'Salf Kha'h"was again dppointed, as' Governor: This time he built a bridge over river ]hell!m which is known to tIllS day after his name and,' is . ~alled " Sa:fal<"3:da[ Aftel-' three' yeats;' he tendered'reslgnatioft' aild"decided to sett1~ li~' a p;'~~!lte ~'i?~_ivldJal. .
. LI62?''iftikhar,'" Khan;' the' next;, "Gove1inor, assumed' office' in-, 16-11 . A. DL I During 'his' time,
2.4
thE!r~:;W4-s.~, ,big •. .,c-onfiagl'::ttip.l3,. which, ~~sWAI'i4" ( 121000 hOUcSf!$" 01':." Srinag;tr, .l;it.Yt'J-,.i.ncluWQ;g ,;,the.,!
] am;ia, M~d.. H;e,;was. sl,lCceqd~ by., ,Q,iwam .riiot1.,. Khan i_~-. ,;1675, I)."D.-'"rql.e;'. )at~;i .¥eici :,,~~,><, office of , .. GQvernol', for' three ','¥I'!ars .. o~:: ~g,: l<l<W{,
was., replaced by IbrahiIll , :KJ?<l:~ whqcltollk o,~~il'" for the second time.~in ~6~9, A. p_, -DJ,l~~iRgJ?j~, regime, there were several natural calamities
and other incidents" ,The "v~lley. "wil#"'~sacl", a.n unprecedented flood whi9h ~wept.· ¥-vay ~h~ bridges of riwer ]h<:lum ,I!-nd,.ca.~eq ,bea~Y,-)<i>:liS of life and property. This w~s followed by'~ severe earthquake' in which thousands'of pedple lost their' liVes. In':1686 Ai D,,:therewa& again a 'conflict between Shias':and,Sl;lnnis,r.elIultl.ng.:iri, the decimaHon'-of!;i' Iatg-e .. rtumbeI':'.of plH;sons. Ibrahim' Khan-" was~ 'therefGr-e',' 'deprn;ed: and' replaced by: Hifz Ula. K·han··;in l68Y AD.;<Tbe· latter refu.ained in: ofliGe::· ,for. a:i,oLtt'- ,: .f011lf;:, "teal'S
and was succeeded in; :1689.: A. n. 'by Mi:naffil.r. Khall. The. new Governor, also ,relinquished Qffice" in 16!H "A:'D. 'ahd' H~fldeif dvM til Abu N,~~~i'ri~~?a~" 'Jie'. ~~§~liio)t&~ioJs' for!iep'reS'SiOri and was" exiled'. under "ordefs':'tHiilie iiffiper-6r.:J ,; .: .:. '., ·:: .. ··L ~;,;{-f :.~~ ~)~.,.,..·H.;L!.
" 1.163: Fazil 'Khan;:':the riew,-GowriiO-t,,;;ioall over in 1697 A. D. He devoted himself to- the welf~re of the peopJe and repE;aled the various . ~ ;' ,", .. ! . , . ~' .. ~. ,"'. j: .' . ..... • ." .... "'.... ~
laws introduced' by 'hlS predecessors' for -the IeJy, pf different, t;i.~s. ,,'He bhi1t"t1ie "b'ttnd of
Ha~t' 9hinar; t~.emo~qiie~:i)tH.~sanaba:d ~nd]ogi Lanker, a school ariq a public ~aih!w.i:ih arrange-
) • ".- . :.. .' ~. • .• I ~ '_ • j . - "t . ,;.. merits. for .hot water. After over" three- years, he resign~d and' '~as "sricceeded- bY:- Ibrahim Khan who took over as Governor for the third time: " On, this ;oGcasion, <he, behaved 'well and devoted himself zealously to" the affairs of the State. ,In -1705 A. D,,, he w~s:.> trflIlsfeJTed to Ahmedabad' and.; .. iieplaced ,.by N awaiskt, Khan Rumi; <Meanwhile, Aurangzeb '-died .. and was sucCeeded :by··'M-u-azzam Shah Alam .Bahadur.
1.164 Arpong th~ :l,>()vern\)r~". <j.pp~,Ated by Shah Alam., th~ fi.!:st, was JlIlar .. " K~~~ who -assumed,ofE;ce in 1,707 A."D. Btl -wM -~ great drunkard and- a dest?~t;', Ibrahim ;K~n who succeeded. him. in ·17Q9 fI:-.: :p" 'dieq aft~r three ,months . only' . and was ..replaced ,,lilY ~~wazish

Khan. The latter could not also remain irt office for more than It year due to his inability to cope with two major calamities which the valley witnessed during his time. The first was in the form of a heavy flood which washed away all crops and destroyed thousands of houses.' The other was a large conflagration accounting for the wiping out of 40,000 houses of 20 densely populated mohallas of Srinagar city.
1.165 Amanat Khan, the new Governor, took over in 1711 A. D. but died after a year or so only. He was succeeded, ip. 1711 A.D. by Mushar~f Khan, who had to relinquish his post folIo';ving the death of Shah Alam. His successor Inayat Ullah Khan did not remain in office for more than nine months due to the death of his son who was killed while fighting Bumbu tribes of Muzaffarabad. Meanwhile, Emperor J ahandar Shah was killed and Farukh Siyar declared as his successor. He appointed Ali Mohammed Khan, a Sayed, as Governor of Kashmir in 1715 A.D. The latter imposed several taxes on the people and was in consequence deposed after holding office for two years and four months. His successors included Azam' Khan, Ali Mohammed Khan and Ihtirain Khan who held the office of Governor for short durations not· exceeding in the aggregate two years.
1.166 Mir Ahmed Khan, the next Governor, took over in 1719 A. D. He held . office for three years during which he concentrated his attention on the implementation of various measures for die well-being of the people. It was during his time that Farukh Siyar was killed and prince Rafi-ul-Darajat installed in his place. Rafi died of tuberculosis after five months only. His brother Rufi-ud-Dawla was not also destined to rule for more than six months. In the meanwhile Mohammed Shah, the great grandson of Aurengzeb, was declared as the emperor of India. .
1.167 Abdullah Khan lJahlJe(lI'succeeded Mir Ahmed Khan as Governor of Kashmir in 1722 A. D. He proved an inefficient administrator
25
and was removed after six months only. Momin Khan, the new Governor, could not also retain the post of Governor for more than seven months due to his mal-administration which reflected itself in the Sunni-Shia conflict. Abdullah Khan Dahbedi who succeeded him again was replaced after five months by Abdul Samad Khan, a stern administrator and a despot. He issued orders prohibiting non-Muslims to ride horses or to wear costly dress or to educate their children in schools. On receipt of these complaints, the emperor got him replaced by Arif Khan. This man also did not prove equal to the task assigned to him and was re-called after six months only. During the time ,of Azam Khan who took over in 1726 A. D. there were heavy rains and the crops were washed away before being harvested. The result was an unprecedented famine and starvation. Azam Kh3Jjl was, therefore, deposed and was succeeded by Fakher-ud-Din Khan in 1727 A. D. He was followed by Abul Barkat Khan and Agar Khan, one after another. The latter launched an open campaign of extortion and appropriated large amounts collected by imposing heavy fines on innocent people. He was, therefore,. removed
. from his post after one year and was again succeeded by Abul Barkat Khan. The latter had to vacate the assignment in 1731 A. D. to make room for Ihtiram Khan for a short while~
'During his third term of office, there were heavy rains for several days continuously and thous3.nds of houses were destroyed. The rivers were in spate and the crops were washed away. Many houses remained under water for about one month. Toyvards the end of the same year (1738 A. D.), the valley experienced a severe earthquake which continued at short intervals for over three months at a stretch. Many houses tumbled down and thousands of people lost their lives.
1.168 The next Governor, Jalil-ud-Din Khan, who assumed office in 1740 A. D. faiied to run the administration and numerous complaints were lodged against him before the emperor a't Delhi. After eight months he was removed and replaced by Fakher-ud-Daula. The latter was also not
destined to rule for more than nine months and was succeeded by Inayat Ullah Khan.
1.169 Jan Nisar Khan, the next Governor, assumed the charge of his office in 1748 A. D. He was re-called after six months and replaced by Afrasiab Beg Khan. One of the severest famines which Kashmir has ever known broke out during his time. Rice became scarce and could ,not be had even at Re. I f- .per kilo. People had to pawn their ornaments and even the agricultural implements to secure food cereals. The famine was so acute that, as remarked by the author of Tareikh - Hasan. a child was sold for two or three pice or, if such a sale could not be negotiated, he was slaughtered and consumed as food. Many people migrated to the plains and settled there. After two years (1750 A. D.), the famine re-appeared and was immediately after followed by a hurricane accompanied by lightning and earthquake. As a result, about 30,000 houses were destroyed. The bridges were washed away and the fruits, on which alone the people depended'due to famine, rottened and became uncomumable!
1.170 Mohammed Shah, the emperor of Delhi, died in 1747 A. D. and was succeeded by his son Ahmed Shah. The latter recalled Afrasiab and appointed Ahmed Ali Khan, Malik Hasan Irani and lVEr Muqim Kant in successsion as Governors of Kashmir. During the time of Abul ~sim Khan, the next Governor, Kashmir was invaded by Abdullah Khan, a Lieutenant of Ahmed Shah Durani. Qasim was defeated and captured by the Afghan army.
1.171 Abdullah Khan was not interested in settling in Kashmir and he directed his energies to the persecution of people and in loot and plunder. It is said that there were about eighty foreigners running commercial establishments in Srinagar at that time. Being unable to stand the atrocities of Abdullah Khan, all of them packed up and returned home.
1.172 The next Governor. Khwaja Abdullah Khan, held office for 4 months only and was succeeded by Raja Sukh Jewan~ In 1754 A. D.,
26
there was again a famine due to heavy snowfall and rice became scarce. Abul Hasan Khan, who was the Minister of Revenue under Sukh Jewan. conducted a census of the whole city and organised, for the first time, a rationing system which remained operative for 6 months. The rations were issued from Govemnient godowm in which paddy was stocked for being issued during famine.
1.173 In 1762 A. D. Ahmed Shah Durani deputed: an army of 50,000 soldiers under the leadership of N oor Din Khan to invade Kashmir. Sukh Jewan was defeated and escorted to the court of Ahmed Shah Durani where he was got trampled under the feet of elephants and killed.
1.174 Sukh Jewan was a generous person. He was a poet and treated scholars with greatest consideration. He had appointed seven poets to compose the history of Kashmir in poetry. Before, however, the project could be finalised, the invasion of Ahmed Shah took place and the compilation of the book remained i~complete.
1.175 Noor Din Khan, the new Governor. held office for 3 months only and was succeeded by Blund Khan who took over in 1763 A. D. Noor Din Khan took over as Governor again in 1765 A. D. and remained in office for a year and a half. Lal Mohammed Khan. the next Governor, was also re-called after 6 months and replaced by Khuram Khan in 1766 A. D. After a year, Khuram was suc;:ceeded by Mir Faqir Ullah Kant. The latter was a drunkard arid a person of bad character. He persecuted the people and imposed huge penalties on them with the object of massing wealth. Eventually, he revoited against Pathan rule. The result was that a huge army headed by Noor Din Khan again invaded Kashmir. Faqir Ullah was defeated and fled to Karnah where he passed away.
1.176 Ncor Din Kh ... n took over as Governor ,for the third time in early 1769 A. D.

After about 3 years, he was replaced by Khuram· Khan who assumed the ofjice of the Governor for the second time in 1771 A. D. He was an ineompetent administrator and was removed from office after 6 months only. The new Governor Amir KhanJawansher assumed office in 1771 A. D. He built a small island in Dal Lake which survives to this day and is known as Suna Lank. He also constructed the Shergari fort which was actually the site of a garden. Amirakadal, the 1st bridge of Srinagar city, which was also built by him, ·is known after his name to this day.
1.177 Ahmad Shah Durani was succeeded after his death by his son Timur Shah. Haji Karimdad Khan, the first Governor appointed by Timur Shah, took over in 1777 A. D. and was notorious as a despot and a man of loose character. He introduced nazarana which was payable to him by jagirdars and nobles and amounted to almost twice the income of the jagir. He also inflicted penalties on leading businessmen and other capitalists and appropriated the money for his personal use. The zamindars and cultivators equally groaned under the heavy taxes levied on them. Many people cut off fruit .trees to evade the paymeht of the tax and sold the wood as fuel in the open market.
1.178 The distress of the people was further aggravated by the earthquake of 1780 ·A. D. which rocked the valley at short intervals for a period of 6 months. Karimdad died in 1784 . A. D. and was succeeded by his son Azad Khan. The latter followed the footsteps of his father and persecuted everyone who did not co-operate with his campaign for extortion of money. He revolted against Timur Shah, who deputed an anny of 30,000 cavaliers to deal with him. Meanwhile, there were large conflagrations and cholera· broke out in epidemic fonn, which together took a toll of 20,000 lives. It was during his time that salt became extremely scarce and could not be had for a lesser price than that at which copper was being sold. Azad did not take any notice of the famine and continued to persecute the people. He raised a large army. to fight the imperial force
27
but being defeated, fled to Poonch where he committed suicide.
1.179 Madad Khan, under whose leadership the Durani army had invaded Kashmir, now became the Governor in 1786 A. D. He was recalled after a year and replaced by Mir Dad Khan. Mir Dad died in 1788 A. D~ and was succeeded by Mulla Gafar Khan. The latter remained in office for· 4 months only when Jumma Khan was appointed as the Governor of Kashmir. He died of cholera in 1792 A. D. and was succeeded by his son Rahmatullah Khan. After over 3 months only, RahmatuUah was replaced by Mir Hazar Khan. It was during his time that Timur Shah passed away on 18th May 1792 A. D. and was succeeded by Zaman Shah, his son. Mir Hazar discontinued the payment of the tribute to Zaman Shah and persecuted all non-Muslims including Shias. The result: was a fresh invasion of Kashmir by Pathans in which the local army was defeated and Hazar Khan had to vacate his post and to quit the valley. Rahmatullah Khan under whose leadership the Durani army had marched into Kashmir took over as Governor in I 793 A. D. He was unable to pull on with his nobles and was, therefore, replaced soon after by Kifayat Khan. The latter functioned as ·Governor for three months only and was succeeded by Mohammed Khan Jawansher. Some· of his nobles, however, revolted against him and imprisoned him along with his supporters. On receiving the report, Zaman Shah replaced Mohammed Khan by Abdullah Khan in 1796 A. D. The latter remained in·office for about 12 years. During his time, the grand mosque in Id-gah was gutted by fire and was rebuilt by him. This incident was followed by an earthquake which caused heavy damage to buildings. Abdullah Khan rehabilitated the sufferers by helping them to rebuild the houses and by granting relief in cash and kind. On the whole, his regime proved a blessing to the people. The prices of eatables were fairly cheap and repression was conspicuous by its absence. He revolted against Shujaul Malik, the new Afghan ruler, who deputed Atta Mohammed Khan with an army to subdue him. During the
conflict that ensued, Abdullah Khan fell ill and passed awa)
1.180 The new Governor Sher Mohammed Khan assumed office in 1806 A.D. He served for 5 months and was succeeded by his son Atta Mohammed Khan. The latter strived hard to extend the' area of cultivation and to improve the economic condition of the people. There was. peace all over in the valley and the Government revenues, registered a hundred percent increase. He dressed himself as an ordinary citizen and settled all disputes personally. In 1811 A. D. he built the Had Parbat Fort and renovated the Baramulla· bridge.
1.181 In the meanwhile, Shujaul Malik lost the kingdom of Afghanistan and was now planning to occupy Kashmir. Atta Mohammed Khan, managed to invite him to Kashmir and on his arrival imprisoned him in the Had Parbat Fort. Wazir Fateh Mohammed Khan, who ruled Kabul and Qandhar, now decided to conquer Kashmir. 'Accordingly in 1814 A.D., he reached Attak with a large army. In addition, he obtained a re-inforcement of 10,000 soldiers from Maharaja Ranjit Singh, the ruler of Lahore, to whom he ~greed to pay - a nazarana of Rs. 8.00 lakhs annually. Dewan Mahkam Chand, the leader of Sikh army, and Wazir Fateh Mohammed Khan jointly attacked Kashmir but Atta Mohammed Khan confined himself in the Shergari fort along with Shujaul Malik whom he had released in the meanwhile in the hope that he might, with his. assistance, be able to repulse the in va:ders. Finally, both of them came to secret agreement with Mahkam Chand in terms of which the seize of the fort was w be lifted and Atta l'vlohammed Khan was to present the famous diamond "Kohi Noor" to Ranjit Singh and also to hand over to him the fort at Attak.
1.182 Atta Mohammed, therefore, left Kashmir and was replaced by Wazir Fateh MohaIllmed Khan in 1814 A. D. He was succeeded by, his brother Sardar Mohammed Azim Khan ~fter
3 months only. Azim Khan failed to remit die nazarana of Rs. 8.00 lakhs to Ranjit Singh
26
who accordingly decided to invade Kashmir in 1814 A. D. The Sikh army, however, sufi'ered heavy losses in the conflict which lasted for 8 days continuously and eventually, withdrew to Lahore.
1.183 Azim Khan's period of rule was charac. terised by the repetition of faIllines. It is said that a maund of paddy could not be had for less than Rs. 8/-. The scarcity of food continued for about 5 years, causing considerable distress to the people, many of whom died of starvation.
1.184 By this time, Azim Khan's elder brother, Wazir Fateh Mohammed Khan, who was the ruler of Qandhar, was incapacitated to administer his territory due to the loss of eye-sight. H4i!. therefore, summoned Azim Khan to Qandhar to take over the administration. It is said that Azim Khan migrated along with cash, ornaments and furniture valued at one crore of rupees. He appointed his brother Jabar Khan as the next Governor of Kashmir.
Sikh Period
1.185 Jabar Khan took over in 1819 A. D. Soon after, Maharaja Ranjit Singh deputed an army of over 30,000 soldiers to Kashmir under the leadership of Prince Kharak Singh, Raja Gillab Singh and others. There was a stiff battle at Hirpur and J abar Khan was deFeated. The Sikh army occupied the Shergari fort in 1819 A. D.
1.186 Dewan Moti Ram, the first Sikh Governor of Kashmir, took over in 1819 A. D. He appointed· Panmt Birbal Dhar as his Revenue Minister. Birbal was a rank communalist and ordered the closure of J amia Musjid. He also prohibited Muslims from saying prayers in the mosques. The Pather musjid in Srinagar and several other mosques were taken over by the Government and treated as State property. He was deposed after one year and 2 months and was replaced in 1819 A. D. by Sardar Hari Singh. The latter introduced the new rupee which was known after his name and was valued at annas eight only. After two years, Had Singh was replaced by Dewan Moti Ram.
This time Moti Ram held the post of Governor for 4 years when under the orders of Ranjit Singh, he was replaced by Dewan Chuni Lal in 1825 A. D. Chuni Lal was unable to remit the annual tribute to the Central Government at Lahore due to the intrigues in his court. He was, therefore, forced to commit suicide in 1827 A. D. and was replaced by Dewan Kripa Ram.
1.187 Among the Sikh Governors who ruled KaShmir, Kripa Ram holds a very high position due to his dedication to the well· being of the people ~nd his solicitude to re-build the economy of the State and to maintain peace. There were, however, some -natural calamities during his time which shattered the economy of the whole region. In 1827 A. D., there was a violent earthquake which, besides uprooting thousands of houses, resulted in the loss of a large section of the population. It is said that the tremors continued to shake the valley for a month.
1.188 The same year, there was a severe cholera epidemic. The number of deaths caused was so large that the dead had to be wrapped in grass instead of cloth before being buried or cremated. After three years, Kripa Ram was succeeded by Behram Singh who was deposed after one year only. In 1831 A. D., Prince Sher Singh took over as Governor of Kashmir. Sher Singh was given to heavy drinking and did not take interest in the affairs of the State.
1.189 Later, Sheikh Ghulam Mohi-ud-Din was appointed as Governor. It was during his time that there was a heavy snowfall in the first week of October -when the paddy crop had just been harvested. The result was a famine in which many people lost their lives. According to 'fareikh - Hassan, the scarcity of eatables became so acute that mothers fed themselves on infants and people died like dogs on the roads and streets.
1.190 The next Governor, Mian Singh KarnaiI, took Over in 1834 A. D. He - is one of the few Governors, of Ranjit Singh whose name
29
is held in high esteem by the people of Kashmir. At the time of his coming to office. the valley suffered from acute scarcity of food and the population of livestock had substantially shrunk. Mian Singh imported 20,000 maunds of rice from Punjab and an almost equal quantity from other places against cash payment at Rs. 16/- per maund. As the people could not afford to purchase the rice at this abnormal rate, Mian Singh subsidized the cost to the extent of Rs. 13/- per maund and doled out rations to the inhabitants of both rural and' urban areas at Rs_ 3/- per maund only. Further, with a view to - re-building the livestock wealth, he imported sheep, cows and chicken from outside the valley and distributed the same among the cultivators. Side by side, he took stern action against wad-dars, hoarders and those indulging in exploitation. I t is also said that he 'Jot weights and measures made of iron manu-. factured and introduced these throughout the valley_ He also repealed the law by which parties entering into matrimonial alliances were required to pay a fixed tax to the Government.
1.191 During the time of Mian Singh, the cultivators had to supply only one-fouI-th of their produce to the Government in lieu of land revenue and were free to dispose of the balance in the manner they liked. This removed a long standing grievance of the peasantry, some of whom who had migrated to other parts of India returned home.
Id 92 Mian Singh also founded the garden known as Basant Bagh on the right bank of river Jhelum. The garden has since been wiped out- but the locality which is a mohalla of Srinagar city is still called by the same name.
1.193 Another achievement of the time of Mian Singh was that the number of shawl weaving establishments which had shrunk to 2,000 only before he took over, registered a 100% increase within four years only. He also reduced the tax leviable from shawl weavers to Rs. 1.25 only.
1.194 ~an Singh was assassinated at night in his bed room in 1841 A. D. He was

succeeded again by. Sheikh Gulam Mohi-ud-Din whose period of Governorship was also characterised by his solicitude for the well-being of the people. He re-opened J amia Musjid which had been· closed to prayers in IB19 A. D. During his time, three maunds of paddy were sold for a rupee only in all the rural areas. The inhabitants of the city were required to pay 5 ~nnas (31 naya paise) per maund of paddy issued to them as rations. The well-known spring Chashma-Shahi on the southern ban'k of Dal Lake which had got dilapidated was also repaired by him. He also founded a garden which he named after himself as Sheikh Bagh. Like Basant Bagh. the garden does not exist any more but the locality which constitutes a mohalla of Srinagar city·is still known as Sheikh Bagh.
Dogra Rule
1.195 In the meanwhile, the relations between the Sikh rulers and East India Company became strained. The result was that in 1846 A. D., when Lord Hardinge was the Governor-General of India, the British forces marched on Lahore and inflicted a crushing defeat - on the Sikh army. Raja Gulab Singh who was appointed as the next Chief Minister of the territory held by the successors of Maharaja Ranjit Singh did not see eye to eye with his masters and sec red y established cordial relations with the British. The result was that a treaty was drawn between the British and Lahore court, which provided, inter alia, that Gulab Singh, till then only a Chief of Jammu, would be recognised as the Mahar<lia of the territory extending to the south of Pir Panchal ranges. By the same treaty, it was also agreed upon that the Lahore court would in lieu of the indemnity of 150 lakhs of rupees payable to the East India Company, transfer to the said Company the territory between the rivers of Bias and Sindh including Kashmir and Hazara on a permanent basis. Later on, Gulab Singh secured possession of Kashmir from the British for a consideration of 75 lakhs of rupees by another treaty of March, IB46.
30
1.196 Sheikh GUlam Mohi-ud-Din died in 1845 A. D. and was succeeded by his son, Sheikh Imam-ud-Din. Like his father, he also devoted himself to the well_being of the people. Under his orders, the shawl weavers were declared free to work in any establishment. of their choice and the binding that they could not migrate from one industrial concern to another was removed. Further, the proprietors of shawl weaving establishments were made to pay a bonus of Rs. 3/- per head to each ·weaver. The tax leviable from the weav~rs for the supply of rations was also reduced by two annas, (12 naya paise) and of the balance one-third 'was to be contributed by the proprietors. The wage structure was also revised and the rates were increased by 25%. Imam-ud-Din was not, however, destined to rule Kashmir for more than six months as in the meantime, the administration of the valley had, as stated above. btten transferred to Maharaja Gulab Singh. Wazir Lakhpat, the Dogra Commander-jn-Chief, therefore, marched into Kashmir with a huge army along with Wazir Ratilun, the new Governol·. As Imam.ud-Din had been appointed by the Lahore court, he refused to hand over to Wazir Lakhpat. The result was a conflict between the Dogfa and Sikh armies in which Wazir Lakhpat and many Dogra Generals lost their lives .. On receipt of this report, Gulab Singh invoked the assistance of the British at whose instance Imam-ud-Din was summoned by Lahore court and the territory was handed over to the nominees of Maharaja Gulab - Singh.
1.197 Gulab Singh combined in himself good and bad qualities. He was accessible to everyone and did not mind meeting persons belonging to lowest rung of the society. He suppressed the activities of Bumbu and Khukha tribes and merged the territories held by them with his dominion by granting them adequate compensation. On account, however, of the advice tendered to him by his courtiers, he restored the repressive laws which were .operative during Sikh rule. The levy of tax on marriages was revived and the charges payable by the shawl weavers were enhanced from one rupee to
Rs. 2.50 per head. The cultivators were allowed to retain only ,one-third of their produce, m~or
'part of which was also utilized by them to entertain Govermnent officials. The rupee introduced by Hari Singh which was valued at 50 naya paise was withdrawn and replaced by a new one known as chilki rupee. It was valued at Rs. 1.25 for the purpose of sales and purchases but at one rupee only in so far as the Government revenues were concerned.
1.198 In 1855 A. D., Gulab Singh held a Durbar in which he cmonated his son, Ranbir Singh, as the ruler of Jammu and Kashmir. Simultaneously, Dewan Kripa Ram was appointed as the Chief Minister of the new Maharaja.
1.199 During the time of Maharaja Ranbir Singh, there were two successive attacks of cholera epidemic and a severe famine which took 'a ,heavy toll of human lives. -It is said that on this occasion the Maharaja, issued food-grains to the people at a nominal price of one to two annas per maund only.
1.200 Ranbir Singh dissolved the administrative units which had been carved out from the time of Moghul rule and iwtead divided the vaHey, into twentytwo tehsils. Further, he wrote off the arrears of land revenue .amounting to Rs. 16.50 lakhs approximately. In 1863 A. D., there was a violent earthquake which uprooted thousands of houses. The tremors were feIt for six inonths but due to the precautions taken by the Government, there was no loss of life. This was followed ,in 1884 A. D. by a still more severe earthquake which shook the whole of north Kashmir and wiped out a large number of villages along' with their houses and inhabitants. It is estimated that' as lnany as 35,000 heads of cattle including buffaloes, horses, cows etc. were lost in this disaster. The people were so much scared by the havoc caused that even today they name every unusual happ~ning as "wuter bunuil" or the earthquake of north Kashmir.
1.201 Dewan Kripa Ram, the Governor of Kashmir under Ranbir Singh, conducted a popu-
31
lation census of the valley and issued weekly rations from the Government Stores to the inhabitants of the areas which suffered from scarcity. He also imported large quantities of wheat from Punjab which was sold at nominal prices and, in deserving cases, free of cost.
1.202 On the advice of Kripa Ram, the Maharaja divided Kashmir into five wazarats or districts four of which were headquartered at Srinagar, Shupiyan. Anantnag and Kamraj. The fifth wazarat was set up for the administration of hilly areas.
1.203 Ranbir Singh reduced the tax leviable from shawl weavers from Rs. 48/- to Rs. l2jper head per annum and to make up the loss of revenue introduced stamp paper. He also abolished the levy of marriage tax which had been introduced during the Sikh regime. Further, the civil and criminal laws were got re-drafted and brought at par with British laws in force in the rest of India.
1.204 In 1867 A. D., when Dewan Thakur Das was the Governor of Kashmir, there was another out-break of cholera in an epidemic form. As a result, 8,000 people lost their lives. During the same year, mile-stones were set up on the various routes aRd fishing, which had been banned for two years, was again permitted.
1.205 During 1868 A. D., the Maharaja reconstituted the wazarats and raised their number to six. In 1871 A, D., opium cultivation was introduced for the first time in the valley. -The experiment proved a failure as the crop was mostly appropriated by the officials responsible for its collection. After a year (1872 A. D.), the rupee introduced by Maharaja Gulab Singh which contained a nominal percentage of silver was withdrawn and replaced by a new rupee carrying a value of ten annas (62 naya paise) and containing an appropriate' percentage of pure silver.
1.206 Before the time of Ranbir Singh, the premises of Jamia Musjid were used as central market for sales and purchases of different commodities. The Maharaja built the famous
commercial centres of Maharaj Gunj and Maha. raj Bazar where all commercial transactions were in future to take place. Both these places sur. vive to this day and are the principal comme~-cial centres of Srinagar city. -
1.207 The silk industry which had been established in Kashmir during the regime of Mirza Haider was patronised by the Maharaja who took several measures for its stabilisation. Mulberry plants were imported from China and distributed among the zamindars. The cocoon rearers and silk reelers were given necessary trammg to ensure the productio_n of good co· coons and fine silk yarn.
1.208 The Maharaja also set up a factory on the southern bank of Dal Lake for the distillation of liquor from the locally grown grapes. As the - indigenous grapes were not of a superb quality, young saplings were imported from France and planted in an area of about 150 acres in the' vicinity of Chashma-Shahi. Two specially trained gardeners were also recruited from Persia for the plantation of grape trees of superior quality grown in Persia.
1.209 Ranbir ~ingh died in 1885 A. D. and was succeeded by his son Pratap -Singh who ruled the State from 1885 A. D. to 1925 A. D. He was designated as the Maharaja of Jammu and Kashmir and its Dependencies.
1.210 .Ranbir Singh had not acceded to the_ demand of the British to establish a British Residency in Srinagar and although Praiap Singh also resisted it, he finally gave in.
1.211 Pratap Singh's reign started with intri· gues against him in his own family. His brothers <:onspired with the British Government who sus· pected the Maharaja of being in league with Russia. In March 1889 A. D., he was made to issue a decree surrendering all his powers to the Council of Regency which was newly constituted and consisted of his two brothers, a sala~ied European officer and two local leaders. The decree was accepted by the Viceroy in the following words:-
ce Notwithstanding the ampie resoUrces of your State, your treasury was empty; corruption and disorder prevailed in every department and every office; 'Your Highness was still surrounded by low and unworthy favourites and the continued misgovernment of your State wa~ becom .. ing, everyday, a more serious source of anxiety."
1.212 In 1889 A. D., there was a complete financial breakdown and the State was practically bankrupt. The picture obtaining at that time has been clearly depicted by Sir Walter Lawrence in -his famolls book "The Valley of Kashmir". Sir Lawrence who was serving the State as Settlement Commissioner at th~t time was offered water chestnuts and oil~eeds in lieu of his salary and it was with great difficulty that _ he managed to get his dues in rupees. Heavy and unjust taxes were, therefore, imposed to augment the economic re90ur~s _of the Government. The campaign was carried to such a pitch that taxes were levied ~ven on the sale of horses and amounted to half the price at which the animal was disposed of. According to Sir Lawrence, when he started the settlement work, everything --ex_cept air and water was being taxed. The liability of paying the taxes was not confined to the rich and the industrial and commercial establishments only but ev.- manual labourers like the gravediggers had to part with a portion of their income to fill up the coffers of the. state.
1.213 _ The situation was _ aggravated by the visitation of a number of natural calamip.es. There was a severe earthquake in 1885 A. I?, cholera in 1888 A. D., 1892 A. D., 1900-1902 A. D., 1906.1907 A. D., and 1910 A. D~, and plague in Jammu in 1903-1904 A. D. Big fires broke out in the valley in 1892 and 1899 A. D. and heavy floods swept away the crops in 1893 and 1903 A. D.
1.214 An important achievement of the regime of Pratap Singh was the conducting of settlement ~perations of the valley of Kashmir by Sir Walter Lawrence. He had to work against great odds as the upper' class which surrounded the Maharaja resented the neW system and tried to
wreck it. The numerous natural calamities made the task of Sir Lawrence still more difficult but
,he faced all these boldly and completed the settlement in 1893 A. D. though it actually came into force in 1896 A. D. By 1912 A. D., there was hardly any tehsil or district which was not settled for the first time or in the revision. In accordance with . the proposals made by the Settlement Commissioner, the land revenue was assessed at 30% of the gross produce. Other important features of the Settlement Report are mentioned below:-
1. The State demand was fixed for 14 years.
2. Payment in kind was substituted by recoveries made in cash.
3. The' practice of employing force for
the collection of revenue was discontinued.
4. Forced labour, locally known as 'Begar', was abolished.
5. Occupancy rights were granted to zamindars in respect, of undisputed lands.
6. Lands in possession of privileged holders in excess of areas sanctioned in their favour were assessed at' ordinary rates.
7. Waste lands were entered as khalsa (lands under Government management) but preferential rights to acquire these were granted to the tenants.
8. Those who accepted the first assessment were granted permanent but non-alienable hereditary rights.
9. Arrears of land revenue amounting to Rs. 31 Iakhs were written off.
].215 During Pratap Singh's regime, Urdu was declared as the court language in place of Persian. The second largest college affiliated to Punjab University was opened for the first time in Srinagar in 1905 A. D. and named after the Maharaja. Two years later, another college known after the then Prince of Wales was established in Jammu. In addition, several high schools and a ~umber of primary schools were also set up in important towns and villages.
33
1.216 With a view to combating the epidemics. a number of hospitals and dispensaries were' established. Filtered water was supplied to the inhabitants of the cities of Srinagar and Jammu by pipl;ll.-
1.217 Further, to improve agricultural produce, swamps, were reclaimed, kuhls and streams etc. repaired and waste lands given to cultivators on fa~ourable terms. Sericulture was started both in Srinagar and Jammu by setting up large factories which not only helped to improve the State revenues but also provided employ- ' ment to thousands ,of people.
1.218 Communications also received equal attention. Besides the construction of several roads, such as the Jhelwn Valley road connecting Srinagar with Kohala via Baramulla and the Banihal Cart road linking up Srinagar with Jammu, the railway line was extended from Sialkot to Jammu. Srinagar and Jammu were connected by telephone and two electric plants, one to feed the city of Srinagar and the other for Jammu, were installed at Mohara and Jammu respectively.
1.219 It was during the regime of Pratap Singh that the first Municipal Act was promulgated in 1886 A. D. In 1905 A. D., a judge of the High Court was also appointed and the previous practice of assigning this work to a member of the State Council was discontinued. A Criminal Procedure Code was also introduced iIi Urdu under the name Ranbir Dand-bidhi.
. 1.220 These reforms. it must be conceded, were prompted by the advice or by urge of the British Resident.
l.221 Pratap Singh was an orthodox Hindu and did not, therefore, travel outside India. He discouraged litigation and settled, ill private, complicated civil cases with the aid of arbiters.
1.222 The economic condition of the people was pitiable during the regime of Pratap Singh. The famous writer Aldous Huxley has remarked in his book Jesting Pilate, "It is cheaper in

Kashmir to have a waggon pulled by half a dozen men than by a pair of oxen or horses". This was because neither Pratap Singh nor any of his Dogra predecessors possessed the imagination or the ability to build up new resources or to set up new industries or to open up the inaccessible areas. The result was that the people lived in abject poverty and were, as observed by Sir Albian Banerjee, being driven like dumb cattle.
1.223 Pratap Singh died in September 1925 and was succeeded by his nephew, Hari Singh whose name came into unwelcome prominence in the famous case, Robinson versus Midland Bank Ltd. During the first few years of his rule, he tried to popularise himself by granting audience to every common man on Thursdays. The practice was discontinued soon after and the Maharaja resumed the policies outlined by the previous Dogra rulers.
1.224 In 1931 A. D., trouble broke out in Srinagar city due to the alleged desecration of the Holy Quran by a police official. The Muslims got infuriated and held meetings in which the Government was condemned for its refusing to pUnish the miscreant. Some of the speakers were arrested and thrown into prison where they were tried in camera for various offences under Ranbir Penal Code. The people assembled outside the jail premises and refused to withdraw whereupon they were fired at and as many as thirteen of them shot dead. This incident took place on 13th July 1931 at Srinagar and was the beginning of the political upheaval in Kashmir. The corpses of those killed were taken to the Jamia Musjid from vihence they were transferred to the nearby shrine of Naqishband Saheb and laid to eternal rest. The day has since been named as Martyr's Day and is now observed as a public holiday every year.
1.225 During the following years, political consciousness grew more and more and allegations of misrule and discrimination were publicly made again6t the ruler and his Government. A Commission of Inquiry headed by
34
Sir B. J. Glancy was accordingly set up and in pursuance of the recommendations made by it, a number of grievances of the people were redressed. These included the restoration of religious institutions taken over by the Government, guarantees for adequate representation of all communities in Government services, reduction in the maximum period of imprisonment prescribed for cow-slaughter and grant of proprietary rights to cultivators in respect of lands under cultivation which though held by them in their possession for many generations, were owned under law by the GovernIl;lent, etc. etc.
1.226 These measures did not pacify the people who were encouraged by the freedom struggle going on in other parts of the country. They, therefore, launched, what is known as 'The Quit Kashmir Movement', demanding the ejection of Dogra rulers from Kashmir. It was after one full century that they realised that the British' Government had sold them off for a paltry consideration of seven and a half million rupees. Mahatama Gandhi himself observed on 5th August 1947 in l1is evening prayers held at Wah near Rawalpindi that "the Treaty of Amritsar was in reality a deed of sale".
1.227 Before 1939, there was no political organisation as such in the State and the people voiced their grievances and demands through communal bodies. The growing contacts and the association of the local leaders with the leading congressmen in India brought about a radical change in their outlook with the result that the Muslim Conference, the largest communal organisation, was dissolved and transformed into National Conference in which members of all communities and creeds could join and actively participate.
1.228 The Maharaja retaliated by resorting to all sorts of repressive measures. There was a great hue and cry and Pandit Nehru, then the Prime Minister of undivided India, decided to pay a personal visit to the State and to study the situation on spot. He was, however, arrested,
",t Domel, 96 miles to the north of Srinagar, whence he had to go back as he could not afford to absent himself from Delhi for long due to the impending partition of the Subcontinent.
1.229 There can, however, be no denying the fact that Maharaja· Hari Singh introduced several constitutional and administrative reforms in the State. Immediately after his accession, he reorganised the High Court and provided it with a Chief Justice and two Judges. The numbe~ of subordinate courts was also increased and the inconvenience experienced in the past by the litigant public was thus removed to a large extent.
1.230 The Maharaja also realised that in view of the growing number of democratic institutions in other parts of the country, it was no longer possible to defer indefinitely the association of the people with the administration of the State. Accordingly in 1934, he approved of t~e setting up of a Legislative Assembly, known as Praja Sabha. The Assembly was to consist of 75 members including as many as 15 nominated by the Government and COIlsisting of ministers, secretaries and Heads of Departments etc.
1.231 Further, the Maharaja also gave his assent to the introduction of a number of laws designed to reform the social life of the people. Some of these are listed below:-
1. Infant Marriages Prevention Act of 1985 (1928 A. D.)-By this Act, marriage of girls and boys below the age of 14 and 18 years respectively was prohibited and persons found guilty of contravening the law were made liable to undergo one year's imprisonment or a fine of Rs. 1,000/or both.
2. The Juvenile Smoking Act of 1986 (1929 A. D.) -Smoking by children under the age of 16 was declared as an offence under this law.
3. Hindu widows re-marriage and Property Act of 1989 (1932 A. D.)-The marriage of
3,1)
Hindu widows which was not permitteu by the orthodox sections of the community was legalised.
4. Suppression of Immoral Traffic Act of 1991 (1934 A, D.)-By this law, the setting up of brothels which was very common in various areas of Jammu province and in certain parts of Kashmir was prohibited.
5. The Buddhist Polyandrous Marriages Prohibition, Act of 1998 (1941 A. D.)-The Buddhists inhabiting the district of Ladakh indulged in polyandry for many centuries in the past. The law prohibited the marriage of a female to more than one male person at a time.
Tribal raids of 1947
),232 Shortly after, the two dominions of Bharat and Pakistan came into being. The political leaders were released from the jails and the cases pending against them were withdrawn. The Maharaja was left with no alternative but to sign a Provisional Instrument of Accession which envisaged, inter alia, that the people of the State would be given, in course of time, the option to accede to one of the two dominions. Meanwhile, the Pakistan army occupied parts of State territory in the north and north-w·est. The result was an armed conflict between the two dominions which lasted for several· months. A complaint was eventually lodged by the Government of India in the Security Council on whose intervention a Cease-Fire was declared and the two dominions retained the possession of the areas held by them. Later, the State Constituent Assembly ratified the accession of the State to India and declared it an irrevocable one.
The Constitution o£ JalDlDu aDd KashlDir
1.233 The Maharaja was subsequently deposed and his son Dr. Karan Singh succeeded him as the Regent. Later on, a Constitution of the State was drawn up by which the Regency was abolished and the Head of the State who was to be elected in future after eVery five years, was designated as the Sadar-i-Riyasat. The executive powers were vested in the Government

and the administration of justice was assigned to a High Court consisting of a Chief Justice and two Judges. Two Houses of Legislature, one comprising 75 members and known as Assembly and the other of 36 members and designated as the Council, were also set up. Each of these, unless dissolved earlier, is ~o continue for five years from the date of its first meeting.
1.234 For purposes of election, the State is to be divided into territorial constituencies in such a manner that the ratios between the population of each constituency and the number of seats allotted to it shall, so far as practicable, be the same throughout the State. In this context, the expression "population" represents the population as ascertained at the last preceding Census of which the relevant figures have been published.
Principal AchieveDlents of Po~t-independeace Period
1.235 During the post-independence period, the State has marched ahead in almost every direction and has made considerable progress when compared with the conditions obtaining before 1947. It has now a University of its own and maintains a large number of educational institutions of all grades, though the literacy percentage is still lowest when compared with other States in India. A net-work of roads has been built linking up not only the district and tehsil headquarters but also many other areas which
SECTION
were inaccessible in the past. Transport services have been introduced both by the Government and by private entrepreneurs and the primitive conveyances have been completely discarded in most of the areas. Two Air-ports, one at Srinagar and the other at Jammu, have also been built and regular air services operate
. between the two cities and Delhi, Amritsar and
other important places.
1.236 New electric generating stations are being installed at different places. Pending production of sufficient energy by exploitation of indigenous resources, electricity' is also being purchased in bulk from Punjab Govern:inent to feed the city of Jammu and other areas.
1.237 The number of hospitals, dispensaries, health centres .and health un~ts as also of unani and ayurvedic dispensaries has considerably increased. There is no denying the fact, however, that these institutions are fairly small in number when compared with the size of the population to be catered. Besides, most of these are designed for the treatment of out-patients only and are not equipped with arrangeinents for the admission of in-patients and surgical cases.
1.238 Above all, new industries are springing up and old ones, which had either disappeared or stagnated, have been rehabilitated 'and' renovated. Side by side, export trade is receiving equal attention. A large number of emporia have been set up in important cities, such as, Delhi, Calcutta, Bombay, Madras, Lucknow, etc.
2
INTRODUCTORY ~OTE ON THE CENSUS OF 1961
1.239 The 7th decennial
and Kashmir which is the
Census of Jammu
10th in its series
so far as India as a whole is concerned, was
conducted from 10th February 1961 to sunrise
of Ist March 1961 which was declared as the
zero hour of the reference day as announced
by the Government of India in the Ministry
of Home Affairs Notification No. 2/115/59-Pub-I
dated 5-12-1959. The enumeration period was
36
followed by a revisional rOllnd from 1st March to 3rd March 1961, subsequently extended to 5th March on account of the celebration of HoH festival which fell on the 2nd and 3rd March 1961.
1.240 The . concept of Census was, for the first time, introduced in Jammu and Kashmir in 1873 when a rough enumeration of the people inhabiting the various districts or parganas,

as they were then called, was carried out. This was not regarded as a Census at any time in' the accepted. sense of the word as' also observed by the Census Commissioner of 1891 in his Report, wherein he has remarked that "no previous census appears to have been taken, the enumeration of 1873 being far from reliable .. "
1.241 In 1881 also, no census was held in Jammu and Kashmir for reasons which are neither available from the records of the State Government nor cited in any contemporary chronicle. From 1891 onwards, decennial censuses were held regularly except in 1951 when on account. of abnormal conditions caused by the tribal raids of 1947. and the subsequent splitting up of the State into two sectors by what" is known as the Cease-Fire Line, the organising of a decennial census was not found feasible. The tribal raids brought in their wake a large number of territorial changes in the jurisdictions of the various administrative units, such as districts, tehsils and towns etc. Many residual parts of such of the districts and tehsils which fell on the other side of the Cease-Fire Line were merged with the contiguous districts and tehsils. This necesSitated the reconstitution of most . of the districts and tehsils which was still in progress when other States in India were busy taking the census.
1.242 Enumeration of the inhabitants of a locality may be conducted eitha' on a de jure or on defacto basis~ The former is designed to restrict the enumeration to only such persons who usually reside in the area; irrespective of whether they are present or away.. On the other hand, a defacto Census implies the counting of all persons native or alien who are found physically present in the local area at the time of enumeration. The Census of 1961 has, like its predecessors, been a defacto census and the data collected at it relates not only to the normal residents but all other persons who happened to be present at the place of enumeration during the period from 10 February 1961 to the. sunrise of Ist March 1961, provided they had not been enumerated elsewhere within this interval.
37
1.243 The. complexion and the scope of census has undergone a radical change during the last two decades. The tradition 'followed till 1941 of merely enumerating the population and classifying it by castes and communities and collecting meagre data on demographic and economic aspects has now been replaced by more comprehensive and detailed surveys in all such spheres which have a direct bearing on the life of the people. The modern census, therefore, needs an elaborate planning in advance to ensure that the questionnaire to be incorporated in each schedule is suitably drafted and is capable of eliciting the desired answers from the respondents concerned. Further, the various phases in which the operations would be conducted and the arrangements to be made for the training of the field staff and for strict observance of time schedule have also to be carefully conceived and chalked out before the actual field work is commenced.
1.244 It was because of these considerations that preliminary arrangements for the Census of 1961 were made in most of the States as far back as the beginning of the financial year 1959-60. The early appointment of the Census Superintendent afforded him a unique opportunity of equipping himself with necessary background of the work assigned to him and to acquaint himself with previous Census Reports and literature. That this was a. step in the right direction is amply borne out by the preparatory work carried out before the convening of the first Census Conference in September 19,'>9.
1.245 Two pretests, one in January 1959 and the other in July/August 1959, were, therefore, conducted in the various States. The first of these was designed to ascertain the changes, if any, required to be made in the draft questionnaire and the instructions for filling up the schedule. The second pretest was aimed to ensure whether the import of the instructions and the schedules was correctly followed by the field staff and whether they were capable of effectively implementing the same.
1~246 In Jammu and Kash.mir, however. the

Census office was established late in July 1959. What was more, the officer selected for appointment as Census Superintendent. was withdrawn by the State Government after about two months only and as this change was contemplated from the very time the officer had taken over, no action except the appointment of a few officials and arrangements for accommodation was taken to implement the various circulars and instructions received from the office of the Registrar General, India, in connection with the holding of either of the two pretests referred to above. No attempt was either made to trace out and collect the old records so much so that even a copy of the· latest Census Report was not available.
l.247 I took over as Census Superintendent at Si-inagar on 22nd September 1959 and participated in the First Census Conference held in Delhi on the following day. While, therefore, my colleagues from other States who had done considerable spade work during the pretests, gave a detailed account of the experience they had gained and sought guidance on various questions rela:ting to their respective States, I had nothing to report at the Conference about the work done in Jammu and Kashmir. I must, however, confess that my participation in the Conference helped me immensely in the execution of the decisions taken which were preceded by prolonged discussions.
Legal basis
1.248 It is necessary here to state that before 1950 CE'n5US was not a Central subject at least so far as Jammu and Kashmir State was concer. ned. Till then, the State Government used to make their own arrangements for conducting de. cennial censuses though all the operations includ. ing the tabulation of the data were carried out simultaneously along with other States and in accordance with the instructions received from the Census Commissioner of India.
1.249 The Census Act of India (Act No. XXXVII) which was enacted in 1948 excluded from its jurisdiction the State of Jammu and Kashmir. Two years later, this exception was delet-
sa
ed by an amendment of Section 2, vide Adaptation of Laws Order, 1950 and the Act was made appli. cable to the State of Jammu and Kashmir also. As stated earlier, however, the legislation remained on the statute only and could not, because of the prevalence of abnormal conditions, be implemented when the last Census was taken elsewhere in the country.
1.250 The Census Act vests in the Central Government the power to take Census and to appoint a Census Commissioner· for Ind~ and Superintendents of Census Operations for each of the States included in the Indian Union. ' The Act also empowers the State Governments to appoint Census Officers and to delegate the' power of appointing such officers.
1.251 Under the Census Act, every' person employed in connection with the execution of Census Operations is deemed to be ~ public servant within the meaning of Ranbir Penal Code of the State Government.
1.252 The Census Act further imposes a legal binding on every person of wh9m questions may be asked by a Census, Officer to answer the questions to the best . of his belief and knowledge except in respect of the names of female members etc. The Act· impos68 penalties on Census Officers who refuse or neglect to use reasonable diligence in performing the duties assigned to them or obeying the orders issued in accordance with the Census Act or the rules made thereunder. Likewise, according to the Act, Census Officers intentionally putting offensive or improper questions etc. make themselves liab1e to penal action. On the other hand, people who are found deliberately misleading the Census officials by giving false answers and/oe refusing to answee to the best of their knowledge and belief or persons refusing access to Census Officees in their premises foe the performance of Census Operations and persons removing, ob1iterating, altering, or damaging Census numbers, marks etc. are also liable to similar penalties.
1.253 These and other provisions in the Act give Ilecessary legal basis to the Census. As
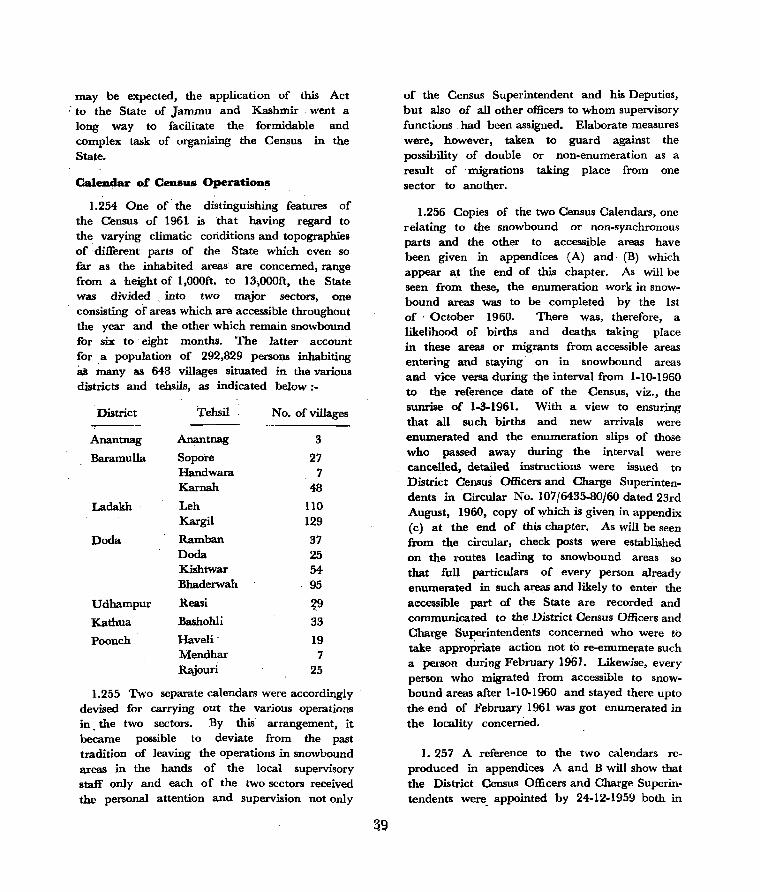
may be expected, the application of this Act ; to the State of Jammu and Kashmir, went a
long way to facilitate the formidable and complex task of urganising the Census in the State.
Calen~ar of Census Operations
1.254 One of the distinguishing features of the Census of 1961 is that having regard to the varying climatic coriditions and topographies of different parts of the State which even so far as the inhabited areas are concerned, range from a height of 1,000ft. to 13,OOOft, the State was divided into two major sectors, one consisting of areas which are accessible throughout the year and the other which remain snowbound for six to eight months. The latter account for ,a population of 292,829 persons inhabiting as tnany as 648 villages situated in the various districts and tehsils, as indicated below:-
District
Anantnag
Baramulla
Ladakh
Doda
Udhampur
Kathua
Poonch
Tehsil ----
Anantnag
Sopore Handwara Karnah
Leh Kargil
Ramban Doda Kishtwar Bhaderwah
Reasi
Bashohli
Haveli . Mendhar Rajouri
No. of villages
3
27 7
48
110 129
37 25 54 95
:(!,9
33
19 7
25
1.255 Two separate calendars were accordingly devised for carrying out the various operations in. the two sectors. By this arrangement, it became possible to deviate from the past tradition of leaving the operations in snowbound areas in the hands of the local supervisory staff' only and each of the two sectors received the personal attention and supervision not only
of the Census Superintendent and his Deputies, but also of all other officers to whom supervisory functions . had been assigned. Elaborate measures were, however, taken to guard against the possibility of double or non-enumeration as a result of ' migrations taking place from one sector to another.
1.256 Copies of the two Census Calendars, one relating to the snowbound or non-synchronous parts and the other to accessible areas have been given in appendices (A) and (B) which appear at the end of this chapter. As will be seen from these, the enumeration work in snowbound areas was to be completed by the 1st of . October 1960. There was, therefore, a likelihood of births and deaths taking place in these areas or migrants from accessible areas entering and staying on in snowbound areas and vice versa during the interval from 1-10-1960 to the reference date of the Census, viz., the sunrise of 1-3-1961. With a view to ensuring that all such births and new arrivals were enumerated and the enumeration slips of those who passed away during the interval were cancelled, detailed instructions were issued to District Census Officers and Charge Superintendents in Circular No. 107/6435-80/60 dated 23rd August, 1960, copy of which is given in appendix (c) at the end of this chapter. As will be seen from the circular, check posts were established on the routes leading to snowbound areas so that full particu.,lars of every person alread y
enumerated in such areas and likely to enter the aecessible part of the State are recorded and communicated to the District Census Officers and Charge Superintendents concerned who were to take appropriate action not to re-enumerate such a person during February ]96]. Likewise, every person who migrated from accessible to snowbound areas after 1-10-1960 and stayed there upto the end of February 1961 was got enumerated in the locality concerned.
1.257 A reference to the two calendars reproduced in appendices A and B will show that the District Census Officers and Charge Superintendents were_ appointed by 24-12-1959 both in

the snowbound and accessible areas. Further in both sectors, code numbers were assigned.to dis. tricts and tehsils by 23·1-1960 and to the· cities
and towns by 15·2·1960.
1.258 As the various operations relating to snowbound areas had to be completed before the closure of passes in October 1960, these were given precedence and carried out ahead of the time· schedule prescribed for similar operations in accessible areas. Accordingly, the allotment of code numbers to the villages was completed by lst March 1960 and the selection and appoint. ment of enumerators and supervisors was finalised in consultation with District Census Officers and Charge Superintendents before 1.4-1960. Side by side, the circles and blocks to be placed in charge of supervisors and enumerators were also de· marcated to eliminate the possibility of jurisdictio. nal overlappings. This was followed by the distribution of instructions in Urdu for filling up Houselists. Meetings were organised during May 1960 at district and tehsil headquarters as also in towns and . centrally located villages for the training of Census staff for house-numbering and house-listing operations. During the training, theoretical instructions and practical demonstrations were given on the numbering of houses and for incorporating the particulars of each structure in the Houselist Form. House-numbering which was taken up first and was followed by house-listing was completed in two stages. The house-numberer was required to record the number with a piece of chalk on the entrance of every building in 'his block. When t'he numbers thus asslgned were checked and declared correct, permanent numbers were painted on the dool' or the front wall of the house 01' at a prominent place.
1.259 The house-numbering operation was carried out in the first fortnight of June 1960. During the next ten days, Houselist Forms were distributed and by 15t'h July, the houselists had been filled up in all the snowbound areas.
1.260 As stated earlier, no pretests could be organised in the State due to the delay caused
.0
in setting up of the Census office. It was, therefore, deemed necessary that the actual enumeration and filling up of the various schedules should be preceded by sample operations both in the snowbound and accessible areas. For this purpose, Individual Slips and House. hold Schedules which were to be used for sample enumeration were printed in red by the office of the Registrar General so as to distinguish them from those meant for actual census which were printed in black. As the Houselists were printed in black only, some of these were stamped by this office in red with the word 'Sample' and made use of for preliminary tests.
1.261. Instructions in Urdu and English for filling up Individual Slips and Household Schedules were distributed immediately after. These were discussed at lengfu with the District Census Officers and Charge Superintendent' in the first instance and their ~plications brought home to them. The enumerators and supervisors were then summoned to central places in their respective temils and given theoretical and practical training for filling up the forms. They were taken to an adjoining village where the sample slips and schedules were got filled by them. This was followed by the distri\)\~tion of the requisite number of pads of Individual Slips and Household Schedules which was arrived at on the basis of the population returned through houselists.
1.262 The actual enumeration and filling up of Household Schedules was started on 10th September 1960 and completed by the end of the same month. From Ist October to 3rd October 1960, the enumeration agency made a revisionsl round and brought the records uptodate by cancelling the slip' of those who had passed away after the enumeration and by filling up slips in respect of others who were born or had arrived in the snowbound areas during the interval between the date of enumeration and 1st October. On 30th October 1960, the District Census Officers reported the provisional totals to the Superintendent. Census Operations and Registrar General and simultane-
~usly despatched the Individual Slips and.liousehold Schedules to the Census office at Srinagar.
1.263 In so far as the accessible areas are concerned, code numbering of villages was completed by 10th May 1960 followed by the appointment of supervisors and" enumerators and" the delimitation of their respective circles and blocks which was finalised by 15th June. For other operations, the order of precedence was the same as in the case of snowbound
" areas, except that the dates on which these were carried out were different. The houselisting work in Kashmir province had, however, to be postponed by 10 days due to an unexpected outbreak of cholera in an epidemic form in the second" fortnight of November 1960.
1.264 The provisional totals were reported by the District Census Officers telegraphically to Census Superintendent and" Registrar General by 10th March 1961. Some delay was, however, caused by one or two army installations which did not report the figures of non-combatants in time. The totals were, however, released to the press in a Conference held at Srinagar on 13th March 1961 and were simultaneously announced from the two stations of All India Radio at Jammu and Srinagar and published in all local papers.
1.265 An important innovation of the 1961 Census, so far as Jammu and Kashmir is concerned, was the introduction of a postenumeration check to determine the extent of error in the Census count. This was carried out from 15th April 1961 to 30th April 1961 and was applied to selected blocks and houses in accordance with an elaborate scheme evolved by the office of the Registrar General. The results of this check have been discussed in brief in a subsequent paragraph.
1.266 In pursuance of the decisions taken ill the Census Conference of 1959, instructions were issued to all enumerators for the preparation of notional maps of their respective blocks indicating - the boundaries of the block, the location of the houseS, roads, offices, electric stations,
schools and dispensaries etc. It appears from the previous Census Reports that the preparation of such maps was never attempted in the past.
GeDeraJ V.Uage aad Town Repliter
1.267 As no census was held in the State in 195 I and beeause further, the ~eeords relating to the 1941 Census ~d either been destroyed during the tribal raids or got misplaced or had become obsolete on account of numerous jurisdictional changes, we had to start with a clean
"slate in so far as the preparation of census registers is concemed. Instructions for the preparation of the General Village and Town Register were accordingly issued in March, 1960, vide this office circular letter No. Cen/113J2349-57/60 dated 24-3-1960. The register contains information regarding the number of zones into which the rural and urban sectors of each tehsil were divided for purposes of Census, the names of inhabited and uninhabited villages or mohallas and hamlets together with the number of houses in each. It also listed the names of enumerators and supervisors in charge of various blocks and circles. Further, a remarks column was provided for recording such pertinent information" as may not have been covered by the entries made in other columns. The registers were subsequently inspected on spot and, wherever necessary, got completed.
1.268 One of the pre-requisites to ensure full coverage and to eliminate the possibility of double or non-enumeration is the comprehensiveness of a block division. In the plain areas, where the" dwellings consist of massive clusters which may be shapeless, linear or rectangulal-, the constitution ,of" a block is comparatively easy. On the other hand, where villages are formed of isolated homesteads built 011 small cultivable holdings on the hill slopc;S, the delimitation of a comprehensive block divi~iol1
involves a careful survey of the whole area .. While this is mostly true of the regiom; included in the snowbound areas, there are instances in which villages of this pattern are also found in the accessible parts of the State. For instance, there are several villages in Doda district whose

habitations are dispersed on . two mountain slopes which are separated other by the National Highway and and streams bordering the road.
or more from each the. rivers
1.269 Nevertheless, as stated above, the blocks were carved out with well-defined boundaries, such as roads, streams, canals, rivers, lakes and mountains, which left no room for any over-lappings or exclusion of an area. As a result, no instances of discrepancy of jurisdiction came to notice.
UDiDhabited Villages
1.270 An uninhabited. village was defined as a village which did not contain any habitations at all at the time of Census.
1.271 There has not been any material change in the· number of uninhabited villages during 1941-1961 but a large number of villages which were· well inhabited till 1947 were completely depopulated consequent upon the migration of their populations to West Pakistan and to the State territory on the other side of the Cease-fire Line. Thus, while the number of uninhabited villages in Jammu district was only thirteen both in 1941 and 1961, as many as 155 inhabited villages were c,?mpletely
District Area transferred from other districts
deserted as a .result of mass migrations. In Kathua district also, the number of uninhabited villages has risen from 7 of 1941 to 43 in 1961. The latter include, among . others, 31 depopulated villages. Baramulla is the only other district in which there has been a significant increase in the number of uninhabited villages. This is mainly due to the inclusion of residual parts of Muzaffarabad district Which being on this· side of the Cease-fire Line ·were merged with Baramulla district.
Inter-district tr_sfer of Territorial Uults
1.272 As may be expected, the splitting up of the State by the Cease-fire Line necessitated the
. realignment of all the districts which are now bordered by the said line. In addition, with the implementation of the Five Year Plans, the reconstitution of the old and the carving out of new districts became necessary for the i expeditious execution of various projects and for ad~inistrative convenience.
1.273 Except for the district of Kathua, which has not suffered any jurisdictional change, there is no district in the State which was not realigned during the inter-census period. The following statement indicates the transfers made from one district to another:-
Area transferred to other districts
Anantnag 1. 13 villages of Ramban tehsil of Udham- 1. pur district.
Srinagar tehsil (Khas) (except 14 villages) transferred to newly formed Srinagar district.
Srinagar
Baramulla
2. 7 villages of Reasi tehsil of Reasi district. 2.
1. Srinagar tehsil (Khas)(except 14 villages) transferred from Anantnag district.
2. Badgam tehsil (except 6. :villages) transferred from Baramulla district.
3. 12 villages transferred from Baramulla tehsil of Baramulla district.
1. 104 whole villages, 2 part villages and 1 town transferred from Uri tehsil of Muzaffarabad district.
2. 40 whole villages and 8 part villages transferred from Karnah tehsil of Muzaffarabad district.
3. 14 villages transferred from Anantnag district.
42
1.
2.
14 villages of Srinagar tehsil transfered to Baramulla district.
Badgam tehsil. (except 6 ferred to Srinagar district.
villages) trans-
12 villages of Baramulla tehsil of Baramulla district transferred to Srinagar district.
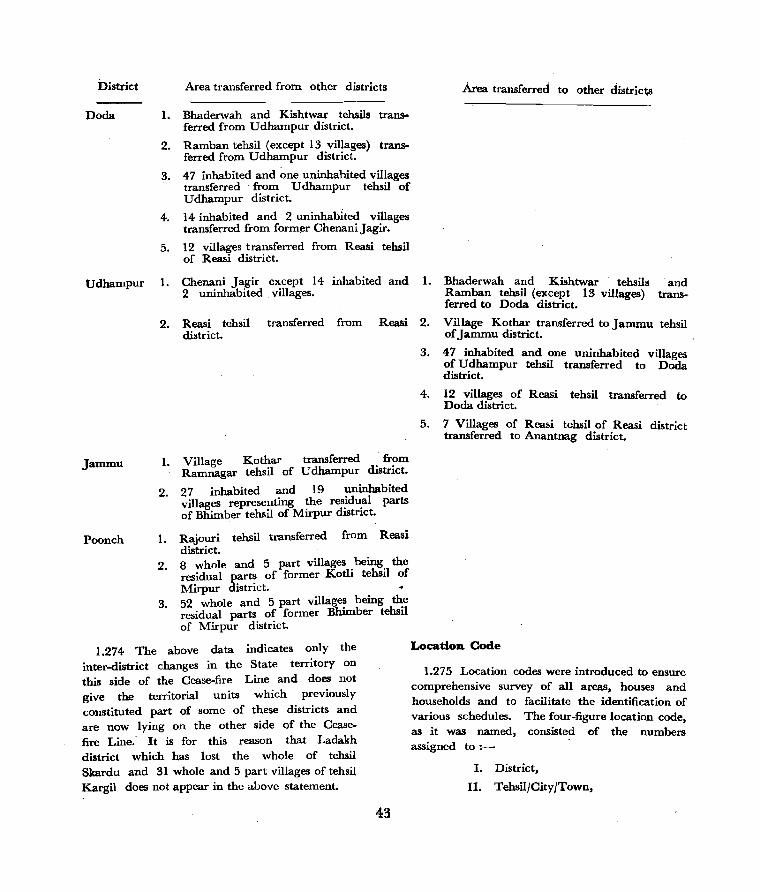
District
Doda
Udhampur
Area transferred from other districts
1. Bhaderwah and Kishtwar tehsils trans. ferred from Udhampur district.
2. Ramban tehsil (except 13 villages) tranSferred from U dhampur district.
3.
4.
5.
47 inhabited and one uninhabited villages transferred from U dhampur tehsil of U dhampur district.
14 inhabited and 2 uninhabited villages transferred from former Chenani Jagir.
12 villages transferred from Reasi tehsil of Reasi district.
1. Chenani . J agir except 14 inhabited and 2 uninhabited villages.
Area transferred to other districts
1. Bhaderwah and Kishtwar tehsils and Ramban tehsil (except 13 villages) transferred to Doda district.
2. Reasi tehsil district.
transferred from Reasi 2. Village Kothar transferred to Jammu tehsil of Jammu district.
Jammu
Poonch
1. Village Kothar transferred from Ramnagar tehsil of U dhampur district.
2. 27 inhabited and 19 uninhabited villages representing ~he res.idu.al parts of Bhimber tehsil of Mrrpur dlStnct.
1.
2.
3.
Rajouri tehsil transferred from Reasi district. 8 whole and 5 part villages . being. the residual parts of former Koth tehsil of Mirpur district. 52 whole and 5 part village~ being tb:e residual parts of former Bhunber tehsll of Mirpur district.
1.274 The above data indicates only the inter-district changes in the State territory on this side of the Cease-fire Line and does not give the territorial units which previously constituted part of some of these districts and are now lying on the other side of the Ceasefire Line. It is for this reason that Ladakh district which has lost the whole of tehsil Skardu and 31 whole and 5 part villages of tehsil Kargil does not appear in the above statement.
43
3. 47 inhabited and one uninhabited villages of Udhampur tehsil transferred to Doda district.
4. 12 villages of Reasi tehsil transferred to Doda district.
5. 7 Villages of Reasi tehsil of Reasi district transferred to Anantnag district.
Location. Code
1.275 Location codes were introduced to ensure comprehensive survey of all areas, houses and households and to facilitate the identification of various schedules. The four-figure location code, as it was named, consisted of the numbers assigned to:-
I. District,
II. Tehsil/City/Town,
III. WardjMohallajVaiage, and IV. HousehoI9.,
1.276 Some of these four elements, were sub-divided so as to indicate the number of the blocks into which a village had been split up and of the Census Houses comprising a building or structure. The code numbers of districts, tehsils, villages and census houses were rec(uded in Arabic numerals and those of towns and cities in Roman letters. Blocks were identified by suffixing an alphabet to the village code number. Similarly, each census household in a building or a census house was also assigned an alphabet suffixed after the number of the building or the census house, as the case may have been. The elements were kept separate from ,each other by drawing an ,oblique line between e~ery two elements except before the first and the last.
1.277 In allotting code numbers to the districts, it was not found feasible to follow strictly the order of their geographical location. If the numbering had been commenced from north-west corner of the State map, we should have had to start with Baramulla or Ladakh, which would not have. been in- conformity with the procedure followed at the previous Censuses. Even at the Census of 1941, the numbering of districts had been done in a haphazard manner without regard either to their geographical location in the State as a whole or in any of its regions. In the circumstances, the numbering was done according to the geographical location of the districts falling ill each of the two pr.ovinces, Kashmir and Jammu, and in this way, a compromise was struck between the order followed in 1941 and the prescribed procedure of numbering the districts from the north-west corner of the State.
1.278 In the case of tebsils, no difficulty 'was experienced in allotting numbers according to their geographical location in the district,
. the' first number being given to the tehsil in the north-west and the last to the one in the south-east of the district. The same procedure was ,also followed in respect of Urban areas.
44
1.279 Appendix D given at the end of this chapter shows the location code numbers assigned to the various distriCts and their respective constituent tehsils and towns.
Urball Areas
1.280 The following three tests were prescribed by the Registrar General, India, for the determination of an urban area for the Census of 1961, it being emphasized that an area proposed to be declal'ed urban should satisfy all ,the three tests with reference to the Census figures of 1951 -
1. An area/village whose popUlation is not below 5,000,
2. An area{village whose three-fourth population consists of non-agriculturists, and
3. An area which has a density of not less than 1,000 persons per square mile.
1.281 It was, however, agreed upon that all corporations, municipalities and cantonment boards should, irrespective of their population and characteristics, be treated as towns. Exceptional cases like an area inhabited by a popUlation of less than 5,006, which possessed definite urban characteristics and amenities, could also be classed as towns with the approval of the Registrar General.
1.282 There were nevertheless a number of areas which, though satisfying all or . most '"Of the tests prescribed by the Registrar' General, could not be declared urban for reasons set out at length in Chapter III of this Report. Among thtse, mention may be made of Tral, a village' of Pulwama tehsil, district Anantnag, which was found to have a population of 5,069 of whom over 75% are non-agricultul'ists. The village also satisfied the criterion of density as its entire population is concentrated in a total area of 3.39 square miles. The State Government were; however, averse to the proposal to declare the village an urban area due to difficulties' envisaged in implementing the developmental projects.

. , Ward No', 7,
\ ./
REHAR.
\ tCOLONE~./
• I
\
Nat'ional Map Of
JAMMU CIT·Y CITY 80UMDARY. _._. _
.".0 80UMO"R., , ,_'_, _ '
__ t: .
,.
1.283 Another controversial area Was the towrl of Bandipur which had already been declared a town area by the State Government. No Town Area Committee to administer the locality had, however, been set up due to differences anlOng the inhabitants of the three villages of which the. town was constituted. The Ministry of Local Self Government with whom the matter was taken up, agreed after some correspondence to the classification of the area as a town.
1.284 In one case, at ,least, difficulty was experienced regarding its classification as a rural or urban area. This was Gurha Chhabilian, a village which, as can be seen from the enclosed map, is bordered on one side by Jammu city and on the other by Jammu tehsil. The village was disowned both by the Administrator of Jammu Municipality as also by the Charge Superintendent (Tehsildar) of Jammu tehsil. On scrutinising the old records of Jammu municipality, however, it was found that the village had, during the inter-census period, been merged with the city and no longer formed part of Jammu tehsil. The Government Notification showing the merger of the village with the city could not, however, be traced.
Q.uaUty of Census Agency
1.285 The organisation set up for conducting the' various operations connected with the Census was drawn almost exclusively from the administrative departments of the State Government. The house-numberers and houselisters who later functioned as enumerators also consisted mainly of school teachers, patwaris, foresters,' medical compounders etc. Unlike 1941, the powers of appointing the enumerating agency were not centralised in the Census Superintendent and were instead delegated under Section 4(3) of' the Census Act of India, 1948 to the District Census Officers. The Census Superintendent and his Deputies, however, actively participated in selecting the field staff in collaboration with the District and Tehsil Officers of various administrative departments. While every care was taken to pick up the right type of personnel, it was found that the quality of work of sOJite of
them was below average. The patwaris and. other officials of the Revenue Departm~nt discharged their duties admirably. :Most: of the school teachers were also enthusiastic about their new assignments but some of the village level workers were either intellectually incapable of doing full justice to their jobs or treated these with indifference.
1.286 As the large majority of the field stafi' consisted of persons below the age of 35, none of .them had participated even in the latest Census held in 1941.· In other states, experi. enced persons who had worked in the 1951 Census were available and most of them were rec. ruited to .build up the organisation required for the Census of 1961. In the circumstances, census was an. altogether new concept not only for the house-numberers, houselisters, enumerators and supervisors of the State but even for Charge Superintendents and some of the District Officers. The few who had heard of census were cohtent with the notion that it related to the enumeration of persons following different religions, their sex-wise composition, age and marital status etc. None including those who constitute the intelligentia had any conception of the vast scope of the modern census. Naturally, therefore, it was an uphill task to bring home to every fieicf worker the aims and objects of the present census and the implications of the questions listed in the various schedules. The organisation of training camps to which a reference has been already made in a preceding paragraph, however, facilitated this work considerably. The modus operandi of the various operations were discussed at length with almost every member of the staff whose ability to work was furthel' tested in the field on more than one occasion. Attendance at these camps was quite good ·in urban and centrally located rural areas. In far-flung areas, however, due to the difficulty vf topography, .distance and climatic conditions, the attendance was sometimes thin. In such cases, subsidiary camps had to be established and the absentees . were got trained by the supervisory staff. White on the whole the training programnle proved quite . successful.

the quality of work of such of the staff which could not attend the camps and had to be trained subsequently was not found good.
Mistakes m.ade during the Training Classes and Sam.ple Training Census
1.287 Some of the concepts which the trainees could not easily grasp and as a result of which mistakes were committed during training classes and sample training census are listed below;-
1. The procedure of assigning building number was not correctly followed by some of the trainees although it was emphasized that all structures within an enclosed or. open compound belonging to one person should be allotted only one.building number. The trainees, however, assigned this number even to such other buildings of the owner which, though situated in the same census block, could be reached by going round a village road or a lane. ~hey were advised that such buildings were to he assigned a separate number and not the one allotted to the main building.
2. There are many houses in the rural areas of Kashmir with a large square or rectangular hole constructed in a cornel' of the s~cond floor through which the first floor can be reached. This is a climatic necessity as, due to heavy
. snowfalls in winter, people prefer to move about from one floor to another through internal entrances only. The trainees, however, did not take note of these entrances and treated the two parts of the same building 'as two separate census houses. They were made to understand that as the ~wo floors were inter-. connected intefllally, they constituted one census house only.
3. In reply to question 4(a) , birth place, many people, particularly displaced persons, declared one of the areas of the State territory now on the other side of the Cease-fire Line as their place of birth. The trainees were doubtful as whether such persons should be categorised with those born in other districts of the State or with migrants from other States in India. As a r~sult, the entry against this
4G
question was left blank. They were, however, advised that all such areas were to be treated as parts of State territory and that in each case the name of the district on the other side of the Cease-fire Line followed by the words "Jammu and Kashmir" should be recorded.
Another common error committed in replying this question was that instead of writing the letter D in respect of persons born elsewhere in the district of enumeration, the trainees noted the actual name of the place of birth and omitted to mention the district concerned. They were instructed to write letter D only if the _person enumerated belonged to the same district in which the place of enumeration is situated.
4. In some cases, it was noticed that the class of work referred to in question 11 (c) had been confused with the reply to question 10 (c). This mistake was committed even by intelligent enumerators. The difference between the two questions was brought home to them during the course of training.
5. The words "other than" appearing in question 11 of the Enumeration Slip also caused misunderstanding. The enumerators misconstrued these words to mean that the question related to persons who did not at all work. i~
any of the three activities mentioned in questions 8, 9 or 10. They were made to understand that the question also related to persons who besides being engaged in cultivation or working as agricultural~ labourers or working at household industry, did some other .work in addition.
6. Some of the enumerators recorded the words "wage earner" or "employee" against question ID(c) in respect of members of a household working .in a household industry~ It was pointed out to them that an employee was a person who worked in a household industry of some other households and not in the one which was being run by his own family.
7. The definition of a household industry in rural areas also caused some confusion. Some
of the trainees appeared averse to classify as a household industry a small scale rural industry whi,ch was being run elsewhere in the village area but not in the premises of the household which owned it. The discrepancy was set right and the trainees were told that the condition that the household industry should be run within the premises of the household was applicable to urban areas only.
8. The blank column provided in the Household Schedule betweeen the two columns "Nature of Industry" and" Number of months in the year during which conducted" caused considerable confusion. It was made clear to the enumerators that the column was meant for recording the code number of industry and was not to be filled up by them.
9. A common mistake in filling up section 'C' of the Household Industry. was that some of the enumerators recorded against item 3, viz., 'both in household cultivation and household industry' the sum total of first two categories, namely 'household cultivation only' and 'househoid industry only'. The enumerators were told that the three categories are quite. independent of each other and represent three diffe~ent
classes of households.
Q.uality or Houselists
1.288 The quality of Houselists and Block Maps also varied from area to area and even In the same locality depending on the amount of interest taken by the Houselister in his work. It will be, therefore, futile to suggest that the lists in question were always of the desired standard or free from errors and mistakes. Some of the mistakes which were committed by many houselisters are enumerated below:-
I. In tehsil. Leh where wood is very scarce,. only two wooden planks are spread over the walls as a measure of economy and the intervening gaps between them are covered with tender twigs· of poplar trees. The holes and crevices are then filled up 'with mud or stone metal after which the entire surface is plastered with thick mud coating. Roofs of
047
almost the same pattern are also found in the upper regions of Bhaderwah tehsil. In both cases, however, the enumerato.rs were content by recording mud or clay as the material used in the construction of roofs. The matter was, however, referred to the District Officers and the mistakes got corrected.
2. Some of the flouselisters 'of tehsil Karnah, district Baramulla and tehsil Leh of district Ladakh had noted the code numbers of districts in the column for tehsils and vice vcrsa.'
3. In many tehsils, particularly Baramulla, Uri, Ramnagar and Bashohli, only one copy
'of the Houselists had been prepared although instructions had been repeatedly issued both during the training and through circular letters for the preparation of two sets of Houselists.
4. In a few cases, it was noticed that the houselisters had recorded the number of the households in column 3 instead of column II.
5. Full description of the purpose for which a Census house was being used was not invaiiably recorded in column 4 of the Houselist. Generic expressions like a shop etc. were. only mentioned. Likewise, the type of fuel used was not clearly stated in column 8 of the list.
6. Columns 11 to 17 of _ the Houselist Form were to be filled only for Census houses used as dwellings. Some enumerators filled in these columns even when the Census house was used as a shop or establishment only.
7. The HouseHst Abstract was not filled up with adequate care and there were instances in which the number of Census households givcn in the Abstract did not tally with the actual number recorded in the list.
8. The above discrepancies were . mostly set right by correspondence with the District Officers and Charge Superintendents concerned. There was, however, one case in which it became necessary to conduct verification on spot, This happened in Baramulla town where the houselisting work of two mohallas had been assigned to one person only. The hou~elister had
given continuous serial buildings in both the difficult to compile the unit separately.
numbers to all the mohaJIas making it
data' relating to each
Q._lity of Block Maps
1.289 Each Hou'selist was to be accompanied by a map of tbe block showing its boundaries, location of houses and important places like dispensary, school, electric station, temples, mosques, rivers, canals, roads etc. etc. Many houselisters had taken considerable pains to prepare a vivid notional map of the block. The Registrar General, while on a tour of the State, inspected some of these maps at Katra in Udhampur district and Jammu city. He was immensely pleased to note that the houselisters had depicted. the minutest details in the maps. Some of the houselisters had, however, prepared only one copy of the map and not two, as was directed and there were a few others who omitted to prepare any map at all.
Q.uality of Household ~chedules
1.29U The quality of Household Schedules which were prepared by Revenue officials, such as Girdawars, Patwaris etc. was definitely superior to those filled up by other enumerators. They were naturally in a better position to fill up' sub-part A of the Schedule relating to cultivation. The lists of local names of the right on cultivated land owned or held from Government or taken from private persons or institutions as also of the land given to others for cultivation purposes were obtained by this office in advance from the Provincial Commissioners of Revenue and distributed among the enumerators. Some of the enumerators, however, confused the two categories A-I (i) and A-I (ii) am! did not record the local name of the right on the land in the appropriate place provided for the purpose. Mistakes were also committed in distinguishing between the land held from Government under grant, lease etc. with rights of permanent and heritable possession but with or without the right of transfer.
1.291 In certain cases, it was found that
46
the land cultivated by the household included areas which were situated far away from the normal residence of the household and which
-could not even be supervised by any member of the household from day to day. Since, however, a note had been appended to the schedule indicating the names of the villages and tehsiJs in which the various plots of land were situated, there was no difficulty in deducting such areas from A-I (i) and' A-I (ii) as the case may have been.
1.292 During. the emphasized that the should be invariably only. Some of the
training camps, it was area of land cultivated
recorded in kanals or acres enumerators in Kashmir
had, however, given the area in local measures, viz., traks and khars and these had to be converted into kanals and acres i~. the Tabulation Office (A trak represents 2 kanals of land. and 16 traks or 32 kanals make a khar).
De:liDidoD of Houaehold Indll.try
1.293 As already stated earlier; the definition of household industry presented. some difficulty even during the training stage. This hapPened particularly in case of rural areas where an industry was being run by a household at a fairly long dis~nce from the residence.. but within the village area. The enumerators could not decide whether a blacksmithy which was being run in a shop of the village by the head of a household of the same village a~sisted by the members of his family and I or paid apprentices should be categorised as a household industry or a manufacturing concern other than a household industry.
1.294 The scrutiny of 20% household schedules has revealed that there are in all 77 household industries which provide employment to 24,565 households in the State as a whole. In addition, the total number of households which are engaged both in cultivation and household industry is estimated in the neighbourh(Jod of 101,830. It is not, however. possible to classify the household industri~s by their importance as, due to climatic and geographical variations, different
to
household industries have thrived in different regions and districts. Thus, patch work embroidery, for" instance, in which 3,355 housilholds approximately are employed in the entire State is mostly concentrated in Srinagar district where the number of households engaged in this industry is "estimated at 3,220. Similarly, more than 50% households which make t~eir living by producing traditional garments 'have been returned from Srinagar district. On the other hand, against the total number of 425 households engaged in cotton clQth weaving on handlooms in the State as a whole, as many as 225 households belong to Jammu district.
Entries to be made in sub-part-C of the Household Schedule.
1.295 The -scrutiny of household schedules showed that the enumerators had correctly fined up the entries against items" 1 and 2 in Part-C of the schedule relating to members of _ the family and hired workers engaged in household
,cultivation only and household industry only. It was, however, found that although during the training stage the enumerators had been alerted that households engaged in both cultivation and household industry constituted a separate category and did not represent the aggregate number of those engaged in cultivation only and household industry only, some of them had summed up the figures recorded against items 1 and 2 and incorporated the same against item No.3. In order to ascertain the incid~ce of this mistake, random samples consisting of 30 schedules per district or 270 in all were picked up and examined. The scrutiny disclosed that there were only two schedules or less than 1 % in which the enumerators had confu~ed households engaged both in cultivation and household industI-y with those working in household cultivation only and household industry only.
Consecutiveness and comprehensiveness of Q.uestions in the Individual ~lip.,
1.296 The Individual Slip contained ill all thirteen questions on social, demographic and
49
economic aspects. The questions were translated into the regional language and were easily comprehensible. Except for question 13, Sex, all the questions had been listed in their natural order. In my opinion, this question should have preceded the one relating to marital status and should have' been listed as question No.3. It looks rather anamolous to ascertain the sex after the respondent has replied all social, demographic and economic questions. Being the last question, it was printed in the extreme right hand corner at the bottom of the slip where very little space for recording the reply was available.
1.297 In the case of some of the questions, geometric diagrams, such as, rectangles, circles, triangles and parallelograms, were _ provided in the enumeration slip for recording the re}?lies. This facilitated the work of the enumerator considerably and reduced the chances of his committing mistakes. For instance, every enumerator had committed it to memory that the reply to question 4(b) "which was to be recorded in a circle was R or U. Similarly, it was widely known among the enumerators that the inverse triangle was meant for the class of worker engaged in an activity other than those referred to in questions 8 to 10.
1.298 Nevertheless, the use of common expressions in two different questions caused a certain amount of ambiguity. Questions IO(a)
and 11 (a) both related to 'Nature of work'. Since, however, the former applied to persons worklng in household industry and the latter to those who were doing work other than the one referred to in questions 8, 9 or 10, the enumerators did not record against question 11 (a) the nature of work of persons who besides being engaged in any of these activities did some additional work also. Similarly, it was found difficult to differentiate between a family worker who was doing his work in his own family without recelvmg wages or salary in cash or kind (question 11 (c» and a member of the family engaged in his household industry. These ambiguities" could perhaps be removed if
in question 11 "doing work other than 8, 9 or 10", the words "besides or" could be inserted after the word 'work' arid before the word ·other'. In that event, the question would read 'doing work besides or other than 8, 9 or 10' •. Further, if question l1(a) 'Nature of work' is replaced by 'assignment held'. the possibility of its confusion with question 10 (a) would be removed.
1.299 The difficulty in recording precise and appropriate answers to parts (a) and (b) of questions 10 and 11 would be eliminated to a large extent if it is explained in the instruc_ tions that part (a) relates to the respondent's occupation and that part (b) is :meant for noting the sector of industry in which he may be- working.
1..300 Incomplete or incorrect replies were generally returned to the following questions:-
1. It was made clear to the enumerators that Scheduled Castes could belong to Hindu and Sikh communities only. The list of the thirteen castes which have been declared scheduled under the constitution was also supplied to them. Some of the . .enumerators, however, while enumerating persons belonging to castes, such as Watal, Chamar, Julaha and Chura, which are common among Hindus, Sikhs, Muslims and Christians, recorded Scheduled Caste Watal, Scheduled Caste Chamar etc. against question 5 (c), even though the entry made against· question 5(b) was Muslim or Christian.
2. In some Individual Slips, no entry had been made against question 7 (a), Mother-tongue. The omission was made up by a reference to the relevant entries against this question in the slips of other members of the same household. Where, however, the household consisted of one member only, the predominant language of the area was adopted as the mother-tongue of the person concerned.
3. I t is a known fact that persons running ·industrial or commercial establishments dispense
50
with the recruitment of outsiders to the extent the deficiency in manpower can be met from their own family members. Even so, it would be wrong to assume that every member of the family, regardless of age and sex, would be working in such establishments. The enumerators, however, recorded the occupation of the head of the household against questions 8, 9 and 10 on the slips of all the members of the family under the impression that the occupation of the head of the family was to be regarded as the occupation of every member who was dependent on him.
1.301 The Houselist, Household Schedule and Facsimile of Individual Slip with their translation in Urdu have been reproduced at the end of this chapter along with the English version of instructions and their Urdu tranSlations indicating how the various schedules were to be filled up.
1.302 It may be remarked here that while every effort was made to ensure that the various concepts and instructions are faithfully reproduced in their Urdu renderings, it became necessary to deviate here and there from the literal translation of the original te*t. The English version, for instance, did not make any mention of the programme of operations in the snowbound and inaccessible areas. .. With·· a view, therefore, to dispensiIig with the necessity of printing another set of instructions for such areas, the corresponding dates were inserted in the Urdu version at the appropriate places along with those applicable to the accessible parts of the State. Similarly, it was felt necessary to slightly elaborate the translation where the literal rendering of the English text into Urdu would not have been easily comprehensible by the enumerator. Thus, the sentence "but you will not have to take notice of any birth or death or visit occuring after sunrise of Ist March, 1961" was not translated word for word and instead it was laid down that the filling up of new slips. or cancelling of the written ones dQes not apply to births, deaths or visits occuring after the sunrise of lst March. 1961.
i .303 The English venion of the questionnaire and the instr~tions also contained expressions 'for which appropriate equivalents a~ not available in Urdu. The literal translation in Urdu of 'stable defacto union' would not, for instance, connote- the precise import of these words. In such cases, preference was given to the nuance of English version than 'to its Iiter~
translation. Similarly, question II of the Individilal Slip which is designed to ascertain particulars of the work if any, being done by the person enumerated other than the activities referred to, does not only relate to those who work as cultivators, agricultural labourers or in household industry and do some other work in addition to these but also to persons who may neither be working as cultivators nor as agricultural labourers nor in household industries but may be - doing some other work such as running a commercial establishment, employment in office etc. etc. There is no equivalent in Urdu for the words 'other than' appearing in this question which would cover the - cases of both the categories. If, therefore, the trans. lation -had merely conformed to the original text, there was every apprehension of the question being misconstrued and the information being given in respect of one or the other category only.
Advantages and Disadvantages of Central Priatiag and Distribution
1.304 The printing of the schedules, forms, abstracts, instructions and their timely distribution was in itself a complex problem. There are very few printing presses in the State and those among them which coutd be expected to undertake quality printing are conspicuous by their absence. The topography of the state and the frequent suspension of communications due to the inclemency of weather in winter, when the Census is taken, added in no small measure to aggrevate our difficulties. The Registrar General anticipated the impracticability of printing the schedules, instructions and forms etc. in the private and Government presses available in various States as also the difficulties which the Census Superin~endents would have to face
51
in arranging paper for prin ting and necessary transport ,for the expeditious carriage and distribution of the packages and consignments to different destinations. They were, therefore, spared of the inconvenience of arranging the printing-paper which was at the instance of the Registrar General supplied direct by the Mills both to the Presses concerned as also to the State Census offices. It was further decided to assign the work of printing of the following schedules and instructions to the three Government of India Presses stationed at Calcutta, Aligarh and Nasik. The States were also classified into three groups, each being affiliated to the Press nearest to it. Jammu and Kashmir was thus included among the States whose printing work was assigned to Aligarh Press - -
I. Houselists in Urdu 2. Household Schedules in English 3. Household Schedules ill Urdu 4. Enumeration Slips in English 5. Enumeration Slips in Urdu 6. Abstracts of Enumeration pads in Urdu 7. -Abstracts of Enumeration pads in English 8. Instructions for filling up Houselists in
English 9. Instructions for filling up Household
Schedules and Individual slips in English. 10. Abbreviations in English.
1.305 With a view to distinguishing the Household Schedules and the Individual slips to be used for training from those meant for actual enUIneration, the former were printed in red and the latter in black ink.
1.306 The Houselists were supplied in loose form but the Household Schedules were·, bound in books of 50 and 25 schedules each. Similarly, Enumeration Slips were supplied in pads of two sizes, one containing 100 and the other 25 slips.
1.307 The packages despatched by the press contained on the outside a list of contents indicating the languages of the forms and the number of forms in each language. In addition, a sample of each- form contained in the package was also. pasted on the outside._
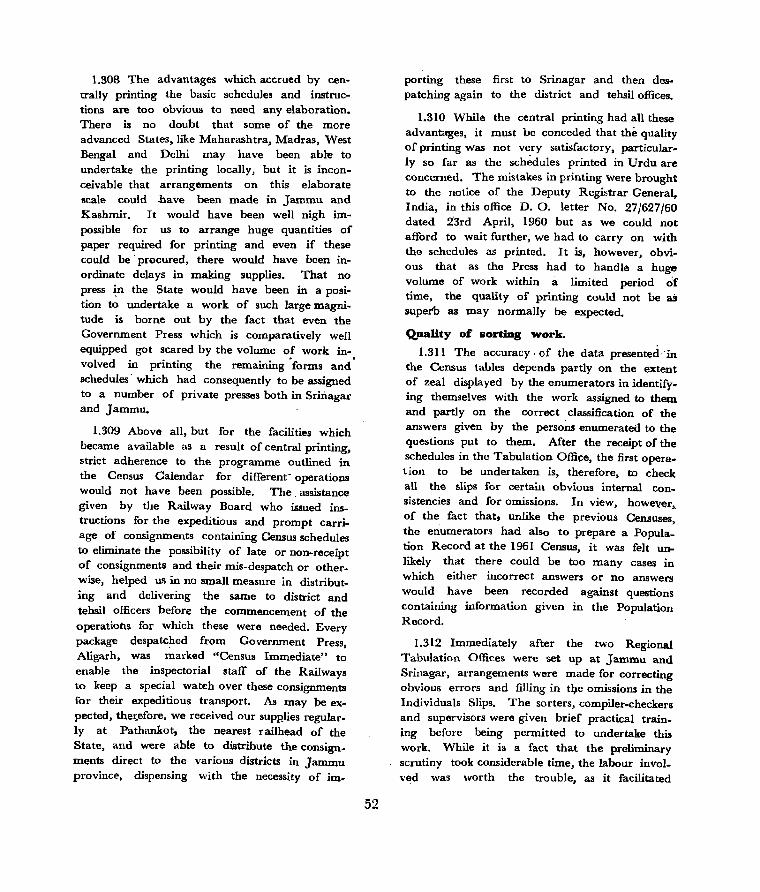
1.308 The advantages which accrued by centrally printing the basic schedules and instructions are too obvious to need any elaboration. There is no doubt that some of the more advanced States, like Maharashtra, Madras, West Bengal and Delhi may have been able to undertake the printing locally, but it is inconceivable that arrangements on this elaborate scale could .have been made in Jammu and Kashmir. It would have been well nigh impossible for us to arrange huge quantities of paper requit'ed for printing and even if these could be' procured, there would have been inordinate delays in making supplies. That no press in the State would have been in a position to undertake a work of such large magnitude is borne out by the fact that even the Government Press which is comparatively well equipped got scared by the volume of work involved in printing the remaining' forms and' schedules' which had consequently to be assigned to a number of private presses both in Sriitagar and Jammu.
1.309 Above all, but for the facilities which became available as a result of central printing, strict adherence to the programme outlined in the Census Calendar for different- operations would not ha ve been possible. The assistance given by the Railway Board who issued instructions for the expeditious and prompt carriage of consignments containing Census schedules to eliminate the possibility of late or non-receipt of consignments and their mis-despatch or otherwise, helped us in no small measure in distributing and delivering the same to district and tehsil officers before the commencement of the operations for which these were needed. Every package despatched from Government Press, Aligarh, was marked "Census Immediate" to enable the inspectorial staff of the Railways to keep a special watch over these consignments for their expeditious transport. As may be expected, thel;efore, we received our supp-lies regular. ly at Pathankot, the nearest railhead of the State, and were able to distribute the consign_ ments direct to the various districts in Jammu province, dispensing with the necessity of im-
52
porting these first to Srinagar and then despatching again to the district and tehsil offices.
1.310 While the central printing had all these advantages, it must be conceded that the quality of printing was not very satisfactory, particularly so far as the schedules printed in Urdu are concerned. The mistakes in printing were brought to the notice of the Deputy Registrar General, India, in this office D. O. letter No. 27/627/60 dated 2'3rd April, 1960 but as we could not afford to wait further, we had to carryon with the schedules as printed. It is, however, obvious that as the Press had to handle a huge volume of work within a limited period of time, the quality of printing could not be as superb as may normally be expected.
Q.aaHty of sorting work.
1.311 The accuracy· of the data presented' 'in the Census tables depends partly on the extent of zeal displayed by the enumerators in identifying themselves with the work assigned to them and partly on the correct classification of the answers given by the persons enumerated to the questions put to them. After the receipt of the schedules in the Tabulation Offi~e, the first operation to be undertaken is, therefore, to check all the slips for certain obvious internal Consistencies and for omissions. In view, howeve¥, of the fact that, unlike the previous Censuses, the enumerators had also to prepare a Population Record at the 1961 Census, it was felt unlikely that there could be too many cases in which either incorrect answers or no answers would have been recorded against questions containing information given in the Population Record.
1.312 Immediately after the two Regional Tabulation Offices were set up at Jammu and Srinagar, arrangements were made for correcting obvious errors and filling in tl}.e omissions in the Individuals Slips. The sorters, compiler-checkers and supervisors were given brief practical training before being permitted to undertake this work. While it is a fact that the preliminary scrutiny took considerable time, the labour invol_ ved was worth the trouble, as it facilitated

subsequent sorting· and compilation. There was also . a risk of the sorters replacing the correct answers already recorded on the slips by incorrect entries. To guard against these and similar mistakes, no corrections were permitted to be made except in consultation with the supervisors and statistical assistants. Doubtful cases were brought to the notice of the Deputy Superintendent and were at times referred for instructions to the Census Superintendent.
1.313 The elaborate instructions for sorting issued by the Registrar General and the incentive provided to the sorters in the shape of grant of bonus not only resulted in improving the outturn, but also in toning up the quality of work. The compiler-checkers were required to conduct a 100% check of the work done ·by each sorter and to maintain separate notebooks for recording the results of the checking done by them. Surprise inspections by the Tabulation Officers and frequent visits by the Census Superintendent contributed to the elimination of sorting mistakes and created a sense of alertness and vigilence not only among the sorters but also in the supervisory staff.
1.314 As we had to deal with a large hastily recruited extra temporary staff, some of the sorters nevertheless committed mistakes in the initial stages. The totals were found wrong and the sorter's tickets had not been filled up according to the .instructions given. There were also one or two instances in which the slips of one industrial category had been mixed up with those of another. The mistakes were, however, progressively reduced with the passage of time.
ProbJelDs of Coding
1.315 Considerable emphasis was laid on correct coding of industrial and occupational classification of the workers. Two code numbers were assigned to every person engaged in some activity or other, one on the basis of industry and the othe~ according to the occupation. The former was coded with reference to Standard Industrial Classification and the latter on the basis of National Classification of Occupations. With a view to distinguishing the two. codes, the
53
coders were made to use two different inks, one for industry and the other for occupation_
1.3 I 6 On the whole, the incidence of the mistakes committed by the coders was not large. Cases were, however, traced in which due to the apparent applicability of two codes to the same occupation or industry, a wrong code number had been assigned. The entry "breaking of stones", for instance, can be the occupation of a person working in a quarry or who may be engaged in laying of roads or construction of buildings. The coder could not decide whether to classify such a person in Category III (Mining and Quarrying) or to include him among workers of Category VI (Construction). Again, Occupational Code No. 330 (Salesmen and Shop Assistants, wholesale and retail trade) and No. 339 (Salesmen, Shop Assistants and related workers not elsewhere classified) also caused some confusion. This happened generally in cases in which 'shop assistant' had been recorded in the Individual Slip. In such cases, Code No. 330 was adopted and Code No. 339 was assigned only where it was specifically mentioned that the trade conducted was neither wholesale nor retail.
I .31 7 Occupational Group 00 meant for Architects, Engineers [and Surveyors also caused some misunderstanding. The entries made in the Enumeration Slip disclosed that some of the Engineers held teaching assignments in Universities and educational institutions. The coders naturally classified all Engineers in the Occupational Group 00. The coding was corrected and replaced by the Occupational Group 05-teachers.
1.318 Instance3 also came to notice of workers engaged both in catching fish and then selling the same. The coders classified such workers under 'trade' as 'sellers of fish'. The mistake was corrected and the workers were included among fishermen.
1.319 In certain cases it was noticed that in spite of the instructions given,. no answer was recorded against the question "na.ture of industry". The omission was made up by making an appropriate entry consistent with the replies

given to other questions with particular reference to the location code. Similarly, the coders wrongly classified the entries against Questions 10 (a) and 11 (a) under families XOO, X08 and X09 which relate to workers without occupations. The mistake was corrected and the figures appearing under these families were transferred to family X90, viz. workers not reporting occupations.
Results or Post-Enu.D1eratiOil check
1.320 As stated earlier, the Census count was subjected to a post-enwneration check to ascertain the degree of error in the enumerated population. The check was conducted soon after the census in accordance with an elaborate scheme evolved by the Registrar General for the re-enumeration of sampled blocks and houses in the rural and urban areas. The size of the sample was restricted to 10% houses of 1% rural and 5% houses of 5% urban blocks only. The snowbound areas were excluded from the purview of the scheme as they were not accessible in April, 1961. Of the 29 tehsils which are either entirely accessible or partly accessible and partly snowbound, sample blocks of 26 tehsils only came under re-enumeratio!l. In the case of urban areas also, blocks of only 14 towns and 2 municipalities fell within the purview of 5% blocks out of the total number of 43 such areas in the State. This was because all the rural blocks in the 29 tehsils were numbered continuously for the entire State and only one block out of Ii. hundred was selected. It, therefore, so happened that generally no block of such of the tehsils which included less than 100 blocks could be selected as a sample for re-enumeration. The same procedure was followed in the case of urban areas also.
1.321 In order to ensure that the check yielded reliable results, the re-enumeration work was assigned to persons completely different from those who conducted the original enumeration in the block concerned. The first ru~all urban block was selected at random by the Deputy Registrar General and the subsequent
54
blocks in each of the two' sectors were determined by this office by omitting every hundred rural and twenty urban blocks following the two random numbers. In the case of houses, the first random number was selected by the Superintendent of Census Operations and the succeeding numbers were worked out by the concerned Charge Superintendents.
1.322 The check which was eventually carried out on 22nd and 23rd March 1961 after the verification staff had been given necessary training for two days at Jammu and Srinagar consisted of two types of verifications. The first was, designed to ascertain. the coverage of censused houses and the second to verify the number of inmates enumerated in the sampled. houses. For the purposes of the fo~mer. the verification officers were asked to prepare themselves an independent houselist of the respective blo~ks
assigned to them. This list was then compared with the censused houses prepared by the charge officers from the household schedules and in this way the cases of omission were located. The verification officers were also given a list of inmates of the houses which included not only genuine members but also spurious entries and deliberate deletions. They were asked to enumerate the households and to report omissions, fictitious entries as also particulars ·of persons who should have been enumerated at the time of census but had been left out of count.
1.323 The results of the re-enumeration disclosed that there were 1,004 persons against every 1,000 persons enumerated in the State as a whole. The corresponding error traced in the All-India Census figures was found to be an under-enumeration of 7 per 1,000. In the rural areas of the State, the extent of error was comparatively small, the actual population reenumerated being 1,002 against the Census count of 1,000. So far, however, as the urban areas are concerned, the check revealed that there were I ,016 persons a gainst every I ,000 persons counted during the Census.
APPENDICES


APPENDIX-A
CALENDAR FOR CENSUS OF 1961 (SNOWBOUND. AREAS)
1. Appointinent of District Census Officers and Charge Superintendents and reporting their names to' Census Headquarters
2. Allotting Code Nos. to Districts and Tehsils and reporting them in triplicate to Census Headquarters
3. Allotting Code· Nos. to Cities and Towns and reporting them in triplicate to Census Head-
24-12-1959
23-1-1960
quarters 15-2-1960
4. Allotting Code Nos. to villages and reporting them in tripli-cate to Census Headquarters 1-3-1960
5. Delimitation of Supervisors' Circles and Enumerators' Blocks
and appointment of Supervisors and Enumerators and reporting the Nos. of circles and blocks in each Charge to Census Headquarters 1-4-1960
6. Distribution of instructions for filling up Houselists 15-4-1960
7. Training of District Census Officers, Charge Superintendents, Deputy Charge Superintendents, Supervisors and Enu-merators 1-5-1960 to 31-5-1960
8. House-Numbering 1-6-1960 to 15-6-1960
9. Distribution of Houselist forms 16-6-1960 to 25-6-1960
57
10. Houselisting
11. Distribution of Sample Enumeration Slips, Sample Household Schedule forms and Ins-
1-7-1960 to 15-7-1960
tructions for Enumerators 16-7-1960 to 31-7-1960
12. Training of Enumerators, Super-· visors, etc.· for filling up of Enumeration Slips, Household Schedule and population record and distribution of these forms 1-8-1960 to 31-8-1960
13. Filling up of Enumeration SIips, Household Schedules and popu-lation record 10-9-1960 to 30-9-1960
14. Revisional round 1-10-1960 to 3-10-1960
15. Reporting of totals:-
(i) by Enumerators 5-10-1960
(ii) by Supervisors 8-10-1960
(iii) ·by Deputy Charge Superin-tendents 12-10-1960
(iv) by Charge Superintendents 25-10-1960
(v) by District Census Officers to Superintendent Census Opera-tions and kegistrar General 30-10-1960
16. Sending of records to the office of the Superintendent, Census Operations by District Census Officers 5-11-1960
17. Post-enumeration check 15-11-1960 to 30-11-1960
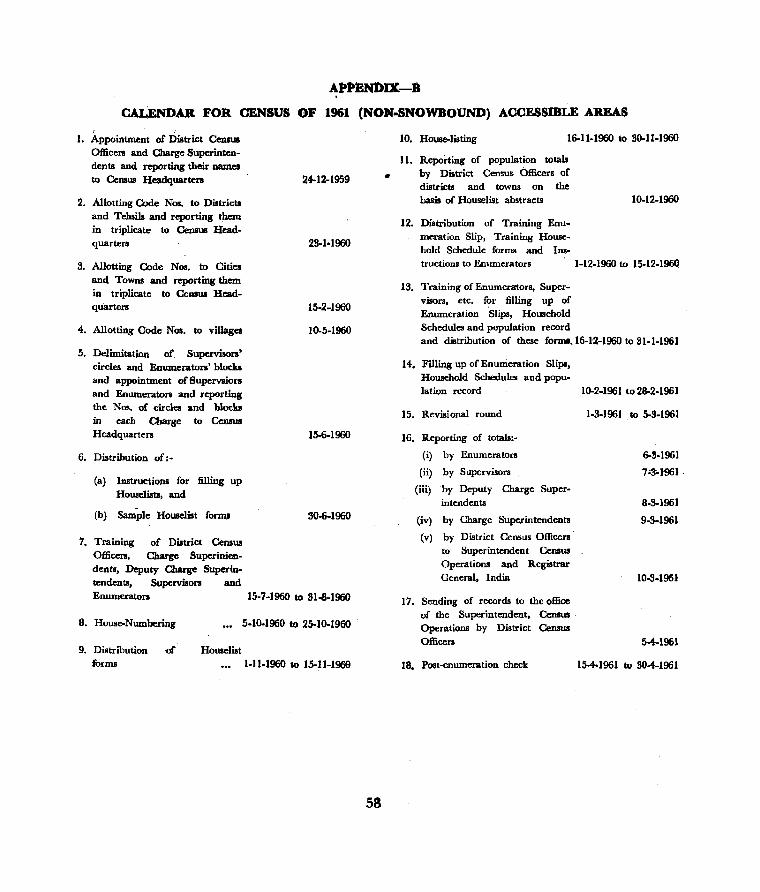
AP'JtENDIX-B
CAUNDAR FOR CENSUS OF 1961 (NON.SNOWBOUND) ACCESSIBLE AREAS
1. Appointment of District Census Officers and Charge Superintendents and reporting their names to Census Headquarters
2. Allotting Code Nos. to Districts and Tehsils and reporting them in triplicate to Census Headquarters
3. Allotting Code Nos. to Cities and Towns and reporting them in triplicate to CeRSUS Headquarters
4. Allotting ·Code Nos. to villages
5. Delimitation or Supervisors' circles and Enumerators' blocks and appointment ofSupervsiors and Enumerators and reporting the Nos. of circles and blocks in each Charge to Census Headquarters
6. Distribution of:-
( a) Instructions for filling up Houselists, and
24-12-1959
23-1-1960
15-2-1960
10-5-1960
15-6-1960
(b) Sample Houselist fOnDJ 30-6-1960
7. Training of District Census Officers, Charge Superinien-dents, Deputy Charge Superin-tendents, Supervisors and Enumerators 15-7-1960 to 31-8-1960
8. House-Numbering 5-10-1960 to 25-10-1960
9. Distribution -of Houselist forms 1-11·1960 to 15-11-1969
.•
58
10. House-listing 16-11-1960 to 30-11-1960
11. Reporting of population totals by District Census Officers of districts and towns on the basis of Houselist abstracts
12. Distribution of Training Enumeration Slip, Training House· hold Schedule forms and Ins-
10-12-1960
tructions to Enumerators 1-12-1960 to 15.12-1960
13. Training of Enumera'tors, Supervisors, etc. f?l' filling up of Enumeration Slips, Household Schedules and population record and distribution of these forml, 16-1-2-1960 to 31-1-1961
14. FUling up of Enumeration Slips, Household Schedules and population record
15. Revisional round
16. liteporting of totals;·
(i) by Enumerators
(ii) by Supervisors
(iii) by Deputy Charge Super. intendents
(iv) by Charge Superintendents
(v) by District Census Officers to Superintendent Census Operations and Registrar General. India
17. Sending of records to the office of the Superintendent. Census Operations by District Census Officers
18. Post-enumeration check
10·2-1961 to 28·2-1961
1·3·1961 . to 5-3·1961
6-3·1961
7"3" .. 1961·
8-3-1961
9-3-1961
]0-3-1961
5-4-1961
15-4-1961 to 30-4-1961
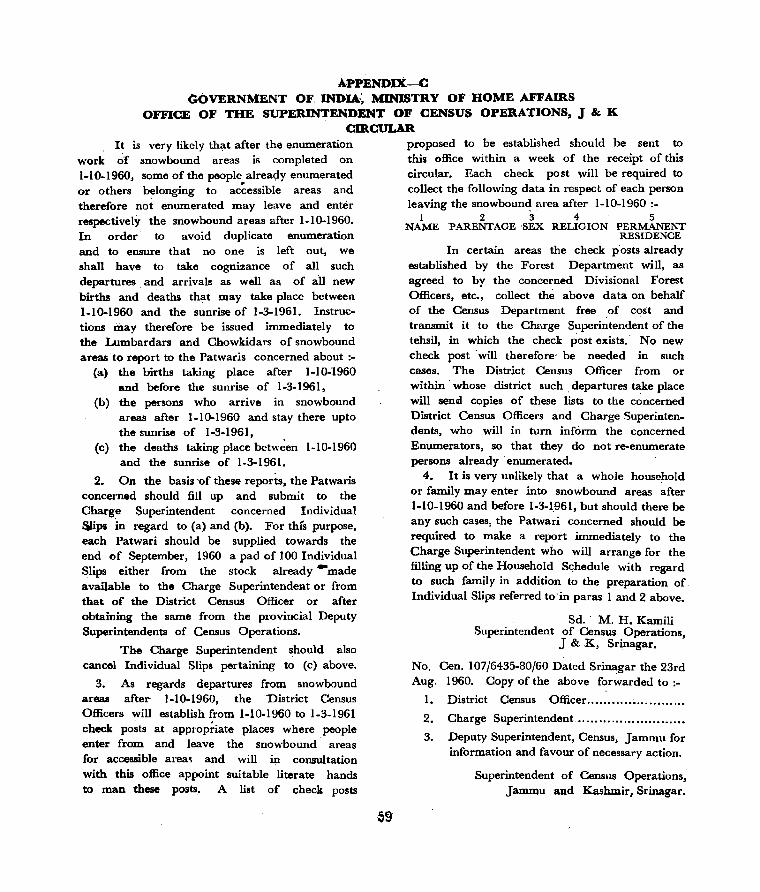
APPENDIX~C (;()'VERNMENT OF, INDIA~ MINISTRY OF HOME AFFAIRS
OFFICE OF THE SUPERINTENDENT OF CENSUS OPERATIONS, J & K CIRCULAR
It is very likely that after the enumeration work of snowbound areas is completed on 1-10-1960, some of the people alreac;ly enumerated or others belonging to ac~essjble areas and therefore not enumerated may leave and enter respectively the snowbound areas after 1-10-1960. In order to avoid duplicate enumeration and to ensure that no one is left out, we shall have to take cognizance of all such departures and arrivals as well as of all new births and deaths that may take place between 1-10-1960 and the sunrise of 1-3-1961. Instructions may therefore be issued immediately to the Lumbardars and Chowkidars of snowbound areas to report to the Patwaris concerned about :-
(a) the births taking place after 1-10-1960 and before the sunrise of 1-3-1961,
(b) the persons who arrive in snowbound areas after 1-10-1960 and stay there upto the sunrise of 1-3-1961,
(c) the deaths taking place betw~en 1-10-1960 and the sunrise of 1-3-1961.
2. On the basis 'of these reports, the Patwaris concerned should fill up and submit to the Charge Superintendent concerned Individual l:ilips in regard to (a) and (b). For tMs purpose, each Patwari should be supplied towards the end of September, 1960 a pad of 100 Individual Slips either from the stock already -made available to the Charge Superintendellt or from that of the District Census Officer or after obtaining the same from the provincial Deputy Superintendents of Census Operations.
The Charge Superintendent should also cancel Individual Slips pertaining to (c) above.
3. As regards departures from snowbound areas after- 1-10-1960, the -nistrict Census Officers will establish from 1-10-1960 to 1-3-1961 check posts at approp~iate places where people enter from and leave the snowbound' areas for accessible area~ and will in consultation with this office appoint suitable literate hands to man these posts. A list of check posts
proposed to be established should be sent to this office within a week of the receipt of this circular. Each check post will be required to collect the following data in respect of each pel'son leaving the snowbounc! area after 1-10-1960:-
1 2 3 4 5 NAME PARENTAGE -SEX RELIGION PERMAl';"ENT
RESIDENCE
In certain areas the check p'osts already established by the Forest Department will, as agreed to by the concerned Divisional Forest Officers, etc., collect the above data on behalf of the Census Department free .of cost and transmit it to the Charge Superintendent of the tehsil, in which the check post exists.' No new check post 'will therefore' be needed in such cases. The District Census Officer from or within' whose district such. departures take place will send copies of these lists to the concerned District Census Officers and Charge Superintendents, who will in turn inform the concerned Enumerators, so that they do not re-enumerate persons already' enumerated.
4. It is very unlikely that a whole household or family may enter into snowbound areas after 1-10-1960 and before 1-3-1961, but should there be any such cases, the Patwari concerned should be required to make a report immediately to the Charge Superintendent who will arrange for the filling up of the Household Schedule with regard to such family in addition to the preparation of Individual Slips referred to' in paras I and 2 above.
Sd. . M. H. Kamili Superintendent of Census Operations,
J & K, Srinagar.
No. Cen. 107/6435-80/60 Dated Srinagar the 23rd Aug. 1960. Copy of the above forwarded to :_
I. District Census Officer ........... ~ .......... ..
2. Charge Superintendent ........................ ..
3. Deputy Superintendent, Census, Jammu for information and favour of necessary action.
Superintendent of Census Operations. Jammu and Kaslunir, Srinagar.
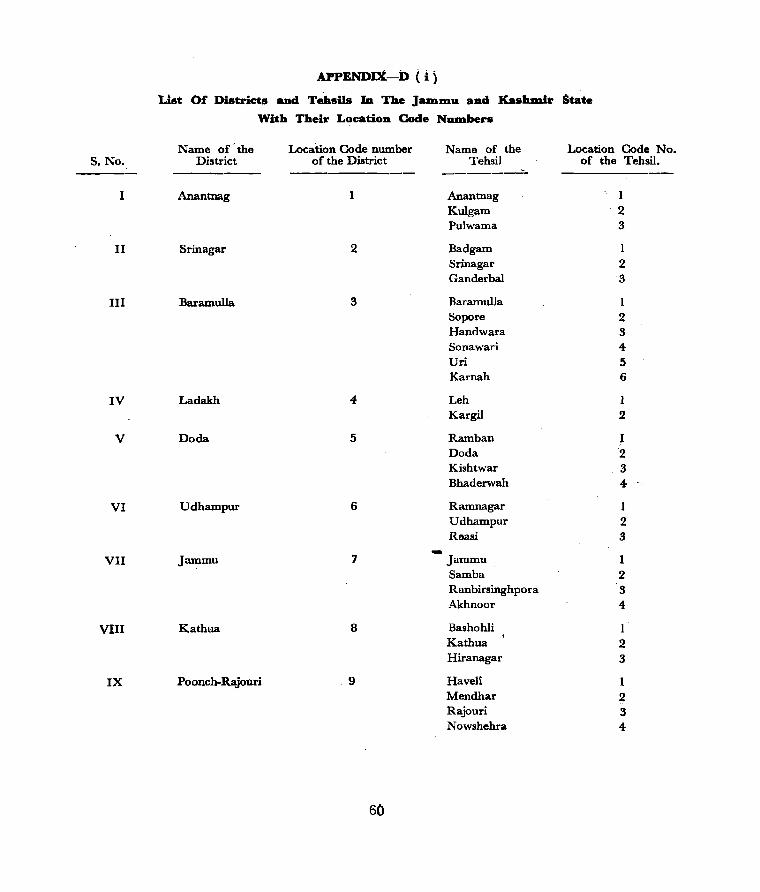
APPENDIX-D ( i )
Ust Of Districts and TeiasUs Ia The JamDlu aad KashJDir State With Their Locatioa Code NUDlbers
Name of-the Location Code number Name of the Location Code No. S, No. District of the District Tehsil of the Tahsil.
----- ---------- -------I Anantnag Anantnag
Kulgam 2 Pulwama 3
II Srinagar 2 Badgam 1 Srinagar 2 Ganderbal 3
III Baramulla 3 Baramulla Sopore 2 Handwara 3 Sonawari 4-Uri 5 Karnah 6
IV Ladakh 4 Leh Kargil 2
V Doda 5 Ramban ,1 Doda 2 Kishtwar 3 Bhaderwah 4-
VI Udhampur 6 Ramnagar I Udhampur 2 Reasi 3 -VII Jammu 7 Jammu Samba 2 Ranbirsinghpora 3 Akhnoor 4
VIII Kathua 8 Bashohli 1 Kathua 2 Hiranagar 3
IX Poonch-Rajouri 9 Haveli 1 Mendhar 2 Rajouri 3 Nowshehra 4
60

APPENDlX-D ( ii ) List Of Towns In JalDDlu and KashDlir State With Their Location Code NUlDbers
Name of the Location Code Name of Location Code Estimated popula-S'-No. District No. of District the Town No. of Town tion of Town
---- ------ ---~-- ------ .------- ---------Anantnag KuJgam I 4,000
Anantnag II 17,000 Bijbehara III 7,000 Shupiyan IV 6,000 Pampore V 6,000 PahaJgam VI 1,600
2 Srinagar 2 Srinagar Municipality I 2,87,000 Natipora-Hyderpora II 5,000 Badamibagh Cantonment III 19,000
3 Raramulla 3 Gulmarg I 500 Sopore II 17,000 Baramulla III 25,000 Uri IV 607 Sumbal V 3,318 Hajin VI 5,600 Palhalan VII 3,715 Ajas VIn 4,684 Bandipur IX 3,935
4 Ladakh 4 Leh I 4,000
5 Doda 5 Banihal I 1,260 Ramban II 5,000 Batote III 4,000 Doda IV 4,500 Bhaderwah V 5,000 Kishtwar VI 4,273
6 Udhampur 6 Ramnagar I 3,000 Udhampur II 20,000 Katra III 2,100 Reasi IV 3,000
7 Jammu 7 Jammu Municipality I 1,25,000 Jammu Cantonment II 10,000 Samba III 5,()(X) Bishna IV 7;000 Arnia V 7,500 Ranbirsinghpora VI 11,000 Akhnoor VII 5,000
8 Kathua 8 Bashohli I 3,000 Kathua II 16,000 Hiranagar. III ·4,000 Lakhenpore IV 277
9 Poonch-Rajouri 9 Nowshehra I 1,400 Rajouri II 4,500 Poonch III 11,000
61
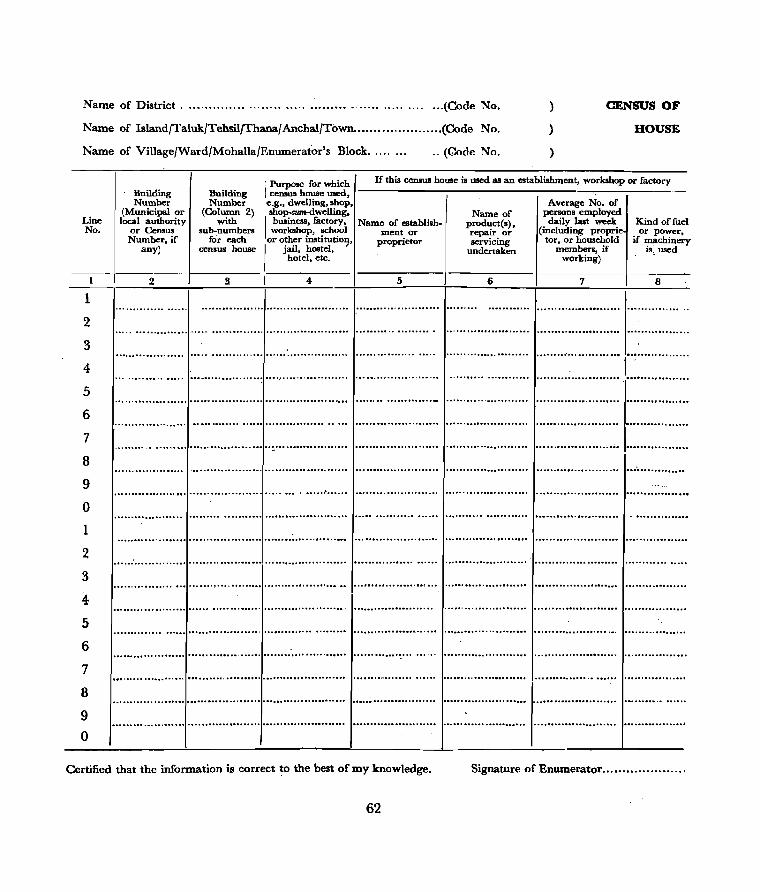
Name of District. ......... ..... ... ..... ..... •.. •.. ... . ........... .... . .. (Code No. )
)
)
CENSUS OF
HOUSE Name of Island/Taluk/Tehsil{fhana/Anchal/Town .•••.................. (Code No.
Name of Village/Ward/Mohalla/Enumerator's Block ...... " .. (Code No.
Line No.
1
2
3
4
5
6
7
8
9
o 1
2
3
4-5
6
7
8
9
o
: Purpose for which ! census house used, e.g., dwelling, shop,
If this census house is used as an establishment, workshop or factory Building Number
(Municipal or local authority
or Census Number, if
any)
2
Building Number
(Column 2) with
sub-numbers fo'r each
census house
. shop-cum-dwelling,
I business, factory, Name of establish-workshop, school ment or
or other institution, proprietor
I jail, hostel, , hotel, etc.
I _________ I ____ ~----3. I 4- 5
Name of product(s) , repair or servicing
undertaken
6
Average No. of persons employed
daily last week (including propr~".
tor, or household members, if"
working)
7
Kind of fuel or power,
if machinery is, used
8
........................ 1.. .............. . ........................ - ................................................................................................................................. .
:::::: ::::::::: ::: :::~:: I::~:::::::::::::::
................... ,,0 .0.0. •••••••• •••••• ••••••••••••••••• •• ••• ••••••••• •••••• ••••••••• ••••••••••••••••••••• ••• • ......................................... ..
............ ...... .... ...... ............. ... ... ~ .................... . ..... .................•. . ................ .
.................... ' ...................................................................................................................................... .
..............................................................................................................................................................
................................................................ ,. ..... ........... ...... ........... ...... ...... ........................ . .............. . ........ .... ........ ... ......... ......... ............ ...... ...... . ................ ,. ...... ............... ......... ........................ . ................ .
.............................................................................................................................................................
.............. , .. . ......... ~. ... ... ....... ....................... . . . ... ... . .. ........... ... ...... ...... ......... ... ... ...... . ..... ......... . ................ .
............................................................................................................................................................
..........................................................................................................................................................
...........................................................................................................................................................
...........................................................................................................................................................
.............................................................................................................................................................
......... ... ............ ...................... ........................... ........................... ...... ......... ................. ............................ .. ..................... ..
Certified that the information is correct to the best of my knowledge. Signature of Enumerator .................... .
62
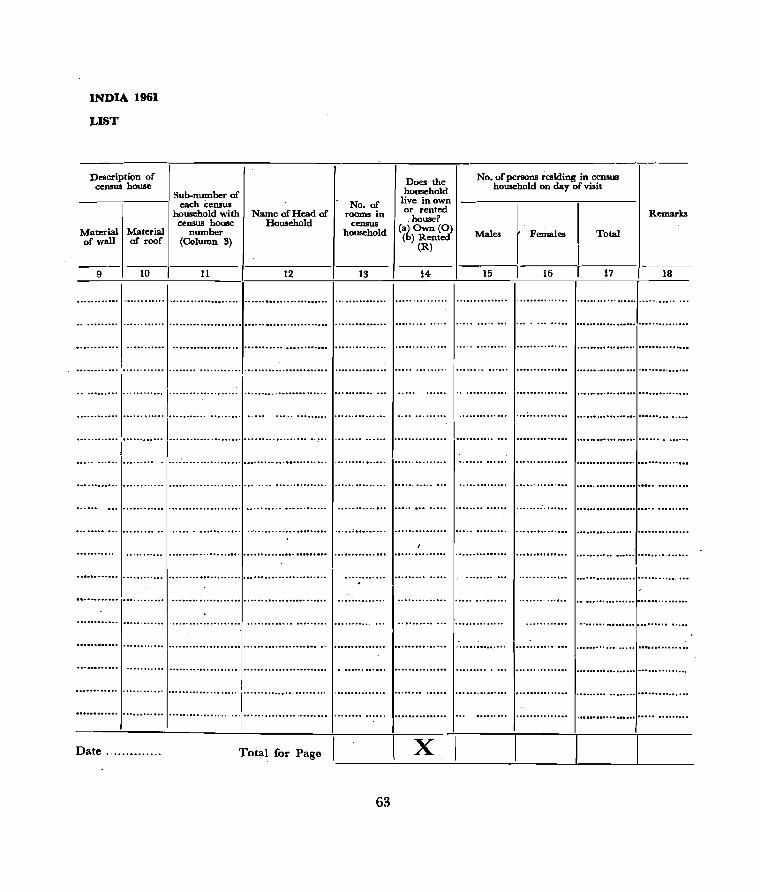
INDIA 1961
LIST
Descriptir;m . of Does the No. of persons residing in census
census house household household on day of visit Sub·number of
each census No. of live inown bousehold with Name of Head of rooms in or rented Remarks census house Household census . house?
Material Material number household (af. Own (0) Males Females Total of wall of roof (Column 3) ( ) Rented
(R)
--- -----9 10 11 12 13 14- 15 16 17 18
........................................................................................... -............................................. .
..................... ........................ ............... ......... ..... ..... ..... ... ...... ......... ................................ . ............ . ........................................................................................................................................ .
, .............. .
............... ......... ,; ..................... .
.......... •.. • .............................................. = ..................................................................................... .
.............. ............ ......... -............................................................................................................................. ..
. ::::. ::. :::::::::::::: ::.:: j:::::: ::::::. :::: ::: 1
········· .. ····
...............
Date. Total for Page x
63
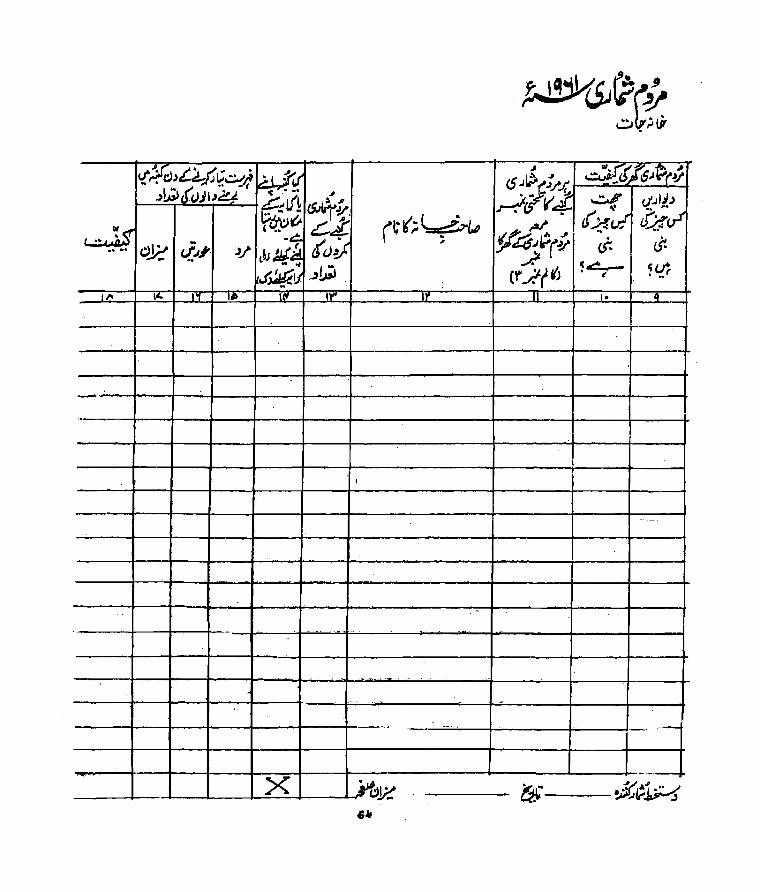
"
--.~~--~~--~--~---+----~-----+--~--~--~--~ ... --t--t--+--+--+--+--~---~---I---~---i.
---f---f---1--4--4--+-----... _"'____.--;.;.0...-. ---'-i-'----+-----~--- -
----1---r--r--~~~-~---------~----~----~----__ --f--_ . ......I~__I_._....J_,:x~_,__-~· l:'Jj1 ---- M---~j,!1H'

• l$.J~(:Y •• .••. (.. ··'.J~,JfIJjIJ/rJl'~
. '~'J:J~;.~;l(ky.lX'J('.Jb'6.J~J.J~).J'r'6J~r"~1:'JFfo .. ~(~(.~}v! ...-.-:'cJ~ /.C)~ '?fV~ft ;'1;JJ~:f;j:J ~~~!(LVU~ fp''7':'J~ C.P-ttl) c:rl~!~<' iJ'Pti'CU!J'~ .Ja,.1,,(uJIt/('bI ~/J'<1'Lrc:;, ';bl (5J~'JI( .)o~J,.')rJJ ,.fcJ:}J c$(ioi(¥/.N' !~I~rl!;!)v J~, ~ (~t~"...)"J~~~ b~ ~ ;'~(,;~'JI("fJ'~J c.)' (SJ~~! ~ -: .. OJ, ~. vJ L .. JI ?; t!t ~. '. , -!J},£,.jf .. .... . Uc .~I ;,J!I'"'!I)I,,::, AU') .~~ . r' t; .:::..-C • - If (L , . ~ rH &:) • • " ~ ( cJ{' l/(II '-7(31(. .t!."£lf" ~ ~ ..
,.. -r "f .6 tv ... I'
I
t'
r t"
I
(j
~
i
. I.
A
~ ..
;~ , r
'f
~
~ . 'I
L
A
1 ..

CONFIDENTIAL CENSUS OF INDIA 1961
[To be filled up during Enumeration] Is this an institution?
PART I_HOUSEHOLD SCHEDULE I LOGAT10NCODE ____________________________________________ ~--~:========~
Full Name of Head S C / /
)
of Household___________________________ S:T: '--__ ,------
A. CPltivatiOIl
B.
C.
1. Land under cultivation by Household (i) owned or held from Government
(ii) held from private persons or institutions for payment in money, kind or share
(iii) Total of items (i) and (ii) 2. Land given to private persons for culti
vation for payment in money, kind or share
Household Iud1l8try
Household industry (not On the scale of a registered Jactory) conducted by the Head of the household himself and/or mainly members of the household at home or within the village in rural areas and only a t home in urban areas.
Workers at Cultivation or Ho_ehold Industry
Members including Head of family working and hired workers, if any. kept wholetime during current or last work-ing season.
I. Household Cultivation only
2. Household Industry only
3. Both in Household Cultivation & Household Industry
Dated Signature of Supervisor
(a)
(b)
Local name of right on land
I Area in acres
1_-.-
Nature of Ifldultry N b f urn ero months in the year during
which conducted
I
I
I ----I
Members of family working Hired
~ workers
Head Other Total females
----es
----
Dated Signature of Enumer~tor
Note Part ll- Census Population Record overleaf should be filled up during the first round of enumeration (10 February to 26 February) from the enumeration slips relating to the household and brought up-ta-date with corrections, if any, after the second visit during check period 1 March to 5 March, 1961.
66

~(S)tPr.~t~~
I I ~fj;.fl J.. ___ ~l ~oJb' ~)';('/t..:;jJ'ft
t ~le"if~p;_.4sJ~(¥~J ;...Al~?J;I~
..... \~-.~~~~~-""~ .. ~. ~~) -----.------ -----ft;!J~',.v'f"l.P (<i'.uJ 1f);''.J (' <5 ~'" <9' 11 lLf ..;:..9~;-..ll,
~~;L~<fJ,,111J -1 (_.oI(i.)($~~k~ }ftil
L...i;I~Jbltc/~I~}ItJftii) - - - .... -: J 0. J~.j, oJ L • ' ~ .i(}{' .I.. ~A7 •• .:.r..P.1 • ,
<:)t:(~il; .,,' ti)c,!). tii'~ f-- - - - - - - - - -- - .,j)t~~ .:G;r.~ Cl2i ~~..;Jy.ci' 11 ,~
.i( (5..) .::}:J " £JJ. ,./'if tf-!:1 J!(.]. L.'. ~~dlv ((;l(~ ~).J'-,,:-, £.d"ti~" i ;.tiY'(.p~-t,;;-!;~4;c~.r)~-i1 ( . _"
_I :r.. ,:;i.l;lc(~,.~i:!;;'&441.);~1; ,.,. .. ~ ,. o{-a..J;'I~~if~Ju"L.)jj)~C.:l~ttcs; & .. '.. •• ,.. ~ - t I· .
i (y)
(I(~u.?fl .)UI.iliLJt 1/ L/ .dll..L1(~c.t~ijt..:.s-!J; -~ .d.llLl . <:>Ji: '4J'IS/J' ,)/~J) • t;,_.,./"i ~jt~()I.:IJ(4.'??I.,j;j.)!?I.Jj'j.:!:'~;f;' ~u ,. .
")lh-ltu~I''-I(IIj~u~:qf( U .... ::.7 f·j, V I •• :J,J. '-' -
cJ:.~ .. " lJ u/-~ -
I . -tt~' J ctoJ.).:JI.=.~~ ..i,'O.!l .... ~·. -I"
!J3G~~,i.,;" ~R~ hf'
1{{~!?{t(S..~(¥'i?'C:O/.~J,},y/l'-ISJJi.'~t.t~~.J~(;..~J~(($J~(y{~'7".).)_:!.)~q,,~ ·f:::.r~ci'?.frO{(5.J~d~e{~I"~\~olm.cJC~c.t.::;f(S_".,'(~h~~14tl)",.JtJ~CIr
G"
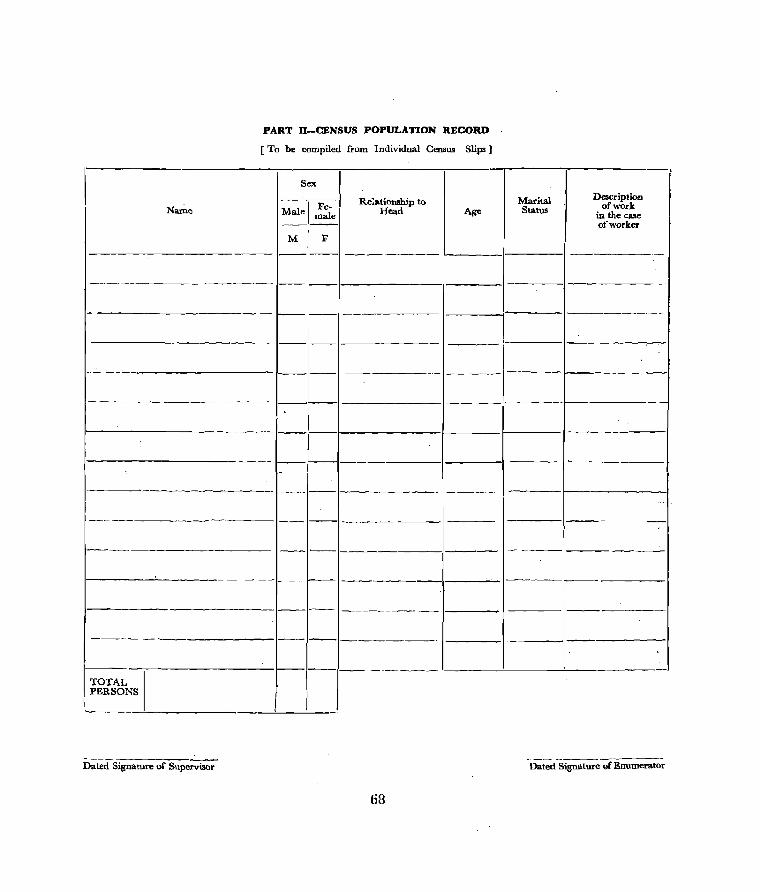
PART II-CENSUS POPULATION RECORD
[To be compiled from Individual Census Slips]
I Sex I Relationship to Marital Description
I Name Male I Fe- Head Age Status of work male in the case _._-- of worker
Mj F ---- _---
_-_. I--- ---_ ---- -----_.----- .--
I -- -----~I
----
I ---I I
--- -----
--_. --- - -----
-- ---- ------ ---- --
-------- _- --'------
--- --------- ------"'--- -- -.~.-.-~.---.
-1-- --I TorAL I ! PERSONS I I --.
Dated Signature of Supervisor 'l);t;d Signature of Enumerat~~
68

~)~~)~r/-(..7.);q . [L\e'~c..?/~~J.;(Sls-iJ((5.1~(y.~]
t4ft" ~;,I;,-?(.p ~ ,
)-..II ~I~I (~ . d.:U)~ .. ' . lJ; ~ CJ)}' >/ "' .~a, L(
- -, t;; (
I
I
.. _-_, --.
-
,
.) !) 1e)..J2"

CONFIDENTIAL CENSUS 1961
Location Code ________________ , ____________________________________ ~-------------
1 (a) Name _________________________ _
Relationship Age last [: 1 (b) to Head ______________________ 2 birthday L ___ -"
Marital Birth-3 Status, ________________ 4 (a) place ______________ _
4 (b) Born R/U Duration of'
O 4 Cc) residence if'
born elsewhere
5 (a) Nationality _________ 5 (b) Religion
S.C.! 5 (c) S.T.
Literacy & _______________ 6 Education ________________ _
Mother 7 Ca) tongue
Any other 7 (b) language(s) ____________ _
Workin,l as 8 Cultivator
Working as _______________________ 9 Agricultural _____ ._.
labourer
.. I (a) Nature of work
Working at
j 10 Household Nature of
Industry Household (b) Industry
(c) IC Employee
(a) Nature of' work
(c) Class of Worker Doing Nature of' Industry, Work (b) Profession. Trade
11 Other or Service than 8, 9 or 10
~~/ Name of'
(d) Establishment
12 Activity if
j Not Working 7 ,."
//,/' ,/ .13 Se-x
70

r- - - -- -, I I l--- - __ ......

CENSUS OF INDIA 1961
Instructions Cor fi.Iling up the Houselist
Column I-Line Number
Only one digit of the line number has ·been printed in .this column. The line numbers should be continuous for your block. Where the line numbers exceed 9 write the earlier qigit(s) yourself.
Column 2-Building ,Number (Municipal or Local Authoriry or Census ,Number, if any).
This refers to the entire structure on the ground. There are, however, high, large or long buildings along a street or lane which have been partitioned or portions of which have been sold, which have distinct, separate main exit- on the road and which belong to separate owners or occupiers or alternatively there aTe a ':se'~ies of different houses joined each to each by common walls on either side to make the whole look like one building but parts of which have been built at different times and, belong to separate owners. Such distinguishable 's,tructurel!; although not separate from each other, should be regarded as separate buildings' and given sei:>arilte numbers. Each building should have a separate number. If in big cities a large mansion or building containing several census houses has a" w~ll ,known name by which it is generally known 'then the name of the' building should also be recorded for converuent reference. If there are more than one structure within an enclosed or open ,compound belonging to the same person e.g., the main house, the servants' quarters, the garage, etc., only one building number should be given. If the locality consists of a number of streets in a village, the buildings in the various streets should be numbered continuously and the streets should be taken in uniform order, from North-West to
72
'~()AP(o/t~.IJ(,( .....:!.-JL ~ U.6. fCJI.rt~(p· ••. .,,;
•• , at.~"-
South-East. Experience suggests that the best wru' of numbering is to continue with one consecutive serial on one side of .the street and' complete the numbering on that side before crossing ovet tQ:~~e end of the other side of the street and continuing with the serial, stopping finally opposite t-o'wh~e the first numbering began. In a city. enumeration block, the numbering will have to respect th~ axis of the ~heet and not any preconceived 'geog!"aphical direction like North-West. A building under construction should also be given a number in the
serial. If a new hut or building is c0!ls~!~ between the time when the housenumbei:ing and houselisting have been completed and the c~sus count it should be given a new number beyond :the la~t number of the serial for the ';'illagei Ar~bic numerals should be used for building numbers.
This will facilitate. verIfication by supervisors. In areas e.g., urban, where . ihe buildings are already numbered by the municipal ,or other authorities, the enumerator may adopt thQ existing numbers in the Houselist. In such caseS, : coiilmn 2 will carry the established municipal or local authority number which will faci.litate identification. Where there are municipal or local authority numbers but there are reasons to: believe that the number is incomplete or un-satisfactory, the municipal or local authority number ~y. still be entered in column 2, but at the same titp.e. it will be necessary to serially nfimber ihe buildings afresh for the purposes of census houselist .. 'In that case, the new census serial for buildings" will be entered in column 3 and the ~~w ~ensus numbers for the buildings will have to b~ pa4tted on the buildings themselves. In those, cas~s: where there are no municipal or local author-iti ~Q_~bers in existence, all buildings will have to be serially
73
numbered for the census and column 2 will contain entries of this census serial. This number will have to be repeated in column 3 with sub-numbers for census houses, if any.
Column 3-Building Number (Column 2) with subnumbers for each Census House
A Census house is a structure or part of a structure inhabited or vacant, or a dwelling, a shop, a shop-cum-dwelling or a place of business, workshop, school etc., with a separate entrance.
If a building has a number of flats or blocks which have separate entrance of their own and are independent of each other giving on the road or a common staircase or a common courtyard leading to a main gate, they will be considered as separate census houses. If within an enclosed or op~n compound there are separate buildings then each such building will also be a separate census house. If all the st,:_uctures within an enclosed compound are together treated as one building then each structure with a separate entrance should be treated as a separate census house.
The order in which census houses within a building should be numbered should be continuous, preferably clockwise, or in any convenient manner if it is at all difficult to do it clockwise. If a building itself is a census house, then it ·will have only one number, namely, that of the building. If within a building there are a number of cenSllS houses, then each census· house will have two sets of numbers, e.g., the number of the building and the sub-number of the census house. The census house number should be written after the building number in arabic numerals in brackets such as
74
-=?y'c}VUcs:~C')t:OC ~1i-U1 ;':.rF{ at'.:,)9.~4s) r;;(~c.t.V!ilJ-.JSIJ..fi.f~
1""'. •• ~ :"'" "':_" • .1 . ..1< • '~"P'l'¥ .p'."z ~:,-($.I~(~,.....;~v_r?rI "":r.~;...~. , .
. ~ ~~.:.:A/.fc l)"'b/~~Jc.r.~:VIf lJ)
£,_jt5J~(;.4~(r2r'IJ.2<:)I{,aJ.'&?~~ . L.::.;I;t-l?F
2(2),3(2), etc. A census house may contain more than one household, in which case, each household will have to be denoted by a separate alphabetical sub-number (see instructions for column II
below).
Column 4-Purpose for which census house !lsed, e.g., dwelling, shop, shop-cum-dwelling, business, factory, workshop, schoo_l or oth" institution, jail, hostel, hotel, etc.
The actual use to ~hich a census house is put should be written here.
In the case of a factory or workshop 'Factory' should be written for a large' factory if registered under the Indian Factories Act and 'Workshop' for a sman unregistered workshop. A workshop is a place wtere some kind of production. repair or servicing goes on or where goods or articles are made and sold. Similarly, a shop is a place where articles are sold for cash or for credit. Business houses are those where transactions in money or other articles are taking place e.g., bank, etc. But rooms or apartments where professional consultations are held such as· by doctors, hakims, pl~aders, etc., should be de.scribed as 'professional consultation rooms' and not workshops. In the case, however, of a dispensary where, in addition to consulta:tion by a doctor, medicines are prepared and sold, the house should be de~cribed as a dispensary. Write also if used for place of worship or congregation or if unoccupied, 'vacant' . If the census house is a shop, business house, bank, etc., but is not a factory or
75
7-C!J~_,f(5.1tt(.y~U"'.hr!-~r' _).;'; ':tt:G';lV.lI(~~.U((Df£.l~~)CI(,t(.(~~.I~
.~JJ.:( J1'J.:',~.bI'-/J.)!~)t
~11 ".J,;'~~J:L4.iMr.t ;r,tr1 .~I:,..;.{/t~~JI_'1.."r
_,-;,.. (t' VV-I
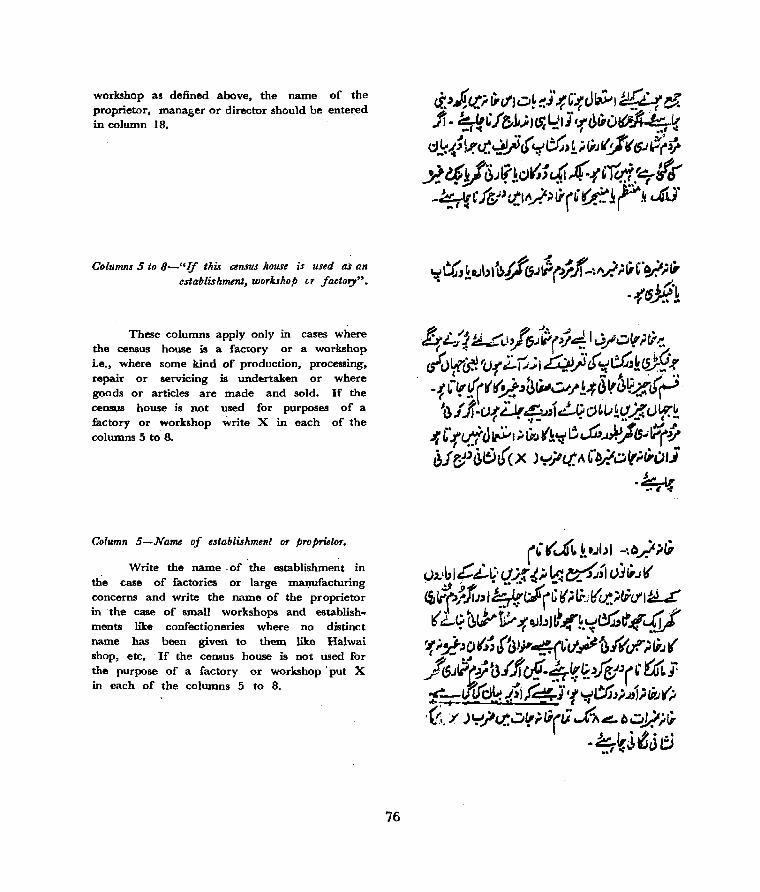
workshop as defined above. the name of the proprietor, mana€,er or director should be entered in column 18.
Columns 5 to 8-"lf this census house is used as an establishment, workshop Lr factory".
These columns apply only in cases where the census house is a factory or a workshop ie., where some kind of production, processing, repair or servicing is undt:rtaken or where goods or articles are made and sold. If the census house is not used for purposes of a factory or workshop write X in each of the columns 5 to 8.
Corumn 5~Name of establishment or proprietor •.
Write the name· of the establishment in the case of factories or large manufacturing concerns and write the name of the proprietor in the case of small workshops and establishments like confectioneries where no distinct name has been given to them like Halwai shop, etc. If the census house is not used for the purpose of a factory or workshop' put X in each of the columns 5 to 8.
76

Column 6-Name of product(s). repair or sirvicing undertaktIn.
In this column enter the actual work that is being done in the establishment, factory or workshop, like paper making, shoe making, cycle repairing, motor servicing, etc.
Coillmn 7~Average number rif persons employed daily la.st week (including proprietor or hiJusehold ftlembers, if any).
The total number of workers including apprentices, either paid or unpaid, employed in the factory or . workshop, including the owner or ·proprietor and any of his family members (if working), should be entered. The average number of persons working per day during the week preceding the date. of your visit should be entered.
In case more than one product is produced it is not necessary to enquire· the number: of persons employed in the production o( each product. It may not be possible to get this information in cases where the. operation~ ~y be composite.
Column 8--Kind oj jllet or power, if machinery is used.
If the factory or workshop uses' .st~am or diesel engine or fuel, e.g., kerosene, soft coke, electricity, water-mill, etc., f~1" _ tunning
77
(l)jl,Ll(I{':'I;')~Jltt ;jt;;,V§ J9.;~ (.)!~f.ft,t;ljJ ~ . ....uc~.)~
tf.r(~Ji~l.'irf 'H(:f'~J -lY,;li.4'(~.
~ t~,'~&.i~!~~·~~':(et"k;VJ(f1 d-c:t.:=:'~, ~ifi )lfi'»'..j',c2. (}" '~ ~Cf'~1
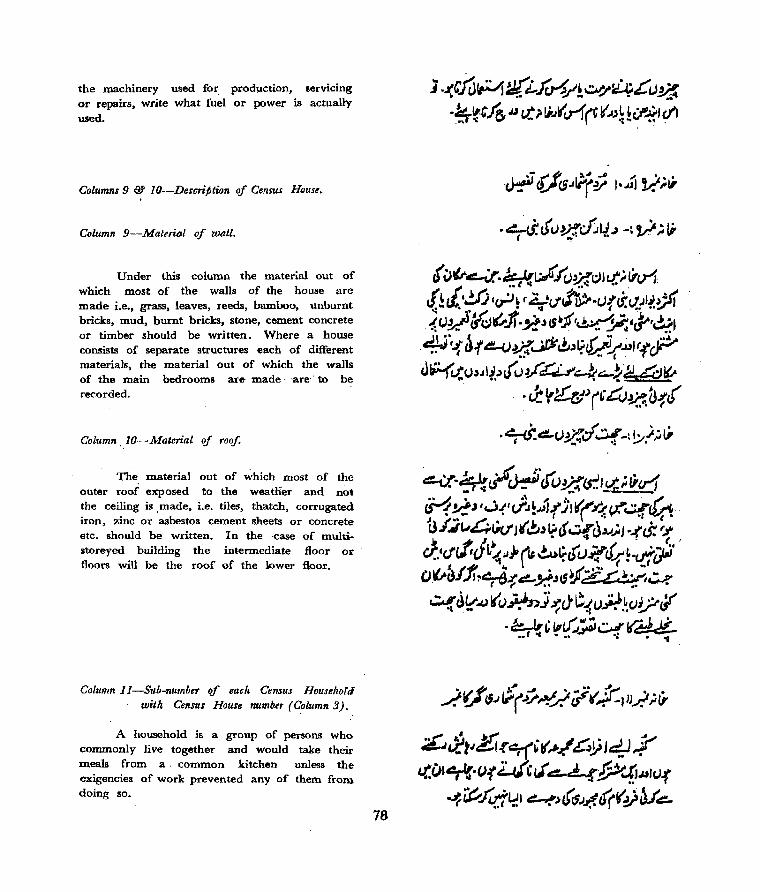
the machinery used for, production, servicing or repairs, write what fuel or power is actually used.
Columns 9 & lO-Description qf Census House.
Column 9-Maleriol of wall.
Under this column the material out of which most of the walls of the house are made i.e., grass, leaves, reeds, bamboo, unburnt bricks, mud, burnt bricks, stone, cement concrete or timber should be written. Where a house consists of separate structures each of different materials, the material out of which the walls of the main bedrooms are made' 'are" to be recorded.
Column, lO-J.faterial rif roof.
The material out of which most of the outer roof exposed to the weatHer and not the ceiling is ,made, i.e. tiles, thatch, corrugated iron, zinc or asbestos cement sheets or concrete etc. should be written. In the ,case of multistoreyed building the intermediate floor 01'
floors will be the roof of the lower floor.
Column 11-Sub-number qf each Census Household with Census House number (Column 3).
A household is a group of persons who commonly Ii ve together and would take their meals from a. common kitchen unless the exigencies of work prevented any of them from doing so.
78
1 . .r:~H:J{Lfcn/i ~4L'tJ~ .~~.tJ6 '" ct ;'!j..J~cr1(' rJ)~ kcl'-:?'~I
'iJtr~·~i:~.IO~(jJct.;,1i-1.1'1 .1) i',y; ,~~ r 4r(j'~!9.t)! II. tJ.;J'.!, ift {f)~/I'cJ~Jr.!J!J ISlrJ'(~~c~rd.?' ~·f..f d-r4!!-()~,_pc!J~~~..(.J"rf? O~c..CO~Jli.~'~if~~.:::....'}44:J~
. ·tlY~)('Cv~~1(
.~Lf)J)Jd'q_: !;J~(j.
;;£J,J:tJJ!t~,+(~(,I-/ ~J) J4! )" L(.DI~.(Ji"i4'" c=..4~~.ulu-f
-.J(~f0'~J ~.)'l$J~((r:y~~
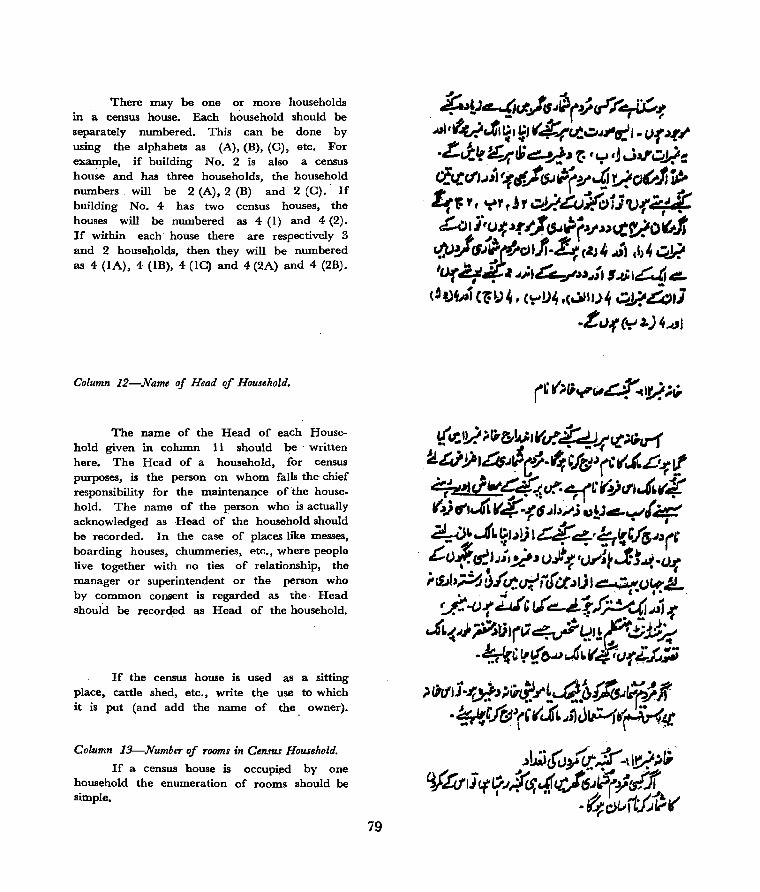
There may be one or more households in a census house. Each household should be separately numbered. This can be done by using the alphabets as (A), (B), (C), etc. For example, if building No. 2 is also a census house and has three households, the household numbers will be 2 (A), 2 (B) and 2 (C).· If building No. 4 has two census houses, the houses will be numbered as 4 (1) and 4 (2). If within each· house there are respectively 3 and 2 households, then they will be numbered as 4 (IA), 4 (IB), 4 (1C) and 4 (2A) and 4 (2B).
Column 12-Name of Head of Household.
The name of the Head of each Household given in column II should be written here. The Head of a household, for census purposes, is the person on whom faIls the· chief responsibility for the maintenance of the household. The name of the person who is actually acknowledged as Head of· the household should be recorded. In the case of places like messes, boarding houses, chummeries, etc., where people live together with no ties of relationship, the manager or superintendent or the person who by common consent is regarded as the· Head should be recorded as Head of the household.
If the census house is used as a sitting place, cattle shed, etc., write the use to which it is put (and add the name of the owner).
Column 13-Numbcr of rooms in Census Household.
If a census house is occupied by one household the enumeration of rooms should be simple.
79
t U!y. ;'!;6!J,;,Vc? ~!('l;c;.rl ~WJ)'4.J~ct--~C/r;)(,r',",.l!~,! <-=/",.J""~~~L·r~"J~(¥ r',vO"',JL V$-1'6 .JJ.,~; U!;4£,.~'~ ~'" -0'1. ~J~!) '4c::-'~~'J&.I"r'· J:.t)!.~jJ;)~~C);.i/'~:t.1jJ.J!"()~ ;'c1..1b~~/~~;dc:t~JJI~()~L. ~-(){'UCt,(~~l~~~-r
Ji..l.,}~~ti)""'L1....,?' .... 4:-'(..)1' p,~~~ " ",.. I' ~ ~. ~~ III '4
-~'It(c,.»J'""Jt1lJ7j,.~;; • •• .. •. ~ I / ... ..c f"t':_ <IV ~.1?
)1I(/IJ-WJ;'iI'«.f!'.~ .. ()~Iir.(/J . .~"~"(Ll(t(~.I;)JIP-1(~~
,)~cW~~~ -lIU;.I;·
o/ull (( L( -,,res; c1f 1/:J6~1i'(~a!f(_,~ -~ c>v rt:;j Ii'i (
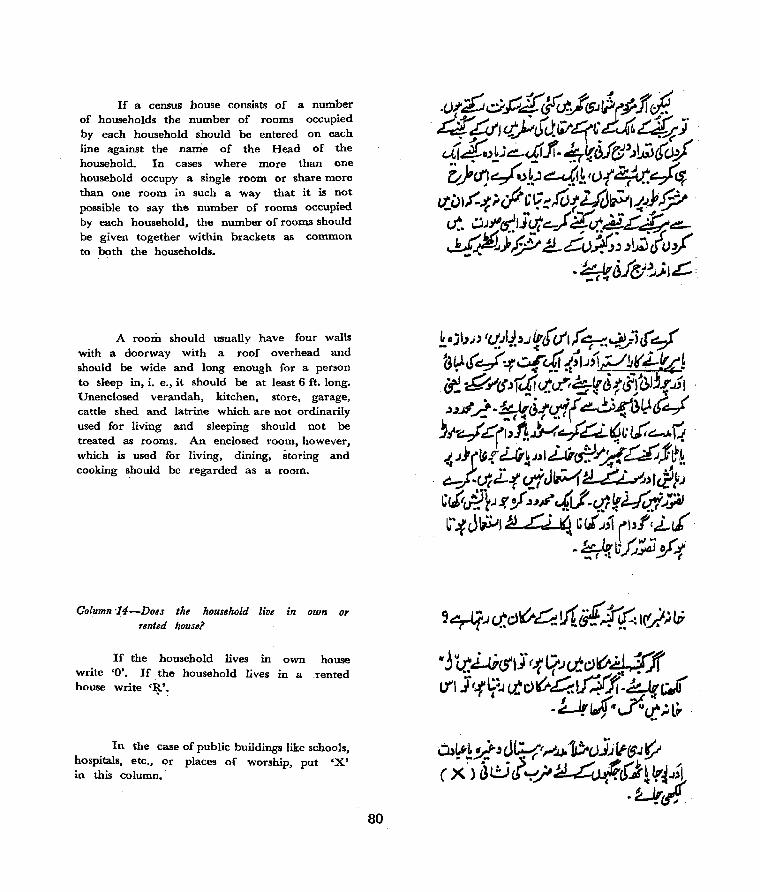
If a census house consists of a number of households the number of rooms occupied by each household should be entered on each line against the name of the Head of the household. In cases where more than one household occupy a single room or share more than one room in such a way that it is not possible to say the number of rooms occupied by each household, the number of rooms should be given together within brackets as common to both the households.
A room should usually have four walls with a doorway with a roof overhead and should be wide and long enough for a person to sleep in, i. e., it should be at least 6 ft. long. Unenclosed verandah, kitchen, store, garage, cattle shed and latrine which are not ordinarily used for living and sleeping should not be treated as rooms. An enclosed room, however, which is used for living, dining, storing and cooking ~hould be regarded as a room.
Column'14-Does the household live in own or rented house?
If the household lives in own house write '0'. If the household lives in a .rented house write <R'.
o .
In the case of public buildings like schools, hospitals, etc., or places of worship, put <X' in this column.
80
9 ... • ,/, ,..... ·1 ,..( •• r( :"r":",.... '.. "'ir-i?.J c.t.C)V~!J l'.~ ~ ~ -: IUAv

Columns 15 to l7-Number of persoTls residing in census household on day of visit.
Write the number of males residing in, the household in column 15" the number of females residing in the household in column 16 and the total number of persons in column 17.
Column l8-Remarks
In this column should be entered any useful or sigruficant information about the building or the census house or the census household that has not been entered in any other column. For example, if the census house is a shop, the name of the proprietor or owner should be recorded in this column. If a census house is vacant at the time of houselisting but there is reason to believe that the house will be occupied in the course of the next few days and almost certainly before the census enumeration period, then the word 'Vacant' should be entered in column 4 and a remark should be 'entered in column, 18 to the effect 'likely to be occupied shortly'. Thus, the Remarks column should be utilised for recording all significant information relating to the building or census house or census household.
,Each person engaged in housenumbering of one block will have to make out an abstract
• at the conclusion of houselisting and house-' numbering. This abstract will be in the form shown in the next page:-
81

HOUSE~IST ABSTRACT
Name and number of District ... , ...................•.•
..... -......................................................... . Name and number of Tehsil, etc ...•......••......•.•
Name and number of Village! Ward/Enumerator's Block, etc ........................ .
Total number of sheets used .......................... .
Census Household Numbers From .................... .
to ................................................................ .
Total number of Census Households .•........... _ ..•
Nurnberof Total number establishments, of roomS it) workshops all households or factories
I Dated .................... .
Signature of Supervisor
Number of persons residing in households
Males Females Total
-- -_
I I
I .Dated .................... .
Signature of Enumerator
.. . ., ... ~;,~C~~ ... .- .-
..' ~~~;I(L'(cJ-?'
(L-II-;;', ~-:cJC~~~"/~.,,. , •• _.iJAJ
;. .. ~ .. .,~JtcJ_j"" ·...c/d".;.....,
:t;G c)...,bl~)Jt ~~.Jd' cJ?' U·r
L (.).t~1 , r{Us./ .JI ..
,[ W';.Jr ,~ cf ~ cbJ' -?/ ,).k....J J ••
.:}I._..,J
82
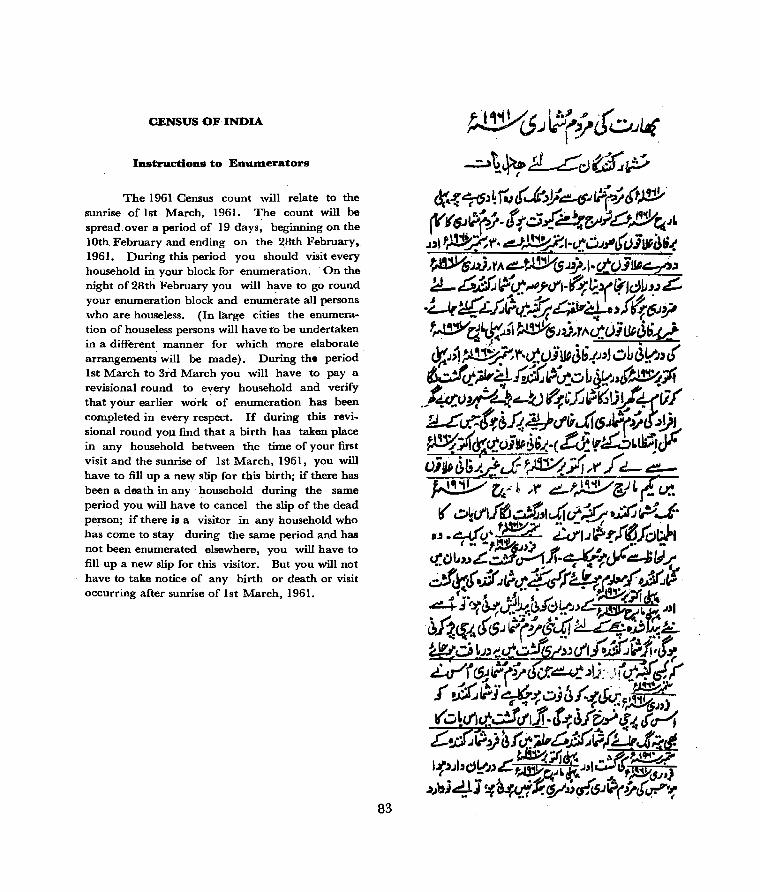
CENSUS OF INDIA
Instructions to EnulD.erators
The 1961 Census count will relate to the sunrise of lst March, 1961. The count will be spread.over a period of 19 days, beginning on the 10th February and ending on the 28th February •. 1961. During this period you should visit every household in your block for enumeration. . On the night of 28th February you will have to go round your enumeration block and enumerate all persons who are houseless. (In large cities the enumeration of houseless persons will have to be undertaken in a different manner for which more elaborate arrangements will be made). During the period lst March to 3id March you will have to pay a revisional round to every household and verify that your earlier work of enumeration has been completed in every respect. If during this revi. sional round you find that a birth has taken place in any household between the time of your first visit and the sunrise of 1st March, 1961, you will have to fill up a new slip for this birth; if there has been a death in any household during the same period you will have to cancel the slip of the dead person; if there is a visitor in any household who has come to stay· during the same period and has not been enumerated elsewhere, you wiII have to fill up a new slip for this visitor. But you will not have to take notice of any birth or death or visit occurring after sunrise of lst March, 1961.
83
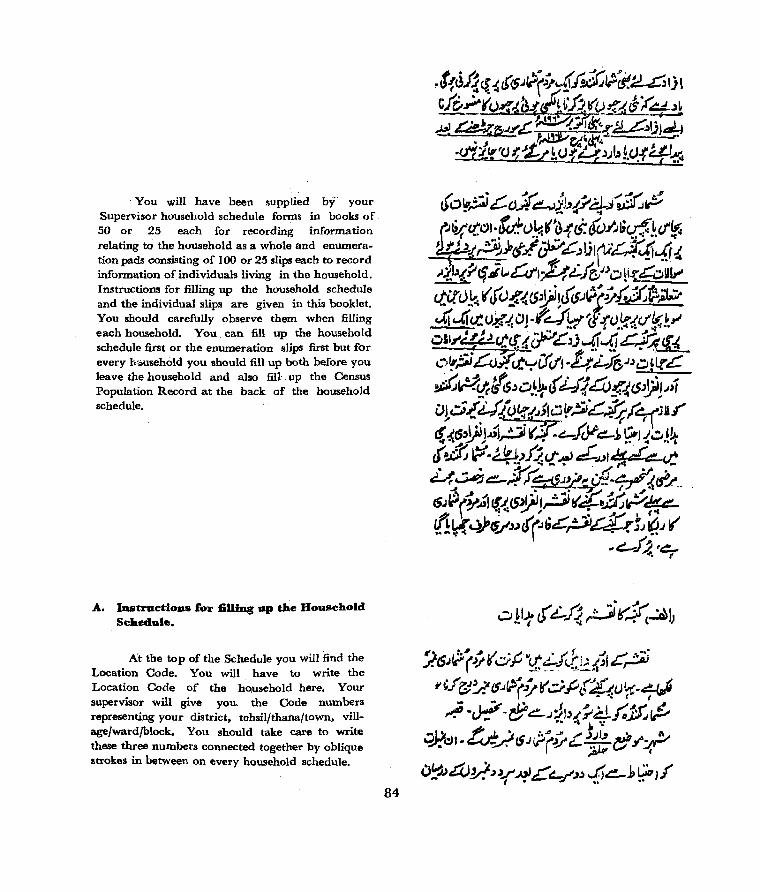
You will have been supplied by your Supervisor household schedule fonns in books of 50 or 25 each for recording information relating to the household as a whole and enumeration pads consisting of 100 or 25 slips each to record information of individuals living in the household. Instructions for filling up the household schedule and the individual slips are given in this booklet. You should carefully observe them when filling each household. You can fill up the household schedule first or the enumeration slips first but for every I:v ... usehold you should fill up both before you leave the household and also fill up the Census Population Record at the back of the household schedule.
A. IQStructioDs for filling up the Household Sche.dule.
At the top of the Schedule you will find the Location Code. You will have to write the Location Code of the ho,usehold here. Your supervisor will give you. the Code numbers representing your district, tehsil/thana/town, village/ward/block. You should take care to write these three numbers connected together by oblique strokes in between on every household schedule.
84

When you are visiting each household for enumeration you should write the .code number of the household also on the Household Schedule. For purposes of the census a Census· House has been defined as a structure or a part of structure, a ,dwelling, a shop, workshop, factory or place o{ business, or ·shop-cumdwelling giving on the road or a common staircase· or a common courtyard leading. to a main gate Or enjoying a separate entrance. A household means the entire group of persons who commonly live together in the same census house and take their meals from a common mess unless the exigencies of work prevent them from doing so. In some census houses there may be more than one group of persons, each gJOUp with a common mess. In such cases, each group should be regarded as a separate household for purposes of the census and a separate household schedule should be prepared. You should write the household number from the extracts of the Houselist given to you by your supervisor. If, in any case, you find a census house or a household satisfying the definitions given above has . not been numbered you should bring it to the notice of y~ur supervisor and have a separate number given to the house or household and enurnera.te the household.
85
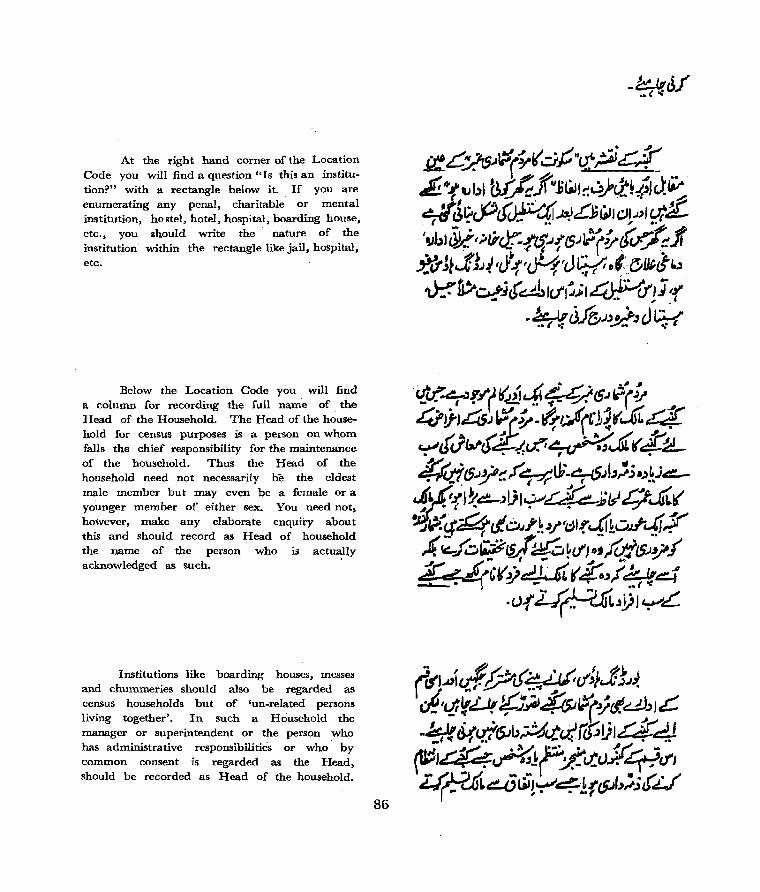
At the right hand comer of the Location Code you will find a question "Is this an institution?" with a rectangle below it. If you are enumerating any penal, charitable- or mental institution, hostel, hotel, hospital, boarding house, etc., you should write the nature of the institution within the rectangle like jail, hospital, etc.
Below the Location Code you will find a column for recording the full name of. the Head of the Household. The Head of the household for census purposes is a person on whom falls the chief responsibility for the maintenance of the household. Thus the Head of the household need not necessarily be the eldest male member but may even be a female or a younger member of either sex. You need not, however, make any elaborate enquiry about this and should record as Head of household the name of the person who is actu~l~y
acknowledged as such.
Institutions like boarding houses, messes and chummeries should also be regarded as census households but of 'un-related persons living together'. In such a Household the manager or superintendent or the person who has administrative responsibilities or who hy common consent is regarded as the Head, should be recorded as Head of the household.
86
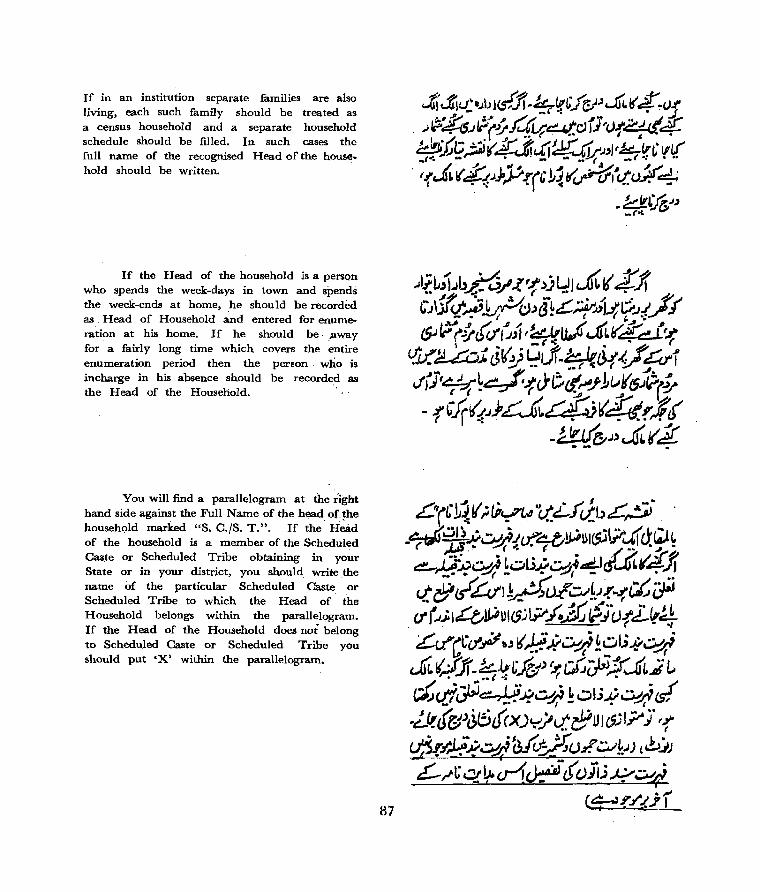
If in an institution separate families are also living, each such family should be treated as a census household and a separate household schedule should be filled. In such cases the full name of the recognised Head of the household should be written.
If the Head of the household is a person who spends the week-days in town and spends the week-ends at home, he should be recorde<:\ as ,Head of Household and entered for enumeration at his home. If he should be· :away for a fairly long time which covers the entire enumeration period then the person, who is incharge in his absence should be recorded as the Head of the Household.
You will find a parallelogram at the right hand side against the Full Name of the head of.!he household marked "S. C./S. T.". If the Head of the household is a member of the Scheduled Caste or Scheduled Tribe obtaining in your State or in your district, you should write the name of the particular Scheduled Caste, .or Scheduled Tribe to which the Head of the Household belongs within the parallelogram. If the Head of the Household does not belong to Scheduled Caste or Scheduled Tribe you should put 'X' within the parallelogram.
B7
L:t~·1~II;li~L.I·'t.LJu.:b~~· _ .... ,r~lj...v~j.l'..P" ..... ~1J,.iUI~~~lct~~ ~;M ,. ~·'~V.(V _. • J •
tt:!!-,f!~~ ~~u~~;~t/~v'~~ c.t&~L4)~'£~fl'("{'c;t~ (j'(~~I~~U!".iI?/~~i(.)tL"~ L.J'~t;'JlP":J~ 1.-: l';.~-hul;...v~""; 1.1. k v~ ~~ ~P_ .. ~IF
~qJf-~~cl&)~GGi)b1%~~..i~ ct·.w,~~I.,j~~C;') Lul;..(iv_",; f V_/~' ... • 7r 1r
_ .~' rs: -L(((~pJt:)U(X)':-')'Lt.&UJc?;l?l '1' c.f5.(/',Lit~~at~(J/. ~kJ) {~)) £r't:~'r~~(.(O]J;R~.j
C4-'.(/.('jl

You· should thel} fill up the part of the household schedule relating to Cultivation and Household Industry. Sub-part 'A' relates to Cultivation; sub-part 'B' to Household Industry and sub-part 'C' to workers at Cultivation or Household Industry.
Sub-part cA' relating to Cultivation will have to be filled in only where the household cultivates land. (Land includes all land normally used for cultivation purposes including temporary fallows). Three categories of land are given in items lei), I (ii) and 2. Items lei) and I (ii) relate to land actually cultivated by the household. Item 2' relates to land. which is not cultivated by the household but luis been given .. by it to private persons for cultivation for payment in money, kind or share. In each of the three cases the total of separate plots or parcels of land in different places, owned or held, or taken or given should be made and entered. A number of lines has been provided for this purpose in l(i) and I(ii) to account for separate plots or parcels of land held or owned or taken under different recognised local rights. If the household (a) cultivates land owned or held from Government or taken from private persons or institutions or (b) has given land to private persons for cultivation purposes you should ascertain the local name of the right on such land and record in the column relating to "local name of right on land". Category I (i) land owned or held from Goverrunent, will inClude the total of all pieces of land owned or h~ld in owner-like possession, e. g., land' held . directly from Goverrunent under a grant, lease or assignment, (i) with rights of permanent, heritable and transferable possession, (ii) with rights of permanent and heritable possession, but without the right of transfer and (iii) temporary or conditional leases of any kind with the Government. Category I (ii) land taken from private persons or institutions for payment in money, kind or share, will include land (i) with rights of permanent, heritable and transferable
as
C)~r~~~~J.(JlI~ .
-~Z-JC5j ~j! tfct.;.(·tf{t:/!d.:~ ~~£ 6J~~.J}~.(J{"O~~I~DJ')Y~;) .J;~~tt. OI.J;I-cJ-fJ-rJIP-1 ~!i1.c -1-UJltil "I-UJI~I;. (~L:.tf.~;.)~Q-
~1J.-q;~~~11(~~-~"~l" lib -U;~~~;~ll'iJ-I"~lj,~-I-~1 ~~Icr.I-~-~I-~c:(5i~<i{c!4~if. jr.r.f-~ CJct!fS~ ~&! %.t:.(,(-~t:!_ ~ ~ LL-Jis1 ~ti1'_(CJ'tr=(~!: 1t;L ;.;t' U_;J()~OlatJ-! ~.)c)j'-L{)~~~"~
-..:PI.I"llii,,-\-uJ! "d)-I-~I~~1.(C'-c..t ,!.Jt!/. t(o_,~ Let ).,,;1 O#(V v i'u.::..t. ~»c\') k &ff. ,I) ~d ,,~ -{; I.7,jL~~.r (:)'~~-C).;Lrbfc)¥n,r; k4~
-I...:.JI ClU. £j:i>~£u(t"J .. ~~C"if rc- cIi~! fC/2 ¥c.t.J. Gt e:r:::.. i iJ -1- t..itJ!" dJ
~'I ~ C)1&!J. .((/. ; ~ W;; "~4-:-; f!;(ti a-L:(;';~~'yu.W..f'~C){~"~ ~ ltj~l,lJ%"-J.:~~"(){~ d~_'~! I5J ~_~{ ~ r ?Cj{sj ~ ~
~ '.f tlo ~()J)bJ! ~ti}&"cs ~ ~ ~ .Jd~ ~~ It: cr.; c" .it, t
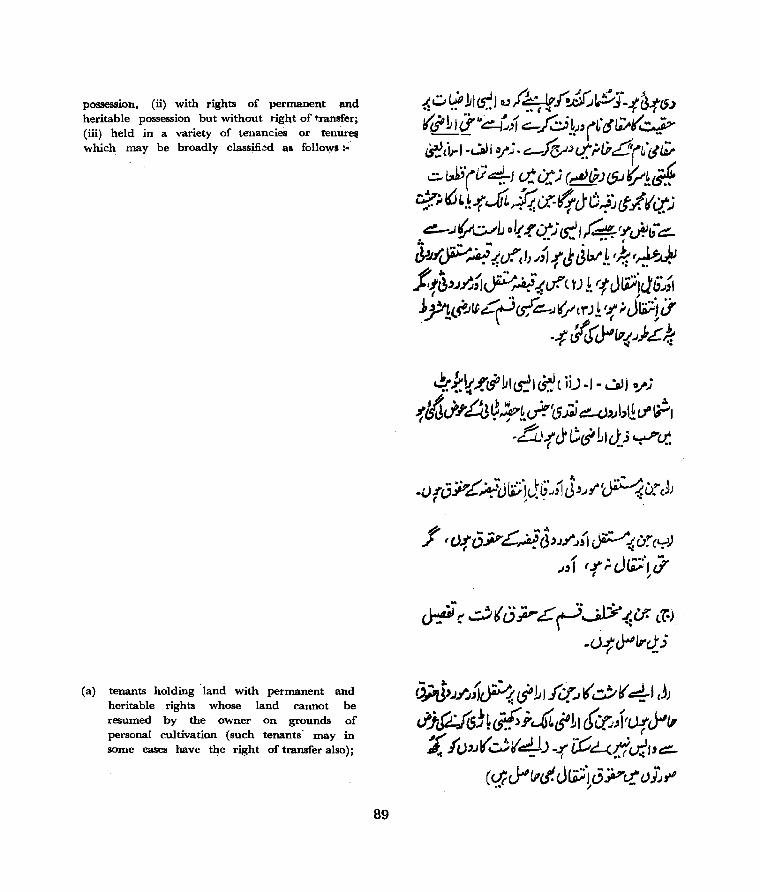
possession, (ii) with rights of permanent and heritable possession but without right of transfer; (iii) held in a variety of tenancieS or tenures which may be broadly classified as follows:~
(a) tenants holding land with permanent and heritable rights whose land cannot be resumed by the owner on grounds of personal cultivation (such tenants' may in some cases have the right of transfer also);
89
~~~~ICS:I o/~, !rf~~J-.f~.f().) J(<i1 I cf"4/i G-f~.L;'(~·dW.V'~ ~,irl·U)J 0/;. c:-)V'r..t.;(p£!tr~·tJti;. ~tJ;·(O~J ~i.t.; (~{;;(S.J~!t?
cr.;. ~ ~.~.f'....(t.;q C:X-~J' t~) tf.l.~'lt) ~..JYUJL Dl.(;:c:r;tS:!J~ ~~ba::.. . .. ,,- ... ~/~ ~1:LT-cJ}.I{1 -( J Jbt'.~ I/.:- 1~..J.u tji~'.J~{jJW'~I:if.'( t)~. r.,Jtp:;iJ6~;1 j,p!(.~~£"fC5(~~~(,.).~ '{',iJu;;iJ. .~~t~~~j£~
~ ~ ._:..!; ~ c:; p-£" r'~tY -t:if. If.) .()1' c.}oIlr ~ j
a.,;,J'.J/.,,JM ci 1 J fit'~ t( ~ I{ ~I J) "jtL1fsj~~;4/.c111 t~Jh)-rJ''' :( Iv,; I( u;V~) -{ ~tL.(d~I,e:::-
( <!.( tY lP(/, J lij;·t J.;A?c.t. v )~ ~

(b) tenants who have been given permanent rights subject to the right of resumption by the owner (in some cases the tenant has the right to acquire ownership of the non-resumable area. In other cases he does not possess the right);
(c) tenants holding land in areas where interim measures have been enacted for stay'· of ejectment or for continuing the lease~ for a specified period;
(d) tenants holding land on temporary leases who are liable to ejectment; and
(e) areas held on condition of rendering service either to a village community or to Government (This also includes cases where labourers on plantations are given some land for cultivation with permanent rights);' and
(iv) the following:-
(a) land taken for a fixed amollnt of money,
(b) land taken for a fixed amout of produce,
(c) Land taken for a share of the produce,
90
ufJ4IY{~t/',(jj7Pf'~i/Qj(4 (y)
ct. rJhil:{;{J-( 4utJ_'£:jttj~,r f'~ trif.1( L.:ir~.J .. ~dJ()~.(~!(c::41 ~c}'/'~V?-1hr'''if'#.tJ.:'~ (C~ 0J-' t?J'~ I Jdj c.I:())~f($J." .'!r
'U{C)}G~~ tJ c.t.v)itv4..r.J( dV lr.:J ~r/J..;£;fS~f~). ~~~JbJ<)lf. _(t~~!p,)L£~tS.J!!.f~~~
I; I ~L_;"(),~~£(.) ~ f~ . .J~.ru!?r!~ ,"II) rI.~ql)-() .. ~~ r0~d.raf ;'.,.,£,0)7 ~ JuJ.J.1V () l-r":t:.v! J C a'?' OJ.) f~()/ I ,;P' d..~j t -~,..r OJ . • I ~c II rs="
((.){~{((
c)~~.J~~£5'f..rct~1 ~J c...:.JJ) . -u-t 7d
urj cj ~ .£ ~rsf z:..J t.,k J' ~11 OC I CCo) .. ~'" . -U(
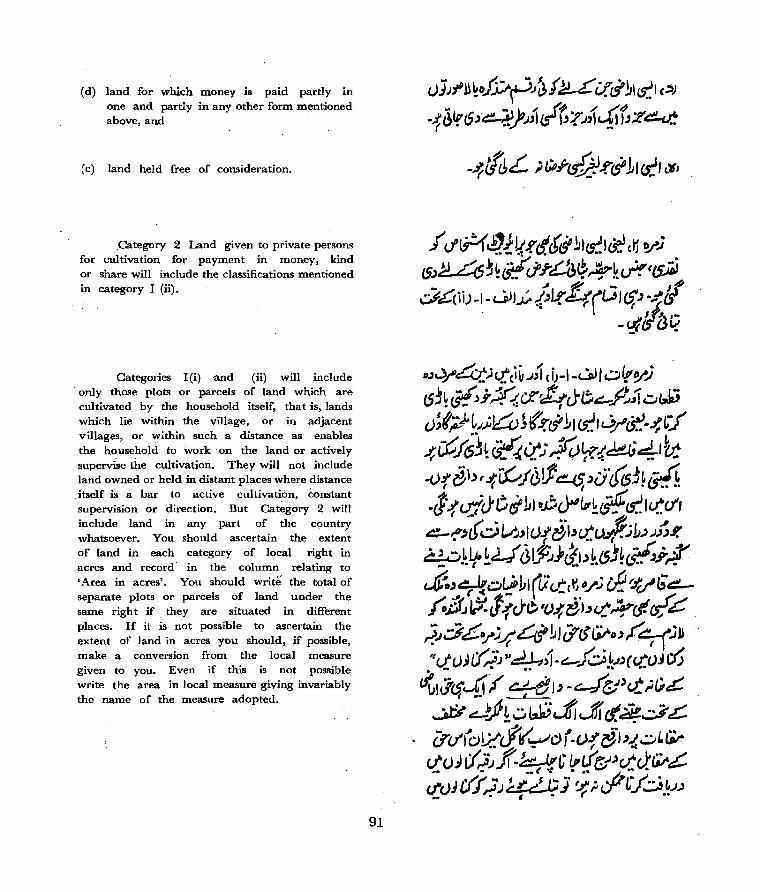
(d) land for which money is paid partly in one and partly in any other form mentioned above,and
(e) land held free of consideration .
. Category 2 Land given to private persons for cultivation for payment in money, kind or share will include the classifications mentioned in category I Cii).
Categories I (i) and (ii) will include only those plots or parcels of land which are cultivated by the household itself, that is, lands whiCh lie within the village, or in adjacent villages, or within such a distance as enables the household to work . on the land or actively superviSe the cultivation. They will not include land owned or held in distant places where distance . itself is a bar to active cultivation, constant supervision or direction. But Category 2 will include land in any part of the country whatsoever. You should ascertain the extent of land in each category of local right in acres and record' in the column relating to 'Area in acres'. You should write the total of separate plots or parcels of land under the same right if they are situated in different places. If it is not possible to ascertain the extent of land in acres you should, if possible, make a conversion from the local measure given to you. Even if this is not possible write the area in local measure giving invariably the name of the measure adopted.
91
1t.l~/4t,ht(i~..I;1 t i)-I-Ua)I u/to/) (Sj~ ~j ~(f.r£rJet:-ft;j Cw ()~If;J-L;;~jf.s:ci'1Ictl,j/tr!-~~:r ~cC.ft5~~ ~lt)~l;r!:~4.-It: -u! 6" r ~i:(., j <1 if ~ ,c:t'dlsj ~ ~ .J -!ujc)Cr111 • ..o~(,.~~~I~d' ~f'')(O~JIC)!ijl~d.:.u.I;1.).J:'.I.' ~:c,jitr~U~tf~.}<t,)~.(SJ~~;',.r-~,~( ~CI~hl((j~,~.,./.; rf:vG~ ~J!;~!1r)e'C).f~·br..t~(J!rsft:C ;'.J'::]L~;~£#1JJr()~",r~ .. i11 '(d(.)){(';JJ}.d.L.t;j-,-f~L.I)(cI'C)Jc6
~,j(fc..4/ ~& " -JY'''-·,i{j,~ ,.. _ .... 1_-
~ dJ'~ .:,t:J,J$i J, r/.;#3,c. . if(j'(dLCfl('~dr-(){ ~I'{~~~ ct:())(/~)Jt.b::;{G {?!(~)~cJ.'W-~ CCV) elf,l) q:.Ll?)" ~;-c:P (( ~.~.).)
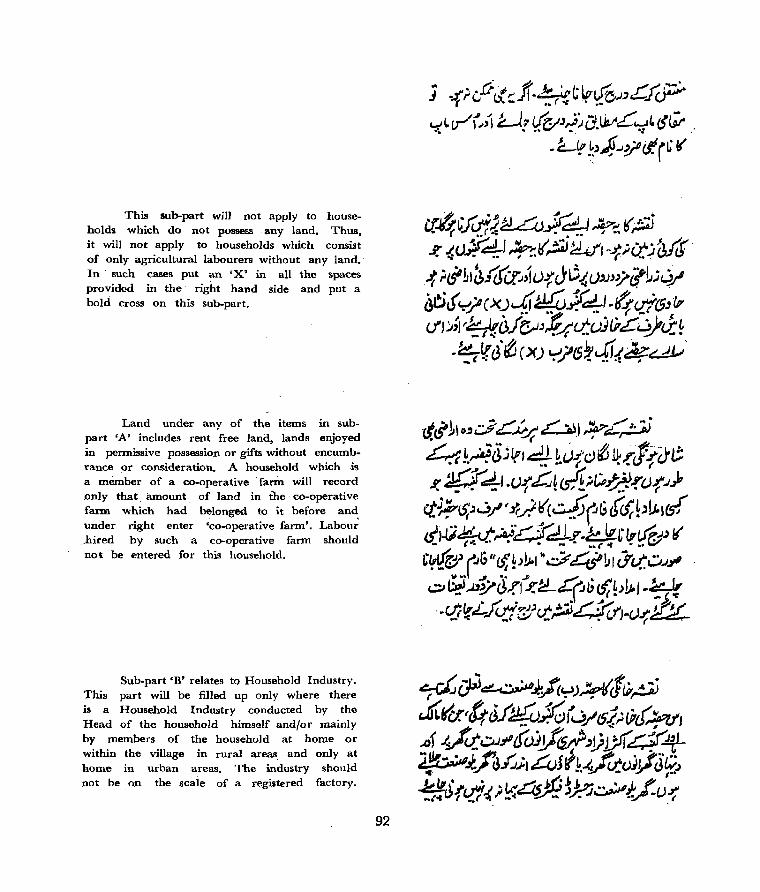
This sub-part wiIJ not apply to households which do not possess any land. Thus, it will not apply to households which consist of only agricultural labourers without any land. In such cases put an 'X' in all the spaces provided in the right hand side and put a bold cross on this sub-part.
Land under any of the items in subpart 'A' includes rent free land, lands enjoyed in permissive possession or gifts without encumb. rance or consideration. A household which is a member of a co.operative farm will record only that. amount of land in the co.operative farm which had belonged to it before and under right enter ·co.operative farm'. Labou~ .hired by such a co-operative farm should not be entered for this household.
Sub.part 'B' relates to Household Industry. This part will be filled up only where there is a Household Industry conducted by the Head of the household himself and/or mainly by members of the household at home or within the village in rural areas. and only at home in urban areas. The industry should not be on the scaie of a registered factory.
92
tt<5'1Io~dL»4~1~£;'#';; ~ L~~jlPl.dl L lJ.i'Cr/J ~ ..fit'"':;~~t:; .( -... . ..... ( .. • (.J, (,J
.9; ~41.U1~~cdf;i:P~-r()fJ; Q':~c.s;~h;'/'~/.I{(~rG(cfr~,u.lcsf «I.tI~"¥d.4y.·~~ClrW~1( C~t(~ rG((lf;~J!;.'" d4i'bl (yl.(:.;)J~ .
~~~~J~'f.~4~~~J~J -::=i!r .. ~'l d-/ u::!r;;l r_t,!jJ£";
Tht!! participation of the Head of the house. hold and/or members of the household is an essential feature of the Household Industry. In a rural area the Household' Industry can be located either at home or within the village~ But in an urban area the Household Industry or at least the major part of its work must be located only at home., A Household Industry should relate to producti~m, processing, servicing or repairing and includes makers and. sellers of goods.
The test for a Household Industry is mainly threefold:
(a) Household Industry should embrace manufacture, processing or servicing and may include sale but should not be confined simply tp buying and selling. At least part of the goods offered for sale from the household should be manufactured or processed by members of the household.
(h) Household Industry should be on the household scale where the workers mainly will be the Head of the household himself and. members of the household, the role of hired workers from outside being of
. secondary importance. Thus, in any Household Industry, ,members of the household should be in a position to lend a hand in the industry whenever they find the time in the course of their daily chores. Housebold Industry cannot, therefor.~, be on the scale of a registered factery but can use machinery and employ power like
93
(f'/c:tcl; -!,.J.v~ ~ ~}.J . -: ift..J~ II. ••
k v/~~",,~£v~~lJc~b tI.(""fS£u:-.~~I-::( ~f~4~ d~h-!:j~/~~j~~~J"~ ~.Jy~~ t~dJ~{;""trc.f{ ~~:J; ~rO ('tL):r .:;;~ttPiu:,r
-C){4.J}~1C:::
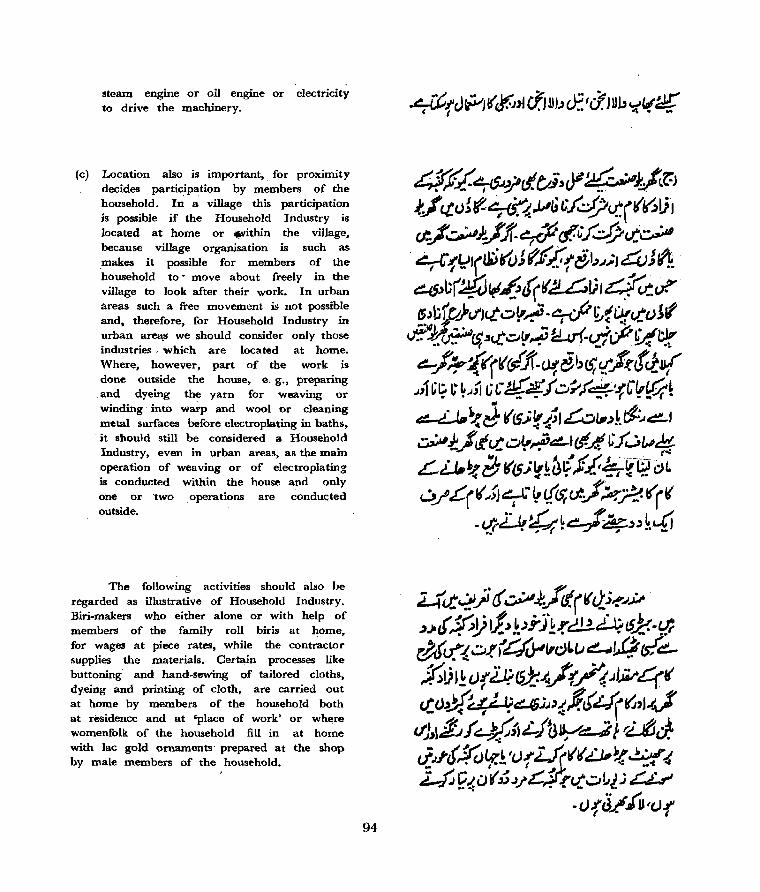
steam engine or oil engine or electricity to drive the machinery.
(c) Location also is important, for proxImIty decides participation by members of the household. In a village this participation is possible if the Household Industry is located at home or ,.vithin the village, because village organisation is such as makes it possible for members of the household to· move about freely in the village to look after their work. In urban are;!s such a free movement is not possible and, therefore, for Household Industry in urban arel\s we should consider only those industries ,which are located at home. Where, however, part of the work is done outside the house, e, g., preparing and dyeing the yarn for weaving or winding into WMP and wool or cleaning metal surfaces before electroplating in baths, it should still be considered a Household Industry, even in urban areas, as the main operation of weaving or of electroplating is conducted within the house and only one or 'two operations are conducted outside.
The following activities should also be regarded as illustrative of Household Industry. Biri-makers who either alone or with help of members of the family roll biris at home, for wages at piece rates, while the contractor supplies the materials. Certain processes like buttoning and hand-sewing of tailored cloths, dy.eing and printing of cloth, are carried out at home by members of the household both at residence and at 'place of work' or where womenfolk of the household fill in at home with lac gold ornaments' prepared at the shop by male members of the household.
94
~-£~¥cI.(;;j!l~~.:JP~~J J::/' r.t.C)~~~~bC/~'-t.(t(i6!iJ ~.J~}Jj(.~cf.Cf~ti~ ~LUI(Oii r1_'J f,( /,.i' ';;1",;;, ~J lit I {- V •• ,(,,;i' ••
~t(~~~trl(~I),~cr. ~!p~CI}"j(t.'O~~ ·~1;.,1~r.t()jf
J.?~cP~_,tt~~~1d.cr(.0LP0f~ ~.I~:(r'(((clJt-~el,CS; ctfitJ;.u{
.I,1Gc, L·L.JJJ c(,-gZf .;)~,(~'.J':C{,tUL •• ... .. .... ( ."" I"
~ L{.,~JI(S';~;ILQt.r.)~.ct:.J~1 ~.fJtfr..tolt~&!!-trr~'fJl,..I~ ", l.t.~ -~ t(jI5JII'L ~\c:' f..tb.:.£f-(:) (:)(. tt:.-- ;.e c;I ., _1.1. •• _ .. 4 -c ...
Uj£(~.J:J7L .. t,l(<>;tf.J~~t(r(( . t.!J4~ ~G-;f-Ar" ~.~
Utt~_; rf ~ifrt(((cl;~.J'y .);.(,r;J}!.lJ!)j-J!.r~4W-9.f r:.Ut/."{ ~.((~,jJ"C>l.tJ ~J£! rsft:!.-%t}I~ ()!~C5..t..IJ{A JJ;;r4t ,,-()d~ J J?~;.I,~l.t~~'J.lJ ctJ'i~.Jf J~;,~jb¥~ ~ rLtlJ: <f_Jl'tJfu'f:'! 'cJr L.(("I(LJ,~ q-& L-;:; f~u( .J.J..I~~~~Li...i ~
. V.J'JL' .,(iJtcJ _rJ ( I
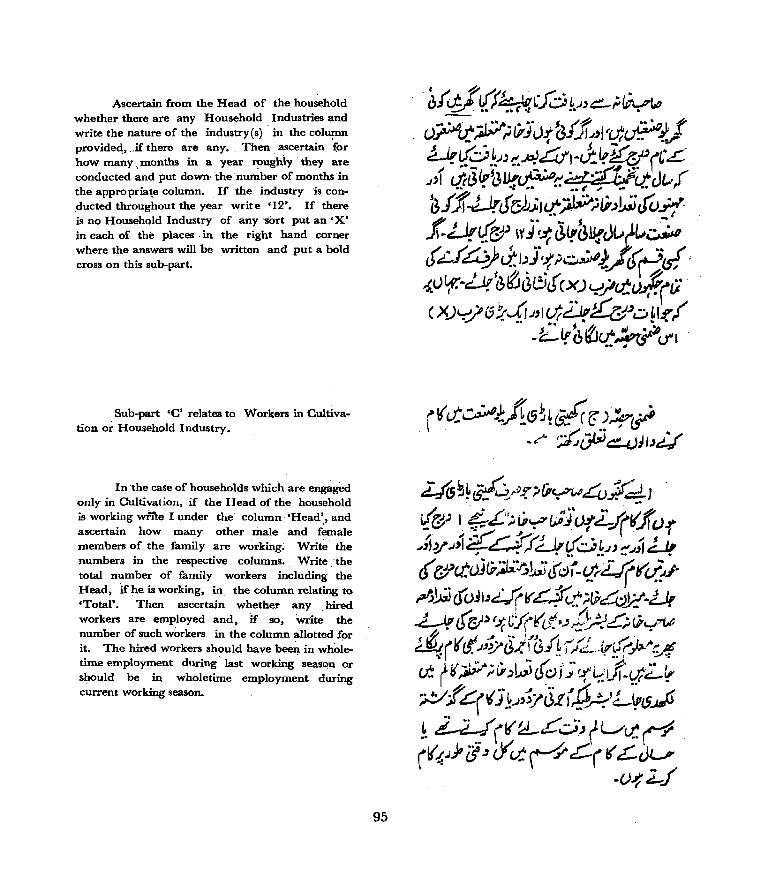
Ascertain from the Head of the household whether the~ are any Household, Industries li/-nd write the nature of the industry(s) in the colu~n provided" "if there are any. Then, ascertain (or how many" months in a year roughly they are conducted and put down, the -number of months in the appropriate column. If the industry 'is conducted throughout the year write '12'. If there is no Household Industry of any -sort put an 'X' in each of the places, in the right hand corner where the answers will be written and put a bold cross on this sub-part.
Sub-part 'C' relates to Workers in Cultivation or Household Industry.
In the case of households which are engaged only in Cultivation, if the Head of the household is working write I under the column 'Head'" and ascertain how many other male and female members of the family are working; Write' the numbers in the respective columns. Write ,'the total number of family workers including the Head, if he is working, in the column relating to 'Total'. Then ascertain whether any ,hired workers are employed and, if so, write the number of such workers in the column allotted for it. The hired workers should have been in wholetime employment during "last working season or should be in wholetime employment during current working season.
95
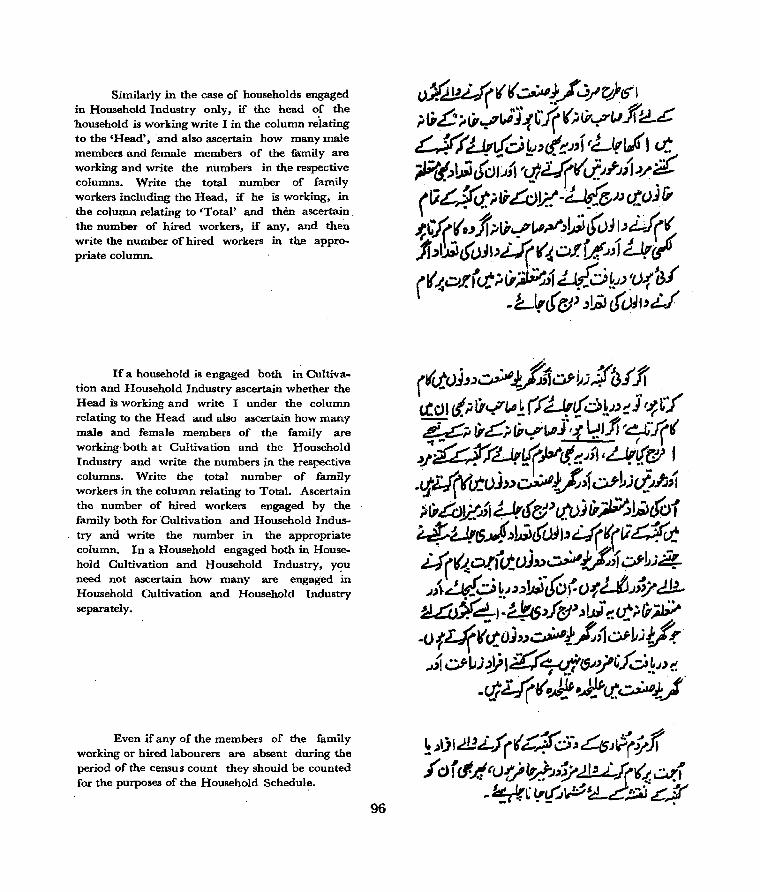
Similarly in the case of households engaged in Household Industry only, if the head of the household is working write I in the column reiating to the 'Head', 'and also ascertain how many male lllembers and female members of the family are working and write the numbers in the respective columns. Write the total number of family workers including the Head, if he is working, in the column relating to'Total' and then ascertam, the number of hired workers, if any, and then write the number of hired workers in the app:t:opriate column.
If a household is engaged both in Cultivation and Household Industry ascertain whether the Head is working and write I under the column relating to the Head and also ascertain how many male and female members of the family are working-both at Cultivation and the Household Industry and write the numbers in the respective columns. Write the total number of family workers in the colUllln relating to Total. Ascertain the number of hired workers engaged by the family both for Cultivation and Household Indus-
, try and write the number in the appropriate column. In a Household engaged both in Household Cultivation ,and Household Industry, y()u need not ascertain how many are engaged in Household Cultivation and Household Industry separately.
Even if any of the members of the family working or hired labourers are absent during the period of the census count they should be counted Cor the purposes of the Household Schedul~.
96
vY.~Ll(l( ,,~!._I' J/~6'1 ~t;~ ;,tP":!"(,i'J_.f(1( (; l?~V ft ~~ o.r LJtl('o~I'cf.C'J,r fLJplJ( t ~ ~i,)~tc)Jj" 'ctrU('I,j_;/"JfI-?/;;£ (tj~~;&;£ov.:.¥)Ju.:()j{; ~'1(! . .,ft;t~~~~~~ .. tWJ~,)fJ(\{ jj.)')'st}U)"Uf t{.:( ~J.'L{.JJ J Llt(/, (I{' {~J.'r <t ~tit~fJ Ll{.;j ~I) ~V{3/
·L.lttS'e:p ~!PJ cJ'VJI,L.f

IIi. the case of households engaged in Cultivation only, put 'X' in - the columns relating to 'Household Industry only' and iBoth in Household Cultivation and Household Industry'. Similarly, in the case of -Households engaged in Household Industry pilt 'X' in the columns relating -to,' Household Cultivation only, and 'Both in House,. hold Cultivation and Household Industry'. If a household is engaged both in Household Cultivation and Household Industry put 'X' in the columns relating to, 'Household Cultivation only' and 'Household Industry only'. If a household is not engaged in either Household Cultivation or Household Industry or both.put 'X' in all the columns and a bold 'X' on this sub-part.
The test for a worker is whether a person is actually working in Cultivation or Household Industry or supervising or directing work thereon.
B. Instructions :for enum.erating individual Dl.eD1bers of households.
1. Yeneral.
J. Enumerate all persons who are normally resident in the household i.e., those who live in the household and a]50 those who have recently become members of the household through
97
~v~.(,J~.J~~ ':J {.r }~ "tj((V"rk~:!( (<5" I) 1l3~~lj!
. ¥.,(lfVr 1(11 ;: ..:J.~~
~'"'~(t)!~~J.P~.r.)IJIC~" ~ ~.)ectCS;JlP~ct"J~It)I~$.r.)J>J
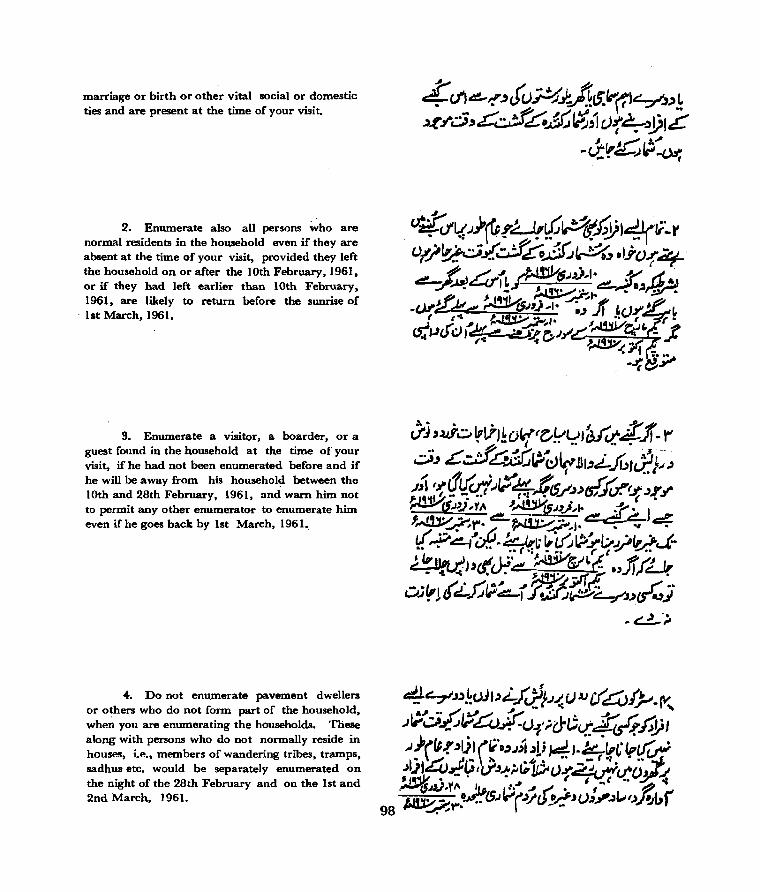
marriage or birth or other vital social or domestic ties and are present at the time of your visit.
2. Enumerate also all persons who are normal residents in the household even if they are absent at the time of your visit, provided they left the household on or after the 10th February, 1961, or if they had left earlier than 10th February, 1961, are likely to return before the sunrise of
. 1st March, 1961.
3. Enumerate a visitor, a boarder, or a gu~t found in the household at the time of your visit, if he had not been enumerated before and if he will be away from his household between the 10th and 28th February, 1961, Imd warn him not to permit any other enumerator to enumerate him even if he goes back by 1st March, 1961.
4. Do not enumerate pavement dwellers or others who do not form part of the household, when you are enumerating the households. These along with persons who do not normally reside in houses, i.e., members of wandering tribes, tramps, sadhus etc. would be separately enumerated on the night of the 28th February and on the 1st and 2nd March, 1961.
_,., '" '. -~,.
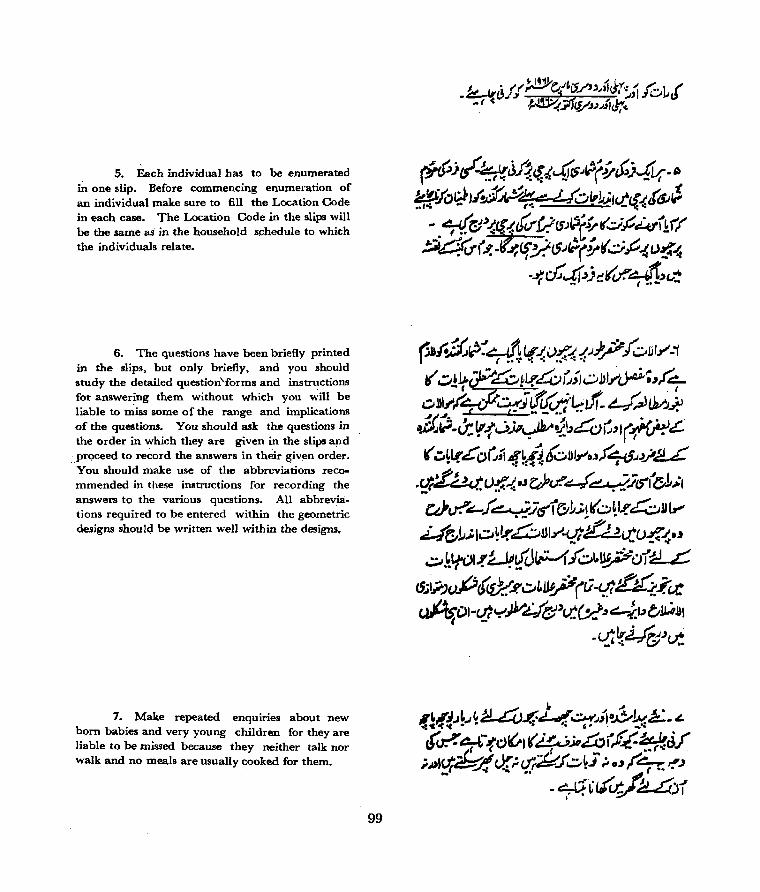
5. Each individual has to be enumerated iiI one slip. Before commencing enumel:ation of an individual make sure to fill the Location Code in each case. The Location Code in the slips will be the same as in the household schedule to which the individuals relate.
6. The questions have been briefly printed in the slips, but only briefly, and you should study the detailed question"forms and instructions for answering them without which you will be liable to miss some of the range and implications of the questions. You should ask the questions in the order in which they are given in the slips and
',.proceed to record the answers in thcir given order. You should make use of the abbreviations recommended in these instructions for recording the answers to the various questions. All abbreviations required to be entered within the geometric designs should be written well within the designs.
7. Make repeated enqUlnes about new born babies and very young children for they are liable to be missed because they neither talk nor walk and no meals are usually cooked for them.
99
(f~)tI~t{J4"=i4(S'~~(~"j..{Lf-c. .k!tL/O~t.I~~~ L/Q"l;,crt.fJ.'(5.;~ •• ,.; t4> •• 0.: ,_
- .cn(~.){(f.lwV.(f)';f~(..::J~~'1r''( ~4U-i'~ -~'fy'($;~(;'i';:;~i l)~-!i
·~c.C4_'j~I('cr."~(..=
~ • -!.I • J. , ? J. ~.! t'" 1 .. ».r~.)~·~.~t({V~I:,)~.i~.IJIy'."I
If ~,)J.£a~J.P'4.>u;'~bly'~:,r~ O»"f'4CP~j~Lf'~"t..~vt ~V0~ ( ,. __ •• 1 •• •
~~-6;~.f'_:')?~~b4:>~'I(~tk'c:!. (.:,~l(£oG;j ~hfi (uJlI""u,('4-6.)~1:!..£
... J (II' ~.. .... "t..., t'" - - .I I .'.!~(.)~-t. d "if-~t::!..A..d...I($'Ilf,t;J';1
c.dtr.'~f~;cflt:t1,;!I(~~I-!~JI" ~~1;1~~!.r~~1_""-0'~U:(j~{." ~.~IfOI.r~~~~f'~I.~o1'~
c5;~)~(~.P.~LjJ;/(ti.C!tJ:t:£'.r.i' cJ! ~OI-c.tr~)YU'~~~~" t:!..-_J:ubJ.LAJtI
-~~J.J&"u!
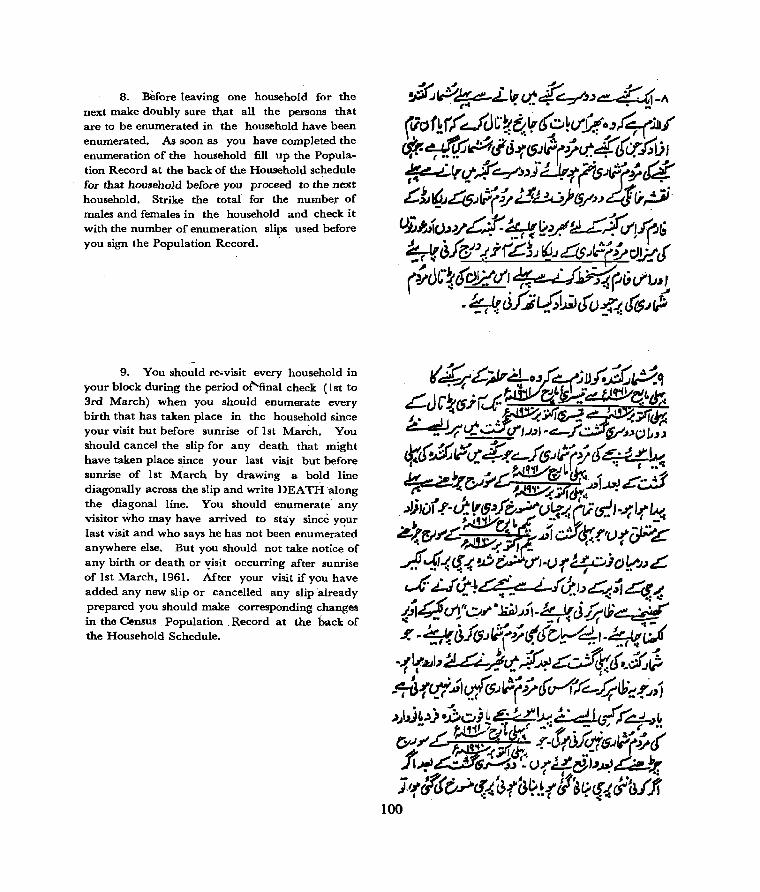
8. B-efore leaving one household for the next make doubly sure that all the persons that are to be enumerated in the household have been enumerated. As soon as you have completed the enumeration of the household fill up the Population Record at the back of the Household sc~edule for that household before you proceed to the next household. Strike the total for the number of males and females in the household and check it with the number of enumeration slips used before you sign t.he Population Record.
9. You should re-visit every household in your block duril1g the period ot'final check (I st to 3rd March) when you should enumerate every birth that has taken place in the household since your visit but before sunrise of lst March. You should cancel the slip for any death that might have taken place since your last visit but before sunrise of 1st March by drawing a bold line diagonally across the slip and write DEATH "along the diagonal line. You should enumerate" any visitor who may have arrived to stay since y~ur last visit and who says he has not been enumerated anywhere else. But you should not take notice of any birth or death or yisit occurring after sunrise of 1st March, 1961. After your visit if you have added any new slip or cancelled any slip "already prepared you should make corresponding changes in the Census Population Record at the back of the Household Schedule.
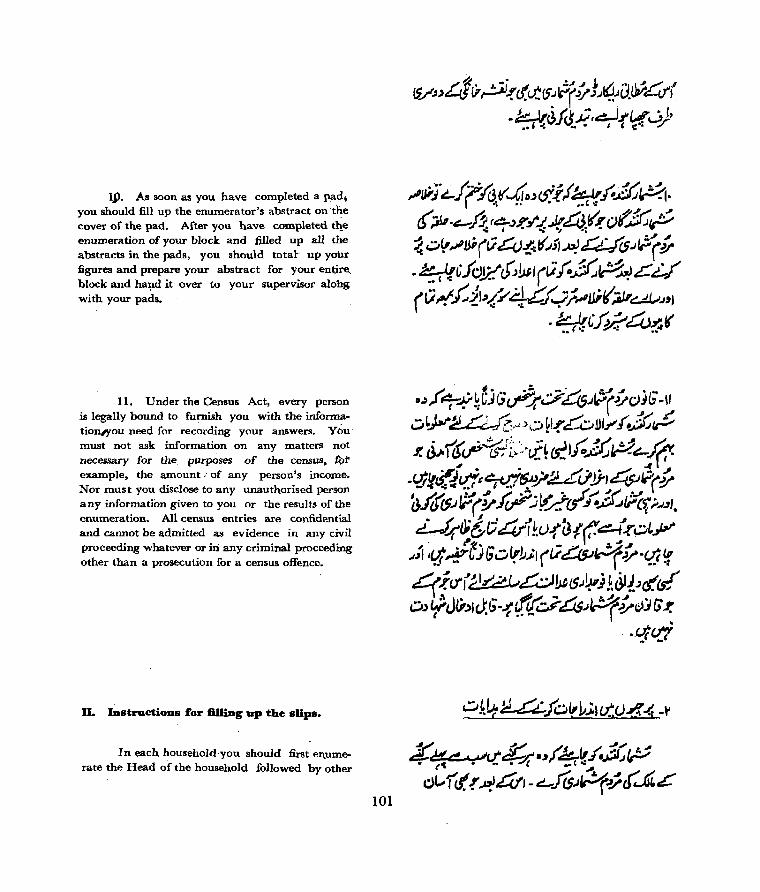
Ip. As soon as you have completed a pad, you should fill up the enumerator's abstract on the cover of the pad. After you have completed tl!_e enumeration of your block and filled up all the abstracts in the pads, you should total:- up yoilr figures and prepare your abstract for your enti:re_ block and hand it over to your supervisor alohg with your pads.
11. Under the Census Act, every person is legally bound to furnish you with the informationlYou need for recording your answers. YOU· must not ask information on any matters not necessary for the. purposes of the census, rof'
example, the amount .. of any person's income. Nor must you disclose to any unauthorised person any information given to you or the results of the enumeration. All census entries are confidential and cannot be admitted as evidence in any civil proceeding whatever or iIi any criminal proceeding other than a prosecution for a census offence.
D. mstrudioDs lor &lling up the slips.
In each household·you should first el'l.umerate the Head of the household followed by other
101
15./~:>d ij,_::;;j .fd'.d:.(}~~.v L~.JatV4r -~t!~J<tk'~!~__;)~
~ui'J~jr4t(4o:>~.r/~:.f.ACP.1. (,:;1I·&.-4('7".)F.,.~~~:t-!O($p ~ ~~,JIJji(Lf cCv~t(.J;j.R:' ~.I~(;'
. ~ t{'fcJJi!.'~~J (t.i.f...a::~~£..) (C;~;:;i'''~Y 4£.(-?}~Ji(('~c::A,.IJ'J . . .1:f: (~rcf ~ .co~r
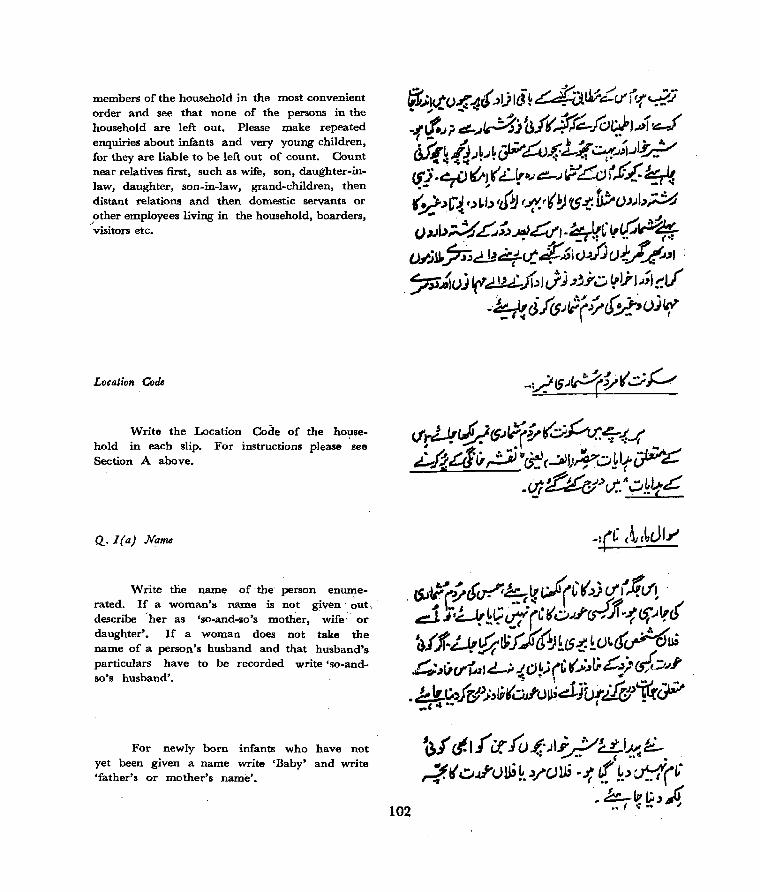
members of the household in the most convenient order and see that none of the persons in the household are left out. Please I;Ilake repeated enquiries about infants and very young children, for they are liable to be left out of count. Count near relatives first, such as wife, son, daughter-inlaw, daughter, son-in-law, grand-children, then distant relations and then domestic servants or
-,other employees living in the household, boarders, visitors etc.
Location Code
Write the Location Code of the household in each slip. For instructions please see Section A above.
Q.I(a) Name
Write the name of the person enumerated. If a woman'~ name is not given ~ut .. describe 'her as 'so-and-so's mother, wife" or daughter'. If a woman does not take the name of a person's husband and that husband's particulars have to be recorded write 'so·andso's husband'.
For newly born infants who have not yet been given a name write 'Baby' and write 'father's or mother's name'.
102
(}f ct.1_( if. fU.(·JI~k ~ ~£.. ~l(v";<.)U;~ . .)/(.)U;·.I/ {.~.)~(~.
_ .b:-." (;. J ;r •• I -:.. "

Q..l(b) Relationship to the Head rif the ,household.
In the case of the Head of the household write 'Head'. The person who should be treated as the 'Head of the Household' has been fully explained in Part A. All relationships in this question should be recorded in respect of that person. In the case of relations write the relationship in full. Do not use words like nephew, niece or uncle, but state whether brother's or sister's son or daughter (for nephew or niece) or father's or mother's brother (uncle). 'Son' will include 'adopted sop' or step son'; similarly for a daughter. In the case of visitors, boarders or employees Write 'visitor'. 'boarder' or 'employee' as the case may be.
If on the check or revisional round between the 1st and 3rd March the Head of the household as recorded previously is found "to have died, the person in the household who succeeds him by common consent as Head should be recorded as Head and the relationships in all other slips will have to be suitably corrected. The slip of the dead Heat! of household will, of course, be cancelled.
In the ,case of places like messes, boarding houses, chummeries, etc., where people live together with no ties of relationship, the manager or superintendent or the person who by common consent is regarded as the Head should be regarded as Head' of the household.
103

Other members should be recorded as 'unrelated' in this questiun.
Q.. 2 Age in completed years last birthdq;y
Write age in years completed last birthday. For infants below one year of age, write '0'. You will find many persons who cannot state their age correctly. You should assist them to state the correct age. If you are not able to elicit correct age directly, you should stimulate their memory by' referring to historical incidents or religious events etc. You may use any local calep.dar of such events that may have been prepared for' the purpose.
Q.. 3 Marital Status
For never married write NM
Married write M
Widowed write, W
Separated or Divorced write S
For a person who has never been married write 'Nl\1:'. For a person married, whether for the first or another time, write 'M'. Write 'M' also for persons who are recognised by custom or society as married and for persons in stable de facto union. Even if a marriage is disputed in the locality write 'M' if the person concerned says he or she is married or in stable de facto union. For a widowed person, whose husband or wife is dead, and who has not been married again,
104
• ...e'l!':;;'di:::.~~ilVc.t; ~ ~ ~ J.,,; J L.; (,fj' !
, " J~(3r0~t:;.&'I/.'~/c4-1 ,:,.~cr;.fS.)C.tfcf J~I.i~/~£P0-U. ~ ~;J ol-Lltill",-,':;':";:(~ .,:.;,.,(£.-'",,! V.fLlt~: j~"t;;u.U:-0.die;~.(~ ~~c.(£l~!iJD;"~ldJ;,)~¥.&,~ ~!;;t.1.I~~;,~~tCe:_..r4~}-ti.ij~tt/.
•• II ••
"'..i~ct;;~4t"L·~"":;CS.)t".))~f(-v{i:./
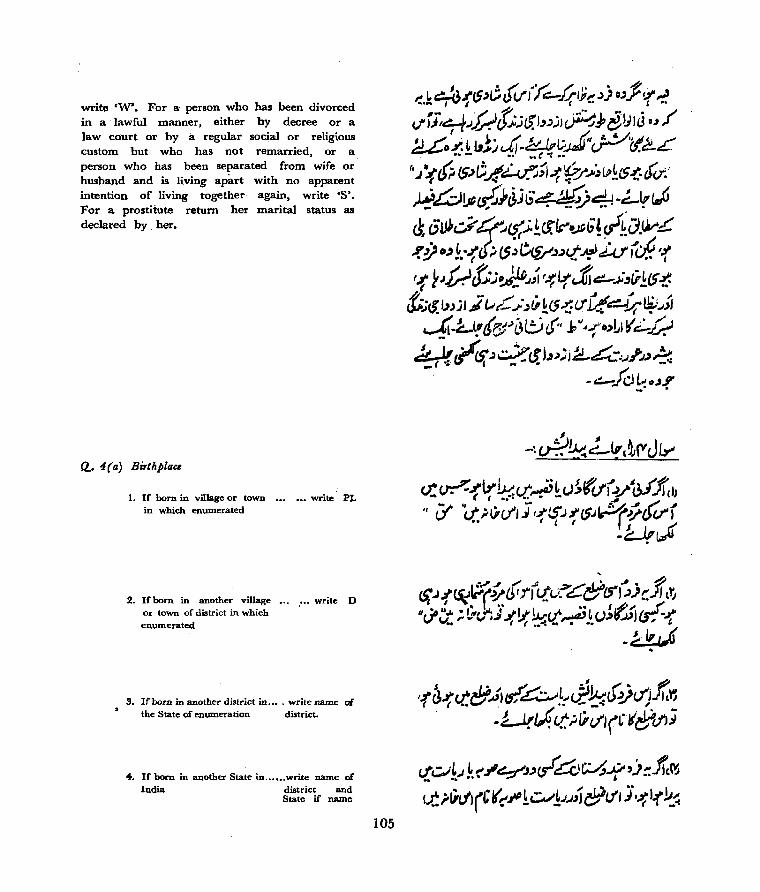
writ!! 'W·. For a p!!r5on who has been divorced in a lawful manner, either by decree or a law court or by a r!!gular social or religious custom but who has not remarried, or a person . who has been separated from wife or husband and is living apart with no apparent intention of living together again, write'S'. For a prostitute return her marital status as declared by her.
Q.. 4(a) Birthplace
1. I( born in village or town in which enumerated
••• write PL
2. Ifborn in another village ... . ••. write D Or town of district in which enumerated
S. If born in another district in .... write name of the State of enumeration district.
4. If born in another State in ...... write name of India district and
State if name
105
--~-j ~ -: c.r:; ~ ~~, ~J(Y J 1".-
u.:~{tr~<t~k()~f(.f(.v$t>f$(b If d' ·(I.'_;lic.lJ}'~~.J{CSJ~r:.;,.tf(/r
-~~
tt.';;';!.J ~.( -"'~J_'~ ~1c.:..1~ ,j~Jk~ It.;~cJl(C((rPh=''''!J..J,J&''J:JI~I.fJ.,~
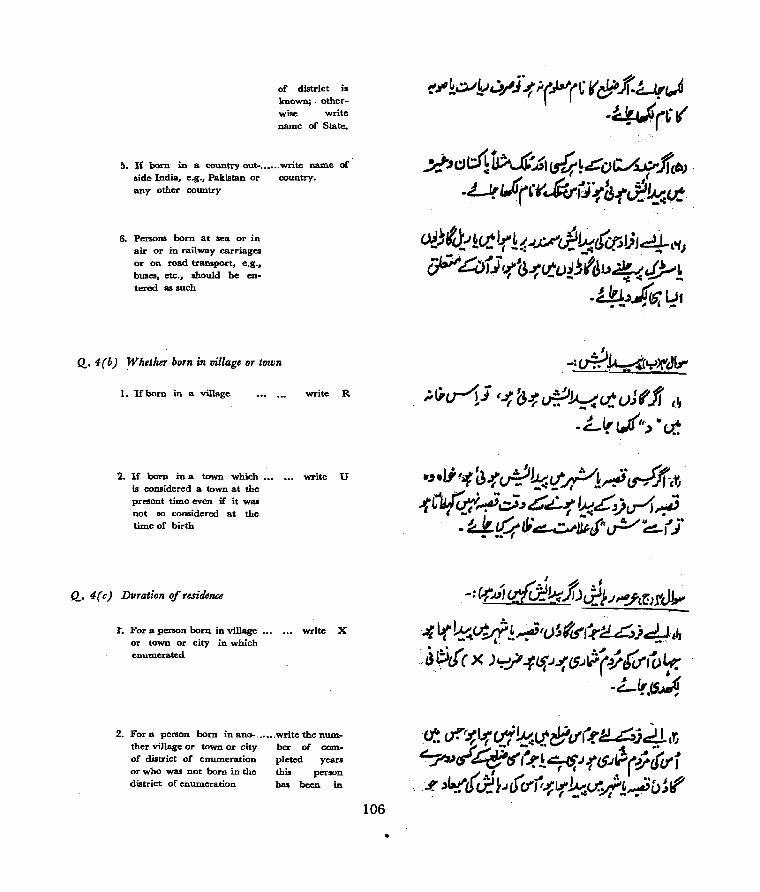
of district i. known; . otherwise write
name of State.
!'l. If born in a country out-.••... write name of side India, e.g., Pakistan or country. any other country
6. Persons born at sea or in air or in railway carriages or on road transport, e.g., buses, etc., should be entered as such
Q..4(b) Whether born in village aT town
1. Iebom in a village write R
2. If born in a town which... ... write U is considered a town at the present time even if it was not 80 considered at the time of birth
Q. 4(c) DUTation ofresidence
... For a person born in village ... ... write X or town or city in which enumerated
2. For a person bOrn in ano-, ..... write the num-ther village or town or city ber of com-of district of enumeration pleted years or who was not born in the this person district of enumeration bas been in
106
•
~~!~~~/j~t~(~v~ff.~~ .. ~!cJ{(,r
.!t!.tdtJ1u;;'$..G1 <4~&Oc:/~ Jfc~) .Ll!I.t(L·f'..Ju()<3i"JE~V!
~ A ' ;
()))fJ_-J!<ttr!1:.JP"£E~(c:(jlh4'~) ~aJ] ~~~<t.C)~-'fdu~ !:~!
.~ ~t..)..('" ~f
.-_..~ .
-: (}":':"~~)("&'
;li-Ml ,.t;(3-t~~d.:()Jff{ t.IJ
. Lir ,.,I't> .. u.t
-: (.f», ct@J~JDJ}J..1 ""_',r:) fJ~ ·..(l(~~4!~'()~f~f:r~)~L~ < d~£f'( X )~..? 4~.J~ (5j!Pr,ywtC) 'f:
. -Llr.(5.J,
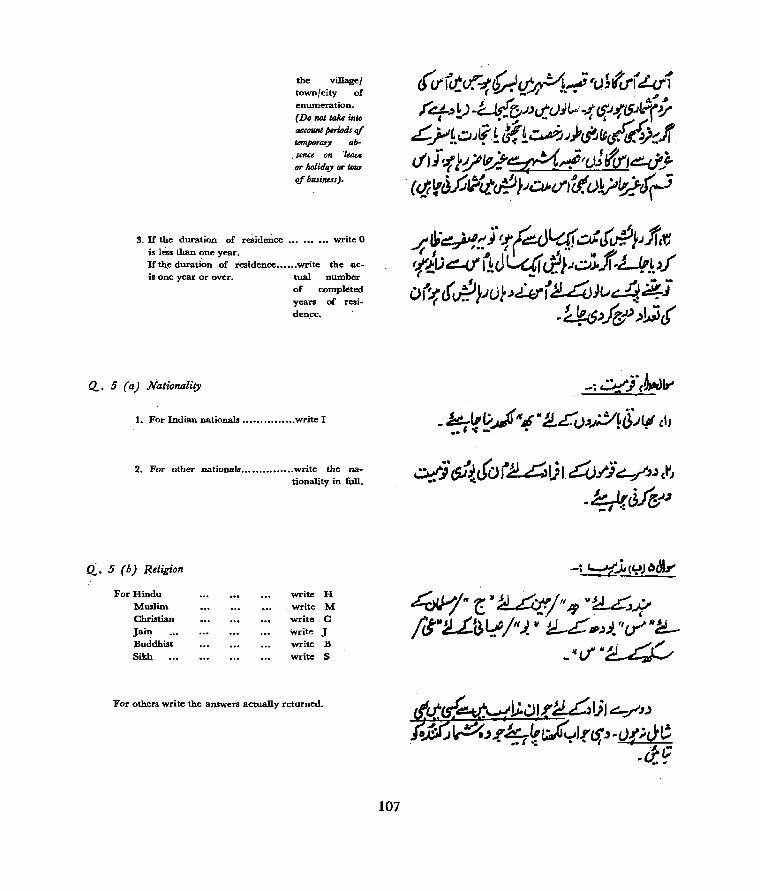
the yilll\g<'/ town/city of enumeration.
(Do not tak, into account periods oj tlJmjloTary ab-
o senc~ on 'kaw or IwlidtV or tour qf business J.
3. If the duration of reside';'ce ••• ••• ••• write 0 is l';"s than one year. If thie durati~n of residence ••••.. write the ac-is one year or over. tual number
of completed years of resi-den,ce.
Q. 5 (aJ Nationality
1. For Indian national ................ write I
2. For other nationals ............... write the nationality in full.
Q. 5 (b) Religion
For Hindu Muslim Christian
Jai,?Buddhist Sikh
write H write M write C write J write 'B write S
For others write the answers actually returned.
107
4~~~ Jr (~Lqf~,{vP.'tJ1t'(j 'rl.U&!-ifr!Jv4J.1J..:;Jj..f-L1t.~)f O(~tS'~}.I()I~~;'~}v~~j
-1:Jt.6')& .)ktc,(
, -~ ~)" ,6J'c)Jy
_ ~(,t;.~ IfJl II ~£v,,~Li>~(,( ,IJ .. '-C_. . .
4tYj" r:: ¥ ~/I(~' u~-¥ (cJtI:u:..a~/fI).1I !d-£JI))i."crllk
_II(/'II~~

Q.. 5 (c) Scheduled Castes and Scheduled Tribes
The answer to this question will be recorded only if a person belongs to a Scheduled Caste or Scheduled Tribe. If the person belongs to . a Scheduled Caste or Scheduled Tribe obtaining in your State, or in your district write the name of the caste or tribe to which he belongs. ,For' ,aU others, write 'X' in this column. A list of Scheduled Castes and Scheduled Tribes obtaining in your S~te or in yqur district is given elsewhere in these instructions. '
If the person belonging to a Scheduled Caste or Scheduled Tl-ibe returns his cast~ or tribe by a synonym or a generic DaJ:lle 'of, a caste or tribe as given in your list, wri!e the name as returned and the name of' the relevant caste!;)r tribe, as per printed list,' within brackets.
Do not write the names of Scheduled Castes in general terms as 'Harijan', • Achhut~. You should ascertain the name of the cas~e when it is returned and write it. If a person is. negligent and insists on calling himself merely 'Hatij:im' tell him that this description will not earn the person any benefits under the Constitution' permissible to Scheduled CasteS and Scheduled Tribes. This may persuade him to give out the correct name:
108
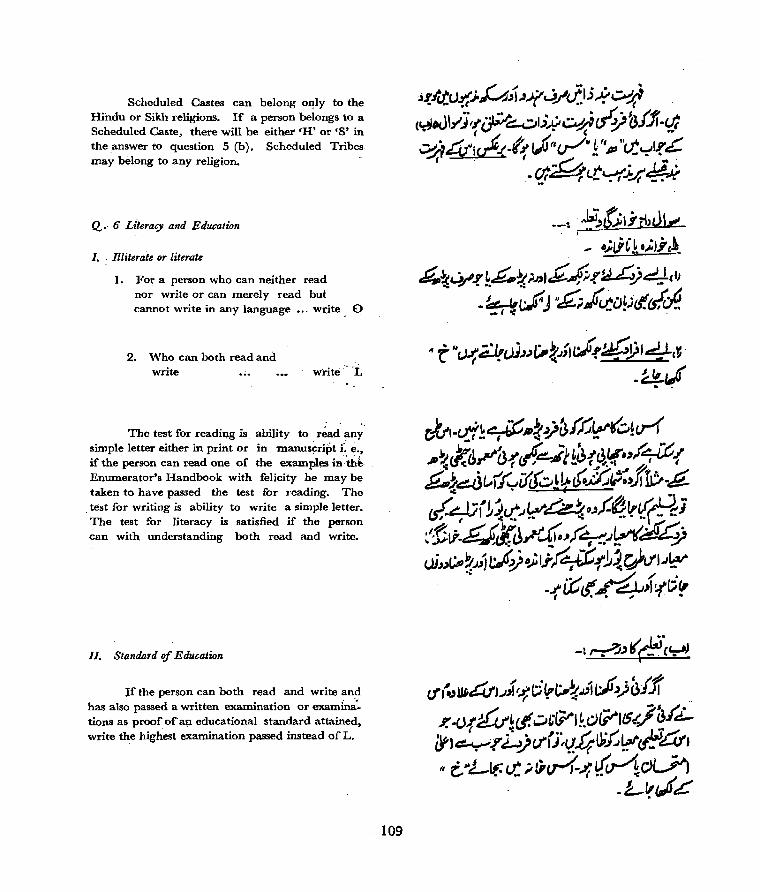
Scheduled Castes can belong oqly to the Hindu or Sikh religions. If a person belongs to a Scheduled Caste, there will be either 'R' or'S' in the .answer to question 5 (b). Scheduled Tribes may belong to any religion.
Q. 6 Literary and Education
I. ' Illiterate or literate
1. For a person who can neither read nor write or can merely read but cannot write in any language •.. write 0
2. Who can both read and write . .; .. write" °L
The test for readiI).g is ability to r~ad any simple letter either in print or in manuscript t. e., if the person can read one of the examples iH the Enumerator's Handbook with felicity he may be taken to have passed the test for reading. The test for writing is ability to write a simple letter. The test for literacy is satisfied if the person can with understanding both read and write.
II. Standard of Education
If the person can both read and write and has also passed a written examination or exanii~~ tions as proof of'a!). educational standard attained, write the highest examination passed instead of L.
109
;;J:rcJ:.()~;,Mft".J.(J/J.lj~'::p..1 '
(~.J\_,I }(7~~I;~~.jcl'~3fj,'-l/t' ~4:ich.-4~"u-/u 1 "61 "c.tyl(.:C
, . -o/~c.t~;'-4¥..J(
__ ~ ,,~~tf;';'thJ\, . r~
- ·;JiCi·..,:J)'tl
H;.~u/.f'~£.~).I,J£.~.(~)4,f) - ~I wt;..fJ n£;~~D~;tf.tsfrA
If t "c.J{'.a=l!V))",t;,.t.J;,c,{.r~»J4c~ .~~ 11/
d't.lI-Ld!~ .. ~~~f,c~(~~a-{ "'iJ:d,{31~t:::..;(!~!_,~.'(u~'7it! ~~~t.-ii,:,ifo~!~(..J::;~:J'rc,.~ £Sf-~;(1~~~~~~o-'f-~Ir{&j ~~li-~¥u/4-~~ :.I~~~ u.i_'')~~J,J c.I~~lj~!1{~dl.JkV
--f;:;:1{ ~ 1..r ~{j!,
-:~.)I(~~~
"J~~4tJ.J; ~ ti "(;,~'"" L:J' -?)~f1i F. .o1~~cJ! ~~·~I~.d~IlS'~}'~.(.l... i1,~.r~)u";'j~(/.4U,:r.:~~~t
fI t"Ll(.(.(. ;,~M-~{~OV"I , .!-~~~
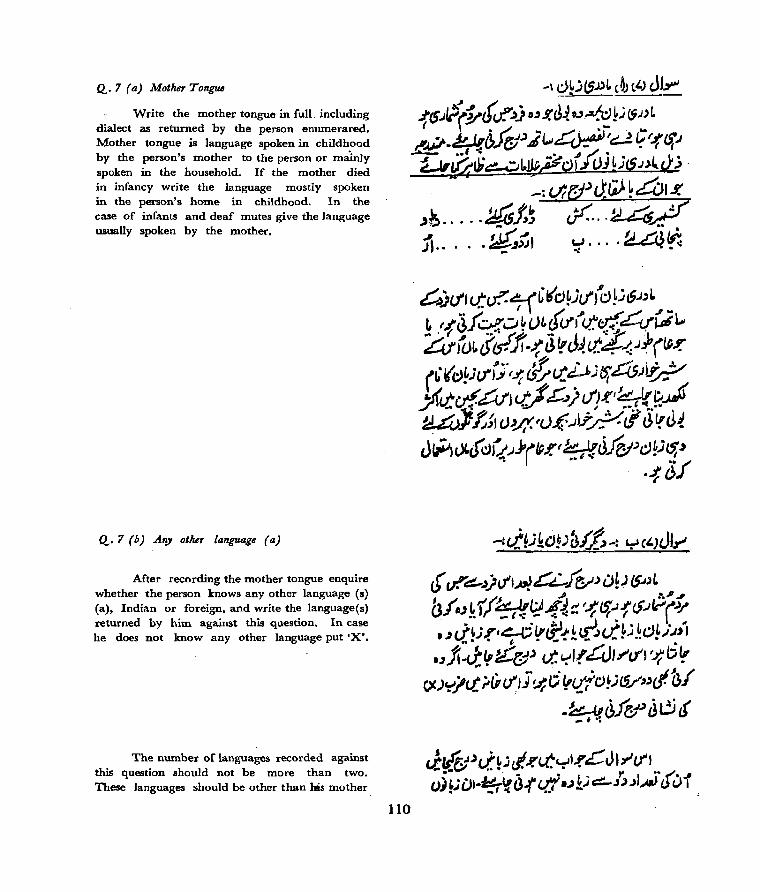
Q..7 (a) Mother TongU4
Write the mother tongue in full. including dialect as returned by the person enumerared. Mother tongue is language spoken in childhood by the person's mother to the person or mainly spoken in the household. If the mother died in infancy write the language mostly spoken in the person's home in childhood. In the case of infants and deaf mutes gi ve the language usually spoken by the mother.
Q.7 (b) Any other language (a)
Mter recording the mother tongue enquire whether the person knows any other language (s) (a). Indian or foreign, and write the language(s) returned by him against this question. In case he does not know any other language put ·X'.
The number of languages recorded against this question should not be more than two. These languages should be other than his mother
110
~)ctllttr.=7(Gl(d~J(/;'C)P6.J.)L ~ .(/~fq,CJ~u~{()"(l/:'{[L.q-(jt" Lttw~tffsffl.~tJItJ~Lt:?~.J;'((Vy' (L'I( C)~; c.fl'j"f-,( ~ ~ i.-~; ts;47AfdY
Jst'tto.f.f<!J<i;}' £~ j t1'J':/~.~~ ~} 1;;, cJ.vx ,1)'(= .. Af ~ cff t3 'r U~ J~)(.)I,,jC)~~jrlP'(( ~;.1.r~)C1)cJ~; ~~
.. ..fijf
-:c.t~;koP;~.I.t-: YCi.JJIr'
tf ,r.c:..-~)cfl~C£-)rY)iJ~; (,f.JJL
afOJ ~1/~l2'~~ '~~.J1'(j.J';(~ .~cl.~;.(,~~~-!!~ci~J.~d~.I~'''1 uJi-cl"!£~J «.t.~I!£tJl"""(/" ~b(fr
Of.)~/ct ;,(i (/,] ~ d "0'C)~;(5/,'cf.1;1 .~c}fe:p Jt,!j £(
Jl{y'J.: ~,j J. ..rtCyl.r L:' J, '" (.f' I C)j~; DI.~\f tJ4' qf 0.) 1) t:::!...J~ ~tMi' ~ 1
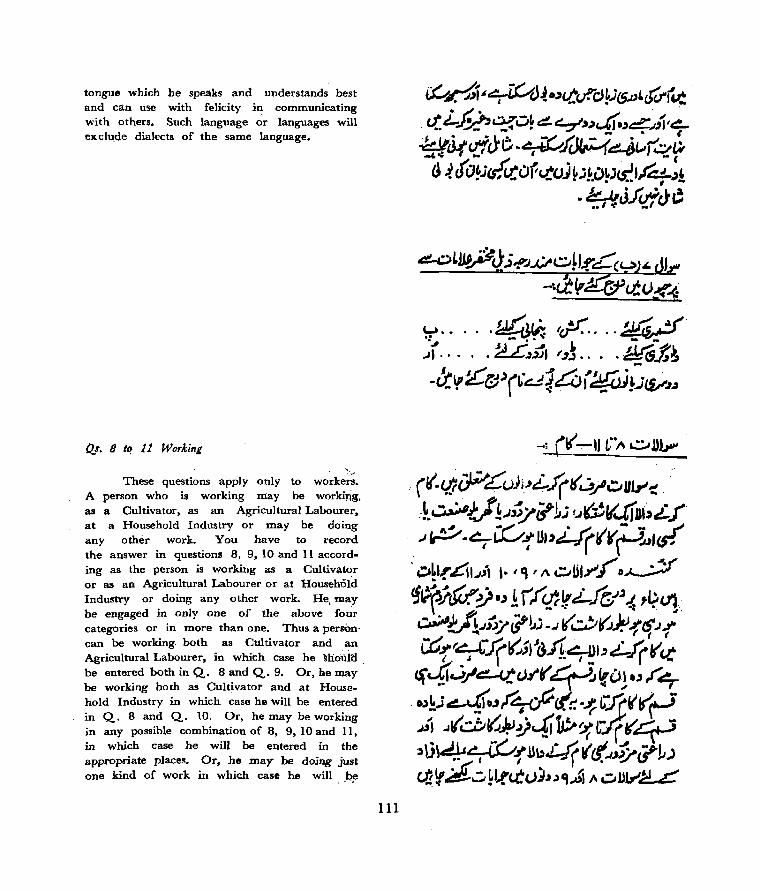
tongue which he speaks and unders~ands best and can use with felicity in communicating with others. Such language or languages will exclude dialects of the same language.
Qf. 8 to- 11 Workinz
These questions apply only to worke~~. A person who is working may be working. as a Cultivator, as an Agricultural Labourer, at a Household Industry or may be doing any other work. You have to record the answer in questions 8, 9, 10 and 11 according as the person is working as a Cultivator or as an Agricultural Labourer or at HousehOld Industry or doing any other work. He, may
be engaged in only one of the above four categories or in more than one. Thus a persOn, can be working. both as Cultivator and an Agricultural Labourer, in which case he ~houla. be entered both in Q. 8 and Q. 9. Or, he may be working both as Cultivator and at Household Industry in which case he will be entered in Q, 8 and Q. 10. Or, he may be working in any possible combination of 8, 9, 10 and 11, in which case he will be entered in the appropriate places. Or, he may be doing just one kind of work in which case he will. _l~F
111
tJ:J~ ,,~~ ."ttd-'"d~;(5.I,'&U-IU! Lt. j_J2-,~u~ t:!. ~'''~.'~.J{j'7
*,1'J.(':1d'~ -~f~~'-'r'qr a ~t()~;tsf'-Cuv~oJ~;~.c)~j<.r!Jk: ,,!
• k.bJfUC?d'~ •• 1., ",.1
~OL~.p<lj~b~~J.f"£'~)~ dJ".., --tc.t{pi~C'&tt ()_.'f"",
-; C_( -:-lJ ~"'I\ ~ JJ'~
.' (l(-i~£())j'c£_J(i(~j4~UUo-'-:! .. :~.~Y~J,)7~1; t..l~I(4fli'Lf Jp...-~~1'u,,~rr~lcsf
'~LI,.c·iI..I;1 '·'9' 1\ ~U'Y"Jo~ .. . Cj~J(u:'~." !ll'ctr~Lf'~"~ ''?cI!.: ~M.J;)7t?L; -..I f( ~I(~ 1tf.J! C6-r¥l(~'IJ~J1~I_,ti-1(&"'c.t cfc.(l..j.t'~()fr 01(D1",f' 4-.• '~J~'" r~(('t..~ c:rc~~ rJ ~ .J('Q~)V~~U>~L:I(f(~ ~\j\4'~!!lb~(cr..J.J~t?LJ ~~~~~I..rc.tvj".),,~ A .,:,uV'.::!..L'
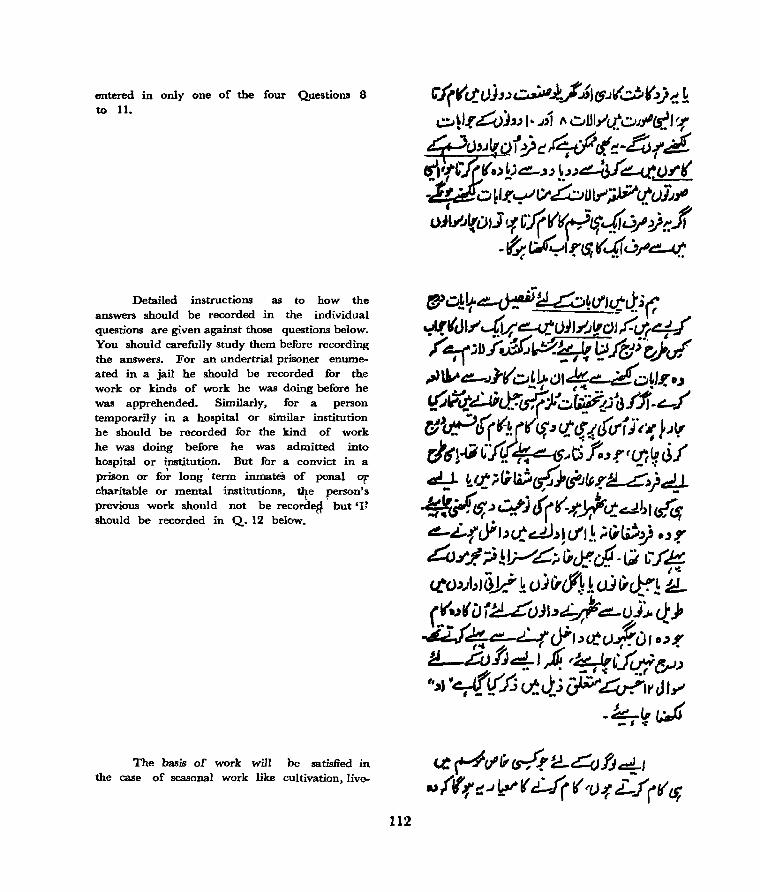
entered in only one of the four Qlestions 8 to 11.
Detailed instructions as to how the answers should be recorded in the individual questions are given against those questions below. You should carefully study them before recording the answers. For an undertrial prisoner enumeated in a jail he should be recorded for the work or kinds of work he was doing before he was apprehended. Similarly, for a person temporarily in a hospital or similar institution he should be recorded for the kind of work he was doing before he was admitted into hospital or institution. But for a convict in a prison or fo~ long' term inmates of penal or charitable or mental institutions, ~e person's previous work should not be recorded but '11 should be recorded in Q.12 below.
The basis of work will be satisfied in the case of seasonal work like cultivation, live-
112
C"J(l(tt{.)jJ.)~).._f.JIG'.JII~k'lj1. ~. CJ ~I.( 4JJJ 1·.Jii {\ uUlyl<t.~JjlCS:' ~ ~-r" ,;1I. t:)C~rt~"~I~ :r~t(., £.l""-~' !"~ .:...tt.ud • :. CI~IJ.'~t:r~JJlJ"'~£tV)~r' OJI_.,JJi(Dlj '4 CJfv'I(~t.fc.f,J/ ~~Jj
. ~ ciI'~I.r<s; (4~.t'.c:::-¢.
~ ~clV cr;(r :d..4fJ ~l Nr"(~.J ~r L..1( ('/)>; L.f(V" t;;
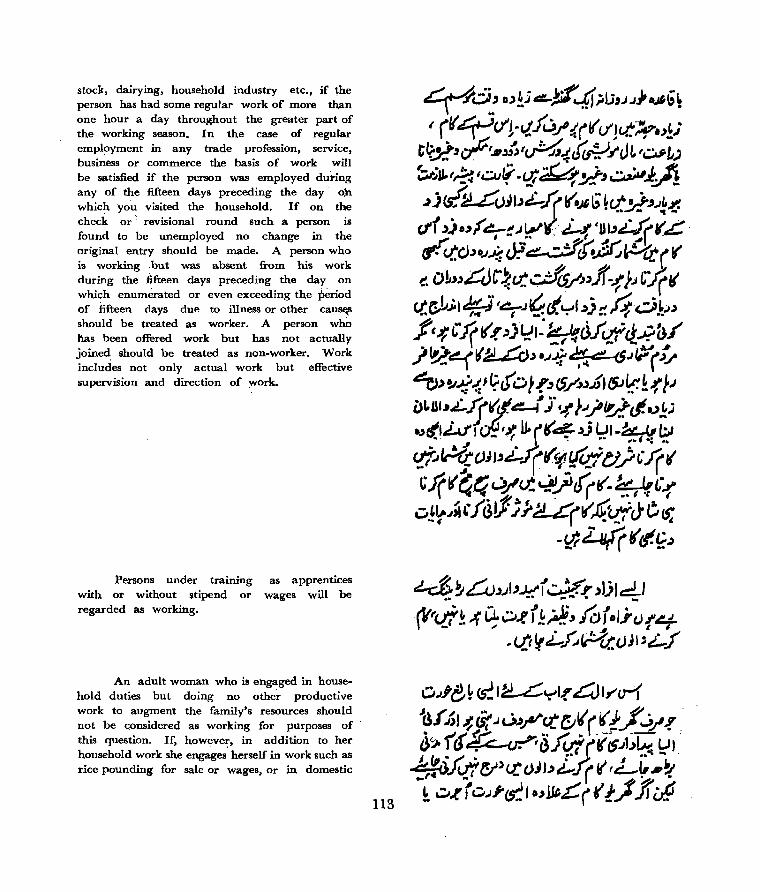
stocle, dairying, household industry etc., if the person has had some regular work of more than one hour a day throughout the greater part of the working season. In the case of regular employment in any trade profession, service, business or commerce the basis of work will be satisfied if the person was employed during any of the fifteen days preceding the day 0)1
which you visited the household. If on the check or \ revisional round such a person is found to be unemployed no change in the original entry should be made. A person who is working but was absent from his work during the fifteen days preceding the day on which enumerated or even exceeding the period of "fifteen days due to illness or other cau~s should be treated as worker. A person who )\as been offered work but has not actually joined should be treated as non-worker. Work includes not only actual work but effective supervision and direction of work.
Persons under training with or without stipend or regarded as working.
as apprentices wages will be
An adult woman who is engaged in household duties but doing no other productive work to augment the family's resources should not be considered as working for purposes of" this question. If, however, in addition to her household work she engages' herself in work such as rice pounding for sale or wages, or in domestic
113
~6..' DJ~) ~;a"',,*,;'IJ".J.J}~G~ ( (I( 4:'ct!-'l'}U/, :((1( (j'lLt~.,.V t~"~I_"J;)t~{d~.1"JL I~L) ~;JI./~ID.I~-u:'(~.J.J~l. ~ - ... (~. ~!
..) J <;.( ~(.)jlJ~1( ((.~ G ~c.t..!J-".J~~ eff .).}uf &:;-t:J~l( i-.f t1)IJ~~(,c" ":ct.d~o.J~J:i~~~c(~~(1( G oJ,'J£Jr~c.t.~/"Jf-11.J C:.fr ~?141t#!-J ''':::'''.JtG, .Ji.J!,,\,J 4d~J~ •• u--' ,we I ... 0. 1
• ".r •• ( ••
.f'~~1((.( .)JL:!':~(irct.id.:ki3.t
.J!?~(~.) 'J~~-<5.1~(lj ~.) '!I..A.t -!:' ~(D f -rJ "/~.).";t fSJ i!-~.f f.l iJI.JU~.L.f(I('''.e!.-( } '.( tJ j4~cI-I"'!:.; ~ctIM(tfi-'¥; 1J,r(~Jj ~J-~i~l?' ~~()JJ:JI£_1({f.-ti<tftJ/';.f( t:f((t;t;~/u!~~t((r'-::r, ~t·1 V~Jf.l~(,"f<3!f.i;'U(I(....crtdJ-c,<s;
-q; ¥r r fI-f:.)
~~U').JIJJ,..I'j' u:.t."r .)JjJdl .. ....... . ... (\'f<d!,I( C;~.ff.~~~ m iDJ}t.){~
. <.!t ~ L;:'tr:{(. (.JJ I '~f
CI.J'e~ ~J~L~J.raJ""u-1
J~.(.6) ~Jir JUJFr::~" r~t/~~: ~'J. rC(~~f~ ('I( £S".Jb~ ~t" ~~Jf0'~)u: C)jlJ,i_,l( ~ fL~.~
h ~J! j C.J~~, o,,~~( r t.J J( ill
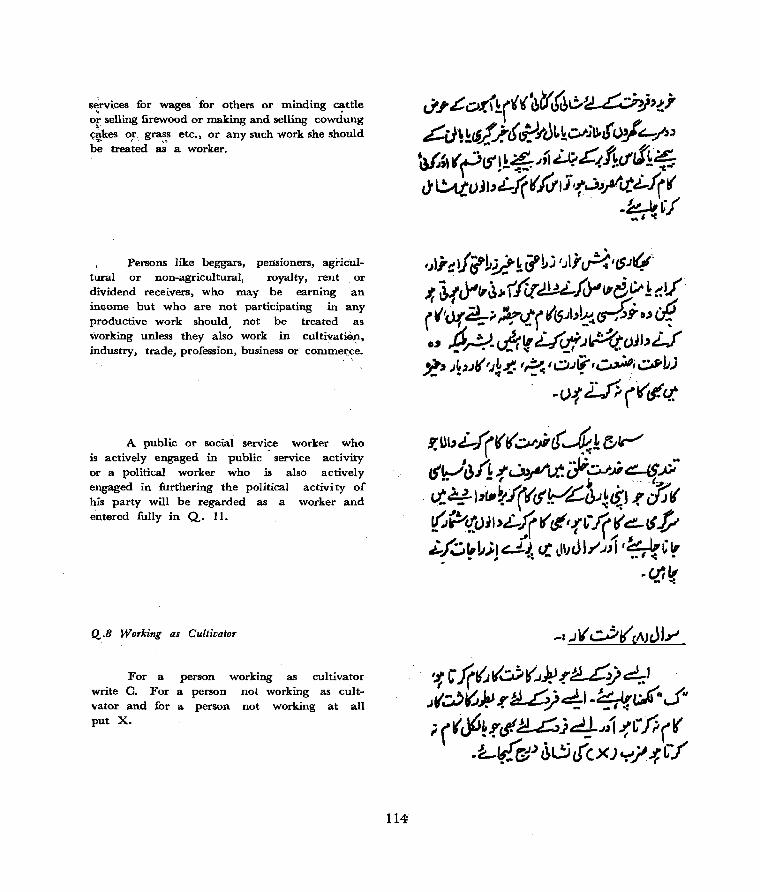
services for wages for others or minding cattle o~ selling firewood or making and selling cowdung c~kes or. grass etc., or any such work she should . '1l.~ ' .. ' , ..
be treated as a worker.
Persons like beggars, pensioners, agriCultural or non-agricultural: royalty, rent or dividend receivers, who may be earning an income but who are not participating in any productive work should not be treated as working unless they also work in cultivatiOn, industry, trade, profession, business or comme.f?e.
A public or social service worker who is actively engaged in public - service activity or a political worker who is also actively engaged in furthering the political activi ty of his party will be regarded as a worker and entered fully in Q. 1 I.
Q,.8 Working as Cultivator
For a person working as cultivator write C. For a person not working as cuItvator and for a person not working at all put X.
tf.r~o.t"!r~"~~~I!.r~.;?.!}'lj ~LJH~L6~.ttJLb::~_";U.,r O:!,-p,
~~'(~IS!~~.Ai~~~f1t1~~ ()'l!.1t()jlJc!-l((.wI)'f'J~tt~1((
-~,/ .. ,-:
IJl;~tf~LUki?Lj IJI';~/C$.JIl!·· i; ~J'«y,,~Jor'.(([ ~f~II'e.~! ~tf· ("'J.r~. ;.)r..t( (lS.Jb~ ~i., cJf ., ~?-ufcl( L.Ec.tf .J~cJJbL.f i!' ..I~')(('.J~-!-'~ I~.JI(I~,~IJ;
-O.f ~ (" tJ! ct.
y'UIJ.i-1(1(1( ~j£(-4! &ir'"
cfJu'(~ .i'~/Lt: C)i;_jjA~P. <t·¥I,~~f((cfV~~.J~ct.) ;~I( ~~t(.()jl'~.fr( (tJ(I{L"R( (t:!-tJ.v
.,.." J .l;' '__. 1_ • .l..I~~t,;J~~: u: LIIJU I""",JJ I (~I,I!
- ·Uil1 .. -;
-: ,i'{ ~I( q\JJJy
. ~'"fr(,{QI(.J1!J.(~:>d::-J Jr~~J.vr.&£~~I-~i"¥r~J" ;, (rJ6~.rcl ~]4..IJi /,L""»(r
.L(f(G1.) ~1.!iLI'(X)~/~r/
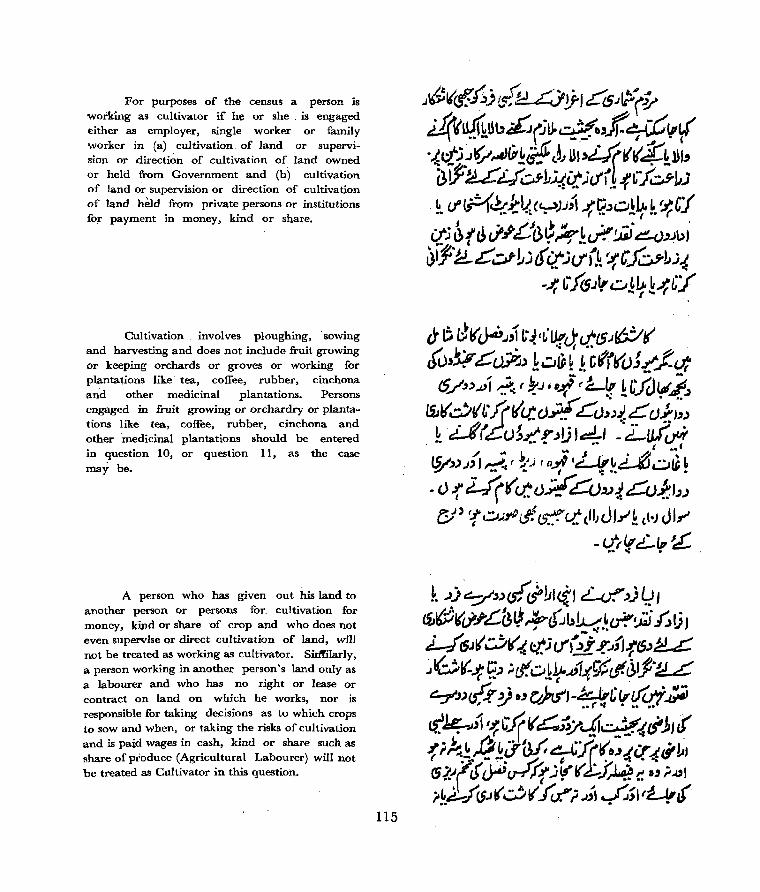
For purposes of the census a person is working as cultivator if h~ or she is engaged either as employer, single worker or family worker in (a) cultivation of land or supervision or directi~n of cultivation of land owned or held from Government and (b) cultivation of land. or supervision or direction of cultivation of land hetd from private persons or institutions for payment in money, kind or share.
Cultivation involves ploughing, . sowing and harves6ng and does not include fruit growing or keeping orchards or groves or working for plantations like tea, coffee, rubber, cinchona and other medicinal plantations. Persons engaged in fruit growing or orchardry or plantations like tea, coffee, rubber, cinchona and other medicinal plantations should be entered in question 10, or question 11, as the case may be.
A person who has given out his land to another person or persons for. cultivation for money, kipd or share of crop and who does not even supervise or direct cultivation of land, will not be treated as working as cultivator. SirlfilarIy, a person working in another person's land only as a labourer and who has no right or lease or contract on land on which he works, nor is responsible for taking decisions as to which crops to sow and when, or taking the risks of cultivation and is paid wages in cash, kind or share such as share of produce (Agricultural Labourer) will not be treated as Cultivator in this question.
115
J~t(~£jLt{1d £d~14J~(~ d('uf.{ku,,~(ju.q}f:,jf-~,,( ·{ct;~~~Iit!~ ,~) ul,LJ(vt(4=i'»b tl~~U CS"1J{it ;t.fl.~ -f(r~~) ~. £ftF{~k~ {':-»J;j {'I?.)CI!~~. '.I; C)
ttl ~t ~ d.l'L!£>~ ~!~!.UJ·~.uu" ~lj'!d.C~~j6ct·hfr.~ ,?c.f~JJ;{
-~ L-:rC5J"u.~~!~C:J
d'D LtI(J-a'.J,1 L·~I~·u.r~~C5.J(6.:Ii( J0)~ eV;P-.J) ~wfP ~ k ct(Y()J~.J:u: 6'/J '.JJ/ ~ ( ~.J 111.1 (L~ H:JV(,()"
~I( ~~; 1(11((. u;i!" tCt);){ ~ cJt;;~ ~ L.ft~()!~.r)!JI~1 -L-urV1
/ .. j, ... J. : .~' .~ lY'~).I' J ~ ( ~.i (fJ-1'~~d-luc..:,.~ ~
~ " -f Uri( tt (.J.;;r-Cv»{ L::u..t. J.,) e:J> r.;;J,;~£t t.>::rc.t. (II)JL""~ ,I·j Jl,..,
- (./'(('L.(' ~ - ttl •
k .))~~)csfc5-'11<tJ Lif.,)l:.!1
t£~r".1"£.(31! ~d".Jb~.~~~· ~~, U ($.It( Q~-I: c:t; tf'~ ;:-JfJ.f(5.)~ ~ 0r.{, ~-' ;s tJ! O.~lt.Jif{r§ tf. jJj'!d.L ~~)t/,Y. V .., D>tf'I-~!C ttt('!i ~ ~~{t 1~C"1 V~»yc-{l~,tfJ,J c( of ;k.~ t?~iY(3f, 7'Jr~o.t:(C( -t. Ii' ~I "l«f~~ j~~~f~c;.' ;.JJI. , Le.;,....Jcs.J( ~"f r.T.'IJ" ~,J IL-f,( - ..
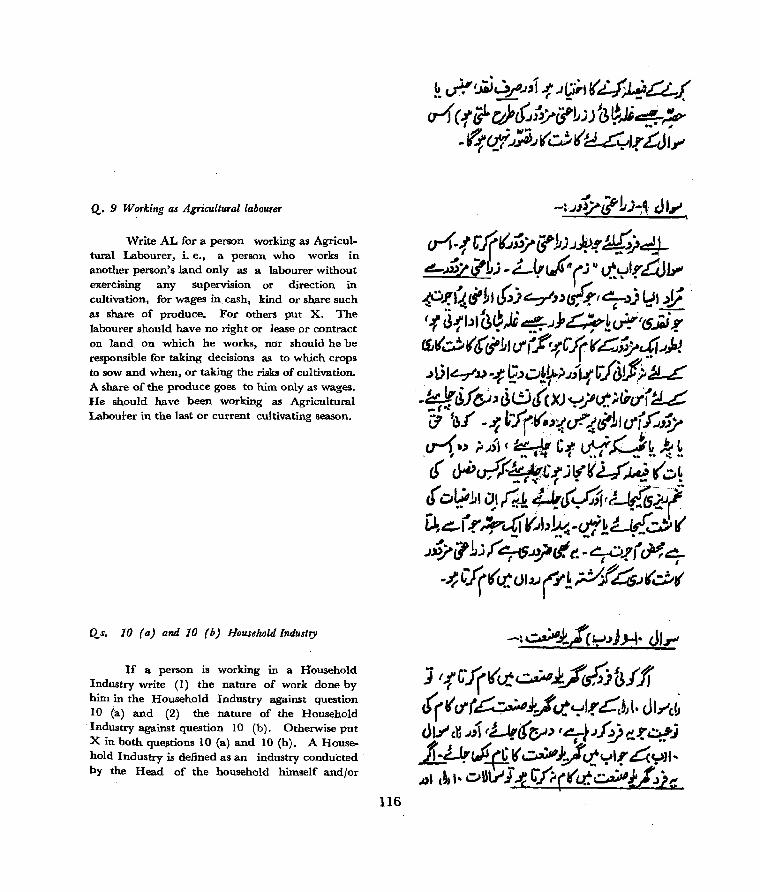
Q. 9 Working as Agricultural labourer
Write AL for a person working as Agricultural Labourer, i. e., a person who works in another person's land only as a labourer without exerclsmg any supervision or direction in cultivation, for wages in cash, kind or share such as share of produce. For others put X. The labour~r should have no right or lease pr contract on land. on which he works, nOr should he be responsible for taking decisions as to which crops to sow and when, or taking the risks of cultivation. A share of the produce goes to him only as wages. He should have been working as Agricultural Labouter in the last or current cultivating season.
Qs. 10 (a) and 10 (b) Household Industry
If a person is working in a Household Industry write (I) the nature of work done by him in the Household Industry against question 10 (a) and (2) the nature of the Household Industry against question I 0 (b) . Otherwise put X in both quelitions 10 (a) and 10 (b). A Household Industry is defined as an industry conduCted' by the Head of the household himself and/or
116
oJ .. J -:.JJjfi/' ;J)-,q ,HI'" I
u-1-! C:{lG.u_/£?L).JJp.r ~)4-4-AJ)-1J# ],I) • Lt,~ (j" e,t",!.r £db-' _(ULIJ. ';'1, ~i"" --'",.) I ~(~.) '; u, .)1: . ~ _.:,t;' t_)J~.. ts:-.f ,'.r... ~ (.fd-flJt(l~,li~.J.P~!,*(CS~·.r C£l(~((cflJt.fifr.fC1(V~~/cfiJ~ ~l)J4J) -~ ~.)~!lt)J;J{L:fJ!.f;.~ -~~J.r~, Jt.;j(cXJ y/v::;,(icil~ rJ 1~f' -.'( t:rrl(.~!:(r.r.{~~J(j~J~ .u-f" ;.J)i c ~-t( C-f ~P.k k ~ tf' ·~'v.4'~L-.f J~((; f"',.~ i. .. L v-; _f.,. ( . ~~ '-'_ (oY,11~1,r;,!4J[(~,~~~(· ~~(.r~~VJb~ .. cd!Llr.(~1( .J;?i/1J I &:;-6.J!i1l1fl'. • ~..r( eM 4--~V((lt.()'.u(.t!P.l'4(O(
-:~}..j(':-J .. JJ-\' uJ, j (ftJ(I(u:~l.f~ijfj,' . ((I(()"(~;'::Ic.t':JI.rCc~Jl. cJb"',~ 01-"" ,YJ.I" (!..Ir((~.) '7}.Jf:Yc...r~j k.LJr~ 4.~ ~}JU:,=,I! ~<:->JJ .. A' ,'J" oU\.r'J"';: r/;.((ct:~thjf.

,mainly members of the household at home or within the village in rural areas and only at home in urban areas. The industry should not be run on the scale of a registered factory. Thus the main criterion for a Household Industry is the participation of one or more members of a household, in rural areas. In the urban areas the industry ~hould be confined to the house. You should car'efuliy keep in mind the definition of Household Industry in the rural area if you are enumerating a rural area and the definition in the urban area if you are enumera,tlng an urban area.
A Household Industry should relate to production, processing, servicing, repairing or ~aking and selling of goods. I t does not include professions such as pleader or doctor or barber or waterman or astrologer.
A person though he may not be working in his own Household Industry may be working as a paid employee in another Household Industry. You should, therefore, enquire whether the person who is not working in his own Household Industry is working in any other Household Industry' and if so, write the nature of the work done by him against question 10 (a) and the nature of the Household Industry against 10 (b).
117
~.tf(?o/.l)8f'~-'{ _ ~f.I.Jjptt~}.:tLS"/"J~~ C");,((Lt ~I1Jy ~J£,;:.,~-.i( L"1(( .c'(;U, , Zi::J_OJ,f'e-kt'ir~jcf"'I'I'" f"" -or (.:.r ~ r .J if ),-)":;' .~.I) I ~:)0 (t( <.t ~J....I ~1.'1ff(:!,,1(l(cC~!..J'(~;; ~ f~; '((()"(Lt.yl.rcCC~J I· JI,J ~ C"f ${t'~C~~.!.I"'-';J'.(4~ 1·.1" ~G:}.J

Q.. 10 (c) .(f Employee in Household Industry .
This question will be filled up only for a person who is working as a paid employee in ·another person's Household Industry. In his or her case write E.E. For all others put X.
The following examples will illustrate how questions 10 (a) to 10 (c) should be filled up for persons working at Household Industry :
Q.. 10. Working at Household Industry·
(a) NatUre of work
1. Spinnirtk yarn
(b) Nature of Household Industry_
Spinning yarn in Ambar Charkha
(c) If Employee
x
2. Dyeing and prihting yarn
Handloom weaving x
3. Threshing and Flour making cleaning grain chakki x
4. La,!?ourer Oil ghani E.E. employed for crushing oil
.1lS
.. .. ~./ .JI? ~(.Ju.~U'.)~.)rlS~c.:;:,?I""I-t l~J.I· JI.,...
~if~.)~J~ U.I"ylY.\(U 1-""0"1 "
Lf;1J.JJ.~c.t~tf~)G:-/·u6. d:::(J~d'~..I_'~J7.I4-1 ~ ,1(" yY~!)1 ~/')J-L(r I,,6(U) O:,-:",Ir.
. L~Ji~1J ~ L:Jc(C ~
..;:;~_, (( CI~()"Je(.))e,.(3{:<5'<tq,J
C)~d'('»)\J4(I(U:~~/t i-If {' U!S~I..r~(~JI· ..,,;j cyJI' _, l~J I .. ,.::,jJ~'-t
x
-4!~i..fesf (;I)
ifr:f~ .. ~ G'j'~ (,I..,;j
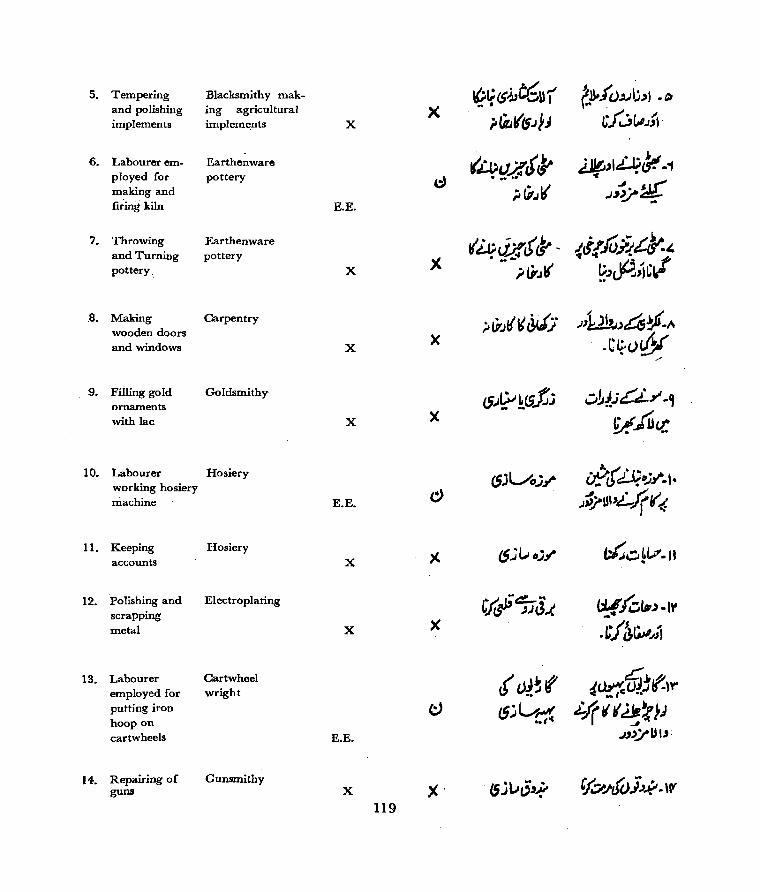
·5. Tempering Blacksmithy mak- ~t;(S'-kt6U) tn./U",;l.bl .~ agricultural X
. .. and polishing ing i'~I((5.JJ.J C.r~(,I.J;) . implements implements X
(~c.1)f&,~ ~ LJ;~ 6. Labourer em- Earthenware ., ,I . .-"1 ployed for pottery c) .....
.J'~~ making and ;rli..ll( firing kiln E.E.
7. Throwing Earthenware t(~ii!J'~~ ~ci!JOiitL.~'-and Turning pottery .)( . .. -"
~_,~:,C~ pottery. X ; ti-.. I(
.8. Making Carpentry ;.li-JI{ \( W] ..,,4:: ji1.J)4¥·" wooden doors
X .C~.()&, and windows X /
9. FiIIing gold Goldsmithy ~~!(5..t; .;,1)J C,Lr' .~ ornaments
X ~fu~ with lac X
:'((c • 10. Labourer Hosiery C5JVo;~ Wi &.~_"..,.
working hosiery c> J~ll"L.1((,* machine E.E.
11. Keeping Hosiery l5;I,..J"jY t:t.:CJ ~I/. It accounts X
Polishing and Electroplating W t::!:-- •• 1M f'c,t,., ·1" 12. C/~ ))(3..( scrapping _"
metal X X .,j3~.I;;
13. Labourer Cartwheel t ()).~f tCjJrf-employed for wright ~~() •• .J .\V' putting iron <:) l5;'L_..,~ .i.Jf t (JJ,,-, l) hoop on .J~
cartwheels E.E. .J,' ..,i-U IJ
14. Repairing of Gunsmithy X· . (S_j\..l"'~ 'I.;;;A'())~k. "v guns X
119
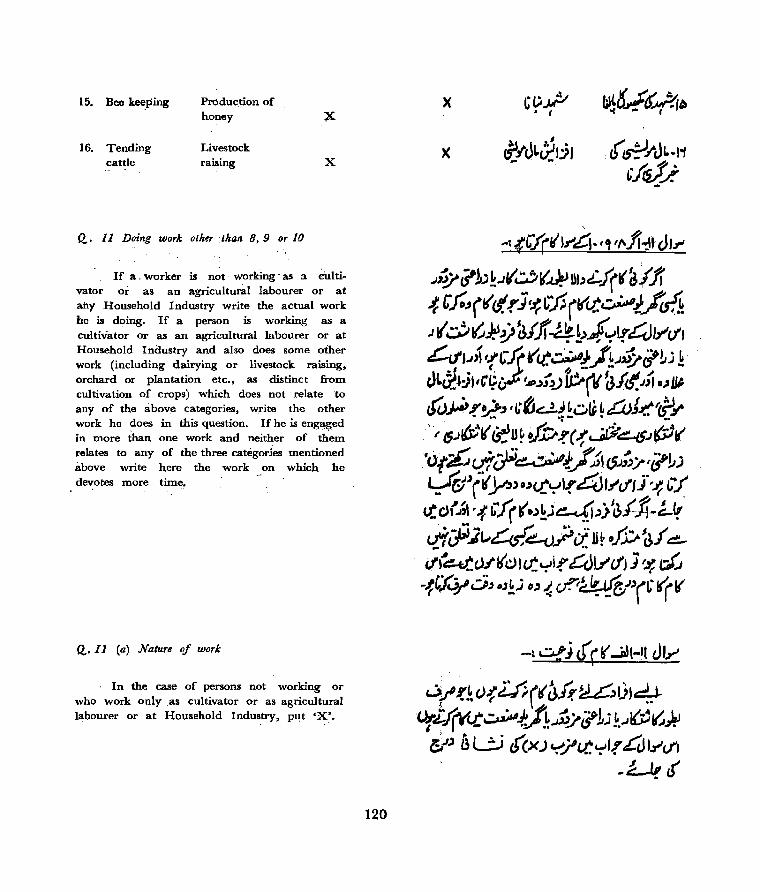
15. Bee keeping Production of honey X-
16. Tending Liv.estock cattle railling X
Q.. 11 Doing work otMr :than 8,9 or 10
If a. worker is not working' as a cultivator oi: as an agricultural labourer or at any Household Industry write the actual work he is doing. If a person is working as a cultivator or as an agricultural labourer or at Household Industry and also does some other work (including dairying or livestock raising, orchard or plantation etc., as distinct from cultivation of crops) which does not relate to any of the above categories, write the other work he does in this question. If he is enga~ed in more than one work and neither of them relates to any of the three categodes mentioned above write here the work on which be devotes more time.
Q.. I1 (a) Nature of work
In the case of persons not working or who work only as cultivator or as agricultural labourer or at Household Industry, put 'X.'.
120
)( CCP • I tI~6_,.f~b
X ~J'JLj,jl ( ~.rJI.-I" - . .. ~:I~/'
-11(((111"..,4." l"fl~lcJJ' .I~c?1) ~.JV" ~(~ Ubc:C.l(1(3ffr ->: ')oJ(~ct. .r}~rfirf(<J.':~;./tS!j J" .;:; It.# ~ afJf 4!>)"~t.rc!(JI""d' L:ct'.J~ 1:f~.:H Ytt.u·'·Jt...I':.~i/tj !
.1.. ., "'", $ ~ clLcl~:}l""I?' ~.J".v lD'rv ~/"-JJI D)Jjp
~~ ~~~ 'l:iJd:t ~D~ ~£oJ~I'~_'" .1' tS.J~1(~1I~!1"V~(1~~~t(P'f( 'Of;£; citcfi~.t/;i($J;'/'i11) ~J(L(y."u<t,:"I.r41I""'d'IJ''''( IJJ
.. ~ .. t"',/ J. __ ~. ~:t /? I L' u: C>I.I" r.:f 11;.1 (t D.)!.J~I,.)) 1;1;.t-;)--J-'-'!
c.i1(jJl~~~?,j ll~ tJ.fp~f ~ ;~C).ll(dlu.':":,,i.ridl.)"'dJ 1 ~ t:J'.J -.fC;fJ/6J aj:) O~ {~~~'(L'I('(l(
-t U!j tel( ~Hl (,)JyI
tJ/ -!~ c)~ U(I( ~Jf U'I."c:?Jurl.f(r{t~.f)1~/c?1j ~ . .J~(6)!J y, l3 L.;;j c(cX) ~y(J.':,":"Lr 41y'c.t1
-Dr ,f
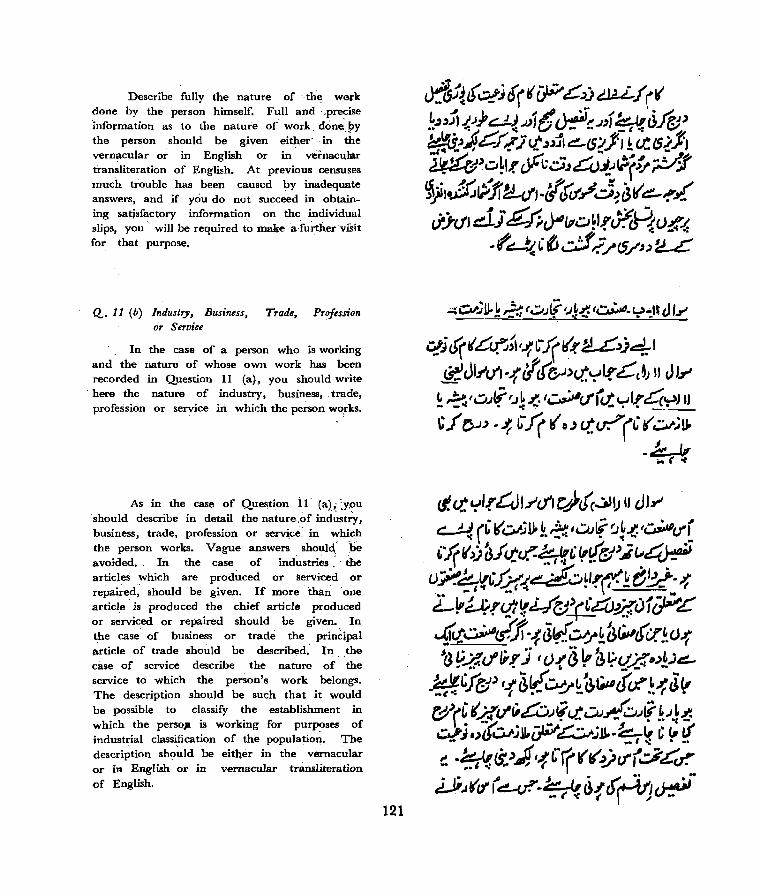
Describe fully the nature of: the wo.rk done by the person himself. Full and . _precise Information as to the nature or" work done:!IY the person should be given either' . in the vernacular or in English or in vernacular transliteration of English. At previous censuses much trouble has been caused by inadeqUate answers, and if you do not succeed in obtaining satisfactory information on the individual slips, you" will be required to make a·further viSii for. that purpose.
Q.. 11 (b) Industry, Business, Trade, Profession or Service
In the case of a person who is working and the nature of whose own work has been recorded in Question 11 (a), you should write
. here the nature of industry, business,. trade, profession or service iIi which the person works.
As in the case of Question ir (a); :Y()U 'should describe in detail the nature,of inci~stry, business, trade, profession or service in . which the person works. Vague answers should' he avoided.. In the case of ind~stries ,'. the articles which are produced or serviced' or repaired, should be given. If more' than one article is produced the chief article produced or serviced or repaired should be given. In the case of business or trade the principal article of trade should be described. In, .the case of service describe the nature of the service to which the person's work belongs. The description should be such that it would be possible to classify the establishment in which the persoJi. is working for purp?ses of industrial classification of the population. The description sho~dd be either in the vernacular or in English or in vernacular transliteration of English.
121
~~Cu';Jj. ~ ~(.;;"ii ~J.t,:'~.L:>~'t. cJ 1.1"
~; «( rL'c.f.j;, t~ .rf ltJ." !d...:C'J)4.-' ~ JIJ"'U"I·..f c1' c( ~.)<t.':"' l.r c:C',~) II J J.,..,
~ ~(O.Af/J~~ 1~c.fr~,,=,,1!4':-'J II ~.fOJ"·~ C-J(t(I_'tt.~('(~;u.
./:t:_j, .. (-:
(f ct. ,:,Jr £Jlrdl ZY(c..:,)!J IJ cJ'''''' ~ (~I(Vt'j1J. k~ 1c.:).Jl( ~ ~~ ,~()"r '1("';; ~fct.cr.:~, "t(e:JJ_;",,~ (.)?~"L:rY'.I~~I,,A(L ~I_'_j..,t; _,., ~ .. -: • . \t..:..._.V'~ ( L!P4!0''{l./~:;_>(L·4J_,../$(J' iP'L 4(/'~t/j(·fJtf.~f~a~(c:r.!(J1' -U~..?td';! J tc).«(j~3l?(/g • .>!.J~
-t~GfC1) t-t~~0~(>~J'uf'.~~J~ &>(C (?tJ'r,£U)~4i:,;).JJI!S.ii!.i ~~ ~;.>((~jjl,~~jJJ..~" C", II - .. 1-: ....
(. -~&..)~t"C"rf'(l('ijc1';,aL'~ J_J;J(ct(~.~( ~.I(~J"J _w.~. - -: ( I -;~

In the case of a person for whom" an X is put in Question 11 (a), put an X in this question also.
Important points to remember in Questions II (a) and II (b).
l. Women or children who help with work, such as rice pounding or doing domestic service for wages or minding cattle or selling firewood or making and selling cow dung cakes, grass, etc. should be described_ fully even if they work part-time. In the case of married or grown-up women who do any of the work mentioned above in addition to the usual househol~ duties such work should be fully described and HW written in brackets after the full description.
2. If a person makes' the articles he sells, he should be entered as maker a"nd seller of them.
3. Wherever convenient, for complete' description, the work should be expressed by the vernacular name by which it is knowII.
122
()i'l-fij. (tJ(L1((9·.fU.(J:t ()j~,.tt.1 ,~ ( ~.tJ~·iCJf(lAo.e-f~.(;!~l}U;i. r.1{J,q()J.£h~ 11 ~d~! <I~. cf'~.I.: ~6J(5'1!IJ,ol;'~'.f& ;}dl: ~ ~j~J'~~.I;i ~CSJ~ out L1(( c5;
6"(r-!fiJj~)L(...1j dj~().t(U~ .;/; L.{1( ~)~csJ{(J(((f~v~J~~~~
o ~~:>.J, Itrf ".J;'I C¥. ~~u"J .1.)1
(j! 61 :i·,t(.l."1C~f()~cJl~ a/j"tj ~) 111" ~.~,l L~ ~()q. 0 ( ,::..:j 1 1.( cl
• ~(, ~. " If" ... { *: ,. ...
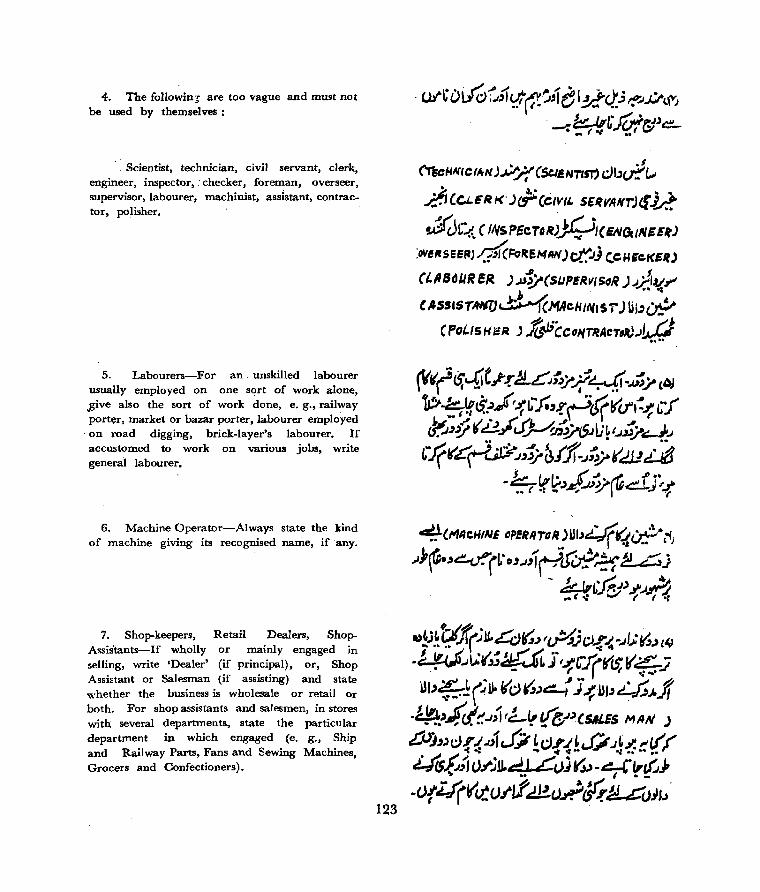
4. The followinJ are too vague and must not be used by themselves:
, Scientist, technician, civil servant, clerk, engineer, inspector,' checker, for~an, overseer, supervisor, labourer, machinist, assistant, contractor, polisher.
5. Labourers-For an unskilled labourer usually employed on one sort of work alone, _give also the sort of work done, e. g., railway porter, market or hazar porter, labourer employed
. on road digging, brick-layer's labourer. If accustomed to work on various jobs, write general labourer.
6. Machine Operator-Always state the kind of machine giving its recognised name, if any.
7. Shop-keepers, Retail Dealers, Shop-Assis'tants-If wholly or mainly engaged in selling, write 'Dealer' (if principal), or, Shop Assistant or Salesman (if assisting) and state whether the business is wholesale or retail or both. For shop assistants and salesmen, in stores with several departments, state the particular department in which engaged (e. g., Ship and Railway Parts, Fans and Sewing Machines, Grocers and Confectioners).
123
.1 (T'a:HNf C (IrN )V f, (SetE Nilm c,;.)bc..r.!" (..0
,.ii(GI.ERt<')cr(CIVIL 5£RYANrJcfU
~Ct.. (INSPECTDR)JI;JICE~GcINEEIt) :oveIfSEr:ItJ.4cFotteMIW)~j c..eu.c.fCSIlJ
(LA 8dUR ER ) ..u~(SUPERvI5aR ) .").i",, C,4SSCST.+NUd:!.-(c.MAeH/~ISi JUI,W
(PoLISHER) bCctlI4TIlAeT,R)..JW ......
~!J~ i;!Jf'( ';lloLd~.., I cf5) D-{'" -..JJ..,: ~_, l'J
-4<.t..l~~~¥~; I~~J(((CS; II <:;:':7 UI'~J(;llo~di1.)~ ]~JjI"L;;),Jf
-J:!f~}~~~.J!I ,Ll! tH;,JJCSM.ES MAN )
.cO)", cJ.I' .I.1{J J'_)- '0.1".1' cf..;6" J b'! '" if ,f' <..: .. .,.,... -: ...... .
~~;, ()3' ;JJ.e{1 ,CC)J r'"., -¥r!?.p -cJ{lJ(&lct.u.lLf &~~~()JJ,).
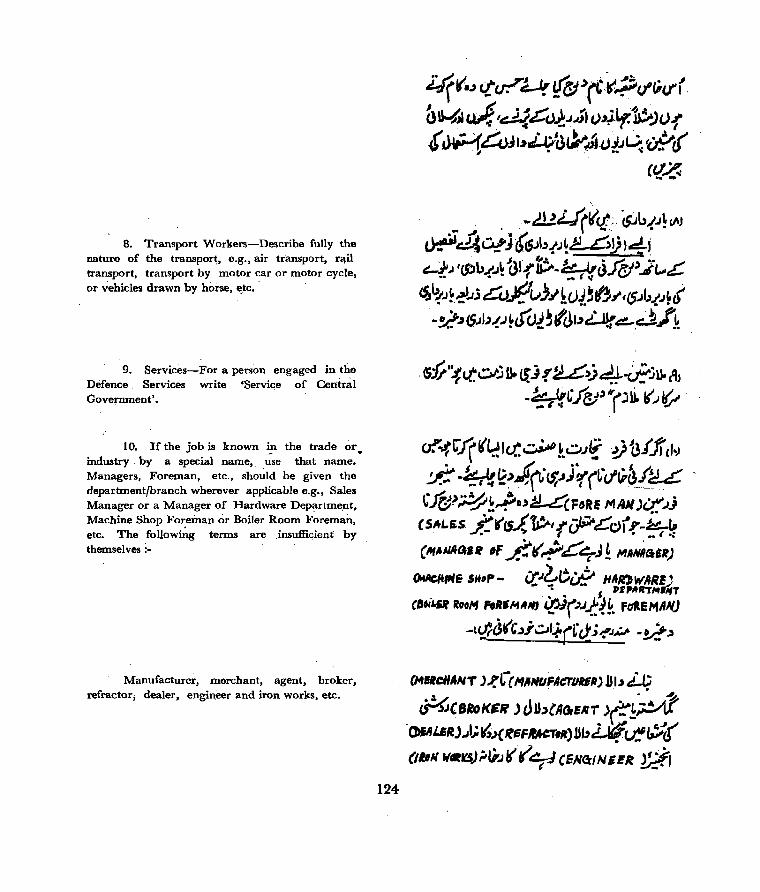
8. Transport Workers-Describe fully the nature of the transpor~, e.g., air transport, rClil transport, transport by motor car or motor cycle, or vehicles drawn by horse, ~tc ..
9. Services-For a person engaged in the Defence _ Services write 'Service of Cen:ir~l Government' .
10. If the job is known ~n the trade or. industry by a special name, use that name. Managers, Foreman, etc., should be given the department/branch wherever applicable e.g., Sales Manager or a Manager of Hardware Departm~nt. Machine Shop Foreman or Boiler Room Foreman, etc. The followi~g terms are' insufficient by themselves :-
Manufacturer, merchant, agent, broker, refractor; dealer, engineer and iron works, etc.
124
.. . .-.dULJ(I(t~· (sJl,,-tAtM ~~CA!'j6(SJb-tA~J»)4J 4..1 ,(f;Jb.(..I~ ~l., u;,.-~ ffJft!J' ..JL"L ~'tJ~~.J.3 G:();q~_;.Ik()J.~tf)"""..Ib-!.J~'
. a !(!~(5Jb-!.J ~&V~~fdb~ ~.~f~
ct"~r1( (~Ic.t. ~ k L;J.Jl! ~ 13ff,c!')
~ ·~~~.ir·tS;_'jr(L·d~~_.(.~_L 'l&.)~~~U~FORE J'IIAN)D::.JJ
CS.4L.5S f-'((5.1.,tp'(rP'eCrJ"i.r-J;:( ~ (M"Alfto,SIl IF ~tI~tC4-j! /IIIANHGill)
(MlfCl+fItI~ Sit,," - (r?~c;~ HIf/t)WARV ... -: • {. . »E,.lttn""./IIT
C8.it.U Roo,., FoRtMANJ cl'.I}\"'.J~~k Fa-.EMAN)
-tq:c)(,_'j~I;j.(L·c.t;~J~ -V:!.)
(MlfcHANT )~L(I'I*NUFAa-l1RfR) JJb ~
~C8RoK~R JcJlb{ROr!NT )(:!d ·()JALsRJ."I;~.,)(IfIiF~)ll"LVt!r.r.!~c( (IbN W."s);,lir.J(1 '7-"J (ENGcINEER g;

11. Domestic Services-In the- ~ase of ~ny , private servant e.g., a cook or domestic servant,
write only 'private cook or domestic servant'. There is no industry in his case but in ·the Case of persons employed in hostels, restaurants, boarding houses, institutions, etc. the words hotel, restaurant, etc., should be added.
For persons in the employ of Firms carrying on two or Jtlore businesses, if the businesses are carried on in separate premises then the business carried on at the premises in 'which the person is e~ployed sho~ld be given. . If the businesses are carried on in the same premises but' each has a separate organisation (i.e., they have separate' records of employment, prod\lction, etc.) then the appropriate business should be· quoted. If, howe"ver, the two activities are carried on side by side
.then the major activity of the firm or establishment should be given.
'. 12. Commerce_:_Special care should be taken to see that the distinction between retail and wholesale business is clear. As in industries, the goods handled should be clearly indicat!'ld.
Q.. 11 _( c) Class of worker
For a person who is :
I. an Employer, that is, who hires ,one or more persons in his work' described in Q. l1·(a).
write ·.·MR
125.
(;l,I.t.t.()jli-.lI(}'();iOCIT.~9JC>(
.J~.lJr~j;' '()1U~~J(I).~;~'" j,_"J." U.f
(C (~~'.Ir'tr II..Ufl-t, ~ ~~ ~ (r' ~~Q\r.'1'~ It tf~C/'I~'t:=7'{~)V.) .. VI,' l...l!J:H $.tS;...(lA-'J( ~~1r .. .f r;j J"~'~..iv. ~)~~~~J.l1(.r rP. J (O.f 4~ c$i.Jr ~C(, ,,:-,I;.c~, A.vl(c.tofr.~;:O~e;1J(~·~~~,I(~ ct.Lthr!(j(/'J'()1L1t¥.t~'}.bY ·J:r!~' ~L' t(" (, r (,'aJ~) .J~J.;((.(
-t~(t&G-IltJ~ .
~ !LL:".,j .d f . "rru1~J)'!i1 O)~; ~'-fI.(tk! f,Jf,,~"
·V:!.;ji(·~I(~ C~J II JJ'f31';J~
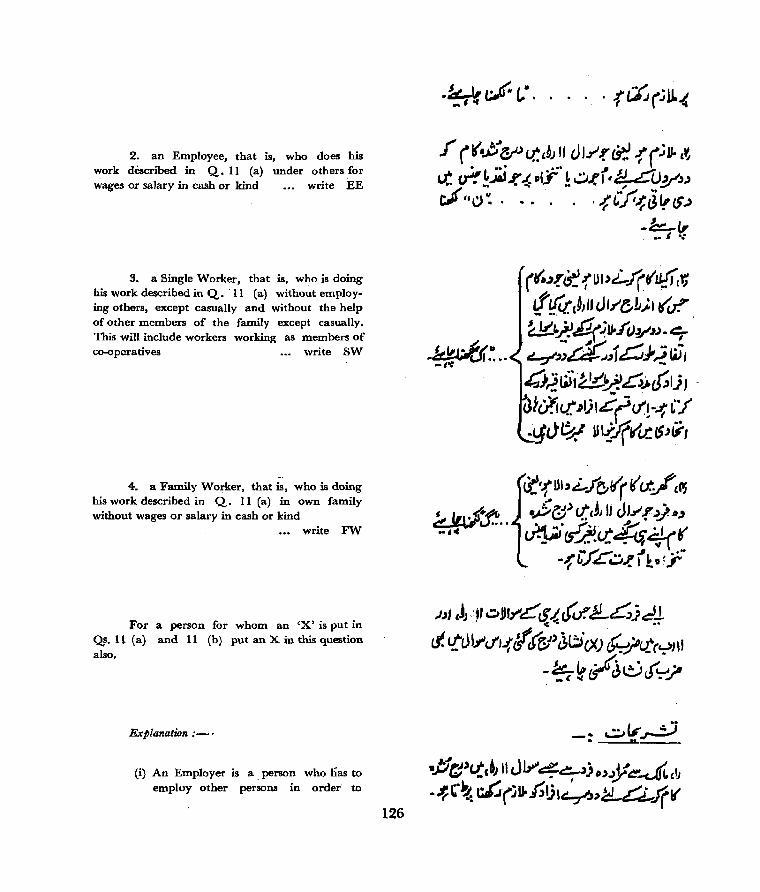
2. an Employee, that is, who does his work described in Q. 11 (a) under others for wages or salary in cash or kind .•. write EE
3. a Single Worker, that is, who is doing his work described in Q. 'II (a) without employing others, except casually and without the help of other members of the family except casually. This will include workers working as members of co-operatives ... write SW
,-' 4. a Family Worker, that is, who is doing
his work described in Q. 11 (a) in own family without wages or salary in cash or kind
.•• write FW
For a person for whom an 'X' is put in Qs. II (a) and 11 (b) put an X in this question also.
Explanation :- .
(i) An Employer is a, person who lias to employ other persons in order' to
126
J '- - ~ I • .'.~ 'LL .*,!f c",r ". , . . . {~J(.J "
f (r~~)lt,'~JII UJ.1".r&!:' !(jJ.l.,~ v.': c?!~ r. {ol:;:' ! ~J:(' ¥LJy.)" CII',o". . . {L":r:.t;J"£F~
, L._ (,/."
... ~, .... -t·:
~"-l.;f~ .. -,,,
-~(, •• I 0;
.JJI cJ) :j'~JI)"'C~{t~c&..~j~!
Ii. ctLH.1"dl{ if fBI' JL::icX) (~/c.t(,:?J\1 -~~Al::)f~~
.J1l:1)t.t,6) IIJJro'4~jO)#~~CIJ
. ~ t'% ~(jjJ. h!i'~.,.hL eC:LJfV

perform the work entered in Q. 11 (a). That is to say. such a person is not only responsible for his own personai work but also for giving work to others in the business mentioned in Q. II (a). But a person who employs domestic servants for household duties or has subordinates under him' in an 6ffic~ where he is employed by others, is not 'an employer, even if he has the po~er to employ another person in his office on behalf of his own employer or employers.
(ii) An Employee is a person who usually , works under some other person for salary or wages in cash or kind. There may be persons who are employed as managers, superintendents, agents, etc., and in that capacity employ or control other workers on behalf of their own employers. Such persons are only em- , ployees, as explained above, and should not be regarded as employers.
(iii) A Single Worker for the purpose of Q. II (c) is a person who works by himself but not as Head of household in a Household Industry. ,He is not, employed by anyone else a~d in his turn does not employ anybody else not even members of his household except casually. This definition of a Single Worker will include a person who works in joint partnership with one or several persons hiring no employees, and also a member of a producers' co-operative. Each one of the partners or members of such producers' cooperatives should be recorded as 'Single Worker'.
127
.'(d\..:G).J" ,& J.I(II.(~) o.J(;1I- ,~ -!i4--~Cfr(!f'~~<S'I/.'~~_.i;I·!I:~.((.It ~~':'::..,I( "1ANAGcER Jt!'.I~.r4ti C~'CAGrE"'T )~?1 (SUPERINTENDENT'
~J"~~~~~ ~1.'clIJ;j.()(r;~ L:u(( UL4!u/ ;:f./;!J J~JJLi(V @;lf~{lf«:5,,·~(jU.'9'4.!"().l
-J:.I{'fcd/,:ise1L~lrif(
~jJ.'~.)ilJuIJiJ((lifJ'~e)1I UJ.t" \~ (1(v.':~~:/<4)t1'~~.A"1~J .,,;,.,$I'7.-'{, tt.:'l'i(jl)o~) Ldl ~ ~ JJJJ i.J"
, ' (f1f,'t,;,a;.J ~;.J;'j~(;1J..);JJ'ftcr( -~LJJ ).~~Lit'J(Sfr'L -¥tt-{((
.f!c)Ctf.')ldJc.t.'-JI_;1(/I~'JlJ(k'u5 ~~J .l:'(;JI.~4JL,..':c'VI ""!; l~.r
~.J:!'U:«.)J iidl.J~ r -tlf(~~~ /'~ tJ'c)JJI'tt.I-~ i(VV(5JI(JufJ61"~ ~~~ (j)f'J{jf'c!I.f'~f.){/pi .~,~'f&; £,) L.f( t(iJ(tU 4"tfl .

(iv) A Family Worker is a member who works, without receiving wages in cash or kind, in an industry, business or trade conducted mainly by members of the family and ordinarily does at least one hour of work everyday during the w~rking season. For the purpose of the entire Q; 11, such .an industry should be on a scale larger than what has been covered in 'Household Industry' in Q. 10 whether ruft at home or away from home in town or village and even away from village in rural area and should ordinarily be in the nature of a recognised partnership; joint stock company or registered factory. For the purpose of this definitiim members of a family may be drawn from beyond the limits of the household by ties of blood or marriage. T.he family worker may not be entitled to a share of the profits in the work of the business carried on either by the person or head of the household or other relative.
Members of the household. who help solely ~ household duties should not be tceated as family . workers.
Q.. 11 (d) Name of Establish.ment.
Describe in detail the name of the factory, workshop, business house, company, shop, etc. If. a person has no fixed place of work, write 'No ~ed place of work'!
~.r'~io~#~~LJ(~dj'(~ 0;1( k.J~'J "t~<s!It/~.((~~_;;j "-.If! ~~"1(tI'C)f L~.)\i.!.?l44~ ~ li.tJ JJ.L!,;/ c4{51 (ct. r4 ~(((~ ~I,g 4eCIi ~U iJJ.I"'-~.L'fr1( ~t!! ~VW~Jtt.J·cJl""'~ Lt.: ()1f~.~~'J DI}'.c!:(~~{{;.~ LJ!JJV ~~.).IiJ ~~~ ~~~~A~_j'
.p. - I._J t. .J _, J ,# r_;],~":' 1.(:..1.1' IP.~ 0. ..I,,~t:::!-f)_' If c.t. ~~!&.fr,,,~y~!~~ 6' -ill i-.f(r' c/!f~({Jf,f~) t{ JU) dJ_ u:: .)VJ~tC~';i(J",
u.,./,~C!-~·J.JIC?.r ~:r;YrJ' v(j! ~JJ.it.,;4~~,t~.,c:. !~JjJ" cdf$J'.?~ ;LCdl!L/(((/:J-()~ eV.;!/Jltp.e.-(1(' £..I~')Jl{"'(/'i~( r ~~.J') ~ ~ "z.~.;)' u-(' '~~r
~;; C u..r .J" ;;.f:,1
v:.ev'r"}':J' ~./.r f,J)I 4 cf'!f ~~ &L::r( I( u!'/U1' ~;,~
.J:t._" •• 1 -:
-:(~·l(o~bl (.))-11 c)J.r'
( '.Jb J (5;,,.,1( '''-I c,~., I;' IiJr C/Y' .,(,,~~(~-I( ~-' iJ (~ -J(
. cl'qi(I({~~~).lt>ffi'. ~r~ 128
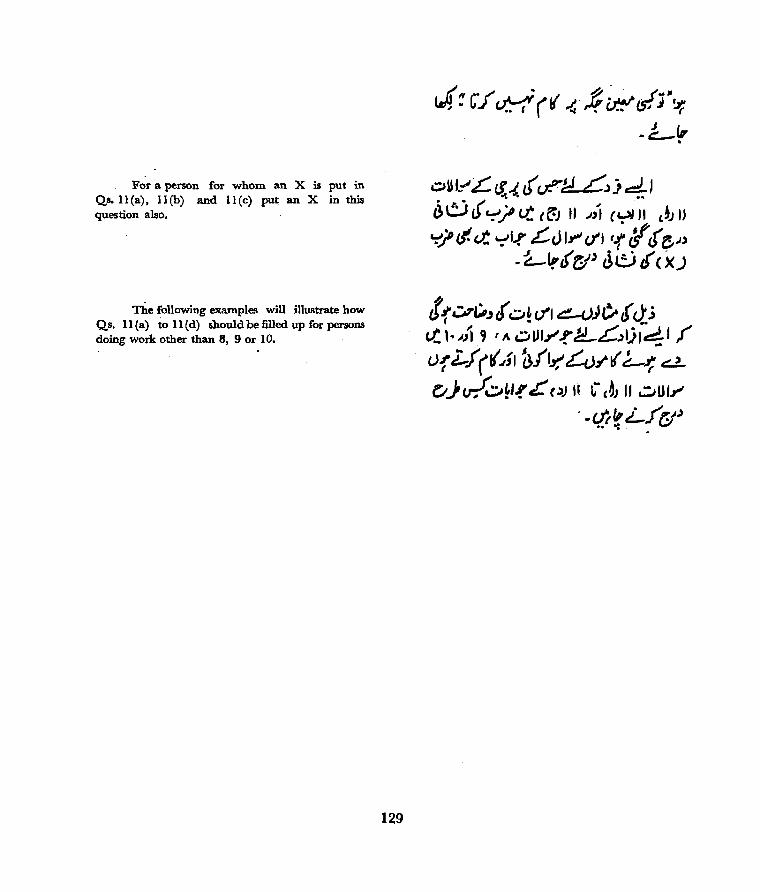
For a person for whom an X is put in Qs. Il(a), ll(b) and 11(c) pu~ an X in thi3 question also.
The following examples will illustrate how Qs. 11 (a) to 11 (d) should be filled up for persons doing work other than 8, 9 or 10.
129
. t! N .. ~ .,j ?... .1''''' ~ • C.J ~ (D ~.',;.r ~(S; j ~
-Lr
oU to!'" L: £l.,t. tf cJ!""b! Col j d...1 ~ . ..
'}~,JL:"'/t.t (~J II "',) (~II '~JIJ "¢' If. ~ ~I.r £J " dl if if tS' c,-lj
-Llr'~' Jt.:,jt(X)
tf-r':'';'J( D~'" ~}c,.t J.:'; tI.: t·.IJi CJ 'A ~1JIY' of" J:!..._L.)I;J~I ,(
L>fl..f((.I;' ~/1.Y,'L.uf( ~ cl..
t:I)v-!'v~l.r L PJ H C" (~J " ~UI"'" . -u'i"LfyJ
.. -=
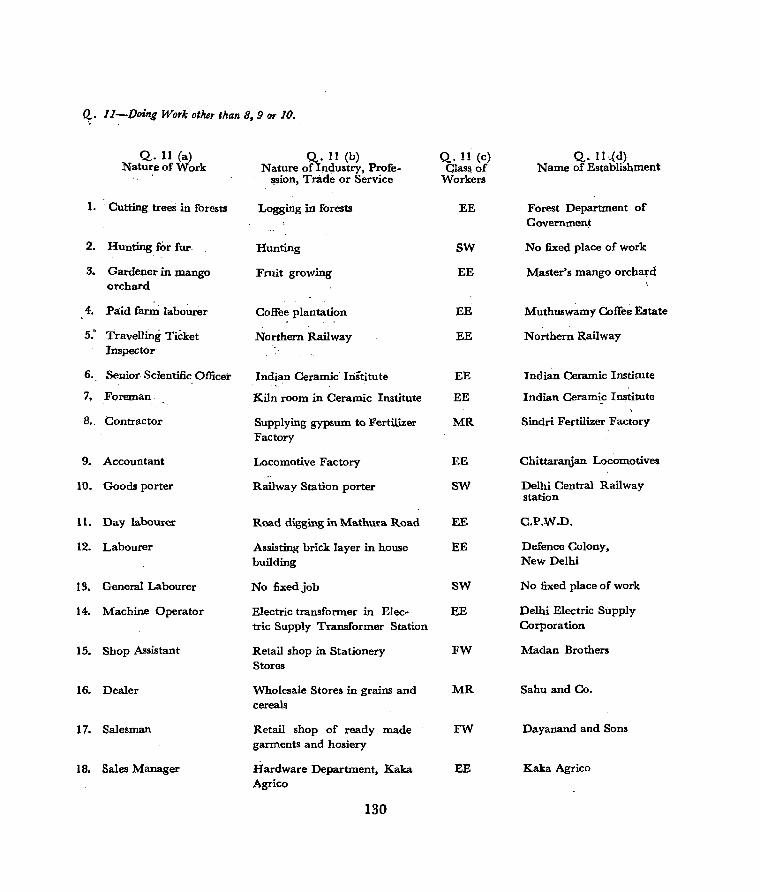
Q.. ll-J)oing Work other than 8, 9 or 10.
Q. 11 (a) Q. 11 (b) Q.11 (c) Q. IL(d) Nature of Work Nature of Industry, Profe- ClaSl! of Name of Establishment
lision, Trade or Service Workers
1. . Cutting trees in forests Loggmg ill forests EE Forest Department of Governmenj;
2. Hunting for fur·. Hunting SW No fixed place of work
3. Gardener in mango Fruit growing EE Master's mango orcha:rd orchard
4. Paid farm labo~rer Coffee plantation EE Muthuswamy Coffee Estate
5;' Travelling· Ticket Northern Railway EE Northern Railway Inspector
6. Senior Scientific Officer Indian Ceramic Institute EE Indian Ceramic Institute
7, Foreman Kiln room in Ceramic Institute EE Indian Ceramic Institute
8 •. Contractor Supplying gypsum to Fertilizer MR Sindri Fertilizer Factory Factory
9. Accountant Locomotive Factory EE Chittaranjan Locomotives
10. Goods porter Railway Station porter SW Delhi Central Railway station
1l. Day labourer Road digging in Mathura Road EE C.P.W.D.
12. Labourer Assisting brick layer in house EE Defence Colony, building New Delhi
13. General Labourer No fixedjob SW No fixed place of work
14. Machine Operator Electric transformer in Elec- EE Delhi Electric Supply tric Supply Transformer Station Corporation
IS. Shop Assistant Retail shop in Stationery FW Madan Brothers Stores
16. Dealer Wholesale Stores in grains and MR Sahu and Co. cereals
17. Salesman Retail shop of ready made FW Dayanand and Sons garments and hosiery
18. Sales Manager Hardware Department, Kaka EE Kaka Agrico Agrico
130
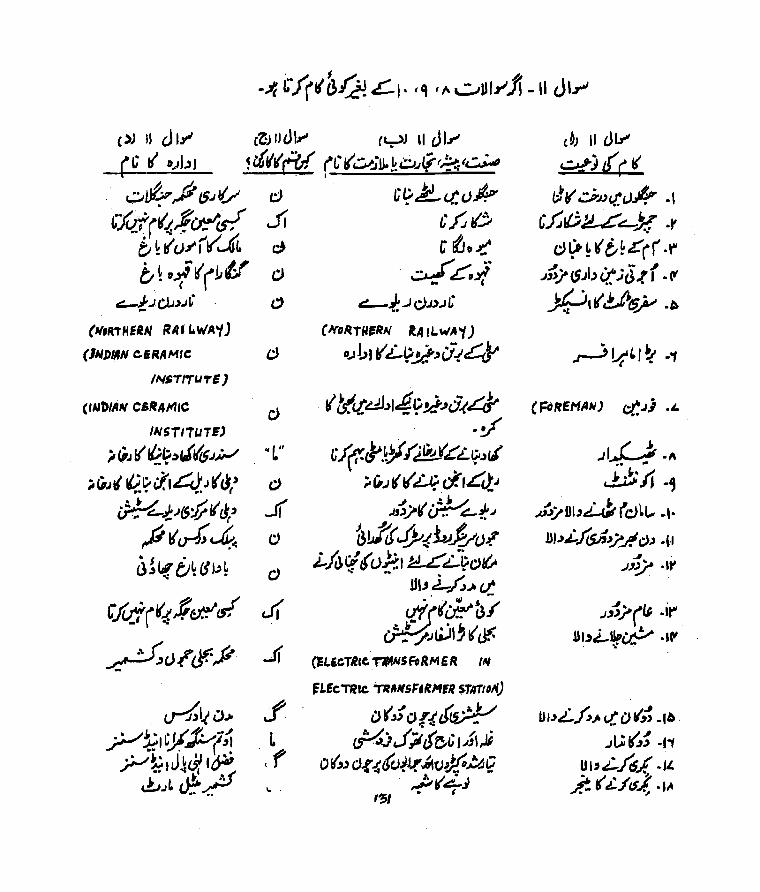
( ») 11 d '''''' c~ IJ cJ" (yJ II J I, -!£tf 0;'-'1 ~t£r(i¥ rL"l(v~;U.kO~(((..?:{~
~V&-,P tS~~ cJ CCJ:!...(J'uk-'fllf(~{!,y:/'cs.f JI . ~.~ ff_!,
b ~ I( u-'" (I( ~ c) C {J D J! tl~D11((1(:/ CJ ·~~4
~..iC).;".lL· d t:!..-.f..J C).J).JC
(l('ItTHERN fVULW'A'I) (l(aRTH,RN lA,LWlA"f)
(INDIAN C.&RAMIC cJ 0 •• ,1.,,1 r' £...1?.i}~6-t4 INSTITUTE)
(INDIAN CSR.4Ji1IC
INS TI1U TE)
;, ~J I(' 'bt;,~"&1s.JJ,./ . ... ;'(;Jt( ~1?c:(I41.J(~/
~tJfS~ I( d;' 'p,,~d:.~ ~~l! b~ Yl.)~
"L"
d .J(
C)
C)
((vir r~ $.r;r.?' t/ c.f(
~cJ~¥",P 11
f L ,( \,
( ttctdh'4't!J-"a.(~ -~
cf(-c?~I'~~L~.)" ;.1io.J t t( a cY.ILIi J
J I/:~ I~ .b);a. ~ tC-!:~ 3~~~1.J.fl_/v.(
L/uc;(uP..1 ~CL~dlV .. .. JJIJL.h.Jtu' qj((~~/
~.J~I;"df. (!l.&eTRrc. Ta'4A15 Fo RM e R tAl
fLEcTRIC -mIfNSF4(tMER 51.411'1'4)
D(J:CJ{{t~ ~ ,Jjltfec J~;\;
o ("J d.( {'C)~J.(~t)~~q ~(&i..)
'''51 • t
(6) II cJlr'
~j((1(
tJ II '::;;'~>ct. tJ# -I
Ch.e~,-y .f'
C) t;t ~ I( b ~ .erf' ·r .J;',/(5Jb it ;(j,(( -,
Jfj,I(U~ ./)
.JI~-A Jl;i; -,
~ .... " 1 »"./1.11'~ I Cht... a'.
jJl"£,JfSj'.>/...!Ic:>,, -U
.J,,1/(~ .• ~ »I"..L~~ .,ev
ul"L~ ... f.)" 0 1(:' -lb.
..Ii; If.,~ .,'1 U I' .:C.J6.t' .Il.
/.':. ( ti../ is.!, .,~

Q. 11 (a) Nature of work
19. Boiler Room Foreman
20. Air pilot
21. Bus driver
22. Manager and Proprietor
23. Radiologist
24. Plant Nutritionist
25. Chemist
26. Chemist
27. Secretary
28. Assistant Secretary
29. Supervisor
30. Machinist
31. Private cook or domestic servant
32. Cook
33. Khansama
34. Grocer
35. Chartered Accountant
36. Accountant
37. Cinema Artist
38. Sign painter
39. Canvas bag maker
40. Sharebroker
Q. Ii (b) Nature of Industry, Profe
ssion, Trade or Service
Indian Iron and Steel Company
Air transport
Motor Transport Service
Motor Truck goods transport
Surgical Department of Hospital
Plant Protection Research
Sugar factory
Pharmaceutical factory
Administrative Department of Life Insurance Corporation
Commerce and Industry Department. Madras
Jewellery "Works
Lathe Department in Engineering Works
Residential Hotel
Boarding 'House and Club
Retail trade in grocery
Steel Production Factory
Jute Mill
Cinema Company
Commercial Sign painting
Cement Company
Broker in tea and jute shares
132
Q. 11 (c) Class of
Workers
EE
EE
EE
MR
EE
EE
EE
EE
EE
EE
FW
EE
EE
EE
EE
SW
EE
EE
EE
EE
EE
SW
Q. 11 (d) Name of Establishment
Indian Iron and ,Steel Company, Burnpur
Indian Airlines Corporation
Government Motor Transport Service
Prakash Transport Service
Medical College, Calcutta
I.C.A.R. Pusa, Delhi
Bimla Sugar factory
Akash Chemical and Pharmaceutical factory.
L.I.C., Delhi
Government of; Madras State
Kundan Brothers Je~ellers, Jaipur
Hoogly Docking, Company
Master's "house
Ashoka Hotel, New Delhi
XYZ Club
Home
Bhilai Steel Plant
HowrahJute Mill
ABC Cinema Co.
Rupalekha Company
Portlal'llll. Cement Co'.
ABC Share Exchange

,~) " J 1.1'" (C I( .J'JI
c.e~J ,. JI, (.~) It J ,,.,.,, ftar' fbi' (.cr ~.ijJ.!~Jlf'~ ,,.·fiJl}
_tAl( ZIlDN IINI> STEEL
c.,",PIINi, SIlINAGtA~
I~DIAAI AlII LilIES CdR P,RATtI"
GuvuNHJItr MtmR ~IIN.PIIT
S5RIIIC.E
~~J i!)II)~c1.W Htl(~~
d'r~1J..Rf.J~r ~/~f • ....,1, ('; R',,,lJ,I
(5::r'!:' ;1<1 t;, •
~~ (t{CS')vl,,) ~p
-dc-'i8!.J r ~;Jtiu A();.',jr~ ",~~~, ,,~)I(
Jev-JI: (1)j.r ~f _/rr-6L
hcl(;J~ h.-.J(Mf
-_/
H"",,~~~6.11V ~b.~~lS~.:tlu;,~1
,f.,J .-('~. _:l.A/
CI- -.q.; 1 :U-If~ cJ;,r ?~/)~-(!J - -~I.' t· ____...It,. 'f .I~.t-6~~~
(BtJltf8AY- d~J!. ,SIMllf 61<tE.'HANG,E) .
d c)
t.
" d o C)
d.
eI f ·0
d C)
cJ J(
C)
c)
cJ d
cJ J(
INDIAN 'XIZON. AND
STEEL COM PANY
. (SJb..{.J~ ~.I;,cj 'f.JI.( MD'IIR TRANSPORr SE6VlCE
c.fIIIHERCIAL StirN 'P/lINTINo,
;lP;, l( I( £,?~
Jib t( o-/~.,JJ L't
",
c.~J II Jf, qjt(rY
&oILS ~ R"" /III .. I,. FOilSMAN
" J u" ~) w.t3J{' .. yo
UI.t~£5 ~ (~_". .. '" ...
~·cv- -rr RII1>IDLo(ifST' -ft"
--1L I( qljtW-,.)-i -t'''' CHEMIST -r. CUE~'ST -t'.,
(5)P .. .,,, l5W~-r"·
.,J·j,~..tP -r, ~.. -=
!JIJ~~-"" (J·jJ.t!1'i.lJ ~ -rl·
t[A~ ·rr d~U';' -rr ~W-fP'
_!j.'/f j';JI,.- r~ .. CHAETER~·AcCDVNr~Nr
• J, J. if -rot .I I{ JY (fr.:-/ ";f'"
S (UrN PIII"'TE~ -fA
Ulf. t;~",.~ -t"i c)Jb(~ -r'-

Q. 11 (a) Q.11 (b) Q. 11 (c) Q. 11 (d) Nature of Work Nature of Industry, Profe- Class of Name of Establishment
ssion, Trade or Service Workers
4l. Discount broker Discounting of bills in business MR ABC Business House Ltd. House
42. Die Caster General Engineering Works EE Ramachandra Engineering Co.
43. Ochre grinder Wood Paint Factory EE ABC Paint Factory
44. Distillation Plant Brewery Factory EE Solan Breweries Operator
45. Grinder Chemical Factory EE ABC Chemical Factory
46. Cleaner Steel Re-rolling Works EE ABC Re-rolling Mills'.
47. Ticket Collector Cinema House EE ABC Cinema
48. Iron moulder Iron and Steel Foundry EE ABC Engineering Works
49. Foreman Packing Department in Oil EE ABC Oil Mill Company Mill
50. Foreman Saw mill in Wagon factory EE ABC Wagon Company
51. Foundry Caster Aluminiwn Factory EE ABC Alluminilim Company
52. Furnace man B9iler shop, Iron Foundry Works -
EE ABC Iron foundry
53. Mono printer Printing works EE Govt. Printing Press-'
54. Brass turner Small tools production EE ABC Smal,l Tools Company
55. Honorary social worker State Social Welfare ,Board SW State Social Welfare Board
56. Member of Parliament Parliament SW Parliament, Delhi
57. Free Lance J oumalist Writing for newspapers and periodicals
SW No fixed journal
58. Political worker Political work SW Name of party
134

t:» II cJlyo' &J II,JtJ"" (u) \I VI.7'" ((I( 0..11" Hj;~v'& ~~)ib:~.JIi'(a-r~
~ tf.(~1 " (j~ L .J.i,f '" V~~"L(.JV.J~~ h/!£;!.~~~ u.£-6Yl4~f
Sg'NAGdfll cHEMICAL f4eT#1l1
~ IP.J I( t( .) uj I( ~ lJ.'I
~/-y.~~~ .IJ.~d~-1'~~ b~Y,-~IJ1J~
"(L.t?~4J:.I.1{Jt~ ~_... _;., I(u
~/...(j.J;JIJ ~ u..VJ
.)j ~~';IJj.'j C);(t~ ..c... - ••
(J;~ ,!;hf)..1 h.&ij~J~b~
STATE SIt:IAL WELfAIE aoAR])
.,J..)_~",,, (1, .."
L/cd(r~tf'~~ _foUt:-t.? j~ d?
cJ cJ
C)
c> d C)
c:J cJ
rl('lIe:!{ ~ LY.J '( lti;!.J (IP
~ li.Jrl( ~.{ (/J){ ,,¥ ;. ti-.J r~ ~. OJ'
CIlE/1It!AJ. FAt.TPR"f
_:, Ii-... t (.,lJ)
f~ ~c(.)iJ) .. ~1· d
,;p'l;:1? ()~~ ;~r4.· (s!ld: ;. Li-J~ £Lt; ~ &.1
- ~;r~~ cJ ;..t;JI(V~·
d. L-j~~,!V::;'(P..Jl(L'~.J ~~
,1J "(.)1,, ~:nrl(
ulJ21_j,_:J~-rr . UIJ ~ .:letr
illJ L~ it.?' Ji'Jl' ~~r lll.)~-r'~ _ ..
CLEA"'E~ .~.,
~Y,~rl. .IlJJ~S,6.'L;l('d.~~ . .... I _
(FoiEMAN J it'".J.J ·ct'
C FoRE MAli J i/:.J J -~ ~
Ut-'i.j J~, i/?;i-. f)" UI'~';'..( "Ij / t.B -~(t'
~ .. ~~~¥-1s;J:fJ .pb
L' I( ~..I~ • • tJ., . ..-.:
'-'="'}.,I?IJ!; r.~4
(/;(11 r.::/ ./},..
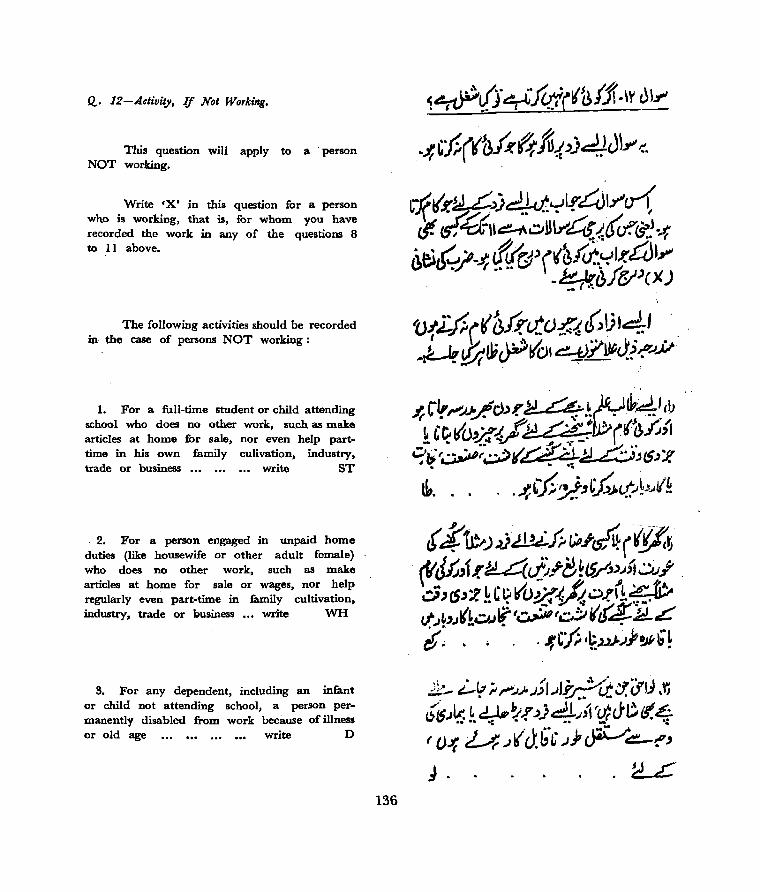
Q.. 12-Activity, q Not Working.
This question will apply to a . person NOT working.
Write 'X' in this question for a person who is working, that is, for whom you have recorded the work in any of the questions 8 to 11 above.
The following activities should be recorded in the case of persons NOT working:
1. For a full-time student or child attending school who does no other work, such as make articles at home for sale, nor even help parttime in his own family culivation, industry, trade or business ••• ••. .•. write ST
2. For a person engaged in unpaid home duties (like housewife or other adult female) who does no other work, such as make articles at home for sale or wages, nor help regularly even part-time in family cultivation, industry, trade or business ..• write WH
3. For any dependent, including an infant or child not attending school, a person permanently disabled from work because of illness or old age •.. ••• ..• ••• write D
136
~~V·~f£t.i(~~fj(.w C}~,
.~ ~£(I(hk.~~{ ,)~Jt~~.
rJfl('F.U.)j4tt.~I.r4}If'a1 ¥ 7.f'f,,~~u'~4~(if.~~
,lei G~-.i:, tfu1:).'(~~f'u:yl.(£V'~ ~ t}':"".r r •••. \,;I -~i>f~)(XJ
v.fLfiCr~£.to?{(,~'4.-J . ..:~~lli~(c:JI ~7~J:~~..v
J;CIr"'»./.Cb'-M.q!)y~~4.~'lJ ! '~lIo~if~~(I(~f;{I '?iir~f~l('~ Jd.L:';:;,J(5)1! . '. ~. .. . . .s:LfiJ.!' ~tt..J~-~II~
(~tp.) »)~» t:Pi'~ ((ff.t ~Jt,1.(ld..4~~ .. J-e~~~{J~~j' . 6,csJ:l k'l?l(og~~?,~.9 ~.I~'.Jl(~.O.Jl((~I,;;!;Irtf$~L 6'. . · . . ",:,6I~)>>..J},~b~

4. For a retired person who is not employed again, rentier, person living on agricul,tural or non-agritultural royalty, rent or dividend or any other person of independent means for securing which he does not have to work and who does no other work ••• ... write R
5. For a beggar, vagrant or independent woman without indication of source of income and others of unspecified source of existence.
write B
6. For a convict in jail (an under-trial prisoner will be shown as a worker if he used to work before he was apprehended) or an inmate of a penal, menta] or charitable institution write I
7. For a person who has not been employed before but is seeking employment for the first time. " ... write NE
8. For a person employed before but now out of employment and seeking employment
••. write UN
Explanation :-
If a person, who does not work cannot be rea?ily class!fied. in any of th~ above cat~goTll:s, put .hIm m category 5 and ,"Tite B m thIS question. A retired person who has taken up. regu.lar wor~ again should not be entered m thIS questIOn as he would have been entered for his new work in Questions 8 to II.
137
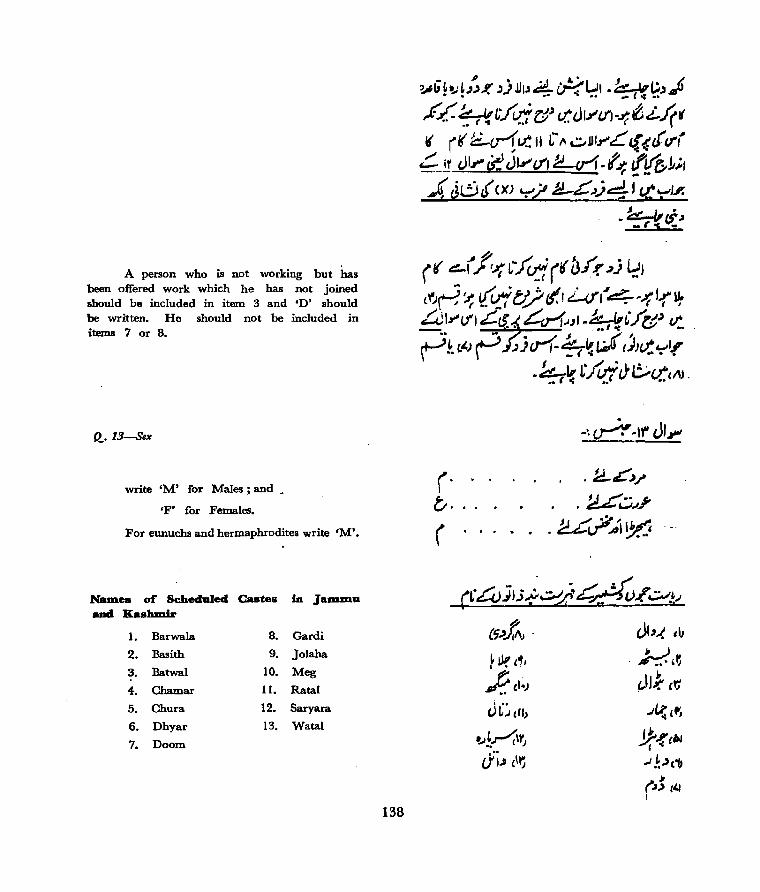
A person who is not working but has been offered work which he has not joined should be included in item 3 and 'D' should be written. He should not be included in items 7 or 8.
Q.13-Sex
write 'M' for Males; and _
'F' for Females.
For eunuchs and hermaphrodites write eM'.
NlUIle. of Schedaled Ca.tes in JalDlDu IIJIIl XasbDdr
1. Barwala 8. Gardi
2. Basith 9. Jolaha
3. Batwal 10. Meg
4. Chamar 11. Ratal
5. Chura 12. Saryara
6. Dhyar 13. Watal
7. Doom
138
(( &!-I f;; ~"") oj (I( ~.f'.f' _,) l::l tf)~~ t(vjtJ,?tf.!Lq,.'~~-rl.rlJ: al""'''1 £.tS.J Ctr1~JI-~t ~~.)~, v:. ~~ r.') t=' f.:jri- ~ {~ ~ C;J~ ,:,'.f
(. b.
(
. ~~ L)'Li £i t:.;.o.: (l1J .
. .
{Ij.,J;..; .
~ W. ", ~cl~ JCcll)
~~",-<\I') dj., tIl)
·1tL,c'F . ~~J.J'
.~~Ai~
(,)1,..( clJ
J..!.,~ JJ}. c~ .J~(tv,
Jf-rc.' I
.J .~_',"f) J1
~J'> 141 I
CHAPTER. D
DISTR.IBUTION AND MOVEMENT OF POPULATION
SECTION 1.
AREA AND JURISDICTiON'
The Ref'erence nay or 1961 Census
The history of Census in Jammu and Kashmir dates back to 1872 when an attempt was made for the first time to take a population Census. This was in fact no better than an estimate and before long it was found that the results achieved were grossly in error. The first regular Census was held in 1891 synchronously with the rest of India except Gilgit Agency. Since then, decennial Censuses were held regularly till 1941 after which this continuity was suddenly broken as a result of the tribal raids of 1947 as the taking of Census was not found feasible in the abnormal conditions obtaining in the State in 1951. The enumeration period of the 1941 Census started on lst February 1941 and ended on 25th February. During the following three days which ended on the sunrise of 1st March, 1941, the reference day of the Cemus, the entries in the schedules were scrutinised and corrected," wherever necessary, in accordance with the changes which had taken place during the period intervening between the original enumeration and the reference day.
2.2 In 1951, when as usual the decennial Census was held in other States, the period was reduced by 5 days and the schedules were filled up from 9th February to the sunrise of lst March. During the following three days, the enumerators paid a "second visit to their respective blocks so as to bring the records upto date. In 1961 also, the period of enumeration started on 10th February and ended on the sunrise of lst March 1961 which was as
139
usual declared the reference day of the Census. The period of revisional round was, however, extended to five days (1st March to 5th March) so as to enable the enumeratorS and other field staff to celebrate HoH which fell on 3rd March 1961.
Geogrllphical Locatioll of the Stat.
2.3 Before we attempt an analysis or the data collected at the Census of 1961, it will be perhaps worthwhile to give a broad description of the State, its boundaries, area, population and administrative units, etc. Physiographically, the State, except for its sub-montane region, looks as a separate territorial unit with well-defined natural boundaries all round it. It is bounded in the north by China, in the east by Tibet, in the north-west by Afganistan and in the west by Pakistan. The southern boundary is contiguous with Himachal Pradesh and the Gurdaspur district of Punjab.
2.4 The State including that part of its territory which is now on the other side of the Cease-fire Line 1ie~ between 32.17° to 36.58° North Latitude and" 73.26° to 80.30° East Longitude. Geographically, it consists of four broad regions or valleys formed by its four principal rivers, namely, the Indus, jhelum, Chenab and Ravi. These valleys have been formed by sharp foldings and faultings of sedimentary rocks and resulting in thrust faults. The Indus cuts the State territory almost diagonall y from south-east' to north-west. Rising in Tibet at a height of about 17,000' above the sea level from Mansarowar lake, it crosses into Kashmir at 13,800' whence it flows steadily upto Moun t Haramokh in the west of Gilgit.
It has a total length of 1,800 miles and is fed enroute by a number of tributaries, important among which are Shyok; Zaskar, Dras, Shigar and Gilgit, etc.
2.5 River Jhelum, which is locally known as 'Veth', has its source at Vednag in the north-east of Anantnag town. I t flows northwest wards and passes through the city of Srinagar and the towns of Sopore and Baramulla. At Baram~l1a, the river makes an abrupt change in its course because of a deep gorge. Due to its fall from a level of 5,000' to 2,000' only, the river grows ferocious at this place ~aking navigation, which constitutes an important factor of the economy of the areas situated on either side of the river from Anantnag to Baramulla. impossible. Important among its tributaries are Liddar, Dood Ganga, Sindh nallah and Kishen Ganga.
2.6 The source of Chenab is also in the Himalayas. It splits itself at Lahul into two branches called Chandra and Bhaga which meet at Tandi whence they flow jointly in the north-westernly direction. The river makes a characteristic bend at Kishtwar, cuts across Pir Panchal through a gorge and before entering Punjab receives the tribute of river Tawi which flows through Jammu city.
2.7 As regards Ravi, one of its important tributaries, namely, Qjh, passes through the State near about its southern border with Punjab.
Geological Structure
2.8 Much information is not available regarding the geological structure of the areas to the south of Pir Panchal ranges known as the Outer Hills and the Sub-montane region. In so far Its the Jhelum Valley known as the Valley of Kashmir is concerned, geologists have estimated its age at about a hundrad million years. Among the oldest rocks, the Shankaracharya or Takht-i-Sulaiman Hill is believed to be the most aged and considered as the first appearance of Kashmir on the surface of the earth. This part of the State enjoys world-wide reputation for its captivating beauty. Even its
140
extreme ruggedness and the scars left during the course of its tumultuous evolution in the Himalayan heights add to its beauty. Its gigantic mountains with their majestic snowy peaks and grand glaciers, its unique lakes, water-falls, rivers and springs, all co-operate to make it a land of many attractions. In short, as Sir Walter Lawrence remarked, 'the valley contains everything which should make life enjoyable.'
Area
2.9 The State extends to an area of 222,800 square kilometres (86,023 sq. miles) which is slightly more than that of Korea and one-half of Iraq. It exceeds the aggregate area of Himachal Pradesh and Mysore put together.
2.10 No field surveys to determine the extent of the Cease-fire Line.
have been carried out of area on The Survey
\ tliis side of India
have, however, provislonally estimted the area at 138,992 square kilometres (53,665 sq. miles) by planimetering. On this basis, the State, which otherwise holds sixth position among other States of the Indian Union, ranks tenth' only.
son
2.11 The character of soil in the tehsils of districts Doda and· U dhampur except the teiisils of Kishtwar and Ramnagar is identical with what are known in most of the States as Pranti lands where limestone beds either penetrate or are immediately beneath the surface of the soil and cultivation is consequently precariolls. This is also true of tehsil Bashohli but so far as the other tehsils of districts Kathua and Jammu and tehsil Nowshehra of Poonch district are concerned, the soil corresp(lnds to Tarai lands. In the remaining parts of the province which are dominated by kandi table-lands, the soil is made up of red loam intermixed with shingle and stone. In this area, cultivation is dependent on the Monsoon rainfall.
of Kashmir of district
of tehsil
2.12 In the southern region valley consisting of the tehsils Anantnag, tehsil Srinagar and part
Badgam, the- soil is mostly alluvial and, therefore, fairly fertile. One of the table-lands of this area is made of white clay which grows saffron.
2.13 The central part of the valley comprising the tehsils of Badgam, Sonawari and Sopore consists of a plain of low-level alluvium composed of loam and clay. The major part of the borders of this area contains extensive elevated plateaus of alluvial material. These table-lands cannot, however, be 'brought under irrigation.
2.14. Further north of the valley, we come across land covered with calcareous and arenaceous soil due to underlying sedimentary rocks. The soil is sandy, rocky and unproductive though there are a few places on the mountain slopes where forest growth is faid y fine.
RaiDf'all
. 2.15 The rainfall conditions are comparatively more favourable in the western Himalayan region than in the country as a whole. Considering the average rainfall of the State which stands at 43·, it would be seen that the State faUs in the Light Green Belt of th~ country where the annual rainfall ranges from 30' to 50· a year. There are, however, certain tehsils, particularly those of Udhampur and Poonch districts, where the average rainfall exceeds 50' and is at least in one case as high as 83.60'. Except for this tehsil, which falls in the Blue Belt, the remaining tehsils in this region belong to Dark Green Belt. It would not be, however, correct to assume that as a result of this copious rainfall, the size of cultivable land in this sector is large as on account of its mountainous character, the topographical write off is fairly high. At any rate, in the Light Green Belt as a whole, the vagaries of monsoon are apt to cause occasional failure of crops.
2.16 The major part of the State faUs in what is known as Yellow Belt where the annual rainfall does not exceed 15· on an average. In this region, cultivable lands are Scarce and the density of population is as low as 2 per square mile.
141
Population
2.17 The population of the State as returned at the 1961 Census in respect of the area on this side of the Cease-fire Line stands at 3,560,976, or twice _ the Jewish population of Palestine. No information is available about the number of people inhabiting the State territory on \ the other side of the said line.
2.18 If the popalation of the State administered territory only be taken into account, it will be seen that Jammu and Kashmir is least populated among all the major States of India.
AdlDinistrative Divisions
2.19 No information is available about the major _ territorial umts in which the State was divided for the purpose _ of administration before the Mughal rule. Even as it is, while some rough account of purganas, zillas and tehsils of Kashmir _ valley under Moghul rule is forthcoming from some of the chronicles, no such data, whatsoever, is available regarding the province of Jammu.
2.20 Before 1320 A. D., when Muslim rule was for the first time established, Kashmir was divided into three divisions, viz., Maraj in the south, Yam raj or Srinagar city in the centre and Kamraj in the north of the valley. Tradition says that Marhan and Kaman were two brothers who fought each other for the crown of their father as a result of which the territory below Srinagar fell to Kaman and was known as Kamanraj. Marhan conquered the region between Pir Panchal and Srinagar and this part of the valley was named after him as Mahanraj. Srinagar is no longer known as Yamraj, but the areas to its north and south, although forming no administrative units, are sfill called Kamraj and Maraj respectively. Col. Lawrence has stated in his book 'the Valley of Kashmir' that these divisions were later divided into 34 sub-divisions and although most of these had already ceased to exist by 1895, the people preferred to style themselves as the residents of these sub-divisions. A further period of about 70 years has since elapsed, and even now it is customary to call a person belonging to any of the villages round and about the village of Sha~bad-
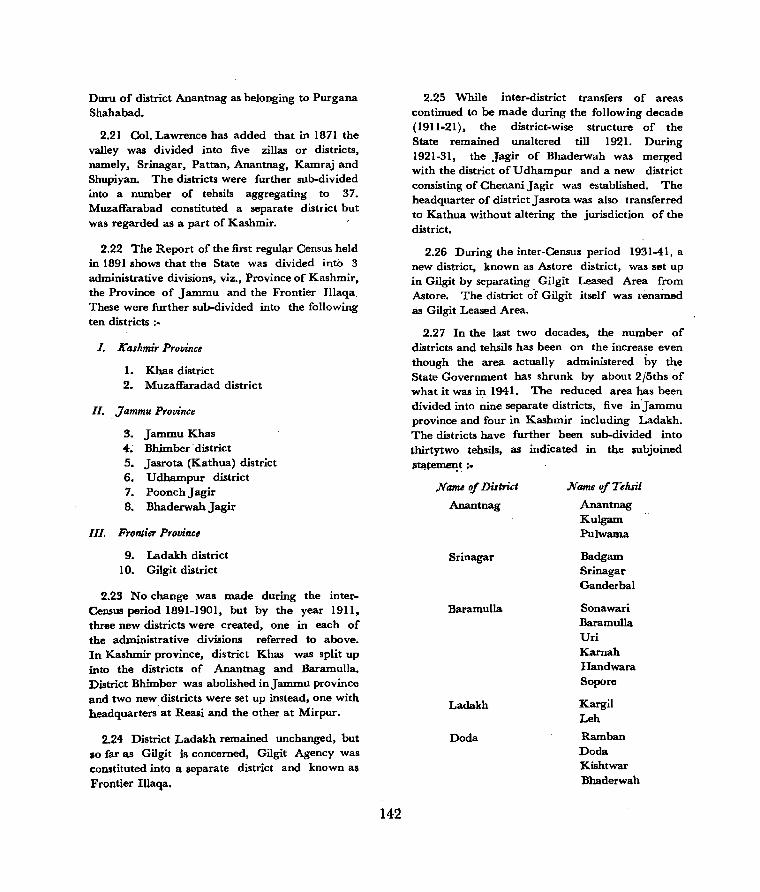
Duru of district Anantnag as belonging to Purgana Shahabad.
2.21 Col. Lawrence has added that in 1871 the valley was divided into five zillas or districts, namely, Srinagar, Pattan, Anantnag, Kamraj and Shupiyan. The districts were further sub-divided into a number of tehsils aggregating to 37. Muzaffarabad constituted a separate district but was regarded as a part of Kashmir.
2.22 The Report of the first regular Census held in 1891 shows that the State was divided into 3 administrative divisions, viz., Province of Kashmir, the Province of Jammu and the Frontier Illaqa, These were further sub-divided into the following ten districts :-
I. Kashmir Province
1. Khas district 2. Muzaffaradad district
II. ,Jammu Province
3. Jammu Khas 4~ Bhimber district 5. Jasrota (Kathua) district 6. Udhampur district 7. PoonchJagir 8. Bhaderwah Jagir
III. Frontier Provine,
9. Ladakh district lO. Gilgit district
2.23 No change was made during the interCensus period 1891-1901, but by the year 1911, three new districts were created, one in each of the administrative divisions referred to above. In Kashmir province, district Khas was split up into the districts of Anantnag and Baramulla. District Bhimber was abolished in Jammu province and two new districts were set up instead, one with headquarters at Reasi and the other at Mirpur.
2.24 District Ladakh remained unchanged, but so far as Gilgit is concerned, Gilgit Agency was constituted into a separate district and known as Frontier Illaqa.
142
2.25 While inter-district transfers of areas continued to be made during the following decade (1911-21), the district-wise structure of, the State remained unaltered till 1921. During 1921-31, the Jagir of Bhaderwah was merged with the district of U dhampur and a new district consisting of Chenani Jagir was established. The headquarter of district J asrota was also transferred to Kathua without altering the jurisdiction of the district.
2.26 During the inter-Census period 1931-41, a new district, known as Astore district, was set up in Gilgit by separating Gilgit Leased Area from Astore. The district of Gilgit itself was I'enamed as Gilgit Leased Area.
2.27 In the last two decades, the number of districts and tehsils has been on the increase even though the area actually administered by the State Government has shrunk by about 2f5ths of what it was in 1941. The reduced area has been divided into nine separate districts, five in'jammu province and four in Kashmir including Ladakh. The districts have further been sub-divided into thirty two tehsils, as indicated in the ,ubjoined
lI~te~t ;.
,Name of District
Anantnag
Srinagar
Baramulla
Ladakh
Doda
Name of Tehsil
Anantnag Kulgam Pulwama
Badgam Srinagar Ganderbal
Sonawari Baramulla Uri Karnah Handwara Sopore
Kargil Leh
Ramban Doda Kishtwar Bhaderwah
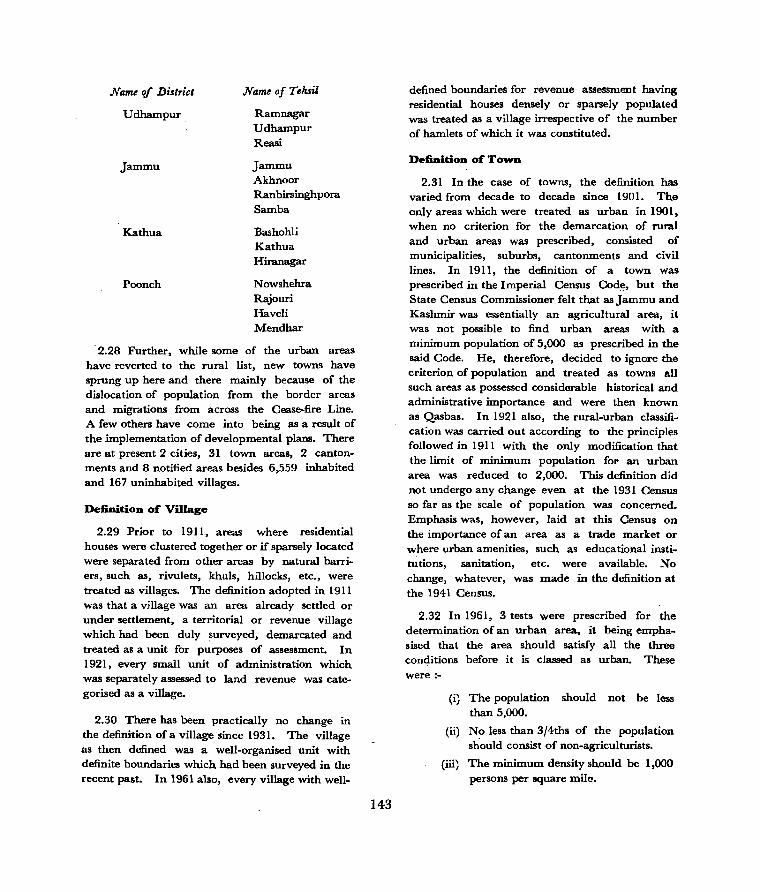
Name of DistTict
Udhampur
Jammu
Kathua
Poonch
Name of Tehsil
Ramnagar Udhampur Reasi
Jammu Akhnoor Ranbirsinghpora Samba
Bashohli Kathua Hiranagar
Nowshehra Rajouri Haveli Mendhar
-2.28 Further, while some of the urban areas have reverted to the rural list, new towns have sprung up here and there mainly because of the dislocation of population from the border areas and migrations from across the Cease-fire Line. A few others have come into being as a result of the implementation of developmental plans. There are at present 2 cities, 31 town areas, 2 canton~
ments and 8 notified areas besides 6,559 inhabited and 167 uninhabited villages.
DefiDitiOD of Village
2.29 Prior to 1911, areas where residential houses were clustered together or if sparsely located were separated from other areas by natural barriers, such as, rivulets, khuls, hillocks, etc., were treated as villages. The definition adopted in 1911 was that a village was an area already settled or under settlement, a territorial or revenue village which had been duly surveyed, demarcated and treated as a unit for purposes of assessment. In 1921, every small unit of administration which was separately assessed to land revenue was cat~ gorised as a village.
2.30 There has been practically no change in the definition of a village since 1931. The village as then defined was a well-organised unit with definite boundaries which had been surveyed in the recent past. In 1961 also, every village with well-
143
defined boundaries for revenue assessment having residential houses densely or sparsely populated was treated as a village irrespective of the number of hamlets of which it was constituted.
DefioitiOD of TowD
2.31 In the case of towns, the definition has varied from decade to decade since 1901. The only areas which were treated as urban in 1901, when no criterion for the demarcation of rural and urban areas was prescribed, consisted of municipalities, suburbs, cantonments and civil lines. In 1911, the definition of a town was prescribed in the Imperial Census Cod~, but the State Census Commissioner felt that as Jammu and Kashmir was essentially an agricultural area, it was not possible to find urban areas with a minimum population of 5,000 as prescribed in the said Code. He, therefore, decided to ignore the criterion of population and treated as towns all such areas as possessed considerable historical and administrative importance and were then known as Qasbas. In 1921 also, the rural-urban classifi~
cation was carried out according to the principles followed in 1911 with the only modification that the limit of minimum popUlation for an urban area was reduced to 2,000. This definition did not undergo any change even at the 1931 Census so far as the scale of population was concerned. Emphasis was, however, laid at this Census on the importance of an area as a trade market or where urban amenities, such as educational institutions, sanitation, etc. were available. No change, whatever, was made in the definition at the 1941 Census.
2.32 In 1961, 3 tests were prescribed for the determination of an urban area, it being emphasised that the area should satisfy all the three conc:iitions before it is classed as urban. These were :-
(i) The population should not be less than 5,000.
(ii) No less than 3f4ths of the population should consist of non-agriculturists.
(iii) The minimum density should be 1,000 persons per square mile.
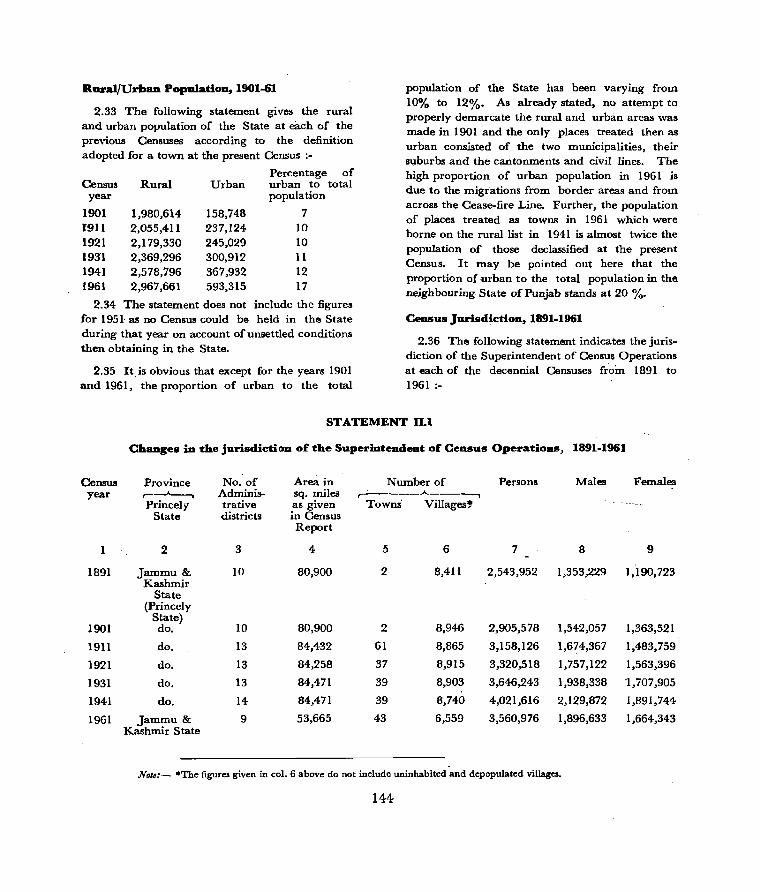
Rural/Urban Population, 1901-61
2.33 The following statement gives the rural and urban population of the State at each of the previous Censuses according to the definition adopted for a town at the present Census :-
Percentage of Census Rural Urban urban to total
year population
1901 1,980,614 158,748 7 1911 2,055,411 237,124 10
1921 2,179,330 245,029 10 1931 2,369,296 300,912 11 1941 2,578,796 367,932 12 1961 2,967,661 593,315 17
2.34 The statement does not include the figures for 1951 as no Census could be held in the State during that year on account of unsettled conditions then obtaining in the State.
2.35 Itis obvious that except for the years 1901 and 1961, the proportion of urban to the total
population of the State has been varying from 10% to 12%. As already stated, no attempt to properly demarcate the rural and urban areas was made in 1901 and the ·only places treated then as urban consisted of the two municipalities, their sl,lburbs and the cantonments and civil lines. The high proportion of urban population in 1961 is due to the migrations from border areas and from across the Cease-fire Line. Further, the population of places treated as towns in 1961 which were borne on the rural list in 1941 is almost twice the population of those declassified at the present Census. It may be pointed out here that the proportion of urban to the total population in the. neighbouring State of Punjab stands at 20 %.
Census Jurisdiction, 1891-1961
2.36 The following statement indicates. the jurisdiction of the Superintendent of Census Operations at each of the decennial Censuses from 1891 to 1961 :-
STATEMENT 11.1
Changes in the jurisdiction or the Superintendent or Census Operations, 1891-1961
Census Province No. of Area in Number of Persons Males Females year ..----A.___, Adminis- sq. miles r-----...A..-----,
Princely trative as given Towns' Villages'!' State districts in Census
Report
1 2 3 4 5 6 7 8 9
1891 Jammu & 10 80,900 2 8,411 2,543,952 1,353,229 1,190,723 Kashmir
State (Princely
1901 State) do. 10 80,900 2 8,946 2,905,578 1,542,057 1,363,521
1911 do. 13 84,432 61 8,865 3,158,126 1,674,367 1,483,759
1921 do. 13 84,258 37 8,915 3,320,518 1,757,122 1,563,396
1931 do. 13 84,471 39 8,903 3,646,243 1,938,338 1,707,905
1941 do. 14 84,471 39 8,740 4,021,616 2,129,872 1,891,744
1961 Jammu & 9 53,665 43 6,559 3,560,976 1,896,633 1,664,343 Kashmir State
Note:- -The figures given in col. 6 above do not include uninhabited and depopulated villages.
144
2.37 Prior to 1846, when the Treaty of Amritsar was signed, the jurisdiction of the State Government varied from time to time extending on one occasion as far as Kabul and Panipat. With the excflption of a few
. territorial exchanges and annexation of some areas made by Maharaja Gulab Singh (1846-1857), there has been no change in the boundaries of the State for a period of 100 years from 1846 to 1947. Yet, as is clear from the above .statement, varying figures of area have been adopted at most of the decennial Censuses held since 1901. The first settlement of the State was undertaken by Col. Lawrence in 1889 and according to the information supplied by him and that given in the Imperial Gazetteer of India, the area as then adopted stood at 80,900 sq. miles. It appears that the settlement operations did not include the areas of Poonch and 13haderwah Jagirs which acounts for the variation between the figures adopted in 1891 and' 1911. Although there was no change in the boundaries of the State during the following decade, yet in 1921 the area was again reduced to 84,258· sq. miles on the advice of the Survey of India. The fall of 1741- sq. miles. was partly reflected in the three valley districts wheJ.·e the area went up from 8,433 sq. miles of 1911 to 8,533 sq. miles and partly in Jammu province, the area of which fell from 12,439 sq. miles to 12,165 sq. miles only. In 1931, when the area figure was raised to 84,471 sq. miles, the then Census Commissioner stated that this increase was reflected in district U dhampur in respect of which Officer-in-Charge No. 1 Party of the Survey of India had supplied figures .only for the area covered by the Modern Surveys, while the Census Commissioner had also included the area which had yet to be surveyed.
2.38 In 1941, the Survey of India agaIn wanted to revise the area, but the then Census Commissioner repeated the figure of 1931 on the advice of the State .Government.
2.39 During the present Census, the Surveyor General of India re-examined the whole position and observed as under:-
145
"The Director, Map Publication, Survey of India has now intimated that the Census map of India, appearing after page 22 of Census of India, 1941 Volume I, India, Part I, Tables by M. W. M.
. Yeatts does not show the northern. portion of the State boundary constituting the external boundary of India. He has added that the area figures of the State' as supplied by the Directorate of Map Publication prior to 1959 were based on the boundary information shown on the above map and were only estimates for the northern districts which were uncovered by Modern Surveys or by large scale maps. The Directorate is now i~ possession of l' maps covering the area with the external boundary marked on' them and the correct area of the State as arrived at after fresh planimetering on' these maps stands at 86,023 square miles;"
. I
2.40 As there has been no change in the boundaries of the State during the ten decades' ending 1941, the disclosure made' by the Surveyor General of India would lead to the' inference that the successive Census Commissioners:.from 1891 to 1941 should have adopted the area of the State at 86,023 square miles.
2.41 After 1947, the jurisdiction of the Superintendent of Census Operations shrank by" about 32,358 square miles consequent upon- the: splitting of the State by the Cease-fire Line.: It was because of the tribal raids of 1947 and: the abnormal conditions caused by theJ.n that we could not fall in line with the rest of thecountry and hold the Census of 1951. Atany rate, the jurisdiction' of Superintendent of Census Operations was thus reduced for the - . first time 'upto the Cease-fire Line, which starting from Kargil runs alongside the northern border of tehsil Sopore and enters Handwara detaching 14! of its villages. It then passes through Karnah intersecting the Domel-Uri Road and extends through Haj"ipir road to Haveli tehsil. Beyond Heveli, the line moves southwards splitting up the tehsils of Mendhar. Kotli and Bhimber.
2.42 In this. way, the jurisdiction of the Census Superintendent was reduced by three districts, viz., Astore, Gilgit Leased Area and Gilgit Agency and five whole tehsils, viz., Muzaffarabad, Skardu, Mirpur, Bagh and Sudhnuti, as also 638 whole and 44 part villages and 4 towns representing the residual parts of such of the tehsils which were split up by the Ceasefire Line. The aggregate area covered by these districts, tehsils and villages etc. as provisionally estimated stands at 32,358 square miles.
2.43 The areas which fell on this side of the said line consisted of six whole districts, namely, Anantnag, Udhampur, Jammu, Kathua, Reasi and Chenani and district Baramulla less by Hi villages of Handwara tehsil, parts of district Muzaffarabad now constituting the tehsils of Uri and Karnah, part of . district Ladakh consisting of tehsil Leh and a portion of Kargil telplil, a part of tehsil Bhimber known as nayabat Chhamb and parts of split-up tehsils of Haveli, Mendhar and Kotli which together with the nayabat of Nowshehra previously included in district Mirpur comprise the new Poonch district. In addition, village Mansar of tehsil Leh has also been excluded from the jurisdiction of 1961 Census due to its occupation by the Chinese.
2.44 The Directorate of Map Publication, Dehradun, have provisionally estimated the atea oil this side of the Cease-fire Line at 53,664.9 square miles as. shown in column 4 against the Census year 1961.
A ColDparisOD or HouseHst and Census Populations
2.45 The subjoined statement gives (a) the houselist population, (b) provisional totals and
(c) final enumeration results by total, males and females:-
Persons Males Females
Houselist Population 3,537,778 1,881,545 1,656,233 Provisional totals 3,583,585 Final Count 3,560,976
1,902,902 1,896,633
1,680,683 1,664,343
It is clear from the above that the final population figures disclose a difference of 22,609 when compared with the provisional' totals. The fall which works out to less t~n 1% was occasioned by the double enumeration of Kashmiri labour which had migrated during winter to Jammu and Punjab, etc. in search of employment and had returned to their homes in the last week of February to celebrate the Id-festival which was approaching fast. Many of these had already been enumerated inJammu during the month of February and were again counted in the course of revisional round from lst to 5th of March, 1961 in the districts of Anantnag and Srinagar. They were, therefore allowed to be enumerated in their home districts only and were struck-off from the records of Jammu district.
2.46 The variation between the ho~elist
population and the final count is .explained by the fact that the former did not include (a) the combatants of the army, (b) houseless population including forest workers and wood· cutters, etc., (c) nomadic population- like Bakerwals and (d) the refugees, such as,khampas from Central Asia.
2.47 The following statment gives the total and sex-wise population of actual count of 1961 and the Planning Commission Committee estimates of 1959 in respect of the State of Jammu and Kashmir:-
Total
( Figures in millions )
Males Females ,....---_..A.. __ ----,
Estimates Actuals r-----..A. Estimates Actuals
,------...",._-----, Estimates Actuals
,5.31 3.56 2.75 1.90 2.56 1.66
146
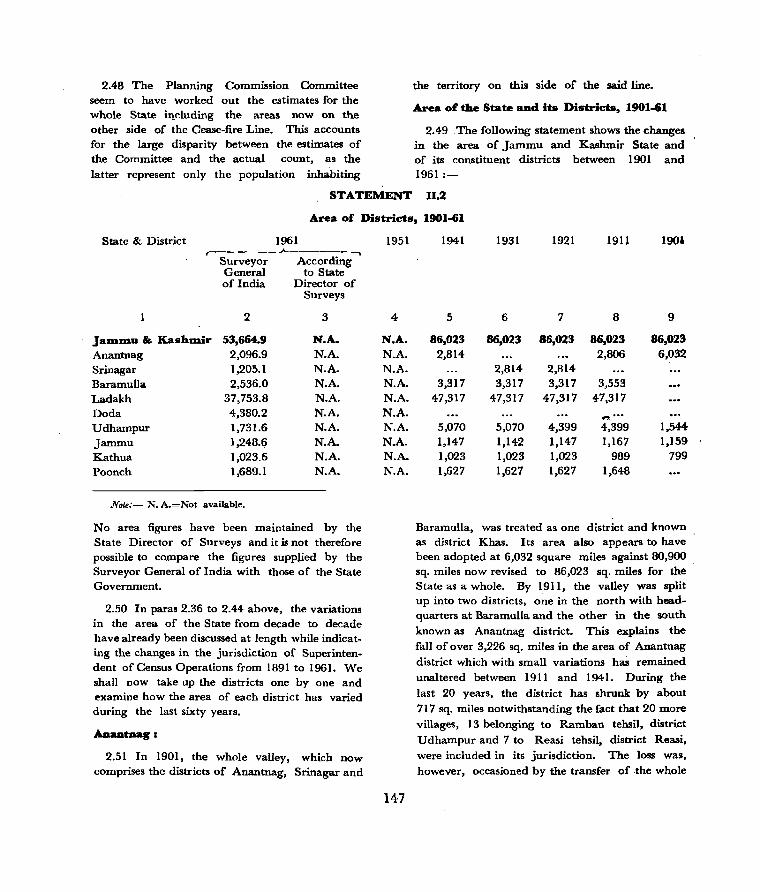
2.48 The Planning Commission Committee seem to have worked out the estimates for the whole State illcluding the areas now on the other side of the Cease-fire Line. This accounts for the large disparity between the estimates of the Committee and the actual count, as the
latter represent only the population inhabiting
STATEMENT
the territory on this side of the said line.
Area of the State and its Districts, 1901-61
2.49 .The following statement shows the changes in the area of Jammu and Kashmir State and of its constituent districts between 1901 and 1961 :-
11.2
Area of Districts, 1901-61
State & District 1961 r-------J-.--------,.
JalDlDU & KashlDir Anantnag Srinagar Baramulla Ladakh Doda Udhampur Jammu Kathua Poonch
Surveyor According General to State of India Director of
2
53,664.9 2,096.9 1,205.1 2,536.0
37,753.8 4,380.2 1,731.6 1,248.6 1,023.6 1,689.1
Surveys
3
N.A. N.A. N.A. N.A. N.A. N.A. N.A. N.A. N.A. N.A.
Nots:- N. A.=Not available.
No area figures have been maintained by the State Director of Surveys and it is not therefore possible to compare the figures suppJied by the Surveyor General of India with those of the State Government.
2.50 In paras 2.36 to 2.44 above, the variations in the area of the State from decade to decade have already been discussed at length while indicating the changes in the jurisdiction of Superintendent of Census Operations from 1891 to 1961. We shall now take up the districts one by one and examine how the area of each district has varied during the last sixty years.
2.51 In 1901, the whole valley, which now comprises the districts of Anantnag, Srinagar and
1951
4-
N.A. N.A. N.A. N.A. N.A. N.A. N.A. N.A. N.A. N.A.
147
1941
5
86,023 2,814
3,317 47,317
5,070 1,147 1,023 1,627
1931
6
86,023
2,814 3,317
47,317
5,070 1,142 1,023 1,627
1921
7
86,023
2,814 3,317
47,317
4,399 1,147 1,023 1,627
1911
8
86,023 2,806
3,553 47,317
..,. ..... 4,399 1,167
989 1,648
1901
9
86,023 6,032
1,544-1,159
799
Baramulla, was treated as one district and known as district Khas. Its area also appears to have been adopted at 6,032 square miles against 80,900 sq. miles now revised to 86,023 sq. miles for the State as a whole. By 1911, the valley was split up into two districts, one in the north with headquarters at Baramulla and the other in the south known as Anantnag district. This explains the
fan of over 3,226 sq. miles in the area of Anantnag district which with small variations . has remained
unaltered between 191 I and 1941. During the
last 20 years, the district has shrunk by about
717 sq. miles notwithstanding the fact that 20 more villages, 13 belonging to Ramban tehsil, district
U dhampur and 7 to Reasi tehsil, district Reasi,
were included in its jurisdiction. The loss was,
however, occasioned by the transfer of the whole
of tehsil Khas to the districts of Srinagar and Baramulla.
SriDagar I
2.52 The area figures shown against this district against the Census years 1921 and 1931 represent the area of Anantnag district, the headquarter of which was transferred duri~g these years to Srinagar. After the tribal raids of 1947, however, a third district was carved out in the valley by detaching certain tehsils and villages from the mstricts of Anantnag and Baramulla. The new district was headquartered at Srinagar and was formed by a redistribution of the villages of tehsils Badgam and Khas of districts Baramulla and Anantnag respectively, which, except for 6 villages of Badgam and 14 villages of tehsil Khas transferred to Sonawari tehsil, Baramulla district, were along with 12 villages detached from Baramulla tehsil, converted into the three constituent tehsils of district Srinagar, namely Badgam, Srinagar and Ganderbal.
Tehsil ,..-__ ..1>.._---. Karnah Uri
1911 area r----_....-A..----~
-1,017 sq. miles
510 " " 2.55 During the two decades 1941-61, the
district lost one whole tehsiI, namely, Badgam (less by six villages) which along with 12 other villages of tehsil Baramulla were transferred to the newly constituted district of Srinagar. In addition, 141 villages of tehsil Handwara now on the other side of the Cease-fire Line were also removed from the jurisdiction of the district. These losses have been partially compensated by the inclusion in the district of 106 villages and one town of tehsil Uri and 48 villages of tehsil Karnah being the residual parts of these tehsils left on this side of the Cease-fire Line. The exact net effect of the losses and gains has not been ascertained, but on the basis of planimetering it is estimated that the district suffered on the whole a loss of 781 square miles.
Ladakh:
2.56 The area of Ladakh district has not
140
B ... aIDulIa:
2.53 The district came into being for the first time in 1911 when its area was estimated at 3,553 sq. miles. During the following decade, it suffered a territorial loss of 236 square miles as indicated below:-
Tehsil Uttarmachipura Langet (Handwara) Tehsil Baramulla
including 179 sq.
Tehsil Sri Pratapsingh Po~ (Badgam)
25 "
32 "
miles
"
" 2.54 While the Census Report of 1921' does
not give any details indicating how this fall was occasioned, it i'is almost certain that some areas of tehsils Uttarmachipura (Handwara) and Baramulla were transferred during the .previous decade to the contiguous tehsils of Karnab and Uri of district Muzaffarabad. This inference is justified by the variation in the area figures of tehsils Karnah and Uri of diStrict Muzaffar,abad for the years 1911 and 1921 which stand as under:-
1921 area Increase ,_.-____ ...A--__ -.., r-----. .J.---~ 1,179 sq. miles 162 sq. miles 590
" " 80
" t,
been given in the Census Report of 1901 nor it is possible to estimate it on the basil! of the density of popUlation as given in the said Report which appears to have been worked out in respect of village areas only and not for the district as a whole. The Report of 1911, however, shows that the district measured 45,762 square miles. There was no change in the boundaries of the district during the subsequent decades and the area of 1911 wa! therefore repeated in all the decennial Census Reports from 1921 to 1941. For reasons already stated in a preceding paragraph, however, the Surveyor General, India has now fixed the area of the district at 47,317 sq. miles of which the territory .on this side of the Cease-fire Line is estimated at 37,753.8 square miles only.
Dada:
2.57 There can be no denying the fact that as a result of the merger of the Jagirs of Chenani

and Bhaderwah, the jurisdiction of Udhampur district became unwieldy after 1941. It covered an extensive area with difficult and varying topographies and a large sparsely dispersed population. The State Govel'nment, therefore, divided the district into two districts, one with headquarters at Udhampur and the other at Doda, a distance of 66 miles. District Doda was formed with the following constituents :-
(i) Bhaderwah and Kishtwar tehsils of Udhampur district.
(ii) Ramban tehsil of Udhampur district except 13 villages.
(iii) 48 (including one uninhabited) villages transferred from U dhampur tehsil of Udhampur district.
(iv) 16 villages (including two uninhabited) transferred from former ChenaniJagir to then Ramban tehsil of Udhampur district, subsequently transferred to Doda tehsil of Doda district.
(v) 12 villages transferred from Reasi tehsil of former Reasi district to Udhampur district, subsequently transferred to Ramban tehsil of Doda district.
Udha:mpur:
2.58 The area figure of Udhampur district for 1901 as shown in the above statement is not available in the Census Report of that year, but has been worked out on the basis of mean density of the 1901 population. The Census Report 1911 also does not give any indication of the jurisdictional changes of the district during the previous decade. The Report, however, shows that the area of the district stood at 4,399 sq. miles including the Jagir of Chenani. and excluding the Jagir of Bhaderwah which was being treated as a separate district then. By 1931 , Chenani was declared a jurisdictional Jagir and separated from Udhampur and the Jagir of Bhaderwah was merged with district Udhampur. This accounted for a territorial gain of 553 sq. miles of Bhaderwah Jagir and a loss of 95 sq. mires representing the area occupied
149
by Jagir of Chenani. There was no jurisdictional change in the district during the decade 1931-41. During the inter-Census period 1941-61, the district lost the folil~wing areas which were transferred to the newly constituted district of Doda:-
(i) Tehsils of Bhaderwah, Kishtwar and Ramban (except 13. villages of Ramban tehsil),
(ii) 48 villages (including one uninhabited) of Udhampur tehsil,
(iii) 12 villages transferred from Reasi tehsil.
In addition, one village of tehsil Ramnagar. namely, Kothar, was also transferred to district Jammu.
These losses were set off partially by the inclusion in the district of;
(a) Former Chenani Jagir merged with U dhampur district except 16 villages (including 2 uninhabited) transferred to then Ramban tehsilof Udhampur district, subsequently transferred to Doda tehsil of Doda district and
(b) Reasi tehsil (less by 7 villages transferred to Anantnag district) which was previously included in Reasi district.
As a result of these changes, the area of the district as obtained on the basis of planimetering shrank in 1961 to 1,731.6 square miles only.
JaDlInu:
2.59 The area of Jammu district as it stood in 1901 is not available, but judging from the mean density as given in the Census Report of 1901, it appears that the district extended to an area of 1,159 sq. miles. This is confirmed by the Report of 1911 in which the area of the district has been placed at 1,167 sq. miles. During the following decade, the district lost 20 square miles and its area was reduced to 1,147 square miles only. Details showing how this change was brought about and which parti-
cular villages were transferred to which district, are not, however, traceable from the concerned Census Report. The only information available from Provincial Table I appearing at the end of the Report is that the decrease was reflected in all the four tehsils, viz., Jammu; Samba, Ranbirsinghpora and Akhnoor, to the extent of 6 sq. miles, 5 sq. miles, 3 sq. miles and 6 sq. miles respectively. The fly-leaf to Table I, however, shows that the area figures had been revised on the basis of information obtained from the Survey of India.
2.60 During the following decade, the district appears to have shrunk by another 5 sq. miles notwithstanding the statement made by the Census Commissioner of 1931 lhat it had territorially -gained by the addition in its jurisdiction "of some 10 villages of Reasi tehsil and 4 villages of tehsil Bhimber".
2.61 In 1941, the area of the district was again adopted at 1,147 square miles. The notes appearing with State Table I of Volume XXII, Parts 1 and 2 of Census of India, 1941 show that the 1931 area of the district was extended by 3 square miles. on account of the inclusion in the district of two villages which belonged to the district of Poonch but were for purposes of enumeration included in Jammu' district. No explanation is available regarding the difference of two square miles except that the areas of the tehsils were not authoritative but accurate enough for all purposes.
2.62 During the period of 20 years from 1941 to 1961, the district gained territorially by the inclusion in its jurisdiction of the nayabat of Chhamb which previously formed a' part of the then tehsil of Bhimber. One village was also transferred to this district from tehsil Ramnagar of district Udhampur. The net arell; in 1961 as estimated after planimetering has 'been placed at 1,248.6 square miles.
K.athua:
2.63 In so far as district Kathua is concerned
the Census Report for 1901 gives the areas of two of its ,three tehsils, Kathua and Hiranagar only, at 224.11 square miles and 182.76 square miles respectiv~ly and does not make any mention about Bashohli. The area of the district as a whole as estimated on the basis of mean density of population has, however, been placed at 799 square miles. During the following decade, there have been slight variations in the areas of tehsils of Kathua and Hiranagar which have been placed at 225 and 185 square miles, but no details showing how , these variations are accounted for are available. The Census Report, however, gives the area of, tehsil Bashohli at 579 sq. miles.
2.64 By 1921, field surveys were completed by the Settlement Departmen~ and the area of the district was fixed 'at 1,023 square' miles. consisting of Kathua (232 sq. miles), Hir,anagar (191 sq. miles) and Bashohli (600 square,miles).
2.65 It, however, appears from the Previous Reports that there have been no jurisdictional changes in the district ever since it was carved out in 1901. The variations in the figures given in the Census Report of 1901 to 1921 seem to be due to the fact that the figures for 1901 and 1911 in respect of tehsil Bashohli which is mostly mountainous were mere-~c~ tures and were not based on any field survey. During the followiug 40 years from 1921 to 1961, the area :;If the district has remained unchanged and has been adopted at 1,023 sq. miles at all Censuses held in 1931, 1941 and 1961.
POODch:
2.66 Poonch was a jurisdictional Jagir -in 1901 held by the Raja of Poonch and was
ot regarded as an integral part of the State L the same sense as the other districts.
_. 'here is, therefore, no mention of the district which was then known as Poo!1ch Illaqa in the Census Report of 1901. The Census Report for 1911, however, shows that Poonch Illaqa
Nolo:- *The Census Report of 1911 mows that the two villages claim an area of 6 aq. miles. ThUl..,ems to be correct as the variation between the 1931 and 1941 area figures of the district stands at 5 square miles.
150
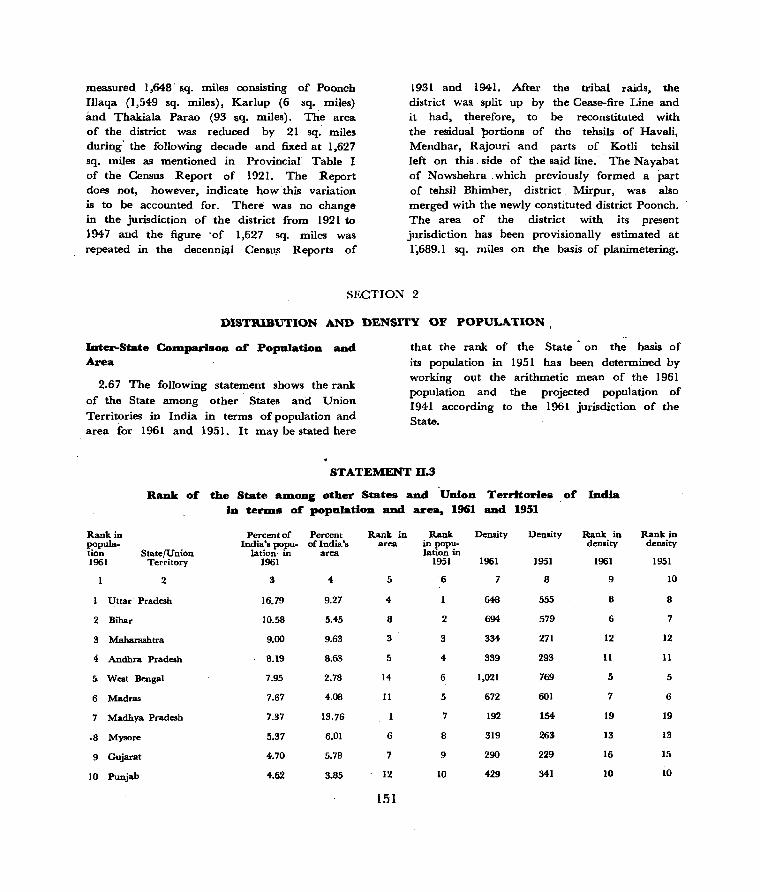
measured 1,648· $.q. miles consisting of Poonch Illaqa (1,549 sq. miles), Karlup (6 sq •. miles) and Thakiala Parao (93 sq. miles). The area of the distdct was reduced by 21 sq. miles during· the following decade and fixed at 1,627 sq. miles as mentioned in Provincial Table I of the Census Report of 192 I . The Report does not, however, indicate how ·this variation is to be accounted for. There was no change in the jurisdiction of the district from 1921 to
1947 and the figure ·of 1,627 sq. miles was repeated in the decenni<JI Censu~ Reports of
1931 and 1941. After the tribal raids, the district was split up by the Cease-fire Line and it had, therefore, to be reconstituted with the residual tx>rtions of the tehaBs of Haveli, Mendhar, Rajouri and parts of Kotli tehsil left on this. side of the said line. The Nayabat of Nowshehra . which previously formed a part of tehsil Bhimber, district Mirpur, was also merged with the newly f'.onstituted district Poonch. The area of the district with its present jurisdiction has been provisionally estimated at 1~689.1 sq. miles on the basis of planimetering.
SECTION 2
DISTRIBUTION AND DENSITY OF POPULATION
luter-State COD1parison of" Population and Area
2.67 The following statement shows the rank
of the State among other States and Union Territories in India in terms of population and area for 1961 and 1951. It may be stated here
that the rank of the State on the basis of its population in 1951 has been determined by working O\1t the arithmetic mean of the 1961 population and the projected population of 1941 according to the 1961 jurisdiction of the State.
STATEMENT n.s Rank of" the State alDang other States and Union Territories of" India
in terIDS of" popUlation and area. 1961 and 1951
Rank in Percent of Percent Rank in Rank Density Density Rank in Rank in popula- India'. popu- of India's area in popu- density density tion State/Union !ation· in area lation in 1961 Territory 1961 1951 1961 1951 1961 1951
2 3 4 5 6 7 8 9 10
Uttar· Pradesh 16.79 9.27 4 648 555 8 8
2 Bihar 10.58 5.45 8 2 694 579 6 7
3 Maharashtra 9.00 9.63 3 3 334 271 12 12
4 Andhra Pradesh 8.19 8.63 5 4 339 293 11 11
5 West Bengal 7.95 2.78 14 6 1,021 769 5 5
6 Madras 7.67 4.08 II 5 672 601 7 6
7 Madhya Pradesh 7.37 13.76 7 192 154- 19 19
·8 Mysore 5.37 6.01 6 8 319 263 13 13
9 Gujarat 4.70 5.78 7 9 290 229 16 15
10 Punjab 4.62 3.85 12 10 429 341 10 10
151
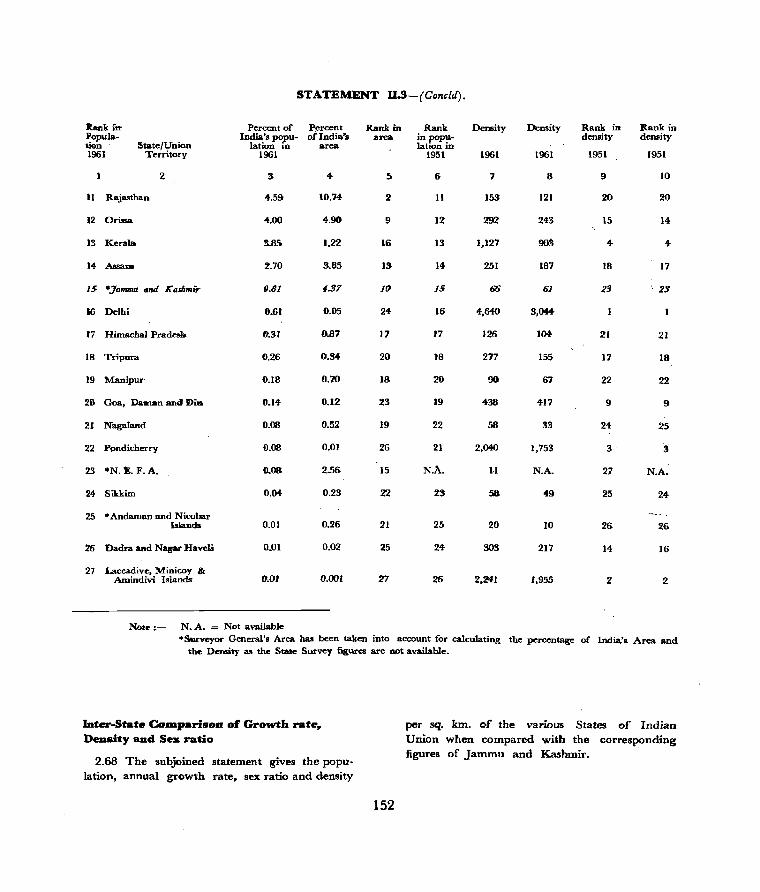
STATEMENT D.3-(Ccmclcl).
Rank irr Percent of Percent Rank in Rank Density Density Rank in Rank in Popula- India's popu- oflndia's area in popu- dens.ity density tion I.'itate(Uilion Iation in area Iation in 19tH Territory 19tH 1951 1961 1961 1951 1951
2 :3 4 !) 6 7 8 9 10
U Rajasthan ".59 10.74 2 II 153 121 20 20
12 Orissa ".00 4.90 9 12 292 243 15 14
)3 Kerala 3..85 1.22 16 13 1,127 90S 4 4
14- Assam 2.70 3.85 13 14 251 187 18 17
15 .. jarrmuz and X'asllmi'r fJ.81 4.37 10 15 66 61 23 \ 23
a6 Delhi 0.61 0.05 24 16 4,640 3,044
17 Himachal Pradesh 8.31 0.87 17 17 126 1M 21 21
18 Tripura 0.26 0.34 20 18 277 155 17 18
19 Manipur· t).tS 0.70 18 20 90 67 22 22
26 Goa, Daman and DiD f).14 0.12 23 19 438 417 9 9
21 Nagaland 0.08 0.52 19 22 58 33 24 25
22 Pondicherry 0.08 0.01 26 21 2,040 1,753 3 3
23 "N.~.F.A. 0.08 2.56 15 N.A. 11 N.A. 27 N.A.
24- Sikkim 0.04 0.23 22 23 58 49 25 24
25 "Andaman and Nicobar Islands om 0.26 21 25 20 10 26 26
26 'Dadra and Nap Havel> 0.01 0.02 25 24 303 217 14 Hi
27 Laccadiv." Minie<>y '" Arnindivi Islands 0.01 0.001 27 26 2.MI 1,955 2 2
Note :- N. A. = Not available .Surveyor General's Area has been taken into account for calculating the percentage of India'" ATCa and
the Derl&ity as the State Survey figu.res are not available,
Inter-State CoIDpari_1I 01 Growth rate,. Density and Ses ratio
2.68 The subjoined statement gives the population, annual growth rate, sex ratio and density
152
per sq. km. of the various States of Indian Union when compared with the corresJ:>onding figures of Jammu and Kaslnnir.
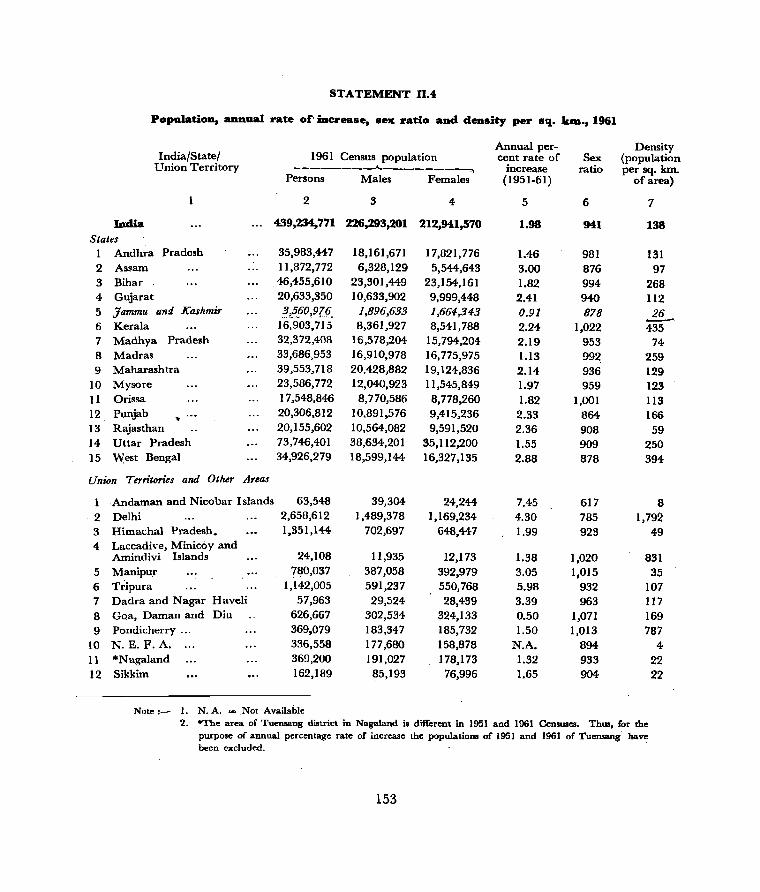
STATEMENT 11.4
Population, annual rate of'iDerease, Bex ratio and density per sq. km.., 1961
India/State/ Union Territory
~ States
1 Andhra Pradesh
2 Assam 3 Bihar 4 Gujarat 5 Jammu and Kashmir 6 Kerala 7 ~adhya Pradesh 8 ~adras
9 Maharashtra 10 Mysore
11 12
Orissa Punjab
13 Rajasthan ..
14 Uttar Pradesh 15 ~est Bengal
Union Territories and Other Areas
.Andaman and Nicobar Islands
2 Delhi 3 Himachal Pradesh. 4 Laccadive, Minicay and
Amindivi Islands 5 Manipur 6 Tripura 7 Dadra and Nagar Haveli 8 Goa, Daman and Diu 9 Pondicherry ...
10 N. E. F. A. 11 * NagaJand 12 Sikkim
1961 Census population --------~-------~
Persons Males Females
2 3 4
439,234,771 226,293,201 212,941,570
35,983,447 1I,872,772 46,455,610 20,633,350
~,~60,9!§. 16,903,715 32,372,408 33,686,953 39,553,718 23,586,772 17,548,846 20,306,812 20,155,602 73,746,401 34,926,279
63,548 2,658,612 1,351,144
24,108 780,037
1,142,005 57,963
626,667 369,079 336,558 369,200 162,189
18,161,671 6,328,129
23,301,449 10,633,902
1,896,633 8,361,927
16,578,204 16,910,978 20,428,882 12,040,923
8,770,586 10,891,576 10,564,082 38,634,201 18,599,144
39,304 1,489,378
702,697
] 1,935 387,058 591,237
29,524 302,534 183,347 177,680 191.027 85,193
17,821,776 5,544,643
23,154,161 9,999,448 1,664,343 8,541,788
15,794,204 16,775,975 19,124,836 11,545,849
8,778,260 9,415,236 9,591,520
35,112,200 16,327,135
24,244 1,169,234
648,447
12,173 392,979 550,768 28,439
324,133 185,732 158,878 178,173 76,996
Note:- 1. N. A. = .Not Available
Annual percent rate of
increase (1951-61)
5
1.98
1.46 3.00 1.82 2.41 0.91 2.24 2.19 l.l3 2.14 1.97 1.82 2.33 2.36 1.55 2.88
7.45 4.30 1.99
1.38 3.05 5.98 3.39 0.50 1.50
N.A. 1.32 1.65
Density Sex (population
ratio per sq. km.
6
941
981 876 994 940 878
1,022 953 992. 936 959
1,001 864 908 909 878
617 785 923
1,020 1,015
932 963
],071 1,013
894 933 904
ofarea)
7
138
131 97
268 112 26 -435 74
259 129 123 113 166 59
250 394
8 1,792
49
831 35
107 117 169 787
4-22 22
2. ·The area of Tuensang district in Nagaland is different in 1951 and 1961 Censuses. Thus, for the purpose of annual percentage rate of increase the population. of 1951 and 1961 of Tuensang have been excluded.
153

(a)-D~.i:ty
2.69 Jammu and KalIhmir State ranks 10th and 15th in respect of area and population respectively when compared with other major States in the Indian Union. It is, therefore,
,that the density per square kilometre of area lis also low, being higher only than the densities 10f a few Union Territories.
2.70 The density of population usually depends on three factors, namely, topography, soil and rainfall. According to its jurisdiction of 1941, the State claims a total land area of 55,054,720 acres consisting of -
(1) Mountains above the ") height of 7,000 feet j= 50,454,720 acres
(2) Hills above the height of 3,000 feet but less than 7,000 feet
(3) Plateaus lying between 1,000 feet and 3,000 feet above the sea-level
Plains
1 = 2,700,000 acres I approximately· I
J
1 r = 1,600,000 acres I approximately J
300,000 acres
2;71 It is interesting to note that the area covered by mountains in the State accounts for about 61% of the total m~untainous area of India and 92% of the total land area of the State. Of this, no less than 95% is to be written off as unsuitable for cultivation.
2.72 Even so far as hills are concerned, only 25% of their area can be made use of for farming. In the case of plateaus and plains, however, the write offs are estimated at 25% and 5% respectively.
2.73 On this basis, it will be seen that the unusable area of the State is as huge as 50,371,984 acres and the topographically usable area is approximately 4,682,736 acres only.
2.74 Statistics showing the topographic components of the State territory on this side of
154
the Cease-fire Line are not available At any rate, except for the· region extending from Udharnpur to Pooneh, all other areas are densely interspersed by mountains and hills, the only exception being the valley of Kashmir which also has a height of more than 5,000'. The per capita land area on this side of the Cease-fiire Line works out to 9.6 acres of which no less than 9 acres are unusable reducing the per capita cultivable area to 0.6 acres only. The net area sown per capita is still less and stands at 0.5 acres.
2.75 Summing up, it is clear that the land area per capita is fairly high in the State as a result of which the density of population is extremely low. This is, as it should be, as
the Western Himalayan Sub-region to which Jammu and Kashmir belongs, hall, ex;cept for the desert, the lowest density in the whole of India.
2.76 It seems that the splitting up of the State by Cease-fire Line has slightl¥ improved the density of population . inhabiting the ter..-itory on this side of the said line. The Census Report of 1941 shows that the State extended to an area of 222,800 sq. kilometres (86,023 sq. miles) and was inhabited by 4,021,616 persons. If, therefore, the State had not bee~ _. split up, it should have had a population of 4,753;556 in 1961 according to the annual pe;centage growth rate of 0.91 per year, giving a density of 21 per square kilometre. Even if we work out~e population of the whole State in 1961 on the basis of the. growth rate during the inter-Censal period 1931-4-1, it should have stood at 4,858,116 resulting in a density of ~2 per square kilometre only.
2.77 The very low density of the State is due to the concentration of the population in a small sector of area where cultivable lands and irrigational facilities are available and which provide larger avenues of employment to the inhabitants. The m~or part of the State is however, inhabited by a very small percentage of its popUlation with a density of 2 per sq. mile or 0.91 per sq. kilometr.~. This region

abounds in nude· moun~ains where vegetanon is scarce, cultivable areas limited and alternative avenues of employment very few, if any.
2.78 If we exclude the area and population of district Ladakh which, as constituted at present, claims more than 2/3rds 01 the State area and less than 2.5% of iq population on this side of the Cease-fire Line, the density per sq. kibmetre would be 84. In other words, the de:runty of population for the residual area would be h~her than the densities of Madhylt Pradesh and' Rajasthan
2.79 Yet another important reason for the low de:::lSity of the State is the annual growth rate which when compared to other States in the Indian Union is also the lowest. A reference to the map on page 121 of the "Census of India, 19;;1, Volume I, Part I-A-Report" will show that the mean annual growth rate in Jammu and Kashmir for six: decades from 1891-1901 to 1941-51 has been 1.1% per year only. In other States except the Eastern Himalayan Sub-region, where the rate was slightly higher and stood at 1.2%, it varied from 2.1 % to 5.2% pet year.
2.80 The fact, however, remains that the density of the State has been progressively [ncreasing ftom decade to decade all along in the past as indicated below:-
Density per sq. mile ,-_____ --A. _______ -,
1901 1911 1921 1931 1941 1961
Density according to the· population at each Census 36 37
Density on the ba3i~ of PI'ojected popUlation accol'ding to 1961 jurisdiction 40 43
39 43 48 66
45 50 55 - 66
2.81 The following statement gives the districtwise densities per !'q. mile according to the actual Censuses of 1941 and 1961 and the 1941 density on the basia of 1 S61 juriidicLiuDs:-
155
1941 1941
District 1961 Density Density
Density (adjusted (actual population) popula-
tion)
Anantnag 312 251 303 Srinagar 531 412 Baramulla 238 199 185 Ladakh 2 2 4-Doda 61 46 Udhampur 147 122 58 Jammu 414 343 376 Kathua 203 174 174 Poonch 193 192 259
2.82 The statement shows that there has been practically no increase in the densities of population of Poonch and Ladakh districts as worked out on the basis of their 1961 population and the adjusted population of 1941. If, however. the actual density of 1941 is compared with that of 1961, it would be seen that the densities of the two districts have suffered a substantial fall. In other districts, the rate of increase in the density has varied more or less in proportion to the size of immigrants absorbed by them.
2.83 It is evident that the increase in the density of population is mainly reRected in such of the districts where agriculture is the mainstay of the people. The districts of· Anantnag, Srinagar and Jammu have registered phenomenal increases when compared with Baramulla, Doda, Udhampur and Kathua which are most! y mountainous and include much smaller proportions of cultivable areas. If, therefore, cultivated areas alone are taken into account, it will be seen that the density per square mile in the State as a whole would be as high as 1,404.
(b) Decemdal Increase.
2.84 In his all-India Report on the 1931 Census, Dr. Hutton observed that the decennial increase of 10.6% in India's population during 1921-31 was <cfrom most points of view a cause of alarm rather than satisfaction". It is difficult to surmise what comment Dr. Hutton would have made in 1961 when the growth rate had more than tWubled and stood at 21.5%. While

this is true of India as a whole, the decennial increase in Jammu and Kashmir has remained within bounds and has not registered any phenomenal rise. On the other hand, as is clear from the preceding statement, the State has had the lo~est increase percent when compared not only with other major States in India but also in relation to several Union Territories, such as Pondicherry, Nagaland and Sikkim etc. etc.
2.85 The persistent low growth rate in Jammu and Kashmir is the cumulative effect of several factors which have been operating simultaneously to retard the speed of multiplication of population. These include, among others, economic backwardness, natural calamities, absence of adequate medical facilities and the cultural background of the persons living in the State. According to previolls Census Reports, there has been hardly a decade when the State or some of its parts were not visited by natural calamities which dealt severe blows to its already frail economy and took a heavy toll of human lives every time. During the decade 1901-11, Cholera broke out in epidemic form in Kashmir no less than three times resulting in the death of 17,118 persons. This was followed by pneumonic plague which had its own share of human lives. In Jammu, the harvests were ba.d and malaria ravaged the lower tracts.
2.86 In 1920, a number of areas in the State experienced an extraordinary dry year due to which the mortality rate was fairly high. Many people deserted their homes and migrated to pl<..ins in search of livelihood. During this decade, influenza and plague also broke out in the two provinces of Kashmir and Jammu respectively and as observed by the then Census Commissioner "wrought havoc among the population regardless of climate, locality, profession, sex or age". Influenza alone accounted for a death toll of 44,514 persons, while the number of deaths from plague which had nine visitations was estimated at 9,134. In Kashmir, influenza was followed by cholera adding another 18,064 persolls to the death roll. As if these
156
calamities were not enough to thin down the. population, small-pox also visited both the provinces of Jammu and Kashmir and had its own share of 16,504 lives.
2.87 Another important event of the decade was . the outbreak of world war I. . While some of the 18,000 recruits supplied by State were killed in action, many others were, on their return, Pf'rmanently absorbed in British Indian Army .
• 2.88 During the decade 1921-31, • a severe
famine appeared in Jammu Province and was followed by diseases of various kinds re~ulting
in a fairly high death rate. In Kashmir~ the rainfall was below normal and the crops were damaged in the rabi and kharif seasons of 1921 and 1922. In 1924 Reasi and Kathua had excessive and untimely rains which damaged the kharif crops leaving very little for harvest.
2.89 In 1925, Cholera again broke· out in Kashmir and was followed by plague inJammu in 1928.
2.90 In 1927-28, the valley experienced unprecedented heavy rainfall which brought about disastrous floods washing away all crops and a large number of cattlt' and resulting in the death of many people. In Jammu Province also, the rivers, streams"- and nallahs rose to inconceivable heights bringing wholesale destruction to all life and property which feU before the fatal current. Soon after the district of Jammu and other areas were visited by plague adding to the already heavy death roll of human beings. In 1929 also all low level areas in Kashmir were submerged in floods which caused immense loss in the shape of crops, cattle, houses and human beings. During the following year, rainfall was excessive resulting in water laggings of large cultivable areas which told heavily on both rabi and kharif crops. 1930, however, rains were scarce and the produce was hardly sufficient even for local consumption.
2.91 In the subsequent decade (1931-41), plague broke out several times. in epidemic form
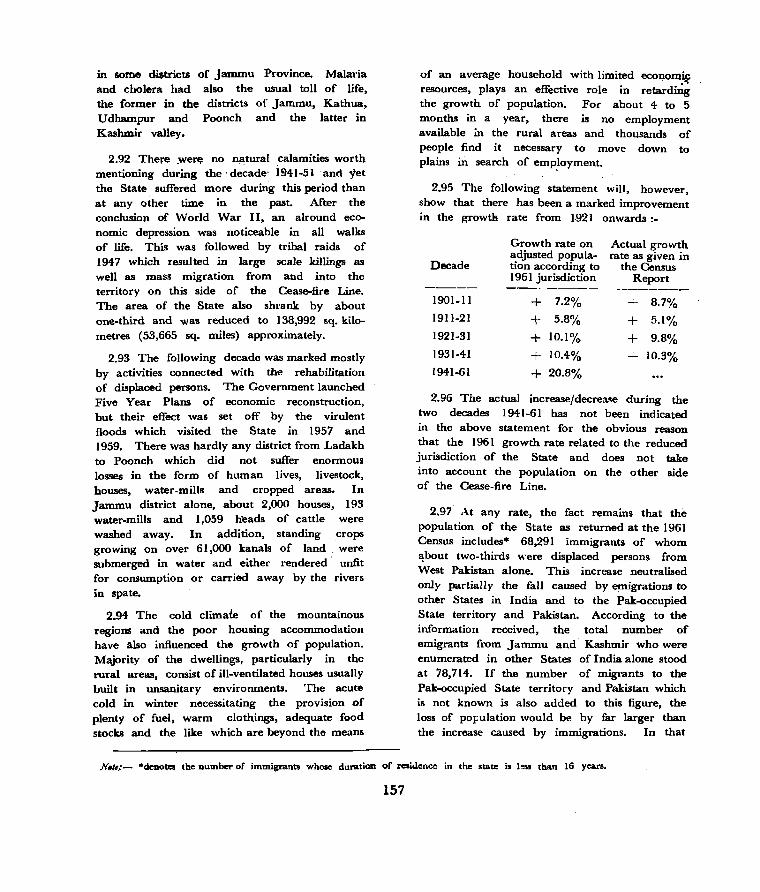
in some di$tricts of Jammu Province. Malaria and cholera had also the usual toll of life, the former in the districts U dhampur and Poonch Kashmir valley.
of Jammu, Kathua, and the latter in
2.92 There .we~ no n;ltural calamities worth mentioning dUring the' decade' 1941-51 . and yet the State suffered more during this period than at any oiher time in the past. After the conclusion of World War II, an alround economic depression was noticeable in all walks of life. This was followed by tribal raids of 1947 which resulted in large scale killings as well as mass migration from and into the territory on this side of the Cease-fire Line. The area of the State also shl'ank by about one-third and was reduced to 138,992 sq. kilometres (53,665 sq. miles) approximately.
2.93 The following decade was marked mostly by activities connected with the rehabilitation of displaced persons. The Government launched Five Year Plans of economic reconstruction, but their effect was set off by the virulent floods which visited the State In 1957 and 1959. There was hardly any district from Ladakh to Poonch which did not suffer enormous losses in the form of human lives, livestock, houses, water-mills and cropped areas. In Jammu district alone, about 2,000 houses, 193 water-mills and 1,059 beads of cattle were washed away. In addition, standing crops growing on over 61,000 kanats of land, were submerged in water and either rendered' unfit for consumption or carried away by the rivers in spate.
2.94 The cold climale of the mountainous regions and the poor housing accommodation have also influenced the growth of population. Majority of the dwellings, particularly in the rural areas, consist of ill-ventilated houses usually built in unsanitary environments. The acute cold in winter necessitating the provision of plenty of fuel, warm clothings, adequate food stocks and the like which are beyond the means
of an average household with limited econom~ in retardnig
about 4 to 5 resources, plays an effective role the growth of population. For months in a year, there is no employment available in the rural areas and thousands of people find it necessary to move down to plains in search of emp~oyment.
2.95 The following statement will, however, show that there has been a marked improvement in the growtk rate from 1·921 onwards:-
Growth rate on Actual growth
Decade adjusted popula- rate as given in tion according to the Census 1961 jurisdiction Report ----- ----- -------
1901-11 + 7.2% + 8.7% 1911-21 + 5.8% + 5.1%
1921-31 + 10.1% + 9.8% 1931-41 + 10.4% + 10.3%
1941-61 + 20.8%
2.96 The actual increase/decrea.se during the two decades 1941-61 has not been indicated in the above statement for the obvious reason that the 1961 growth rate related to the reduced jurisdiction of the State and does not take into account the population on the other side of the Cease-fire Line.
2.97 At any rate, the fact remains that the population of the State as returned at the 1961 Census includes* 68,291 immigrants of whom ~bout two-thirds were displaced persons from West Pakistan alone. This increase neutralised only partially the fall caused by emigrations to other States in India and to the Pak-occupied State territory and Pakistan. According to the information received, the total number of emigrants from Jammu and' Kashmir who were enumerated in other States of India alone stood at 78,714. If the number of migrants to the Pak-occupied State territory and Pakistan which is not known is also added to this figure, the loss of pOFulation would be by far larger than the increase caused by immigrations. In that
N.,.;- "denotes the number of immigrants whOle dUTatiOll of residence in the state i. blS than 16 years.
157
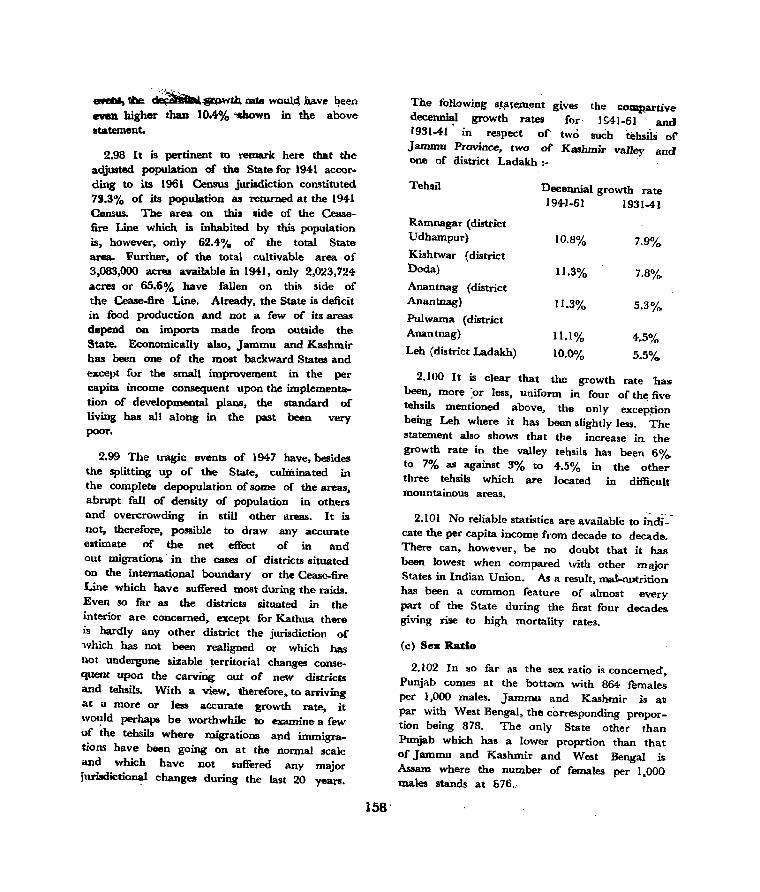
8ftJN, 'rIbe. ~~tb. tale would, have been even higher than 10.4% ,.sown in the above ltatement.
2.98 It is pertinent to remark here that the adjusted population of the State for 1941 according to its 1961 Census juriadiction constituted 73.3% of its population as returned at the 1941 Census. The area on this side of the Ceasefire Line which is inhabited by this population is, however, only 62.4% of the total State area. Further, of the total cultivable area of 3,083,000 acres available in 1941, only 2,023,724 acres or 65.6% have fallen on this side of the Cease-fire Line. Already, the State is deficit in food production and not a few of its areas depend on imports made from outside the State. Economically also, Jammu and Kashmir has been one of the most backward States and except for the small improvement in the per capita income consequent upon the implementation of developmental plans, the standard of living has all along in the past been very poor.
2.99 The tragic events of 1947 have, besides ~he splitting up of the State, culminated in the complete depopulation of some of the areas, abrupt fall of density of population in others and overcrowding in still other areas. It is not, therefore, possible to draw any accurate estimate of the net effect of in and out migrations in the cases of districts situated on the international boundary or the Cease-fire Line which have suffered most during the raids. Even so far as the districts situated in the interior are concerned, except for Kathua there is hardly any other district the jurisdiction of which has not been realigned or which has not undergone sizable territorial changes consequent upon the carvj~ aut of new districts and tehsils. With a view, therefore~ to arriving at a more or less accurate growth rate, it wo~ld perhaps be worthwhile to examine a few of the tehsila where migrations and immigrations have been going on at the normal scale and which have not suffered any major jurisdictional changes .during the last 20 years.
158'
The foJlowing s~Me.m.ent gi,v~ the compartive decenn~l growth rates for' IS41-61 and 1931 ..... 1 in respect of' two such tehsii. or Jammu Province, two of Kashmir valley and one of aistrict Ladakh:-
Tehsil Decennial growth rate 1941-61 1931-41
Ramnagar (district Udhampur) 10.8% 7.9% Kishtwar (district Doda) 11.3% 7.8% Anantnag {district Anantnag) 11.3% 5.3% Pulwama (district Anantnag) 11.1% 4.5% Leh (district Ladakh) 10.0% 5.5%
2.100 It is clear that the growth rate 'has been, more :or less, uniform in four of the five tehsils mentioned above, the onI y excep~ion being Leh where it has been slightly less. The statement also shows that the increase' in. the growth rate in the valley tehsils ha, been 6'Y.,. to 7% as against 3% to 4.5% in the other three tehsils which are located in difficult mountainous areas.
2.101 No reliable statistics are available to indio cate the per capita income from decade to decade. There can, however, be no doubt that it has been lowest when compared with other major States in Indian Union. As a result, mall-nutrition has been a common feature of almost every part of the State during the first four decades. giving rise to high mortality rates.
(c) Ses Ratio
2.102 In so far as the sex ratio is concerned, Punjab comes at the bottom with 864 females per 1,000 males. Jammu and Kashmir is all par with West Bengal, the corresponding proportion being 878. The only State other than Punjab which has a lower proprtion than that of Jammu and Kashmir and West Bengal is Assam where the number of females per 1,000 males stands at 676~.

2.103 The. deficiency of femal~ population as cr;>mpared to that of males is not peculiar to JimlInu and Kashmir onlY'but is true in varying degrees of most of the States in India. The reasons accounting for this disparity have been discussed at some length by Shri R. A. Gopa1aswami in Volume I, Part I-A, Census of India, 1951, in which he has observed that we' must accept as a fact the existence of male excess at the time of birth and that the deficiency of females must be recognised as a biological phenomenon. It is also true, as stated by him, that nature having given rise to inequality redresses it by a large proportion of male infant deaths than those of females. According to the vital statistics of the State for 1960, the proportion of female births was only 873 as against 1,000 males. The 1961 Census figures, however, show that within one year of the birth this large disparity was almost completely wiped out and the number of female infants of less than one year's age stood at 980 as against 1,000 male children of the Saine age.
2.104- Besides the ",hove, there are several other causes which co-operate £0 retard the growth of female population. Among these, mention may be made of early marriages which though prohibited under the Infant Marriages Act are still being practised in certain areas. The 1961 Census data shows that of the total number of 26,921 marriild persons in the agegroup 10-14, as many as 21,927 were females. In addition, there were 154 widowed and 151 divorced or separated females of the same group.
2.105 There can be no denying the fact that the Infant Marriages Act has succeeded in restraining the people to some extent from marrying minor children, but it would be a mistake to assume that this social evil has been completely eradicated. The Census Report of the State for 1941 shows that there were 39,13~ married females in the age-group 10-14 in a total female population of 1,891.744. glvmg a percentage of 2.1 approximately. The corresponding proportion of married females in this age-group in 1961 is slightly more than
159
1.3%, the number of married females being 21,927 against the total. female population of 1,664,343. It is possible that with a view to escaping the penalty imposed by the law, some of the'married females in the age-group 15-19 may have returned inflated ages even though they actually belonged to the lower age-group. This explanation gains support from the fact that there has been virtually no fa)] in the proportions of married females in the age-group 15-19 during the years, 1941 and 1961 which stand at 6.3% in each case.
2.106 This analysis could be further elaborated if the mortality rates of boys and girls at different ages had been available. Unfortunately, however, the data on vital statistics supplied by the Directorate of Health Department of the State Government gives the total number of births and deaths of each sex and does not contain the break-up by different ages.
2.107 That there is a larger incidence of mortality at the time' of child birth of females married at an early age is corroborated by the statistics of single year age-groups for the State and its rural and ,urban areas which show an abrupt fall in the sex ratio at the age of 15 in all the three sectors, as indicated below:-
Total Rural Urban
Sex ratio at the age of r-------..A------- .......
13 14 15
916 906 954
919 917 931
802 792 855
2.108 The correspondin~ proportions in the higher age-groups disclose a steady improvement in the female population inhabiting the State as a whole and its rural areas. In so far, however, as the urban' parts are concerned, the decline in the proportion of females continues even in higher age-groups where the corresponding proportions sfWld at 870, 811 and 782 at the age of 16, 17 and 18 years respectively. While the main cause for this fall is greater mortality of females at child birth, the variation between the rural and urban proportions of

females per 1,000 males appears to be also due to frail and anaemic physical structure of urban females who are not used to hard work and consequently succumb to diseases and ailments. The rural females, on the other hand, work for the major part of the year along with male members and develop a greater power of resistance. That is why the proportion of rural females per 1,000 males is 884 against 844 of the urban areas. This disparity is also reflected in varying degrees in the sex ratios of broad age-groups, as indicated below:-
Age- Overall Rural Urban group proportions only only
0-9 957 961 938
10-19 875 876 869
20-29 1,008 1,037 879 30 and above 755 759 730
2.109 The fact that the proportion of females to males from the age of 30 and above is progressively declining suggests that besides the high mor~~lity rate brought about by early marriages, the health of women is not being looked after properly and that adequate medical facilities are not made available to them. It is also a matter of common knowledge that middle and advanced aged women have a tendency of deflating their ages and it is possible that this may have to some extent contributed to the fall of sex ratio in higher age-groups. Further, many women in Kashmir live behind closed doors doing very little work, if any, which gradually reduces their power of resistance and makes them anaemic and therefore easily prone to diseases.
2.110 Besides the high incidence of female deaths at child birth and greater mortality of grown-up females due to their vulnerable physical build-up, migrations of males into urban areas also play an effective role in reducing the proportion of female population. During winter when the Census is taken, tlw rural areas provide very limited avenues of empolyment with the result that many males pour into towns and cities in search of livelihood leaving behind their families in the rural areas.
160
2.111 Let us now examine the year-wise vital statistics for the period 1951-60 and work out the incidence of births and deaths in the two sexes for e~ year. This will show that while the number· of female births has every year been less than that of males, the number of female deaths has, except for the years 1952-54, been proportionately larger than that of their births, as indicated in the following statement:-
Year
1951
1952
1953
1954
1955
1956
1957
1958
1959
1960
Average for 1951-60
Female births per 1,000 male births
797
895
933
976
940
917
912
892
867
873
901
Female deaths per 1,000 male deaths
1,025
863
760
892
1,045
1,021
1,018
895
997
912
935
2.112 The decade did not witness any_ extraordinary calamities except the floods of 1957 and 1959 and cholera epidemic of 1960 which was, however, brought under control immediately after it broke out. There has, of course, been some loss of life due to floods but the statistics made available show that the male popUlation suffered proportionately more on this account than the females. This goes to show that the high female mortality rates are not due to any extraordinary incidents of the decade but are attributable to the cumulative effect of the various causes which have already been mentioned.
2.113 Finally, it must also be acknowledged that the strains of life tell heavily on women at certain ages and on men at some other age wherefore disparities are noticeable more prominently in different age-groups of the two sexes. Further, the data shows that the sex ratio in the districts which are wholly or partly
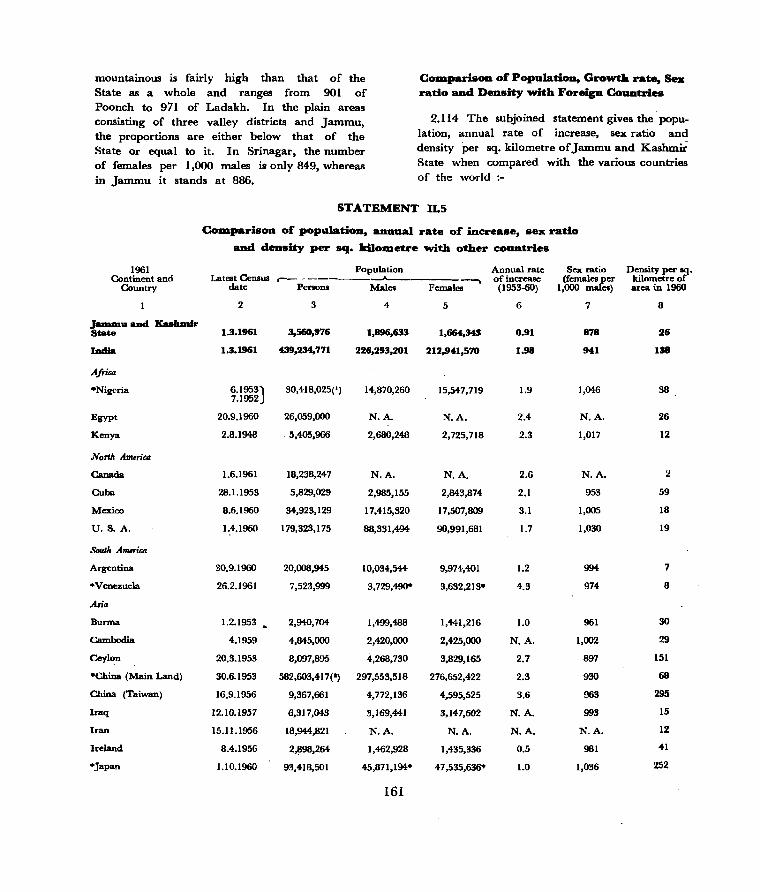
mountainous is fairly high than that of the State as a whole and ranges from 901 of Poonch to 971 of Ladakh. In the plain areas consisting of three valley districts and Jammu, the proportions are either below that of the State or equal to it. In Srinagar, the number of females per 1,000 males is' only 849, whereas in Jammu it stands at 886.
COlDparisOD of Population, Growth rate, Ses ratio and Density with Foreign Countries
2.114 The subjoined statement gives the population, annual rate of increase, sex ratio and density per sq. kilometre of Jammu and Kashmii State when compared with the various countries of the world :-
STATEMENT 11.5
1961 Continent and
Country
J_uaad KaaJunir State
India
Africa
-Nigeria
Egypt
Kenya
North America
Canada
Cuba
Mexico
U. S. A.
Soulh A....nca
Argentina
*Venezl1eia
Asia
Burma
Cambodia
Ceylon
-China (Main Land)
China (Taiwan)
Iraq
Iran
Ireland
*.Tapan
ColDparisoD of popalatiOll, aDUuai rate of increase, sex ratio
and density per sq. kUODIetre with other countries
Population Annual rate Sex ratio Latest Census ,-----------"----------. ofinerease (fema~er
date Penon. Males Female. (1953-60) 1,000 es)
2 3 4 5 6 7
13.1961 3,560,976 1,896,633 1,664,343 0.91 878
1.3.1961 439,234,771 226,293,201 212,941,570 1.98 941
6.1953J 7.1952
30,4-18,025(1) 14,870,260 15,547,719 1.9 1,046
20.9.]960 26,059,000 N.A. N.A. 2.4 N.A.
2.8.1948 5,405,966 2,680,248 2,725,718 2.3 1,017
l.6.1961 18,238,247 N.A. N.A. 2.6 N.A.
28.1.1953 5,829,029 2,985,155 2,843,874 2.1 953
8.6.1960 34,923,129 17,415,320 17,507,809 3.1 1,005
1.4.1960 179,323,175 88,331,494 90,991,681 1.7 1,030
30.9.1960 20,008,945 10,034,544 9,974,4()1 l.2 994-
26.2.1961 7,523,999 3,729,490· 3,632,213- 4.3 974
1.2.1953 2,940,704 1,499,488 1,441,216 1.0 961
4.1959 4,845,000 2,420,000 2,425,000 N.A. 1,002
20.3.1953 8,097,895 4,268,730 3.829,165 2.7 897
30.6.1953 582,603,417(·) 297,553,518 276,652,422 2.3 930
16.9.1956 9,367,661 4,772,136 4,595,525 3.6 963
12.10.1957 6,317,043 3,169,441 3,147,602 N.A. 993
15.11.1956 18,944,821 N.A. N.A. N.A. N.A.
8.4.1956 2,898,264- 1,462,928 1,435,336 0.5 981
1.10.1960 93,418,501 45,871,194· 47,535,636· 1.0 1,036
161
Density per sq. kilometre of area in 1960
8
26
138
38
26
12
:!
59
18
19
7
8
30
29
151
68
295
15
12
41
252

STATEMENT n.5-(Concld).
Population Annual rate Sex ratio .1961 Continent and
Country Latest Census r---------....... ---.------,. of increase
Density per .,. (females per kilometre 0
(1,000 males) area in 1960 date Pel'S9ns Males Females (1953-60) 1 2 3 4 5 6 7 8
loll. 1955 21,526,374 10,766,777 10,759,597 N.A. 999 230 Republic of Korea
·PakiBtan 1.2.1961 93,831,982 49,308,645 (a) 44,411,968(·) 1.9 901 JIY Nepal
'"Thailand
Europe
Denmark
France
Federal Republic of Germany
Greece
Hungary
·Poland
Rumania
Spain
"U.K.
*Yogos1avia
Ouania
Australia
New Zealand
Note:-
28.5.1954
25.4.1960
1.l0.1955
10.5.1954
25.9.1956
19.3.-1961
1.1.1960
6.12.1960
21.2.1956
31.\2.1950
23.4.1961
31.3.1961
30.6.1961
18.4.1961
.. Provisional
8,256,625 4,050,607
26,257,848 12,729,018.
4,448,401 N.A.
42,843,520 20,551,100
50,963,500 23,898,800
8,387,201 N.A.
9,976,530 4,815,838
29,731,009 14,374,400*
17,489,450 8,503,420
27,976,755 13,469,684-
52,675,556· 25,478,000*
18,538,150 (0) 9,029,000"
10,508,191 5,312,284
2,414,984- 1,213,376
4,184,472 N.A.
12,790,947· 4.3
N.A. 0.7
22,292,420 0.9
27,064,700 l.2
N.A. 0.9
5,160,692 0.6
15,356,600· 1.8
8,986,030 1.3
14,507,071 0.8
27,198,000* 0.5
9,510,000" I.I
5,195,907 2.2
1,201,608 2.1
1,033
1,005
N.A.
1,085
1,132
N.A.
1,072
'1,068
1,057
1,077
1,068
1,053
978
990
62
51
105
83
215
64-
107
95
77
58
215
72
9
(1) Re8l!On for discrepancy between this figure and the sum of frequencies shown for male aDd female i. inclusion in latter of rounded figures for African population of former Northern Cameroons.
('J Population registered, plus estimate of 8,397,477 for persons living in out-lying areas where local registration offices were not estabhshed. SeJ<·breakup of estimate is not available.
(oJ Excludes the foreigners, numbering 111,369 for both sexes. (0) Reason for discrepancy between this figure and sum of frequencies for male and female i. rounding Qf figure
for the latter. N. A. = Not available
(a) Growth rate
2.115 It is obvious that the ann'!la1 growth rate in the State is fairly low when compared with most of the countries of the world including India. Denmark, France, Greece, Hungary, Spain and U. K. are perhaps the only countries where the annual increase in population is as slow as in Jammu and Kashmir.
2.116 The low growth rate in the State is not, however, accounted for by the same circumstances which obtain in Denmark, France and
162
other countries_ It would not also be correct to assume that more effective checks than those employed in ad vanced countries like Canada, U. S. A, Poland etc. have been adopted in this State to control the growth of population. Contraception. for instance, which has becorne part of the normal mode of conjugal life in Europe and America is almost unknown in the State. A few family planning centres have, however, sprung up in some of the urban areas after 1960 and in view of the fact that their number is very limited and that not more' than

a handful of persons have availed of the services of these centres, it is inconceivable that these could have had any impact on the growth rate of the decade. A more convincing explanation {or the comparatively slow rate appears to be a biological phenomenon which· has been operating independently of conscious human volition. As has already been explained in a pr~eding paragraph, there has hardly been a decade when, apart from the loss of life in the normal course, the growth rate was not held in check by repeated visitations of natural calamities in the form of epidemics, Hoods and out-break of fires. In foreign countries, the loss of life caused by natural calamities is comparatively very small due to better hygienic conditions and elaborate preventive measures taken to protect the life of the people. Furthermore, the growing concentration of the people in the limited areas available fOL" habitation where every existing avenue of employment is over· crowded has in no less measure contributed to the controlled growth rate.
(b) Sex ratio
2.117 The sex ratio in the State is the lowest among all the countries mentioned in the statement. Even Ceylon, where the female population is only 897 against every 1,000 males has a higher ratio than that of Jammu and Kashmir.
2.118 There are several historical factors also which have no less contributed to the deficiency of females in the State and which have not been operative in most of the foreign countries referred to in the above statement. These are briefly discussed below:-
(1) The custom of female infanticide which was so common among Rajputs only two to three decades ago accounted for a larger number of death of females in that community which reduced the sex ratio of the State as a whole. As a result of the reformatory measures introduced by the social organisations under the patronage of Dogra rulers, the custom has, however, died out since.
163
(2) Male and female children have not been receiving equal attention in most parts of the State, particularly in Kashmir. As stated earlier, a male child is even now a welcome addition to the family as it holds out the prospect of the family income being augmented in course of time. Females, on the other hand, are regarded as a liability as they impose an additional' strain on the already meagre economic resources of the family. It is a known fact that during winters which are usually severe in Kashmir, infants are more prone to exposures and chills. The male infant, however, recieves prompt medical relief but an ailing female is made to depend on the treatment of nature unless she is in acute trouble.
(:'I) While no reliable statistics are available to show the number of females who die at the time of child birth, it is estimated that their proportion to total female deaths is fairly high. '
(4) A fairly good percentage of Muslim women observe parda and do not move out of their premises except very rarely. They live in congested areas looking after their family .and cooking the meals. As a result their health condition is not satisfactory and they succumb to diseases more quickly than men.
(5) The economic backwardness has also its impact on the growth of female population. Many rural inhabitants of the State migrate to other States in India during winter in search of work. While they are away, their families whom they leave behind live in distress, partly because of pecuniary needs and partly for want of proper medical aid with the result that many die of pneumonia, coughs, fevers, measles etc. Normally the absence of male migrants at the time of Census should have improved the sex ratio but the increase in the proportion of females is more than set off by the large number of immigrants who have poured into the State during the two decades 1941.61 and consist mostly of migrants from other States in India and displaced persons from Pakistan.
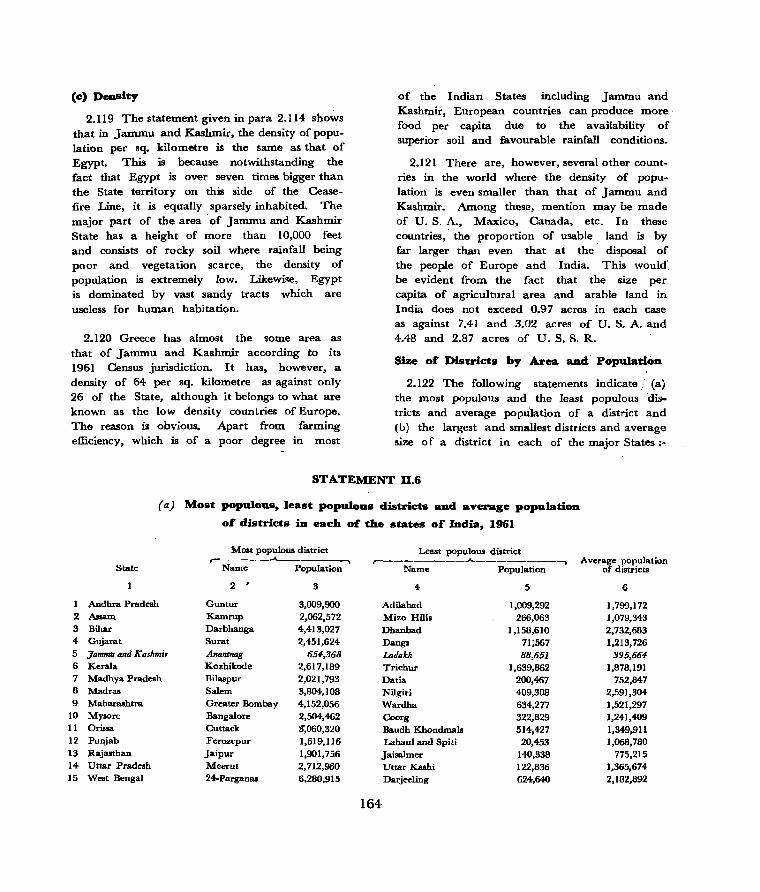
(c) Density
2.119 The statement given in para 2.114 shows that in Jammu and Kashmir, the density of population per sq. kilometre is the same as that of Egypt. This is because notwithstanding the fact that Egypt is over seven times bigger than the State territory on this side of the Ceasefire Line, it is equally sparsely inhabited. The major part of the area . of Jammu and Kashmir State has a height of more than 10,000 feet and consists of rocky soil where rainfall being poor and vegetation scarce, the density of population is extremely low. Likewise, Egypt is dominated by vast sandy tracts which are useless for human habitation.
2.120 Greece has almost the some area as that of Jammu and Kashmir according to its 1961 Census jurisdiction. It has, however, a density of 64 per sq. kilometre as against only 26 of the State, although it belongs to what are known as the low density countries of Europe. The reason is obvious. Apart from farming efficiency, which is of a poor degree in most
of the Indian States including Jammu and Kashmir, European countries can produce more food per capita due to the availability of superior soil and favourable rainfall conditions.
2.121 There are, however, several other countries in the world where the density of population is even smaller than that of Jammu and Kashmir. Among these, mention may be made of U. S. A., Maxico, Canada, etc. In these countries, the proportion of usable .. land is by far larger than even that at the disposal of the people of Europe and India. This would:. be evident from the fact that the size per capita of agricultural area and arable land in India does not exceed 0.97 acres in each case as against 7.41 and 3.02 acres of U. S. A. and 4.48 and 2.87 acres of U. S. S. R.
Size of Districts by Area and' POPUlatiOD
2.122 The following statements indicate,. (a) the most populous and the least populous districts and average population of a district and (b) the largest and smallest districts and average size 0 f a district in each of the major States :-
STATEMENT 11.6
2 3 4-5 6 7 8 9
10 11 12 13 14 15
(aJ Most populous, least populous districts aDd average populatioD
oC districts in each of the states of India, 1961
Most populous district Least populous district r------~----. ~--------~--------~ State Name Population Name Population
2 ,
3 4 5
Andhra Pradesh Guntur 3,009,900 Adilabad 1,009,292 Assam Kamrup 2,062,572 Mizo Hills 266,063 Bihar Darbbanga 4,4J3,027 Dhanbad 1,158,610 Gujarat Surat 2,451,624 Danga 71;567 :Jammu and K ashmi, Anantnag 654,368 Ladakh 88,651 Kerala Kozhikode 2,617,189 Trichur 1,639,862 Madhya Pradesh Bilaspur 2,021,793 Datia 200,467 Madras Salem 3,804,108 Nilgiri 409,308 Maharashtra Greater Bombay 4,152,056 Wardha 634,277 MY90re Bangalore 2,504,462 Coorg 322,829 Orissa Cuttack 3',060,320 Baudh Khondmals 514,427 Punjab Ferozepur 1,619.ll6 Labaul and Spiti 20,453 Rajasthan ]aipur 1,901,756 ]aisalmer 140,338 Uttar Pradesh Meerut 2,712,960 Uttar Kashi 122,836 West Bengal 24-Parganas 6.280,915 Darjeeling 624,640
164
Average pOJ1ulatiun of districts
6
1,799,172 1,079,343 2,732,683 1,213,726
395,664 1,878,191
752,847 2,591,304 1,521,297 1,241,409 1,349,911 1,068,780
775,215 1,365,674 2,182,892
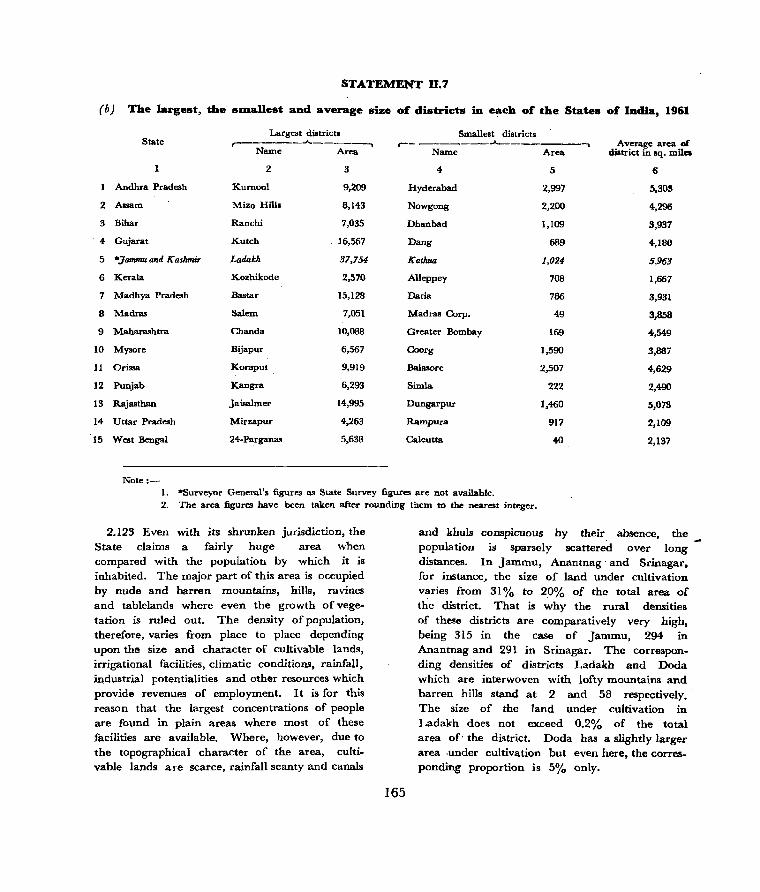
STATEMENT n.7
(b) The largest, the slD.allest and average size of districts in each of the State. of India, 1961
Largest districts Smallest districts State
,.-______ .A.. _____ -. r-- _______ ..A.. ________ -, Average area of Name Area Name Area district in sq. mile.
1 2 3 4 5 6
Andhra Pradesh Kurnool 9,209 Hyderabad 2,997 5,303
2 Assam Mizo Hills 8,143 Nowgong 2,200 4,296
3 Bihar Ranchi 7,035 Dhanbad 1,109 3,937
4 Gujarat Kutch 16,567 Dang 689 4,180
5 "Jammu and K a.hmir Ladakh 37,754 Kathua 1,024 5,963
6 Kerala Kozhikode 2,570 AUeppey 708 1,667
7 Madhya Pradesh Bastar 15,128 Datia 786 3,931
8 Madras Salem 7,051 Madras Corp. 49 3,858
9 Maharashtra Chanda 10,088 Greater Bombay 169 4,549
10 Mysorc Bijapur 6,567 Coorg 1,590 3,887
11 Ori .... Koraput 9,919 Balasore 2,507 4,629
12 Punjab Kangra 6,293 Simla 222 2,490
13 Rajasthan Jaisalmer 14,995 Dungarpur 1,460 5,073
14 Uttar Pradesh Mirzapur 4,263 Rampura 917 2,109
15 West Bengal 24-Parganas 5,638 Calcutta 40 2,137
Note:-1. "Surveyor General's figures as State Survey figures are not available. 2. The area figures have been taken after rounding them to the nearest integer.
2.123 Even with its shrunken jurisdiction, the State claims a fairly huge area when compared with the population by which it is inhabited. The major part of this area is occupied by nude and barren mountains, hills, ravines and tablelands where even the growth of vegetation is ruled out. The density of population, therefore, varies from place to place depending upon the size and character of cultivable lands, irrigational facilities, climatic conditions, rainfall, industrial potentialities and other resources which provide revenues of employment. It is for this reason that the largest concentrations of people are found in plain areas where most of these facilities are available. Where, however, due to the topographical character of the area, cultivable lands al'e scarce, rainfall scanty and canals
165
and khuls conspicuous by their absence, the population is sparsely scattered over long distances. In Jammu, Anantnag' and Srinagar, for instance, the size of land under cultivation varies from 31 % to 2.0% of the total area of the district. That is why the rural densities of these districts are comparatively very high, being 315 in the case of Jammu, 294 in Anantnag and 291 in Srinagar. The corresponding densities of districts Ladakh and Doda which are interwoven with lofty mountains and barren hills stand at 2 and 58 respectively. The size of the land under cultivation in Ladakh does not exceed 0.2% of the total area of, the district. Doda has a slightly larger area nnder cultivation but even here, the corresponding proportion is 5% only.

2.124 The first of these statements shows that 24-Parganas district of West Bengal which has a population of 62,80,915 is the most populous district all over India. In striking contrast with this, the most populous district of the State, namely, Anantnag, is not only least populated when compared with similar districts of other States but it is inhabited by smaller number of people than Adilabad, Dhanbad and Trichur the least populous districts of Andhra Pradesh, Bihar and Kerala respectively.
2.125 Ladakh has the least population among all the districts of the State. There are, however, two other districts, namely, Dangs of Gujarat State and Lahaul and Spiti of Punjab, whose population is smaller than that of Ladakh.
2.126 ,Bihar has the highest average of 27,32,683 persons per district when compared with the average population of the districts of other States. On this basis also Jammu and Kashmir ranks last, the average population per district being 3,95,664 only.
2.127 The range between the most populous and the least populous district in -the State is neither too nar~w nor too wide as in the case of Punjab and Gujarat. In this respect, the ~tate is comparable with Assam, Madras and Mysore where the range between the most
populous and least populous districts is about the same as in Jammu and Kashmir.
2.128 So far as area is concerned, it is clear from the second statement that district Ladakh of Jammu and Kashmir has the largest area among all the districts all over India. Even Kathua which is the smallest district by area in the State claims a larger area than the smallest districts of many other states.
2.129 In respect of the average area of a district also, Jammu and Kashmir again t,ops the list. This is because the range between district Ladakh and Kutch, the next largest district in India, is so wide that the average size of a district in the State exceeds the corresponding average of every other State.
2.130 Dada is the only district in the' State which has an area relatively nearer to the average area per district. All other districts eXcept Ladakh which alone accounts for 70.4% of the total State area claim comparatively very small areas.
2.131 The following statement gives the number and the total population of the districts in each State whose population is above or below the average population of a district in the con~~nea State :-
STATEMENT D.B NUDlber of districts and 'their total populations which are above or below
'the average population of a district for each state, 1961 Number of Number 01
Number of districts in" districts which districts in the Total popula- the State which Total popula- are within 20% Total popula-
State which are tion comprised are below the tion comprised (±) of the tion comprised State above the average in districts average popu- in districts average popu- in districts
population of dis- mentioned in lation of distriet mentioned in lation of district mentioned in trict for the State co1.2 for the State col. 4 for the State col. 6
2 S 4 5 6 7 Andhra Pradesh 10 22,225,178 lO 13,758,269 11 20,075,312
2 Assam 7 10,557,603 4 1,315,169 2 2,500,431 !I Bihar 9 31,414,419 8 15,041,191 6 17,334,716 4 Gujarat 7 12,571,241 10 8,062,109 4 4,569,741
5 Jmnmu and Kaslunir 4 2,416,370 5 1,144,606 1 326,061
6 Kerala 2 4,558,417 7 12,345,298 8 14,286,526
7 Madhya Pradesh 16 17,701,448 27 14,670,960 17 12,321,601
8 Madras 8 25,933,389 5 7,753,564- 4 10,396,452
9 Mabarashtra 10 20,484,032 16 19,069,686 13 19,064,184 10 Myaore 9 15,391,052 10 8,195,720 6 7,269,550
166
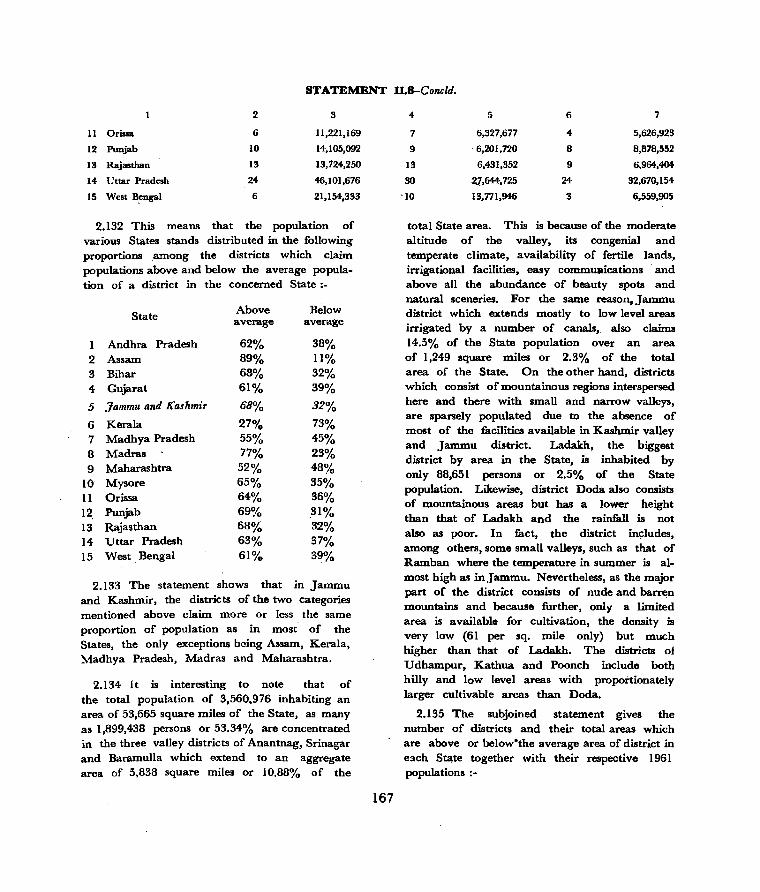
STATEMENT
2 3
11 Orissa 6 11,221,169
12 Punjab 10 14,105,092
13 Rajasthan 13 13,724,250
14 Uttar Pradesh 24 46,101,676
15 West B.engal 6 21,154,333
2.132 This means that the population of various States stands distributed in the following proportions among the districts which claim populations above and below the average population of a district in the concerned State:-
State
Andhra Pradesh 2 Assam 3 Bihar 4 Gujarat
5 .Jammu and Kashmir
6 Kerala 7 Madhya Pradesh 8 Madras 9 Maharashtra
10 Mysore 11 Orissa 12. Punjab 13 Rajasthan 14 Uttar Pradesh 15 West Bengal
Above average
62% 89% 68% 61%
68%
27% 55% 77% 52% 65% 64% 69% 68% 63% 61%
Below average
38% 11% 32% 39%
32%
73% 45% 23% 48% 35% 36% .31% 32% 37% 39%
2.133 The statement shows that in Jammu and Kashmir, the districts of the two categories mentioned above clam more or less the same proportion of population as in most' of the States, the only exceptions being Assam, Kerala, lVladhya Pradesh, Madras and Maharashtra.
2.134 It is interesting to note that of the total population of 3,560,976 inhabiting an area of 53,665 square miles of the State, as many as 1,899,438 persons or 53.34% are concentrated in the three valley districts of Anantnag, Srinagar and Baramulla which extend to an aggregate area of 5,838 square miles or 10.88% of the
167
11.8-Concld.
4 5 6 7
7 6,327,677 4 5,626,923
9 ·6,201,720 8 8,878,552
13 6,431,352 9 6,964,404
30 21,644,725 24 32,670,154
'10 13,771,946 3 6,559,905
total State area. This is because of the moderate altitude of the valley, its congenial and temperate climate, availability of fertile lands, irrigational facilities, easy commuaications . and above all the abundance of beauty spots and natural sceneries. For the same reason, Jammu district which extends mostly to low level areas irrigated by a number of canals, also claims 14.5% of the State population over an area of 1,249 square miles or 2.3% of the total area of the State. On the other hand, districts which consist of mountainous regions interspersed here and there with small and narrow valleys, are sparsely populated due to the absence of most of the facilities available in Kashmir valley and Jammu district. Ladakh, the biggest district by area in the State, is inhabited by only 88,651 persons or 2.5% of the State population. Likewise, district Doda also consists of mountainous areas but has a lower height than that of Ladakh and the rainfall is not also as poor. In fact, the district includes, among others, some small valleys, such as that of Ramban where the temperature in summer is almost high as inJammu. Nevertheless, as the major part of the district consists of nude and barren mountains and because further, only a limited area is available for cultivation, the density is very low (61 per sq. mile only) but much higher than that of Ladakh. The districts of Udhampur, Kathua and Poonch include both hilly and low level areas with proportionately larger cultivable areas than Doda.
2.135 The subjoined statement gives the number of districts and their total areas which are above or below"the average area of district in each State together with their respective 1961 populations :-
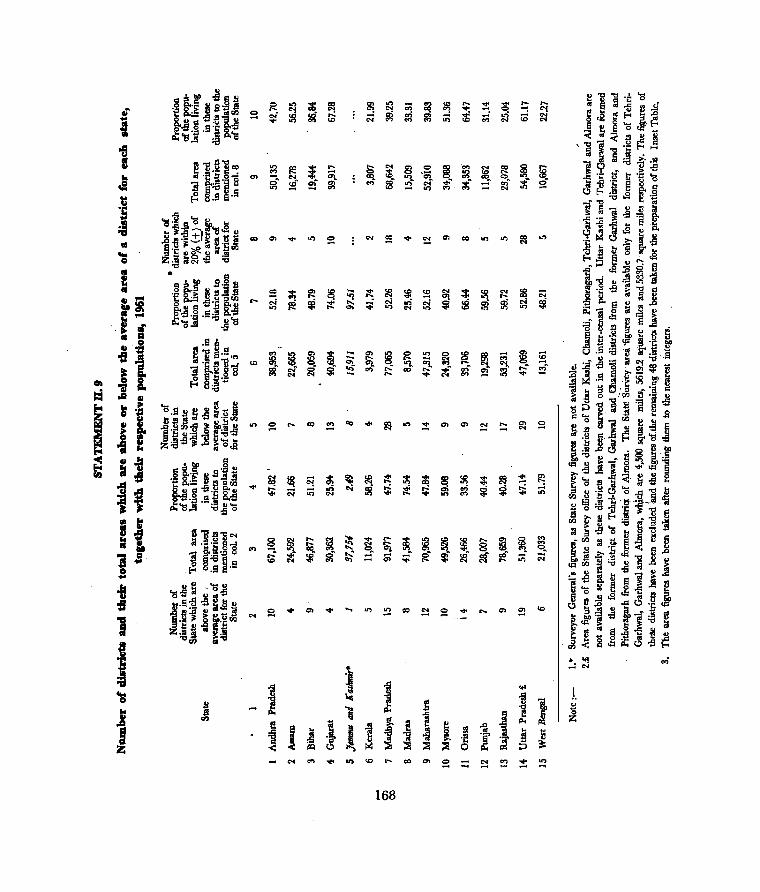
" Z:! 13 1 ·c ~ . "" ..9 8!l on .., .... .... .8 i'~ ti g·.::s R on ~ ~ ~ .... ..,
::!: C!; !:; .. Ei ..., I:l <i • ~ ~ .., "'l <'l i C"'I E :.:: ..9D~tIJ 2 'i. ~ co; e!" " -&; ~ ;;; c;:; ~ \C N orif!~!~ ! 011)-= (,) U N '" .., N
l~j'S] t~ Sej'oo;:': • < .. '( .II " ~ '9
\"'tj C; .~ ~ .... ~ ~ "'Q !:
= t! 1l.r~co Ii lii .!!I ,,:. ..
." ~ ~
.... .... I g: <:> ~
'.., N re i i -0 "'"i:l:E 1i·!!I b 0"": '" i
<:> ~Oi :.::l '" ! .f: tj' ~ .~ ~ lot .., ;; .. , N- CO, on ~- ~A ;r c2 "3 a:a'~ ~ ~
.., :!l- ~ -to' <1;- ~
.. il ._ ~ i3 0 ." '" .. b 0. d
.! ~ §.e 6'- t.)E-<:g.s~.g -"" .. 'o:§c:a'otl, ..
1 Iii - ... rJ 10 ... ..., ._ ~ oS ". go
=a . ..... ~ ~ ... e ....
~1:a~t!'O~u a> ~~~.s~~ Jl :I .~.:t ~ g .1H! CO .., -to ..., 2
.., ~ -to ~ CO ..., ...,
~ on ._ ... t.).?;- 05 • ""
9'~ u~ ~ ~{/J ~S~§i'1s z- .. 2)..., .-0 ;S NN ~ "C .. SS~d~ ! • c:a of! ct=I;Dt'I1]J
Q:!I ~ e·g B m,-gu1~s • .0~tiD.iS co -to a:. ~ ~ it <C
~ ~ .,..
~ :R f;:! :B f! .- 05 ;., '" d t,i ~ .... ~.~ aU) ;l
.., .... "" OJ "" .s~ ~;Jl ... ~ ~ it ~ Col on Col ~ :8 ai oi Col ~ ~.s.~ .E~ 8..s '" '" ." IN ..., on '" on ._ Ei .. rJ · ... ~ieC,\l=~
~ .A ~'O..!!I .s'o ;.:;I" !l'" ~ S ~ ° u .II •
• II c: • s t .~ .. ~ tl S
. 0 .- Q . l! ~ ~ crt '1: bel .., "D ~]P." ... on .., U .S :.a .~ i'.il ~ -tI '" ! '" ~ '" <:> :!l <:> ~ ~ .... § t :, on ...
~ ~-... ""
.., ~ !.~ sli_, '" ~ "!. '" "l. .., .., r-_ "" CN .-.s._:;",,""II'
l s G"!.! g 8 ~ .,; co .... - -+ ..,
~ ..,' ..... ~ .!l! 12l~ii "" "" ... .... -to "" .., ." -to ~ .S ~ if:g ~ a 01 ~ a·i ·':::
= 11 "" '<ij ~"".·a c: .a .., ;., S ° :r;n l'l .- "
i IS ·1 ... 5 a ~:51l1rllEi ~..s o .S !l ~ .s l;j 1:1 S g ... :> .. S ".s .. -II S ·_tIJ co ... -to co ..,
~ ..,°B'iiltIJeJjs j 1-!:l0ll-B ~ t·iJi on ~ .... !l ..., ::!: a:. a> ::! .... t "" .... "" litldj~!I ... u ... u·_ .... ~
= z~.s~:8 ~'oJ e 'fi u' ~ i' ;: .s • lot 6l,:6..!l ~8 e.W'
~ 411 j ,; ~ ·B" u - ... ." 6l,' ~ <c:I u j 'i ~ -to' 0;: §
{IJ .~ ~.~ ., s~ i ~ ~ ~ ~ ~ -to :I;
~ ~ :R ~ :!: ~
... .s ~-uuo it 1:: := Dtl~rn c:; ... ~ ~'aD:;'(:;.s ..
t ~" c: 05._ 8. " -to ~ c:;; ;;; on ... ~ it co;
~ ~ .... ~8'E:ita-5"'dt
1 ;s.~ .51 i .s ... '" "" '" .. lEi .!!I .a'~ :a---~ .:a p.,'oA :"~'o - 0'" '1:; ~ ~ 5 .. i J1{)I!lE-<.~ - ....
:I "1tlllC'l ;i:.s'Q~~-ts
lot § ~ ....
~ ~ <t ...
~ ! .., <C .... :?-l t5 '" - ~ :I tI. ~ Ei 11 Ii • l;j '-'~ c: .... .... l;j_ ~ ~. :. '" .. "boS ." co_ .::"' ~ "" . o_ II" ._ ::( <I
1 .s '3 a:a''= d .: ooto-~ ..... - a; :;;.- !;J:- <0 ;;; c:;; ~->-bcS u.Q
'" "" '" .... C'I ... J! -.~ ""t:I u ~ s.s ~.~ <R"-l~",,~~..o~
mU"t _u~ ... =;.ss. s~.i" -II ~e ~'au I:l'" !Il Ei e ~ e 'O..s .. "II;S 5° s ..... tlJ t .8.5~ -5 li1oS S ..... a> ..... ~
.., t.) i'l Z '" ..., c3 .~
tI~~f-S ~ -to ." co ~ 2 -to .... a> !:!! .. ~~.s §,-;i.i i.'I
1 ~ . .E .8 .~012 N
~<R!! e~"":; Z.!!I i" .1i >fl:S.s-e~ ..
i ""<I) ...... ~<8.gii:c3-s~
!:~ ..; • • • 1:: - ! "CII
i 1 '" 'S 1: 1 'i .I. s
1 ..
j J1 ~
i i 5 '0
i z e J ] @ U
~ p.,
~
I '8 J ...
1 l III ... ~ ,g "S .!!I I ~ ... : '( !Xl ~ :::il :::il 0 ;:J
... '" -to .... <0 .... co '" 2 ::! !l :!: ~
168
2.136 The statement shows that Jammu and Kashmir is conspicuous among the other States on account of some of its special features. These are:
(1) There is no State in India except Jammu and Kashmir in which only one district has an area above' the average area of a district in the State;'
(2) "The proportion of the population living in the district which has an area above the average area ofa distrtct in Jammu and Kashmir to the total popUlation of the State is not only the lowest when compared to other States but is exceedingly small and almost insignificant;
(3) There is no other State where over 97% population is concentrated in districts which are below the averpge area of a district in the concerned State; and
(4) Jamr,nu and Kashmir is the only State which does not Include any district with an area of 20% ahove or below the average area of a district for the State.
2.137 There can, therefore, be no gainsaying the fact tLat the area of the State is inequitably distributed among its various constituent districts. This does not mean that in other States, the distribution of areas among the districts is not fraught with inequalities. In Punjab, for instance, only 7 districts claim over 28,000 sq. miles whereas 12 others covel an area 0119,298 sq. 'miles only. These disparities are not, however, as striking as in the case of Jammu and Kashmir. Ai; already stated, the inequitable distribution of areas in the State is mainly due to its geographical conditions, varying topography and the conse<;.uent availaJiIity or absence 01 avenues of employment.
2.138 Leaving alone the district of Ladakh which is an exception, it will be seen that the disparities in the areas of other districts are not so large. Srinagar and jammu claim approximately equal' areas, though, the latter, notwithstanding its slightly larger area, has a
169
comparatively lesser population The same is true of the districts of Udhampur and Poonch.
2.139 District Doda, however, claims more than the aggregate area of the districts of Jammu, Udhampur and Kathua put together, although its population does not exceed 27% of the total popUlation of these districts. Likewise, district Anantnag has twice as much area as that of Kathua but the population of the latter is less than 32% of that of Anantnag. Again, district Jammu has less than half the area of Baramulla though the disparity between their respective populations is comparatively very small.
2.140 It is evident that the topographical character of the major part of the State operates as a permanent hurdle against any regular short-ranged size distribution of its district:l. Ladakh, for instance, which 'absorbs more than 2J3rds of the State territory cannot afford to support even 2.5% of the population of the State by which it is inhabited. This is also true, though not to the same extent, of other hilly districts, such ,as Doda, Udhampur, Kathua, etc. There is, therefore, nothing surprising to find that the pace of developmental activity in these districts is very slow when compared with those which extend mostly to plain and low-level areas like Jammu, Anantnag, Srinagar and Baramulla. Even the districts of latter category are not of unitorm size. While the disparity between Jammu and Srinagar is small, it is fairly large when compared with Anantnag and Baramulla which consist of both plain and mountainous areas.
Coaeea.tra'tioa of Populatioa by size of Villages and Towns
2.141 Statements 11.10 and 1I.ll given below indicate in respect of each State and Union Territory, (a) the number of persons per 10,000 population in villages and towns of selected population sizes and (b) the percentage of villages and towns among all villages and towns including cities and town-groups of selected population sizes respectively:-
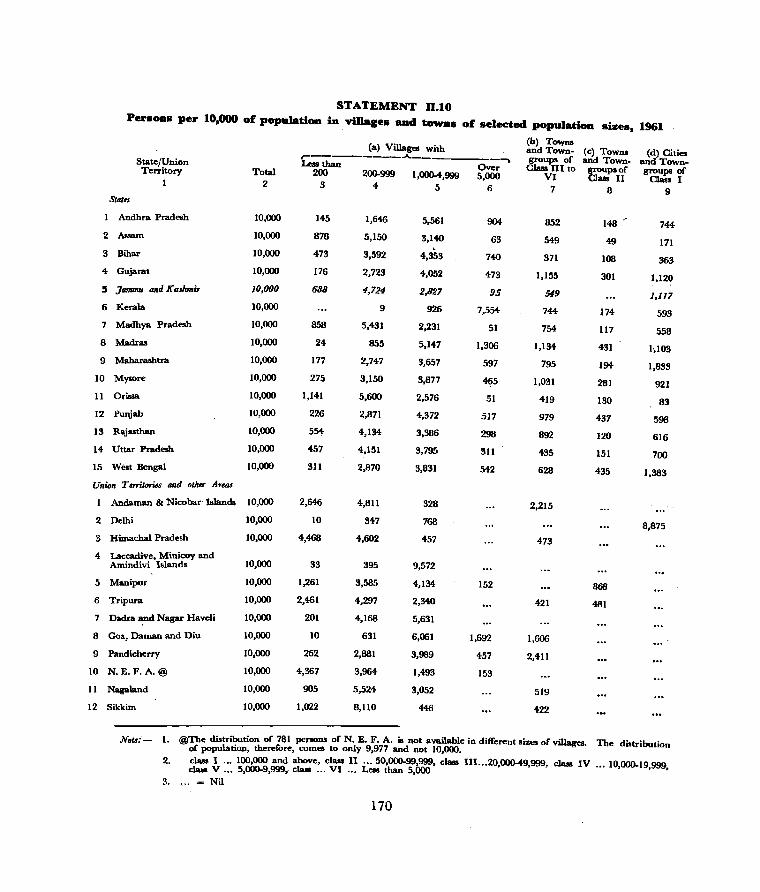
STATEMENT D.I0 PerB_s per 10,000 of popalatioa in vilIageB _d 'towIl& of Belected populati_ Bizes, 1961
State/Union Territory
1
Stoh.
Andhra Pradesh
2 Assam
3 Bihar
4 Gujarat
5 Jammu and.K tzShmiT
6 Kerala
7 Madhya Pradesh
8 Madras
9 Maharashtra
10 Mysore
11 Orissa
12 Punjab
13 Rajasthan
14 Uttar Pradesh
15 West Bengal
Union Tmitories and other ArMS
Total 2
10,000
10,000
10,000
10,000
10,000
10,000
10,000
10,000
10,000
10,000
10,000
10,000
10,000
10,000
10,000
Andaman & Nicobar-lslands 10,000
2 Delhi 10,000
3 Himachal Pradesh 10,000
4 Laccadive, Minicoy and Amindivi Islands
5 Manipur
6 Tripura
7 Dadra and Nagar Haveli
8 Goa, Daman and Diu
9 Pandichcrry
10 N. E. F. A. @
11 Nagaland
12 Sikkim
10,000
10,000
10,000
10,000
10,000
10,000
10,000
10,000
10,000
(a) Villages with ~~-------...... ,---- ~
Over 5,000 200
3
145
878
473
176
688
858
24
177
275
1,141
226
554
457
311
2,646
10
4,468
33
1,261
2,461
201
10
262
4,367
905
1,022
200-999
1,646
5,150
3,592
2,723
4,724
9
5,431
855
2,747
3,150
5,600
2,871
4,134
4,151
2,870
4,811
347
4,602
395
3,585
4,297
4,168
631
2,881
3,964
5,524
8,110
1,000-4,999 5
5,561
3,140
4,353
4,052
2,827
926
2,231
5,147
3,657
3,877
2,576
4,372
3,386
3,795
3,831
328
768
457
9,572
4,134
2,340
5,631
6,061
3,989
1,493
3,052
446
6
904-
63
740
473
95
7,554
51
1,306
597
465
51
517
298
311
542
152
1,692
457
153
(b) Tmyns and Towngroups of
CI .... III to VI
7
852
549
371
1,155
549
744
754
1,134
795
1,031
419
979
892
435
628
2,215
473
421
1,606
2,411
519
422
(c) Towns and Towngrouplof Class II
8
148
49
108
301
174
117
431
194
281
130
437
120
151
435
868
481
(d) Cities and Towngroups of
Class I 9
744
171
363
1,120
1,117
593
558
1,103
1,833
921
83
596
616
700
1,383
8,875
Nol4:- 1. @Tbe distribution of 781 persons of N. E. F. A. is not available in different sizes of villages. The distribution of population, therefore, comes to only 9,977 and not 10,000.
2. class I ... 100,000 and above, class II ... 50,000-99,999, class 111. .. 20,000-49,999, class IV ... 10,000-19,999, class V ... 5,000-9,999,- clan ... VI '" Less than 5,000
3 .... = Nil
170

STATEMENT 11.11 PerceDt of villages aDd towns a:m.ODg aU villages aDd towns (iDcluding cities
aDd town-groups respectively of selected POPUlatiOD sizes), 1961
State/Union Territory
1
States
Andhra Pradesh
2 Assam
3 Bihar
4 Gujarat
5 jammu and Kashmir
6 Kerala
7 ~adhya Pradeah
8 ~adras
9 ~aharashtra
10 ~ysore
11 Orissa
12 Punjab
13 Rajasthan
14 Uttar Pradesh
15 West Benal
Union T errilorillS and other orcas
Total
2
100
100
100
100
100
100
100
100
100
100
100
100
100
100
100
Andaman & Nicobar Islands 100
2 Delhi 100
9 Himachal Pradeah
4 Laccadive, Minicoy and Amindivi Islands
5 Manipur
6 Tripura
7 Dadra and Nagar Haveli
8 Goa, Daman and Diu
9 Pondicherry
10 N. E. F: A.
Ii Nagaland
12 Sikkim
100
lao
lao lao 100
"lOa
100
lOa 100
100
Nol.:- 1. N 2.
Negligible = Nil
Villages r- .A.. -----____ -,
Less than Over 200 200-999 I,OOO~,999 5,000
9
22
41
31
17
35
N
97
5
19
29
46
23
92
29
27
82
9
89
10
57
74
11
9
22
84.
37
30
4
99
50
52
57
55
56
32
57
57
48
53
56.
56
53
18
54
17
10
33
23
60
24
56
15
54
69
171
5
37
9
16
25
10
29
7
59
23
19
6
23
12
15
19
N
37
80
10
3
29
67
21
9
6
2
N
N
70
N
4
N
N
N
N
6
N
Towns ~ ______ .A.. ___ ~
Towns Towns and town- Towns and groups of and town- town-
Total class III grouPl' of groups of
7
100
100
100
100
100
100
100
100
100
100
100
100
100
100
lOa
100
100
100
100
100
100
100
100
100
to VI class II class I
8
91
95
87
91
95
90
94-
88
90
.93
99
90
93
86
77
100
100
83
100
100
100
100
9
4
2
6
6
5
2
8
5
4
5
7
::I
7
16
100
17
10
5
3
'l
3
5
5
4-
4-
5
3
2
3
4-
7
7
100
. 2.142 The first of these statments shows that the population of the State stands divided between its' rural and urban sectors in the proportion of 83 to 17 approximately. It is also clear that viilages with less than 1,(lOO population are inhabited by over 54% of the State population as against 29% in the villages of higher population groups. Further, statement n.ll indicates that no ,less than 90% villages belong to the population group 0-999. This leads to the conclusion that more people prefer to live in a large number of small villages than 'in others •. The same cannot, however, be said about the urban areas. According to statement II.IO over twice the population inhabiting tuwns and town-groups of classes III to VI live in cities and town-groups of class 1. The fact that there is greater concentration in cities of class I than in small towns is confirmed by the huge disparity between their respective numbers. The former constitute only 5'10 of the total number of urban areas in the State as against 95% claimed by the latter. Unlike the rural areas, therefore, there is a greater tendency for more people to live In cities and large towns than in smaller urban areas where avenues of employment are comparatively by far limited.
2.1403 The State-wise statistics given in statement II.IO show that majority of the population of As~am, Madhya Pradesh and Orissa is concentrated in the villages of population-group 200-999. Jammu and Kashmir ranks next, the corresponding proportion being 47.24%. It is true that in most other States (the only exceptions being Andhra pradesh, Kerala, Madras), the proportion of villages in this group is fairly high and in 'certain cases exceeds even the corresponding proportion~ of Assam, Madhya Pradesh, Orissa and Jammu and Kashmir, but the percentages of total population inhabiting these villages are comparatively very small.
2;144 So far as villages in the populationgroup 1,000-4,999 are concerned, Andhra Pradesh and Madras are the only States in which over 50% population is concentrated in these villages
172
although majority of the villages in Andhra Pradesh belong to the population-group 200~999. In other major States, the corresponding proportions vary from 9.26% of Kerala to 43.72% of Punjab. The proportion of' population in the villages of this group in Jammu and Kashmir exceeds those of Kerala, Madhya Pradesh and Orissa and stands at 28.27% only.
2.145 Villages with over 5,000 population claim'less than I % of the total population of the State. Even though this proportion is very low, it is nevertheless higher than the corresponding proportions of Assam, Madhya Pradesh and Orissa.
2.146 Like Jammu and Kashmir, majority of the urban population in Maharashtra and West Bengal belongs to the few cities and town-groups of these States. In a few other States; the urban population is more or less equitably
. distributed between towns and town-groups of classes III to VI and cities and town-groups of class I as in Gujarat and Madras. Towns and town-groups of class II are limited in number and inhabited by smaller proportions of population in all the States without any exception.
2.147 As we shall see in chapter III, the road mileage per 100,000 population of the rural sector of the State is 65.0 miles or 104.7 kilometres. Considering the fact that the roa:d mileage per 100 sq. kilometres of area does not exceed 1.4 linear miles, it must be conceded that .the means of inter-commuincatioils in rural areas are very limited and that the population is sparsely scattered in small isolated villages.
2.148 It is also clear that the density per acre of cultivated land in the rural sector is 1.8 and of cultivable areas 1.5 as against 2.2 and 1.8 for the State as a whole. The total forest area in the State being 8,036.3 sq. miles or 5,143,232 acres, the density of rural population would come to 0.58 against 0.69 for the entire State. In the circumstances it is only natural that the rural population should be- concentrated in villages of small population-groups, as indicated in the 'foregoing table.

Ranking of Districts by Area and Population
2.149 The following statement gives the ran-
kings of districts within the State in terms of population and area in 1961 and 1941 :-
STATEMENT 11.12
, Raoking of districts within the State in terlD.s of population and area, 1961-1941
'Rank in Name of Per cent of State's Per cent of State's Rank in Rank in population district population area in 1961 area 1961 population
in 1961 in 1961 in 1941 1 2 3 4 5 6
1 Anantnag 18.38 3.91 4 1
2 Srinagar 17.98 2.24 8 3
3 Baramulla 16.98 4.72 3 2
4 Jammu 14.52 2.33 7 4
5 Poonch 9.16 3.15 6 5
6 Doda 7.~4 8.16 2 7
7 Udhampur 7.13 3.23 5 6
8 Kathua, 5.82 1.91 9 8
9 Ladakh ,2.49 70.35 1 9
Nols:- In other States, this table has been prepared in respect of the, years 1961 and 1951 but as no Census was held in Jammu and Kashmir in 1951, the comparison or the rankings for these years would 'not have yielded any results. The Registrar General, therefore" agreed vide his letter No. 9/6/62-RG (V) dated 27.2.1964 to substitute 1941 for 1951 in this table.
2.150 It may be of interest to note that the geographically contiguous districts of Poonch, Baramulla and Ladakh as also the districts of Anantnag and Doda are inhabited by equal proportions of persons with agricultural and non-agricultural livelihoods. As we shall see later on, in the case of the first three districts, these proportions stand at 86 to 14, while in Anantnag 83% and in Doda 84% workers depend for their livelihood on agriculture. The corresponding proportions of people with agricultural livelihoods in the contiguous districts of Udhampur and Kathua stand at 81%. and 77% respectively.
2.151 As in the case of agricultural and nonagricultural livelihoods, the proportions of people living in the rural and urban sectors of
173
geographically contiguous districts are also more or less uniform. Thus we find that while in district Anantnag, the urban: sector claims 7% of th& total population, the corresponding proportions in the contiguous districts of Doda, Udhampur and Poonc;h: stand at 6%, 6% and 5% respectively. No such uniformity exists in non-contiguous districts like Srinagar and Jammu where the proportions of rural/urban population 'stand at 54:46 and 75:25 respectively.
2.152 The statement shows that, except for the districts of Srinagar, Baramulla, Doda and Udhampur, there has been no change in the rank of any other district after 1941. The districts of Srinagar and Baramulla have exchanged their ranks and so have the districts of Doda and Udhampur. At a later stage, we
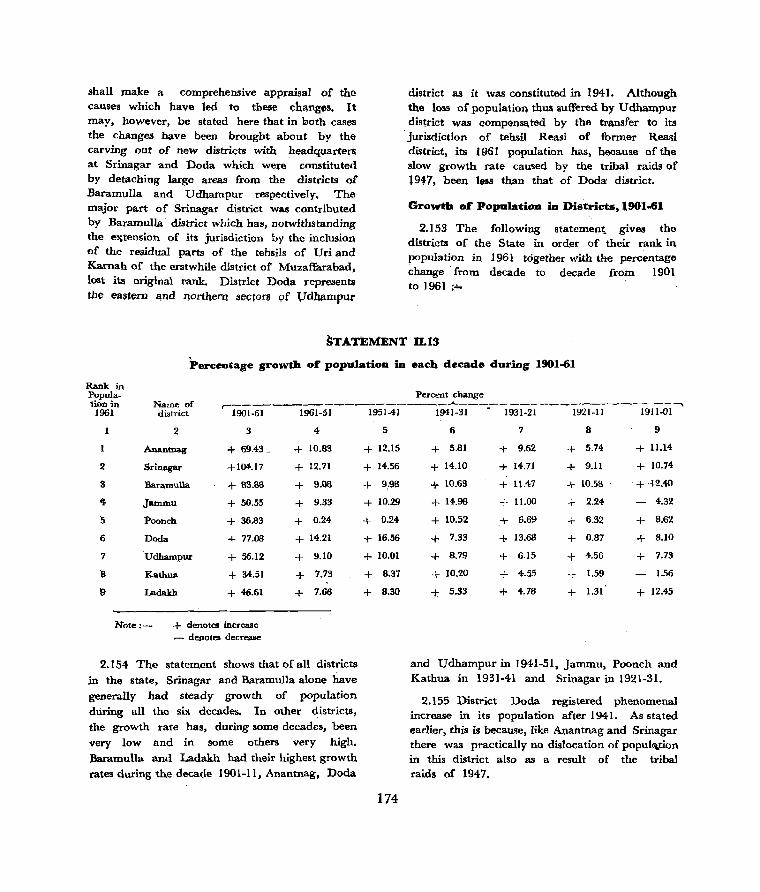
shall make a comprehensive appraisal of the causes which have led to these changes. It may, however, be stated here that in 00th cases the changes have been brought about by the carving out of new districts with headquartefll at Srinagar and Doda which were constituted by detaching large areas from the districts of Baramulla and Udhampur respectively. The major part of Srinagar district WIlS contributed by Baramulla· district which has, notwithstanding the e"tension of its jurisdiction by the inclusion of the residual pa.rts of the tehsils of Uri and Kamah of the erstwhile district of Muzaffarabad. lost its original rank. District Doda represents tllC ea~tern Clnd :northern sectoJl 9£ Vdhampur
district as it was constituted in 1941. Although the loss of population thus suffered by U dhampur district was compcmsa.ted by the transfer to its
. jurisdiction of tehsil Reasi of former Read district, its 1961 population has, because of the slow growth rate caused by the tribal raids of 1947, been less than that of Doda: district.
Growth of' Popaladon ia Districts. 1901-61
2.153 The following statement;. gives the districts of the State in m'der of their rank in population in 1961 together with the percentage change from decade to decade from 1901 to 1961 : ....
STATEMENT n.1:J
Percentage growth of population in each decade during 1901-61
Percent change Rank in Population in Name of r-------------------------"'--------~------------. -- ""'"-\
1901-61 1961-51 1951-41 1941-31 - 1931-21 1921-11 1911-01 1961
2
1I
4-
5
6
7
8
9
district
2 3
Anantnag + 69.43_
Srinagar +104.17
BaramuUa + 8S.8B
Jammu + SO.55
Poollch + 36.83
Dada + 77.08
Udhampur + 56.12
Kathu .. + 34.51
Ladakh + 4(;.61
Note:- + denotes increase - denotes decrease
4
+ 10.83
+ 12.71
+ 9.08
+ 9.33
+ 0.24-
+ 14.21
+ 9.10
+ 7.73
+ 7.66
2_154 The statement shows that of all districts in the state, Srinagar and Baramulla alone have generally had steady growth of population during all the six decades. In other districts. the growth rate has, during some decades, been very low and in some others very high. Baramulla and Ladakh had their highest growth rates during the decade 190I-Il, Anantnag. Doda
5
+ 12.15
+ 14.56
+ 9 .. 98
+ 10.29
+ 0.24-
+ 16.56
+ 10.01
+ 8.37
+ 8.30
174
6 7 8 9
+ 5.81 + 9.62 + 5.74 + 11.14
+ 14.10 + 14.71 + 9.11 + 10.74-
+ 10.63 + 11.47 + 10.58 . +,{-2.40
+ 14.98 + 11.00 + 2.24- 4.32
+ 10.52 + 6.69 + 6.32 + 8.62
+ 7.33 + 13.68 + 0.87 + 8.10
+ 8.79 + 6.15 + 4.56 + 7.73
+ 10.20 + 4.55 + 1.59 1.56
-t 5.33 + 4.78 + 1.31 + 12.45
and Udhampur in 1941-51, Jammu, Poonch and Kathua in 1931-41 and Srinagar in 1921-31.
2.155 District Doda registered phenomenal increase in its popUlation after 1941. As stated earlier, this is because, like Anantnag and Srinagar there was practically no dislocation of popul<\.tion in this district also as a result of the tribal raids of 1947.

2.156 The district of Jammu has had spectacular increase in its growth rate during 1931-41 which went up from 11% of the previous decade to about 15%. While the highest growth rate for the decade 1921-31 was returned from Srinagar, the corresponding rates for the same decade of districts Jammu and' Doda would appear to be more spectacular, having risen from 2.24% and 0.87% of 1911-21 to 11.0% and 13.68% of 1921-31 respectively.
2.157 Baramulla stands out for its highest growth rate in the State during the decade 1911-21 though it has registered a decrease of about 2% when compared with the rate of the previous decade.
2.158 The following two statements give the names of the districts which have had higher or lower percent increase than the average of the State from 1901-61 :-
STATEMENT D.14
Districts which have had higher percent increase thall the average
Name of District
for the State ;1901-61
Percent Increase ,--____ -.A.. _______ ---.
,1Wl~1 1921~1 1951~1
2 3 4 Average for the State 66.45 46.88 9.44
10.83 12.71 9.08
14.21
Anantnag 69.43 44.16
Sri nagar 104.17 68.98 Baramulla 83.88 47.95 Doda 77.08 62.41
STATEMENT D.15
Districts which have had lower percent increase than the average
Name of District
1
for the State 1901-61
Percent Increase ~-----~-----~
1901-61 1921~1 1951--61
2 3 4 Average for the State 66.45 Ladakh 46.61
46.88 28.69
9.44 7.66
Udhanipur 56.12 38.60 9.10 Jammu 50.55 53.90 9.33 'Kathua 34.51 34.51 7.73 Poonch 36.83 18.49 0.24-
175
2.159 Three regional patterns are distinctly discernible from the above two statements. The first of these consists of all the four geographically, contiguous districts which have had higher percent increase than the average for the State during 1901-61. Ladakh constitutes a separate region by itself.' The remaining four districts, namely, Udhampur, Jammu, Kathua and Poonch, which are ,also geographically contiguous, comprise the thrid region.
2.160 It may be of interest to note that the climatic conditions, the social structure of the people and the languages spoken in the three regions are quite distinct and separate from one another. The first region extends mostly to areas with a height of more than 5,000 feet which are interwoven with hills and valleys of varying sizes. It has a mild and temperate climate in summer but experiences severe cold' in winter. Majority of the people inhabiting the region consist of Kashmiris who speak a language of their own different from those of the other two regions. In respect of dress, social habits, mode of living and culture, they have nothing in common with the people in the other parts of the State.
2.161 The second region is height of more than 10,000
situated at a feet above the
sea-level and consists of nude Himalayan ranges interspersed with a few narrow and small valleys here and' there. The rainfall is very poor and the minimum temperature in winter is-23.3°C. There are very few cultivable areas with the result that the density of population is only 2 per sq. mile. The people, speak Balti and Bodhi which bear no semblance t~ Kashmiri,_ Dogri and otlier languages spoken in the other two regions.
2.162 The major part of the third region consists of plain and low level areas where summers are fairly warm and winters mild. I t is mostly inhabited by Dogra Brahlnins and
Rajputs who are not easily distinguishable from the people of West Punjab either by dress or social habits or even by the language spoken.
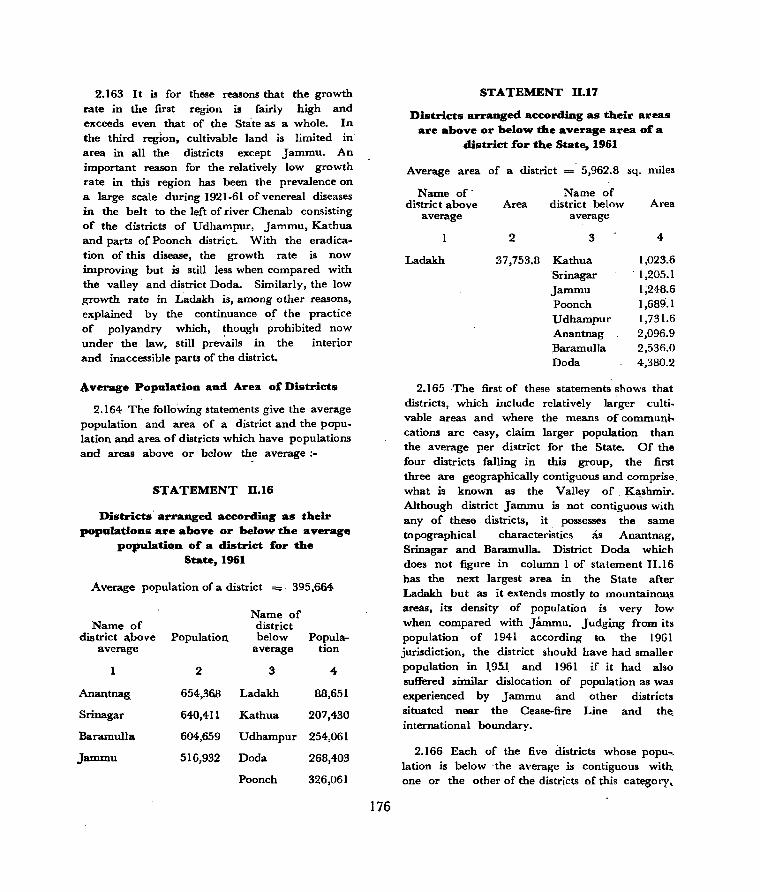
2.163 It is for these reasons that the growth rate in the first region is fairly high and exceeds even that of the State as a whole. In the third region, cultivable land is limited in" area in all the districts except Jammu. An important reason for the relatively low growth rate in this region has been the prevalence on a .Iarge scale during 1921-61 of venereal diseases in the belt to the left of river Chenab consisting of the districts of Udhampur, Jammu, Kathua and parts of Poonch district. With the eradication of this disease, the growth rate is now improving but is still less when compared with the valley and district Doda. Similarly, the low growth rate in Ladakh is, among other reasons, explained by the continuance of the practice of polyandry which, !hough prohibited now under the law, still prevails in the interior and inaccessible parts of the district.
Average Popula'tion and Area of Districts
2.164 The following statements give the average population and area of a district and the population and area of districts which have populations and areas above or below the average:-
STATEMENT D.16
Districts" arra:Qged according as their popQladons a .. e above or below the average
POpulatiOD of a district fo .. the State, 1961
Average population of a district =;" 395,664
Name of Name of district
district a.bove Population. below Popula-average average tion
1 2 3 4
Anantnag 654,36.8 Ladakh 88,651
Srinagar 640,411 Kathua 207,430
Baramul1a 604,659 Udhampur 254,061
Jammu 516,932 Doda 268,403
Poonch 326,061
176
STATEMENT 11.17
Districts arranged acco..cUng as thei .. areas a .. e above 0 .. below the average a .. ea of a
district f'or the State, 1961
Average area of a district =' 5,962.8 sq. miles
Name of' Name of di~trict above Area district below Area
average average
1 2 3 4
Ladakh 37,753.8 Kathua 1,023.6 Srinagar ' 1,205.1
Jammu 1;248.6 Poonch 1,689.1 Udhampul' 1,731.6 Anantnag 2,096.9 Baramulla 2,536.0 Dada 4,380.2
2.165 ,The first of these statements shows that districts, which include relatively larger cultivable areas and where the means of commun.ications are easy, claim larger population than the average per district for the State. Of the four districts falling in this group, the first three are geographically contiguous and comprise" what is known as the Valley of Ka,sbmir. Although district Jammu is not contiguous with any of these districts, it possesses the same topographical characteristics as Anantnag, Srinagar and Baramulla. District Doda which does not figure in column 1 of statement 11.16 has the next largest area in the State after Ladakh but as it extends mostly to mountain~s. areas, its density of population is very tow when compared with Jammu. Judg~ng from its population of 1941 according to. the 1961 jurisdiction, the district should have had smaller population in 1.95.1, and 1961 if it had also suffered similar dislocation of population as was experienced by Jammu ~md other districts situated nsar the Cease-fire Line and the. international boundary.
2.166 Each of the five districts whose popu-, lation is below -the average is contiguous with. one or the other of the districts of this category.
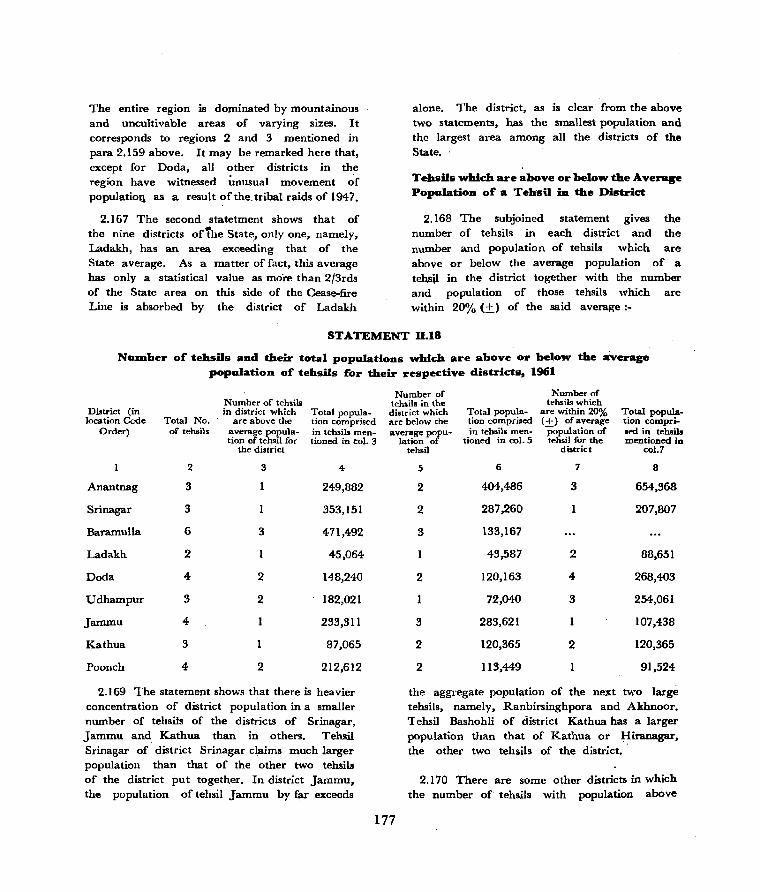
The entire region is dominated by mountainous and uncultivable areas of varying sizes. It corresponds to regions 2 and 3 mentioned in para 2.159 above. It may be remarked here that, except for Doda, all other districts in the region have witnessed unusual movement ~f populatioll as a result of the. tribal raids of 1947.
2.167 The second statetment shows that of the nine districts of"lhe State, only one, namely, Ladakh, has an area exceeding that of the State average. As a matter of fact, this average has only a statistical value as more than 2/3rds of the State area on this side of the Cease-fire Line is absorbed by the district of Ladakh
alone. The district, as is clear from the above two statements, has the smallest population and the largest area among all the districts of the State.
Tehslls which are above or below the Average PopulatioD of a TehllU in the District
2.168 The subjoined statement gives the number of tehsils in each district and the number and population of tehsils which are above or below the average population of a tehsil in the district together with the number and population of those tehsils which are within 20% (±) of the said average:-
STATEMENT D.18
Nu_ber of tehslls and their total popUlations which are above or below the average populatioD of'tehsils f'or their respective districts, 1961
District (in location Cede
Order)
Anantnag
Srinagar
Baramulla
Ladakh
Doda
Udhampur
Jammu
Kathua
Poonch
Total No. of temils
2
3
3
6
2
4-
3
4
3
4
Number of teh,il. in district which
are above the average population of tehsil for
the district
3
3
2
2
2
Total population comprised in teh,iI, mentioned in col. 3
4-
249,882
353,151
471,492
45,064
148,240
182,021
233,311
87,065
212,612
2.169 The statement shows that there is heavier concentration of district popUlation in a smaller number of tehsils of the districts of Srinagar, Jammu and Kathua than in others. Tehsil Srinagar of district Srinagar claims much larger population than that of the other two tehsils of the district put together. In district Jammu, the population of tehsil Jammu by far exceeds
Number of tehon. in the district which are below the average popu-
lation of tehsil
5
2
2
3
2
3
2
2
Total population comprised in tebsils men-
tioned in col. 5
6
404,486
287,260
133,167
43,587
120,163
72,040
283,621
120,365
113,449
Number of tehsils which
are within 20% ( +) of average Population of teh.iI for the
district
7
3
2
4
3
2
Total population compri."d in tehsils mentioned in
co1.7
8
654,368
207,807
88,651
268,403
254,061
107,438
120,365
91,524
the aggregate population of the next two large tehsils, namely, Ranbirsinghpora aDd Akhnoor. T ehsil Bashohli of district Kathua has a larger population than that of Kathua or Hiranagar, the other two tehsils of the district •.
2.170 There are some other districts in which the number of tehsils with population above
177
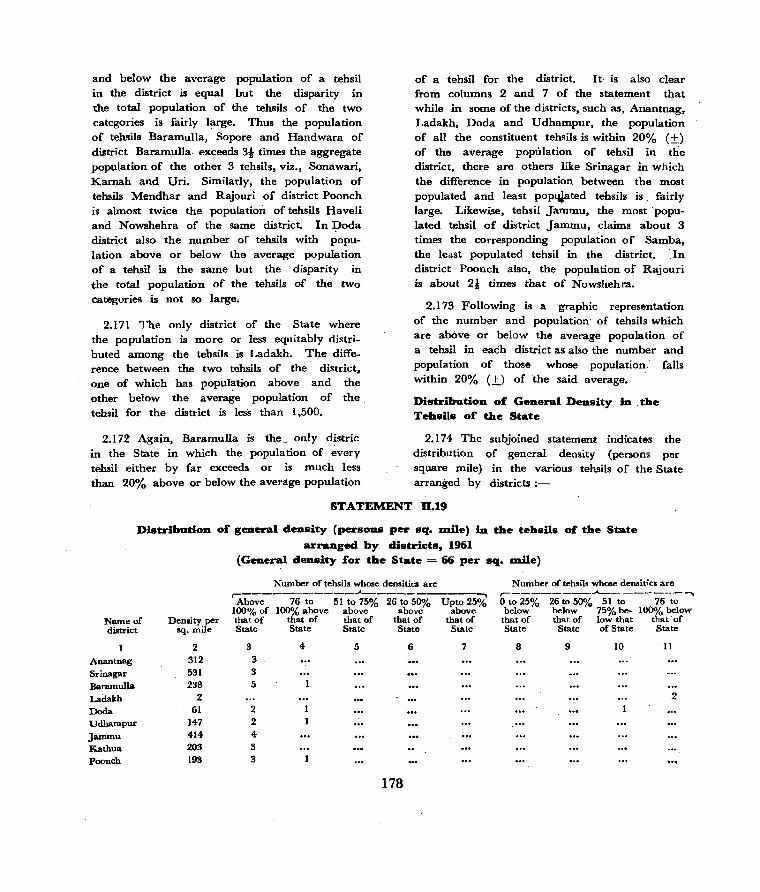
and below the average population of a tehsil in the district is equal but the disparity in the total population of the tehsils of the two categories is fairly large. Thus the population of tehsils Baramulla, Sopore and Handwara of di~trict Baramulla, exceeds 3t times the aggregate population of the other 3 tehsils, viz., Sonawari, Karnah and Uri. Similarly, the population of tehsils Mendhar and Rajouri of district Poonch is almost twice the population of tehsils Haveli and Nowshehra of the same district. In Doda district also the number of tahsils with population above or below the average population of a tehsil is the same but the disparity in the total population of the tehsils of the two categories is not so large.
2.171 The only district of the State where the population is more or less equitably distributed among the 'tehsils is Ladakh. The difference between the two tehsils of the district, one of which has population above and the other below the average population of the tehsil for the district is less than 1,500.
2.172 Again, Baramulla is the _ onl y distric in the State in which the population of every tehsil either by far exceeds or is much less than 20% above or below the average population
of a tehsil for the district. It is also clear from columns 2 and 7 of the statement that while in some of the districts, such as, Anantnag, Ladakh, Doda and Udhampur, the population of all the constituent tehsils is within 20% (±) of the average population of tehsil in the district, there are others like Srinagar in which the difference in population between the most populated and least pop~ated tehsils is _ fairly large. Likewise, tehsil Jammu, the most -populated tehsil of district Jammu, claims about 3 times the corresponding population of Samba, the least populated tehsil in the district,. :.In district Poonch also, the population of Rajouri is about 2t times that of Nowshehra.
2.173 Following is a graphic representation of the number and population' of tehsils which are above or below the average population of a tehsil in each district as also the number and population of those whose population,' falls within 20% (±) of the said average.
Distribution of General Density :iD ,the Tehsils of the State
2.174 The subjoined statement indicates the distribution of general density (persons per square mile) in the various tehsils of the State arranged by districts:-
STATEMENT n.19
Distrihution of general denSity (persons per sq. D1ile) in the tehsils of the State
arranged hy districts, 1961 (General density for the State = 66 per sq. D1i1e)
Number oftehsil. whose densities are Number of tehsil. whose dcnait1es are ,---:----------"""'--------------,
Above 76 to 51 to 75% 26 to 50010 Upto 25% 100% of 100% above above above above that of that of that of that of that of State State State State State
,-________ ..A.. __________ _...,.
o to 25% 26 to 50% 51 to 76 to . below below 75% be- 100% below
that of that of low that that -of State State of State State
Name of Density per district sq. mile
2 3 4 5 6 7 8 9 10 11
Anantnag 312 3
Srinagar 531 3
Baramulla 238 5
Ladakh 2 2
Doda 61 2 Udhampur 147 2
Jammu 414 4
Kathua 203 3
poonch 193 3
178
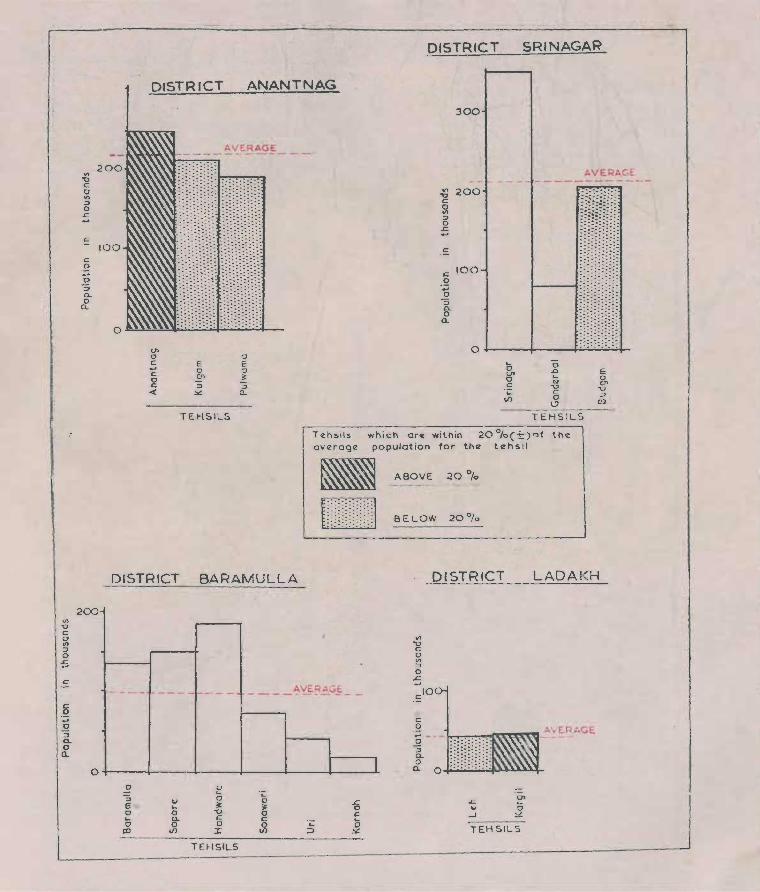
..... -0 C 0 VI ::J 0 -5
c
c: ,2 oJ' a :; Q.
0 Q.
200 VI "0 c: a '" ::I 0
.c.
c 100
c ,£? ..-0 ::7 0-0 a_
0
DISTRICT ANANTNAG
0-0 c .. c: 0 c «
AVERAGE. - - ------ ------
0 E E 0 0 CI> " ::> :>
:.:: 0..
TEHSILS
T~h5ils.
overage
DISTRICT BARAMULLA
200
0
0 :; E 0 L-a
CD
'" .... o Q. o
IJ)
o La ~ "0 c: a
:I:
TEHSILS
.;:: o
'" o c ~
1 I
DISTRICT SRINAGAR
300
AVE.RAGE - - -- -------- - - .. -
VI 200 "0 c: a VI :> 0 .c _.
.!;
c 100 .2 .. a
"3 0.. 0 (l.
0 L-a 01 0 C '<: ."
II,~;III-::::::::::: :: : :::: ::: : ~ ~ . . - -
1----.. :::::::::=:
0 .D E ... 0 ... -0
en c: "0 0 ::;J
(2 C)
TEHSILS
which or« within 20 %ct) ~f th~ population for th~ t~hsi'
I
ABOVE 20 %
DISTRICT
.c ...
....J
TEHSIL S
LADA KH
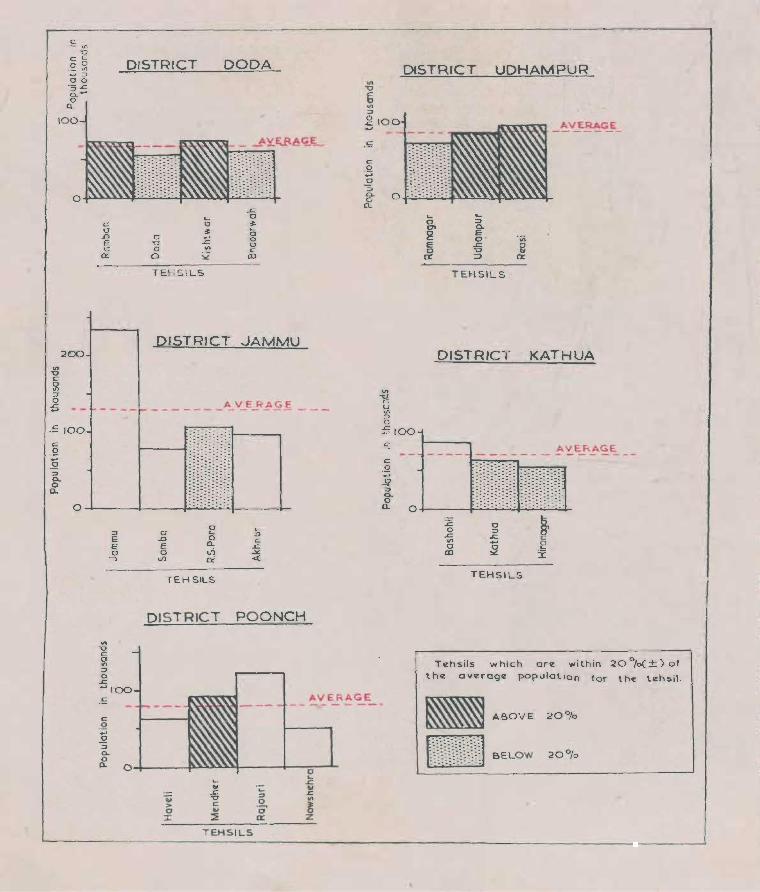
c - '" "0
c C 0 0 ._ <II ~ :::> 00
g_~ o
n.
100
200
5,00
c .Q ... ~ ::> a. o a.
c o .D E c 0:
DISTRICT DaDA
DISTRICT JAMMU===-
AVERAGE ---- ~ -------------
1---""' . . . .. -. .. . . ,
0~----~----~~~+-----4-
0 L. ::::> 0 L. ::> E ..0 0 c:: E E n. ..c. 0 0 .n -'" -, Vl oi ~
TEHSILS
DISTRICT POONCH
AVERAGE
DISTRICT UDHAMPUR
'" ~ u VI ::> o :::100
c: .2 ..... .£
::> a.
.... a 0' g e 0 a:
AVERAGE -------
L-::> a. e . ';; 0 ..c ~ -0 ~ r::r
TEHSILS
DISTRICT KATHUA
HmUH»~/ ::: : : : : ::::=::: : : . . - - - - - - - - --:- :- : : : : > :-:-:- :< . - _. - - - - ' . --
~ o+-------~: ~: ~:~:~:~:~-~·-~:-~: ~-:~·:·· :~ :c o .c
'" o cD
TEHSILS
Tozhsils which are within 20o/o(±)of
the overage populat ion for the: te:hsil .
-------c
.Q ..... o "3
C>o a.
~ > 0
:J:
0 .... L. ..c ...
L. ... ..c
'" ..c
"C7 0 '" C .0' ~ ... ~ r::r z
TEHSILS

Tehsns with Higher DeDsities thaD that 01 the State
2.175 Such of the tehsils in the above statement as have densities higher than the average
for the State as a whole are classified in the following statement according to their respective densities and the character of each tehsil, viz., entirely rural, non-industrial and industrial.
STATEMENT D.20
Character 01 tehsns whose densities are, higher thaD the average lor the IItate, 1961
Name of district
Anantnag
Srinagar
Baramulla
Ladakh
Dada
Udhampur
Jammu
Kathua
Poonch
Not, :-
Number of tehsils wbose densities are above that of the State as a whole
r-Above 100% 76-100010 51-75%
,--__ _""A",.__.... r----.A-------. r----""-----,
(a) (b) (c) (a) (b) (c) (a) (b) (c)
2 3 4 5 6 7 B 9 10
3
2
2 2
2 1
2 1
4
3
2 1
(a) Entirely rural (b) Non-industrial each cOntaining at least one non-industrial town (c) Industrial tehsils each containing at least one industrial town
26-50% Upto 25% ,..----A. ___ -. ....-----'-------.
(a) (b) (c) (a) (b) (c)
11 12 13 14 15 16
2.176 This would lead to the following three statements according to the respective character-
istics of the tehsils as indicated by (a), (b) and (c) above:-
1~9

STATEMENT D.21
(a) Entirely rural tehslls
Tehsils with density above 100% that of State .
,...-______ ____.r..._ ________ __,
Tehsils with density 76-100% above that of State
~-__ - _____ -A ___ ---____ -.,.
State/District No. of Density in No. of Density in Tchsils Population Area 1961 Tchsils Population Area 1961
1 2 3 4 5 6 7 8 9
Ja .... na and Kaslunir 3 356,542 1,561.3 228 1 18,508 157.0 188
Anantnag
Srinagar
BaraID.ulla
Ladakh
Doda
Udhampur
Jammu
Ka:thua
Poonch
79,453
.185,565
91,524
Tehsils with density 51-75% above that of State
561.1 142
613.3 303 1
386.9 237
Tchsils with density 26-50% above that of State
18,508 157.0 118
Tehsils with density upto 25% above that of State
State/District ~-------"""'-------.. ~-------....... ------__, r--------A.-------..... No. of Popu- Density No. of Popu- Density No. of Popu- Density Tehsils lation Area in 1961 Tehsils lation Area in 1961 Tehsils lation Area in 1961
10 11 12 III 14 15 16 17 18 19 20 21
JlUIUIlUand Kaslunir
Anantnag
Srinagar
Baramulla ~ .. Ladakh
Doda
Udhampur
Jammu
Kathua
Poonch
180

STATEMENT 0.22
(b) NOD-industrial tehsila each cODtaiDiDg at least ODe DOD-industrial town
Tehsils with density above 100% that of State
Tehsils with density 76-100% above that of State
,.-_.",A". ________ .----. r- .A. _______ --.,.
State/I)istrict No. of Density in No. of Density in Tehsils Population Area 1961 Tehsils Population Area 1961 ,
2 3 4- 5 6 7 8 9
JIIDIDlU aDd Kashmir 17· 1,938,448 6,163.~4 315 3 207,386 l,739.10 119
Anantnag
.Srinagar
Baramulla
Ladakh
Dada
Udhampur
Jammu
Kathua
Poonch
State/District
J __ uaad Kasha:air
Anantnag
Srinagar
Baramulla
Ladakh
Dada
Udhampur
Jammu
Kathua
Poonch
2 560,958 644.04 871
2 178,107 589.40 302
2 132,026 837.10 158 61,783 526.20 117
2 158,899 .917.70 173 95,162 813.90 117
4 516,932 1,248.60 414
3 207,430 1,023.60 203
2 184,096 903.20 204- 1 50,441 399.00 126
Tehsils with density 51-75% above that of State
Tehsils with density 26-50% above Tehsils with density upto 25% above that of State that of State
No. of Tehsils
10
-.A. _______ -.. ,. ______ .A.--__ -----, ,.-
.Popu- Density No. of Popu- Density No. of lation Area in 1961 Tehsils lation Area in 1961 Tehsils
11 12 13 15 16 17 18
181
population
19
Area
20
Dcnisty in 1961
21
-..

STATEM£Nt D.23
(c) IndulltrlaJ. tehsH. eaCh cOIltahdng at I •• st ODe iJidu.trial to_
Tehsils with density. above 100% that of Siate
Tehsils with density 76-100% abo'Ve that of State r----------""-----------. ,--_________ ..A.--_______ -.
State {Dis trict No. of Density in No. of Density in Teboil. Population Area 1961 Tehsila Population Area: 1961
Srinagar
Baramulla
Ladakh
Dada
uahampur
JIlIIltnU
Kathua
Poonch
2
5
3
2
3
876,tK7
654,368
222,479
Temits with density 51-75% a.bove that of State
.. 8.273.2
2,096.9
1,176.3
5
268
312
189
6.
Tehsils with (iemity 26-50010 abo'V': that of State
7 8 9
Tehsils with den,.Olty upto 25% above that of State
State/District ,..------____._-----.... .------__,.;.__...:..------. .-------"-------'--. Nq, of P9PU- Der,sity No. of POl'ii- Depsity No. of· Popu- DellSity
Ananmag
Srinagar
Baqamulla
Ladakh
Dada
Udhampur
Jammu
Kathua
POOllch
Teboils 1atiol1 Area in 1961 Tehsils lation Area in 1961 . Tehail. !alion Area in 1961
10 11 12 13 15 16 17 18 19 20 21
.. ;.
182
. 2~ 177 It is important to state here' again that, unlike other States, Jammu and Kashmir has a distinguishing physiographical structure which accounts for its density being the lowest among all the States and Union Territories except North-East Frontier Agency, Nagaiand, Sikkim and Andaman and Nicobar Islands. As has aIr,eady been pointed out, one of the nine districts constituting the territory on this side of the Cease-fire Line which extends to an area of 53,665 square miles occupies no less than 37,754 square miles approximately and is inhabited by a population of 88,651 persons only. If, theretore, the density of the State were worked out in respect of the area covered by the other 8 districts only, it will be seen that the tehsils of Ganderbal, Sopore, Uri, Karnah, Ramban, Dada, Bhaderwah, Ramnagar, Bashohli, Haveli, Rajouri and Nowshehra would have lesser and not higher densities than ,that of the State.
(a) Entirely Rural Tehan.
2.178 A reference to columns 2 and 6 of statement II.21 shows that there are only four entirely rural tehsils, namely, Ganderbal, Handwara, Mendhar and Karnah. The first three of these have densities 100% above that of the State while the density of Karnah exceeds the State density by 76 to 100%.
2.179 There is no among the first three
geographical contiguity tehsils which are too
scattered from each other to form a conglomeration. Ganderbal and Handwara tehsils are separated by tehsil Sopore, while Mendhar is situated hundreds of miles away from both these tehsils in the extreme south-west of the State.
2.180 Tehsils Handwara and Karnah are, however, contiguous and share, so far as tehsil Karnah as a whole and the north-western sector of Handwara are concerned, a common topography. Except for small low level spots here and there, the terrain of this region is entirely mountainous and most of the land is covered with calcareous and arenaceous soil due to
183
underlying sedimentry rocks. Wherever there are igneous, hard, crystalline rocks, the soil is necessarily sandy, rocky and un-productive though there are a few places even on the mountain slopes where the forest growth is fine.
2.181 The tehsil 'of Handwara as a whole gets an average rainfall of 46.21" (1173.803 roms), but areaS at higher altitudes, particularly its north-western region and tehsil of Karnah, receive even greater rainfall. The snowfalls are fairly heavy in winter and plenty of water is available in summer for irrigation of land. In spite of this generosity of nature, the entire area has all along in the past been a deficit one and its food produce has had to be supplemented by imports from outside. The total production of food crops in about onesixth cultivated area of tehsil ~arnah is sufficient for three months consumption only, though in the remaining area the yield rate is comparatively better and the produce is consumed in' six months' time.
2.182 In view of the difficult topography of the region, it has neither been possible to construct any canal nor to build many khuls to irrigate the few cultivable areas available on the slopes. Maize is the principal crop which is grown on 71 % of the cultivated area of tehsil Karnah and 60% of the upper slopes of tehsil Handwara. The other crops consist
. of rice, wheat and pulses which are grown more or less in equal proportions in tehsil Karnah and the kandi area of tehsil Handwara.
2.183 The net cultivated area per capita in tehsil, Karnah does not exceed 0.36 acres. In Handwara, however, which includes large arens of low level and well irrigated lands, the corresponding average is 0.51 acr~s. While this is true of the tehsil as a whole, the net cultivated area per capita in its north-western
. sector, which has the same terrain and topography as the tehsil of Karnah, is . estimated in the neighbourhood of 0.32 acres only.
2.184 The region is mostly inhabited by Muslim Gujars though a few dwellings of Kashmil'i Muslims are also seen strewn here and there.
2.185 Pahari, the predominant language of tehsil Karnah, is spoken by more than 83% of its population. Other languages spoken consist of Gojri and Kashmiri which claim more or less equal number of speakers. In tehsil Handwara, however, KashIJIiri is the predominant language and Pahari ranks next to it. The number of Kashmiri speaking people in the north-western sector of Handwara tehsil is not available but as the area is dominated by Gujars only, it is estimated to be faidy small. Speakers of Pahari language in tehsil Handwara who number 14,759 or about 8% of the tehsil population are mostly concentrated in this sector.
2.186 The density of road mileage. in the hilly sector of tehsil Handwara which adjoins Karnah is about 24 per 100 square miles, the same as the corresponding density of Karnah.
2.187 Tehsil Karnah does not own more than one road which gives access to it from the valley and extends to Teatwal, one of the villages in the close vicinity of the Cease-fire Line. The t~hsil has a population of 18,508 only with the result that the density of road mileage per 100,000 population is relatively high and stands at 205.3. This is also true of the north-western sectOr of tehsil Handwara which is sparsely populated like Karnah and has very few roads. The density of mileage per 100,000 population in this sector is, therefore, higher than that of tehsil Handwara as a whole.
2.188 There is a wide disparity in .the sex ratio of the two tehsils. Handwara is inhabited by 890 females against every thousand males whereas the corresponding proportion in Karnah stands at 811 only. Here again, if" the sex ratio is worked out separately for the northwestern secto r of -Handwara, it, would be much less than that of the tehsil as a whole and almost equal to that of Karnah.
2.189 The literacy percentage of Handwara is 6.7% as against 8.2% of Karnah. By and large, the literate population of the two tehsils is concentrated in their low level areas
184
and such of the villages where tehsils and other Government institutions are headquartered. In the mountainous areas, the literacy percentages are fairly low in either case.
2.190 It has been already stated that tehsil Handwara includes large low level areas where the soil is comparatively more fertile and better irrigational facilities are available than those obtaining in Karnah. Langet, Zainagir and Lolab, for instance, are some of the fertile regions of this tehsil where cultivable areas are irrigated with the help of artificial canals, natural streams and zamindari khuls. That is why rice is the principal crop grown in these areas. In hilly slopes, however, the size of cultivable land being small and irrigational facilities rare, the incidence' of agricultural workers is comparatively less pronounced. The overall proportion of agricultural workers, to non-agricultural workers in the tehsil as a whole, therefore, stands at 13: 1 only. In tehsil Karnah, the net cultivated area per capita being more than half the corresponding area of tehsil Handwara, the number of agricultural workers is proportionately small and equal to five times the number of nonagricultural workers.
2.191 A closer examination of sex wise number of workers in the two tehsils shows that the proportion of female workers in Handwara is much higher than that of Karnah. This will be clear from the fact that of every 3 workers in Handwara, about 2 are males and over
'one a female, whereas in Karnah, against every 8 male workers there is only one female approximately. What is true of Karnah holds good in respect of the population of Handwara inhabiting its north-western sector.
2.192 This -also explains the disparity in the proportion of workers and non-workers of the two tehsils. In Handwara, the two categ"?ries claim more or less equal proportion, but in Karnah the number of non-workers is about twice than that of the workers. This imbalance being due to the difference in the topographical character of the major part of the two tehsils, it may reasonably be inferred that the proportion of
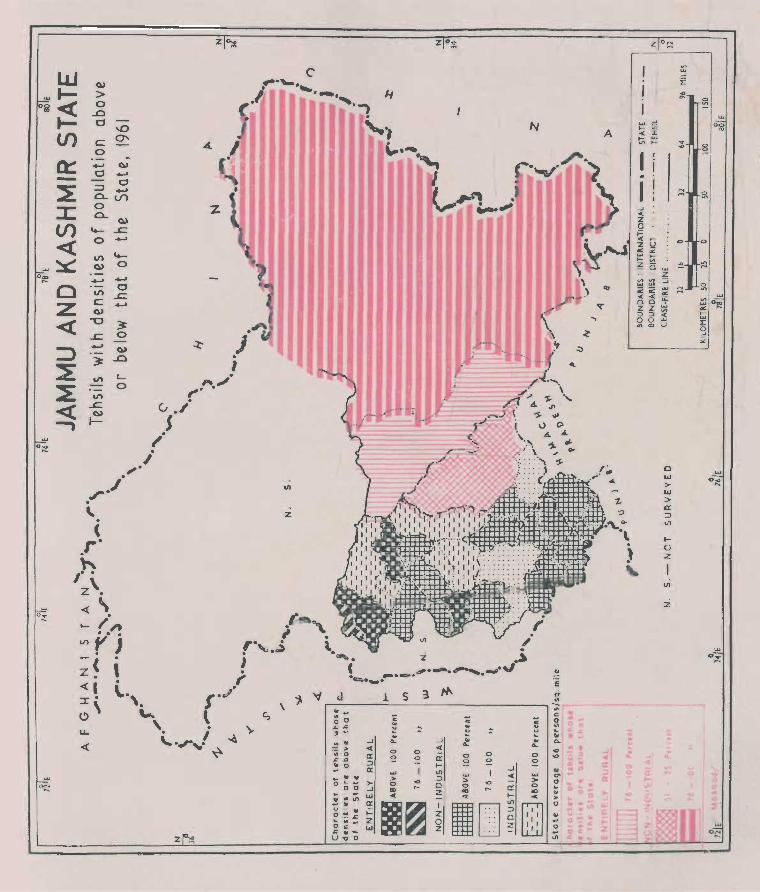
°2
w
o~
o~
W <» I- >
~ 0
.Ll 0
(/) c 0
a::: .... 0 -
~ ::J 0...
::c 0 0...
U) -< 0
.,., ~ <» .... 0 .,., Z
c <»
< "U
..c
::> .... ~
~ .,., ~ .,.,
< ..c <»
~ I--
.r"
""
..0 0'
<» .... 0 ....
\/)
<» ..c .... -0 .... 0
..c .... ~ a <»
..0
L a
, ,...~ . " . v .~ •
1 ~.
z o~
N
2
" . z\ <{\ ~ /,. .f "\. VI Y.· . ,. .,.".1 i ! -( • J .~. i ~ Z , C """.-. --- _ • ..J . ;, . ....~'" .... -~. « I . , Cl:t .....
d .. ~ 1 5 . \.., ,.J' '>l '" 3 M. :r \. ~ \" r-----=--=----------, C> "'" \ c, u.
~ " s::S:: t~ .. .. ..J
== > « .. 0 a: .cD ::> !! 0 a:
, . ... . I .. \.. . .,-.... ""
~
0 .. .. .. ~ >-0 " ..J .. W .. "III
~ .. a: v - .. i= O~. .... ~ z " c; w s:: .. -U'O 0
c .. v .. w ...
0 !:! ... > o II> ...
::
<> 0
..J « II: tIII :::> o Z
~ w v .. ...
0
~
c
: .. u .. .. ...
0 0 0
..J « ....
> a: 0 .., t- ... '" [ill :::> 0 z I
z o~
w -' E ~ <>
~
w _.
A t- ~ -< t-v> ....
I
0:il
..,. ~ '"
" I ,...
g ~
_. -< z 0 ;:; < .... z u ~ G<: l- t;; ~ Q
<>
~ ;0
::: g w
:::-at. .... I-.... ~ ~ '"
,. 0 .'- w .' ... W 0",
>- .... w
"1- > ?
II: ::>
.'\. ... of)
'" t-. 0
) 2
vi
2
w o;!: ..
E a ~ .. c 0 .. .. .. 0..
'" '" « cr ..
'" a: ~ " .. .. >
" .. ~
" ~ o~ oJ!

agricultural to non-agricultural workers in the north-western zone of Handwara is the same as in Karnah.
2.193 The proportions of children in the . age-group .0-4 to the total popUlation are almost equal in the two tehsils being 1:8 in the case of Handwara and 1:7 so far as Karnah is concerned. It is unlikely that the corresponding proportion of the children of this age in the hilly area of Handwara could be less than that of Karnah.
2.194 The above analysis of the various factors, which normally operate in area. where the density of popUlation is fairly high, indicates that there is a large amount of homogeneity in tehsil Karnah and the mountainous region of tehsil Handwara. Both possess the same, religious, tribal and linguistic characteristics, both are dominated by unproductive lands and suffer from want of irrigational facilities. The incidence of literacy is fairly low and the proportion of agricultural workers to non-agricultural workers small. The number of female workers and the proportion of workers to, non-workers are, when compared with other parts of the State, also equally low.
2.195 If tehsil Karnah is left out of consideration, it will be seen that the other three tehsils, namely, Ganderbal, Handwara and ]\:lendhar, show a disjointed broken scatter' on the map of the State. Reasons for the high density of population in these tehsils are not far to seek. Tehsil Ganderbal is situated on either side of the Sringar-Leh road which has been built during the inter-Census period on account of the growing importance of Ladakh. Inhabitants of the tehsil, particularly of the villages situated on or near this road, now find an easy market for the disposal of agricultural products, such as, poultry, milk and its by-
,products, which are constantly in demand. The higher altitudes in the tehsil include some fine pastures where grazing facilities are available on a large scale. It is, therefore, that we find most of these places occupied by Gujars who have settled there in large numbers.
185
2.196 Further, besides tourists and visitors" who keep on m:oving about in the tehsil to see glaciers and other beauty spots and who need ponies for this purpose, the army also provides employment to a lrage number of the inhabitants by hiring their mules and ponies for transporting kerosine oil and other commodities to the tehsils of Kargil and Leh.
2.197 Tehsil Handwara is rich in forest wealth and leases, wh~ch are being operated upon in many of its forests, provide employment to a large number of people. The tehsil is also famous for fruit industry which constit.utes an important' subsidiary occupation of many of its inhabitants. Among other reasons responsible for the high density of population, mention may also be made of the 'land reforms introduced by the State Government during the inter-Census period as a result of which many big Jagirs, such as those of Rajas of Zachalrl3.ra, Rajpora etc., were resumed by the Government and allotted' to -the landless persons and others.
-2.198 Tehsil Mendhar is situated OR the Cea~ fire Line and many of the villages which were" included in its jurisdiction before 1947, as also some of the other tehsils of the district, such as, Bagh, Sudhnoti and Kotli etc., are now on the other side of the said line. There is, therefore, a constant flow of infiltraters into the tehsil from across the Cease-fire Line which seems to be one of the principal causes of the high density of the tehsil. In addition> avenues of employment :.ore now avalaible on a larger scale due to the stationing of 'the army in and around the tehsil.
(b) Non-industrial Tehsils
2.199 A reference to statement 11.22 shows that there are in all 2.0 non-industrial tehsils in the State. Seventeen of these have fairly high densities which exceed that of the State by more than 100%. In the remaining three tehsils, namely, Bhaderwah, Reasi and Nowshehra, the density is 76 to 1.00% above that of the State as a whole.
2.200 The first 17 tehsils consist of the two
isolated tehsils of Haveli and Rajouri and two conglomerations, viz. :-
(i) Tehsils Srinagar, Uri, and
Badgam, Baramulla,
(ii) Tehsils Ramban, Doda, Ramnagar, Udhampur, Jammu, Samba, Ranbirsinghpora, Akhnoor, Bashohli, Kathua and Hiranagar.
2.201 Three of the tehsils included in the first' conglomeration consist mostly of low level plain areas whereas the fourth, viz. Uri, is entirely mountainous except for a number of small and narrow valleys which are interspersed among the ravines.
2.202 In the plain areas of this conglomeration, the soil is alluvial and consists of loam and clay formed by the rivers while in floods. The major part of the borders of this area contains extensive elevated plateaus of alluvial material known locally as karewa (table land).
"These karewas cannot generally be brought under irrigation and are easily distinguishable in summer from the plaiI! of the river alluvium which is densely covered by rice crops.
2.203 The conglomeration is bordered in the west by mountains which extend from the
"Shiwalik ranges near about Shupiyan towards the north. Besides the river Jhelum and its important tributaries, such as, Dood Ganga, Sindh, Ferozpur nallah, ~tc., several other streams and rivulets flow down from the western mountains and provide ample water for irrigation. The soil is mostly porous making it
"necessary to keep the water running over the terraced fields from the time of sowing until the crops are harvested. If this is not done, the soil beComes hard and caked and its stalks are pinched and the plant suffers.
2.204 The subjoined statement shows the cultivated area per capita and percentage of net area sown to total area according to village papers and according to the provisional figures supplied by the Survey of India:-
186
Tehsil
Cultivated area per capita
2
Srinagar 0.06 acres Badgam 0.48 acres Baramulla 0.59 acres Uri 0.37 acres
Percentage of net area sown to total area
According to village papers
3
36 54 72 24
According to Survey of
India 4
19 32 39
9
2.205 The cultivated area per capita in the case of Srinagar tehsil comes to 0.30 acres if Srinagar city which claims 81 % of the tehsil popUlation is left out of account. In" that case, the average for the tehsil would be almost equal to that of Uri and .much below the average of the tehsils of Badgam and Baramulla.· In this context, we cannot also lose sight of the fact that a substantial proportion of the rural area of tehsil Srinagar is occupied by large size lakes and roads, "such as, Dal and' Anchar lakes and National Highway and inter.district and intertehsil roads.
2.206 Tehsil Uri has a different topographical and geological structure. The soil is hard, -sandy and stony and except for snow-fed khuls and nallahs, there are practically no" other facilities available for irrigation.
2.207 T.lIe rainfall in this conglomeration ranges from 635.600 mms (25.02·) of Badgam to 1,343.914 mms (52.91") in Uri. Srinagar gets 705.186 mms (27.76") and Baramulla 957.655 mms (37.70"). This shows that Uri alone gets moderate rainfall and that the other three tehsils belong to the Poor Rainfall Division. In spite of this high rainfall, the density of popUlation in tehsil Uri is only 156 as against 433 of Badgam, 425 of Baramulla and 2,147 of Srinagar. This is because of the mountainous character of the tehsil which leaves very little cultivable area to support any large size population. The high density of Srinagar tehsil is obviously due to the inclusion in it of Srinagar city. " In the rural sector of the tehsil the density stands at 419 only. At any rate, the deficiency of rainfall in tebsils Badgam, Srinagar and
Baramulla is set off by natural and artificial facilities available for il·rigation. This will be clear from the subjoined statement which shows
the areas irrigated by canals, khuls, wells, etc. and the percentage of irrigated area to the net cultivated area in each of the four tehsils:-
Area irrigated in acres r-----------J.--
Tehsil 'Govern-ment .Private Wells
1.
Srinagar
Badgam
Baramulla
Uri
canals
2
293
2,532
2;842
161
canals
3
11,543
63,676
34,386
6,317
2.208 The large disparity in the percentages of irrigated to net cultivated area of the fint two .tehsils when compared with Baramulla and Uri is due only to topographical variation and the nature of soil which facilitate the consmlCtion of canals, wells and khuls etc., in the former. _
2.209 Rice and maize are the principal crops grown but_ whereas major part of cultivated areas of t~hsils Srinagar, Badgam and Baramulla produce rice, in Uri the area under maize cultivation is about times five that of rice.
2.210 The proportion of net cultivated area to uncultural fallows (cultivable waste plus current fallows plus fallow lands other than current fallows) stands as under:-
Tehsils
Srinagar Badgam Baramulla Uri
Proportion ofr.net cultivated areas to uncultural fallows
I : 0.50 1 0.40
0.07 0.87
2.211 It is clear from here that the area under uncultural fallows in Uri is almost the same as the net cultivated area of the tehsil. Further, in Baramulla, the size of uncultural fallows is proportionately the least, though as' indicated earlier, the net area cultivated does not exceed 39% of the total area of the tehsil.
2.212 Except for 2% population of the rural
4
856
460
187
Net Percentage of cultivated irrigated to
Other Total area net cultivated sources area
5 6 7 8
2,229 14,921 20,429 73
9,144 75,812 99,470 76
37,228 80,841 46
280 6,758 15,448 44
sectors of the tehsils of Srinagar, Baramulla and Uri which consists of Hindus and Sikhs, all other inhabitants are followers of blam. In Badgam, the _percentage of Muslim population is; however, 97 only.
2.213 Kashmiri is the predominant language of the three tehsils of Srinagar, Badgam and Baramulla. In tehsil Uri 46% rural population speak Pahari. 32% Kashmiri and 20% Gojri and Urdu.
2.214 It is thus evident that there is a homogeneity of religious characteristics in all the four tehsils and linguistically Uri alone is somewhat distinguishable from the other three.
2.215 The road mileage per 100 square miles of area is 39.0 miles in the case of Srinagar and 23.5 and 25.5 so far as Badgam and Baramulla, which are partly hilly and partly plain, are concerned. In Uri, the corresponding average is still less and does not exceed 7.8 miles.
2.216 By size, Srinagar is the smallest of the four tehsils referred to above,. being about I of Baramulla, less than 2/3 of Uri and slightly more than 1/3 of Badgam. According to the information supplied by the Forest Department, 71 % of the total area of Srinagar is covered by forests and rakhs, as against 18% of Badgam, 43% of Baramulla and 44% of Uri. The scope for road development in Srinagar is, therefore, very limited. The city is, however, interwoven'
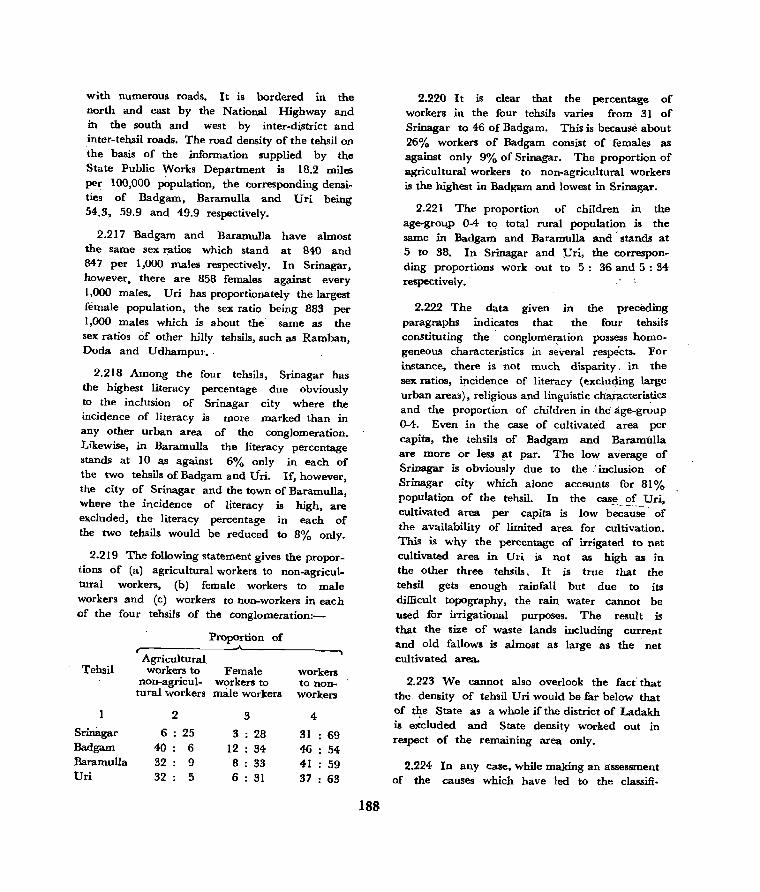
with numerous roads. It is bordered in the north and east by the National Highway and in the south and west by inter-di.strict and inter-tehsil roads. The road density of the tehsil on the basis of the infonnation supplied by the State Public Works Department is 18.2 miles per 100,000 population, the corresponding densities of Badgarn, Baramulla and Uri being 54.3, 59.9 and 49.9 respectively.
2.217 Badgam and Baramulla have almost the same sex ratios which stand at 840 and 847 per 1,000 males respectively. In Srinagar, however, there are 858 females against every 1,000 males. Uri has proportionately the largest female population, the sex ratio being 883 per 1,000 males which is about the same as the sex ratios of other hilly tehsils, such as Ramban, Doda and Udhampur ..
2.218 Among the four tehsils, Srinagar has the highest literacy percentage due obviously to the inclusion of Srinagar city where the incidence of literacy is more marked than in any other urban area of the conglomeration. Likewise, in Baramulla the literacy percentage stands at 10 as against 6% only in each of the two tehsils of Badgam and Uri. If, however, the city of Srinagar and the town of Baramulla, where the incidence of literacy is high, are excluded, the literacy percentage in each of the two tehsils would be reduced to 8% only.
2.219 The following statement gives the proportions of (a) agricultural workers to non-agricultural workers, (b) female workers to male workers and (c) workers to non-workers in each of the four tehsils of the conglomeration:-
Proportion of
Agricultural Tehsil workers to Female workers
non-agricul- workers to tural workers male workers
to non-workers
2 3 4
Srln8.gar 6 25 3 28 31 69 Badgam 40 6 12 34 46 54 Baramulla 32 9 8 33 41 59 Uri 32 5 6 31 37 63
188
2.220 It is clear that the percentage of workers in the four tehsils varil's from 31 of Srinagar to 46 of Badgam. This is because about 26% workers of Badgam consist of· females as against only 9% of Srinagar. The proportion of agricultural workers to non-agricultural workers is the highest in Badgam and lowest in Srinagar.
2.221 The proportion of children in the age-gro4P 0-4 to total rural population is the same in Badgam and Baramulla and -stands at 5 to 38. In Srinagar and Vri, the corresponding proportions work out to 5: 36 and 5 : 34 respectively.
2.222 The data given in the preceding paragraphs indicates that the four tehsils constituting the conglome~tion possess homogeneous characteristics in several respects. For instance, there is not much disparity. in the sex ratios, incidence of literacy (excluding large urban areas), religious and linguistic cha,r;l.cteristics and the proportion of children in the age-group 0-4. Even in the case of cultivated, area per capita, the tehsils of Badgam and Baramulla are more or less ~t par. The low average .of Srinagar is obviously due to the·· inclusion of Srinagar city which alone acceunts for 81 % population of the tehsil. In the cas~. of Uri, cultivated area per capita is low b~;~-;~· of the availability of limited area for cultivation. This is why the percentage of irrigated to net cultivated area in Uri is not as high as in the other three tehsils. It is true that the tehsil gets enough rainfall but due to its difficult topography, the rain water cannot be used for irrigational purposes. The result is that the size of waste lands including current and old fallows is almost as large as the . net cultivated area.
2.223 We cannot also overlook the fact" that the. density of tehsil Uri would be far below that of the State as a whole if the district of Ladakh is excluded and State density worked out in respect of the remaining area only.
2.224 In any case, while making an assessment of the causes which have led to the classifi-
cation of these tehsils as non-industrial tehsils, it is important to take note of their Past history. Before 1947, Srinagar, Baramulla and Uri were all situated on the then National Highway connecting Srinagar with Rawalpindi. With the diversion of the rail-head to Pathankot and the large scale devastation which the two tehsils' of Uri and Baramulla experienced as a . result of the tribal raids, the size and volume of the private enterprise in these tehsils has substantially reduced.
2.225 The main reason for the classification of Sri nagar among non-industrial tehsils is. that its principal urban area, the city of Srinagar, is the seat of Government as a result of ~hich the proportion of workers in tehsil Srinagar in other services exceeds the corresponding proportion of those engaged in manufacturing. The fact, however, remains that despite its predominance of service characteristics, Srinagar is the most important industrial town in' the State, both in respect of organised industry as also handicrafts.
2.226 Tehsil Badgam is reputed for the high fertile character of its soil .and is regarded as an importa.nt rice producing area of the State. In this tehsil, agriculture is the mainstay of the people and except for a small township, which has sprung up as late as 1959, there are no urban areas in the tehsil.
2.227 1 he conglomeration of other eleven tehsils of which each component unit has a density exceeding that of the State by more than 100% is contiguous with the three tehsils, Bhaderwah, Reasi and Nowshehra whose density exceeds the State density by 76 to 100% only. Tehsil Bhaderwah is situated on the north-eastern border of the conglomeration and Reasi and Nowshehra which lie to its north and northwest are contiguous with Ramban, Udhampur, Jammu and Akhnoor. It would be, therefore, appropriate to consider all the fourteen tehsils together to ascertain the causes which accoWlt for their high densities.
2.228 The tehsils extend to· the area in the
189
south of :rir Panchal ranges and cover the whole of Jammu Province except the area occupied by tehsils of Kishtwar, Haveli, Mendhar and Rajouri. Seven of the tehsils, namely, Kathua, Hiranag~r,. Samba, Ranbirsinghpora, Jammu, Akhnoor and Nowshehra constitute what is known as the Sub-Montane Region and the other seven belong to the Outer Hills.' The former consist mostly of plain and partly of broken kandi country skirting the mountain ranges of the Himalayan series. The tehsils belonging to the Outel' Hills are, except for small valleys, plateaus, etc. mostly hilly with limited area available for cultivation. If the State density for the territory on this side of the Ceasefire Line except district Ladakh is compared with the densities of these tehsils, it would be seen that Udhampur alone would have a density slightly more than that of the Stat.e and the densities of all other tehsils in the Outer Hills would be by far less when compared with the State density.
2.229 The character of soil in the tehsils falling in the Outer Hills is identical with Prati lands in other States where limestone beds either penetrate or are immediately beneath the surface of the soil and cultivation is consequently precarious. The soils in the flat sector of the Sub-Montane Region correspond to Tarai lands. Next to this moist area are the kandi table lands, where the soil consists of red loam, intermixed with shingle and stone.- In this area, cultivation is mainly dependent on the Monsoon rainfall.
2.230 The area comprising the fourteen tehsils falls in "Moderate Rainfall Division" with average rainfall ranging from 40' to 80' (1016 mms to 2032 roms). It is because of this sufficient rain~ fall that the forests flourish in the hills and several crops can be. grown in the plains without any artificial system of irrigation.
2.231 As has been stated above, the region consists partly of hilly and partly of plain areas. The table lands in the hilly sector are irrigated by torrents which are fed by melted snow. The course of the water thus made available
is regulated by the cultivators themselves who provide properly graded water courses for their fields. At lower levels, the deficiency of rainfall, if any, is made up by artificial canals and to some extent by wells.
2.232 In Ranbirsinghpora, 71 % area under cultivation is irrigated and fed by Ranbir Canal only. So far as other tehsils are coricerned, the proportion of irrigated to net cultivated -- area varies from 2% to 43% as indicated' below:-
Area irrigated iJil acres Percentage of
Tehsil
Ramban Doda Udhampur Ramnagar Bhaderwah Bashohli Kathua Hiranagar Samba Rambirsinghpora Jammu Akhnoor Reasi Nowshehra
Government canals
2
249
762 '1,577
708 76,645 17,923
3,345 159
8
Private canals
3
3,633 5,040 2,582 1,104 3,092 5,715
12,107 5,396
11
6,880 1,132 4,428
708
2.233 The crops grown consist of wheat, rice, maize, barley, gram, millet, cotton and sugar~
cane. Maize is generally grown at higher levels where drainage is good and artificial irrigation is not possible.
2.234 The proportion of net cultivated area to culturai fallows varies from tehsil to tehsil depending upon topography, character of the soil and the amount of rainfall in a year. Thus, while in Ranbirsinghpora the size of net cultivated area is more than twice that of uncultural fallows, in Nowshehra the proportion of net cultivated area to uncultural fallows stands at 1 : 1.7 as indicated below:-
Tehsil
Ramban Doda Udhampur
Proportion of net area sown to uncultural fallows (culturable waste plus fallow lands other than current
fallows plus current fallows)
I 0.51 1 0.63 1 0.75
Wells
4
10 12
153
9 84
190
---. Other Cultivated irrigated to
sources Total area cultivated area
5 6 7 8
3,633 32,617 11 5,040 29,086 17
897 3,728 47,030 8 3,850 4,954- 41,614 12
3,092 26,566 12 963 6,678 54,699 12
12,879 29,930 43 337 7,322 46,637 16
872 54,258 2 97 76,743 108,500 71
24,817 62,753 40 4,561 73,432 6
5 4,592 46,82~ 10 716 29,158 2
Proportion of net area sown to un-cultural fallows (culturable waste
Tehsil plus tallow lands other tlu!:n current fallows plus current falIows)
----Ramnagar 1 : 0.66 Bhaderwah I : 0.68 Bashohli 1 : 0.34 Kathua I : 1.00 Hiranagar 1 : 0.49 Samba 1 : 0.70 Ranbirsinghpora 1 : 0.45 Jammu 1 : 0.61 Akhnoor 1 : 0.55 Reasi 0.34 Nowshehra I : 1.70
2.235 The above data shows that with the exception of the tehsils of Kathua and Nowshehra, the size of net area sown exceeds that of uncultural fallows in all other tehsils of the region.
2.236 The net cultivated area per capita varies from 0.27 acres of tehsil Jammu to
0.83 acres of tehsil Hiranagar. Jammu has the largest population among all the fourteen tehsils but the area under cultivation is proportionately very small which accounts for the low average of cultivated area per capita. On the other hand, except for Nowshehra, Hiranagar is the least populated tehsil but as the size of its cultivated area is larger than that of Nowshehra, the per capita cultivated area of the tehsil is highest among all the 14 tehsils. The subjoined statement shows the cultivated area per capita in each of the tehsils and the percentage of net area sown to total area according to village papers and according to Survey of India :-
Percentage of net area sown to total area
Cultivated r-----.A.. ----......... area per According According
Tehsil capita to vmage to Survey (in acres) papers of India
2 3 4
Ramban 0.44 II 12 Doda 0.50 II 11 Udhampur 0.54 18 19 Ramnagar 0.58 12 12 Bhaderwah 0.43 33 8 Bashohli 0.63 14 14 Kathua 0.47 21 21 Hiranagar 0.83 40 40 Samba 0.69 26 26 Ranbirsinghpora 0.56 60 59 Jammu 0.27 28 28 Akhnoor 0.76 27 27 Reasi 0.49 10 9 Nowshehra 0.58 12 11
2.237 Of the fourteen tehsils comprising the region, Ramban, Doda, Bhaderwaloi and Reasi have a predominant Muslim population. In the remaining ten tehsils, majority of the inhabitants consist of Hindus.
2.238 Dogri is the predominant language of all the tehsils except Ramban, Dada and Bhaderwah. In Ramban and Doda, Kashmiri speaking people are in majority and in Bhaderwah. Bhadrawahi is the predominant language of the tehsil.
191
2.239 Due to the difficult topography of most of the tehsils, the road mileage per 100 sq. miles of area is generally very low, particularly in tehsils falling in the Outer Hills except Ramban, Doda, U dhampur and Bashohli which are situated on the National Highway or District roads. Even plain areas other than the tehsils of Nowshehra, Jammu and Ranbirsinghpora, where the road mileage per 100 sq. miles of area varies from 14 to 25.7 miles, do not have many roads. In Kathua, - for instance, which is both plain and hilly, the mileage per 100 sq. miles of area does not exceed 6.6.
2.240 The density of road mileage per 100,000 population is not also uniform among all the tehsils constituting the conglomeration. Tehsil Kathua with a population of 63,918 has a road length of 15 miles only whereas Nowshehra, which is inhabited by 50,441 persons, is catered by roads measuring 56 miles III length. Obviously, the density of road mileage per 100,000 population in Nowshehra is about 5 times that of Kathua. In other tehsils, the road mileage density varies from 15.9 to 96.4 miles depending upon the location of the tehsil, its topography, population, etc.
2.241 Broadly speaking, _ the density of road mileage per 100,000 population is not low in tehsils which have plain topography or are situated on the national or district road9. Tehsils, which wholly or mostly extend to mountainous areas and are accessible by one or two roads only, have low or high densities depending upon the size of population fed by such roads. It is, therefore, that we find that tehsil Ramban which is mostly hilly but is inhabited by 73,646 persons only has a density of over 96 miles. On the other hand, .Ranbirsinghpora which is dominated by plain areas and inhabited by 107,438 persons -has a density of 37.7 miles as the tehsil is neither situated on the National Highway nor any inter-district boundary.
2.242 Except for the tehsils of Ramban, Doda, Udhampur, Jammu and Kathua, the sex ratio is normal in -all other tehsils and varies from
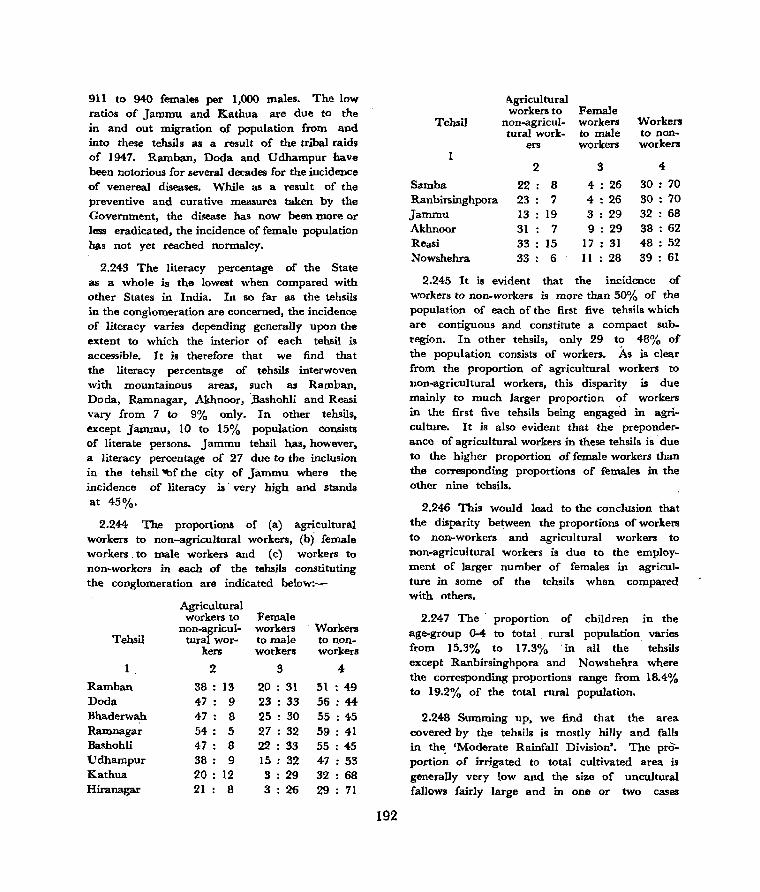
911 to 940 females per 1,000 males. The low ratios of Jammu and Kathua are due to the in and out migration of population from and into these tehsils as a result of the tribal raids of 1947. Ramban, Dada and Udhampur ·have been notorious for several decades for the incidence of venereal diseases. While as a result of the preventive and curative measures taken by the Government, the disease has now been more or less eradicated, the incidence of female population fuls not yet reached normalcy.
2.243 The literacy percentage of the State as a whole is the lowest when compared with other States in India. In so far as the tehsils in the conglomeration are concerned, the incidence of literacy varies depending generally upon the extent to which the interior of each tehsil is accessible. It is therefore that we find that the literacy percentage of tehsils interwoven with mountainous areas, such as Ramban, Doda, Ramnagar, Akhnoor, .BashohH and Reasi vary from 7 to 9% only. In other tehsils, except Jammu, 10 to 15% popUlation consists of literate persons. Jammu tehsil has, however, a literacy percentage of 27 due to the inclusion in the tehsil 'tlf the city of Jammu where the incidence of literacy is very high and stands at 45%.
2.244 The proportions of (a) agricultural workers to non-agricultural workers, (b) female workers to male workers and (c) workers to non-workers in each of the tehsils constituting the conglomeration are indicated below:-
Agricultural workers to Female
non-agricul- workers . Workers Tehsil tural wor- to male to non-
kers workers workers
2 3 4
Ramban 38 13 20 31 51 : 49 Dada 47 : 9 23 33 56 : 44 Bhaderwah 47 : 8 25 : 30 55 : 45 Ramnagar 54 : 5 27 : 32 59 : 41 Bashohli 47 8 22 : 33 55 : 45 Udhampur 38 : 9 15 32 47 : 53 Kathua 20 : 12 3 29 32 68 Hiranagar 21 : 8 3 26 29 : 71
192
I\gricultural workers to Female
Tehsil non-agrieul- workers Workers tural work- to male to non-
ers workers workers
2 3 4
Samba 22 8 4- 26 30 70
Ranbirsinghpora 23 7 4- : 26 30 70 Jammu 13 19 3 : 29 32 68 Akhnoor 31 7 9 : 29 38 62 Reasi 33 15 17 : 31 48 : 52 Nowshehra 33 6 II : 28 39 : 61
2.245 It is evident that the incidence of workers to non-workers is more than 50% of the popUlation of each of the first five tehsils which are contiguous and constitute a compact subregion. In other tehsils, only 29 to 48% of the population consists of workers. As is clear from the proportion of agricultural workers to non-agricultural workers, this disparity is due mainly to much larger proportion of workers in the first five tehsils being engage'd in agriculture. It is also evident that the preponderance of agricultural workers in these tehsils is due to the higher proportion of female workers than the corresponding proportions of females in the other nine tehsils.
2.246 This would lead to the conc1usion that the disparity between the proportions of workers to non-workers and agricultural workers to non-agricultural workers is due to the employment of larger number of females in agriculture in some of the tehsils when compared with others.
2.247 The proportion of children in the age-group 0-4 to total . rural population varies from 15.3% to 17.3% Ul all the tehsils except Ranbirsinghpora and Nowshehra where the corresponding proportions range from 18.4% to 19.2% of the total rural population.
2.248 Summing up, we find that the area covered by the tehsils is mostly hilly and falls in the. 'Moderate Rainfall Division'. The proportion of irrigated to total cultivated area is generally very low and the size of uncultural fallows fairly large and in one or two cases
equal and even more than the net area sown. The cultivated area per capita is not small but as the soil is not also very fertile, the yield per acre is comparatively poor. The large majority of the inhabitants consist of Hindus whose predominant language is Dogri. The road mileage pel' 100 sq. miles of area and its den~ity per 100,000 population is generally low in· most of the tehsils. With a few ex-
. ceptions, the sex ratio is normal ·in all other tehsils but the literacy percentage is poor. In most of the tehsils, very fl'.w females are employed on agriculture as a result of which the proportion of non-workers is very high. The population of children in the age-gro·up 0--4 ranges between 15'% to 19%.
2.249 It would thus be seen that very few of the factors which usually have the effect of raising the density of population of an area exist in the
tehsils forming the conglomeration. Since, however, the State density is very low because of more than 2/~rds of its area having a density of 2 per sq. mile only, the density of these tehsils appears to be higher than that of the State as a whole.
2.250 As stated earlier, tehsiis with a density of 100% more than that of the State include, among others, the two isolated tehsils of Haveli and Rajouri. Both the tehsils are bordered by the Cease-fire Line and have witnessed large scale movement of population during and after the tribal raids of 1947. The number of displaced penons who settled in tehsil Rajouri is estimated at 26,583 or about 22% of the total tehsil population. Similarly, 9,198 persons or 15% of the population of tehsil Haveli consists of persons displaced from other parts of the State.
2.251 This is the main cause for the high density of population of these two tehsils when compared with that of the State as a whole. It must, however, be conceded that the construction of the 153-mile long tarred road, which takes off from Jammu and after passing through Rajouri and Mendhar ends near about the border of Haveli tehsil, has substantially contri-
193
buted to the increase in population. and its consequent high density.
(c) Industrial TehsUs
2.252 Statement II.23 gives the number, population, area and the density of such of the tehsils which contain at least one industrial town and whose density is above 100% than that of th~ State. These consist of two conglomerations, one comprising all the three tehsils of district Anantnag, namely, Anantnag, Kulgam and Pulwama and the other the tehsiIs of Sonawari and Sopore of district Baramulla.
2.253 The terrain of the first conglomeration consists mostly of low-level areas lying in the south of the valley. The region is bounded in the south-east and south-west by the Shiwalik ranges and is contiguous in the north and north-west with the tehsils of Srinagar and Badgam. The mountains' enclosing the region range in height from 8,000 to 10,000' generally though some of the peaks rise even to a height of 14,000-15,000'. The plain areas are over 5,000' above the sea-level and consist of the most fertile lands.
2.254 The soil is mostly alluvial, its important classes being Gurtu (clayey soil), Bahi! (rich loam), Sekil (light loam with sandy sub-soil) and Dazanlad (low lying swamps). An important feature of the region is that one of its Karewas (table land) con~ists of white clay which grows saffron.
2.255 Among the minerals available in the region, mention may be made of Copper, Slate, Bauxite, Gypsum and Limestone.
2.256 The region gets poor rainfall ranging from 565.112 mms. (22.24') to 733.139 mms. (28.86'). As the climate is temperate and evaporation is less, the population is fairly dense. The area, however, receives plenty of water supply for irrigational purposes through natural water courses and snow-fed khuls flowing from the adjoining mountain. Snowfalls are usually heavy in December and January and as the temperature falls during this period below the freezing point, the snow gets frozen in the.

mountains and is stor-ed there till the monsoon season when it melts away and irrigates the fields. In addition, a number of canals have also been built by the State Government for the irrigation of such of the areas where natural facilities are not available.
2.257 The following statement shows the area irrigated in each tehsil by canals, wells, etc. and the percentage of irrigated to the net cultivated area:-
Area irrigated in acres Percentage of
Tehsil Government Private' canals canals
1 2 3 Anantnag 10,629 49,724 Kulgam 8,723 64,349 Pulwama 2,336 64,596
2.258 The crops grown consist of rice, maize, wheat, millet, barley, oil seeds, pulses and saffron.
2.259 Compared to non - industrial tehsils, the size of uncultural fallows in the three tehsils constituting the conglomeration is fairly small. In Anantnag and Kulgam, the proportion of net cultivated area to uncultural fallows does not exceed 1: 0.21 and 1: 0.23 respectively, whereas in Pulwama, which due to the highly fertile character of its soil is known as the Granary of the Valley, the correJponding proportion is only 1: 0.20.
2.260 The net area sown per capita is not on an average as high as in the non-industrial tehsils referred to in a preceding paragraph but the percentages of net area sown to the total area. are, according to the figures of the State Land Revenue Department, fairly high as indicated below:-
Tehsil
Anantnag Kulgam Pulwama
Percentage of net area sown to total area
Net area sown r-----.A__-------, per capita According According (in acres) to village to Survey of
papers India
2 3 4 0.39 57 15 0.50 57 28 0.58 59 38
2.261 The population of the three tehsils is predominantly Muslim and ranges from 95 to
Wells
4 21
40
194
"""'"\ Other irrigated to net sources Total cultivated area
5 6 7 253 60,627 63
73,072 68 66,972 61
97% in the rural sectors of the three tehsils. The community-wise urban populati~n figures are not available for each tehsil but in the district as whole, 91% of the urban population consits of Muslims only.
2.262 Except for a small number of Gujars, the inhabitants of the three tehsils are Kashmiri speaking people.
2.263 Tehsil Kulgam is comparatively more hilly than Anantnag and Pulwama which explains the absence of as many roads as in the other two tehsils. III any case, the road mileage .. _ per 100 sq. miles of. area in Kulgam is only 8.4 as against 19.3 of Anantnag and 16.1 of Pulwama.
2.264 Among the three tehsils, Pulwama has the lowest population but the road mileage per 100,000 population is comparatively high although the aggregate length of its roads is limited to 73 miles as against 51 miles of Kulgam. Anantnag, which has the highest population, has a mileage of 80.0 per 100,000 population, the corresponding averages for Kulgam and Pulwama being 23.8 and 38.2 respectively.
2.265 A comparison of the sex ratios of the three tehsils as reflected by the respective populations in 1941 and 1961 shows that the disparity between the male and female population is declining steadily. This will be clear from the subjoined statement:-
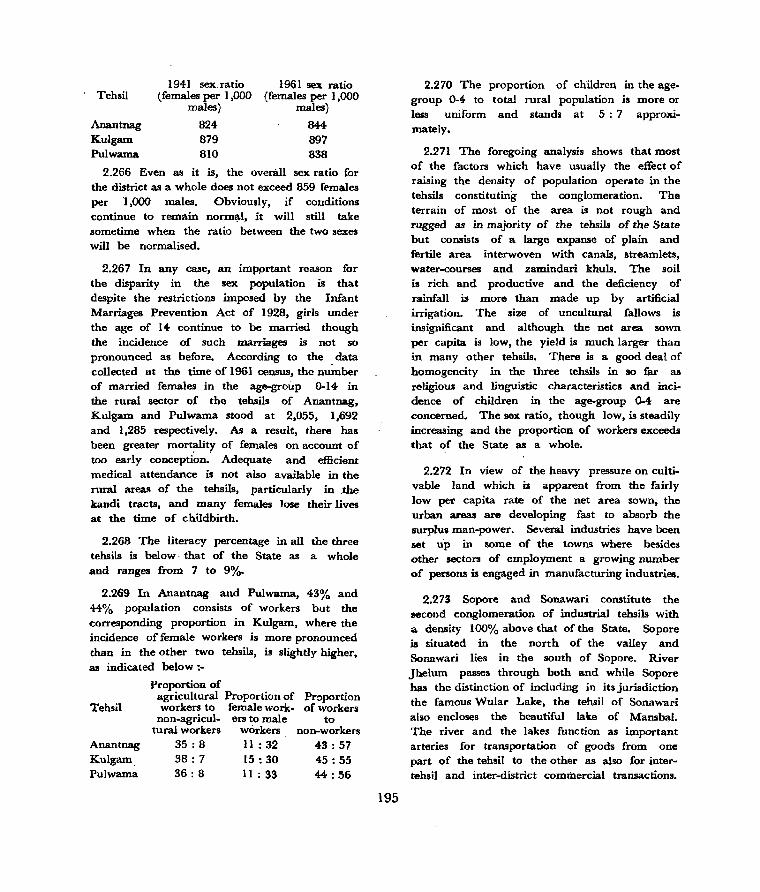
Tehsil
Anantnag Kulgam Pulwama
1941 sex: .. ratio (females per 1,000
males)
824 879 810
1961 !!eX ratio (females per 1,000
males)
844 897 838
2.266 Even as it is, the overall sex: ratio for the dis-trict as a whole does not exceed 859 fe-males per 1,000 males. Obviously, if conditions continue to remain norm~l, it will still take sometime when the ratio between the two sex:es will be normalised.
2.267 In any case, an impprtant reason for the dis-parity in the sex population is- that despite the restrictions imposed by the Infant Marriages Prevention Act of 1928, girls under the age of 14 continue to be married though the incidence of such marriages is- not so pronounced as before. According to the _ data collected at the time of 1961 census, the number of married females in the age-group 0-14 in the rural sector of the tehsils of Anantnag, Kulgam and Pulwama stood at 2,055, 1,692 and 1,285 respectively. As a result, there has been greater mort:uity of females on account of too early conception. Adequate and efficient medical attendance is- not also available in the rural areas of the tehsils, particularly in .the kandi tracts, and many females lose their lives at the time of childbirth.
2.268 The literacy percentage in all the three tehsils is- below· that of the State as a whole and ranges from 7 to 9%.
2.269 In Anantnag and Pulwama, 43% and 44-% population consists of workers but the corresponding proportion in Kulgam, where the incidence of female workers is more pronounced than in the other two tehsils, is slightly higher, as indicated below :-
Proportion of agricultural Proportion of Proportion
Tehsil workers to female work- of workers non-agricul- ersto male to
tural workers workers non-workers Anantnag 35: 8 II : 32 43: 57 Kulgam. 38: 7 15: 30 45: 55 Pulwama 36: 8 11 : 33 44: 56
195
2.270 The proportion of children in the agegroup 0-4 to total rural population is more or less uniform and stands at 5: 7 approximately.
2.271 The foregoing analysis shows that most of the factors which have usually the effect of raising the density of population operate in the tehsils constituting the conglomeration. The terrain of most of the area is not rough and rugged as in majority of the tehsils of the State but consists of a large expanse of plain and fertile area interwoven with canals, streamlets, water-courses and zamindari khuls. The soil is rich and productive and the deficiency of rainfall is- more than made up by artificial irrigatioIL The size of uncultural fallows is insignificant and although the net area sown per capita is low, the yield is much larger than in many other tehsils. There is- a good deal of homogeneity in the three tehsils in so far as religious and linguis-tic characteristics and incidence of children in the age-group 0-4 are concerned. The sex ratio, though low, is- steadily increasing and the proportion of workers exceeds that of the State as a whole.
2.272 In view of the heavy pressure on cultivable land which is apparent from the fairly low per capita rate of the net area sown, the urban areas are developing fast to absorb the surplus man-power. Several industries have been set up in 50me of the towns where besides other sectors of employment a growing number of persons is- engaged in manufacturing industries.
2.273 Sopore and Sonawari constitute the second conglomeration of industrial tehsils with a density 100% above that of the State. Sopore is situated in the north of the valley and Sonawari lies in the south of Sopore. River Jhelum passes through both and while Sopore has the distinction of including in its jurisdiction the famous Wular Lake, the tehsil of Sonawari also encloses the beautiful lake of Mansbal. The river and the lakes function as important arteries for transportation of goods from one part of the tehsil to the other as also for intertehsil and inter-dis-trict commercial transactions.

Heavy and light boats keep on plying between Ganderbal, Sonawari, Sopore and Srinagar. They usually carry heavy loads of fish, watec-nuts which grow in Mansbal and Wular Lakes, limestone extracted from the mines near Mansbal. woodfuel and other commodities.
2.274 Wular lake is bordered in the east by Himalayan ranges which separate tehsil Sopore from Ladakh. The famous Rajdhani peak lies to the north of the lake and partitions the two topographically different zones of the tehsil, namely, the plain and fertile areas in the west of the lake and the predominantly mountainous and unproductive areas of Gurez and Tilel.
2.275 As the flow of river Jhelum below Srinagar has less velocity than in the area in the south of the city, because of the fall of topography being only 55' in the former case as against 165' in the latter, the major pact of Sonawari tehsil consists of a low level alluvium formed by the river during floods. As a result, the level of the river water in this region is generally higher than that of the adjoining fields and when floods appear, the embankments suffer breaches, submerging the fields under water. There wlB hardly any year before 1955 when all the standing crops were not washed away bringing complete distress to the inhabitants and making them dependent on imports from neighbouring places. It is for this reason that the State Government have rebuilt and repaired the bunds, widened and deepened the nallahs and streams, and drained off the rain and flood water from all the areas situated in the close neighbourhood of the river. Sonawari now wears a changed complexion and is not only self-sufficient in food but disposes of a substantial quantity of its surplus produce to the city.
2.276 Besides limestone, several other minerals, such as gypsum and peat, are also available at various places in Sonawari tehsil. Gypsum is extracted from the lime mountain Ahaktang which overlooks the Mansbal lake. Peat is . obtained from the low lying ground on either side of river Jhelum below Srinagar. It is cut
196
in dry weather and stacked for being used as an extra fuel. Lime is also obtained from the hills of Ajas town which is situated on the eastern bank of Wular lake. The town is also famous for "Devri" stone which is extracted from the large quarry of the adjoining hill and is exported to other parts of the tehsil after being chiselled by the local artisans.
2.277 There is no rain-gauge at Sonawari but Sopore falls in the "Moderate Rainfall Division. "
2.278 The principal sources of irrigation are the Government and private canals in both the tehsils. In a few parts of Sonawari tehsil, where . canals have not as yet been built, wells and zamindari khuls are also used to irrigate the lands. Nevertheless, there are still large cultivable areas in the tehsil which have. not so far been provided with irrigational facilities. It is, therefore, that while 56% of the :net cultivated area in tehsil Sopore consists of irrigated land, the corresponding proportion in Sonawari is only 36%.
2.279 The crops growl\ consist of rice, maize, wheat, barley, oilseeds and pulses etc.
2.280 The size of uncultural fallows is. proportI0nately much larger in Sonawari than in Sopore. As already stated, .this is because the process of .ecIamatioll of lands in Sonawari is still in progress. In tehsil Sopore, the proportion of net cultivated area to uncultural fallows does not exceed 100: 15 whereas in Sonawari the corresponding p'fOportion stands at 100 : 32.
2.281 Even as it is, the net cultivated area per capita in Sonawari stands at '0.59 acres as against only 0.50 of Sopore. The disparity is due to larger population and proportionately lesser net area sown when compared with Sonawari. At any rate, these averages compare favourably with similar averages of most other tehsils of the valley.
2.282 Like the tehsils of district Anantnag, Sopore and Sonawari also possess homogeneous religious and linguistic characteristics. Both have
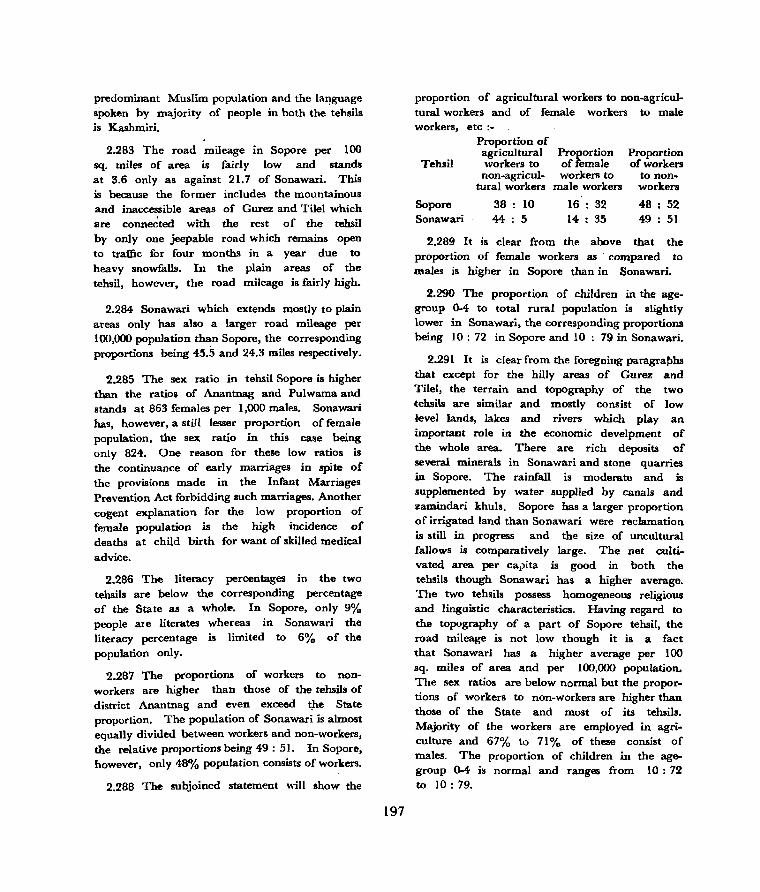
predominant Muslim population and the language sPoken by majority of people in both the tehsils is Kashmiri.
2.283 The road mileage in Sopore per 100 sq. miles of area is fairly low and stands at 3.6 only as against 21.7 of Sonawari. This is because the fo rmer includes the mountainous and inaccessible areas of Gurez and Tilel which are conne~ted with the rest of the tehsil by only one jeepable road which remains open to traffic for four months in a year due to heavy snowfalls. In the plain areas of the tehsil, however, the road mileage is fairly high.
2.284 Sonawari which extends mostly to plain areas only has also a larger road mileage per 100,000 population than Sopore, the corresponding proportions being 45.5 and 24.3 miles respectively.
2.285 The sex ratio in tehsil Sopore is higher than the ratios of Anantnag and Pulwama and stands at 863 females per 1,000 males. Sonawari has, however, a still lesser proportion of female population, the sex ratio in this case being only 824. One reason for these low ratios is the continuance of early marriages in spite of the provisions made in the Infant Marriages Prevention Act forbidding such marriages. Another cogent explanation for the low proportion of female population is the high incidence of deaths at child birth for want of skilled medical
advice.
2.286 The literacy percentages in the two tehsils are below the corresponding percentage of the State as a wholeo. In Sopore, only 9% people ate literates whereas in Sonawari the literacy percentage is limited to 6% of the population only.
2.287 The proportions of workers to nonworkers are higher than those of the tehsils of district Anantnag and even exceed t_he State proportion. The population of Sonawari is almost equally divided between workers and non-workers, the relative proportions being 49 : 51. In Sopore, however, only 48% population consists of workers.
2.288 The subjoined statement will show the
197
proportion of agricultural workers to non-agricultural workers and of female workers to male workers,
Tehsil
Sopore Sonawari
etc :-Proportion of agricultural workers to
non-agricul-tural workers
38 : 10 44 : 5
Proportion of female workers to
male workers
16 32 14 35
Proportion of workers
to nonworkers
48 52 49 : 51
2.289 It is clear from the above that the proportion of female workers as . compared to males is higher in Sopore than in Sonawari.
2.290 The proportion of children in the agegroup 0-4 to total rural population is slightly lower in Sonawari, the corresponding proportions being 10: 72 in Sopore and IO : 79 in Sonawari.
2.291 It is clear from the foregoing paragrafJhs that except for the hilly areas of Gurez And Tilel, the terrain and topography of the two tehsib are similar and mostly consist of low level lands, lakes and rivers which play an important role in the economic develpment of the whole area. There are rich deposits of several minerals in Sonawari and stone quarries in Sopore. The rainfall is moderate and is supplemented by water supplied by canals and zamindari khuls. Sopore has a larger proportion of irrigated land than Sonawari were reclamation is still in progress and the size of uncultural fallows is comparatively large. The net cultivated area per catlita is good in both the tehsils though Sonawari has a higher average. The two tehsils possess homogeneous religious and linguistic characteristics. Having regard to the topography of a part of Sopore tehsil, the road mileage is not low though it is a fact that Sonawari has a higher average per 100 sq. miles of area and per 100,000 population. The sex ratios are below normal but the proportions of workers to non-workers are higher than those of the State and most of its tehsils. Majority of the workers are employed in agriculture and 67% to 71 % of these consist of males. The proportion of children in the agegroup ().4 is normal and ranges from 10: 72 to 10: 79.

2.292 Let us now e~amine certain other characteristics of each of the two conglomerations, such as electricity supply, proportion of rural/urban population and proporlion of workers according to. their industrial classification.
2.293 The following statement shows electricity supply per 100,000 population in each of the three tehsilf forming the first conglomeration:-
Average Average electric
Tehsil electric Population supply per supply per 100,000
hour population
Anantnag 400 kws. 249,882 160 kws. Kulgam 200 kws. 213,298 94 kws.
Pulwama 400 kws. 191,188 209 kws.
The statement shows that in the region as a • whole, the average quantity of electricity consumed by a. lakh population does not exceed 154 kws. It ~i\ilso clear that very few areas of tehsil Kulgl'tm have been electrified and that the consumption per 100,000 population in the tehsil is fairly small when compared with Anantnag and Pulwama. This,_as already stated, is due to the geographical location of the tehsil and the difficult topography of some of its areas.
2.294 At any rate, electricity supply per 100,000 population in the individual tebsits and in the conglomeration a~ a whol~ is by far less than the· State average which stands at 365 kws. This is bacause of the high consumption in the cities of Srinagar and Jammu. According to the infor1llation made available by the Electric Department, tehsil Srinagar consumes over 8,900 kws. per hour giving an average of 2;265 kws. per 100,000 population.
2.295 The subjoined statement shows that the consumption of electricity in the two tehsils forming the second conglomeration is comparatively high. This is because the tehsils are situated very near to the Generating Stations of Mohra and Ganderbal and it has consequently been possible to electrify large portions of their respective rural areas. T?e average for the two tehsils put together, however, stands at 204 kws. per 100,000 population only as indicated below :-
198
Average Average electric
. electric supply per Tehsil supply per Populatioh 100,000
hour population
Sopore 300 kws. 149,911 200 kws. Sonawari 150 kws. 72,568 207 kws.
2.296 In so far as the proportion, of rural! urban population is concerned,· Anantnag has a much higher percentage of·. unban population than the other two tehsils. This is partly due to the number of towns in Anantrtag·· being larger and partly because the town of Anantnag. is the third biggest urban area in the State with a population of 21,087. On the other hand, the P9pulation of every other . town in the three tehsils ranges from 1,920 to 6,394 only. It is, therefore, that the urban' areas of Pulwama and Kulgam do not claim.·more than 3% and 5% of the tebsil populatiOh~ whereas in Anantnag, the corresponding proportion is 12%. In the State as a whole, .the proportion of rural/urban population is very high and stands at 83 to 17.
2.297 In the case of Sopore and Sonawari tehsils, these proport:ons are nearly the same as that of the State being 85 : 15 and- ar: . 19
respectively.
2.298 In so "far as the incidence of workers and non-workers is concerned, each of the tehsils in the two conglomerations except Anantnag claim higher proportions of workers as against non-w~rkers than that of the State as a whole. In Anantnag, the proportion of workers is the same as for the entire State, viz., 43% of the total population.
2.299 According to the functional classification of towns adopted for the Census of 1961 every urban area, in which the proportion of aggregate number of workers . of categories III, IV, V and VI to the total number in categories III to· IX is higher than the corresponding proportion of workers in categories VII and VIII put together and also when compared with workers of category IX, is to be categorised as an industrial town. In other words,
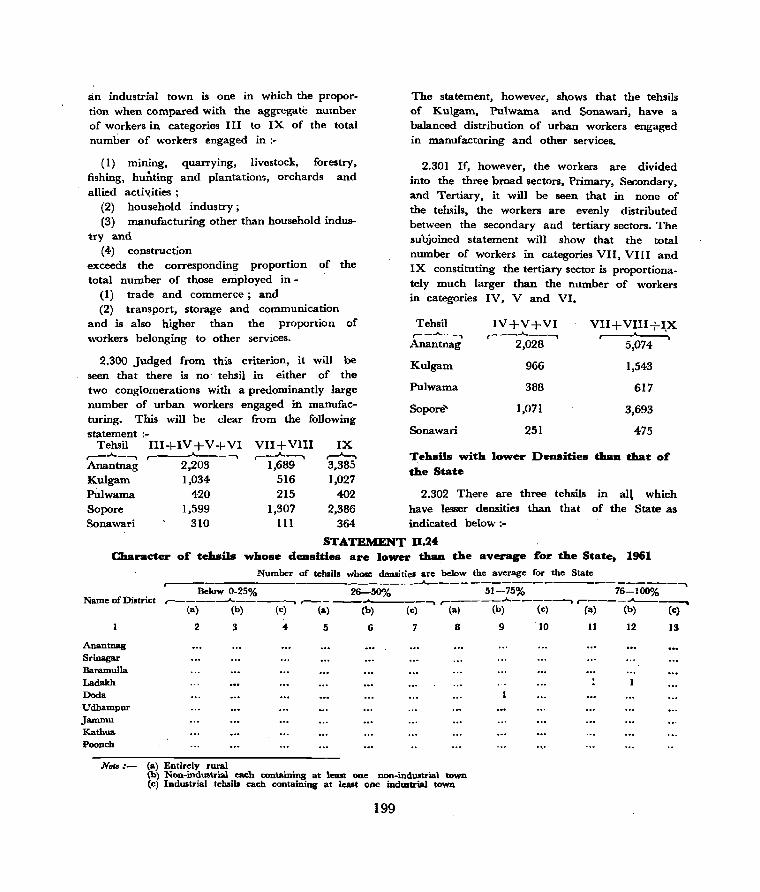
an industrial town is one in which the proportion when compared with the aggregate number of workers in categories III to IX of the total number of workers engaged in:-
(I) mmmg, fishing, hunting allied acth:ities;
quarrying, livestock, forestry, and plantations, orchards and
(2) household industry; (3) manufacturing other than household indus-
try and (4) construction
exceeds the corresponding proportion of the total number of those employed in-
(I) trade and commerce; and (2) transport, storage and communication
and is also higher than the proportion of workers belonging to other services.
2.300 Judged from this criterion, it will be seen that there is no tehsil in either of the two conglomerations with a predominantly large number of urban workers engaged in manufacturing. This will be clear from the following statement :-
Tehsil III+IV + V + VI r-_J.--.--.. ,-___ ..A--__ --.
Anantnag 2,203 Kulgam 1,034
VII+VIII ,--_-A.._...,
IX ,...-A-_, 3,385 1,027
The statement, however, shows that the tehsils of Kulgam, Pulwama and Sonawari, have a balanced distribution of urban workers engaged in manufacturing and other services.
2.301 If, however, the workers are divided into the three broad sectors, Primary, Secondary, and Tertiary, it will be seen that in none of the tehsils, the workers are evenly distributed between the secondary and tertiary sectors. The subjoined statement will show that the total nwnber of workers in categories VII, VIII and IX constituting the tertiary sector is proportiona. tely much larger than the number of workers in categories IV, V and VI.
Tehsil IV+V+VI VII + VIII + l_X ,-_..A..._-""" r--___,._----"'\ Anantnag 2,028 5,074
Kulgam 966 1,543
Pulwama 388 617
Sopore' 1,071 3,693
Sonawari 251 475
Tehsils with lower Densities than that of the State
Pidwama 420
1,689 516 215
1,307 111
402 2.302 There are three tehsils in all which Sopore Sonawari
1,599 310
2,386 have lesser densities than that of the State as 364 indicated below:-
STATEMENT B.24 Character of tehsils whose dellsides are lower than the average for the State, 1961
Numlxr of tehsils. whose densitieS are below the average for the State ,-_____________________ ..A. _______________________ ~
Name of District Below 0-25% 2~()oA. 51-75% 76-100%
~_-__ ..A.-----__"" r-- - ....... ,-_____ .A. ____ -----. r------"-----.... (a) (b) (c) (a) (b) (c) (a) (b) (c) (a) (b) (c)
Anantnag Srinagar Baramulla Ladakh Dada Udhampur Jammu Kathua Poonch
2 5 6 7 8
NottJ:- (a) Entirely rural (b) Non-indUlltrial eaeh containing at least one non-industrial town (c) Industrial tehsib each containing at least one industrial town
199
9 10 11 12 13
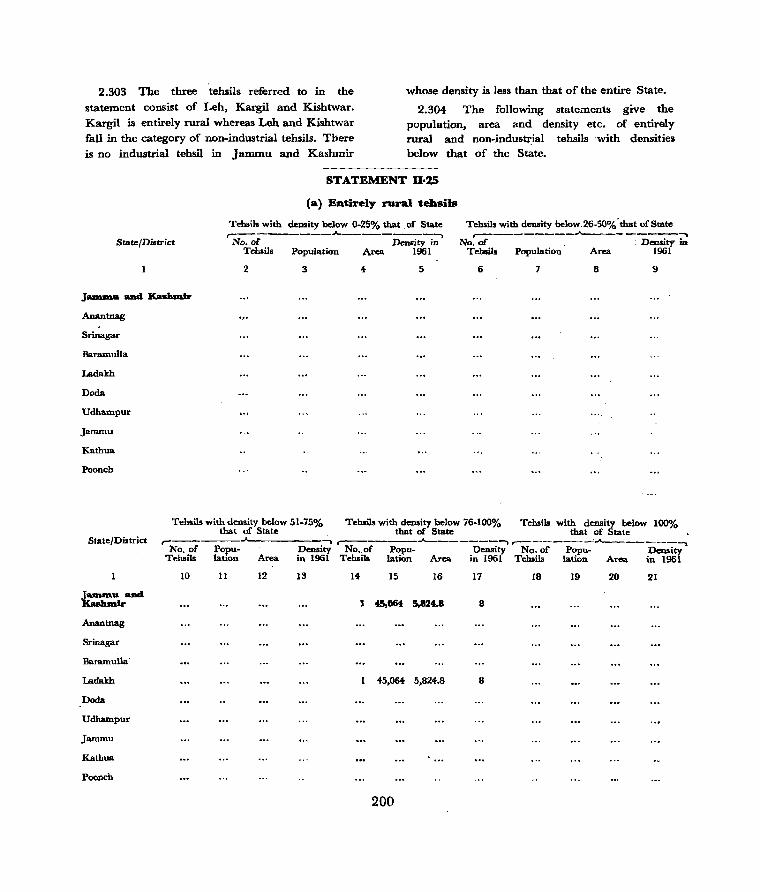
2.303 The three tehsils referred to in the
statement consist of Leh, Kargil and Kishtwar. Kargil is entirely rural whereas Leh and Kishtwar fall in the category of non-industrial tehsils. There is no industrial tehsil in Jammu and Kashmir
whose density is less than that of the entire State.
2.304 The following statements give the population, area and density etc. of entirely rural and non-indus-Q:ial tehsils with densities below that of the State.
STATEMENT U-25
(a) Entirely rural tehsils
Tehsil. with density below 0-25% that . of State Teh.il. with density below 26-50%-that of State ,---------"""-----------,
,-________ ..A--. _________ -,
State/District No. of Density in Tehsils Population Area 1961
No. of . Density in Tehsils Population Area 1961
2 3 5 6 7 8 9
Jammu aad Kaslunlr
Anantnag
Srinagar
Baramulla
Ladakh
Doda
Udhampur
Jammu
Kathua
Paonch
State !District
J ......... ua .... KasJualr
Anantnag
Srillagar
Baramulla·
Ladakh
Doda
Udhampur
Jammu
Kathua
Poonch
Tehsil. with density below 51-75% that of State
Tellsil. with denaity below 76-100% that of State
Tebsils with density below 100% that of State r-------.A--------. r--------J....--------. ,..-______ _..:...A.. _______ --.
No. of Popu- Density No. of Popu- Density No. of Popu- Density Tehsils lation Area in 1961 Tebsils lation Area in 1961 Tehsils lation Area in 1961
10 11 12 13 14 15 16 17 18 19 20 21
1 45,064 5,824.8 8
45,064 5,824.8 8
200

STATEMENT D.26
(b) Non-industrial tehsUs each CODtainiDg at least one uo_industrial town
Tehsils with density below 0-25% that of State
Tehsils with density below 26-50% that of State
State/District r----------.A.----------, No. of Tehsils
. Population Density in
1961
,-____________ .A-______ ~
No. of Density in Teh.ils Population Area 1961 Area
2 3 5 6 7 8 9
JIUlllDU ami KasluDir
Anantnag
Srinagar
:Earamulla
Ladakh
Dada
Udhampur
Jammu
Kathua
Poonch
State/Dist~ict
J...._.. aud Kaslunir
Anantnag
Srinagar
Baramulla
Ladakh
Doda
Udhampur
Jammu
Kathua
Poanch
Tehsils with density below 51-75% that of State
T"hsils with density bel.;w 76-1000", that of State
Tehsils with density below 100% that of State
,-_______ ..A.. _______ -.. , ______ -....A... ______ ---'\ r----------"'---------. No. of Popu- Density No. of Popu- Density No. of Popu- Density Tehan. lation Area in 1961 Tehsil. lation Area in 1961 Tehsils lation Area in 1961
10 11 12 1,3 14 15 16 17 18 19 20 21
1 74,594 3,016.9 25 1 43,587 31,929.0 1
43,587 31,929.0
74,594 3,016.9 25
(a) Eu.tirely Rural Tehsils quently split up by the Cease-fire Line and while as
a result its population shrunk by about 15% only,
the loss of area was proportionately higher and
stood at 21%. This i, why the 1961 density of the
tehsil stands at 8 as against only 7 of 1941.
2.305 Before 1947. tehsil Kargil extended to an area of 7,392 square miles which was inhabited by 52,853 persons, giving a density of 7 per square mile. The tehsil was subse-,
201

2.306 Like other parts of district Ladakh, the tehsil is entirely mountainous and except for small cultivable patches of land here and there, the few plain areas, wherever visible, are mOlltly sanety and unsuitable for cultivation. Facilities for irrigation of lands are extremely limited and food crops are mostly jmported from the valley. Further, except for one or two household industries, there are no factories or workshops worth the name anywhere in the tehsil.
(b) Noa-iaduBtrial Tehsils
2.307 The area of Leh tehsil should have been even larger than that returned at the 1961 census, if a part of its territory had not fallen under Chinese occupation. Since, however, in this case the consequent loss of population has been very small and because the jurisdiction of the tehsil extends to a very huge area, there has been no change in the density·of population which continues at 1 per sq. mile as in 1941. The tehsil abounds in series of Himalayan ranges which rise to great heights at almost aU places. All the mountains are nude and barren and the rainfall -is extremely poor. There are no industries except one or two rural crafts, such as, weaving of woollen cloth in handloom, manufacture of other footwear. spinning. of wool by charkha and manufacture of agricultural implements etc.
2.308 Tehsil Kishtwar lies to the south-west of Kargil and its north-easte.rn sector has, therefore. the same topography a~ any other part of Ladakh. The means of communication are extremely difficult and the population is sparsely scattered over large areas. The western and southern sectors of the tehsil which border the tehsils of Anantnag, Doda. and Bhaderwah, how ever, contain, proportionately larger cultivable areas. This part of the tehsil has many good for-ests which are being exploited by the State Government and provide employment to many people. Here again, however, the incidence of ·literacy is very low and the only manufacturing activity consists of handloom weaving etc.
COlDpariSOD of 'the Density of Eatirely Rural, Noa-iaduatrial aild IDduBtnal TehaUB with the Average Deasity of 'their respeetive Districts
2~309 Let us now compare the density of entirely rural, non-industrial and industrial tehsils with the average density of their respective dis~rict~. This will show that. there is not much disparity in the number of tehsils which have higher and lower densities than that of the district in which each tehsil is situated. The following statement shows the distribution of these tehsils according as they are entirely rural, non-industrial or industrial by character:-
STATEMENT D.27
Character of tehsils whose deasities are above or below that of the district cODceraed
Tehsils whose densities are above the average for the district concerned
Tehsi1s whOlle demities are below the average for the district cODcemed
Character of ,--------------..... -------------. r----------....__----~~-___. tehsil above 100%
that of the district 76-100% 51-75% 26-50% Upto 25% 76-100% 51-75% 26-50% 0-25%
Concerned
2 3 4 5 6 7. 8 9 10
Entirley Rural KargU Handwara Mendhar Ganderbal Karnah
Non-industrial Srinagar Baramulla Ranbirsingh- Udhampur Haveli KiJhtwar Uri Badgam
Leh Ramnagar porI.
Kathua Rajouri Ramban Bhaderwah Jammu Doda Hiranagar Samba Rcui
Akluaoor Bashohli Nowmehra
Ind.uuial Sonawari Pulwama Kulcam Ananlnag
202

LLJ ~
> w f-
Oal « 0 .0 0
l-(/) c.
0
0:: +J
0 -~
:J 0-0
:c 0-
(f)
« w ::s:::
'-0
Vl ~
O~ ..... 0 Vl
z C. 0)
« -0
.c. .... 3
u.
o~
~ 0-
+J U
L. .... Vl
a ~
.L::. ..... '-0
...... 0
..c ...... 3 0
C» .0
L... o
H
I .~.
.J II
I
.~
z ,,M
I
--, ,. --..
;, i ...... ~
z .,~
A 8
~ i
.. ,. Go. ~ ... .. I .. ..,
'" II) " '"
;~ W
0 ", ....
:: .. ... .... ~ ... I , ..
'" .,..
N
c
... ... '"
W
N °ot
, r ,
~ 0 c UJ
u :: ::: .. >-W .... > ex: :J I/)
I-0
00
z I .Ii w
Z O~

(a) Eath-ely Rural Tehsils
2.310 Except Kargil, all entirely rural tehsils whose density exceeds or is below that of the district concerned get moderate rainfall ranging from 45.75" (1,162.050 roms). to 67.68· (1,719.227 mms). KargiI, which gets a rainfall ·of 25.17' (639.361 mms). only, falls in what is known as Poor Rainfall Division.
2.311 Maize. rice and wheat are the principal crops grown in two of the three tehsils with densities higher than that of the district, namely, Handwara and Mendhar, while in Kargil, grim, wheat and barley constitute the important crops. The difference in the crop pattern is obviously due to the unfertile character of the soil and the deficiency of rainfall in Kargil.
2.312 IrrigationaI facilities vary in the tehsils according to the quantity of annual rainfall. In Mendhar, which gets the highest rainfall among all the rural tehsils, only 10% of the net cultivated area is irrigated. Most of the cultivated lands in the tehsil are situated on hill slopes where maize crop flourishes without any assistance of art.ficial irri~ation. On the other hand, the deficiency of rainfall in Kargil is met by zamindari khuls and private canals which· irrigate 80% of the net cultivated area of the tehsil. Handwara gets moderate rainfall and this is supplemented by Government and private -canals ~hich together irrigate 55% of the net area under cultivation. This is also true of the tehsils of Ganderbal and Karnah in which 65% and 36% cultivated land is provided with irriga tional facilities.
2.313 Kargil has a road density of only 1.8 miles per 100 sq. miles of area and 233.0 miles per 100,000 population as against the corresponding proportions of 0.8 miles and 354.2 miles respectively of the district as a whole. The reason is obvious. District Ladakh consists of two tehsils only, namely, Leh and Kargil, of which the former extends to over five times the area occupied by the latter, even though the disparity between their respective populations is very small.
203
2.314 The road mileage per 100 sq. miles of area and per 100,000 population in ,Handwara which, like Kargil, has higher density than that of the district concerned stand at 15.3 and 50.7 respectively. The corresponding densities for district Baramulla as a whole do not exceed 12.0 per 100 sq. miles of area and ·50.3 per 100,000 of population.
2.315 Karnah, like Kargil, is mostly moun. tainous and very sparsely populated though not to the same extent. It has the smalleSt popUlation and ranks next to last in respect of the size of area among all the tehsils of the State which explains its relatively high road mileage of 24.2 per 100 sq. miles of area and 205.3 miles per one lakh of population. The rainfall is moderate and is supplem~nted by artificial canals built by the cultivators. As, however, the soil is mostly rocky and unsuitable for cultivation, only ·a limited area can be '~rrigated. The principal crops grown consist of maize, rice and. wheat but the yield rate is generally poor.
2.316 Handwara is ])artly hilly and partly plain and is inhabited by over 10 times the popUlation of Kamah, while it is less than four times larger in size than the area falling within the jurisdiction of Karnah tehsil. It is, therefore, that road mileage per lOa sq. miles in Handwara is only 13.3 as against 24.2 of Karnah. Similarly, the disparity between the mileage per lakh population, which stands at 50.7 in the case of Handwara and 205,3 so far as Karnah is concerned, is due to the proportionately much larger population inhabiting Handwara tehsil. This also explains the reason for the variation in the road mileage per 100 sq. miles of area and per lakh of population between Handwara and Baramulla district which is inhabired by over three times the population of tehsil Handwara although pcoportionately'· its area is much larger than that occupied by Handwara tehsil.
2.317 Tehsil Mendhar has more or less the same topography as Karnah but as it gets enough rainfall by which proportionately larger
areas are brought under cultivation, it has a population about five times greater than that of Karnah although the area of former is only about 21 times more than that of the latter. Again, the disparity between the road mileage per 100 sq. miles of Mendhar and district Poonch which stand at 8.0 and 1l.2 respectively is explained by the topographical difference. The district extends both to plain and hilly areas and has, therefore, been provided with a larger number of roads than tehsil Mendhar which is predominantly mountainous. For the same reason, the road mileage per 100,000 population in the tehsil does not exceed 33.9 against over 205 miles of tehsil Karnah and 58.0 of district Poonch as a whole.
2.318 Ganderbal also falls in the Moderate Rainfall Division. Except for s~ll valleys and a part of its south-western sector, the tehsil extends mostly to mountainous areas and stretches to the foot of the famous Zojilla pass. The major part of the cultivated area is irrigated by Government and private canals which together
with the. annual rainfall irrigate 65% o~ the net cultivated area. In this-- case also, the principal crops consist of rice, maize and wheat. The tehsil being II)ostly covered by hills and mountains, the road mileage per 100 sq. miles of area is 12.2 only. Since, however, it is situated on the National Highway connecting Srinagar with Ladakh, the mileage per 100,000 of population is proportionately large when compared with its size and population and stands at 86.0.
~.
2.319 District Srinagar in which tehsil Ganderbal is situated has a total area of 1,205.1 sq. miles and is inhabited by 640,411 persollll. Tehsil Ganderbal extends to 561. I sq. miles or about ! area of the district with a popUlation equal to about 1f8th of that of the district as a whole. It is, therefore, only natural that it should have a lesser road mileage per 100 sq. miles of area and a higher mileage per lakh of population when compared with the district.
(b) Non-industrial Tehsil.
2.320 The non-industrial tehsils whose densities
204
exceed the density of the· concerned district fall into the following two categories according to the' quantity of rainfali they receive on an average during a year:- .
(a) t~sils whO!!e density exceeds that of the district by 100%
(b) other tehsils.
. Tehsils of the first category do not get adequate rainfall and belong to what. is known as Poor Rainfall Division. Those mentioned at (b) above receive moderate or nearly moderate rainfall, ranging from 904.006 mms to 1,854.668 IIll"QS
(35.59" to 73.01*).
2.321 Among the tehsils of category (a), 73% of the net cultivated area in Srinagar is irrigated by Government and Private canals, wells etc. In striking contrast with this, only' 1 I % and 17% cultivated area is irrigated in the . tehsils of Ramban and Dada respectively. The~ disparity is due to the fact that Srinagar eXtends mostly to plain and fertile areas while Ramban -and Dada are cradled in mountains where. due to topographic difficulties, the rain "vater cannot be used for irrigational purposes and the construction of canals and khuls is not also feasible.
2.322 Baramulla and Bhaderwah get more rainfall than the three tehsils referred to in the previous paragraphs. Here again, the disparity in the proportions of irrigated areas is conspicuous. In BaraIl1ulla, which extends mostly to plain areas, 46% cultivated land is irrigated as against only 12% of Bhaderwah. This is, however, set off to a large extent by grea ter quantity of rainfall which Bhaderw.J.h receives on an average during the year.
2.323 Among the remammg seven tehsil!, Ranbirsinghpora is the only tehsil, which is on the border line, between the Poor and Moderate Rainfall Divisions. In the remaining six tehsil!, the annual rainfall varies. from 1,056 mms of Hiranagar to 1,855 mms of Udhampur. The deficiency of rainfall in Ranbirsinghpora is more than met by artificial irrigation which claims 71 % of the total cultivated area. In Jammu and Kathua, irrigational facilities have

:been made available to the extent of 40% and 43% of net cultivated area. There are very few canals and other sources of irrigation in the other tehsils with the result that the irrigated area does not exceed 16% of the net cultivated area.
2.324. There is no non-industrial tehsil in the State 'having a density below 76% of the corresponding density of the district. Further, Kishtwar is the only tehsil with a density 51 to 75% bel()w the average for the district of Doda. The rainfall of the tehsil is nearly moderate and this is supplemented by artific~l irrigation which feeds 21% of the net cultivated area.
·2.325 Of the remaining nine non-industrial tehsils, six have densities 26-50% and the remaining three 25% or less below the densities of their respective districts.' Among the former, Leh is the only tehsil which falls. in what is known as Desert and Semi-desert Rainfall Division, the average annual rainfall being about 140 mins only. All other tehsils get moderate rainfall which is supplemented in varying proportions, not exceeding 44% of the net cultivated area, by artificial irrigation.
2.326 The other three tehsi1s, namely, Badgam, Ramnagar and Reasi, fall in three different rainfall Divisions. Badgam gets poor and Reasi almost good rainfall on an average. Ramnagar is the only tehsil .in the State which falls in Good Rainfall Division and receives 2,124 mms a year. In Badgam, the deficiency is met by a net-work of artificial canals and zamindari khuls which irrigate 76% of the net cultivated area. The corresponding proportions for Ramnagar and Reasi stand at 12% and 10% respectively.
2.327 Rice is the most largely cultivated crop in tehsil Srinagar. Maize occupies the next largest area and wheat ranks third. Due to difficulties of irrigation, maize is the principal crop both in Ramban and Doda. The other important crop!! in Ramban consist of rice, wheat and barley. The order of importance in Doda is, however, barley, wheat and rice.
205
2.328 As may be expected, the varittion in the cropping pattern between the plain and fertile areas of tehsil Srinagar on the one hand and the mountainous areas of Ramban and Doda on the other, is also discernible in the crops of Baramulla and Bhaderwah. In Baramulla, rice is the principal crop and maize, wheat and barley rank second, third and fourth according to the size of area cultivated. On the other hand, the most important crop of Bhaderwah is maize. Wheat ranks next and rice and barley come thereafter.
2.329 Tehsil Ranbirsinghpora is the richest rice growing area in Jammu Province. This, as we have already seen, is because the rainfall, if not quite, adequate, is not scanty and is augmented by artificial canals which feed about 71 % of the total cultivated area. The next largest area in this tehsil is used for wheat cultivation. Maize ranks third and barley comes thereafter. In Jammu and Hiranagar, wheat is the most largely cultivated crop and rice claims the next biggest . cultivated area. The other crops consist of bajra and maize.
2.330 Maize and wheat are the most predominant crops in Udhampur and Kathua respectively. Rice occupies the next largest cultivated area in Kathua and maize and barley rank thereafter. In Udhampur, however, wheat, rice and barley claim the second, third and fourth position respectively.
2.331 Haveli and Rajouri have more or less the same cropping pattern, maize being the most important crop in both the tehsils. The other crops consist of wheat, rice and barley.
2.332 Among the non-industrial tehsils having density below that of the concerned district, Badgam is the only tehsil in which rice crop occupies the largest proportion of cultivated area. This, as already stated, is due both to the highly fertile character of the soil and plain topography of the tehsil which facilitates artificial inigation. The proportion of such areas is comparatively small in the other tehsils having lower density compared to that of the
district. Except fQr Leh, where no rice or maize is grown, the most predominant crop in other tehsils is either maize or wheat. In tehsils Ramnagar, Reasi, Uri and Kishtwar, which get moderate and even good rainfall, maize easily flourishes in the lower slopes of hills and plain areas. In Samba, Akhnoor, Bashohli and Nowshehra where, besides rainfall being moderate, most of the area consists of low level and plain tracts, wheat receives first priority and occupies the largest cultivated area. Bajra is the next important crop in Samba and Akhnoor and rice ranks third in Samba and fourth in Akhnoor. Maize occupies the least area in Samba but a larger proportion than that of rice in ~khnoor.
2.333 The other crops besides wheat grown in tehsils of Bashohli and Nowshehra consist of rice, badey _and mai~e with the only difference that while maize occupies the second position in Nowshehra, it ranks last in Bashohli.
2.334 The road mileage per 100 sq. miles in the non-industrial tehsils of Srinagar, Ramban and' D~da which have a density 100% above that of their respective districts compares favourably with the corresponding averages of districts Srinagar and Dada in which they are situated. This is because the tehsils occupy proportionately smaller areas when compared with other similar territorial units of their respective districts. The average mileage per 100,000 of population in Srinagar is, however, much less than that of the district. The same cannot be said of Ramban where the corresponding average is higher. The reason is obvious. Tehsil Srinagar claims only 26% of t~e total road mileage in the district although it is inhabited by over 55% of the district popvlation. As against these averages, 45% of the road mileage of district Doda falls within the jurisdiction of Ramban which is inhabited by only 27% of the district population.
2.335 There are only two non-industrial tehsils, Baramulla and Bhaderwah, whose densities are 76-100% above the densities of their respective districts. The former extends to 11%
20.6
of the total area of the district although 27% of the aggregate road length of the district falls in its jurisdiction. The mileage per 100 sq. miles of area in the tehsil is, therefore, more than twice that of the district as a whole. The proportion of tehsil to district population is ~ot, however, as high with the result that the mileage per 100,000 of population in the tehsil is larger" than . that of the district. The position of Bhaderwah is, however, differeRt. The tehsil claims only 12% of road mileage while it is inhabited by 23% population of the district. In this case the averiLge road length per 100,000 of popula.tion is, therefore, much smaller than that for the entire district.
2.336 The average road length per 100 sq. miles of area in Ranbirsinghpora and Jammu which have densities 51-75% above that of. the district in which they are situated is about 50% more than that of the district. The p~oportion of road mileage in Ranbirsinghpora, when compared with that of the district, is almost the same as the proportion of tehsil to district popu[ation. There is, therefore, very little 'disparity between the average road length per 100,000 of population of the tehsil when compared with the corresponding proportion of the district. In the case of tehsil Jammu, however, mileage per 100,000 of population is slightly less than the corresponding average for the district. This is because the tehsil is inhabited by 45% of the district population while only 41% road length of the district falls in its jurisdiction.
2.337 Hiranagar is the third tehsil falling in the same density group as Jammu and Ranbirsinghpora. By size, it is the smallest tehsil in district Kathua extending only to 18% of the district area. The road mileage in the tehsil is proportionately still lower and limited to 12% of the aggregate length of roads in the entire district. The average mileage per 100 sq. miles of area, therefore, stands at 4.9 in case of the tehsil and at· 7.3 so far as the district is concerned.
2.338 The tehsil has, however: a comparatively larger population than what is warranted by
its size. It is inhabited by 27 % of the district population resulting in a larger disparity between the proportions of its population and mileage in relation to those of the district. As should, therefore, be expected, the mileage per 100,000 of population in the tehsil is only 15.9 as against 36.2 of the district as a whole.
2.339" Of the two tehsils of Udhampur and Kathua, which have densities 26-50% above those of their respective districts, Udhampur occupies 23% of the district, area only while it claims 58% of the total road mileage in the district. The mileage per 100 sq. miles of area in the tehsil is, therefore, very high and stands at 16.9 as against 6.7 for the entire district. The disparity in the proportion of mileage per 100,000 population is, however, much lells as the, tehsil is inhabited by 34% of the district population giving a mileage of 77 per lakh of population as against 45.5 only of the entire district.
2.340 Like Hiranagar, Kathua has also proportionately lower road length than what would be due on the basis of its area. The' jurisdiction of the tehsil extends to 22% of the district area while it claims 20% of the road length of the district. It is, therefore, that we find that the mileage per 100 sq. miles of area in the tehsil is 6.6 while for the district as a whole it stands at 7.3. The proportion of road mileage in the tehsil per 100,000 of population does not exceed 23.5 as against 36.2 for the entire' district.
2.341 Haveli and Rajouri, which have densities not exceeding 25% above that of the district, are both situated in district Poonch. The area occupied by each of these tehsils is commensurate with the sizes of their respective populations. Haveli utends to 18% of the district area and is inhabited by 19% of its population. Rajouri, which is double the size of Haveli, occupies 35% of district area inhabited by 37% population in the entire district, In so far. therefore, as the r:>ad mileage per 100 sq. miles of area is concerned, the average for Haveli is twice that of Rajouri, being I 7.5 and 8.2
207
respectively as against 11.2 for the whole dist,rict. The same cannot, however, be said about mileage per 100,000 of population. Rajouri does not claim more than 26% of the road mileage in the district notwithstanding its much larger area and population. The a\'erage mileage per 100,000 of population is only 40.5. against district average of 58.0 and 84.1 of tehsil Haveli.
2.342 Coming now to the tehsils which have lower densities than those of the concerned districts, we find that Kishtwar alone has a density 51 to 75% less' than the density of its p~rent district. The tehsil occupies 69% of the district area but as it is entirely mountainous and the topography is difficult, it does not Cblim more than 23% of the aggregate r03d length of the district. The road mileage per 100 sq. miles of area is, therefore, only 1.2 as against the district average of 3.6. The population inhabiting the tehsil is also incommensurate with its size and does not exceed 28% of the district population., The average mileage per 100,000 of population thus stands at 48.9 only as against 58.7 for the entire district.
2.343 Of the six non-industrial tehsils with densities 26-50% below those of their respective districts, Samba and Akhnoor alone belong to the same district while each of the remaining four tehsils falls in different districts. Uri claims only 11 % of the area of district Baramulla and still smaller proporti.>n of its road length (7%). The population of the tehsil, however, bears the same proportion to the district population . as that of the road mileage. For these reasons, the road mileage per 100 sq. miles of area and per 100,000 of population in the tehsil stand at 7.8 and 49.9 as against the corresponding proportions of 12.0 and 50.3 for the entire district. It may be stated here that the tehsil is mostly hilly and its topography does not permit the construction of many roads.
2.344 Tehsil Leh extends to no', less than 85% area included in district Ladakh. Its road mileage is, however, only 67% of the

tot~l road length in the di.strict. Apart from this, owing to the difficult terrain and the lofty mountains which abound in the district, the road mileage per 100 sq. miles of area is almost insignificant in the· district and stands at 0.8 only. The corresponding average for the tehsil of Leh stands at 0.7.
2.345 In so far, however, as road mileage per 100,000 population is concerned, the average for the tehsil, viz., 479.5, exceeds the corresponding proportion for the district which stands at 354.2. This is because the tehsil is inhabited by 49% of the district population while the corresponding proportion of its road mileage is higher and stands at 67%.
2.346 Samba and Akhnoor have more or less the same road lengths, the respective averages being 19% and 20% of the total mileage in the district. Akhnoor is, however, bigger in size and extends to 34% of the district area as against 26% of Samba. This disparity is also reflected in their respective populations which stand at 19% in the case of Akhnoor and 15% so far as Samba is concerned. Both the tehsils are partly plain and partly hilly which explains the reasons for their limited road mileage. The road mileages per 100 square miles of area therefore stand at 12.1 for Samba and 10.0 for Akhnoor against 16.5 for the whole of Jammu district. As the two tehsils are inhabited by proportionately lesser populations the average per lakh of population in both cases exceeds the corresponding district average. In the case of Samba, this average stands at 49.4 as against 39.8 for the district. Akhnoor has a· mileage of 43.2 per 100,000 of population.
2.347 Bashohli is the biggest tehsil in district Kathua and its area is ] t times the aggregate area of the remaining tehsils of the district. With the construction of Dhar-Udhampur road, the road mileage in the tehsil has swollen up and comprises 68% of the aggregate road mileage in the district. The road mileage per 100 sq. miles of area is, therefore, almost the same as for the entire district, the corresponding ave.·ages being 8.3 and 7.3 respectively.
208
2.348 The size of population, which does not exceed 42% of the district population, is small when compared to the area occupied by the tehsil. It is nevertheless equally smaller than the proportion of road mileage in the district claimed by it. For that reason, the average road mileage per 100,000 of population stands at 58.6 as against only 36.2 for the district.
2.349 Tehsil Nowshehra extends to 24% area of district Poonch but is inhabited by only 15% of its population. The road mileage in the tehsil is, however, proportionately· large and stands at 30% of the total road mileage in the district. Consequently, the road mileage per 100 sq. miles of area in the tehsil stands at 14 as against the corresponding' average of 11.2 for the district. In view, however, of its proportionately small population, the average mileage per 100,000 of population is fairly high and stands at III while .that for the entire district does not exceed 58.
2.350 We now come to the three tehsils with densities ranging from 0-25% below the corresponding density of the district. concerned. Among these, Badgam extends . to 40% of the area occupied by district Srinagar. The . Bi.ze_ of population is comparatively small and is limited only to 32% of the district population. The tehsil has, however, more roads than what would be due on the basis of its population and area, and comprise 46% of the total length of the road mileage in the district. It is, therefore, that the mileage per 100 sq. miles of area in the tehsil is about 24 as against 20.4 of the district. Similarly, the average mileage per 100,000 population is also higher and stands at 54.3 while the corresponding average for the district is 38.3 only.
2.351 In tehsil Ramnagar, the size of population is almost commensurate with the area in its jurisdiction, the corresponding proportions being 28% and 30% of the district population and area respectively. Due to its difficult topography, however, there are very few roads in the tehsil which comprise only 16%
of the total road mileage in the district. The average road length per 100 sq. miles of area is, therefore, limited to 3.6 only as against 6.7 for the district as a whole. For the same reason, the average road mileage per 100,000 of population in the tehsil is only 26.4 while the overall average for the district stands at 45.5.
2.352' Tehsil Reasi is rather sparsely populated when compared with its size. It extends to 47% of the district area but is inhabited only by 37% of its population. The road mileage, due to topographic difficulties, is still less and does not exceed 26% ""of the total road length in the district. In this case also, therefore, the average "road mileage per 100 sq. miles of area and per lakh of popUlation stands at 3.7 and 31.5 respectively
(e) Industrial Tehsil.
2.353 There are only five industrial tehsils in the State. Three of these constitute the district of Anantnag and the other two belong to Baramulla district.
2.354 Of the three tehsils whose densities are above the average for the district concerned, Sonawari has a density 76-100% more than that of district Baramulla in which it is situated. The density of Pulwama is only 26-50% higher than that of its parent district. Kulgam has a density 0-25% above that of district Anantnag.
2.355 Tehsil Sonawari has been a' well. known deficit area all along before 1955, as the slightest rise in the water level of river Jhelum which passes through it used to submerge almost the entire cultivable area 0 f the tehsil. The result was that the crops were washed away and the inhabitants had to depend for food on imports made from other neighbouring areas. The State Government, therefore, decided to concentrate their attention on the development of the area and launched simultaneously a number of sche~es to ameliorate the economic condition of the people. Bunds were raised and repaired to guard against the" illcursion of river-water. Canals were built, lift irrigation
209
pumps were installed, schools and dispensaries were opened and loans for agricultural purposes granted.
2.356 There is no rain-gauge in Sonawari but it is certain that it falls in the Poor Rainfall Division,. Facilities for artificial irrigation have been made available to 36% cultivated area so far.
2.357 Pulwama and Kulgam do not also receive much rainfall but there is a large network of natural streams, canals, khuls and water courses which irrigate 61 % and 68% of net cultivated area in the two tehsils respectively.
2.358 The cropping pattern is the same in all the industrial tehsils including the two having densities below the average of their respective districts. Rice is the most predominant crop, maize and wheat rank second and third and barley comes' last of all.
2.359 Sonawari is one of the smallest tehsils in the State and does not extend to more than 6% of the total area falling within the jurisdiction of Baramulla district. The tehsil is, however, inhabited by 12% of the district population and claims 11 % of the total road mileage in the district. It is, therefore, that the road mileage per 100 sq. miles of area is
21.7 against oE-ly 12.0 of the district as a whole.
2.360 Tehsil Pulwama occupies 22% area of the district and includes 23% of the total road mileage. It is inhabited by 29% of the district population with the result that while the road mileage per 100 sq. miles of area is 16.1 against 15.4 for the district, the mileage per 100,000 of population is less than the corresponding average for the district, being 38.2 and 49.5 respectively.
2.361 Kulgam is a slightly bigger tehsil than pulwama and extends to 29% of the district area. It is inhabited by about 1/3rd population of the district but has not, due to topographical difficulties, been provided with roads in equal proportion. The tehsil includes only 16% of the road mileage in the district and the average

per 100 sq. miles of area does not exceed 8.4 miles. The road mileage per 100.000 of population is also less than the corresponding average for the district and stands at 23.8.
2.362 Sopore has a density of 26-50% below the average density for the district of Baramulla. It gets moderate rainfall. the average per year being about 41' (1,041 mms). About 56% of the net cultivated area is fed by Government and Private Canals. The tehsil extends to 40% of the district area and is inhabited by 25% of its population. Compared to its size and population. it has a poor road mileage which is limited to 12% of the aggregate road length in the district. It is, therefore. that the average road length per 100 sq. miles of area is much less than the average for the
district and mileage per exceed 24.3
stands at 3.6· only. Even the 'road 100,000 of population does not
against 50.3 for the entire district.
2.363 Tehsil Anantnag falls in the Poor Rainfall Division but is equipped with a net· work of Government and Private Canals, water courses, zamindari khuls, wells, etc. which together irrigate 36% of its net cultivated area. The tehsil covers about half the area of the district which is inhabited by only 38% of its population. It has a fairly good number of roads measuring collectively 62% of the total road length in the district. The average rhileage per 100 sq. miles of area and per 100,000 of population therefore stand at 19.3 and 80.0 against the district average of 15.4 and 49.5 respectively.
SECTION 3
DENSITY OF CENSUS HOUSES
De~don 01 Census House
2.364 A census house was defined as a structure or part of a structure inhabited or vacant or. a dwelling, a shop, shop-cumdwelling or a place of business, workshop. school, etc. with separate entrance. Buildings having a number of flats or blocks each with a separate entrance of its own and independent of the other giving on the road or a common staircase or a common courtyard which lead to a main gate were treated as separate Census houses. Additional buildings standing in an enclosed or open compound were also treated as one or more separate Census houses depending upon whetheJ' or not the various parts into which the building was partitioned by walls were independent of each other in respect of accessibility.
210
Definition 01 a Census Household
2.365 A household was defined as a group of persons who commonly live together and would take their meals from a common kitchen unless the exigencies of work prevented any of them from doing so.
Distributioa or Households
2.366 According to the data collected in connection with the Housing Survey of the State, out of every 100 Census houses (occupied and vacant), 10 are vacant, 49 used as dwellings of all kinds and 41 as other occupied houses. The incidence of vacant Census houses is more pronounced in the mountainous regions than in the low level areas as indicated in the following ,statement:-
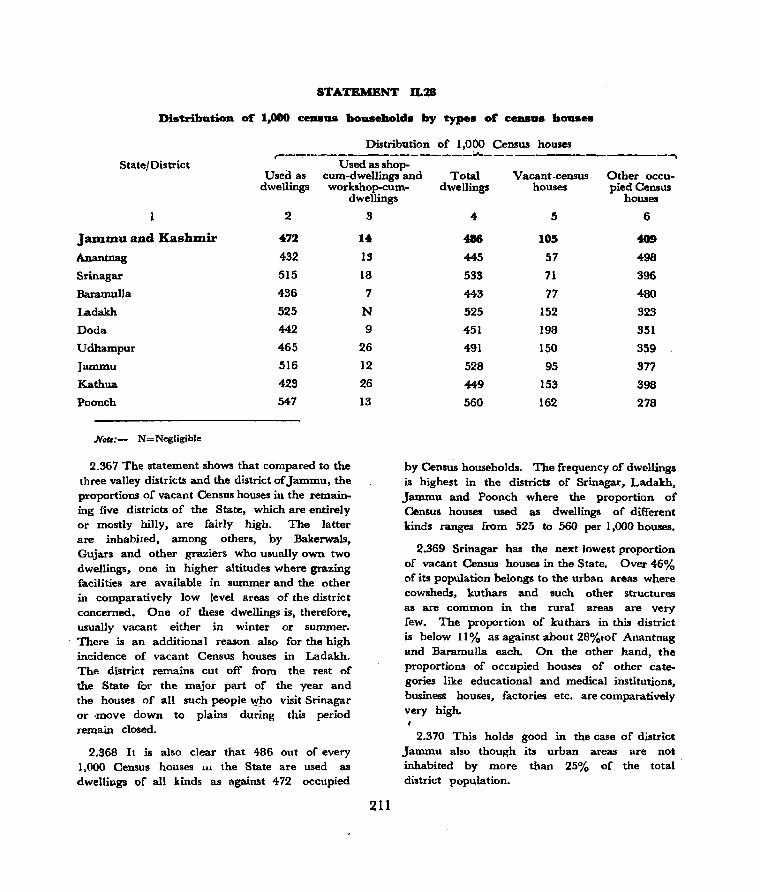
STATEMENT D.2B
Distribution of' 1,000 _aua householda by ty)Ms of' CeDSUS houa_
Distribution of 1,000 Census houses r--~"-.---------------:.A..------------------.
State/District Used as shop-Used as cum-dwellings and Total
dwellings workshop-cum- dwellings Vacant .census
houses Other occupied Census
houses dwellings
2
Jammu and Kashmir 472
Anantnag 432
Srinagar 515
Baramulla 436
Ladakh 525
Doda 442
Udhampur 465
Jammu 516
Kathua 423
Poonch 547
Note:- N=Negligible
2.367 The statement shows that compared to the three valley districts and the district of Jammu, the proportions of vacant Census houses in the remaining five districts of the State, which are entirely or mostly hilly, are fairly high. The latter are inhabited, among others, by Bakerwals, Gujars and other graziers who usually own two dwellings, one in higher altitudes where grazing facilities are available in summer and the other in comparatively low level areas of the district concerned. One of these dwellings is, therefore. usually vacant either in winter or summer. There is an additional reason also for the high incidence of vacant Census houses in Ladakh. The district remains cut off from the rest of the State for the major part of the year and the houses of all such people Who visit Srinagar or ·move down to plains during this period remain closed.
2.368 It is also clear that 486 out of every 1,000 Census houses Hi the State are used as dwellings of all kinds as against 472 occupied
3
14
13
18
7
N 9
26
12
26
1-3
211
5 6
486 105 409
445 57 498
533 71 396
443 77 480
525 152 323
451 198 351
491 150 359
528 95 377
449 153 398
560 162 278
by Census households. The frequency of dwellings is highest in the districts of Srinagar, Ladakh, Jammu and Poonch where the proportion of Census houses used as dwellings of different kinds ranges from 525 to 560 per 1 ,000 houses.
2.369 Srinagar has the next lowest proportion of vacant Census houses in the State. Over 46% of its population belongs to the urban areas where cowsheds, kuthars and such other structures as are common in the rural areas are very few. The proportion of kuthars in this district is below II % as against about 28%.of Anantnag and Baramulla each. On the other hand, the proportions of occupied houses of other categories like educational and medical institutions, business houses, factories etc. are comparatively very high.
2.370 This holds good in the case of district Jammu also though its urban areas are not inhabited by more than 25% of the total district population.
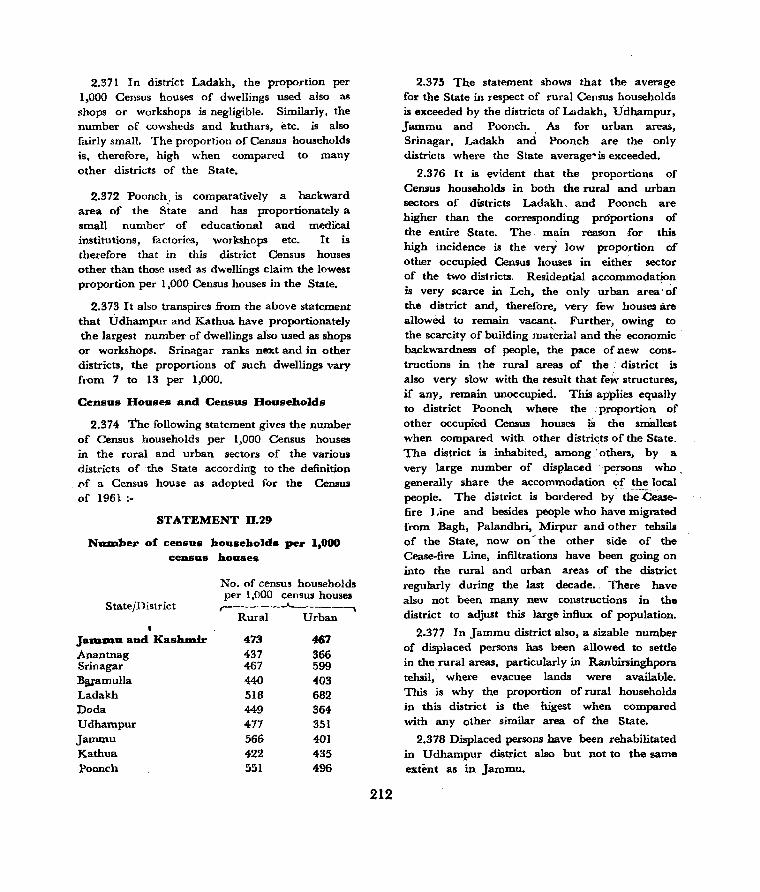
2.371 In district Ladakh, the proportion per 1,000 Census houses of dwellings used also as shops or workshops is negligible. Similarly, the number of cowsheds and kuthars, etc. is also fairly small. The proportion of Census households is, therefore, high when compared to many other districts of the State.
2.372 Poonch. is comparatively a backward area of the State and has proportionately a small number" of educational and mediCal institutions, factories, workshops etc. It is therefore that in this district Census houses other than those Ilsed as dwellings claim the lowest proportion per 1,000 Census houses in the State.
2.373 It also transpires from the above statement that Udhampur and Kathua have proportionately the largest number of dwellings aiso used as shops or workshops. Srinagar ranks next and in other districts, the proportions of such dwellings vary from 7 to 13 per 1,000.
Census Houses and Census Households
2.374 The following statement gives the number of Census households per 1,000 Census houses in the rural and urban sectors of the various districts of the State accordin-g to the definition l'f a Census house as adopted for the Census of 1961:-
STATEMENT 0.29
NUJDber of census households per 1,000 census houses
No. of census households per 1,000 census houses
State/District ,-----.....__----, Rural Urban ,
JaKD.D1l1. and Kashl:nir 473 467 Anantnag 437 366 Srinagar 467 599 BiU"amulla 440 403 Ladakh 518 682 Doda 449 364-Udhampur 477 351 Jammu 566 40] Kathua 422 435 Poonch 551 496
212
2.375 The statement shows that the average for the State in respect of rural Census households is exceeded by the districts of Ltldakh, U'dhampur, Jammu and Poonch. As for urban areas, Srinagar, Ladakh and Poonch are the only distrkts where the State average'is exceeded.
2.376 It is evident that the proportions of Census households in both the rural and urban sectors of districts Ladakh, and Poonch are higher than the corresponding proportions of the entire State. The main reason for this high incidence is. the very low proportion of other occupied Census houses in either sector of the two districts. Residential accommodation is very scarce in Leh, the only urban area' of the district and, therefore, very few houses are allowoo to remain vacant. Further, owing to the scarcity of building material and the econl;)mic backwardness of people, the pace of new constructions in the rural areas of the. district is also very slow with the result that feiN structures, if any> remain unoccupied. This applies equally to district Poonch where the. proportion of other occupied Census houses is the smallest when compared with other districts of the State. The district is inhabited, among.' others, by a very large number of displaced persons who generally share the accommodation ~f the local people. The district is bordered by th~'{:ieasefire Line and besides people who have migrated from Bagh, Palandhri, Mirpur and other teruils of the State, now on - the other side of the Cease-fire Line, infiltrations have been going on into the rural and urban areas of the district regularly during the last decade.. There have also not been many new constructlons in the district to adjust this large influx of population.
2.377 In Jammu district also, a sizable number of displaced persons has been allowed to settle in therural areas, particularly in Ranbirsinghpora teruil, where evacuee lands were available. This is why the proportion of rural households in this district is the higest when compared with any other similar area of the State.
2.378 Displaced persons have been rehabilitated in Udhampur district also but not to the same extent as in Jammu.
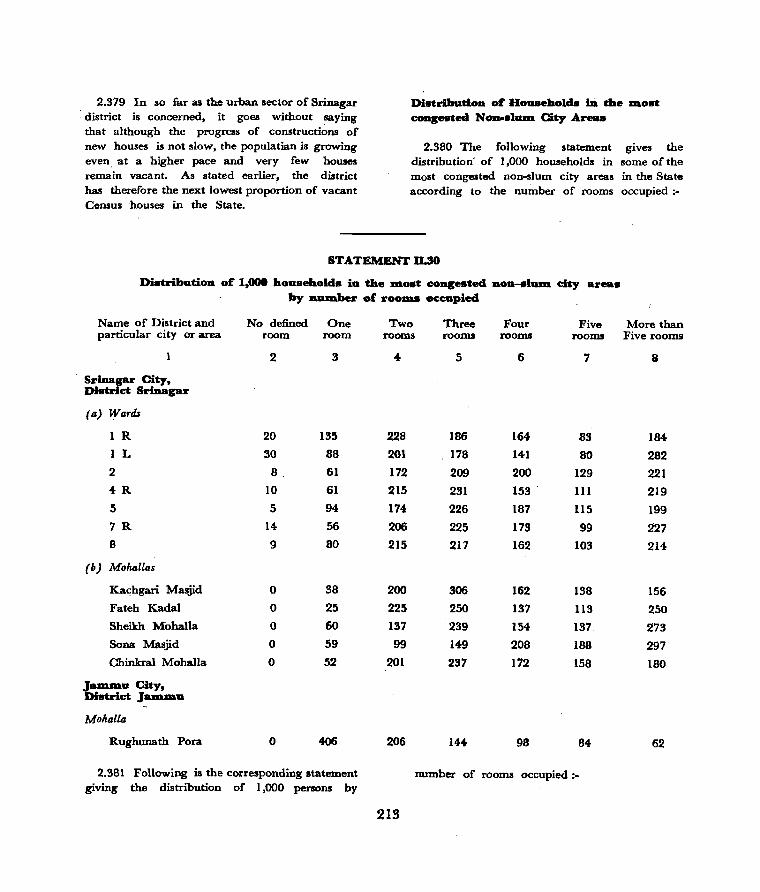
2.379 In so far as the urban sector of Srinagar : district is concerned, it goes without saying that although the progress of constructions of new houses is not slow, the populatian is growing even at a higher pace and very few houses remain vacant. As stated earlier~ the district has therefore the next lowest proportion of vacant Census houses in the State.
DistributiOD or HODseholds ill the 1Il0st coagested. Non-Blum. City Areas
2.380 The following statement gives the distribution' of I ,000 households in some of the most congested non-slum city areas in the State according to the number of rooms occupied:-
STATEMENT D.H
Dhtribution or 1,000 ko.seholds in the most congested nOD-IJIum. city area. by number of rOOIllB occupied
Name of District and particular city or area
Srinagar City, District Sriaagar
(a) Wards
1 R
1 L
2 4R
5
7R
8
(b) Mohallas
Kachgari Masjid
Fateh Kadal
Sheikh Mohalla
Sona Masjid
Chinkral MahalIa
Jammu City, District JUDIIlU
Molzalla
Rughunath Pora
No defined One room room
2
20 30
8
10
5
14
9
o o o o o
o
3
135
88
61
61
94
56
80
38
25 60
59
52
406
2.381 Following is the corresponding statement giving the distribution of 1 ,000 persons by
Two rooms
228 201
172 215
174
206
215
200
225 137
99
201
206
213
Three rooms
5
186
178
209
231
226
225
217
306
250
239
149
237
144
Four rooms
6
164-
141
200 153 '
187
173 162
162
137
154
208
172
98
Five More than rooms Five rooms
7
83
80
129
III 115
99
103
138
113
137.
188
158
84
a
184
282
221
219
199
227 214
156
250
273
297
180
62
number of rooms occupied:-

STATEMENT u.:n DistributioD of 1,000 persODs iD the most eoagested DOD.slam. city areas
by Dumber of rooms oeca.pied
Name of District and No defined One paricular city or area room room
I 2 3
SriDagar· City, District Srinapr (a) Wards I R 16 100
1 L 24 49 2 6 30 4R 8 37 5 4 69 7R 14 47 8 6 54
(b) Mohallas Kachgari Masjid 0 27 Fateh Kadal 0 10 Sheikh MahalIa 0 26 Sona Masjid 0 42 Chinkral MohaIla 0 29
Jam.m.u City, District Jam.m.u Mohalla Rughunath Pora- 0 241
2.382 It is clear that there are no households occupying no regular rooms in the non-slum mohal)as of Srinagar city and that the size of population of such households in the nonslum wards of the city is very small. Further except for ward 1 R where the average number of persons occupying J room only is 100 per 1,000, there is no ward/mohalla in which the number of persons, occupying one room is more than 69. Again, households occupying two rooms do not claim more than 18.2% population in any of the non-slum wards of the city and 1 7.7% in· the non-slum mohallas. Households occupying 3 rooms account for about 17% to 21 % of the total population in the various wards mentioned in the statement. The mohaIla-wiSe proportions show that such households may even constitute about 27% of the total population.
2.383 The following graphs indicate the distribution of 1,000 persons according to the number of rooms occupied by the households. These will show that a fairly high proportion of the populd.tion in the non-slum areas of'
Two Three Four Five More than rooms rooms rooms rooIllS Five rooms
4
182 161 151 176 140 156 169 147 177 90 77
164
168
5 6 7' 8
175 176 97 ,,254-164 131 83 388 190 176 134 313 208 145 132 294 206 165 127 289 180 204 110 289 204 157 126 284 268 157 143 258 228 162 136 287 218 157 211 298 169 222 193 297 201 185 172 249
188 163 136 104
Srinagar city live in dwellings consisting_.either of three rooms or of more than 5. An important feature of these areas is. that the population in nonslum areas of Srinagar is distributed--in ascending proportions according to the number of rooms occupied. It is, therefore, that we find that except for households living in four to five rooms, the size of population grows with the increase in the number of rooms occupied. The position obtai~ing in Rughnathpora of Jammu city is, however, just the reverse. The largest number of households consists of those living in single rooms only and this proportion gradually declines with the increase in the number of rooms occupied.
. DistributioD of 1,000 Households and 1,000 Population iD the Slum. Areas of the Cities
214
2.3P-4 The subjoined statement gives the distribution of 1,000 households and 1,000 population according to number of rooms occupied in some of the recognised slum areas of the cities of Srinagar and Jammu.
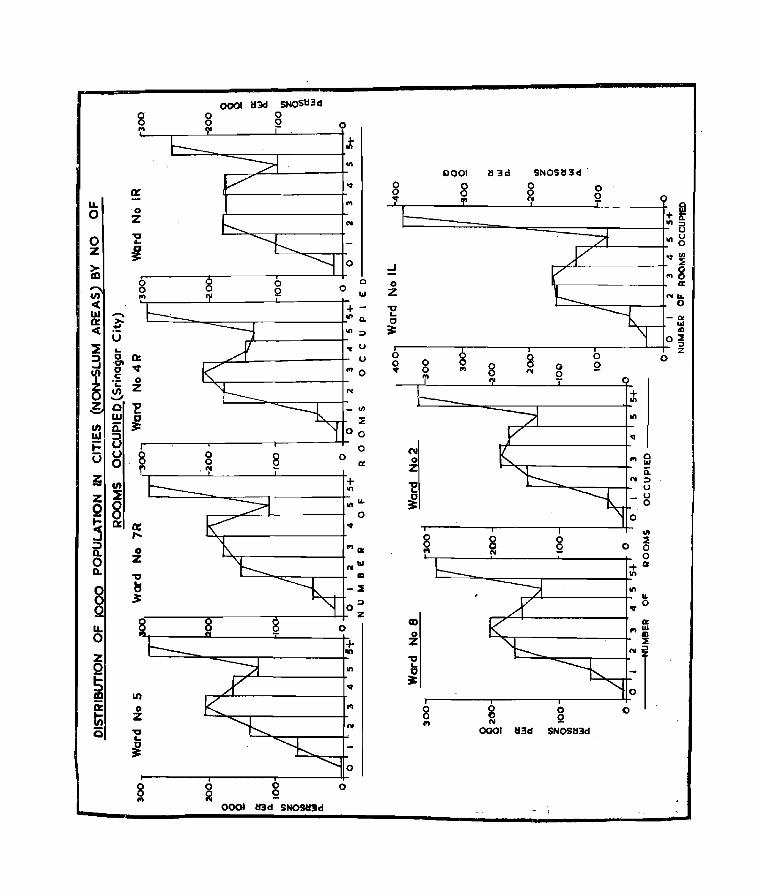
0001 H3d SNOSti3d
8 0 0 0 Q 0
'" .t ....
0001 H 3d SNOSH3d 0: 0 0 0 0 a: 0 0 0 Q '"
'If ~ II.
+~ 0 '0 Z N .... ::;)
U
0 ~ III U ... 0 z f 0: 111 0 ::;;
til .J ... 8 c 0 tr
en w Z NIL
« +- ~ 0
UJ ...... on Il. ... a: >- a « ,,!:: III ::;) 3: u ~ 'Of U r---... 3 c Q: u 0 8 8 0 0
'01 ~
0 8 8 0 Q c "'0 • '" N
~ C '" 52 'L; 0 N
e Z N + on Z 0 'E - III
W I :::;: III
II) a: II.! a 'I
t= 0 N U U 0
~ 0 0 .., a 0 0 tr 1&1
,N Z a: ~ + N ::;)
II) ~ U ~
VI ... Z 0 U
0 8 III'" ~ 0
~ 0
a: a: '" ,... VI .J 8 8 0 ~ :;)
"'II: Q 0 0 a. 0 ... N Z 0
0 NUl +tr a. ~ ID In
8 b VI
3: II. 0
0 '" CD tr
II. 0
..,1&1
0 m oJ- Z J! 1ft
=1
z ~
Q VI ... g
i '" 3:
In ii 0 ... 0 0 0 0 Ii; Z 0 0 Q
N II) N
Q "0 0001 tl3d SNOStlld ... ~
8 0 0 0 II) ~ Q
0001 tBd SN09lIId _' :

0 0 0
IX
'" Co
DISTRIBUTION OF 1000 POPULATION IN CITIES (NON-SLUM AREAS) BY NO OF ROOM S OCCUPIED
300
aoo
Kochgiri Masjid SRI NAGAR CITY 300
00
Fahh Kadal SRINAGAA CITY 300
200
Shei kh Mohall a . SRINAGAR CITY
III:
II! VI
!I 100 00 100 00 Z ~ 0
~ '" Q.
0 0 2 3 4 5
-- NUMBER OF
300
o 200 o Q
rr w Co
IIJ 100 z S a .... Q.
Sooa Maslid SRINAGAR CITV
-----NUMBER
Q:
Ir
0 I 2 '3 4 5 5+ 0
:0 2 3 4 5 5+ ROOMS OCCUPIED
Chinkral Mohalla Raqhunalh Pora 300
SRINAGAR 100
CITY .JAMMU CITY
00
100
2 3 4 5 5-t a
OF ~OOMS OCCUPIED ---------
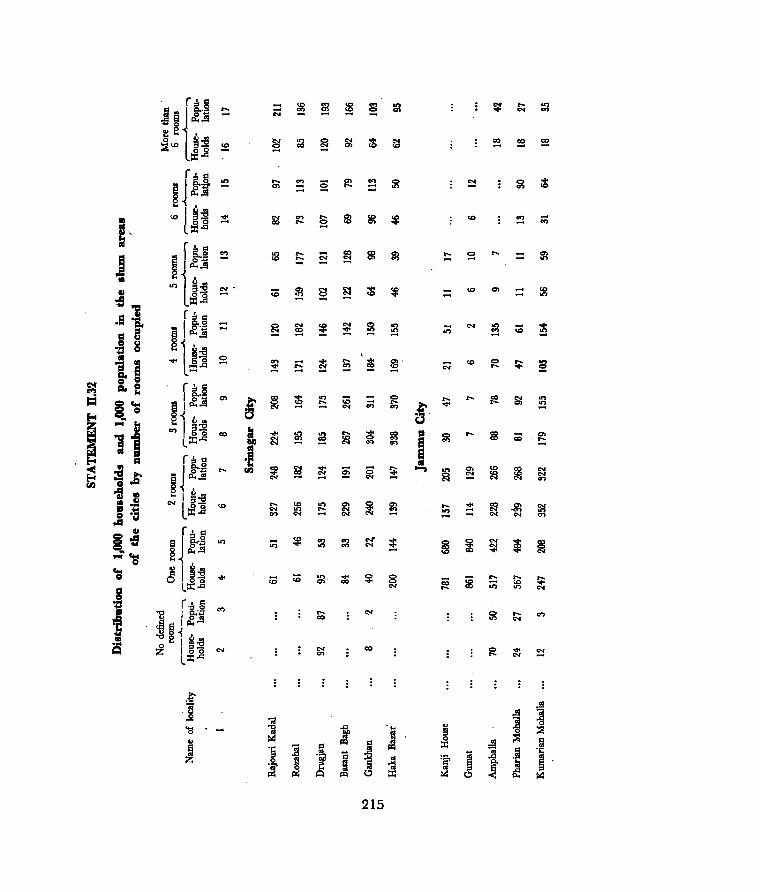
~!t1 .... - :! §! !2 ~ ~ ~ .... . .., - N ... - N
f 2 • ~<D ~:S ~ :::3 <:> S! ~ "" :2 ~ ~ !2 ~ <D
=..8 f:!s c::
:2 .... ~ ~ <:> <:> "'" E , g..~ ~ § ~ C'I - - on ..., IQ
8 Il-i.!l ., 0{ •
• <D I ~:S :!: IN ..., .... ~ l§l ~ '" ~ -100 '" .... !=: ..,
m' l::t::..c:
f:!s=
J e I g..~ ~ an .... c:; co 3l 0> ~ !=: .... 0> <D ~ ~
.., an 8 Il-i_
III .. i . on 0-a
II l;!- ~. iD C'I § IN $ ~ = '" 0> <D
-.91 =..8 :2 ~ an
f:!s c:: .S "S. .. I g..9 - <:> $I ! ~ 0 on ;;; "" on iD ti 1:1 811l-i] - ~ :2 :2 ~
i Col Col ~ i . {l ~ 0
" "'" L~"O !=: :£ -. "'" ..... ! 0> . IQ <:> .... ~ - e ~..c: c:;
" ~ ~ ~ !2 ..... "'" N
go 0 c:a. 0 f:!ss C"l ..
= I g.·lJ 0> g ~ "'" on iD <:> ..... .... {e S! on l'; e 11l-i.!l !2 ~ c;:; .... g. "'" :2 IN N ..,
~ go{ •
m - II .,,0 .. .., g~
'" ..
"'" 2l on ..... C!: '" a .... g;j 0> 11 l:r: .Q " IN ~ '" c<> <:> c;; ~
·r IN N ..., ..., ...,
~ f:!s = a
~ a " -Ill !II I g..,g ..... fI) ~ $I ~ §i 0 .... ..., "" 0> '" ~ IN
t; ;:g ;... e~ll-i.!! N :!: <:> ~ IQ N
.a IN N "" N .... 0
11 III §I"" III II "" I g~ ..... '" on 0> ~
0> :!: co ... IQ ..... _g: "" III ~ l::t:.Q eN .., ~ "" ~ .., N "" 0
..., "" "" - - N N c<>
..1:1 Col
8 II f:!s c:: ..1:1
E! 1 g..,g on - ~ .., ..., N' :£ <:> ~ "" ! co ... ..., .., .... N ~ ~ <:>
...;'eo.c e Il-i.!l co "" 0 l;!IM-a '; 016- """ iD iD ~ ~ <:> 8 c;; G .... ..... .....
l::t::ll """ - <D """ i "" .... "" .., on ""
;: r· s "" t ." I it'lJ .... "" 15 ..... ...,
j I~.!! co N
u E!-< ... ." e I ~-a III
is oj, I 6'0 N N co <:> ~ ~ l:Z::..c:: en ....
.~ co '5 .!l :::;
.s 0; OJ ~ 'a ." i
., M
il ::1! :2 co ... .. ~ c:: = c:: ~ :z:: t os
~ ] .. c:: .. .. 'E ..c::
~ .~ 6 S '6i! ~ .. :6' .!!1 os
~ ~ ..
':i' ~
.. .. .. .. os ~
os P:I P:I ~ 0 ::.: 0 ::.:
215
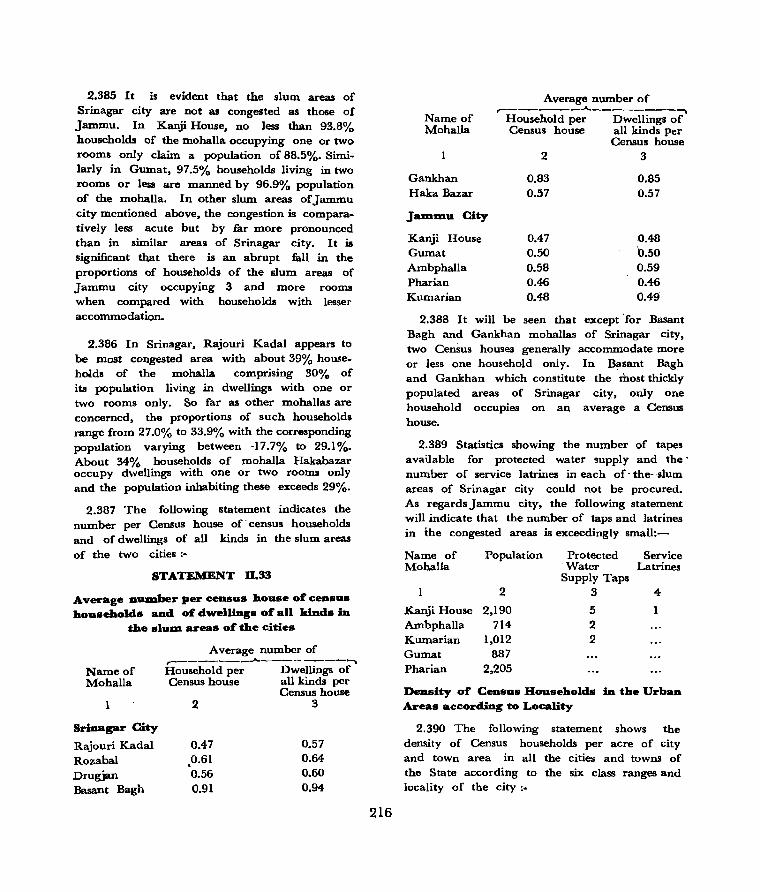
2.385 It is evident that the slum areas of Srinagar city are not as congested as those of Jammu. In Kanji House, no less than 93.8% households of the mohalla occupying one or two rooms only claim a population of 88.S%. Similarly in Gumat, 97.5% households living in two rooms or less are manned by 96.9% population of the mohalla. In other slum areas of Jammu city mentioned above, the congestion is compara-. tively less acute but by far more pronounced than in similar areas of Srinagar city. It is Significant that there is an abrupt fall in the proportions of households of the slum areas of Jammu city occupying 3 and more rooms when compared with households with lesser accommodation.
2.386 In Srinagar, Rajouri Kadal appears to be most congested area with about 39% households of the mohalla comprising 30% of its population living in dwellings with one or two rooms only. So far as other mohallas are concerned, the proportions of such households range from 27.0% to 33.9% with the corresponding population varying between -17.7% to 29.1 %. About 34% households of mohalla Hakabazar occupy dwellings with one or two rooms only and the population inhabiting these exceeds 29%.
2.387 The following statement indicates the number per Census house of' census households and of dwellings of all kinds in the slum areas of the two cities:-
STATEMENT D.33
Average nUDlber per census house of census households and of dwellings of all kinds in
the sluDl areas of the cities
Name of Mohalla
1
SriDagar City
Rajouri Kada1 Rozabal Drugjan Basant Bagh
Average number of ,-_______ .,.A...---- ____ -.. Household per Dwellings of Census house all kinds per
Census house 2 3
0.47 0.57 0.61 0.64 . 0.S6 0.60 0.91 0.94
216
Name of . Mohalla
Gankhan Haka Bazar
Average number of r--------..A.----------.
Household per Dwellings of Census house all kinds per
Census house 2 3
0.83 0.85 0.57 0.57
JaDlDlu City
Kanji House 0.47 .0.48 Gumat 0.50 O.SO Ambphalla 0.S8 0.S9 Pharian 0.46 0.46 Kumarian 0.48 0.49
2.388 It will be seen that except 'for Basant Bagh and Gankhan mohallas of Srinagar city, two Census houses generally accommodate more or Jess one household only. In Basant Bagh and Gankhan which constitute the most thickly popUlated areas of Srinagar city, only one household occupies on an average a Census house.
2.389 Statistics showing the number of tapes available for protected water supply and the' number of service latrines in each of, the- ·slum areas of Srinagar city could not be procured. As regards Jammu city, the following statement will indicate that the number of taps and latrines in the congested areas is exceedingly 8mall:-
Name of Population Protected Service Mohalla Water Latrines
Supply Taps 2 3 4
KarUi House 2,190 5 1 Ambphalla 714 2 Kumarian 1,012 2 Gurnat 887 Pharian 2,20S
Density of Ceusus Households in the Urban Areas according to Locality
2.390 The following statement shows the density of Census households per acre of city and town area in all the cities and towns of the State according to the six class ranges and locality of the city:-
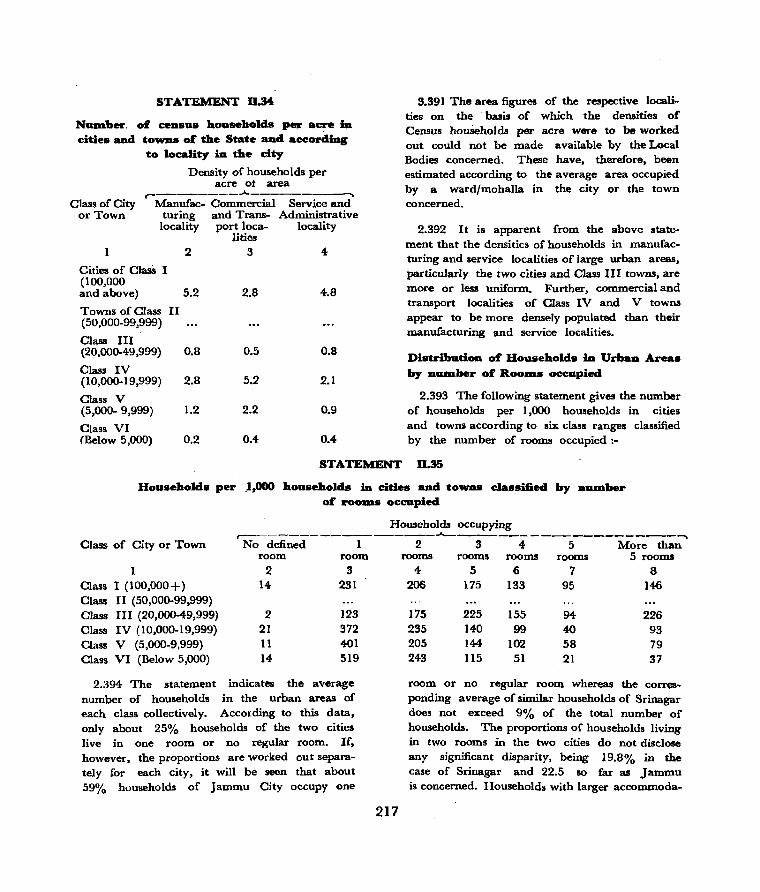
STATEMENT 0.34
Nuuaber. of census hcnaseholds per acre ill cities and towns of the State and according
to locality in the dty
Density of households per acre ot area
r---------- ........ -----------... Class of City
or Town Manufac- Commercial Service and
turing and Trans- Administrative locality port loca- locality
lities 2 3 4
Cities of ClasS I (100,000 and above) 5.2 2.8 4.8
Towns of Class II ( 50,000-99,999)
Class III (20,000-49,999) 0.8 0.5 0.8
Class IV (10,000-19,999) 2.8 5.2 2.1
Class V (5,000- 9,999) 1.2 2.2 0.9
Class VI (Below 5,000) 0.2 0.4 0.4
3.391 The area figures of the respective localities on the' basis of which the densities of Census households per acre were to be worked out could not be made available by the Local Bodies concerned. These have, therefore, been estimated according to the average area occupied by a ward/mohalla in the city or the town concerned.
2.392 It is apparent from the above statement that the densities of households in manufacturing and service localities of large urban areas, particularly the two cities and Class III towns, are more or less uniform. Further, commercial and transport localities of Class IV and V towns appear to be more densely populated than their manufacturing and service localities.
Distribud.on of Households in Urban Areas by na.m.ber of RoolDS occupied
2.393 The following statement gives the number of households per 1,000 households in cities and towns according to six class ranges classified by the number of rooms occupied;-
STATEMENT 0.35
Households per .1,000 households in dties and towas classified by na.m.ber of roouas occupied
Households occupying r-------------------,.,A..,,----------------------........
Class of City or Town No defined I room room
1 2 3 Class I (100,000+) 14 231 Class II (50,000-99,999) Class III (20,000-49,999) 2 123 Class IV (10,000-19,999) 21 372
Class V (5,000-9,999) 11 401
Class VI (Below 5,000) 14 519
2.394 The statement indicates the average number of households in the urban areas of each class collectively. According to this data, only about 25% households of the two cities live in one room or no regular room. If, however, the proportions are worked out separately for each city, it will be seen that about 59% households of Jammu City occupy one
217
2 3 4 5 More than rooms rooms rooms rooms 5 rooms
4 5 6 7 8 206 175 133 95 146
175 225 155 94 226 235 140 99 40 93 205 144- 102 58 79 243 115 51 21 37
room or no regular room whereas the corresponding average of similar households of Srinagar does not exceed 9% of the total number of households. The proportions of households living in two rooms in the two cities do not disclose any significant disparity, being 19.8% in the case of Srinagar and 22.5 so far as Jammu is concerned. Households with larger accommoda-

tion, however, claim much higher proportions in Srinagar when compared with jammu, as indicated below:-
Name of Households per 1,000 households Town occupying
,----------'---------..... 3 4 5 Mocethan
rooms rooms rooms 5 rooms
2 3 4 5
Srinagar 211 171 130 202
jammu 9!} 49 19 23
2.395 The preponderance in jammu of households which_ live in one room or no regular room is explained partly by the heavy i,nflux of displaced persons and inunigrants from the other side of the Cease-fire Line and West Pakistan and partly by the growth of population of the city as a result of the implementation of developmental plans. Srinagar has also propOrtionately grown in size but it has accommodated very few persons displaced from other areas. This is why the prop.ortion of its households living in less than two rooms is comparatively small.
2.396 Another important reason for these disparities is that Srinagar City, like other parts of the valley, experiences severe cold and heavy snowfalls in winter and fairly warm weather in summer. The mlDlDlum accommodation needed by a household, therefore, is two living rooms, one on the ground floor for use in winter and the other on the first fioor to which the household retires during summer. In jammu, winters are mild and the necessity of providing two living rooms is not an indispensable one. For the same reason the inhabitants of the valley need extra accommodation where food grains, wood fuel, dry vegetables and other requirements, which are not easily available in winter, can be stored and protected against rain and snow.
2.397 At any rate, the fact that over 45% households in Class I as a whole occupy on an average accommodation not exceeding two rooms throws ample light on housing difficulties in this sector of the urban areas. This is more
218
pronounced in the case of households occupying one room or lesser accommodation in Jammu city.
2.398 Anantnag is the only town in the State which falls in Class III. The town is comparable with Srinagar city in respect of the distribution of households according to the size of the accommodation in their occupation' except that the number of households living in one room only and three rooms is proportionately larger than in Srinag.ar.
2.399 Class IV includes four towns of which two, namely, Baramulla and Sopore belong to the valley and the other two, viz., . Udhampur and Poonch, fall in Jammu province. The distribution of households in each of these towns, according to the number of room; occupied, shows that there is a huge dispal)lty between the proportions of households living 11'1 no regular room or one room only in the towns of Jammu province as compared with those· of Baramulla and Sopore. In Baramulla, the aggregate proportion of households living in less than two rooms does not exceed 16% as against 72.4% of Poonch and" 63.8% of Udhampur. Even ill Sop ore, the cQrresponding proportion ~-of· . such households is less than 18%. This is because UdhaJ4lpur and Poonch have also absorbed immigrants and displaced persons while there have not been any such incursions into the towns of Baramulla and Sopore. Further, as in the case of the cities of Srinagar and jammu, the climatic difference is no less responsible for these disparities.
2.400 Class V includes six towns, two belonging. . to Jammu province and four to Kashmir. The forme'r consist of Kathua and Jammu Cantt. and the latter of Bijbehara, Shupiyan, Pampore and . Badamibagh Cantonment. . The data given in the stat~ment indicates that very few households of these towns live in no regular rooms. Further, in this case the towns of Jammu are not distinguishable from those of Kashmir for high proportion of households living in no regular rooms. In fact, such households have been returned in larger proportien from Badamibagh Cantonment of Srinagar district.
2.401 The Jammu towns are, however, conspjcuous for the concentration of-households occupying only one room. InJammu Cantonment, about 81% households live in single rooms as against 17% approximately of Badamibagh Cantonment. Similarly, the accommodation available t~ about 66% households of Kathua town is limited to one room only. The other three towns of Kashmir have comparatively very few hopseholds living in one room only and their· proportions range from 86 to. 136 per 1,000.
2.402 An inevitable effect of the high proportions ~f households with small accommodation is . that comparatively larger proportion of households of the four towns of Kashmir occupy dwellings consisting of more than one room whireas the corresponding proporticns of Jammu towns are -fairly small.
2.403 About 70% urban areas of the State consist of small towns falling under Class VI an9 their population varies from 206 to 4,820. Many of these have been urbanised during the inter-Census period even though they were borne on the urban list a few decades earlier. In view of the fact that the number of households in most of these towns is small, the high percentages of those with no regular rooms have only a statistical value. It is therefore that while in towns like'Ranbirsinghpora, Akhnoor, Nowshehra and Banihal, the incidence of such households is when compared with other similar urban areas of Jammu province fairly high, the percentages of households living in no regular rooms in a few towns of Kashmir valley, like Ajas and Uri, are even higher.
2.404 As in the cases of other classes 0
towns, the incidence of households occupying only one room is more pronounced in Class VI towns of Jammu province than those of Kashmir valley and Ladakh. In comparing the incidence of such households, however, some of the towns where the high percentages of households occupying one room are due to special circumstances not obtaining elsewhere must be excluded. Thus, Lakhenpur where about 96%
219
households live in one room only is a small township and is inhabited mostly by shopkeepers and the staff of Government institutions, particularly the personnel of Excise and Taxation Department.
2.405 Gulmarg and Pahalgam are the two reputed health resorts of Kashmir. Most of the buildings in the two towns are rented out to tourists visiting Kashmir during summer. The rent being rather high, the visitors usually manage with one room only. It is for this reason that over 70% and 55% households in Gulmarg and Pahalgam were found occupying single rooms only.
2.406 The position of Ranbirsinghpora, Samba, Akhnoor, Bishna, Reasi, Ramnagar, etc. is different. These towns have absorbed a fairly good number of migrants and displaced persons from other parts of the State. Not a few of them live in small newly built huts consisting of one room and a kitchen only while many others share the old dwellings with the local inhabitants. It would not, however, be correct to assume that the high incidence of such households is exclusively due to the concentration of migrants and displaced persons. The economic backwardness of the inhabitants is equally responsible for this acute congestion. Another reason which accounts for the high incidence of such households is the functional character of some of the towns. Batoie, for example, is both a health resort as also an important commercial area catering to the needs of the everflowing traffic from and into Srinagar. Ramban, Ranbirsinghpora, Samba Rajouri, Akhnoor, Doda, Hiranagar, Reasi, Ramnagar and Nowshehra are all tehsil headquarters and are inhabited, among others, . by a fairly good number of Government employees who usually live in single rooms. In so far as Kashmir is concerned, the high incidence of households occupying one room only in towns other than Gulmarg and Pahalgam is mainly due to the economic backwardness. Prominent among these are the four notified areas, Palhalan, Hajin, Ajas and Sumbal of tehsil Sonawari which has been the most backward area of the valley all along in the past and has now been

selected by the State Govemment for intensive development.
distribution of 1,000 households according to
the number of rooms occupied in each of the
class VI towns of the State:-2.407 The subjoined statement indicates the
Name of Town
Ranbirsinghpora Kulgam Samba Rajou!i Kishtwar Bhaderwah Bandipore Akhnoor Amia Palhalan Leh Hajin Ajas Doda Hiranagar Sumbal Bishna Bashohli Reasi Ramnagar Nowshehra Pahalgam Batote Katra Ramban Banihal Uri Lakhenpur Gulmarg
STATEMENT n.36
Distribution of 1,000 households according to nUlnber of roolns occupied in each of the class VI towns of the State
rNo
room
2
32
16 7 6
37 29
15
44-7
25
ID
7 48 29
22
42 50
Households per 1,000 households occupying ----A-- ,----- ---.
1 2 3 4 5 More than room
3
883 305 653 543 333 349 176 644 468 269 167 483 313 657 733 478 709 365 682 876 771 551 679 527 797 447 450 955 704
rooms rooms rooms
4 5 6
(Based on 20% Sample)
54 251 179 350
'356 316 305 225 354-385 258 259 330 182 117 348 213 305 227 117 143 232 210 264 156 298 300
23 186
72 75
208 191 221
79 109 115 237 146 183 96 59 76 48
203 64
29 1I6
74-99 31
128 50
4 72 60 16 59 65 99
5 28
162 96 43 61 22
,56 54 ID 93 27
29 l2 44 16 64
150
rooms
7
4 72' 30
15 20 '54
10 6,
15 40 26 26 29
17
9 29
33
21
5 rooms
8
114 6
22 33
145
6 54
187 43 43
7 8
44 10 17
14 25 11
N atipora-Hyderpora 79
45 185 213
37 247
74 180 112 169
220
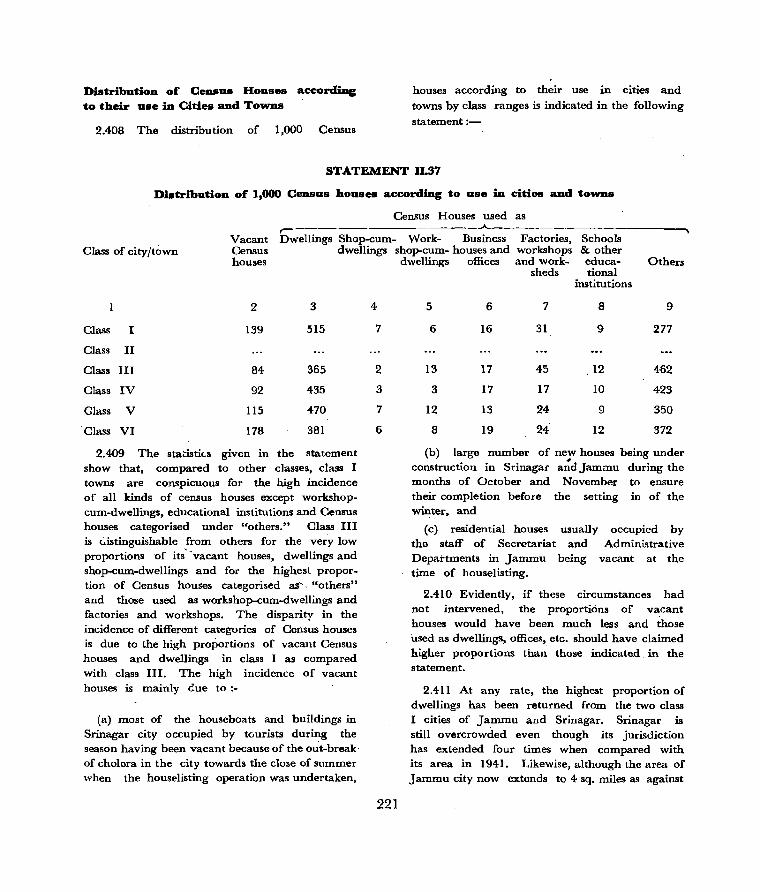
Distribution of Ceo"ulI Houses accordiug to their use in Cities and ToWDs
2.408 The distribution of 1,000 Census
houses according to their use in cities and towns by class ranges is indicated in the following
statement :-
STATEMENT 11.37
Distribution of 1,000 Census houses according to lise in cities and toWDS
Census Houses used as r- ...A..
~
Vacant Dwellings Shop-cum- Work- Business Factories, Schools Class of city/town Census dwellings shop-cum- houses and workshops & other
Class I
Class II
Class III
Class IV
Glass V
'Class VI
houses
2
139
84
92
115
178
3
515
365
435
470
381
2.409 The statistks given in the statement show that, compared to other classes, class I towns are conspicuous for the high incidence of all kinds of census houses except workshopcum-dwellings, educational institutions and Census houses categorised under "others." Class III is c:..istinguishable from others for the very low proportions of its"'vacant houses, dwellings and shop-cum-dweUings and for the highest proportion of Census houses categorised as-·· "others" and those used as workshop-cum-dwellings and factories and workshops. The disparity in the incidence of different categories of Census houses is due to the high proportions of vacant Census houses and dwellings in class I as compared with class III. The high incidence of vacant houses is mainly due to:-
(a) most of the houseboats and buildings in Srinagar city occupied by tourists during the season having been vacant because of the out-break· of cholera in the city towards the close of summer when the houselisting operation was undertaken,
4
7
2
3
7
6
221
dwellings offices and work- educa- Others sheds tional
institutions
5 6 7 8 9
6 16 31 9 277
13 17 45 12 462
3 17 17 10 423
12 13 24 9 350
8 19 24' 12 372
(b) large number of new houses being under construction in Srinagar a;dJammu during the months of October and November to ensure their completion before the setting in of the winter, and
(c) residential houses usually the staff of Secretariat and Departments in Jammu being time of houselisting.
occupied by Administrative
vacant at the
2.410 EVidently, if these circumstances had not intervened, the proportions of vacant houses would have been much less and those used as dwellings, offices, etc. should have claimed higher proportion~ than those indicated in the statement.
2.411 At any rate, the highest proportion of dwellings has been returned from the two class I cities of Jammu and Srinagar. Srinagar is still overcrowded even though its jurisdiction has extended four times when compared with its area in 1941. Likewise, although the area of Jammu city now extends to 4 sq. miles as against
only 2 sq. miles of 1941, the city suffers from acute scarcity of residential accommodation. Both Srinagar and Jammu are making rapid progress in industrial, commercial and educational spheres and the proportion of dwellings is likely to increase still further during the next few years.
2.412 It is also important to note here that in view of the highly urban character of the two cities, there are very few structures of the kind commonly found in rural areas, such as godowns, kuthars and cowsheds, etc. The proportion of other Census houses is therefore comparatively small and that of dwellings fairly
high.
2.413 Parts of Anantnag town, on the other hand, still wear a rural complexion. About 9% of its population consists of agriculturists who usually maintain separate structures called Kuthars for storage of fcod grains. In addition, separate sheds are also erected in the premises of the dwellings to house the cattle. Further, in such of the sectors of the town which are distinguishable for their urban characteristics, every dwelling has a private latrin:; attached to it. Another important feature of the town is that bathrooms have been built on the streamlets which flow through the premises of most of the dwellings. '1 he cumulative effect of these additional structures is that the proportion of dwellings per 1,000 Census houses is about 365 only.
2.414 Class III represents the town of Anantnag only which is a district and tehsil headquarter. It is therefore that· compared to many other classes, the proportions of Census houses used as workshop-cum-dwellings, business houses, factories, workshops and schools, etc. are the highest. The industrial classification of the workers shows that the next largest majority of workers consists of those engaged in household industry and manufacturing other than household industry who together claim over 6% of the total population of the town. This is also confirmed by the foregoing statement which shows that 58 per 1,000 Census houses, the highest when compared with othel' classes, are
222
used as workshop-cum-dwellings and factories, workshops, etc,
2.415 The statement shows that there is not much disparity in the incidence of vacant and other Census houses of class III and class IV towns, The high proportion, of other houses is
indicative of rural characteristics, such' as separate structures used as godowns for storage of food crops, cow-sheds and the like, which claim a comparatively small proportion in class I towns. The industrial classification of the workers in class IV towns indicates that only 38 per 1,000 of the population is engaged in manufacturing (household industry and manufacturing other than household industry) as against 61 per 1,000 of class III. This is also reflected in the preceding statement which shows that the proportions of Census houses t,lsed partly as dwellings and partly as workshops and of those in which factories and workshops are housed stand at 20 per 1,000 only in class IV towns.
2.416 The variation between the proportions of dwellings of the two classes is explained by' more pronounced incidence of houses c'ategorised under 'others' in class III as compared with class IV. There is not much disparity in the inci~ence of shop-cum-dwellings and houses occupied by schcols and other educational insti tu tions.
2.417 The fact, however, remains that of the four towns included in class IV, Udhampur and Poonch have returned higher proportions of unoccupied houses than Baramulla and Sopore. The relevant statistics indicate that these proportions stand at 138 in the case ofUdhampur, 148 in PooDch, 61 in Baramulla and 44 per 1,000 in Sopore respectively. The disparity is due to the absence from their houses of graziers and Bakerwals of U dhampur and Poonch towns who move to higher altitude during summer. There are no Bakerwals and· Gujars in the towns of Baramulla and Sopore. At any rate, all the four towns are important commercial centres catering to the needs not only of the urban population but also of the surrounding rural
areas. This explains the' high incidence of business houses, offices, workshops and factories, etc.
2.418 The high incidence of vacant Census houses in class V as compared with class III and class IV towns is due to the high proportion of such houses in Jammu Cantorunent and Kathua, the only two towns of this class in Jammu Province. A distinguishing feature of class V towns is that the proportion of its other Census houses is small and not as high as in the case of class III or class IV. This is because, except the town of Kathua, the number of hotels, sarais, dharamsalas and restaurants, sweetmeat shops and eating places in other towns of this class is fairly small. Similarly, the number of houses occupied by medical institutions ranges from 2 to 7 only in the case of four of the six towns. As a result, the proportion of dwellings is much higher than that of class III or class IV.
2.419 Another important feature of class V towns is that the proportions of Census houses used for various purposes as indicated by cols. 3 to 9 of the statement are reasonably good being neither too low nor too high as in the case of shopcum-dwellings and other Census houses of classes III and IV. The fact that the proportions of shops and shop-cum-dwellings and of factories and workshops compare favourably with most other classes is indicative of the commercial and industrial activities of these towns. Four of the six towns included in this class are situated on the National Highway and the fifth is a district and tehsil headquarter. As may, therefore, be expected, a sizable volume of business is being carried on in the towns to cater to the needs of the traffic' and the surrounding population. The sixth town, namely, Shupiyan, which is situated in the interior has the largest number of shops other than eating houses. The town is a distributing centre for all the rural areas in the mountainous region of Kulgam tehsil.
2.420 Class V includes three of the six industrial towns of the State, namely, Bijbehara Shupiyan and Pampore. This explains the high
223
incidence of Census houses used as workshopcum-dwellings and factories, workshops and worksheds, etc.
2.421 It has already been stated earlier that about 70% towns of the State have a population of less than 5,000 and fall in Class VI. Such of 'the towns as are situated in plain and low level areas have generally a population ranging from 3,500 to 5,000. Towns in hilly areas have comparatively much less popUlation except those among them which function as district headquarters, such as Leh, or Doda, or which are historically important and are borne on the urban list for many decades continuously.
2.422 Class VI is conspicuous among all urban areas of the State for . its highest proportion of vacant Census houses. It includes, among others, the notified area of Gulmarg where 920 out of every 1,00J Census houses have been found vacant. Reasons for this have already been explained in Paras 2.403 to 2.406 above. Gulmarg :is situated at an altitude of 2,639 metres and large majority of the visitors vacate the town in early November on account of its growing cold weather. Pahalgam and Batote ... hich are also health resorts are, however, situated at 2,149 and 1,585 metres respectively above the sea level and their climate is not, therefore, so repulsive. This is why only 203 and 303 Census houses per 1,000 were found vacant at these places.
2.423 Other Class VI towns in which the incidence of vacant Census houses is comparatively high include Reasi, Kishtwar, Samba, Doda, Bamhal, Ramnagar, Akhnoor, Hiranagar, Rajouri, Uri, Katra, etc. These towns are inhabited, among others, by Bakerwals and graziers who lock up their houses for the duration of their migration to higher altitudes. A number of Government buildings, some of them newly built, were also found unoccupied in these towns.
2.424 Owing to the economic backwardness of the State, particularly of its kandi areas, small towns situated in the far-flung areas are still dominated by rural characteristics and agricult).lre and animal husbandry continue to
be principal occupations which maintain the bulk of their population. It is, therefore, that the overall proportion of cowsheds in district Doda, all of whose 'towns belopg to Class VI, is no less than 133 per 1,000 Census houses. The corresponding proportion in the case of Udhampur district stands at 175. While this is one of the reasons for the low incidence of Census houses used as dwellings, the high proportion of vacant CeIlllUS houses is no less responsible for this. As already stated, most of the dwellings occupied in winter by Bakerwals and herdsmen had been vacated by them at the time of houselisting on account of their departure to higher altitudes where grazing facilities are available.
2.425 Another distinguishing feature of class VI towns is that the claim they highest proportion of Census houses used as business houses and offices. The town-wise classification of the Census houses according to the uses to which they are put shows that this high incidence is mainly due to the concentration of Government and other Offices in these towns. It is therefore that we find that Kulgam, Sumbal, Uri, Leh, Dada, Ramban, Bhaderwah, Reasi and Rajouri, which are either district or tehsil headquarters, have much higher proportion of Census houses used as business houses than the proportion for the class as a whole. There are still some other towns of this class, such as Banihal,
Batote, Katra and Lakhenpur which have also returned high proportions of Census houses of this category. Three of these are situated on the Pathankot-Jammu-Srinagar National Highway where, besides commercial organisations, many Government offices have be~n stationed for the facility of the tourists and passengers. Katra is a reputed place. of pilgrimage which attracts hundreds of thousands of people from :all over India every year. There are, the)'efore, lii: number of Government and private offices functioning at this place.
2.426 The high incidence of Cen~us houses used as factories and workshops, ,etc. is no index of any new measures having been taken for the industrial development of these areas. Most of these Census houses are used ~s workshops for handloom weaving of woollen', or cotton fabrics. Thus, the highest proportion of such houses has' been returned from ahaderwah. town which is reputed for manufacturing special type of woollen blankets not produced elsewhere .hi the State. Kishtwar, like Bhaderwali, is also famous for manufacturing blankets of beautiful designs on handlooms. Again, Samba is the..only town in the State where cotton fabrics are produced on handlooms on a large scale. In the case of other towns, these workshops mosly represent tailoring shops, pottery and leather works and the like.
SECTION 4
GROWTH OF POPULATION
Growth of Population in Districts and Tehsi1s, 1951-61
2.427 No Census was taken in the State in 1951 due to abnormal conditions created by the tribal raids of 1947. The following statement,
224
however, gives the percentage increase/decrease of population in districts and tehsils during 1951-61, the 1951 population being the arith~
metic mean of the 1961 population and the projected population of the districts and tehsils in 1941 according to the 1961 jurisdictions :~
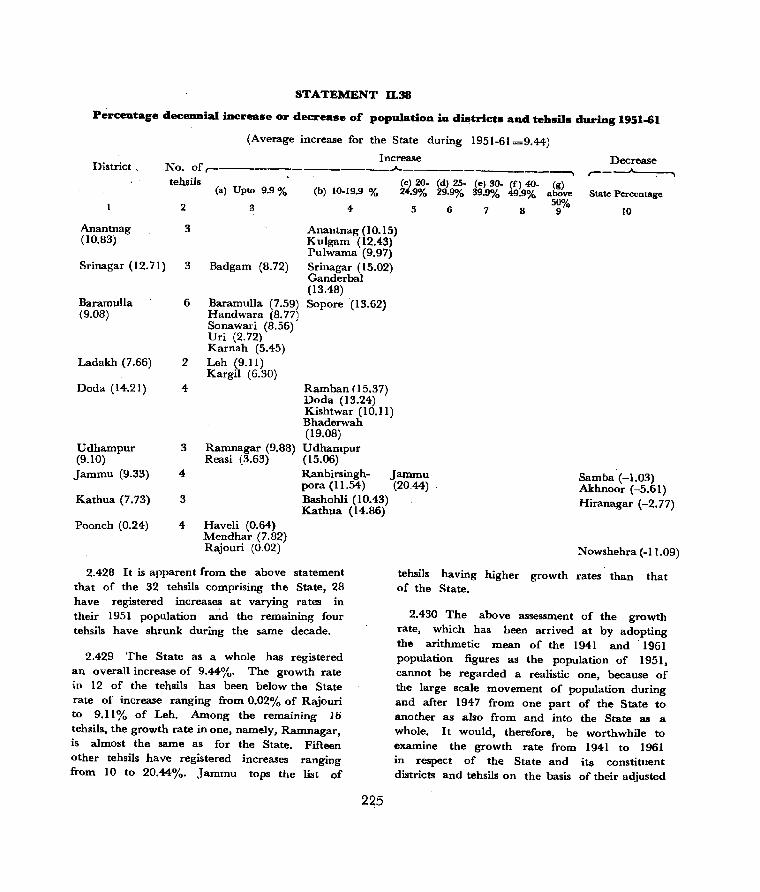
STATEMENT 11.38
Perc:entage dec:ennial inc:rease or decrease of' population in districts and tehsils during 1951-61
(Average increase for the State during 1951-61 =9.44)
I>istrict .. Increase I>ecrease No. of ,-------________ .A. ____________ --... ,-__ .....__-,---.,
tehsils (cl 20- (d) 25- (el 30- (C) 40- (g) (a) Upto 9.9 % (b) 10-19.9 % 24.9% 29.9010 39.9% 49.9% aoove State Percentage
50% 2 3 4 5 6 7 8 9 10
Anantnag (10.83)
3 Anantnag (10.15) Kulgam (12.43) Pulwama (9.97)
Srinagar (12.71) 3 Badgam (8.72) Srinagar (15.02) Ganderbal (13.48)
Baramulla 6 Baramulla (7.59) Sopore (13.62) (9~08) Handwara (8.77)
Sonawari (8.56) Uri (2.72) Karnah (5.45)
Ladakh (7.66) 2 Leh (9.11) Kargil (6.30)
Doda (14.21) 4 Ramban (15.37) I>oda (13.24) Kishtwar (10.11) Bhaderwah (19.08)
Udhampur 3 Ramnagar (9.88) Udhampur (9.10) Reasi (3.63) (15.06) Jammu (9.33) 4 Ranbirsingh- Jammu Samba (-1.03)
pora (11.54) Kathua (7.73) 3 Bashohli (10.43)
Kathua (14.86) Poonch (0.24) 4 Haveli (0.64)
Mendhar (7.82) Rajouri (0.02)
2.428 It is apparent from the above statement that of the 32 tehsils comprising the State, 28 have registered increases at varying rates in their 1951 population ~d the remaining four tehsils have shrunk during the same decade.
2.429 The State as a whole has registered an overall increase of 9.44%. The growth rate in 12 of the tehsils has been below the State rate of increase ranging from 0.02% of Rajouri to 9.11 % of Leh. Among the remaining 16 tehsils, the growth rate in one, namely, Ramnagar, is almost the same as for the State. Fifteen other tehsils have registered increases ranging from 10 to 20.44%. Jammu tops the list of
(2044) Akhnoor (-5.61) Hiranagar (-2.77)
Nowshehra (-11.09)
tehsils having higher growth rates than that of the State.
2.430 The above assessment of the growth rate, which has been arrived at by adopting the arithmetic mean of the 1941 and 1961 population figures as the population of 1951, cannot be regarded a realistic one, because of the large scale movement of population during and after 1947 from one part of the State to another as also from and into the State as a whole. It would, therefore, be worthwhile to examine the growth rate from 1941 to 1961 in respect of the State and its constituent districts and tehsils on the basis of their adjusted

population of 1941 according to their 1961 jurisdictions. The following statement shows
the corresponding growth rates:-
STATEMENT U.39
Perc_tage deceanial increase or decrease of population .in. districts and tehsils duriag 1941-61
(Average decennial increases for the State during 1941-61=10.43)
Increase Decrease No.ofr------.--
District tehsils (a) upto 9.9% (b) I ()'I 9.9%
.1 2 3. 4-/
Anantnag 3 Anantnag (11.30) (12.15) Kulgam (14.20)
Pulwama (11.07) Srinagar (14.56) 3 Badgam (9.55) Srinagar (17.68)
Ganderhal ( 15.58)
Bararnulla 6 Baramulla (S.22) Sopore (15.77) (9.99) Handwara (9.61)
Sanawari (9.36) Uri (2.79) Karnah (5.77)
Ladakh (S.30) 2 Kargil (6.73) Leh (10.03) Dada (16.56) 4 Ramban (18.16)
Dada (15.27) Kishtwar(ll.25)
l.'dhampul· 3 Reasi (3.77) Ramnagar (10.01) (10.97)
Udhampur (17.73)
.J ammu (10.29) 4 Ranbirsillgh-para ( 13.04)
Kathua (8.38) 3 Bashahli (11.64) Kuthua (17.46)
Poonch (0.24) 4 Haveli (0.65) Rajouri (0.03) Mendhar (8.49)
2.431 A c't>mparison of the two statements will indicate that by and large there is no material variation in the decennial growth rates of 1951-61 and 1941-61. As before, Samba, Akhnoor, Hiranagar and Nowshehra alone have suffered decreases in their respective populations during the two decades ending 1961. In all other tehsils, the decennial growth rate as bet
ween 1941 and 1961 has been slightly higher than for the decade 1951-61.
226
~ r---~~ (cl20- (d) 25- (el 3()' (fl4O- (g)
State Percentage 24.9% 29.9% 39.9% 49.9% above 50%
5 6 7 8 9 10
Bhaderwah (23.58)
Jammu Samba (-1.02) \25.69) Akhnoor(-5.31)
Hiranagar (-2.70)
Xowshehra(-9.98)
Rural aDd Urban cODlponents of Tehsils with Higher growth Rates thau the State
2 432 It is evident that there is no variation in the number and the names of the tehsils which have registered increases above the State average for 1941.61 and 1951.61. Thfl following statement shows the rural and urban components of increase in the population of these tehsils during the decade 1951.61:-
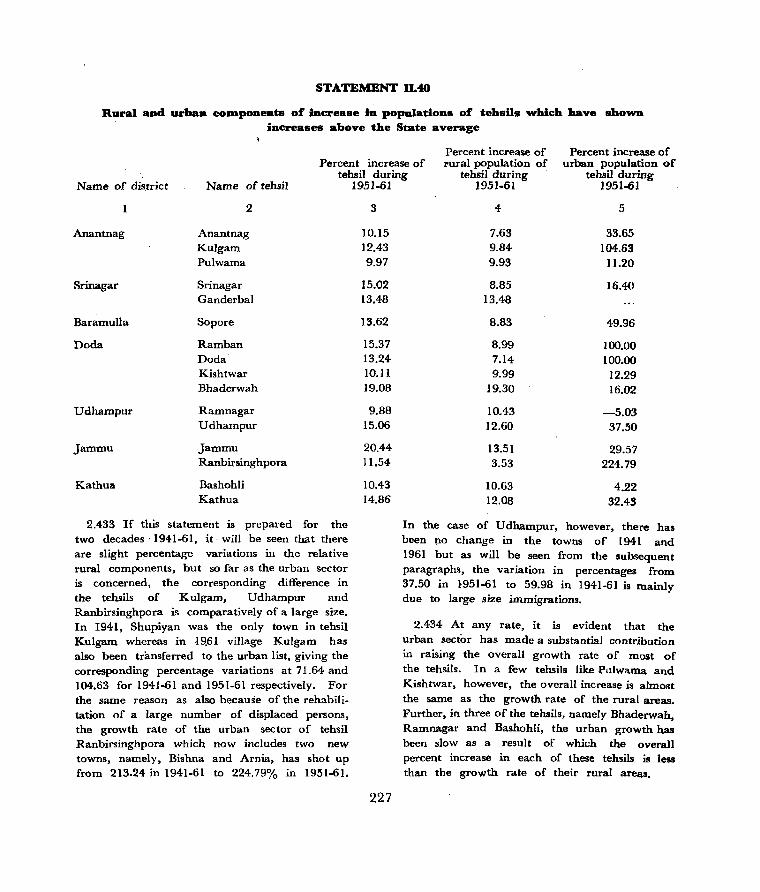
STATEMENT 11.40
Rural and urban CODlponents of increase in popnlations of . tehsils which have shown increases above the State average
Percent increase of Percent increase of Percent increase of rural population of urban population of
tehsil during tehsil during tehsil during Name of district Name of tehsil
2
Anantnag Anantnag Kulgam Pulwama
Srinagar Sri nagar Ganderbal
Baramulla Sop ore
Doda Ramban Doda Kishtwar Bhaderwah
Udhampur Ramnagar Udhampur
Jammu Jammu Ranbirsinghpora
Kathua Bashohli Kathua
2.433 If this statement is prepared for the two decades ·1941-61, it- will be seen that there are slight percentage variations in the relative rural components, but so far as the urban sector is concerned, the corresponding difference in the tehsils of Kulgam, Udhampur and Ranbirsinghpora is comparatively of a large size. In 1941, Shupiyan was the only town in tehsil Kulgam whereas in J9.61 village Kulgam has also been transferred to the urban list, giving the corresponding percentage variations at 71.64 and 104.63 for 1941-61 and 1951-61 respectively. For the same reason as also because of the rehabilitation of a large number of displaced persons, the growth rate of the urban sector of tehsil Ranbirsinghpora which now includes two new towns, namely, Bishna and Arnia, has shot up from 213.24 in 1941-61 to 224.79% in 1951-61.
1951-61
3
10.15 ]2.43 9.97
15.02 13.48
13.62
15.37 13.24 10.11. ]9.08
9.88 15.06
20.44 11.54
10.43 14.86
227
1951-61 1951-61
4 5
7.63 33.65 9.84 104.63 9.93 11.20
8.85 16.40 13.48
8.83 49.96
8.99 100.00 7.14 100.00 9.99 12.29
]9.30 ]6.02
]0.43 -5.03 12.60 37.50
13.51 29.57 3.53 224.79
10.63 4.22 12.08 32.43
In the case of Udhampur, however, there has been :p.o change in the towns of 1941 and 1961 but as will be seen from the subsequent paragraph~, the variation in percentages from 37.50 in 1951-61 to 59.98 in 19-41-61 is mainly due to large size immigrations.
2.434 At any rate, it is evident that the urban sector has made a substantial contribution in raising the overall growth rate of most of the tehsils. In a few tehsils like Pulwama and Kishtwar, however, the overall increase is almost the same as the growth rate of the rural areas. Further, in three of the tehsils, namely Bhaderwah, Ramnagal' and Bashohli, the urban growth has been slow as a result of which the overall percent increase in each of these tehsils is less than the growth rate of their rural areas.
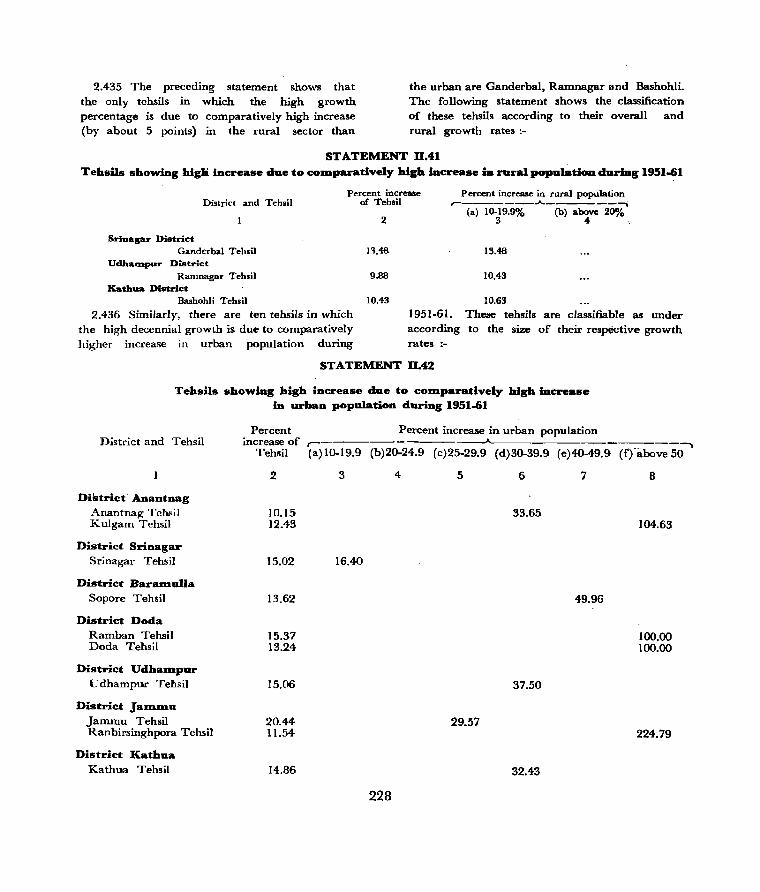
2.435 The preceding statement shows that the only tehsils in which the high growth percentage is due to comparatively high increase (by about 5 points) in the rural sector than
the urban are Ganderbal, Ramnagar and Bashohli. The following statement shows the classification of these tehsils according to their overall and rural growth rates:-
STATEMENT 11.41
Tehsns showing higJi increase due to co:m.paratively high increase in rural populatioa during 1951.61
District and Tehsil
Srioagar District Ganderbal Tehsil
Udharnpur ndtrict
Percent increase of Teb.il
2
1'1.48
Ramnagar Tehsil 9.88 Kathua District
Bashohli Tehsil 10.43
Percent increase in rural population ,...-_______ ..A.. _______ --..;
(a) 10-19.9"10 (b) above 20% 3 4
13.48
10.43
10.63
2.436 Similarly, there are ten tehsiIs in which the high decennial growth is due to comparatively higher increase in urban population during
1951-61. These tehsils are classifiable as under according to the size of their res~tive growth rates :-
STATEMENT 11.42
Tehails showing high increase due to co:m.paratively blgh Increase in urban population during 1951-61
District and Tehsil
District' Anantnag Anantnag Tchsil Kulgam Tehsil
District SriDagar Srinagar Tehsil
District BaralDuDa Sopore Tehsil
District Doda Ramban Tehsil Doda Tehsil
District UdhaDipur U dbampur Tehsil
Distric.t JaDUnu Jammu TehsiI Ranbirsinghpora Tehsil
District Kathua Kathua Tehsil
Percent Percent increase in urban population increase of ,-.--------------"------------------..,
Tehsil (a) 10-19.9 (b)20-24.9 (c)25-29.9 (d)30-39.9 (e)40-49.9 -(t,}iibove 50
2
ID.15 12.43
15.02
13.62
15.37 13.24
15.06
20.44 11.54
14.86
3 4
16.40
228
5 6 7 8
33.65 104.63
49.96
100.00 100.00
37.50
29.57 224.79
32.43
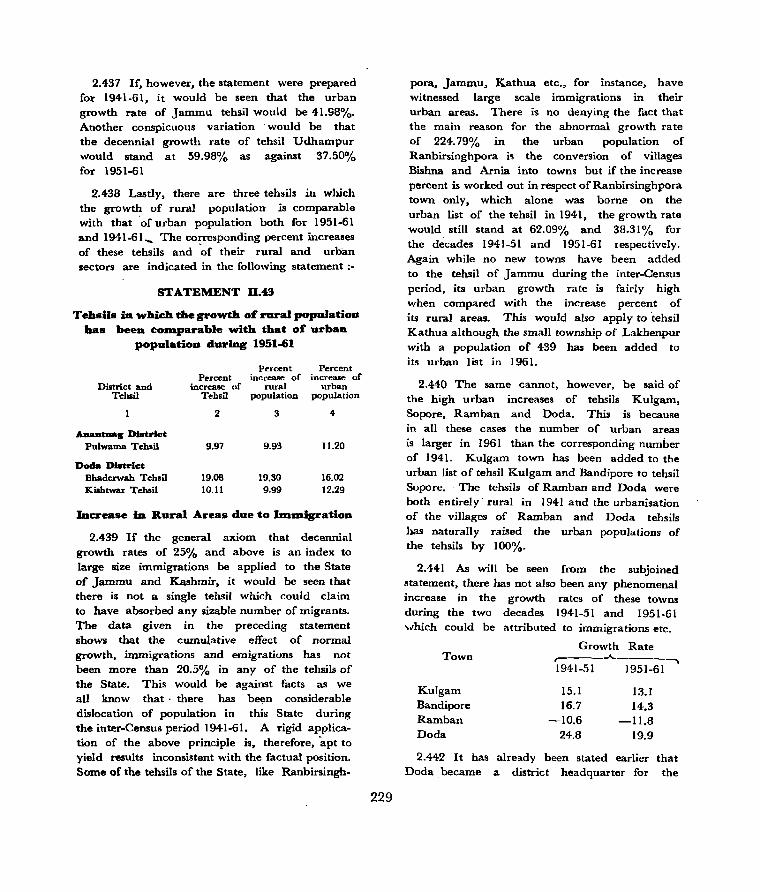
2.437 If, however, the statement were prepared for 1941.61, it would be seen that the urban growth rate of Jammu tehsil would be 41.98%. Another conspicuous variation 'would be that the decennial growth rate of tehsil Udhampur would stand at 59.98% as against 37.50% for 1951-61
2.438 Lastly, there are three tehsils in which the growth of rural population is comparable with that 'of urban population both for 1951-61 and 1941-61_ The corresponding percent increases of these tehsils and 'of their rural and urban sectors are indicated in the following statement :-
STATEMENT n.43
TehsUs m which the growth of rural popalatioa has beea cOIBparable with that or urban
popalation during 1951-61
percent Percent Percent increase of increase of
District and increase ur rural urban Tehsil Tehsil population population
2 3 4
Aaaa-C District Pulwama Tehsil 9.97 9.93 11.20
Doda District Bhaderwah Tehsil 19.08 19.30 16.02 Kiahtwar Tehsil 10.11 9.99 12.29
Inerease in Rural Areas due to IlDlDigration
2.439 If the general axiom that decennial growth rates of 25% and above is an index to large size immigrations be applied to the State of Jammu and Kashmir, it would be seen that there is not a single tehsil which could claim to have absorbed any sizable number of migrants. The data given in the preceding statement shows that the cumul.ative effect of normal growth, immigrations and emigratiuns has not been more than 20.5% in any of the tehsils of the State. This would be against facts as we all know that· there has been considerable dislocation of population in this State during the inter-Census period 1941-61. A rigid application of the above principle is, therefore, apt to yield results inconsistent with the factual position. Some of the tehsils of the State, like Ranbirsingh-
229
pora, Jammu, Kathua etc., for instance, have witnessed. large scale immigrations in their urban areas. There is no denying the fact that the main reason for the abnormal growth rate of 224.79% In the urban population of Ranbirsinghpora is the conversion of villages Bishna and Arnia into towns but if the increase percent is worked out in respect of Ranbirsinghpora town only, which alone was borne on the urban list of the tehsil in 1941, the growth rate would still stand at 62.09% and 38.31% for the decades 1941-51 and 1951-61 respectively. Again while no new towns have been added to the tehsil of Jammu during the inter-Census period, its urban growth rate is fairly high when compared with the increase percent of its rural areas. This would also apply to tehsil Kathua although the small township of Lakhenpur with a popUlation of 439 has been added to its urban list in 1961.
2.440 The same cannot, however, be said of the high urban increases of tehsils Kulgam, Sopore, Ramban and Doda. This is because in all these cases the number of urban areas is larger in 1961 than the corresponding number of 1941. Kulgam town has been added to the urban list of tehsil Kulgam and Bandipore to tehsil Sopore. The tehsils of Ramban and Doda were both entirely' rural in 1941 and the urbanisation of the villages of Ramban and Doda tehsils has naturally raised the urban populations of the tehsils by 100%.
2.441 As will be seen from the subjoined statement, there has not also been any phenomenal increase in the growth rates of these towns during the two decades 1941-51 and 1951-61 which could be attributed to immigrations etc.
Town
Kulgam Bandipore Ramban Doda
Growth Rate r----........ ------. 1941-51 1951-61
15.1 13.1 16.7 14.3
-10.6 -II.8 24.8 19.9
2.442 It has already been stated earlier that Doda became a district headquarter for the
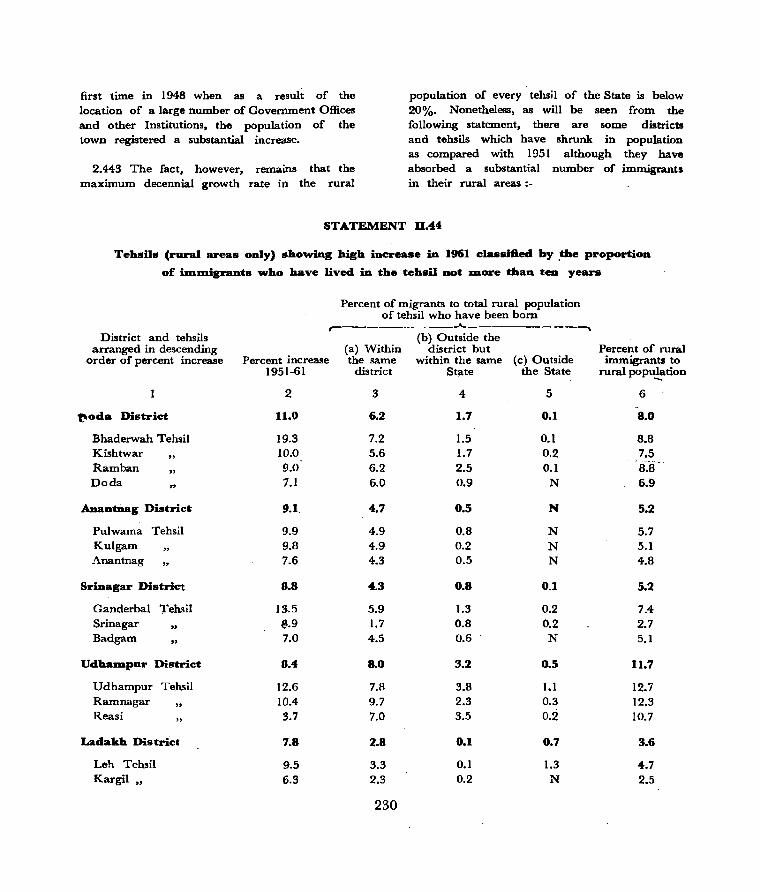
first time in 1948 when as a result of the location of a large number of Government Offices and other Institutions, the population of the town registered a substantial increase.
2.443 The fact, however, remains that the maximum decennial growth rate in the rural
population of every tehsil of the State is below 20%. Nonetheless, as will be seen from the following statement, there are some districts and tehsils which have shrunk in population as compared with 1951 although they have absorbed a substantial number of immigrants in their rural areas:-
STATEMENT 0.44
Tehsils (rural areas only) showing high increase in 1961 classified by .the proportion
of mlDigrants who have lived in the tehsil DOt lDore than ten years
District and tehsils arranged in descending
order of percent increase
f'oda District
Bhaderwah Tehsil Kishtwar
" Ramban " Doda "
AnantDag District
Pulwama Tehsil Kulgam Anaxitnag
" Srinagar District
Ganderbal Tehsil Srinagar
" Badgam "
UdhalDpur District
Udhampur Tehsil Ramnagar Reasi
" Ladakh District
Leh Tehsil
Kargil "
Percent of migrants to total rural population of tehsil who have been born
r----------..A----------~ (b) Outside the
(a) Within district but Percent increase the same within the same (c) Outside
1951-61 district State the State
2 3 4 5
U.Q 6.2 1.7 0.1
19.3 7.2 1.5 0.1 10.0 5.6 1.7 0.2 9.0 6.2 2.5 0.1 7.1 6.0 0.9 N
9.1. 4.7 0.5 N
9.9 4.9 0.8 N 9.8 4.9 0.2 N 7.6 4.3 0.5 N
8.8 4.3 0.8 0.1
]3.5 5.9 1.3 0.2 8.9 1.7 0.8 0.2 7.0 4.5 0.6 N
8.4 8.0 3.2 0.5
12.6 7.8 3.8 1.1 ]0.4 9.7 2.3 0.3 3.7 7.0 3.5 0.2
7.8 2.& 0.1 0.7
9.5 3.3 0.1 1.3 6.3 2.3 0.2 N
230
Percent of rural immigrants to
rural poP\l~tion
6
&.0
8.8 7.5 B.S-·· 6.9
5.2
5.7 5.1 4.8
5.2
7.4 2.7 5.1
11.7
12.7 12.3 10.7
3.6
4.7 2.5
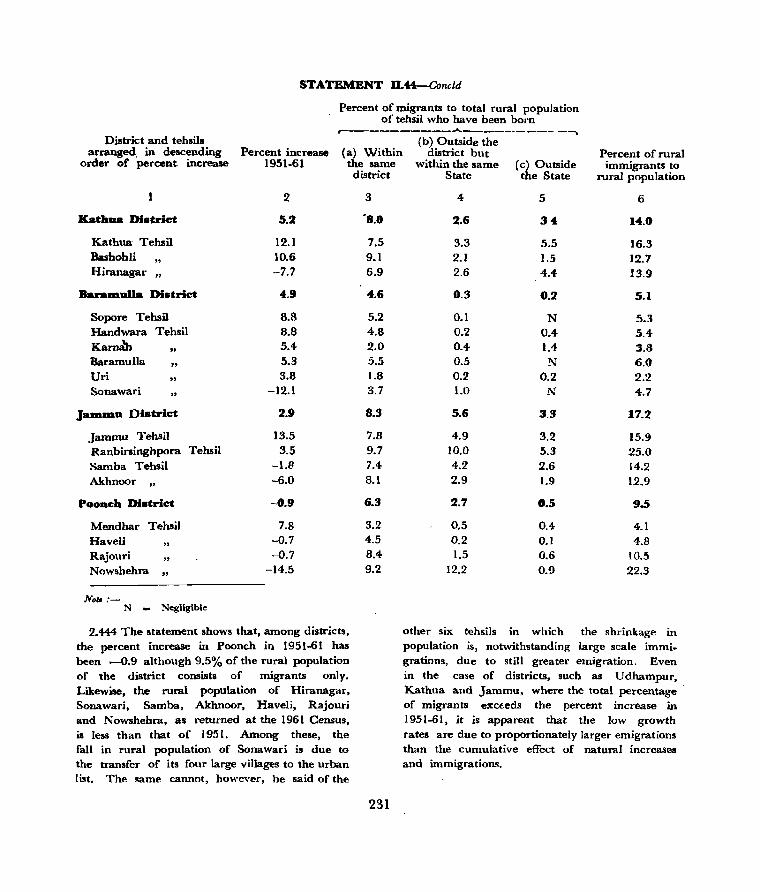
STATEMENT D.t4-Concld
Percent of migrants to total rural population of tehsil who have been bom r-----------,.I\".-______ .. ___ ~
District and tehsils arranged. in descending
order of percent increase Percent increase
1951-61 (a) Within the same district
Katla_ District
Kathua Tehsil Bashohli
" Hiranagar ..
BaraDl1lll_ Distriet
Sopore Tehsil Handwara Tehsil
KarnJh Baramulla Uri Sonawari
" "
J_IDDua Diatrict
Jammu Tehail Ranbirsinghpora Tehsil Samba Tehsil
Akhnoor "
Pooacla Distriet
Mendhar Tehsil
Haveli Rajouri Nowshehra
N.t, :-
" " "
N = Negligible
2
5.2
12.1 10.6 -7.7
4.9
8.8 8.8 5.4 5.3 3.8
·-12.1
2J~
13.5 3.5
-1.8 -6.0
-0.9
7.8 -0.7 -0.7
-14.5
2.444 The statement shows that, among districts, the percent increase in Poonch in 1951-61 has been -0.9 although 9.5% of the rural population of the district consists of migrants only. Likewise, the rural population of Hiranagar, Sonawari, Samba, Akhnoor, Haveli, Rajouri and Nowshehra, as returned at the 1961 Census, is less than that of 1951. Among these, the fall in rural population of Sonawari is due to the transfer of its four large villages to the urban list. The same cannot, howe'ver, be said of the
3
'8.0
7.5 9.1 6.9
4.6
5.2 4.8 2.0 5.5 1.8 3.7
8.3
7.8 9.7 7,4
8.1
6.3
3.2 4.5 8,4 9.2
231
(b) Outside the district but
within the same (c) Outside . State the State
4
2.6
3.3 2.1 2.6
0.3
0.1 0.2 0.4 0.5 0.2 1.0
5.6
4.9 10.0 4.2 2.9
2.7
0.5 0.2 1.5
12.2
5
34
5.5 1.5 4.4
0.2
N 0.4 1.4 N
0.2 N
3.3
3.2 5.3 2.6 1.9
0.5
0.4 0.1 0.6 0.9
Percent of rural immigrants to
rural population
6
14.0
16.3 12.1 13.9
5.1
5.3 .5.4 3.8 6.0 2.2 4.7
17.2
15.9 25.0 14.2 12.9
9.5
4.1 4.8
10.5 22.3
other six tehsils in which the shl"in'kage in popUlation is, notwithstanding large scale immi_ grations, due to still greater emigration. Even in the case of districts, such as Udhampur, Kathua and Jammu, where the total percentage of migrants excE.eds the percent increase in 1951-61, it is apparent tha t the low growth rates are due to proportionately larger emigrations than the cumulative effect of natural increases and immigrations.
2.445 An important feature of the above statement is that the percentage increase is mostly contributed by the high proportion of migrants belonging to the district of enumeration. The only tehsils in which the proportions of migrants from other districts. of the St~te are higher consist of Ranbirsinghpora and Nowshehra. There are a few other ditricts and tehsiis, such as the district and tehsil of Kathua, tehsils of Hiranagar, Karnah and Leh etc. where the number of immigrants from outside the State exceeds the number of those belonging to other districts of the State.
TehsUs with Higher Growth ~ateB than that of 1:he State
2.446 Following are the tehsils in which the growth rate exceeds the average decennial increase for the State as a whole:-
(1) Sopore (9) Doda
(2) Ganderbal (10) Bhaderwah
(3) Srinagar (II) Bashohli
(4) Pulwama (12) Kathua
(5) Kulgam (13) Ramnagar
(6) Ramban ( 14) Udhampur
(7) Anantnag (15) Jammu
(8) Kishtwar (16) Ranbirsinghpora
2.447 The tehsils when plotted on the map would appear to constitute Ii conglomeration of, contiguous areas which may be sub-divided into the following three groups:-
(A) Tehsils of high rural increases with immigrations exceeding one-third of total increase
Ganderbal, Bhaderwah, Ramnagar, Bashohli.
(B) Tehsils of high ul'ban increases suggestive of immigration
Anantnag, Kulgam, Srinagar, Sopore, Ramban, Doda, Udhampur, Jammu, Ranbirsinghpora, Kathua.
(C) Tehsils of even or comparable rural or urban increase
Pulwarna, Kishtwar.
232
2.448 There is no tehsil in the State with a growth rate above that of the State in which less than one-third of rural increase is due to immigrations.
2.449 Tehsil Ganderbal is entirely' rural and is not contiguous with Bhaderwah, _ Ramnagar and Bashohli although like the latter three tehsils, it has also absorbed an appreciable number of immigrants. Most of these hail from the other parts of the same district beirig ~ttracted by larger avenUE,. of employment whicJ:l haye become' available consequent upon the construction of Srinagar-Ganderbal-Kargil-Leh road.'
2.450 With the construction of Dhar-Udhampur ' road which passes through Bashohli and Ramnagar tehsils and links up Udhampur ~irect with Pathankot, a substantial proportion ()~ ,the rural population of the districts of U dhamptir and Kathua has migrated to the two tefisi)s to avail of the nUlllerous avenues of employment which have been thrown open by this road.
2.451 Bhaderwah has been all along a, comparatively flourishing tehsil on _a~«<cll~,I1t of its fertile areas' which are, rare' iii. other parts of district Dada, With the implementation of developmental plans, the tehsil is attracting people hoth from within and outside the district.
2.452 In so far as group (B) is conc~rned, it will be seen that if the immigrations are not accounted for, the natural growth rates in the rural sectors of these tehsils wOlJld be faj~ly low as indicated below :- '
Anantnag 2.8% Ramban 0.2%
Kulgam 4.7% Doda 0.2%
Srinagar 6.2'% Udhampur -0.1%
Sopore 3.5% Jammu -2.4% Ranbirsinghpora-21.,')% Kathua -4.2%
2.453 Notwithsta~ding these low rural growth rates, the overall increases in these tehsils are fairly high hecause of comparatively large urban growth rates, as indicated below:-

zo~
....
s
.. / .
{~.""""'"
..... ~
N A
'" '" .. '" .;
~ ;;;
0
" III .. '"
>
'" .., III
.; -:; > a:
• .2 :::>
... ~a ...
>

Overall Urban increase increase
(1951-61) (1951-61)
Anantnag 10.15% 33.65%
Kulgam 12.43% 104.63%
Srinagar 15.02% 16.400,{,
Sopore 13.62% 49.96%
Ramban 15.37% 100.00%
Dada 13.24% 100.00%
Udhampur 15.06% 37.50%
Jammu 20.44% 29.57%
Ranbirsinghpora 11.54% 224.79%
Kathua 14.86% 32.43%
2.454 Reasons for these abnormal increases ha'(e already been hinted at in a previous paragraph. In most of the tehsils, such as Anantnag, Kulgam, Sopore, Ramban, Doda and Ranbirsinghpora, the number of urban areas has increased. This, of course, is not the exclusive reason for these high growth rates. Other causes which account for the increase are the construction of new roads, setting up of new industries and expansion of commercial activities. In Udhampur, Jammu, Ranbirsinghpora and Kathua, the main cause is the large scale immigrations fwm other parts of the State and from outside.
2.455 There flas been no change in the number of urban areas of the tehsils of Pulwama and Kishtwar when compared with 1951. The rural and the urhan growth rates of these tehsils do not, therefore, disclose any substantial disparity though in both cases the nrban increase pel'cent is slightly larger than the rural growth rate.
Tehsils with Lower Growth Rates thaD those of their respective Districts
2:456 Let us now take up the tehsils in which the growth rate is lower than the average increase of their respective districts. There are seventeen such tehsils which are classifiable into the following three broad categorics:-
(a) Tehsils in which there has been actual decrease from 1951.
..:l33
Tehsil Growth Rate r----A---~
r--_.- J.... ___ --,
1. Nowshehra -11.09% 2. Akhnoor 5.61% 3. HiTanagar 2.77% 4. Samba 1.03%
(b) Tehsils in wh~ growth rate does not
exceed 9.90%
1. Rajouri 0.02% 2. UTi 2.72% 3. Reasi 3.63% 4. Karnah 5.45% 5. Kargil 6.30% 6. Baramulla 7.59% 7. Sonawari 8.56% 8. Badgam 8.72% 9. Handwara 8.77%
(c) Tehsils in which growth rates vary from
9.91% to 19.90%
1. Pulwama 9.97% 2. Kishtwar 10.11% 3. Anantnag 10.15% 4. Doda 13.24%
2.457 The main cause fOT the fall in the. population of the first four tehsils is the mass migration of people after 1947 to the areas on the other side of the Cease-fire Line The vacuum created by these out-migrations has been partially made up by immigrations and natural increases. The decrease disclosed by the 1961 figures is actually a legacy .of 1941 which is reflected in the fignres of 1951 and has not been made up during the inter-Census period 1951-61, as indicated below:-
Adjusted population of 1941 in respect of the ar .... within the 1961
Tchsil jurisdiction of the tehsil
1941 1951 1961
Nowshehra 63,019 56,730 50,441
Akhnoor 1,08,707 1,02,936 97,165
Hiranagar 59,670 58,058 56,447
Samba 80,fiG7 79,842 79,018
2.458 According to these figures, the population of the four tehsils has been progressively declining
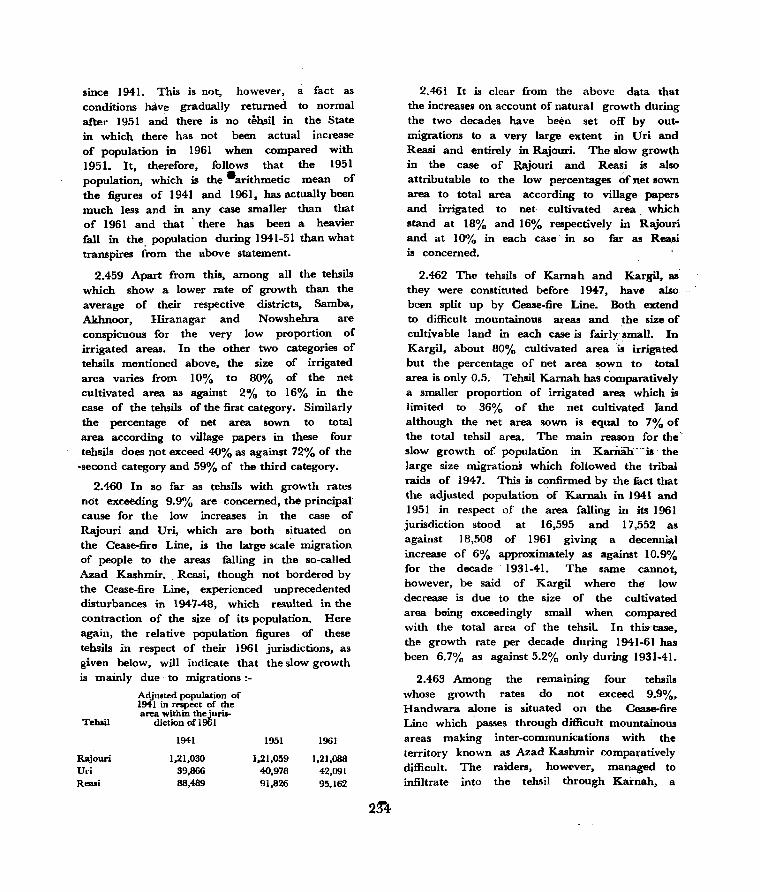
since 1941. This is not, however, a fact as conditions have gradually returned to normal after 1951 and there is no tehsil in the State in which there has not been actual increase of population in 1961 when compared with 1951. It, therefore, follows that the 1951 population, which is the -arithmetic mean of the figures of 1941 and 1961, has actually been much less and in any case smaller than that of 1961 and that there has been a heavier fall in the. population during 1941-51 than what transpires from the above statement.
2.459 Apart from this, among all the tehsils which show a lower rate of growth than the average of their respective districts, Samba, Akhnoor, lIiranagar and Nowshehra are conspicuous fOl· the very low proportion of irrigated areas. In the other two categories of tehsils mentioned above, the size of irrigated area varies from 10% to 80% of the net cultivated area as against 2% to 16% in the case of the tehsils of the first category. Similarly the percentage of net area sown to total area according to village papers in these four tehsils does not exceed 40% as against 72% of the
·second category and 59% of the third category.
2.460 In so far as tehsils with growth rates not exceeding 9.9% are concerned, the principal cause for the low increases in the case of Rajouri and Uri, which are both situated on the Cease-fire Line, is the large scale migration of people to the areas fulling in the so-called Azad Kashmir .. Reasi, though not bordered by the Cease-fire Line, experienced unprecedented disturbances in 1947-48, which resulted in the contraction of the size of its population. Here again, the relative popUlation figures of these tehsils in respect of their 1961 jurisdictions, as given below, will indicate that the slow growth is mainly due to migrations:-
Adjusted population of 1941 in r ... pect of the
Teluil area within the juris-
diction of 1961
1941 1951 1961
Rajouri 1,21,030 1,21.059 1,21.088 Uri 39,866 40.978 42,091 Reasi 88,489 91,826 95,162
2.461 It is clear from the above data that the increases on account of natural growth during the two decades have been set off by outmigrations to a very large extent in Uri and Reasi and entirely in Rajouri. The slow growth in the case of Rajouri and Reasi is also attributable to the low percentages ~f net lown area to total area according to village papers and irrigated to net· cultivated area which stand at 18% and 16% respectively in Rajouti and at 10% in each case in so far as Reasi is concerned.
2.462 The tehsils of Karnah and Kargil, as they were constituted before 1947, have also been split up by Cease-fire Line. Both extend to difficult mountainous areas and the' size of cultivable land in each case is fairl~·~mal1. In Kargil, about 80% cultivated area is irrigated but the percentage of net area sown to total area is only 0.5. Tehsil Karnah has comparatively a smaller proportion of irrigated area which is limited to 36% of the net cultivated mnd although the net area sown is equal to 7% of the total tehsil area. The main reason for the' slow growth of' population in Karnan··-1s· the large size migrationS which followed the tribal raids of 1947. This is confirmed by the mct that the adjusted population of Karnah in 1941 and 1951 in respect of the area falling in its 1961 jurisdiction stood at 16,595 and 17,552 as against 18,508 of 1961 gIvmg a decennial increase of 6% approximately as against 10.9% for the decade· 1931-41. The same cannot, however. be said of Kargil where the low decrease is due to the size of the cultivated area being exceedingly small when compared with the total area of the tehsil. In this-ease, the growth rate per decade during 1941-61 has been 6.7% as against 5.2% only during 1931-41.
2.463 Among the remaining four tehsils whose growth rates do not exceed 9.9%. Handwara alone is situated on the Cease-fire Line which passes through difficult mountainous areas making inter-communications with the territory known as Azad Kashmir comparatively difficult. The raiders, however. managed to infiltrate into the tehsil through Karnah, a

contiguous tehsil, and occupied pOI·tions of its north_western sector. Badgam, Baramulla and Sonawari are situated in the interior and ordinarily they should have remained unaffected by the tdbal raids. It is, however, a known fact that' tire raiders after advancing via KohalaDomel-Uri-Baramulla road, the traditional route of the State, penetrated deep into the valley and were repulsed only when they had reached Shalteng, a village 5 miles to the north of Srinagar city. The entire tehsils of Sonawari, Baramulla and parts of Badgam and GaHderbal were occupied and rummaged by them though for a very short duration only. As may therefore be expected, the raids had the inevitable effect of crippling the economy of the tehsils and of causing out-migrations on a substantial scale, mostly to the urban areas of the district or . to other parts of the State. This will be evident from the fact that the rural growth rate of tehsil Baramulla does not exceed 5.3% as against over 23% of its urban sector. A comparison of the lists of urban areas of the tehsil for 1941 and 1961 shows that except for the addition in 1961 of the small notified area of Gulmarg with a population of 206 souls only, there has been no change in the urban areas of the tehsil. Obviously, this could not cause any phenomenal increase in the urban population or make any material difference in the rural growth rate. On the other hand, it is a known fact that many of the migrants of Baramulla tehsil have settled in Batote, Kud, Udhampur and different parts of Jammu district. This is also why the overall growth rate of the tehsil during 1951-61 is limited to 7.6% as against 9.4% in 1931-41.
2.464 With the expansion of industrial and commercial activity in Srinagar city, there is a growing tendency among the rural inhabitants of the contiguous tehsil of Badgam to settle in the city where larger avenues of employment are available. The analysis of the growth rate of the 1961 population of Srinagar shows that, among others, the immigrants include 3,275 persons born in the rural areas of Srinagar district and enumerated in Srinagar city. As the growth rates of the other constituent tehsils of this district, namely
235
Srinagar • and Ganderbal, are higher than the average increase of the district as a whole, it may well be inferred that the 3,275 immigrants hail from the rural areas of tehsil Badgam. But for their migration, the rural growth rate of tehsil Badgam sho.uld have been 8.7% or almost the same as for the rural sector of the entire district. Further, if there had not been any such migrations, the overall growth rate for the entire tehsil should not have been less than 10.4% or 2.3% less than the .average increase of the entire district.
2.465 The low growth rate of Badgam appears to be a legacy of 1931-41. A reference to the Census Report of 1941 will show that the decennial increase of the population of Badgam during 1931-41 did not exceed 7.12% as against 9.39% of district Bal'amulla to which the tehsil then belonged. Even the growth rate of the tehsil on the basis of its 1931 and 1941 adjusted population has been low as compared with the overall increase of Srinagar, its parent district in 1961. These figures show that the decennial increase of the tehsil stood at 7.20% only while that of the district as a whole was no less than 14.10%.
2 .. 466 It goes .without saying that while Badgarr. includes the most fertile areas of the valley, there are very few, if any, alternative avenues of employment available to the people. No industries other than the traditional rural crafts have as yet been set up in any part of the tehsil nor have any of its mineral resources, like lignite deposits available at Raithan, been. exploite.d. The pressure on land is steadily growing and the holdings are becoming· uneconomic in the large majority of cases.' There is, therefore, an increasing tendency to migrate to areas where larger avenues of employment are available.
2.467 Sonawari became a tehsil for the first time during the decade 1.951-61. I t consist~ of low-level areas extending on either side of river Jhe1um about 5 miles to the north of Srinagar. The tehsil has been a deficit area all along in the past as with the slightest rise
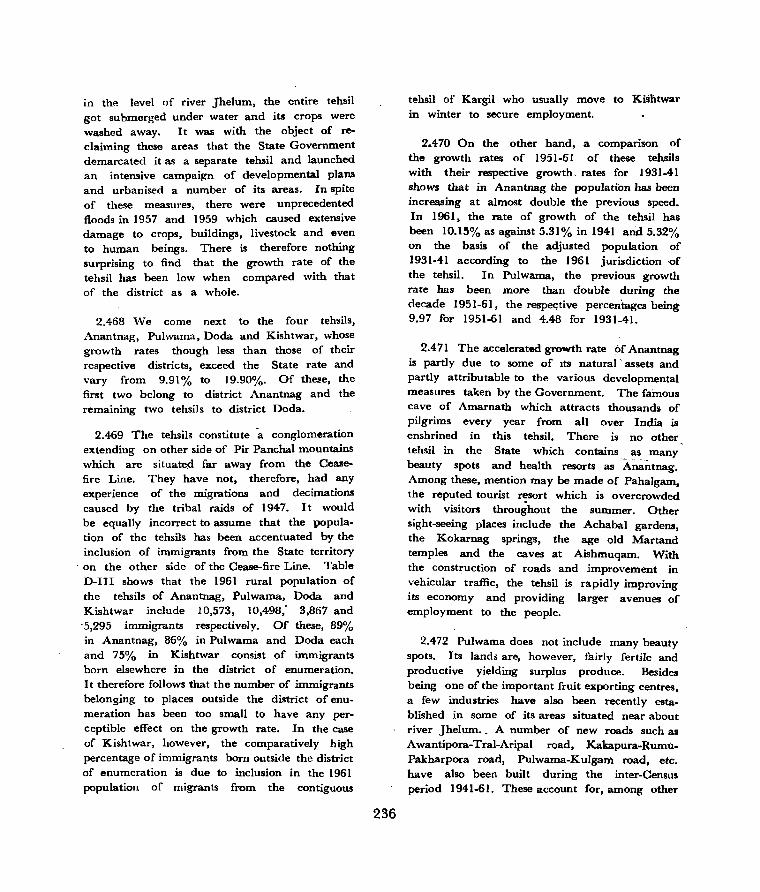
in the level of river Jhelum, the entire tehsil got submerged under water and its crops were washed away. It was with the object of reclaiming these areas that the State Government demarcated it as a separate tehsil and launched an intensive campai([n of developmental plans and urbanised a number of its areas. In spite of these measures, there were unprecedented floods in 1957 and 1959 which caused extensive damage to crops, buildings, livestock and even to human beings. There is therefore nothing surprising to find that the growth rate of the tehsil has been low when compared with that of the district as a whole.
2.468 We come next to the four tehsils, Anantnag, Pulwama, Doda and Kishtwar, whose growth rates though less than those of their respective districts, exceed the State rate and vary from 9.91% to 19.90%. Of these, the first two belong to district Anantnag and the remaining two tehsils to district Doda.
2.469 The tehsils constitute a conglomeration extending on other side of Pir Panchal mountains which are situate.d far away from the Ceasefire Line. They have not, therefore, had any experience of the migrations and decimations caused by the tribal raids of 1947. It would be equally incorrect to assume that the population of the tehsils has been accentuated by the inclusion of immigrants from the State territory
. on the other side of the Cease-fire Line. Table D-III shows that the 1961 rural population of the tehsils of Anantnag, Pulwama, Doda and Kishtwar include 10,573, 10,498; 3,867 and
'5,295 immigrants respectively. Of these, 89% in Anantnag, 86% in Pulwama and Doda each and 75% in Kishtwar consist of immigrants born elsewhere in the district of enumeration. It therefore follows that the number of immigrants belonging to places outside the district of enumeration has been too small to have any perceptible effect on the growth rate. In the case of Kishtwar, however, the comparatively high percentage of immigrants born outside the district of enumeration is due to inclusion in the 1961 population of migrants from the contiguous
236
tehsil of Kargil who usually move to Kishtwal' in winter to secure employment.
2.470 On the other hand, a comparison of the growth rates of 1951-61 of these tehsils with their respective growth. rates for 1931-41 shows that in Anantnag the population has been increasing at almost double the previous speed. In 1961, the rate of growth of the tehsil has been 10.15% as against 5.31% in 1941 and 5.32% on the basis of the adjusted population of 1931-41 according to the 1961 jurisdiction ·of the tehsil. In Pulwama, the previous growth rate has been more than double during the decade 1951-61, the respe<;tive percentages being 9.97 for 1951-61 and 4.48 for 1931-41.
2.471 The accelerated growth rate of Anantnag is partly due to some of Its natural' assets and partly attributable to the various developmental measures taken by the Government. The famous cave of Amarnath which attracts thousands of pilgrims every year from all over India is enshrined in this tehsil. There is no other tehsil in the State which contains as many beauty spots and health resorts as Amlntnag. Among these, mention maybe made of PahaJgam, the reputed tourist resort which is overcrowded with vlSltors throughout the summer. Other sight-seeing places include the Achabal gardens, the Kokarnag springs, the age old Martand temples and the caves at Aishmuqam. With the construction of roads and improvement in vehicular traffic, the tehsil is rapidly improving its economy and providing larger avenues of employment to the people.
2.472 Pulwama does not include many beauty spots. Its lands are, however, fairly fertile and productive yielding surplus produce. Besides being one of the important fruit exporting centres, a few industries have also been recently established in some of its areas situated near about river Jhelum.. A number of new roads such as Awantipora-Tral-Aripal road, Kakapura-RumuPakharpora road, Pulwama-Kulgam road, etc. have also been built during the inter-Census period 1941-61. These account for, among other
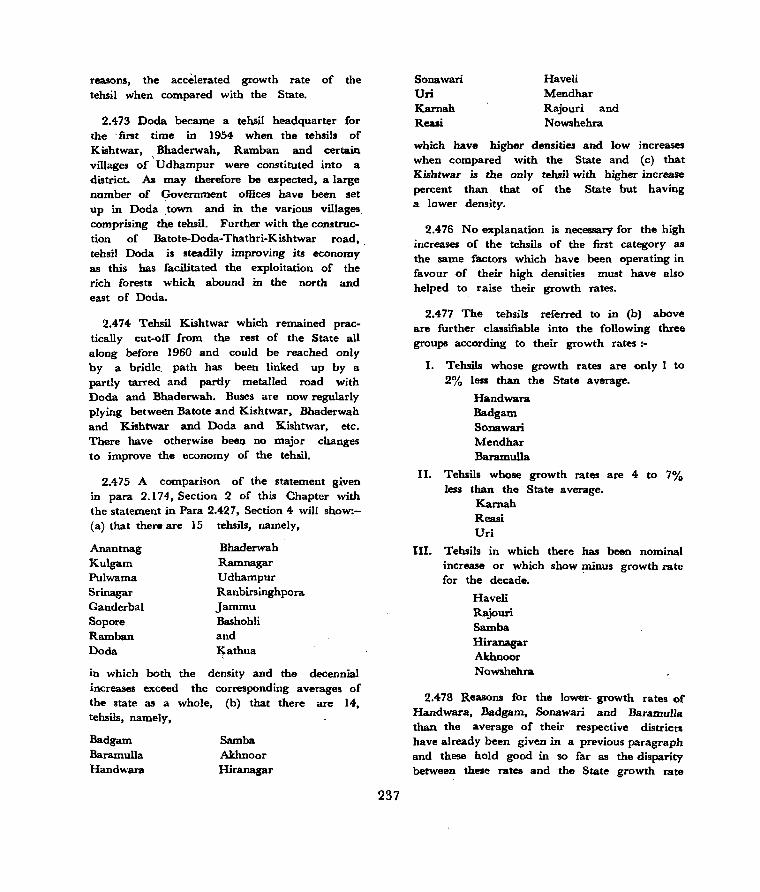
reasons, the accelerated growth rate of the tehsil when compared with the State.
2.473 Doda became a tehsil headquarter for the . first time in 1954 when the tehsils of Kishtwar, . Bhaderwah, Ramban and certain villages of Udhampur were constituted into a district. As may therefore be expected, a large number of Government offices have been set up in Doda ,town and in the various villages. comprising the tehsil. Further with the construction of Batote-Doda-Thathri-Kishtwar road,. tehsil Doda is steadily improving its economy as this has facilitated the exploitation of the rich forests which abound in the north and east of Doda.
2.474 Tehsil Kishtwar which remained practically cut-off from the rest of the State all along before 1960 and could be reached only by a bridle path has been linked up by a partly tarred and partly metalled road with Doda and Bhaderwah. Buses are now regularly plying between Batote and Kishtwar, Bhaderwah and Kishtwar and Doda and K.ishtwar, etc. There have otherwise beeu no major changes to improve the economy of the tehsil.
2.475 A comparimn of the statement given in para 2. 174, Section 2 of this Chapter with the statement in Para 2.427, Section 4 will show:(a) that there are 15 tehsils, namely,
Anantnag Bhaderwah Kulgam Ramnagar Pulwama Udhampur Srinagar Ranbirsinghpora Ganderbal Jammu Sopore Bashohli Ramban and Doda Kathua
in which both the density and the decennial increases exceed the corresponding averages of the state as a whole, (b) that there are 1+. tehsils, namely,
Badgam Baramulla Handwara
Samba Aklmoor Hiranagar
237
Sonawari Uri Karnah Reasi
Haveli Mendhar Rajouri and Nowshehra
which have higher densities and low increases when compared with the State and (c) that Kishtwar is the only tehsil with higher increase percent than that of the State but having a lower density.
2.476 No explanation is necessary for the high increases of the tehsils of the first category as the same factors which have been operating in favour of their high densities must have also helped to raise their growth rates.
2.477 The tehsils referred to in (b) above are further classifiable into the following three groups according to their growth rates:-
I. Tehsils whose growth rates are only 1 to 2% less than the State average.
Handwara Badgam Sonawari Mendhar Baramulla
II. Tehsils whose growth rates are 4 to 7%
III.
less than the State average. Karnah Reasi Uri
Tehsils in which there has been nominal increase or which show minus growth rate for the decade.
Haveli Rajouri Samba Hiranagar Akhnoor Nowshehra
2.478 Reasons for the lower- growth rates of Handwara. Badgam, Sonawari and Baramulla than the average of their respective districts have already been given in a previous paragraph and these hold good in so far as the disparity between these rates and the State growth rate
is concerned, Other reasons which account for the low increase percent of the four tehsils are mentioned below:-
(I) The 1957 and Sonawari,
damages caused by the floods of 1959, particularly to the tehsil of
{2} The economic distress which most of these tehsils witnessed following the tribal raid~ of 1947,
(3) The low productivity of the tehsil!! of Handwara and Sonawari which have ail along in the past been treated as deficit areas in respect of food crops,
(4) Lack of new irrigational facilities in Handwara and large areas of Baramulla and Badgam tehsils,
(5) Absence of any industries other than the traditional rural crafts.
2.479 Tehsil Mendhar is distinguishable from the four tehsils referred to above for its high growth rate .which even exceeds -that of Poonch district as a whole. It is rich in forests and includes the most fertile areas of the district. Since, however, the tehsil has been split up by the Cease-fire Line, it has experienced sizable in and out-migrations during the previous fourteen years. Further, neither' in this tehsil nor in any other part of the district, any new irrigationaI,projects or industries have been established during the decade.
2.480 Of the three tehsils falling in group II, Karnah and Uri are both situated on the Cease-fire Line and have been split up by it. Even in normal times, Karnah was always a deficit area and its food produce had to be supplemented by imports from outside. This is also
'true of Uri, though' not to the same extent. The two tehsils have retained to this day their conservative complexion having neither been provided with any new irrigational facilities nor any new industries to augment the economic resources of the inhabitants. Further-more, many of the inhabitants have migrated to the area on the other side of the Cease-fire Line. The
238
cumulative effect of all these· factors has been the slow growth of population.
2.481 Reasi though situated centrally has suffered heavily during the disturbances of 1947 which resulted in decimations and out-migratioll!ll of a sizable order. The tehsil' is known to be richest in mineral deposits in the State but no . attempt to exploit any of" these except the extraction of coal at Jangalgali which ha~ been going on for about twenty years has been made during the decade under review. Further, not more than 10% of its cultivated area enjoys irrigational facilities, which have mostly been organised by the inhabitants themselves.
2.482 We next come to the third group comprising the six tehsils which ha~ either shrunk in population or in which the, growth rate '. has been insignificant.· The tehsils are bordered either by the Cease-fire Line or by the inter-na:tional border or by bOth. There have, therefore, been mass migrations to the area on the other side of the Cease-fire Line and to West Pakistan. This is also confirmed by a comparison of the community-wise ·population figures of the tehsils for 1961 with the corresponding figures of 1941. Besides, there has been no serious effort during the decade to provide new irrigational facilities to feed .the cultivable areas. This is apparent from the fact that not more than 2% cultivated area is irrigated in the tehsils of Samba and Nowshehra. In Akhnoor and Haveli, the size of irrigSlted area is limited to 6% and 12% of net cultivated area respectively. Hiranagar and Rajouri are the only tehsils where the corresponding percentages are comparatively higher, being 16% of the net cultivated area in each case.
2.483 These retarding factors have further been reinforced by the absence of developmental works and new projects which' could provide alternative avenues of employment and improve the g~owth rates. It is significant to note that notwithstanding the fact that displaced persons and other immigrants have" settled in most of these tehsils, they have not made up the shortfall caused by the out-migrations and
have registered decreases in population when compared with 1951.
2.484 Kishtwar ranks third in area among the tehsils of the State including those constituting the district of Ladakh. It extends to 3,017 sq. mil~s and is inhabited by 74,594 persons only. As may therefore be expected, it has a lower density than that of the State as a whole. The higher growth rate of the tehsil is mainly due to the construction of the 7().mile metalled road connecting the tehsil with the National Highway and the other tehsils of district Doda from which it could be approached by bridle paths only in the past. Passenger buses and truck-loads now regularly operate between Jammu and Kishtwar and this has obviously helped to improve the economy of the tehsil. Another reason, though not as important, for the high growth rate of the tehsil is the inclusion in its rural population of 1,322 persons mostly belonging to the contiguous district of Ladakh.
Districtwise. Growth Rates of PopulatioD between 1951 and 1961
2.485 The following statement shows at a glance the growth rates of the population during 1951-61 for the State as a whole and for its constituent districts:-
STATEMENT 11.45
Percentage decemdal merease in populatioD of districts betweeD 1951 and 1961
State/District
Ja:m:mu aDd Kashmir Anantnag Srinagar Baramulla Ladakh Doda Udhampur Jammu Kathua Poonch
Increase
9.44% 10.83% 12.71% 9.08% 7.66%
14.21% 9.10% 9.33% 7.73% 0.24%
It is clear that the rates of increases in districts Baramulla. Udhampur and Jammu have been On the whole moderate and almost at par with
239
that of the State. WlIie Anantnag has had a slightly higher increas~, the growth rates of Srinagar and Doda are substantially large when compared with the overall increase of the State. Similarly, the rates of inc~ases in Ladakh and Kathua are slightly less than that of the State, the difference in each case being about 2% only. District Poonch stands out prominently on account of its nominal increase of 0.24%.
2.486 As there have been large scale migrations and immigrations in several districts, it would have been worthwhile to determine the actual growth rate by working out the difference between the populations of 1941 and 1961 as arrived at after adding or deducting the net effect of in and out-migrations during the decade 1931-41 and the two decades 1941-61 to the adjusted population of 1941 and the Census population of 1961 respectively. This is not possible due to the non - availability of the number of persons who migrated to Pakistan or to Pak-held territory.
2.487 There is another way of making an approximate assessment of the actual growth rate of the State during the two decades, 1941-61. The State territory on this side of the Cease-fire Line consists of nine districts. Of these, some have been affected directly or indirectly by the tribal raids of 1947 while others being situated in the interior have not had any such experience. The former include districts like Poonch and Ladakh which have shrunk in jurisdiction because of being split up by the Cease-fiire. Line jis also the districts whose jurisdictions have been extended for the administration of the residual parts of areas which now lie on the other side of the Ceasefire Line. Jammu and Baramulla are two such districts whose 1961 jurisdictions extend beyond their limits of 1941 due to the merger of parts of erstwhile districts of Mirpur and MuzaffaTabad which have fallen on this side of the Cease-fire Line. The affected districts also include those whose 1941 jurisdictions have remained unchanged but which have all the same witnessed large emigrations and immigrations due to their being situated on the International
Border with Pakistan. '.oJ:.his i~ true particularly of Kathua which has • suffered any jurisdictional change but where the movement of population has been unusually large. U dhampur is the only district which, though not situated on the International Border or on the Ceasefire Line, has witnessed sizable in and outmigrations_
2.4-88 This leaves the districts of Doda, Anantnag and Srinagar unaccounted for. Being situated far away from the International Border on either side of Pir Panchal ranges, these districts have been least affected by the tribal raids of 1947. Their growth rates for 1951-61 which stand at 14.21%, 10.83% and 12.71% respectively compare :favourably with the increase percent of the State for the four decades 1921-61 as shown below;-
1961-51 1951-4-1 194-1-31 1931-21
9.4-4-% 10.42% 10.36% 10.14%
2.489 We will thus have to confine our enquiry to the remaining six districts Qllly which have returned lower growth rates than that of the State. Before 194-7, m~jority of the population inhabiting three of these districts, namely, Baramulla, Ladakh and Poonch, consisted of Muslims. Udhampur, Jammu and Kathua were, however, dominated by Hindus and other nonMuslim communities.
2.490 It is a known fact that following the raids of 1947, many Muslims living in border districts of Kathua and Ladakh and the tehsils of Karnah and Uri of Baramulla district migrated to the contiguous areas of West Pakistan or the State territory on the other side of the Cease-fire-Line. Likewise, the non-Muslim population inhabiting Mirpur, Kotli, Bhimber, Bagh, Palandhri, Gilgit, Skardu, etc. which now lie on the other side of Cease-fire Line, migrated mostly to Jammu district and to some extent to the districts of Kathua, Poonch and Udhampur.
2.491 For reasons already stated, it is not possible to assess even on an approximate basis the net effect of emigrations and immigrations
240
which the State as a whole witnessed .during the two decades, 1941-61. Roughly speaking, however, it is estimated that if. the growth rate during the two decades 1941-61 had been the same as that of 1931-41, the result of in and out-migrations and the net effect of deaths and births should have been a fall of 148,433 in the population of the State. But for this, the Census population in 1961 should li~ve stood at 3,709,409 (3,560,976 + ]48,433). On this basis, it may well be assumed that the 1951 population (adjusted population of the state in 1941 according to its 1961 jurisdiction + half the difference between this and the probable 1961 popUlation of the State) should have stood at 3,34],922, giving a growth rate of 1 t'Yo as against 9.4%, the growth rate worked out on the basis of assumed popUlation of 1951 and Census population of 1961. It may he noted here that the adjusted popUlation' /0£ 1941 referred to above, includes 27,706 pe~sons of 155 depopulated villages of Jammu district.
2.492 As stated earlier, district Anaritnag did not suffer any dislocation of population conse· quent upon the triba'! raids of 1947. It is for this reason that the growth rate in this district which stands at 10.83% is higher than- of- the State.
2.493 The growth rate of district Srinagar is already higher than that of the State. In this case also, however, the transfer of Secretariat Offices, Government Departments and their personnel to Jammu for winter months as also the migration of local businessmen etc., to the plains has affected the growth rate which should otherwise have been still higher than that returned at the Census.
2.494 Baramulla district has returned a lower growth rate than tbat of the State. This is because the net effect of immigration into and emigration from the district is estimated to have been a :fall of 7,000 persons approximately. Even if these migrations had not taken place, the growth rate of the district woUld not have exceeded 9.6% which is still less than the probable increase of the State.

2.495 The district is bordered by the Ceasefire Line and was rummaged by the raiders resulting in the uprooting of the population inhabiting its north-western sector. For quite some time after the raids, conditions . continued to be abnormal and the economic structure of the district was practically shattered. This is why the district has not been able to keep pace with the growth rate of the State.
2.496 The subjoined statment giving the decennial increases of district Ladakh for the five decades ending 1961 will show that the low growth rate of the district. is a tradition of the past and is inherent in the conditions obtaining in the district.
Decade
1911-21 1921-31 1931-41 1941-51 1951·61
Growth rate
1.3% 4.8% 5.3% 8.3% 7.7%
2.497 The main reason which has been operating to arrest the growth of population in the district is the practice' of polyandry. Although this has now been prohibited under the law, the practice has not completely ceased nor have the polyandrous relations, which subsisted before the enforcement of this law, been severed. The growth rate, therefore, continues to be slow, though not to the same extent as before. This is evident from table C-II which shows that the number of. married males of the age of 35 and above exceeds the corresponding number of all married females in each age-group 35-39, 40.44, 45-49, etc. etc.
2.498 Another factor which has influenced the growth rate is that many Buddhist girls are dedicated to the monasteries and become nuns. Further, the cessation of commercial transactions with Central Asia and Tibet, which provided a substantial means of subsistence to the people of this economically most backward district, has also retarded the growth rate. On the other hand, while developmental activities are being carried out on an extensive scale in
241
other districts, very little appears to have been done so far to augment the avenues of employment and to improve the ecc;momic resources of the people of Ladakh.
... 2.499 The growth rate in district Doda is
the highest among all the districts and exceeds not only the actual increase percent of the State but even the probable growth rate which the State. should have registered, had there been no raids. There are several reasons for this, among which mention may be made of the following:-
(1) Before 1950, the tehsiIs now constituting district Dada formed part of U dhampur district along with the tehsils of Ramnagar and Udhampur. In 1948, the tehsils and a number of villages of the tehsils of Udhampur and Chenani Jagir were detached from Udhampur district and converted into a separate district with headquarters at Doda. As a result, a large number of district offices were set up at Dada and in the various tehsils of the district. In 1954, a new tehsil with headquarters at Dada was formed by a redistribution of the villages previously included in the tehsils of Bhaderwah, Ramban, Udhampur and the J agir of Chenani. With this change, a large number of tehsil offices were set up at Doda proper. The inevitable effect of these reorganisations was a proportionate increase in the population of - the district.
(2) The migration to district Doda of a section of the population which previously inhabited district U dhampur has also to some extent affected the growth rate.
(3) The construction of the 70-mile long partly tarred and partly metalled road 'from Batote to Kishtwar has for the first time connected the isolated tehsil of Kishtwar with the rest of the State. As may be expected, this has facilitated the expansion of commercial activities not only among the tehsils constituting the district but also as between the district and other parts of the State.
(4) Two of the tehsils of the district, namely, Doda and Bhaderwah, have been provided with
electric power as a result of which a number of industrial establishments are now functioning in these tehsili.
2.500 The growth rate of population of district U dhampur has been smaller than the corresponding rate of the State as a whole all along in the past as indicated below :-
Growth rate Growth rate Decade of the district of .the State
1961-51 9.1% 9.4% 1951-41 10.0% 10.4% 1941-31 8.8% 10.4% 1931-21 6.2% 10.1% 1921-11 4.6% 5.8%
2.501 According to this statement, the rate of increase has substantially improved after 1941 and has almost reached the same level as that of the State. Before 1941, the district was notorious for the high incidence of venereal· diseases and the amenability of the population inhabiting its lower· elevations to malarial infection. This has naturally been_ impeding the growth of p6pulation of the district and particularly of non-Muslims among whom venereal diseases have been very common and whose growth rate during 1931-41 has been only 5.4% against 15.5% of the Muslims. Likewise, in 1921-31 the increase percent among Muslims stood at 8.7% whereas in the case of nonMuslims, the population shrank and registered a decrease of 3.3%. With the provision of medical facilities, however, malaria has almost been completely eradicated and venereal diseases effectively controlled as is reflected by the growth rates of 1941-51 and 1951-61.
2.502 Further, the proportions in which the 'Various communities inhabited the district before 1947 changed radically following the internal disturbances and the tribal raids of 1947. It is estimated that if there had been no large scale movement of population and if the growth rate had remained the same as was returned for ·the decade 1931-41, the district should have had a population of 274,125 in 1961, giving an average growth rate of 1~.9%.
242
2.503 The growth rate in Jammu district has been almost the same as that of the State as a whole. Normally and if there had been no disturbances and tribal raids, the district should have been inhabited in 1961 and. 1951 by approxi'mately 584,900 and 520,700 persons respectively (including 27,706 persons of the 155 depopulated villages) as against 516,932 returned '. at the. Censns. This would ha,-e given a growth rate of 12.3% or 1.3% more than that of the State as a whole.
2.504 Jammu is one of the principal districts which has absorbed a large number displaced· persons not only f['om the areas on the other side of the Cease-fire Line but also from West Pakistan and other States in India. But for these immigrations, the district should have returned a much lower growth rate. Another reason for the accelerated growth of populatjon is the transfer of the rail-head from Rawalpindi t~ Pathankot. Jammu, which is situated on the National Highway connecting Pathankot with Srinagar and Ladakh, has thus. grown into an important commercial centre. Further, it is one of the few districts of the State which has benefitted most by the implementatj()_D ___ . of developmental schemes designed to raise the economic standards of the people.
2.505 District Kathua has not suffered any jurisdictional change since 1901. It has, however, witnessed large scale emigrations and immigrations following the tribal raids of 1947. The net effect of these in and out-migrations is roughly estimated to have been a ,fall of 6,621 in the 1961 population. The population of the distdct should, therefore, have stood at 214,051 in 1961 and at 195,862 in 1951, giving a growth rate of· 9.3%. This would still be 1.7% less than the probable growth rate of the State under normal conditions.
2.506 As will be seen from the su~ioined
statement, the growth rate of the district has almost invariably been less than that of the State as a result of several factors which have been co-operating to control the increase of population :-

1941·51 1931-41 1921-31 1911-21
Growth rate of the district
8.4% 10.2% 4.6% 1.6%
Growth rate of the State
10.4% 10.4% 10.1% 5.8%
2.507 Before 1947, when the State was accessible by two main- routes, one by railway connecting Jammu city with Sialkot and the other by a tarred road connecting Rawalpandi with Srinagar, Kathua constituted a border area and did not receive much attention from the Government. Even during the decade under review, there has not been any perceptible activity in connection with the execution of developmental schemes to ameliorate the living conditions of this economically backward area. Except for one or two small training centres for handloom weaving and manufacturing of bamboo goods, there has been no industrial development other than the continuance of the traditional rural crafts.
2.508 The very low growth rate of 0;24% in district Poonch shows that there has been practically no increase in its population. The district has been truncated by the Cease-fire Line as a result of which there has been a large scale movement of population. It is estimated that the district population has in consequence shrunk by 68,113 persons approximately. If this had not happened, the 1961 population of the district would have stood at 394,174. On this basis, the 1951 population would have been approximately 359,335 being equal to the adjusted population of the district in 1941 according to its 1961 jurisdiction plus half the difference of this population and the probable population of 1961. It, therefore, follows that under normal conditions the growth rate of the district would have been 9.7% as against 11 %, the probable rate of increase for the State as a whole.
SECTION 5
NATURAL GROWTH OF POPULATION
2.509 As indicated earlier, complete data which could help to determine the natural growth rate of population is not available. The figures of Vital Statistics supplied by the Directorate of Health Services cover the last decade only while similar statistics for the period 1941-51 have not been furnished. Even as it "is, some of this data can hardly be regarded as reliable.
2.510 Further besides Vital Statistics, the availability of an estimate of the population which has emigrated from the State during the inter-Censal period is as necessary for calculating the natural growth rate as the number of immigrants from other parts of India and foreign countries enumerated in the State at the time of the Census. The figures of emigrants to foreign countries are usually very small and the natural growth rate can be worked out even without taking into account the number of such emi-
grants. There has, however, been a mass movement of the popUlation during and after 1947 and a large section of the inhabitants, particularly those blonging to the districts and tehsils on or near the Cease-fire Line has migrated to the Pak-occup.ied territory of the State and to Pakistan. The number of such emigrants could not be determined even on a rough basis. In the circumstances, the natural growth rate if worked out on the basil' of the inadequate data of Vital Statistics and the 'number of immigrants and of emigrants to other parts of the country would not be correct.
2.511 The following statement gives districtwise percentages of age-groups (0-14) and (15-59) and of married women in the age-group 15-49 to total population and of children in the age 0-4 to married women (15-49) from 1911 to 1961 :-

STATEMENT D.46
Percentage of age-groups 0-14 and 15-59 and of Dl.arriecl wODl.en (15---49) to total populatioa and children (0-4) to Dlarried WODl.en (15--49) in district 1911-61
An_tnag District
Percentage ofpenons, males and females to total population Percentage of Percentage ~------------------~---~-------------~ married wo- of children
Year Age-group 0-14 Age-group 15-59 men ,(15-49) (0-4) ,to total r- ________ ...A... __ --------"'l ~-----_-_-A.-______ -, to total married women
Persons Males Females Persons Males Females population (1~-49)
2 3 4 5 6 7 ,8 9
1911 42.2 41.2 43.4 53.2 53.7 52.7 N.A. N.A.
1921 41:8 .w.9 42.8 54.2 54.6 53.7 20.0 73.9
1931 37.5 36.7 3B.4 52.2 52.7 51.7 19.B 58.4
1941 39.0 37.7 40.6 57.9 58.9 56·7 20.4 '4&.7
1961 39.6 38.1 41.3 56.1 57.0 55.0 21.3 64.0
Sriaagar District
19111 available ,1921j .N 0 t
1931 1941 1961 .w.5 39.0 42.3 55.6 56.8 54.3 19.6 67.1
BaraDl.uIIa District
1911 43.8 43.0 44.6 51.4 51.4 51.3 N.A. N.A.
1921 43.0 42.4 43.8 52.3 52.2 52.5 20.3 '71':1'-
1931 41.0 40.4 41.6 56.1 56.1 56.1 21.B 59.8
1941 39.1 38.4 39.6 57.8 57.9 57.7 21.6 48.3
1961 3B.6 37.4 .w.0 57.0 57.3 56.6 21.4 62.3
Ladakh District
1911 3B.2 3B.9 37.5 53.2 52.8 53.5 N.A. N.A.
1921 36.9 37.9 36.2 54.1 54.1 54.1 19.3 72.4
1931 36.5 37.1 35.9 56·9 56.4 57.5 19.4 63.7
1941 35.4 36.4 34.4 57.9 57.7 58.1 17.9 52.1
1961 33.4 33.3 33.5 57.B 57.7 57.9 IB.l 62.9
Doda District
1911 ] 1921 1931 Not IJlJailal>le, 1941 1961 44.5 43.9 45.1 49.6 49.6 49.7 IB.9 95.3
UdhaDl.pur Di.trict
1911 36.7 36.0 37.5 55.1 55.2 55.0 N.A. N.A. 1921 37.4 36.6 38.1 54.8 55.3 54.3 18.4 71.0 1931 37.8 37.1 38.5 56.8 57.2 .56.3 20.0 60.5 1941 37.3 36.2 38.6 57.0 57.7 56.4 19.4 49.5 1961 40.7 39.9 41.7 52.4 52.9 51.9 19.1I 84.1
244
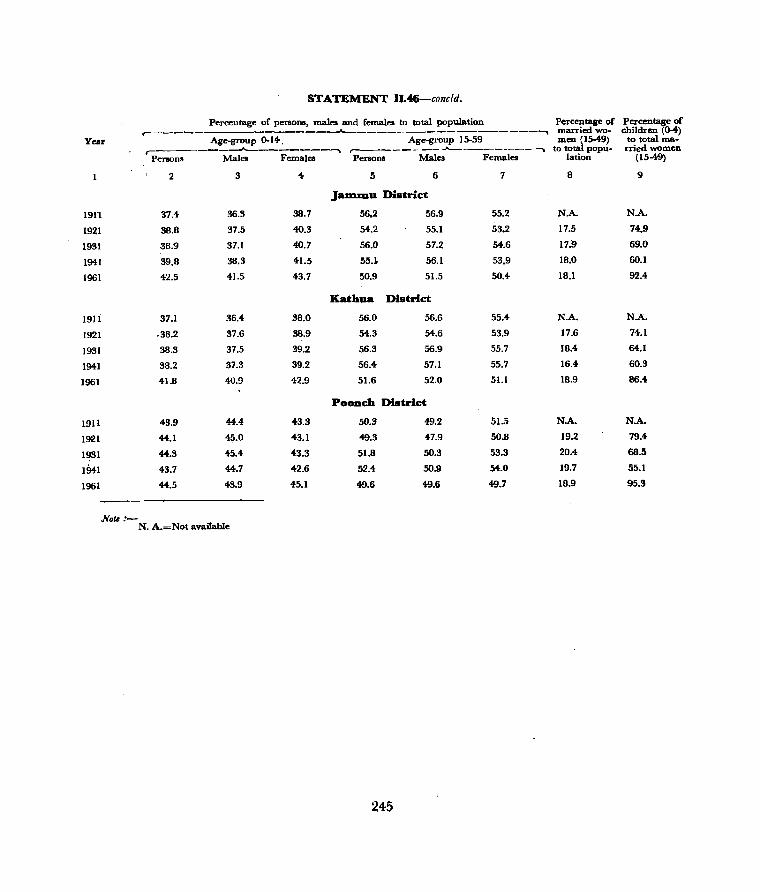
STATEMENT I1.46-concld.
Percentage of persons, mal.,. and female. to total populatio.n Percentage of Percentage of .,------------------_,._,----_. -.-----------~ married wo- children (0-4-)
Year Age.group 0-14-. Age-group 15-59 men \15-49) to total ma-,.--------__,..__------~
r-------- -- ...A-.... ____________ to tota popu- rried women PerIODS Males Female. Persons Males Females lation (15-49)
2 3 1- 5 6 7 8 9
Ja:lDll1u District;
1911 '37.4- 36.3 38.7 56.2 56.9 55.2 N.A. N.A.
1921 38.8 37.5 4Q.3 54.2 55.1 53.2 17.5 74-.9
1931 38.9 37.1 4Q.7 56.0 57.2 54-.6 17.9 69.0
1941 39.8 38.3 4-1.5 55.1- 56.1 53.9 18.0 60.1
1961 42.5 41.5 43.7 50.9 51.5 50.4- 18.1 92.4
Kathua District;
1911 37.1 36.4 38.0 56.0 56.6 55.4- N.A. N.A.
1921 .38.2 37.6 38.9 54.3 54-.6 53.9 17.6 74-.1
1931 38.3 37.5 39.2 56.3 56.9 55.7 18.4- 64.1
1941 38.2 37.3 39.2 56.4 57.1 55.7 16.4- 60.3
1961 41.8 4Q.9 4-2.9 51.6 52.0 51.1 18.9 86.4
Poonch District
1911 43.9 44.4 43.3 50.3 49.2 51.5 N.A. N.A.
1921 44.1 4-5.0 4-3.1 49.3 4-7.9 50.8 19.2 79.4-
1931 44.3 45.4- 4-3.3 51.8 50.3 53.3 20.4- 68.5
1941 4-3.7 44.7 42.6 52.4- 50.9 54-.0 19.7 55.1
1961 44.5 43.9 4-5.1 4-9.6 49.6 4-9.7 18.9 95.3
Nol. :-N. A.=Not available
245

CHAPTER ID
THE URBAN POPULATION
SECTION 1
CLAssmCATION
DefiDitiOD of Urb_ Area
It has already been indicated in the last Chapter that before 1901 the concept of an urban area was very hazy and no criterion other than the classification of such of the units which constituted the headquarters of the Government or where the armed forces were concentrated or which had been declared as municipalities had been evolved. With the passage of time, the concept of an urban area was gradually developed and the title of an area for being classified as urban was detennined if it satisfied certain conditions such as the size of its population, historical importance, volume of commercial transactions etc. etc. This criterion was not made applicable unifonnany at all Censuses and modifications were made now and then in the conditions to be satisfied by an area to qualify it for being included among urban areas. In 1921, for instance, the minimum population by which an urban area should have been inhabited was fixed at 2,000 only as against 5,000 adopted in 1911. The revised limit of 2,000 was adhered to even at the following two Censuses held in 1931 and 1941.
3.2 So far as the Census of 1961 is concerned, the following three tests were prescribed by the Registrar General for the determination of urban areas, it being emphasised that all the three tests should be satisfied with reference to the Census figures of 1951 before any area is Classed as urban:-
(1) An area/village whose population is not below 5,1)00,
(2) An area/village whose 3/4th population consists of non-agriculturists, and
246
OF TOWNS
(3) An area which has a density of not less than 1,000 persons per square mile.
3.3 The following extracts proceedings of the First contain these instructions in
quoted from the. Census Conference detail :-
"It was agreed that all Corporations, Municipalities and Cantonment Board~, irrespective of their population or other characteristics, should be treated as towns. For other areas, it was generally agreed that their claims should be closely examined in the light of the three tests prescribed by the Registrar General before they are· included in the list of towns and there should be an insistence on aU .-tile three tests being satisfied with reference to the Census figures of 1951. There will be new cases of urban areas, as for example, Bhilai or Rourekella, which did not exist in 1951 but have sprung up in the last decade. There are other ~xceptional cases where an area may have a population of less than 5,000 but yet in which definite urban characteristics and amenities exist, e.g., newly-founded industrial areas, large housing settlements, large urban housing setth:ments or places of tourist importance which have been recently served with all civic amenities. In all such exceptional cases, it would be desireable for the Superintendents of Census Operations to make a reference to the Registrar General's Office and obtain its concurrence. Each case should be accompanied with full and sufficient reasons supporting the proposal to treat the place as a town. In certain States, it might be necessary to drop from the list of towns quite a number of places which had, in previous
censuses, been treated as towns, although they did not fulfil the tests laid down by the Registrar General. If in 1961 it was proposed to omit such places from the list of towns, there might be local' resentment. To avoid any such misunderstanding, Superiritendents of Census Operations would be well advised to keep the State Governments informed and secure their approval."
3.4 In persuance of these instructions, a number of towns and villages were surveyed in order to determin.e their eligibility for being classed as urban areas.
3.5 The Registrar General had desired that we should ascertain whether the 3 tests prescribed by him were satisfied with reference to the Census of 1951. As no Census was held that year in Jammu and Kashmir, there was no alternative for us but to apply the aforesaid tests to the popl,llation and density, etc. of 1941 Census. This was by no means an easy job as during the interval the State' was split up resulting in considerable dislocation of population in the tf"rritory on this side of the Cease-fire Line. Further, no correct estimates of popUlation in . respect e,,'en of the areas in the interior of the State, which were not directly affected' by the tribal raids, were either available. We had, therefore, to adhere to the list of areas which were declared urban by the State Government and known as corporations, municipalities, canton~ents, towns and notified areas.
3.6 After the figures of 1961 Census were compiled, it became known that there were a number of places in the State which satisfied two of the three conditions prescribed by the Registrar General, India. Some of these are mentioned belo\Y:-
Number of persons Density
Name of place engaged in per sq. Population agriculture mile
2 3 4 , Nandpora (Tehsil Srinagar) 8,469 2,396 1,540
Cbarar Sharief (Tehsil Badgam) 5,173 1,329 595 Kalaruch (Tehsil Handwara) 7,579 3,204- 1,011 Haihama (Tehsil Handwara) 5,465 2,529 1,163 Darhal (T"nsil RajJur~) 7,254 2,188 3.818
247
3.7 In some of these villages, such as, Charar Shader, urban amenities ljke electricity, tap-water, slaughter house, high school, dispensary, bus-stand etc. are available but as the village satisfies only one of the three conditions. it was not included in the list.
3.8 Village Tral of tehsil Pulwama which has the appearance of a fairly big town and enjoys larger urban amenities than several towns like Kulgam, Uri, Doda, etc. has also been retained on the rural list. According to the revenue records and the previous Census Reports, Tral consists of two distinguishable villages known as Tral Pain and Tral Bala and not of one compact territorial unit. Taking both the parts together, it has been found that its total population, stands at 5,069 with an overall -density of 1491. The number of agriculturists also stands at 816 only which is less than 1/4th of the total population. The State Government, however, did not agree to the village being declared ~ town as they apprehended that this would cause difficulties in the execution of developmental plans.
3.9 Another controversial area was the town of Bandipore. The State Government had declared it a town by notification number 426-LS/58 of 1958 published in the Government Gazette, dated 23-8-1958 but on account of some dispute among the inhabitants, no Town Area Committee was ever set up and aU the three constitpent villages, namely, Bandipore, Nowpora and NUlu, were treated as separate units. Enquiries made on spot, however, showed that the population of the town was in the neighbourhood of 5,000 and that its density was also fairly high. The' matter was, therefore, taken up with the Ministry of Local Self Government, who agreed after some correspondence to the classification of the ,area as a town. The 1961 Census figures show that the population of the town excluding persons who migrate to plains in winter is 4,074-and its density stands at 2,122. The number of agriculturists is also very small being only 779. The town enjoys all the urban, amenities, such as electricity, water-taps, bus-stand, high school, dispensary, etc.
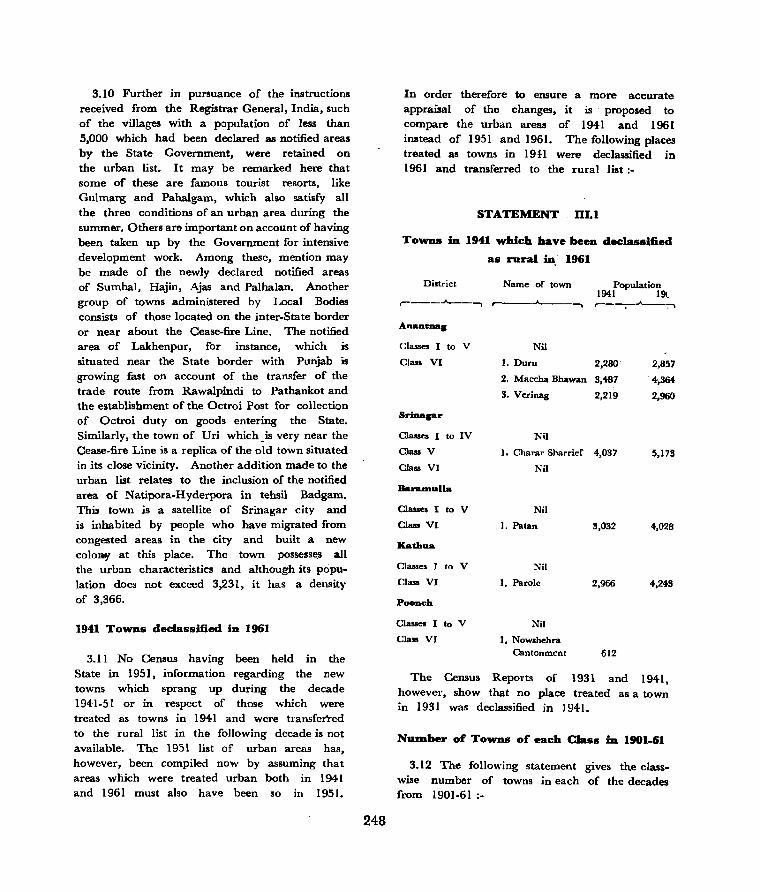
3.10 Further in pursuance of the instructions received from the Registrar General, India, such of the villages with a papulation of less than 5,000 which had been declared as notified areas by the State Government, were retained on the urban list. It may be remarked here that some of these are famous tourist resorts, like Gulmarg and Pahalgam, which also satisfy aU the three conditions of an urban area during the summer. Others are important on account of having been taken up by the Government for intensive development work. Among these, mention may be made of the newly declared notified areas of Sumbal, Hajin, Ajas and Palhalan. Another group of towns administered by Local Bodies consists of those located on the inter-State border or near about the Cease-fire Line. The notified area of Lakhenpur, for instance, which is situated near the State border with Punjab is growing fast on account of the transfer of the trade route from Rawalpindi to Pathankot and the establishment of the Octroi Post for collection of Octroi duty on goods entering the State. Similarly, the town of Uri which_is very near the Cease-fire Line is a replica of the old town situated in its close vicinity. Another addition made to the urban list relates to the inclusion of the notified area of Natipora-Hyderpora in tehsil Badgam. This town is a satellite of Srinagar city and is inhabited by people who have migrated from congested areas in the city and built a new colo~ at this place. The town posseSSeji all the urban characteristics and although its population does not exceed 3,231, it has a density of 3,366.
1941 Towns declassified. in 1961
3.11 No Census having been held in the State in 1951, information regarding the new towns which sprang up during the decade 1941-51 or in respect of those which were treated as towns in 1941 and were transfeI"red to the rural list in the following decade is not available. The 1951 list of urban areas has, however, been compiled now by assuming that areas which were treated urban both in 1941 and 1961 must also have been so in 1951.
248
In order therefore to ensure a more accurate appraisal of the changes, it is' proposed to compare the urban areas of 1941 and 1961 instead of 1951 and 1961. The following places treated as towns in 19 n were declassified in 1961 and transferred to the rural list:-
STATEMENT BI.I
Towns in 1941 which have been declassified
as rural in. 1961
District Name of town Population 1941 19l_
r----..A..---"'\ r----....... ---~ r----;-.A...---7"'\
Aaantnac
Classes I to V
Class VI
Cia ..... I to IV
Class V
CIa .. VI
II&nunulla
Classes I to V
Class VI
Katbu.
Classes I to V
Class VI
Paonch
Cla .. e. I to V
Cia •• VI
Nil
I. Duru 2,280·
2. Maccha Bhawan 3,487
3. Verinag 2,219
Nil
I. Charar Sharrief 4,037
Nil
Nil
I. Patan
Nil
1. Parole
Nil
I. Nowshehra Cantonment
3,032
2,966
612
2,857
4,364
2,960
5,173
4,028
4,243
The Census Reports of 1931 and 1941, however, show that no place treated as a town in 1931 was declassified in 1941.
NUlDber of Towns of each Class in 1901-61
3.12 The following statement gives the classwise number of towns in each of the decades from 1901-61:-
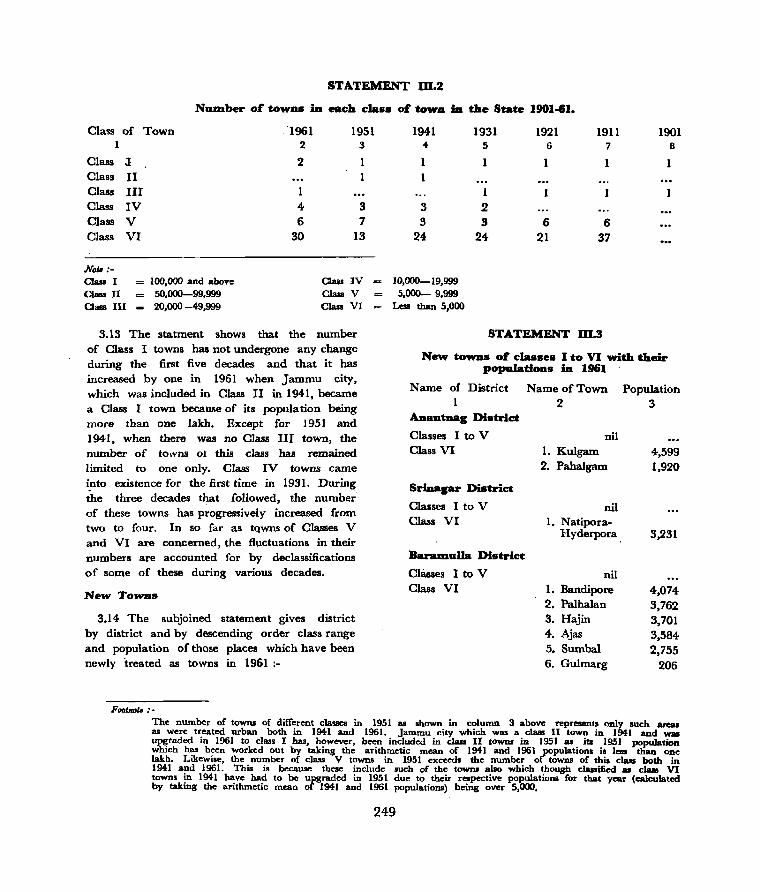
STATEMENT m.2
Nwnber ot towns in each class ot toW-A in the State 1901-61.
Class of Town ·1961 1951 1 2 :3
Class J 2 1 Class II 1 Class III Class IV 4 3 Class V 6 7 Class VI 30 13
No" :-Class I = 100,000 and above Class IV Class II 50,000-99,999 Cla.ss V Cl ..... III == 20,000 -49,999 Class VI
3.13 The statment shows that the number of Class I towns has not undergone any change during the first five decades and that it has increased by one in 1961 when Jammu city, which was included in Class II in 1941, became a Class I town because of its population being moce than one lakh. Except for 1951 and 1941, when there was no Class III town, the number of towns 01 this class has remained limited to one only. Class IV towns came into existence for the first time in 1931. During the three decades that followed, the number of these towns has progressively increased from two to four. In so far as tQwns of Classes V and VI are concerned, the fluctuations in their numbers are accounted for by declassifications of some of these during various decades.
New Towns
3.14 The subjoined statement gives district by district and by descending order class range and populatilln of those places which have been newly treated as towns in 1961:-
Footnou :-
1941 4-
1 1
3 3
24
10,000-19,999 5,000- 9,999
Less than 5,000
1931 5
1 2 S
24
1921 6
1911 7
6 6 21 37
STATEMENT m.3
1901 8
New tOW'DS ot classes I to VI with their populations in 1961
Name of District 1
AnaDt_g District
Classes I to V Class VI
Srinagar District
Classes I to V Class VI
BaraD1uDa District
Classes I to V Class VI
Name of Town 2
nil I. Kulgam 2. Pahalgam
nil 1. Natipora
Hyderpora
nil I. Bandipore 2. Palhalan 3. Hajin 4. Ajas 5. Sumbal 6. Gulmarg
PopUlation 3
4,599 1,920
3,231
4,074 3,762 3,701 3,584 2,755
206
The number of towns of different classes in 1951 as shown in column :3 above represen~ only such areas as were treated urban both in 1941 and 1961. Jammu city which was a class II town in 1941 and was upgtaded in 1961 to class I has, however, been included in class II towns in 1951 as its 1951 population which has been worked out by taking the arithmetic mean of 1941 and 1961 populations ia 1_ than one lakh. Likewise, the number of class V towns in 1951 exceeds the number of towns of this class both in 1941 and 1961. This is because these include such or the towns also which though classified as class VI town. in 1941 have had to be upgraded in 1951 due to their respective populations for that year (calculated by taking the arithmetic mean of 1941 and 1961 populations) being over 5,000.
249
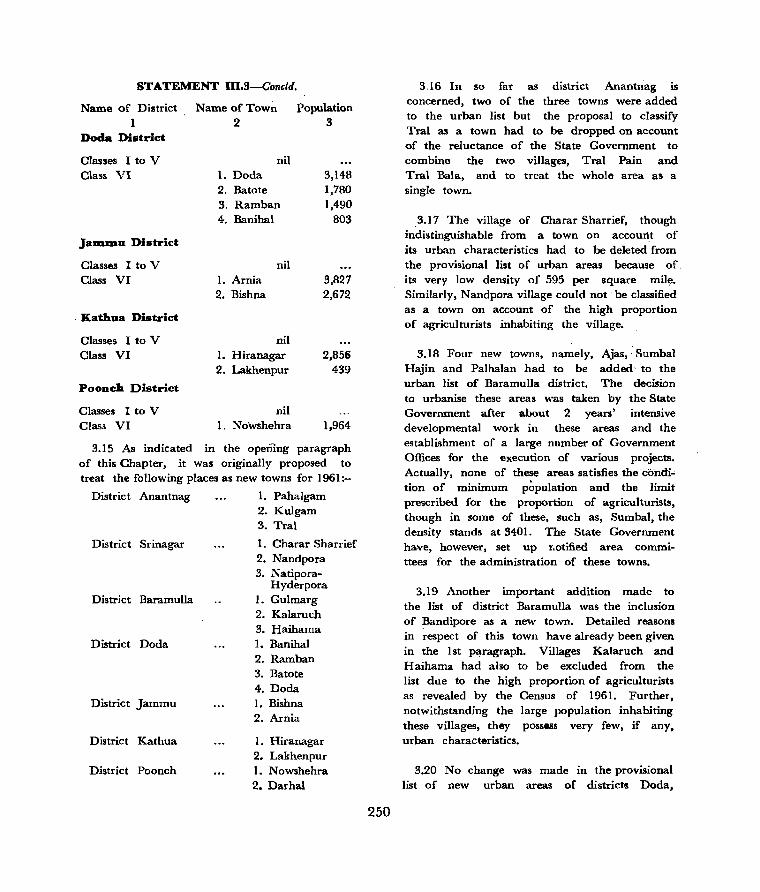
STATEMENT In.3-Concld.
Name of District Name of Tow~ Population 3 1 2
Doda District
Classes I to V Class VI
Jammu District
Classes I to V Class VI
. Kathua District
Classes I to V Class VI
Poonch District
Classes I to V Class VI
nil 1. Doda 2. Batote 3. Ramban 4. Banihal
I. Arnia 2. Bishna
nil
nil I. Hiranagar 2. Lakhenpur
nil I. Nowshehra
3,148 1,780 1,490
803
3,827 2,672
2,856 439
1,964
3.15 As indicated in the openIng paragraph of this Chapter, it was originally proposed to treat the following places as new towns for 1961:-
District Anantnag 1. Pahalgam
District Srinagar
District BaramulJa
District Doda
District Jammu
District Kathua
District Poonch
2. Kulgam 3. Tral
1. Charar Sharrief 2. Nandpora 3. Natipora-
Hyderpora 1. Gulmarg 2. Kalaruch 3. Haihama 1. Banihal 2. Ramban 3. Batote 4. Doda 1. Bishna 2. Arnia
1. Hiranagar 2. Lakhenpur I. Nowshehra 2. Darhal
250
3.16 In so far as district Anantnag is concerned, two of the three towns were added to the urban list but the proposal to classify Tral as a town had to be dropped on account of the reluctance of the State Government to combine the two villages, Tral Pain and Tral Bala, and to treat the whole area as a single town.
3.17 The village of Charar Sharrief, though indistinguishable from a town on account of its urban characteristics had to be deleted from the provisional list of urban areas because of. its very low density of 595 per square mile. Similarly, Nandpora village could not 'be classified as a town on account of the high proportion of agriculturists inhabiting the village.
3.18 Four new towns, namely, Ajas,' Sumbal Hajin and PalhaJan had to be added' to the urban list of Baramulla district. The decision to urbanise these areas was taken by the State Government after about 2 years' intensive developmental work in these areas and the establishment of a large number of Government Offices for the execution of various projects. Actually, none of these areas satisfies the 'cOi1di~ tion of minimum population and the limit prescribed for the proportion of agriculturists, though in some of these, such as, Sumbal, the density stands at 3401. The State Government have, however, set up I.otified area committees for the administration of these towns.
3.19 Another important addition made to the list of district Baramulla was the inclusion of Bandipore as a new town. Detailed reasons in respect of this town have already been given in the lst paragraph. Villages Kalaruch and H aihama had also to be excluded from the list due to the high proportion of agriculturists as revealed by the Census of 1961. Further, notwithstanding the large population inhabiting these villages, they possess very few, if any. urban characteristics.
3.20 No change was made in the provisional list of new urban areas of districts Doda,
Jammu and Kathua. In so far as village Darhal of district Poonch is concerned the proposal to include it in the urban list had to 'be . abandoned because of the high incidence of agriculturists. The village has a derisity of 3,818 persons per square mile, the highest among all . the villages of the State, ,but it dose nO$ enjoy· any urban amenities, whatever.
Areas· or Towns·
3.21 No upto-date record is available either in the State Revenue Department or with the Local Bodies concerned indicating the areas of the towns falling within their respectivejurisdictions. Even in the case of new towns which have, been carved out by merging together two or three villages, there are instances in which accurate areas are not available and varying figures are supplied by different office~s of the Revenue Department. It appears that these variations arise because of agricultural lands whkh formed part of the villages before their conversion into towns and which have not been taken i~to account while determining the area of the new town.
3.22 Apart from these difficulties, we had to face some unexpected problems. also in making a precise assessment of the urban areas. One of the villages, namely, Gurha Chhabilian, of district Jammu which is situated on the common border «!if tehsil Jammu and Jammu city was disowned both by the Administrator, Jammu Municipality and Tehsildar who functioned as Charge Superintendents for the Census of the city· and tehsil respectively. The question remained 'unresolved till late in 1960 when with the intervention of the Deputy Commissioner concerned and after scrutinizing relevant records and inspecting the village, it was finally agreed upon that it should be treated as a part of Jammu city and included in it.
3.23 There are, besides, a numqer of urban areas in the State whose areas as reported by the tehsildars do not seem to be correct and need further verification. These are dealt with below district by district;-
251
AlIBDtDag District
3.24 We have adopted the area of Pahalgam town at 8 sq. miles as reported by the tehsildar in 1960. In a subsequent reference received from his successor in 1963, the area of the town waS said to be 2.60 sq. ~iles representing the aggregate area covered by the four villages constituting the town. While this figure may be correct though it is based on very old assessment, it is a known fact that the town of Pahalgam has grown out of all proportions during the last few years and new buildings have s~ung up over a wide area which may even be mort:! than 8. square miles, At any 'rate, this needs further verification.
3.25 This is also true of the towns of Kulgam and Pampore though the disparities in the two sets of figures of areas of these towns are not as large as in the caSe of Pahalgam. Both Kulgam and Pampore have outgrown their rural sizes and extended to thE;! suburbs which previously fell in the rural sector. We have therefore adopted the higher estimates of 6 sq. miles for Kulgam and· ·1.5 sq. miles for Pam pore which ilppear to be fairly . correct.
Bara.IDulIa Distriet
3.26 The exact area of Sopore town as reported in 1960 was 0.55 sq. miles. It was Pointed out to the Tehsildar that the town was a fairly large one and seemed to cover a much bigger area than that reported by him. He was not inclined to revise the· figure and insisted that the area given by him was correct. In 1963, h0'ijver, his successor intimated that the town measured 5.16 square miles. This seemed to be too high as compared with the a~tual inhabited area. In any case, it has not been possible to ascertain the exact area of this town and the figure of 0.55' sq. miles adopted in the. Census Report should only be regarded as ten:tative. .
3.27 Varying area figures have also been reported in respect of the town areas of Sumbal, Hajin. Palhalan and Ajas. The figures adopted in the Census Report represent the areas of

these towns when "they were borne on the rural list. These areas are, naturally, larger than those reported subsequently which are limited to the inhabited sector only. According to the Government notification under which they were declared towns, their respective agricultural areas are also to be included ill their urban jurisdictions. On this basis, it would seem that the areas adopted in the Census Report are reasonably correct.
Doda Dl.tric:t
3.28 In the case of Doda town also, two' varying fig~res of al"ea, viz., 5.50 sq. miles and 1.5 sq. miles, have been reported by the successive tehsildar~. We have adopted 5.50 square miles which has been verified on spot. The town consists of two inhabited areas, one on the plateau of a hillock and the other at a distance of over two miles 011 ~he left bank of river Chenab.
Kathua Dilltrid
3.29 In this district also, ihe area 0(
Hiranagar town is in dispute. The Tehsildar has assessed" the area at 0.30 square miles whereas the Special Revenue Officer in the Financial Commissioner's Office has reported that the area "stands at (1.43 sq. miles. As the tehail records are based 011 very old assenments, we have adopted the figure supplied by the Special Revenue Officer which includes additional areas to which the town extendit.
To __ group
3.30 A town-group is a co"tellation of satellite towns around a principal city. During the course of the 3rd Census Conference held in February, 1962, the Registrar General emphasised the desirability of the formation of town-groups 0\ urban areas which bad grown in the suburbs of cities and were developing at a fast speed. It was felt that if there are indications that tbe vacant or rural areas intervening between the City and the towns would be urbanised before long, the city and the towns may together be treated as a town-
2~2
grouping together be that the State
purposes of future
group. The advantag!l of such urban areas would Government would for planning reckon the entire urban area as a compact unit.
3.31 In view of thC1e considerations, the city of Sl"inagar with Badamibagh Cantonment and Xatipora HyderpOl"a lloti~d area as" the, other constituenb was treated the Census of India, of the town-group as stands at 295,081.
as a town-group for 1961. The population
returned at tbe Census
3.32 In my origin"l proposals to the Registrar General, I had suggested tbe inclusion· in this town-group of the town of Pampore which though belonging to the adjoining district of Ananrnag is situated only at a distance of less than 4 miles from the Srinagar Cantonment. The proposal was not agreed to on the ground that tif! town belonged to a district other than the one in which the t")wn-group was being formed. The fact, however, remains that the area between the Cantonment and the town of Pampot'e is fast developing and is being urbanised. A large number of important industries;" -such as, plywood, brick and tile manufacture, saw" mills, quanies and a net-work of timber depGts and their offices, etc. have already been set up at these plans. In addition, leveral Government Dep::utments like Radio Kashmir, Stores and Purchases branch of the Public Works Dep3rtment, are also functioning in this area.
3.33 There are indications of some more town-groups coming into being within a decade or so. The rural area intervening between the towns of Anantnag and Bijbehara which extends to only 3 miles of the National Highway is developing at a rapid speed. Khanabal, the northern suburb of Anantnag, is the junction of the roads connecting Jammu and Anantnag with Srinagar. "Besides an Intermediate College which has"' been set up during the last decade, several importallt Government offices have also been headquartered here. In addition, a number of shops and industrial establishments have also sprung up at tills place. The jurisdiction of

Bijbehara, which is one of: the few industrial towns in the State, is also extending steadily towards the south. It is not, therefore, unlikply that the whole area may be inhabited before long transforming Anantnag, Bijbehara and the area irHervening . between them into one compact urban unit.
3.34 Two other important towns of the State which are not far off from each other are Baramulla and So pore. Both show prospects of developing economy as a result of which their respective jurisdictions have been extended from time to time. The village· of Seer ]agir with a population of 2,676 is already situated in the vacant area between the two towns. The village though
d~minated by agriculturists has the apPearan~e of an urban area.
3.35 The following map shows the geographical location of Srinagar town-group. The shape of the irregular ring of dotted line indicates how the group is tending to expand:-
Geographic:al Distri1nati.oa .r Cities aad Towa-gro ...
3.36 The following statement gives the geographical ·distribution of cities. towll-groups. and their constituent units, their densities and the total and rural densities of the tehsils in which they are situated:-
STATEMENT 111.4
Geographical distribution or dties and to __ .roups, J96l
District City and town-group with name of each unit
Population Density (persons Density of the tehsils in which (with popula- per sq. mile) of they are located
tion of each each urban r------.JI..--------., unit) area Total density Densityof rural
area
2 3 4- 5 fi
Srinagar Srinagar town-group 295,084 15,417 871 ",25 (a) Srinagar (M. C.) 285,257 17,829 2.147 419 (b) Badamibagh Cantt. 6,596 3,026 2,147 419 (c) Natipora-Hyderpora
(N. A.) 3,231 3,366 433 .27
Jammu Jammu (M. C.) 102,738 25,685 ~8 366
N",,:- (i) M. C.=MWlicipal Committee (ii) Cantt.=Cantonment (iii) N. A.-Notifted area
3.37 The total and the rural densities given in cols. 5 and 6 against the constituent units of Srinagar town-group represent the average densities of population of the two tehsils of Srinagar and Badgam in which the towns are situated.
3.38 It is clear from the statement that there is considerable congestion in the cities of Jammu and Srinagar. when compal·ed with the overall and the rural densities of the tehsils to which they belong.
253
Urban Develop_eat, 1901-61
3.39 We may now determine the .. reas or the State which have made rapid progr;,ss in urban development and concentration of ;urban population. This has been attempted in the following seven maps each reJating to OJte of the Census years from 1901 to 1961. The different urban areas of each CeDlU! year have been represented b}· circles of :ria: varying siz£I depending upon the particular class to wq_i(:h a town belongs on the basis of its pop~tion.

Each map shows the district boundaries as on 1st March 1961, National Highways, navigation canals and rivers.
.. 3.40 The map indicating the urban growth :.as returned at the decennial censuses held from 1891
··to 1901 shows ·that· the concept of rural/urban classification had not' developed till 1901 and that except for the two cities of Jammu and Srinagar ·~here the State Government was headquartered in winter and summer respectively, .!ill .. other areas . were, irrespective of their characteristics, trea.ted as rural. During the following . decade , . ·the classification of different areas of the State· into rural and urban was,
. "" for the first time, conceived and fortyfive areas including the cities of Srinagar and Jammu were declared urban. The map shows that there was considerable concentration of urban areas' in the districts of Anantnag, Baramulla, Udhampur and Jammu. Apparently, this classification did not stand ,the test of time and by 1921, a large IlU~be~. of areas previously treated as urban
had to be transferred to the rural list.
3.41 During the next two decades, there was only a slight improvement in the number of UI ban areas. The zones representing the districts or Udhampur and Jammu on the one hand and Srinagar and Anantnag on the other, however, continued to include a number of closely knit together urban areas.
3.42 The map for the census year 1951 depicts only such of the towns which were tre~ted
as urban both in 1941 and 1961. During the inter-census peri<;>d 1951-61, however, several developmental plans were implemented in the various parts of the State resulting in rurall urban migrations as also in the urbanisation of several areas previously borne on the rural list. The map shows concentration of urban areas in that part of the State territory :~hich is bordered in the north by Cease-fire· Lirie, in the east and north-east by district Ladakh and in the west by Poonch district.
SECTION 2
GROWTH OF CONURBATION
Cluster. of Conurbation
.. 3.43 A closer study of the map of 1961 shows tbat' there are distinct clusters of cities and towns cor different size classes(as distinct from town-groups) ~hich extend to larger geographical areas than that of a town-group. These, clusters have been delineated in the following map by throwing a ring around each or them -
3.44" It will be noticed that there are some
254
large clusters composed of smaller disti~ctly
identifiable clusters. These are known as clusters of conurbation. The following statement
gives the discernible zones of conurbation, their
population and the proportion of their population to the urban population of the State
and distribution of 1,000 persons of the urban
pOpulation of each zone among the six classes of cities and towns, etc:-
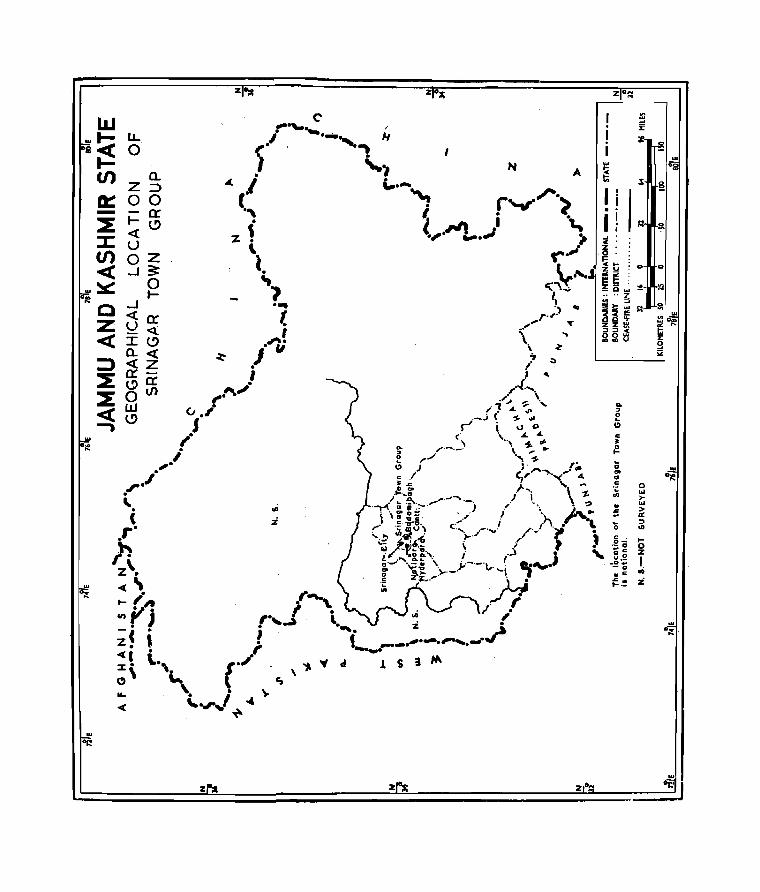
a:: -~ :::I: Ul « w~ Ie
C Z «
Z~ 00 -c:r I-~ « U OZ ..J3=
..J~ «tr U.q: I~ 0.« (iZ C)tr oC/) W ~
Z":I!
N A
z 2
Q.
" o i; c: .. {!.
it·

N
OCLASS I pOP 100,000 ,
"lOVE,
O CLASS II Not Ell ,t in,
N POP 50,000_90,0" ]1,00 CLASS III
pOP. 10,000.19,9
III
8 CLASS V Not ,.,. ~OP 5,000- 9,999 Elutll'l
o CLASS VI I "
o .O:L:O~OSO~-ti······ l I
pOP 8U.OW S,O •
DOl' 1ft tho ""I .. "j,(lt. \ \ , 10,1'1011 ot U. to.1IS ~,;,.,.
Netionot HighWOY _ ~",,,'V "'\ River". . _ :s . N S -i'l0\ Sur.cy.d 9-
o nE
I SRINAGAIt
a J ... Irrl4MU
• 70 • 76 E
o 76 E
GROWTH OF
78 E SOE
JAMMU AND KASHMIR STATE URBAN CENTRES
1901
...
96 MILES
KILOHmES SO~~15~~~~~SOliiiiiiiiiiiiiiiiiiiIOO~~~lrlO II 16 n
N
J
N o
II
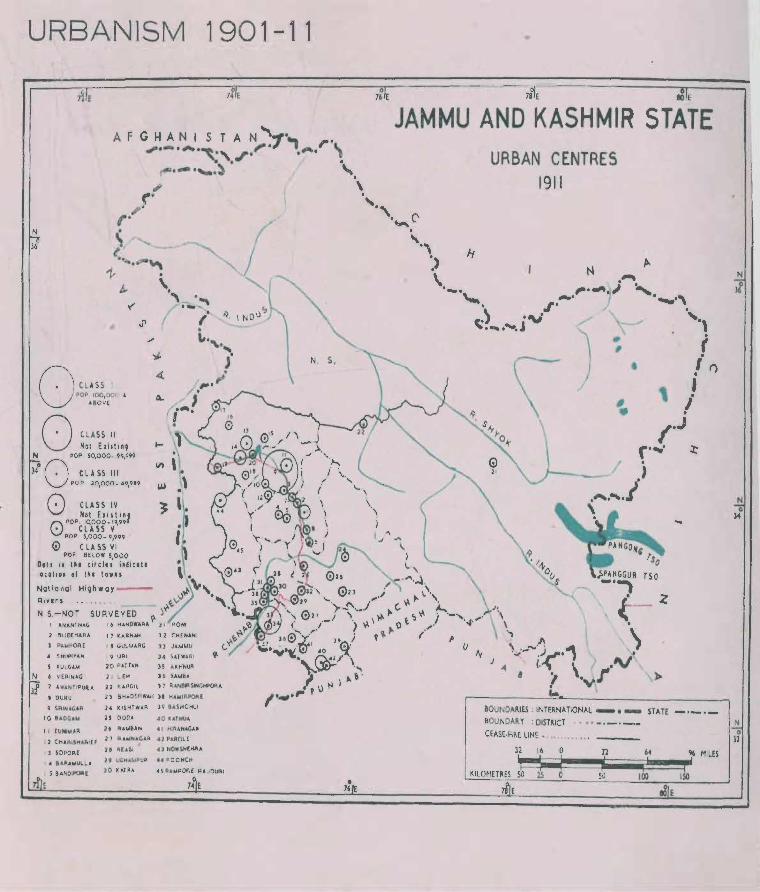
URBANISM
N
36
O CLASS II Hot Eiiltln,
N pop, 50,000. 99,909
O CLHS III pOP ~O,OOO. '9,9t9'
O CLASS IV Not E."t",
O pOP, 10000_ 19,994' CLASS V
pOP 5,000_ 9,999
o CLASSVI pOP BElOw 5000
1901-11
O.t. " t •• eircl.~ ildlClt. lotltiu of t~. to". , 0;] National Highway - 1'~', Rivers y.. "\. N S.-NOT SURVE yEO )
I A,NANTN.l(i 16 HAND .... Pt" ~ ) I PONt
8IJBlH.HU
PA.".pOAE
.. SHl)PIY"'"
I KULC,,""
N 6 V ERIN't;
3/ 7 A W.lN'fIPUflA
• DURu
9 ~RIH'G"'A
10 UOG ... ~
t I ZUNlWA"
t 2 CHARtSH'ARI[F
I] lOPoM
I. a"'''A ... VlLA t S SANDIPCME
7f:
17 U.P.H~
I It GUL~AAG
19 URI
20 PATT'N
'JI Lnl
] '} CH(NANI
33 JAMMU
14 SATWAAI
lS AKMHUA
36 SAMe...
22 I( ... RGII.. 17 R. ... NBIRSIN.:.HPOA ...
'}] BHAO[AWAH )I H ...... tRPO"£
2< I(I~HTW"'R )9 8.lSHOHLI
" 000,1, 40 ItATHUA
26 ".UAUN .. t HlrU,NA,G.u
2 7 ".Irot~U.GAR 42 PAROL[
78 REA!.I 4l NOWSHE~A
29 UDHA!.CPUA 44 POO""'"
)0 1(4TR,.l 4S R ..... POA£·R.JOUAI
0 1H • 16
o 7~ E
o 78 E IOE
JAMMU AND KASHMIR STATE URBAN CENTRES
1911
N
..
(J IV J
~
BOUNDARIES : INTERNATIONAL _. _ STATE _._._
BOUNDAR Y : DISnlCT ••• _. _. _._
CEASE·FIRE LINE.
12 16 )1 64 96 HIL£!
KILOMETRES SO 2.1 50 100 ISO
1fE e8f
N o
'"
N o
II
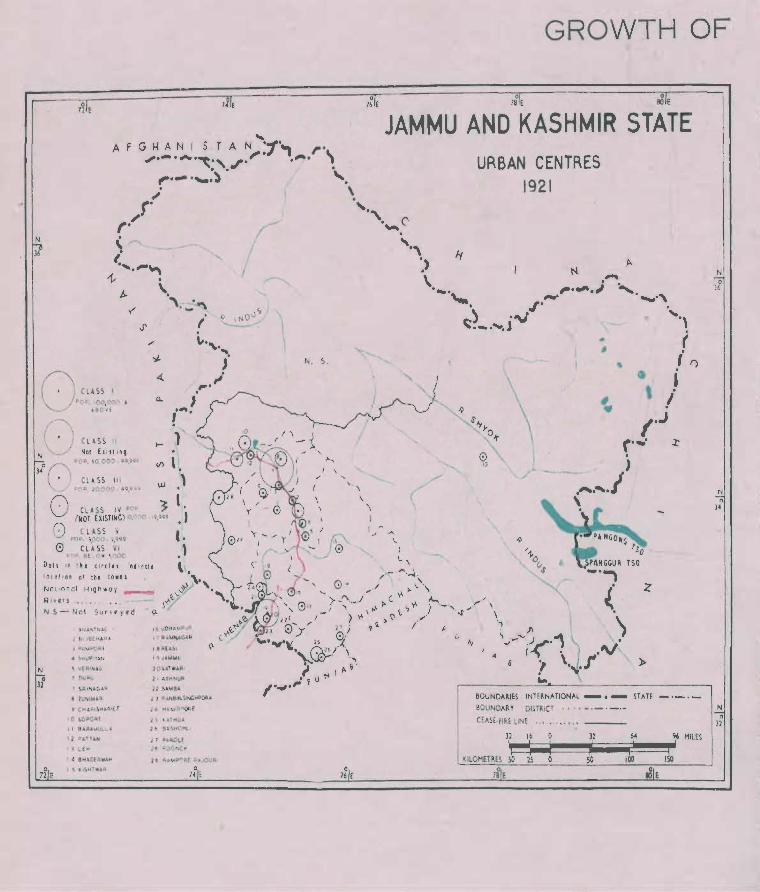
O CLASS I pop. -00, 001"1 &
__ "SOv£
/""""",-( J CLASS II N Not El l I I H'I ~ )<40 (\ pop. ~O, 000 OQ,~Q'"
( , C LASS III
N o
11
\_ "0 P . lO,OOO 4 0,00(0 o CLASS IV POO
(~OT EXISTI NG) ,0.,'00
0) CLASS V pOP, '),000 ~,QOO o CLASS VI
,op BE 0 '11' \000
A' lA NTN.f.C·
} &1 JBE ~A n A
JPtI -.l P(la.. f
• SH(jP1'I'AN
S v [ RUd e.
~ PU llt,l
, 51=1."" .. (.· 0,
I l U"'lMAr:I
Q C Hl ", SH4 1l1( r
'0 s.O PO'H II BAAAM UI.:_ "
I ~ PATTAH
I ) UH
1 4 BHA DERWAIoi
o I ~ k 'SI"lT w"~ 72E
'" "',' -.J.
..... , . « ,..~ Q., J
("".
I- 1
16 UDH AM P ... o;
11 R.u.Ut~"GM'
I eRt .. !) ,
I Q J AMM U
20 !t .. TWAA I
2 I U H NUP
n SAMBA
14 H.e, •• u pnOilE
} C, KAT I'I UA
26 BASH(' Hl
2 7 p,t, R.Ol" f } . POONe ,",
19 ", u",pl"\~ £ :) AJOlJA
o I~ E
\ /
Y I
N. S.
i'-,
I \
" ... '-
(8
o 76 E
\
\
• 76 E
\
1./ ~
o 18 E
GROWTH OF
o 80E
JAMMU AND KASHMIR STATE
II.
""" (
'-)
URBAN CENTRES 1921
\ Sly 1-0
+ 0
IJ I /"
\ \
.') ' " 1 \ --) "'\
", ' J I~'. 8 ~ \. ...
BOUNDAPJES INTE RNA TIONAL _. _ STAlf _ . _ ._
80UNDA~ Y DISTRICT . . . • - • - . -.-
CEASE · fl~E LINE ..... .... ,, ' ---
7BE
N o
J6
N o
H
N o
12

URBANISM
N
)6
o 72E
OCLA55 I POPe 100,0 00 I
A BOV:;:
I 0 CLA55 II Not E..i~t in;
~ POP. 50,000- ",'"
I 0 po; L :o~;o~ ~' ~,,' •• I 0 Fo;L ,~~o500 ~Y., •• , I 0 Cl A55 V
I (:) PO~ l\O~~ -~~99
I pOP BE LOW 5000
Dotl- ill tht circl e , indicI" II !OU~iQ" ot Ute towru
, ' Notional Highway ............ RIY~rs •. _ .•. _
NS_Not SurY~y'-d
I VEP.IN"C
~ ...... NtNA(,.
1 81J8UUA. ...
., P,U04POAf.
5 MACH "SHAW ... ",
6 OURU
, SHUPI¥AN
e SRINAGAR
Ib k lSliTWAA
I' 9M"DE~'W"'''' 18 RA~NAGAR
I 9 UDHA~PUR
20 ettAS,1
21 K4TRA
22 JAMMU
2 1 JA~.H.4U (ANn
o CHIoAISHA::\llF" 24 AkHNUA
10 BAD" MISA.CH CANTY :I 5 SAMBA
1921-31
o T. E
I I URI 26 RAN81RSNGHPOAA 30 "OONCH
o 7le
.,2 SOPOR!: 2' BASt-IOHLI
LhAAMULL.t. 2' It:ATH\.JA
PATTA.'"
I 5 l.EH
31 P. ... MPOA£·'U, JOUAI
o 16 E
o 18 E ROE
JAMMU AND KASHMIR STATE URBAN CENTR ES
1931
BOUNO"RIES INTERN"TlON"L _ . _ ST"U _ . _ . _
80UNOARY - DISTRICT - - - - -. - - _._
CE"SE-FIRE LlN~ _ . .. . ..... _
l~2~!$'6iiiii~O~~~~1~liiiiiiiiiiiiiii~~~~~~,,;96 MILES
KILOMETRES SO 2S
N o
H
N o
32
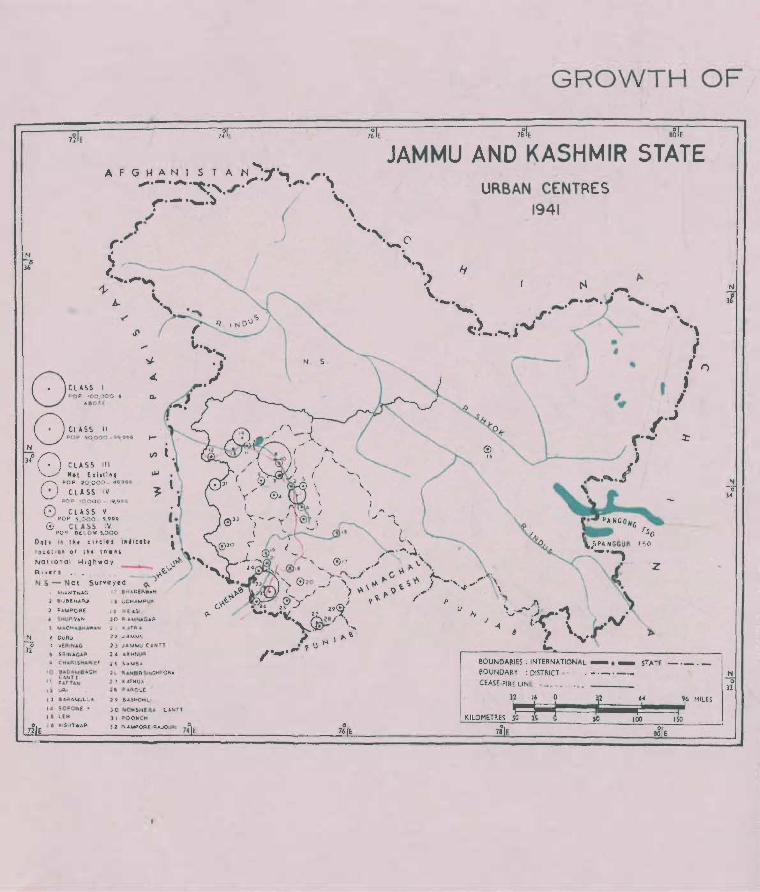
N
]ji
OCl ASS I PO P '00,000
,t,8 0vl
P OP SO,OOO _ 0 0,0<;) 9
N O CLA SS II
00 )4 • CL A SS III
Not E li f ti ng
1:\ POP. ~ o,ooo- 4Q,Q QQ ' ••• J V CLA SS IV ~,
pO P ' ,000 _ ' ,'" ,. o CLASS IV pO P aHow 5,000
Dots I ii t he tlf( II' 1 "~ l eet. , I Oc.Qt I on 01 tn c t o w n ,
o
" E
o pO;l:':;o ~ IQ,QQC \
Nallon a l HIgh way ,:. " ~ , v ~ r! -- ~vv .~ . ---,v" / • N :. _ No t Surv.y.d Q-. •
N o
12
0 72 E
.lN ANl"N " G
2 e lJ eEt'1.4~
3 PA~POP,E
• SHUPIVAN
5 M ACH"BHAW .& ",
e DURU ., I/EF\ IN.t. C;
& SP' INAC,i..1l
Q C IU.~I SHA A Ifj:
10 BA DA.Mle.GH CI\NTt
I I PArT'''N
\ 1 V9-1
" BARAMl)l L A
14 SOP ORf ~
" L'" " I(ISI-ITWAP
I 7 e H 40E~w"H
I S' UDHA'-4PUl'o
1 9 1=1 (,,$1
., I K Al A.
2 2 .JAMMU
2] J"MMU CANn
241 AKHNUR
2S SAMl3j
2 to R.lt.NBIR SINGHP O R.Il
2 1 It ATH UA
2' P"Q.C Lt
., Q BASHOHl.. 1
J 0 NOWSHE R.'" C.ANn
)' POONCM
J 2 p. ", .,.POR[ ·R,t,JOURI 7: ~
/
o 76 E
o 76 E
GROWTH OF
o 18 E
o 80 E
JAMMU AND KASHMIR STATE URBAN CENTRES
1941
N
I SO
\ , f> '., . A
(J Iy \.",_-) • ., \ •
J ~ i,~ \ ~.", 8 ! .,.~ ...
BOUNDARIES ; INTERNATIONAL _. _ STATE SOUNDM Y : DISHleT r' • _, _. _._
CEASE·FfRE LINE " ' _"
)",,1 ~~I~'_.~0~~~"'l'~2 __ iiiii~~' !!'II!'!III~9,6 MilES ! ~ i i KILOMETRES SO 50 100 150
N Q
)4
N o
Jl

URBANISM
N
36
O CLASS I POP .100,000 I
A!JOV£
n CLASS II U POP. SO,OOO-99.099
N
CLASS III Jl8 Not hi.ti", r:'\ pOP 20,000 - 49,990
V CLASS IV pOP. 10,000 _ 19,999 o CLASS V
PO P 5,000 - 9,999
@ CLASS IV pOP. eE1..0W 5,000
Dots in th, cir,l" indicat.
... : '.\ ~ '. .1
I.
I
1941-51
lo,.lion of tl. to.,. ,.l' \\., Notional Highwoy--- v\J .... Rive.. .. )~<,; '. N. S :-Not Surveyed ,?-.
I ANAHTI'IAG 15 RAMNAGAR
2 BiJBEH,UU. ,. teATA. ...
3 SHUPIV.4.N 17 JAfr.4~U
4 PAUPORE r 8 JAMMU CANH
N S SRINACOA.R " RANBIRSINGHPORA
If 6 BA,OAMIBAGI'I 20 SAMBA CANn
>I Aj(HNUR 7 BARA.,.UlL ... 8 SOPO~E 22 KATHUA
I) URI >J BASHOHLI
10 LEH ,. POONCH
II KISHTVfAR l5 RAJOURI
Ii BHADERwAH
13 UDHAJ..IPlJ"
14 RE4.S1
0 0 nE 74 E 0 76 E
o 76 E
o 78 E
JAMMU AND KASHMIR STATE URBAN CENTRES
~\
\
1951
I ~ 1'\ (J \. ... _ ..... ).1
tv J ",I' ~ k~ \
IJ ., ,. ...
...
eOUND~RIES : INTERN"TION"L _. _ STATE _._._ BOUNDAR Y : DISTRICT _ • _. _._
CEASE·FIRE LINE
32 " 0 11 '4 , I I I : 1m. r
'''''' KILOMETRES 50 25 0 50 100
7g E
N o
34
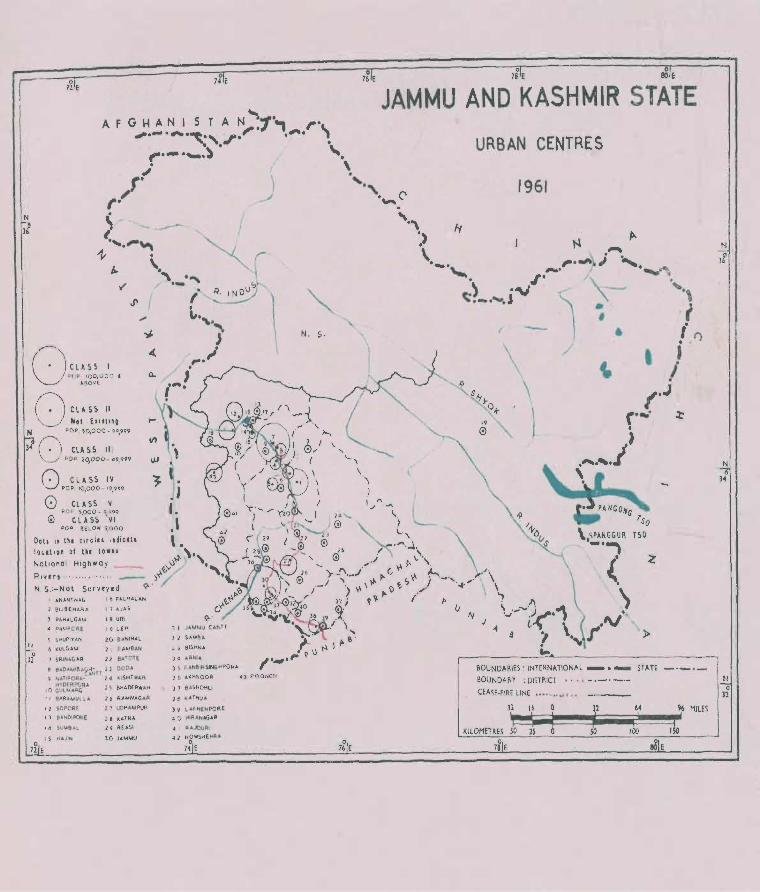
F
O CLASS 11 Not [Slnlftl
N PCP SO.OCO - 90,999
O CLASS III pOP C-D,OOO- 49,990
PO~ aEl.OW s,ooo
Doh Ifl th c,r el " i lidicllt.
'I, J \. (1)
lo< .t,o' of thl to... ,.
Notional Highwa y _ _ ",,,,,,oJ. ) "" R,v rrs ,,· .. · ........ · _ i/ . N S.:-Nat Sur vt yod q.'
" o 32
0 72 E
I ANANTNAG
:2 BIJ6 ( MAP,A
, PAI-IALGA~
.. PAvpo.qE
S 5HUPIY.A~
16 PAl,HA\.4,..
1'7 AJ"S
'8 uRI
10L£"
20 SAMHAt.
6 I(Ul(,'t.4 21 RAt.48AN
7 SRINA,(,A!:t 22 8.ATOTE
I!I BAD"MIBA~~NTl 2l DODA Q ,..AnpORA- :2 <I ~ISMTW"'R.
HVD£RPORA I 0 GUL~ .. J~C
II B""fUMULL.A
" SOPOR[
,) &ANDIPOAE
$lJMS,t.L
'S tU,JIN
1" RAMNAC; .. R
:2 7 UDHAMPUR
2 8 uTAA
:2 Q RE ASI
10 JAMMU
') I ).u..u.6U (ANTl
):2 S.M~A
J 3 BISHN A
J 4 ARNI ...
) S kAN8IR5',....-u>ORI,
) 0 UH~OO~ 43 POONCH
37 8 A5"OHI.I
38 ICAoTHUA
39 I..AKI1ENPOP<E
4 () ~IR.N~A "
.. I A'JOuRt
42 NgwSI'iEHAA
H E o
76 E
SOE
JAMMU AND KASHMIR STATE
URBAN CENTRES
" (1)
1961
\ )
1./' (, L " i... , \ SPAH CCUR !\ ....... l., ._ • .,
. ,1 r- "\ ( c, '" i.... J
lI' " '> '" i '_.'. .... . \ • '" \ Q ~ ",' ",. \ \
~'l-'" /" . " '> (J ~ J -4 \/"i~'1\ ".",,' ,
8 ., • ...,.1 » .. r-------------~~--------------------------~
BOUNDA~IES: INTE RN"TIONM _. _ ST"H
BOUNDA~ Y : DIST~ICl •• " -. _ . -.-
CEASE·fIRE LINE ••••• "," ..
II 16 \2 M 96, HILES
'~~~\"~~~~~""~i~i~~~i ' KilOMETRES 50 2~ 50 100 ISO
c 78E
N
I.d o
32
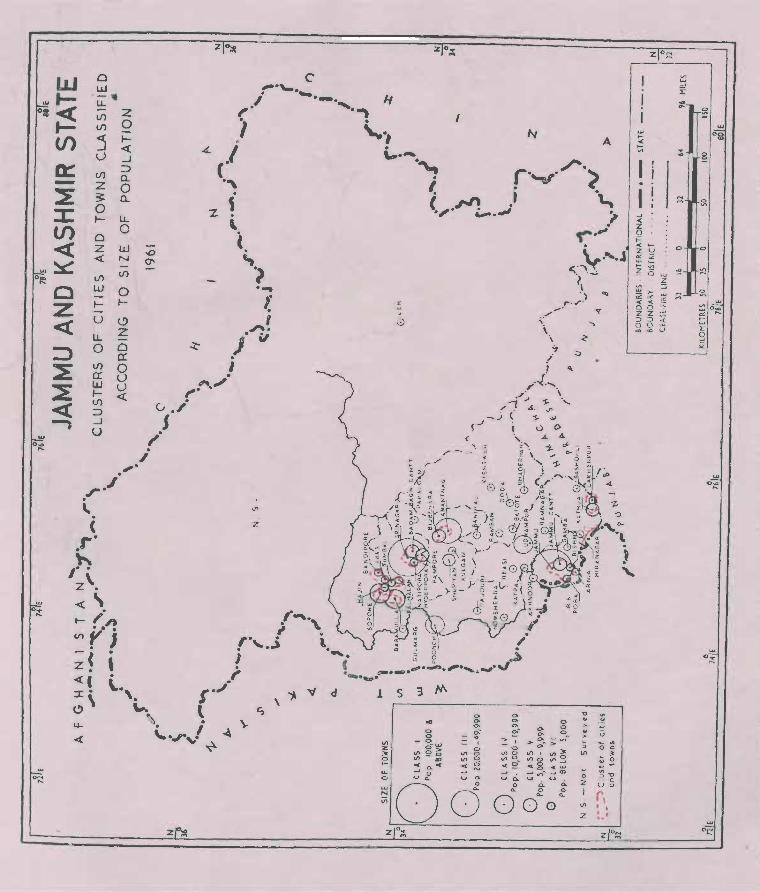
0", .....
c z «
o w -,. u.. I/)
I/)
:5 u I/)
Z ~ o I-
o Z « I/)
W
I-
u u.. o I/) C( W lI/)
::::::> ..J U
z o le{ ..J ::::::> a.. o a.. u.. o W N
I/)
o I-
l!) Z o 0: o U U «
C' __ .'-. . --.-.-
J ".-'\ (. \.._., I
~. . i.._...._ r . ....,. ~ J "] i \ .. t.. (' .,_" ~ .' ! .,. -. ,.. ...
-z , .. -..... J L ~~ l 1, '-. . ) . "'~ r · .r·
I
N A
I i . I I
0 0
~ ;!l
M ~ ~
,. ,..' ... o ,. ....
\ . \
" ~ .. .~ ,._ ~ u
'0 ~ " c II) 'It
~ 0 !:~ ~ "O 0 2 co z v 0
I ro I I
Vl • • Z • , ..
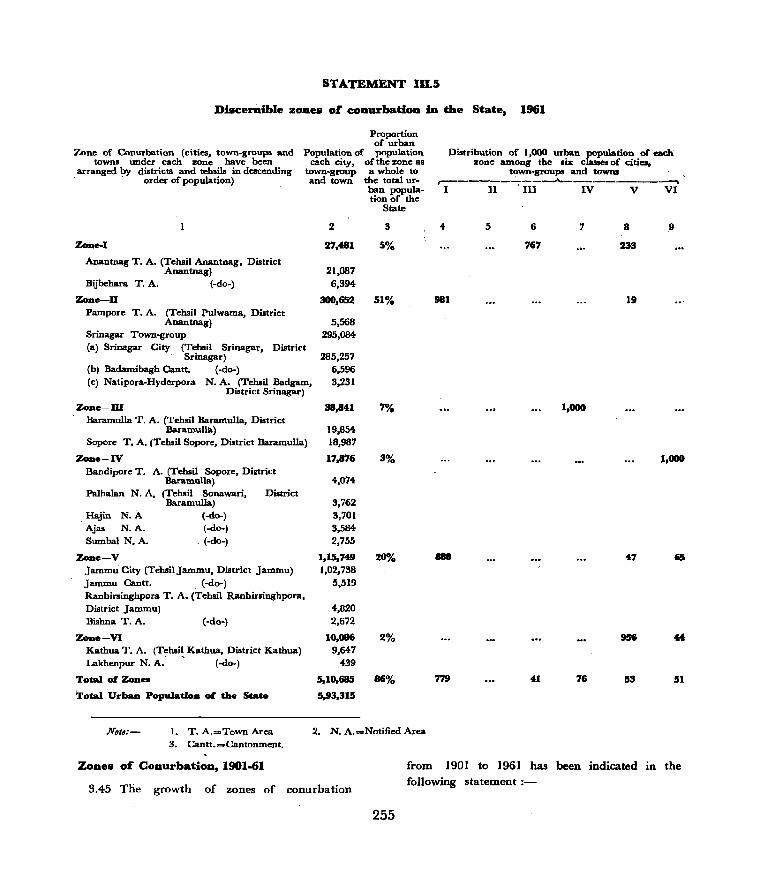
STATEMENT IIL5
Disc:eraible ZODes o£ cODurbatfoD m. the State, 1961
Zone of Conurbation (cities, town-groupa and townl under each zone have been
arranged by districts and teh.il. in descending . order of population)
Zcme-l
Anantnag T. A. (Tehsil Anantnag, District Anantnag)
Bijbehara T. A. (-do-)
Zcme-D Pamporc T. A. (Tehail Pulwama, District
Anantnag) Srinagar Town-group
Proportion of urban
Population of population each city, of the zone as
town-group a whole to and town the total ur
ban population of the
State
2 3
27.481 5%
21,087 6,394
lIOO,652 51%
5,568 295,OM
(a) Srinagar City (Tehsil Srioagar, District Srinagar) 285,257
(bl Badamibagh Cantt. (-do-) 6,596 (cl Natipora-Hyderpora N.A. (Tchsil Badgam,
District Sri nagar) 3,231
Zcme-m 38,8U ,..,.{, Bararoulla T. A. (Tehsil Baramulla, District
Baramulla) 19,854-Sopore T. A. (Tehsil Sopore, District Baramulla) 18,987
Zcme-IV 17,876 3% Bandipore T. A. (Tehail Sopore, District
Baramulla) 4,074 Palhalan N. A. (Tehsil Sonawari, District
Baramulla) 3,762 Hajin N.A (-do-) 3,701 Ajas N.A. (-do-) 3,5M Sumbal N.A. . (-do-) 2,755
Zone-V 1,15,749 20% Jammu City (TehsilJammu, District Jammu) 1,02,738 Jammu Cantt. (-do-) 5,519 Ranbirsinghpora T. A. (Tehsil Ranbirsinghpora, District Jammu) 4,820 Bishna T. A. (-do-) 2,672
Zcme-VI 10.086 2% KathuaT. A. (Tehsi! Kathua, District Kathua) 9,647 Lakhenpur N. A. (-do-) 439
Total 01 Zones 5,10,685 86%
Total Urban Population 01 the State 5,93,315
Not6:- 1. T. A.=Town Area 2. N. A.=Notified Area 3. Cantt.=Cantonment.
Distribution of 1,000 urban. population. of each zone among the lix clauea of cities,
town-groups and towns ~------"':""----"'----.... ---------..
I II· III IV V VI
4 5 6 7 8 .9
767 233
981 19
1,000
1,000
III 47 65
779 41 76 53 51
ZODes o£ CODurbatioD, 1901-61
3.45 The growth of zones of conurbation
from 1901 to 1961 has been indicated in the following statement:-
255
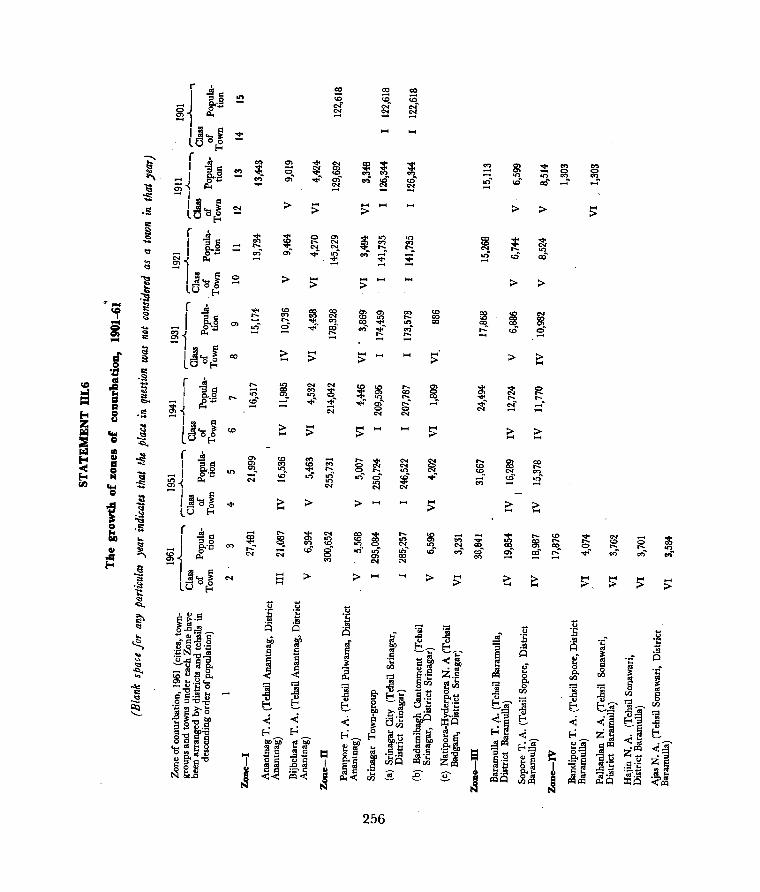
t
= I
j
;;: ....
256
....
....
....
.... ~ .... -Q
"" .... > ....
~ <t eo .... - Q .... --> ....

_") -en
.lie '3 0 Q,.~
o-Il..
.... >
1
.... .... ....
.... .... ....
.... .... ....
.... ....
.... ....
-co ;:.
>
>
> .... >
>
>
>
>
>
>
257

SECTION 3
FUNCTIONAL CLASSIFICATI6N OF TOWNS
Towns Classified by PredoD1inant Functional Characteristics
3.46 We may now examine the predominant characteristics of the urban areas of the State, except town-groups which reflect a complex or composite quality due to the several characteristics contending for recognition. The town-group will, however, be taken up in a subsequent paragraph separately.
3.47 The predominant characteristics of a city or town is that it may be important as a port or a centre of commercial, industrial, transport, communication or administrative, residential and educational activities. The opinions furnished by the District Officers about the predominant characteri.stics of the urban areas of their respective jurisdictions do-- not, however, seem to be correct, as these are not in many cases corroborated· by the industrial classification of workers. The city of Srinagar, for u"tstance, which abounds in handicrafts and arts cannot be categorised as a manufacturing area because the highest proportion of its workers falls in the category 'Other Services'. If the first two categories, namely, cultivators and agricultural labourers are left out and interse propol'tions worked out in respect of the remaining seven categories on the assumption that the aggregate number of workers falling in these is 100, the urban areas may be classified into three broad groups, namely-
(a) Manufacturing towns, (b) Trade and transport towns, and ( c) Service towns.
3.48 A manufacturing town would be one in which the sum of percentages in categories III, IV, V and VI is greater in value by 20% or more than the sum of percentages of cate-
258
gories VII and VIII or the percentage of IX.
3.49 Where, however, the sum of percentages of categories VII and VIII exceeds in value by 20% or more, the sum of values of categories III to VI or IX, the town may' be treated as a trade and transport town.
3.50 Lastly, if the percentage of workerS of category IX is greater by 20% or more than the sum of percentages of categories III to VI or of categories VII and VIII, the area may be classified as a service town.
3.51 The trade and transport towns may further be sub-divided into those whose predominant charactertistic is trade and commerce only 'and others in which transport and communication activity is more conspicuous. Accordingly, an urban area in which the proportion of workers in category VII, viz., trad~.~!1d
commerce, exceeds' the number of workers in category VIII, namely, transport and communication by 10% or more may be classified as a trade and commercial town. Conversely, where the number of workers in category VIII is larger by 10% or more than the corresponding number of category VII, the town may be classified as a transport and communication town.
3.52 Service towns which betoken a greater impact of population growth than economic and industrial expansion fall into two broad categories, viz., those where administrative offices are concentrated and others which function as educational centres or are used mostly for residential purposes.
3.53 Following this classification, the urban areas of the State may be categorised according to their predominant functional characteristics, as indicated in the following statement:-
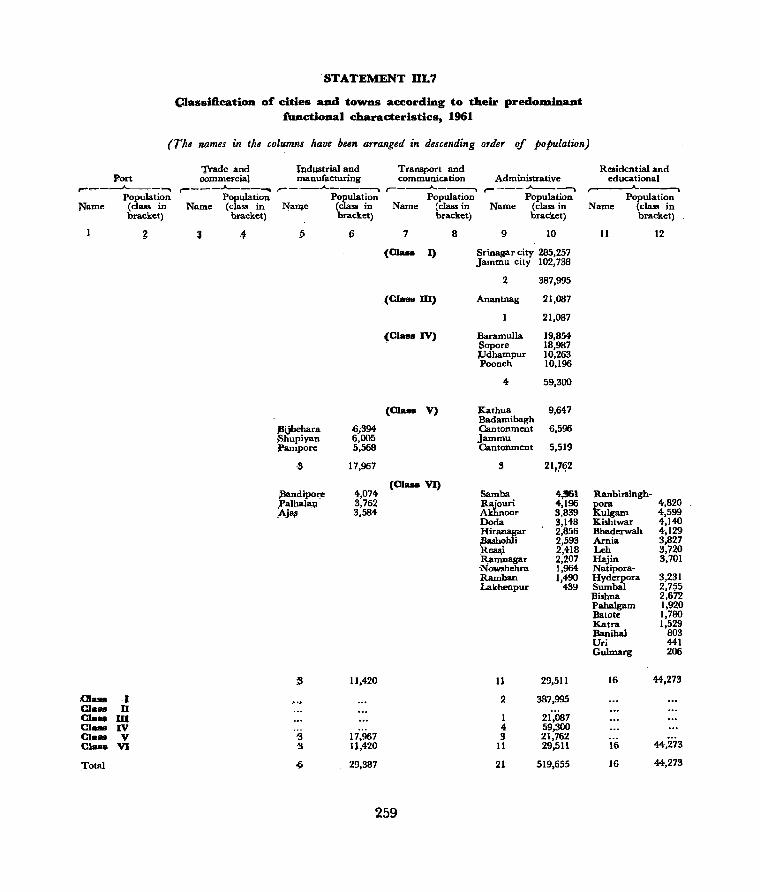
· STATEMENT 111.7
Classification of cities and towns according to their predoD1inant functional characteristics, 1961
(The names in the columns have been arranged in descending order qf population)
Port F __ --.A..-~. --,
Population Name (class in
bracket)
g
,OIass I Clalls D Cia •• ID Class IV Cia •• V Class VI
Tota]
Trade and cammer-cial
~---........_--_,.
Population Name (class in
bracket)
lndJ.lStrial and manufacturing
Transport and communication
,.- ---......_--~--, Population
,-___ .A. ____ -, Administrative
r----.A-...._-~
Population NallJ.e (class in
bracket)
6
Jiijbehara 06;394-,8hupiyan 6,005 :pampore 5,568
,3 17,967
,Bandipor:e 4,074 ,PalhalaJOl 3,762 _.Aja~ 3,584
:3 11,420
S 17,967 -3 11,420
9 29,387
Population Name (class in
bracket)
8
.(CIaS8 m)
~Class IV)
(Class V)
(Cia •• VI)
259
Name (class in bracket)
9 10
Srinagar city 285,257 Jammu city 102,738
2 387,995
Anantnag 21,087
21,087
Baramulla 19,854 Sopore 18,987 pdhampur 10,263 Poonch 10,196
4 59,300
Kathua 9,6H Badamibagh Cantonment 6,596 Jammu Cantonment 5,519
3 21,7~2
Samba 4,!161 Rajouri 4,196 Akhnoor 3,839 Doda 3,148 Hiranagar 2,856 ~shoh1i 2,593 Reas,i 2,418 R,lImnagar 2,207 Nowshehra 1,964-Ramban 1,490 Lakhenpur 439
11 29,511
2 387,995
] 21,087 4 59,300 3 21,762 II 29,511
2] 519,655
Residential and educational
,--__....A. ___ -,
Population Name (class in
bracket)
11 12
Ranbirsingh-rra 4,820
ulgam 4,599 Kishtwar 4,140 Bhaderwah 4,129 Arnia 3,827 Leh 3,720 Hajin 3,701 Natipora-Hyderpora 3,231 Sumbal 2,7;i5 Bi.hna 2,672 Pahalgam 1,920 »alote 1,780 Katra 1,529 Banihal 803 Uri 441 Gulmarg 206
16 44,273
16 44,273
16 44,273
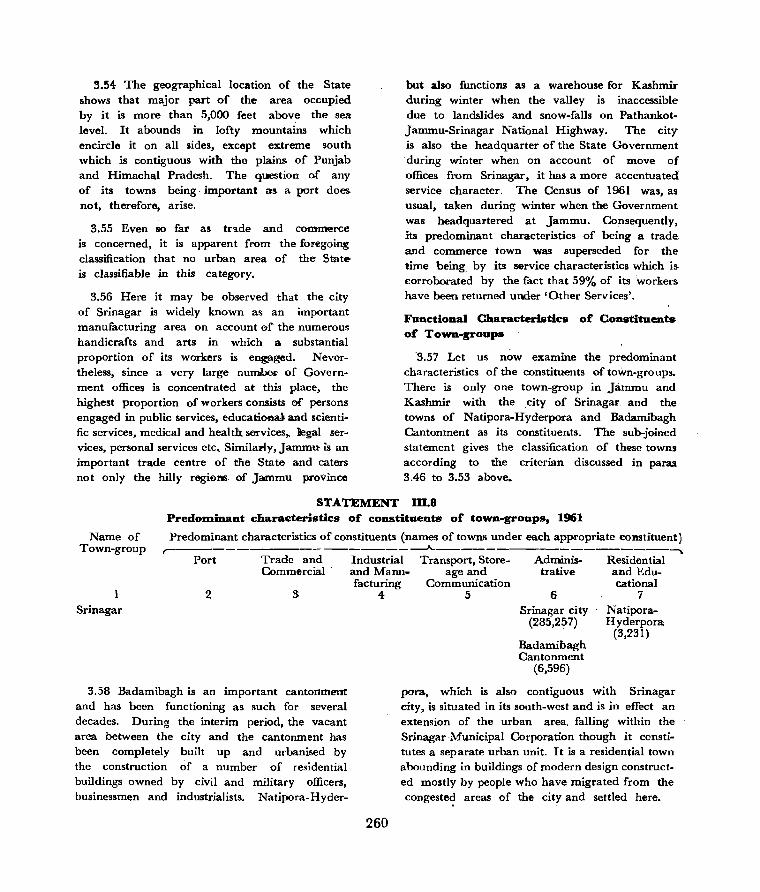
3.54 The geographical location of the State shows that major part of the area occupied by it is more than 5,000 feet above the sea level. It abounds in lofty mountains which encircle it on all sides, except extreme south which is contiguous with the plains of Punjab and Himachal Pradesh. The question of any of its towns being important as a port does not, therefore, arise.
3.55 Even so far as tn.de and commerce is concerned, it is apparent from the foregoing classification that no urban area of the Stateis classifiable in this category.
3.56 Here it may be observed that the city of Srinagar is widely known as an important manufacturing area on account of the numerous handicrafts and arts in which a substantial proportion of its workers is engaged. N evertheless, since a very large nuIJ"Johei' of Government offices is concentrated at this place, the highest proportion of workers consists of persons engaged in public services, educatioftaJI Uld scientific services, medical and health: se!"vices~ legal services, personal services etc, SimilaPly, Jammu is an important trade centre of tile State and caters not only the hilly regie1'l6. of Jammu province
STATEMENT
but also functions as a warehouse for Kashmir during winter when the valley is inaccessible due to landslides and snow-falls on PathankotJammu-Srinagar National Highway. The city is also the headquarter of the State Government . during winter when on account of move of offices. from Srinagar, it has a more accentuated service character, The Census of 1961 was, as usual, taken during winter when the Government was headquartered at Jammu. Consequently, its predominant characteristics of being a trade. and commerce town was superseded for the time being. by its service characteristics which is. corroborated by the fact that 59% of its workers. have been returned under 'Other Services'.
Functional Characteristics of Constituents of Town':groups
'3.57 Let us now examine the predominant characteristics of the constituents of town-groups. There is only one town-group in Jammu and Kashmir with the city of Srinagar and the towns of Natipora-Hyderpora and Badarnibagh Cantonment as its constituents. The sub-joined statement gives the classification of these towns according to the criterian discussed in paras. 3.46 to 3.53 above.
111.8 PredOlDinant characteristics of constituents of town-groups, 1961
Name of Town-group
Predominant characteristics of constituents (names of towns under each app.ropriate constituent). ,--------------------____"._---------------------,.
Port Trade and Industrial Transport, Store- Adminis- Residential Commercial and Manu- age and trative and Edu-
facturing Communication cationa] 1
Srinagar 23456 7
3.58 Badamibagh is an important cantonment and has been functioning as such for several decades. During the interim period, the vacant area between the city and the cantonment has been completely built up and Ul'banised by the construction of a number of residential buildings owned by civil and military officers, businessmen and industrialists. Natipora-Hyder-
260
Srinagar city (285,257)
Badamibagh Cantonment
(6,596)
NatiporaHyderpol'a
(3,231 )
pora, which is also contiguous with Srinagar city, is situated in its south-west and is in effect an extension of the urban area, falling within the Srinagar ·M~nicipaI Corporation though it constitutes a separate urban unit. It is a residential town abounding in buildings of modern design constructed mostly by people who have migrated from the congeste~ areas of the city and settled here.
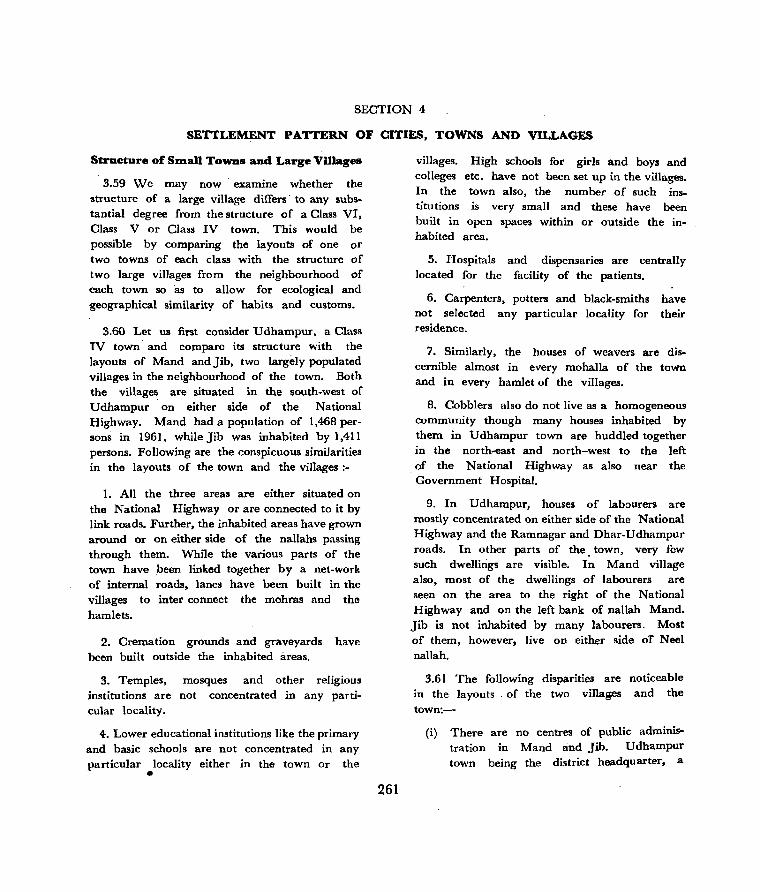
SECTION 4
SETTLEMENT PATTERN OF CITIES, TOWNS AND VILLAGES
Structure of S:rnall Towns and Large VUlages
3.59 We may now· examine whether the structure of a large village differs· to any substantial degree from the structure of a Class VI, Class V or Class IV town. This would be possible by comparing the layouts of one or two towns of each dass with the structure of two large villages from the neighbourhood of each town so as to allow for ecological and geographical similarity of habits and customs.
3.60 Let us first consider U dhampur. a Class IV town· and compare its structure with the layouts of Mand and Jib, two largely populated villages in the neighbourhood of the town. Both the villages are situated in the south-west of Udhampur on either side of the National Highway. Mand had a population of 1,468 persons in 1961, while Jib was inhabited by 1,411 persons. Following are the conspicuous similarities in the layouts of the town and the villages :-
] . All the three areas are either situated on the National Highway or are connected to it by link roads. Further, the inhabited areas have grown around or on either side of the nallahs passing through them. While the various parts of the town have been linked together by a net-work of internal roads, lanes have been built in the villages to inter connect the mohras and the hamlets.
2. Cremation grounds and graveyards have been built outside the inhabited areas.
3. Temples, mosques and other religious institutions are not concentrated in any particular locality.
4. Lower educational institutions like the primary and basic schools are not concentrated in any particular locality either in the town or the
• 261
vil1ages. High schools for girls and boys and colleges etc. have not been set up in the villages. In the town also, the number of such institutions is very small and these have been built in open spaces within or outside the inhabited area.
5. Hospitals and dispensaries are centrally located for the facility of the patients.
6. Carpenters, potters and black-smiths have not selected any particular locality for their residence.
7. Similarly, the houses of weavers are discernible almost in every mohalla of the town and in every hamlet of the villages.
8. Cobblers also do not live as a homogeneous community though many houses inhabited by them in Udhampur town are huddled together in the north-east and north-west to the left of the National Highway as also near the Government Hospital.
9. In Udhampur, houses of labourers are mostly concentrated on either side of the National Highway and the Ramnagar and Dhar-Udhampur roads. In other parts of the. town, very few such dwellings are visible. In Mand village also, most of the dwellings of labourers are seen on the area to the right of the National Highway and on the left bank of nallah Mand. Jib is not inhabited by many labourers. Most of them, however, live on either side oT Neel nallah.
3.61 The following disparities are noticeable in the layouts . of the two villages and the town:-
(i) There are no centres of public administration in Mand and Jib. Udhampur town being the district headquarter, a

number of Government offices function at this place. Most of these have been set up in the open spaces outside the
inhabited area.
(ii) Cultivators are in a minority in the town. They have built their dwellings mostly in the close vicinity of the fields. In the villages, however, where an overwhelming proportion of the inhabitants is engaged in cultivation, there is hardly any mohra or hamlet in which the dwellings of cultivators are not huddled together.
Ciii) The villages are inhabited by very few businessmen, if any. The town which is a commercial centre and caters to all rural areas in the district is inhabited, among others, by a large number of businessmen. They are mostly concentrated in the central part of the town.
(iv) The villages are inhabited by very few employees. In the town, however, the number of Government servants and private employees is fairly large. Most of them, occupy dwellings in the area to the north and west of Government Hospital and in the south-east of Girls High School.
(v) There are no priests in either of the two villages. The few who live in the town dwell in houses built, around the temple near the Dak Bungalow.
3.62 The above analysis shows that the layouts of the town 'and the villages do not disclose any significant difference in their structures. Such of the features which are not common are inherent in the rural and urban character of the areas.
3.63 We may now examine the layouts of another Class IV town and of two well populated villages not far off from it. Sopore is one such town in the north of Kashmir valley. As' there are not many well populated villages in the close vicinity of the town, we may compare its layout with the structures of Haihama and Kalaruch villages which are situated in
262
the north of the town at 33 and 35 miles respectively.
3.64 All the three areas are either predominantly or exclusively inhabited by Kashmiri Muslims who share a common faith, social system and culture. Following are the conspicuous similarities in the layouts of the town and the villages:-
I. The villages are enc~osed by forests and mountains and are interwoven by a "net-work of streams and nallahs. Sopore is, however situated in a plain and low le~el area and has grown on either bank of river Jhelum. It is bordered in the south by a swamp and is intersected in the north by a nallah and a marshy area.
2. The town has the appearance of a conre~ deration of a large number of geopraphical units known as mohallas. These units are even more distinctly discernible in the villages which consist of a number of hamlets demarcated by natural boundaries, such as, hills, forests, nallahs and streams.
3. In all the three" -areas, graveyards have been built outside the inhabited areas, but not far fro m them.
4. Religious institutions, such as, and temples, are not concentrated particular locality either in the town villages. Every mohall a and hamlet or more mosques of its own.
mosques in any
or in the has one
5. In Sapore, long rows of shops have been built on either side of the roads leading to Handwara, Doabgah, Srinargar, Tarzoo and Bandipore. There are very few shops in Kalaruch and Haihama villages, but, even so, many of these have been built alongside the main roads of the villages.
6. Both in Kalaruch and Haihama, clusters of houses of cultivators are seen in the hamlets on the borders of the villages. In Kalaruch, most of the cultivators are concentrated in Kianpur, Lashtiyal, Madh·Madhu, Sonapind and Qasba. Similarly, in Haihama, majority of the

Z a:: a:: ~
::::> a.. ::::>
... 0 ::E
.,_
0 « ::E
I- :l: «
"-0 :r:::
'" :::::> 0
::::> ;;: a: _, « :J z 0... 0 ;:: 2 0 <t: z _j
t-'
I c..>
Vi ~ 0 :l:
:J ..... ..... ->
,
o
0
! 0
J e
~ e e Q
! 'V e e "'I'" ! • e
! e
[]
Q
..... _\ a 0 l ....... _----/
0
\
\ .. \ , ! \ I ;. \
"
Q '.
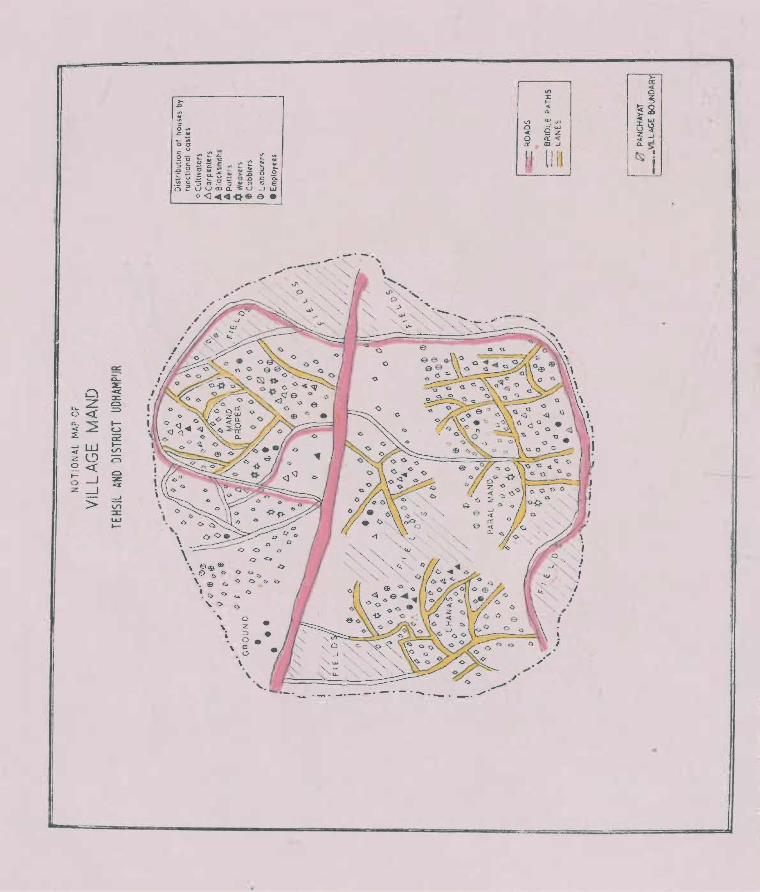
", , '" '- z
• => 0 , a
.'" \
_._.-" _.- -_ --.
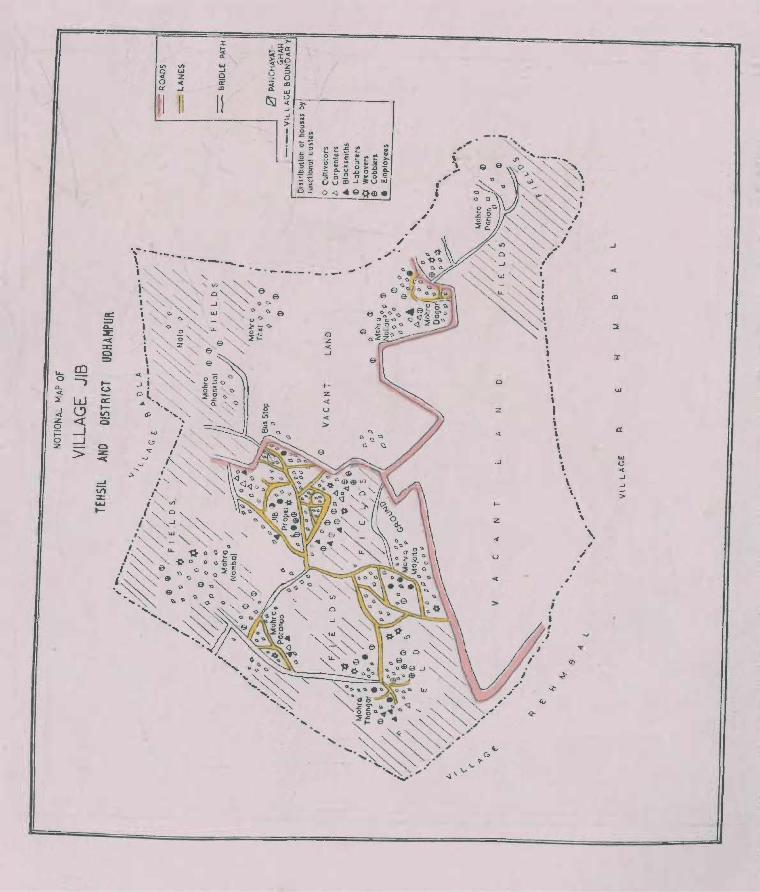
0
z
«
J
,__
z
..:
u
«
> ; I
tv
<I"
, , \
"
I
,
Q)
~
\ \
\ , ;
...
J
«
x
.., Cl ... J

IJ.. Z
: ~ < ~W
..J 0:: ~O o tO Z
\I)
a
UJ ~ I a: o ~ i Cl..~ 001( lila:
< CD
I:J D
""-Cl() 0 / . (lCl~CO •
D()O
~D C.t:J~ /
°Cl(P'< o \( o • I' .
/ . I ,
I • =--,~ J -. _ ___.,
>'" -< o z
~ ell
on .. ~
VI
o v
o c o ..
.. .. ~ c !: 0 ~ on o 0 n.:::!
" • .. .. I-
e
u _. ~ .,. C .... til tn
~ ~..c:: -:: ~ = o u e.r u ._
~";~~E 'i:mo.mlll
:O.()(jI .. :> o .t:

e
« e c.: 0::: --J
~ ~ --J :;::)
<t . ~ 2::
~ e &a... Ie 0::: 0
- :z: c.: CL <{ en -c( z ::E ::c
_J
~ W 0 C> i i=
0 <{ t-Z .....J --J ~
V) ex: .....J :z: t-V) &.LJ Ci > t-
NOTIONAL MAP OF
VILLAGE KALARUCH TEHSIL
DISTRICT
HANDWARA
BARAMULLA
._.'/ __ '---0 0
• a 0 0 0 -.
."
l
-. 0 • _._,) .c. og
.-
( 6~O®
... (
, \
'-. ,..,../ ..... _
o
'_ ._
.- "
". ~. I
...... '. _,J
~ ... . o ~ ,.
-', \
....
LAStiTIAL.
"" ~ '" Q
ID <D
o
o
o
o
o
~ o . -\
a
o <D
-. -<l>!' _.
o ....
IL " •
" )
RO"OS AND LANES _-
.. . _" J
Distribution 01 hoyllPl by hmcllor.cl cosh'l
Cultl .... ators 0 Blacksrncthl ® P.~ ... s g TOllors .. O"sk~t - rnok~r", a Cobblc-rs OJ
Sawyers (1) WC'Q'Wcr,. a

dwellings in Sehipora, Solkot and Helmetpora are occupied by cultivators. A noticeable feature in either case is that the villages have grown around the area under cultivation. While the population of Sopore is dominated by nonagriculturists; the few CUltivating households inhabiting the town have taken their dwellings very near the fields in the east, - south and west of the town.
7. The map of Sopore shows that Telis (oilseed crushers) are concentrated in mohall a Telian which lies to the south-east of the Tehsil Office and on the right bank of river Jhelum.
Likewise, the dwellings of Gujars in villa~e
Haihama are huddled together nearabout the forests in the north-east and north-west of the village where grazing facilities are available.
In Kalaruch, basket-makers have taken their dwellings in the hamlets in the east of the village where raw material for basket weaving is available in the adjoining forests.
8. Priests do not generally live as a homogeneous community. Their dwellings are, therefore, scattered in different parts of the town and the villages.
9. Black.smiths and tailors, whether those living in the town or in the villages, also seem to -prefer to _- live together. • In Sopore. black· smiths are mostly concentrated on the left bank of river Jhelum and to the right of SoporeHandwara road. Similarly, majority of tailors inhabit the area on the right bank of river Jhelutn adjoining Sopore-Handwara road. In Haihama, black-smiths and tailors mostly live in the hamlets known as Qasba and SoJkot. Many black-smiths in Kalaruch have built their dwellings in the hamlet known as Qasba. Tailors are, however, found in Qasba MadhMadhu and Lashtiyal.
10. Weavers are scattered in different parts of the town and of the two villages. Sopore is reputed for the production of woollen fabrics and there is, therefore, hardly any mohalla which is not inhabited by the members of this
263
community. In the villages, the number of weavers is comparatively - small but'" here also they are not confined in any particular locality.
II. The layouts of the town and the. villages are, however, different in several respects.' These are briefly mentioned below:-
(i) There are practically no centres of public administration in the two villages. Sopore is, however, the headquarter of a large number of Government offices and institutions which are concentrated in the open space in the north of the town.
(ii) The villages are inhabited by very few businessmen. In the- town, a fairly good number of dwellings belongs' to the business class. All such houses are concentrated on the left bank of river Jhelum or very near the Sopore-Handwara road.
(iii) There are no tonga drivers in either of the villages. Sopore is, on the other hand, an important communication centre and tongas ply on most of the village roads which connect the rural areas with the town. Tonga drivers mostly live very near Sopore-Handwara road.
(iv) For reasons already stated above, there are very few employees in the villages. In Sopore, the employees have taken their dwellings mostly in the mohallas on either side of the road taking off from the old bridge to Handwara,
(v) Potters are also conspicuous by their absence in the villages. There are, however, many dwellings of potters in Sopore town. All these are situated in the eastern and south-eastern sectors adjacent to the fields.
(vi) Masons are not also found in the villages. Sopore is inhabited by a number of masons many of whom live in the area close to the right bank of river Jhelum.
3.65 We now take -up Pampore; - a Class y town of tehsil Pulwama, district Anantnag, with a population of 5,568 and compare its structure with two other large villages, Awantipore and

Ladhua, of the same tehsil. Awantipore lies about 10- miles to the south of ~ampore and Ladhua 6 miles to its east. According to the Census of 1961, Awantipore had a population of 1,838 and Ladhua of 1,560 persons.
3.66 The notional maps of the town and the two villages show that the general layouts share the following similarities:-
1. All the three areas are bordered i~ the west by rivers or streams.
2. Pampore town and Awantipore village have grown on the Srinagal'-Jammu-Pathankot National Highway while Ladhua has sprung up on the -'tehsi! road which takes off from the Natiorud Highway at about 5 miles to the south of Srinagar and passing through Khrew and Ladhua again merges with the National Highway at Pampore.
3. Orchards have been laid in the out-skirts of the inhabited sectors of the town and the two villages. The open spaces adjoining the orchards and the fields have been converted into graveyards.
4. Places of worship are dispersed in different parts of the town and the villages, each sector having a separate mosque of its own.
5. Rows of contiguous shops have. been built on either side of the National Highway in Pampore and Awantipore. In Ladhua, the shops are mostly situated on the Khrew-Ladhua.Pampore and Khrew-Ladhua-Lettapora roads though they are fewer in number and are sparsely located.
6. Centres of public administration are mostly concentrated outside the main inhabited area of the town and the villages. In Awantipore, the Police Station, Electric Sub-station, Water Works etc. lie in the south and south-east. Similarly, in Ladhua, the Sheep and Wool Development Unit, Electric Transformer, Post Office and Basic School have also been built in the south. Again, the southern sector of Pampore town is occupied 'by the High School, Hospital, Forest and Block Development Offices and the Water Works.
264
7. By and large, in all the three areas people of different occupational castes are Concentrated in separate sectors. In A wantipore, for instance, the area on either side of the National Highway between Jamia Masjid and the shrine of Syed Saheb is inhabited by Muslim priests. Again, the dwellings of fishermen are clustered together alongside the eastern bank of river Jhelum extending from the Range Office to the point in the north where the river and the National Highway' seem to converge. The Telis (oilseed crushers) are als~ huddled together in the area to the left of the National Highway around the Post Office. Many dwellings of cultivating households are· concentrated very close to the areas under cultivation. Potters have chosen to inhabit the area in the extreme north of the village where. clay for earthen-ware is readily available.
In Ladhua village also, one of the mohalIas is dominated by religious priests only. Potters and barbers are concentrated in Block B in the at't!a to the south of Khrew-Lettapora road and to the east of the nallah. Several -houses of stone chisellers have sprung - -UP---Yery near the quarries. Black-smiths and carpenters -have almost monopolised the southern sector of the village near the Post Office and the Basic School. Telis (oilseed crushers) ate concentrated on either side of the nallah running from north to the south and intersecting the Khrew-Lettapora road. -
In Pampore, cultivators and potters dominate the area in the south-east of the town on either side of the road leading to Khrew. The milkmen are concentrated in two groups in the south and south-west, the intervening space being occupied by houses of cultivators and cobblers. Masons mostly live around the shrine of Khwaja Saheb in the south-east. Tonga drivers are found mainly in the outskirts of the town near the Octroi Post.
8. Both in the two villages and the town majority of the houses owned by businessmen are clustered together on the National Highway and the tehsil road or very near the same.
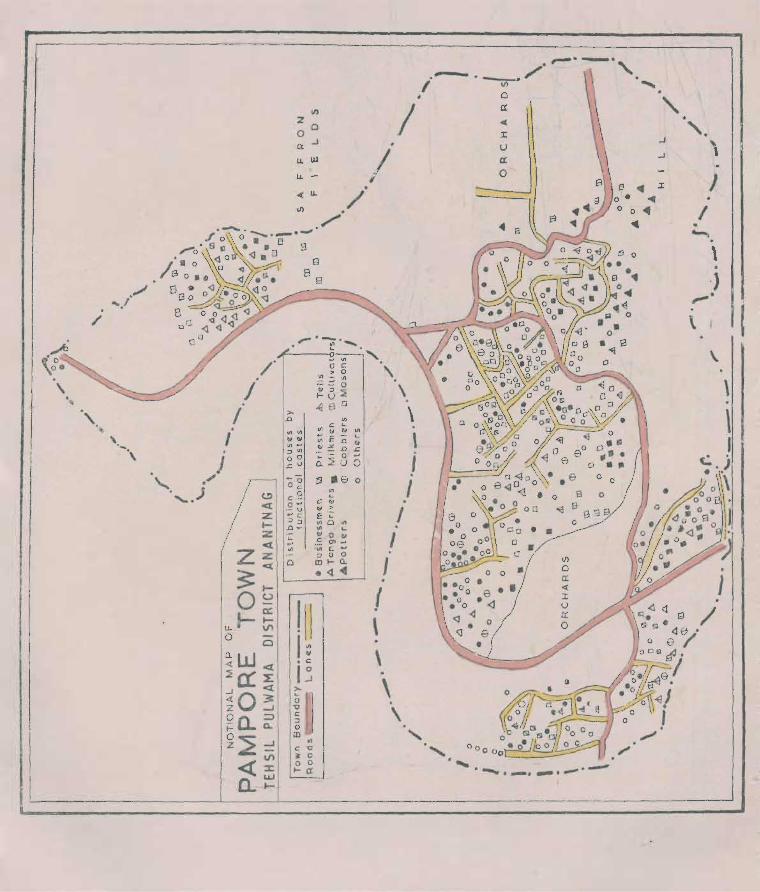
o
~W ::::0: ~O go. ~~ « a.
t-U
a:: t-V'\
Cl
oCt :l: oCt ~ _, ;::, Q..
_, \1'1 ::J: UJ t-
2
00
n J
Ii. W
u.
! 11 h • c
I ~ >-
11 III
til C ." It 0 o 0 t-a:
\II ... c '" '" > E 't: oil 0 oil \II ._
'" 0 '" C; '" ~ ·Vi c ..., " 0 0 lIlt-a. • <l ~
.1 ,
I . I \ \ .
I
\ .
/
\ I I
I
,
-i
,......_. . '\. ._./ . I/) .....
o IX " « . J:
,. J , U
IX .J .
0
• J: J o •
~ o 0 .. I
'4 ...... . \ . . )
,.,-0
\.
\
/ ~ /

~'" \
" .., . ) '-.
l
/ J
o
/'
/
o
z o
II)
o a: J
U. UJ
u.
on VI .... "'.., " '" 0 0 _c" -0 Oc
o c ·-0'" .- u .... c
"" .0-
'.... '"
l~ • c
I ~
fJ III
III C "0 J 0 o 0 .... 0:
on '
c .. .. > E "L: '" 0 on III '-.. 0 .. .~ o-.-oJ III C ...
" 0 0 m .... a. • <l -4
.1 ,
\ . \
,_ . ._. . "\. . .....-..-. . ---...._ . ./ . I II) ,
o c!
~
:t
U
0:
o
/
\ . "
, J
J
4 .I: o· ~ o 0 4 ~
. ,. , . J
/
\ . . )
". \
\
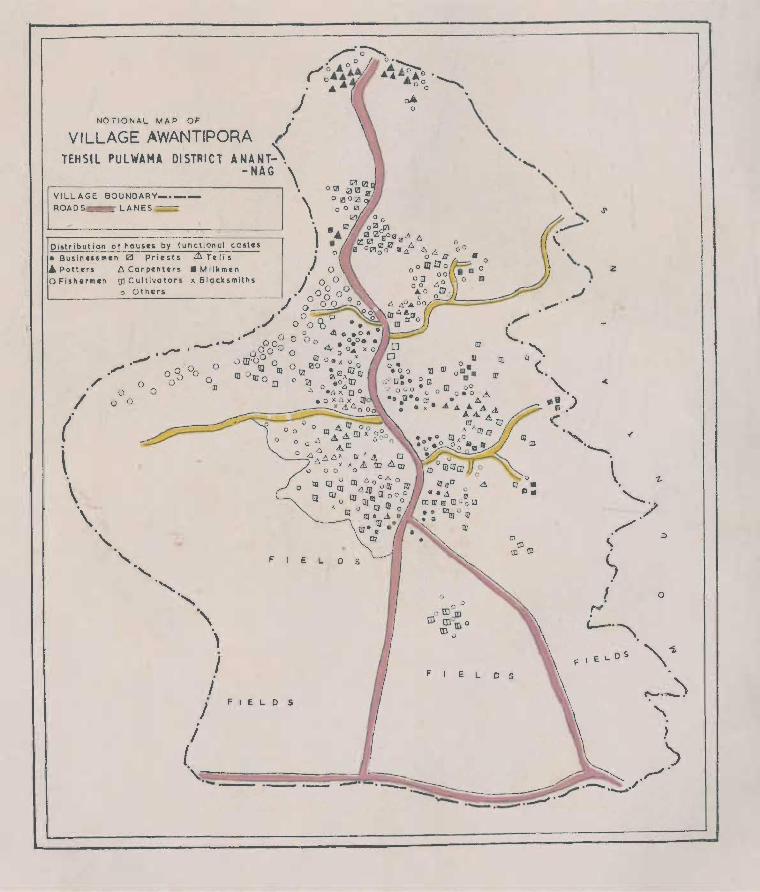
) NOTIONAL MAP OF
VILLAGE AWANTIPORA ,/ TEHSIL PULWAMA DISTRICT ANANT.\
-NAG \
\ VILLAGE BOUNDARY-. __
ROADS LANES = Distribution 01 houses by functional castes \ • Businessmen 0 pri~sts &Trlis • 0
A Potters J:; Carpentcrs • Milkmcn .1 0 10 Fishermen rn Cultivators x Blacksmiths / 0 0 I 0 Oth~rs • 0
00 0° L_____ __ --=-...:.....:___:__:_-----I 0 n
/' /
( \ \ '\
o o 0
o
"
"
"
/ 0 00 ~o
./' o~ • 0 0 D •
", 0 41 ... 08· • .",., • Q 00 0 () 0 • 0.0 ••
• ___,. 000 a 0 4- 0 0... x 0
o o
In
'\ , j
i J .
-.) /II 'OO 0 0 0 .. ~ U x m :) III III 0 t.IJ eo • ca ll]~
lD 0 , tJ "Ia 0 Ii!~O~QJ
F E
FIELD S
6. .tJ, x. tJ 0
.ox u x Q7 xdlc'ooo
L D s
F E L D 5
o
,\1-c-._)
" , / ( ! \ \ ')
~~;;:::;::==~~~~-'~~-'-'/'~' ,._-.......;;;.-.-.~.
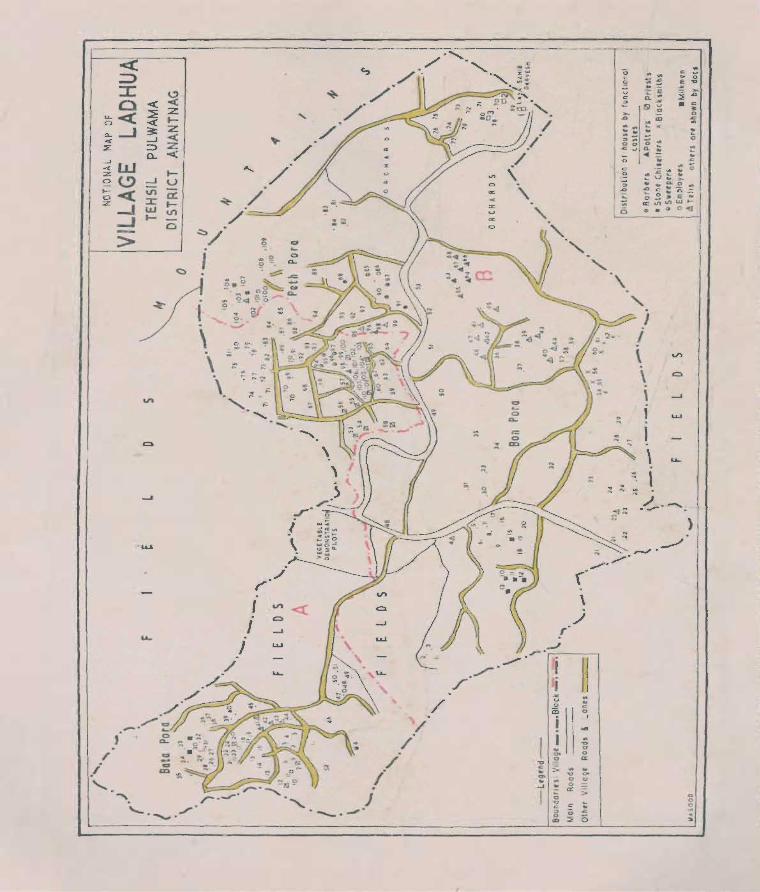
<'w ;;C) ~« Z_J
_J
>
_,
/ I
/ /
/
. ..",,-/"
I ~ c . ~ .J
I
\ ./
r _,
I II ~ u ~
0 c ID " ! --'
I ~ ~
" '" " ~
" c::
>
"0 ~ u c
"
~ 0
E '" ~ ~ I ~ • c ..
o -;
u..
e 0
~

V)
z
z
o
I , f ,
1
, I
" •
o o
~ 0
o
J 0 '0 0
I I )
I . J J J IV)
i Cl
,-1 jUJ j l ,"-\ \ \ \.
." <> <:> <>
<> ,,"
, .,
e
e. e
• c
'" • 0
0
/ \
I
/ /
'" I <-......
"q"
,_
/
\.
\
\ '\
\
V)
o

.\ 'V .1 N n 0 m
s ~ Li.I ~ U
~ u: LL
0 ~ ... '"
'" ..
~ « ~
~-""'., I
.. "
""""-\1
u u Z . . - « . a.
\
i '" w
.t' z ~
r ...J
. V)J
, '" ( I ~
....
. IJ E ~
Z/" V) • '" " U 0
" J>
I ~
"'- " <I> .. cD ...J
--. <>
( Q, ~<l « . 0 _g~ ..
\ cr ~
...... W ~~~ , 0 o e- ~
I) « " -
<> 0 , ...J U::t
"< "0 <:>,,0
...J c: C-. ,> ~ Y'! It) ~ ......
... :> 0 ..
" .., ~ ... _ 0 0 .... > -
a: r :z: \ 0 0
"- <! -c( .::J. o ~
\ .;~ ~
0 al -c( I) {> ~
I :::l: 0 I Z. () <:> '"
\ ou UI
0... OJ " ~
oC( 0 <> « a:: 0 0° '" \ ~ . -:::> _J ~, « W z
.,.<) 0 0 0 I .) ~ <>
t- <! t- I ~ 0 _J -l <..) :z
• - 0 <> <>
_J ... ' ~ , .:. " <> (> <0 ~<:> \) (> 0 I) " " <l
:r t-- I (> () ~ "
IoU t.n <0 '0 0
<) ~ {) '"
> t-- Cl ,
0(> 0 0 "
tI '\
<:. <> 0° () 0 ,,<> <l
, <> <> (>
I)
\ (>
<> <>
!
. \
! 0 ~
tJ)
I <> ~ l ... <.>
f , a Z
, ~ \:I
J I
~ 0
tl r:. " l-
• j« ~
-0 !J-
'" 1> U
I
0 """ °0 i2
.. \)
" \)
<.> ~ " r.
~ ,.-• ._ _ .. _ .d • ...". • ..". .. - ......
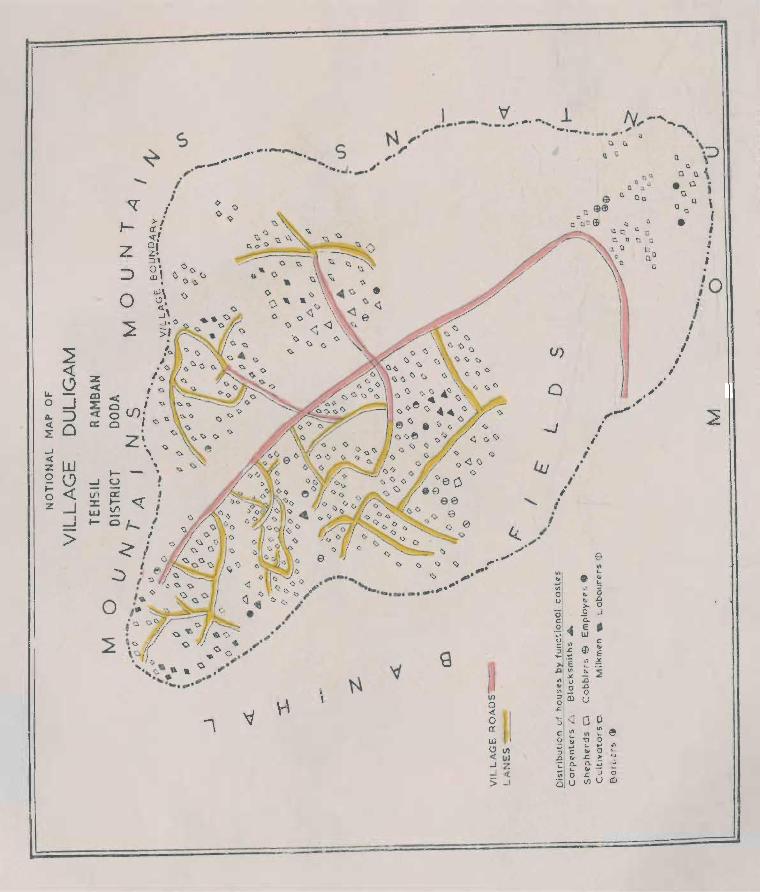
...J « Z W 0 19 I-
...J
0 <! If)
z ...J J:
...J UJ I-
>
-'~
......
z ::>
o ~
. Z' .
."",.., . .",.,.- ..... ,....... s ,.- ..... . ... I '-.~ ,. i ._.
i (>
>-; <> <> cr.' ~ <{I o· z! :;)\
~i
\ '" . , I-U
, a: ..... <r ! IJ") !
o
\
_-
,. /. ! "'- tI
,. ",'
) VI o
~ il o III <l. III ~Z = <l. > _I
",. ",'
.... ' ... ... '" a u
e III L. . '" L.
'" " .. 0 .. .0 >- a
.Q ..J 0.
~ . c
G) ~ ~ ~
~ ::? .0 o U
; 6 ,
fa i
I i , ,.
l
u

3.67 The above analysis indicates that the pattern of the layout of, the town is substantially the same as of the villages. A distinguishing feature of the town is, however, that its northern sector is developing fast into an industrial area.
3.68 We may now consider the layout of Banihal, a Class VI town and compare its structure with villages Duligam and Khari. Duligam lies to the south-east of Banihal at a distance of two miles, and had a population of 2,314 in 1961. Village Khari which had a population of ,2,398 lies a~ut five' mile, away in the north-west of the town.
3.69 Following are the common features, of the layouts of the town and the two villages :-
1. The town has sprung up in a long and narrow valley enclosed by lofty Pir Panchal ranges and bordered in the north by naJlah Bichhlari. Another nallah flows right through the town from south to ',north and later merges with Bichhlari.
Duligam ; village has also grown in a small narrow valley fanned by mountains. Like the town, Duligam is alSo 'bordered on one side by Gugthal millah and is intersected by Dulmandu nallah which flows diagonally from north-west to SQuth..east alOIigside the road connecting the village with the National Highway.
Village Khari has e~n more mountainous topography than Duligam. It is not only enclosed by mountains but is also intersected by them. Bichhlari nallah which· lies to the north of Banihal town, borders the village in the east and flows alongside the National Highway. A number of other nallahs ,taking off from the foot of the mountains in the central part of the village also flow southwards and merge with Khari, a tributary of Bichhlari nallan..
2. The town and the villageS have grown on either side of well-built roads which pass from one extreme end of the inhabited area to the other. In additio~, a net-work of lanes has been built in aU the three areas to inter-connect their various mohallas and hamlets.
265
3. Except for Duligam, where one or two graveyards have been built within the inhabited area" all other cremation grounds in the town and the villages lie in uninhabited areas near the village boundaries.
4. Religious institutions are not concentrated in any particular locality either in the town or the villages. Due to the severe cold and heavy snowfalls in winter and the inconvenience caused in consequence in walking long distances, almost every bamlElt has a mosque of its owt.. and temples and gurdwaras have been built only in such of the areas which are inhabited. by Hindus and Siklis.
5. Ghrats (water--mills) have been built on the banks of nallahs and, as far as possible, away from the inhabited area.
6. I?rimary and Basic schools have been set up in different parts of th~ town and the villages so that .infants and young children may not have to travel long distances. Higher educational institutions like Secondary schools etc., which have been set up in the town only, have been built outside the inhabited area.
7. In Banihal long rows of shops have been built on either side of the National Highway. There are very few shops in the villages. In Duligam, most of these have been built alongside the road leading to Banihal but the few shops in Khari have been set up near about the bunds of the naHahs. This is apparently because the central road of the village passes through mountainous 'areas which have very low density of population.
8 Like schools, medical institutions are not concentrated in any particular area. Duligam has, however, no such institution.
9. Neither in the town nor in the villages, the dwellings of carpenters and black-smith~
are confined to any particular locality.
10. The houses of labourers, though not clustered together, are very near the National Highway or the link roads.
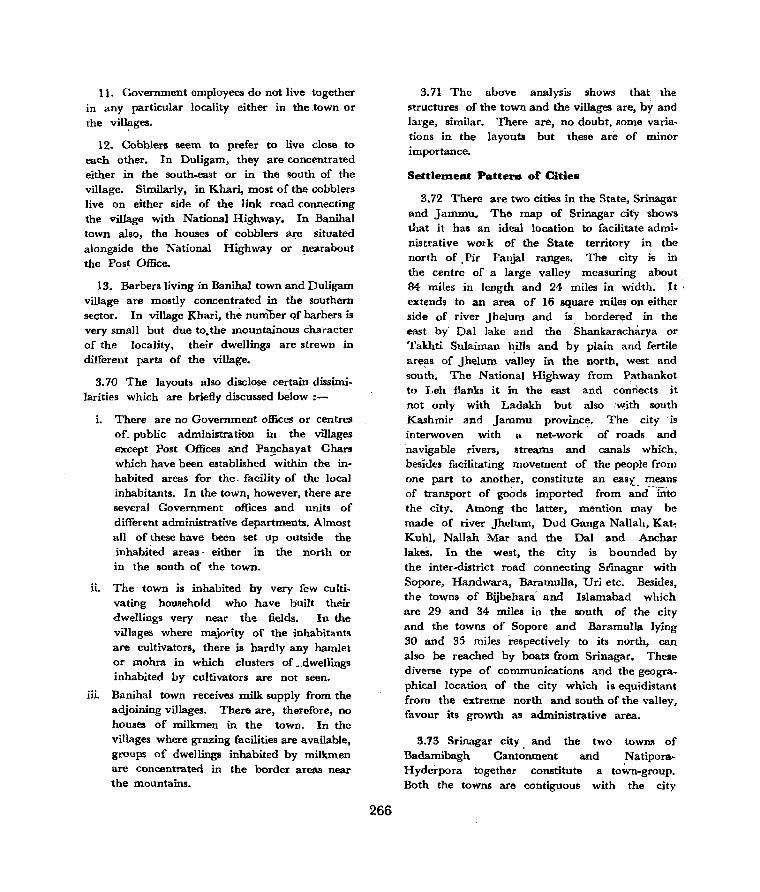
11. Government employees do not live together in any particular locality either in the town or the vil~ges.
12. Cobblers seem to prefer to live close to each other. In Duligam, they are concentrated either in the south-east or in the south of the village. Similarly, in Khari, most of the cobblers live on either side of the link road connecting the village with National Highway. In Banihal town also, the houses of cobblers are situated alongside the National Highway or ~earabout
the Post Office.
13. Barbers living in Banihal town and Duligam village are mostly concentrated in the southern sector. In village Khari, the numner Qf barbers is very small but due to. the mountainous character of the locality, their dwellings are strewn in different parts of the village.
3.70 The layouts also disclose certain dissimilarities which are briefly discussed below ;-
i. There are no Government offices or centres oL public administration in the villages except Post Offices and Pa~chayat Ghars which have been established within the inhabited areas for the. facility of the local inhabitants. In the town, however, there are several Government offices and units of different administrative departments. Almost all of these have been set up outside the inhabited areas - either in the north or in the south of the town.
ii. The· town is inhabited by very feW cultivating household who have built their dwellings very near the fields. In the villages where majority of the inhabitants are cultivators, there is hardly any hamlet or mohra in which clusters of _.dwellings inhabited by cultivators are not seen.
iii. Banihal town receives milk supply from the adjoining villages. There are, therefore, no houses of milkmen in the town. In the villages where grazing facilities are available, groups of dwellings inhabited by milkmen are concentrated in the border areas near the mountains.
266
3.71 The above analysis shows that the structures of the town and the villages are, by and large, similar. There are, no doubt, some variations in the layouts but these are of minor importance.
SettleDlent Pattern of Cities
3.72 There are two cities in the State, Srinagar and Jammu. The map of Srinagar city shows that it has an ideal location to facilitate administrative wOlk of the State territory in the north of .Pir Fallja} ranges. The city is in the centre of a large valley measuring about 84 miles in length and 24 miles in width. It, extends to an area of 16 square miles on either side of river Jhelum and is. bordered in the east by Dal lake and the Shankaracharya or Takhti Sulaiman ~ills and by plain and fertile are!!s of Jhelum valley in the north, Wiest and south. The National Highway fTOm P~thankot
to Leh flanks it in the east and connects it not only with Ladakh but· also with south Kashmir and Jammu province. The city 'is interwoven with a net-work of roads and ·navigable rivers, . streams and canals which, besides facilitating movement of the people from one part to another, constitute an easy means of transport of goods imported from ~~d- Into the city. Among the latter, mention may be made of river Jhelum, Dud Ganga NaUah, Kat~ Kuhl, Nallah Mar and the Dal and Anchar lakes. In the west, the city is bounded by the inter-district road connecting Stinagar with Sopore, Handwara, Baramulla, Uri etc. Besides, the towns of Bijbehara' and Islamabad which are 29 and 34 miles in the south of the city and the towns of Sopore and Baramulla lYIng 30 and 35 miles respectively to. its north, can also be reached by boats from Sri nagar • These diverse type of communications and the geographical location of the city which is equidistant from the extreme north and south of the valley, favour its growth as administrative area.
3.73 Srinagar city. and the two town.'! of Badamibagh Cantonment and .NatiporaHyderpora together constitute a town-group. Both the towns are contiguous with the city

and are connected to it by tarred roads. The city. can also be reached from the . Cantorur.ent by the rivet'. This facilitates the employment in 'the Ordnance Depot of the Cantonment of hundreds and sometimes thousands of persons of the city and adjoining rural areas. Likewise, people jnhabiting the Natipora-Hyderpora notified area do 'not find any difficulty in attending schools, Government offices, business houses and industrial establishments in the various parts of the city.
3.74 Jammu city has a relatively different topographical structure with an elevation of 1,257 feet above the sea level. I t forms the terminus of the Shivalic ranges which rise gradually from behind the town and divide the region to the north of the city into isolated areas, enclaves and inaccessible tracts which used to function in the past as ramparts guarding the area against external aggression. It is encircled in the north-west, south and southeast by river Tawi and is bordered in the west by the Ranbir canal. Being situated on the slope of a· hillock, many of its part~ are not easily accessible ~y vehicular conveyances. It is for
this reason that the city is developing fast on either side of the canal and in the south-east across river Tawi where plain and low level habitable areas are available. Like Srinagar, it is also, more or less, centrally located in so far as the Jammu province is concerned. It is about 153 miles from Haveli, the northwestern extreme end of Jammu province and about 118 miles from Banihal which lies in its ex treme north-east. The southern boundary of the State is about 60 . miles to the south of Jammu city. Despite its importance as a trade centre, it has had a more accentuated service character at the time of census which was taken in the winter of 1961 when all Secretariat and other moving departments of the State Government were stationed at Jammu. As will be seen from the map of the city, the main Government. offic"es are concentrated -either in the extreme< north at Mubarik Mandi or in the area intervening between Gandhi Bhawan and Ajaib Garh in Ward No. 11. Residential accommodation for Goveritment Officers has been provided . in the south-east at \ Gandhinagar and in the west at Bakhshinagar and Rehari.
SECTION 5
·TREND OF CHANGE IN URBAN POPULATION
ChaDge hi the Proportion of Urban PopulatiOD, 1901-61
3.75 The sub-joined statement indicates the
trend of change in the proportion of urban
population in relation to general population of
the State during the Jast six decades:-
State/District
STATEMENT m.9
Proportion of urban popUlation per I~OOO of geDeral population of the State and districts, 191H-61
Proportion Proportion Proportion Proportion Proportion Proportion in 1961 in 1951 in 1941 in 1931 in 1921 in 1911
2 3 4 5 6 7
JalDlDu and Kashm.ir 167 141 131 119 110 117
Anantnag 70 55 63 58 5~ 61
267
Proportion in 1901
8
74
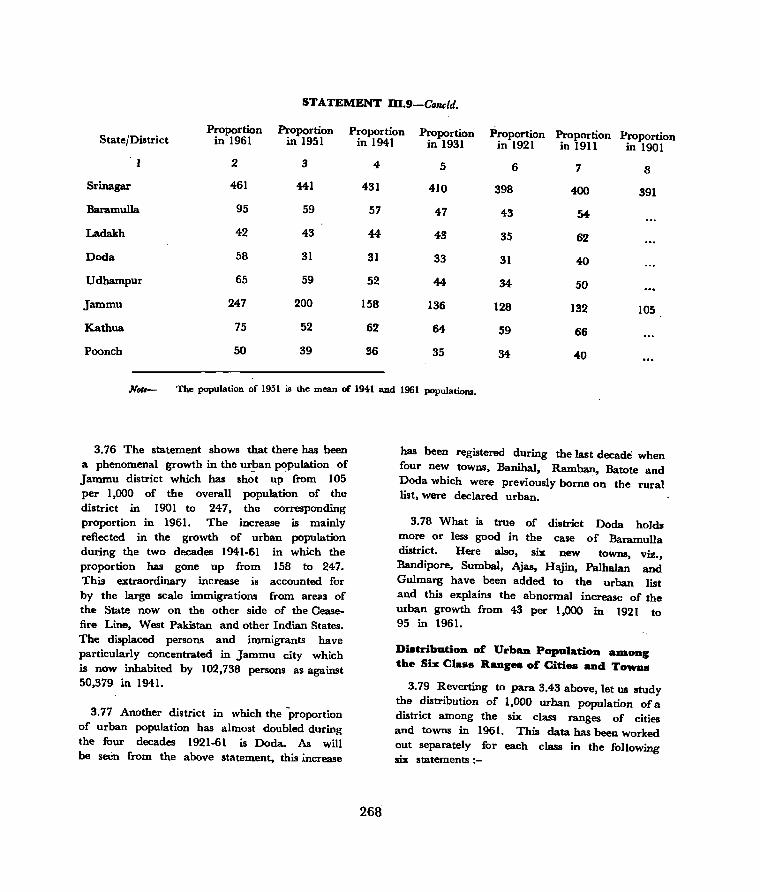
STATEMENT m.9-CQncld.
Proportion Proportion Proportion Proportion Proportion Proportion Proportion State/District in 1961 in 1951 in 1941 in 1931 in 1921 in 1911 in 1901 1 2 3 4- 5 6 7 8
Srinagar 461 441 431 410 398 400 391
Baramulla 95 59 57 47 43 54
Ladakh 42 43 44 "13 35 62
Doda 58 31 31 33 31 40
Udhampur 65 59 52 44 M 50
Jammu 247 200 158 136 128 132 105
Kathua 75 52 62 64 59 66
Poonch 50 39 36 35 34- 40
Nou- The population of 1951 is the mean of 1941 and 1961 populations.
3.76 The statement shows that there has been a phenomenal growth in the ur!>an population of Jammu district which has shot up from 105 per 1,000 of the overall population of the district in 1901 to 247, the corresponding proportion in 1961. The increase is mainly reflected in the growth of urban population during the two decades 1941-61 in which the proportion has gone up from 158 to 247. This extraordinary increase is accounted for by the large scale immigrations from areas of the State now on the other side of the Ceasefire Line, West Pakistan and other Indian States. The displaced persons and immigrants have particularly concentrated in Jammu city which is now inhabited by 102,738 persons as against 50,379 in 1941.
3.77 Another district in which the proportion of urban popUlation has almost doubled during the four decades 1921-61 is Doda. As will be seen from the above statement, this increase
268
has been registered during the last decade when four new towns, Banihal, Ramban, Batote and Doda which were previously borne ·on the rural list, were declared urban.
3.78 What is true of district Doda holds more or less good in the case of Baramulla district. Here also, six new towns, viz., Bandipore, Sumbal, Ajas, H~in, Palhalan and Gulmarg have been added to the urban list and this explains the abnormal increase of the urban growth from 43 per 1,000 in 1921 to 95 in 1961.
Distribution of Urban Population am.on" the Sis Class Ranges of Cities aad To_s
3.79 Reverting to para 3.43 above, let us study the distribution of 1,000 urban population of a district among the six class ranges of cities and towns in 1961. This data has been worked out separately for each class in the following six statements:-

STATEMENT m.lo
NUDlber per 1,000 of total ur'baa popuiatioD of each di.trict ill each eea .... year lo_d in CIa.s I towa., 1901-61 (District. which have DO Cia.. I tOWD. are om.itted)
State/District 1961 1951 1941 1931 1921 1911 1901
2 3 4- 5 6 7 8
JUllm .. aDd Kashmir 654 539 538 546 529 471 772
Srinagar 967 983 973 974- 939 910 1,000
Jammu 804-
STATEMENT m.ll
N .. mber per 1,000 of total urban popalatiOD 01 each district ill each CeD .... year lo_d in Class U towas, 1901-61 (Distncts which have 110 Clas. D towas are omitted) . StatefDistrict
1
Jamm .. and Kashmir
Jammu
1961
2
1951
3
168
810
1941
4
130
744
STATEMENT ID.12
1931
5
1921
6
1911
7
1901
8
NUDlber per 1,000 01 total urball populatiOD 01 each dfatrlct in each CeD .... year louad ill Class m towas, 1901-61 (Districts which have 110 Cla.. m towas are om.itted)
State/District 1961 1951 1941 1931 1921. 1911 1901
2 3 4- 5 6 7 8
Jamm.u aad Ka.hmir 36 122 118 118 22B
Anantnag 463
Jammu 760 730 730 1,000
STATEMENT DI.13
N .. mber per 1,000 of total .. rball populatiOD 01 each di.trict ill each CeIl .... year louad in Clas. IV towas, 1901-61 (Districts which ave 110 CIa •• IV towa. are omitted)
State/District 1961 1951 1941 1931 1921 1911 1901 • 2 3 4 5 6 7 8
Jamm .. aDd Ka.bmh 100 lOS 94: &B
Anantnag 514 360 375
Baramulla 677 974- 850 510
Udhampur 625
Poonch 623
269
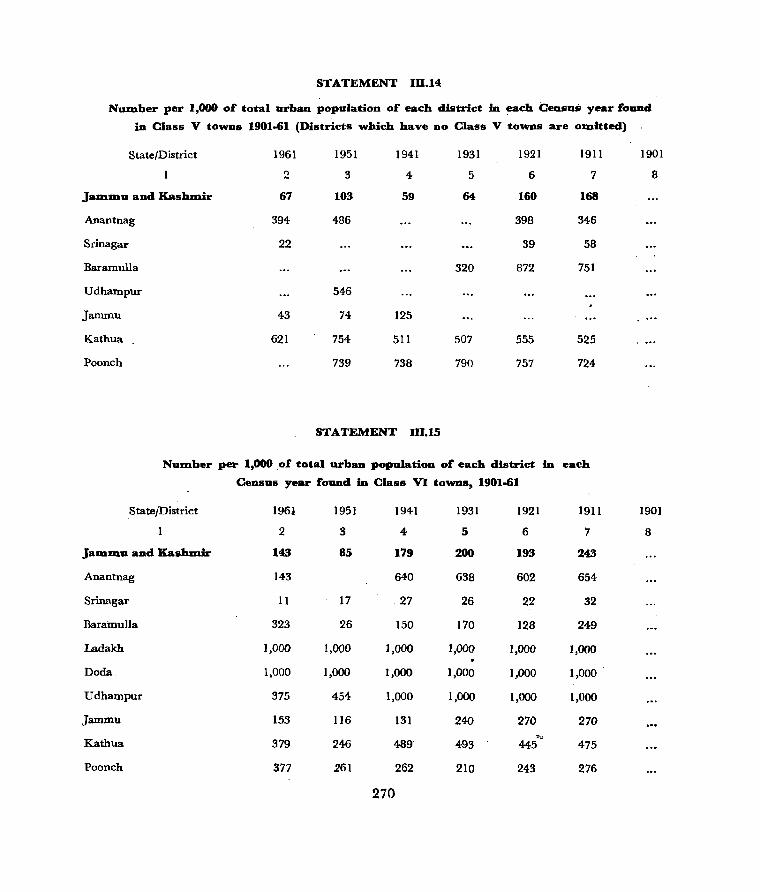
STATEMENT ID.14
Number per 1,000 of total urban population of each district in each Census year found
in Class V towns 1901.61 (Districts which have 110 Class V towns are omitted)
State/District 1961 1951 1941 1931 1921 1911 1901
2 3 4 5 6 7 8
Jammu and Kashulir 67 103 59 64 160 168
Anantnag 394 486 398 346
Srinagar 22 39 58
Baramulla 320 872 751
Udhampur 546
Jammu 43 74 125
Kathua 621 754 511 507 555 525
Poonch 739 738 790 757 724
STATEMENT 111.15
Number per 1,000 _o£ total urban population of each district in each
Census year found io Class VI towns, 1901-61
_statejDistrict 1961 1951 1941 1931 1921 1911 1901
2 3 4 5 6 7 8
JaIDma and KashlDir 143 85 179 200 193 243
Anantnag 143 640 638 602 654
Srinagar 11 17 - 27 26 22 32
Baramulla 323 26 150 170 128 249
Ladakh 1,000 1,000 1,000 1,000 1,000 1,000
Doda 1,000 1,000 1,000 1,000 1,000 1,000
Udhampur 375 454 1,000 1,000 1,000 1,000
Jammu 153 116 131 240 270 270
Kathua '" 379 246 489 493 445 475
Poonch 377 261 262 210 243 276
270

3.80 Here it may be stated that' Class I towns of the State include the cities of Srinagar and Jammu only. Both are situated on the National Highway connecting Pathankot with Ladakh and are at a distance of 183 miles from each other, being separated by Pir Panjal ranges. Srinagar is situated at an altitude of 1,588 ,metres and Jammu at 381 metres above the sea' level. Thus, climatically they are ideally suited as summer and winter capitals of the State Government. Srinagar experiences severe cold and heavy snowfall in winter, whereas Jammu is almost as warm in summer as any plain area in northern India.
3.81 Besides being the centres of administration, large majority of educational institutions of the State, particularly of higher grades, are concentrated in the two cities. Again, the inhabitants of the two cities are the principal consumers of surplus food produce and agriculrur~l products of their respective rural areas. They also function as store houses for distribution of consumer goods to the towns and important rural areas of the two provinces. In this respect, Jammu plays a still more important role as goods meant for Kashmir also are stocked here during most part of the winter when the National Highway is blocked due to heavy snow-fall and land slides. Srinagar is, however, a much bigger city and has been categorised as Class I town throughout the last six decades. It abounds in arts and crafts and provides employment to a large section of inhabitants of the city and to rural population of its suburbs. Another important and distinguishing feature of Srinagar is the net-work of its navigable rivers, lakes and streams which facilitate trade between the city and other important urban and rural areas of Kashmir Province.
3.82 There is no Class II town at present in the State. Jammu city, which was a Class III town till 1931, was upgraded to Class II in 1941 and continued as such till the Census of 1961 when it returned a population of 102,738, qualifying it for classification as Class I town.
3.83 Anantnag or Islamabad was a Class IV
271
town. ,from 1931 to 1951 and was upgraded in 1961 to Class III wlJ.en it was inhabited by 21,087 persons. This is the only town of this class in the State and is an important urban area, ranking next only after the two cities of Jammu and Srinagar. The town is centrally located in the district, being more than 25 miles away from its boundaries with the districts of Srinagar, Poonch and Dada. Besides being a district and tehsil head~uarter, the town is reputed for gubba manufacture and wood work. It also functions as a feeding centre for consumer goods to all the urban areas of district Anantnag and to the adjoining rural area.
- 3.84 The number of Class IV towns is limited .~,
to 4 only. Of these, two, viz., Baramulla and Sopore, are situated in district Baramulla and the other two, namely, Udhampur and Poonch are the headquarters of U dhampur and Poonch districts. Sopore and Baramulla were both Class V towns before 1931 when the former was declared a Class IV town. In 1941, Baramulla also was upgraded and placed in Class IV. Udhampur, on the other hand, was a Class VI town till 1951 when following the disturbances of 1947 it registered relatively larger increase in its population and was categorised as a Class V town. For the same reason, it has returned still larger population in 1961, qualifying it for inclusion in Class IV. Poonch has been a Class V town all along in the past and has, for the first time, been upgraded and placed in Class IV in 1961.
3.85 The he<lVY fall in the proportion of the urban population of Sopore and Baramulla in relation to the total . population of the district in 1961, as compared with 1951, is due to the urbanisation of six areas borne on the rural list till 1941. At any rate, both are important towns of north Kashmir and are the distributing centres for the rural and urban areas of the district. Like Srinagar, both are situated on either bank of river Jhelum and can, therefore, be reached by surface route as well as by river. Before 1947, when Jhelum Valley road connecting Srinagar with Rawalpindi was the principal trade route of the State,

Baramulla had because of its being the gate~ay of the val.ley, grown into an important trade centre. The tribal raids, however, shattered its economy and resulted in the migration of many of its people to the interior of the State. It has since rejuvenated and is making rapid progress in all spheres of life.
3.86 The town of Udhampur is the most important urban area in the region to the south of Pir Panjal ranges and in the north of Jammu city. Unlike most other towns of Jammu which are either situated on plateaus or have been built on the slopes of hills alongside rivers, Udhampur is situated in a small valley. Being the headq~ter of all the armed forces in the State, it has grown into an important commercial area, notwithstanding the fact that the city of Jammu is situated only at a distance of 42 miles from here. Being located on the National Highway, it is also a distributing centre for most of the urban and rural areas in its north.
3.87 The town of Poonch is situated very near the Cease--fire Line. I t has had a chequered career inasmuch as it was a jagir of Raja of Poonch and was merged with the State less than 35 years ago. Again, it has been one of the principal targets of tribal raids in 1947 which resulted in large scale migration and immigration from and into the town. Nevertheless, it is the most important urban area of the district and in spite of its location at the farthest end of the district, it is a distributing centre for most of the adjoining rural areas which are spread over mountainous and hilly areas.
3.88 There are in all six Class V towns in the State, three in district Anantnag and one each in Srinagar, Jammu and Kathua districts. The former consist of Bijbehara, Pampore and Shupiyan and the latter of Badamibagh Cantonment, Jammu Cantonment and Kathua town respectively.
3.89 Bijbehara, Pam pore and Shupiyan were declared urban for the first time in 1911 and continued as Class V[ towns till 1941. In 1951,
272
all the three towns were upgraded to Class V in which they have been retained in 1961 also.
3.90 Bijbehara is at a distance of 3 miles only from the headquarter of Anantriag district. Being situated on the National Highway and accessible by river Jhelum, the town is developing fast. I t is one of the few manufacturing towns in the State and is widely kpown for artistic wood work.
3.91 Like Bijbehara, Pampore is also situated on the National Highway and can be reached by river. It is famous for its Saffron fields which are not to be found in any other part of the State. All the Saffron consumed in the State is supplied by the town which also makes exports to other parts of India.
3.92 The town of Shupiyan is situated· in the south-west of the valley and is the gateway of the old Moghul route connecting Rajol,iri with Kashmir. It is an important centre ot fruit trade like apples, walnuts, cherries and the like which grow in plenty in the rurat areas of tehsil Kulgam. The fruit growers dispose of their crops to the wholesale merchants in the town who export the same to various destinations within and outside the State. .
3.93 Badamibagh Cantonment has been in existence for many decades but ·was declared an urban area of Class VI for the first time in 1931. The upgrading of this town in 1961 has been brought about by normal increase in populatiop and not due to any extraordinary circumstances. The town is contiguous with the city of Srinagar and is a constituent of Srlnagar town-group.
3.94 Like the Badamibagh Cantonment, Jammu Cantonment has also come intu existence as an urban area in 1931. It is situated in the outskirts of Jammu city.
3.95 Kathua town has been categorised as a Class V town ever since it was urbanised in 1911 and continues as such to this day. It is the headquarter of the district and is situated very near the international boundary with

Pakistan and inter-State boundary with, Punjab. Like other important towns of the State, it feeds the urban areas of the district as also the neighbouring rural areas in so far as conSumer goods are concerned. Of late, a number of industries have been ,set up in the town which provide employment to the people of the surrounding areas.
3.96 About 70% urban areas of the State consist of Class VI towns, though their aggregate population is only 14% of the total urban population. They number 30 and are dispersed among various districts in the following order:-'
(i) Anantnag 2 (ii) Srinagar 1
(iii) Baramulla 7 (iv) Ladakh (v) Doda 6
(vi) Udhampur 3
(vii) Jammu 5
(viii) Kathua 3 (ix) Poonch 2
3.97 District Anantnag includes two Class VI towns, viz., Kulgam and Pahalgam. The latter has been declared urban for the first time in 1961. Kulgam was a town in 1911 but was declassified in 1921 and continued to be borne on the rural list till the last Census. The fall in this class in the proportion per 1,000 of the total urban population of the district as compared with 1941 is explained by the upgrading of BiJbehara, Pampore and Shupiyan from Class VI to Class V in 1961.
3.98 Pahalgam is an important tourist resort and is inhabited by several thousand people during summer. At the time of census, however, which was held in the month of February, the town had been vacated, by the tourists and its popUlation shrank to 1,920 only. Kulgam is a tehsil headquarter and is also an important fruit exporting centre.
3.99 Natipora-Hyderpora is the only Class VI town in district Srinagar. It was borne on the rural list before 1961 when it was urbanised to accommodate people living in
273
congested areas of Srinagar city. The faU in the proportion per 1,000 of the total urban population, as reflected in 1961, is due partly to the up~rading of Badamibagh Cantonment which was borne in Class VI in 1941 and partly to the transfer of Charar Sharrief, a town of 1941, to the rural list.
3.100 Six new towns have been added to the list of Class VI towns of district Baramulla in 1961. These are-
(i) Gulmarg (ii) Sumbal :iii) Hajin ;iv) Ajas (v) Palhalan and
(vi) Bandipore As against this increase, only one of its 1941 Class VI towns, namely, Pattan, was declassified. There are now seven towns of Class VI in this district including Uri. This explains the phenomenal increase in 1961 in the proportion of its population per 1,000 of the total urban population of the district.
3.101 Like Pahalgam, Gulmarg is an important tourist centre and is usually over· crowded in summer but inhabited by very few people during winter when the census is taken. Sumbal, Hajin, Ajas and Palhalan are closely knitted towns and have been declared urban in late fifties to facilitate the execution of a pilot project for intensive development of the region which had been a deficit area all along in the past. The towns are girdled by river Jhelum and the Mansbal and Wular lakes which provide easy means of transport for commercial purposes. The area also abounds in limestone deposits, quarries, etc.
3.102 Bandipore is also a new town and is situated in the north-east of the valley, 35 miles away from Srinagar. Being situated at the foot of Rajdhani Pass (11,690 feet above sea level) through which a jeepable road has been built to Gurez and TileI, it is developing as an important commercial centre. The town is situated on the eastern bank of Wular lake which provides several avenues of employment to the inhabitants.
3.103 The old town of Uri was completely wiped out by tribal raids and a new one was later built in its close vicinity. The town has considerably shrunk in population but is never~ theless an important feeding centre of consumer goods for the adjoining rural areas, as Baramulla, the only other nearby town, is situated at a distance of about 30 miles from here.
3.104 Leh is the solitary town of district Ladakh and represents the entire urban population of the district. The town has lost its importance because of the closure of road to Central Asia and Tibet with which it conducted trade on a large scale in the past. It has recently been connected by a metalled road with Srinagar. Being economically the most backward area of the State, the Government are executing various developmental schemes to improve its economy.
3.105 All the six towns of district Doda, viz., Banibal, Ramban, Batote, Doda, Bhaderwah and Kishtwar, belong to Class VI. Of these, Banihal, Ramban, Batote and Doda were declared urban during the inter-census period, though Ramban and Doda were towns in 1911 also but had subsequently been deurb~ised. Three of the towns, viz., Ramban, Bhaderwah and Kishtwar are tehsil headquarters whereas Doda is both a district and tehsil headquarter. Banihal, Ramban and Batote are situated on the National Highway and are rapidly developing due to growing volume of business. Of the other three towns, Doda and Kishtwar are situated on plateaus of hills while Bhaderwah town is situated in a small fertile valley.
3.106 Three of the four towns of district Udhampur, viz., Reasi, Katra and Ramnagar, belong to Class VI. The heavy fall in the proportion of the population of these towns per 1,000 of the total urban population, as reflected in 1961, is due to the transfer of Udhampur from Class VI to Class. IV dul"ing the inter-census period.
274
3.107 Reasi and Ramnagar are the headquarters of the tehsils of Reasi and Ramnagar respectively whereas Katra is an important commercial centre because of the close vicinity of the shrine of Vaishno Devi which is visited by sev'eral lakhs of people every year.
3.108 Jammu district includes seven towns of which five, viz., Akhnoor, Ranbirsinghpora, Arnia, Samba and Bishna, belong to Class VI. Three of these, Akhnoor, Ranbirsinghpo~a and Samba are tehsil headquarters and function as distribu tors of consumer goods for their respec;:tive rural areas. Bishna and Arnia have recently been urbanised due to the concentration of displaced persons and immigrants from across the Cease-fire Line and West Pakistan etc.
3.109 Except for its headquarter tOWil, all other urban areas of district Kathua are Class VI towns. Of these, Lakhenpur has been urbanised after 1947 when the Railhead of the State was transferred to Pathankot. Hiranagar was borne on the urban list in. 1911 but was later declassified as rural and till 1961. Bashohli is an on· the bank of river Ravi.
continued as such old town situated
3.110 There are two Class VI towns in district Poonch, viz., Nowshehra and Rajouri. The former has come into existence after the tribal raids. Rajouri was, however, an urban area all along in the past. The two town~ have absorbed a fairly good number of displaced person~ from across the Cease-fire Line.
ConcentratJon oC Urban Population in laterlDediate Class R_ges
3.111 The following two statements, one relating to 1961 and the other to 1951, bring out the concentration of urban population in certain population ranges which are intermediate between the six class ranges of urban. areas.
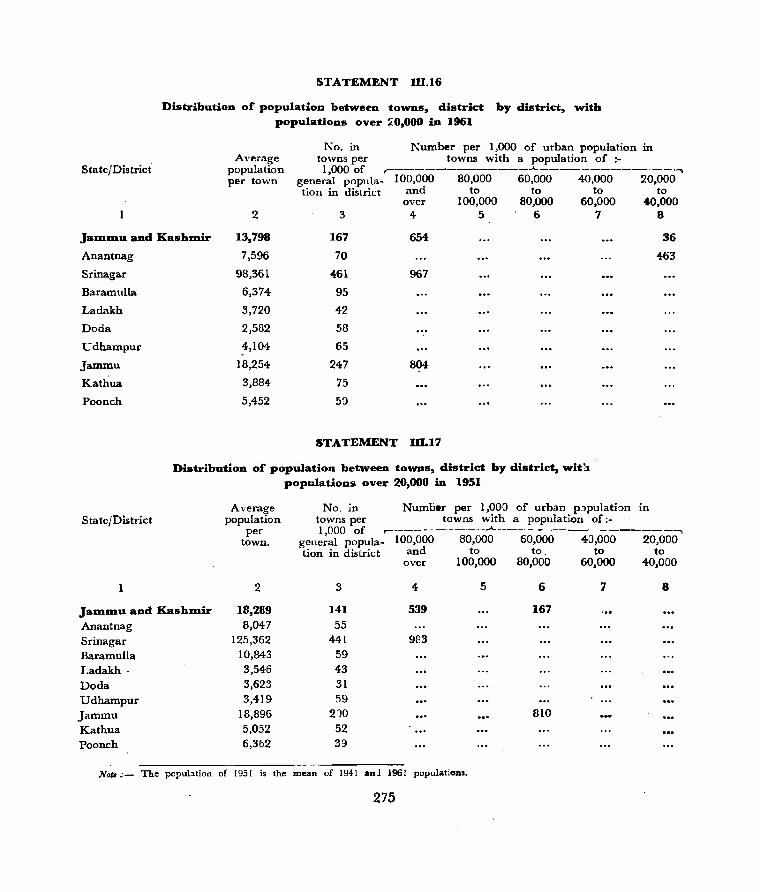
State/District
STATEMENT Ill.16
Distribution of population between towns, district by district, with populations over 20,000 in 1961
Average population per town
2
No. in Number per 1,000 of urban population in towns per towns with a population of ;-1,000 of ,--_____________ .A.. ______________ ......
general popula- 100,000 80,000 60,000 40,000 20,000 tion in district and to to to to
over 100,000 80,000 60,000 40,000 3 4 5 6 7 8
Ja:m:mu and KashJD.ir
Anantnag
13,798
7,596
167
70
654 36
463
Srinagar
Baramulla
Ladakh
Doda
Udhampur
Jammu
Kathua
Poonch
State/District
1
98,361
6,374
3,720
2,582
4,104
18,254
3,884-
5,452
461
95
42
58
65
247
75
50
967
804
STATEMENT 10.17
Distribution of population between towns, district by district, wit'3 populations over 20,000 in 1951
Average population
per town.
2
No. in Number per 1,000 of urban p:lpulation in towns per towns with a population of;-1,000 of ,.-_______ . __ ..A. _________________ -,
general popula- 100,000 80,000 60,000 40,000 20,000 tion in district and to to. to to
over 100,000 80,000 60,000 40,000
3 4 5 7 8
Ja:m:mu and Kash:mir 18,289 141 539
6
167
Anantnag 8,047 55
Srinagar 125,362 441 983
Baramulla 10,843 59 Ladakh 3,546 43
Dada 3,623 31
Udhampur 3,419 59
Jammu 18,896 210 810
Kathua 5,052 52
Poonch 6,362 39
Notl:- The popuhtion of 1951 is the mean of 1941 an] 1961 populations.
275
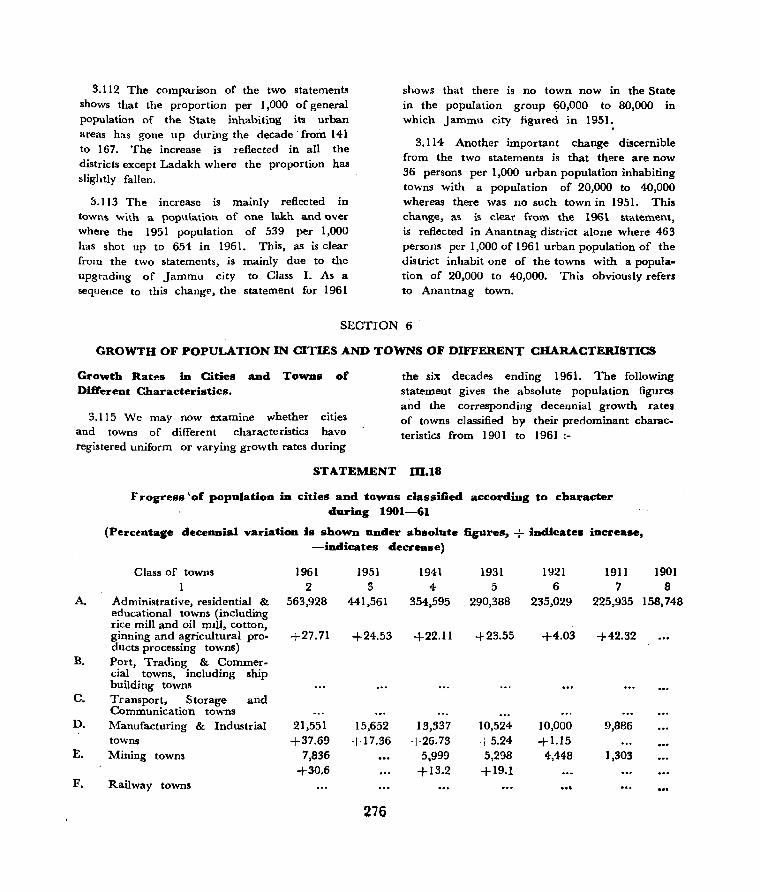
3.112 The compadson of the two statements shows that the proportion per 1,000 of general population of the State inhabiting its urban areas has gone up during the decade· from 141 to 167. The increase is reflected in all the districts except Ladakh where the proportion has slightly fallen.
::S.1I3 The increase is mainly reflected in towns with a population of one lakh a.nd Olver where the 1951 population of 539 per 1,000 has shot up to 654 in 1961. This, as is clear from the two statements, is mainly due to the upgrading of Jammu city to Class I. As a sequence to this changE', the statement for 1961
shows that there is no town now in the State in the population group 60,000 to 80,000 in which Jammu city figured in 1951.
3.114 Another important change discernible from the two statements is that there are now 36 persons per 1,000 urban population inhabiting towns with a population of 20,000 to 40,000 whereas there was no such town in 1951. This change, as is clear from the 1961 statement, is reflected in Anantnag district alone where 463 persons per 1,000 of 1961 urban popUlation of the district inhabit one of the towns with a population of 20,000 to 40,000. This obviousl~ refers to Anantnag town.
SECTION 6
GROWTH OF POPULATION IN CITIES AND TOWNS OF DIFFERENT CHARACTERISTICS
Growth Rates in Cities and Towns of DifI'erent Characteristics.
3.115 We may now examine whether cities and towns of different characteristics have registered uniform or varying growth rates during
STA.TEMENT
the six decades ending 1961. The following statement gives the absolute population figures and the corresponding decennial growth rates of towns classified by their predominant characteristics from 1901 to 1961:-
ID.18
}"rogress 'of popnlation in cities and tawns classified accordiug to chal'ac:ter during 1901-61
(Percentage decennial variation is shown under absolute figures, + indicate. increase, -indicates decrease)
Class of towns I
1961 2
1951 s
1941 4
1931 5
1921 6
1911 7
1901 8
A. Administrative, residential & 563,928 441,561 354,595 290,388 235,029 225,935 158,748 educational towns (including rice mill and oil mIll, cotton, ginning and agricultural pro- +27.71 +24.53 +22.11 +23.55 +4.03 +42.32 ducts processing towns)
B. Port, Trading & Commercial towns, including ship building towns
C. Transport, Storage and Communication towns
D. l\1anufacturing & Industrial towns
E. Mining towns
F. Railway towns
21,551 15,652 +37.69 +17.36
7,836 +30.6
276
13,337 10,524- 10,000 9,886 +26.73 +5.24- +1.15
5,999 5,298 4,448 1,303 +13.2 +19.1
...
3.116 The statement shows that administrative, re~idential and educational towns have registered a phenomenal growth rate during the decade 1901-11. This is explained by the fact that in 1901 there were only two towns in the State, viz., Srinagar and Jammu. During the following decade, a lal"ge number of rural areas were urbanised, raising the total number of towns in the State to 45. These included 25 of the 37 'towns classed as administrative, residential and educational in the Census of 1961, as indicated in Statement III.7 above. The growth rate of 42.32% is, therefore, artifi~ial and has a statistical value only. If, however, the population of the two cities for 1901 is compared with their population in 1911 which stood at 1,58,070, it will be seen that there has been a faU of 678 in their aggregate population. There have been two severe cholera epidemics in Kashmir during the decade 1901-11, resulting in considerable reduction of population. In Jammu, plague remained active throughout the decade and accounted for a heavy death toll, reducing its population from 36,130 to 31,726.
3.11 7 By 1921, seven of these towns were again transferred to the mral list reducing the number to 18 only. This and the fact that there were repeated outbreaks of cholera, influenza, small-pox and plague in the two cities, appear to account for the low growth rate of the decade.
3.11S In 1931 four new towns were added to the list of adm1histrative and residential towns. Of these, two were borne on the urban list in 1911 but were declared rural in the following decade. Two others were urbanised for the first time in 1931. With the increase of administrative and residential towns from 18 to 22, the decennial growth rate also shot up to 23.55%.
3.119 There were no manufacturing or industrial towns in the State in 1901. In 1911, four of the six manufacturing towns of 1961 were treated as urban. One of these, viz., Bandipore was again transferred to the rural list during the following decade. This reduced the growth rate for the decade to 1.15% only. In 1931
277
also, the number of manufacturing and industrial towns stood at three only and although there was no increase in the number of these towns during the decade 1931-41, the growth rate shot, up to 26.73%. The Census Reports of 1931 and 1941 show that the jurisdiction of one of these towns, namely, Shupiyan, was extended in 194-1 by merging with it the villages of Bonagam Shupiyan and Batapora Shupiyan, which were borne on the rural list in 1931. This had the effect of increasing the population of Shupiyan town by about 81% and consequently inflating the growth rate. During 1941-51, the rate of increase percent again shrank to 17.36 due to the after-effects of tribal raids. In the following decade, 3 more towns were added to the list of manufacturing towns resulting in a phenomenal growth rate in 1961.
3.120 Only two towns, viz., Bandipore and Palhalan, have been returned as mining towns in the Census of 1961. Of these, Bandipore alone W 1S an urban area in 1911. It was again transferred to the rural list in 1921 and continued to be borne on it till 1961. Palhalan was, however, a rural area all along in the past and was declared urban for the first time in 1961. The obsolute figures of population and growth rates of these towns as shown in the years 1921 to 1941 represent theil' rural population and rural growth rates respectively. As the rural popUlation of Palhalan for 1911 is not available from the Census Report, it would be futile to determine the growth rate of the two towns for the decade 1911-21.
Variation in the Population o£ Residential Towns
3.121 There are 13 towns in the State which have a residential charilcter. The following statement will show that of these Uri and Banihal alone have returned less poptilation in 1961 than 1911. It is not possible to compal'e the 1961 figures with those of 1901 as the Census Report for the latter year gives the popUlation of districts, tehsils and the two cities of Jammu and Srinagar only and not of other areas.
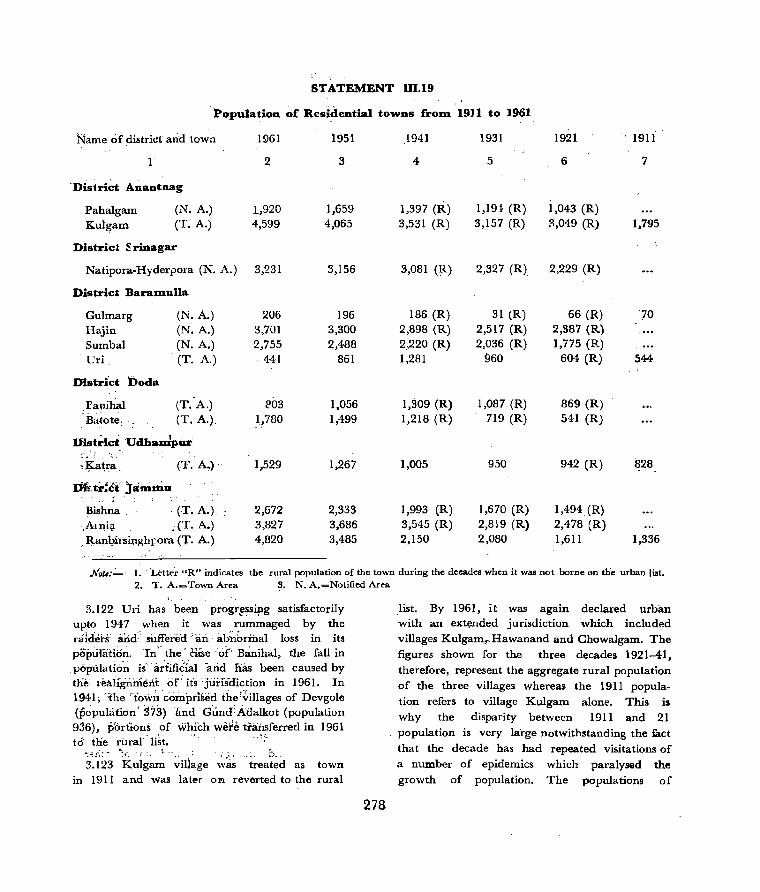
STATEMENT 10.19
Population ~f Residential towns froID 1911 to 1961
Name of p.istrict atid town 1961 1951 1941 1931 1921 1911
1 2 3 4 5 6 7
'District Anantnag
Paha1gam (N. A.) 1,920 1,659 1,397 (R) 1,194- (R) 1,043 (R)
Kulgam (T. A.) 4,599 4,065 3,531 (R) 3,157 (R) :.:1,049 (R) 1,795
District ~rinagar
Natipora-Hyderpora (N. A.) 3,231 3,156 3,081 (R) , 2,327 (R) 2,229 (R)
Districl BaraJUulla
Gulmarg (N. A.) 206 196 186 (R) 31 (R) 66 (R) }O Hajin (N. A.) 3,701 3,300 2,898 (R) 2,517 (R) 2,387 (R)
Sumbal (N. A.) 2,755 2,,488 2,220 (R) 2,036 (R) 1,775 (R)
L'ri (T. A.) 441 861 1,281 960 604 (R) 544
District Dods
l'a\lihal (T. A,) {l03 1,056 1,309 (R) 1,087 (R) 869 (R)
Batote, (T. A.), 1,780 1,499 1,218 (R) 719 (R) 541 (R)
District Udhauipur r· :
'"
':Ka~ra. (T. A.)" 1,529 1,267 1,005 950 942 (R) 828
Dft t~1~1" Jammu .. , ~
Bishna , ,(T. A.) 2,672 2,333. 1,993 (R) 1,670 (R) 1,494 (R)
.A.ln,i<,l .(T.A.) 3,827 3,686 3,545 (R) 2,819 (R) 2,478 (R) _ Ranlftrsinghr:ora cr. A) 4,820 3,485 2,150 2,080 1,611 1,336
Note::"" I. 'Letter "R" indicates the rural population of the town during the decades when it was not borne on th'e urban list. 2. T. A.=Town Area 3. N. A.=Notified Area
3.122 Uri has been progr~ss~g satisfactorily upto 1947 when it 'was rummaged by the niiciei-S arid:' sUffered 'an abnbrfual loss in its pi)p~:Um6n. Tn" the' eliSe 'of' Banihal, the fall in ,Pbpulati6~ is' 'ilI.'fifi~ial iuid has been caused by tne reaIig~merit of'ifs jurIsdiction in 1961. In 1941, -the 'to\vn'c'oinprlsed the!~illages of Devgole (p~puhition' 373) and G'uncf'Adalkot (population 936), portions .of wh~ch weJf~ tiat:~ferred in 1961 t6 tne 'rural' list.
... .;; '-' • - ~ {_' . r, : c .. '''::',' ... D .
3.123 Kulgam viliage was treated as town in 1911 and was later 01'1 reverted to the rural
278
list. By 1961, it was again declared urban with an extended jurisdiction which included villages Kulgam,..Hawanand and Chowa]gam. The figures shown for the three decades 1921-41, therefore, represent the aggregate rural population
of the three villages whereas the 1911 population refers to village Kulgam alone. This is why the disparity between 1911 and 21 population is very la'rge notwithstanding the fact
that the decade has had repeated visitations of a number of epidemics which paralysed the growth of population. The populations of
Hawanand and Chowaigan for 1911 are not available and these could not, therefore, be added to the population of Kulgam for that year.
3.124 Like Shupiyan, Kulgam is also reputed for fruit industry which received a severe blow during the decade 1921-31 on account of the outbreak of San Jose Scale Disease. This naturally shattered the economy of the town which resulted in the slow growth of its population during the decade.
3.125 Natipora-Hyderpora has been a. village all along before 1961. No explanation is, therefore, available for the stagnation of its population during the decade 1921-31. Before its urbanization in 1961, however, the jurisdiction of the town was realigned with the foUowing areas as its constituents:-
1. The whole of village Barzalla
2. Khasra Nos. 186-189, 192, 211-228, 326, 328, 1,110, 1,121, 1,158, 1,163, 1,172, and 1,184-1,186 of village Haiderpora.
3. Khasra Nos. 431-435, 451, 492-494, 496-497, 499-503, 829-831, 840-848 of village Bhagat Barzalla.
4. Khasra Nos. 1-41. 41-125, 128, 129,285, 289, 287, 288, 356, 376, 354, 378-394 of village Kursubadshahibagh.
3.126 It is because of this partial merger of the three villages referred to at item§ 2 to 4 . in the newly constituted town that notwithstanding the immigration of people previously inhabiting the congested areas of city, the growth rate for 1941 and 1961 has been very
slow.
279
3.127 No definite explanation is avaiIabe for· the fluctuation in population of Gulmarg notified area. This .is a famous tourist resort and is generally over-crowded in summer but aimost completely de-populated in winter due to heavy snow-falls and severe cold. Sometimes people visit the town even in the months of January and February for skating and this seems to account for the disparity in the figures.
3.128 Katra town is situated at the foot of Trikuta hills where Vaishno Devi is enshrined. The absence of any growth of population during the decade 1921-31 appears to be due to the heavy toll of lives which small-pox and other epidemics claimed during the decade. The Census Report for 1941 shows that a portion of the town was by mistake included in the rural areas with the result that the population of the town which should have stood at 1,250 .. was returned at 1,005 only. The actual growth rate during the 1931-41 has not, therefore, been Jow_ It is also evident that if correct population figures had been shown against the town in 1941, the 1951 popUlation which is the arithmetic mean ;;'f 1941 and 1961 populations should have stood at 1,390 and not 1,267, as indicatd in the preceding statement.
Variation in the Population of Non-industrial Towns
3.129 Let us now take up the non-industrial towns (residential, administrative, educational or of commercial character) and examine whether any of these stagnated or decayed in certain decades but improved later on. This can be studied from the following statement giving the decennial popula._tion of each such tow:1. from 1911 onwards. As already stated, the town-wise population figures of 1901 are not available:-
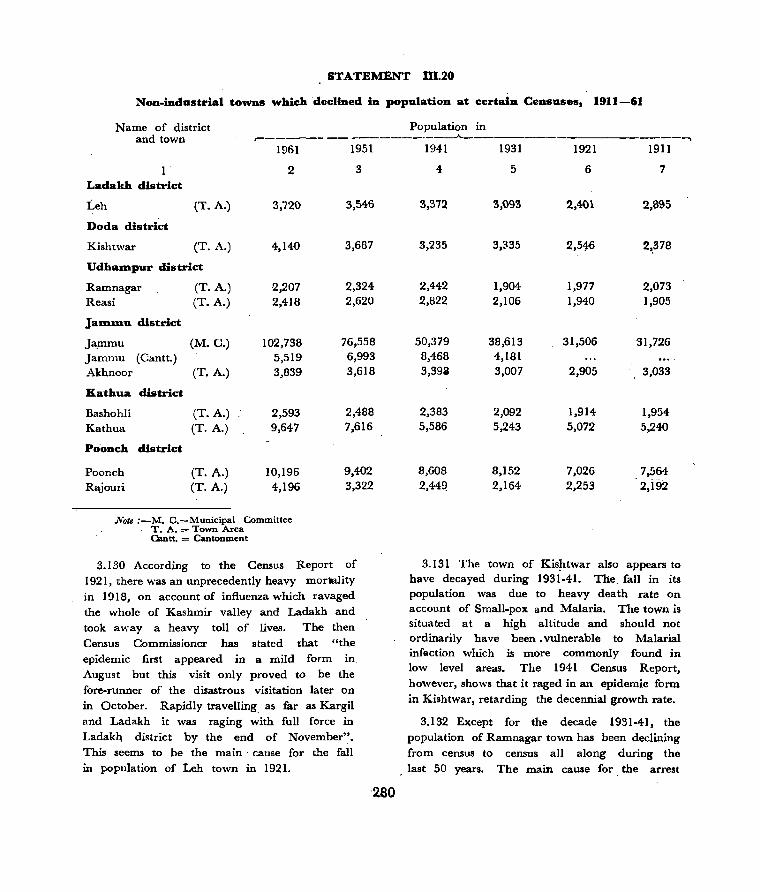
STATEMENT 111.20
Non-industrial towns which 'declined in population at certain Censuses, 1911-61
Name of district Population in and town ,------- --~------.---......... --------.--------------,
1961
2 Ladakh district
Leh (T. A.) 3,720
Doda district
Kishtwar (T. A.) 4,140
UdhalDpur district
Ramnagar (T. A.) 2,207 Reasi (T. A.) 2,418
JaIDlDu district
J~mu (M. C.) 102,738 Jammu (Cantt.) 5,519 Akhnoor (T. A.) 3,839
Kathua district
Bashohli (T. A.) 2,593 Kathua (T. A.) 9,647
Poonch district
Poonch (T. A.) 10,196 Rajouz-i (T. A.) 4,]96
Not. :-M. C.";Municipal Committee T. A. = Town Area Gantt. = Cantonment
1951
3
3,546
3,687
2,324 2,620
76,558 6,993 3,618
2,488 7,616
9,402 3,322
3. I 30 According to the Census Report of 1921, there was an unprecedently heavy moraality in ]918, on account of influenza which ravaged the whole of Kashmir valley and Ladakh and took away a heavy toll of lives. The then Census Commissioner has stated that "the epidemic first appeared in a mild form in, August but this visit only proved to be the fore-runner of the disastrous visitation later on in October. Rapidly travelling as far as Kargil and Ladakh it was raging with full force in Ladak4 district by the end of November". This seems to be the main· cause for the fall
in population of Leh town in 1921.
2.80
1941 1931 1921 1911
4 5 6 7
3,372 3,093 2,401 2,895
3,235 3,335 2,54:6 2;.378
2,442 1,904 1,977 2,073 2,822 2,106 1,940 1,905
50,379 38,613 31,506 31,726 8,468 4,181 3,39i 3,007 2,905 3,033
2,383 2,092 1,914 1,954 5,586 5,243 5,072 5,240
8,608 8,]52 7,026 ,,7,564 2,44Q 2,]64 2,253 2,i92
3.131 The town of Kis!:ttwar also appears to have decayed during 1931-41. The fall in its population was due to heavy death rate on account of Small-pox and Malaria. The town is situated at a high altitude and should not ordinarily have been. vUlnerable to Malarial infection which is more commonly found in low level areas. The 1941 Census Report, however, shows that it raged in an epidemie form in Kishtwar, retarding the decennial growth rate.
3.132 Except for the decade 1931-41, the population of Ramnagar town has been declining from census to census all along during the
last 50 years. The main cause for the arrest

of growth during 1911-31 is the high incidence of venerea I diseases in the whole of Ramnagar tehsil. Syphilis and Gonorrhoea have been very common during the first four decades and the Government have had to establish as many as three Venereal Dispensaries in .this tehsil alone in 1941. Again, there have been large scale migrations during 1941 - 61 consequent upon the splitting up of the State by the Cease-fire Line. This explains the decline of population from 2,442 in 1941 to 2,207 in 1961.
.3.133 According to the Census Report of 1921, influenza, plague and timaH-pox raged continuously during the decade 1911 - 21 in most parts of Jammu province. Of these, influenza is said to have been so wide spread that as stated by the then Census Commissioner, "no part of the province and no class of persons have been immune from the general havoc caused by this epidemic". The report adds that district Reasi was one of the worst affected areas though because of its higher altitude and better climate, it did not suffer any loss from plague. At any rate, this appears to be the cause for the population of Reasi town having remained almost static during the decade 1911 - 21.
3.134 As in the case of Ramnagar, there have been large scale migrations from Reasi during and after 1947. The short fall in the population thus caused was not, however, made up by immigrations and normal growth. This is why the population of the town in 1961 is about 400 less than that of 1941. The 1951 population is only an arithmetic mean of the populations of 1941 and 1961.
3.135 During the earlier decades, Jammu city was the hot bed of plague and experienced, in addition, several visitations of influenza and small-pox. It is estimated that the number of people who lost their lives as a result of these epidemics in 1911-21 was over 22,000. In Jammu city alone there were 10,500 deaths. against 6,038 births only. There is, therefore, nothing surprising to find that the population in 1921 has been over 200 less than that of 1911.
281
3.136 The city also witnessed large scale movement of popUlation during the two decades 1941-61. A substantial proportion of the population inhabiting the city migrated to Pakistan and to areas of the State on the other side of the Cease-fire Line. The short f"ll was. however, more than made up by the immigration of displaced persons from the State territory across the Cease-fire Line, West Pakistan and other States in India. As a result, [he population has more than doubled during the two decades.
3.137 The main reason for the large disparity between the population of the two decades of Jammu' Cantonment is that the 1941 population included the personnel of State forces then posted in the Cantonment. The combatants posted in 1961 in the Cantonment have, however, been included in the population of the States of their birth places.
3.138 Like Ramnagar, Reasi and Jammu city, Akhnoor town also suffered loss of population during 1911-21' on account of plague, influenza and small-pox. This arrested the growth tate and redu~ed the 1911 population by ahout 128. For the same reason, the populations of the towns of Bash~hli, Kathua and Poonch also declined during this decade. In addition, the towns alSo experienced unusual movement of popUlation in the two decades 1941-61. but the' size of emigration was limited when compared with immigrations. While, therefore, there has been no fall in their population during the two decades, the actual growth rate has been slow.
Variation in the Population of Industrial Towns.
3.139 There are in all six industrial towns in the State, viz., Shupiyan, Bijbehara. Pampore, Palhalan. Ajas, and Bandipore. Of these, Palhalan and Ajas were declared urban for the first time m 1961 whereas Bandipore was deurbanised after 1911 and continued as such till 1961 when it was again declared a town. The following statement will show that the growth of population in Bijbehara, Shupiyan and Pampore during some of the decades has either been very slow or it has aetually declined.

STATEMENT 111.21
Industrial towns whose population lluctuated betweel;'- 1911-61
Name of district and town 1961 1951 1941 1931 1921 1911
2 3 4 5 6 7 Anantnag District
Bijbehara 6,394 5,463 4,532 4,438 4,270 4,424 Shupiyan 6,005 5,182 4,359 2,217 2,236 ~,114
Pam pore 5,568 5,007 4,446 3,869 3,494 3,348
Baram.ulla District Bandipore 4,074 3,565 3,055(R) 2,529(R) 2,315(R) 1,303 Palhalan 3,762 3,353 2,944(R) 2,769(R) 2,133(R) N.A. Ajas 3,584 3,188 2,791(R) 2,4-72(R) 1,983(R) N.A.·
Not.:-l. N. A.-Not available 2. Letter (R) indicates the rural population of the town during the decades when it was not borne on the u[b~ list.
3.140 It is clear 1hat Bijbehara has decayed has been no such visitation in this decade, but during 1911·21 and Shupiyan and Pampore have they have been either of a mild character or stagnated during the same period. This has their duration has been comparatively . limited. been a decade of epidemics which took a toll Even as it is, cholera is said to have accounted of 43,569 lives III Kashmir province alone. for as many as 11,712 lives in a few weeks The statistics given in the Census Report of 1921 only. This may have been partly responsible show that the number of deaths exceeded those for the stagnation) of population of Shupiyan of births by 11,906. The fall of population or town during the decade 1921-31. A more its stagnation in towns and thickly populated cogent explanation is 'that the predominant areas is, therefore, easily understandable. characteristics of this town is that it is reputed for
3.141 The increase in the population of fine apples and. walnuts etc. The 'Census
1911-21 Commissioner of 1931 has remarked that "the Bandipore during is only superficial, as the two villages Nusu and Nowpora' were only disquieting feature of the decade has been merged with the town in late fifties and were the appearance of San Jose Scale Disease which treated as separate units in 1911. The villlage- inflicted very heavy damage on the fruit industry
of Kashmir". wise population of 1911 is not available and it has not, the1"efore, been possible to include the 1911 population or" these two villages with that of Bandipore. As this has been a decade of epidemics, it is certain that if the 1921 population of the town were compared with the aggregated population of Bandipore, Nusu and Nowpora for 1911, the former would have been either less or had been equal to the latter. For the same reason, it is not possible to determine the fluctuation in the population of Palhalan and Ajas during the same decade.
3.142 Compared to other. decades, the period of 1921·31 is not conspicuous for the repeated incidence of various epidemics. Not that there
282
3.143 The phenomenal increase in the population of Shupiyan town during 1931-41 is due to the merger of villages Bonagam, Shupiyan and Batapora Shupiyan with Heragam Shupiyan which alone was treated as a town in 1931. In the case of Bijbehara, however, the stagnation in the population during this decade._appears to be due to the high mortality caused by small· pox and cholera which claimed death toll of 13,135 and 5,582 persons respectively in Kashmir alone. The Census Report for 1941 does not, however, specifically bring out the causes responsible for the nominal growth of population of the town.
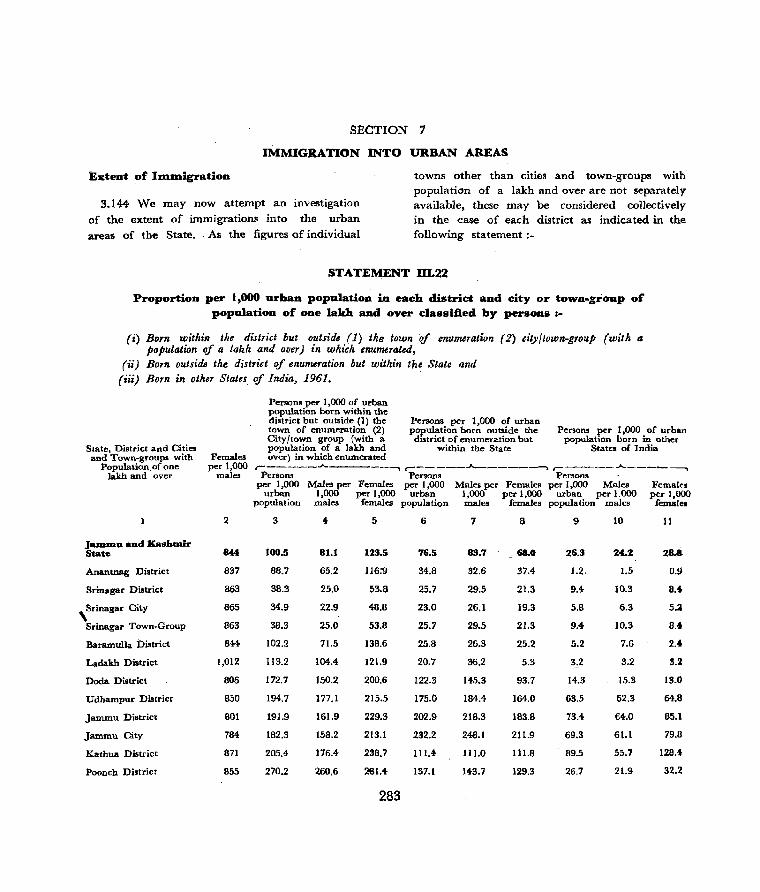
SECTION 7
IMMIGRATION INTO URBAN AREAS
Extent of JDlDligration
3.144 We may now attempt an investigation
of the extent of immigrations into the urban
areas of the State. As the figures of individual
towns other than cltles and town-groups with population of a lakh and over are not separately available, these may be considered collectively in the case of each district as indicated in the following statement:-
STATEMENT m.22
Proportion per 1,000 urban population in eaeh district and city or town-group of population of one lakh and over classified by persons :-
(i) Born within the district but outside (1) the town if' enumeration (2) city/town-group (with II
population of a takk and over) in which enumerated, (ii) Born outside the district rif enumeration but within the State and
(iii) Born in other States rif India, 1961.
Persons per 1,000 of urban population born within the district but outside (1) the Persons per 1,000 of urban town of enumeration (2) P'?Pulation bom outside the Persons per 1,000 of urban City/town group (with a d,strict of enumeration but population horn in other
State, District and Cities population of a lakh and within the State States of India and Town-groups with Females over) in which enumerated
Population of one per 1,000 r------.Jo----------... ,-------_,,__ ____ ~ r------.J....--------.. ]akh and over males Persons Persons Person..",
per 1,000 Males per Females per 1,000 Males per Females per 1,000 Males Femal<s urban 1,000 per 1,000 urban 1,000 per 1.000 urban per 1.000 per 1,000
population males females population males females popUlation male. females
2 3 4 5 6 7 8 9 10 11
JIUDIIUI and Kashalir 8U 100.5 81.1 123.5 State 76.5 83.7 68.0 26.3 24.2 28.8.
Anantnag District 837 88.7 65.2 116:9 34.8 32.6 37.4- 1.2. 1.5 0.9
Srinagar District 863 38.3 25.0 53.8 25.7 29.5 21.3 9.4- 10.3 8.4-
Srinagar City 865 34.9 22.9 48.8 23.0 26.1 19.3 5.8 6.3 5.:1 , .
Srinagar Town-Group 863 38.3 25.0 53.8 25.7 29.5 21.3 9.4- 10.3 8.4
Baramul1a District 844 102.2 71.5 138.6 25.8 26.3 25.2 5.2 7.6 2.4
Ladakh District 1,012 113.2 104.4 121.9 20.7 36.2 5.3 3.2 3.2 5.2
Doda District 806 172.7 150.2 200.6 122.3 145.3 93.7 14.3 15.3 13.0
Udhampur District 850 194.7 177.1 215.5 175.0 184.4 164-.0 63.5 62.3 M.B
Jammu District 801 191.9 161.9 229.3 202.9 218.3 183.8 73.4 £4.0 85.1
Jammu City 784 182.3 158.2 213.1 232.2 248.1 211.9 69.3 61.1 79.B
Kathua District 871 205.4 176.4 238.7 111.4 1l1.0 111.8 89.5 55.7 12B.4
Poonch District 855 270.2 260.6 281.4 137.1 143.1 129.3 26.7 21.9 32.2
283
3.145 The sex ratio in the urban sector of the State has been very low all along in the past, as indicated by the sub-joined statement which gives these ratios as returned at each
Adjusted Population
Census Population
1901
809
809
1911
799
801
3.]46 This shows that there has been a progressive improvement in the number of females per 1,000 males as a result of the remedial measures taken by the State Government. The various factors which contribute to the disparity in the population of the two sexes have already been discussed in detail in the previous chapter. The main cause is the large scale migration of male population from rural to -urban areas where greater avenues of employ" ment are available and, to some extent, the persistence in spite of the statutory provisions to the contrary, of early marriages which result in high female mortality rates. The only exception among the districts is the town of Leh in Ladakh where the female popUlation exceeds that of males. The overall sex ratio of the district being only 971, it is obvious that polyandry, if still practised, exists on a small scale only and this could not be the cause of female population being larger than that of males in a small town like Leh. The town has a population of 3,720, consisting of 1,849 males and 1,871 females. The small excess of females may be due to women employed in various Government institutions like, hospitals, dispensaries, middle and basic schools and nuns inhabiting Leh Monastery.
3.147 The foregoing statement shows that migrants enumerated in the· urban areas of the State have been classified into three broad categories, viz.. (a) those born within the district but outside the townfcityftown-group of enumeration, (b) born in other districts of the State and (c) born in other States in India. Among these, the highest proportion in the State as a whole is' claimed by the migrants of the first
284
census and as worked out on the population of the State according to jurisdiction :"
1921
803
801
1931
784
781
1941
790
791
1951
823
822
adjusted its 1961
1961
844
844
category. Even so far as the districts are concerned, except for Jammu district the urban population inCludes the highest propor,tion of migrants born within the district in which the' town of enumeration is situated.
3.148 Another conspicuous feature' of the statement is that movement from other parts of the district to the town of enumera~ion has been on limited scale in the three districts of Kashmir valley and Laciakh when compa:red with the dirtricts of Jammu province. As has been stated in the previous chapter, Anantnag and Srinagar are among the few districts of the State which were least effected by the tribal raids of 1947 and which did not in consequence witness any sizable movement of popUlation. The same cannot, however, be said of Baramulla where conditions remained more or less abnormal. foc quite sometime after the tribal raids.
3.149 Broadly speaking, following are the principal causes' of the large scale inmigration to the urban areas:-
(1) An urge to settle in areas where life and property were deemed to be secure.
(2) Prospect of 'availability of larger avenues. of employment.
(3) Matrimonial alliances.
(4) Availability of facilities for education.
3.L50 With a view to .examining the posi~()n further, we may now attempt to ascertain the extent of migration made from the rural and urban areas under each of the three categories mentioned above. The sub-joined statement gives this data:-
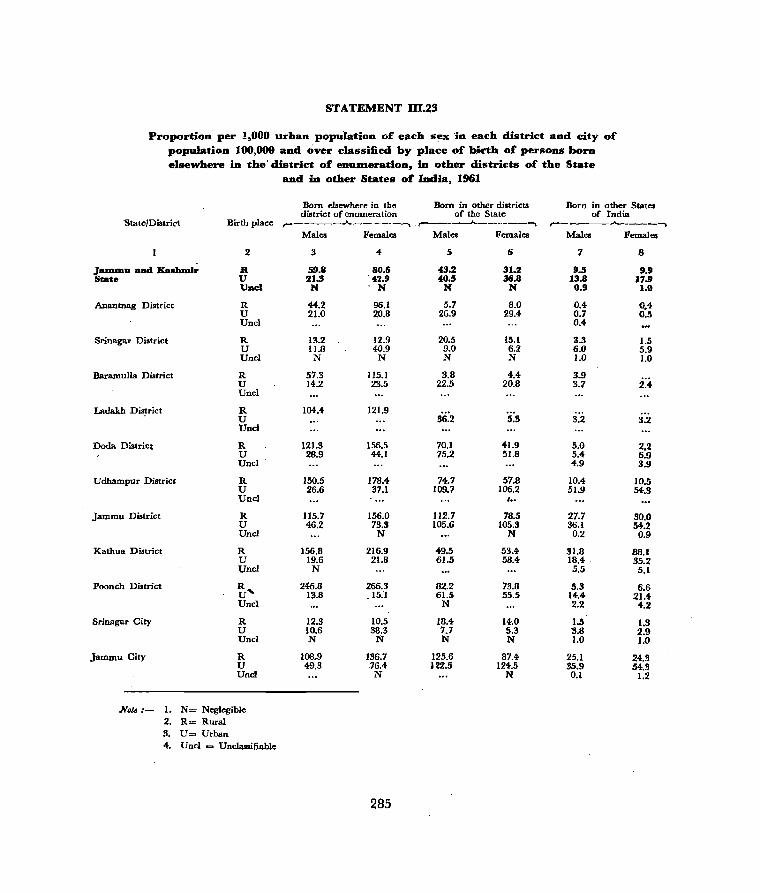
STATEMENT m.23
Proportion per 1,000 urban population of each sex -in each district and city of population 100,009 and over classified by place of birth of persons born elsewhere in the' district of enuD1eration, in other districts of the State
and in other States of India, 1961
Born elsewhere in the Born in other districts Born in other States district of enumeration of the State of India
State/District Birthplace ,,------"--------"'\ . r------J...-------"'\ r------A ----"'""'"
Males Females Males Females Males Females
2 3 4 5 6 7 8
JIIDlDlU ami Kaslunir R 59.8 80.6 43.2 31.2 9.5 9.9 State U 21.3 - 42.9 40.5 36.8 13.8 17.9
UDcl N N N N 0.9 1.0
ADantnag District R 44.2 96.1 5.7 8.0 0.4 0.4 U 21.0 20.8 26.9 29.4 0.7 0.5 Unci 0.4
Srinagar District R 13.2 12.9 20.5 15.1 3.3 1.5 U 11.8 40.9 9.0 6.2 6.0 5.9 Unci N N N N 1.0 1.0
llaramulla District R 57.3 115.1 3.8 4.4 3.9 U 14.2 23.5 22.5 20.8 3.7 2.4 Unci
Ladakh District R 104.4 121.9 U S6.2 5.3 3.2 3.2 Unci
Doda District R 121.3 156.5 70.1 41.9 5.0 2.2 U 28.9 44.1 75.2 51.8 5.4 6.9 Unci 4.9 3.9
Udhampur District R 150.5 178.4 74.7 57.8 10.4 10.5 U 26.6 37.1 109.7 106.2 51.9 54.3 Unci I ..
Jammu District R 115.7 156.0 112.7 78.5 27.7 30.0 U 46.2 73.3 105.6 105.3 36.1 540.2 Unci N N 0.2 0.9
Kathua District R 156.8 216.9 49.5 53.4- 111.8 88.1 U 19.6 21.8 61.5 58.4 18.4 35.2 Unci N 5.5 5.1
Poonch District R 246.8 266.3 82.2 73.8 5.3 6.6 U .... 13.8 .15.'1 61.5 55.5 14.4 2l.4 Uncl N 2.2 4.2
Srinagar City R 12.3 10.5 18.4 14.0 1.5 1.3 U 10.6 38.3 7.7 5.3 3.8 2.9 Unci N N N N 1.0 1.0
Jammu City R 108.9 136.7 125.6 87.4- 25.1 24.3 U 49.3 76.4 H2.S 124.5 35.9 .'14.3 Unci N N 0.1 1.2
JVol8 :- 1. N= Neglegible 2. R= Rural 3. U= Urban 4. Unci = Unclassifiable
285

3.151 It is cleaT from cols.· 3 and 4 of the above statement that the rural sector has made much larger contribution of migrants to the town of enumeration than other urban areas of the district, the only exception being the district of Srinagar where the proportion of female migrants from other urban areas exceeds the proportion of migrants from the rural sector. The data given against Srinagar city further shows that the larger influx of female migrants from other urban areas than the proportion of the rural migrants of the same sex is reflected in the city.
3.152 As may well be presumed, the larger influx of rural popUlation of the two sexes into the towns is primarily due to the availability of greater avenues of employment in urban areas. Having regard to the difficult topography of most of the areas of the State which are cradled in inaccessible mountainous regions and the absence of alternative employment in winter when the census is taken, a section of the rural inhabitants moves down to the towns where they are in great demand for eItlployment all domestic servants.
3.153 Another important feature of the statement is that the proportions of female migrants from the rural sector ha ve been much larger than the corresponding proportion of males in all districts except Srinagar where the two proportions are more or less equal. Again, Anantnag, Kathua and Poonch are the only districts in the State in which there is no significant disparity between the proportions of male and female migrants hailing from other urban parts of the three districts.
3.154 The fact that the proportion of female migrants from the rural areas is larger than that of males in all the districts except Srinagar indicates tltat more brides are imported from the rural into urban areas as a -result of matrimonial alliances. The disparity between the rural and urban female migrants in Srinagar district should not, however, be construed to imply larger recruitment of brides from the other urban areas of the district. While the
28Q
incidence of such marriages is not nded out, it has to be conceded that most of· the female migrants from other urban areas of the district were present in the town of enumeration for other reasons, snch as, employment in Government and private offices and undertakings. This is particularly true of Srinagar city which is contiguous with the other urban' areas. Df the district and provides several avenues of employment to the members of female sex.
3.155 The main reason for the large dispa'rity in the proportions of migranis referred to in cols. 3 and 4 against the valley districts, when compared with those of Jammu province, is that all educational· institutions in Kashmir remain closed during winter. Boys and girls who usually attend schools and colleges during silmmer return to their birth places during winter vacations and this has the inevitable effect of ~ducing
the proportion of migrants from the rural into the urban areas. In Jammu province, however, the educational institutions function throughout the winter and the student community of whom a large number consists of members of either sex hailing from different rural parts of the district are present at the time of census and are enumerated along with permanent population of the towns.
3.156 Some interesting concl usions are also deducible from the data given in cols. 5 and 6 of the statement. In this case, Srinagar. Jammu and Poonch are the only districts in which the proportions of male migrants from , .
other urban parts of the State outside the district of enumeration are lesser than the proportions of males recruited from the rural sector. In so far as female migrants are concerned, the proportions of those recruited from the rural areas are lesser than the corresponding proportions of urban migrants in all the districts except Srinagar and Poonch.
3.157 Another conspicuous feature of the statement is that the recruitments made by the three valley districts, Ladakh and Doda from other States of India are of very limited size wh6ln compared with the other four districts of
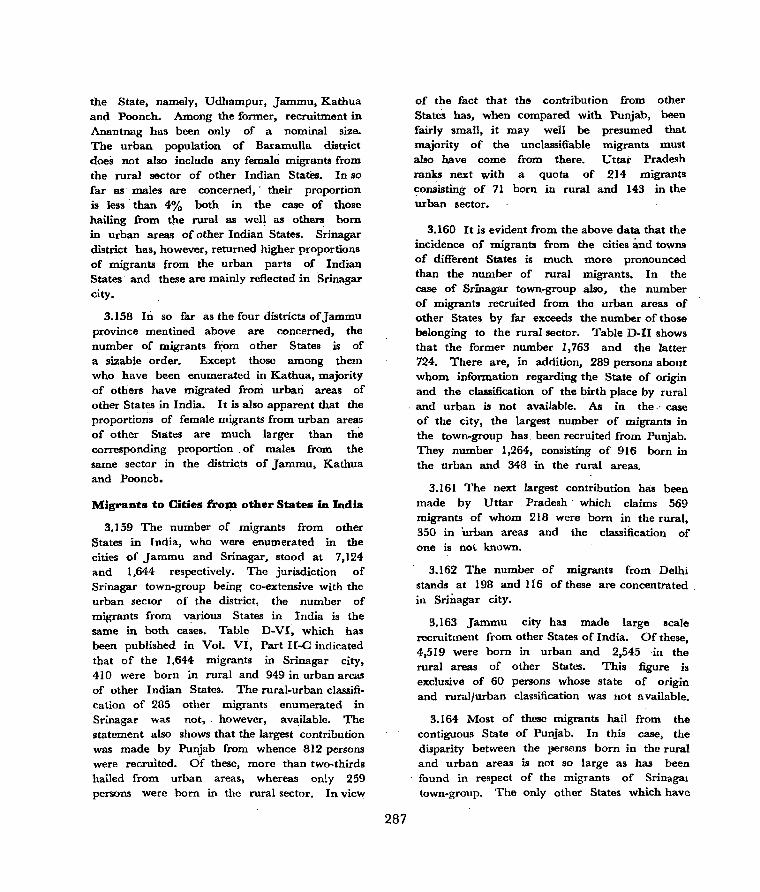
the State, namely, Udhampur, Jammu, Kathua and Poonch. Among the former, recruitment in Anantnag has been only . of a nominal size. The urban population of Bat:amulla district does not also include any female migrants from the rural sector of other Indian States. In so far as' males are concerned,' their proportion is less' than 4% both in the case of those hailing from the rural as well as others born in urban areas of other Indian States. Sri nagar district has, however, returned higher. proportions of migrants from the urban parts of Indian States' and these are mainly reflected in Srinagar city.
3.158 In so far as the four districts of Jammu province mentined above are concerned, the number of migrants from other States is of a siZable order. Except those among them who have been enumerated in Kathua, majority of others have migrated from urban areas of other States in India. It is also apparent that the proportions of female migrants from urban areas of other States are much larger than the corresponding proportion of males from the same sector in the distric.ts of Jammu, Kathua and Pooneb.
Migrants to Cities :froJ:ll other States in India
3.159 The number of migrants from other States in India, who were enumerated in the cities of Jammu and Srinagar, stood at 7,124 and 1,644 respectively. The jurisdiction of Srinagar town-group being co-extensive with the urban sector of the district, the number of migrants from various States in India is the same in both cases. Table D-VI~ which has been published in Vol. VI, Part II-C indicated that of the 1,644 migrants in Srinagar city, 410 were born in rural and 949 in urban areas of other Indian States. The rural-urban classification of 285 other migrants enumerated in Srinagar was not, however, available. The statement also shows that the largest contribution was made by Punjab from whence 812 persons were recruited. Of these, more than two-thirds hailed from urban areas, whereas only 259 persons were born in the rural sector. In view
287
of the fact that the contribution from other States has, when compared with Punjab, been fairly smal1, it may well be presumed that majority of the unclassifiable migrants must also have come from there. Uttar Pradesh ranks next with a quota of 214 migrants ~onsisting of 71 born in rural and 143 in the urban sector.
3.160 It is evident from the above data that the incidence of migrants from the cities imd towns of different States is much more pronounced than the number of rural migrants. In the case of Srinagar town-group also, the number of migrants recruited from the urban areas of other States by far exceeds the number of those belonging to the rural sector. Table D-n shows that the former number 1,763 and the latter 724. There are, in addition, 289 persons about whom information regarding the State of origin and the classification of the birth place by rural and urban is not available. As in the·' case of the city, the largest number of migrants in the town-group has been recruited from Punjab. They number 1,264, consisting of 916 born in the urban and 348 in the rural areas.
3.161 The next largest contribution has been made by Uttar Pradesh' which claims 569 migrants of whom 218 were born in the rural, 350 in urban areas and the classification of one is no~ known.
3.162 The number of migrants from Delhi stands at 198 and 116 of these are concentrated in Srinagar city.
3.163 Jammu city has made large scale recruitment from other States of India. Of these, 4,519 were born in urban and 2,545 in the rural areas of other States. This figure is exclusive of 60 persons whose state of origin and rural/urban classification was not available.
3.164 Most of these migrants hail from the contiguous State of Punjab. In this case, the disparity between the l*rsens born in the rural and urban areas is not so large as has been found in respect of the migrants of Srinagal town-group. The only other States which have
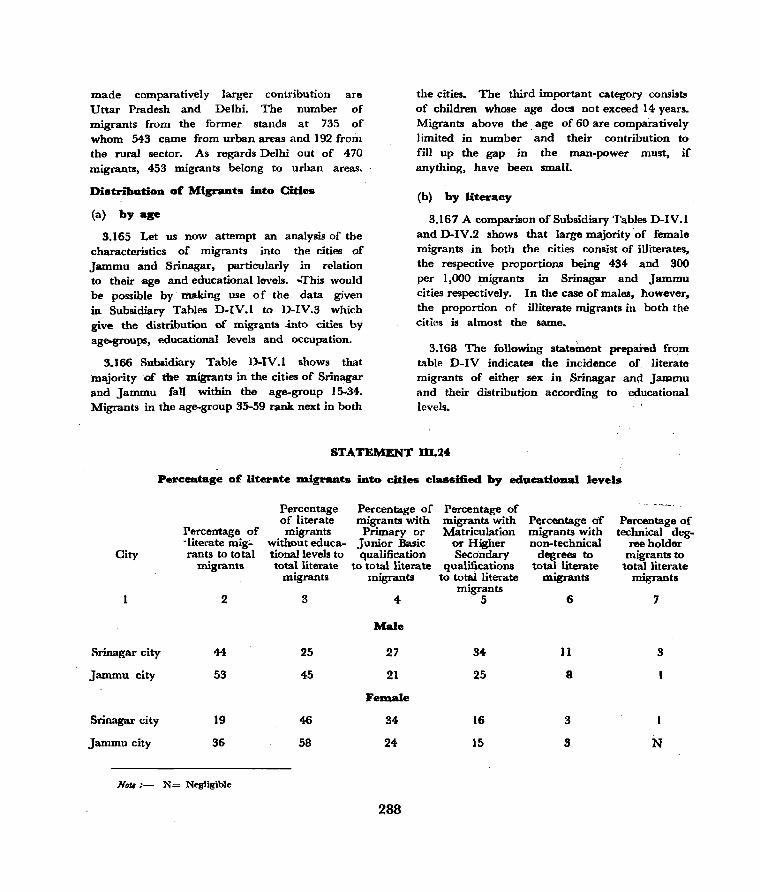
made comparatively Uttar Pradesh and
larger contribution Delhi. The number
are of
migrants from the former stands at 735 of whom 543 came from urban areas and 192 from the rural sector. As regards Delhi out of 470 migrants, 453 migrants belong to urban areas.
Distribution of Migrauts into Cities
(a) by age
3.165 Let us now attempt an analysis of the characteristics of migrants into the cities of Jammu and Srinagar, particularly in relation to 'their age and educational levels. ...This would be possible by making use of the data given in Subsidiary Tables D-IV.l to D-IV.3 which give the distribution of migrants -into cities by ag~roups, educational levels and occupation.
3.166 Subsidiary Table D-IV.l shows that majority 'Df the migrants in the cities of Srinagar and Jammu fall within the age_group 15-34. Migrants in the age-group 35-59 rank next in both
the cities. The third important category consists of children whose age does not exceed 14 years. Migrants above the age of 60 are comparatively limited in number and their contribution to fill up the gap in the man-power must, if anything, have been small.
(b) by literacy
3.167 A comparison of Subsidiary Tables D-IV.I and D-IV.2 shows that large majority of female migrants in both the cities consist of illiterates, the respective proportions being 434 and 300 per 1,000 migrants in Srinagar and Jammu cities respectively. In the case of males, however, the proportion of illiterate migrants in both the cities is almost the same.
3.168 The following statement prepared from table D-IV indicates the incidence of. literate migrants of either sex in Srinagar and Jammu and their distribution according to educational levels.
STATEMENT BL24
Percentage of Uterate Dligrants iuto cities classified by educational levels
Percentage Percentage of Percentage of of literate migrants with migrants with Percentage of Percentage of
Percentage of migrants Primary or Matriculation migrants with technical deg--literate mig;. without educa- Junior Basic or Higher non-technical ree holder
City rants to total tionallevels to qualification Secondary degrees to migrants to migrants total literate to total literate qualifications total literate total literate
migrants migrants to total literate migrants migrants migrants
2 3 4 5 6 7
Male
Srinagar city 44 25 27 34 11 3
Jammu city 53 45 21 25 8
FeJDale
Srinagar city 19 46 34 16 3
Jammu city 36 58 24 15 3 N
Nou:- N = Negligible
288

3.169 Ie is apparent from the above statement that Jammu has been attracting more literate male migrants than Srinagar. In both cases, however, the proportion of literate female migrants is much smaller than that of the males. One reason for these disparities is the higher literacy percentage in the two cities than in the surrounding rural areas and in other urban parts Of the State wherefrom majority of the migrants have been recruited. Further, the level of female education in the State is still low and this is why the large m~ority of female migrants in the cities consist of illiterates only. Again, as the overall literacy percentage in the -districts of Jammu province is higher than that obtaining in the valley districts, the proportions of literate migrant population of either sex in Srinagar are smaller than those of Jammu.
3.170 About half of the literate male migrant pop~iation c;>f Srinagar consists of persons who have pa'lSed Matriculation and higher examinations or are holders of technical and non-technical degrees. In the case of Jammu, however, the correspo~ding proportion is about on&othird of the total literate migrant population.
3.171 In so far as females are concerned, 80010 of the literate migrants in Srinagar consist of those who do not possess qualifications higher than Primary or Junior Basic examination. The corresponding proportion in Jammu city is slightly larger. The incidence of literate females who have passed Matriculation or HigherSecondary examination or non-technical and technical degree is almost uniform in both the cities.
(c) by OCcapatiOll
3.172 Let us now draw further conclusions about the characteristics of migrants who are
289
also workers with the help of the data given in Subsidiary Table D-IV.3. A reference to this table will show that of every 1,000 male migrants in Srinagar, 16 are engaged as cultivators, 4 are employed as agricultural labouren and the remaining 980 pursue different occupations~ In striking contrast with the small proportion of male migrants who have taken to cultivation, the corresponding proportion of females is fairly high and stands at 113 per 1,000 female migrants. This has naturally reduced the proportion of females engaged in other occupations which, stands at 887 per 1,000. A cogent reason for the high incidence of female migrants engaged in cultivation is that Srinagar city abounds in vegetable fields which grow crops for sale in the market. Majority of the workers in this activity consist of women who look after weeding, transplantation and harvesting. It is possible that vegetable growers may be importing more brides from the rural areas where skilled labour is available. The position obtaining in Jammu is, however, different. All the vegetables consumed by local inhabitants are imported from rural areas or from other parts of the State. There is, therefore, little scope for the absorption of women in this activity.
3.173 The data concerning Jammu city showl that the proportion of male cultivators and agricultural labouren is much lesser than that of Srinagar. and that without a single exception all the female migrants have taken to various occupations other than cultivation and agricultural labour.
3.174 The sub-joined statement prepared from D-IV.3 indicates the important categories of workers engaged in other occupations and their proportion per 1,000 migrant workers of either sex:-
STATEl\b:NT 111.25
Distribution of 1,000 workers aDlong Dligrants to cities by se:.: and im.portant occupations
Occupation
. Nurses, Midwives, Health visitors, Vaccinators and other related workers
Teachers
. Clerical workers, Miscellaneous
Unskilled office workers
Working Proprietors, wholesale and retail trade
Drivers, Road transport
Spinners, weavers, knitters" Dyers and related workers
Labourers n. e. c.
House-keepers, cooks, maids and related workers
Building care-takers, cleaners, sweepers and watermen
3.175 According to this data, following are the characteristics of the various occupational groups of, migrants in the two cities.
3.176 Majority of male workers in Srinagar are employed as house-keepers, cooks etc. whereas the highest proportion offemal"es is claimed by those engaged in spinning, weaving, knitting, dyeing, etc. IIi. Jammu city, over one-fourth of the total working migrants of each sex is engaged in manual labour. This is, as it sJ10uld be, in view of the fact ~hat Srinagar abounds in'hotels, restaurants and rented houses where domestic servants like house-keepers and cooks are in great demand. In Jammu, this avenue ofemployment is available on a limited scale, although we find that maids, female house-keepers and similar other workers are engaged by many people wherefore the proportion of migrants engaged in this occupation ranks third in case of males and next only among females. It is a known fact that in Jammu, women work along with men as labourers on constructional works, such as building of roads, houses, bridges etc. Mixed labour except in cultivation and
290
Srinagar City ,---_ ....... -_------,---.,
Males Females
2
15
20
92
31
54
49
43
69
212
24
3
77
154-
25
7
213
6
158
57
Jammu City r---------....... ------~
Males Females
4
6
17
45
54
116
65
5
264-
74-
12
5
70
, 193
37
8
10
,255
204
137
boat transport etc. is scarce in Srinagar. This is based on the social concept that women should share the work, if at all they - ,.must, with the male members of' their own families and not with outsiders. Spinning and weaving, however, attract many female migrants to Srinagar partly because of the· shortage of man-power in this sector and partIy because these can be managed at home and need' not be shared with outsiders. Another reason for the high proportion of such migrants is the availability on sale of raw -material for spinning which' can be had on cash payment or from Co-operative Societies and other organisations free of cost subject to its being returned after being spun against payment of the fixed wages. A few decades before, a large majority of the permanent female popUlation of the city made subsidiary hving by spinning of pashmina wool etc. With the improvement in economic standards and expansion of facilities for education, very few women are interested in this occupation. They have instead taken to knitting, embroidery, tailoring etc. The gap in the man-power thus created has been made up by female migrants from other' areas.
3.177 Another important category of female migrants consists of teachers. This is true of both the cities, the corresponding proportion being 154 per 1,000 in Srinagar and 193 in Jammu. The large disparity between the male and female migrants engaged in this occupation in both the cities is not due as much to the non-availability of qualified persons to man the posts of teachers in the girls education as to the preference of the employees recruited from areas outside the cities for being posted either to institutions, if any, functioning in their birth places or in large' urban areas like cities where greater amenities of life are available.
3. I 78 Female immigrants are also attracted by medical institutions in the two cities where they are employed as nurses, midwives, house-keepers etc. in' good nllmber when compared with several other occupations. Except for vaccination work in which males. alone are employed, all other assignments classifiable in this category are mos·t!y held by females. This is why the number of male migrants in this category is exceedingly low when compared with those of females.
3.179 Commercial establishments dealing in wholesale and retail trade also absorb a substantial proportion of male migrants. In Jammu, the number engaged 'in this occupation is 116 per 1,000 against only 54 of Srinagar.
3.180 It may be stated here that Jammu functions as a distributing centre of consumer goods for the entire State and the incidence of wholesale commercial establishments in this city is, therefore, more pronounced than in Srinagar which caters the three valley districts and Ladakh only.
3.181 Female migrants are also preferred. in both the cities for employment as building care-takers, sweepers and cleaners etc. Scavenging and sweeping are looked after in Jammu city exclusi~ely either by the members of Scheduled Castes or Christians and by the members of no other community. The prospect of employment
291
in this occupation, therefore, serves as an incentive for the migration of ChriStians and Scheduled Caste females to the city. This is nor, however, so in the case of Srinagar where the occupation is monopolised by members of Muslim community. Consequently, the recruitment of female migrants to man these assignments in Srinagar is comparatively small.
3.182 Over 9% male worker migrants in Srinagar consist of clerks. The city being the summer capital of the State Government, the number of Government 'and private institutions and offices functioning at this place. is fairly large and can absorb more educated persons than the rural institutions and offices. It must, however, be noted here that these migrations are not exclusively due to the shortage ·of man-power in the city. For administrative convenience. inter-transfers of clerical workers are frequently made from one territorial unit to another which are eventually reflected in the migrant population_
3.183 There are very few female workers holding clerical posts in the State. The above statement shows that no female migrant has been absorbed as a clerk inJammu city, whereas the proportion of those holding such assignments in Srinagar is exceedingly small.
3.184 The statement also shows that 5.3% migrants in Jammu are engaged as unskilled office workers. Most of these consi,t of males. In Srinagar, the corresponding proportion is small.
(d) by Sex
3.185 We may now analyse the data given in Tables D-II to D-V with a view to studying another interesting sociological feature, namely the disparity between male and female immigrants into the cites and town· groups. Table D-ll gives the following breakup of the immigrants into the two cities from areas outside the district of enumeration excluding those born in countries outside India as' also those whose rural/urban classification is not available!-
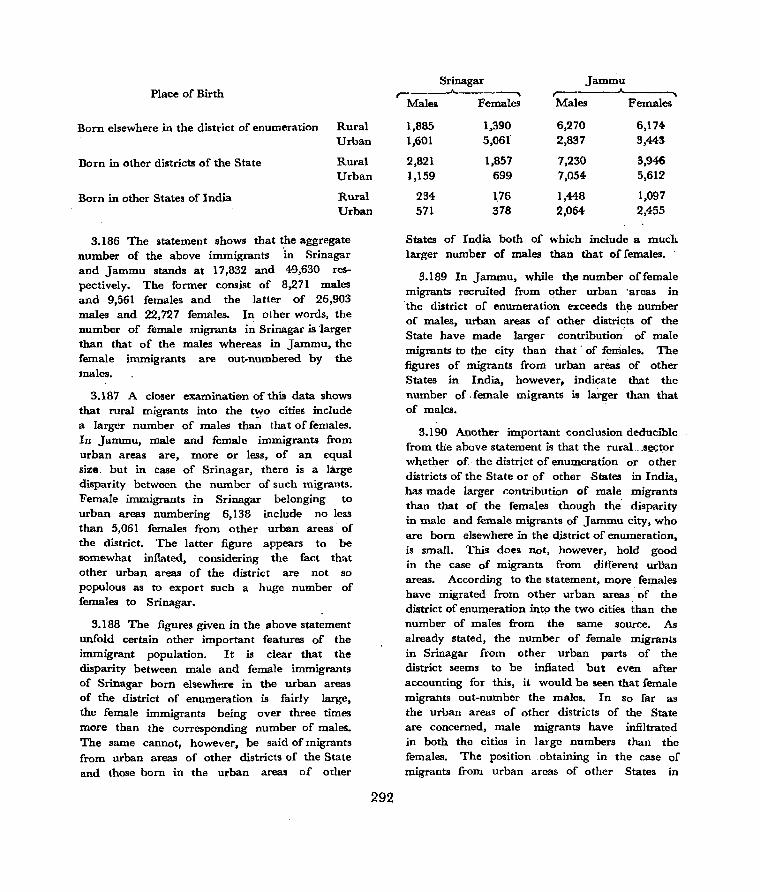
Place of Birth
Born elsewhere in the district of enumeration Rural Urban
Born in other districts of the State Rural Urban
Born in other States of India Rural Urban
3.186 The statement shows that the aggregate number of the above immigrants in Srinagar and Jammu stands at 17,832 and 49,630 respectively. The former consist of 8,271 males and 9,561 females and the latter of 26,903 males and 22,727 females. In other words, the number of female migrants in Srinagar is 'larger than that of the males whereas in Jammu, the female immigrants are out-numbered by the males.
3.187 A closer examinatien of this data shows that rural migrants into the t~o cities include a larger number of males than that of females. In jammu, male and female immigrants from urban areas are, more or less, of an equal size. but in case of Srinagar, there is a large disparity between the number of such migrants. Female immigrants in Sri nagar belonging to urban areas numbering 6,138 include no less than 5,061 females from other urban areas of the district. The latter figure appears to be somewhat inflated, considering the fact that other urban areas of the district are not so populous as to. export such a huge number of females to Srinagar.
3.188 The figures given in the above statement unfold certain other important features of the immigrant population. It is clear that the disparity between male and female immigrants of Srinagar born elsewh~re in the urban areas of the district of enumeration is fairly large, the female immigrants being over three times more than the corresponding number of males. The same cannot, however, be said of migrants from urban areas of other districts of the State and those born in the urban areas of other
292
Srinagar jammu ,..- ~ ,..----_ ....... _---,.
Males Females Males Females
1,885 1,390 6,270 6,174
1,601 5,061" 2,837 3,443
2,821 1,857 7,230 3,946 1,159 699 7,054 5,612
234 1.76 1,448 1,097 571 378 2,064 2,455
States of India both of which include a much larger number of males than that of females. .
3.189 In jammu, while the number offemale migrants recruited from other urban ·areas in ·the district of enumeration exceeds the number of males, urban areas of other distrkts of the State have made larger contribution of male migrants to the city than that' of females. The figures of migrants from urban areas of other States in India, however, indicate that the number of, female migrants is larger than that of males.
3.190 Another important conclusion deducible from the above statement is that the rural. _s~c;:tor whether of.· the district of enumeration or other districts of the State or of other States in India, has made larger contribution of male migrants than that of the females though the disparity in male and female migrants of Jammu city, who are born elsewhere in the district of enumeration, is small. This does not, however, hold good in the case of migrants from different urllan areas. According to the statement, more females have migrated from other urban areas of the district of enu~eration intp the two cities than the number of males from the same source. As already stated, the number of female migrants in Srinagar from other urban parts of the district seems to be inflated· but even after accounting for this, it would be !reen that female migrants out-number the males. In so far as the urban areas of other districts of the State are concerned, male migrants have infiltrated in both the cities in large numbers than tlie females. The position .obtaining in the case of migrants from urban areas of other States in

India is, however, different. Sdnagar has not made any large scale recruitment of such migrants whether hailing from the rural or urban areas. In the case of Jammu. on the other hand, both the sectors have exported a fairly good, n\lmber of migrants of either sex. Migrants in Srinagar from urban areas of other States in India are, however, distinguishable from those
of Jammu on account of larger number of males than females.
3.191 Another conspicuous feature of the immigrants, as disclosed by the statement, is
that majority of these enumerated in Jammu city have been recruited from other parts of
. the State, whereas the contribution made by this source to Srinagar is of a smaller size
than the' number of migrants from other parts of Srinagar district.
(e) by duration of residence in place of enulDeratioD
3.192 Ordinarily, the disparity between male and female migrants should be greater as the distance of migration and the period of settlement increases. That is to say. the disparity between the two sexes with less than one year's duration of residence at the place of enumeration is usually greater than that between the two sexes with 1 to 5 years stay and so on. Let us now examine how far this holds good in the case of migrants to the cities of Ja~mu and Srinagar. The following statement prepared from Table D-III and giving the sex-wise statistics of migrants from urban and rural areas with varying periods of residence in the two cities will indicate how far the figures respond to this general rule. Data relating to places from which recruitment of migrants has been made on a limited scale has not been indicated in the' statement.
STATEMENT ID.26
Migrants classified by place of birth and duration of residence in the place of enulDeratioD
Srinagar Municipality
Rural/ Duration of Residence in place of Enumeration in years Urban r-----------_______ -A. ____________________ --.
~otal Less than 1·5 year. 6·10 years U-15 years 16 years Period not MIgrants One year and over stated
Where born
r--..A..-_, r--..A-_.--r, r--..A..-~ ,..-_J.-_--.. ~-.A..-~ ,.-_...A..._-"\ ,-_....A.. ____
M F M F M F M F M FM F M F
2 3 4 5 6 7 8 9 10 11 12 13 14 15 16
Born elsewhere in the district Rural 1,885 1,390 378 I'll 291 264 270 279 266 350 436 199 242 187
of enumeration Urban 1,601 5,061 144
norn outside the district but Rural 2,821 1,857 '217
within the State of enumeration Urban 1,159 699 224
." norn in Punjah Rural 127 132
Urban 343 210
norn in Uttar Pradesh Rural 47 24
Urban 95 48
Born in Pakistan 388 388
32
64
19
21
39
57 277 442 202 412 90 488 272 1,678 616 1,984
57 497 282 468 209 446 394 858 581 335 334
51 311
3
36
10
8
26
293
27
79
14
27
51
90 172
39
72
9
11
74
6
17 23
51. 60
94 207 153 225 242
11
27
2
14
29
6
19
33
88
3
4
43
6 9 5 11 8
53 109 103 107 116
20
10
9
4
22
69
69
13
2
4
39
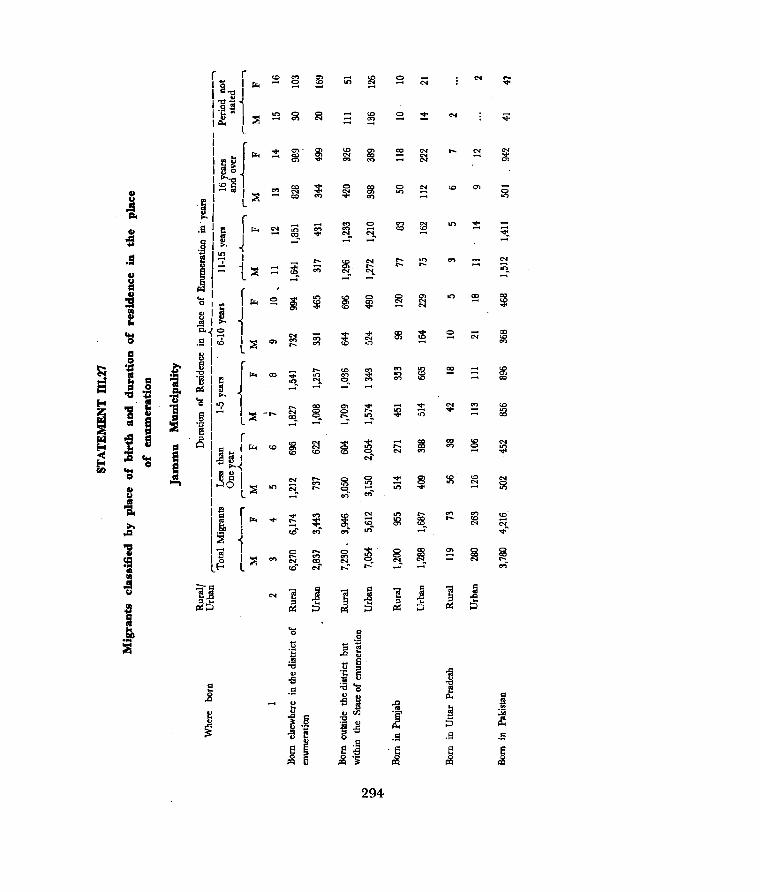
! oS .S
E .8
f~ i
i L~
* .,;
o ..., .,. .... "
294
... ....
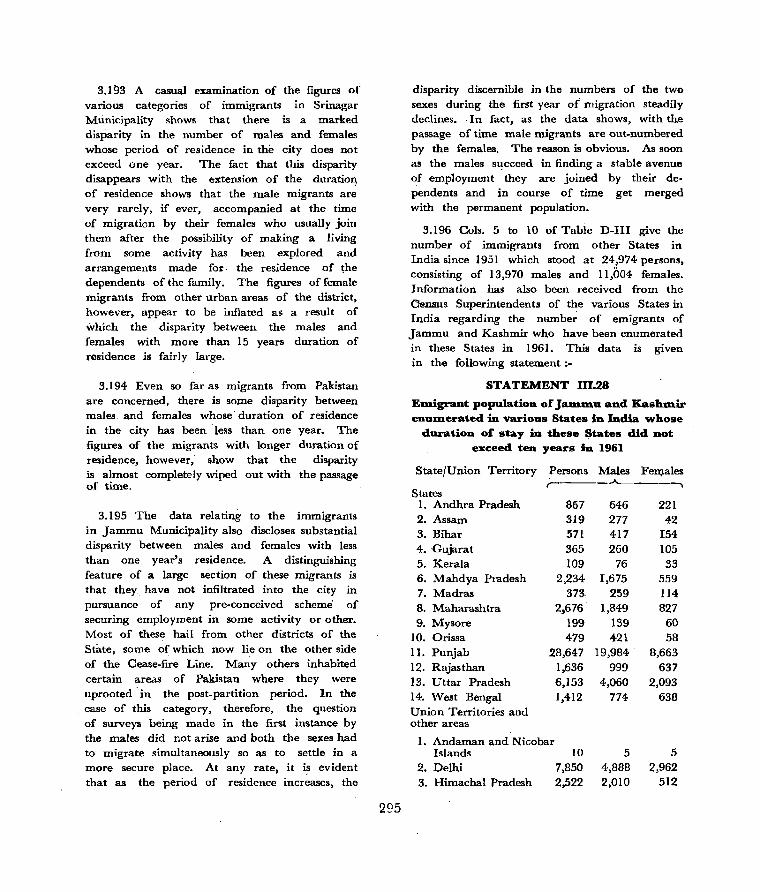
3.193 A casual examination of the figures of various categories of immigrants in Srinagar Municipality shows that there is a marked disparity in the number of males and females whose period of residence in the city does not exceed one year. The fact that this disparity disappears with the extension of the duratioq of residence shows that the male migrants are very rarely, if ever, accompanied at the time of migration by their females who usually join them after the possibility of making a living from some activity has been explored and arrangements made for· the residence of the dependents of the family. The figures of female migrants from other urban areas of the district, however, appear to be inflated as a result of which the· disparity between the males and females with more than 15 years duration of residence is fairly large.
3.194 Even so far as migrants from Pakistan are concerned, there is some disparity between males. and females whose· duration of residence in the city has been ·less than one year. The figures of the migrants with longer duration of residence, however, show that the disparity is almost completely wiped out with the passage of time.
3.195 The data relating to the immigrants in Jammu Municipality also discloses substantial disparity between males and females with less than one year's residence. A distinguishing feature of a large section of these migrants is that they have not infiltrated into the city in pursuance of any pre-conceived scheme" of securing employment in some activity or other. Most of these hail from other districts of the State, some of which now lie on the other side of the Cease-fire Line. Many others inhabited certain areas of Pakistan where they were uprooted· in the post-partition period. In the case of this category, therefore, the question of surveys being made in the first instance by the males did not arise and both the sexes had to migrate simultaneously so as to settle in a more secure place. At any rate, it is evident that as the period of residence increases, the
295
disparity discernible in the numbers. of the two sexes during the first year of migration steadily declines .. In fact, as the data .shows, with the passage of time male migrants are out-numbered by the females. The reason is obvious. As soon as the males succeed in finding a stable avenue of employment they are joined by their dependents and in course of time get merged with the permanent population.
3.196 Cols. 5 to 10 of Table D-III give the number of immigrants from other States in India since 1951 which stood at 24,974 persons, consisting of 13,970 males and 11,(lO4 females. Information has also been received from the Census Superintendents of the various States in India regarding the number of emigrants of Jammu and Kashmir who have been enumerated in these States in 1961. This data is given in the following statement :-
STATEMENT 111.28
EDligrant population of Jauunu and KashD1ir enUlDerated in "VarioDs States in India whose
duration of stay :in these States did Dot exceed ten years in 1961
State/Union Territory Persons Males Fen:).ales r---------~--------~
States 1. Andhra Pradesh 867 2. Assam 319 3. Bihar 571 4. Gujarat 365 5. Kerala 109 6. Mahdya Pradesh 2,234 7. Madras 373 8. Maharashtra 2,676 9. Mysore 199
lO. Orissa 479 11. Punjab 28,647 12. Rajasthan 13. Uttar Pradesh 14. West Bengal Union Territories and other areas
1. Andaman and Nicobar Islands
2. Delhi 3. Himachal Pradesh
1,636 6,153 1,412
lO 7,850 2,522
646 277 417 260
76 1,675
259 1,849
139 421
19,984-999
4,060 774
5 4,888 2,010
221 42
154 105 33
559 114 827
60 58
8,663 637
2,093 638
5 2,962
512
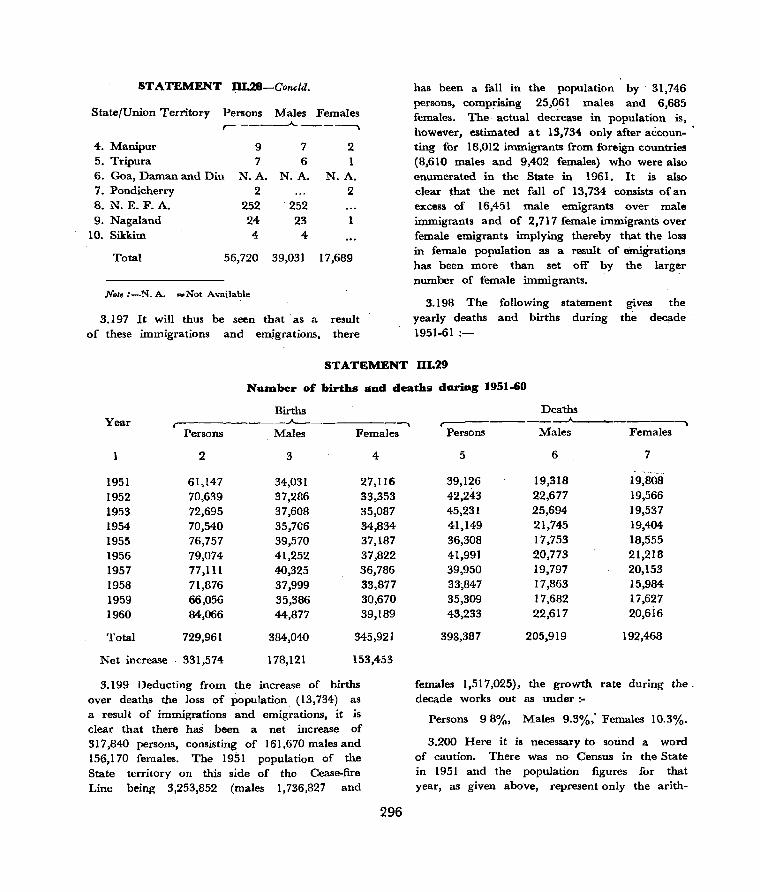
STATEMENT III.28-Concld.
State/Union Territory Persons Males Females r-----..A.------.,
4. Manipur 9 7 2 5. Tripura 7 6 1 6. Goa, Daman and Diu N.A. N.A. N.A. 7. Pondicherry 2 2 8. N. E. F. A. 252 252 9. Nagaland 24 23 1
10. Sikkim 4 4
Total 56,720 39,031 17,689
Not. :-N. A. ..Not Available
3.197 It will thus be seen that as a of these immigrations and emjgrations.
result there
has been a fall in the population by' 31,746 persons, comprising 25,061 males and 6,685 females. The actual decrease in population is, however, estimated at 13,734 only after accoun- . ting for 18,012 immigrants from foreign countries (8,610 males and 9,402 females) who were also enumerated in the State in 1961. It is also clear ~hat the net fall of 13;734 consists of an excess of 16,451 male emigrants over male immigrants and of 2,717 female immigrants over female emigrants implying thereby that the loss in female population as a result of emi~ations has been more than set off by the larger number of female immigrants.
3.198 The following statement yearly deaths and births during 1951-61 '-
gives the the decade
STATEMENT IIL29
NUJDber of births aDd deaths duriDg 1951-60
Births Year r---------..A. --.,
Persons Males Females
2 3 4
1951 61,147 34,031 27,116 1952 70,639 37,286 33,353 1953 72,695 37,608 35,087 1954 70,540 35,706 34,834 1955 76,757 39,570 37,187 1956 79,074 41,252 37,822 1957 77,111 40,325 36,786 1958 71,876 37,999 33,877 1959 66,056 35,386 30,670 1960 84,066 44,877 39,189
Total 729,961 384,040 345,921
Net increase 331,574 178,121 153,453
3.199 Deducting from the increase of births over deaths the loss of population (13,734) as a result of immigrations and emigrations, it is clear that there has been a net increase of 317,840 persons, consisting of 161,670 males and 156,170 females. The 1951 population of the State territory on this side of the Cease-fire Line being 3,253,852 (males 1,736,827 and
296
Deaths r----------..A..------~
Persons Males Females
5 6 7
39,1~6 19,318 19,808 42,243 22,677 19,566 45,231 25,694 19,537 41,149 21,745 19,404 36,308 17,753 18,555 41,991 20,773 21,218 39,950 19,797 20,153 33,847 17,863 15,984 35,309 17,682 17,627 43,233 22,617 20,6i6
398,387 205,919 192,468
females 1,517,025), the growth rate during the. decade works out as under:-
Persons 98%, Males 9.3%; Females 10.3%.
3.200 Here it is necessary to sound a word of caution. There was no Census in the State in 1951 and the popUlation figures for that year, as given above, represent only the arith-

metical mean of the 1961 popUlation and the adjusted population for 1941 of the various districts of the State according to their 1961 jurisdictions. Olwiously, the 1951 population figures have only a statistical value and do not indicate the actual population of the State in that year. The calculations made above can, therefore, be regarded at best as an approximation of and not the actual growth rate which could be estimated if complete data regarding the number of emigrants from the State had been available. This information is available only in respect of migrants from Jammu and Kashmir enumerated in other States in India and not in respect of those who crossed the Cease-fire Line and the international boundary with Pakistan and settled there.
Distribution of IDIIDigrants into Cities by Workers and Non-workers
Srinagar Municipality
3.201 We will now try to ascertain' with the
help of the data given in Table D-IV the categories and the age-groups of the people who adjust themselves to family life more quickly than others. According to this table, the number of immigrants in Srinagar Municipality stood at 18,995 (8,869 males and 10,126 females). Of these, 6,896 consisting of 6,338 males and 558 females are workers. In other words, male workers constitute 71.5% of the total male migr~nt population, whereas the correspondrng proportion in the case of female workers stands at 5.5% only. It is also evident that the large majority of male workers belong to the agegroup 15-34 and 35-59 which claim respectively
54.0% and 39.0% or 93.0% of the total number of workers. In the case of females, the proportions of workers in the age-groups 15-34 and 35-59 stand at 57.9 and 37.8% of the total number of female workers respectively.
3.202 The followirig statement indicates the proportion of male and female workers to the total male and female migrants in their respective age-groups in Srinagar Municipality :-
297
Age-group Males Females
0-14 16.6 0.2 15-34- 79.4- 6.1 35-59 89.9 6.3 60 + 60.2 6.0
3.203 Evidently, except for the age-group 0-14, male workers claim a large majority of migrants in each age-group. As has been discussed in a subsequent paragraph, migrants under the age of 15 years consist mostly of infants and schoolgoing children and boys. In the case of females, however, non-workers swell each age-group and the proportion of workers is exceedingly small.
3.204 It is clear from Table D-IV that the prop-ortions of persons engaged in cultivation or employed as agricultural labourers are small, both in the case of male and female migrants.
3.205 In so far as classification by occupational divisions is concerned.. the table shows that majority of the male workers belong to Division 9, groups 90 and 91, viz., fire fighters, guards, policemen etc. and house. keepers, cooks and the like. Of these, 1,025 fall in the age-group 15-34 who include, among others, 889 persons engaged as house-keepers, cooks or domestic servants. The corresponding number in the age-group 35-59 stands at 301 and representS over 22% of the total male workers of this group.
3.206 The next important sector in which a relatively large number of male workers is engaged is Division 2, group 28 (clerical workers) and 29 (unskilled office workers) in which 382 workers of the age-group 15-34 and ,375 of the group 35-59 are employed. As stated earlier, there is a large net-work of Government and private offices and industrial and commercial establishments in Srinagar where both qualified and unskilled workers are absorbed more quickly than in other urban or rural areas of the State.
3.207 Groups 82 and 89 rank next and provide employment to 311 males of the agegroup 15-34 and 279 of the group 35-59. Most of the workers in group 82 consist of bakers or food workers like, fish, rice sellers and the like. Group 89 refers to ordinary
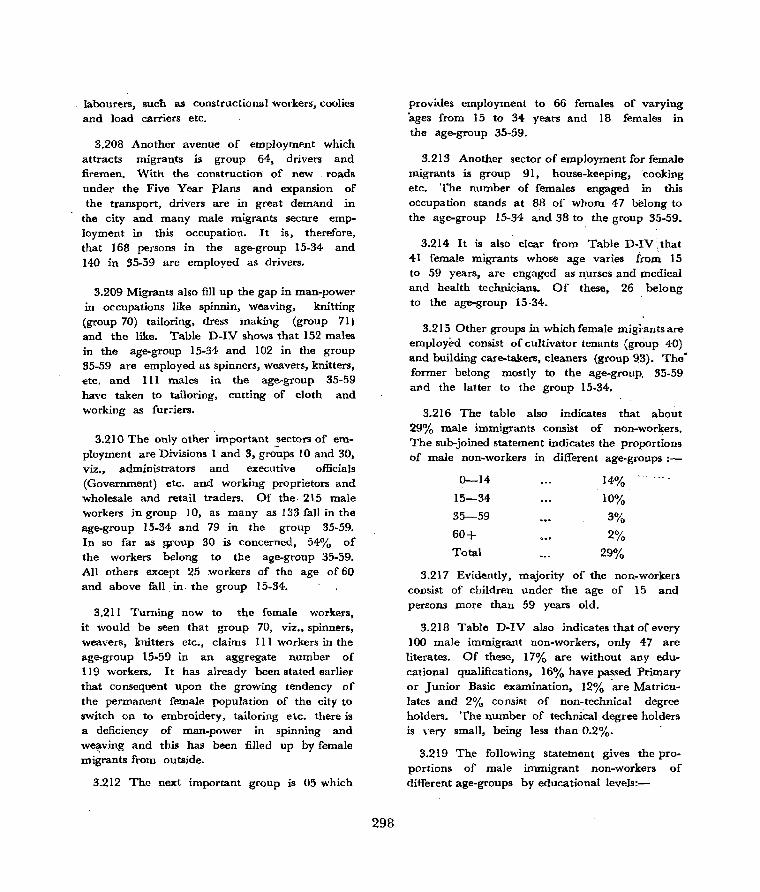
labourers, such as constructional wOl'kers; coolies and load carriers etc.
3.208 _"nother avenue of employment which attracts wigran,ts is group 64, drivers and firemen. With the construction of new roads under the Five Year Plans and eJ(pansion of the transport, drivers are in great demand in
the city and many male migrants secure employment in this occupation. It is, therefore, that 168 persons in the age-group 15-34 and 140 in 35-59 are employed as drivers.
3.209 Migrants also fill up the gap in man-power in occupations like spinnin, weaving, knitting (group 70) tailoring, dress inaking (group 71) and the like. Table D-IY shows that 152 males in the age-group 15-34 and 102 in the group 35-59 are employed as spinners, weavers, knitters, etc. and III males in the age-group 35-59 have taken to tailoring, cutting of cloth and working as fur;:iers.
3.210 The only other important sectors of employment are Divisions 1 and 3, grci~ps 10 and 30, viz., administrators and eJtecutive officials (Government) etc. and working proprietors and wholesale and retail traders. Of the 215 male workers in group 10, as many as 133 fall in the age-group 15-34 and 79 in the group 35-59. In so far as woup 30 is concerned, 540/ 0 of the workers belong to the age-group 35-59. All others except 25 workers of the age of 60 and above fall, in, the group 15-34.
3.211 Turning now to the female workers, it would be seen that group 70, viz., spinners, weavers, knitters etc., claims III workers in the age-group 15·59 in an aggregate number of 119 workers. It has already been stated earlier that consequent upon the growing tendency of the permanent female population of the city to switch on to embroidery, tailoring etc. there is a deficiency of man-power in spinning and we~ving and this has been filled up by female migrants from outside.
3.212 The next important group is 05 which
298
provides employment to 66 females of varying ages from 15 to 34 years and 18 females in the age-group 35-59.
3.21S Another sector of employment for female migrants is group 91, house-keeping, cooking etc. The number of females engaged in this occupation stands at 88 of whom 47 belong to the age-group 15-34 and 38 to the group 35-59.
3.214 It is also clear from Table D-IV' that 41 female migrants whose age varies trom 15 to 59 years, are engaged as nurses and medical and health technicians. Of these, 26 belong to the age-group 15·34.
3.215 Other groups in which female migrants are employed consist of cultivator tenants (group 40) and building care-takers, cleaners (group 9,3). The" former belong mostly to the age-group, 35-59 and the latter to the group 15-34.
3.216 The table also indicates that about 29% male immigrants consist of non-workers. The sub-joined statement indicates the proportions of male non-workers in different age-groups :-
0-14 14%
15-34 10%
35-59 3%
60+ 2%
Total 29%
3.217 Evidently, majority of the non-workers consist of children under the age of 15 and persons more than 59 years old,
3.218 Table D-IV also indicates that of every 100 male immigrant non-workers, only 47 are literates. Of these, 17% are' without any educational qualifications, 16% have pa~sed Primary or Junior Basic examination, 12% are Matriculates and 2% consist of non-technical degree holders. The number of technical degree holders is ,'ery small, being less than 0.2%.
3.219 The following statement gives the proportions of male immigrant non-workers of different age-groups by educational levels:-
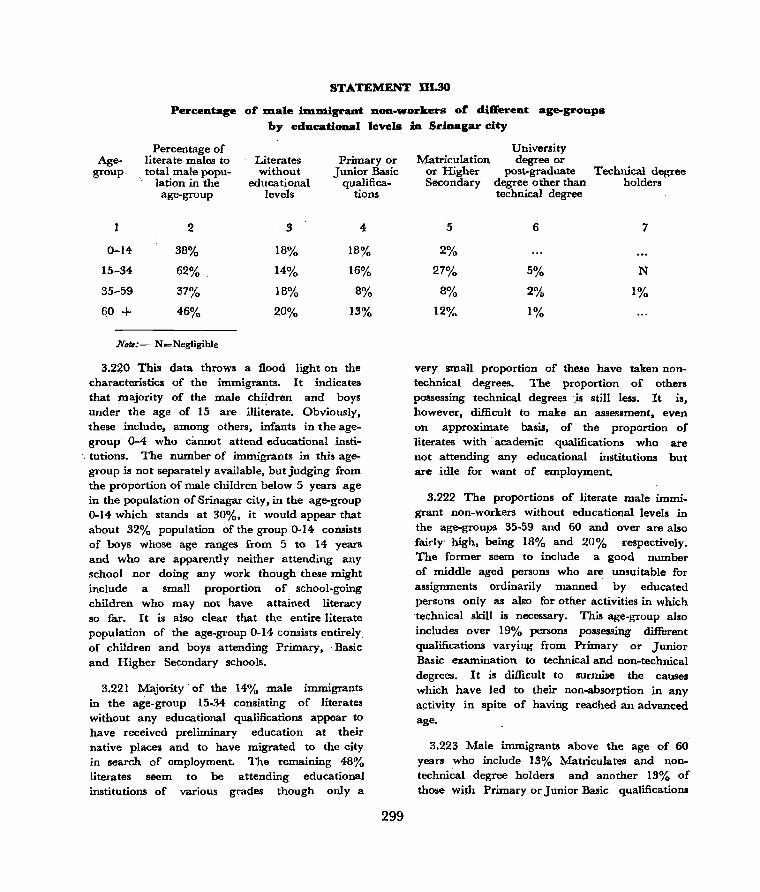
STATEMENT DI.3O
Percentage of D1ale ilnD1igrant non-workers of. dift'erent age-groups by educ:atioaal levels in Srinagar city
Percentage of Age- literate males to Literates Primary or
group. . total male popu- without Junior Basic . lation in the educational qualifica-
age-group levels tions
2 S 4
0-14- 38% 18% 18%
15-34 62% 14% 16%
35-59 37% 18% 8%
qO + 46% 20% IS%
NDk:- N=Negl,gible
3.220 This data throws a flood light on the characteristics of the immigrants. It indicates that majority of the male children and boys under the age of 15 are illiterate. Obviously, these include, among others, infants in the agegroup 0-4 who cannot attend educational insti-
. tutions. The number of immigrants in this agegroup is not separately available, but judging from the proportion of male children below 5 years age in the population of Srinagar city, in the age-group 0-14 which stands at 30%. it would appear that about 32% population of the group 0-14 consists of boys whose age ranges from 5 to 14 years and who are apparently neither attending any school nor doing any work though these might include a small proportion of school-going children who may not have attained literacy so far. It is also clear that the entire literate population of the age-group 0-14 consists entirely of children and boys attending Primary. Basic and Higher Secondary schools.
3.221 Majority' of the 14% male immigrants in the age-group 15-34 consisting of literates without any educational qualifications appear to have received preliminary education at their native places and to have migrated to the city in search of employment. The remaining 48% literates seem to be attending educational institutions of various grades though only a
299
University Matriculation degree or
or Higher post-graduate Technical degree Secondary degree other than holders
technical degree
5 6 7
2%
27% 5% N
8% 2% 1%
12% 1%
very small proportion of these have taken nontechnical degrees. The proportion of others possessing technical degrees ·.is still less. It is, however, difficult to make an assessment, even on approximate basis, of the proportion of literates with academic qualifications who are not attending any educational institutions but are idle for want of employment.
3.222 The proportions of Bterate male immigrant non-workers without educational levels in the age-groups 35-59 and 60 and over are also fairly high, being 18% and 20% l'espectively. The former seem to include a good number of middle aged persons who are unsuitable for assignments ordinarily manned by educated persons only as also for other activities in which ·technical skill is necessary. This age-group also includes over 19% persons possessing different qualifications varying ffom Primary or Junior Basic examination to technical and non-technical degreeS. It is difficult to surmise the causes which have led to their non-absorption in any a.:;tivity in spite of having reached an advanced age.
3.223 Male immigrants above the age of 60 years who include 13% ?vlatriculates and nontechnical degree holders and another 13% of those with Primary or Junior Basic qualifications

apparently consist of retired persons or old men who cannot attend to any work. Only 18% of the overall female immigrant non-working population consists of literates, half of whom have not passed any examination.
3.224 The data given in the various age-groups of Table D-IV shows that only 37% of the female immigrant non-workers under the age of 15 years are literate. About 21 % of these consist of persons who have not attained any educational levels. The distribution·of the remaining 16% shows that they may be attending schools of different grades as it is unlikely that they could have taken up- any assignment at this early age. The proportion of literates in the age-group 15-34 is, however, very small, being 21 % of the total population of this group. It appears that most of these females were withdrawn from educational institutions at a very early stage and before attaining any academic qualifications. It is also likely that the 7% literates with Primary or Junior Basic qualification must have discontinued attending the schools after marriage. - At any rate, no explanation is available to indicate why 5% of the literate female population consisting of Matriculates and with Higher Secondary qualification and non-technical degrees have not been absorbed in any activity.
3.225 The literate population in the agegroup 35-59 claims a still lesser proportion of 9%. Of these, not more than 3% possess academic qualifications, all others being without any educational levels. In this case also, it appears that most of the few literate females have discontinued attending the schools at an early age. The number of females with Matri. culation or higher qualifications is small and it is presumed that they are attending household, duties only.
3.226 The category of female immigrants above the age of 60 includes only 3% literates, none of whom possess any educational qualifica tions.
Jammu Municipality
3.227 Let us now consider the characteristics
300
of immigrants enumerated in Jammu Municipality .• Their total population stands at 57,809 persons, consisting of 30,757 males and 27,052 females. The following statement indicates the total and sex-wise proportions of the immigrants by broad age-groups :-
STATEMENT 11131
Pncentage of total, lIlale and female imllligrants by broad age-grou.ps.
Age-group
Total 0-14
15-34 35·-59 60+
Total immigrants
2
100.0 18.3 47.7 28.1 5.9
Male Female immigrants imlPigrants~
3
100.0 17.4 46.1 31.2 5.3
4
- 100.0
19.4 49.5 24.6
6.5
3.228 It is clear that about half the immigrants consist of youngmen and women whose ages range from 15-34 years. The next important category consists of those falling in the agegroup 35-59. Infants and children below the age of 15 rank next. The statement also _i:t_lt!!c~~es that the proportions of females in all age-groups except 35-59 are larger than the corresponding proportions of males.
3.229 Table D-IV shows that workers constitute over 40% of the total migrant population who number 23,267 comprising 22,215 males and 1,052 females. The corresponding proportions of male and female workers stand at 72.2% and 3.9% respectively.
3.230 As in the case of Srinagar Municipality, the number of immigrants who have taken to cultivation or who are employed as agricultural labourers stands at 181 only in a total migrant population of 57,809. I t is also significant to note that not a single female mig[fl.nt is engaged as cultivator or employed as an agricultural labourer.
3.231 In so far as occupational classification of such of the workers as are engaged in activities other than employment as «_ultivators

aJld agricultural labourers are concerned, Table D-IV shows that over 25% of the total number of male workers in the city are engaged as ordinary labourers (Division 8, group 89) in the age-group 15-59. Of these, 2,840 fall in the age-group 15-34 and the rest in the group 35-59. Ja:qlmu 'city has been an important commercial centre all along in the past and with the transfer- of the railhead of the State from Rawalpindi to Pathankot, the volume of business in the city has assumed large dimensions. This naturally necessitates employment of __!!_IlSkilled labour for diverse type of manual labour. A still more important reason for the high incidence of immigrants employed as ordinary labourers is the transfer of the State capital from Srinagar to Jammu during winter when the Census is taken. In this' season, the number of migrants in Jammu city who include, among others, Govermnent servants of moving offices, their families, legislators, businessmen etc. is very large. Manual labourers like wood cutters, coolies, load carriers and the like are, therefore, in great demand during this part of the year. The deficiency in the man-power is made good mainly by Kashmiri peasants who migrate from iheir native places in winter to the plains in search of employment.
3.232 The next important avenue of employment of male migrants is wholesale and retail trade (Division 3, group 30) in which 1,202 males of age-group 15-34 and 1,051 of the group
, 35-59 have been absorbed. Jammu city has more than doubled in population during the last two decades 'and the demand for consumer goods has, as a result, increased considerably. Entrepreneurs, with varying size of Capital are, therefore, attracted to the city where they build 'good business in wholesale and retail trade.
3.233 As in the case of Srinagar, the number of vehicles in Jammu has registered a phenomenal increase consequent upon the expansion of road construction programme. Drivers are, therefore, in constant need and migrants are readily absorbed in this activity. That is why .812 males in the age-group 15-34 and 610 in 35-59 group
301
are employed as drivers (Division 6, group 64).
3.234 A fairly large number of immigrants are engaged as house-keepers, cooks 'and the like (Division 9, group 91). Over 84% of these numbering 1,378 fall in the age-group 15-34. Apparently, there has been some mistake in the-occupational classification of migrants of the agegroup 35-59 wherefore the number of male migrants of this category engaged as housekeepers and cooks etc. stands at 9 only.
3.235 Not a few of the male migrants are attracted to the city by the prospect of being employed as unskilled office workers (Division 2, group 29). This is because of a very large number of Government and private offices and industrial and commercial establishments functioning in ilie city where peons, chowkidars, guards and other inferior servants are employed in large numbers. The table shows that immigrants engaged in this activity, whose age varies from 15-59 years, number 1,175 of whom 75] belong to the age-group 15-34 and 424 to the group 35-59.
3.236 For the same reason, non-technical qualified hands also migrate in sizable number to the city where they are in demand for being engaged as clerical workers (Division 2, group 28). The category claims 992 workers in ail of whom 630 belong to the age-group 15-34 and 352 to 35.59.
3.237 The Police Department, fire fighting services, excise and octroi departments also engage a fairly good number' of immigrants. The table shows that 934 males are engaged in this activity (group 90) and most of these belong to the age-group 15-59.
3.238 Here it is necessary to clarify that these migrations are not necessarily due to direct recruitments to services but' are often caused as a result of the transfers ordered by the administrat,ive authorities. A large majority of immigrants employed as clerks, peons, Police constables, firemen, guards etc. consist ot officials who move with the Government to Jammu in winter months.
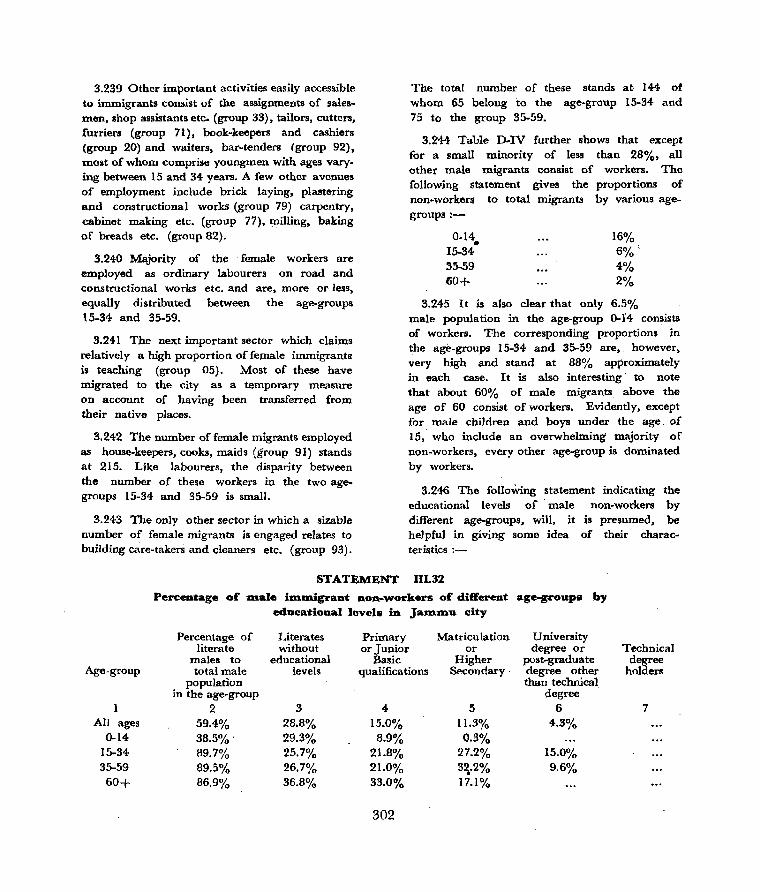
3.239 Other important activities easily accessible to immigrants consist of the assignments of salesmen, shop assistants etc. (group 33), tailors, cutters, furriers (group 71), book-keepers and cashiers (group 20) and waiters, bar-tenders (group 92), most of whom comprise youngmen with ages varying between 15 and 34 years. A few other avenues of employment include brick laying, plastering and constructional works (group 79) carpentry, cabinet making etc. (group 77), lUilling. baking of breads etc. (group 82).
3.240 Majority of the female workers are employed as ordinary labourers on road and constructional works etc. and are, more or less, equally distributed between the age-groups 15-34 and 35-59.
3.241 The next important sector which claims relatively a high proportion of feJUale immigrants is teaching (group 05). Most of these have migrated to the city as a temporary measure on account of having been transferred from their native places.
3.242 The number of female migrants employed as house-keepers, cooks, maids (group 91) stands at 215. Like labourers, the disparity between the number of these workers in the two agegroups 15-34 and 35-59 is small.
3.243 The only other sector in which a sizable number of female migrants is engaged relates to building care-takers and cleaners etc. (group 93).
The total number of these stands at 144 of whom 65 belong to the age-group 15-34 and 75 to the group 35-59.
3.244 Table D~IV further shows that except for a small minority of less than 28%, all other male migrants consist of workers. The following statement gives the proportions of non-workers to total migrants by various agegroups :-
0.14 • 15-34 35-59 60+
16% 6%' 4% 2%
3.245 It is also clear that only 6.5% male population in the age-group 0.f4 consists of workers. The corresponding proportions in the age-groups 15-34 and 35-59 are,. however, very high and stand at 88% approximately in each case. It is also interesting' to note that about 60% of male migrants above the age of 60 consist of workers. Evidently, except for male children and boys under the age of 15, who include an overwhelming majority of non-workers, every other age-group is dominated by workers.
3.246 The following statement indicating the educational levels of' male non-workers by different age-groups, will, it is presumed, be helpful in giving some idea of their characteristics :-
STATEMENT 111.32
Age-group
All ages 0-14-
15-34 35-59
60+
Perceatage of m.ale im.lIligrant non-workers of different age-groups by educational level. :in jam.Inu city
Percentage of Literates Primary Matriculation University literate without or Junior or degree or
males to educational Basic Higher post-graduate total male levels qualifications Secondary· degree other
population than technical in the age-group degree
2 3 4- 5 6 59.4% 28.8% 15.0% 11.3% 4.3% 38.5%' 29.3% 8.9% 0.3% 89.7% 25.7% 21.8% 27.2% 15.0% 89.5% 26.7% 21.0% 3~.2% 9.6% 86.9% 36.8% 33.0% 17.1%
302
Technical degree
holders
7
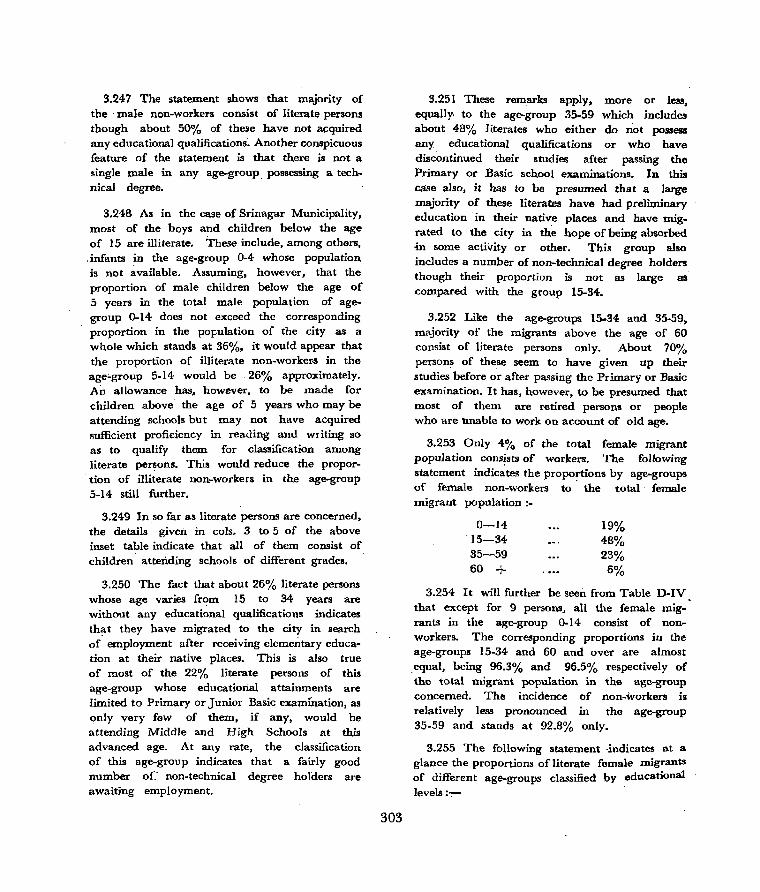
3.247 The statement shows that majority of the 'male non-workers consist of literate persons though about 50% of these have not acquired any educational qualifications: Another conspicuous feature of the statement is that there is not a single male in any age-group. possessing a technical degree.
3.248 As in the case of Srinagar Municipality, most of the boys and children below the age of ] 5 are illiterate. These include, among others,
,infants in the age-group 0-4 whose population is not ~vailable. Assuming, however, that the proportion of male children below the age of 5 years in the total male popula tion of agegroup 0-14 does not exceed the corresponding proportion in the pO}julation of the city as a whole which stands at 36%. it would appear that the proportion of illiterate non-worker-s in the :a.ge"group 5-14 would be 26% approximately. An allowance has, however, to be made for children above the age of 5 years who may be attending schools but may not have acquired sufficient proficiency in reading and writing so as to qualify them for classification among literate persons. This would reduce the propol'tion of illiterate non-workers in [he age-group 5-14 still further.
3.249 1n so far as literate persons are concerned, the details given in cols. 3 to 5 of the above inset table indicate that all of them consist of children attending schools of different grades.
3.250 The fact that about 26% literate persons whose age varies from 15 to 34 years are without any educational qualifications indicates that they have migrated to the city in search of' employment after receiving elementary education at their native places. This is also true of most of the 22% literate persons of this age-group whose educational attainments are limited to Primary or Junior Basic examInation, as only very few of them, if any, would be attending Middle and High Schools at this advanced age. At any rate, the classification of this age-group indicates that a fairly good number of_" non-technical degree holders are awaiting employment.
303
3.251 These remarks apply. more or less, equally, to the age-group 35-59 which includes about 48% literates who either do not possess any educational qualifications or who have discontinued their studies after passing the Primary or Basic school examinations. In this case also, it has to be presumed that a large majority of these literates have had preliminary education in their native places and have migrated to. the city in the hope of being absorbed -in some activity or other. This group also includes a number of non-technical degree holders though their proportion is not as large as compared with the gt'Oup 15-34.
3.252 Like the age-groups 15-34 and 35-59, majority of the migrants above the age of 60 consist of literate persons only. About 70% persons of these seem to have given up their studies before or after passing the Primary or Basic examination. It has, however, to be presumed that most of them are retired persons or people who are bnable to work on account of old age.
3.253 Only 4% of the total female migrant population cons~sts of workers. The following statement indicates the propo~tions by age-groups of female non-workers to the total female migrant population:-
0-14 15-34 35-59 60 +
19% 48% 23% 6%
3.254 It will further be seen from Table D-IV that except for 9 persons, all the female migrants in the age-group 0..14 consist of nonworkers. The corresponding proportions in the age-groups 15-34 and 60 and over are almost
.equal, being 96.3% and 96.5% respectively of the total migrant population in the age-group concerned. The incidence of non-workers is relatively less pronounced in the age-group 35-59 and stands at 92.8% only.
3.255 The following statement ·indicates at a glance the proportions of literate female migrants of different age-groups classified by educational levels :-:-
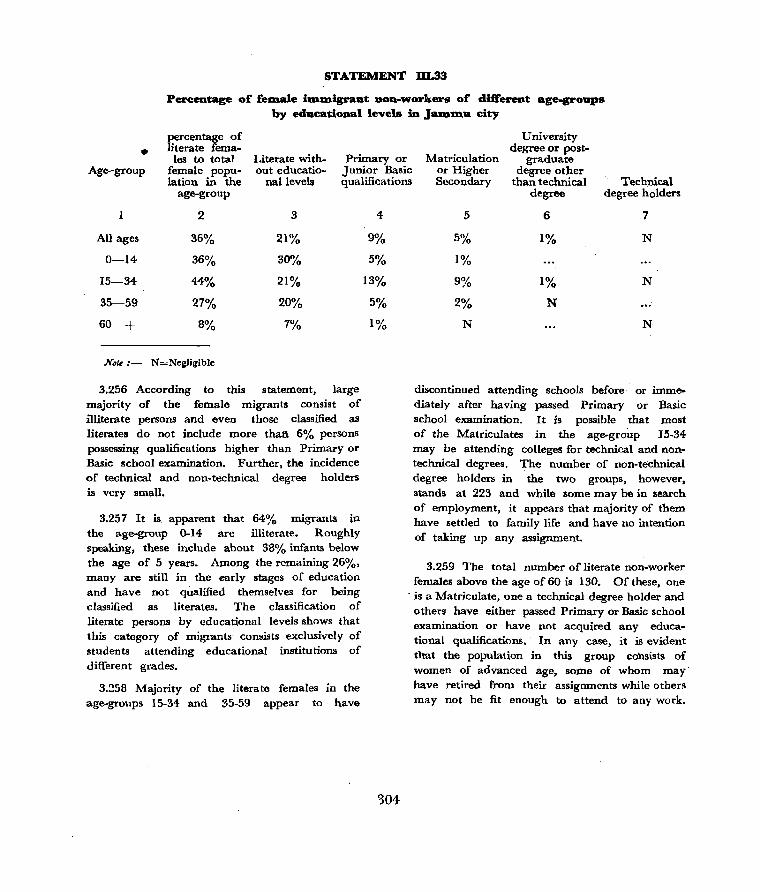
STATEMENT DL33
Percentage of female bnmigrant non-workers of d:ift"erent age-groups by educational levels in Jammu city
percentage of University
• literate ferna- degree or post-les to total Literate with- Primary or Matriculation graduate
Age-group female popu- out educatio- Junior Basic or Higber degree other lation in the nallevels qualifications Secondary than technical Tech1lical
age-group
2 3
AU ages 36% 21%
0-14 36% 30%
15-34- 44% 21%
35-59 27% 20%
60 + 8% 7%
Note :- N=Negligible
3.256 According to this statement, large majority of the female migrants consist of illiterate persons and even those classified as literates do not include more thali 6% persons possessing qualifications higher than Primary or Basic school examination. Further, the incidence of technical and non-technical degree holders is very small.
3.257 It is apparent that 64% migrants ~n
the age-group 0-14 are illiterate. Roughly speaking, these include about 38% infants below the age of 5 years. Among the remaining 26%, many are still in the early stages of education and have not qualified themselves for being classified as literates. The classification of literate persons by educational levels shows that this category of migrants· consists exclusively of students attending educational institutions of different grades.
3.!!58 Majority of the literate females in the age-groups 15-34 and 35-59 appear to have
4
9%
5%
13%
5%
10/ /0
'304
degree degree holders
5 6 7
5% 1% N
1%
gOL ,0 1% N
2% N .,. N N
discontinued attending schools before or immediately after having passed Primary or Basic school examination. It is possible that most of the Matriculates in the age-group 15-34 may be attending colleges for technical and nontechnical degrees. The number of non-technical degree holders in the two groups, however, stands at 223 and while some may be in search of employment, it appears that majority of them have settled to family life and have no intention of taking up any assignment.
3.259 The total number of literate non-worker females above the age of 60 is 130. Of these, one
. is a Matriculate, one a technical degree holder and others have either passed Primary or Basic school examination or have not acquired any educational qualifications. In any case, it is evident that the population in this group consists of women of advanced age, some of whom may have retired froOl their assignments while othe.rs may not be fit enough to attend to any work.
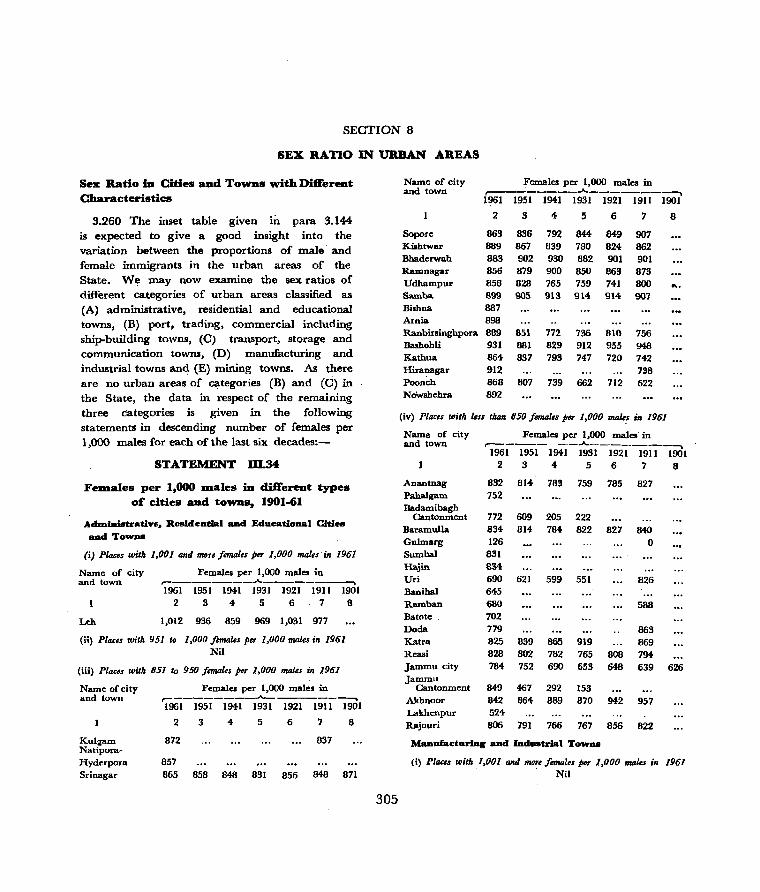
SECTION 8
SEX RATIO IN URBAN AREAS
Sell: Ratio iD Cities and Towns with Difl"ereu.t Characteristics
3.260 The inset table given in para 3.144 is expected to give a good insight into the variation between the proportions of male' and female immigrants in the urban areas of the State. We may now examine the sex ratios of different categories of urban areas classified as (A) administrative, residential and educational tOWIlS, (B) port, trading, commercial including ship-building tOWIlS, (C) transport, storage and communication towns, (D) manufacturing and industrial towns and (E) mining towns. As there are no urban areas of categories (B) and (C) in the State, the data in respect of the remaining three categories is given in the following statements in 'descending number of females per 1,000 males for each of the last six decades:-
STATEMENT m.M
FeDl.ales per 1,000 lDales iD clifI"ereu.t types of cities and towns, 1901-61
Acbnhdstrative, Residential and Educ:ational Cities
and ToWDll
(i) Places with 1,001 anti moT. fnnales PIT 1,000 males'in 1961
Name of city Females per 1,000 males in and town r---______ ..A.. _________ -,
1961 1951 1941 1931 1921 1911 1901 2345678
Leh 1,012 936 859 969 1,031 977
(it) Places with 951 10 1,000 fnnaks per 1,000 maks in 1961 Nil
(iii) Places with 851 to 950 fnnales per 1,000 maks in 1961
Name of city and town
Kulgam Natipora-Hyderpora Srinagar
Females per 1,000 males in ,.- ________ ..A... ______ ---..
1961 1951 1941 1931 1921 1911 1901
2345678
872 837
857 865 858 848 831 856 848 871
305
Name of city and town
Females per 1,000 males in ,.....--.-__; _____ ..,A... ________ ~
1961 1951 1941 1931 1921 1911 1901
2 3 456 7 8
Sopore Kishtwar Bhaderwah Ramnagar Udhampur Samba Bishna
863 836 792 844 849 907 889 867 839 780 824 862 883 902 930 882 901 901 856 879 900 850 863 873 858 828 765 759 741 800 899 905 913 914 914 907 887
Arnia 898 Ranbirsinghpora 889 Bashohli 931
851 881 837
772 829 793
736 912 747
810 955 720
756 948 742 Kathua
Hiranagar Poonch
864 ~2 88 868 807 739 662 712 622
Nowshehra 892
(iv) Places with kss than 850 fnnal,s ptr 1,000 males in 1961
Name of city Females per 1,000 males'in
....
and town r------ __ .A. ________ ........
1961 1951 1941 1931 1921 1911 1901 2345678
Anantnag Pahalgam Badamibagh
Cantonment Baramulia Gulmarg Sumbal Hajin Uri Banihal Ramban Batote Doda Katra Reasi Jammu city Jammu
Cantonment Akhnoor Lakhenpur Rajouri
832 81. 783 759 785 827 752
772 609 205 222 834 814 784 822 827 840
1~ ° 831 834 690 621 599 551 645 680 702 779 825 839 865 919 828 802 782 765 808 784 752 690 653 648
849 467 292 153 842 864 889 870 942 524 806 791 766 767 856
826
588
863 869 794 639 626
957
822
Manuf'ac:turfng and Industrial TOWDlJ
(i) Pla.:,s with 1,001 anti mo,e females pe, 1,000 milks in 1961 Nil
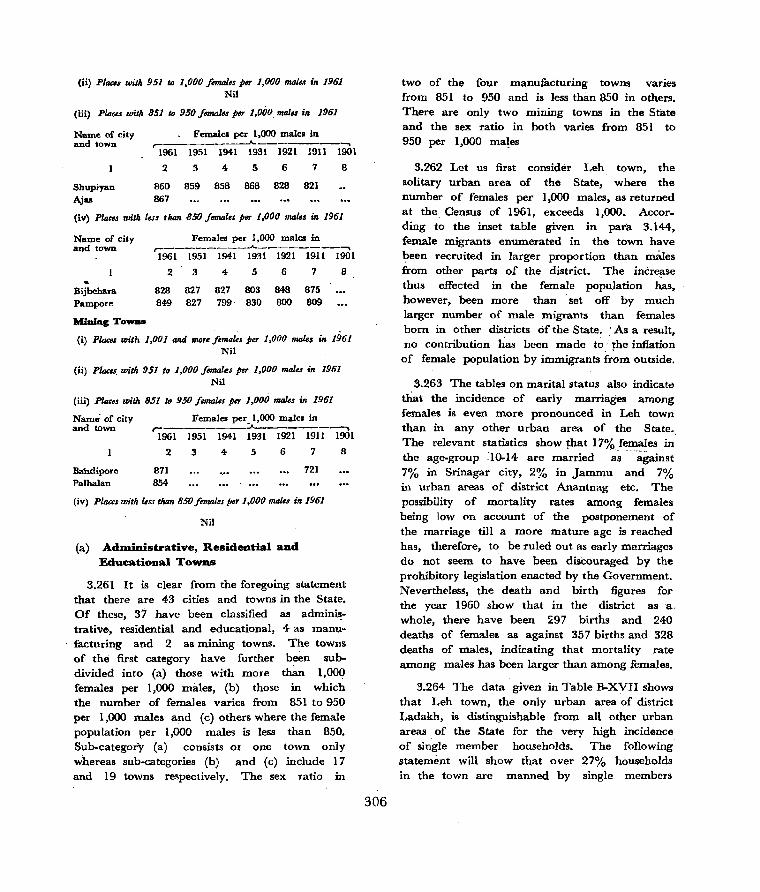
(ii) Plac.s with 951 w 1,000 females per 1,000 mal", in 1961 Nil
Ciii) Plates with 851 to 950 fmzal,s p". 1,000. mailS in }961
Name of city and town
Sbupiyan Ajas
Females per 1,000 males in r----------A-.----------.
1961 1951 1941 1931 1921 1911 1901
2 S 4 5 6 7 8
860 859 858 868 828 821 867
(iv) Pia.,. with less than 850 females per 1,000 mal.s in 1961
Name of city and town
Bijbebara Pampor"
MiDiDc TOWIIlI
Females per 1,000 males in ~--------~-------~ 1%1 1%1 1941 1~1 I~l Iml 1901
2345678
828 827 827 803 848 875 849 827 799 830 800 809
(i) Placer with 1,001 and morefomalu p". 1,000 males in 1961 Nil
(ii) Places with 951.w 1,000 fomales p". 1,000 maIer in 1961 Nil
(iii) Pla .. s with 851 til 950 females per 1,000 males ill 1961
Name" of city and town
Bandipore Palbalan
Females per 1,000 male. in r--------A--------~
1961 1951 1941 1931 1~1 1911 1901
2345678
871 854
721
(iv) Places with less than 850 females per 1,000 males in 1961
Nil
(a) Achn.inistrative, Residendal and Educational Towns
3.261 It is clear from the foregoing statement that there are 43 cities and towns in the State. Of these, 37 have been classified as administrative, residential and educational, 4 as manufacturing and 2 as mining towns. The towns of the first category have further been subdivided into (a) those with more than 1,000 females per 1,000 mides, (b) those in which the number of females varies from 851 to 950 per 1,000 males and (c) others where the female population per 1,000 males is less than 850. Sub-category (a) consists OI one town only whereas sub-categories (b) and (c) include 17 and 19 towns respectively. The sex ratio in
306
two of the four manufacturing towns varies from 851 to 950 and is less than 850 in others. There are only two mining towns in the State and the sex ratio in both varies from 85 I to 950 per I ,000 ma~es
3.262 Let us first consider Leh town, the solitary urban area of the State, where the number of females per 1,000 males, as returned at the. Census of 1961, exceeds 1,000. According to the inset table given in para 3.144, female migrants enumerated in the town have been recruited in larger proportion than mates from other parts of the district. The incre~se
thus effected in the female population has, however, been more than set off by much larger number of male migrants than females born in other districts of the State. .' As a result, no contribution lias been made to· ~he inflation of female population by immigrants from outside.
3.263 The tables on marital status also indicatd that the incidence of early marriages among females is even more pronounced in Leh town than in any other urban area of the State., The relevant statistics show !hat 17% females in the age-group :10-14 are married as "against 7% in Srinagar city, 2% in Jammu and 7% in urban areas of district Anantnag etc. The possibility of mortality rates among females being low on account of the postponement of the marriage till a more mature age is reached has, therefore, to be ruled out as early marriages do not seem to have been discouraged by the prohibitory legislation enacted by the Government. NeverthE'less, the death and birth figures for the year 1960 show that in the district as a. whole, there have been ~97 births and 240 deaths of females as against 357 births and 328 deaths of males, indicating that mortality rate among males has been larger than among females.
3.264 The data given in Table B-XVII shows that Leh town, the only urban area of district Ladakh, is distinguishable from all other urban areas of the State for the very high incidence of single member households. The following statement will show that over 27% households in the town are manned by single members

only while the corresponding proportions in the urban areas of other districts are by far less:-
STATEMENT m.35
Total num.ber of saD1ple, households, single "lIDellDber households and percentage of single DleD1ber household to total DUDlber of households
Total number
District of sample Single member househollds households
2 3
Anantnag" ],474 61 Srinagar 8,595 275 Baramulla 1,837 93 Ladakh 176 48 Doda 579 84 Udhampur 674 114 Jammu 4,611 420 Kathua 636 80 Poonch 726 101
3.265 Again, it is clear from this statement 'that Leh is the only town in the State where single member households manned by females only claim larger proportion than similar house.. holds inhabited by males. This would lead to the inference that females migrating to the town from other parts of the district claim larger proportion than the males. The only other possible explanation for the high incidence of single member households of females is that some of the males of Leh town usually migrate to the neighbouring districts of Sri nagar, Doda and Kulu valley of Punjab etc. during winter months where they work as coolies for snow clearance, construction of roads and manual labour. As the census is invariably 'taken in the month of February, the absence of the males may possibly have inflated the proportion of female population.
3.266 The sex ratio for the six decades given earlier in this paragraph indicates that the excess of females over males in the town is not peculiar to the decade 1951-61 only. The corresponding proportions, of the previous decades show that except for 1941 the number of females has invariably been nearly as large as that of males and sometime~ even greater, as in 1921. This is not only true of the urban
307
Percentage MaJes Females
4 5 6
4.1 52 9 3.2 221 54 5.1 90 3
27.3 20 28 14.5 72 12 16.9 90 24 9.1 308 112
12.6 63 17 13.9 82 19
sector but also of the district as a whole. A reference to Volume VI, Part II-A, General Population Tables, will show that the sex ratio of the district for the six decades ]901-61 stood as under:-
1901 986
1911 1921 1931 1941 J951 997 1,029 1,022 1,011 - 990
]96]
971
3.267 The previous records and the enquiries made indicate that the high proportion of females is most.ly· reflected among Buddhists. While single year age returns by communities have not been compiled in 1961, the following data will show that the proportion of Buddhist females in the age-group 0-1 has in the past been generally higher than that of the males :-
Year
1891 1901 1911 1921 1931 1941
Proportion of female infants " per 1,000 males"
r-------..A-------.-, 1,220 1,034 1,100 1,053
979 743
3.263 In 1961, the overall proportion of females per 1 ,000 males below the age of I year stood

at 1,158. Further, the number of males and females in the age-group 0-4 inhabiting the town stands at 190 and 221 respectively. There is no district in the State except Ladakh in which the male population in this age-group is not larger than that of the females. Obviously, this belies one of the established canons of statistical creed that male birth rate is always higher than the female birth rate. The only possible explanation of this unusual disparity is the religious longing to offer Chomo (female monks) to the local monastery or Gumpa.
3.269 An equally cogent reason for the high incidence of females is the hardy life to which women in the cold region of Ladakh are used and which has the effect of prolonging their life. This is confirmed by the breakup of the male and female population of Leh town by small age-groups, as given in· Tables C-II and C-III, Part-B which indicates that except for the groups 5-9, 35-39, 40-44,45-49 and 65 and over, females "claim larger population than males. in every other group.
3.270 Finally, the prevalence of polyandry, though now· practised on a 1Imall scale, also contributes to the disparity between the male and the female population. It is true that the Government have by a statutory enactment prohibited the practising of polyandry, but to assume that the evil has been completely eradicated would be against facts. Cases of· polyandry have been noticed as late as 1960 in the town itself notwithstanding its being the district headquarter where sufficient supervisory machinery is available to ensure implementation of the provisions of law.
3.271 As indicated in the statement, there is no administrative, residential or educational town in the State with a sex ratio ranging from 951 to 1,000 females per 1,000 males.
3.272 The third category of administrative, residential and educational towns with a sex ratio of 851 to 950 females per ] ,000 males includes 17 urban areas of the various districts of the State. Of these four, namely, the city of Srinagar and the towns of Udhampur,
308
~athua and Poonch are district headquarters in which the disparity in the population of the two sexes is mainly due to the large influx of male migrants from other parts of the State a. also from outside. Srinagar is important not only because of its being the summer capital of the State, but alsQ on account of the network of its industrial and commercial establishments which attract a substantial' number of males from outside the city to man various assignments. The incentive· of a stable employ. ment with its numetous attendant amenities availabe in Government services and the high wages offered by the commercial and industl~i organisations serve as effective temptations to the Tural population inhabiting most parts of the State where no work is available in winter on account of severe cold and heavy snow-fall. It is, therefore, that the sex ratio. in four of the district headquarters varies from 858 to 868 per 1,000 males.
3.273 Srinagar, though not classified as an industrial town, is the home of a large number of handicrafts, which have. earned a world wide reputation. These provide employment to all males above the age of 5 years. Females are very rarely engaged except for such·· ·of the assignments in which they need not share the work with outsiders. The concentration of Government offices of provincial and district level, courts and educational- institutions and private offices equally accounts for the low proportion of females when compared with males. Till 1960-61, there was no office or industrial and commercial ,_establishment except female educational institutions where any females were employed. Even these educational institutions were closed at the time of census on account of winter vacations. At any rate, . the fo~going statement shows that the sex ratio has progressively increased from ]931 onwards.
3.274 Udhampur town is both headquarter of the district and of army installations operating in the State. As a result, there are larger avenues of employment available in this town than in any other district headquarter of the State except the two cities of Srinagar and
Jammu. The prospect of employment has, therefore, attracted good many migrants from outside which has had the effect of infla~ing the male population. In this case also, the decennial ratios show that the disparity, has been progressively decreasing from 1921 onwards.
3;2'75 Kathua town has made a substantial improvement in its sex ratio during the last forty years. Like other district headquarters, the town is inhabited, among others, by a fairly good number of migrants from other parts of the State who are employed in Government' services and industrial and commercial establishments.
3.276 The town of Poonch has had a chequered career from J947 onwards on account of the large scale movement of its population. While the reasons which hold good for the low sex ratio of other district headquarters apply to the town of Poonch equally, it would not be correct to overlook the extraordinary conditions which it has experienced after 1947. The decennial sex ratios of the town presented in the statetment, however, indicate' that except for 1931, the ratio has been progressively improving since 1911 onwards.
3.277 The statement includes 10 other towns which function as the headquarters of their respective tehsils. These are Kulgamj Sopore, Kishtwar, Bhaderwah, Ramnagar, Samba, Ranbirsinghpora, Bashohli, 'Hiranagar and Nowshehra. Evidently in these cases also, the element of male immigrants from outside who are employed in various offices and institutions or who run small commercial establishments accounts for the inflated proportion of male population. At any rate, the sex ratio of some of these towns, such as Bashohli, Hiranagar, Nowshehra, Kishtwar, Samba, Ranbirsinghpora, ·cannot be regarded as abnormal, as the small disparity between the two sexes is acknowledged a biological phenomenon which holds good universal1y.
3.278 Ramnagar has been notorious for the high incidence of venereal diseases. Though on account of the availability of medical relief
309
at all times, the town itself has not suffered much from this fell disease, it is improbable that it .could have altogether escaped its scourge. Unlike the towns of Kashmir province, Bhaderwah and Kishtwar which experience heavy snowfalls necessitating the closure of educational institutions in winter, Ramnagar has a tropical climate and the schools avail of the vacations in summer instead of winter. The migrant population employed in these institutions, which consists, mostly of males, was, therefore. present in the town at the time of enumeration in February 1961 Another important reason for the low sex ratio of the town is that majority of the commercial establislunents and shops are owned and run by people belonging to Jammu, Udhampur and other places outside the town. Due to the difficult topography of the road glvmg access to the town and non-availability of suitable residential accommodation, most of these people leave behind their families at their ,native places.
3.279 The town of Bhaderwah is one of the few urban areas of Jammu province which abounds in fertile lands and is well-off' economically. Even though it is only a tehsil headquarter, it has all the semblance of a small city which abounds in small industrial and commercial establishments and Government and private offices. It is, therefore, that the town attracts a sizable number of male migrants from other parts of the district for employment in different activities. 'Another important reason for the imbalance of the male and female population is the migration to the town of communities which were uprooted' in their native places during and after 1947. Most of the migrants being males only, the sex ratio has declined during the two decades 1941-61.
3.280 Sopore has, more or less, the same lex ratio as Srinagar. Besides being a tehsil headquarter, it is known for production of handloom woollen cloth and country oil. I t is possible that these industries may have attracted male migrants from other areas. Further, the town has for quite some time been reputed for the
high incidence 0( venereal diseases. This may also have retarded the growth of female population.
3.281 The sex ratio of Arnia is not low and does not call for any comments. No explanation is, however, available for the disparity between the male and female population of Bishna, but it is presumed that this m ay be due to the rehabilitation of displaced families uprooted in the State territory on the other side of the Cease-fire Line. Bishna has been declared a town for the first time in 1961 and as it has absorbed a large number of displaced persons. it is not possible to make any assessment of the growth of its sex ratio from decade to decade.
3.282 Kulgam wall transferred from urban" to rural list after 1911 and continued to be borne on the same till 1961 when it was again declared an urban area. The town is both a tehsil headquarter and an important centre of" export trade of fruits, like apples, cherries and walnuts. Majority of the Government servants, shop-keepers and fruit exporters hail from other areas and are not accompanied by their families due to non-availability of acgommodation.
3.283 Natipora-Hyderpora has been declared a notified area for the first time in 1961. A lat~ number of dwellings in this town are owned or occupied on rent by people from outside the city who are not -accompanied by their families. Some of them run industrial and commercial establishments and others hold important assignments in the Government. This seems to be the sole ca~ for the inflation of male population of the town.
3.284 We may now take up administrative, residential and educational towns in which the sex ratio per l,OeO males is less than 850. These consist of 12 administrative and 7 residential towns but the latter may, for the. purpose of the present analysis, be sub-divided into residential and commercial towns as indicated below:-
Administrative towns
Four district headquarters, viz., Anantnag, Baramulla Doda and Jammu city.
310
Residential towns
Commercial towns
Si:a: tellsH headquarters, viz .• Sumbal, Uri, Ramban. "Reasi, Akhnoor and Rajouri.
Two Cantonments, viz.) Badamibagh Cantonment and Jammu Cantonment.
Pahalgam, Gulmarg, Katra and Hajin.
Batote, Banihal and Lakhenpore.
3.285 Reasons already given in the preceding paragraph for the disparity between the male and female popUlation of district headquarter' towns hold equally true in the case of the city of Jammu and the towns of Anantnag, :&Lramulla and Doda. Jammu city is not only a district headquarter but also the capital of State Government during winter months. 'As the census was taken in the morith of F,:,bruary, the population of the city included, among others, a large number of State officials serving in the Secretariat and administrative departments which move with the Government from Srinagar to Jammu. Majority of these had" left their families at their native places owing to the non-availability of residential accommoda.tiQ~_in
Jammu. Further, "the budget session of the State Legislature was also convened in the month of February when the enumeration of the popUlation was in progress. With a few exceptions, no legislator W<iS accompanied by his family. Besides these migrants, ordinary labourers from Kashmir were also present in the city in large numbers at the time of enumeration. This naturally inflated the male popUlation and reduced the corresponding proportion of females.
3.286 The sex ratios of Anantriag and Baramulla towns are comparatively, higher <is
most of the factors which resulted in the inflation of the male population of Jammu did not operate at these places. Even as it is, the two towns were inhabited, among others, by a large" number" of Government officials serving in district and teh~j] . offices of various "administrative departments. As has been explained in the
next paragraph, the position of residential accommodation in the two towns is very acute and very few dwellings are available for residential purposes. The position obtaining in Doda is still more acute. The town is situated on a small piateau at the top of a steep hill and is connected to the main road by a difficult footpath which can be negotiated with great difficulty even by pedestrians. Very few officials serving in the district and tehsil offices located in the town, therefore, get their families along with them.
3.287 These reasons also apply to the 6 tehsil headquarter towns mentioned above. Sumba! has been declared a, town on the eve of the Oensus of 1961 when a net-work of tehsil offices of different departments was set up at this place. The town is very near the city of Srinagar and buses keep on operating several times during the day. Government servants do not, therefore, get their families along with them as they can visit them at shott notice when necessary. Besides, suitable accommodation is not yet available in the town to accommodate the families of Government officials.
3.288 The town of Uri is very near the Cease-fire Line. Before 1947, it was an impor. tant commercial centre as passengers entering into or leaving the State invariably halted here while on their way from Rawalpindi to Srinagar and vice versa. A large number of shops and small commercial establishments had, therefore, been 'established at this place which have since disappeared. New shops and restaurants have now heen set up and most of these are manned by outsiders who do not get their families along with them due to non-availability of accommodation. Except for a few permanent inhabitants, mo:rt of the population in the town consists of Government servants or shop-keepers. Th'! town has been built on the slope. of a hill where construction of new houses is difficult.
3.289 The town of Ramban, which is situated on the National Highway connecting jammu with Srinagar, is important both as an administrative and a commercial town. Being equidistant
311
from the two cities, the tourists and other passengers usually halt here for lunch, tea and even for night break. This attracts entrepreneurs who set up stalls and shops all along the strip of the National Highway passing through the town. Like many other; .. urban areas, Ramban is also situated on the slope of a hill and construction of new houses to accommodate families is not an easy proposition due to non-availability of building space and skilled labour etc. Accordingly, neither the Government servants employed in various tehsil offices nor the shop and stall owners are accompanied by their families which has the inevitable effect of reducing the sex ratio.
'3.290 The town of Reasi is situated on the plateau of a hillock about 18 miles away from Katra. It is accessible by a difficult motorable road, parts of which sometimes get submerged under water. Besides the high incidence of Government' officials serving in different tehsil offices stationed at Reasi who do not get their families with them due to non-availability of residential accommodation, the excess of males over females appears to be due to biological processes which operate all over the world.
3.291 Akhnoor and -Rajouri are both si~ated' on jammu-Nowshehra-Poonch road. Besides being tehsil headquarters, the towns have grown in importance on account of the army installation statibned at these places. The number of business concerns of varying Sizes, which cater both to the 'civilian and the army population is, therefore, steadily increasing. Like Reas:i, the town of Rajouri has been built on a plateau where limited building space is available for new constructions. The existing accommodation is also inadequate and Government servants and shop-keepers generally avoid getting their families to the town. Akhnoor_ is at a distance of 20 miles only from jamnlU city and Government officials do not find it necessary to get their families with them as they can conveniently spend the week-ends at their homes.
3.292 The population of the two Cantonments includes a larger proportion of males tban that
of females. This is because the non,combatants and ordnance workers do not generally get their families with them.
3.293 Pahalgam, Gulmarg and Katra are famous tourist resorts._ At the time of census, however, both Pahalgam and Gulmarg were deserted by the visitors and the population consisted of a few local inhabitants and chowkidars who look after tourist huts, hotels and Government offices etc. The yatra season to Vaishno Devi was still in progress in February 1961 when the census was taken. Migrants from different parts of the State engaged in the sale of different commodities were, therefore, present in the town. Majority of these being males only, the proportion of female population has been low when compared with males.
3.294 Hajin is a new town. The only reason which could possibly account for the disparity in the proportion of the two sexes is the biological phenomenon of excess of males over females, though even as it is, the proportion of females should have been higher.
3.295 The towns of Batote, Banihal and Lakhenpore are situated on the National Highway. With the diversion of the trade route of the State to Srinagar-Jammu-Pathankot road, the towns have become important commercial centres. ,Besides petty establishments of consumer goods, restaurants, Dak Bungalows, Rest Howses and tea shops are found in large numbers at each of these places. The permanent population of Banihal is comparatively small and is dispersed on the slope of a hill. An over-whelming majority of those living in that part of the town through which the .National Highway passes consists of owners, proprietors, managers, salesmen and atttendants of these shops. As in Ramban, only limited space is available for construction of houses to accommodate families. Further, the town being situated on the foot of Pir Panjal ranges, experiences heavy snow-falls and severe cold in winter. Very few people, therefore, favour the idea of living with their families at Banihal in winter.
312
3.296 The town of Lakhenpore is mostly inhabited by employees of Excise and Octroi, Education, Police and other Government Departments as also by owners of tea shops and fruit sellers. Being very near the inter-State border, the officials do not bring their families with them more so because there is no J'esidential accommodation available at this place.
(b) Manufacturing and Iud •• trial Towns
3.297 We next come t<:, manufacturing towns. As indicated earlier, two of these, viz., Shupiyan and Ajas, have sex ratios varying from 851 to 950 per 1,000 males. Shupiyan is an important export centre of fruits and headquarter of forest lessees who take leases in the adjoining forests. The town is situated very' near the Pir Panjal ranges and experiences hc;!avy snowfalls in winter. The low proportion, of females is partly due to natural causes an4~ to some e,rtent, attributable to the high incidence of males engaged in export trade and felling and export of forest timber.
3.298 Ajas was declared a town only a few months before the census was taken. Even so, it has a better - sex ratio than many otherurban areas of the State.
3.299 The other two towns with a sex ratio of less than 850 females are Bijbehara and Pampore which are both situated on the National Highway. Bijbehara is famous for fine wood work and the predominance of its male population appears to be due, among other reasons, to the concentration of people running commercial shops or engaged as apprentices and artisantl. Majority of these hail from other parts of the district and usually leave behind their families at their homes.
3.300 The town of Pampore is at a distance of 8 miles from Srinagar. Government servants stationed in the town do not, therefore, get their families with them and usually spend weekends at their homes.
(c) Mining ToWDs
3.301 This brings us to the last category oC urban areas, namely, mining towns. There are
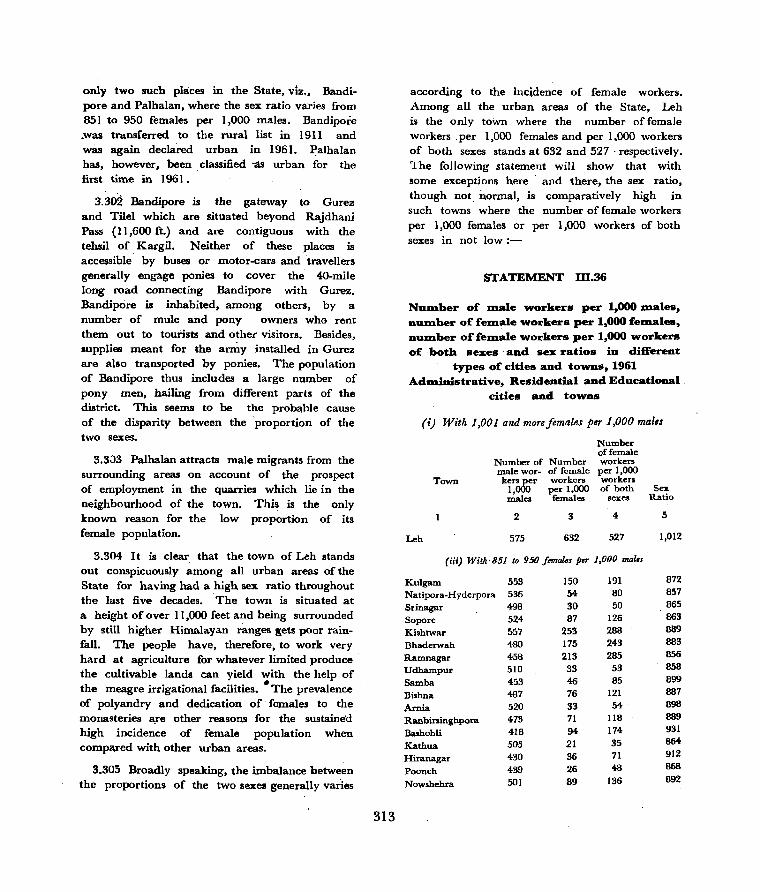
only two such places in the State, viz., Bandipore and Palhalan, where the sex ratio varies from 851 to 950 females per 1,000 males. Bandipore .was transferred to the rural list in 1911 and was again decla·red urban in 1961. Palhalan has, however, been classified ·as urban for the first time in 1961.
3.302 Bandipore is the gateway to Gurez and Tilel which are situated beyond Rajdhani Pass (11,600 ft.) and are contiguous with the tehsil of. Kargil. Neither of these places is accessible by buses or motor-cars and travellers generally engage ponies to cover the 40-mile long road connecting Bandipore with Gurez. Bandipore is inhabited, among others, by a number of mule and pony owners who rent them out to tourists and other visitors. Besides, lupplies meant for the arniy installed in Gurez are also transported by ponies. The population of Bandipore thus includes a large number of pony men, hailing from different parts of the district. This seems to be the probable cause of the disparity between the ·proportion of the two sexes.
3.3;)3 Palhalan attracts male migrants from the surrounding areas on account of the prospect of employment in the quarries which lie in the neighbourhood of the town. This is the only known reason for the low proportion of its female population.
3.304 It is clear that the town of Leh stands out conspicuously among all urban areas of the State for having had a high sex ratio throughout the last five decades. The town is situated at a height of over 11 ,000 feet and being surrounded by still higher Himalayan ranges gets poor rainfall. The people have, therefore, to work very hard at agriculture for whatever limited produce . the cultivable lands can yield with the help of the meagre irrigational facilities. • The prevalence of polyandry and dedication of females to the monasteries a.re other reasons for the sustained high incidence of female population when compared with other urban areas.
3.305 Broadly speaking, the imbalance between the proportions of the two sexel generally vades
313
according to the incidence of female workers. Among all the urban areas of the State, Leh is the only town where the number of female workers . per 1,000 females and per 1.000 workers of both sexes stands at 632 and 527 . respectively. The following statement will show that with some exceptions here and there, the sex ratio, though not. normal, is comparatively high in such towns where the number of female workers per 1,000 females or per 1,000 workers of both sexes in not low:-
STATEMENT 10.36
NUlnber of DJ.ale workers per 1,000 Inales, nUD1ber of feDJ.a1e workers per 1,000 feJDaletl, nUlDber of feDJ.a1e workers per 1,000 workers of both sexes· and sex ratios in different
types of cities and tOWDS, 1961 AdDlinistrative, Residential and Educational
cities and tOWDS
(i) With 1,001 and more females p" 1,000 mallS
Town
Leh
Number of Number male wor- of female ker. per workers
1,000 per 1,000 males females
2 3
575 632
Number of female workers per 1,000 workers of both
sexes
4
527
(iii) With 851 to 950 fornal.s p.r 1,000 mal ..
Kulgam 553 150 191
Natipora-Hyderpora 536 54 80
Srinagar 498 30 50
Sopore 524 87 126
Kishtwar 557 253 288
Bhaderwah 480 175 243
Ramnagar 458 213 285
Udhampur 510 33 53
Samba 453 46 85
Bishna 487 76 121
Arnia 520 33 54·
Ranbirsinghpom 473 71 118
Bashohli 418 94 174
Kathua 505 21 35
Hiranagar 430 36 71
Poonch 439 26 48
Nowshehra 501 89 136
Sell. Ratio
5
1,012
872 857 865 863 889 883 856 858 899 887 898 889 931 864-912 B68
892
Town
STATEMENT DL36-Concld.
Number of Number male wor- of female kers per workers
1,000 per 1,000 males females
2
Number of female workers per 1,000 workers of both
sexes
4
(io) With 18ss than 850 females per. 1,000 malts
Anantnag 526 95 131 Pahalgam 657 564 392 Badamibagh Cantonment 518 3 5 Baramulla 525 52 77 Gulmarg 956 130 17 Sumbal 655 408 341 Hajin 680 330 288 Uri 701 28 27 Banihal 607 222 191 Ramban 599 55 59 Batote 568 22 26 Dada 485 118 159 Katra 513 51 75 Reasi 515 58 86 Jammu city 503 33 49 Jammu Cantonment 514 21 33 Akhnoor 478 37 61 Lakhenpore 472 26 29 Rajouri 494 36 55
Manufacturing and Industrial t6wns. . (iii) With 851 tD 950 females prr 1,000 maks
Shupiyan 543 157 199 Ajas 620 489 406
(i~) With llsf tha" 850 females 1m 1,000 maus
Bijbebara 503 117 162 Pampore 560 59 82
Mining ToUl~
(iii) With 851 to 950 females per 1,000 males
Sex Ratio
5
832 752
772 8M 126 831 834 690 64-5 680 702 779 825 82B 784-849 842 524 806
860 867
B2B 849
Bandipore 535 253 292 871 Palhalan 604 24 33 B54-
3.306 According to this statement, Pahalgam, !Janihal, Ramban, Batote, Doda, Jammu city and Lakhenpore are the only towns where the ratios are fairly low despite the fact that the incidence of female workers is, when compared with other urban areas, very much pronounced. Pahalgam, -as already stated, is a tourist resort and many of ,its buildings are looked after by male chowkidars only during the winter months when the census is taken. In the circumstances,
314
the inflation of male population has an inevitable effect of the principal charact~ristics of the town. Banihal, Ramban and Batote are situated on the National Highway and are inhabited mostly by shop-keepers, hoteliers and Government officials who do not usually get' their families with them on account of severe cold experienced in winter and frequent suspension of communications caused by landslips. Jammu city has witnessed mass movement of population in the wake of the tribal raids of 1947 and many displaced people from the State territory on the other side of the Cease~fire Li.ne, West Pakistan and Punjab etc. have settled here. Lakhenpore has recently been urbanised and being situated on the border of the State with very little residential accommodation is mostly inhabited by males,
3.307 It would have been perhaps of advantage to compare the proportions of fe~ale workers in previous censuses with the respective sex ratios, but this, is not possible, .' partly due to the non-availability of figures of urban workers and partly because the definition of ,the worker, as adopted in 1961, is not exllctly the same as applied in the past •
EJfect of Housiag Scarcity on Sex Ratio in Cities.
3.308 Let us now examine whether housing scarcity or congestion has any bearing on the sex ratio. Subsidiary Housing Table E-V.l, which would be of help for this purpose, however, gives the distribution of households by number of rooms occupied in case of cities and towns with a population of 50,000 and over only and not in respect of urban areas with lesser population. At any rate, the Subsidiary table reproduced below will show that majority ttf the households in Jammu city reside in dwellings with one room only and that over 80,},o households are squeezed in dwellings which are provided with a maximum accommodation of two rooms. The position obtaining in Srinagar is, however, comparatively much better. In this case, the number of housebolds occupying not more than one room is

ess than 9% and of those in posl;lession of accommodation not exceeding two rooms is about 29%. Obviously, the disparity in the sex ratios of the two cities is among other rea!!lOns also due to the limited accommodation available in Jammu.
STATEMENT 01.37
DistribudoD or 1,000 census households according to DUDlber or rOODlS
occupied in cities
Five Name of city Sex No One Two Three Four rooms
ratio regular room rooms rooms rOOms and rooIn. more
2 3 4 5 6 7 8
Srinagar city 865 11 77 198 211 171 332 Jammu ciiy 784 20 569 225 95 49 42
3.309 According to Subsidiary Table E-V.2, the average size of a ho'usehold and the average
number of persons per room in Srinagar city stand at 6.94 and 1.72 persons respectively. Broadly speaking, therefore, the number of rooms in the occupation of a household consisting of 7 persons approximately is not less than 4. The corresponding averages for Jammu, however, stand at 5.55 and 3.08 persons respectively. In this case, the accommodation available to an average household of about 6 persons is 2 rooms only.
3.310 The following statement gives the classification of households by the number of rooms occupied. From this, it will be seen that the number of persons and of males and females in households occupying dwellings with varying sizes of accommodation is larger in all catego~ies in Jammu than the corresponding proportions in Srinagar.
STATEMENT 111.38
NUDlber of persoDs, Dlales and feDlales per rOODl aDd persoDs per household in each category of household in cities
Tofal 1 Room 2 Rooms 3 Rooms r---..A...-~ ,.--------"------....... r------ - J _______ _...... ....-----_.........:._--. _ _,._-,
No. of N().of Persons Males Females Average Persons Males Females Average Persons Males Females Average Name of persons persons No. of No. of No. of
city per per persons persons persollll room house· per per per
hold house· house- house-hold hold hold
2 3 4 5 6 7 8 9 10 11 12 13 14 15
Srinagar 1.72 6.94 4.40 2.46 1.94 4.40 2.76 1.47 1.29 5.51 2.07 1.09 0.98 6.21 city
Jammu 3.08 5.55 4.71 2.60 2.11 4.71 2.98 1.59 1.39 5.97 2.26 1.20 1.06 6.79 city
4 Rooms 5 Rooms and above Name of city
.-____ --; ___ A _ _;_ _________ ---" ,--_________ -A... _____________ .....
Persons ~1ale. F"males Average Persons Males . Females Average
Sri nagar city
Jammu city
Six Ratio by Age
16
1.74
1.88
3.311 We may now make use given in Table B-Il to examine tion of sex ratio in different different types of cities and towns.
17
0.92
('.99
of the data the composi
age-groups in The following
18
0.82
0.89
315
No. of No. of persons persons
per per household household
1.9 20 21 22 23
6.96 1.33 0.71 0.62 8.85
7.53 1.49 0.80 0.69 9.47
statement gives the number of females per 1,000
males by four broad age-groups' in each of the 'towns of the State according to their classi
fication as administrative/residential, manufac
turing/industrial or mining towns:-
STATEMENT 111.39
Sex Ratio (feD1ales per 1,000 Olales) in towns of JalnlnD aDd Kash:mir State
by broad age-groups, 1961 Age-group
r-------A------~ Name of Town
1 Total
2
0-14 15-34 35-59 60 + 3 4 5 6
A Anantnag Pahalgam Kulgam
832 752 872
Srinagar city 865 Badamibagh Cantonment 772 Natipora-Hyderpora 857 Gulmarg 126 Baramulla Sopore Sumbal Hajin Uri Leh Banihal Ramban Batote Dada Kishtwar Bbaderwah Ramnagar Udhampur Rcasi
Katra
834 863 831 834 690
1,012 645 680 702 779 889 883 856 858 828 825
Jammu city 784 Jammu Cantonment 849 Samba 899 Bishna Arnia
887 898
962 821 902 937
955 929 923 931 938 959 911
1,243 1,003
889 976 861 795 977 864 931 959 867 782 917 .
902 890 841 902
Ranbirsinghpora 889 888 Akhnoor .842 944 Baohohli 931 940 Kathua 864 924 Lakhenpore 524 717 Hiranagar 912 878 Pooneh 868 943 Rajauri 806 910 Nowshehra 892 993
B Bijbehara 828 957
Shupiyan 860 946 Pampore 849 896
Ajas 867 953
C Bandipore 871 895 Palhalan 854 921
Not.:-
823 816
1,021 885
692 861 99
839 908 806 866 5+9
1,068 589 556 664 840 901 986 815 908 874 963 727
909 933 998 894 952 766 943 955 509 966 909 789 927
890 922 894 914
929 939
683 605 641 720
583 741 38
680 706 719
721 306
1,012 415 446 502 694 808 815 753 618 701 745 669 587 904 774 943
695 558 628 712
675 414
698 634 632 439 583 779 429 515 725 424 484 652
1,000 701 798 774 736 875 792 947 795
824 807 784 842 865 1,057 663 744-233 1,000 882 835 698 643 618 773 639 !'l84
600 515 623 699 706 730 710 574-
745 812 650 636
A=Administrative. residential and educational towns. B=Manufacturing and industrial towns. C= Mining towns.
316
3.312 The statement shows that category' A', viz., Administrative, residential and educational towns include, among others, the towns of Pahalgam, Badamibagh Cantonment, Gulmarg, Uri, Banihal, Ramban, Batote, Doda, Jammu city and Lakhenpore in which the number of females per 1,000 males is less than 800. There is no such town either in category 'B', viz., Manufacturing and industrial towns or in category 'C', viz., Mining towns.
3.313 The sex ratio by age-groups of Pahalgam shows that the number of females in tl;le group 35-59 is very small as against 1,000 males of the .,same age and stands at 605 only. Similarly, the number of females above the age of 60does not exceed 558 per 1,000 ~les. GulmaI;g stands out more prominently for the very low'· sex ratios in th~ age-groups 35-59 al!-d 60 and over, the number- of females per 1,,000 males being 38 and zero respectively. Even the proportion of females in the age-group 1'5-34 which stands at 99 per 1,000 males is also fairly small. It has already been stated that both Pahalgam and Gulmarg are touriSt resorts which are, among others, inhabited in winter by male chowkidars and house-keepers only. Another cogent reason for the low proportion of females in these age-groups appears to be the severe-cold' and heavy snow-falls which both Pahalgam and Gulmarg experience owing to their location at high altitudes. It is possible that middle and advance aged women avoid living at these places in winter and migrate to the nei!;hbouring low level areas.
3.314 The main reason for the low proportion of females in Badamibagh Cantonment is the smaller female population of the age of 15 and FIobove as compared to males. The population figures of civilians and non-combatants of the. army who live in the Cantonment are not separately available, but it is likely that the smaller proportions of females in these agegroups are attributable to the non-combatants who are not allowed to get their families to the Cantonment.
3.315 The town of Uri is situated very near the Cease-fire Line and migrants, such as
Government servants or others, engaged in business do not usually get their families" to the town. This is why the sex ratios in all the age-groups except 0.14 are fairly small. No explanation is; however, available for the high proportion of females below the age of 15 years. A Government Primary School has, no doubt, been set up in the t~wn, but as all educational institutions remain closed in the" month of February when the census is taken, it is improbable that the excess of females in this age-group could be due to the inclusion of females from surrounding areas who attend schools in Uri town.
3.316 Banihal, Ramban and Batote are situated on the Patbankot-:Jammu-Srinagar National Highway. In all the three towns sex ratios are nearly nonnal in the age-group 0-14, but very low in all other age-groups. The excess of males is, as already explained, partly due to the uncongenial climatic conditions obtaining in winter and partly to the availability of limited residential accommodation. All the three towns have been built on the slopes of hills and the meagre building space nearabout the Nationat Highway is already occupied by hotels, restaurants, tea shops and Government offices.
3.317 Doda has been declared a district headquarter during the inter-census period and a number of district and tehsil offices have of late sprung up at this place. Since, however, the town is situated on the plateau of a hill and is accessible by a difficult footpath only, Government servants very rarely get their families to the town. In this case, the disparity
317
in the population of the two sexes is more conspicuous in the age-group 0-14 and 35 .and above.
3.318 "Reasons for the low sex ratio of Jammu city have already been set out at some length in a previous paragraph. The above statement however, shows that the disparity is particularl; reflected in all the age-groups except 0-14.
3.319 Lakhenpore has a small population which consists mostly of male persons employed in Gover-nment offices and institutions or running tea shops, restaurants etc. or engaged as fruit vendors.
3.320 Broadly speaking, in most of the urban areas the -female population in the age-groups 35-59 and 60 and above is generally less than the male population in these two age-groups. This is due to several reasons which co-operate to restrict the female growth beyond the age of 35 years. Apart from the reasons given in the preceding paragraph which apply to towns having special characteristics, such as predominance of educational activities or purely administrative character of the urban areas, the principal reason for the deficiency of female population in these age-groupll in other towns is the frail and anaemic physical constitution of females which reduces their span of life. The high incidence of female nen-workers in almost every urban area of the State indicates that most "of the middle and advance aged females must be amenable to various diseases.
3.321 The following statement shows the number of females per 1,000 males by broad age-groups in towns of different types:.
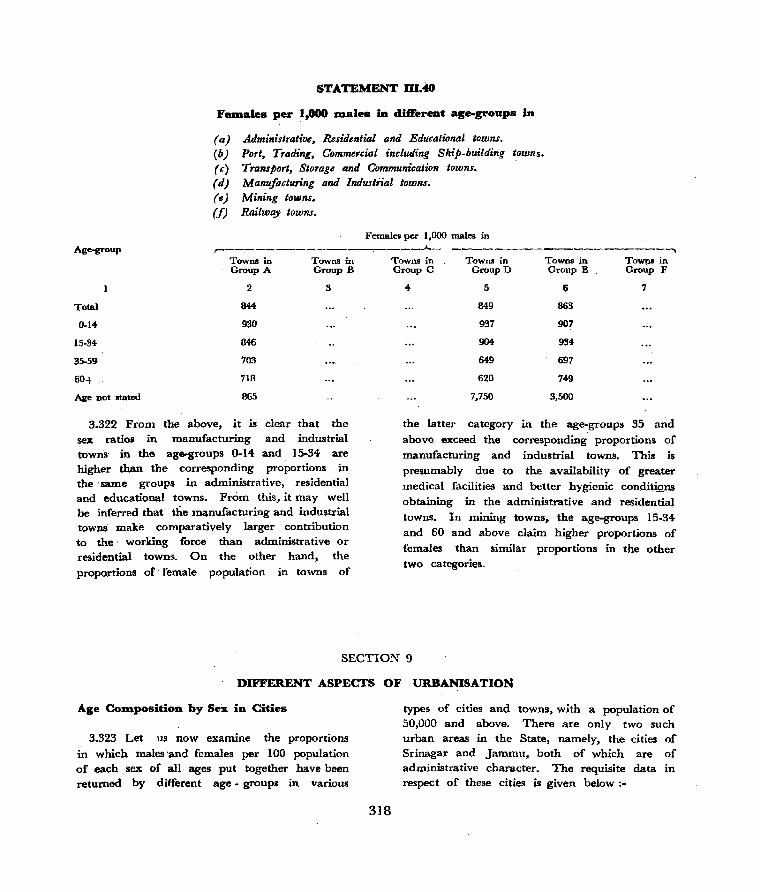
STATEMENT nl.40
F_ales per 1,000 males iD different age-groups iD
(a) Administrative, Residential and Educational towns. (6) Port, Trading, Commerciol including Ship-building towns. (c) Transport, Storage and Communication towns. {d} Manufacturing and Industrial towns. (e) Mining towns. (f) Railway towns.
Females per 1,000 males in
Age-group ,..----------------. ----,.j...._ --------------------~ Towns in Towns in Towns in Towns in Towns in Towpl in Group A Group B Group C GroupD Group E Group F
Total
0-14-
15-34-
35-59
60-+
Age not .tated
2
844
930
846
703
71B
865
3
3.322 From the above, it is clear that the sex ratios in manufacturing and industrial towns in the age-groups 0-14 and 15-34 are higher than the corresponding proportions in the ·same groups in administrative, residential and educational towns. From this, it may well be inferred that the manufacturing and industrial townS make ·comparatively larger contribution to the· working force than administrative or residential towns. On the other hand, the proportions of· female population in towns of
4 5 6 7
849 863
937 907
904 934
649 697
620 749
7,750 3,500
the latter category in the age-groups 35 arid
above exceed the corresponding proportions of manufacturing and industrial towns. This is presumably due to the availability of greater
medical facilities and better hygienic conditi9..IlS obtaining in the administrative and residential towns. In mining towns. the age-groups 15-34 and 60 and above claim higher proportions of females than similar proportions in the other two categories.
SECTION 9
DIFFERENT ASPECTS OF URBANISATION
Age ColUposition by Sex in Cities
3.323 Let us now examine the proportions in which males'and females per 100 population of each sex of all ages put together have been returned by different age - groups in various
318
types of cities and towns, with a population of .50,000 and above. There are only two such urban areas in the State, namely, the cities of Srinagar and Jammu, both of which are of administrative character. The requisite data in respect of these cities is given below:-

$TATEMENT 111.41
Age cOll1position of males and Cell1ales
expressed as percentage of male and Cell1ale
population respectively
(All ages together for each S~:II being 100)
in aubniaistrative type of cities
~d towns of populadou 50,000
Age-group
Total
Q..14
15-34
35-59
60 and over
and above
No. of each sex in each age-group expressed as percent of total of
all ages for each sex in cities and towns of administrative
character
Males Females
2 3
100 100
40 45
35 34
21 18
4- 3
Age not stated N N
Nou :-N = Negligible
3.324 According to this statement, females
in the age-group 0-14 claim a higher proportion than males of the same age. The disparity is, however, set off in higher age-groups in
which the female population progressively declines
when compar.ed with that of the. males. The cumulative effect of this steady decrease is that
while 56% male population falls in the agegroup IS-59, only 52% females belong to this
age.' The following statement has been prepared
to determine more approximately the age at which the decline in the female population
begins :-
319
STATEMENT 111.42
NUlI1ber of each sex in each age-group
exPressed as percent oC total of all ag.s
for each sex in Srioagar and Jall1l11u
cities, 1961
Age-group Males Females
2 S
0-4- 12.7 14.0
5-9 15.3 17.0
IQ..I4- 12.3 13.6
15-19 10.1 9.8
20-24- 9.0 8.7 25-29 8.2 8.6 30-34 7.2 7.1
35-39 6.1 5.6
40-44 5.6 4.7
45-49 4.0 3.3 5Q..54 3.7 2.9
55-59 2.0 1.4-60-64 2.0 1.7
65-69 0.7 0.5 70+ 1.0 1.0 Age not stated 0.1 0.1
Total IQO.O 100.0
3.325 It is clear that girls below the age of 14 years claim higher proportion than boys of
the same age. Further, after the age of 9 years the proportion of females steadily declines
and not only is the disparity wiped out, but the male population in various higher age-groups
claims greater proportions than those of the females. This can be due to many . reasons,
one among these being the incidence of larger number of deaths among teenaged girls.
3.326 We may now examine the data relating to each of the two cities separately, The
following statement indicates the percentage of population of each sex in each age-group:-
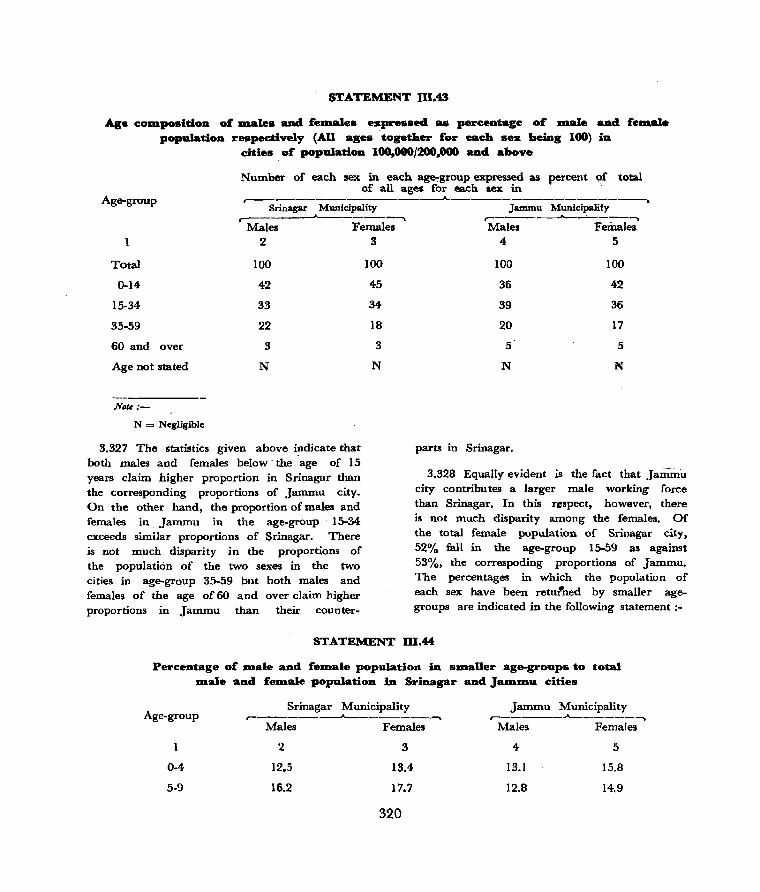
STATEMENT nus Age cOD1position of D1ales and CeDJ.ales expressed. as percentage oC D1a1e and feD1a1.
popnla"tion respecdvely (All ages together for each sez lldog 100) in cities of population 100,000/200,000 and above
Number of each sex in each ag~group expressed as percent 9f total of all ages for each aex in
Age-group ...-_________________ ..A. ______________ ........ ___ -,
Srinagar Municipality Jammu Municipality r-----__.j._---------.. r-------.Jo...-~----_...
Males Females Males Females, 1 2 3 4 5
Total
0-14
15-34
35-59
60 and over
Age not stated
Nl1te :-
N = Negligible
100
42
33
22
3
N
3.327 The statistics given above indicate that both males and females below -the -age of 15 years claim higher proportion in Srinagar than the corresponding proportions of Jammu city. On the other hand, the proportion of males and females in _ Jammu in the age-group 15-34 exceeds similar proportions of Srinagar. There is not much disparity in the proportions of the population of the two sexes in the two cities in age-group 35-59 but both males and females of the age of 60 and over claim higher proportions in Jammu than their counter-
100
45
34
18
3
N
100 100
36 42
39 36
20 17
5 5
N N
parts in Srinagar.
3.328 Equally evident is the fact that Jammu city contributes a larger male working force than Srinagar. In this respect, however, there is not much disparity among the females. Of the total female population of Srinagar city. 52% fall in the age-group 15-59 as against 53%, the correspoding proportions of Jammu. The percentages in which the population of each sex have been retulned by smaller agegroups are indicated in the following statemeni:-
STATEMENT 01.44
Percentage of IDale and felDale population in sJDaller age-groups to total lDale aDd felDale population in Srinagar aDd JalDlDu eities
Age-group Srinagar Municipality
r-------__........----------'\ Jammu Municipality
r-------...A.------~ Males Females Males Females
2 3 4 5
0-4 12.5 13.4 13.1 15.8
5-9 16.2 17.7 12.8 14.9
320
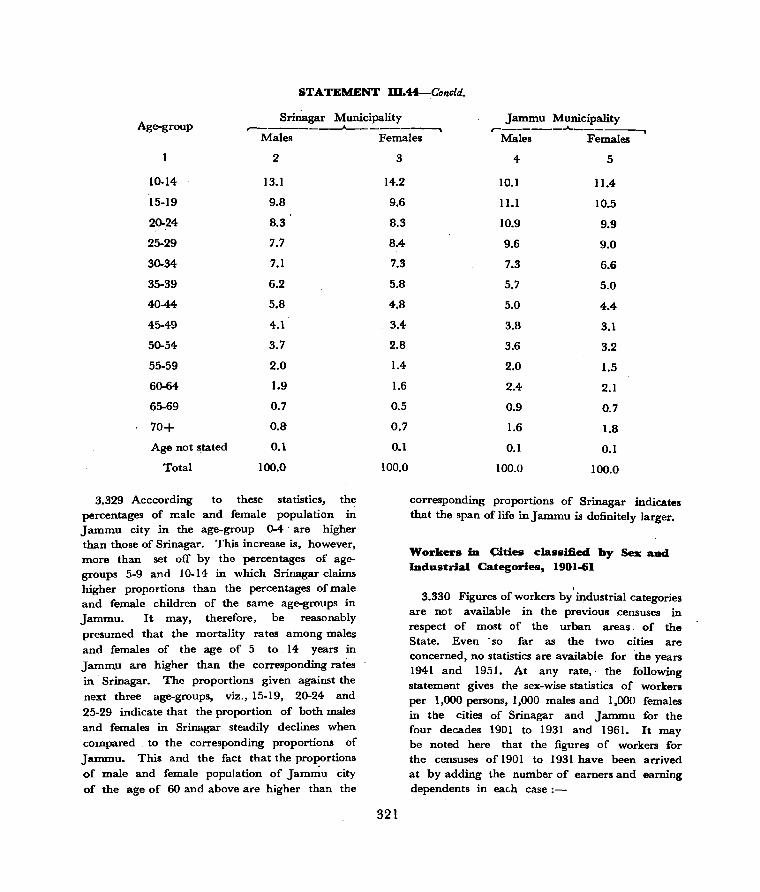
STATEMENT ID.44-CMcld.
Sri~gar Municipality Jammu Municipality Age-group ,--_______ ..A-______ --,
r--------"'-------, Males Females Males Females
2
10-14 13.1
15-19 9.8
20-24 8.3
25-29 7.7
30-34 7.1
35-39 6.2
40-44 5.8
45-49 4.1
50-54 3.7
55-59 2.0
60-64 1.9
65-69 0.7
70+ O.S
Age not stated 0.1
Total 100.0
3.329 Acccording to these statistics, the percentages of rr.ale and female population in Jammu city in the age-group 0-4 are higher than those of Srinagar. This increase is, however, more than set off by the percentages of agegroups 5-9 and 10-14 in which Srinagar claims higher proportions than the percentages of male and female children of the same age-groups in Jammu. It may, therefore, be reasonably
presumed that the mortality rates among males and females of the age of 5 to 14 years in
Jamm.u are higher than the corresponding rates in . Srinagar. The proportions given against the
next three age-groups, viz., 15-19, 20-24 and
25-29 indicate that the proportion of both males
and females in Srinagar steadily declines when compared to the corresponding proportions of Jammu. This and the fact that the proportions
of male and female population of Jam~u city of the age of 60 and above are higher than the
3
14.2
9.6
8.3
8.4
7.3
5.8
4.8
3.4
2.8
1.4
1.6
0.5
0.7
0.1
100.0
321
4 5
10.1 11.4
11.1 10.5
10.9 9.9
9.6 9.0
7.3 6.6
5.7 5.0
5.0 4.4
3.8 3.1
3.6 3.2
2.0 1.5
2.4 2.1
0.9 0.7
1.6 1.8
0.1 0.1
100.0 100.0
corresponding proportions of Srinagar indicates that the span of life in Jammu is definitely larger.
Workers in c:::ities elassified by Sex and Industrial Categories, 1901-61
3.330 Figures of workers by industrial categories are not available in the previous .censuses in respect of most of the urban areas of the State. Even' so far as the two cities are concerned, no statistics are available for ·the years 1941 and 1951. At any rate,· the following statement gives the sex-wise statistics of workers per 1,000 persons, 1,000 males and 1,000 females in the cities of Srinagar and Jammu for the four decades 1901 to 1931 and 1961. It may be noted here that the figures of workers for the censuses of 1901 to 1931 have been arrived at by adding the number of earners and earning dependents in eac.h case:-

STATEMENT nU5
N1III1ber per 1,000 o£ total workers, snales per 1,000 o£ total _Ie workers, £_ales per 1,000 o£ total £esnale workers :iu. the Pine Industrial Categories o£ 1961 cosnpared to their respective
proportions :iu. previous censuses (1901-61) £or cities o£ popUlation 100,000 and above
Name of city Census Number per 1,000 of total workers, males per 1,000 of total male workers, females in descending year per 1,000 female workers in the nine Industrial Categories of 1961
order of population ------------------------------------I 11 111 IV & V
r------"-----... r----_.......t..---~ ,.-----~---....._ , ___ Jo.. ___ -"'"\
P M F P M F P M F P M F 2 3 4 5 6 7 8 9 10 11 12 13 - 14-
Srinagar City 1961 37 32 124- 4 4 14- 12 11 18 324 323 332,
1951J 1941 Not available
1931 27 26 52 45 39 149 431 427 485 1921 24 27 10 23 24 18 445 396 716 1911 41 30 101 9 6 26 11 12 4 473 476 457 1901 32 35 25 31 34- 20 575 471 859
Jammu City 1961 6 6 6 6 II 124 127 74-
1951 J 1941 Not available
1931 21 29 2 2 6 7 2 133 174 41 1921 10 10 6 3 4 103 106 70 1911 59 60 56 2 '4 4 239 239 235 1901 56 59 17 2 12 7 69 150 139· . ·278
Number per 1,000 of total workers, males per 1,000 of total male workers, females Name of city per , I ,000 female workers in the nine Industrial Categories of 1961 Censlls in descending
.----------------------------:--------------_ .. - year order of population VI VII VIII IX
,-----'----~ r----...A------. ,.----"""'------.. r---..A------., p M F P M F P M F P M F
15 16 17 18 19 20 21 22 23 24 25 26 2 16 17 2 109 113 36 69 64 174 429 436 300 1961 Srinagar City
.1\(ot available 1951J 1941
3 3 68 70 25 45 46 38 381 389 251 1931 13 15 175 196 60 56 51 81 264 291 115 1921 33 37 12 123 119 141 77 61 167 233 259 92 1911 5 7 86 114 10 52 59 34 219 280 52 1901
47 49 3 158 165 14 73 76 585 570 897 1961 Jammu City
Not available 1951J 1941
28 38 4 109 155 5 20 30 681 565 947 1931 11 12 104 112 14 17 18 I 752 738 909 1921 2 3 109 120 44 30 34 1 556 539 661 1911
22 24 105 109 45 14 16 641 646 588 ISOl
322
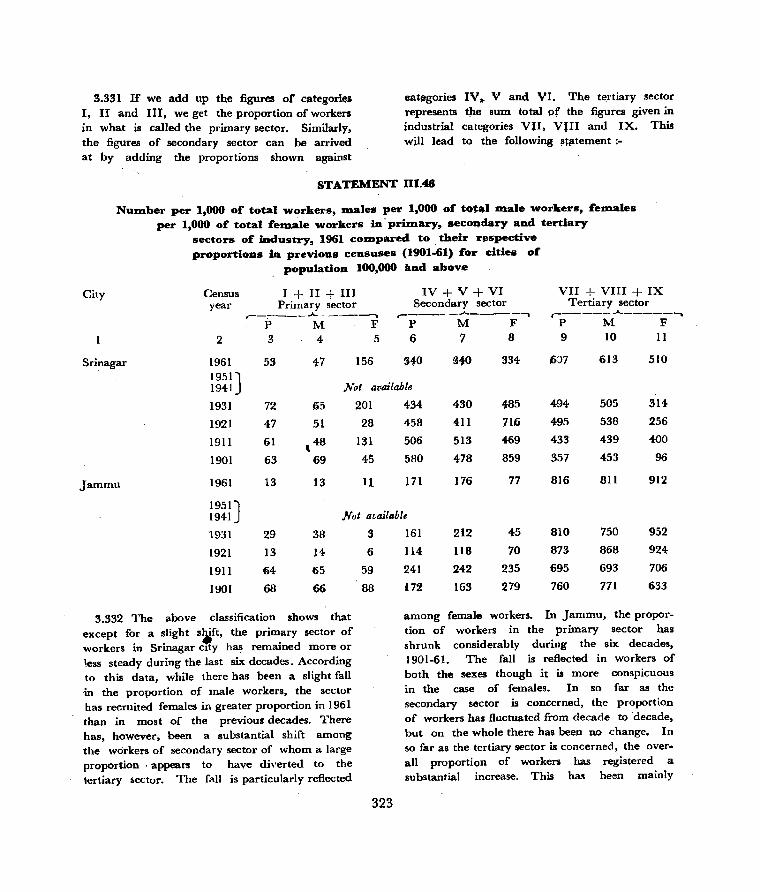
3.331 If we add up the figures of categories I, II and III, we get the proportion of workers in what is called the primary sector. Similarly, the figures of secondary sector can be arrived at by adding the proportions shown against
categories IV.. V and VI. The tertiary sector represents t):le Bum total pf the figures given in industrial categories VU, VJII and IX. This will lead to the following !!tlltement:-
STATEMENT lll.46
NUD1ber per 1,000 of total workers, D1ales per 1,000 of to*_1 D1ale workers, feD1ales per 1,000 of total felDa:le workers in' prilDary, secoQdlJry aDd tertiary
sectors of industry, 1961 cOlDpared to . their r~spective proportioDS in previous censuses (1901-61) for cities of
populatioD 100,000 and above
Census I + II + III IV + V + VI VII + VIII + IX year Primary sector Secondary sector Tertiary sector
r--:---__ ..A... - -------. "..-_____ ...A.. ____ -,
~_---. -A... _____ ......
P M F P M F P M F
City
2 3 4 5 6 7 8 9 10 II
Srinagar 1961 53 4-7 156 ~fO HO 334- 637 613 510
1951J 1941 Not Ol'ailable
1931 72 65 201 4.34 430 4-85 494 505 314-
1921 47 .51 28 458 411 716 495 538 256
1911 61 ,48 131 506 513 469 433 439 400
1901 63 69 45 580 478 859 357 453 96
Jammu 1961 13 i3 11 171 176 77 816 811 912
1951 J 1941 Not a~'ailable
1931 29 38
1921 13 14-
1911 64- 65
1901 68 66
3.332 The above classification shows that except for a slight shift, the primary sector of workers in Srinagar cfty has remained more or 'ess steady during the last six decades. According to this data, while there has been a slight fall ·in the proportion of male workers, the sector has recruited females in greater proportion in 1961 than in most of the previous decades. There has, however, been a substantial shift among the workers of secondary sector of whom a large proportion . appears to have diverted to the lertiary ,ector. The fall is particularly reflected
3
6
59
88
323
161 212 45 810 750 952
114 118 70 873 868 924-
241 242 235 695 693 706
172 163 279 760 771 633
among female workers. In Jammu, the proportion of workers in the primary sector has shrunk considerably during the six decades, 1901-61. The fall is reflected in workers of both the sexes though it is more conspicuous in the case of females. In so far as the secondary sector is concerned, the proportion of workers has fluctuated from decade to 'decade, but on the whole there has been no changee In so far as the tertiary sector is concerned, the overall proportion of workers has registered a substantial increase. This has been mainly
contributed by female workers whose proportion has gone up by about 28% during the intervening six decades.
3.333 The category-wise data given III the preceding statement shows that the proportion of male cultivators in Sri nagar has depreciated during the six decades. The reason for the decrease in the proportion of w9rkers of both sexes put together in primary sector is the low proportion of male wo~kers engaged in mining, quarrying etc. in 1961 when compared with 1901.
3.334 The heavy decrease in the proportion of workers of secondary sector of Srinagar is mainly due to the large scale shift of female workers employed in 1901 at household industry or engaged in manufacturing other than household industry. In this case, the number of females per 1,000 female workers has gone down from 859 of 1901 to 332 in 1961. The corresponding decrease among male workers has. however, been comparatively small. The fall has. however, been set off to a small extent by a slight increase in workers engaged in construction.
3.335 In so far as the tertiary sector is concerned, the proportions of workers in each of the three categories, trade and commerce, transport, storage and communications and, other services have registered considerable increases during the six decades. These have particularly been reflected among the female workers of all the three categories. In so far as males are concerned, the increase in the proportion is conspicuous in other services only.
3.336 The category-wise data of ]=mu city indicates that the size of workers in cultivation, mmmg, quarrying etc. and household industry and manufacturing other than household industry is shrinking and that there is . a growing tendency to shift to other activities, such as construction and trade and commerce. Even the proportion of workers employed in other services, which had shown upward tendency in 1931, has come down by 5.6%.
324
3.337 The 1961 figures show that cultivation, agricultural labour and mining are the least attractive activities and recruit only nominal number of workers. While the same cannot be said or household industry and manufacturing other than household indllstry, it is evident that in this case also the overall proportion of workers has fallen by about 3%, and of female workers by over 20%. There has, however, been some increase in the porportions of male and female workers engaged in construction and of male workers in trade and commerce. The proportion of female workers in trade and commerce has declined after 1911 and does not exceed 1.4% lU 1961. Males appear to ha ve concentrated m large numbers In transport, storage and communications in which theil' proportions have registered a marked increase when compared with 1901.
3.338 The drop in the proportions of fernalp: workers in categories I to VIn has been set off by the large increase in their proportion under 'other services'. The proportion of male workers in category IX has, however, shrunk to some extent as a result of the shift made by some of them to categories VI to VIII.
Literacy by Sex and Age
3.339 \Ve may now make use of Subsidiary 'fable C-III Part B-I giving the distribution of 1,000 persons in urban areas in each agegroup and sex by educational levels. According to this table, over 58% of the male UI ban population of the State consists of illiterate persons as against about 79'1", the corresponding percentage in ,he case of females. The provincewise data indicates that illiteracy is by far more pronounced in the vario~s districts of Kashmir Province than in Jammu. The data available in the Subsidiary table shows that no less than 636 out of 1,000 males are illiterate in Kashmir as against only 451 in Jammu. In the case of females, the disparity is equally marked, the corresponding proportions bein_; 852 and 643 per 1,000 females respectively.
3.340 The data relating to individual districts shows that so far as males are concerned,

illiteracy is most pronounced in Anantnag and Baramulla where the proportion of literate persons is a little over 30% of the total male population of each district. The districts of Udhampur, Jammu and Poonch are, however, conspicuous for higb literacy percentages of the male population which vary from 55% of Poonch to about 57% of Udhampur.
3.341 The proportions of literate and illiterate persons by age-groups also show that Anantnag and Baramulla are distinguishable from other districts for the high incidence of illiteracy in the age-group 5-14. Even the urban sector of Srinagar district, which is interwoven with a net_work of educational institutions, does not claim more than 34% literates of this age. In other districts, the literacy percentage in 5-14 group varies from 46.5% of Jammu to 35.7% of Kathua.
3.342 What has been stated above regarding incidence of literacy in the districts of Anantnag and Baramulla in the age-group 5-14 hold! equally true so far as the group 15-34 is concerned. In both the distri'?ts, the proportion of literate persons • in this group is slightly more than 37%. District Srinagar, however, claims a slightly better proportion, but even as it is, it is lowest compared to other six districts of the State. On the other hand, the highest proportion of male literates in the age-group 15-34, which stands at over 70% of the total male population of this age, has been returned from Poonch. Udhampur ranks next and has nearly the same literacy percentage as Poonch.
3.343 These observations also apply to the age-groups 35-59 and 60 and over in which also Anantnag and Baramulla have returned the least proportions of literate persons. Here again, Udhampur and Jammu excel the other districts for the high incidence of literacy in these age
groups.
3.344 In the case of females, the position obtaining in the districts of Anantnag and Baramulla is still worse. The overall literacy percentage of females' in the two districts
325
ranges between 7.2 to 9.6% only as against 39.3% of Jammu and 37.7% of Udhampur. In Anantnag, the literacy percentages in the age-groups 5-14, I 5-34, 35-59 and 60 and over do not exceed 11%, 7.4%, 1.8% and 0.4% respectively. The corresponding proportions for Baramulla, however, stand at 15.6%. 9%.27% and 1.2% respectively. Srinagar is distin_guishable from these two valley districts in respect of age-group 15-34 in which the literacy percentage of females. is 20% approximately. The position obtaining in Ladakh is unsatisfactory, particularly so far as females above the age of ·15 are concerned.
3.345 While there is no district in the State in which majority of the females are not illiterate, the fact remains that the position obtaining in Udhampur, Jammu, Kathua and Poonch is comparatively better. In Jammu, about 42% females in the age-group 5-14 are literates. The corresponding proportions in Udhampur and Kathua stand at 39% and 30% respectively. District Jammu is, however, distinguishable from other districts of Jammu province for the high incidence of literacy in its female population falling in the age-group 15-34. Udhampur is, more or less, at par with Jammu so far as literate females, whose age ranges from 15 to 34 years. are concerned.
3.346 The highest literacy percentage of female. in the age-group 35-59 has been returned from Jammu where 256 females per 1,000 were literate. Doda ranks last, the corresponding proportion being 101 per 1,0cio only. The agegroup 60 and over is dominated in all the five districts of Jammu province as elsewhere in the State by unqualified females and the· disparity in their respective proportions is very small.
3.347 The classification of the literate population by educational levels indicates that while only 42.4% of males are literates, these include over 20% who do not possess a~y educational qualification. The literacy percentage among females is only 21.3% of whom over 12% are mere literates. The breakup by different agegroups discloses that majority of the male

literates without any educational levels have been returned from the age - groups 5-14 and 60 and over. This is apparently due to the inclusion of school - going children who have acquired literacy but have not yet passed any examination as also because of people in old age who have had elementary education in private schools several decades ago when institutions preparing students for university examinations were few and rare.
3.348 Except for the age-group 15-34, large majority of literate females in other age-groups do not possess any educational qualifications.
3.349 The high incidence of illiteracy among females would be apparent from the fact that only 96 out of 1,000 females in the agegroup 35-59 are literates. What is more, 65 of these are without any educational levels and of the remaining 31 as many as 23 have passed only primary or junior basic examination. Even in the age-group 15-34, about 43% literate females do not possess_ any educational qualifications.
3.350 The province-wise figures show that in Kashmir province the: percentage of literate males stimds at sligtly more than 36% of whom
over 16% are without any educational levels. Among females, however, the position is not as good. In this case, the proportion of literates is very low and half of these are unqualified.
3.351 In Jammu province, 55% of the male population is literate. These include about 28% who do not possess any educational qualifications. The corresponding percentages in the case of females stand at about 36% and 23% respectively. In this province also, maj~rity of unqualified literate males and females fan in the age-group 5-14 which includes infants an'd children attending junior schools who have not yet passed any academic qualification., Further, most of the literate males and females in the age-group 15-34 possess some educational qualfication or other. This is not, however, true of the higher age - groups which revl!al large disparities in the proportions of qualified and unqualified persons of both sexes.
3.352 The following statement is a summary of Subllidiary Table C-IlI, Part B-1 and gives the sex-wise literacy' percentages of qualified and unqualified persons by age-groups in various districts of the State. Qualified perso~s inClude, among others, those who hilVe passed primary or junior basic examinations:-
STATEMENT m.47
District
Anantnag
Sex-wise literacy percentages of qualified and unquaU6ed persons by age-groups :in "the districts of the state
Age-group
2
Total 5-14-
15-34 35-59
60 + Age not stated
Percentage of literates
to total male population
3
30.3 22.3 37.2 30.2 24.7 14.3
Ma I es --A--________ ----, r----
Percentage of literates
without educational
qualifications
4-
16.B 16.3 16.3 18.0 19.0 14.3
Percentage of qualified
males
5
13.5 6.0
20.9 ]2.2 5.7
326
Percentage of literates
to total female
population
6
7.2 11.0
7.4-1.8 0.4-
Females
Percentage of literate,
without educational
qualifications
7
4.5 B.l 3.6 ].1
0.4
Percentage of qualified
females
8
2.7 2.9 3.8 0.7

STATEMENT m.47__;_Contd.
Ma 1 e s Females r-------__,._-------~ r---------~------~
Percentage Percentage Percentage District Age-group Percentage of literates of literates of literates
of literates without Percentage to total without Percentage to total male educational of qualified female educational of qualified population qualifications males population qualifications females
2 3 4 5 6 7 8
Srinagar Total 38.4 16.4 22.0 17.0 8.0 9.0 5-14 34.3 21.0 13.3 22.3 12.7 9.6
15-34 45.4 14.0 31.4 19.6 6.8 12.8 35-59 34.4 13.8 20.6 5.2 3.0 2.2 60 + 31.2 17.2 14.0 1.5 1.1 0.4
Age not stated 23.2 12.1 ILl 2.1 0.7 1. ..
Baramulla Total 30.9 15.9 15.0 9.6 6.5 3.1 5-14 26.7 19.5 7.2 15.6 12.B 2.8
15-34 37.1 14.1 23.0 9.0 4.4 4.6 35-59 28.1 14.8 13.3 2.7 1.9 0.8
60 + 19.0 13.7 5.3 1.2 0.8 0.4-Age not stated 6.5 6.5 3.3 3.3
Ladakh Total 42.2 23.8 18.4- 7.7 6.0 1.7 5-14 41.4 24.1 17.3 17.3 14.6 2.7
15-34 51.3 26.3 25.0 7.1 5.3 1.8 35-59 36.7 21.7 15.0 2.0 1.0 1.0 60 + 22.1 18,4 3.7 3.8 3.8
Age not stated
Doda Total 49.5 28.1 21.4- 22.6 15.0 7.6 5-14 41.7 34.1 7.6 31.3 25.9 5.4
15-34- 60.1 25.1 35.0 23.6 11.6 12.0 35-59 45.4 26.7 1B.7 10.1 6.7 3.4
60 + 29.7 23.8 5.9 2.3 2.3 Age not stated R.9 6.7 2.2
Udhampur Total 56.6 36.2 20.4 36.7 28.2 8.5 5-14 41.1 36.3 4.8 38.7 34.2 4.5
15-34 70.1 37.3 32.8 48.1 33.0' 15.1 35-59 56.7 34.7 22.0 18.8 15.1 3.7
60 + 46.2 35.3 10.9 4.4 4.1 0.3 Age not stated 37.5 12.5 25.0
Jammu Total 56.2 26.7 29.5 39.3 24.5 14.8 5-14 46.5 40.8 5.7 41.7 36.3 5.4
15-34 63.9 20 .. 7 43.2 48.4 -21.3 27.1 35-59 55.4- 21.7 33.7 25.6 17.9 7.7
60-+ -47.2 24.7 22.5 8.2 7.4 0.8
Age not stated 5.7 4.3 1.4 4.1 4.1
327
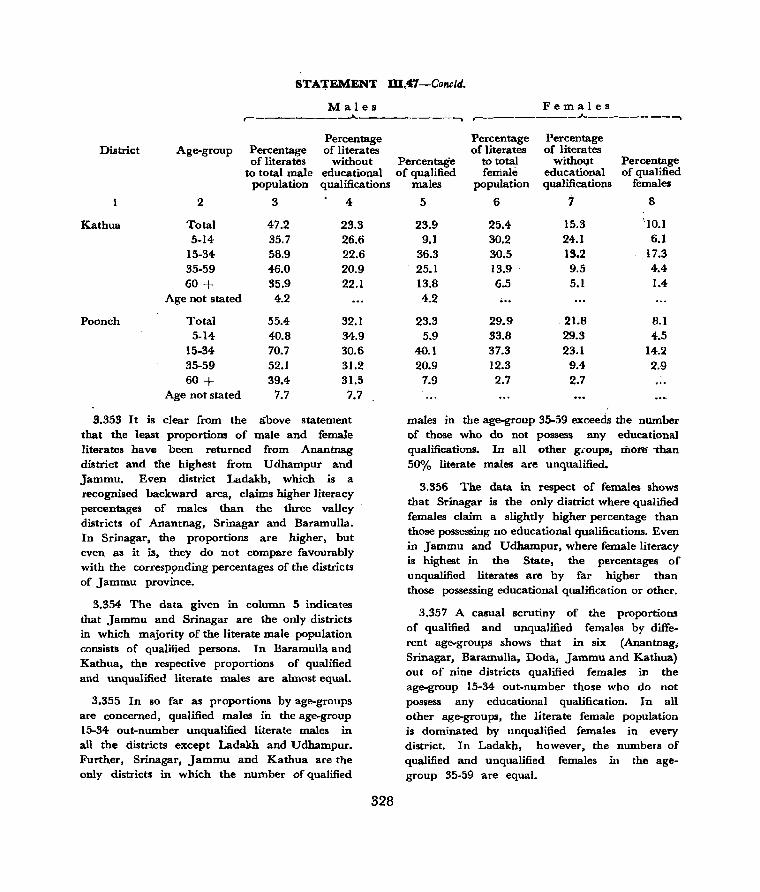
STA,:(,EMENT m.47-Concld.
M a I es Females r------------'-----------. ~-------_-..A..-------_~
Percentage District Age-group Percentage of literates
of literates without to total male educational
population qualifications
2 3 4
Kathua Total 47.2 23.3 5-14 35.7 26.6
15-34 58.9 22.6 35-59 46.0 20.9 60 + 35.9 22.1
Age not stated 4.2
Poonch Total 55.4 32.1 5.14- 40.8 34.9
15-34 70.7 30.6 35-59 52.1 31.2 60 + 39.4- 31.5
Age not stated 7.7 7.7
3.353 It is clear from the above statement that the least proportions of male and female literates have been returned from Anantnag district and the highest from U dhampur and Jammu. Even district Ladakh, which is a recognised backward area, claims higher literacy percentages of males than the three valley districts of Anantnag, Srinagar and Baramulla. In Srinagar, the proportions are higher, but even as it is, they do not compare favourably with the corresP9nding percentages of the districts of Jammu province.
3.354 The data given in column 5 indicates that Jammu and Srinagar are the only districts in which majority of the literate male population consists of qualified persons. In Baramulla and Kathua, the respective proportions of qualified and unqualified literate males are almost equal.
3.355 In so far as proportions by age-groups are concerned, qualified males in the age-group 15-34 out-number unqualified literate males in all the districts except Ladakh and Udhampur. Further, Srinagar, Jammu and Kathua are the only districts in which the number of qualified
328
Percentage Percentage of literates of literates
Percentage to total withO\,1t Percentage of qualified female educational of qualified
males population qualifications females
5 6 7 8
23.9 25.4 15.3 '10.1 9.1 30.2 24.1 6.}
36.3 30.5 13.2 17.3 25.1 13.9 9.5 4.4 13.S 6.5 5.1 1.4-4.2 ...
23.3 29.9 21.8 8.1 5.9 33.8 29.3 4.5
40.1 37.3 23.1 14.2 20.9 12.3 9.4 2.9
7.9 2.7 2.7
males in the age-group 35-59 exceeds the number of those who do not possess any educational qualifications. In all other g .... oups, more---than 50% literate males are unqualified.
3.356 The data in respect of females shows that Srinagar is the only district where qualified females claim a slightly higher percentage than those possessing no educational qualifications. Even in Jammu and Udhampur, where female literacy is highest in the State, the percentages of unqualified literates are by far higher than those possessing educational qualification or other.
3.357 A casual scrutiny of the proportions of qualified and unqualified females by different age-groups shows that in six (Anantnagj Srinagar, Baramulla, Doda, Jammu and Kathua) out of nine districts qualified females in the age-group 15-34 out-number those who do not possess any educational qualification. In all other age-groups, the literate female population is dominated by unqualified females in every district. In Ladakh, however, the numbers of qualified and unqualified females in the agegroup 35-59 are equal.
3.358 SuJ>sidiary Table C-III, Part B-1 also shows· that the proportions of technical and nontechnIcal degree holders are very low and do not exceed 2.3% in the case of males and 0.5% so· far as females are concerned. As may be expected, majority of these belong to the age-groups 15-34 and 35-59. The province-wise figures show that in Kashmir the proportion of male degree holders stands at 1.8% and of females at 0.3% as against 3.3% and 0.8"/0, the corresponding proportions of the two sexes in Jammu province. The highest proportion of degree holders among males has been returned from district Jammu at 4.1 %. Srinagar ranks next, the corresponding proportion being 2.3%. In the case of females also, Jammu leads all other districts of the State with a proportion of 1.2% degree holders.
Distribution of Workers in difrereDt Industrial Categories according to Educational
Levels
3.359 Subsidiary Table B.III, Part A-2 gives the distribution of 1,000 workers in each industrial category and in each sex by educational levels in the urban areas of the State. From this, it' will be seen that except for categories VI, VII and IX, viz., workers engaged in construction. trade and commerce and other services, majority of male workers engaged in other industrial categorit;! consist of illiterate persons. In the case of females, the only category in which the proportion of illiterate females is less than 50% is 'other services.'
3.360 The data further discloses that of the total number of 17,838 male workers engaged as cultivators, 1.7% or 308 have passed matriculation or higher secondary examination and 0.1 % or 25 males hold degrees, The proportion of females is, however, very small. There is no district in the State where some proportion of male matriculates is not engaged in cultivation. As the distribution of workers by agegroups is not available, it is not possible to say precisely whether these matriculates have taken to cultivation due to th~ir failUle to secure
329
some other assignment or whether they mostly. consist of retired person,s who are looking after their lands now.
3.361 In categery II, there are very few misfits. Except for 4.6% males and 2.6% females, all other workers in this category are illiterate. The literate male workers include 2 per 1,000 males who have passed either matriculation examination or hold university degree.
3.362 A reference to main Table B-III Part A will indicate that actually there is only one male degree holder in district Anantnag who has been classified as an agricultural labourer. An examination of the Census slip on which his particulars have been recorded has disclosed that he is a migrant, Rup Narayan Pushan by name. He has passed B. Sc. examination and is employed in some agricultural farm which has been misconstrued as agricultural labour resUlting in his classification in category II.
3.363 In other categories there is nothing unusual except that female workers in category VII, trade and commerce, consist, among others, of graduates who claim a proportion of 13 per 1,000 workers. The actual number of these females is, however, only 3 and all of them have been returned from district Srinagar. On further scrutiny of their Census slips, it has been ascertained that all the three are employed as Insurance agents.
Non-workers
3.364 Let us now make use of tlt8 Subsidiary Tables to Table B-IX and assess the proportions of non-workers who are seeking employment for the first time and who were employed before but are now out of employment and are seeking work. Subsidiary Table B-IX.l shows that out of every 1,000 persons in the urban areas of the State who are above the age of 15 years, 12 are seeking employment. This proportion is exceeded by Srinagar district only where the corresponding proportion stands at 16. Jammu and Kathua have the same proportion as the State, but in other districts, except Ladakh, these- proportions vary from 3 to

10 per 1,000. Ladakh is the only district where, according to this data, there is no problem of unemployment in the urban sector.
3.365 Among males, the proportion of those above the age of 15 years who are in search of employment is 15 per 1,000. Sri nagar has the same average as the State, but in Udhampur Jammu, Kathua and Poonch, the incidence of males seeking employment is more pronounced, the corresponding proportions being 17, 20, 20 and ] 8 respectively. In so far as females are concerned, Srinagar is the only district where unemployment is relatively acute among females above the age of 15 years. In most other districts, the· corresponding proportions are negligible.
3.366 Srinagar also stands out prominently for the higher proportion of employment seekers in the age-group J 5-34 which stands at 22 per 1,000 against the overall average of 17 for the State as a whole. Anantnag, Baramulla and .Doda are the only districts where the corresponding proportions are low and vary from 4 to 7 per 1,000. In other districts, except Ladakh where no one is seeking employment, the proportions are nearly the same as for the. entire urban area of the State.
3.367 Udhampur, JamI~lU, Kathua and Poonch are distinguishable from other districts for the high incidence of unemployed males in the agegroup 15-34. The relative proportions of these districts vary from 25 to 30 per 1,000, as against the corresponding proportion of 21 of the State as' a whole. Srinagar has almost the same average as the State.
3.368 Among females, however, Srinagar is conspicuous for the high incidence of unemployed females in the age-group 15_34 which stands at 24 per, 1,000 as against the average of 12 for the State. In some of the districts like Anantnag, Ladakh and Udhampur, there is no unemployed female in this age-group while in others the corresponding proportion does not exceed 3 per 1,000.
3.369 In so far as the. age-group 35-59 is
330
concerned, Srinagar again leads other districts with a proportion of 7 per 1 ,000 against only 5 of the State as a whole. Among males of this age-group, Kathua has the highest proportion of unemployed persons at 11 per 1,000 while the corresponding average for the State does not exceed 7. Other districts in \'1hich the proportion of employment seekers in this age-group exceeds the State average are Si'inagar and Poonch where 9 per 1,000 males are without any employment and are in search ~f the same. There is practically no unemployment among females of this age-group in any of the districts of the State, except Srinagar where the corresponding proportion stands at 5 per 1,000 as agllinst only 3 of the State.
3.370 Subsidiary Table B-IX.3 giving the distribution of 1,000 non-workers by ,. /lex and type of activity indicates that of every 1,000 non-workers in the State, 618 a['e :females and 382 males. The district-wise proportions sh~w that except Ladakh where 53% non-workers consist of males, in other districts the corresponding proportions of male nOH-workers are less than 41%.
3.371 It is apparent that most of the male non-workers in the various districts of the State consist either of full time students or
dependents, inf3.nts and disabled persons. Among female non-workers, those engaged in household duties as also others who make no contribution to the family income ei'ther because of being too young, such as infants, or who are too old to make any living, claim higher proportions than non-workers of other categories.
3.372 The classifi«ation of non-wprkers by age-groups shows that majority of males are less than 15 years old. In the case of females, however, Anantn~g, Ladakh and Doda are the only districts where the proportion of nonworkers in the age-group 0-14 exceeds 50,% of the total number of female non-workers. As a result of the high incidence of male workers in the age-group 0-14, the corresponding proportions in the age-groups 15-34, 35-59 and 60 over are fairly low. This is also, more or

less, true of females but in this case the disparity between the age-groups 0-14 and 15-34 is not so large as in -the males. This is because of the high proportion- of female non-workers in the age-group 15-34 which includes large number of middle aged women who look after household duties only.
3.373 The proportions of male students in individual districts do not disclose any substantial disparity when compared with the overall average of male students in the State as a
331
whole. The same cannot, however, be said about females, whose proportions in districts Doda, Qdhamlmr, Jammu and Poonch exceed the State average by more than 33%. Again. Anantnag and Baramulla claim comparativ~Iy
small proportions of full time female students which are over 33% less than the State average. The following statement will show the districts in which the proportiuns of different categories of non-workers are higher or lower than the average of the State by 33%:-
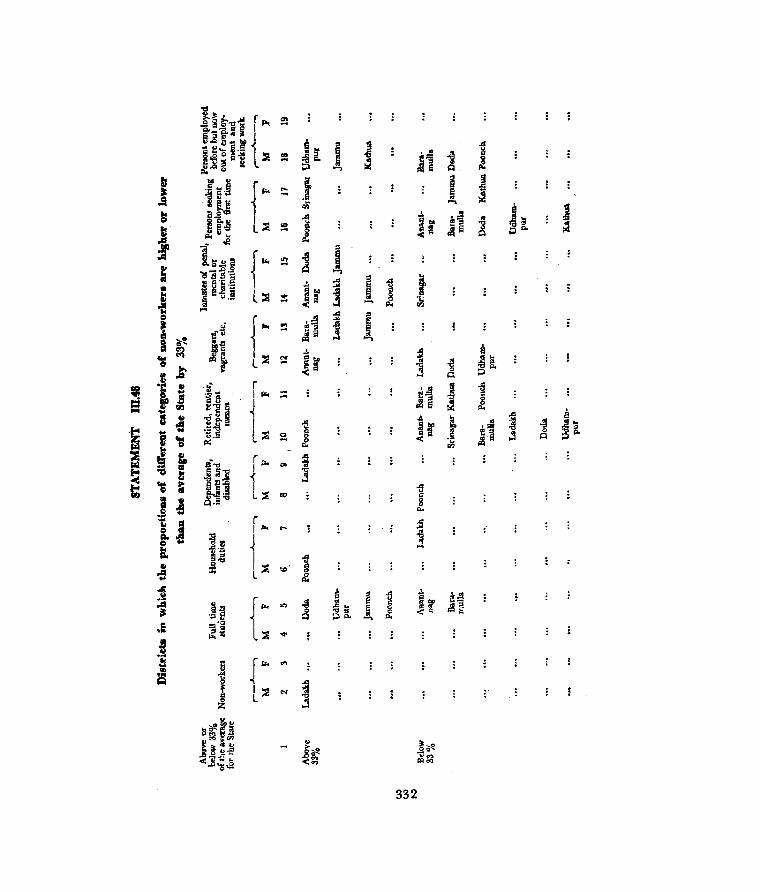
r I"" 1
i L;:;l S
rl>< '" ~.
1 L:;;J co
.1 en
1
332
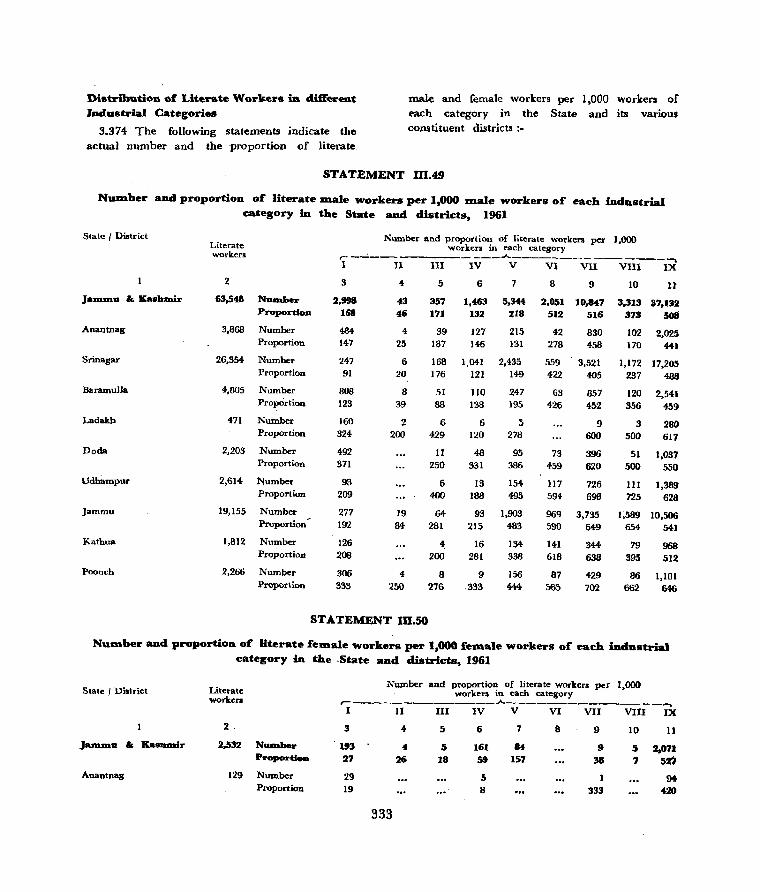
Distribution of Literate Workers ia different Industrial Categories
male and female workers per 1,000 workers of each category in the State and its various constituent districts:-3.374 The following statements indicate the
actual number and the ·proportion of }iterate.
STATEMENT m.49
NUDlber and proportion of literate D1ale workers per 1,000 DUlle workers of each industrial eategory in the State and districts, 1961
State I District
Janunu & Kashmir
Anantnag
Srinagar
Baramulla
Ladakh
Doda
Udhilmpur
Jammu
Katbua
Poonch
Literate workers
2
63,548 N .... ber ProportioSl
3,868 Number Proportion
26,354 Number Proportion
4,805 Number PropOrtion
471 Number Proportion
2,203 Number Proportion
2,614 Number Proportion
19,155 Number Proportion~
1,812 Number Proportion
2,266 Number Proportion
Number and proportion of literate workers per 1,000 workers in each category r -.....:.------______ .A.. __ . _____________ ~
1 II III IV V VI VII VIII IX
3
2,998 168
484 147
247 91
808 123
160 324
492 371
93 209
277 192
126 208
306 333
43 46
4 25
6 20
8 39
2 200
19 M
4 250
5
357 171
39 187
168 176
51 88
6 429
11 250
6 400
64 281
4-200
8 276
6
1,463 132
127 146
1,041 121
110 138
6 120
48 331
13 188
7
5,344 218
215 131
2,435 149
247 195
5 278
95 386
154 495
93 1,903 215 483
16 281
9 .333
134 338
156 444
8 9
2,051 10,847 512 516
42 278
559 422
63 426
73 459
117 594
830 458
3,521 405
857 452
9 600
396 620
726 698
969 3,735 590 649
141 618
87 565
344-638
429 702
10 u 3,313 37,132
373 508
102 2,O2!; 170 441
1,172 17,205 237 488
120 2,541 356 459
3 500
280 617
51 1,037 500 550
III 1,389 725 628
1;589 10,506 654 541
79 395
968 512
86 1,181 662 646
STATEMENT 10.50
NUlDober and proportion or Bterate fe_ale workers per 1,000 i"elDoale workers of each badustrial category in the -State aDd districts, 1961
State I District
Ja_u & Ka811mir
Anantnag
Literate worken
2.
2,532 N1UDber Proportion
129 Number Proportion
Number and proportion of literate workers per 1,000 . workers in each category r-------.------____ .,.4.. _____________ __ -.
I II III IV V VI VII VIn IX
3 4 5 6 7 8 9 10 11
193 " 5 161 84 9 5 2,071 27 26 18 59 157 38 7 52')
29 5 94 19 8 333 420
333
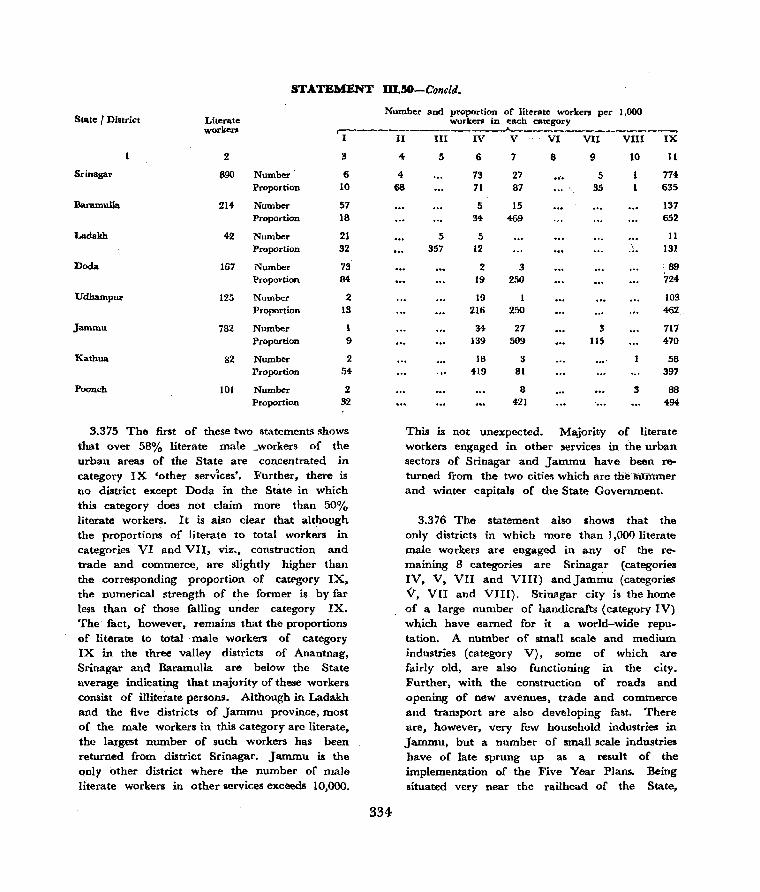
STATEMENT m.50-Concld.
State I District Literate Number and proportion of literate worker, per 1,000
wurkers in each category worker. ,-----------------"-------------------..
I
2 3
Srinagal' 890 Number 6 Proportion 10
Baramulla 214- Number 57 Proportion 18
Ladakh 42 Number 21 Proportion 32
Doda 167 Number 73 Proportion 84
Udhampur 125 Number 2 Proportion IS
Jammu 782 Number 1
Proportion 9
Kathua 82 Number 2 Proportion 54
Poonch 101 Number 2 Proportion 32
3.375 The first of these two statements shows that over 5B% literate male _workers of the urban areas of the State are concentrated in category IX 'other services'. Further, there is no district except Doda in the state in which this category does not claim more than 50% literate workers. It is also clear that although the proportions of literate to total workers in categories VI and VII, viz., construction and trade and commerce, are slightly higher than the corresponding proportion of category IX, the numerical strength of the former is by far less than of those falling under category IX. The· fact, however, remains that the proportions of literate to total male workers of category IX in the three valley districts of Anantnag, Srinagar and Baramulla are below the State average indicating that majority of these workers consist of illiterate persons. Although in Ladakh and the five districts of Jammu province, most of the male workers in this category are literate, the largest number of such workers has been returned from district Srinagar. Jammu is the only other district where the number of maJe literate workers in other services exceeds 10,000.
334
II III IV V VI VII VIII IX
4- 5 6 7 8 9 10 11
4 73 27 .... 5 774 tiS 71 87 35 635
5 15 137 34- 469 652
5 5 11 357 12 131
2 3 ' 89 19 250 724
19 lOS 216 250 462 ..
34- 27 3 717 139 509 115 470
18 3 58 419 81 397
8 3 88 421 494
This is not unexpected. M~ority of literate workers engaged in other services in the urban sectors of Srinagar and Jammu have been returned from the two cities which are the·su:m:mer and winter capitals of the State Goverrunent.
3.376 The statement also shows that the only districts in which more than J ,OO() literate male workers are engaged in any of the remaining 8 categories are Srinagar (categories IV, V, VII and VIII) andJammu (categories \T, VII and VIII). Srinagar city is the home of a large number of handicrafts (category IV) which have earned for it a world-wide reputation. A number of small scale and medium industries (category V), some of which are fairly old, are also functioning in the city. Further, with the construction of roads and opening of new avenues, trade and commerce and transport are also developing fast. There are, however, very few household industries in Jammu, but a number of small scale industries have of late sprung up as a result of the implementation of the Five Year Plans. Being situated very near the railhead of the State,

Jammu city functions. as a store house and distributing centre of the State for imports made from outside. Consequently, the avenues of employment for literate workers Il;re comparatively large in commercial establishments, transport and storage. This will be apparent from the fact that the actull-I number of the workers in these categories in Jammu is larger than that of Srinagar even though the latter is a much bigger city· inhabi~ed by nearly three times the population of Jammu.
3.377 The statement relating to' females also exhibits the same position. In this case, the proportion of literate females employed in other services to total literate female workers is even much higher and stands at about 82%. The classification by industrial categories shows that, except Ladakh, there is no district in the State where majority of the literate females have not been absorbed in other services. The predominance of literate females of Ladakh in category I, viz., cultivators, is due to non-availability of other avenues of employment. All the 21 literate females engaged as cultivators are unqualified, making them ineligible to join Government service, the only alternative employment available to them. Even in Doda, 53 of the 73 females are unqualified literates and of the remaining 20 as many as 18 have passed only primary or junior basic examination.
UneznploYJDent in the State and its Dis-tricts
3.378 The Subsidiary Table based on' Union Table B-VIII, Part-A gives the proportions of unemployed persons of the age of 15 and above by sex, broad age-groups and educational standards in urban areas. The expression 'unemployed persons' used in the heading of this table refers to persons who are. seeking employment for the first time as also those who were employed before but are now out of employment and seeking work. The ratios of the two categories have been given seBaratel'y for each age-group in the Subsidiary Table. A reference to Union Table B-Vln Part-A shows that the total number of males in the urban areas of the State
335
seeking employment for the first time stands at 1,790. Of these, 972 or 543 per 1,000 consist of illiterate persons, literates without edu'cational qualifications and others who have passed primary or junior basic examination only. The remaining 818 .males include 591 persons who have passed matriculation or higher secondary examinations. This category thus claims 330 per 1,000 of th~ total number of males seeking employment for the first time. The number of non-technical diploma (not-equal. to degree) holders is only 3. Further, there are no technical diploma (notequal to degree) holders seeking employment for the first time. Among the remaining unemployed males, 219 or 122 per 1,000 hold University degrees or post-graduate degrees other than technical degrees and 5 others are technical degree holders.
3.379 If we corelate this data with Union Table C-III, Part-B, we can work out the ratio of all categories of males according to educational levels who are seeking employment for the first time to the total population of each category. This will be evident from the following.
3.380 The total male. popUlation of the age of 15 and above inhabiting the urban areas of the State stands at 192,568, as indicated in Union Table C-III, Part-B. Of these, 1,790 or 9 per 1,000 are seeking employment for the first time. Similarly, the male illiterate population of the age of 15 and above being 105,112, it would appear that those among them numbering 385 who are seeking employment for the first time comprise 3.7 or about 4 per 1,000 of the total illiterate male population.
3.381 The following statement gives these proportions for all ages and for different agegroups separately in respect of (a) persons seeking employment for the first time, (b) persons employed before but now. out of employment and seeking work and (c) the aggregate proportion of (a) and (b) put together. The statement has been split up into two parts, one giving the data for males and the other relating to females.
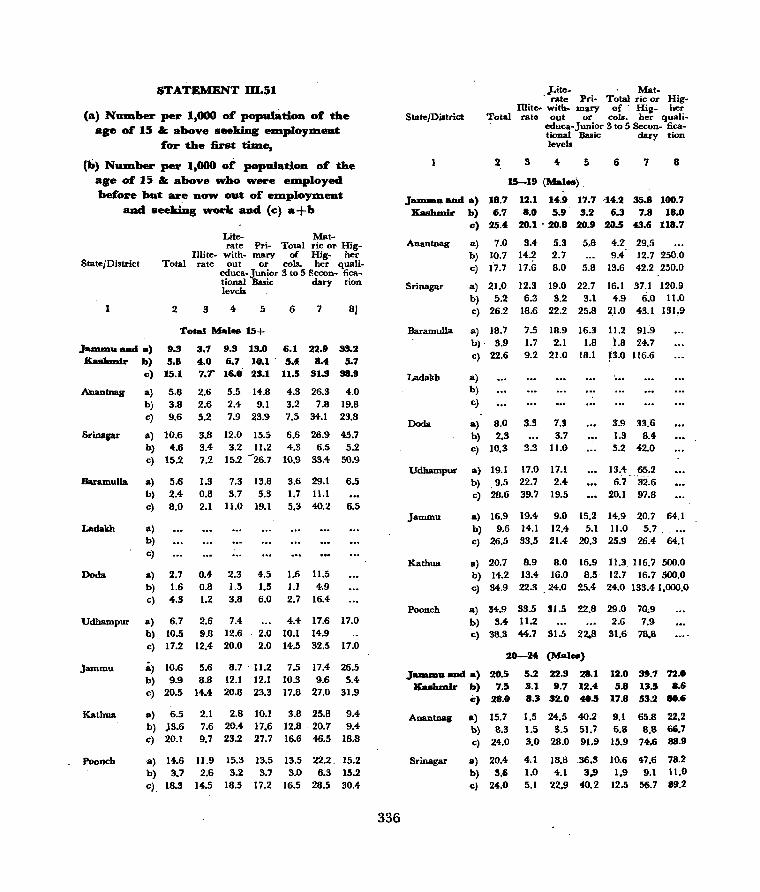
STATEMENT m.Sl
<a> NUDlber per 1,000 of population of tbe age of 15 .& above seeking eDlploYDlent
f'or the first time,
(b) NUDlber per 1,000 of population oC the age of 15.& above who were employed bef'ore but are now out of' em.ploYJDent
and seeking work _d (e) a+b
State/District
I
Lite- Mat-rate Pri- Total ric or Rig
Illite- with- mary of Rig- hel' Total rate out or eols. her quali-
2
educa-Junior 3 to 5 Eecon- ficational Basic dary tion leveb
4 5 6 7 8)
To1al Males 15+ J-- aad a) 9.3 KaaJualr b} 5.8
3.7 9.3 13.0 6.1 22.9 33.2 4.0 6.7 10.1 5.4 8.4 5.7 7.7' 16.0' 23.1 11.5 31.3 38.9
Ananmag
Srinagar
.ramulla
c) 15.1
a) 5.8 b) 3.8 c) 9.6
Il) 10.6 b) 4.6 c) 15.2
2.6 2.6 5.2
5.5 14.8 2.4 9.1 7.9 23.9
4.3 26.3 4.0 3.2 7.8 19.8 7.5 34.1 23.8
3.8 12.0 15.5 6.6 26.9 45.7 3.4 3.2 11.2 4.3 6.5 5.2 7.2 15.2 -26.7 1{).9 33.4 SO.9
Il) 5.6 1.3 7.3 13.8 3.6 29.1 6.5 1.7 11.1 b) 2.4 0.8 3.7 5.3
c) 8.0 2.1 11.0 19.1 5.3 40.2 6.5
Ladakh Il)
Dods
b) c)
Il) 2.7 0.4 2.3 4.5 b) 1.6 0.8 l.5 1 • .5 ~ ~3 1.2 LS 6~
1.6 11.5 1.) 4.9 2.7 16.4
Udbampur 0) 6.7 2.6 7.4 4.4 17.6 17.0
Jammu
Katbua
. Pooncb
bl 10.5 9.8 12.6 2.0 10.1 14.9 c) 17.2 12.4 20.0 2.0 14.5 32.5 17.0
&) 10.6 5.6 S.7 11.2 7.5 17.4 26.5 b) 9.9 8.B 12.1 12.1 10.3 9.6 5.4 C) 20.5 14.4 20.8 23.3 17.8 27.0 31.9
a) 6.5 b) )3.6 c) 20.1
2.1 2.B 10.1 3.8 25.B 9.4 7.6 20,4· 17.6 12.8· 20.7 9.4 9.7 23.2 27.7 16.6 46.5 18.8
a) 14.6 11.9 15.3 13.5 13.5 22.2. 15.2 b) 3.7 2.6 3.2 3.7 3.0 6.3 15.2 c). 18.3 14.5 IS.5 17.2 16.5 28.5 30.4
336
State/District
J..ite- Mat-. rate Pri- Total ric or Rig
Illite- with- mary of' Rig- her Total rate out ·or colo. her quali-
2 3
educa-Junior 3 to 5 Secan- ficatioual Basic dory tion level.
6 7 8
1.5-19 (Males)
J--u _d a) 18.7 12.1 14.9 17.7 -14.2 35.8 100.7 Ka .... mir b) 6.7 8.0 5.9' 3.2 6.3 7.8 18.0
e) 25.4 20.1' 20.8 20.9 2.,,5 43.6 U8.7
Anantnag
Srinagar
Baramulla
Ladakh
Dada
Udhampur
Jammu
Katbua
Pooneh
a) 7.0 9.4 5.3 5.8 4.2. 29.5 b) 10.7 14.2 2.7 9.4' 12.7 250.0 c) 17.7 17.6 8.0 5.B 13.6 42.2 250.0
a) 21.0 12.3 19.0 22.7 16.1 37.1 120.9 b) 5.2 6.9 3.2 3.1 4.9 6.0 11.0 c) 26.2 18.6 22.2 25.8 2.1.0 43.1 131.9
a) 18.7 b)· 3.9 C) 22.6
7.5 18.9 16.3 11.2 91~9 1.7 2.1 1.8 1.8 24.7 9.2 21.0 1B.l 13.0 116.6
a) b) c}
a) 8.0 3.3 7.3 b) 2.3 3.7 c) 10.3 3.3 11.0
a) 19.1 17.0 17.1 b) .9.5 22.7 2.4-c) 28.6 39.7 19.5
3.9 33.6 1.3 8.4 5.2 42.0
13.4 65.2 6.7" '32.6
20.1 97.B
a) 16.9 19.4 9.0 15.2 14.9 20.7 64.1 b) 9.6 14.1 12.4 5.1 11.0 5.7. ... C) 26.5 33.5 21.4 20.3 25.9 26.4 64.1
a) 20.7 8.9 8.0 16.9 11.3. 116.7 500.0 b) 14.2 13.4 16.0 8.5· 12.7 16.7 500.0 c) 34.9 22.3 24.0 25.4 24.0 133.4 1,000.0
a) 34.9 33.5 31.5 22.8 29.0 70,9 b) 3.4 11.2 2.6 7.9 c) 38.3 44.7 31.5 22,.6 31.6 7B.B
20-24 (Mal ... )
J_u aDd a) 20.5 Ka.UDlIr b) 7.5
e) 28.0
5.2 22.3 211.1 12.0 39.7 72 .• 3.1 9.7 12.4 5.8 13.5 8.6 8.3 32.0 40.5 17.8 53.2 80.'
Anantnag
Srinagar
a) 15.7 b) 8.3 c) 24.0
a) 20.4-b) 3.6 c) 24.0
1.5 24.5 40.2 9.1 65.8 22~2
1.5 3.5 51.7 6.8 8.8 6&.7 3.0 28.0 91.9 15.9 74.6 88.9
4.1 18.8 .36.3 10.6 47.6 78.2 1.0 4.1 3.9 1.9 9.1 11.0 5.1 22.9 40.2 12.5 .56.7 89.2

STATEMENT DL51-Contd.
State/District
Baramulla
Ladakh
Doda
Udhampur
Jammu
Kathua
Poonch
Lite- Mat-lllite- rate Pri- Total ric Or Big
Total rate with- mary of Big- her out or cols. her quali.
educa-Junior 3, to 5 Secon- ficational Basic dary tion levels
2
a) 10.4-b) 5.4-c) 15.8
a) b) c)
a) 7.7 b) 1.3 c) 9.0
4 5
0.6 18.3 25.4 1.2 3.0 10.9 I.B 21.3 36.3
6 7
6.3 37.4 2.7 23.0 9.0 60.4
6.3 17.2 5.3 16.2 5.4
6,3 17.2 5.3 21.6
8
a) 21.1, 8.4 22.5 b) 9.0 12.7 11.2. c) 30.1 21.1 33.7
12.7 35.9 76.9 10.6 6.0 23.3 41.9 76.9
a) 27.3 11.5 31.2 21.9 16.6 32.6 80.8 b) H.l 10.0 17.5 19.6 13.8 17.7 3,6 c) 41.4 21.5 48.7 41.5 32.6 50.3 84.4
a) 15.6 3.6 7.4 31.3 9.8 34.5 b) 24.1 10.8 44.4 20.8 21.6 34.5 c) 39.7 14.4 51.8 52.1 31.4 69.0
a) 24.2 27.5 25.3 6.6 21.2 26.3 74.1 b) 6.4 ID.I 13.2 7.1' 5.3 c) 30.6 27.5 35.4 19.8 28.3 31.6 74.1
25-34 (Malcs)
JIUIlD1.U and a} 7.3 Kaslunir b) 7.3
c) 14.6
3.2 5.4 10.4 4.6 14.5 32.5 4.0 9.1 19.9 7.1 9.0 7.1 7.2 14.5 30.3 11.7 23.5 39.6
Anantnag
Srinagar
Baramulla
Ladakh
Doda
a) 3.9 1.8 b) 1.2 c) 5.1 1.8
a) 9.0 3.9 b) 4.4 1.3 c) 13.4 5.2
a) 1.6 0.3 b) 1.6 0.9 c) 3.2 1.2
a) b) c)
1.4 IB.5 1.4 6.2 2.8 24.7
6.8 9.0 2.3 26.2 9.1 35.2
],4 7.8 1.4 7.B 2.8 15.6
3.2 ]5.0 0.8 7.5 4.0 22.5
4.9 ]7.8 51.4-4.3 5.4 3.3 9.2 23.2 54.7
1.3 1.7 3.0
2.5 14.5
2.5 14.5
a) 0.7 b) 2.2 c) 2.9
5.3 0.9 1.6 3.1 5.3 2.7 1.6 3.1 10.6 3.6
337
State/District
Lite- Mat. rate Pri- Total ric or Hig
Total Illite- with- mary of Hig· her rate out or cola. her quali
2 3
educa-Junior 3 to 5 Secane :ficational Basic dary tion levels
4 5 6 7 8
Udhampur a) 2.2 2.0 0.9 4.1 12.8
Jammu
Kathua
Poonch
h} 23.0 24.4 28.5 8.2 24.4 24.4 c) 25.2 24.4 30.5 8.2 25.3 28.5 12.8
.) 9.4 4.6 6.9 12.7 6.6 16.1 20.0 h) 16.5 13.9 19.6 24.1 17.2 15.2 13.3 c) 25.9 18.5 26.5 36.B 23.8' 31.3 33.3
4.2 3.4 6.5 3.r 1'1.1 .} h) c)
15.3 13.6 18.6 19.6 15.7 16.7 19.5 17.0 18.6 26.1 18.8 27.B
a) 8.6 b) 3.9 c) 12.5
4.3 12.9 21.3 10.5 4.3 2.6 2.9 B.6 15.5 21.3 13.4
35 + (Males)
33.9 33~9
JIUlUDD aad a) Kash:adr b)
c)
3.0 3.9 6.9
1.3 3.3 4.6
5.2 3.2 4.7 7.7 9.9 10.9
2.3 9.0 6.1 4.0 4.5 1.5 6.3 13.5 7.6
Anantnag
Srinagar
Baramulla
Ladakh
a) 3.5 3.2 3.3 8.1 b) 1.7 1.5 2.5 c) 5.2 4.7 5.8 8.1
a), 4.2 1.3 9.5 3.3 h) 4.8 4.4 3.5 11.0 c) 9.0 5.7 13.0 14.3
a) 1.7 0'.3
h~ 1.4 0:3 c) 3:1 0.6 i.) b) c)
3.3 11.0 5'.8 3.7 9.1 14.7
Dod. a) h) 1.0 0.8 c) 1.0 O.B
Udhampur a) 0.8 2.4
Jammu
Kathua
Poonch
b) 3.8 0.9 B.5 c) 4.6 0.9 10.9
a) b) c)
a)
1.6 3.9 5.5
b) 9.3 . c) 9.3
a) 6.1 b) 2.B c) 8.9
0.6 4.1 4.7
2.3 5.5 7.8
1.1 5.1 6.2
3.2 16.7 22.6 3.2 16.7 22.6
8.5 6.0 0.9 3.0 4.7 9,4 9.0 4.7
3.5 3.4; 1.6 3.4 5.1 6.8
2.8 14.6 12.2 4.8 5.9 3:2 7.6 20.5 15.4
1.5 1.4 2.9
0.5 0.5
1.0 3.9 4.9
1.1 4.6 5.7
4.8 2.4 7.'1.
8.0 8.0
4.3 4.3
4.4-1.8 6.2
9.2 12.0 9.2 12.0
6.7 2.1 14.4 8.8 14.4
0.9
0.9
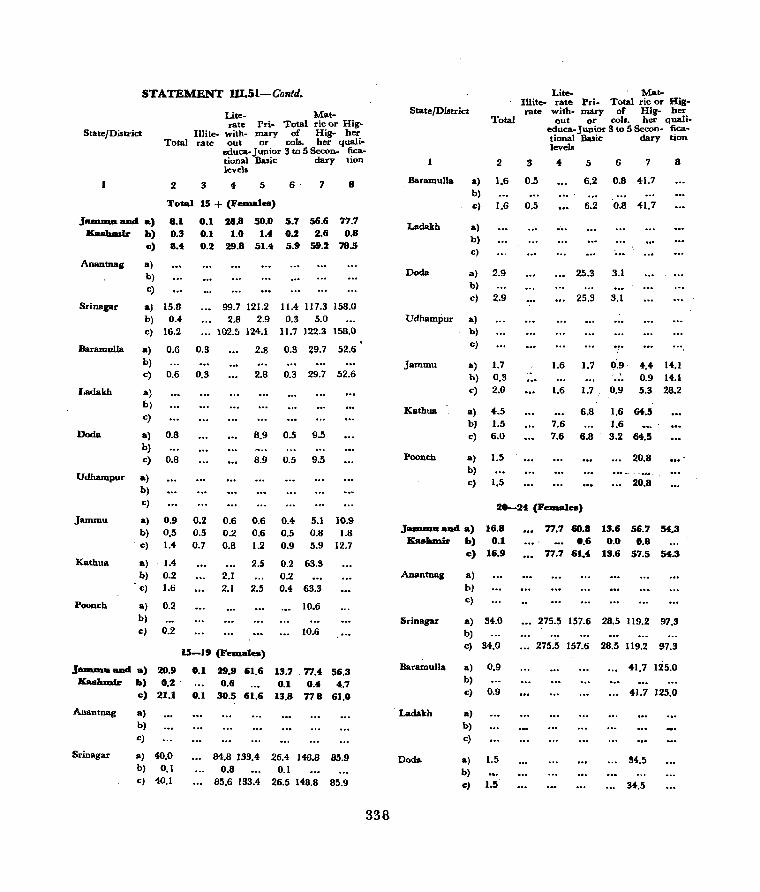
STATEMENT UI.51-Contd.
State/District Total
2
Lite- Mat-rate Pri- Total ric or Hig
Illite- with- mary of Hig- her rate out or cola. her quali-
3
educa-Junior 3 to 5 Secon- ficational Basic dary tion levels
4- 5 6 ' 7 8
Total 15 + (FesnaleB)
JlUIUIla and a) 8.1 Kaehm1r b) 0.3
Il) 8.4
Anantnag
Srinagar
a) b) c)
a) 15.8 b) 0.4 c) 16.2
0.1 28.8 50.0 5.7 56.6 77.7 0.1 1.0 1.4 0.2 2.6 0.8 0.2 29.8 51.4 5.9 59.2 '78.5
99.7 121.2 11.4 117.3 158.0 2.8 2.9 0.3 5.0
102.5 124.1 11.7 122.3 158.0
Baramulla a) 0.6 0.3 b)
2.8 0.3 :':9.7 52.6
c) 0.6 0.3 2.8 0.3 29.7 52.6
Ladakh a) b) c)
Doda a) 0.8 b) c) 0.8
Udhampur a)
Jammu
Kathua
Poonch
b) c)
a) 0.9 b) 0.5 III 1.4
a) 1.4-b) 0.2 Il) 1.6
a) 0.2 b)
c) 0.2
J_a and a) 20.9 Kashmir b) 0.2'
Il) 21.1
Anantnag
Srinagar
a)
b)
c)
a) 40.0 b) 0.1 cl 40.1
8.9 0.5 9.5
8.9 0.5 9.5
0.2 0.6 0.6 0.4 5.1 10.9 0.5 0.2 0.6 0.5 0.8 1.8 0.7 0.8 1.2 0.9 5.9 12.7
2.5 0.2 63.3 2.1 0.2 2.1 2.5 0.4 63.3
10.6
10.6
15-19 (Females)
0.1 29.9 61.6 13.7 '17.4 56.3 0.6 0.1 0.4 4.7
0.1 30.5 61.6 13.8 77 8 61.0
84.8 133.4 26.4 148.8 85.9 0.8 0.1
85.6 133.4 26.5 148.8 85.9
338
State/District
Baramulla
Ladakh
Doda
a)
b)
III
a)
b)
III
Total
2
1.6
1.6
a) 2.9 hI c) 2.9
Udhampur a)
Jammu
Kathua
Pooncb
b)
Il)
a) 1.7 h) 0.3 c) 2.0
a) 4.5 b) 1.5 c) 6.0
a) 1.5 b)
III 1.5
Lite- Mat-Illite- rate Pri- Total ric or Higrate with- mary of Hig- her
out or coIl. her quali.-
3
0.5
0.5
educa-Junior 3 to 5 Secon- ficational Basic clary tion levels
4- 5
6.2
6.2
6 7
O.B 41.7
0.8 41.7
25.3 3.1
25.3 3.1
8
1.6 1.7 1).9 4.4 14.1 0.9 14.1
1.6 1.7.. 0.9 5.3 28.2
6.8 1.6 64.5 7.6 1.6 7.6 6.8 3.2 64.5
20.8
... 20.8
20-24 (Feaaal_)
JlUlUDa alld a) 16.8 Kashmir b) 0.1
Il) 16.9
Anantnag a)
Srinagar
Baramulla
. Laclakh
Docla
b)
Il)
a) 34.0 b)
Il) 34.0
a) b)
cl
a)
b)
Il)
0.9
0.9
a) 1.5 h) c) 1.5'
77.7 60.8 13.6 56.7 54.3 0.6 0.0 0.8
77.7 61.4 13.6 57.5 54.3
275.5 157.6 28.5 119.2 97.3
275.5 157.6 28.5 119.2 97.3
41.7 125.0
41.7 125.0
54.5
34.5
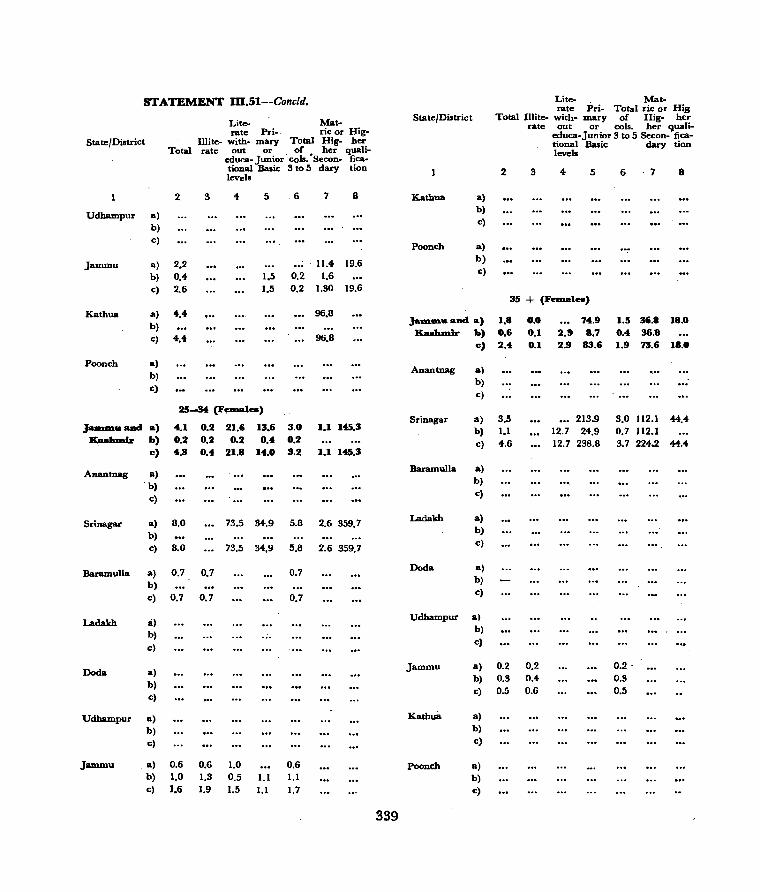
STATEMENT m.51--Concld.
State/District
Udhampur a)
Jammu
Kathua
Poonch
b) c)
a)
b)
c)
a)
b} c)
a)
b)
c)
Total
2
2.2 0.4 2.6
4.4
4.4
Lite- Mat-rate Pri-. ric or Hig-
IIlite- with- mary Total Hig- her rate out or . of • her quali-
3
educa- Junior cols. Secon- ficational Basic 3 to 5 dary tion levels
4 5
1.5 1.5
0.2 0.2
7 8
11.4 19.6 1.6
1.30 19.6
96.8
96.8
25-34 (F ........ _)
JIIDUIlU IUldI a) Ka .... m.. b)
c)
Anantnag a) b)
c)
4.1 0.2 21.6 13.6 3.0 0.2 0.2 0.2 0.4 0.2 4.3 0.4 21.B 14.0 3.2
1.1 145.3
1.1 145.3
Srinagar a) 8.0 b)
73.5 34.9 5.8 2.6 359.7
c) 8.0 73.5 34,9 5.8 2.6 359.7
Baramulla a} 0.7 0.7 b)
Ladakh
Doda
c) 0.7 0.7
Ii)
b)
c)
a} b) c)
Udhampur a)
Jammu
b)
c)
. a) 0.6 b) 1.0 c) 1.6
0.6 1.0 1.3 0.5 1.1 1.9 1.5 1.1
0.7
0.7
0.6 1.1 1.7
339
State/District
Kathua
Poonch
Anantnag
Srinagar
a)
b)
c)
a)
b) c)
a)
b) c)
a) b)
c)
Baramulla a)
Ladakh
Doda
b)
c)
a)
b)
c)
a)
b)
c)
Udhampur a) b)
c)
Lite- Mat-. r,:,-te Pri- Total ric or Hig
Total Illlte- wlth- mary of Hig- her rate out or col.. her quali-
educa-Junior 3 to 5 Secon- ficational Basic dary tion levels
2 3 4 5
35 + (Feaml_)
I.B 0.0 74.9 0.6 0.1 2.9 B.7 2.4 0.1 2.9 83.6
3.5 1.1 4.6
213.9 12.7 24.9 12.7 238.8
6 7 8
1.5 36.8 IB.O 0.4 36.8 1.9 73.6 IB.O
3.0 112.1 44.4 0.7 112.1 3.7 224.2 44.4
Jammu a) 0.2 0.2 0.2 . 0.3 0.5
Kathua
Poonch
b) 0.3 0.4 c) 0.5 0.6
a)
b)
c)
a)
b) c)
3.382 The above data highlights the incidence of unemployment in the urban male and female population of the age of 15 and above classified by educational levels. It is evident from this data that the proportion of males per 1,000 male popUlation of the urban llrea5 above the age of 14 who are seeking employment for the first time is exceeded by Srinaga,r,Jammu and Poonch districts only. In other districts except Doda, the i!lcidence of unemployment varies from 5.6 to 6.7 per 1,000. Doda has returned the lowest proportion of 2.7 per 1,000 only. There is no unemployment in Ladakh.
3.383 In Poonch district, the incidence of males seeking employment for the first time is very high and stands at 14.6 per 1,000.
3.384 The proportion of illiterate males seeking employment for the first time is, when compared with literates without educational levels, fairly low and stands at 3.7 per 1,000 only. This proportion is exceeded by Jammu and ~Donch districts alone and in all other districts except Srinagar, which has nearly the same proportion as that of the State, the corresponding averages are lower than the State average. The proportion of illiterate males seeking employment for the first time in Doda district is exceedingly small.
3.385 In so far as literates without educational levels are concerned, the State average is exceeded by Srinagar and Poonch districts only. Even in Jammu, the corresponding proportion, ~ough very high, when compared with other dilltricts is lower than that of the State.
3.386 Males who have passed primary or junior basic examination and who are seeking employment for the first time claim a proportion of 13 per 1,000 persons possessing such qualifications. All the three valley districts have . returned higher proportions of this category of employment seekers than the State llverage. Poonch has almost the same proportion as that of the State and in other districts, the incidence of males with these qualifications seeking employ~ ment for the first tiIlle is less pronounced than the average for the State.
340
3.387 Column 6 of the statement gives the aggrega,te proportion of males who are either illiterate or possess' lower qualifications than matriculation or higher secondary. The proportion of such persoDs in the State as a whoLe stands at 6.1 per 1,000 persons inhabiting the urban areas of the State who are illiterate or who do not possess qualifications higher than primary or junior basic examinations. In this case also, the State average is exceeded by Srinagar, Jammu and Poonch districts 9nly.
3.388 Males with matriculation or high,er secondary qualifications number 22.9 per 1,000. This average is exceeded by Anantnag, Srinagar, Baramulla and Kathua districts only. Poonch has almost the same proportion as that of the State.
3.389 The State proportion of 33.2 pllir thousand of males possessing qualifications higher than matriculation and equivalent examinations is exceeded by Srinagar district only where . the corresponding proportion stands at 45.7 per 1,000. The incidence of this category of employment seekers in Jammu stands at 26.5 only ·which though lower than the State average is much higher when compared with other, diskicts. In this case, the lowest proportion has been returned from district Anantnag.
3.390 We may now cpnsider the incidence of males above the age of 14 "living in urban areas who were employed before and are now out of employment and seek work. A comparison of the data shown against (a) and (b) indicates that the, proportions of this category of employment seekers are with very few exceptions lower than the corresponding proportions of those seeking employment for the first time. The State average of such persons stands at 5.8 per 1,000. This is exceeded by Udhampur, Jammu and Kathua alone .
3.391 This is also true of illiterate and literate males without educational levels whose incidence in the three valley districts, Dada and Poonch is much less pronounced when compared with the State average and the corresponding propor~ tions of districts Udhampur,jammu and Kathua.
3.392 Males with primary or junior basic qualification who are out of employment and are seeking work number 10.1 per 1,000 in the whole State.' This average is" exceeded by Srinagar, Jammu and Kathua districts only.
3.393 The aggregate average of illiterate and literate males without educational qualifications and males with primary or junior basic qualifications stands at 5.4 per 1,000. The corres-
"ponding proportions in Anantnag, Srinagar, Baramulla, Doda and Poonch are lower than the State proportion. Jammu, Udhampur and Kathua are, however, conspicuous for very high proportions of this category of employment seekers.
3.394 The State average of 8.4 per 1,000 of matriculates and other males possessing equivalent qualifications is exceeded by all districts except Anantnag, Srinagar, Doda and Poonch. In Kathua, the proportion of males of this category stands at 20.7 per ] ,000 as against 4.9 of Doda and 6.3 of Poonch. Even in Srinagar, the corresponding proportion stands at 6.5 per ],000 only.
3.395 There are no males possessing higher quaJifications above of the age of 14 in the urban areas of BaramulIa, Dada and Udhampur who were employed before and being out of work now are seeking employment. Even in Srinagar and Jammu, the proportions of such persons do not exceed 5.2 and 5.4 per 1,000 respectively. Anantnag has, however, returned a very high proportion of this category of unemployed males at 19.8 per 1,000.
3.396 We now take u.p the other part of the statement giving the data regarding females. It is E'vident that the incidence of females above the age of 14 who live in urban areas and are seeking employment for the first time is pronounced in the district of Srinagar only. In Anantnag, Lad~kh and Udhampur, there are no such females at all and in BaramuIla, "Doda and Poonch, their proportions are exceedingly small. Jammu and Kathua have returned slightly higher proportions but they are incomparable in size with that of Srinagar or of the State as a whole.
341
3.397 The proportions of illiterate women of this age who are in search of employment for the first time are negUgible even in Baramulla and Jammu where alone such females are to be found.
3.398 Literate females possessing no educational qualification who seek employment for the first time have been returned in very high proportion in district Srinagar. The only other district in the State where such females are traceable is Jammu but even in this case the proportion stands at 0.6 per 1,000 as against 99.7 of Srinagar and 28.8 of the State as a whole.
3.399 Similarly, females with primary or junior basic qualifications have been returned in high proportions from the district of Srinagar alone. In other districts where such females are found, the corresponding proportions are exceedingly low when compared wit.h that of the State. Among these, Doda has the highest proportion of 8.9 per 1,000 as against 121.2 of Srinagar and 50 per 1,000 of the State. There are no such females in Anantnag, Ladakh, Udhampur and Poonch.
3.400 As may well be presumed, the highest proportion of' illiterate females and those without educational qualifications or possessing primary or junior basic qualifications has been returned from Srinagar at 11.4 per 1,000 as against 5.7 of the State.
3.401 Compared to other categories, the proportions of females above the age of 14 who have passed matriculation or higher secondary examination are comparatively high in several districts of the State though, except Srinagar and Kathua, they are lower than the State proportion. In Srinagar, 117.3 per 1,000 femall!!! who have passed matriculation or higher secondary examination seek employment for the first time as against 56.6 per 1,000 of the entire State. The corresponding proportion in the case of Kathua stands at 63.3 and in Baramulla at 29.7. In Anantnag, Ladakh and Udhampur, there are" no such females.
3.402 The highest proportion of females seeking employment for the first time bas been "returned
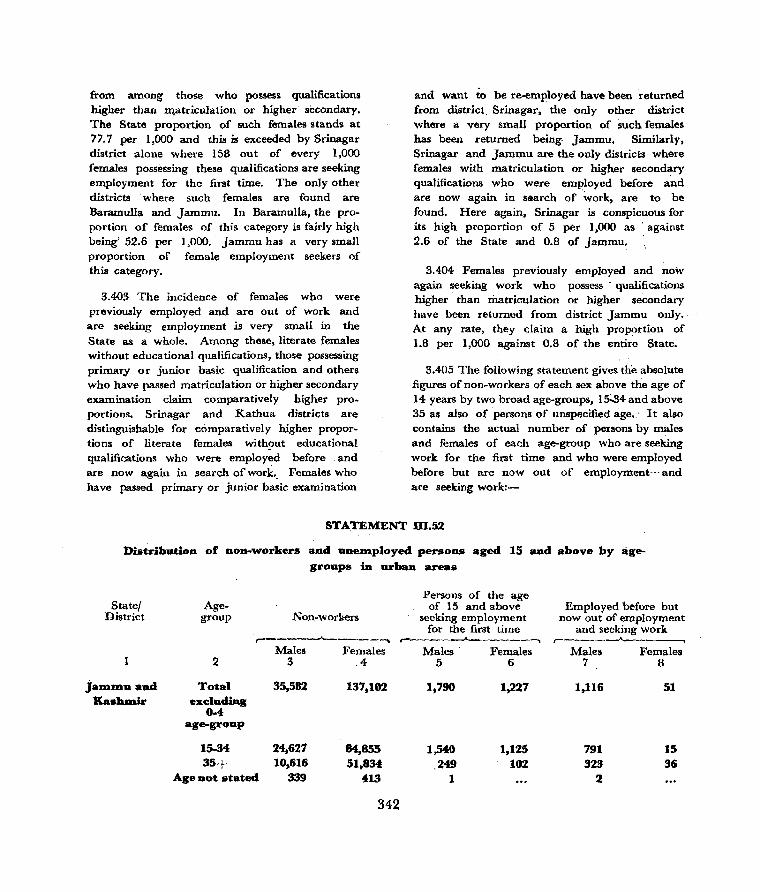
from among those who possess qualifications higher than IIlatriculation or higher secondary. The State proportion of such females stands at 77.7 per 1,000 and this is exceeded by Srinagar district alone where 158 out of every 1,000 females possessing these qualifications are seeking employment for the first time. The only other districts where such females are found are Baramulla and Jammu. In Baramulla, the proportion of females of this category is fairly high being' 52.6 per 1,000. Jammu has a very small proportion of female employment seekers of this category.
3.403 The incidence of females who were previously employed and are out of work and are seeking employment is very small in the State as a whole. Among these, literate females without educational qualifications, those possessing primary or junior basic qualification and others who have passed matriculation or higher secondary examination claim comparatively higher proportions. Srinagar and Kathua districts are distinguishable for comparatively higher proportions of literate females without educational qualifications who were employed before and are now again in search of work., Females who have passed primary or junior basic examination
and want to be re-employed have been returned from district. Srinagar, the only other district where a very small proportion of such females has been returned being- Jammu. Similarly, Srinagar and Jammu are the only districts where females with matriculation or higher secondary qualifications who were employed before and are now again in search of work, are to be found. Here again, Srinagar is conspicuous for its high proportion of 5 per 1,000 as . against 2.6 of the State and 0.8 of Jammu~
3.404 Females previously employed and now again seeking work who possess - qualifications higher than matriculation or higher secondary have been returned from district Jammu only. At any rate, they claim a high proportion of 1.8 per 1,000 against 0.8 of the entire State.
3.405 The following statement gives the absolute figures of non-workers of each sex above tlie age of 14 years by two broad age-groups, 1s;.34 and above 35 as also of persons of unspecified age.· I t also contains the actual number of persons by maies and females of each age-group who are seeking work for the first time and who were employed before but are now out of employment--'~nd
are seeking work:-
STATEMENT m.S2
Distribution of nOll-workers au.cI QneD1ployed. persons aged IS au.cI above by agegr01l.ps in urban areas
State/ District
jaD1D1U and Ka.hm.ir
Agegroup Non-work-ers
r------~---.--_.....
2
Total exclucliog
0-4 age-group
15-34 35+
Age lIot stated
Males Females 3 4
35,582
24,621 10,616
339
137,102
84,855 51.834
413
342
Persons of the age of 15 and above
seeking employment for the first time
r-----~-.....__-----__.
Males Females 5 6
1,790
1,540 249
1
1.227
1,125 102
Employed before but now out of employment
and seeking work r----~__"A..,,_------,
l\1ales Females 7 8
1,116
191 323
2
51
15 36

STATEMENT m.52-Concld.
State! Persons of the age
Employed before but Age. of 15 and above District group Non.workers seeking employment now out of employment
for the first time and seeking work r------J...----..... r-----A------. ,--___ -..A.-___ ---.
Males Females Males Females Males Females
1 2 3 4 5 6 7 8
Anantnag Total 2,139 9,006 86 56
15·34 1,357 5,680 63 45
35-1- 776 3,291 23 II
Age not stated 6 35
Srinagar Total 16,950 70,880 973 1,179 425 33
1$034 11,885 43,673 804 1,079 231 1
35+ 4,945 27,063 168 100 192 32
Age not stated 120 144 2
Baramulla Total 2,619 11,894 106 9 4-6
15-34 1,812 7,277 92 9 34-
35+ 768 4,588 14 12
Age not stated 39 29
Ladakh Total 232 208
15·3f. 132 103
35+ 93 97 Age not stated 7 8
Doda Total 766 2,832 14 3 8
J5·34 566 1,823 14 3 6
35+ 162 963 2 ... Age not stated 38 46
Udhampur Total 881 3,751 35 55
15-34- 634- 2,366 33 46
35+ 237 1,375 2 9
Age not stated 10 10
Jammu Total 9,773 30,828 470 29 440 17
15-34 6,690 19,138 441 27 370 1,3
35+ 3,021 11,616 29 2 70 4
Age not stated 62 74 ... Kathua Total 1,089 3,913 32 6 67 1
15-34 689 2,360 32 6 46 I 35+ 378 1,523 21
Age not stated 22 30
Poonch Total 1,133 3,790 74 1 19
15-34 862 2,435 61 13
35+ 236 1,318 13 6
Age notstated 35 37
343

3.406 On the basis of these figures, the proportions per 1,000 of male and female nonworkers seeking employment for the first time of each age-group and those out of employment
now and seeking work again to the total nonworking population of the respective age-group of each sex are given in the following statement :.
STATEMENT IIL53
Proportion per 1,000 of male aad female non-workers seeking employment for the &.r&t time aad those out of employment now aad seeking work ag_iil to the
total non-working population of _c:h ses
State I District
JallUJlu and Kashmir a)
b)
c:)
Anantnag
Srinagar
Baramulla
Ladakh
Doda
Udhampur
Jammu
a)
b)
c)
a)
b)
c)
a)
b)
c)
a)
b)
c)
a)
b)
c)
a)
b)
c)
a)
b)
c)
Males Females r----_-.A..----_.---...... ,--____ .A. ______ --,
Total
2
50.3
31.4
81.7
40.2
26.2
66.4
57.4
25.1
82.5
40.5
17.6
58.1
18.3
10.4-
28.7
39.7
62.4
102.1
48.1
4-5.0
93.1
15-34-
3
62.5
32.1
94.6
46.4-
33.2
79.6
67.6
19.4-
87.0
50.8
18.8
69.6
24.7
10.6
35.3
52.1
72.6
124.7
65.9
55.3
121.2
344
35+
4
23.5
30.4
53.9
29.6
14.2
43.8
34.0
3S.S
72.8
IS.2
15.6
33.8
12.3
12.3
S,4
38.0
46A
9.6
23.2
32.S
Total
5
B.9
0.4
9.3
16.6
0.5
17.1
0.8
0.8
1.1
I. I
0.9
0.6
1.5
15-34-
6
13.3
0.2
13.5
24.7
0.0
24.7
1.2
1.2
1.6
1.6
lA
0.7
2.1
35+
7
2.0
0.7 2.7
3.7
_1.2
4.!l
0.2
0.3
0.5

STATEMENT DI.53-Concld.
State I District Males Females ---.J>-_ ____ """'"'
,--------"-------~"""'"' Total 15-34 35+ Total 15-34- 35+
2 3 4- 5 6 7
Kathua a) 29.4- 46.4- 1.5 2.5
b) 6L,5 66.8 55.6 0.3 0.4-
c) 90.9 113.2 55.6 1.8 2.9
Poonch a) 65.3 70.8 55.1 0.3 0.4-
b) 16.8 15.1 25.4-
c) 82.1 85.9 80.5 0.3 0.4-
JVote:- a) b)
Proportion per 1,000 of p<)pulation of the age of 15 & above Reeking employment ror the first time to non·workers Proportion per 1,000 population of the age of 15 & above who were employed before but are now out of employment and seek work to non-workers
c) a+b
3.407 This data highlights certain important features of non-workers who are in search of' employment. It indicates that over 5% male non-workers above the age of 14 and 0.9% females of t he same age are seeking employment for the first time. The corresponding proportion Qf males who were employed befoQ! but are now without work 'and are in search of it is over 3%. There are, however, very few females who are out of employment and are trying to resume work.
3.408 It is also clear that among males the age-group 15-34 claims the highest proportion of those seek~ng work for the first time. The proportion of other males is comparatively very small. Further, the incidence of females in the age-group 15-34 seeking work for the first time is very much less pronounced when compared with males. As for females of the age of 35 and above, the corresponding proportion is exc«:edingly small.
3.409 Among the districts, Poonch has the highest proportion of males seeking employment for the first time. Among other districts, Srinagar claims a comparatively high proportion.
345
3,410 So far as females are concerned, the only district where the incidence of those seeking employment for the first time is high, is Srinagar. In other districts, the relative proportions are fairly small.
3.411 Poonch, Srinagar -and Jammu are again distinguishable from other districts for the high proportion of males in the age-group 15-34 who seek employment for the first time. In this case also, Srinagar is the only district which has returned a high proportion of females.
Uneuaploylnellt in Cities
3.412 In this context, it may, be of interest to have some idea of the incidence of unemployment in the two cities of Srinagar and Jammu in reSpect of persons aged 15 and above (a) seeking employment for the first time and (b) others who were employed before but being now out of employment are seeking work. The subjoined statement gives the proportions per 1,000 unemployed persons of t'ach of these categories by sex and their distribution by age-groups and educational levels.
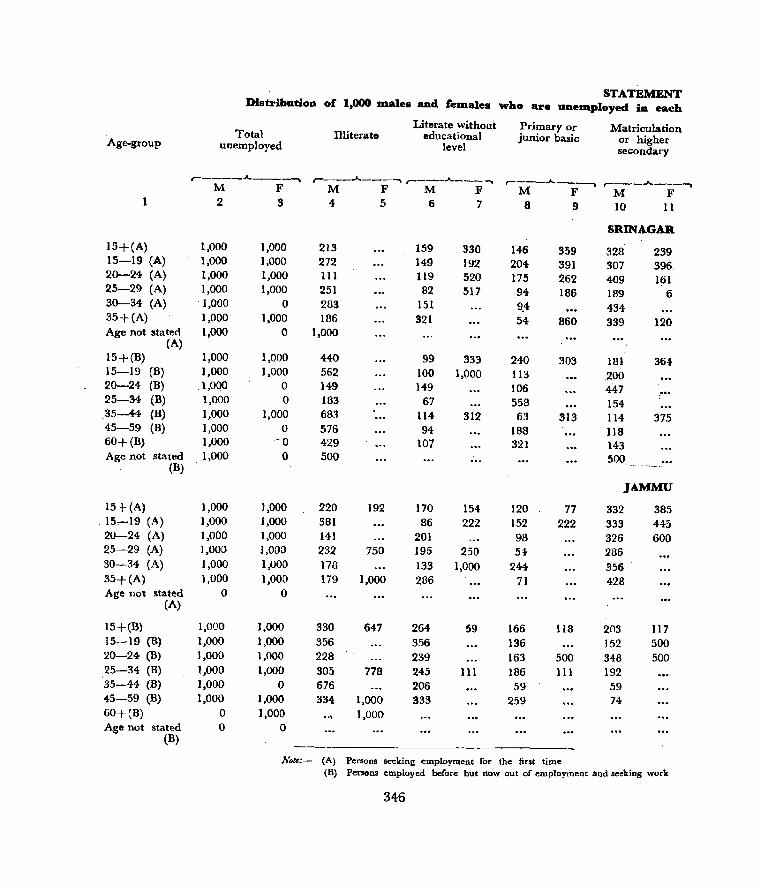
Distribution of 1,000 m.ale. and fem.ale. 'Who are STATEMENT
unem.ployecl in each
Literate without Primary or Matriculation Total Illiterate educational junior basic or higher Age--group unemployed level secondary
r-----"'------. ,...._-..A.. ___ ~ r-----A.-----.. ,---__ ..It._---. ,-_-..A.. ____ "'-' M F M F M F M F M F 2 3 4 5 6 7 8 9 10 11
SRIN4GAR
15+(A) 1,000 1,000 213 159 330 146 359 328 239 15-19 (A) 1,000 1,000 272 149 192 204- 391 307 396. 20-24 (A) 1,000 1,000 111 119 520 175 262 409 161 25-29 (A) 1,000 1,000 251 82 517 94- 186 189 6 30-34 (A) 1,000 ° 283 151 9.4 434 35+(A) 1,000 1,000 186 :321 54 860 339 120 Age not stated 1,000 a 1,000
(A) 15+(B) 1,000 1,000 440 99 333 240 303 181 364 15-19 (B) 1,000 1,000 562 100 1,000 113 .200 20-24 (B) 1,000 0 149 149 106 447 25-34 (B) 1,000 ° 183 67 558 154-35-44 (B) 1,000 1,000 683 114- 312 63 313 114 375 45-59 (B) 1,000 ° 576 94 188 i 18 60+ (B) 1,000 .- 0 429 107 321 143 Age not stated 1,000
(B) 0 500 500
JAMMU
15+ (A) 1,000 ],000 220 192 170 154- 120 77 332 385 15.,-19 (A) 1,000 1,000 381 86 222 152 222 333 445 20-24 (A) 1,000 1,000 141 201 98 326 600 25-29 (A) 1,000 1,000 232 750 195 250 .H 286 30-34 (A) 1,000 1,000 178 133 1,000 244 356 35+ (A) 1,000 1,000 179 1,000 286 71 428 Age not stated 0 0
(A)
15+(B) 1,000 1,000 330 647 264 59 166 118 203 117 15-19 (B) 1,000 1,000 356 3.'16 136 152 500 20-24 (B) 1,000 1,000 228 239 163 500 348 500 25-34 (B) 1,000 1,000 305 778 245 111 186 III 192 35-44 (B) 1,000 0 676 206 59 59 45-59 (B) 1,000 1,000 334 1,000 333 259 74-60+ (B) a 1,000 1,000 Age not stated 0 0
(B)
N.u:- (A) Persons seeking employment for the first time (B) Persons employed before but now out of employment and seeking work
346
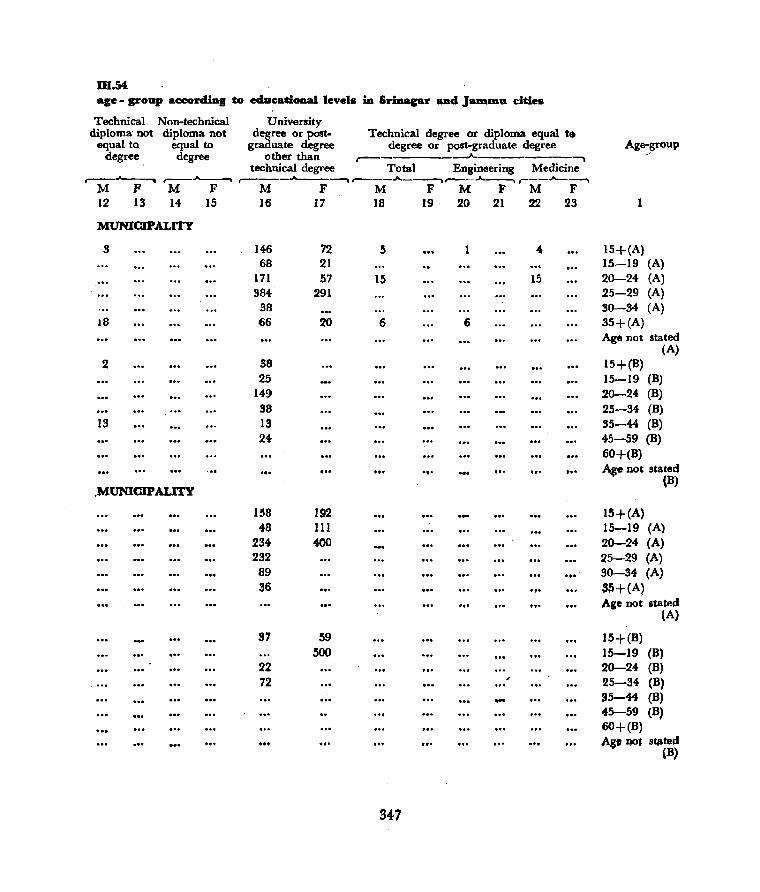
m.M age - group aceorcliug to educational levels in Srinagar and Jammu cities
Technical Non-technical diploma not diploma not
equaltQ equal to degree degree
University degree or post- Technical degree or diploma equal tGl
graduate degree degree or post-graduate degree other than r-- __._---------,
technical degree Total Engineering Medicine r--""'____' r--~ ,-___ .A.. __ ---. ,--__ Jt.._~,___Jt-_ _, ,--"""_--~
M F M F M F M F M F M F 12 13. 14 15 16 17 18 19· 20 21 22 23
MUNICIPALITY
S ]46 72 5 1 .. 68 21
171 57 15 15 384 291
38 J8 66 20 6 6
2 S8 25
149 S8
13 IS 24
.,. .MUNICIPALITY
138 192 48 III
234 400 232 89 36
-,. ".
37 39 300
22 72
S47
Ag&o_group
1
15+(A) 15-19 (A) 20-24 (A) 25-29 (A) 30-34 (A) 35+ (A) Age not stated
(A) 15+(B) 15-19 (B) 20-24 (B) 25-34- (B) 35-44 (B) 45-59 (B) 60+<B) Ase not stated
(B)
15+(A) 15-19 CAl 20-24 (A) 25-29 CA) 30--34 CA)
'5+(A) Age not stated
(A)
15+(B) 15-19 (B) 20-24 (B) 25-34 (B) 95-44 (B) "'5-59 (B) 60+ (B) Aso QO~ s~ted
(B)
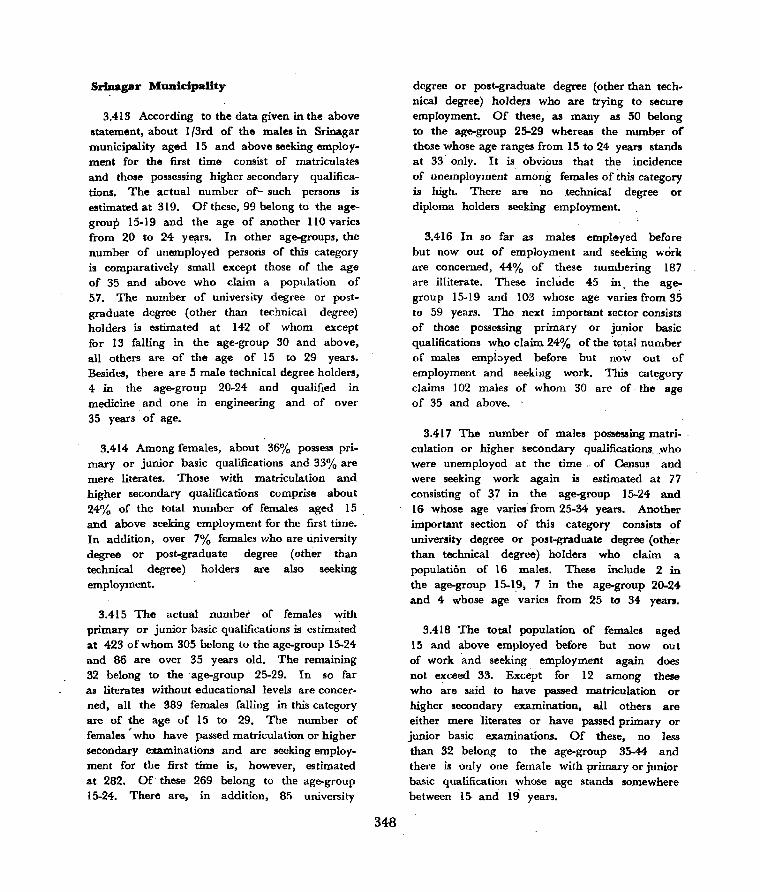
Srlaagar Municipality
3.413 According to the data given in the above statement, about 1 (3rd of the males in Srinagar municipality aged 15 and above seeking employment for the first time consist of matriculates and those possessing higher secondary qualifications. The actual number of- such persons is estimated at 319. Of these, 99 belong to the agegroup 15-19 and the age of another 110 varies from 20 to 24 yellrs. In other age-groups, the number of unemployed persons of this category is compat'atively small except those of the age of 35 and above who claim a population of 5-7. The number of university degree or postgraduate degree (other than technical degree) holders is estimated at 142 of whom except for 13 falling in the age-group 30 and above, all others are of the age of 15 to 29 years. Besides, there are 5 male technical degree holders, 4 in the age-group 20-24 and qualified in medicine and one in engineering and of over 35 years of age.
3.414 Among females, about 36% possess primary or junior basic qualifications and 33% are mere literates. Those with matriculation and higher secondary qualifications comprise about 24% of the total number of females aged 15 and above seeking employment for the first time. In addition, over 7% females who are university degree or post-graduate degree (other than technical degree) holders are also seeking employment.
3.415 The actual number of females with primary or junior basic qualificatioIll! is estimated at 423 of whom 305 belong to the age-group 15-24 and 86 are over 35 years old. The remaining 32 belong to the 'age-group 25-29. In so far as literates without educational levels are concer· ned, all the 389 females falling in this category are of the age of 15 to 29. The number of females' who have passed matriculation or higher secondary examinations and are seeking employment for the first time is, however, estimated at 282. Of these 269 belong to the age-group 15-24. There are, in addition, 85 university
348
degree or post-graduate degree (other than technical degree) holde.rs who are trying to secure employment. Of these, as many as 50 belong to the age-group 25-29 whereas the number of those whose age ranges from 15 to 24 years stands at 33' only. It is obvious that the incidence of unemployment among females of this category is high. There are no technical degree or diploma holders seeking employment.
3.416 In so far as males emple>yed before but now out of employment and seeking work are concerned, 44%, of these numbering 187 are illiterate. These include 45 in. the agegroup 15-19 and 103 whose age varies from 35 to 59 years. The next important lector consists of those possessing primary or junior basic qualifications who claim 24% of the to~al number of males employed before but now out of employment and seeking work. This category claims 102 males of whom 30 are of· the age of 35 and above. .
3.417 The number of males possessing matri- . culatiDn or higher secondary qualifications.,who were unemployed at the time" of Census and were seeking work again is estimated at 77 consisting of 37 in the age-group 15-24 and 16 whose age varies' from 25-34 years. Another important section of this category consists of university degree or post-graduate degree (other than technical degree) holders who claim a population of 16 males. These include 2 in the age-group 15-19, 7 in the age-group 20-24 and 4 whose age varies from 25 to 34 years.
3.418 The total population of females aged 15 and above employed before but now out of work 'and seeking employment again does not exceed 33. Except for 12 among these who are said to have passed matriculation or higher secondary examination, all others are either mere 'literates or have passed primary or junior basic examinations. Of these, no less than 32 belong to the age-group 35-44 and there is only one female with primary or junior basic qualification whose age stands somewhere between 15, and 19 years.
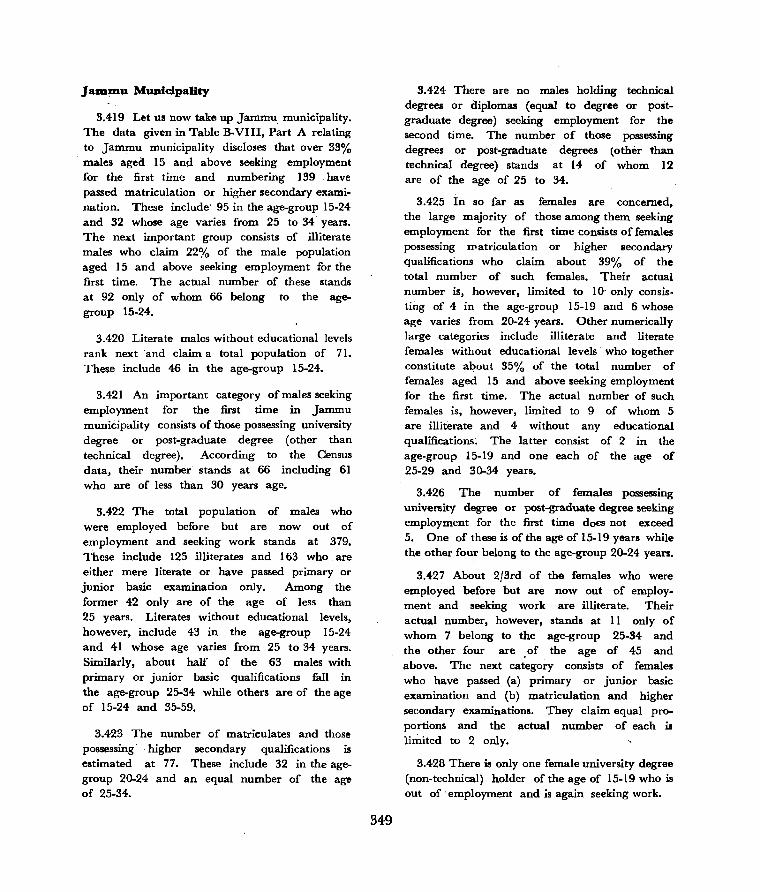
Jal1l~u MUDidpaUty
3.419 Let us now take up Jammu, municipality. The data given in Table B-VIII, Part A relating to Jammu municipality discloses that over 33%
. males aged 15 and above seeking employment for the first time and numbering 139 have passed matriculation or higher secondary examination. These include' 95 in the age-group 15-24 and 32 whose age varies from 25 to 34· years. The next important group consists of illiterate males who claim 22% of the male population aged 15 and above seeking employment for the first time. The actual. number of these stands at 92 only of whom 66 belong to the agegroup 15-24.
3.420 Literate males without educational levels rank next ·and claim a total population of 71. These include 46 in the age-group 15-24.
3.421 An important category of males seeking employment for the first time in Jammu muniCipality consists of those possessing university degree 01' post-graduate degree (other than technical degree). According to the Census data, their number stands at 66 including 61 who are of less than 30 years age.
3.422 The total population of males who were employed before but are now out of employment and seeking work stands at 379. These include 125 illiterates and 163 who are either mere literate or have passed primary or junior basic examination only. Among the former 42 only are of the age of less than 25 years. Literates without educational levels, however, include 43 in the age-group 15-24 and 41 whose age varies from 25 to 34 years. Similarly, about half of the 63 males with primary or junior basic qualifications fall in the age-group 25-34 while others are of the age of 15-24 and 35-59.
3.423 The number of matrIculates and those possessing . higher secondary qualifications is estimated at 77. These include 32 in the agegroup 20-24 and an equal number of the a~ of 25-34.
349
3.424 There are no males holding technical degrees or diplomas (equal to degree or postgraduate degree) seeking employment for the second time. The number of those possessing degrees or post-graduate degrees (other than technical degree) stands at 14 of whom 12 are of the age of 25 to 34.
3.425 In so far as females are concerned, the large majority of those among them seeking employment for the first time consists of females possessing lIlatriculation or higher secondary qualifications who claim about 39% of the total number of such females. Their actual number is, however, limited to 10' only consisting of 4 in the age-group 15-19 and 6 whose age varies from 20-24 years. Other numerically large categories include illiterate and literate females without educational levels· who together constitute about 35% of the total number of females aged 15 and above seeking employment for the first time. The actual number of such females is, however, limited to 9 of whom 5 are illiterate and 4 without any educational qualifications~ The latter consist of 2 In the age·group 15-19 and one each of the age of 25-29 and 30-34 years.
3.426 The number of females possessing university degree or post-graduate degree seeking employment for the first time does not exceed 5. One of these is of the age of 15-19 years while the other four belong to the age-group 20-24 years.
3.427 About 2/3rd of the females who were employed before but are now out of employment and seeking work are illiterate. Their actual number, however, stands at II only of whom 7 belong to the age-group 25-34 and the other four are. of the age of 45 and above. The next category consists of females who have passed (a) primary or junior basic examination and (b) matriculation and higher secondary examinations. They claim equal proportions and the actual number of each is limited to 2 only.
3.428 There is only one female university degree (non-technical) holder of the age of 15-19 who is out of· employment and is again seeking work.

:oastribution or Workers :in each Occupation by Sex and Educational Levels
VI, Part II-B, General Economic Tables of
Jammu and Kashmir; gives the classification by
Occupational Divisions of persons at work other 3.429 Table B-VI which will be found in Volume
City
Srinagar City
Jammu City
STATEMENT
Distribution or 1,000 workers in each occupational division and in
Occupational
division
2
Total literate workers
F
4
Literate (without
educational levels)
M.
5
F
6
Primary or
junior basic
M
7
F M
8 9_
Matriculation or bigher
secondary
F
10
Technical Non-techdiploma. nical dip-
not lorna not equal to equal to degree degree
University degree or
post-graduate degree other
than technical degree
M
11
F M F M' F
12 13 14 15 16
All 1,000 1,000 358 206 227 235 311 323 7 3 18 67,' 86 Divisions o 1 2 3 4 5 6 7-8 9 X
1,000 I,COO 1,000 1,000 1,000 1,000 1,000 1,000 1,000 0 1,000 - 0 1,000 1,000 1,000 l,eOO 1,000 1,000 1,000 0
All 1,000 1,000 Divisions. o 1,000 1,000 1 1,000 1,000 2 1,000 1,000 3 1,000 1,000 4 1,000 1,000 5 1,000 0 6 1,000 I,oeo 7-8 1,000 1,000 9 1,0CO 1,000 X 1,000 a
Note :-
257 148 388 0 238 276 431 500 352 0 333 0 474 1,000 516 616 394 26 756 0
364 199
133 133 115 0 153 529 248 334 252 1,000 692 0 594 0 635 692 495 929
o 0
75 211 417 138 316 328 156 244 487 284 0 248 317 0 245
o 0 667 335 0 165 356 140 113 424 769 76 128 0 87
200 285 322
103 305 402 161 0 389 123 118 611 413 333 278 238 0 346
o 0 77 179 0 206 212 283 145 279 0 192 238 0 238
1. N = Negligible
351 526 350
o o o o
163 77 o
272
301 200 294
o o o o
25 o o
19 1
2 6 o o 1 2
23 o 4
26 2 o o 3 o o o o o
5 o o o o o o o o o o
o o o o o o o o o o
9 25 65 97 o 0 136 158 o 8 112 49 o 0 29 500 o 0 75 0 o 0 0 0 o 0 22·····---0
11 23 o 0 o 0 79 128 o 0 29 0
N
o o o o o o
N o o
o 98
o 243 o 325 o ll3 o 60 o 159 o 231 o 21 o 8 o 34 o 524
103
97 800 59
333 o o
1,000 o
71 o
2. Division 0 . = Professional, Technical and Related Workers 1 = Administrative, Executive and Managerial Workers 2 = Clerical and Related Workers 3 = Sales Workers 4 = Farmers, Fishermen, Hunters, Loggers and Related Worke,"
3-50

than at cultivation by Sex, Broad Age-groups and Educational levels in Urban Areas of the State and its . constituent districts.' The table
does not, however, give similar data in respect of the individual pities. This data is given in the subjoined statement:-
IIL55 ,
each sex by educational levels in urban areas only
Technical degree or diploma equal -to degree or post-graduate degree ,-_____ ~ _____ ------------.....A...------------------------_.... Veterinary
Total Engi,neering . Medicine Agriculture and Techno- Teaching Others Dairying logy
r--_..A..--.., . r--.A.---"""":,,, ,---A-_-----" ,-_A ______
M F
,-_..A._~ r--.Jt...-.......
M F M F M F 1'.1 F M F
17
29
158 9 5 2
11 o 3 2 4 o
12
92 8 N I 2 o o
N o o
18 19
129 3
163 IS o 1
73 2 o 1 o 7 o 0 o 1
58 0 o 0 o 0
141
164 7 o 2 o 0 o 0 o 0 o 0 o 0 o N o 0 o 0
20 21
o 4
o 23 o 0 o o I o 0 o 0 o 2 o 0 o 0 o 0
o
o o o o o o o o o o
8 4 o o o o o o o o
22
13
8 o
49 o o o o o o o
16
19 o o o o o o o o o
23
1 3
o 4 o
N I 2 o
o 1 2 o o o o o
5 = Miners, Quarrymen and Related Workers
24 25 26
o o
o 4 0 .0 0 0 o N 0 000 000 000 000 000 o 0 0 000
o N 0
o 0 o 0 000 000 000 o 0 ,0 o 0 0 000 000 000
6 = Workers in Transport and Communication Occupations
27
o
o o o o o o o o o o
N
o o
N o o o o o o o
28 29
o 20
o 114 o 5 o 1 o N o 0 o 0 o 0 o 1 o 2 o 0
o 9
o 75 o 0 o 0 o 0 o 0 o 0 o 0 o 0 o 0 o 0
7-8 = Craftsmen, Production Process Workers and Labourers, not elsewhere classified 9 = Service, Sport and Recreation Workers X = Workers not classifiable by Occupation
351
30 31
116 N
155 o 0
24 0 o 0 o 0 o 0 o 0
58 0 o 0 o 0
125 0
145 0 o 0 o 0 o 0 o 0 o 0 o 0 o (') o 0 o 0
32
o
o o o o o o o o o o o
o o o o o o o o o o
City
Srinagar City
Jammu City
3.430 A closer study of the statistics given in Subsidiary Table B-VI.l and the corresponding data relating to the cities shows certain distinctive features in some of the districts and cities as compared with others in so far as the incidence of employment of literate male and female workers with different educational levels in: various occupations is concerned. In the case of males, following are some of the patent and easily discernible features:-
I. There are no literate males employed in mining and quarrying etc. (Division 5) in any district of the State except Srinagar and Jammu.
2. All the male sales workers (Division 3), farmers, hunters etc. (Division 4) and transport and communication workers (Division 6) in Ladakh are mere literates.
3. Except for Anantnag and Ladakh districts, majority of professional and technical workers (Division 0) in all other districts have passed matriculation and higher examinations. The highest proportions of matriculates employed as professional and technical workers have been returned from Kathua and Baramulla districts. In Ladakh only 5.5% of the total number of literate male workers in Division 0 possess higher qualifications than the primary or basic school examination.
Non-technical diploma holders are employed as professional and technical workers in Srinagar, Doda and Jammu districts only but even here, the proportions of such workers are exceedingly small.
University degree holders are employed in professional or technical assignments in every district of the State. The highest proportion of such workers has been returned from Jammu at over 24% and the lowest from Ladakh at 1.1% only.
Srinagar district has the highest proportion of technical degree holders employed in the occupations represent;d by Division O. The lowest proportion has been returned from Bal1lmulla district.
352
4. The statistics relating to the two cities show that the largest number tif literate male workers of Division 0 consists of matriculates. In Jammu, non-technical degree holders claim a proportion of 24.3% as against 6.5% only of Srinagar. The deficiency is . set off to some extent by the higher proportion of technical degree holders in Srinagar.
5. There is no district in the State in which nontechnical diploma holders work in administrative, executive and managerial assignments (Division 1). Even the technical diploma holders are conspicuous by their absence in Anantnag, Doda, Udhampur. Kathua and Poonch. Although the proportion .. of technical diploma holders employed as administrative and executive workes in Ladakh is the highest and stands at 37.5%, their actual number is lim:ted to 3 only. "
Ladakh and Jammu are the only districts in the State where majority of administrative and executive workers possess matriculation and higher qualifications. There is, however, a huge disparity between the actual number of such workers in the two districts which stands at 7 and 1,132 respectively. In other districts; majority of the workers in this Division consist either of those who are mere literates 01" who have passed primary or basic school examination.
Ladakh is also the only district in which none of the administrative, executive and managerial workers holds any technical or nontechnical degree. Technical degree holders are found in the districts of Srinagar and Jammu only but even here, their propdrtions are exceedingly low.
University degree holders are employed as administrative and executive workers in every district of the State except Ladakh. Jammu has the highest and Baramulla the lowest proportion of such workers.
Non-technical diploma holders are not employed in occupations represented by Division I in either of the two cities of Srinagar and Jammu. The proportion of non-technical degree holders in Jammu, however, stands at 32.5% as against 13.6% of Srinagar.
6. The proportion of males who are mere literates and are employed as administrative and executive workers in Srinagar city is 39% of the total number of male workers in Division 1. The corresponding proportion in Jammu stands at 12% only.
7. Srinagar, Jammu, Udhampur and Poonch are the only districts. where the proportions of male workers who are mere literates or have passed primary or junior basic' examination are less than 50% of the total number of male literate workers in Division 2. In all other districts, majority of the workers employed as clerks are under-matriculates. The proportion of workers possessing lower qualifications than matriculation jn Ladakh is the highest and
stands at 94%.
Matriculates claim the highest proportion of workers engaged as clerks etc. (Division 2) in all the districts of the State except Anantnag; Baramulla and Ladakh. Ml\iority of the clerical workers in Anantnag, Baramulla, Ladakh, Doda and Kathua districts consist of mere literates or those who have passed primary or junior basic examination.
Technical diploma holders are also employed as clerical workers in Srinagar, Ladakh, Jammu and POunch, but their proportions are exceedingly small.
Non-technical diploma holders are not engaged in clerical assignments in any district of the State. There are only three districts, viz., Srinagar, Baramulla and Jammu, in which a very small proportion of clerical workers consists of technical degree holders.
8. In most of the districts, majority of the sales. workers (Division 3) are mere literates. Srinagar, Jam.nu and Kathua are the only exceptions but even here, the proportions of sales workers possessing no educational qualifications vary from 34.3 to 49.4%. As stated already, there is not a single sales worker in Ladakh who has passed any examination.
The next highest proportion of sales workers in almost all the districts of the State
353
consists of those possessing primary or basic school certificates only.
The proportions of matriculates who work as salesmen in Srinagar and Jammu districts are the higv,est when compared with other districts of the State. In Srinagar, a small proportion of salesmen consists of technical diploma holders also.
Non-technical diploma holders are not employed as salesmen in any district of the State. Even so far as ·technical degree holders are concerned, Srinagar and Jammu are the only districts where 6 penons with these qualifications a:re employed as salesmen.
University degree holders work as salesmen almost in every district of the State but their proportions, except for' Srinagar and Jammu districts, are very small.
9. All the technical degree holders working as salesmen in the State are concentrated in the cities of Srinagar and Jammu only. Further, 94% and 98% non-technical degree holders who work as salesmen in the districts of Srinagar and Jammu are concentrated in the two cities respectively.
10.· Besides Ladakh, where no males employed as farmers, hunters etc. (Division 4) possess any educational qualifications, Anantnag is . the only other district in which majority of the workers in Division 4 consist of mere literates only. The highest proportion of matriculatel employed as farmers, fishermen, hunters, etc has been returned from Kath"ua.
Non-technical diploma holders are not engaged in occupations represented by Division 4 in any district of the State. Even so far as technical diploma holders are concerned, Srinagar and Jammu ar:! the only districts in which a negligible proportion possessing these qualifications work as farmers, fishermen and hunters etc.
There are no technical degree holders working as farmers, hunters etc. in Anantnag, Ladakh, Doda, Udhampur and Kathua. In
other districts, the proportions of such workers are extremely small.
Non-technical degree holders employed in occupations falling under Division 4 have been returned from all the districts of the State except Ladakh. In Poonch, the proportion of such workers is the highest when compared with other districts but their actual number is limit-ed to 9 as against 4 of Baramulla where the proportion of the workers possessing this qualification is the lowest among all districts of the State.
11. Except for a solitary worker returned from non-city urban areas of Jammu district, all literate males employed in the State in. mining and quarrying (Division 5) are concentrated in the cities of Sril'lagar and Jammu. The total number of such workers in Srinagar stands at 3 of whom 2 are matriculates and one is a mere literate. In Jammu, the total number of male workers in Division 5 stands at 14. These include 10 who are mere literates, one matriculate and 3 non-technical degree holders.
12. Srinagar and Baramulla are the only districts where majority of workers employed in transport and .communication occupations Division 6) have passed some examination or other. In all other districts, this sector ~f activity is dominated by mere literates only. Even the proportions of those possessing primary or junior basic qualifications exceed the corresponding proportions of workers who have passed matriculation or higher examinations in all the districts of the State, except Doda and Jammu.
There is not a single district in which non-technical diploma holders are employed in Division 6. Technical diploma holders are also conspicuous by their absence in almost all the districts, the only exception being Srinagar and Poonch where the number of such workers stands at one in each case.
Non-technical degree holders are employed in varying proportions in every district except Baramulla and Ladakh. Srinagar has also the
354
distinction of employing six technical degree hoklers in transport and communication occupations.
13. O,'er 59% workers engaged in transport and communications in Jam~u city are mere literates. In Srinagar, majority of the workers have passed some examination or other. The proportion of matriculates in Jammu city is, however, 20.6% of the total number of~ workers as against 16.5% only of Srinagar. The actlial number of the workers, however, stands at 254 in the case of Jammu and 3]5 so far as Srinagar is concerned. Further, almost all the non-technical degree holders in the districts of Srinagar and Jammu who are employed in transport and communication occupations are concentrated in the two cities. Similarly, all the technical degree holders of Srimlgar district have been returned from the city.
14. Majority of craftsmen, production process workers and labourers etc. (Division 7-8) consist of mere literates in all the districts of the State except Ladakh. There is also no district in which the next highest majority of such w.orkers does not consist of those who have only passed primary or basic school examination. Matriculates are employed in the occupations represented by Division 7-8 in all the districts of the State but technical and non-technical diploma holders are everywhere conspicuous by their absence except in Srinagar and Jammu where a negligible number of workers possess these qualifications.
There are no technical or non-technical degree holders employed as craftsmen and production process workers in Ladakh, Udhampur, Kathua and Poonch. In other districts, either non-technical degree holders or techn"ical degree holders only are employed in these occupations but their proportions are exceedingly small.
15. The data relating to the two cities also shows that majority of the workers in Division 7-8 consist of mere literates only. As in the districts, the next highest proportion in this Division consists of those who have passed primary or 'Gasic school examination only. Srinagar city has the distinction of employing a few technical
diploma and degree holders whereas in Jammu, workers other than those whose educational qualifications are limited to primary or basic school examination consist of either matriculates or non-t~hnical degree holders.
16. In so far as service, sport and recreation workers (Division 9) are concerned, Srinagar and Kathua are the only districts where the propprtion of mere literates is less' than 50%. Even in these districts, the proportions of those possessing qualifications lowt..r than the matriculation exceed 75% of the total number of workers in the Division.
Matriculates are employed as service, sport and recreation workers in all the districts of the State except Ladakh. Srinagar has, however, the distinction of being the only district in which technical diploma and degree holders are also employed in the occupations represented by Division 9.
There is no district where any nontechnical diploma holder is engaged as service, sport and recreation worker. Non-technical degree holders are employed in these occupations in every district of the State except Ladakh where 70% of the workers consist of mere literates and 30% of those who have passed primary or basic school examination.
17. Almost half the workers in Division 9 in Jammu city consist of mere literates only. In Srinagar, the corresponding proportion stands at 39.4%. The disparity is set off by the larger proportions of workers possessing primary or basic school certificates. in Srinagar when compared with Jammu. Srinagar city has, however, the distinction of employing technical diploma and degree holders as service, sport and recreation workers. Further, the proportion of non-technical degree holders in Srinagar is much higher than that of Jammu city.
3.431 Following are some of the sal.ient features of the occupational classification of literate female workers :-
(i) Due to the limited number ofthe workers and precise description of the occupations
355
followed, no female worker has been included in Division X, viz., workers not classifiable by occupation.
(ii) No literate female is employed in muung, quarrying etc. (Division 5) in any of the districts of the State.
(iii) Srinagar is the only district where females possessing technical or non-technical diplomas are employed. The number of such females does not, however, exceed 19. Of these, 18 are professional and technical workers (Division 0) and one holds a clerical assignment.
(iv) Except for Srinagar and Jammu districts, literate females are not employed as sales workers (Division 3) in any other part of the State. Further, besides one nontechnical degree holder in Poonch, Srinagar and Jammu are the only other districts where administrative, executive and managerial assignments are held by literate females.
(v) Ladakh and Jammu alone have the distinction of employing literate females as farmers, fisherwomen, hunters etc. (Division 4), but their number is very s~ll, being limited to 5 in Ladakh and to one in Jammu.
(vi) No literate females are employed in transport and communication (Division 6) in Baramulla, .Ladakh, Doda and Udhampur. The iiumber of these workers in Anantnag, Srinagar and Jammu does not exceed one in each case. Kathua has two and Poonch four literate females who make their living by occupations relating to transport and communication.
In Srinagar and Poonch, all such workers are mere literates. The female worker of Anantnag is a matriculate and of Jammu a non-technical degree holder. In Kathua, literate females employed in transport and communications have either passed primary or junior basic examination.
(vii) In Anantnag district, literate females employed as craftswomen, production process workers etc. (Division 7-8) consist in equal proportion of those who are . mere literates and others who have passed primary or junior basic examination.
(viii)
(ix)
There are only two literate sales workers (Division 3) in Srinagar district. One of these is a mere literate and the other a non - technical degree holder.
Similarly, the .number of literate females employed as service, spOrt and recreation workers in Baramulla district is limited to two. Both have passed primary ex-amination.
3.432 The Subsidiary Table also shows that in some of the districts, females are engaged in a iimited number of occupations only.. This will be clear from the following:-
1. The literate female workers in Ladakh are engaged in only such of the occupations as are represented by Divisions 0,4 ~nd 7-8: The number of professional and technical workers
, (Division 0) stands at 11 in all. Of these, 8 have passed primary school examination and the other :3 are matriculates. In so far as Divisions 4 and 7-8 are concerned, except for 2 matriculates employed as farmers, hunters etc., all others numbering 3 and 5 respectively are mere
. literates.
2. Female .literate workers are employed in district Dada in Divisions 0, 2 and 7-8 only. The total number of professional and technical workers stands at 86' and of these 35 are matriculates. The workers also inchide two non-technical and one technical degree holders.
There are only 3 literate females holding clerical assignments and all of them are mere literates only. Similarly, of the 5 females engaged as craftswomen and production process workers, only one has passed primary school examination and others are literates without any educational qualifications.
3. No literate' females are Udhampur district in Divisions
employed in 1,3,4,5 and
S56
6. The number of workers in Division 2 is limited to 2 only and both ~re mere literates. Likewise, all the workers in Divisions 7-8 and 9 are literates only although they number 24 in the former case .
3.433 Female iiterate workers are· employed in Jammu district in all the occupations except mining and quarrying (DIvision 5). Among these, m~ority of the professional and technical workers (Division 0), administrative and executive workers (Division· 1) and transport and communication workers (Division 6) have passed matriculation or higher examinations. The respective proportions of such workers stand at 57.3% (Division· 0), 100% (Division I) and 100% (Division 6). In so far as clerical. workers (Division 2) are concerned, only about 41% have passed .matriculation and higher 'examinations. In the case of sales workers. (Div~sion 3), the corresponding proportion stands at 25% but all of these consist of technical degree holders. Further, all the female workers employed as farmers, fisherwomen etc. (Division 4) consist of mere literates only. The proportions .or~c~ftswomen, production process workers and service and sports workers who have passed matriculation and higher examinations are exceedingly small.
3.434 Female literate workers ill Kathua district fall ill Divisions 0, 2,6 and 7-8 only . The number of workers in Divisions 2 and 6 stands at 2 in each case. The proportion of professional and technical workers who possess matriculation and higher qualifications is about 54% of the total number of workers in· Division O. Craftswomen aDd production process workers, however, consist either of mere literates or of those possessing only primary or junior basic examination certificates.
3.435 In district Poonch, literate females follow the various occupations represented by Divisions 0, 1,2, 6, 7-~ and 9. The total number of workers stands at 99, of whom 78 belong to Divi~ion O. Majority of the latter have passed matriculation and higher examinations and their proportion stands at over 55%. .

Mother-tongue and BilingnalisD1
3.436 Let us now consider Subsidiary Table c-V.1 giving the distribution of 1,000 persons by mother-tongue. According to the data given in this table, Urdu, which is the State language, is the mother-tongue of a very small minority of people who comprise only 4 per 1,000 of the popUlation. As a matter of fact and as remarked by the State Census Commissioner in 1941, there are few people in the State who ~an rightly claim Hindi or Urdu as their mother-tongue.
3.437 Topographically and climatically, the State is a conglomeration of hetrogeneous regions inhabited by people speaking different mothertongues which have no apparent affinity with each other. Thus, the Kashmiri speaking people of Ganderbal tehsil cannot understand a word of Balti lanj!Uage, the mother-tongue of the majority of the inhabitants of the contiguous tehsil of Kargil. Similarly, Dogri is very different from Kashmiri and neither has any semblance, whatever, with Ladakhi, the numerically predominant language of tehsil Leh.
3.438 The main reason why Urdu has been adopted as the State language is that it is understood by most of the people and used by different linguistic sections as a means of communication between them. This is corroborated by the data given in Table C·VI. (Bilingualism) according to which as many as 244,125 persons with different mother-tongues have returned Urdu as the second language spoken and understood by them. This is not true of any other mother-tongue including Kashmiri and Dogri.
3.439 Kashmiri, which is numerically the most predominant language is, however, the mothertongue of over 53% people of the State as a whole and of 69% of its urban population and 50%. of those inhabiting the rural areas. People with Kashmiri as their mother-tongue are mostly concentrated in the rural and urban sectors of the three valley districts, Anantnag, Srinagar and Baramulla and in the rural areas of Doda district.
357
3.440 Dogri is the next important lan.guage and has been returned as mother-tongue by over 24% people of the State. It is the most predominant language of the rural and urban areas of the three contiguous districts ofUdhampur. Jammu and Kathua.
3.441 The third numerically important language is Pahari (unspecified) which is the mothertongue of about 7% people of the State. Pahari speakers have mostly been returned from the rural and urban areas of district Poonch.
3.442 Gojri ranks next with about 6% people claiming it as their mother-tongue. They are dispersed all over the State in varying proportions but are mostly concentrated in the rural areas of district Poonch. Other important languages include Punjabi and Ladakhi, the former being the mother-tongue of 3.1 % people and the latter of 1.4%. Punjabi is not the predominant
. language of any of the districts of the State, but most of the speakers of this mother-tongue have been returned . from the urban areas of district Jammu. In other districts, the proportion of people with Puqjabi as mother tongue is small. Ladakhi is, however, the predominant language of district Ladakh and has been returned as mother-tongue by over 56% people inhabiting the district. Balti is the other important language of this district and is spoken by a little over 37% of its population.
3.443 As stated above, the proportions of people inhabiting the districts' of Anantnag. Srinagar and Baramulla whose moth~r-tongue is Kashmiri are so high that other mothertongues wane into insignificance. Among these, Gojri, Pahari (unspecified) and Punjabi. however, claim relatively higher proportions than others.
3.444 The position obtaining in the districts of Jammu province is, however, different. While Dogri is the numerically predominant language of Udhampur, Jammu and Kathua districts, Gojri, Kashmiri and Punjabi also claim fairly good number of speakers.
3.445 Doda district is distinguishable from other districts of the State on account of
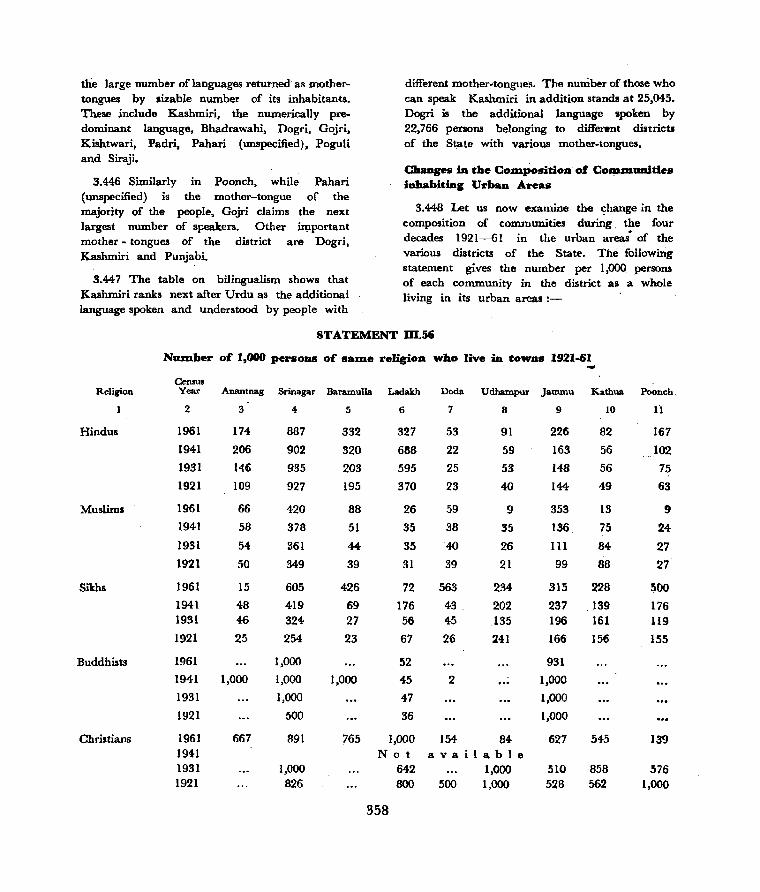
the large number of languages returned as mothertongues by sizable number of its inhabitants. These include Kashmiri, the numerically predominant language, Bhadrawahi, Dogri, Gojri, Kishtwari, Padri, Pabari (unspecified), Poguli and Siraji.
3.446 Similarly in Poonch, while Pahari (unspecified) is the mother-tongue of the majority of the people, Gojri claims the next largest number of speakers. Other ~portant
mother - tongues of the district are Dogri, Kashmiri and Punjabi.
3.447 The table on bilingualism shows that Kashmiri ranks next after Urdu as the additional language spoken and understood by people with
different mother-tongues. The number of those who can speak Kashmiri in addition stands at 25,045. Dogri is the additional language spoken by 22,766 persons belonging to different districts of the State with various mother-tongues.
Chaages ill the Com.position' of Com.m.unities inhabitillg Urban Areas
3.448 Let us now examine the ,?hange in the composition of communities during the four decades 1921-61 in the urban areas of the various districts of the State. The following statement gives the number per 1,000 persons of each community in the district as a whole living in its urban areas :-
STATEMENT DI.56
Religion
Hindus
Muslims
Sikhs
Buddhists
Christians
Num.ber of 1,000 persons of sam.e re6gion who live in towns 1921-61
Cemul Year Anantnag Srinagar Baramulla Ladakh
2
1961
1941
1931
1921
1961
1941
1931
1921
1961
1941 1931
1921
1961
1941
1931
1921
1961 1941 1931 1921
3
174
206
146
109
66
58
54
50
15
48 46
25
1,000
667
4
887
902
935
927
420
378
361
349
605
419 324-
254
1,000
1,000
1,000
500
891
1,000 826
5
332
320
203
195
88
51
44-
39
426
69 27
23
1,000
765
6
327
688
595
370
26
35
35
31
72
176 56
67
52
45
47
36
1,000 Not
642 800
358
Doda Udbampur Jammu Kathua Poonch,
7
53
22
25
23
59
38
40
39
563
43 45
26
2
8
91
59
53
40
9
35
26
21
234
202 135
241
154- 84
available 1,000
500 1,000
9
226
163
148
144
10
82
56
56
49
353 13
136 75
III 84-
99 88
315 228
237 139 196 161
166 156
931
1,000
1,000
1,000
627
510 528
54-5
858 562
11
167
102
75
63
9
24
27
27
500
176 119
155
139
576 1,000
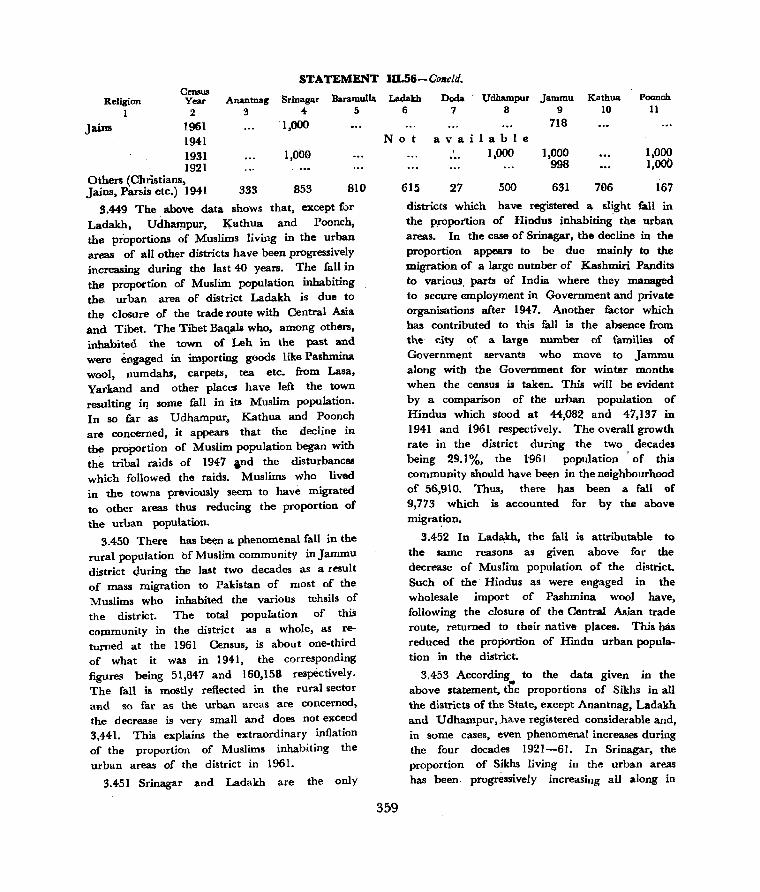
Religion 1
Jains
Census Year
2
1961 1941 1931 1921
Others (Christians, Jains, Parsis etc.) 1941
Anantnag 3
333
STATEMENT
Srinagar Baramulla 4 !;
'1,000
1,000
853 810
3.449 The above data shows that, except for Ladakh, Udhampur, Kathua and Poanch, the proportions of Muslims living in the urban areas of all other districts have been progressively increasing during the last 40 years. The fall in the proportion of Muslim population inhabiting the. urban area of district Ladakh is due to the closure of the trade route with Central Asia and Tibet. The Tibet Baqals who, among others, inhabited the town of Leh in the past and were engaged in importing goods like Pashmina wool, numdahs, carpets, tea etc. from Lasa, Yarkand and other, places have left the town resulting il'! some fall in its Muslim population. In so far as Udhampur. Kathua and Poonch are concerned, it appears that the decline in the proportion of Muslim population began with the tribal raids of 1947 ,nd the disturbances which followed the raids. Muslims who lived in the towns previously seem to have migrated to other areas thus reducing the proportion of
the urban population.
3.450 There has been a phenomenal fall in the rural popUlation bfMusIim community inJammu district Quring the last two decades as a result of mass migration to Pakistan of most of the l\.fuslims who inhabited the various tehsils of the district. The total population of this cOlllmunily in the district as a whole, as returned at the 1961 Census, is about one-third of what it was in 1941, the corresponding figures being 51,847 and 160,158 respectively. The fan is mostly reflected in the rural sector and so far as the urban areas are concerned, the decrease is very small and does not exceed 3,441. This explains the extraordinary inflation of the proportion of Muslims inhabiting the urban areas of the district in 1961.
3.451 Srinagar and Ladakh are the only
m.S6-Concld.
Ladakh Doda Udhampur Jammu Kathua Poonch 6 7 8 9 10 11
718 Not a v a ilable
, 1,000 1,000 1,000 998 1,000
615 27 500 631 706 167
districts which have registered a slight fall in the proportion of Hindus inhabiting' the urban areas. In the case of Srinagar, the decline in the proportion appears to be due mainly to the migration of a large number of Kashmiri Pandits to various, parts of India where they managed to secure employment in Government and private organisations after 1947. Another factor which has contributed to this fall is the absence from the city of a large number of families of Government servants who move to Jammu along with the Government for winter months when the census is taken. This will be evident by a comparison of the urban population of Hindus which stood at 44,082 and 47,137 in 1941 and 1961 respectively. The overall growth rate in the district during the two decades being 29.1%, the 1'961 population' of this community should have been in the neighbourhood of 56,910. Thus, there has been a fan of 9,773 which is accounted for by the above migra~ion.
3.452 In Ladakh, the fall is attributable to the same reasons as given above fOt' the decrease of Muslim population of the district. Such of the Hindus as were engaged in the wholesale import of Pashmina wool have, following the closure of the Central Asian trade route, returned to their native places. This has reduced the proportion of Hindu urban population in the district.
3.453 According .. to the data given in the above statement, th.e proportions of Sikhs in all the dlstricts of the State, except Anantnag, Ladakh and U dhampur, _have registered considerable and, in some cases, even phenomenal increases during the four decades 1921-61. In Srinagar, the proportion of Sikhs living in the urban areas has been. progressively increasing all along in
359
the past. With the construction of new roads and consequent expansion of transport services, Sikhs are in great demand in the city for employment as drivers. While some of these are migrants from the rural parts of the district, others hail from Muzaffarabad and other areas now on the other side of the Cease-fire Line.
3.454 The rural sector of Baramulla was, prior to 1947, inhabited by a large number of Sikhs. They, however, suffered considerably during the tribal raids of 1947 and later concentrated in the urban areas of the district. An equally important "reason for the unusually high proportion of their urban population is the addition of 6 new towns to the urban list of the district.
3.455 The proportion of Sikhs in the urban areas of district Doda was very low before 1941. It has abruptly shot "UP to 563 per 1,000 in 1961 due to;-
a) rehabilitation of Sikh displaced families at Batote,
b) employment of Sikhs in commercial activities in Banihal, Ramban and Batote, the three important towns on SrinagarJammu-Pathankot National Highway, and
c) the formation of a separate district with Doda town as its headquarter and the location of district offices in that town.
3.456 Even as it is,. the aggregate population of this community in thl! urban areas of this district is limited to 270 only. The proportion of Sikhs in the urban sector of Udhampur is not very high when compared wi!h 1941 and 1921. The fact, however, remains that Udhampur being the Corp "Headquarter of the army provides employment to large number of civilians and this seems to be one of the reasons for the increase in the urban proportion of the population of this community. In Jammu and Kathua, the increase is mostly due to displaced persons from other parts of the State territory and from West Pakistan who have settled in the urban areas of these districts.
360
3.457 The urban proportion of Sikhs in district Anantnag has registered a large decrease during the two decades, 1941-61. Actually, the population of this community in the district as a whole has increased by 56.7%, having been 3,8350nly in 1941 as against 6,010 returned at the Census of 1961. The reason for the fall seems to be the migration of some of the urban families to Srinagar where better avenues of employment have been available.
3.458 The fall in Ladakh is eve~ larger when compared with Anantnag. In this case, however, the low proportion has only a statistical vaiue as the actual population "of Sikhs inhabiting the town of Leh in 1941 and 1961 stood only at 9 and 6 respectively.
5.459 Buddhists are as a community concentrated in the district of Ladakh and very few of them live in other parts of the State. With. the development of Leh town and consequent increase in its avenues of employment, there is a tendency among the Buddhists inhabiting the rural areas to migrate to the town. In' other districts, either there are no Buddhists at all in urban areas or the variation is too small to call for any comrpents.
3.460 The 1941 Census Report does not give the population of Christians, Jains, Parsis etc., which have all been lumped together and shown under "Others". At any rate, the number of Christians inhabiting the urban area» of districts Doda, Udhampur and Poonch has all along been very small and the fluctuation in their respective proportions is not of any material significance.
3.461 Except for 4 persons in Srinagar, the entire Jain population is concentrated in Jammu
"district only. No reasons are, however, available for the fall in the proportion of the urban population of the district in 1961 as compared with the previous decades.
Progress of UrbanisatioD
3.462 The following statement gives the changes in the classification and population of cities, town-groups and towns for the period 1901-61:-

co
.... ....
! ... ! ........ ...
.... .....
.... - .... :>
.............. :>
............. :>
...... .... .....
a :> :> :> > :> :> > > >
S :> :> :> > :> :> > > >
~~g~~~ Cfl",C"')-~W") ...... pooooIJ ci Col'" eN ~ ...
.... :>
a'~ :> ~ > :> :> > ~ > ~ > : II)
361

.... .... :> :>
.... :>
.... .... I'I'l :> I'I'l
~ ~ ...:l "1, o c<)
r::z::l ....
~ :>
.... :>
.... .... .... :>
.... :>
362
.... ......... :> :> j>
.... ........ :> I'I'l
I'I'l
~< _ ...:l
(.)
.... ~ j> ~
.... j>
-co ct -.... :>
.... :>
....
....
3.463 It will be clear from the data given in this statement that there has been no change in the status of Srinagar town-group and Srinagar Municipality during the last six decades. Jammu was, however, a Class III city till 1931 and was, upgraded to Class 11 in 1941 and to Class I in' 1961. Consequently, there is no Class II urban area in the State in 1961.
3.464 The town of Anantnag or Islamabad as it is popularly known, has risen from Class V to Class I,ll during the five decades preceding 1961. Baramulla and Sopore have, on the other hand, gone up by one step only, and have been raised to Class IV in 1941 and 1931 res~tively.
3.465 Udhampur was borne on Class VI till 1941. Thereafter, the town registered a
363
phenomenal increase it for inclusion in Class IV in' 1961.
in its population qualifying Class V in 1951 and in
3.466 Poonch has been a Class V town all along in the past upto 1951. It has been upgraded to Class IV in 1961 for the first time.
3.467 Kathua has not witnessed any change in its status and continues to be borne on Class V. Similarly, except for BiJbehara, Shupiyan, Pampore and Jammu Cantonment, there has been no change in the status of other towns also which continue to be borne on Class VI. Bijbehara, Shupiyan and Pampore were Class VI towns till 1941 and were upgraded to Class V in 1951. Jammu Cantonment, however, became a Class V town in 1941.

CHAPTER IV
THE RURAL POPULATION
SECTION I
PRELIMINARY REMARKS
Classification of Rural Population
As will be clear from the observations made in the succeeding paragraphs, it is not possible to give a precise classification of the rural population on account of the varying pattern of village settlements in different States of India and even within individual States. It would, therefore, be enough to state here that all such population as has not been classified as urban constitutes rural population. The criteria applied for the determination of an urban area have already been discussed at length in the previous chapter.
Definition of Village
4.2 For the Census of 1961, a village was defined as· an area with well defined boundaries for revenue assessment having residential houses densely or sparsely populated irrespective of the number of hamlets of which it may be constituted. In pursuance of this definition, every revenue mauza was treated as a Census village in all the areas of the State territory constitut-· ing the jurisdictioris of 1961 Census.
4.3 While no uniform definition of the village ,was adopted at the previous Censuses, an additional difficulty experienced in 1961 was to lay down a definition which could also apply to villages truncated by the Cease-fire Li.ne. Detailed instructions had, therefore, to be issued to make sure that no settlement or hamlet was left out of count merely by reason of the changed complexion of the village or contraction of its size as a result of the raids of 1947. Care was aho taken to ensure lhat entity of every such village which had been completely
364
wiped out as a result of the migration of its entire population to the other side of the Cease-fire Line was preserved.
4.4 The diverse character of the. topography of the State and the consequent varying pattern of village settlements explain, among other reasons, why it is not possible to evolve the concept of a village which may be uniformally applicable to all the areas. Mr. Gait, Census Commissioner of India in 1911, has stated that as the. State comprises settled and unsettled areas, a Census village in the case of the former is a revenue unit whereas it is represented by a residential village in the latter. He has further remarked' that in the plains the houses are col~ted ~n
groups of varying sizes and in hilly tracts, where houses are scattered, villages in the ordinary sense of the term do not exist. This difficulty is not peculiar to Jammu and Kashmir alone but has been experienced in almost every other State in India. Mr. Marten has observed in his report on the 1921 Census of India that the term village has for the most part an arbitrary connotation which differs enormously in various parts of India as there is no single homogeneous unit which can be described as a village. Mr. R. A. Gopalaswami, the Census Commissioner of India in 1951, has further elaborated the extent of relationship between what is reckoned as an administrative and consequently a Census village and what we normally have in mind when we speak of a village. He has pointed out that "a village in the latter sense mean~ or should mean a cluster of houses (or more than one closely adjoining cluster of houses) whose inhabitants are regarded
by themselves as well as by others as a distinctive social uJilit with its identity marked by distinctive local name. The village in the administrative sense is the mauza"a settled area with defined boundaries for which village records have been prepared."
4.5 The definition of a village as adopted for the Census of 1961 was thus evolved with due regard to all these considerations. The basis was plainly' revenue village or mauza wherever it exists because 'the administrative convenience of taking the survey unit of area is very great. Ii: enaoles the local staff to make absolutely certain that no tract, however remote, is left out of account. Thus, the mauza which is for convenience's sake translated as a village in Census parlance, is merely that tract of land inhabited or not, which has been demarcated as a unit for revenue purposes.'
4.6 It may be of some interest here to reiterate the definition of a village as adopted at the previous censuses held in the State. fn 1901, an area whose residential houses were clustered together or if sparsely located were separated from other similar areas by natural barriers, such as a hillock, a rivulet, a xhul' and the lik~ was treated as a village. In 1911, a village was defined as an area already settled or under settlement, a territorial or revenue village, which had been duly surveyed, demarcated and treated as a unit for purposes of assessment. In forest areas, the smallest forest division was treated as a village, and in unsettled areas every collection of houses having an independent existence and name was treated as a village. A hamlet was defined as a small group of houses detached from the main abadi of a village but stil1 depending upon the same.
4.7 In 1921, a village was defined as the smallest unit of administration which was separately assessed to land revenue. This definition was varied in 1931 according to the local conditions. Broadly speaking, a wen organised unit with definite boundaries which had been surveyed in the recent past was treated as a village. This definition was also followed in 1941.
365
There was no Census in .1951 in Jammu and Kashmir.
4.8 Villages in the non-hilly areas of the State consist of shapeless clusters of houses or several small clusters situated at varying distances from each other. In district Ladakh as also in other hilly areas of the State, however, villages are formed of isolated homesteads which are scattered over fairly long distances and are built on small flat projections of mountain slopes where facilities for cultivation, grazing and drinking water are available.
4.9 The defi~tion of a revenue village known as an 'estate' as given in Section 3 q( th~_
State Land Revenue Act 1939, reads as under :-.
"Estate means any area-
(a) for which a separate record of rights has been made;
(b) which. has been separa~ely a!l{lessed to land revenue or would have been so assessed if the land revenue had not been released, compounded for 01' 'edeemed, or
(c) which the Government may by rule or special order declare to estate."
general be an
4.10 Broadly speaking, a village ~ually means a group of hamlets (a hamlet "f;!ing a duster of human habitation set closer together than other clusters or groups of habitations from which it is separated by the distance of fields,_ waste lands, ditches or jungles etc.) of which one hamlet is usually bigger than others. In plain areas of the valley, a village mayor may not consist of more than one hamlet, but in either case the houses are closely knit together with very limited space intervening between them. Where a village consists of more than one hamlet, the distance between the two hamlets generally exceeds five furlongs.
4.11 Villages in the plain areas of the districts of Jammu, Kathua and Udhampur also follow the same pattern, but in this case, some of the houses forming part of a hamlet are usually
situated at some distance from the main cluster and from each other.
4.12 The position obtaining in the hilly areas is still different. Due to the availability of limited areas suitable for cultivation and the long distances at which such areas are situated, no haml.et or village consists of a cluster of houses as in the plain areas. This pattern of settlement is obviously warranted by the topographical conditions which necessitate the building of houses very near the small patches of cultivable areas. It is therefore that houses in the villages of districts Ladakh, Doda, etc., are sparsely dispersed on hill slopes and separated by long distances.
Uninhabited Village
4.13 An uninhabited village is a revenue village with surveyed boundaries which had no habitations at all on the Census day within its boundaries as a result of the inhabitants having deserted the village site and shifted to some other area. e.rhis brings out !D0re vividly the concept of a village as envisaged in its legal definition. It indicates that every area recognised as a legal or revenue village was inhabited at some stage or other when its boundaries were demarcated on the basis of a survey, a record of rights was made and the area was assessed to land revenue. The assessment and collection of land revenue may later be suspended or postponed if the inhabitants desert the village and migrate to some other 'area. Even then, it wiII continue to be categorised as a village with the only difference that it will be treated as an uninhabited one. It will retain its boundaries and jurisdiction and if and when the old inhabitants return or fresh immigrants settle in the area, it will again be assessed to land revenue.
4.14 Normally, an inhabited village may be d !serted &y its inhabitants due to the availability of larger and more lucrative avenues of employment in some other area, absence of irrigational facilities as a result of the change in the course of a river and similar other reasons. The
.
366
number of, uninhabited villages in a tehsil/taluk is usually very small and they: 'are scattered over long distances. The tribal raids of 1947 have, however, resulted, among other things, in the transformation of a number of well-populated and contiguous inhabited villages into uninhabited areas. Notwithstanding this, depopulation, the entity of the villages has been preserved and they have been accounted for and assigned the same position as the inhabited villages with the only difference that they havE! been categorised as uninhabited. and the columns for Census data have been left blank against them.
SettlelD.ent Pattern of Villages
4.15 It is significant to note here that while it has been possible in ·1961 to 'achieve a measure of uniformity in the defihitton of the town, the evolving of a uniform definition of a village has eluded successive Censuses since 1872. This is, as already stated, mainly because of the varying pattern of village settlements obtaining in different parts of the country. In Kerala, for instance, the village a~glomeration typical of the plain areas of, Kashmir valley and of most parts of thc_C.ci:tIntry is scarcely to be found anywhere. The layout and the settlement pattern of the villages is such that it is not possible to determine on the basis of physical features where a village ends and whence the next contiguous village starts. But as soon as we leave Kerala and enter the neighbouring State of Madras, we find a Census village comprising of half a dozen or even more in some cases, distinct agglomerations. In view of this diverse character of village settlement in the various States of India, no meaningful comparison of village data can be made for all parts of the country ..
4.16 There is no getting away from the fact that a village in the legal sense used (administratively or for revenue purposes) in the State will continue to be officially recognised and tabulated in the Census. This naturally causes so much divergence in the definition of the concept of the village from State to State. Even m

Jammu and Kashmir, where a uniform definition of a village is followed in all the districts, the settlement pattems of villages vary from region to region depending upon ,the topography, natural resources and other factors. In plain areas" such as the major part of Jammu district, low level areas of Udhampur, Kathua and PooiJ.ch and in the valley districts, a village consists of one or more clusters of houses situated at short distances from each other. In 'some of these villages, stray and isolated houses are also found away from the
clusters. Ladakh and Doda districts, present different patterns altogether.
however, Both the
districts are interwoven with mountain ranges which leave very little space for building purposes. Small cultivable areas are scattered on plateaus and low level hill slopes. For these reasons, houses are dispersed over long distances and the area falling within the jurisdiction of a village is by far larger than in the plains. Like Kerala, there are no lines of demarcation defining the common boundary of any two contiguous villages.
SECTION 2
INHABITED AND UNINHABITED VILLAGES
Inhabited and Uninhabited VilJages in the States of India
4.17 An inevitable corollary of the varying administrative or revenue definition of village from State to State and sometimes even within the State is that any comparison of the number of villages, State by State, or even of the average population of villages in various States would be somewhat artificia1. The following statement, however, gives the number of inhabited and uninhabited villages in each State and Union Territory as also the average number of persons per inhabited village in 1961 :-
STATEMENT IV.l
Num.ber of villages (inhabited and' uninhabited) . and the average num.ber of
persons per inhabited village in each State of India, 1961
State/Union Territory
1 India
States 1 Andhra Pradesh 2 Assam 3 Bihar 4 Gujarat
Average number of per-
Number of villages sons per ,-___ .A. __ -~ inhabited Uninhabited Inhabited village 234
54,868 567,351 615
1,913 27,084- 1,097 1,565 25,702 426
10,428 67,665 629 433 18,584 824
5 Jammu and Kashmir 6 Kerala
167 2
6,559 452 1,573 9,122
·367
Average numher of per-
State/U nion Number of villages sons per Territory r-----A.---~ iiJ.habited
Uninhabited Inhabited village
2 3 4-
7 Madhya Pradesh 6,429 70,414 394-8 Madras 615 14,124 1,749 9 Maharashtra 3,016 35,851 792
10 Mysore 2,972 26,377 695 11 Orissa 5,659 46,466 354 12 Punjab 1,405 21,269 763 13 Rajasthan 2,285 32,241 523 14 Uttar Pradesh 12,720 112,624 571 15 West Bengal 3,486 38,465 686
Union Territories and otlzer areas
Andaman and Nicobar Islands 13 399 124
2 Delhi 24 276 1,084-3 Himachal Pradesh 1,316 10,438 123 4 Laccadi ve,Minicoy and
Amindivi· Islands 9 10 2,411 5 Manipur 42 1,866 382 6 TrillUra 354 4,932 211 7 Dadra and Nagar
Haveli 72 8.05 8 Goa, Daman and Diu 245 2,147 9 Pondicherry 3138 722
10 North-East Frontier Agency 2,451 137
11 Nagaland 14 814 430 12 Sikkim 462 336

4.18 From this statement, it will be seen that the proportion of uninhabited villages in Jammu and Kashmir which stands at 2.5% only is far below the All-India average of 8.8% and almost lowest when compared with other States. The highest proportion has been returned
from Orissa at 10.9%.
4.19 The average number of persons per inhabited village is extraordinarily high in Kerala. Among major States, Assam, Jammu and Kashmir, Madhya Pradesh, Orissa, Rajasthan, Uttar Pradesh and Bihar' alone have returned lower number of persons per village than the All-India average. The average population per village in all other major States is larger than the overall average [or India as a whole. In Bihar, however, the average per village is almost at par with the All-India average.
Advantages of adopting the Legal Village as Territorial Unit for purposes of Ceusus.
4.20 The main reason for the adoption of the legal village in the Census_ is that by this process alone, the needs of revenue and administrative authorities can be satisfied. If the legal village had been substituted by some other unit, the administrative authorities would .have been considerably handicapped in the matter of their day to day official business and in the planning and implementation of developmental sch.emes. A legal village is the basic and lowest territorial unit for administrative purposes and constitutes the corner stone for assessment of land revenue. Another important reason for the adoption of the legal or revenue village is that the Census data should conform to the jurisdiction of village authorities. The revenue village is a permanent unit with ·definite
STATEMENT
and surveyed boundaries and has not been constituted arbitrarily. Traditional and cultural association of a group of habitations have bee:ri the key note for the formation of a revenue village which has, with the passage of time, come to be recognised as !l distinct unit and has stood the test of time.
. 4.21 Yet another and equally important reason is that by adopting the legal village as the basic unit no area is duplicated or rhissed in taking the Census count and other data bea:r~ng on the social, cultural and economic life of the people. The Indian Census enjoys wide reputation for its extraordinarily complete coverage,. a rare feature when compared with the Census results of other countries. The post-enumeration check conducted immediately,' after the Census of 1961 shows that the net effect of over and under-enumeration of the rural population did not exceed an under enumeration of 6 persons per 1,000 counted in the whole of India and 2 per 1,000 only in the rural areas of Jammu and Kashmir. If the legal village had not been adopted, it is unlikely that the' coverage -would have been so exhaustive-· and the error of omissions and duplications so small.
Inhabited and Uninhabited Villages between 1901 'and 1961
4.22 The State of Jammu and Kashmir remained unaffected by the scheme of Reorganisation of States introduced in 1956 although its jurisdiction shrank in 1948 as a result of a part of its territory having fallen on the other side of the Cease-fire Line. At any rate, the following statement gives the number of inhabited and uninhabited villages in 1961 and of inhabited villages in the previous decades :-'
IV.2
Number of viUages (inhabited _d aaiDhabited) in the State 1901-61.
State and District
Jammu and Kashulir
1961 r-----,A.__-.----., Uninhabited Inhabited
2 3
167 '6,559
1941
Inhabited 4
7,049
368
1931 1921 1911 1901
Inhabited Inhabited Inhabited Inhabited 5 6 7 8
7,085 7.086 7,052 6,836
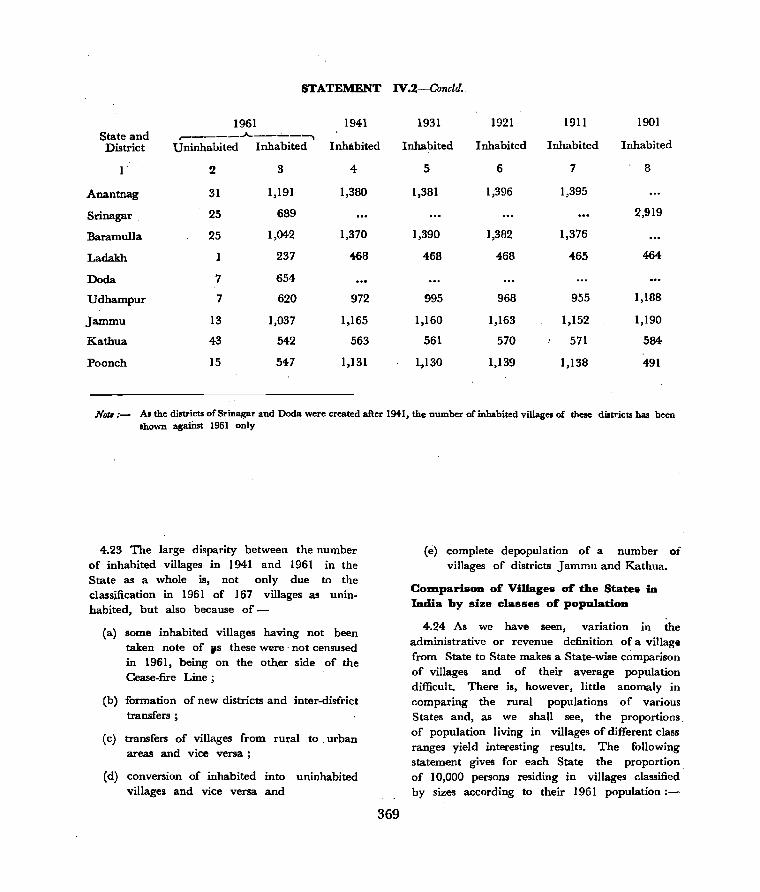
STATEMENT IV.2-Concld ..
1961 1941 1931 1921 1911 1901 State and
~ ____ ..A. __ ..;...._--.,
Inhabited District Uninhabited Inhabited Inhabited Inhabited Inhabited Inhabited
1 2 3 4 5 6 7 8
Anantnag 31 1,191 1,380 1,381 1;396 1,395
Srinagar 25 689 2,919
Baramulla 25 1,042 1,370 1,390 1,382 1,376
Ladakh 237 468 468 468 465 464
Doda 7 654
Udhampur 7 620 972 995 968 955 1,188
Jammu 13 1,037 1,165 1,160 1,163 1,152 1,190
Kathua 43 542 563 561 570 571 584
Poonch 15 547 1,131 1,130 1,139 1,138 491
Nut,:- As the districts ofSrinagar and Doda were created after 1941, the number ofinbabited villages of these districts has been shown a~aiDst 1961 only
4.23 The large disparity between the number of inhabited villages in 1941 and 1961 in the State as a whole is, not only due to the classification in 1961 of 167 villages as uninhabited, but also because of-
(a) some inhabited villages having not been taken note of ,S these were' not censused in 1961, being on the other side of the Cease-fire Line;
Cb) formation of new districts and inter-district transfers;
(c) transfers of villages from rural to . urban areas and vice versa;
Cd) conversion of inhabited into uninhabited villages and vice versa and
369
(e) complete depopulation of a number of villages of districts Jammu and Kathua.
COIDparisOD of Villages of the States in India by size classes of populatioD
4.24 As we have seen, variation in the administrative or revenue definition of a village from State to State makes a State-wise comparison of villages and of their average population difficult. There is, however, little anomaly in comparing the rural populations of various States and, as we shall see, the proportions. of population living in villages of different class ranges yield interesting results. The following statement gives for each State the proportion of 10,000 persons residing in villages classified by sizes according to their 1961 population:-
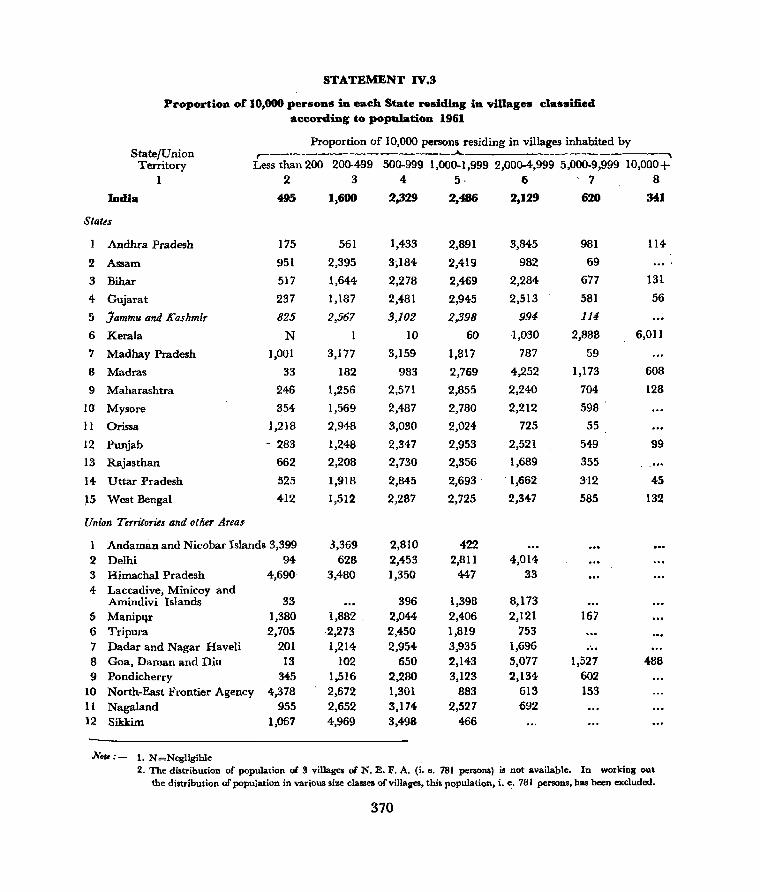
STATEMENr IV.3
Proportion of 10,000 persons ill each State residing in villages classified according to populatioD 1961
Proportion of 10,000 persons residing in villages inhabited by StatefU nion
,.-_______________ ..A.
-"'\
Territory Less than 200 200-499 500-999 1,000-1,999 2,000-4,999 5,000-9,999 10,000+
1 2 3 4 5· 6 7 8
Iadia 495 1,600 2,329 2,486 2,129 620 341
Slates
1 Andhra Pradesh 175 561 1,433 2,891 3,845 981 114
2 Assam 951 2,395 3,184 2,419 982 69
3 Bihar 517 1,644 2,278 2,469 2,284 677 131
4 Gujarat 237 1,187 2,481 2,945 2,513 581 56
5 Jammu and Kashmir 825 2,567 3,102 2,398 994 114
6 Kerala N 1 10 60 1,030 2,888 6,01l
7 Madhay Pradesh 1,001 3,177 3,159 1.817 787 59
B Madras 33 182 983 2,769 4,252 1,173 608
9 Maharashtra 246 1,256 2,571 2,855 2,240 704 128
10 Mysore 354 1,569 2,487 2,780 2,212 598
11 Orissa 1,218 2,948 3,030 2,024 725 55
12 Punjab - 283 1,248 2,347 2,953 2,521 549 99
13 Rajasthan 662 2,208 2,730 2,356 1,689 355 .. _ .. 14 Uttar Pradesh 525 1,918 2,845 2,693 . '1,662 312 45
~5 West Bengal 412 1,512 2,287 2,725 2,347 585 132
Union Territories and otlier Areas
1 Andaman and Nicobar Islands 3,399 3,369 2,810 422 ... 2 Delhi 94- 628 2,453 2,811 4,014 3 Himachal Pradesh 4,690 3,480 1,350 447 33 4 Laccadive, Minicoy and
Amindivi Islands 33 396 1,398 8,173
5 Manipqr 1,380 1,882 . 2,044 2,406 2,121 167 6 Tripura 2,705 2,273 2,450 1,819 753
7 Dadar and Nagar Haveli 201 1,214 2,954 3,935 1,696 ... 8 Goa, Daman and Diu 13 102 650 2,143 5,077 1,521 488
9 Pondicherry 345 1,516 2,280 3,123 2,134 602 10 North-East Frontier Agency 4,378 2,672 1,301 883 613 153 11 Nagaland 955 2,652 3,174 2,527 692 12 Sikkim 1,067 4,969 3,498 466
No,. :- 1. N=Negligible 2. The distribution of population of 3 villages of N. E. F. A. (i. e. 781 persol1ll) is not available. In working out
the distribution of popuJation in various size classes of villages, this population, i. e. 781 persons, hllll been excluded.
370
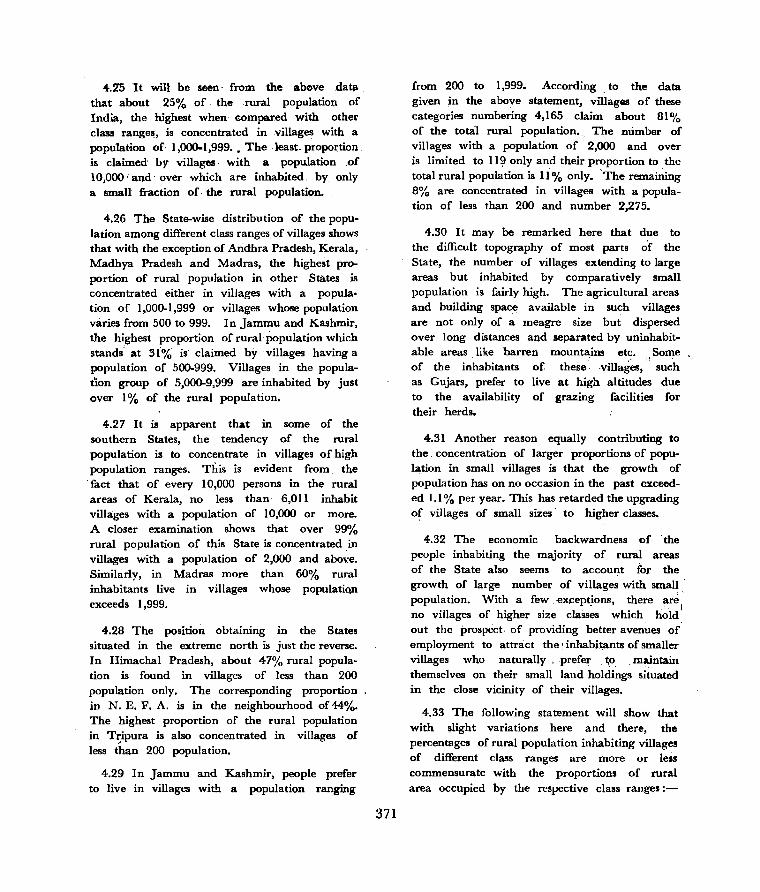
4.2'5 It will be seen· from the a.bove .datil that about 25% of· the rural population of India, the highest when €ompared with other class range~, is concentrated in .villages with a population of 1,000-1,999 .• The . least. propo~tion is claimed by villages with a.-population ,of 10,000' and over which are inhabited. by only a small fraction of, ·the rural population,
4.26 The State-wise distribution of the popula tion among different class ranges of villages shows that with the exception of Aridhra Pradesh, Kerala, Madhya Pradesh and Madras, the highest proportion of rural population in other States is concentrated either in villages with a popula. tion of 1,000:.1,999 or villages whose population varies from 500 to 999. In Jammu and Kashmir, the highest proportion of rural population which stands' at 31% is claimed by' villages having a population of 500:.999. Villages in the populatIon group of 5,000:.9,999 are inhabited by just over I % of the rural population.
4.27 It is apparent that in some of the southern States, the tendency of the rural population is to concentrate in villages of high population ranges. This is evident from the fact that of every 10,000 persons in the rural areas of Kerala, no less than 6,011 inhabit villages with a population of 10,000 or more. A closer examination shows that over 99% rural population of this State is concentrated in villages with a population of 2,000 and above. Similarly, in Madras more than 60% rural inhabitants live in villages whose populatiQD exceeds 1,999.
4.28 The position obtaining in the States situated in the extreme north is just the reverse. In Himachal Pradesh, about 47% rural population is found in villages of less than 200 population only. The corresponding proportion in N. E. F. A. is in the neighbourhood of 44%. The highest proportion of the rural population in T~ipura is also concentrated in villages oC less than 200 population.
4.29 In Jammu and Kashmir, people prefer to live in villages with a population ranging
371
from 200 to 1,999. According. to the data given in the above statement, villages of these categories numbering 4,165 claim about 81% of the tota1 rural population.. The number of villages with a population of 2,000 and over is limited to ll!il only and their proportion to the total rural population is 11% only. 'The remaining 8% are concentrated in villages with a population of less than 200 and number 2,275.
4.30 It may be remarked here that due to the difficult topography of most parts of the State, the number of villages extending to large areas but inhabited by comparatively small population is fairly high. The agricultural areas and building space available in such villages are not only of a meagre size but dispersed over long distances aJ1.d separated by uninhabitable areas, like barren mountains etc:. " Some of the inhabitants of these', .villages, such as Gujars, prefer to live at high altitudes due to the availability of grazing facilities for their herds.
4.31 Another reason equally contributing to the concentration of larger proportions of population in small villages is that the growth of population has on no occasion in the past exceeded 1.1 % per year. This has retarded the upgrading of villages of small sizes' to higher classes.
4.32 The economic backwardness of . the people inhabiting the majority of rural areas of the State also seems to account for the growth oC large number of villages with small ' population. With a few, ex~eptJons, there ar~"
::. I no villages of higher size classes which hold out the prospect, of providing better avenues or' employment to' attract the' inhab~tants of smaller villages who naturally, prefer' ~o. maintain themselves on their small land holdings situated in the close vicinity of their villages.
4.33 The following statement will show that with slight variations here and there, the percentages of rural population inhabiting villages of different class ranges are more or less commensurate with the proportions of rural area occupied by the respective class ranges:-
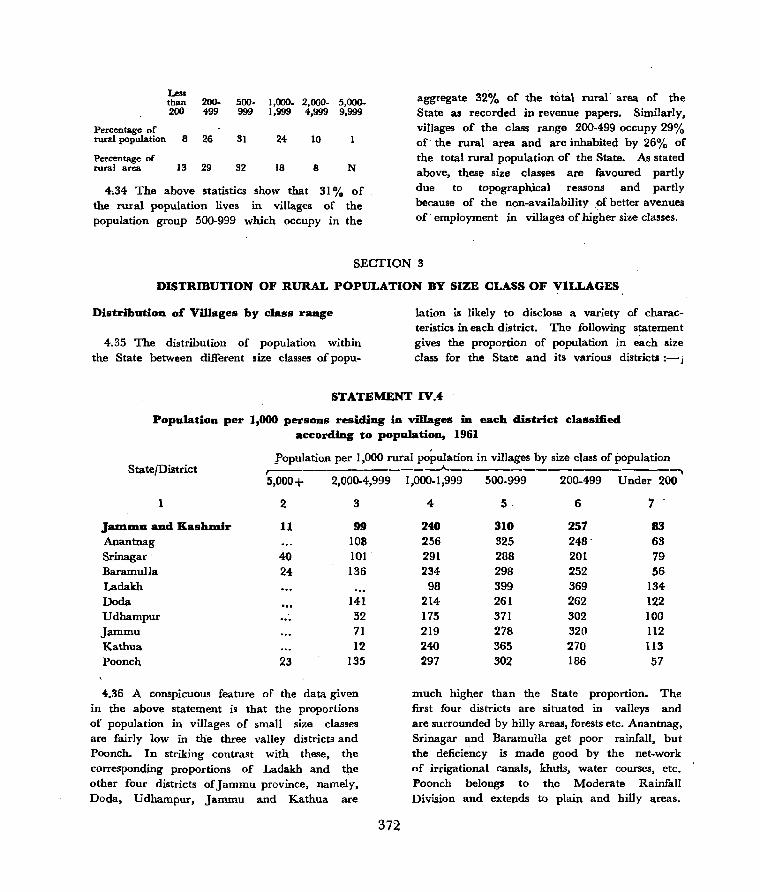
Le!!S than 200- 500- 1,000_ 2,000- 5,000-200 499 999 1,999 4,999 9,999
Percentage of rural population 8 26 31 24 10
Percentage of rural area 13 29 32 18 8 N
4.34 The above statistics show that 31% of the rural population lives in villages of the population group 500-999 which occupy in the
aggregate 32% of the total rural" area of the State as recorded in revenue papers. Simllarly, villages of the class range 200-499 occupy 29% of" the rural area and are inhabited by 26% of the total rural population of the State. As stated above, these size classes are favoured partly due to topographical reasons and partly because of the non-availability of better avenues of employment in villages of higher size classes.
SECTION 3
DISTRmUTION OF RURAL POPULATION BY SIZE CLASS OF VILLAGES
Distribution of Villages by class range
4.35 The distribution of population within the State between different size classes of popu-
lation is likely to disclose a variety of characteristics in each district. The following statement gives the proportion of population in each size class for the State and its various district.:- j
STATEMENT IV.4
Population per 1,000 persons residing in villages in each district classified according to population, 1961
l'opulation per 1,000 rural population in villages by size class of population State/District r---------------"----------------------.
5,000+ 2,000-4,999 1,000-1,999 500-999 200-499 Under 200
1
Jammu and Kashmir Anantnag Srinagar" Baramulla Ladakh Doda Udhampur Jammu Kathua Poonch
2
11
40 24
23
3
99 108 101 136
141 52 71 12
135
4.36 A conspicuous feature of the data given in the above statement is that the proportions of population in villages of small size classes are fairly low in the three valley districts and Poonch. In striking contrast with these, the corresponding proportions of Ladakh and the other four districts of Jammu province, namely, Doda, Udhampur, Jammu and Kathua are
372
4- :; 6 7 -
240 310 257 83 2.56 325 248- 63 291 288 201 79 234- 298 252 56
98 399 369 134-214- 261 262 122 175 371 302 100 219 278 320 112 240 365 270 113 297 302 186 57
much higher than the State proportion. The first four districts are situated in valleys and are surrounded by hilly areas, forests etc. Anantnag, Srinagar and Baramulla get poor rainfall, but the deficiency is made good by the net-work of irrigational canals, khttls, water courses, etc. Poonch belongs to the Moderate Rainfall Division and extends to plain and hilly areas.

On the other hand, Ladakh notwithstanding the huge area to which it extends, consists of closely knit nude mountains of great height with very few areas suitable for cultivation. What is more, the district gets nominal rainfall and the only sources of irrigation are the zamindari khuls and water courses here and there. This is also true, to a large extent, of Doda district, though the incidence of plain areas in this district is not so limited. As the habitable areas in both the districts consist of small patches of plain areas situated on hill slopes, the houses are strewn over long distances and majority of the rural population lives in villages of small s:ze classes. In Ladakh, for instance, over 50% of the rural population is concentrated in villages with a population of less than 500 whereas the maximum proportion of population living in such villages in the districts of Anantnag, Srinagar, Baramulla and Poonch is limited to 31% only. Similarly, the proportion of rural population of district Doda living in villages with population of less than 200 is lower than the corresponding proportion of Ladakh only. Udhampur, Jammu and Kathua are climatically alike and include plain areas interspersed by a complicated net-work of low level hills. The proportion of rural population inhabiting villages with a population of less than 500 exceeds 38% in each of these districts.
4.37 The average population in villages of the size class 5()()"999 in the thtee valley districts, Jammu and Poonch does not disclose any significant disparity when compared with the proportion per 1,000 of rural population living in such villages in the State as a whole. As already stated, Anantnag, Srinagar and Baramulla share the huge Kashmir valley among themselves though they are bordered by and include here and there mountainous areas. Major part of district Jammu also consists of plain and fertile areas which enjoy as good jrrigational facilities as the districts of Kashmir valley. Poonch is contiguous with the valley districts and is comparable with them for its beautiful landscapes, fertile areas, rich forests and the like.
4.38 District Ladakh is conspicuous for the
373
high proportion of its rural population in the villages of 500-999 size class. The difficult topography of the district and the absence of economic. resources in the major part of the area to which it extends account for larger concentration of the people in areas where cultivable land, irrigational facilities and other avenues of employment are available. That is why of all the districts in the State, Ladakh claims highest proportion of rural population in this size class.
4.39 Other districts in which the proportion of rural population in vjlJages of 500-999 size class is fairly high or too low, when compared with the corresponding State average, consist of Udhampur, Kathua and Doda. The proportion of rural population of Doda in villages of this catl"'gory is the smallest when compared with othel" districts. This, as is clear from the statement, is due to the fact that almost an equally large proportion' lives in villages with a population of 1,000-1,999. On the oth~r hand, due to scarcity of habitable areas in Ladakh, only a small fraction of the total number of villages is inhabited by population ranging from 1,000 to 1,999. This is further corroborated by the fact that there -are no villages of higher population groups in this district.
4.40 The proportions of rural population of Udhampur and Kathua districts in villages of 500-999 population by far exceed the State average. Neither of the districts is as mountainous as Doda. Parts of tehsils Kathua and Hiranagar consist of plain areas where large areas of cultivable land are available to maintain the growing population of villages. This is also true of tehsils of Udhampur and Reasi of district Udhampur.
4.41 In so far as villages with the population of 1,000-1,999 are concerned, the proportions of such villages in Srinagar, Ladakh, Udhampur and Poonch alone disclose marked variation with the State average. Reasons for the very low proportion of population in villages of this category in Ladakh have already been discussed above. Srinagar consists mostly of plain areas
where the soil is fertile and irrigational facilities are available in plenty. There is, therefore; a tendency to concentrate in large size villages where, besides facilities for cultivation, other avenues or ernpolyment are also available. The major part of district. Poonch consists of plain and low level areas and eveti the· .hilly regions are interspersed by small habitable valleys. The rainfall is adequate and the deficiency, if any, is met by khuls, water courses, etc. This explains the reason why a high proportion of rural population is concentrated in this size class. Udhampur is, however, dominated by mountainous areas. Except for hill slopes, plateaus and sma]] valleys, habitable areas are not available to accommodate villages with large population.
4.42 In Anantnag, Srinagar andJammu, the proportions of rural population inhabiting vilJages with a population of 2,000-4,999 are approximately the same a the State average for this size class. Even in other districts, except Kathua, the disparity is not too large to call for comments. In Kathua, the smallest proportion of rural population inhabits villages of this category. In Ladakh, there is no village with a population . of over 2,000.
4.43 Srinagar, Baramulla and Poonch are the only. districts in which villages with a population of 5,000 and above exist. Except for Srinagar, the proportions of population inhabiting such villages are not at much variance with the State average. Srinagar includes two villages of this category, namely, Nandpora and ChararSharier. The former is situated in the suburbs of the city and; although majority of its workers are engaged in cultivation, household industry which provides employment to a fairly large number of persons, plays an important role
374
in the economy of the village. The latter consist mostly of artisans like embr9iderers, wood carvers, paper machie makers, etc. who are employed by large industrial establishments in Srinagar on piece wage basis. Charar-Sharief is visited by several hundred thousand pilgrims every year who come to pay homage at the shrine of Sheikh Noor Din, a ,prominent Muslim saint of Kashmir entombed at this place. This has attracted many immigrants who make good living by producing diverse type of things, such as kangris, earthenpots, bakery produtts and many other articles of domestic use.
4.44 Like Srinagar, tehsil Haodwara also includes two villages, namely, Haihama and Kalaruch, each with a population of more than 5,000. Kalaruch is adjacent to pastoral areas and provides employment in household industry
. to no less than 12% of its workers·., Similarly, almost the entire population of village Haihama where the lands are fertile and the size of an average holding fairly large when compared with many other areas is engaged in cultivation.
4.45 Darhal is the only village in district Poonch having a population of more than 5,000 • Like Kalaruch, due to the close neighbourhood of large' pastoral areas, many inhabitants of the village are engaged in rearing of cattle and handloom weaving, etc.
ChlUlging pattern of Vntagell
4.46 we may now .study the proportions per 1 ,000 of rural population residing in villages classified by broad population ranges to bring out the changing pattern of village sizes. The following statement gives these proportions for the State and its constituent districts for the four decades 1921-61:-

STATEMENT IV.5
Changes in the proportion of 1,000 perso_ residing in viOages classUled ac:cerding . to population in State and districts 1921-61.
Population per 1,000 rural population in by size class of population
villages ,--____________ .A.
State and District Census year 2,000-4,999 1,000.1,999 500-999 Under 500 1 2 3 4- 5 6
Jam.DlU and KashlDir 1961 100 240 :no 339 1941 70 211 295 412 1931 60 195 295 447 1921 44 167 303 480
Anantnag 1961 108 256 325 311 1941 75 212 3lO 399 1931 76 197 319 400 1921 50 155 326 456
Srinagar 1961 101 291 288 280 1941 39 246 324 362 1931 38 197 338 419 1921 29 174 352 442
BaramulJa 1961 136 234 298 309 1941 67 263 265 387 1931 67 241 267 422 1921 38 213 280 452
Ladakh 1961 98 399 503 1941 49 358 593 1931 50 357 593 1921 34 330 636
Doda 1961 14.1 214 261 384 1941 75 216 253 456 1931 50 198 243 509 1921 14 190 241 555
Udhampur 1961 52 175 371 401 1941 41 113 369 477 1931 137 304 559 1921 109 314 577
Jammu 1961 71 219 278 432 1941 90 164 229 499 1931 66 144 237 553 1921 74 129 224 572
Kathua 1961 12 240 365 384 1941 12 148 321 519 1931 134 299 567 1921 90 345 565
Poonch 1961 135 297 302 243 1941 132 283 321 246 1931 128 278 331 263 i921 103 261 345 291
Not. t- (I) The statement could not be prepared for 1901 and 1911 as no village-wise figure. are available. (2) The difference between 1,000 and the sum total of cols. 3 to 6 in some of tbe decades i •. due to the exclusion
of villages with a population above 5,000 and such other population which have not been related to any Bize class of the villages in the previous Reports.
375
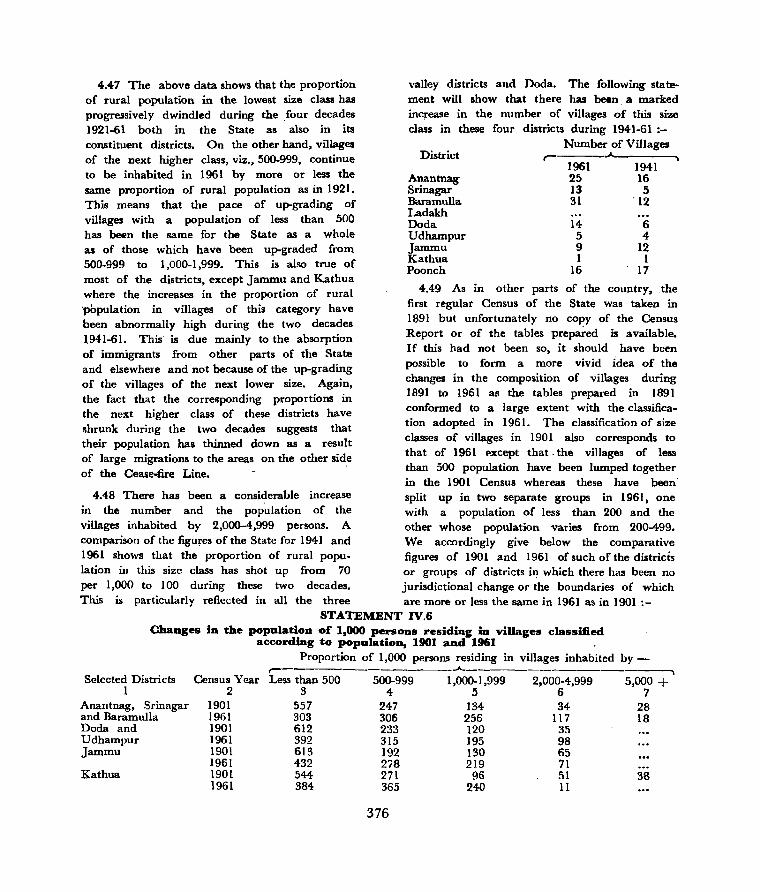
4.47 The above data shows that the proportion of rural population in the lowest size class has progressively dwindled during the four decades 1921-61 both in the State as also in its constituent districts. On the other hand, villages of the next higher class, viz., 500-999, continue to be inhabited in 1961 by more or less the same proportion of rural population as in 1921. This means that the pace of up-grading of villages with a population of less than 500 has been the same for the State as a whole as of those which have been up-graded from 500-999 to 1,000-] ,999. This is also true of most of the districts, except Jammu and Kathua where the increases in the proportion (if rural ·pbpulation in villages of this category have been abnormally high during the two decades 1941-61. This is due mainly to the absorption of immigrants from other parts of the State and elsewhele and not because of the up-grading of the villages of the next lower size. Again, the fact that the corresponding proportions in the next higher class of these districts have shrunk during the two decades suggests that their population has thinned down as a result of large migrations to the areas on the other side of the Cease-fire Line.
valley districts and Doda. The following statement will show that there has been. a marked increase in the number of villages of this sillle class in these four districts during 1941-61 :-
District
Anantnag Srinagar Baramulla Ladakh Doda Udhampur Jammu Kathua Poonch
Number of Villages r-,-------,~------~
1961 25 13 31
14 5 9 1
16
1941 16 5
'12
6 4
12 I
17
4.49 As in other parts of the country, .the first regular Census of the State was taken in 1891 but unfortunately no copy of the Census Report or of the tables prepared ill available. If this had not been so, it should have been possible to form a more vivid idea of the changes in the composition of villages during 1891 to 1961 as the tables prepared in 1891 conformed to a large extent with the classification adopted in 1961. The classification of size classes of villages in 1901 also corresponds to that of 1961 except that. the villages of less than 500 population have been lumped together in the 1901 Census whereas these have been'
4.48 There has been a considerable increase split up in two separate groups in 1961, one in the number and the population of the with a popUlation of less than 200 and the villages inhabited by 2,000-4,999 persons. A other whose population varies from 200-499. comparison of the figures of the State for 194] and We accordingly give below the comparative 1961 shows that the proportion of rural popu- figures of 1901 and 1961 of such of the districts lation in this size class has shot up from 70 or groups of districts i~ which there has been no per 1,000 to 100 during these two decades. jurisdictional change or the boundaries of which This is particularly reflected in all the three are more or Jess the same in 1961 as in 1901 :-
STATEMENT IV.6 Changes in the population of 1,000 persons residing in villages dassmed
according t:o populat:ion, 1901 and 1961 , Proportion of 1,000 persons residing in villages inhabited by-
,-----__________ .A. ________________ ~
Selected Districts Census Year Less than 500 500-999 1,000-1,999 2,000-4,999 5,000 + I 2 3 4 .5 6 7
Anantnag, Srinagar and Baramulla Doda and Udhampur Jammu
Kathua
1901 1961 1901 1961 1901 1961 1901 1961
557 247 ]34 34 28 303 306 256 II 7 18 612 233 120 35 392 315 ]95 98 613 192 130 65 432 278 219 71 544 271 96 51 38 384 365 240 11
376
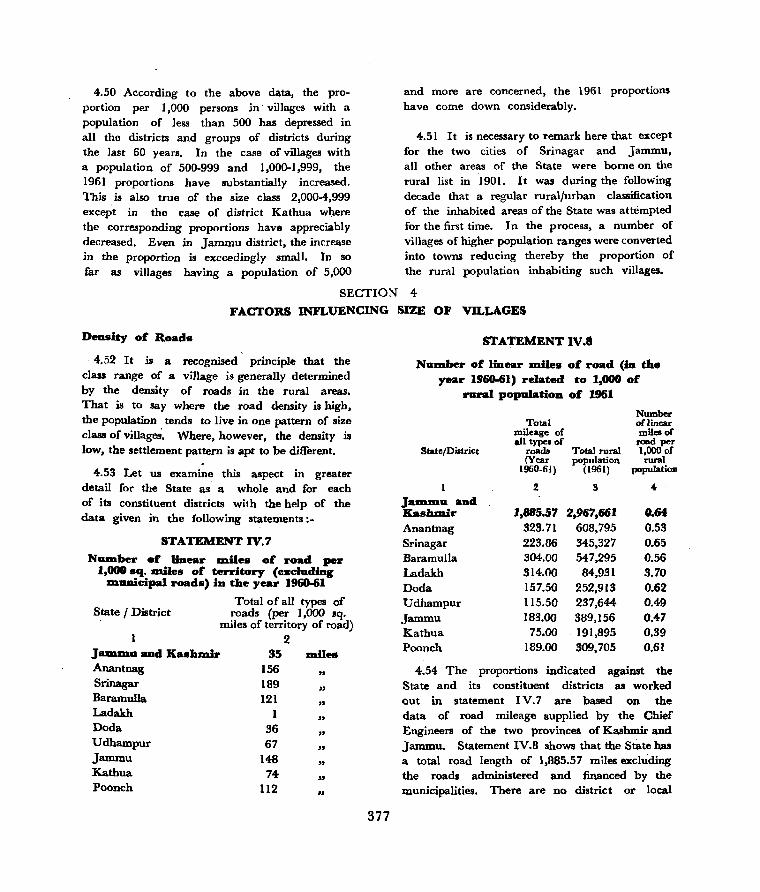
4.50 According to the above data, the proportion per 1,000 persons in' villages with a population of less than 500 has depressed in all the districts and groups of districts during the last 60 years. In the case of villages with a population of 500-999 and 1,000-1,999, the 1961 proportions have substantially increased. This, is also true of the size dass 2,000-4,999 except in the case of district Kathua w)lere the corresponding proportions have appreciably decreased. Even in Jammu district, the increase in the proportion is exceedingly small. In so far as villages having a population of 5,000
and more are concerned, the 1961 proportions have come down considerably.
4.51 It is necessary to remark here that except for the two cities of Srinagar and Jammu, all other areas of the State were borne on the rural list in 1901. It was during the following decade that a regular rural/urban classification of the inhabited areas of the State was attempted for the first time. In the process, a number of villages of higher population ranges were converted into towns reducing thereby the proportion of the rural population inhabiting such villages.
SECTION 4
FACTORS INFLUENCING SIZE OF VILLAGES
Density of Roads
4.52 It .is a recognised principle that the class range of a village is generally determined by the density of roads in the rural areas. That is to say where the road density is high, the population tends to live in one pattern of size class of villages'. Where, however, the density .is low, the settlement pattern is apt to be different.
4.53 Let us examine this aspect in greater detail for the State as a whole and for each of its constituent districts with the help of the data given in the following statements:-
STATEMENT 1V.7
Number 0' Unear lIliIes of road per 1,000 sq. DliIes of territory (escluding
DlDDicipal roads) in the year 1960-61
S,tate I D.istrict Total of all types of
roads (per 1,000 sq. miles of territory of road)
2 JalDDlU _d Kashmir Anantnag
35 156
miles
" Srinagar Baramulla Ladakh Dada Udhampur Jammu Kathua Poonch
189 121
1 36 67
148 74-
112
" " " " " " " ••
377
STATEMENT IV.8
NUDlber of linear lIliIes of road (in the year 1960-61) related to 1,000 of
rural population of 1961
Number Total of linear
mileage of mileaof
State/District all types of road per
roads Total rural 1,000 of (Year population rural
1960-61) (1961) population
2 3 4-
JaDlDlu and Kashmir 1,885.57 2,967,661 O.6f Anantnag 328.71 608,795 0.53 Srinagar 223.86 345,327 0.65 Baramulla 304.00 547,295 0.56 Ladakh 314.00 84,931 3.70 Doda 157.50 252,913 0.62 Udhampur 115.50 237,644- 0.49 Jammu 183.00 389,156 0.47 Kathua 75.00 191,895 0.39 Poonch 189.00 309,705 0.61
4.54 The proportions indicated against the State and its constituent districts as worked out in statement IV.7 are based on the data of road mileage supplied by the Chief Engineers of the two provinces of ' Kashmir and Jammu. Statement IV.8 shows that the state has a total road length of 1,885.57 miles excluding the roads administered and financed by the municipalities. There are no district or local

board roads in the rural areas of the State. Even the bridle paths, such as Kishtwar-Padder mines road, Leh-Hemis road, Reasi-Gulabgarh road, etc. ~tc. have been built by the Government. These have not been included by the Chief Engineers in the above mileage.
4.55 It is clear from statement IV.8 that the State proportion of linear miles of road per 1,000 of rural population is mainly exceeded by Ladakh district. The proportion of Srinagar is also slightly higher but in all other districts,
. the number of linear miles is smaller than the State average.
4.56 The rural sector of the State territory on this side of the Cease-fire Line, which is inhabited by 2,987,661 persons, extends to an area of 53,547 sq. miles giving the density per square mile, of the population and the roads at 55 persons and .04 miles respectively. The corresponding proportions for individual districts are given below:-
Density of Density of roads DistriCt population per sq. mile
2 3
Anantnag 294 .16 miles
Srinagar 291 .19 .. Baramulla 218 ~12
" Ladakh 2 .01
" Dada 58 .04
" Udhampur 138 .07 ,. Jammu 315 .15 .. Kathua 188 .07
" Poonch 184 .11 "
4.57 It is now evident that in Jammu district where the density of population is the highest among all the districts, the number of linear miles per 1,000 population is almost the lowest, the only exception being Kathua district. On the other ha~d, Ladakh which is inhabited on an average by two persons per sq. mile of area, has the highest density of 3.70 miles per 1,000 rural population. In other districts, the disparity between the density of population and the road mileage 'per 1,000 population is not so large.
378
Doda has approximately the same population density and the road mileage per ,1,000 population as the corresponding averages of the State as a whole.
4.58 The data gIVIng the road density per sq. mile shows that Ladakh notwithstanding its exceptionally high roda mileage of 3.70 per 1,000 population, has a density 0.01 miles per sq. II}ile of area. In the contiguohs district of Qoda, which is almost as hilly as Ladakh, the corres· ponding road density per sq. mile is 0.04 miles only. Udhampur and Kathua have neither such difficult topographies as of Ladakh ~nd Dodanor' they are dominated by plain areas a,s is the case with the three valley districts and Jammu. The road density per sq. mile of area in these two districts i8 therefore, of an intermediate size.
4.59 An obvious explanation for. these val"iations is that road development ,programme is receiving greater attention either' in districts which have plain topography and where industrial and commercial establishments can be -set up without much difficulty or which are deemed to be important from administrative and defence points of view. It is significant to note th~t
while seven of the nine districts of the State are situated :on either' side of the National Highway, at least four of theSe, namely, Kathua, Udhampur, Doda and Ladakh, have pOOl· densities of roads per sq. mile. It therefore follows that except where the needs of defence make it obligatory to build roads, .the State Government have been mainly concentrating on the development of communication in plain areas. It is a known fact that a number of roads in the State have been built by the army and their alignment are too difficult to attract civilian vehicular traffic. For instance, no light vehicles can ply on Zojela-Leh road (220 miles), Chowkibal-Tangdara road (30 miles), SunderbaniGurez road (40 miles) and Kalidhar-Poonch road (125 miles).
4.60 The construction of village roads does not also appear to have received adequate attention. As will be seen from the subjoined statement, except

for Kathua majority of villages in all other districts are accessible by toot-paths only. in Doda, the proportion of villages connected by roads is
limited to 11 %. Even In Anantnag district, which extends to large plain areas, only 22% villages have so far been connected by roads.
STATEMENT IV.9
Percentage of villages cODnect~ by roads to total nwnber of villages, 1961
State I Distr,ct Total No. of villages No. of villages
connected by roads Percentage of villages connected by road.
to total number of villages
2 3 4
Jamma and Kashmir 6,726 2,055 31 Anantnag 1,222 Srinagar 714 Baramulla 1,067 Ladakh 238 Doda 661 Udhampur 627 Jammu ],050
Kathua 585 Poonch 562
4.61 Let us now compare the ar,as of highand low densities as indicated by the above Statement with their employment patterns. This
265 22 211 30 477 45
73 31 70 II
]25 20 369 35 326 56 139 25
will be evident from the following statement which has been prepared from the data presented in Subsidiary table B-1. 1 of 1961.
STATEMENT IV.IO
Districts of ffigh and Low Road Densities related to the prOPOrtiODS of workers in IDdastrial categories and to aon-workers
Districts arranged No. of miles in descending of road per order of road 1,000
density population
1 2
Ladakh 3.70 Srinagar 0.65 Doda 0.62 Poonl!h 0.6]
Baramulla 0.56 Anantnag 0.53 Udhampur 0.49 Jammu 0.47 Kathua 0.39
Distribution of 1,000 persons as workers and non-workers , ~ .....___._-------------,
As cultivators, agricultural
labourers, in mining, quarrying,
livestock, forestry, fishin_g, hunting,
animal husbandry, orchards and allied activities (I to III)
3
587 399 499 348 430 391 444 261 349
319
Workers .A.-__ - ______ -----..,
At household industry, in manu
facturing other than household
industry (IV & V)
4
49 27 51 25 20 33 57 13 32
In construction. trade and comme-
rce, transport, storage, communi-
cation, other services (VI to IX)
5
27 36 14 13 27 21 22 59 38
Non-workers
6
337 538 436 614 523 555 477 667 581

4.62 The above statistics disclose that the incidence of workers in categories I to III is very high in all the districts of the State when compared with the proportions of categories IV and V on the one hand and VI to IX on the other as also in relation to the aggregate proportion of categories IV to IX.
4.63 It is clear that the proportions of workers in categories IV and V and VI to IX in Ladakh district, where the road density is the highest, are smaller than the corresponding proportions of several other districts although their densities are camparatively very low. The reason is obvious. The 210-mile long road length of National Highway passing through the district is designed to connect the town of Leh with the rest of the country and to make it accessible for the whole year around. The areas on either side of this road abound in lofty mountain ranges which leave very little space for building purposes. The road has, therefore, little impact on the economy of the district. Further, as there are very few avenues of employment other than cultivation, agricultural labour, etc. available
to the people, the surplus man-power is absorbed in manufacturing.
4.64 This is more or less equally true of Doda and Udhampur districts which except for their respective heights have gen~rally the same topography as Ladakh.
4.65 Srinagar and Jammu are conspicuous for comparatively larger proportions of workers in categories VI to IX. Most of the workers of the two districts are engaged in other services, trade and commerce, transport, etc.
4.66 Kathua district extends on either. side of the National Highway at the border of the State and has almost equal proportions of workers In categories IV and V and VI to IX.
Road mileage in India com.pared with Advanced Countries
4.67 We may now compare the road mileage per 1,000 of population and per ],000 sq. miles of area with the corresponding proportions of Indian Union and some important foreign countries as indicated beldw:-
STATEMENT IV.II
Road IDileage ill India and Jam.mu and Ka.hm.ir com.pared with advanced countries or the world
U. S. A. U. K.
2 3 Population in millions 179.3 (1960) 52.7 (1961)
Area in thousand sq. miles 3,615.2 (1960) 94.2 (1961)
Total mileage of
France
4
42.8 (1954)
212.8 (1954-)
Japan Jammu and
Indian Union Kashmir State
5 6 7
93.4 (1960) 439.2 (1961) 3.6 (1961)
142.7 (1960) 1,264.3 (1961)
roads 3,546,693 (1961) 202,786 (1961) 945,183 (1961) 597,704 (1961) 440,626 e1961}
B6.0 (1961)
1930 (1961 )
Linear miles of road per 1,000 sq. miles of area 981.05 2,152.33
Road mileage per 1,000 of population 19.78 3.85
4.68 The above data relates both to the rural and urban sectors of the territories referred to and not to rural areas only. It is clear from this statement that Jammu and Kashmir is conspicuous for the very small size
4,441.19
22.06
380
4,187.77 348.50 22.44
6.40 1.00 0.54
of its population and total mileage when compared with Indian Union and other countries mentioned in the statement.
4.69 It may be remarked here that the area of the State as indicated in col. 7 of the

statement includes both the territory currently administered by the State Government as also those parts of the State which are at present under Pak or Chinese occupation. On the other hand, the road mileage and the population of the State given in the statement relate only to the areas on this - side. of the Cease-fire Line. This is one of the reasons why notwithstanding the fact that the disparity between the areas of United Kingdom and Jammu and
Kashmir is very small, the number of linear miles per 1,000 sq. miles of area and road mileage per 1,000 population are when compared with United Kingdom exceedingly low.
Road Denlility in States
4.70 Let us now take up the rural sectors of various States in India· and compare as in the following statement the road 'mileage per 1,000 population and per 1,000 sq. miles of area.
STATEMENT.IV.12
Mileage of surfaced and unsurfaced roads in several States of India (Year-1OO1) (Excluding Municipal roads)
State Area. in sq. miles
2 Andhra Pradesh 104,607
2 Assam 47,141 3 Bihar 66,147 4 Gujarat 70,323 5 Jammu and Kashmir 53,547 6 Kerala 14,571 7 Madhya Pradesh 168,322 8 Madras 48,138 9 Maharashtra 115,736
10 Mysore 72,662 11 Orissa 59,775 12 Punjab 46,873 13 Rajasthan 129,771 14 Uttar Pradesh 112,922 15 West Bengal 33,536
4.71 The statement shows that the State is comparable on the basis of its road mileage per 1,000 population with Andhra Pradesh but its average mileage per 1 ,000 sq. miles of area is incomparably low. It is also clear that the road mileage per 1,000 population is the lowest in this State. The main reason is that the Slate extends to a huge area which is interwoven with valleys, hills, mountains, rivers, lakes, etc. The rural population is, therefore, strewn in plaip areas, hill slopes, narrow valleys, forests and in other remote regions, many of which are still inaccessible and have not been provided
S81
Population in Total Road mileage Road mileage thousands mileage per J ,000 per 1,000 sq.
population miles of area 3 4- 5 6 29,709 19,998 0.67 191.17 10,960 8,581 0.78 182.03 42,542 50,347 1.18 761.14 15,317 14,481 0.95 205.92 2,968 1,886 0.64. 35.22
14,350 12,830 0.89 880.52 27,745 31,159 1.12 185.12 24,696 24,499 0.99 508.93 28,391 24,383 0.86 210.68 18,320 28,384 1.55 390.63 16,439 20,465 1.24 342.37 16,218 12,333 0.76 263.12 16,874 25,614 1.52 197.38 64,267 61,440 0.96 544.09 26,385 40,307 1.53 1,201.90
with any roads worth the name. 4.72 Similarly, the road mileage per 1,000 sq.
. miles of area is also smallest in the State. This is because over 70% area of the State on this side of the Cease-fire Line (37,753.8 sq. miles) constituting the district of Ladakh consists almost entirely of a series of nude Himalayan ranges where the question of buildinll roads does not arise. Even the contiguous district of Doda claiming an area of 4,380.2 sq. miles abounds in lofty mount&ins of Shiwalik ranges in which road construction is neither feasible not conducive to economic development
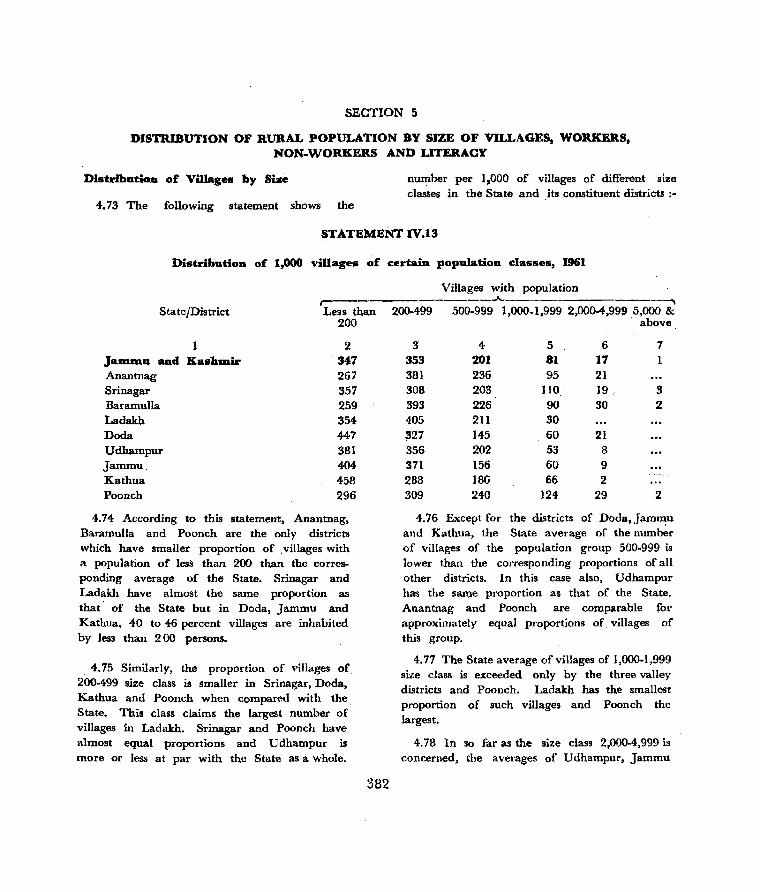
SECTION 5
DISTRmUTION OF RURAL POPULATION BY SIZE OF VILLAGES, WORKERS, NON.WORKERS AND UTERACY
Distribution of Villages by Size
4.73 The following statement shows the
number per 1,000 of villages of different size classes in the State and its constituent districts :-
STATEMENT IV.13
Distribution of 1,000 villages of certain population classes, 1961
Villages with population ,..--____________ ..A. ,----- ---"""I
State/District Less than 200-499 500·999 1,000.1,999 2,000-4,999 5,000 & 200 above.
1 Jammu and Kashmir Anantnag Srinagar Baramulla Ladakh Doda Udhampur Jammu Kathua Poonch
2 347 267 357 259 354 447 381 404 458 296
4.74 According to this statement, Anantnag, Baramulla and Poonch are the only districts which have smaller proportion of ,villages with a population of less than 200 than the corresponding average of the State. Srinagar and Ladakh have almost the same proportion as that of the State but in Dada, Jammu and Kathua, 40 to 46 percent villages are inhabited by less than 200 persons.
4.75 Similarly, the proportion of villages of 200·499 size class is smaller in Srinagar, Doda, Kathua and Poonch when compared with the State. This class claims the largest number of villages in Ladakh. Srinagar and Poonch have almost equal proportions and U dhampur is more or less at par with the State as a whole.
382
3 4 353 201 381 236 308 203 393 226 405 211 ;i27 145 356 202 371 156 288 186 309 240
5 81 95
110 90 30 60 53 60 66
124
6 17 21 19 . 30
21 8 9 2
29
7 1
3 2
2
4.76 Except for the districts of Doda,Jammu and Kathua, the State average of the number of villages of the population group 500·999 is lower than the corresponding proportions of all other districts. In this case also, Udhampur has the same proportion as that of the State. Anantnag and Poonch are comparable fOl' approximately equal proportions of. villages of this group.
4.77 The State average of villages of 1,000-1,999 size class is exceeded only by the three valley districts and Poonch. Ladakh has the smallest proportion of such villages and Poonch the largest.
4.78 In so far as the size class 2,000·4,999 is concerned, the averages of Udhampur, Jammu
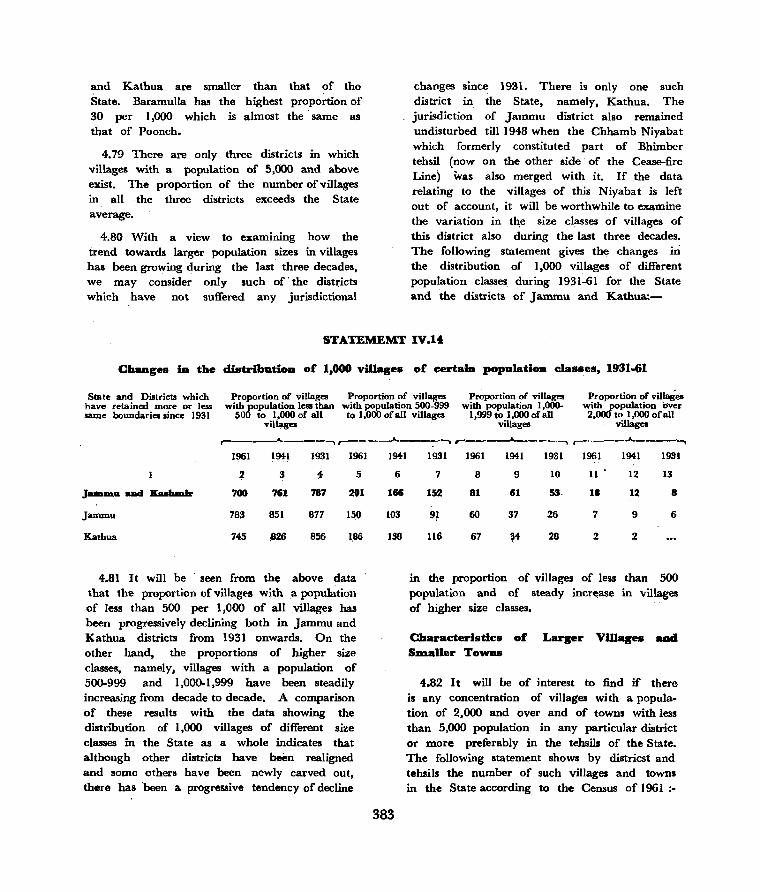
and Kathua are smaller than that of the State. Baramulla has the highest proportion of 30 per 1,000 which is almost the' same as that of Poonch.
4.79 There are only three districts in which villages with a population of 5,000 and above exist. The proportion of the number of villages in all ,the three districts exceeds the State average.
4.80 With a view to examining how the trend towards larger population sizes in villages has been growing during the last 'three decades, we may consider only such of' the distdcts which have not suffered any jurisdictional
changes since 1931. There is only one such district in the State, namely, Kathua. The jurisdiction of Jammu district also remained undisturbed till 1948 when the Chhamb Niyabat which formerly constituted part of Bhimber tehsil (now on the other side of the Cease-fire Line) was also merged with it. If the data relating to the villages of this Niyabat is left out of account, it will be worthwhile to examine the variation in th,e size classes of villages of this district also during the last three decades. The following statement gives the changes in the distribution of 1,000 villages of different population classes, during 1931-61 for the State and the districts of Jammu and Kathua:-
STATEMEMT IV.l"
Chaages III the elistribatioD of 1,000 viUages of certaia popalati_ claslles, 1931-61
State and Districts which have retained more or less same botmclaries since 1931
Proportion of villages Proportion of villages with population less than with population 500-999
Proportion of villages with population 1,000-
1,999 to 1,000 of all villages
Proportion of vilIa8es with population OVer 2,000 to 1,000 orall
villages 500 to 1,000 of all to 1,000 of all villages
villages
r---__..A,.----~ r-----.A.--~ r--___....._-----, ,-____ ...A. ____ -,
1961 19+1 1931 1961
2 3 ~ 5
J-_1I aad Ka&hmJr 700 761 787 201
Jammu 783 851 877 150
Kathua 745 .826 856 1,86
4.81 It will be 'seen from th~ above data that the proportion of vill~gt'8 with ,a population of less than 500 per 1,000 of all villages has been progressively declining both in Jammu and Kathua districts from 1931 onwards. On the other hand, the proportions of higher size classes, namely, villages with a population of 500-999 and 1,000-1,999 have been steadily increasing from decade to decade. A comparison of these results with the data showing the distribution of 1,000 villages of different size classes in the State as a whole indicates that although other districts have been realigned and some others have been newly carved out, there has 'been a progressive tendency of decline
1941 1931 1961 1941 1931 1961 1941 1931
6
166
103
138
383
7 8 9 10 II" 12 13
152 81 61 53- 18 12 8
9~ 60 37 26 7 9 6
116 67 ~4 28 2 2
in the proportion of villages of less than 500 population and of steady increase in villages of higher size classes.
Characteristics of LarRer VillaRes aDd S:m.aller TOWDS
4.82 It will be of interest to find if there is any concentration of villages with a population of 2,000 and over and of towns with less than 5,000 population in any particular district or more preferably in the tehsils of the State. The following statement shows by districst and tehsils the number of such villages and towns in the State according to the Census of 196] ;-
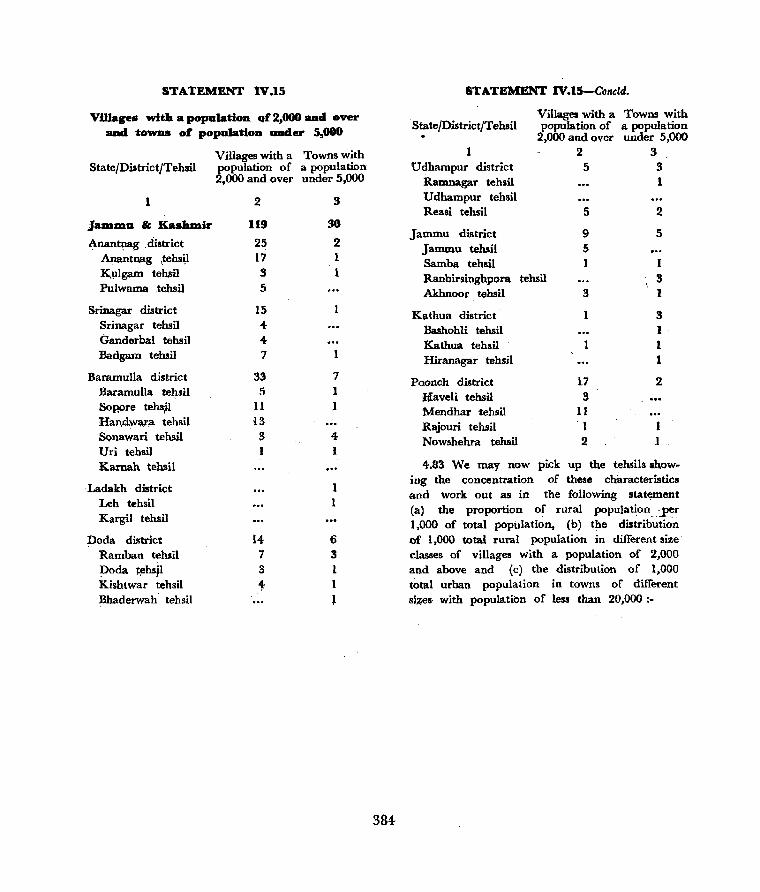
STATEMENT IV.IS
Villages with a populatroa. qf 2,000 and over and towns or population UDder 5,000
State/District/Tehsil
1
JlUDmu & Kashmir
Anant~S' . district Anantnag ,tehs~l
K.ulgam tehsil Pulwama .tehsil
Srinagar district Srinagar tehsil Ganderbal tehsil Badgam temil
Baramulla district Baramulla teJ::l.sil Sop,ore tehsjI Han,dw:;l,l";il tehsil Sonawari tehsil Uri tehsil Karnah tehsil
Ladakh district Leh tehsil Kargil tehsil
poda di~trict
Ramban tehsit poda ~hsJl Kishtwar tehsil Bhaderwah tehsil
Villages with a Towns with population of a population 2,000 and over under 5,000
2
119
25 17 3 5
15 4 4 7
33 5
11 B 3
14 7 3
t
3
30
2 1 1
1
7 1 , 4
6 3 1 1
J
384
STATEMENT lV.IS-Condi.
State/District/Tehsil . Villages with a Towns with population of a population
2,000 and over under 5,000
Udhampur district Ramnagar tehsil Udhampur tehsil Reasi tehsil
Jammu district Jammu tehsil Samba tehsil Ranbirsinghpora tehsil Akhnoor tehsil
Kathua district Bashohli tehsil Kathua tehsil Hiranagar tehsil
Poonch district Haveli rehsil Mendhar tehsil Rajouri tehsil N owshehra temil
2 3 5 3
5
9 5 1
3
1
17 3
11 I 2
1
2
5
I
3 1
3 1 1
2
1
4.83 We may now pick up the temils showing the concentration of these ch'aracteristics and work out as in· the following stat«1ment (a) the proportion of rural population -per 1,000 of total population. (b) the distribution of 1,000 total rural population in different size· classes of villages with a population of 2,000 and above and (c) the distribution of 1,000 total urban population in towns of different si;1;es- with population of less than 20,000:-
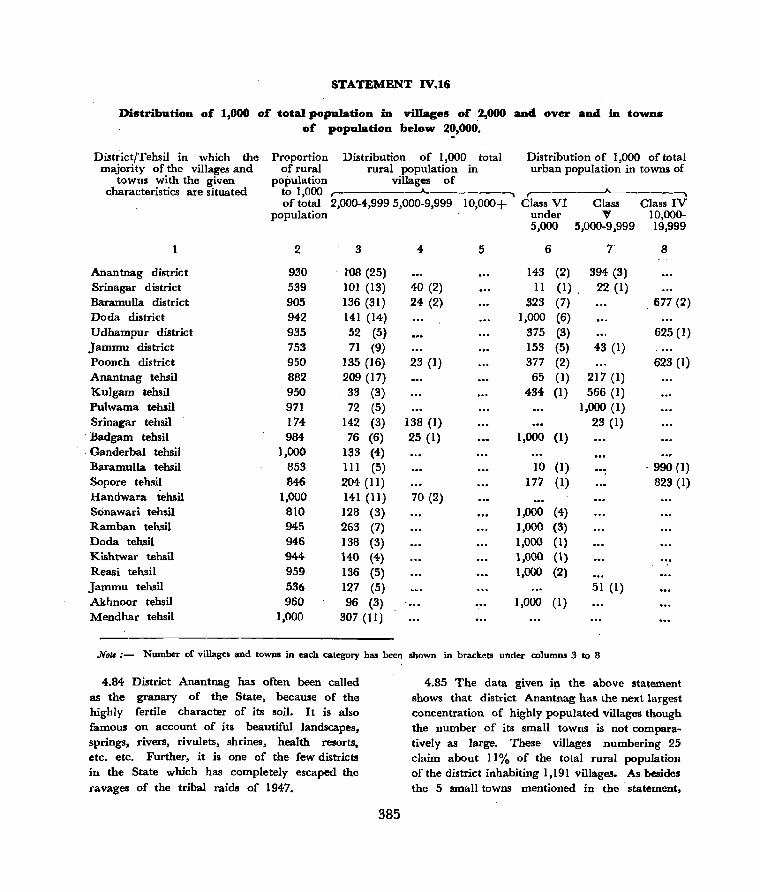
STATEMENT IV.I6
Distribution of 1,000 of total population in villages of .2,000 and over and in towns of population below 20,000.
DistrictfTehsil in which the majority of the villages and
towns with the given characteristics ate situated
Proportion Distribution of 1,000 total Distribu tion 0 f ] ,000 of total urban population in towns of of rural rural population in
population villages of to 1,000 r--------A..--------., r------A.-------., of total 2,000-4,999 5,000-9,999 10,000+ Class VI Class Class IV
population under ~ 10,000-
Anantnag district Srinagar district Baramulla district Doda district Udhampur district Jammu district Poonch district Anantnag tehsil Kulgam tehsil Pulwama tehsil Srinagar tehsil
. Badgam tehsil Ganderbal tehsil Baramulla tehsil Sopore tehsil Handwara tehsil SOnawari tehsil Ramban tehsil Doda tehsil Kishtwar tehsil Reasi tehsil Jammu tehsil Akhnoor tehsil Mendhar tehsil
2
930 539 905 942 935 753 950 882 950 971 174-984
1,000 853 846
1,000 810 945 946 944 959 536 960
1,000
3
lOB (25) 101 (13) 136 (31) 141 (14) 52 (5) 71 (9)
135 (16) 209 (17)
. 33 (3) 72 (5)
142 (3) 76 (6)
133 (4) 111 (5) 204 (11) 141 (11) 128 (3) 263 (7) 138 (3) 140 (4) 136 (5) 127 (5) 96 (3)
307 (11)
4
40 (2) 24 (2)
23 (I)
138 (1) 25 (1)
70 (2)
5
5,000 5,000-9,999 19,999
6
143 (2) 11 (1).
323 (7) 1,000 (6)
375 (3) 153 (5) 377 (2)
65 (1) 434 (1)
1,000 (1)
10 (1) 177 (1)
1,000 (4) 1,000 (3) 1,000 (1) 1,000 (\) 1,000 (2)
1,000 (1)
T
394 (3) 22 (1)
43 (1)
217 (1) 566 (I)
1,000 (1) 23 (1)
51 (1)
8
. 677 (2)
625 (1)
623 (1)
. 990 (1)
823 (1)
Note:- Number of villages and towns in each category has been shown in brackets under columllll 3 to 8
4.84 District Anantnag has often been called as the granary of the State, because of the highly fertile character of its soil. It is also famous on account of its beautiful landscapes, springs, rivers, rivulets, shrines, health resorts, etc. etc. Further, it is one of the few districts in the State which has completely escaped the
ravages of the tribal raids of 1947.
385
4.B5 The data given in the above statement shows that district Anantnag has the next largest concentration of highly populated villages though the number of its small towns is not comparatively as large. These villages numbering 2.5 claim about 11 % of the total rural population of the district inhabiting 1,191 villages. As besides the 5 small towns mentioned in the . statement,

the district includes only one other town, about 54% urban population is concentrated in the former.
4.86 Among the villages some are contiguous, a few others are not far off from each other while the t:est are dispersed over long distances. None of the towns is, however, geographically contiguous but some of them have grown in the close ne~hbourhood of other larger urban areas. The town of Bijbehara, for instance, which belongs to Class V, is situated in the close vicinity of Anantnag, a Class III town. Similarly, another Class V town, namely, Parnpore, is more or less a satellite town of Srinagar city.
4.87 These characteristics are mostly reflected in tehsil Anantnag which includes 17 villages with a population of above 2,000 and 2 towns each with a population of less than 10,000. About 21 % of the rurl!ol popUlation of the tehsil is concel)trated in these villages only. The corresponding proportion of urban population inhibiting the two towns is still larger arid exceeds 28%.
4.88 The contiguous tehsil of Kulgam which consists of as many as 474 inhabited villages does not include more than 3 villages with a popUlation of 2,000 and above and two towns, one of Class V and the other of Class VI. The rural population inhabiting the three villages is slightly more than 3% whereas the urban population is shared by the two towns in the proportion of 57 : 43 approximately. There is no contiguity between any of these villages and towns.
4.89 Similarly, Pulwama the third tehsil of the district contains only 5 villages with a population of over 2,000 constituting just over 7% of the total rural population in the tehsil. In addition, the tehsil includes only one town. One of the villages is the tehsil headquarter and another known as Toknu which is situated on the left bank of river Jhelum has grown in its neighbourhood. Guru the third village is contiguous with Toknu. Another village Tral Pain which has the resemblance of a town and
enjoys many urban amenities is situated at a fairly long distance both from Pulwama and Toknu. The fifth village Khrapoo is an isolated one and has grown in the extreme north of the tehsil.
4.90 Another district in which the concentration of the above characteristics .i8 discernible is Srinagar which includes 13 villages with a population of 2,000 to 4,999, 2 villages of the population group 5,000-9,999 and two towns having less than 10,000 population each. The proportion of rural population inhabiting these villages is larger than that of similar villages .of Anantnag district and exceeds 14%.· The two towns, however, claim a very small proportion of the urban population. One of the two towns and as many as seven of the villages fall in tehsil Badgam alone. The la.tter includes, among others the village of Charar &harief which was a town in 1941 and was later' transferred to the rural list. At any rate, over 10% rural population of the tehsil ha s been returned· from these seven villages only, although ihft tehsiI includes no less than 467 inhabited villages iIi all. There is only one town in the tehsil anc! thiS is why the entire urban popul.~tion is concentrated here.
4.91 The other tehsil conspicuous for these characteristics is Srinagar. Although the number of villages with a population of 2,000 and more in this tehsil is only 4, they are inhabited by 28% of the total rural population of the tehsil. Three of these viz., Bren, Nandpora and Anchar, have grown on the banks of the Dal and Ancbar lakes. Being accessible both by road and the river, the villages are developing fast. Nandpora and Anchar are important fruit and vegetable producing areas which cater to the needs of the city.
4.92 The tehsil also includes one small town known as Badamibagh Cantonment. I t is contiguous with the city of Srinagar and is virtually a satellite town. Due to its location on the National Highway and accessibility by' river Jhelum, which borders the town in the west, the civil population is increasing steadily. Another reason for this growth is the l~rge
scale at which employment is provided in the Ordnance Depot of the Cantonment.
4.93 There is no urban ar~a in GanderbaI, the third tehsil of Srinagar district. It, however, includes four villages, each with a population of ov~r 2,000 and inhabited by over 13% of the total rural population of the tehsil. Of ihese, Tolamulla where the temple of Goddess Ragini is enshrined is famous all over the State and attracts a perennial flow of pilgrims. Village Salora which has a population of 2,403 is not far off from Tolamulla and has grown on the right bank of Sindh nallah. The other two villages consist of Manigam and Chatra Gul which are situated at a long distance from each other.
4.94 The largest concentration of highly populated villages and small towns has been returned from district Baramulla. The district includes, among others, 33 villages with a population ranging from 2,000 to 10,000 and as many as seven Class VI and two Class IV towns. The former account for 16% of the rural population of the district. Class VI towns are, however, inhabited by less than one· third of the total urban population, notwithstanding the fact that their number is very large when compared with Class IV towns in which all the remaining urban population is concentrated. Except for the four towns of tehsil Sonawari which, though not geographically contiguous, are situated in the close neighbourhood of each other, the other towns are dispersed over long distances. Similarly, while some of the villages, such as, Pattan, Hanjiwara, Lalpur of tehsil Baramulla, Diver Inderbug, Tikipora, Lalpur and Warnaw of tehsil Handwara; are either contiguous or have grown at short distances, others are separated by large areas covered by villages of smaller size classes.
4.95 Tehsil Handwara includes the following 13 highly populated villages, eleven of the size dass 2,0004,999 and two others whose population "is more than 5,000 and less than 10,000:-
1. Kalaruch 2. Haihama
5,000-10,000 -do-
387
3. Avoran 2,000 - 5,000 4. Panjgam -do-5. Trehgam -do-6. Gulgam -do-7. Dewarinder -do-8. Tikipora -do-, 9. Lalpur -do-
lO. Warnaw -do--II. Dardpora -do-]2. Drugmulla -do--13. Magam -do-
4.96 Over 21% of the rural population of tile tehsil belongs to these villages only. The first three villages lie in the extreme north of Handwara and are separated from each other hy forest areas and rivulets only. Panjgam, Trehgam and Gulgam are situated within short distances of one another on or very near the IS-mile long Kupwara-Panjgam road, the only motorahle route giving access to tehsil Karnah. Five other villages, Dewarinder, Tikipora, Lalpur, Warnaw and Dardpora, though not quite contiguous, are separated from each other by small areas occupied by a village or a forest. Drugmulla and Magam have no" geographical affinity with each other.
4.97 Before the area constituting the tehsil of Sopore was detached from Handwara, the latter was one of the largest tahsils in the State, It was divided into a number of regions each of which was and continues to he known by a separate name to this day. The north-eastern sector comprising a beautiful valley of fertile land is known as Lolah. Another highly productive region is Khuhihama in the east of the tehsil. Other iIlaqas are known as Uttar, Hamal, Machhipore, Mawar, Langet, etc.
4.98 A reference to the tehsil map shows that highly populated villages are concentrated in the Lalab valley, Khuhihama and Uttar regions. Villages in Langet, Hamal, Mawar, etc. which lie in the south and south-east are generally sparsely populated.
4.99 The next largest number of highly populated villages of district Baramulla has been returned fro~ tehsil Sopore. These villages
numbering eleven absorb over 20% of the entire rural population of the tehsil. In addition, the tehsH includes one Class VI and one Class IV town also; Five of the villages, viz., Kalusa Nathpora, Qazipora patushi, Alusa, Malangam and QuiImuqam are situated in the north and north-east of the tehsil at different points on the bank of Wular lake. Four other villages, Hardoshiu, Dangerpora, Seer and Achabal, which lie in the north-west ·of Sopore town, are also very close to each other, though they are not contiguous. These villages fall in Zainagir region where previously maize and wheat were the principal crops grown and rice cultivation was unknown due to non-availability of irrigational facilities. With the construction of Shahkhul, there has been a complete switch over to paddy cultivation which has revolutionised the economy of the villages fed by the canal. Hardosh.iu is situated on the road connecting Watiab, a famous village on the western bank of Wular lake, with Kulangam and Kupwara. Similarly, Seer is an important village on the bank of river Pohru which is navigable and pr~vides an easy means of transport of goods from and into tehsil Handwara. Dangerpora is in the east of Seer and is by area a much bigger village than many other equally populated villages of the tehsil like Achabal, Chatibandi, etc. Achahal is also situated on the bank of river Pohru and is accessible from Sopore both by road and river Jhelum.
4.100 The other two villages Chatibandi and Butakot are situated far away from each other in the east and north-east of Wular lake. Butakot is very near Sonawari, the famous health resort not far off from Bandipore town.
4.101 The town of Bandipore, which has a population of less than 5,000, is one of the series of highly populated villages, Kalusa Nathpom, Qazipur, etc., situated on the north and northeastern bank of Wular lake. It is a very important station on the trade route between the valley and Gurez and Tilel regions which lie in the north beyond Rajdhani pass (11,938 feet). Before 1947, when the State was not split
388
up by the Cease-fire Line, Bandipore was still more important on account of its being the gateway of Gilgit and Astore districts. The town is accessible both by tarred road from Srinagar and . Handwara as also by Wular lake. One of its important features is that it is an important exporting centre of sheep which are reared in large numbers in Gurez and Tile} and are stocked here for sale to the urban areas of the valley.
4.102 Sopore is one of the few towns in the State which because of its numerous urban characteristics looks more like a city than a town. It is an important distributing· centre of consumer goods and caters all the rural areas of the tehsil including the far-flung and more or less inaccessible areas of Gurez and Tilel.
4.103 Of the five highly populated villages of Baramulla tehsil which are inhabited" by over II % of the rural population, Hanjiwara, Pattan and Delina, are situated on the SrinagarBaramuIla-Rawalpindi road. The first two are contiguous and the third is very near Sangrama, the junction of Srinagar-Baramulla and So poreBaramulla roads. Two other villages, Ferozpore and Lalpore, are situated on the Srinagar-Gulmarg road on the right bank of Ferozpore nallah. The former is a health resort on account of its. invigorating climate and high quality of drinking water.
4.104 The tehsil includes two towns, Gulmarg and Baramulh1.. Gulmarg has the smallest population among all the urban areas of the State. It is a summer resort at a height of 2,639 metres and very neal' village Ferozpore referred to above. Baramulla is one of the largest towns of the State and is the district and tehsil headquarter. It is situated on the Srinagar-Baramulla-T)ri State Highway and has grown on either bank of river Jhelum which passes through its centre.
4.105 Safapora. one of the three villages of Sonawari tehsil in which about 13% of the rural popUlation is concentrated, is the junction of Srinagar-Bandipore and Ganderbal.Sumbal
'roads. It is bordered in the south and southeast by Mansbal lake. Another village, Matipora, is sitlllated on the Srinagar-Baramulla State Highway. Naidkhai, the third village, is
, bordered· by the Haigam sanctuary which ex, tends to, the southern bank of Wular lake.
4.106 There are only four towns in the tehsil, each with a population of 2,000-5,000. Among these, Sumbal and Ajas are important stations on the Srinagar-Bandipore-Gurez road. Sumbal, which is also a tehsil headquarter, is bordered in the north and east by river Jhelum. Ajas is very near Wular lake and is reputed for its quarries of high quality stones which are exported 'to other areas after being chiselled by the local artisans.
4.107 The other two towns are Palhalan and Hajin. The formeF is an industrial town located on the Srinagar-Baramulla-Uri State Highway. Hajin is known for fish rearing which is exported from here to Srinagar in bulk. The town is adjacent to Wular lake. and is mostly inhabited by fishermen.
4.108 Uri tehsil includes ,only one village and one town having a population of above 2,000 and less than 5,000 respectively. The contiguous tehsil of Karnah also does not include either any village with a population of 2,000 and over or any ,town. Obviously, there is no concentration of the villages of higher size classes and of towns of less than 20,000 population' in either of these tehsils.
4.109 In so far as Ladakh district is concerned, not a single village in any of its tehsils has a population exceeding 1,999. Further except for the small town of Leh, there is no urban area in the district. In this case also, therefore, the question of concentration of villages of higher and towns of lower size classes does not arise.
4.110 District Doda includes, among others, _ fourteen villages of the popUlation group 2,000-4,999 and six Class VI towns. Three of the towns, Ramban, Bhaderwah and Kishtwar, are very old, ha~ing been urbanised as early as 191 I. Kishtwar is historically important because
389
of its having been the seat of the rulers of Kishtwar whose domain 'once extended beyond Chenab. Tehsil Bhaderwah, which is one of the most fertile areas in the Outer Hill region, was a jagir till late twenties when it was merged with the rest of the State territory. The town of Bhaderwah very much resembles the densely popUlated parts of Srinagar city and has a similar pattern of buildings, stree.t$, shops, bridges, etc.
4.111 Ramban town, which is also the tehsil headquarter, is situated on the National Highway and is equally distant from the cities of Srinagar and Jammu. With the diversion of the trade route of the State from Sri nagar-Rawalpindi to Srinagar-Jammu-Pathankot, Ramban has grown into a very important -administrative and commercial town.
4.112 Banihal and Batote which are also situated on the National Highway have emerged as towns consequent upon the change in the trade route. Banihal is situated on the slope of a hill at the foot of Pir Panehal mountain and is bordered by a smali rivulet. Batote, which is a sanatorium and has the same height as Srinagar, has grown on the lower slopes of Patni top hills. VehiCles carrying passengers from Srinagar to Pathankot and back usually break their journey at Batote and Banihal. A large number of new buildings have consequently spru'ng up at different points of the hill on which the town is situated.
4.113 Doda is the district and tehsil headquarter and is the junction of the roads leading to Batote, Bhaderwah and Kishtwar. It is' situated on a plateau and is bordered in the south and west by river Chenab. The town has been reputed in the past for opium culti-
"vation which is- now grown on a l~ited scale on account of the restriction imposed by the Government.
4.114 It is thus evident that three of the six towns of the district are concentrated in tehsil Ramban alone. The tehsil also includes seven out of the fourteen villages with a population of 2,000-4-,999. These villages alone
account for over 26% of the total rural population of the tehsil. Two of these, Chamalwas and Sojmatna. have grown on the SrinagarJammu-Pathankot National Highway while another village Khari is also very near it. Two more villages Duligam and Dhanmasta, which lie in the in.terior. are contiguous. Pogal is
,the central village of this sector of the tehsil inhabited by people with Pogali as the mother
. tongue.' 'Ttigam lies in the north but is contii guous to village Khari.
. 4.115 As for the other three tehsils of Dada district there is no village of a population of 2,000 and over in Bhaderwah tehsil. Doda includes three such villages, Desa, Dhandal and Bajarni, inhabited by 13.8% of the total rural population of the tehsil. The villages have grown- in the close vicinity of Dada town and are more or less contiguous. The position obtaining in Kishtwar is no different, there being in all four'villages with a population of 2,000 and over. The aggregate PopUlation inhabiting these v{Uages n; 'i 4% ot the total rural population of the tehsil. . 'Two of the villages, namely, Indarwal and Chhatroo, are contiguous. The other two Sigdee and Palmar are also very near Indarwal and Chhatroo and not far-off from Kishtwar town.
4.116 There are only five villages with a population or" 2,000-4,999 in district Udhampur and all the five are concentrated in tehsil Reasi and inhabited by about 14% of the rural population. The district also includes four towns, one of Class IV and the other three of. Class VI. Two of the villages Gul and Dewal are bordered by tehsil Kulgam and are accessible by a newly built road connecting Ramban with Gulabgarh in the extreme north. Two other villages, Budhan and Thuru, are contiguous. Thuru and another highly populated village Tuli are situated on either bank of nallah Annus, a tributary of river Chenab.
4.117 Two of the three Class VI towns of the district also lie in tehsil Reasi. One of these, viz., Katra, is important on account of its being situated in the close neighbourhood
390
of the cave of Vaishno Devi, a shrine of AllIndia reputation. The other town, Reasi, is the headquarter of the teh5il and has been an urban area right from 1911. The town functions as a distributing centre of consumer goods for all the rural areas in the north and west of the tehsil which are not connected with the town by any motorable road.
4.118 Ramnagar, the headquarter of tehsil Ramnagar, is a historical town. It has :. been once the seat of rulers of Rajas of Ramnagar and is famous for its paintings .
4.119 Udhampur is one of the few large towns of the State situated on the SrinagarJammu-Pathankot National Highway. It is the headquarter of district offices and . of all army installations operating in the State. The town has out-grown its dimensions owing to
the increasing volume of commercial activity.
4.1~O Jammu is another district which claims a concentration of highly populated villages and small size towns. It includes nine villages in the population group 2,000-4,999, five class VI and one Class V towns. Of these, as. --many as five villages and one Class V town faU in Jammu tehsil alone. Three of the villages, Bhalwal, Kot and Raipur Dumana, are fairly large and are situated on Jammu-Akhnoor road. They are bordered by the Ranbir Canal which feeds most of the cultivable lands in the three villages. Another large size village Doongyana is situated close to the junction of the two roads connecting Jammu city with Ranbirsingh~ para and Samba tehsils. The fifth village Bhour is also in the close vicinity of Doongyana and lies in the extreme south of the tehsil on the Jammu-Ranbirsinghpora road. A large number of displaced persons have settled at this place.
4.121 Besides the city of Jammu, the only urban area in the tehsil is the Satwari Cantonment which is contiguous with villages Doongyana and Bhour and is situated on Jammu-Ranbirsingbpora road.
4.122 Of the other three tehsils of the district, there is no village with a popUlation of 2,000
and over in Ranbirsinghpora. The tehsil, however, includes three towns, viz., Ranbir-' singhpora, Bishna and Amia. Ranbirsinghpora is the headquarter of the tehsil· and Bishna and Arnia have been transformed in urban areas for the first time as a result of mass movement of population flom and into the tehsil.
4.12!1 Samba tehsil includes only one village and one town with populations of over 1,999 and less than 5,000 respectively. There is, therefore, no concentration of villages and towns of either category in the tehsil.
4.124 There are, 3 villages each with a population of 2,000 and over and one Class Vr town in Akhnoor tehsil. The villages which consist of Deva, Chamb and Kangial Sangial are inhabited by 9.6% of the total rural population. Of these, the first two which claim populations of 3,712 and 3,092 respectively are contiguous and are situated near the Cease-fire Line. The third village Kangial is inhabited by 2,162 persons and is far away from the other two villages.
4.125 The number of viIlages with a population of 2,OQO and over in Kathua district is limited to one only. The village is situated in Kathua tehsil and claims over 4% of its rural
'\ population.
4.126 The district includes four urban areas, three of which belong to Class VI and one to Class V. The former consist of Hiranagar, Bashohli and Lakhenpur. Lakhenpur is situated near the inter-State border with Punjab and has sprung up into a new township following the diversion of the trade route of the State from Srinagar-Rawalpindi to Srinagar-Pathankot. Hiranagar and Bashohli are both tehsil headquarters.
4.127 Poonch district claims even a larger concentration of highly populated villages than Jammu. These villages numbering seventeen are inhabited by about 16% of the total rural popUlation of the district. Though the number of small towns is much less than in Jammu,
391
these are inhabited by the entire urban population of the district.
4.128 This concentration is particularly reflected in tehsil Mendhar '\\ hich includes, among others, 11 villages inhabited by about 31% of the total rural population of the tehsil. Four such villages, Chhajlah, Mankote, Gohlad and Dharglovan, are situated on Jammu-Mendhar road. Chhajlah and Mankote are contiguous and Dharglovan is bordered in the south by the Cease-fire Line and is contiguous to village Galhota. Two other villages. Hari and Marhote, which are situated on nallah Marhote. are also contiguous. Another large village Gundi is situated on the right bank of Poonch river opposite to Surankote, a famous health resort of the district.
4.129 Another constellation of highly populated villages of the tehsil consists of Gorsahi, Salwah and Ari. Two of these, Ari and Gorsahi, which claim very large areas are bordered by the Poonch-Mendhar road.
Industrial Category of Worker. aDd NOD-worker.
4.130 We may now attempt an analysis of the distribution of rUfal, population in the nine industrial categories of workers and non-workers. One part of Subsidiary Table B-I. 1, which is based' on U:nion Table B-1, gives the distribution of 1,000 persons by each industrial category of worker and non-worker and by sex in respect of rural sectors of the State and of its constituent districts. Some of these districts show abnormal distribution when compared with the corresponding State average for the various industrial categories. A district may be regarded as having abnormal distribution if the proportion of any of its industrial categories exceeds or is less than 25%, when compared with the corresponding proportion of the State for that particular category. The following statement gives the distribution of 1.000 persons 'by each industrial category of worker and non-worker of the rural population of various districts of the State as constituted in 1961:-
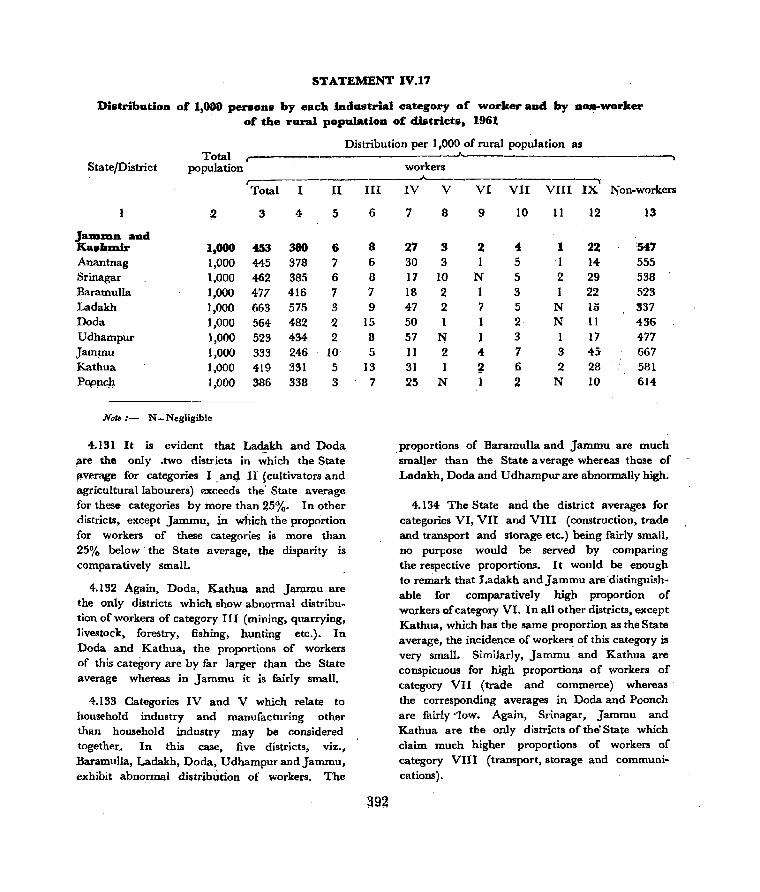
STATEMENT IV.17
DistributioD of 1,000 perSODS by each industrial category or worker aad by Do .... worker
o£ the rural population of districts, 1961
Distribution per 1,000 of rural population as Total
,-___ , ____________ ---A---~
State/District population workers r----------------Jo-Total I II
~ 3 4 5
Ja.uun aad KqhlDiJ: 1,000 453 380 6 Anantnag 1,000 445 378 7 Srinagar 1,000 462 385 6 Baramulla 1,000 477 416 7 Ladakh 1,000 663 575 3 Doda 1,000 564 482 ·2 Udhampur 1,000 523 434 2 Jamptu 1,000 333 246 10 Kathua 1,000 419 331 5 Popncl?, 1,000 386 338 3
Note:- N = Negligible
4.131 It is evident that Ladakh and Doda are the only .two districts in which the State flverage for categories I .ang II (cultivators and agricultural labourers) exceeds the' State average for these categories by more than 25%. In other districts, except Jammu, in which the proportion for workers of these categories is more than 25% below' the State average, the disparity is comparatively small.
4.132 Again, Doda, Kathua and Jammu are the only districts which show abnormal distribution of workers of category III (mining, quarrying, livestock, forestry, fishing, hunting etc.). In Doda and Kathua, the proportions of workers of this category are by rar larger than the State average whereas in Jammu it is fairly small.
4.133 Categories IV and V which relate to household industry and manufacturing other than household industry may be considered together .. , In this case, five districts, viz., Baramulla, Ladakh, Doda, UdhampurandJammu, exhibit abnormal distribution of workers. The
III
6
8 6 8 7 9
15 8 5
13 7
IV V VI VII VIII IX ~on-workers
7 8 9 10 11 12 13
27 3 2 4: 1 22 "547
30 3 1 5 I 14 555 17 10 N 5 2 29 538 18 2 I 3 1 22 523 47 2 7 5 N 15 337 50 1 2 N 11 436 57 ~ l 3 1 17 477 11 2 4 7 3 45 667 31 ~ .6 2 28 581 25 N 2. N 10 614
proportions of Baramulla and Jammu are much smaller than the State a verage whereas those of Ladakh, Doda and Udhampur are abnormally high.
4.134 The State and the district averages for categories VI, VII and VIn (construction, trade and transport and storage etc.) being fairly small, no purpose would be served by comparing the respective proportions. It would be enough to remark that Ladakh and Jammu are' distinguishable for comparatively high proportion of workers of category VI. In all other districts, except Kathua, which has the same proportion as the State average, the incidence of workers of this category is very small. Similarly, Jammu and Kathua are conspicuous for high proportions of workers of category VII (trade and commerce) whereas the corresponding averages in Doda and Poonch are fairly ~low. Again, Srinagar, Jammu and Kathua are the only districts of the' State which claim much higher proportions of workers of category VIII (transport, storage and communications).
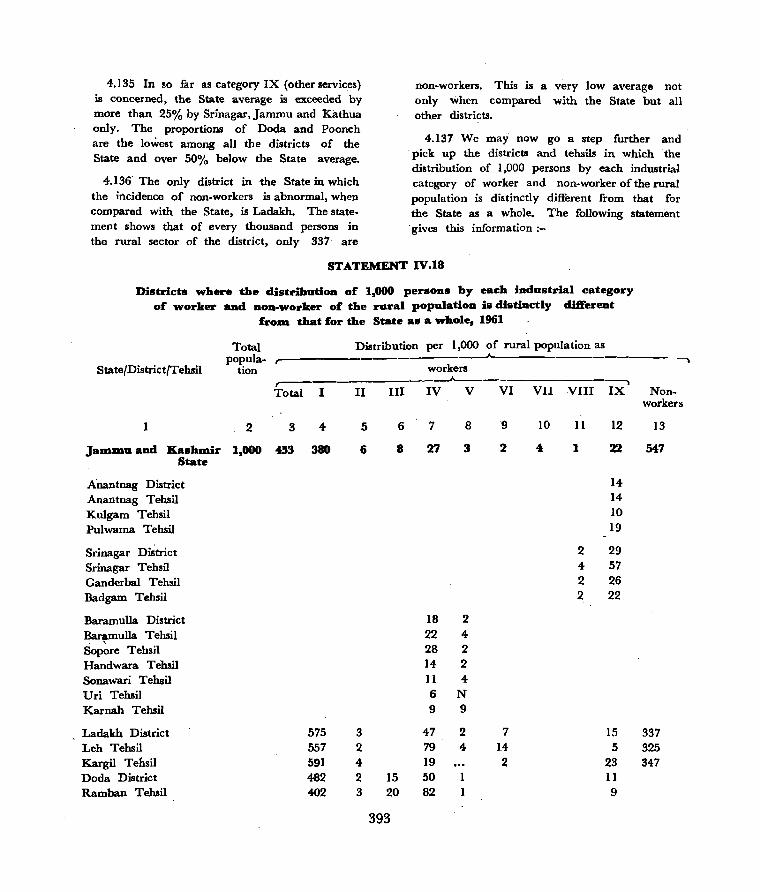
4.135 In so far as category IX (other services) is concerned, the State average is exceeded by more than 25% by Srinagar,Jammu and Kathua only. The proportions of Doda and Poonch are the lowest among all the districts of the State and over 50% below the State average.
4.136' The only district in the State in which the incidence of non-workers is abnormal, when compared with the State, is Ladakh. The statement shows that of every thousand peI1lons in the rural sector of the district, only 337 are
non-workers. This is a very low average not only when compared with the State hut all other districts.
4.137 We may' now go a step further and pick up the districts and tehsils in which the distribution of 1,000 persons by each industrial category of worker and non-worker of the rural population is distinctly different from that for the State as a whole. The following statement 'gives this information:-
STATEMENT IV.18
Districts where 'the distributioD of 1,000 persons by each industrial cl'tegory of worker and nOD-worker of the rural population is distinctly di1I"erent
frOID that for the State a. a whole, 1961
Total Distribution per 1,000 of rural population as popula-
,--_______________ .A.
State/District/Tehsil tion workers ....Jo- ~ ,---
Total I II III IV V VI VII VIII IX
2 3 4- 5 6 7 8 9 10 11 12
JallllDlI and K.ashIDir 1,000 453 380 6 8 21 3 2 4 1 22 State
Anantnag District 14 Anantnag Tehsil 14
Kulgam Tehsil 10
Pulwama Tehsil 19
Srinagar DU;trict 2 29 Srinagar Tehsil 4 57
Ganderbal Tehsil 2 26 Badgam Tehsil 2 22
Baramulla District 18 2 BarlpDulla Tehsil 22 4 Sopare Tehsil 28 2 Handwara Tehsil 14 2 Sonawari Tehsil II 4 Uri Tehsil 6 N
Karnah Tehsil 9 9
Ladakh District 575 3 47 2 7 15 Leh Tehsil 557 2 79 4- 14 5 Kargil Tehsil 591 4 19 2 23 Dada District 482 2 15 50 11
Ramban Tehsil 402 3 20 82 9
393
Non-workers
13
547
337 325 347

STATEMENT IV.IS-Coneld.
Total
State/District/Tehsil popula- r-
lion r--Total I
1 2 3 4
Doda Tehsil 488 Kishtwar Tehsil 551
Bhaderwah Tehsil 491
U dhampur District Rilmnagar Tehsit tJdhampur Tehsil Reasl Tehsil
.tammu District 246
jammu Tehsil 218
Samba Tehsil 230
Ranbirsinghpora Tehsit 224 Akhnoor Tehsil 316
Kathua District Bashohli Tehsil Kathua Tehsil Hiranagar Tehsil
Poonch District Haveli Tehsil Mendhar Tehsil Rajouri Tehsil Nowshehra Tehsil
4.138 It is evident from the above data that the high proportion of workers of categories I and II (cultivators and agricultural labourers) in Ladakh district . is reflected more in Kargil tehsil than Leh. The proportion of Kargil tends to widen the disparity between the district and the State average, whereas that of Leh narrows down the difference to some extent. In district Dada, Kisbtwar tehsil is conspicuous for the high proportion of workers of these two categories which is also by far larger than the district average. Dada and Bhaderwah
Distribution per 1,000 of rural population as
II
5
2 2 3
10 18 6
13 1
.A.. ________________ --, workers .A.._---------..,
III IV V VI VII VIII IX Non-
6
13
3 25
5 8 8
4
13 15 17 6
workers
7 8 9 10 11 12 13
59 1 9
26 2 12
34 1 13
57 N 15 N 19 1
121 1
11 2 4 7 3 45 12 4 3 9 5 59
11 1 1 6 2 40
10 :3 1 7 3 38 11 N 11 5 N 36
6 2 5 7 2 6 2
10 26
6 6
10
have ;;'lmost the same proportions as that of the district, but Ramban has a compuatively low proportion which is approximately the. same as the average for the State.
4.139 In Jammu district, three of the tehsils, Jammu, Samba and Ranbirsinghpora, have equal. proportions of workers of categories I and II which are less than the district average. These tehsils, therefore, tend to widen the disparity between the district and State proportions. Akhnoor, on the other hand, has comparatively much higher proportion which is almost as
394
~uch less than the State average as it is larger than that of the district.
4.140 The districts and tehsils which show abnormal distribution of categories I and II have been plotted on the enclosed map of the Stat~. It will be seen that such of the tehsils in which the State average is exceeded by 25% are contiguous and lie in the east and sou th-east of the State and those in which the respective proportions are over 25% below the State average are also contiguous and are situated in the extreme south. Haveli is the only tehsil which is isolated and is not contiguous with any area of abnormal distribution.
4.141 The high incidence of workers of category III (mining, quarrying, livestock, etc.) in Doda district is reflected mainly in Ramban and Bhaderwah tehsils. The corresponding proportion in Kishtwar is extremely low and by far less than that of the State. Similarly, Bashohli and Kathua tehsils of district Kathua have returned high proportions of workers of
. this category whereas Hiranagar, the third tehsil, has a low proportion tending to bridge the disparity caused by the high proportions of other two tehsils between the State and district averages.
4.142 In the case of categories IV and V (household industry and manufacturing other than household industry) , three of the districts, Ladakh, Doda and Udhampur, have returned much higher proportions than that of the State. Of the two constituent tehsils of district Ladakh, Leh has a very high proportion which tends to widen th~ gap between the two averages. Kargil, on the other hand, has returned a lower proportion.
4.143 The abnormally high proportion of workers of these categories in Doda district is mainly due to their large incidence in Ramban and Doda tehsils. The disparity between the district and the State averages which would thus - have been much greater has, however, been narrowed down by the corresponding proportions of Kishtwar and Bhaderwah tehsils which are more or less the same as the State average.
395
4.144 In the case of Udhampur, the high incidence of workers engaged in manufacturing is exclusively due to the abnormally high proportion of Reasi tehsil which is more than twice the district average and four times the corresponding proportion for the State. Ramnagar and Udhampur, the other constituent tehsils of the district, have, however, very low proportions of such workers and this has restricted the size of the disparity between the district and the State averages which should otherwise have disclosed a phenomenal gap.
4.145 As stated earlier, Baramulla district has an abnormally low incidence of workers of categories IV and V (manufacturing). The gap between- the district and State averages would have been much larger if the proportions of workers in Baramulla and So pore tehsils had also been as low as in the other four tehsils of the district. The high proportions of Baramulla and Sopore tend to reduce the disparity between the district and State averages but as the corresponding proportions of the remaining tehsils are extremely small, the overall average of the district is low.
4.146 The proportions of Jammu district and of its various tehsils are all below the State average and none of the tehsils tends to widen or narrow down the disparity between the district and State averages.
4.147 Ladakh and Jammu districts have returned high proportions of workers of category VI (construction) when compared with the average of .workers of this category for the State as a whole. In the case of the former, while Kargil tehsil has the same average as that of the State, Leh tehsil discloses an abnormal incidence of workers engaged in construction. Similarly, Akhnoor tehsil is conspicuous among other tehsils of district Jammu for very high proportion of workers engaged in construction. Jammu tehsil has an intermediate proportion between the district arid State averages but those of Samba and Ranbirsinghpora are exceedingly low.
4.148 Jammu district also stands out conspicuously for the high proportion of workers of category VII (commercial activities). The district proportion, which is almost twice as much as that of the State is, however, exceeded by Jammu tehsil only. Even the other three tehsils have returned higher proportions than the State average but aU of these except Ranbirsinghpora fall below the district proportion.
4.149 Kathua is the other district in which the incidence of workers of category VII is abnormal. The proportions of all the three tehsils of the district are higher than that of the State. Kathua is the only tehsil which has a higher average than that of the district as a whole. •
4.150 In Srinagar district, the proportion of workers of category VIII (transport, storage and communications) is twice the corresponding average of such workers in the State as a whole. This high proportion is particularly reflected in Srinagar tehsil which claims 4 per 1,000 of population working in transport, storage and communications as against I and 2, the corresponding proportions for the State and district respectively.
4.151 In Jammu district, the proportion of workers who make their living by employment in transport, storage and communications is even higher than that of Srinagar and thrice as much as the State proportion. The gap between the district and State proportions has been widened by the abnormally high percentage of workers of this category in Jammu tehsil where every 5 persons per 1,000 population are engaged in transport and storage etc. Sambl!l and Akhnoor tehsils, which claim small proportions, tend to narrow down the disparity between the State and the district averages but in Ranbirsinghpora, the corresponding proportion is comparatively high.
4.152 Kathua district is comparable with Srinagar, both having returned the same proportions of workers in category VIII. Among the constituent tehsils of the district, Bashohli claims
396
a smaller average of workers of this category when compared with the district ,proportion. In the other two tehsils, the corresponding proportions are high and these have contributed to the distinct disParity between the State and district proportions.
4.153 Six out of the nine districtll of the State disclose an abnormal distribution of workers of category IX (other services). Among these, Jammu and Poonch are particularly ci;>nspicuous, the former for the very high and the latter for exceedingly low incidence of workers engaged in other services. The State average, of 22 per 1,000 is exceeded by all the four constituent tehsils of district Jammu. .Among these, Jammu tehsil alone, however, has a higher average than the district proporti<?n. So far as Poonch district is concerned, the State and the district averages are exceeded by Haveli tehsil only. In Mendhar and Rajouri, the corresponding proportions are even lo*er than the district average which is already by far lower than the State proportion.
.... ]54 The only district in the State where the proportion of non-workers is abnormal-, when compared with the' State average, is Ladakh. As the district claims very high proportions of categories I and II (cultivation) and IV and V (manufacturing), the number of nonworkers in the district is proportionately very small and by far below the State average. There is not much disparity in the proportions of its two tehsils which are approximately the same as the district average.
4.155 Summing up, it is evident that Doda and Jammu districts stand out conspicuously for abnormal distribution of workers in most of the industrial categories. Those common among these to the two districts are categories I and II (cultivation), category III (mining, quarrying, forestry etc.), categories IV and V (manufacturing) and category IX (other services). Jammu district has returned, in addition. high proportions of categories VI and VII (construction and trade and commerce). Even as it is, the incidence of workers engaged in cultivation is
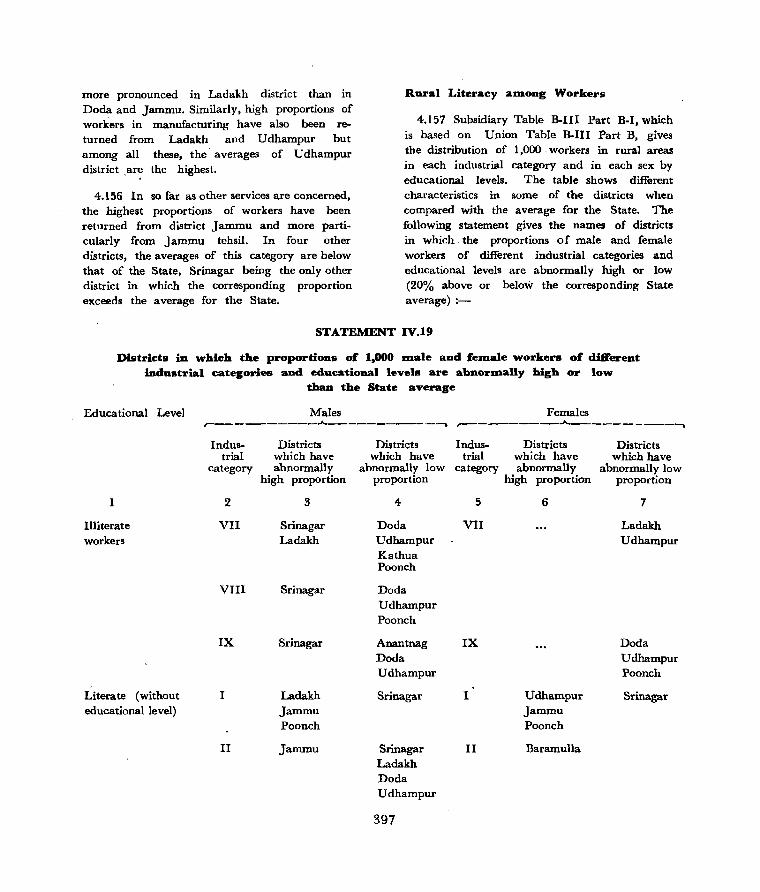
more pronounced in Ladakh district than in Dada and Jammu. Similarly, high proportions of workers in manufacturing have also been returned from Ladakh and UdlIampur but among all these, the' averages of Udhampur district ,are the highest.
4.156 In so far as other services are concerned. the highest proportions of workers have been returned from district Jammu and more particularly from Jammu tehsil. In four other districts, the averages of this category are below that of the State, Srinagar being the only other district in which the corresponding proportion exceeds the average for the State.
Rural Literacy alUong Workers
4.157 Subsidiary Table B-IlI Part B-1, which is based on Union Table B-III Part B, gives the distribution of 1,000· workers in rural areas in each industrial category and in each sex by educational levels. The table shows different characteristics in some of the districts when compared with the average for the State. The following statement gives the names of distdcts in which the proportions of male and female workers of different industrial categories and educational levels are abnormally high or low (20% above or below the corresponding State average) :-
STATEMENT IV.19
Districts in which the proportions of 1.000 lDale and felUale workers of difFerent industrial categories and educational levels are abnorDlally high or low
than the State average
Educational Level
Illiterate workers
Literate (without educational level)
Males Females ,--___________ ..A... __________ • __ __.... ,..-___ - _____ ..,Jt.,.. __________ __,_
Indus- Districts trial which have
category abnormally high proportion
2 3
VII Srinagar Ladakh
VIII Sri nagar
IX Srinagar
I Ladakh Jammu Poonch
II Jammu
Districts which have
abnormally low proportion
4
Doda Udhampur Kathua Poonch
Doda Udhampur Poonch
Anantnag Doda Udhampur
Srinagar
Srinagar Ladakh Doda Udhampur
397
Indus- Districts Districts trial which have which have
category abnormally abnormally low high proportion proportion
5 6 7
VII Ladakh Udhampur
IX Doda Udhampur Poonch
1 Udhampur Srinagar Jammu Poonch
II Baramulla

STATEMENT IV.19-Conla.
Male~ Female~
~-----------~----------~ r-----------A ---------......
Indus- Districts Districts Districts Districts Educational Level trial which have which have Indu .. which have which have
category abnormally abnormally low trial abnormally abnormally low high proportion proportion category high proportion proportion
2 3 4 5 6 7 III Doda Baramulla III Baramulla Kathua
Jammu Udhampur
IV Anantnag Srinagar IV Stinagar Baramul1a
Jammu Doda Ladakh Doda Udhampur Jammu Udhampur
Kathua Poonch
V Baramulla Srinagar V Anantnag Srinagar Dada Udhampur Jammu Kathua
VI Srinagar Anantnag :Daramulla Poonch Ladakh Kathua
VII Dada Srinagar VII Ladakh Udhampur Ladakh Doda Kathua Udhampur
Kathua Poonch
VIII Doda Anantnag Udhampur Srinagar Jammu :Daramulla Kathua Ladakh Poonch
IX Anantnag Srinagar IX Anantnag Srinagar Kathua Udhampur Kathua
Poonch
Literate workers I Kathua Ladakh I Poonch with primary or Poonch Udhampur junior basic examina- Jammu tion qualifications
II Anantnag Srinagar Kathua Baramulla
Doda Udhampur Jammu
398

STATEMENT IV.19-Contd.
Males Females r--------. _____ J.. __________ .....,. .r---.------..A.--------, Educational Indus- Districts Districts Indus- Districts Districts Level trial which have which have trial which have which have
category abnormally abnormally low category abnormally abnormally low high proportion proportion high proportion proportion
2 3 4 :; 6 7
III Doda Srinagar Katbua Ladakh
Udhampur Jammu
IV Baramul1a Srinagar IV Doda Kathua Ladakh Jammu
Udhampur Kathua
V Udhampur V Srinagal'
Jammu Kathua
VI Srinagar Ladakh Baramulla Jammu Udhampur Kathua
VII Baramulla Srinagal' VII Baramulla Kathua Ladakh Pooock Jammu
VIII Ladakh Doda Udhampur Pooock
Kathua
IX Ladakh Srinagar IX ,~da
Udhampur Udhampur Anantnag
Jammu Poonch Srinagar
Poonch Ladakh
Literate workers I Bararnulla
possessing Matricula- Jammu
tion and higher Kathua
qualifications
III Anantnag Srinagar Baramulla Doda Ladakh Udhampul' Kathua Jammu
Poonch
399

. STATEMENT IV.19~Contd.
Males Females '. ~ _______ • ___ J.... __________ -, ,.- _ _________ J... __________ -,
Educational Level
Industrial
category
Districts Districts Indus- Districts Districts which have which have trial which have which have abnormally abnormally low category abnormally abnormally low
high proportion' proportion high propor~ion proportion
IUBterate lVorkers
2
IV •
V
VI
VII
VIII
IX
3
Anantnag Kathua
Doda Udhampur Jammu Kathua
Ladakh Doda Udhampur Kathua
Ladakh Kathua Poonch
Ladakh Doda Udhampur Poonch
Anantnag Doda Udhampur
4.158 Table B-IlI, Part B-1 shows that in the State as a whole the large majority of workers of every industrial category, whether male or female, consists of illiterate persons. The only noticeable difference in the characteristics of different districts is that the disparity between the proportions of literate and illiterate persons in some of the districts is more pronounced than in
others. 4.159 So far as proportions by industrial
categories are concerned, there is nothing abnormal
4
Anantnag Srinagar Baramulla
Anantnag Jammu
Srinagar Baramulla Doda Udhampur
Kathua
Srinagar Ladakh Jammu
5
IX
6
Srinagar Jammu
Doda Udhampur Jammu Poonch
7
Anantnag Srinagar Baramulla Ladakh Kathua
in the characteristics of any of the districts in respect of illiterate male. and female workers of categories I to VI. In all these cases, the district averages of workers of either sex are close to the State average and the variation, if any, is within 20% below or above the State proportion.
400
4.160 The same cannot, howl!ver, be said of categories VII to IX. There are a number of districts which show different characteristics than the _ average of the State in each of these categories. Srinagar is, however, the only district

which claims abnormally high pl'oportions of illiterate male workers in all the three categories VII, VIII and IX. In other districts, the proportion of such workers is either dose to the 'State average or abnormlilly below it; the only exception being Ladakh where the incidence of category VII, illiterate male workers, is mote pronounced than in the State as a whole.
4.161 As in the case of categories I to VI, the averages of illiterate female workers of category VHf in all the districts are very near the State proportion. Again, there is no district in which the proportions of illiterate
'c female workers in' categories VII and IX may be regarded as abnormally high when compared with the State average. Ladakh and Udhampur have, however, returned very low proportions in category VII and so have Doda, Udhampur and Poonch in category IX.
Literate without Educational Levels
4.162 rilt us now consider male and female literate workers possessing no educational qualifica
tions.
4.163 Srinagar is the only district in the State where the incidence of literate male and female workers without educational levels is least pronounced in category I (cultivators) . Among the remaining districts, except Ladakh, Jammu and Poonch which have much higher proportions, the respective averages of such workers are very near the State proportion.
4.164 The overall average of literate female cultivators without educational levels is exceedingly low in the State as a whole, being 3 per 1,000 workers only. This is exceeded by Ladakh, Doda, Udhampur, Jammu and Poonch only by more than 20%. This meam that in Jammu and Poonch districts male and female literate cultivators who have not passed any recognised examination claim much higher proportions than the State average.
4.165 The number flf literate male workers without educational levels engaged in agricultural labour (category II) is very small in the State,
401
being limited to 23 per 1000 workers only. The proportion of female w(i)rkers in this sector is still smaller and does not exceed 3 per 1,000. There are no such workers in Srinagar, La~kh, Doda, Udhampur, Kathua and Poonch. Jammu and Baramulla disclose an abnormal disparity of male and female workers of category II when compared with the respective averages of the State. In so far as male workers are concerned, the corresponding proportions are very low in Srinagar, Ladakh, Doda and Udhampur, being more than 20% below the State average.
4.166 In the case of category III, four of the nine districts have returned abnormal proportions of male workers. Among these, Doda and Jammu claim higher and Baramulla and Udhampur lower averages than. ·that of the State. The overall proportion of female workers of this category in the State as a whole is as low as in category II. The only districts which indicate a measurable disparity when compared with the State average, are Baramulla and Kathua. Baramulla has five times the State average, whereas there are no such workers. in Anantnag, Srinagar, Dada and Udhampur. The incidence of female workers of this cate~ry is least pronounced in Kathua among the remaining districts of the State.
4.167 Jammu is distinguishable from all other districts .of the State for the very high incidence of male and female literate worker-s without educational levels engaged in household industry (category IV). Similarly, Doda. and 'Udhampur are conspicuous for the very low proportions of workers of either sex in category IV.
4.168 Besides Jammu, the only other district which discloses abnormal proportion of male workers is Anantnag. In Srinagar district, the proportions of male and female workers of this category are respectively too low and too high than the State average.
4.169 While the average of male workers in the remaining four districts is very close to the State proportion, in three of these, viz. Ladakh, Kathua and Poonch, the incidence of female workers is very high. Baramulla is another
district besides Doda and U dhampur where the proportion of female workers of this category is very low.
4.170 The overall proportions of male and female workel's engaged in manufa.cturing other than household industry are not so high in the State as a whole, being B4 and 28 per 1,000 workers of the two sexes respectively. Five of the districts, Baramulla, Doda, Udhampur, Jammu and Kathua, have, however, returned very high proportions of male workers. Among these, the disparities of Udhampur and Kathua, when compared with the State average, are strUc:ingly large.
4.171 Srinagar is the only district in which the incidence of male and female literate workers without educational qualifications engaged in manufacturing other than househ~ld industry is the lowest when compared with the State and its other constituent districts. Anantnag, however, has the highest proportion of female workers of this category whiCh is over three times the State average.
4.172 There are no literate females with or without any educational qualifications engaged in construction . (category VI) in any of the districts of the State. In so far as males are concerned, four of the districts, Srinagar, Baramulla, Ladakh and Kathua have abnormally high proportions. Anantnag and Poonch are the only districts in which the incidence of male literate workers without educational levels is abnormally low.
./ 4.173 The three contiguous districts, Doda,
Udhampur and Kathua, have returned very high pro'portions of male and female literate workers without educational levels engaged in trade and commerce (category VII). Udhampu'r and Ladakh are conspicuous for very high and low incidence of female and male workers of this category respectively.
4.174 The only other district which has returned much lower proportion of male workers of category VII than the State average is Srinagar •. Similarly, Poonch is the other distdct besides
402
Ladakh, Dada, Udhampur and Kathua where the average of female workers engaged in trade and commerce is fairly high.
4.175 There is not a single district in the State in which literate females without educational qualifications are employed in transport, storage .and communications (category VIII). Further, there is DO district in which the proportion of male workers of this category is not either abnormally high or low in comparison with the State average. The three districts of Kashmir valley and the contiguous district of Ladakh are characterised by very low averages of such. workers. On the lother hand, all the" five districts of Jammu province are conspicuous for exceedingly high proportions.
4.176 District Anantnag has abnormally high proportions of male and female literate workers without educational qualifications engagedin other services (category IX). Similarly, Srinagar and Kathua are distinguishable on account of the \'ery low incidence of workers of either ;ex engaged in other services. Except for Udhampur and Poonch, w~ch also disclose high proportions of female workers of this category, the corresponding averages of all other di,triCts both in respect of male and female workers are approximately the same as that of the State.
Literate Workers with i'rim.ary or Junior Basic Q.ualificatioDs
4.177 The proportions of literate workers with primary or junior basic qualifications in different industrial CliLtegories show that the incidence of male workers is abno rmally high in Kathua district in each of the eight categories I to VIII when compared with the corresponding State averages. Another important characteristic of this district is that the proportions of its male and female workers with primary or junior basic qualifications who are engaged in household industry (category IV) are fairly high when compared with the State average.
4.178 The data given in 'the table also indicates that thE're is no district in the State in which the incidence of literate fc:male workers

with primary or junior basic qualifications can even be regarded as abnormally low in any of the eight 'categories I to VIII. This is p~tly due to the fact that there are no female workers with these educational qualifications in some of the categories such as II, III, VI and VIII in any of the districts of the State and'. partly because even the State averages in some categories are extremely low compared to which the corresponding averages of the districts are negligible.
4.179 The only other districts which have returned abnormally high proportions of male workers with these' qualifications in categories I to IV are Poonch (category I), Anantnag (category H), Dada (category HI) and Baramulla (category IV).
4.180 Udhampur is conspicuous for the high proportions of male workers of categories V, VI, VIII and IX. Other districts which claim very high proportions of m~le workers are Jammu (categories V and IX), Srinagar (category VI), Bararr~ulla (categories VI and VII), Poonch (categories VII and IX) and Ladakh (categories VIn and IX).
4.181 Except for Ladakh and Doda, there is no distl"ict in the State in which the proportion of male workers with primary or junior basic qualifications who are engaged in manufacturing other than household industry (category V) can be regarded as abnormally low. On the other hand, there are three districts in which these .propartions are much higher than the State average.
4.182 The proportions of workers of categories I, II, III, VI and VII inJammu district and of categories I, III, IV, VI and VII in Ladakh and of categories I to IV of district Udhampur are abnormally low when compared with the respective State averages. Similarly, the averages of workers of district Srinagar in categories II to IV and VII and IX disclose substantial disparities when compared with the State averages of these categories. The other districts in which the averages are fairly below the
403
State proportion are district Doda (categories II and VIII), district Baramulla (category II) and district Poonch (category VIII).
4.183 As already stated, Anantnag, Srinagar and Ladakh are the only districts in which the proportions of female workers with primary or junior basic qualifications are abnormally low and that too in category IX only. In other categories, there are either no such workers at all or the respective proportions are too small to qualify 'them for classification with districts having abnormally low proportions. This is particularly true of categories II, III, VI and VIII which do not include any of the districts of the State with abnormally high proportions of female workers with these educational qualifications. Poonch, Srinagar and Baramulla are, however, conspicuous for the high averdges of female workers of categories I, V and VII respectively. The only other districts which disclose abnormal distribution of female workers consist of Doda, Jammu and Kathua (category IV) and Doda, Udhampur
. and Poonch (category IX).
Literate Worker. with Matrlc:ulatioa aad Higher Q.aalificadoas.
4.184 The State average of literate male workers possessing matriculation or higher qualifications engaged in cultivation (category I) is very small and does not exceed 2 per 1,000. Further, there are only three districts, Baramulla. Jammu and Kathua, which have returned higher proportions of such workers than the State average. There is also no district with an abnormally low proportion of male workers of this category.
4.185 The incidence of female workers 'with matriculation and higher qualifications is still less pronounced and the overall average for the State is negligible. There is, therefore, no district in which the proportion of female workers of this category can be deemed to be abnormally above or below the State average.
4.186 Another noteworthy feature of the table is that there are practically no male and female
workers with matriculation or higher qualifications engaged in agricultural labour (category II).
4.187 Male workers possessing matriculation and higher qualifications engaged in mmmg, quarrying', livestock, forestry, fishing etc. (category III) are found in every district of the State but the respective proportions are either too high or too low when compared with the State a.verage. The statement shows that Anantnag, Baramulla, Ladakh and Kathua have abnormally high proFortions while the proportions of all the five remaining districts are exceedingly low.
4~ 188 There is no female worker in the State who has passed matriculation or some higher examination and is engaged in mining, quarrying etc.
4.189 It- appears from the table that very few well qualified persons, whether males or females, are interested in household industries (category IV). The State average of this category of workers stands at 2 per 1,000 in the case of males and is negligible .so far as females are concerned. Anantnag and Kathua are the only districts where the proportions of male workers of this category, thoug\/. very small, a_!:e abnormally higher than the State average.
4.190 Category V (manufacturing other than household industry)· does not also seem to aUract many workers, whether males or females, with matriculation or higher qualifications. There are, however, some districts in which the proportions of male workers of this category are very much :high when compared with the State average. ~athua, for instance, has a proportion of 32 per 1,000 as against only 4 for the State. Similarly, Jammu, Udhampur and Doda also figure among the districts with abnormally high proportions of male workers. Anantnag, Srinagar and Baramulla have, however, returned very low proportions.
4.191 Srinagar and Jammu are the only districts in which the proportions of female workers with matriculation or higher qualifications who are engaged in manufacturing other than household industry are abnormally high.
4.192 As in the caseofmallY other categories,
404
there are no female workers possessing matriculation or higher qualifications who are engaged in construction (category VI) in any part of the State. In so far as males are concerned, Kathua has more than twice the State proportion. In Ladakh, Doda and Udhampur, the corresponding proportions exceed the State average by more than 20% .. Anantnag and Jammu are the only districts in which the proportions of male workers of this category are fairly low.
4.193 There are no female workers . with matriculation and higher qualifications engaged in trade and commerce (category VII) and transport, storage and communications (category. VIII) in any part of the State. In so far as males are concerned, except for Anantnag and Jammu which have returned proportions very close to the State average, the. proportions of other districts are either abnormally hig)l. or low than the' State average. As regards category VIII, Ladakh, Doda, Udhampur and Poonch have returned very high proportions of male workers possessing matriculation and higher qualifications. Kathua is the only district in which the corresponding proportion is abnormally low.
4.194 The districts of the State stand equaH y divided into three groups in - so far as the proportions of male workers engaged in other services (category IX), who possess matriculation or higher qualifications, are concerned. Anantnag; Doda and Udhampur have abnormally high proportions and Baramulla, Kathua and Poonch are very near the St~te average. Srinagar, Ladakh and Jammu have returned abnormally low proportions.
4.195 In the case of female workers, the proportions of various districts are either too high or too low than the State average. The former include Doda, Udhampur, Jammu and Poonch and the latter all the remaining five districts.
Rural Literacy am.onlf Non-workers
4.196 The following statement indicates the. districts in which the proportions _ per 1,000 persons of different educational levels, who are not at work, are abnormally high or low than the State average:-

STATEMENT IV.20
Districts in which the proportioDs per 1,000 persons of dift"erent educational levels who are not at work are abnorlDally high or low than the State average
Educational level Males Females r-----------A..-----------, r---------..A..-----__ ~ Districts which have Districts which have Districts which have Districts which have
abnormally high abnormally low proportions (+25% proportions (-25%
abnormally high abnormally low
that of State) that of State) proportions (+25% proportions (-25%
that of State)' that of State)
Literate without educational levels
Jammu, Kathua
2 3
Poonch
Primary or junior Anantnag, Udhampur basic Kathua Jammu
Poonch
Matriculation and Anantnag, Ladakh· above Jammu Doda
Udhampur Poonch
4.197 In the State as a whole, 859 per 1,000 male non-workers are illiterate. The corresponding
'averages of individual districts are also very near the State proportion. This is also true of, illiterate female non-workers in whose case the State proportion is much higher and stands at 981 per 1,000.
4.198 Besides this high incidence of illiteracy, literate males with no educational qualifications claim an abnormally high proportion when compared with those who possess some qualifications or other. This applies with greater force in the case of female literates without educational levels.
Literate without EducatioDal Levels
4.199 In six of the districts, the proportions of male non-workers who are literate but possess no educational qualifications are very near the State proportion, viz., 103 per 1,000. Of the remaining three districts, Jammu and Kathua have abnormally high and Poonch has
405
4
Udhampur Jammu Kathua
Kathua
5
Anantnag Srinagar Baramulla Ladakh Poonch
Poonch
exceedingly low proportion when compared with the State average.
4.200 Among females, the State average is exceeded by the three contiguous districts of Udhampur, Jammu and Kathua only. In all other districts, except Doda, the proportions are abnormally low.
PrilDary or Junior Basic
4.201 District Kathua is conspicuous for very high incidence of male and female non-workers who have passed primary or junior basic examination. On the other hand, the proportions of both male and female non-workers with these qualifications in district Pooncb are exceedingly low.
4.202 Anantnag is the only other district where the proportion of male non-workers with the above qualifications is fairly high. Further, besides Poonch, other districts which have returned very low proportions of male nonworkers with these qualifications consist of Udhampur and Jammu.

Matriculation and above
4.203 The number of female non-workers who have passed matriculation and higher examination is negligible in the State as a whole. So far as male non-workers are concerned, Anantnag and Jammu alone have returned higher proportions than the State average. Ladakh, Doda, Udhampur and Poonch have abnormally low proportions. The proportions of other three
-districts are very near the State average.
Rural Unem.ploym.ent by Sex
4.204 The above commentary relates to the incidence of literacy among non-workers of all age-groups inhabiting the rural areas of the State. We may now examine more closely the
proportions of lIDales and females above the age of IS years in the rural areas who are illiterate or literate with or without educational qualifications and (a) are seeking employment for the first time or (b) were employed before but are now out of employment and seeking work.
4.205 The subjoined statement indicates the districts in the rural areas of which the proportions of unemployed males and females aged 15 and above, who are seeking work .for', the first or second time, are abnormally high or low than the State average for each class, viz., illiterate, literate without educational levels, primary or junior basic and matriculation and above:-
STATEMENT IV.21
Districts in which the proportions oC 1,000 unemployed males and Ce_ales oC different educational levels aged 15 and above are abnor_ally high
or low than the State average
Districts which have abnormally high or low proportion of males r----------..J....---.------._...
+ Illiterate
Doda Udhampur Jammu
Anantnag Baramulla Ladakh Poonch
Literate without educational levels
Jammu
Primary or junior basic
Anantnag Baramulla Ladakh Poon<:!y
'Doda Udhampur
Doda Udhampur Jammu
406
Districts which have abnormally high or low proportion of females r--------__ . ..,It... _______ -,
+
Srinagar Dada Udhampur Poonch
Baramulla
Baramulla
Baramulla Ladakh Jammu
Srinagar Ladakh Kathua Doda Udhampur Jammu Poonch
Srinagar Ladakh Doda Udhampur
Jammu Poanch
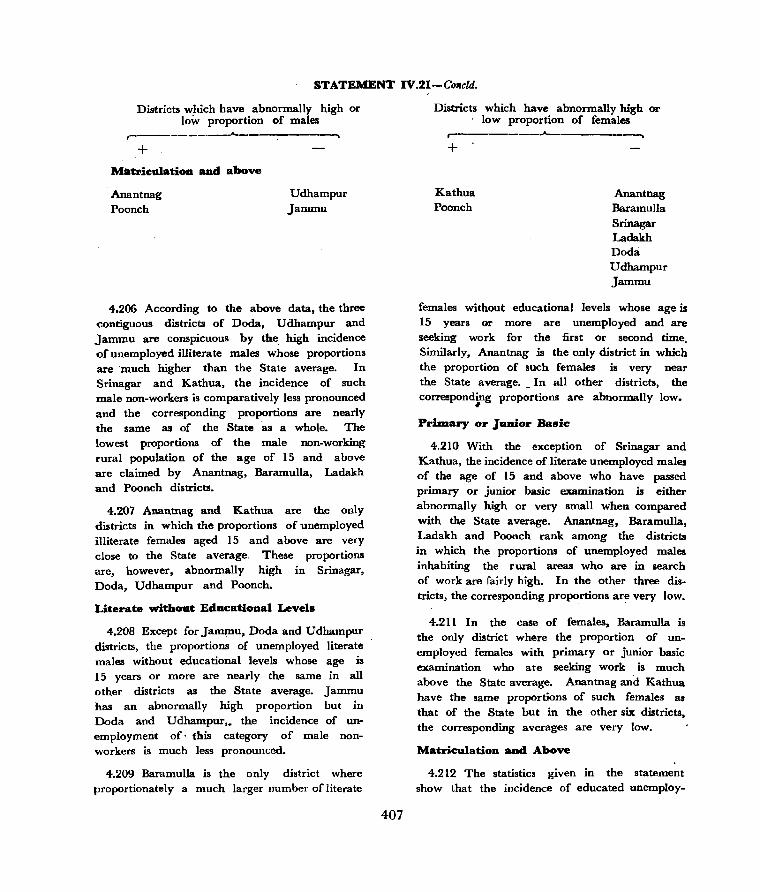
STATEMENT IV.21-Co"cld.
Districts which have abnormally high or low proportion of males .. ---------_ ..... _----. -----.....
+ MatricalatioD aad above
Anantnag Poonch
Udhampur Jammu
4.206 According to the above data, the three contiguous districts of Doda, Udhampur and Jammu are conspicuous by the. high incidence of unemployed illiterate males whose proportions are much higher than the State average. In Srinagar and Kathua, the incidence of such male non-workers is comparatively less pronounced and the corresponding proportions are nearly the same as of the State as a whole. The lowest proportions of the male non-working rural population of the age of 15 and above are claimed by Anantnag, Baramulla, Ladakh and Poonch districts.
4.207 Anantnag and Kathua are the only districts in which the proportions of unemployed illiterate females aged 15 and above are very close to the State average. These proportions are, however, abnormally high in Srinagar, Doda, Udhampur and Poonch.
Literate without Educational Levels
4.208 Except for JamplU, Doda and Udhampur districts, the proportions of unemployed literate males without educational levels whose age is 15 years or more are nearly the same in all other districts as the State average. Jammu has an abnormally high proportion but in Doda and Udhampur,. the incidence of unemployment of· this category of male nonworkers is much less pronounced.
4.209 Baramulla is the only district where proportionately a much larger number of literate
407
Districts which have abnormally high or . low proportion of females
r--------..... ---------, +
Kathua Poonch
Anantnag Baramulla Srinagar Ladakh Doda Udhampur Jammu
females without educational levels whose age is 15 years or more are unemployed and are seeking work for the first or second time. Similarly, Anantnag is the only district in which the proportion of such females is very near the State average. _ In all other districts, the correspond~ng proportions are abnormally low.
Prhnary or Junior Basic
4.210 With the exception of Srinagar and Kathua, the incidence of.literate unemployed males of the age of 15 and above who have passed primary or junior basic examination is either abnormally high or very small when compared with the State average. Anantnag, Baramulla, Ladakh and Poonch rank among the districts in which the proportions of unemployed males inhabiting the rural areas who are in search of work are fairly high. In the other three districts, the corresponding proportions ar~ very low.
4.211 In the case of females, Baramulla is the only district where the proportion of unemployed females with primary or junior basic examination who are seeking work is much above the State average. Anantnag and Kathua have the same . proportions of such females as that of the State but in the other six districts, the corresponding averages are very low.
MatriculatioD and Above
4.212 The statistics given in the statement show that the incidence of educated unemploy-
ment among males of rural areas whose age is 15 years or more is more pronounced in the districts of Anantnag and Poonch than in the State as a whole. Srinagar, BaramuIla, Ladakh, Doda and Kathua have almost the same proportions of such unemployed males as the State average. In Udhampur and Jammu, however, the number of unemployed males who have passed matriculation and higher qualifi~ cations and are seeking work for the first or second time is comparatively very small.
4.213 In no less than seven districts of the State, the incidence of females aged 15 and above inhabiting rural areas who are unemployed and are seeking work is abnormally low. Kathua and Poonch are the only districts which have returned much higher proportions of such unemployed females.
4.214 A further clarification about the disposi~ tion of unemployed persons (those seeking employment for the first time and th.ose emp~ loyed before but now out of employment and seeking work) in the rural areas of the State and its constituent districts is. a~ailable in Subsidiary Table B-IX.I which gives the proportions of such persons per 1,000 of population aged 15 and above by broad age-groups separately for persons, males and females. According to this table, the total number of unemployed persons per 1,000 rural population of the age of 15 and above stands at 2 in the State as a whole. The corresponding proportion among males is, however, 3. In so far as females are concerned, the proportion of unemployed to. 1,000 rural females of the age of 15 and above is negligible.
4.215 In Ladakh and Doda districts, the proportions of unemployed males and females are abnormally low. This, as we have already seen, is due to much higher proportion of females who inhabit the rural areas of these districts being engaged in cultivation and household industry. Jammu and Kathua are, however, conspicuous for abnormally high proportions of Imemployed males.
408
4.216 The break-up by age-groups shows that in Ladakh, Doda and Poonch the incidence of unemployed 'males in the age-groiip 15-34-is very much below the State average. In this case also, Jammu and Kathua districts claim very high proportions of unemployed males.
4.217 The proportion of unemployed females in the age-group 15-34 is negligible in the State as a whole. This is also true of almost every district of the State.
4.218 So far as age-group 35~59 is concerned, Ladakh district is again conspicuous for having returned least proportions of both unemployed males and females. In this case, however, Udhampur and Kathua districts are distinguishable for the high proportions of their unemp~ loyed males and unemployed females respectiyely.
4.219 The overall proportions of unemployed males and females of the age of 60 and above are negligible in the State as a whole. Even in individual districts, the respective proportions do not disclose any abnormal disparities when compared with the State average.
4.220 Poonch is the only district which discloses an abnormally high incidence" ofunemployed females who have not specified their ages. The proportions of unemployed males and females in this age-group are, however, normal in all other districts.
4.221 We may now examine the distribution of 1,000 persons not at work by broad agegroups. This data is given in the rural part of Subsidiary Table B-IX.2.
Following are some of the· important features of this table.
(I) The proportions of males and females not at work in district Ladakh are abnormally high or abnormally low in every age-group except so far as males below the age of 15 years are conoerned.
(2) There is no district in the State in which the proportions of males in the age~group 0-14 who are doing no work are not very near to the State average.
(3) An overwhelming majority of male nonworkers of every district falls in the ._agegroup 0-14.
(4) Further, except for Jammu district, the proportions of female non-workers whose age ranges from, 0-14 years exceed 50% of the' total female population of every other dR trict.
4.222 Doda is the only district besides Ladakh in which the incidence of female non-workers below the age of 15 years is abnormally high. In all other districts, the respective averages are very close to the State proportion.
4.223 In the case of age-group 15-34, except for Ladakh, Udhampur and Poonch, the proportions of male non-workers in all other districts are nearly the same as that of the State as a whole. Ladakh has an abnormally high proportion whereas the averages of Udhampur and Poonch are very low when compared to the State.
/
4.224 There is no district in which the proportion of unemployed females in the age-group 15-34 can be regarded abnormally high. District Ladakh has, however, an extremely low proportion of such females, reasons for which have already been given earlier. The other districts in which the respective proportions are very low co~pared to the State, average consist of Doda and Udhampur.
4.225 The State average of male non-workers in the age-group 35-59 is substantially exceeded by Anantnag and Ladakh districts only. Doda, Udhampur and Poonch have, however, abnormally low proportions of such males. In a~l'
other districts, the corresponding proportions are very near the State- average.
4.226 So far as female non-workers of this group are concerned, the averages of seven districts are very near the State proportion. The only exceptions are Ladakh and Doda in which the corresponding proportions are abnormally low.
4.227 Except Ladakh, there is no other district
409
in the State in which the incidence of male non-workers of the age of 60 and above is abnormally high. The averages of other districts do not disclose any substantial disparity when compared with the State proportion.
4.228 The same cannot be, however, said about females. Ladakh, Doda and Udhampur have returned abnormally high proPortions of female non-workers whose age is 60 or above. In Anantnag district, the incidence of such females is toxceedingly low.
4.229 The proportion of male non-workers in Ladakh whose age is not known is seven times the corresponding State average for this agegroup. Srinagar is the only other district in which the proportion of such male non-workers is abnormally high. Doda, Jammu and Poonch rank among the districts where the corresponding proportions are very low
4.230 As in the case of males, the proportion of female. non-workers in Ladakh, whose ages are not known, is about 10 times the corresponding proportion of the State as a whole. Srinagar is again the only other district in which the proportion of females of this age may be regarded as abnormally high. BaramuUa, Doda and Poonch have. however, returned abnormally low proportions,
4.231 The incidence of non-workers in the State and its constituent districts is further elaborated by Subsidiary Table B-IX.3 which gives the distribution of 1,000 persons not at work by sex and of 1,000 non-workers of each sex by the type of activity.
4.232 The data given in this table shows that full-time male students claim abnormally' high proportions in Jammu and Kathua districts. District Poonch is, however, conspicuous by the low incidence of male students. In all other districts, the corresponding proportions are very near to the State average.
4.233 In the ~se of females, the incidence of full-time students in the various districts is not so uniform. Ladakh, Jammu and Kathua have returned very high averages of full-time,

female students while in Anantnag, Baramulla and Poonch, the corresponding proportions are fairly low.
4.234 The incidence of male non-workers engaged in household duties is negligible in the State as a whole. This is also true of eight of the districts, the only exception being Poonch where the corresponding proportion is very high. It is a known fact that the avenues of employment available in winter to the inhabitants of hilly areas of the State are very limited. Many people from such areas, therefore, move down to to';\ ns and cities towards the close of autumn to secure employment as manual labourers, wood cutters etc. People in the mountainous regions of Poonch district,
• however, find it difficult to undertake long journeys over difficult hilly routes and do not, therefore, migrate to any other part of the State. Instead, they engage themselves in household work.
4.235 Majority of the female non-workers in at least three districts of the State, namely, Srinagar, Baramulla and Jammu are engaged in household duties. Even in other districts, except Ladakh and Doda. the corresponding proportions of such females are very high. The proportion in Ladakh is very low, being slightly more than 5% of the total female non_working population. Reasons for this have already been given in a previous paragraph. In Dada, the corresponding proportion, though much higher than that of Ladakh, is still very much low when compared with the State average.
4.236 There is nothing abnormal in any of the districts of the State in so far as the incidence of male dependents, infants and disabled persons are concerned. The fact, however, remains that there is no district in' which an overwhelming majority of male non-workers does not fall in this category.
4.237 The proportions of female dependents, infants etc. do not disclose any abnormal disparity in seven districts when compared with the State average. The only exceptions - are Ladakh and Doda districts ill both of which
410
the corresponding proportions are much higher than the average for the State.
4.238 Anantnag and Jammu are the only districts where retired males etc. ,are concentrated in abnormally high proport:on than the State average for this class of male non-workers. Srinagar, Ladakh, Doda, Udhampur and Poonch, however, lank among the districts where the incidence of such male non-workers is least pronounced.
4.239 District Poonch' is conspicUous on account of abnormally high r:roportion of retired females and rentiers etc., which stand~ at 28 per 1,000 female non-workers as against only 6, the corresponding State average. With 'the exception of Anantnag and Ladakh, in all other districts the relative propfJrtions are abnormally low.
4.240 Anantnag is also distinguishable from other districts on account of the' concentration of male and.. female beggars, vagrants etc. Their incidence is estimated at ,46 per 1,000 as against only 17 of the State. In all other districts, except Baramulla and Udhampur, the corresponding propo:r;tions are abnormally low.
4.241 Except district Anantnag where the proportion of' female beggars, vagrants - 'etc. is very high, the relative proportions of most other districts are very. close to the State average. In Baramulla, Jammu and Kathua, however, the corresponding averages are fairly low_
4.242 The rural'sector of district Ladakh is, according to the data given in this table, the home of a large number of male inmates of penal, mental and charitable institutions. This is clear from the fact that while the State average for this class of non-workers is as low as 3 per 1,000, the corresponding proportion for Ladakh stands at 53. Baramulla is the only other district where the corresponding proportion is high, but even as it is, it does not exceed 7 per 1,000. The data also shows that there is not a single district in Jammu Province where the incidence of such non-workers is not abnormally low.
4.243 The State average of female inmates of penal, mental and charitable institutions is negligible. Here_ again, district Ladakh is conspicuous on account of its high proportion of 3 per 1,000.
4.244 The proportion of males seeking employment for the first time in most of the districts is the same as in the State as a whole. BaramuUa and Jammu districts, have, however, returned very high proportions of males who are in search of employment for the first time. Ladakh, Doda and Poonch rank among the districts . in which the incidence of such males is abnormally low.
4.245 There are very few females, if any, who are searching employment for the first time in the State and in its constituent districts.
4- 246 District Baramulla has returned a high proportion of male non-workers who were emp- -
. loyed before but are now out of employment and are seeking work. The respective proportions of Anantnag, Udhampur, Jammu and Kathua are, however, very near the State average. Srinagar, Ladakh, Doda and Poonch are'th~ only districts where the incidence of such males is low.
4.247 In so far as females who were employed before but are now out of employment and are seeking work are concerned, district Kathua alone has a comparatively high proportion. In all other districts of the State, either there are no such: female non-workers or their proportions are negligible.
Extent of Literacy in Rural areas
4.248 Subsidiary Table C-III-Part C.I shows that only 15.1 % of the male population above the age of 5 years in the rural areas of the State is literate. The corresponding proportion for the urban areas, however, stands' at 42.4%. As 83% male population of the State above the age of 5 years is concentrated in the rural areas, the overall literacy percentage of ntales in the rural and urban areas put together does not exceed 19.7.
411
4.249 ·In so far as the individual districts are concerned, the disparity in the proportions of literate males of the rural areas is not large in any district except Jammu and Kathua when compared with the corresponding average of the rural sector of the State as a whole. The incidence of literacy in Jammu and Kathua appears to be relatively abnormally high, being 21.5% and 19.1% respectively.
4.250 Even as it is, no less than 10.4% out of the 15.1% literate male popuhition of rural areas of the State does not possess any educational qualifications at all. Among the remaining 4.7%, the proportions of matriculates and those possessing higher qualifications do not exceed in the aggregate I %, all other literates having passed either primary or junior basic examination only.
4.251 As stated above, the rural sector of Jammu district claims the highest proportion of literate males. The correspondirig proportion in Srinagar district is abnormally low and stands at 11.4% only. In all other districts, the incidence of literacy in the rural male literate population above the age of 5 years is nearly the same as in the State as a whole.
4.252 The proportions of male literates in the various age·groups of the State and its constituent districts show that there is no group in which district Jammu is not distinguishable for its abnormally high literacy percentage. Similarly, except the age-group 5-14, the incidence of literacy among rural males of Srinagar district is abnormally low in all other groups when compared with the respective State averages.
4.253 Another important feature of the Subsidiary Table is that the proportions of male literates of district Ladakh in the age-groups 35-59 and 60 and over are, as in Jammu, abnormally high than the State proportions for each of these groups. Further, Kathua is the only district, besides Jammu, which has a very high proportion of literate males in the age-group 5-14. Similarly, Poonch is the only district in which the literacy percentage in the age-group
5-14 is abnormally low in the male population of the rural areas.
4.254 The proportions of all other districts in every age-group are very close to the State average.
4.255 We may now examine the proportions of literate male population according to the educational levels in each of the age-groups mentioned above.
Litenate without Educatioaal Levels
4.256 The Subsidiary Table shows that the districts of Jammu and Srinagar stand out conspicuously on account respectively of the abnormally high and low proportionS of literate males without educational levels in each of the five age-groups. By and large, the proportions of other districts in these age-groups are almost very near the State average. The only exceptions are Ladakh and Kathua. The former has an abnormal~y high proportion of literate males without educational levels in the age-group 15-34 and a very low average in the group 5-14. Kathua has a very high proportion of male literates without educational -revels in the age.group 5-14.
Primary or Junior Basic
4.257 In so far as the rural males of this category are concerned, Kathua is at the top with abnormally high proportions in all agegroups, except 5-14. The proportions of Jammu in the age-groups 15-34 and 60 and over are also very high and disclose large disparity when compared with the State average. Anantnag and Srinagar are the only districts in which the proportions of literate males in the rural sector in the age-group 5-14 are by far higher than the State proportion for this group.
4.258 District U dhampur is conspicuous on account of its abnormally low proportions in aU age-groups, except 60 and over. Other districts, in which the incidence of literate males with primary or junior basic examination is very' low, consist of Jammu and Poonch in the agegroup 5-14' and Ladakh in the age-groups 35-59
412
and 60 and over. The proportions of all other districts in the various age-groups are very near the State average.
Matriculation and above
4.259 There is no district in the State in which the proportion of male literates with matricula. tion or higher qualifications in the age-group 5-14 can be regarded as abn~rmaUy. high. Further, Jammu is the only district which has returned abnormally high proportions of literate
. males with these qualifications in aU the reml!-in-ing four age-groups. Kathua is the other dist~ict in which the proportions of literate males with marticulation and higher qualifications in the age--groups 15-34 and 35-59 are abnor-' mally high.
4.260 Ladakh and Poonch have exceedingly low proportions not only in all the age-groups put together, but also in each individual ,group. Doda is conspicuous for a very low prop~rtion of qualified male literates in the age-group 5-14. Further, besides Ladakh and Poonch,' the only other districts in which the prqportions of male literates with matriculation and higher' qualifications in the age--group 15-34 are exceedingly low, consist of Doda and Udhampur. As stat~ above, Jammu is. the only district which has abnormally high proportion of qualified males in the age-group 60 and above. The corresponding proportions of Srinagar, Doda and Kathua are very near the State average. In the remaining 5 districts, the respective proportions are abnormally low.
4.261 The overall literacy percentage of rural females in the Statt. is exceedingly low, being 1.8% only. This is why the incidence of literacy among rural males and females above the. age of 5 years with various educational levels is lowest in Jammu and Kashmir and does not exceed 8.9%.
4.262 Jammu and Kathua are the only districts in which the proportions. of literate females in the age-groups 5-"14, 15-34 and 35-59 are abnormally high when compared with the State proportion. Again, Jammu is
,the only district which claims very high proportion of females of the age of 60 and above.
4.263 In striking contrast with Jammu and Kathua, Srinagar and Baramulla have abnormally low proportions of literate females in all the age-groups including 60 and over. . Other distric~ in which the incidence of literacy is abnormally low consist of Ladakh· (age-groups 5-14 and 15-34), Anantnag (age-groups 15-34 and 35-59), Doda (age-groups 5-14, 15-34 and 60 and over) and Poonch (age-groups 5-14 and 60 and over).
4.26.4 Following is an analysis of the incidence of literacy among females of different age-groups by educational levels.
Literate without EdacatioDai Levels
4.265 Jammu and Kathua are the only districts which have abnormally high proportions of literate females without educational levels in the age-groups 5-14, 15-34 and 35-59. There is no district with an abnonnally high proportion of literate females without educational levels in the age-group 60 and over.
4.266 Srinagar, Baramulla and Doda rank among. the districts in which the proportions of literate females without educational levels are abnormally low in all the age-groups. The same is true also of Ladakh and Poonch districts except that in Ladakh the proportion of literatE"'·· females without educational levels in the agegroup 60 and above is nearly the same as of the State and the proportion of literate females of Poonch in the age-group 15-34 is also nearly the same as the State average for thL; group.
4.267 Anantnag is distinguishable for the abnormally low proportions in the ag.!-groups 15-34 and 35-59.
Pri:m.ary or Junior Basic
4.268 In this case, Kathua is the only district in which the proportion of females in all agegroups put together is abnormally high. Of the remaining eight districts, the proportions of Anantnag, Srinagar, Baramulla and Jammu are very nearly the same as the State average.
413
In the relIiaining four districts, the corresponding . proportions are abnormally low.
4.269 The only districts in which the proportions of female literates in the age-group 5-14-who have passed primary or junior basic examination are abnormally high than the State average, consist of Anantnag, Srinagar and Kathua. Baramulla and Ladakh have nearly the same proportions as the State average. In other districts, the corresponding proportions are fairly low.
4.270 Except for Jammu, Kathua and Doda, the proportions of literate females in the agegroup 15-34 with primary or junior basic examination qualifications are in all other districts nearly the same as the State average. Jammu and Kathua have, however, abnonnally high proportions whereas Doda is conspicuous for very low incidence of literate females, having passed primary or junior basic examiJll!.tion,
4.271 Jammu and Kathua are again the only districts in which the proportions of literate females with primary or junior basic -qualifications in the age-group 35-59 are abnormally high. The respective proportions of the remaining 7 districts are very near the State average for this group.
4.272 There are practically no females who have passed primary 01' junior basic .examinations and are of the age of 60 and over in Anantnag, Srinagar, Ladakh and Doda which, therefore, comprise the districts having abnormally low proportions of literate females of this category. In other districts, the corresponding proportions do not disclose any substantial disparity when compared with the State average.
Matriculation and above
4.273 The State average for all age·groups of literate females with matriculation and higher qualifications is not exceeded by more than 20% by any of the districts. While Anantnag, Baramulla, Ladakh, Doda and Poonch have returned alm:>st the same proportions as that of the State as a whole, the corresponding
proportions in other districts are slightly higher than the State average.
4.274 Similarly, the average of the State for the age-group 5-14 is also not exceeded by any district. In this case also, Ladakh, Doda, Udhampur and Poonch are the only districts in which there are no females with matriculation and higher qualifications.
4.275 Jammu and Kathua have returned very high proportions of literate females in the agegroup 15-34 who have passed matriculation and higher examinations. In all other districts, the corresponding proportions are nearly the same as the State average.
4.276 In so far as the age-gtoup 35-59 is concerned, Jammu alone has an abnormally
414
high proportion of literate females with matriculation and higher qualifications. The proportions of other districts except Kathua in which there are no females in this age-group possessing matriculation and higher qualifications are nearly the same as the State average.
4.277 As in the case of age-group 5-14, there is no district in the State in which the proportion of females aged 60 and above with matriculation and higher qut',lifications could be regarded as abnormally high. Baramulla, Ladakh, Udhampur, Kathua and Poonch: are not inhabired by any females of the age' of 60 and above who have passed . matriculation and higher examinations. The remaining four districts claim nearly the same averages as for the State as a whole.

APPENDIX
DATES OF IMPOR,.ANT EVENTS REPRESENTED BY CHRONOGRAMS
With the establishment of Muslim rule in Kashmir, . the convention followed in Islamic countries of composing chronograms in respect of important events, particularly the dates of accession and death of rulers, natural calamities and other incidents, was also introduced in Kashmir. Besides indicating the dates of occurrence, the chronograms are invariably designed to give a glimpse into the career of the person concerned or the nature of the event. The calculations are made according to the values prescribed to different alphabetical letters, as indicated below :-
Alphabet
• Value Alphabet
Tariekh-
1 2 3 4
Hassan Event Vol. II
Page No.
169 Death of Sultan Shams-ud-Din
171 Death of Sultan Ala-ud-Din
171 Accession of Sultan Shahab-ud.Din
174 Death of Sultan Shahab-ud-Din
...
-' J
C
176 Death of Sultan Qutb-ud-Din and accession of Sultan Sikandar
185 Death of Timur.the-Lame
Value
5 6 7 8
Chronogram
Alphabet Value Alphabet Value
b 9 J 100
..s 10 J 200 U 20 ~ 300
J 30 .:I 400
r 40 ~ 500
I:.) 50 t 600
v- 60 j 700
t. 70 ~ 800 ~ 80 .Ii 900
. v- 90 t- 1000
We give below a list of such of the events for which chronograms could be traced from the available historical record:-
Year
747 H, corresponding to 1342 A. D.
761 H, corresponding to 1354 A. D.
761 H, corresponding to 1354 A. D.
780 H, corresponding to 1373 A. D.
796 H, corresponding to 1389 A. D.
807 H, corresponding to .1400 A. D.
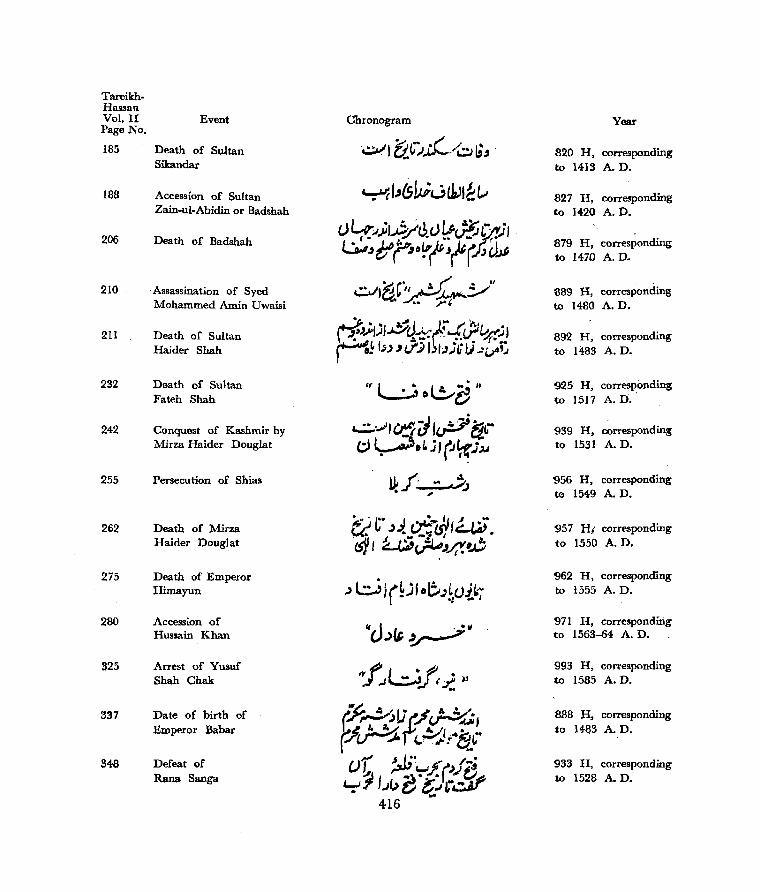
TareikhHassan Vol. II Event Page No.
185 Death of Sultan Sikandar
188 Accession of Sultan Zain-ul-Abidin or Badshah
206 Death of Badshah
210 -Assassination of Syed Mohammed Amin Uwaisi
211 Death of Sultan Haider Shah
232 Death of Sultan Fateh Shah
242 Conquest of Kashmir by Mirza Haider Douglat
255 Persecution of Shias
262 Death of Mirza Haider Douglat
275 Death of Emperor Himayun
280 Accession of Hussain Khan
325 Arrest of Yusuf Shah Chak
337 Date of birth of Emperor Babar
348 Defeat of Rana Sanga
Chronogram
~"'(S~uUzJI~ ~
()~;J;,..b/du{tJ:+;V,!;, l.AJ~ if f10~ t J~p; d~ ~Ita,"ti -:.~"
.~~
.._::.._.." Cd;j I~ (ill(;) ~D~ ';'I-'':r);.J
~f .. ,~ ,
Year
820 H, corresponding to 1413 A. D.
827 H, corresponding to 1420 A. D.
879 H, corresponding to 147D A. D.
889 H, corresponding to 1480 A. D.
892 H, corresponding to 1483 A. D.
925 H, corresr>0nding to 1517 A. D.
939 H, corresponding to 1531 A. D.
956 H, corresponding to 1549 A. D.
957 HI corresponding to 1550 A. D.
962 H, corresponding to 1555 A. D.
971 H, corresponding to 1563-64 A. D.
993 H, corresponding to 1585 A. D.
888 H. corresponding to 14&3 AD.
933 H, corresponding to 1528 A. D.

TareikhHassan
Page No. Event Vol. II
349 Death of Babar
350, Accession of Emperor Himayun
382 Assassination of Bairam Khan
416 Appointment of Qasim Khan as First Moghul Governor of Kashmir
457 Death of Emperor Akbar
484 Death of Emperor Jahangir
514 Accession of Aurangzeb
542 Constrm:tion of Safakadal
bridge of Srinagar city
544 Floods
552 Death of Emperor Aurangzeb
560 Death of Jafar Khan, Governor of Kashmir
566 Accession of Farukh Siyar
572 Assassination of Farukh Siyar
588 Out-break of fire
Chronogram
417
Year
937 H, corresponding to 1530 A. D.
937 H, corresponding to 1530 A.·D.
968 H, corresponding to 1560 A. D.
994 H, corresponding to 1585 A. D.
1014 H, corresponding to 1606 A. D.
1036 H, corresponding, to 1626 A. D.
1069 H, corresponding to - 1659 A. D.
1081 H, corresponding to 1670 A. D.
1094 H, corresponding to 1683 A. D.
1118 H, corresponding to 1707 A. D.
1121 H, corresponding to 1710 A. D.
1125 H, co~respon:ding to 1714 A. D.
1131 H, corresponding to 1718-19 A. D.
1144 H, corresponding to 17~1 A. D.

TareikhHassan Page No. Event Vol. II
620 Floods
626 Assassination of Afrasiab Kiian, 'Governor of Kashmir
656 Out-break of famine
674 Death of Ahmad Shllb Durani
686 Death of Karim Da(l Khan; Governor of Kashmir
700 Death of. Timur Shah, soil. of Ahmad Shah Durrani
719 Defeat of Abdullah Khan; 'Gover-nllr of Kashmir
732 Assassination of Dewan Hira Das
733 Out-break 'of famine
739 Conquest of R;ashmir
by Ranjit Singh
775 Death of Ran.iit singh
778 Assassination of Mian Singh Dogra Governor of Kashmir
841 Death of Maharaja Gulab Singh and accession of Maharaja Ranbir Singh
853 Shia-Sunni conflict
Chronogram
IIJo~" ... ... ... ~ 4· L.
It '1 WI' ~.,; cJ./!-~ ! "~n(!.U:;';
1ft (;y)~jdt;:./itlJ'
'J:.~! &? .~:jd~)j"
~
,"(t·~"
iI'~I.P.'~
II f J l_"J) N
n Uti. ~f_' tJ.j).1I ..I
U?o~~;)..o~~ (U;fP~J6rbi .. d. ' tt!J).t~~~~~{/;' i:P ,.,t~i)Vt;..I)e'tr;J~'-
~~; ... ~~...I.!';, M£,,,ll .. "'. ~I~I.&~L ..{. .... " •• ar'. II •
I'~/HII
418
Year
1160 H, corresponding to 1747 A. D •
1166 H, corresponding to 1752 A. D.
i 168 H, corresponding to 1754 A. D.
1188 H, corresponding 'to 1712 A. D.
t Ig7 H, ool'i'espoilding to 1783 A. D.
1207 H; correSJl9nding 'to 1792 A. D.
'1221 H. corresponding to 1807 A. D.
122~ H, coirespond-mg to 1813 A. D.
1228 H, corresponding to 1813, A. D.
1234 H, corresponding
to 1819 A. D •
1255 H, corresponding to 18S9 A. '1;>.
1257 H, corresponding to 1841 A. D.
1273 H, corresponding to 1857 ,A. D •
1289 H, corresponding to 1872 AD.
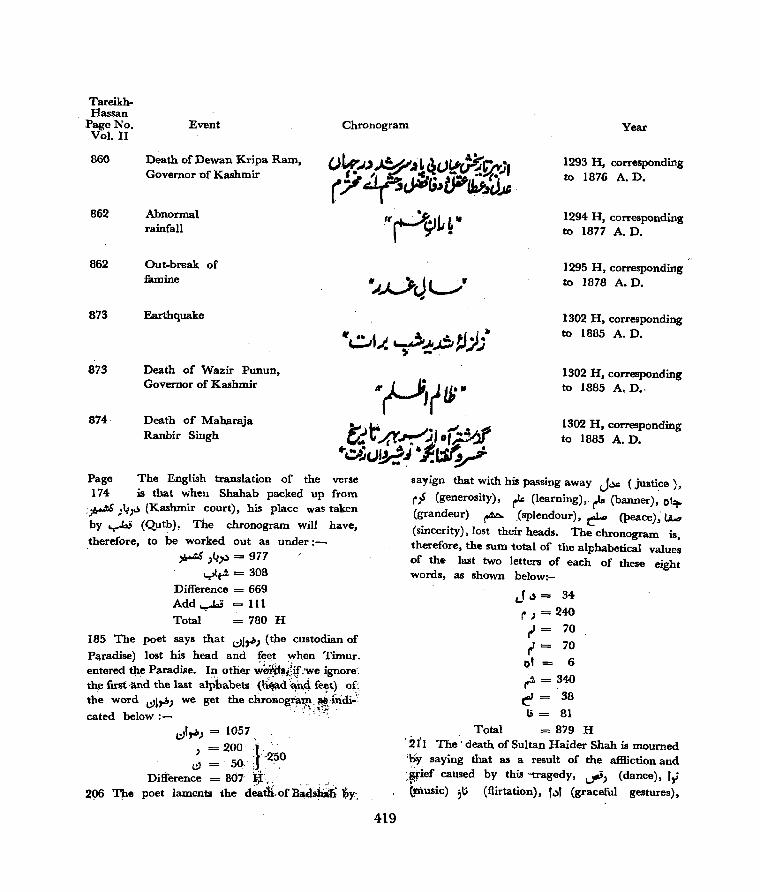
TareikhHassan
Page No. Event Vol. II
Chronogram Year
860 Death of Dewan Kripa Ram, Governor -of Kashmir
862 Abnormal rainfall
862 Out-break of famine
873 Earthquake
873 Death of Wazir Punun, Governor of Kashmir Ar~(tb·~
1293 H, corresponding to 1876 A. D.
1294 H, corresponding to 1877 A. D.
1295 H, corresponding to 1878 A. D.
1302 H, corresponding to 1885 A. D.
1302 H, corresponding to 1885 A. D.,
874 Death of Maharaja Ranbir Singh ~r 4Y-"'::"';I.~
"~(j~~ '1.~Y'
1302 H, corresponding to 1885 A. D.
Page The English translation of the verse 174 is that when Shahab packed up from :;~ )l~).) (Kashmir court), his place was taken
by ~ (Qutb), The chronogram will have,
therefore, to be wOI'ked out as under:-
~ )~)') = 977 yl~ = 308
Difference = 669 Add..,...b3 = III Total = 780 H
]85 The poet says that 1.:))"'" (the custodian of
Paradise) lost his head and feet :when Timur. entered the Paradille. In other w6tlis,Jif.:'we ignore': the first and the last alPhabets (n:~d ~4 _~t) oe ~e word I.:)h.b, we get the chronog~~~;0m:di~:~ cated below:-
I.:)t,_.;) = 1057, '
) = 200 .}'-, '2'~0 l!,) = 50,; "
Difference = 807- ~,,' , , " __ ,_ 296 The poet laments the deaiii,of BadsiUili ~y.~
419
sayign that with his passing away J~ (justice),
r-J (generosity), ~ (learning)" rlo (banner), o(~ (grandeur) ~ (splendour), ~ (lleace),1.l.,.,
(sincerity), lost their heads. The chronogram is, therefore, the sum total of the alphabetical values of the last two letters of each of these eight words, as shown below:-
Total
J 0) = 34
r) = 240
r' = 70
r = 70
0' = 6 ('~ = ~40 e = 38
t,; = 81 = 879 H
'21'1 The' death of Sultan Haider Shah is mourned 'b.y saying that as a result of the affliction and :i,rief caused by this -tragedy, ~) (dance), t,; . tllluSic);1; (flirtation), t.)t (graceful gestures),
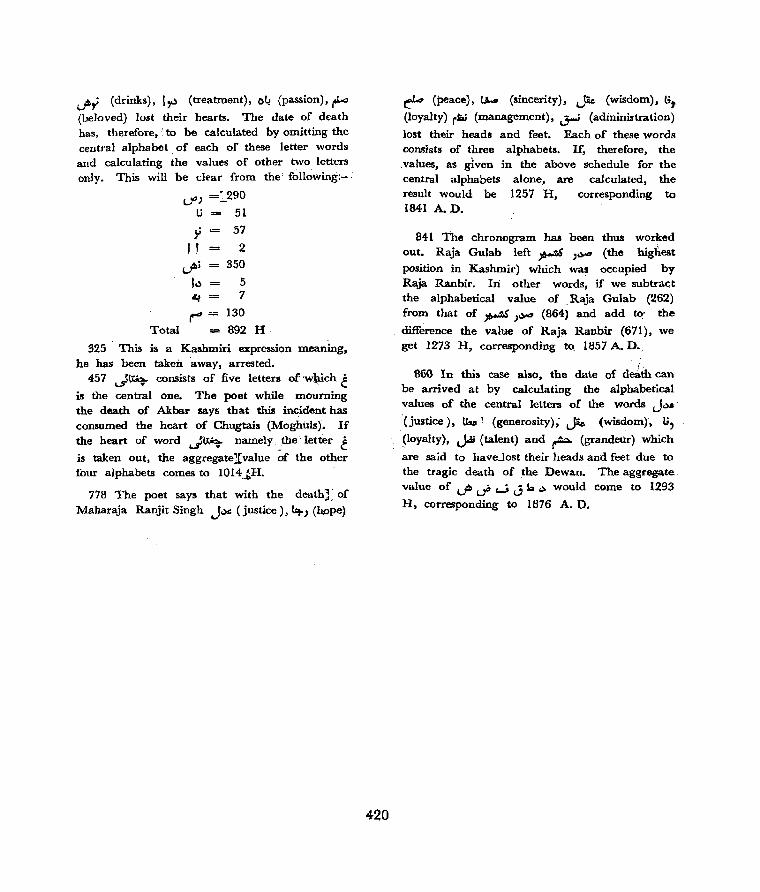
'-'~.; (drinks), I,.) (treatment), ov. (passion), ~
(beloved) lost their hearts. The date of death has, therefore,: to be calculated by omitting the central alphabet. of each of these letter words and calculating the values of other two letters only. This will be clear from the following:-
L)") =::"290 l.i 51
Y 57
II 2
J>; 350
I.) 5
~ 7
~= 130
Total 892 H
325 This is a Kashmiri expression meaning, he has been taken 'away, arrested.
457 ..}~ consists of five letters of 'w\rlch t. is the central one. The poet while mourning the death of Akbar says that this incident has consumed the heart of Chugtais (Moghuls). If
the heart of word ..}~ namely _the letter t. is taken out, the aggregatelvalue of the other four alphabets comes to 1014_~H.
778 The poet says that with the death): of Maharaja Ranjit Singh Jo)Il (justice),~) (hope)
420
~ (peace), t.W (sincerity), ~ (wisdom), (;,
(loyalty) rl<ai (management), ~ (adininistration)
lost their heads and feet. Each of these words consists of three alphabets. If, therefore, the .values, as given in the above schedule for the central alphabets alone, are calculated, the result would be 1257 H, corresponding to 1841 A. D.
841 The chronogram has been thus worked out. Raja Gulab left ~ )0.)04 (the highest
position in Kashmir) which was occupied by Raja Ranbir. hi other words, if we subtract. the alphabetical value of .. Raja Gulab (262) from that of ~ )0.)04 (864) and add to' the
difference the value of Raja Ranbir (671), we get 1273 H, corresponding tQ 1857 A. D.,
860 In this case also, the date of d~th can be arrived at by calculating the alphabetical values of the central letters of the words J~
'(justice), Uu' (generosity); JAc (wisdom), t;,
~loyalty), j.a; (talent) and ~ (grandeur) which
are said to haveJost their heads and feet due to the tragic death of the Dewan.' The aggregate value of J> t..i' u ..:; b .,) would come to 1293
H. corresponding to 1876 A. D.
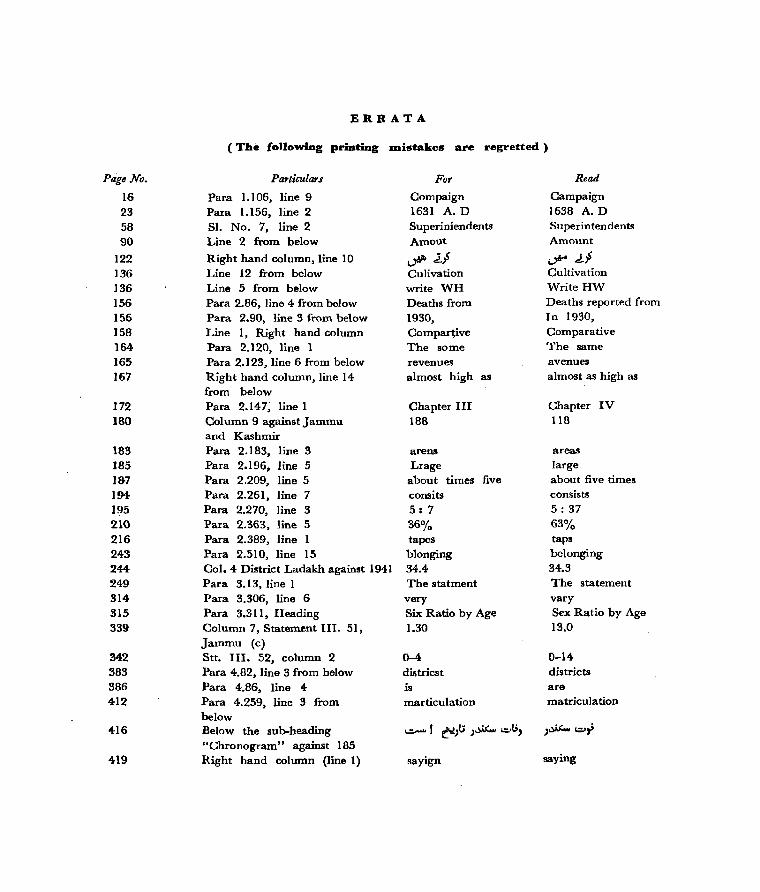
Page No.
16 23 58 90
122 136 ]36 ]56 ]56
158 164 165 167
172 180
183 185 1&7 194-195 210 216 243 244 249 314 315 339
342 383 386 412
416
419
ERRATA
(The following printing :a:nis1:akes are regretted)
Particulars
Para 1. 1 06, line 9 Para 1.156, line 2 SI. No.7, line 2 Line 2 from below
Right hand column, line 10 Line 12 from below Line 5 from below Para 2.86, line 4 from below Para 2.90, line 3 from below Line 1, Right hand column Para 2.120, line 1 Para 2.123, line 6 from below Right hand column, line 14 from below Para 2.147, line 1 Column 9 against Jammu and Kashmir Para 2.) 83, line 3 Para 2.196, line 5 Para 2.209, line 5 Para 2.261, line 7 Para 2.270, line 3 Para 2.363, line 5 Para 2.389, line Para 2.510, line 15 Col. 4 District Ladakh against 1941 Para 3.13, line 1 Para 3.306, line 6 Para 3.311, Heading Column 7, Statement III. 51, Jammu (c) Stt. III. 52, column 2 Para 4.82, line 3 from below Para 4.86, line 4 Para 4.259, line 3 from below Below the sub-heading "Chronogram" against 185 Right hand column (line 1)
For
Compaign 1631 A. D Superiniendents Amont
d'" J.i Culivation write WH Deaths from 1930, Compar~ive
The some revenues almost high as
Chapter III 188
arens Lrage about times five consits 5: 7 36% tapes blonging 34.4 The statment very Six Ratio by Age 1.30
0-4 districst is marticulation
sayign
Read
Campaign 1638 A. D Superintendents Amount
~ J..f Cultivation Write HW Deaths reported from In 1930, Comparative The same avenues almost as high as
Chapter IV 118
areas large about five times consists 5: 37 63% taps belonging 34.3 The statement vary Sex Ratio by Age 13.0
0-14 districts are matriculation
saying


LIST OF AGENTS FOR THE SALE OF GOVERNMENT OF INDIAN PUBLICATIONS (as on 17 February 1964)
AGARTALA-Laxmi Bhandar Books & . Scientific Sales (Rest.)
AGRA-1. National Book· House, Jeoni Mandi 2~ Wadhawa & Co., 45, Civil Lines 3. Banwati LaI Jain; Publishers, Moti
Katra 4. English Book Depot., Sadar Bazar,
(Reg.) (Reg.)
(Rest.)
Ag~ Cantt. (Rest.)
AHMADNAGAR-V; T. JOrakar, Prop. Rama General Stores, Navi Path '" (Rest.)
AHMEDABAD-1. Balgovind Kuber Das & Co., Gandhi
Road (Reg.) 2. Chandra Kant Chiman Lal Vora,
Gandhi Road 3. New Ordet Book Co., Ellis Bridge .. 4. Mahajan Bros., Opp. Khadia Police
Gate 5, Sastu Kitab Ghar, New Relief Talkies,
Patthar Kuva, Relief Road
AJMER-1. Book-Land, 663 Madar Gate 2. Rajputana Book House, Station Road .. 3. Law Book House, 271, HathiBhata .-_ 4. Vijay Bros., Kutchery -Road 5. Krishna Bros., Kutchery Read
ALIGARH-Friend's Book House, Muslim Market
ALLAHABAD-1. Superintendent, Printing & Stationery,
U. P. 2. Kitabistan, 17-A A. Kamla Nehru
(Reg.) (Reg.)
(Rest.)
(Reg.)
(Reg.) (Reg.) (Reg.) (Rest.) (Rest.)
(Reg.)
Road (Reg.) 3. Law Book Co., Sardar Patel Marg,
P. Box 4 ... (Reg.) 4. Ram Narain Lal Bem Modho 2-A,
Katra Road 5. Universal Book Co., 20, M.G. Road ... 6. The University Book Agency
(of Lahore), Elgm Road 7. Wadhwa & Co., 23, M. G. Marg ... 8. Bharat Law House, 15, Mahatma
Gandhi Marg
(Reg.) (Reg.)
(Reg.) (Rest.)
(Rest.)
'I
9. Ram Narain La! Bem Prashad, 2-A, Katra Road (Rest.)
AMBALA-
1. English Book Depot., Ambala Cantt .... (Reg.) 2. Seth Law House, 8719, Railway Road,
Ambala Cantt. . .. (Rest.)
AMRITSAR-1. The Law Book Agency, G. T. Road,
Putligarh (Reg.) 2. S. Gupta, Agent Government Publi-
cations, Np,ar P. O. Majith Mandi ... (Reg.) 3. Amar Nath & Sons, Near P.O.,
Majith Mandi (Reg )
ANAND-1. Vijaya Stores, Station Road 2. Charto Book Stall, Tulsi Sadan, Stn.
Road
ASANSOL-D. N. Roy and R. K. Roy, Booksellers, Atwal Building
BANGALORE-
1. The Bangalore Legal Practitioner Co-op. Society Ltd., Bar Association Building
2. S. S. Book Emporium, 118, Mount Joy Road
3. The Bangalore Press, Lake View, Mysore Road, P. O. Box 507 .. ,
4. The Standard Book Depot., Avenue Road
5. Vichara Sahitya Private Ltd., Balepet 6. MakkaIa Pustaka Press, Balmandira,
Gandhinagar 7. Maruthi Book Depot, Avenue Road ... 8. International Book House P. Ltd.,.
4-F Mahatma Gandhi Road 9.· Navakarnataka Puhns. Private Ltd.,
Majestic Circle
BARE ILL Y -Agarwal Bz:others, Bara Bazar
BARODA-I. Shri Chandrakant Mohan Lal Shah,
Raopura 2. Good Companions Booksellers, Publi
shers & Sub-Agent
(Rest.)
(Rest.)
(Rest.)
<!~_eg.)
(Reg.)
(Reg.)
(Reg.) (Reg.)
(Reg.) (Rest.)
(Reg.)
(Rest.)
(Reg.)
(Rest.)
(Rest.)
3. New Medical Book House, 540, Madan Zampa Road (Rest.)
BEWAR-The Secretary, S. D. ·College, Co-operative Store Ltd. (Rest.)
BELGHARIA-Granthlok, Antiquarian Booksellers & Publishers (24-Parganas), 5/1 Amlica Mukherjee Road (Reg.)
BHAGALPUR-Paper Stationery Stores, D. N. Singh Road (Reg.)
BHOPAL-
1. Superintendent, State Government Press
2. Lyall Book Depot, Mohd. Din Bldg., Sultania Road (Reg.)
3. Delite Books, Opp. Bhopal Talkies •.• (Rest.)
BHUBANESHW AR-Ekamra Vidyabhaban, Eastern Tower, Room No.3 (Rest.)
BIjAPUR-Shri D. V. Deshpande, Law Booksellers, Prop. Vinod Book Depot, Near Shrialshetti Chowk ...
BIKANER-Bhandani Bros.
BALASPUR-Sharma Book Stall, Sadar Bazar
BOMBAY-
1. Supdt. Printing and Stationery, Queens Road
2;' Charles Lambert and Co., 101, Mahatma Gandhi Road
3. Co-operator's Bank Depot.5/32 Ahmed Sailor Bldg., Dadar
4. Current Book House, Maruti Lane,
(Rest.) (Rest.)
(Rest.)
(Reg.)
(Reg.)
Raghunath Dadaji St. (Reg.) 5. Current Technical Literature Co., P.
Ltd., India House, lst floor 6. International Book Home Ltd., 9 Ash
Lane, M. G. Road 7. Lakkani Book Depot Girgaum 8. Elpees Agencies, 24-, Bhangwadi;
Kalbadevi 9. P. P. H. Book Stall, 190-B, Khetwadi
Main Road 10. New Book Co., 188-190, Dr. Dadabhai
Naoroji Road 11. Popular Book Depot, Lamington Road 12. Sunder Dass Gian Chand, 601
Girgaum Road, Near Princess Street ... 13. D. B. Taraporewala Son~ and Co. (P)
Ltd., 210 Dr. Dadabhai Naoroji Road 14. Thacker and Co., Rampart Row
(Reg.)
(Reg.) (Reg.)
(Reg.)
(Reg.)
(Reg.) (Reg.)
(Reg.)
(Reg.) (Reg.)
II
15. N .. M. Tripathi Private Ltd., Princess Street (Reg.)
16. The Kothari Book Edward Road
Depot, King
17. P. H. Rams Krishna and Sons 147, Rajaram Bhuvan, Shivaji Park Road
(Reg.)
No.5 (Rest.)
18. C. Jamnadas and Co., Bo~ksellers, 146-C, Princess Street . (Reg.)
19: Indo Nath and. Co., A-6 Daulat Nagar Borivli (Reg.)
20. Minerva Book Shop, Shop No. 1/80, N. Subhas Road . (Reg.)
21. Academic Book Co., Association Building Girgaum Road (Rest.)
22. Dominion Publishers, 23 B.I Building, Shri ·P. M. Road .... (Rest.)
23. Bomay National History Society,. 91 Walkeshwar Road ... (Rest.)
24. Dowamadeo and Co., 16, Naziria· Building, Ballard Estate .... :'. (Rest.)
25. Asian Trading Co., 310, the Miraball, P.B. 1505 ... (Rest.)
CALC0TTA-
1. Chatterjee and Co., 3/1. Bachatam Chatterjee Lane (Reg.)
2. Dass Gupta and Co. College Street
Ltd., 54/3, (Reg.)
3. Hindu Library, 69 A, Bolaram De Street (Reg.)
4. S. K. Lahiri and Co. Private Ltd., College Street (Reg.)
5. M. C. Sarkar and Sons Private Ltd., 14-, Bankim Chatterjee Street (Reg.)
6. W. Newman and Co. Ltd., 3, Old Court House Street (Reg.)
7. Oxford Book and Stationery Co., 17 Park Street (Reg.)
8. R. Chambray and Co. Ltd., Kent House, P. 33, Mission Road Extension (Reg.)
9. S. C. Sarkar and Sons Private Ltd., I. C. College Square (Reg.)
10. Thacker Spink and Co. (1933) P. Ltd., '3, Esplanade East (Reg.)
11. Firma K. L. Mukhopadhaya, 6/IA; Banchha Ram, Akrar Lane (Reg.)
12. K. K. Roy, P. Box No. 10210, Calcutta-I 9 '"(Reg.)
13. Sm. P. D. Upadhyay. 77 Muktaram Babu Street ., (Rest.)

14. Universal Book Dist., 8/2 Hastings Street (Rest.)
15. Modern Book Depot., 9, Chowringhee Centre (Rest.)
16. Soor and Co., 125, Canning Street ." (Reg.) 17. S. BhattachaIjee,49, Dharamtala Street (Rest.) 18. Mukherjee Library, 10 Sarba Khan
Road (Reg.) 19. Current Literature Co., 208, Mahatma
Gandhi Road (Reg.) 20. The Book Depository, 4/1, Madan
Street (Ist Floor) (Rest.) 21. Scientific Book Agency,' Netaji Subhas
Road (Rest.) 22. Reliance Trading Co., 17/1 Banku Bihari
Ghose Lane, District Howrah (Rest.) 23. Indian Book Dist. Co., 6512 Mahatma
Gandhi Road (Rest.)
CALI CUT-Touring Book Stall
CHANDIGARH-
1. Supdt. Govt. Printing and Stationery, Punjab
2. Jain Law Agency, Flat No.8, Sector
(Rest.)
No. 22 (Reg.) 3. Rama News Agency, Bookseller, Sector
No. 22 (Reg.) 4. Universal Book Store, Booth 25 Sector
22 D (Reg.) 5. Engli;ih Book Shop, 34, Sector 22 D ... (Rest.) 6. Mehta Bros, 15-Z Sector 22 B. (Rest.) 7. Tandan Book Dept. Shopping Centre,
Sector 16 (Rest.) 8. Kailash Law Publishers, Sector 22 B ... (Rest.)
CHHINDWARA-The Verma Book Depot. (Rest)
COCHIN-Saraswat Corporation Ltd., Pal-liarakav Road •.. (Reg)
CUTTACK-
1. Press Officer Orissa Sectt. 2. Cuttack Law Times 3. Irabhat K. Mahaptra, Mangalabag
P. B. 35 ... 4. D. P. Sur & Sons, Mangalabag 5. Utkal Stores, Balu Bazar
DEHRADUN-
(Reg.) (Reg.)
(Reg.) (Rest.) (Rest.)
1. Jugal Kishore & Co. Rajpur Road (Reg.) 2. National News Agency, Paltan Bazar (Reg.) 3. Bishan Singh and Mahendra Pal Singh,
318, Chukhuwala (Reg.) 4. Uttam Pustak Bhandar, Pal tan Bazar .•. (Rest.)
iii
DELHI-
1. J. M.Jaina & Brothers, Moti Gate (R;eg.)
2. Atma Ram & Sons, Kashmere Gate ... (Reg.)
3. Federal Law Book Depot., Kashmere . Gate •• , (Reg.)
4. Bahri Bros., 188, Lajpat Rai Market .• , (Reg.)
5. Bawa Harikishan Dass Bedi (Vijaya General Agencies) P. B. 2027, Ahata Kedara, Chamelian Road (Reg.)
6. Book-Well, 4, Sant Narankari Colony, P. B. 1565 ... (Reg.)
7. Imperial Publishing Co., 3, Faiz Bazar, Daryaganj ... (Reg.)"
S. Metropolitan Book Co., 1 Faiz Bazar (Reg.)
9. Publication Centre, Subzimandi (Reg.)
10. Youngman & Co., Nai Sarak (Reg.)
11. Indian Army Book Depot., 3, Daryaganj (Reg.)
12. All Indian Educational Supply Co., Shri Ram Buildings, Jawahar Nagar '" (Rest.)
13. Dhanwat Medical & Law Books House 1522, Lajpat Rai Market (Rest.)
14. University Book House, 15, U. B. Bangalore Road,Jawahar Nagar (Rest.)
15. Law Literature House, 2646, Balimaran (Rest.)
16. Summer Brothers, P. O. Birla Lines ... (Rest.)
17. Universal Book & Stationery Co., 16 Nataji Subhash Marg (Reg.)
18. B. Nath & Bros., 3808, Charkhawalan (Chowri Bazar) (Rest.)
19. Rajkamal Prakashan P. Ltd., 8, Faiz Bazar (Reg.)
20. Premier Book Co., Printers Publishers & Booksellers, Nai Sarak (Rest.)
21. Universal Book Traders, SO, Gokhale Market (Reg.)
22. Tech. & Commercial Book Coy., 75 Gokhale Market (Rest.)
23. Saini Law Publishing Co., 1416, Chabi-ganj. Kashmere Gate ... (Rest.)
24. G. M. Ahuja, Booksellers & Stationers, 339, Nehru Bazar (Rest.)
25. Sat Narain & Sons, 3141 Mohd. Ali Bazar, Moti Gate (Reg.)
26. Kitab Mahal (Wholesale Div.) P. Ltd., 28, Faiz Bazar (Reg.)
27. Hindu Sahitya Sansar, Nai Sarak (Rest.) 2S. Munshi Ram Manohar Lal, Oriental
SookelleTs & Publishers, p, B. 1165, N ai Sarak (Rest.)
29. K. L. Seth, Suppliers of Law Commercial Tech. Books, Sha,nti Nagar, Ga-neshpura (Rest.)
30. Adarsh 'Publishing Service, 5/10 Ansari Road (Rest.)
DHANBAD-1. Ismag Co-operative Stores Ltd., P. O.
Indian Schools of Mines 2. New Sketch Press, Post Box 26
DHARWAR-
(Reg.) (Rest.)
1. The Agricultural College Consumers Co-op. Society (Rest.)
2. Rameshraya Book Depot., Subhas Road (Rest.)
3. Karnatakya Sahitpa Mandira of Publishers and Booksellers
ERNAKULAM-1. Pai & Co., Cloth Bazar Road (Rest.) 2. South India Traders C/o Constiutional
Journal (Reg.) FEROZEPUR-English Book Depot., 78,
Jhoke Road (Reg.)
GAUHATI-Mokshada Pustakalaya (Reg.)
GA YA-Sahitya Sadan, Gautam Budha Marg (Reg.)
GHAZIABAD-Jayana Book Agency (Rest.)
GORAKPUR-Vishwa Vidyalaya Praka-shan, Nakhes Road (Reg.)
GUDUR-The General Manager, The N. D. C. Publishing & Ptg. Society
Ltd. (Rest.)
GUNTUR-Book Lovers Private Ltd., Kadriguda, Chowrasta (Reg.)
GWALIOR-1. Supdt. Printing & Stationery M. B. 2. Loyal Book Depot., Patankar Bazar,
Lashkar (Reg.)
3. M.C. Daftari, Prop. M.B. Jain & Bros., Booksellers, Sarafa, Lashkar
HUBLI-Pervaje's Book House Koppikar Road
HYDERABAD-
1. Director Govt. Press 2. The Swaraj Book Depot, Lakdikapul 3. Book Lovers Private Ltd. 4. Labour Law Publications, 873, Sultan
Bazar
(Rest.)
(Reg.)
(Reg.) (Rest.)
(Rest.)
IMPHAL-Tikendra & Sons Booksellers... (Rest.)
INDORE-1. Wadhawa & Co., 56, M. G. Road... (Reg.)
iv
2. Swarup Brothers, Khiijuri Bazar 3. Madhya Pradesh Book Centre, 41.
Ahilya Pura 4. Modern Book House, Shiv Vilas Palace 5. Navyug Sahitya Sadan, Publishers &
Booksellers, 10, Khajuri Bazar
JABALPUR-
(Rest.)
(Rest.) (Rest.)
(Rest.)
1. Modern Book House, 286,jawahargarti (Reg.) 2. National Book House, 185Jai Prakash
Narain Marg (A)
jAIPUR-
1. Government Printing and Stationery Department, Rajasth.an
2. Bharat Law House, Booksellers & Publishers, Opp. Prem Prakash Cinema
3. Garg Book Co., Tripolia Bazar 4. Vam Mandie, Sawai Mansingh
Highway 5. Kalyan Mal & Sons, Tripolia Bazar ... 6. Popular Book Depot, Chaura Rasta .. . 7. Krishna Book Depot., Chaura Rasta ... .' 8. Dominion Law Depot., Shah Building,
P . .tl. J'.o. 23
jAMNAGAR-Swedeshi Vastu Bhandar
jAMSHEDPUR-
1. Amar Kitab Ghar,'Diagonal Road, P. B. 78 ..
2. Gupta Stores, Dhatkidih 3. Sanyal Bros., Booksellers & News
Agents, Bistapur Market
jAWALAPUR-Sahyog Book Depot.
JHUNJHNU-I. Shashi Kumar Sarat Chand 2. Kapram Prakashan PrasarlUIl,
Namdha Niwas, Azad Marg
JODHPUR-
1/90
I. Dwarka Dass Rathi, Wholesale Books and News Agents
2. Kitab-Ghar, Sojati Gate 3. Ghoppra Brothers, Tripolia Bazar
jULLUNDUR-
1. Hazooria .Bros., Mai Hiran Gate 2. Jain General House, Bazar Bansanwala 3. University Publishers, Railway Road
KANPUR-
(J;teg;) (Reg.)
(Reg.) . (:Reg.) (Reg.) (Rest.)
(Rest.)
(Reg.) (Reg.)
(Rest.)
(Rest.)
(Rest.)
(R)
(Reg.) (Reg.) (Reg.)
(Rest.) (Reg.) (Rest.)
1. Advani & Co., P. Box, 100, The Mall (Reg.) 2. Sahitya Niketan, Shradhanand Park... (Reg.)
3. The Universal Book Stall, The Mall (Reg.) 4. Raj Corporation, Raj House, P. B. 200,
·Chowk (Rest.)
KABUR-Shri V. Nagaraja Rao,26 Sri-nivasapuram (Rest.)
KODARlv,[A-The Bhagwati Press, P. O. JhumH Tila.iya, Dt. Hazaribagh ...
KOLHAPUR-Maharashtra Granth Bhan-dar, Mahadwar Road (Rest.)
KOTA-Kota Book Depot (Rest.)
KUMTA-S. V. Kamat Booksellers and Stationers (N. Kanara) (Reg.)
LUCKNOW-
1. Soochna Sahitya Depot (State Book Depot)
2. Balkrishna Book Co. Ltd., Hazratganj (Reg.) 3. British Book Depot, 84, Hazratganj ... (Reg.) 4: Ram Advani, Hazratganj, P. B. 154... (Reg.) 5. Universal Publishers (P) Ltd. Hazrat-
ganj (Reg.) 6. Eastern Book Co., Lalbagh Road ... (Reg.) 7. Civil & Military Educational Stores,
106/B Sadar Bazar (Rest.) 8. Acquarium Supply Co., 213, Faizabad
Road (Rest.) 9. Law Book Mart Amin-ud-Daula Park (Rest.)
LUDHIANA-
1. Lyall Book Depot. Chura Bazar 2. Mohindra Brothers, Katcheri Road ... 3. Nanda Stationery Bhandar, Pustak
Bazar 4. The Pharmacy News, Pindi Street
MADRAS-
1. Supdt., Govt. Press. Mount Road 2. Account Test Institute, P. O. 760 Em-
gore 3. C. Subbiah Chetty & Co., Triplicane 4. K. Krishnamurty, Post Box 384 .,. 5. Presidency Book. Supplies, 8 Pycrofts
(Reg.) (Rest.)
(Rest.) (Rest.)
-(Reg.) (Reg.) (Reg.)
Road, Triplicane ... (Reg.) 6. P. Vardhachary & Co., 8, Linghi
Chetty Street 7. Palani Parchuram, 3 Pycrofts Road,
(Reg.)
TripHcane ... (Reg.) 8. NCBH Private Ltd., 199, Mount Road (Rest.) 9. V. Sadanand, The Personal Bookshop,
10 Congress Building, Ill, Mount Road (Rest.)
v
MADURAI-
l. Oriental Book House, 253, West Masi Street . (Reg.)
2. Vivekananda Press, 48, West Masi Street (Reg.)
MANDYA SUGAR TOWN -K.N. Nari-mhe Gowda & Sons (Rest.)
MANGALORE-U. R. Shenoye Sons, Car Street, P. Box 128 (Reg.)
MANJESHWAR-Mukenda KrishnaNayak (Rest.)
MATHURA-Rath & Co., Tilohi Building Bangoli Ghat ,.. (Rest.)
MEERUT-1. Prakash Educational Stores, Subhas
Bazar 2. Hind Chitra Press, West Kutchery
Road 3. Loyal Book Depot, Chhipi Tank 4. Bharat Educational Stores, Chhippi
Tank 5. Universal Book Depot, Booksellers &
News Agents
MONGHY AR-Anusndhan, Minerva Press Building
MUSSOORIE-
I. Cambridge Book Depot, The Mall 2. Hind Traders
MUZAFFARNAGAR-
1. Mittal & Co., 85-C, New Mandi 2. B. S. Jain & Co., 71, Abupura
MUZAFFAR PUR-
1. Scientific & Educational Supply Syndicate
2. Legal Corner,Tikmanio House, Amgola Road •
3. Tirhut Book Depot
MYSORE-
l. H. Venkataramiah & Sons, New Statue
(Reg.)
(Reg.) (Reg.)
(Reg.)
(Rest.)
(Rest.)
(Rest.) (Rest.)
(Rest.) (Rest.)
(Reg.)
(Rest.) (Rest.)
Circle (Reg.) 2. Peoples Book House, Opp. Jagan
Mohan Palace (Reg.) 3. Geeta Book House, Booksellers &
Publishers, Krishnamurthipuram ... (Rest.) 4. News Paper House, Lansdowne Buil-
ding (Rest.) 5. Indian Mercantile Corporation, Toy
Palace Ramvilas (Rest.)
NADIAD-R. S. Desay, Station Road .,. (Rest.)
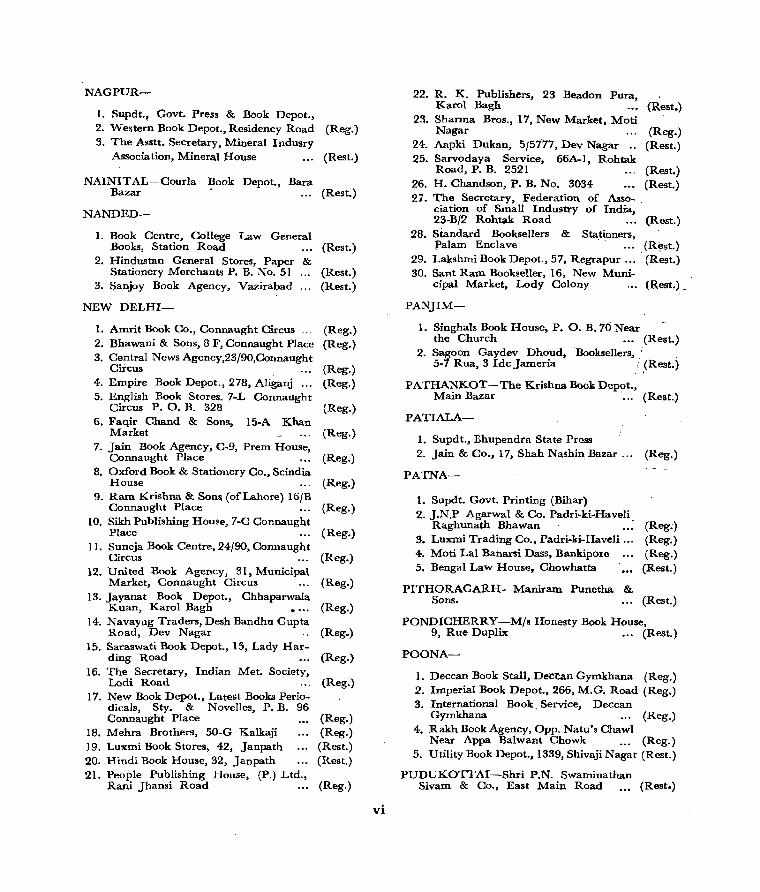
NAG PUR-
I. Supdt., Govt. Press & Book Depot., 2. Western Book Depot., Residency Road (Reg.) 3. The Asstt. Secretary, Miner"l Indusry
Association, Mineral House (Rest.)
NAINIT AL-Courla Book Depot., Bara. Bazar (Rest.)
NANDED-
1. Book Centre, College Law General Books, Station Road
2. Hindustan General Stores, Paper & Stationery Merchants P. B. No. 51
3. Sanjoy Book Agency, Vazirabad
NEW DELHI-
1. Amrit Book Co., Connaught Circus .. 2. Bhawani & Sons, 8 F, Connaught Place 3. Central News Agency,23/90,Connaught
Circus 4. Empire Book Depot., 278, Aliganj ... 5. English Book Stores. 7-L Connaught
Circus P. O. B. 328 6. Faqir Chand & Sons, 15-A Khan
Market 7. Jain Book Agency, C-9, Prem House,
Connaught Place 8. Oxford Book & Stationery Co., Scindia
House 9. Ram Krishna & Sons (of Lahore) 16/B
Connaught Place 10. Sikh Publishing House, 7-C Connaught
Place 1 I. Suneja Book Centre, 24/90, Connaught
Circus 12. United Book Agency, 31, Municipal
Market, Connaught Circus 13. Jayanat Book Depot., Chhaparwala
Kuan, Karol Bagh 14. Navayug Traders, Desh Bandhu Gupta
Road, Dev Nagar 15. Saraswati Book DepGt., 15, Lady Har
ding Road 16. The Secretary, Indian Met. Society,
Lodi Road 17. New Book Depot., Latest Books Perio
dicals, Sty. & NoveIles, P. B. 96 Connaught Place
18. Mehra Brothers, 50-G Kalkaji 19. Luxmi Book Stores, 42, Janpath 20. Hindi Book House, 32, Janpath 21. People Publishing House, (P.) Ltd.,
Rani Jhansi Road
(Rest.)
(Rest.) (Rest.)
(Reg.) (Reg.)
(Reg.) {Reg.)
(Reg.)
(Reg.)
(Reg.)
(Reg.)
(Reg.)
(Reg.)
(Reg.)
(Reg.)
(Reg.)
(Reg.)
(Reg.)
(Reg.)
(Reg.) (Reg.) (Rest.) (Rest.)
(Reg.)
vi
22. R. K. Publishers, 23 Beadon Pura, Karol Bagh '" (Rest.)
23. Sharma Bros., 17, New Market, Moti Nagar (Reg.)
24. Aapki Dukan, 5/5777, Dev Nagar .. (Rest.) 25. Sarvodaya Service, 66A-l, Rohtak
Road, P. B. 2521 (Rest.) 26. H. Chandson, P. B. No. 3034 (Rest.) 27. The Secretary, Federation of Asso- .
ciation of Small Industry of India, 23-B/2 Rohtak Road
28. Standard Booksellers & Stationers, Palam Enclave .
29. Lakshrni Book Depot., 57, Regrapur ... 30. Sant Ram Bookseller, 16, New Muni
cipal Market, Lady Colony
PANJIM-
1. Singhals Book House, P. O. B. 70 Near
(Rest.)
(R~st.)
(Rest.)
(Rest.) _
the Church (Rest.) 2. Sago on Gaydev Dhoud, Booksellers,.; .
5-7 Rua, 3 IdcJameria , ,(Rest.)
PATHANKOT -The Krishna Book Depot., Main Bazar . (Rest.)
PATIALA-
1. Supdt., Ehupendra State Press 2. Jain & Co., 17, Shah Nashin Bazar... (Reg.)
PATNA-
1. Supdt. Govt. Printing (Bihar) 2. J.N.P Agarwal & Co. Padl'i-ki-Haveli
Raghunath Bhawan . ..: 3. Luxmi Trading Co., Padri-ki-Haveli .. , 4. Moti Lal Banarsi Dass, Bankipore 5. Bengal Law House, Chowhatta
PITHORAGARH-Maniram Punetha & Sons.
(Reg;) (Reg.) (Reg.) (Rest.)
(Rest.)
PONDICHERRY-M/s Honesty Book House, 9, Rue Duplix ." (Rest.)
POONA-
1. Deccan Book Stall, Deccan Gymkhana (Reg.) 2. Imperial Book Depot., 266, M.G. Road (Reg.) 3. International Book. Service, Deccan
Gymkhana (Reg.) 4. Rakh Book Agency, Opp. Natu's Chawl
Near Appa Balwant Chowk (Reg.) 5. Utility Book Depot., 1339, Shivaji Nagar (Rest.)
PUDUKOTTAI-Shri P.N. Swaminathan Sivam & Co., East Main Road •• , (Rest.)
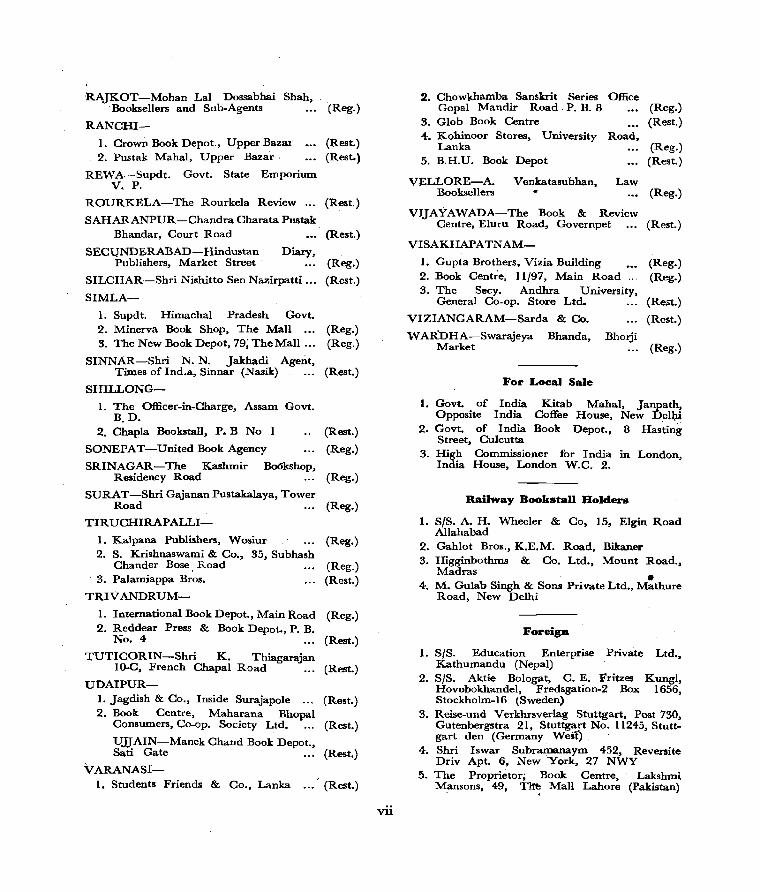
RAJKOT-Mohan Lal Dossabhai Shah, "Booksellers and Sub-Agents
RANCHI-
1. Crown Book Depot., Upper Bazar' 2. Pustak Mahal, Upper Bazar·
RE,\VA-Supdt. Govt. State Emporium V. P.
(Reg.)
(Rest.) (Rest.)
ROURKELA-The Rourkela Review ... (Rest.)
SAHARANPUR-Chandra Charata Pustak Bhandar, Court Road
SECUNDERABAD-Hindustan Diary, Publishers, Market Street
SILCHAR-Shri Nishitto Sen Nazirpatti ...
SIMLA-
1. Supdt. Himachal Pradesh Govt. 2. Minerva Book Shop, The Mall 3_ The New Book Depot, 79; The Mall ...
SINNAR-Shri N. N. Jakhadi Agent, Times of Ind.a, Sinnar (Nasik)
SHILLONG-
1. The "Officer-in-Charge, Assam Govt. B.D.
2. Chapla Bookstall, P. B No 1
SONEPAT-United Book Agency
SRI NAGAR-The Kashmir Bo6kshop, Residency Road
SURAT -Shri Gajanan Pustakalaya, Tower Road
TIRUCHIRAPALLI-
1. Kalpana Publishers, Wosiur 2. S. Krishnaswami & Co., 35, Subhash
Chander Bose. Road . 3. Palamiappa Bros.
TRIYANDRUM-
(Rest.)
(Reg.)
(Rest.)
(Reg.) (Reg.)
(Rest.)
(Rest.)
(Reg.)
(Reg.)
(Reg.)
(Reg.)
(Reg.) (Rest.)
1. International Book Depot., Main Road (Reg.) 2. Reddear Press & Book Depolo, P. B.
No. 4 (Rest.)
TUTICORIN-Shri K. Thiaga1"l\ian 100C, French Chapal Road (Rest.)
UDAIPUR-1. Jagdish & Co., Inside Surajapole (Rest.) 2. Book Centre, Maharana Bhopal
Consumers, Co-op. Society Ltd. (Rest.)
UJJAIN-Manek Chand Book Depot., Sati Gate ... (Rest.)
VARANASI-1. Students Friends & Co., Lanka ... ' (Rest.)
vii
2. Chowkhamba Sanskrit Series Office Gopal Mandir Road. P. B. 8
3. Glob Book Centre 4. Kohinoor Stores, University Road,
Lanka 5. B.H.U. Book Depot
VELLORE-A. Venkatasubhan, Law Booksellers
VIjAYAWADA-The Book & Review
(Reg.) (Rest.)
(Reg.) (Rest.)
(Reg.)
Centre, Eluru Road, Governpet (Rest.)
VISAKHAPATNAM-
1. Gupta Brothers, Vizia Building 2. Book Centre, 11/97, Main Road ... 3. The Secy. Andhra University,
General Co-op. Store Ltd.
VIZIANGARAM-Sarda & Co.
W ARDHA-Swarajeya Bhanda, BhOIji Market
For Local Sale
(Reg.) (Reg.)
(Rest.)
(Rest.)
(Reg.)
l. Govt. of India Kitab Mahal, Janpath, Opposite India Coffee House, New Del~
2. Govt. of India Book Depot., 8 Hasting Street, Culcutta
3. High Commissioner for India In London, India House, London W.C. 2.
Railway Bookstall Holders
I. SIS. A. H. Allahabad
Wheeler & Co, 15, Elgin Road
2. Gahlot Bros., K.E.M. Road, Bikaner 3. Higginbothms & Co. Ltd., Mount Road.,
Madras • 4. M. Gulab Singh & Sons Private Ltd., Mathure
Road, New Delhi
Foreign
1. SIS. Education Enterprise Private Ltd., Kathumandu (Nepal)
2. SIS. Aktie Bologat, C. E. Fritzes Kungl, Hovobokhandel, Fredsgation-2 Box 1656, Stockholm-16 (Sweden)
3. Reise-und Verkhrsverlag Stuttgart, Post 730, Gutenbergstra 21, Stutt~;t No. 11245, Stuttgart den (Germany West). .
4. Shri Iswar SubraIIlQnaym 452, Reversite Driv Apt. 6, New York, 27 NWY
5. The Proprietor; Book Centre, Lakshmi Mansons, 49, Tlftl Mall Lahore (Pakistan)
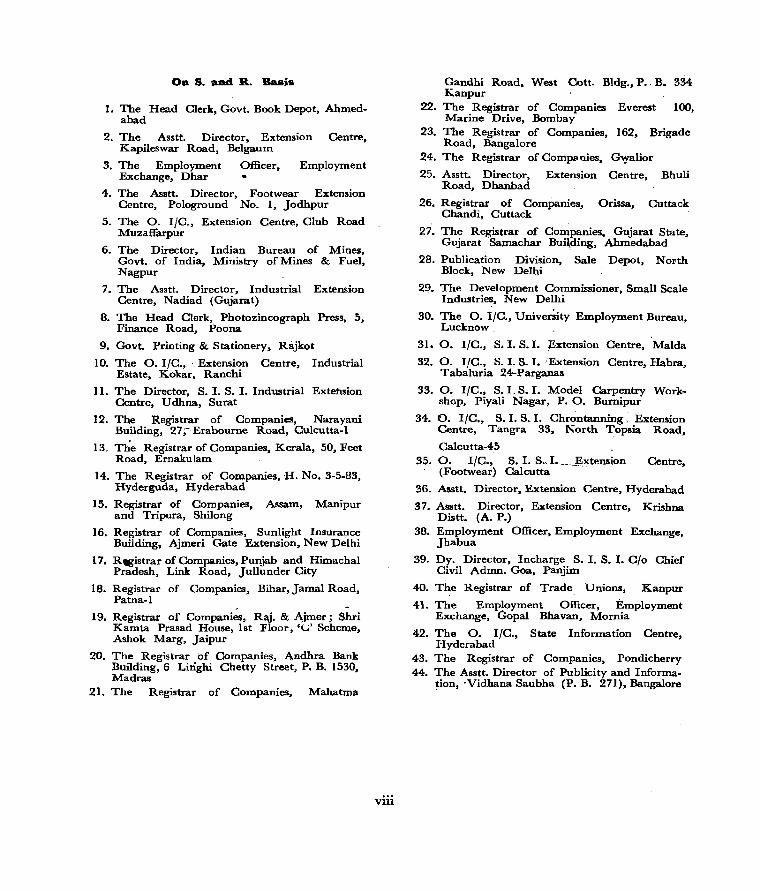
OD S. aDd R. Basis
I. The Head Clerk, Govt. Book Depot, Ahmedabad
2. The Asstt. Director, Extension Centre, Kapileswar Road, Belgaum
3. The Employment Officer, Employment Exchange, Dhar
4. The Asstt. Director, Footwear Extension Centre, Pologround No.1, Jodhpur
5. The O. I/C., Extension Centre, Club Road Muzaffarpur
6. The Director, Indian Bureau of Mines, Govt. of India, Ministry of Mines & Fuel, Nagpur
7. The Asstt. Director, Industrial Extension Centre, Nadiad (Gujarat)
B. The Head Clerk, Photozincograph Press, 5, Finance Road, Poona
9. Govt. Printing & Stationery, Rajkot
10. The O. I/C., _ Extension Centre, Industrial Estate, Kokar, Ranchi
11. The Director, S. I. S. I. Industrial Extehsion Centre, U dhna, Surat
12. The Registrar of Companies, Narayani Building, 27;--Erabourne Road, Culcutta-l
13. The Registrar of Companies, Kerala, 50, Feet Road, Ernakulam
14. The Registrar of Companies, H. No. 3-5-83. Hyderguda, Hyderabad
15. Registrar of Companies, Assam, Manipur and Tripura, Shilong
16. Registrar of Companies, Sunlight Insurance Building. Ajmeri Gate Extension. New Delhi
17. Registrar of Companies. Punjab and Himachal Pradesh, Link Road, Jullunder City
lB. Registrar of Companies, Bihar, Jamal Road, Patna-l
19. Registrar of Companies, Raj. & Ajmer; Shri Kamta Prasad House, lst Floor, '(_;' Scheme. Ashok Marg, Jaipur
20. The Registrar of Companies, Andhra Bank Building, 6 Lirighi Chetty Street, P. B. 1530. Madras
21. The Registrar of _ Companies, Mahatma
viii
Gandhi Road. West Cott. Bldg., P. -B. 334 Kanpur
22. The Registrar of Companies Everest 100, Marine Drive, Bombay
23. The Registrar of Companies, 162. Brigade Road, Bangalore
24. The Registrar of Comp~uies, G-"yalior
25. Asstt. Director, Extension Centre, Bhuli Road, Dhanbad
26. Registrar of ComPanies. Orissa. Cuttack Chandi, Cuttack
27. The Registrar of COIT.Ipanies, Gujarat State. Gujarat Samachar Bui~ding, Ahmedahad
28. Publication Division, Sale Depot, North Block, New Delhi
29. The Development Commissioner, Small Scale Industries. New Delhi
30. The O. ItC .• Unive~ity Employment Bureau, Lucknow _ .
31. O. ItC., S. I. S. I. Extension Centre. Maida
32. O. ItC.. S. I. S. I. :Extension Centre, Habra, Tabaluria 24-Parganas
33. O. ItC., S. I. S. I. Model Carpentry Workshop, Piyali Nagar, P. O. Burnipur
34. O. ItC., s. I. S. I. Chr~ntanning -.- Extension centre, Tangra 33. North Topsia Road.
Calcutta-4S 35.- O. ItC.. s. I. SO' I.._._._~xtension Centre,
(Footwear) Qalcutta
36. Asstt. Director, Extension Centre, Hyderabad
37. Asstt. Director, Extension Centre, Krishna Distt. (A. P.)
3B. Employment Officer, Employment Exchange, Jhabua
39. Dy. Director. Incharge S. I. S. I. Cto Chief Civil Admn. Goa, Panjim
40. The Registrar of Trade_ Unions, Kanpur
41. The Emp10yment Officer, Employment Exchange, Gopal Bhavan, Mornia
42. The O. ItC., State Information Centre, Hyderabad
43. The Registrar of Companies, Pondicherry 44. The Asstt. Director of Publicity and Informa
tion, 'Vidhana Saubha (P. B. 271). Bangalore
Copyright © 2022 FDOKUMEN