Gene pathways and subnetworks distinguish between major glioma subtypes and elucidate potential...
8
Gene pathways and subnetworks distinguish between major glioma subtypes and elucidate potential underlying biology Stefan Wuchty a , Alice Zhang a , Jennifer Walling a , Susie Ahn a , Aiguo Li a , Martha Quezado b , Carl Oberholtzer b , Jean-Claude Zenklusen a , Howard A. Fine a,⇑ a Neuro-Oncology Branch, National Cancer Institute, National Institutes of Neurological Disorder and Stroke, National Institutes of Health, Bethesda, MD 20894, USA b NCI Center for Biomedical Informatics and Information Technology, National Cancer Institute, National Institutes of Neurological Disorder and Stroke, National Institutes of Health, Bethesda, MD 20894, USA article info Article history: Received 12 January 2010 Available online 7 September 2010 Keywords: Classification Gliomas Subnetworks Pathways abstract Molecular diagnostic tools are increasingly being used in an attempt to classify primary human brain tumors more accurately. While methods that are based on the analysis of individual gene expression prove to be useful for diagnostic purposes, they are devoid of biological significance since tumorgenesis is a concerted deregulation of multiple pathways rather than single genes. In a proof of concept, we uti- lize two large clinical data sets and show that the elucidation of enriched pathways and small differen- tially expressed sub-networks of protein interactions allow a reliable classification of glioblastomas and oligodendrogliomas. Applying a feature selection method, we observe that an optimized subset of path- ways and subnetworks significantly improves the prediction accuracy. By determining the enrichment of altered genes in pathways and subnetworks we show that optimized subsets of genes rarely seem to be a target of genomic alteration. Our results suggest that groups of genes play a decisive role for the pheno- type of the underlying tumor samples that can be utilized to reliably distinguish tumor types. In the absence of enrichment of genes that are genomically altered we assume that genetic changes largely exert an indirect rather than direct regulatory influence on a number of tumor-defining regulatory networks. Published by Elsevier Inc. 1. Introduction Gliomas represent a heterogeneous family of primary brain tu- mors and are a significant cause of cancer mortality in the United States [1]. While the glioma cell of origin is currently unknown, it has been proposed that it may be different from one tumor to an- other, ranging from a dedifferentiated astrocyte or oligodendrocyte to a fully undifferentiated neural stem cell. The potential different cells of origin compounded by the genetic and epigenetic heteroge- neity within gliomas undoubtedly contribute to the heterogeneous biologic behavior and variable clinical course seen in patients with these tumors. As a consequence of this glioma heterogeneity, the standard glioma classification systems which are based on histopa- thological criteria suffer from significant intra-observer variability and are poor predictors of treatment response and patient progno- sis. Furthermore, traditional classification schemas give little in- sight into the biological basis of the underlying neoplastic process, a particular disadvantage given the advent of molecularly targeted anti-tumor therapeutic agents. Without an understanding of the underlying biology that drives the neoplastic phenotype within a given tumor, devising appropriate clinical trials as well as treating patients will be impossible. Thus, there is a significant need for tumor classification systems that reflect and elucidate tu- mor biology. With the availability of high-throughput microarray technology [2,3] gene expression profiles of genes in tumors provide a glimpse into the inner workings of a cell, suggesting the opportunity for a quantitative characterization of individual tumor biology and tu- mor classification [3–7]. Recently, several groups have identified certain gene-based features that are associated with a particular glioma type. Although important steps forward, the findings of these studies have been limited by the use of expression values that were derived from single gene analysis. Even when classifica- tions are constructed in such a fashion, the derived classifiers are often devoid of biological significance. In fact, the genes of interest are selected through extreme expression patterns and tend to be derivatives of distant primary events, not fully evident in the anno- tation of the selected biomarkers. Moreover, most complex biolog- ical processes, such as tumorigenesis, are a product of concerted deregulation of complex pathways rather than of any single gene. Thus, disease classifications that are based on the analysis of the 1532-0464/$ - see front matter Published by Elsevier Inc. doi:10.1016/j.jbi.2010.08.011 ⇑ Corresponding author at: Neuro-Oncology Branch, National Cancer Institute, National Institutes of Health, 9030 Old Georgetown Rd., Bethesda, MD 20892, USA. Fax: +1 301 480 2246. E-mail address: hfi[email protected] (H.A. Fine). Journal of Biomedical Informatics 43 (2010) 945–952 Contents lists available at ScienceDirect Journal of Biomedical Informatics journal homepage: www.elsevier.com/locate/yjbin
Transcript of Gene pathways and subnetworks distinguish between major glioma subtypes and elucidate potential...
Journal of Biomedical Informatics 43 (2010) 945–952
Contents lists available at ScienceDirect
Journal of Biomedical Informatics
journal homepage: www.elsevier .com/locate /y jb in
Gene pathways and subnetworks distinguish between major glioma subtypesand elucidate potential underlying biology
Stefan Wuchty a, Alice Zhang a, Jennifer Walling a, Susie Ahn a, Aiguo Li a, Martha Quezado b,Carl Oberholtzer b, Jean-Claude Zenklusen a, Howard A. Fine a,⇑a Neuro-Oncology Branch, National Cancer Institute, National Institutes of Neurological Disorder and Stroke, National Institutes of Health, Bethesda, MD 20894, USAb NCI Center for Biomedical Informatics and Information Technology, National Cancer Institute, National Institutes of Neurological Disorder and Stroke,National Institutes of Health, Bethesda, MD 20894, USA
a r t i c l e i n f o a b s t r a c t
Article history:Received 12 January 2010Available online 7 September 2010
Keywords:ClassificationGliomasSubnetworksPathways
1532-0464/$ - see front matter Published by Elsevierdoi:10.1016/j.jbi.2010.08.011
⇑ Corresponding author at: Neuro-Oncology BrancNational Institutes of Health, 9030 Old Georgetown RFax: +1 301 480 2246.
E-mail address: [email protected] (H.A. Fine).
Molecular diagnostic tools are increasingly being used in an attempt to classify primary human braintumors more accurately. While methods that are based on the analysis of individual gene expressionprove to be useful for diagnostic purposes, they are devoid of biological significance since tumorgenesisis a concerted deregulation of multiple pathways rather than single genes. In a proof of concept, we uti-lize two large clinical data sets and show that the elucidation of enriched pathways and small differen-tially expressed sub-networks of protein interactions allow a reliable classification of glioblastomas andoligodendrogliomas. Applying a feature selection method, we observe that an optimized subset of path-ways and subnetworks significantly improves the prediction accuracy. By determining the enrichment ofaltered genes in pathways and subnetworks we show that optimized subsets of genes rarely seem to be atarget of genomic alteration. Our results suggest that groups of genes play a decisive role for the pheno-type of the underlying tumor samples that can be utilized to reliably distinguish tumor types. In theabsence of enrichment of genes that are genomically altered we assume that genetic changes largelyexert an indirect rather than direct regulatory influence on a number of tumor-defining regulatorynetworks.
Published by Elsevier Inc.
1. Introduction
Gliomas represent a heterogeneous family of primary brain tu-mors and are a significant cause of cancer mortality in the UnitedStates [1]. While the glioma cell of origin is currently unknown,it has been proposed that it may be different from one tumor to an-other, ranging from a dedifferentiated astrocyte or oligodendrocyteto a fully undifferentiated neural stem cell. The potential differentcells of origin compounded by the genetic and epigenetic heteroge-neity within gliomas undoubtedly contribute to the heterogeneousbiologic behavior and variable clinical course seen in patients withthese tumors. As a consequence of this glioma heterogeneity, thestandard glioma classification systems which are based on histopa-thological criteria suffer from significant intra-observer variabilityand are poor predictors of treatment response and patient progno-sis. Furthermore, traditional classification schemas give little in-sight into the biological basis of the underlying neoplasticprocess, a particular disadvantage given the advent of molecularly
Inc.
h, National Cancer Institute,d., Bethesda, MD 20892, USA.
targeted anti-tumor therapeutic agents. Without an understandingof the underlying biology that drives the neoplastic phenotypewithin a given tumor, devising appropriate clinical trials as wellas treating patients will be impossible. Thus, there is a significantneed for tumor classification systems that reflect and elucidate tu-mor biology.
With the availability of high-throughput microarray technology[2,3] gene expression profiles of genes in tumors provide a glimpseinto the inner workings of a cell, suggesting the opportunity for aquantitative characterization of individual tumor biology and tu-mor classification [3–7]. Recently, several groups have identifiedcertain gene-based features that are associated with a particularglioma type. Although important steps forward, the findings ofthese studies have been limited by the use of expression valuesthat were derived from single gene analysis. Even when classifica-tions are constructed in such a fashion, the derived classifiers areoften devoid of biological significance. In fact, the genes of interestare selected through extreme expression patterns and tend to bederivatives of distant primary events, not fully evident in the anno-tation of the selected biomarkers. Moreover, most complex biolog-ical processes, such as tumorigenesis, are a product of concertedderegulation of complex pathways rather than of any single gene.Thus, disease classifications that are based on the analysis of the
946 S. Wuchty et al. / Journal of Biomedical Informatics 43 (2010) 945–952
aggregated effects of expression regulation along functional unitsor functional protein pathways will theoretically be more informa-tive and useful. Such a classification schema should allow a betterunderstanding of the biological differences between the differentsubgroups of tumors by the functional nature of the discoveredclassifiers. As proof of principle, we have utilized the expressionprofiles of glioblastomas and oligodendrogliomas and have identi-fied protein pathways that are enriched or depleted in these differ-ent, yet common glioma subtypes. We also utilized a large networkof pairwise human protein–protein interactions, protein–DNAinteractions and phosphorylation events in order to identify differ-entially expressed subnetworks that allow the largest possible dis-crimination between the underlying tumor types. Both approacheshold promise that functionally related gene sets may act as reliableclassifiers as well as suggest functional networks that may be un-iquely operative in these different types of gliomas.
2. Methods
2.1. Patient selection, tissue acquisition and sample description
All tumor specimens used in this study were obtained from pa-tients undergoing medically indicated surgical resection of a pre-sumed or known glioma. Following written consent inaccordance with the National Cancer Institute and the collaborat-ing center’s Institutional Review Boards surgical procedures wereperformed at a number of institutions and hospitals around thecountry. Specifically, we utilized 134 patient samples collectedfrom a retrospective database at Henry-Ford hospital (HF) and136 samples from the prospective NCI-sponsored Glioma Molecu-lar Diagnostic Initiative (GMDI) which were provided as snapfrozen sections and profiled using HG-U133 Plus 2.0 arrays. Inthe HF data set, 77 are Glioblastoma Multiforms (GBM) and 57Oligodendrogliomas (Oligo), while the GMDI data set consists of81 GBMs and 55 Oligos. Pathological diagnosis was determinedby the home instructional neuropathologist and reviewed by twoneuropathologist at the NIH who were blinded to the original diag-nosis from the home institution. Only tumors that met the criteriaof having a consensus pathological diagnosis from the NIH neuro-pathologists were utilized for our analyses.
2.2. RNA extraction and array hybridization
We used approximately 50–80 mg of tissue from each tumor todetermine RNA with the Trizol reagent (Invitrogen, Carlsbad, CA)and verify the RNA’s quality with the Bioanalyzer System [8] (Agi-lent Technologies, Palo Alto, CA) using the RNA Pico Chips. UtilizingT7-linked Oligo (dT) primer, we converted 6 lg of total RNA tocDNA with Superscript reverse transcriptase (Invitrogen) andin vitro transcribe complementary DNA with the T7 Bioarray HighYield RNA Transcript Labeling Kit (ENZO Diagnostics) to generatebiotinylated cRNA. We fragmented and hybridized 20 lg of puri-fied cRNA to the Genechip� Human Genome U133 Plus 2.0 Expres-sion arrays [9] (Affymetrix, Inc., Santa Clara, CA) and processed thearrays following the manufacturer’s recommendations using thefluidics station 450 and high-resolution microarray scanner 3000.Finally, we generated initial gene expression analysis data filesusing Affymetrix GeneChip Operating Software (GCOS) version 1.3.
2.3. Microarray data preprocessing
Utilizing parameters in .rpt files generated by GCOS, weconfirmed that all arrays complied with minimal quality controlstandards. Specifically, we tested if a scaling factor is <5 whenthe expression values are scaled to a target mean signal intensity
of 500. Similarly, we controlled for a signal intensity ratios of the30 to 50 end of the internal control genes of b-actin and GAPDHbeing <3. Finally, we required that Affymetrix spike control (BioC,BioDN and CreX) were always present with present call rates of>35% for brain tissue. Arrays that passed the minimal quality con-trol were normalized using dChip [10] at the PM and MM probe le-vel. Using the average difference model to compute expressionvalues, we calculated the model-based expression levels with nor-malized probe level data. Log-transforming expression values, neg-ative average differences which were deemed biologicallyirrelevant (MM > PM) were set to 0. Gene expression data setsare available through the Rembrandt database (http://rem-brandt.nci.nih.gov/).
2.4. Data treatment
We demanded that the normal specimen section came formnon-tumor bearing patients and had no signs of tumor cells onmicroscopic examination. Furthermore, the behavior of the globalgene expression profiles must resemble the normal tissue inexploratory data analysis of microarrays using principle compo-nent analysis (PCA) and hierarchical clustering (HC). Accountingfor weak signal intensities, we removed all probesets with morethan 10% of zero log-transformed expression values. Representingeach gene, we chose the corresponding probeset with the highestmean intensity in GBMs and Oligodendrogliomas, separately.
2.5. Genomic alterations
We collected 1979 genes with experimental evidence of at leastone genomic alteration. In particular, we utilized a large-scalegenomic study of 178 gliomas, allowing the identification of geno-mic regions affected by copy number alterations (amplifications,homozygous and heterozygous deletions) and allelic imbalances(loss of heterozygosity and gene conversions) [11]. As indicated,mRNA expression and genomic alterations showed strong correla-tions in many cases, suggesting that a gene’s expression is evi-dently affected by a genomic change. Such candidate genes havebeen verified using real-time PCR and methylation sequencing as-says [12]. As a reliable sequence resource, we utilized the results ofa recent re-sequencing effort to identify types of somatic muta-tions in protein kinase genes in gliomas [13].
2.6. Protein interactions and pathways
We utilized interaction data from large-scale high-throughputscreens [14–16] and several curated interaction databases [17–20], totaling 93,178 interactions among 11,691 genes. As a reliablesource of experimentally confirmed protein–DNA interactions, weused 6669 interactions between 2822 transcription factors andstructural genes from the TRED database [21]. As for phosphoryla-tion events between kinases and other proteins we found 5462interactions between 1707 human proteins utilizing networKIN[22,23] and phosphoELM database [24]. Pooling all these interac-tions we obtained a total network of 11,969 human proteins thatare embedded in 103,966 links.
As a comprehensive collection of human gene pathways we uti-lized pathway information from the NCI/NIH/Nature PathwayInteraction Database [25]. Combining data from various sourcesPID provided information about 1004 different human pathways.
2.7. Detection of significant subnetworks
Utilizing a large network, composed of protein–protein, pro-tein–DNA interactions and phosphorylation events, we applied agreedy algorithm to identify subnetworks that were differentially
S. Wuchty et al. / Journal of Biomedical Informatics 43 (2010) 945–952 947
expressed in two classes of gene expression profiles [26] as imple-mented in the PinnacleZ-plugin of the cytoscape package [27]. Spe-cifically, gene expression profiles of samples of two different types(i.e. Glioblastoma Multiforms and Oligodendrogliomas) weretransformed into a subnetwork activity matrix. For a given subnet-work Mk, its activity score in sample j, Akj was defined asAkj ¼
PiZij=
ffiffiffinp
. While n is the number of genes in Mk, Zij is the Z-transformed expression score of gene i in sample j that has beennormalized over all samples. A greedy search algorithm identifieddifferentially expressed subnetworks if their t-test score maxi-mizes the association between the subnetworks activity scoreand the two sample classes. Significant subnetworks (P < 0.05)were picked according to null distributions obtained by randomiz-ing the topology of the underlying interaction network.
2.8. Gene set enrichment analysis (GSEA)
Utilizing gene sets from the PID database, GSEA [28] allowed us todetermine the degree to which genes in a pathway or gene set werelargely found at the extreme ends of a ranked list of gene expression,comparing two different tumor samples. Ranking genes according totheir t-test scores an enrichment score (ES) was calculated by walk-ing down this ranked list where a running-sum statistic is increasedwhen we found a gene in the underlying gene set and vice versa. Theenrichment score is defined as the maximum deviation from zero,corresponding to a Kolmogorov–Smirnov-like statistic. The statisti-cal significance of the enrichment score was assessed by a genotype-based permutation test, and we considered a pathway or gene set assignificantly enriched if the nominal P < 0.05.
2.9. Support-vector machine algorithm (SVM)
SVMs are machine-learning approaches that are widely used fordata classification. Each SVM was trained with a set of instance la-bel pairs (Xi, ci), i = 1,. . .,l where vector X holds activity coefficientsAkj of enriched pathways or differentially expressed subnetworks kin a given sample j that either was assigned to Glioblastoma Mul-tiforms (ci = 1) or Oligodendrogliomas (ci = �1). In our case, train-ing vectors Xi were mapped into a higher dimensional space by aradial kernel function, k(Xi, Xj) = exp(�g|Xi � Xj|2), where g = 1.The SVM algorithm finds a separating hyperplane with the maxi-mal margin in this higher dimensional space, where we set thepenalty parameter of the error term C = 1. As a fast implementationof SVMs, we used the libsvm 2.8 package [29].
2.10. Significance of links between pathways
Determining the significance of links between pathways if theyshare proteins that have evidence of genomic alterations, weformed a 2 � 2 contingency table for each pair of pathways. In par-ticular, we defined a as the number of shared, altered proteins,while b was the number of remaining proteins in a pair of overlap-ping pathways. Analogously, we defined c as the number of alteredproteins, and d as the number of remaining proteins in all otherpathways. The probability of obtaining any such set of values ran-domly is given by the hypergeometric distribution
p� ¼aþ b
a
� � cþ d
c
� ��N
aþ c
� �
where N = a + b + c + d. In order to investigate the two tails of theunderlying distribution we constructed all possible contingency ta-bles by keeping the sum of rows and columns constant. The P-valueto reject the null hypothesis which is the independence of rows andcolumns in the contingency table was defined as the sum of theprobabilities pi, of all contingency tables, P ¼
Ppi�p�pi [30].
2.11. Feature selection
For each of N tumor samples that are represented by a vector ofsubnetwork or pathway scores X, the I-Relief algorithm [31,32] de-fines sets of nearest hits Hn (samples of the same tumor type) andnearest misses Mn (samples of the other type). The objective func-tion of the algorithm is to scale each feature such that the averagemargin in a weighted feature space is maximized. Briefly, theI-Relief algorithm estimates probability distributions of the unob-served data as exponential functions f(d) = e�d/s where we sets = 2. Iteratively, I-Relief adopts a quasi Expectation–Maximizationstrategy to assess the weights of the underlying features until con-vergence is reached. For details of the theoretical and technicalaspects of I-Relief please see [31]. As a reliable implementation ofI-Relief we used the mlpy package (http://mlpy.fbk.eu).
In order to determine an optimal subset of features that allowsthe best possible discrimination between classes, we ranked allfeatures according to their weights. Running through this rankedlist, we added a feature to a list of best features and determinedtheir prediction performance. We defined the subset of rankedfeatures with the highest prediction accuracy as our optimizedfeatures list.
3. Results
3.1. Classification with enriched pathways and differentially expressedsubnetworks
In order to provide proof of principle that a gene set or network-based tumor classification is feasible, we chose to compare two gli-oma subtypes, Glioblastoma Multiforms (GBM) and Oligodendro-gliomas, that are deemed biologically different based on bothstandard pathologic criteria and clinical course. Utilizing geneexpression data from 134 patient samples from Henry-Ford hospi-tal (HF) and 136 samples from the Glioma Molecular DiagnosticInitiative (GMDI) we were interested in finding groups of genesthat allow a reliable discrimination between the underlying tumortypes. Although traditional gene expression-based classificationapproaches have evaluated individual genes, one could potentiallyuse groups of genes to identify pathways that are over- or under-expressed in one tumor type compared to the other (Fig. 1a). Uti-lizing 1004 fully annotated pathways from the PathwayInteraction Database (PID), we applied Gene Set Enrichment Anal-ysis (GSEA) [28] to determine pathway enrichment in GBMs com-pared to Oligodendrogliomas and identified 196 pathways in theHF data set and 122 in the GMDI data set (P < 0.05, SupplementaryTables 1 and 2). Specifically, we found 100 pathways that were en-riched in both tumor types. Although GSEA alone is a powerful toolto identify pathways of genes that potentially play a role in differ-ent tumor types, we were also interested in alternative methods.For the identification of differentially expressed gene sets withoutresorting to any precompiled pathway or gene set information weassembled a network of experimentally obtained pairwise molecu-lar phosphorylation events, protein–protein and protein–DNAinteractions. Applying PinnacleZ [26], a Cytoscape plugin [27], toa network of 103,966 interactions between 11,969 human proteinswe found 89 differentially expressed subnetworks in the HF dataand 32 in the GMDI data (P < 0.05, Supplementary Tables 3 and4) (Fig. 1b). To test the validity of our hypothesis that both en-riched pathways and differentially expressed subnetworks canreliably distinguish between different tumor types, we applied aSupport-Vector Machine approach [29], utilizing gene sets as clas-sifiers. Specifically, we transformed our gene expression profiles ofGBMs and oligodendrogliomas into a matrix of Z-scores [26]. Foreach set of genes Mk we calculated an activity score in sample j,
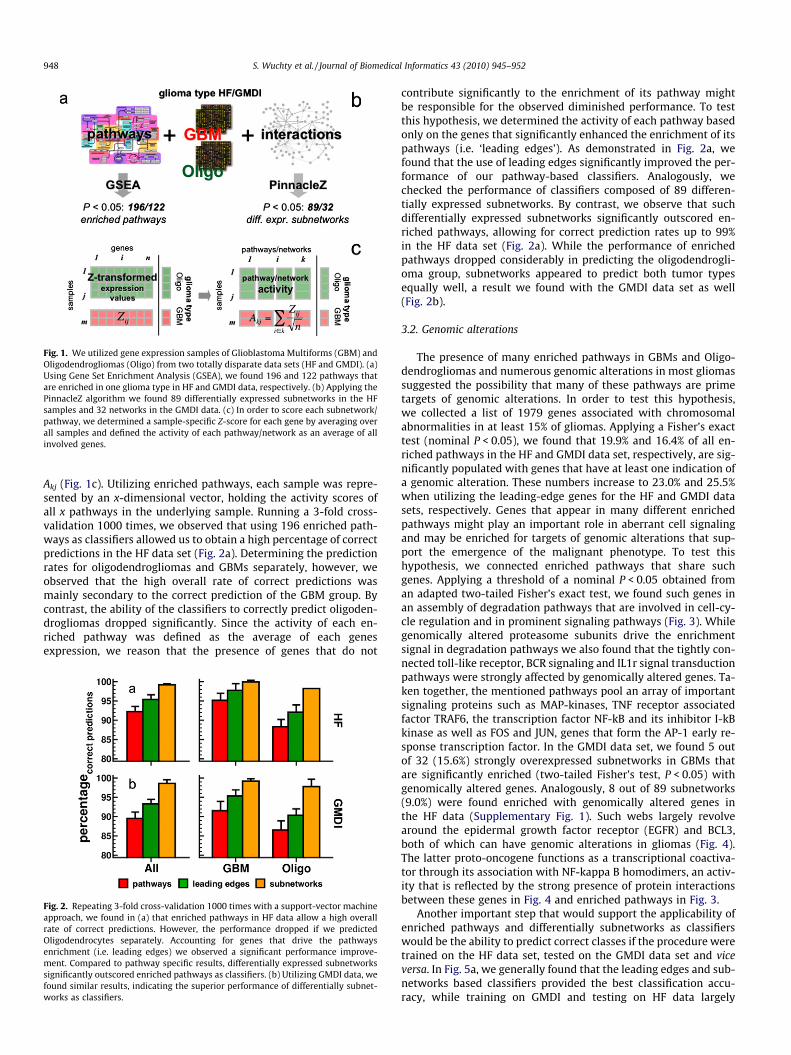
Fig. 1. We utilized gene expression samples of Glioblastoma Multiforms (GBM) andOligodendrogliomas (Oligo) from two totally disparate data sets (HF and GMDI). (a)Using Gene Set Enrichment Analysis (GSEA), we found 196 and 122 pathways thatare enriched in one glioma type in HF and GMDI data, respectively. (b) Applying thePinnacleZ algorithm we found 89 differentially expressed subnetworks in the HFsamples and 32 networks in the GMDI data. (c) In order to score each subnetwork/pathway, we determined a sample-specific Z-score for each gene by averaging overall samples and defined the activity of each pathway/network as an average of allinvolved genes.
948 S. Wuchty et al. / Journal of Biomedical Informatics 43 (2010) 945–952
Akj (Fig. 1c). Utilizing enriched pathways, each sample was repre-sented by an x-dimensional vector, holding the activity scores ofall x pathways in the underlying sample. Running a 3-fold cross-validation 1000 times, we observed that using 196 enriched path-ways as classifiers allowed us to obtain a high percentage of correctpredictions in the HF data set (Fig. 2a). Determining the predictionrates for oligodendrogliomas and GBMs separately, however, weobserved that the high overall rate of correct predictions wasmainly secondary to the correct prediction of the GBM group. Bycontrast, the ability of the classifiers to correctly predict oligoden-drogliomas dropped significantly. Since the activity of each en-riched pathway was defined as the average of each genesexpression, we reason that the presence of genes that do not
Fig. 2. Repeating 3-fold cross-validation 1000 times with a support-vector machineapproach, we found in (a) that enriched pathways in HF data allow a high overallrate of correct predictions. However, the performance dropped if we predictedOligodendrocytes separately. Accounting for genes that drive the pathwaysenrichment (i.e. leading edges) we observed a significant performance improve-ment. Compared to pathway specific results, differentially expressed subnetworkssignificantly outscored enriched pathways as classifiers. (b) Utilizing GMDI data, wefound similar results, indicating the superior performance of differentially subnet-works as classifiers.
contribute significantly to the enrichment of its pathway mightbe responsible for the observed diminished performance. To testthis hypothesis, we determined the activity of each pathway basedonly on the genes that significantly enhanced the enrichment of itspathways (i.e. ‘leading edges’). As demonstrated in Fig. 2a, wefound that the use of leading edges significantly improved the per-formance of our pathway-based classifiers. Analogously, wechecked the performance of classifiers composed of 89 differen-tially expressed subnetworks. By contrast, we observe that suchdifferentially expressed subnetworks significantly outscored en-riched pathways, allowing for correct prediction rates up to 99%in the HF data set (Fig. 2a). While the performance of enrichedpathways dropped considerably in predicting the oligodendrogli-oma group, subnetworks appeared to predict both tumor typesequally well, a result we found with the GMDI data set as well(Fig. 2b).
3.2. Genomic alterations
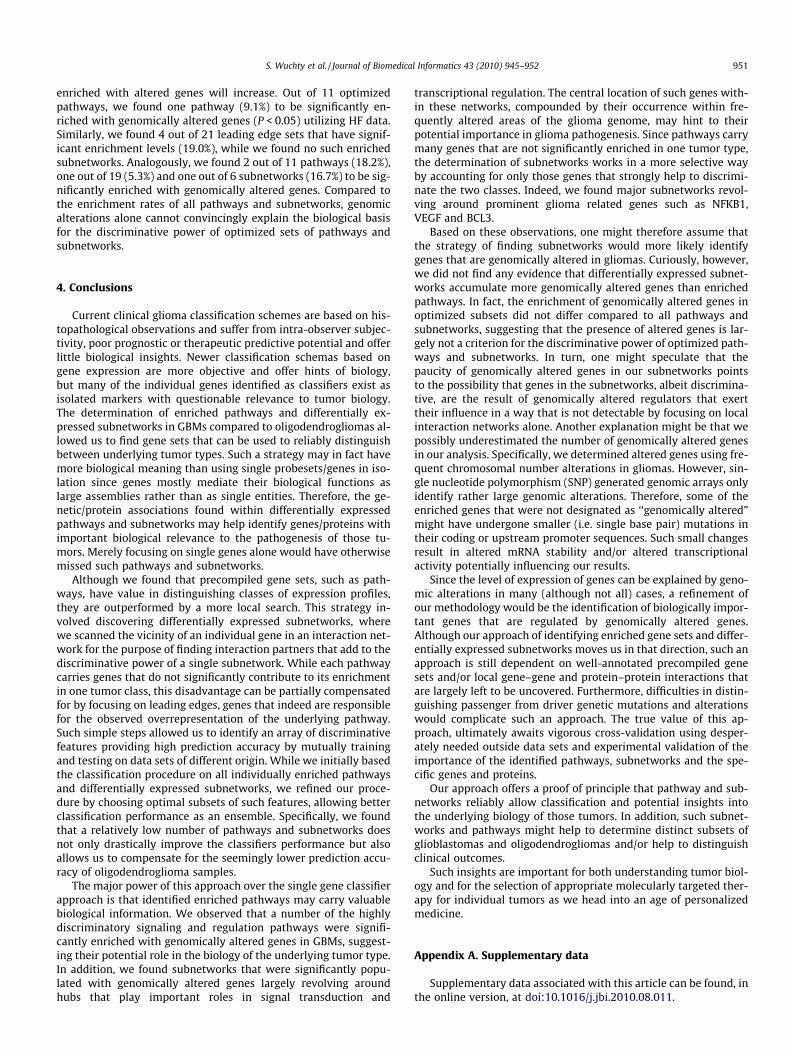
The presence of many enriched pathways in GBMs and Oligo-dendrogliomas and numerous genomic alterations in most gliomassuggested the possibility that many of these pathways are primetargets of genomic alterations. In order to test this hypothesis,we collected a list of 1979 genes associated with chromosomalabnormalities in at least 15% of gliomas. Applying a Fisher’s exacttest (nominal P < 0.05), we found that 19.9% and 16.4% of all en-riched pathways in the HF and GMDI data set, respectively, are sig-nificantly populated with genes that have at least one indication ofa genomic alteration. These numbers increase to 23.0% and 25.5%when utilizing the leading-edge genes for the HF and GMDI datasets, respectively. Genes that appear in many different enrichedpathways might play an important role in aberrant cell signalingand may be enriched for targets of genomic alterations that sup-port the emergence of the malignant phenotype. To test thishypothesis, we connected enriched pathways that share suchgenes. Applying a threshold of a nominal P < 0.05 obtained froman adapted two-tailed Fisher’s exact test, we found such genes inan assembly of degradation pathways that are involved in cell-cy-cle regulation and in prominent signaling pathways (Fig. 3). Whilegenomically altered proteasome subunits drive the enrichmentsignal in degradation pathways we also found that the tightly con-nected toll-like receptor, BCR signaling and IL1r signal transductionpathways were strongly affected by genomically altered genes. Ta-ken together, the mentioned pathways pool an array of importantsignaling proteins such as MAP-kinases, TNF receptor associatedfactor TRAF6, the transcription factor NF-kB and its inhibitor I-kBkinase as well as FOS and JUN, genes that form the AP-1 early re-sponse transcription factor. In the GMDI data set, we found 5 outof 32 (15.6%) strongly overexpressed subnetworks in GBMs thatare significantly enriched (two-tailed Fisher’s test, P < 0.05) withgenomically altered genes. Analogously, 8 out of 89 subnetworks(9.0%) were found enriched with genomically altered genes inthe HF data (Supplementary Fig. 1). Such webs largely revolvearound the epidermal growth factor receptor (EGFR) and BCL3,both of which can have genomic alterations in gliomas (Fig. 4).The latter proto-oncogene functions as a transcriptional coactiva-tor through its association with NF-kappa B homodimers, an activ-ity that is reflected by the strong presence of protein interactionsbetween these genes in Fig. 4 and enriched pathways in Fig. 3.
Another important step that would support the applicability ofenriched pathways and differentially subnetworks as classifierswould be the ability to predict correct classes if the procedure weretrained on the HF data set, tested on the GMDI data set and viceversa. In Fig. 5a, we generally found that the leading edges and sub-networks based classifiers provided the best classification accu-racy, while training on GMDI and testing on HF data largely
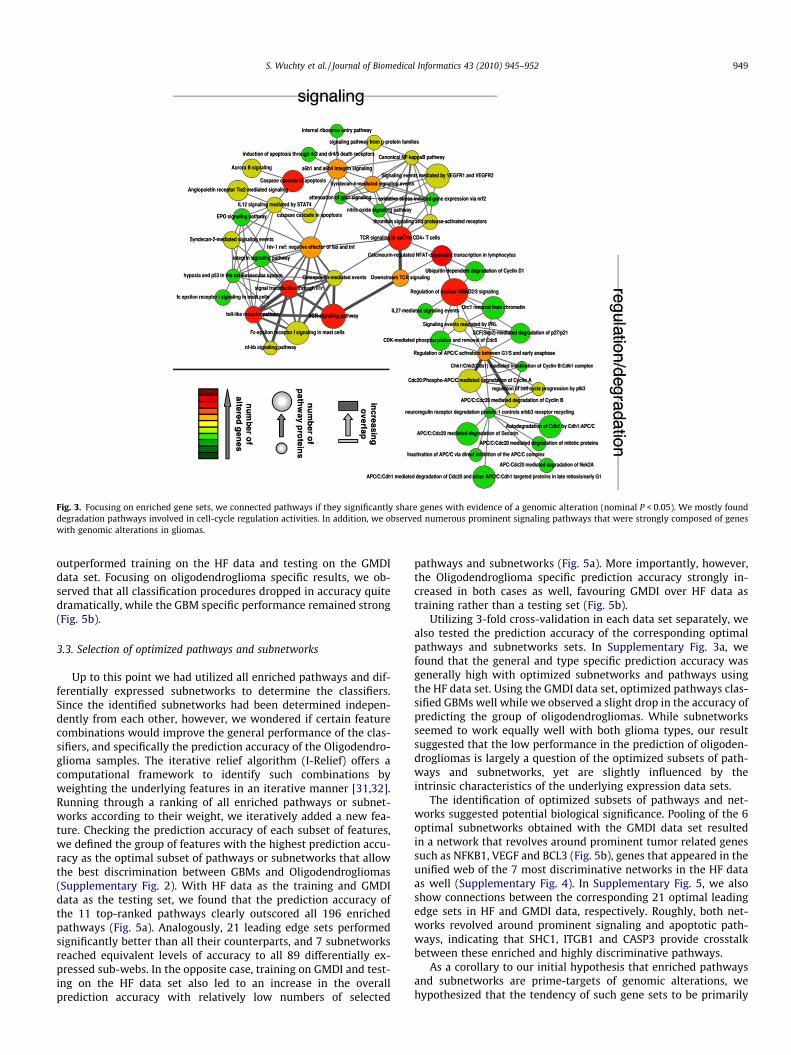
Fig. 3. Focusing on enriched gene sets, we connected pathways if they significantly share genes with evidence of a genomic alteration (nominal P < 0.05). We mostly founddegradation pathways involved in cell-cycle regulation activities. In addition, we observed numerous prominent signaling pathways that were strongly composed of geneswith genomic alterations in gliomas.
S. Wuchty et al. / Journal of Biomedical Informatics 43 (2010) 945–952 949
outperformed training on the HF data and testing on the GMDIdata set. Focusing on oligodendroglioma specific results, we ob-served that all classification procedures dropped in accuracy quitedramatically, while the GBM specific performance remained strong(Fig. 5b).
3.3. Selection of optimized pathways and subnetworks
Up to this point we had utilized all enriched pathways and dif-ferentially expressed subnetworks to determine the classifiers.Since the identified subnetworks had been determined indepen-dently from each other, however, we wondered if certain featurecombinations would improve the general performance of the clas-sifiers, and specifically the prediction accuracy of the Oligodendro-glioma samples. The iterative relief algorithm (I-Relief) offers acomputational framework to identify such combinations byweighting the underlying features in an iterative manner [31,32].Running through a ranking of all enriched pathways or subnet-works according to their weight, we iteratively added a new fea-ture. Checking the prediction accuracy of each subset of features,we defined the group of features with the highest prediction accu-racy as the optimal subset of pathways or subnetworks that allowthe best discrimination between GBMs and Oligodendrogliomas(Supplementary Fig. 2). With HF data as the training and GMDIdata as the testing set, we found that the prediction accuracy ofthe 11 top-ranked pathways clearly outscored all 196 enrichedpathways (Fig. 5a). Analogously, 21 leading edge sets performedsignificantly better than all their counterparts, and 7 subnetworksreached equivalent levels of accuracy to all 89 differentially ex-pressed sub-webs. In the opposite case, training on GMDI and test-ing on the HF data set also led to an increase in the overallprediction accuracy with relatively low numbers of selected
pathways and subnetworks (Fig. 5a). More importantly, however,the Oligodendroglioma specific prediction accuracy strongly in-creased in both cases as well, favouring GMDI over HF data astraining rather than a testing set (Fig. 5b).
Utilizing 3-fold cross-validation in each data set separately, wealso tested the prediction accuracy of the corresponding optimalpathways and subnetworks sets. In Supplementary Fig. 3a, wefound that the general and type specific prediction accuracy wasgenerally high with optimized subnetworks and pathways usingthe HF data set. Using the GMDI data set, optimized pathways clas-sified GBMs well while we observed a slight drop in the accuracy ofpredicting the group of oligodendrogliomas. While subnetworksseemed to work equally well with both glioma types, our resultsuggested that the low performance in the prediction of oligoden-drogliomas is largely a question of the optimized subsets of path-ways and subnetworks, yet are slightly influenced by theintrinsic characteristics of the underlying expression data sets.
The identification of optimized subsets of pathways and net-works suggested potential biological significance. Pooling of the 6optimal subnetworks obtained with the GMDI data set resultedin a network that revolves around prominent tumor related genessuch as NFKB1, VEGF and BCL3 (Fig. 5b), genes that appeared in theunified web of the 7 most discriminative networks in the HF dataas well (Supplementary Fig. 4). In Supplementary Fig. 5, we alsoshow connections between the corresponding 21 optimal leadingedge sets in HF and GMDI data, respectively. Roughly, both net-works revolved around prominent signaling and apoptotic path-ways, indicating that SHC1, ITGB1 and CASP3 provide crosstalkbetween these enriched and highly discriminative pathways.
As a corollary to our initial hypothesis that enriched pathwaysand subnetworks are prime-targets of genomic alterations, wehypothesized that the tendency of such gene sets to be primarily
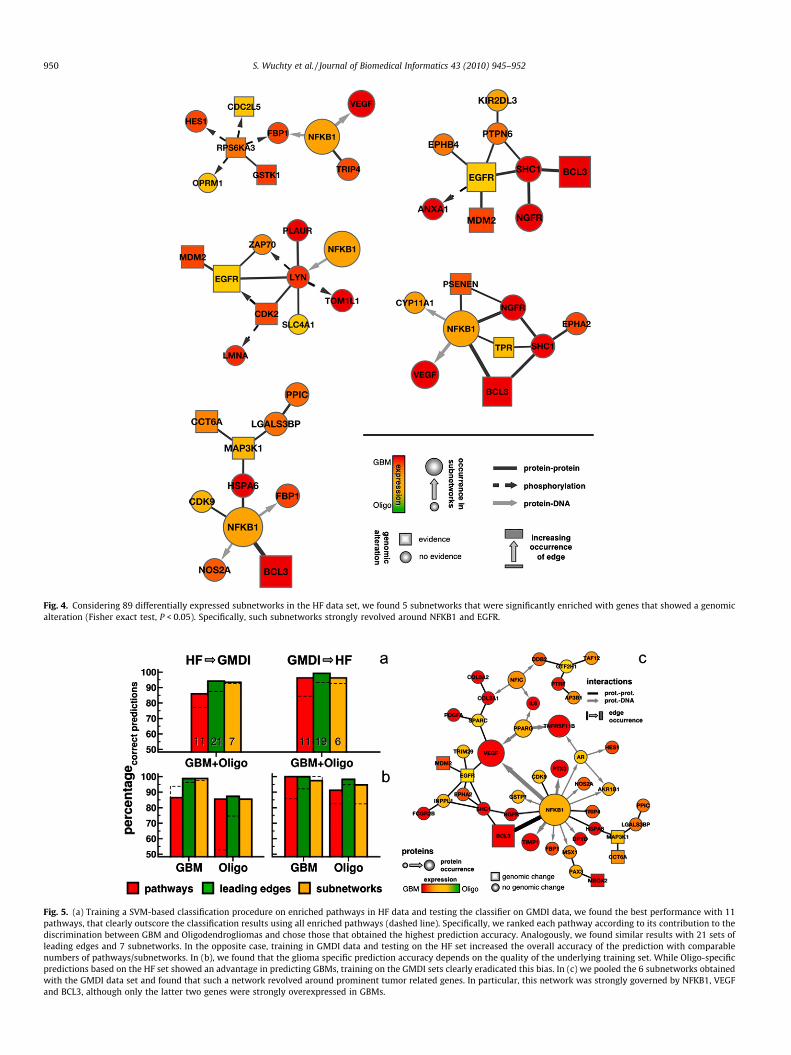
Fig. 4. Considering 89 differentially expressed subnetworks in the HF data set, we found 5 subnetworks that were significantly enriched with genes that showed a genomicalteration (Fisher exact test, P < 0.05). Specifically, such subnetworks strongly revolved around NFKB1 and EGFR.
Fig. 5. (a) Training a SVM-based classification procedure on enriched pathways in HF data and testing the classifier on GMDI data, we found the best performance with 11pathways, that clearly outscore the classification results using all enriched pathways (dashed line). Specifically, we ranked each pathway according to its contribution to thediscrimination between GBM and Oligodendrogliomas and chose those that obtained the highest prediction accuracy. Analogously, we found similar results with 21 sets ofleading edges and 7 subnetworks. In the opposite case, training in GMDI data and testing on the HF set increased the overall accuracy of the prediction with comparablenumbers of pathways/subnetworks. In (b), we found that the glioma specific prediction accuracy depends on the quality of the underlying training set. While Oligo-specificpredictions based on the HF set showed an advantage in predicting GBMs, training on the GMDI sets clearly eradicated this bias. In (c) we pooled the 6 subnetworks obtainedwith the GMDI data set and found that such a network revolved around prominent tumor related genes. In particular, this network was strongly governed by NFKB1, VEGFand BCL3, although only the latter two genes were strongly overexpressed in GBMs.
950 S. Wuchty et al. / Journal of Biomedical Informatics 43 (2010) 945–952
S. Wuchty et al. / Journal of Biomedical Informatics 43 (2010) 945–952 951
enriched with altered genes will increase. Out of 11 optimizedpathways, we found one pathway (9.1%) to be significantly en-riched with genomically altered genes (P < 0.05) utilizing HF data.Similarly, we found 4 out of 21 leading edge sets that have signif-icant enrichment levels (19.0%), while we found no such enrichedsubnetworks. Analogously, we found 2 out of 11 pathways (18.2%),one out of 19 (5.3%) and one out of 6 subnetworks (16.7%) to be sig-nificantly enriched with genomically altered genes. Compared tothe enrichment rates of all pathways and subnetworks, genomicalterations alone cannot convincingly explain the biological basisfor the discriminative power of optimized sets of pathways andsubnetworks.
4. Conclusions
Current clinical glioma classification schemes are based on his-topathological observations and suffer from intra-observer subjec-tivity, poor prognostic or therapeutic predictive potential and offerlittle biological insights. Newer classification schemas based ongene expression are more objective and offer hints of biology,but many of the individual genes identified as classifiers exist asisolated markers with questionable relevance to tumor biology.The determination of enriched pathways and differentially ex-pressed subnetworks in GBMs compared to oligodendrogliomas al-lowed us to find gene sets that can be used to reliably distinguishbetween underlying tumor types. Such a strategy may in fact havemore biological meaning than using single probesets/genes in iso-lation since genes mostly mediate their biological functions aslarge assemblies rather than as single entities. Therefore, the ge-netic/protein associations found within differentially expressedpathways and subnetworks may help identify genes/proteins withimportant biological relevance to the pathogenesis of those tu-mors. Merely focusing on single genes alone would have otherwisemissed such pathways and subnetworks.
Although we found that precompiled gene sets, such as path-ways, have value in distinguishing classes of expression profiles,they are outperformed by a more local search. This strategy in-volved discovering differentially expressed subnetworks, wherewe scanned the vicinity of an individual gene in an interaction net-work for the purpose of finding interaction partners that add to thediscriminative power of a single subnetwork. While each pathwaycarries genes that do not significantly contribute to its enrichmentin one tumor class, this disadvantage can be partially compensatedfor by focusing on leading edges, genes that indeed are responsiblefor the observed overrepresentation of the underlying pathway.Such simple steps allowed us to identify an array of discriminativefeatures providing high prediction accuracy by mutually trainingand testing on data sets of different origin. While we initially basedthe classification procedure on all individually enriched pathwaysand differentially expressed subnetworks, we refined our proce-dure by choosing optimal subsets of such features, allowing betterclassification performance as an ensemble. Specifically, we foundthat a relatively low number of pathways and subnetworks doesnot only drastically improve the classifiers performance but alsoallows us to compensate for the seemingly lower prediction accu-racy of oligodendroglioma samples.
The major power of this approach over the single gene classifierapproach is that identified enriched pathways may carry valuablebiological information. We observed that a number of the highlydiscriminatory signaling and regulation pathways were signifi-cantly enriched with genomically altered genes in GBMs, suggest-ing their potential role in the biology of the underlying tumor type.In addition, we found subnetworks that were significantly popu-lated with genomically altered genes largely revolving aroundhubs that play important roles in signal transduction and
transcriptional regulation. The central location of such genes with-in these networks, compounded by their occurrence within fre-quently altered areas of the glioma genome, may hint to theirpotential importance in glioma pathogenesis. Since pathways carrymany genes that are not significantly enriched in one tumor type,the determination of subnetworks works in a more selective wayby accounting for only those genes that strongly help to discrimi-nate the two classes. Indeed, we found major subnetworks revol-ving around prominent glioma related genes such as NFKB1,VEGF and BCL3.
Based on these observations, one might therefore assume thatthe strategy of finding subnetworks would more likely identifygenes that are genomically altered in gliomas. Curiously, however,we did not find any evidence that differentially expressed subnet-works accumulate more genomically altered genes than enrichedpathways. In fact, the enrichment of genomically altered genes inoptimized subsets did not differ compared to all pathways andsubnetworks, suggesting that the presence of altered genes is lar-gely not a criterion for the discriminative power of optimized path-ways and subnetworks. In turn, one might speculate that thepaucity of genomically altered genes in our subnetworks pointsto the possibility that genes in the subnetworks, albeit discrimina-tive, are the result of genomically altered regulators that exerttheir influence in a way that is not detectable by focusing on localinteraction networks alone. Another explanation might be that wepossibly underestimated the number of genomically altered genesin our analysis. Specifically, we determined altered genes using fre-quent chromosomal number alterations in gliomas. However, sin-gle nucleotide polymorphism (SNP) generated genomic arrays onlyidentify rather large genomic alterations. Therefore, some of theenriched genes that were not designated as ‘‘genomically altered”might have undergone smaller (i.e. single base pair) mutations intheir coding or upstream promoter sequences. Such small changesresult in altered mRNA stability and/or altered transcriptionalactivity potentially influencing our results.
Since the level of expression of genes can be explained by geno-mic alterations in many (although not all) cases, a refinement ofour methodology would be the identification of biologically impor-tant genes that are regulated by genomically altered genes.Although our approach of identifying enriched gene sets and differ-entially expressed subnetworks moves us in that direction, such anapproach is still dependent on well-annotated precompiled genesets and/or local gene–gene and protein–protein interactions thatare largely left to be uncovered. Furthermore, difficulties in distin-guishing passenger from driver genetic mutations and alterationswould complicate such an approach. The true value of this ap-proach, ultimately awaits vigorous cross-validation using desper-ately needed outside data sets and experimental validation of theimportance of the identified pathways, subnetworks and the spe-cific genes and proteins.
Our approach offers a proof of principle that pathway and sub-networks reliably allow classification and potential insights intothe underlying biology of those tumors. In addition, such subnet-works and pathways might help to determine distinct subsets ofglioblastomas and oligodendrogliomas and/or help to distinguishclinical outcomes.
Such insights are important for both understanding tumor biol-ogy and for the selection of appropriate molecularly targeted ther-apy for individual tumors as we head into an age of personalizedmedicine.
Appendix A. Supplementary data
Supplementary data associated with this article can be found, inthe online version, at doi:10.1016/j.jbi.2010.08.011.
952 S. Wuchty et al. / Journal of Biomedical Informatics 43 (2010) 945–952
References
[1] Harras A. Cancer rates and risks. 4th ed. Washington, DC: US Department ofHealth and Human Services, Public Health Service, National Institutes ofHealth; 1996.
[2] Kitange GJ, Templeton KL, Jenkins RB. Recent advances in the moleculargenetics of primary gliomas. Curr Opin Oncol 2003;15:197–203.
[3] Rich JN, Sathornsumetee S, Keir ST, Kieran MW, Laforme A, Kaipainen A, et al.ZD6474, a novel tyrosine kinase inhibitor of vascular endothelial growth factorreceptor and epidermal growth factor receptor, inhibits tumor growth ofmultiple nervous system tumors. Clin Cancer Res 2005;11:8145–57.
[4] Liang Y, Diehn M, Watson N, Bollen AW, Aldape KD, Nicholas MK, et al. Geneexpression profiling reveals molecularly and clinically distinct subtypes ofglioblastoma multiforme. Proc Natl Acad Sci USA 2005;102:5814–9.
[5] Golub TR, Slonim DK, Tamayo P, Huard C, Gaasenbeek M, Mesirov JP, et al.Molecular classification of cancer: class discovery and class prediction by geneexpression monitoring. Science 1999;286:531–7.
[6] Phillips HS, Kharbanda S, Chen R, Forrest WF, Soriano RH, Wu TD, et al.Molecular subclasses of high-grade glioma predict prognosis, delineate apattern of disease progression, and resemble stages in neurogenesis. CancerCell 2006;9:157–73.
[7] Li A, Walling J, Ahn S, Kotliarov Y, Su Q, Quezado M, et al. Unsupervisedanalysis of transcriptomic profiles reveals six glioma subtypes. Cancer Res2009;69:2091–9.
[8] Miller CL, Diglisic S, Leister F, Webster M, Yolken RH. Evaluating RNA status forRT-PCR in extracts of postmortem human brain tissue. Biotechniques2004;36:628–33.
[9] Lipshutz RJ, Fodor SP, Gingeras TR, Lockhart DJ. High density syntheticoligonucleotide arrays. Nat Genet 1999;21:20–4.
[10] Li C, Wong WH. Model-based analysis of oligonucleotide arrays: expressionindex computation and outlier detection. Proc Natl Acad Sci USA2001;98:31–6.
[11] Kotliarov Y, Steed ME, Christopher N, Walling J, Su Q, Center A, et al. High-resolution global genomic survey of 178 gliomas reveals novel regions of copynumber alteration and allelic imbalances. Cancer Res 2006;66:9428–36.
[12] Kotliarov Y, Kotliarova S, Charong N, Li A, Walling J, Aquilanti E, et al.Correlation analysis between SNP and expression arrays in gliomas identifypotentially relevant targets genes. In: Cancer Res; 2008.
[13] Greenman C, Stephens P, Smith R, Dalgliesh GL, Hunter C, Bignell G, et al.Patterns of somatic mutation in human cancer genomes. Nature2007;446:153–8.
[14] Rual JF, Venkatesan K, Hao T, Hirozane-Kishikawa T, Dricot A, Li N, et al.Towards a proteome-scale map of the human protein–protein interactionnetwork. Nature 2005;437:1173–8.
[15] Stelzl U, Worm U, Lalowski M, Haenig C, Brembeck FH, Goehler H, et al. Ahuman protein–protein interaction network: a resource for annotating theproteome. Cell 2005;122:957–68.
[16] Ewing RM, Chu P, Elisma F, Li H, Taylor P, Climie S, et al. Large-scale mapping ofhuman protein–protein interactions by mass spectrometry. Mol Syst Biol2007;3:89–99.
[17] Kerrien S, Alam-Faruque Y, Aranda B, Bancarz I, Bridge A, Derow C, et al. IntAct– open source resource for molecular interaction data. Nucleic Acids Res2007;35:D561–5.
[18] Matthews L, Gopinath G, Gillespie M, Caudy M, Croft D, de Bono B, et al.Reactome knowledgebase of human biological pathways and processes.Nucleic Acids Res 2008.
[19] Chatr-aryamontriA,CeolA, Palazzi LM, Nardelli G, Schneider MV, CastagnoliL,et al.MINT: the Molecular INTeraction database. Nucleic Acids Res 2007;35:D572–4.
[20] Peri S, Navarro JD, Kristiansen TZ, Amanchy R, Surendranath V, Muthusamy B,et al. Human protein reference database as a discovery resource forproteomics. Nucleic Acids Res 2004;32:D497–501.
[21] Jiang C, Xuan Z, Zhao F, Zhang MQ. TRED: a transcriptional regulatory elementdatabase, new entries and other development. Nucleic Acids Res2007;35:D137–40.
[22] Linding R, Jensen LJ, Ostheimer GJ, van Vugt MA, Jorgensen C, Miron IM, et al.Systematic discovery of in vivo phosphorylation networks. Cell2007;129:1415–26.
[23] Linding R, Jensen LJ, Pasculescu A, Olhovsky M, Colwill K, Bork P, et al.NetworKIN: a resource for exploring cellular phosphorylation networks.Nucleic Acids Res 2008;36:D695–9.
[24] Diella F, Gould CM, Chica C, Via A, Gibson TJ. Phospho.ELM: a database ofphosphorylation sites – update 2008. Nucleic Acids Res 2008;36:D240–4.
[25] Schaefer CF, Anthony K, Krupa S, Buchoff J, Day M, Hannay T, et al. PID: thepathway interaction database. Nucleic Acids Res 2009;37:D674–9.
[26] Chuang HY, Lee E, Liu YT, Lee D, Ideker T. Network-based classification ofbreast cancer metastasis. Mol Syst Biol 2007;3:140.
[27] Shannon P, Markiel A, Ozier O, Baliga NS, Wang JT, Ramage D, et al. Cytoscape:a software environment for integrated models of biomolecular interactionnetworks. Genome Res 2003;13:2498–504.
[28] Subramanian A, Tamayo P, Mootha VK, Mukherjee S, Ebert BL, Gillette MA,et al. Gene set enrichment analysis: a knowledge-based approach forinterpreting genome-wide expression profiles. Proc Natl Acad Sci USA2005;102:15545–50.
[29] Shen J, Zhang J, Luo X, Zhu W, Yu K, Chen K, et al. Predicting protein–proteininteractions based only on sequences information. Proc Natl Acad Sci USA2007;104:4337–41.
[30] Francesconi M, Remondini D, Neretti N, Sedivy JM, Cooper LN, Verondini E,et al. Reconstructing networks of pathways via significance analysis of theirintersections. BMC Bioinformatics 2008;9(Suppl. 4):S9.
[31] Sun Y. Iterative RELIEF for feature weighting: algorithms, theories, andapplications. IEEE Trans Pattern Anal Mach Intell 2007;29:1035–51.
[32] Sun Y, Goodison S, Li J, Liu L, Farmerie W. Improved breast cancer prognosisthrough the combination of clinical and genetic markers. Bioinformatics2007;23:30–7.