Gene expression profiles in testis of pigs with extreme high and low levels of androstenone
16
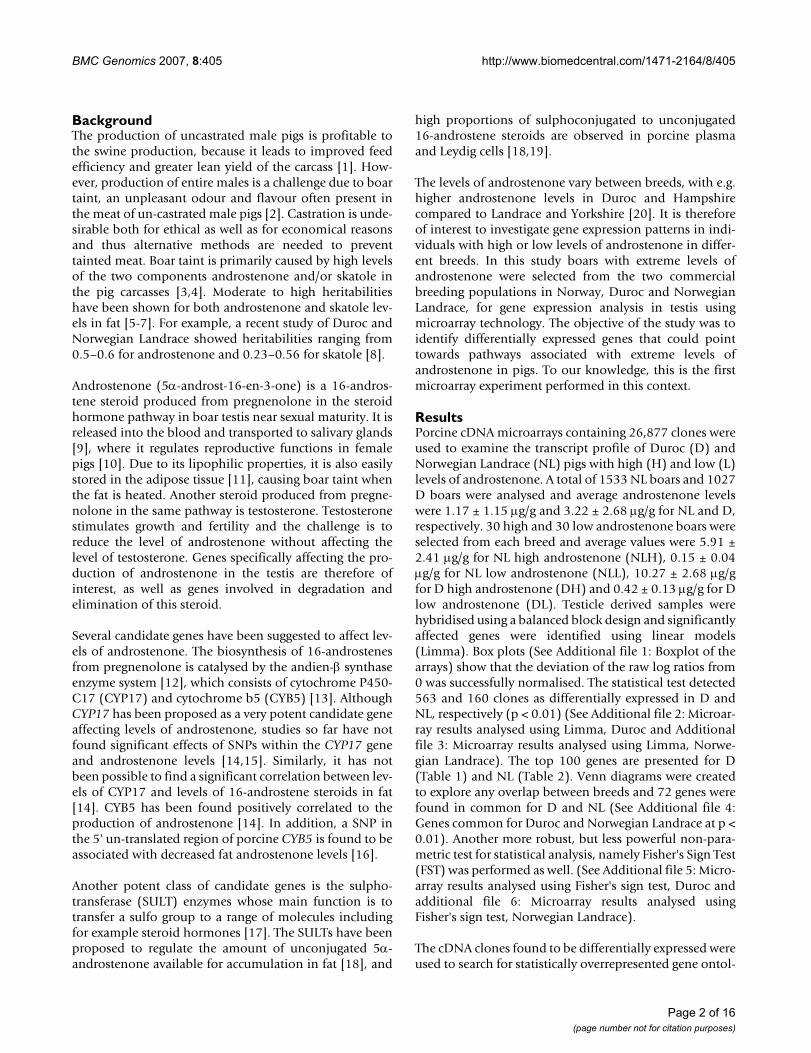
BioMed Central Page 1 of 16 (page number not for citation purposes) BMC Genomics Open Access Research article Gene expression profiles in testis of pigs with extreme high and low levels of androstenone Maren Moe* 1,2 , Theo Meuwissen 2,3 , Sigbjørn Lien 2,3 , Christian Bendixen 4 , Xuefei Wang 4 , Lene Nagstrup Conley 4 , Ingunn Berget 3,5 , Håvard Tajet 1,2 and Eli Grindflek 1,3 Address: 1 The Norwegian Pig Breeders Association (NORSVIN), Hamar, Norway., 2 Department of Animal and Aquacultural Sciences, Norwegian University of Life Sciences, Ås, Norway., 3 Centre for Integrative Genetics (CIGENE), Norwegian University of Life Sciences, Ås, Norway., 4 Faculty of Agricultural Sciences, University of Aarhus, Tjele, Denmark. and 5 MATFORSK, Osloveien 1, Ås, Norway. Email: Maren Moe* - [email protected]; Theo Meuwissen - [email protected]; Sigbjørn Lien - [email protected]; Christian Bendixen - [email protected]; Xuefei Wang - [email protected]; Lene Nagstrup Conley - [email protected]; Ingunn Berget - [email protected]; Håvard Tajet - [email protected]; Eli Grindflek - [email protected] * Corresponding author Abstract Background: Boar taint is a major obstacle when using uncastrated male pigs for swine production. One of the main compounds causing this taint is androstenone, a pheromone produced in porcine testis. Here we use microarrays to study the expression of thousands of genes simultaneously in testis of high and low androstenone boars. The study allows identification of genes and pathways associated with elevated androstenone levels, which is essential for recognising potential molecular markers for breeding purposes. Results: Testicular tissue was collected from 60 boars, 30 with extreme high and 30 with extreme low levels of androstenone, from each of the two breeds Duroc and Norwegian Landrace. The samples were hybridised to porcine arrays containing 26,877 cDNA clones, detecting 563 and 160 genes that were differentially expressed (p < 0.01) in Duroc and Norwegian Landrace, respectively. Of these significantly up- and down-regulated clones, 72 were found to be common for the two breeds, suggesting the possibility of both general and breed specific mechanisms in regulation of, or response to androstenone levels in boars. Ten genes were chosen for verification of expression patterns by quantitative real competitive PCR and real-time PCR. As expected, our results point towards steroid hormone metabolism and biosynthesis as important biological processes for the androstenone levels, but other potential pathways were identified as well. Among these were oxidoreductase activity, ferric iron binding, iron ion binding and electron transport activities. Genes belonging to the cytochrome P450 and hydroxysteroid dehydrogenase families were highly up-regulated, in addition to several genes encoding different families of conjugation enzymes. Furthermore, a number of genes encoding transcription factors were found both up- and down-regulated. The high number of clones belonging to ferric iron and iron ion binding suggests an importance of these genes, and the association between these pathways and androstenone levels is not previously described. Conclusion: This study contributes to the understanding of the complex genetic system controlling and responding to androstenone levels in pig testis. The identification of new pathways and genes involved in the biosynthesis and metabolism of androstenone is an important first step towards finding molecular markers to reduce boar taint. Published: 7 November 2007 BMC Genomics 2007, 8:405 doi:10.1186/1471-2164-8-405 Received: 3 July 2007 Accepted: 7 November 2007 This article is available from: http://www.biomedcentral.com/1471-2164/8/405 © 2007 Moe et al; licensee BioMed Central Ltd. This is an Open Access article distributed under the terms of the Creative Commons Attribution License (http://creativecommons.org/licenses/by/2.0 ), which permits unrestricted use, distribution, and reproduction in any medium, provided the original work is properly cited.
Transcript of Gene expression profiles in testis of pigs with extreme high and low levels of androstenone
BioMed CentralBMC Genomics
ss
Open AcceResearch articleGene expression profiles in testis of pigs with extreme high and low levels of androstenoneMaren Moe*1,2, Theo Meuwissen2,3, Sigbjørn Lien2,3, Christian Bendixen4, Xuefei Wang4, Lene Nagstrup Conley4, Ingunn Berget3,5, Håvard Tajet1,2 and Eli Grindflek1,3Address: 1The Norwegian Pig Breeders Association (NORSVIN), Hamar, Norway., 2Department of Animal and Aquacultural Sciences, Norwegian University of Life Sciences, Ås, Norway., 3Centre for Integrative Genetics (CIGENE), Norwegian University of Life Sciences, Ås, Norway., 4Faculty of Agricultural Sciences, University of Aarhus, Tjele, Denmark. and 5MATFORSK, Osloveien 1, Ås, Norway.
Email: Maren Moe* - [email protected]; Theo Meuwissen - [email protected]; Sigbjørn Lien - [email protected]; Christian Bendixen - [email protected]; Xuefei Wang - [email protected]; Lene Nagstrup Conley - [email protected]; Ingunn Berget - [email protected]; Håvard Tajet - [email protected]; Eli Grindflek - [email protected]
* Corresponding author
AbstractBackground: Boar taint is a major obstacle when using uncastrated male pigs for swine production. One of themain compounds causing this taint is androstenone, a pheromone produced in porcine testis. Here we usemicroarrays to study the expression of thousands of genes simultaneously in testis of high and low androstenoneboars. The study allows identification of genes and pathways associated with elevated androstenone levels, whichis essential for recognising potential molecular markers for breeding purposes.
Results: Testicular tissue was collected from 60 boars, 30 with extreme high and 30 with extreme low levels ofandrostenone, from each of the two breeds Duroc and Norwegian Landrace. The samples were hybridised toporcine arrays containing 26,877 cDNA clones, detecting 563 and 160 genes that were differentially expressed (p< 0.01) in Duroc and Norwegian Landrace, respectively. Of these significantly up- and down-regulated clones, 72were found to be common for the two breeds, suggesting the possibility of both general and breed specificmechanisms in regulation of, or response to androstenone levels in boars. Ten genes were chosen for verificationof expression patterns by quantitative real competitive PCR and real-time PCR. As expected, our results pointtowards steroid hormone metabolism and biosynthesis as important biological processes for the androstenonelevels, but other potential pathways were identified as well. Among these were oxidoreductase activity, ferric ironbinding, iron ion binding and electron transport activities. Genes belonging to the cytochrome P450 andhydroxysteroid dehydrogenase families were highly up-regulated, in addition to several genes encoding differentfamilies of conjugation enzymes. Furthermore, a number of genes encoding transcription factors were found bothup- and down-regulated. The high number of clones belonging to ferric iron and iron ion binding suggests animportance of these genes, and the association between these pathways and androstenone levels is not previouslydescribed.
Conclusion: This study contributes to the understanding of the complex genetic system controlling andresponding to androstenone levels in pig testis. The identification of new pathways and genes involved in thebiosynthesis and metabolism of androstenone is an important first step towards finding molecular markers toreduce boar taint.
Published: 7 November 2007
BMC Genomics 2007, 8:405 doi:10.1186/1471-2164-8-405
Received: 3 July 2007Accepted: 7 November 2007
This article is available from: http://www.biomedcentral.com/1471-2164/8/405
© 2007 Moe et al; licensee BioMed Central Ltd. This is an Open Access article distributed under the terms of the Creative Commons Attribution License (http://creativecommons.org/licenses/by/2.0), which permits unrestricted use, distribution, and reproduction in any medium, provided the original work is properly cited.
Page 1 of 16(page number not for citation purposes)
BMC Genomics 2007, 8:405 http://www.biomedcentral.com/1471-2164/8/405
BackgroundThe production of uncastrated male pigs is profitable tothe swine production, because it leads to improved feedefficiency and greater lean yield of the carcass [1]. How-ever, production of entire males is a challenge due to boartaint, an unpleasant odour and flavour often present inthe meat of un-castrated male pigs [2]. Castration is unde-sirable both for ethical as well as for economical reasonsand thus alternative methods are needed to preventtainted meat. Boar taint is primarily caused by high levelsof the two components androstenone and/or skatole inthe pig carcasses [3,4]. Moderate to high heritabilitieshave been shown for both androstenone and skatole lev-els in fat [5-7]. For example, a recent study of Duroc andNorwegian Landrace showed heritabilities ranging from0.5–0.6 for androstenone and 0.23–0.56 for skatole [8].
Androstenone (5α-androst-16-en-3-one) is a 16-andros-tene steroid produced from pregnenolone in the steroidhormone pathway in boar testis near sexual maturity. It isreleased into the blood and transported to salivary glands[9], where it regulates reproductive functions in femalepigs [10]. Due to its lipophilic properties, it is also easilystored in the adipose tissue [11], causing boar taint whenthe fat is heated. Another steroid produced from pregne-nolone in the same pathway is testosterone. Testosteronestimulates growth and fertility and the challenge is toreduce the level of androstenone without affecting thelevel of testosterone. Genes specifically affecting the pro-duction of androstenone in the testis are therefore ofinterest, as well as genes involved in degradation andelimination of this steroid.
Several candidate genes have been suggested to affect lev-els of androstenone. The biosynthesis of 16-androstenesfrom pregnenolone is catalysed by the andien-β synthaseenzyme system [12], which consists of cytochrome P450-C17 (CYP17) and cytochrome b5 (CYB5) [13]. AlthoughCYP17 has been proposed as a very potent candidate geneaffecting levels of androstenone, studies so far have notfound significant effects of SNPs within the CYP17 geneand androstenone levels [14,15]. Similarly, it has notbeen possible to find a significant correlation between lev-els of CYP17 and levels of 16-androstene steroids in fat[14]. CYB5 has been found positively correlated to theproduction of androstenone [14]. In addition, a SNP inthe 5' un-translated region of porcine CYB5 is found to beassociated with decreased fat androstenone levels [16].
Another potent class of candidate genes is the sulpho-transferase (SULT) enzymes whose main function is totransfer a sulfo group to a range of molecules includingfor example steroid hormones [17]. The SULTs have beenproposed to regulate the amount of unconjugated 5α-androstenone available for accumulation in fat [18], and
high proportions of sulphoconjugated to unconjugated16-androstene steroids are observed in porcine plasmaand Leydig cells [18,19].
The levels of androstenone vary between breeds, with e.g.higher androstenone levels in Duroc and Hampshirecompared to Landrace and Yorkshire [20]. It is thereforeof interest to investigate gene expression patterns in indi-viduals with high or low levels of androstenone in differ-ent breeds. In this study boars with extreme levels ofandrostenone were selected from the two commercialbreeding populations in Norway, Duroc and NorwegianLandrace, for gene expression analysis in testis usingmicroarray technology. The objective of the study was toidentify differentially expressed genes that could pointtowards pathways associated with extreme levels ofandrostenone in pigs. To our knowledge, this is the firstmicroarray experiment performed in this context.
ResultsPorcine cDNA microarrays containing 26,877 clones wereused to examine the transcript profile of Duroc (D) andNorwegian Landrace (NL) pigs with high (H) and low (L)levels of androstenone. A total of 1533 NL boars and 1027D boars were analysed and average androstenone levelswere 1.17 ± 1.15 µg/g and 3.22 ± 2.68 µg/g for NL and D,respectively. 30 high and 30 low androstenone boars wereselected from each breed and average values were 5.91 ±2.41 µg/g for NL high androstenone (NLH), 0.15 ± 0.04µg/g for NL low androstenone (NLL), 10.27 ± 2.68 µg/gfor D high androstenone (DH) and 0.42 ± 0.13 µg/g for Dlow androstenone (DL). Testicle derived samples werehybridised using a balanced block design and significantlyaffected genes were identified using linear models(Limma). Box plots (See Additional file 1: Boxplot of thearrays) show that the deviation of the raw log ratios from0 was successfully normalised. The statistical test detected563 and 160 clones as differentially expressed in D andNL, respectively (p < 0.01) (See Additional file 2: Microar-ray results analysed using Limma, Duroc and Additionalfile 3: Microarray results analysed using Limma, Norwe-gian Landrace). The top 100 genes are presented for D(Table 1) and NL (Table 2). Venn diagrams were createdto explore any overlap between breeds and 72 genes werefound in common for D and NL (See Additional file 4:Genes common for Duroc and Norwegian Landrace at p <0.01). Another more robust, but less powerful non-para-metric test for statistical analysis, namely Fisher's Sign Test(FST) was performed as well. (See Additional file 5: Micro-array results analysed using Fisher's sign test, Duroc andadditional file 6: Microarray results analysed usingFisher's sign test, Norwegian Landrace).
The cDNA clones found to be differentially expressed wereused to search for statistically overrepresented gene ontol-
Page 2 of 16(page number not for citation purposes)
BMC Genomics 2007, 8:405 http://www.biomedcentral.com/1471-2164/8/405
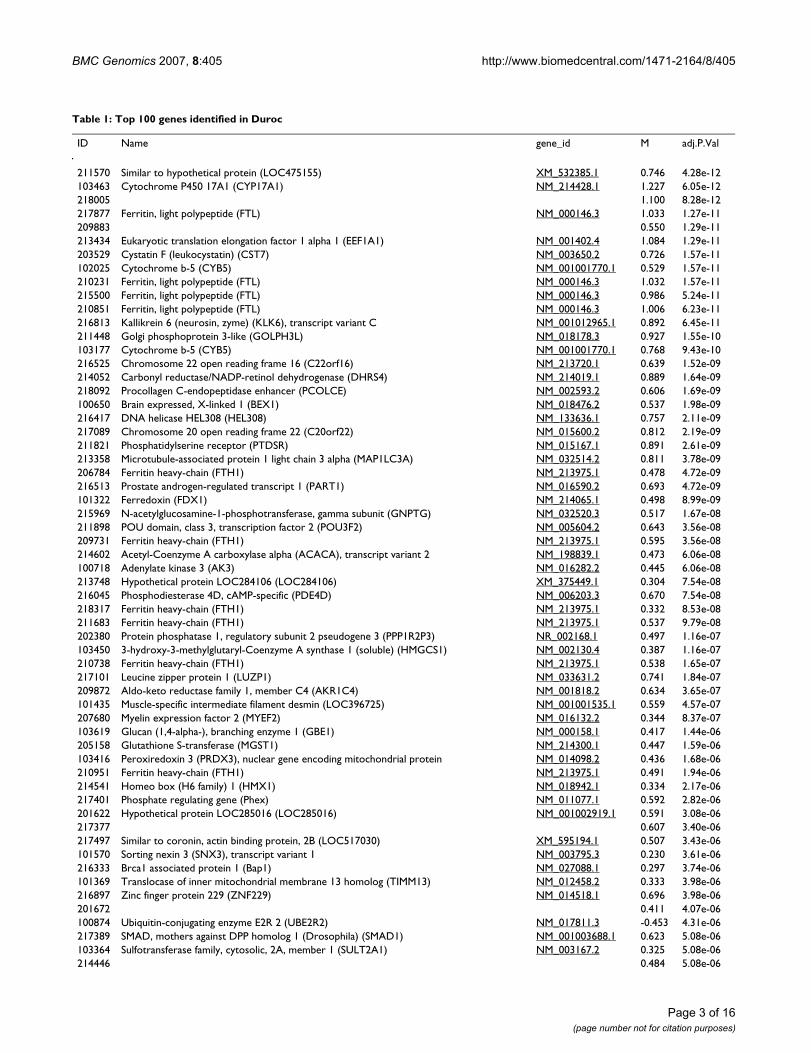
Table 1: Top 100 genes identified in Duroc
ID Name gene_id M adj.P.Val
211570 Similar to hypothetical protein (LOC475155) XM_532385.1 0.746 4.28e-12103463 Cytochrome P450 17A1 (CYP17A1) NM_214428.1 1.227 6.05e-12218005 1.100 8.28e-12217877 Ferritin, light polypeptide (FTL) NM_000146.3 1.033 1.27e-11209883 0.550 1.29e-11213434 Eukaryotic translation elongation factor 1 alpha 1 (EEF1A1) NM_001402.4 1.084 1.29e-11203529 Cystatin F (leukocystatin) (CST7) NM_003650.2 0.726 1.57e-11102025 Cytochrome b-5 (CYB5) NM_001001770.1 0.529 1.57e-11210231 Ferritin, light polypeptide (FTL) NM_000146.3 1.032 1.57e-11215500 Ferritin, light polypeptide (FTL) NM_000146.3 0.986 5.24e-11210851 Ferritin, light polypeptide (FTL) NM_000146.3 1.006 6.23e-11216813 Kallikrein 6 (neurosin, zyme) (KLK6), transcript variant C NM_001012965.1 0.892 6.45e-11211448 Golgi phosphoprotein 3-like (GOLPH3L) NM_018178.3 0.927 1.55e-10103177 Cytochrome b-5 (CYB5) NM_001001770.1 0.768 9.43e-10216525 Chromosome 22 open reading frame 16 (C22orf16) NM_213720.1 0.639 1.52e-09214052 Carbonyl reductase/NADP-retinol dehydrogenase (DHRS4) NM_214019.1 0.889 1.64e-09218092 Procollagen C-endopeptidase enhancer (PCOLCE) NM_002593.2 0.606 1.69e-09100650 Brain expressed, X-linked 1 (BEX1) NM_018476.2 0.537 1.98e-09216417 DNA helicase HEL308 (HEL308) NM_133636.1 0.757 2.11e-09217089 Chromosome 20 open reading frame 22 (C20orf22) NM_015600.2 0.812 2.19e-09211821 Phosphatidylserine receptor (PTDSR) NM_015167.1 0.891 2.61e-09213358 Microtubule-associated protein 1 light chain 3 alpha (MAP1LC3A) NM_032514.2 0.811 3.78e-09206784 Ferritin heavy-chain (FTH1) NM_213975.1 0.478 4.72e-09216513 Prostate androgen-regulated transcript 1 (PART1) NM_016590.2 0.693 4.72e-09101322 Ferredoxin (FDX1) NM_214065.1 0.498 8.99e-09215969 N-acetylglucosamine-1-phosphotransferase, gamma subunit (GNPTG) NM_032520.3 0.517 1.67e-08211898 POU domain, class 3, transcription factor 2 (POU3F2) NM_005604.2 0.643 3.56e-08209731 Ferritin heavy-chain (FTH1) NM_213975.1 0.595 3.56e-08214602 Acetyl-Coenzyme A carboxylase alpha (ACACA), transcript variant 2 NM_198839.1 0.473 6.06e-08100718 Adenylate kinase 3 (AK3) NM_016282.2 0.445 6.06e-08213748 Hypothetical protein LOC284106 (LOC284106) XM_375449.1 0.304 7.54e-08216045 Phosphodiesterase 4D, cAMP-specific (PDE4D) NM_006203.3 0.670 7.54e-08218317 Ferritin heavy-chain (FTH1) NM_213975.1 0.332 8.53e-08211683 Ferritin heavy-chain (FTH1) NM_213975.1 0.537 9.79e-08202380 Protein phosphatase 1, regulatory subunit 2 pseudogene 3 (PPP1R2P3) NR_002168.1 0.497 1.16e-07103450 3-hydroxy-3-methylglutaryl-Coenzyme A synthase 1 (soluble) (HMGCS1) NM_002130.4 0.387 1.16e-07210738 Ferritin heavy-chain (FTH1) NM_213975.1 0.538 1.65e-07217101 Leucine zipper protein 1 (LUZP1) NM_033631.2 0.741 1.84e-07209872 Aldo-keto reductase family 1, member C4 (AKR1C4) NM_001818.2 0.634 3.65e-07101435 Muscle-specific intermediate filament desmin (LOC396725) NM_001001535.1 0.559 4.57e-07207680 Myelin expression factor 2 (MYEF2) NM_016132.2 0.344 8.37e-07103619 Glucan (1,4-alpha-), branching enzyme 1 (GBE1) NM_000158.1 0.417 1.44e-06205158 Glutathione S-transferase (MGST1) NM_214300.1 0.447 1.59e-06103416 Peroxiredoxin 3 (PRDX3), nuclear gene encoding mitochondrial protein NM_014098.2 0.436 1.68e-06210951 Ferritin heavy-chain (FTH1) NM_213975.1 0.491 1.94e-06214541 Homeo box (H6 family) 1 (HMX1) NM_018942.1 0.334 2.17e-06217401 Phosphate regulating gene (Phex) NM_011077.1 0.592 2.82e-06201622 Hypothetical protein LOC285016 (LOC285016) NM_001002919.1 0.591 3.08e-06217377 0.607 3.40e-06217497 Similar to coronin, actin binding protein, 2B (LOC517030) XM_595194.1 0.507 3.43e-06101570 Sorting nexin 3 (SNX3), transcript variant 1 NM_003795.3 0.230 3.61e-06216333 Brca1 associated protein 1 (Bap1) NM_027088.1 0.297 3.74e-06101369 Translocase of inner mitochondrial membrane 13 homolog (TIMM13) NM_012458.2 0.333 3.98e-06216897 Zinc finger protein 229 (ZNF229) NM_014518.1 0.696 3.98e-06201672 0.411 4.07e-06100874 Ubiquitin-conjugating enzyme E2R 2 (UBE2R2) NM_017811.3 -0.453 4.31e-06217389 SMAD, mothers against DPP homolog 1 (Drosophila) (SMAD1) NM_001003688.1 0.623 5.08e-06103364 Sulfotransferase family, cytosolic, 2A, member 1 (SULT2A1) NM_003167.2 0.325 5.08e-06214446 0.484 5.08e-06
Page 3 of 16(page number not for citation purposes)
BMC Genomics 2007, 8:405 http://www.biomedcentral.com/1471-2164/8/405
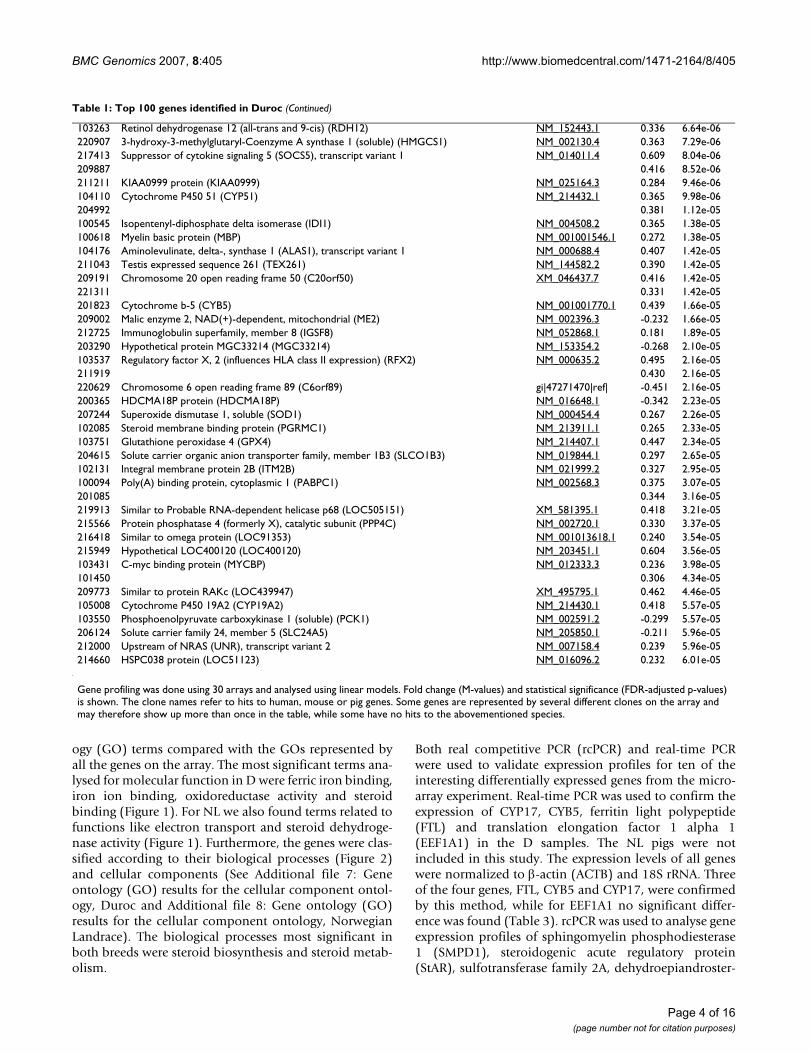
103263 Retinol dehydrogenase 12 (all-trans and 9-cis) (RDH12) NM_152443.1 0.336 6.64e-06220907 3-hydroxy-3-methylglutaryl-Coenzyme A synthase 1 (soluble) (HMGCS1) NM_002130.4 0.363 7.29e-06217413 Suppressor of cytokine signaling 5 (SOCS5), transcript variant 1 NM_014011.4 0.609 8.04e-06209887 0.416 8.52e-06211211 KIAA0999 protein (KIAA0999) NM_025164.3 0.284 9.46e-06104110 Cytochrome P450 51 (CYP51) NM_214432.1 0.365 9.98e-06204992 0.381 1.12e-05100545 Isopentenyl-diphosphate delta isomerase (IDI1) NM_004508.2 0.365 1.38e-05100618 Myelin basic protein (MBP) NM_001001546.1 0.272 1.38e-05104176 Aminolevulinate, delta-, synthase 1 (ALAS1), transcript variant 1 NM_000688.4 0.407 1.42e-05211043 Testis expressed sequence 261 (TEX261) NM_144582.2 0.390 1.42e-05209191 Chromosome 20 open reading frame 50 (C20orf50) XM_046437.7 0.416 1.42e-05221311 0.331 1.42e-05201823 Cytochrome b-5 (CYB5) NM_001001770.1 0.439 1.66e-05209002 Malic enzyme 2, NAD(+)-dependent, mitochondrial (ME2) NM_002396.3 -0.232 1.66e-05212725 Immunoglobulin superfamily, member 8 (IGSF8) NM_052868.1 0.181 1.89e-05203290 Hypothetical protein MGC33214 (MGC33214) NM_153354.2 -0.268 2.10e-05103537 Regulatory factor X, 2 (influences HLA class II expression) (RFX2) NM_000635.2 0.495 2.16e-05211919 0.430 2.16e-05220629 Chromosome 6 open reading frame 89 (C6orf89) gi|47271470|ref| -0.451 2.16e-05200365 HDCMA18P protein (HDCMA18P) NM_016648.1 -0.342 2.23e-05207244 Superoxide dismutase 1, soluble (SOD1) NM_000454.4 0.267 2.26e-05102085 Steroid membrane binding protein (PGRMC1) NM_213911.1 0.265 2.33e-05103751 Glutathione peroxidase 4 (GPX4) NM_214407.1 0.447 2.34e-05204615 Solute carrier organic anion transporter family, member 1B3 (SLCO1B3) NM_019844.1 0.297 2.65e-05102131 Integral membrane protein 2B (ITM2B) NM_021999.2 0.327 2.95e-05100094 Poly(A) binding protein, cytoplasmic 1 (PABPC1) NM_002568.3 0.375 3.07e-05201085 0.344 3.16e-05219913 Similar to Probable RNA-dependent helicase p68 (LOC505151) XM_581395.1 0.418 3.21e-05215566 Protein phosphatase 4 (formerly X), catalytic subunit (PPP4C) NM_002720.1 0.330 3.37e-05216418 Similar to omega protein (LOC91353) NM_001013618.1 0.240 3.54e-05215949 Hypothetical LOC400120 (LOC400120) NM_203451.1 0.604 3.56e-05103431 C-myc binding protein (MYCBP) NM_012333.3 0.236 3.98e-05101450 0.306 4.34e-05209773 Similar to protein RAKc (LOC439947) XM_495795.1 0.462 4.46e-05105008 Cytochrome P450 19A2 (CYP19A2) NM_214430.1 0.418 5.57e-05103550 Phosphoenolpyruvate carboxykinase 1 (soluble) (PCK1) NM_002591.2 -0.299 5.57e-05206124 Solute carrier family 24, member 5 (SLC24A5) NM_205850.1 -0.211 5.96e-05212000 Upstream of NRAS (UNR), transcript variant 2 NM_007158.4 0.239 5.96e-05214660 HSPC038 protein (LOC51123) NM_016096.2 0.232 6.01e-05
Gene profiling was done using 30 arrays and analysed using linear models. Fold change (M-values) and statistical significance (FDR-adjusted p-values) is shown. The clone names refer to hits to human, mouse or pig genes. Some genes are represented by several different clones on the array and may therefore show up more than once in the table, while some have no hits to the abovementioned species.
Table 1: Top 100 genes identified in Duroc (Continued)
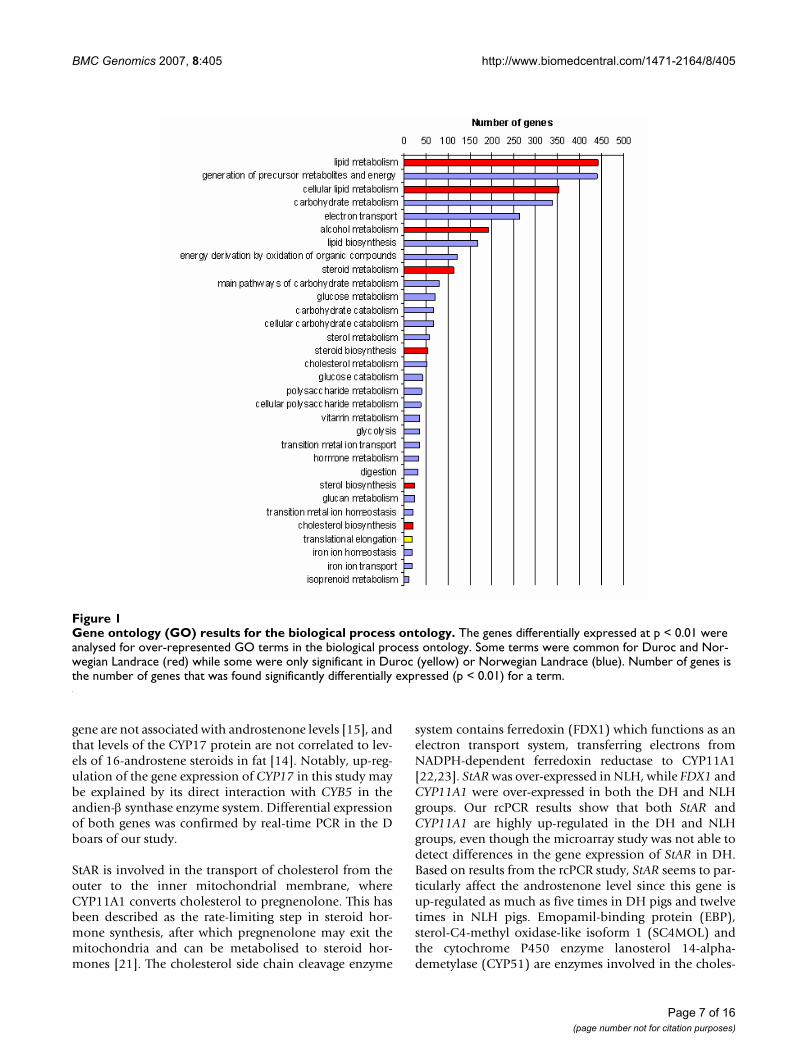
ogy (GO) terms compared with the GOs represented byall the genes on the array. The most significant terms ana-lysed for molecular function in D were ferric iron binding,iron ion binding, oxidoreductase activity and steroidbinding (Figure 1). For NL we also found terms related tofunctions like electron transport and steroid dehydroge-nase activity (Figure 1). Furthermore, the genes were clas-sified according to their biological processes (Figure 2)and cellular components (See Additional file 7: Geneontology (GO) results for the cellular component ontol-ogy, Duroc and Additional file 8: Gene ontology (GO)results for the cellular component ontology, NorwegianLandrace). The biological processes most significant inboth breeds were steroid biosynthesis and steroid metab-olism.
Both real competitive PCR (rcPCR) and real-time PCRwere used to validate expression profiles for ten of theinteresting differentially expressed genes from the micro-array experiment. Real-time PCR was used to confirm theexpression of CYP17, CYB5, ferritin light polypeptide(FTL) and translation elongation factor 1 alpha 1(EEF1A1) in the D samples. The NL pigs were notincluded in this study. The expression levels of all geneswere normalized to β-actin (ACTB) and 18S rRNA. Threeof the four genes, FTL, CYB5 and CYP17, were confirmedby this method, while for EEF1A1 no significant differ-ence was found (Table 3). rcPCR was used to analyse geneexpression profiles of sphingomyelin phosphodiesterase1 (SMPD1), steroidogenic acute regulatory protein(StAR), sulfotransferase family 2A, dehydroepiandroster-
Page 4 of 16(page number not for citation purposes)
BMC Genomics 2007, 8:405 http://www.biomedcentral.com/1471-2164/8/405
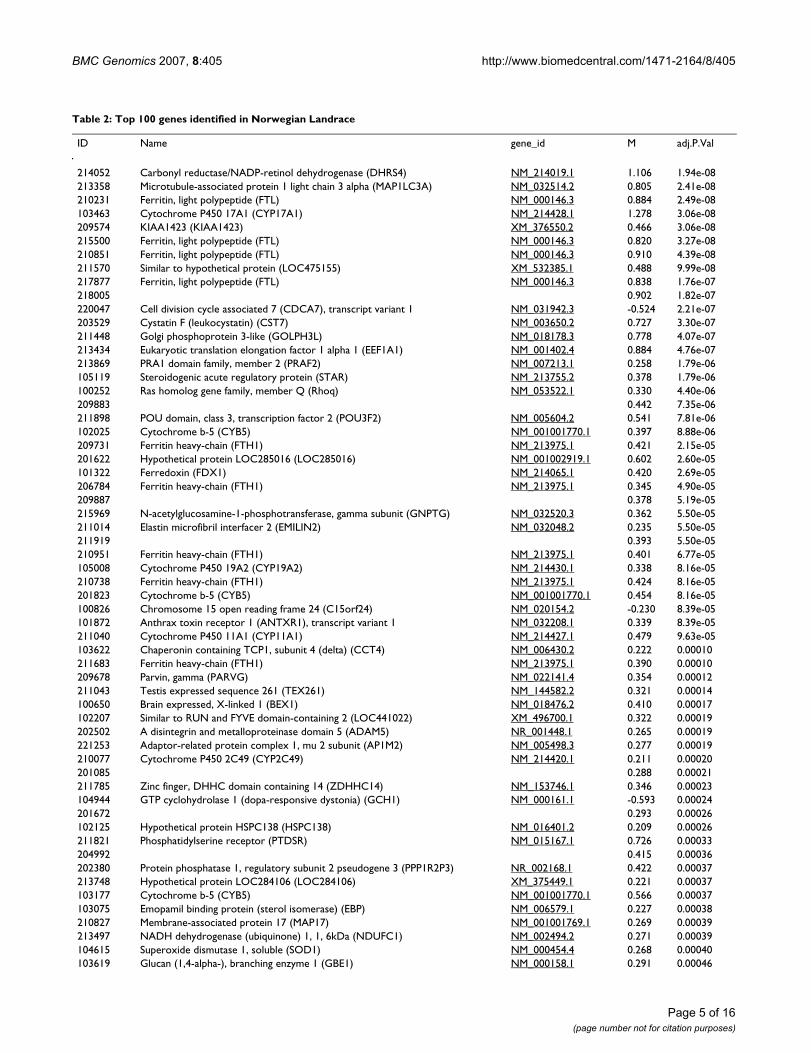
Table 2: Top 100 genes identified in Norwegian Landrace
ID Name gene_id M adj.P.Val
214052 Carbonyl reductase/NADP-retinol dehydrogenase (DHRS4) NM_214019.1 1.106 1.94e-08213358 Microtubule-associated protein 1 light chain 3 alpha (MAP1LC3A) NM_032514.2 0.805 2.41e-08210231 Ferritin, light polypeptide (FTL) NM_000146.3 0.884 2.49e-08103463 Cytochrome P450 17A1 (CYP17A1) NM_214428.1 1.278 3.06e-08209574 KIAA1423 (KIAA1423) XM_376550.2 0.466 3.06e-08215500 Ferritin, light polypeptide (FTL) NM_000146.3 0.820 3.27e-08210851 Ferritin, light polypeptide (FTL) NM_000146.3 0.910 4.39e-08211570 Similar to hypothetical protein (LOC475155) XM_532385.1 0.488 9.99e-08217877 Ferritin, light polypeptide (FTL) NM_000146.3 0.838 1.76e-07218005 0.902 1.82e-07220047 Cell division cycle associated 7 (CDCA7), transcript variant 1 NM_031942.3 -0.524 2.21e-07203529 Cystatin F (leukocystatin) (CST7) NM_003650.2 0.727 3.30e-07211448 Golgi phosphoprotein 3-like (GOLPH3L) NM_018178.3 0.778 4.07e-07213434 Eukaryotic translation elongation factor 1 alpha 1 (EEF1A1) NM_001402.4 0.884 4.76e-07213869 PRA1 domain family, member 2 (PRAF2) NM_007213.1 0.258 1.79e-06105119 Steroidogenic acute regulatory protein (STAR) NM_213755.2 0.378 1.79e-06100252 Ras homolog gene family, member Q (Rhoq) NM_053522.1 0.330 4.40e-06209883 0.442 7.35e-06211898 POU domain, class 3, transcription factor 2 (POU3F2) NM_005604.2 0.541 7.81e-06102025 Cytochrome b-5 (CYB5) NM_001001770.1 0.397 8.88e-06209731 Ferritin heavy-chain (FTH1) NM_213975.1 0.421 2.15e-05201622 Hypothetical protein LOC285016 (LOC285016) NM_001002919.1 0.602 2.60e-05101322 Ferredoxin (FDX1) NM_214065.1 0.420 2.69e-05206784 Ferritin heavy-chain (FTH1) NM_213975.1 0.345 4.90e-05209887 0.378 5.19e-05215969 N-acetylglucosamine-1-phosphotransferase, gamma subunit (GNPTG) NM_032520.3 0.362 5.50e-05211014 Elastin microfibril interfacer 2 (EMILIN2) NM_032048.2 0.235 5.50e-05211919 0.393 5.50e-05210951 Ferritin heavy-chain (FTH1) NM_213975.1 0.401 6.77e-05105008 Cytochrome P450 19A2 (CYP19A2) NM_214430.1 0.338 8.16e-05210738 Ferritin heavy-chain (FTH1) NM_213975.1 0.424 8.16e-05201823 Cytochrome b-5 (CYB5) NM_001001770.1 0.454 8.16e-05100826 Chromosome 15 open reading frame 24 (C15orf24) NM_020154.2 -0.230 8.39e-05101872 Anthrax toxin receptor 1 (ANTXR1), transcript variant 1 NM_032208.1 0.339 8.39e-05211040 Cytochrome P450 11A1 (CYP11A1) NM_214427.1 0.479 9.63e-05103622 Chaperonin containing TCP1, subunit 4 (delta) (CCT4) NM_006430.2 0.222 0.00010211683 Ferritin heavy-chain (FTH1) NM_213975.1 0.390 0.00010209678 Parvin, gamma (PARVG) NM_022141.4 0.354 0.00012211043 Testis expressed sequence 261 (TEX261) NM_144582.2 0.321 0.00014100650 Brain expressed, X-linked 1 (BEX1) NM_018476.2 0.410 0.00017102207 Similar to RUN and FYVE domain-containing 2 (LOC441022) XM_496700.1 0.322 0.00019202502 A disintegrin and metalloproteinase domain 5 (ADAM5) NR_001448.1 0.265 0.00019221253 Adaptor-related protein complex 1, mu 2 subunit (AP1M2) NM_005498.3 0.277 0.00019210077 Cytochrome P450 2C49 (CYP2C49) NM_214420.1 0.211 0.00020201085 0.288 0.00021211785 Zinc finger, DHHC domain containing 14 (ZDHHC14) NM_153746.1 0.346 0.00023104944 GTP cyclohydrolase 1 (dopa-responsive dystonia) (GCH1) NM_000161.1 -0.593 0.00024201672 0.293 0.00026102125 Hypothetical protein HSPC138 (HSPC138) NM_016401.2 0.209 0.00026211821 Phosphatidylserine receptor (PTDSR) NM_015167.1 0.726 0.00033204992 0.415 0.00036202380 Protein phosphatase 1, regulatory subunit 2 pseudogene 3 (PPP1R2P3) NR_002168.1 0.422 0.00037213748 Hypothetical protein LOC284106 (LOC284106) XM_375449.1 0.221 0.00037103177 Cytochrome b-5 (CYB5) NM_001001770.1 0.566 0.00037103075 Emopamil binding protein (sterol isomerase) (EBP) NM_006579.1 0.227 0.00038210827 Membrane-associated protein 17 (MAP17) NM_001001769.1 0.269 0.00039213497 NADH dehydrogenase (ubiquinone) 1, 1, 6kDa (NDUFC1) NM_002494.2 0.271 0.00039104615 Superoxide dismutase 1, soluble (SOD1) NM_000454.4 0.268 0.00040103619 Glucan (1,4-alpha-), branching enzyme 1 (GBE1) NM_000158.1 0.291 0.00046
Page 5 of 16(page number not for citation purposes)
BMC Genomics 2007, 8:405 http://www.biomedcentral.com/1471-2164/8/405
one-preferring, member 1 (SULT2A1), 17-beta-hydroxys-teroid dehydrogenase IV (HSD17B4), aldo-keto reductasefamily 1, member C4 (AKR1C4), and cytochrome P450,subfamily XIA, polypeptide 1 (CYP11A1). The expressionlevels of all genes were normalised using the housekeep-ing gene hypoxanthine guanine phosphoribosyltrans-ferase 1 (HPRT). StAR, SULT2A1, HSD17B4, AKR1C4 andCYP11A1 were all differentially expressed in both D andNL (p < 0.01), while SMPD1 was not significantly differ-entially expressed in either of the two breeds (Table 4 and5, respectively).
DiscussionThe present study describes the transcriptional profiles oftesticle from animals with extreme high and low levels ofandrostenone in D and NL boars. Some of these geneshave already been shown to affect levels of androstenone,although most of them have not previously beendescribed in this context. Both CYB5 and CYP17 were up-regulated in both D high (DH) and NL high (NLH) ani-mals and this was confirmed by real-time PCR. Over-expression of CYB5 cDNA clones in high androstenoneanimals agrees with results previously seen in proteinexpression studies [13,14]. Earlier studies on CYP17 haveshown that polymorphisms in the coding region of the
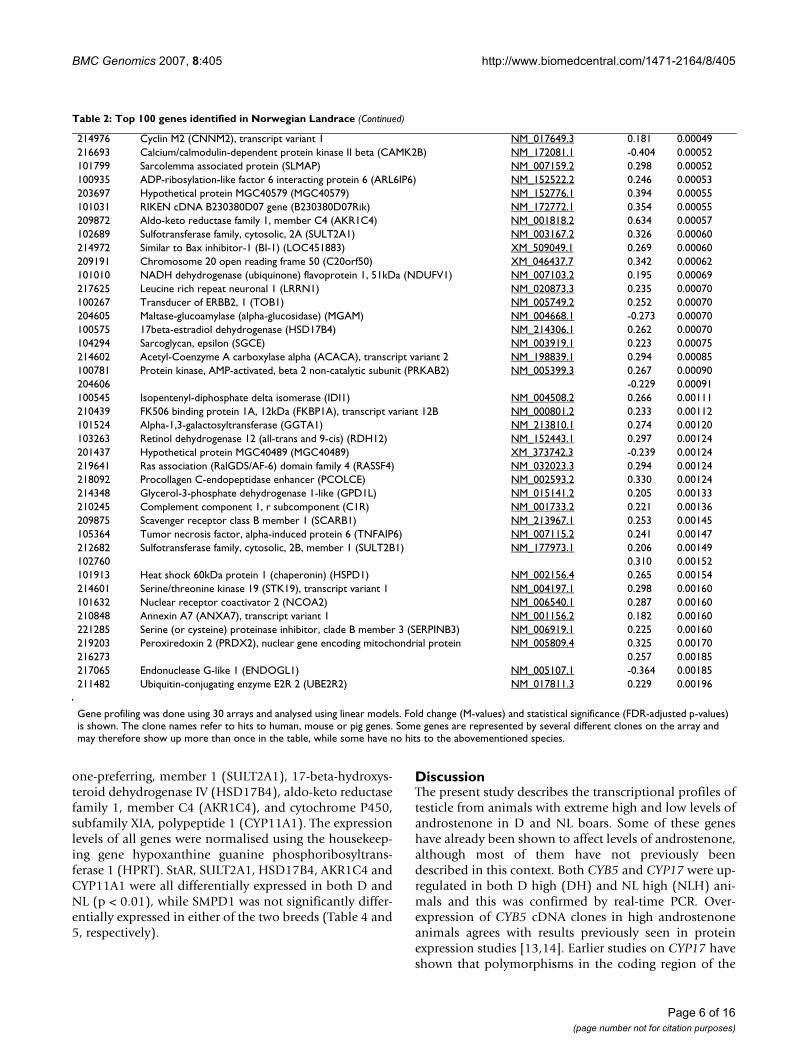
214976 Cyclin M2 (CNNM2), transcript variant 1 NM_017649.3 0.181 0.00049216693 Calcium/calmodulin-dependent protein kinase II beta (CAMK2B) NM_172081.1 -0.404 0.00052101799 Sarcolemma associated protein (SLMAP) NM_007159.2 0.298 0.00052100935 ADP-ribosylation-like factor 6 interacting protein 6 (ARL6IP6) NM_152522.2 0.246 0.00053203697 Hypothetical protein MGC40579 (MGC40579) NM_152776.1 0.394 0.00055101031 RIKEN cDNA B230380D07 gene (B230380D07Rik) NM_172772.1 0.354 0.00055209872 Aldo-keto reductase family 1, member C4 (AKR1C4) NM_001818.2 0.634 0.00057102689 Sulfotransferase family, cytosolic, 2A (SULT2A1) NM_003167.2 0.326 0.00060214972 Similar to Bax inhibitor-1 (BI-1) (LOC451883) XM_509049.1 0.269 0.00060209191 Chromosome 20 open reading frame 50 (C20orf50) XM_046437.7 0.342 0.00062101010 NADH dehydrogenase (ubiquinone) flavoprotein 1, 51kDa (NDUFV1) NM_007103.2 0.195 0.00069217625 Leucine rich repeat neuronal 1 (LRRN1) NM_020873.3 0.235 0.00070100267 Transducer of ERBB2, 1 (TOB1) NM_005749.2 0.252 0.00070204605 Maltase-glucoamylase (alpha-glucosidase) (MGAM) NM_004668.1 -0.273 0.00070100575 17beta-estradiol dehydrogenase (HSD17B4) NM_214306.1 0.262 0.00070104294 Sarcoglycan, epsilon (SGCE) NM_003919.1 0.223 0.00075214602 Acetyl-Coenzyme A carboxylase alpha (ACACA), transcript variant 2 NM_198839.1 0.294 0.00085100781 Protein kinase, AMP-activated, beta 2 non-catalytic subunit (PRKAB2) NM_005399.3 0.267 0.00090204606 -0.229 0.00091100545 Isopentenyl-diphosphate delta isomerase (IDI1) NM_004508.2 0.266 0.00111210439 FK506 binding protein 1A, 12kDa (FKBP1A), transcript variant 12B NM_000801.2 0.233 0.00112101524 Alpha-1,3-galactosyltransferase (GGTA1) NM_213810.1 0.274 0.00120103263 Retinol dehydrogenase 12 (all-trans and 9-cis) (RDH12) NM_152443.1 0.297 0.00124201437 Hypothetical protein MGC40489 (MGC40489) XM_373742.3 -0.239 0.00124219641 Ras association (RalGDS/AF-6) domain family 4 (RASSF4) NM_032023.3 0.294 0.00124218092 Procollagen C-endopeptidase enhancer (PCOLCE) NM_002593.2 0.330 0.00124214348 Glycerol-3-phosphate dehydrogenase 1-like (GPD1L) NM_015141.2 0.205 0.00133210245 Complement component 1, r subcomponent (C1R) NM_001733.2 0.221 0.00136209875 Scavenger receptor class B member 1 (SCARB1) NM_213967.1 0.253 0.00145105364 Tumor necrosis factor, alpha-induced protein 6 (TNFAIP6) NM_007115.2 0.241 0.00147212682 Sulfotransferase family, cytosolic, 2B, member 1 (SULT2B1) NM_177973.1 0.206 0.00149102760 0.310 0.00152101913 Heat shock 60kDa protein 1 (chaperonin) (HSPD1) NM_002156.4 0.265 0.00154214601 Serine/threonine kinase 19 (STK19), transcript variant 1 NM_004197.1 0.298 0.00160101632 Nuclear receptor coactivator 2 (NCOA2) NM_006540.1 0.287 0.00160210848 Annexin A7 (ANXA7), transcript variant 1 NM_001156.2 0.182 0.00160221285 Serine (or cysteine) proteinase inhibitor, clade B member 3 (SERPINB3) NM_006919.1 0.225 0.00160219203 Peroxiredoxin 2 (PRDX2), nuclear gene encoding mitochondrial protein NM_005809.4 0.325 0.00170216273 0.257 0.00185217065 Endonuclease G-like 1 (ENDOGL1) NM_005107.1 -0.364 0.00185211482 Ubiquitin-conjugating enzyme E2R 2 (UBE2R2) NM_017811.3 0.229 0.00196
Gene profiling was done using 30 arrays and analysed using linear models. Fold change (M-values) and statistical significance (FDR-adjusted p-values) is shown. The clone names refer to hits to human, mouse or pig genes. Some genes are represented by several different clones on the array and may therefore show up more than once in the table, while some have no hits to the abovementioned species.
Table 2: Top 100 genes identified in Norwegian Landrace (Continued)
Page 6 of 16(page number not for citation purposes)
BMC Genomics 2007, 8:405 http://www.biomedcentral.com/1471-2164/8/405
gene are not associated with androstenone levels [15], andthat levels of the CYP17 protein are not correlated to lev-els of 16-androstene steroids in fat [14]. Notably, up-reg-ulation of the gene expression of CYP17 in this study maybe explained by its direct interaction with CYB5 in theandien-β synthase enzyme system. Differential expressionof both genes was confirmed by real-time PCR in the Dboars of our study.
StAR is involved in the transport of cholesterol from theouter to the inner mitochondrial membrane, whereCYP11A1 converts cholesterol to pregnenolone. This hasbeen described as the rate-limiting step in steroid hor-mone synthesis, after which pregnenolone may exit themitochondria and can be metabolised to steroid hor-mones [21]. The cholesterol side chain cleavage enzyme
system contains ferredoxin (FDX1) which functions as anelectron transport system, transferring electrons fromNADPH-dependent ferredoxin reductase to CYP11A1[22,23]. StAR was over-expressed in NLH, while FDX1 andCYP11A1 were over-expressed in both the DH and NLHgroups. Our rcPCR results show that both StAR andCYP11A1 are highly up-regulated in the DH and NLHgroups, even though the microarray study was not able todetect differences in the gene expression of StAR in DH.Based on results from the rcPCR study, StAR seems to par-ticularly affect the androstenone level since this gene isup-regulated as much as five times in DH pigs and twelvetimes in NLH pigs. Emopamil-binding protein (EBP),sterol-C4-methyl oxidase-like isoform 1 (SC4MOL) andthe cytochrome P450 enzyme lanosterol 14-alpha-demetylase (CYP51) are enzymes involved in the choles-
Gene ontology (GO) results for the biological process ontologyFigure 1Gene ontology (GO) results for the biological process ontology. The genes differentially expressed at p < 0.01 were analysed for over-represented GO terms in the biological process ontology. Some terms were common for Duroc and Nor-wegian Landrace (red) while some were only significant in Duroc (yellow) or Norwegian Landrace (blue). Number of genes is the number of genes that was found significantly differentially expressed (p < 0.01) for a term.
Page 7 of 16(page number not for citation purposes)

BMC Genomics 2007, 8:405 http://www.biomedcentral.com/1471-2164/8/405
terol biosynthesis pathway [24-26]. EBP was up-regulatedin NLH, while SC4MOL and CYP51 were up-regulated inthe DH. Isopentenyl-diphosphate delta isomerase (IDI1)catalyses the inter-conversion of isopentenyl diphosphate(IPP) to dimethylallyl diphosphate (DMAPP), which isthe substrate for the reaction that ultimately results incholesterol, and this gene was up-regulated in both DHand NLH. The over-expression of all these genes may indi-cate that this early stage of steroid hormone biosynthesisis important for the production levels of androstenone.However, since cholesterol ultimately metabolises intoboth androstenone and testosterone, it might be impossi-
ble to use these genes as markers for low androstenonewithout simultaneously affecting levels of testosterone.However, further studies are needed to address thishypothesis.
In addition to FDX1, two additional ferritin cDNA cloneswere significantly up-regulated in the NLH and DHgroups: FTL and the ferritin heavy-chain (FTH1). The dif-ferential expression of FTL was also confirmed by real-time PCR. Ferritin is an iron storage protein and plays acentral role in numerous essential cellular functions [27].Ferritin may also affect levels of androstenone through theCYB5/CYP450 electron transfer as the haem-containingcytochrome P450s need to receive electrons, e.g. frominteraction with CYB5 [28], to be activated. 5-aminole-vulinate synthase (ALAS1) is the first and rate-limitingenzyme in the haem biosynthesis pathway, providinghaem for e.g. CYP450s [29]. This gene is up-regulated inDH. The gene ontology results also suggest an importantrole for ferric iron/iron ion binding for the levels ofandrostenone in adipose tissue.
Cytochrome P450 c19 (CYP19) encodes the enzyme aro-matase, which catalyses the synthesis of estrogens fromandrogens. The pig secretes unusually high levels of estro-gens from the testes [30] and is the only mammal known
Gene ontology (GO) results for the molecular function ontologyFigure 2Gene ontology (GO) results for the molecular function ontology. The genes differentially expressed at p < 0.01 were analysed for over-represented GO terms in the molecular function ontology. Some terms were common for Duroc and Nor-wegian Landrace (red) while some were only significant in Norwegian Landrace (blue). Number of genes is the number of genes that was found significantly differentially expressed (p < 0.01) for a term.
Table 3: Results from Real-time PCR
Gene Real-time PCR fold change
ACTB 18S
CYP17A1 2.28 (p = 0.0015) 2.87 (p = 0.001)CYB5 2.24 (p = 0.08) 2.84 (p = 0.025)FTL 1.88 (p = 0.078) 2.58 (p = 0.0026)
EEF1A1 0.95 (p = 0.77) 1.30 (p = 0.23)
Real-time PCR was used to confirm expression variations of selected genes from the microarray study. Normalisation of the values was performed by using ACTB and 18S as control genes. Three of four examined genes were verified and one was contradicted.
Page 8 of 16(page number not for citation purposes)
BMC Genomics 2007, 8:405 http://www.biomedcentral.com/1471-2164/8/405
to express functionally distinct isoforms of this gene [31].Our results show an up-regulation of CYP19A2 isoform inboth NLH and DH boars, whereas the CYP19A1 isoformwas up-regulated in DH. Estrogens are shown to be posi-tively correlated with androstenone levels in fat [32] andestrone sulfate levels in plasma have been found posi-tively correlated with both plasma and fat levels ofandrostenone [33]. SMPD1 is involved in the conversionof sphingomyelin to ceramide, which has been shown toinhibit CYP19 activity through induction of transcriptionfactors [34]. SMPD1 was down-regulated in DH animalsin the microarray study, but we were not able to confirmthis in the rcPCR analyses.
HSD17B4 was found up-regulated for both DH and NLH,in both microarray and rcPCR analyses. The 17β-HSDscatalyse the last step in the formation of androgens andestrogens, and the HSD17B4 inactivates hormones veryefficiently [35]. This has been reported for the substrates17β-estradiol and 5-androstene-3β,17β-diol [36] but theenzyme also accepts other substrates [37]. The enzymeshave previously been assigned to porcine Leydig and Ser-toli cells [38] and porcine tissues express HSD17B4 as apredominant dehydrogenase [39]. Progesterone, a metab-olite of pregnenolone, has been shown to increase porcine
HSD17B4 activity [39] and the progesterone receptormembrane component 1 (PGRMC1) was over-expressedin DH. Another 17β-HSD, isoform 11, also called dehy-drogenase/reductase family member 8 (DHRS8) wasdown-regulated in DH boars.
AKR1C4 belongs to the cytosolic aldo-keto reductases thatact as 3α-/3β-/17β-/20α-hydroxysteroid dehydrogenases(HSDs) in human [40,41] and was highly up-regulated inDH and NLH pigs. This was also confirmed by rcPCR.Penning et al. [36] showed that all the isoforms AKR1C1-AKR1C4 could interconvert active androgens and oestro-gens with their associated inactive metabolites, which pre-vents an excess of circulating steroid hormones and makesthe steroids into substrates for conjugation reactions [40].
Nuclear receptor subfamily 5, group A, member 1(NR5A1), also called steroidogenic factor 1 (SF-1), wasover-expressed in DH boars. This transcription factor isinvolved in the regulation of numerous genes, includingStAR [42], CYP11A [43], CYP17 [44] and CYP19 [45].Also, nuclear receptor co-activator 4 (NCOA4), an andro-gen receptor (AR) activator often referred to as ARA70,was up-regulated in the DH group. The nuclear receptorco-activator 2 (NCOA2), another AR activator, was signif-icantly over-expressed in NLH. Other genes regulatingtranscription and translation that were differentiallyexpressed in this study include class III POU transcriptionfactor (POU3F2), microtubule-associated protein lightchain 3 isoform A (MAP1LC3A) and EEF1A1 which wereup-regulated in the DH and NLH groups, eukaryotic trans-lation elongation factor 1 beta (EEF1B2) which was up-regulated in DH boars, and nuclear receptor subfamily 3,group C, member 2 (NR3C2) which was down-regulatedin DH pigs.
Conjugation reactions contribute to the levels and patternof steroids present in the plasma circulation of the boar.The enzymes involved in conjugation reactions were firstthought to strictly inactivate and eliminate the com-pounds by rendering them more water-soluble. However,
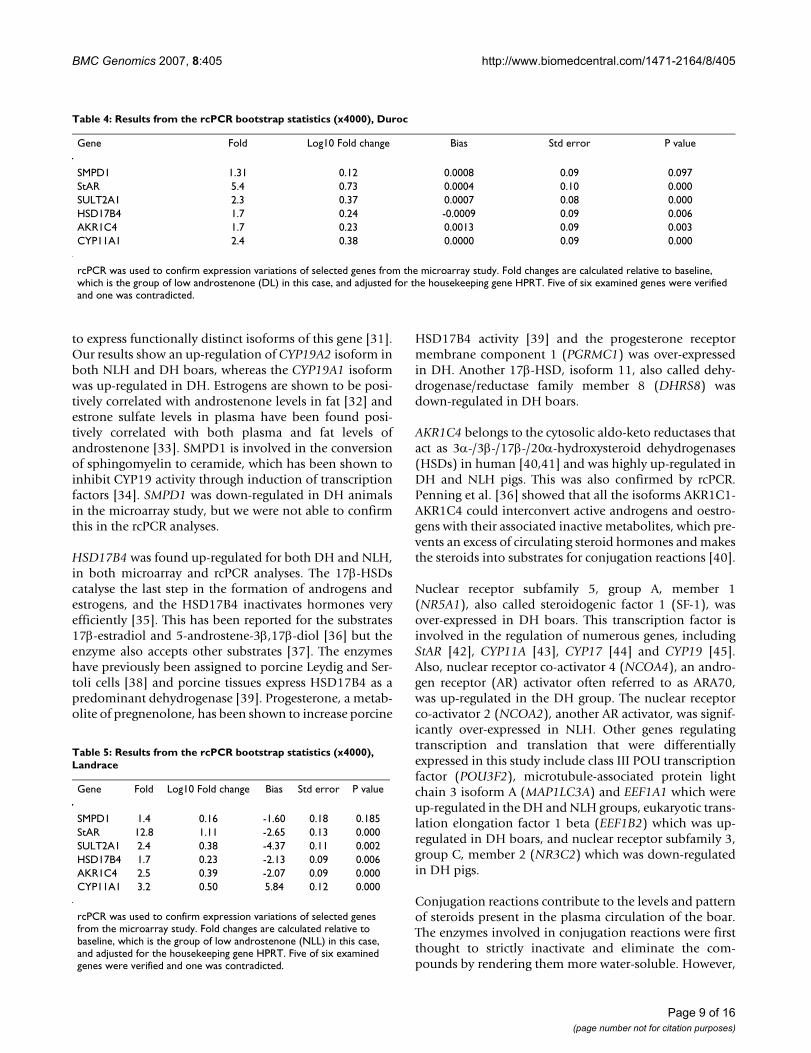
Table 4: Results from the rcPCR bootstrap statistics (x4000), Duroc
Gene Fold Log10 Fold change Bias Std error P value
SMPD1 1.31 0.12 0.0008 0.09 0.097StAR 5.4 0.73 0.0004 0.10 0.000SULT2A1 2.3 0.37 0.0007 0.08 0.000HSD17B4 1.7 0.24 -0.0009 0.09 0.006AKR1C4 1.7 0.23 0.0013 0.09 0.003CYP11A1 2.4 0.38 0.0000 0.09 0.000
rcPCR was used to confirm expression variations of selected genes from the microarray study. Fold changes are calculated relative to baseline, which is the group of low androstenone (DL) in this case, and adjusted for the housekeeping gene HPRT. Five of six examined genes were verified and one was contradicted.
Table 5: Results from the rcPCR bootstrap statistics (x4000), Landrace
Gene Fold Log10 Fold change Bias Std error P value
SMPD1 1.4 0.16 -1.60 0.18 0.185StAR 12.8 1.11 -2.65 0.13 0.000SULT2A1 2.4 0.38 -4.37 0.11 0.002HSD17B4 1.7 0.23 -2.13 0.09 0.006AKR1C4 2.5 0.39 -2.07 0.09 0.000CYP11A1 3.2 0.50 5.84 0.12 0.000
rcPCR was used to confirm expression variations of selected genes from the microarray study. Fold changes are calculated relative to baseline, which is the group of low androstenone (NLL) in this case, and adjusted for the housekeeping gene HPRT. Five of six examined genes were verified and one was contradicted.
Page 9 of 16(page number not for citation purposes)
BMC Genomics 2007, 8:405 http://www.biomedcentral.com/1471-2164/8/405
the high levels of conjugated steroids that are present inthe plasma of the boar may suggest that the biological roleof these reactions is more complex [46,47]. A commonfamily of conjugation enzymes is the sulfotransferases.SULT2A1, also called hydroxysteroid sulfotransferase(HST), was up-regulated in both DH and NLH boars inthe microarray experiment and subsequently confirmedby rcPCR. SULT2A1 is a key sulfotransferase enzyme interms of the 16-androstene steroids, and its activity in thetestis is negatively correlated to androstenone concentra-tions in fat [19,48]. Sulfotransferase family 2 isoform B1(SULT2B1) is also a HST enzyme, showing selectivity forthe conjugation of 3β-hydroxysteroids [49]. The SULT2B1was significantly up-regulated in NLH pigs. The over-expression of the sulfotransferase genes in this study doesnot correspond to the negative correlation to levels ofandrostenone previously reported for this enzyme family[48].
Another conjugation reaction is catalysed by the glutath-ione S-transferases (GSTs). They have been shown to bindhormones [50] and influence their transport, metabolismand action [51]. One isoform of these enzymes (GSTal-pha) is shown to be active in the pig testis Leydig and Ser-toli cells and positively regulated by both estradiol andtestosterone [52]. Glutathione S-transferase omega(GSTO1) and glutathione S-transferase (MGST1) wereover-expressed in DH. These enzymes have not previouslybeen studied in connection with androstenone; however,no correlation was found between fat skatole levels andglutathione S-transferase activity [53].
D and NL show many similar molecular functions andbiological processes in this study, although they also dif-fer with respect to which genes are differentiallyexpressed. [54]. This miscellany might be due to the gen-erally higher androstenone levels observed in D comparedto NL [8]. The variability in the potential for androsten-one production or elimination may to some extent beexplained by breed differences in age at sexual maturity[55]. Differences between D and NL have also beenshown by differential expression of 3β-hydroxysteroiddehydrogenase and SULT2B1 proteins, both enzymes crit-ical for steroid production [54]. The higher number of sig-nificant genes in D compared to NL may be explained bythe more extreme androstenone values in this breed (SeeAdditional file 9: Androstenone values), giving highercontrasts.
In addition to the genes listed, we also identified severalhighly differentially expressed cDNA clones with nohomology to known human or mouse sequences. Furthercharacterisation of these genes may uncover new andunexpected roles in association with androstenone. Theover-expression of for example AKR1C4, SULT2A1 and
SULT2B1 in high androstenone animals does not explaina role for these genes as inactivation enzymes and the roleof these genes needs to be further studied in relation toandrostenone levels. Additional studies of all the genesare necessary to see if their proteins show the same differ-ential expression. Furthermore, identification of singlenucleotide polymorphisms (SNPs) in the genes or in asso-ciation with the genes can be used for breeding purposes.The exact function of genes from interesting gene ontol-ogy pathways, like ferric iron binding, iron ion binding,electron transport activities and oxidoreductase activities,also needs to be clarified.
ConclusionOur study detected differentially expressed genes that arepreviously found to affect androstenone levels in boars, aswell as genes from pathways not formerly described inthis aspect. We confirm the involvement of CYP17 andCYB5 and detect a number of other genes involved in thesteroid hormone pathway that seem to be essential forandrostenone levels. Besides SULT2A1 we identified otherconjugation enzyme genes that might be important,including SULT2B1, AKR1C4, GSTO1, MGST1 andHSD17B4. The genetic profiles identified should be fur-ther examined to clarify their potential as molecular mark-ers for reduced boar taint.
MethodsAnimalsD and NL boars from NORSVIN's three boar testing sta-tions were included in this study. The D and NL boarswere on average 143 and 156 days at 100 kg live weight,respectively, and were slaughtered on average 14 dayslater. Tissue samples from testicle were frozen in liquid N2and stored at -80°C until used for RNA isolation asdescribed below. Fat samples were collected from the neckand stored at -20°C until used for androstenone measure-ments. Androstenone levels in fat were analysed by amodified time-resolved fluoroimmunoassay [56] usingantiserum produced at the Norwegian School of Veteri-nary Science (NVH) [57]. A total of 1533 NL boars and1027 D boars were analysed and statistical power calcula-tions showed that selecting animals from each tail of theandrostenone distribution was an effective way of obtain-ing high probability of finding differentially expressedgenes with limited number of arrays. The power calcula-tions suggested 30 arrays to be sufficient. Hence, for eachbreed, the 30 most extreme boars from each tail of the dis-tribution were selected from all of the phenotyped ani-mals (See Additional file 9: Androstenone values). Inorder to reduce family effects a maximum of two andthree half sibs were chosen from NL and D, respectively.The same animals were used for verification of selectedgenes by rcPCR. Only D pigs were included in the realtime PCR analysis.
Page 10 of 16(page number not for citation purposes)
BMC Genomics 2007, 8:405 http://www.biomedcentral.com/1471-2164/8/405
Expression profiling using microarraysThe microarrays (UltraGAPS coated slides, Corning Incor-porated, MA, USA) were produced at the Faculty of Agri-cultural Sciences, Aarhus University and contained 27,774cDNA clones printed in duplicates [58]. Out of these,26,877 were PCR products amplified from cDNA clonesand 867 were control DNA fragments. Of the 26.877cDNAs, 21.417 map to 15.831 human gene transcript IDscorresponding to roughly 1.35 cDNAs per gene transcript.The remaining 5.460 cDNAs were thus estimated to coveraround 4.036 gene transcripts yielding 19.867 gene tran-scripts in total. The annotation was done using NCBI Ref-erence Sequence (RefSeq) database Release 11. The cDNAclones originated from the Sino-Danish sequencingproject, covering 0.66× of the pig genome [59]. A moredetailed description of the microarray can be found at theNCBI Gene Expression Omnibus (GEO [60]) databaseusing the platform accession number GPL3608.
Total RNA for microarray studies and real-time PCR wereextracted from testicle tissue using the RNeasy midi kitaccording to the manufacturer's instruction (Qiagen, CA,USA). Quantities were measured using a NanoDrop ND-1000 Spectrophotometer (NanoDrop Technologies, DE,USA) and qualities were examined by the 28S:18S rRNAratio using the RNA 6000 Nano LabChip® Kit on 2100Bioanalyzer (Agilent Technologies, CA, USA). Aminoallyl-cDNA was synthesised from 20 µg of total RNA using theSuperScript indirect cDNA labelling system (InvitrogenCorporation, CA, USA) and labelled using ARES AlexaFluor 488 or 594 labelling kit (Molecular Probes, OR,USA). Half of the samples were labelled with one dye andthe other half with the other dye facilitating a direct bal-anced block hybridisation design, where the dye swap isbalanced between the samples. As the animals are selectedfrom a very large number of boars and the contrastbetween the two groups is extremely large, animals withineach of the experimental group were treated as equal. Wehave prioritised a larger number of animals instead ofhybridising all animals twice (with a dye swap), as weexpect the biological variation to be greater than the tech-nical variation. It may be noted that our experimentaldesign eliminates the dye bias in the contrast 'high' versus'low' androstenone, since SUM('high expressions')/30minus SUM('low expressions')/30 is (30*H + 15*R +15*G)/30 - (30*H + 15*R + 15*G)/30 = H - L, where H(L) denotes effect of high (low) androstenone, R (G)denotes the effect of red (green) dye and 30 is the numberof arrays. Spike-in RNA from the Lucidea Universal Score-Card (Amersham Biosciences) was added to the cDNAreactions. "Green" spike-in RNA was added to the sampleslabelled with Alexa-594 and "red" spike-in RNA wasadded to the samples labelled with Alexa-488. Purifica-tion of the amino-modified and fluorescently labelledcDNA was done using the NucleoSpin 96 Extract II PCR
Clean-up kit (Macherey-Nagel, Düren, Germany), and ahybridization blocker (Invitrogen Corporation, CA, USA)containing polydA (Invitrogen Corporation, CA, USA)and Yeast tRNA (Invitrogen Corporation, CA, USA) wasadded. Each microarray was hybridised with one high andone low androstenone sample from the same breed, giv-ing a total of 30 arrays for each breed. The high and lowsamples were paired randomly within each breed. Hybrid-isation was conducted in a Discovery XT hybridisation sta-tion (Ventana Discovery Systems, AZ, USA), followed bya manual wash and drying by centrifugation. Moredetailed descriptions of the microarray experiments areavailable at the GEO database through the series accessionnumber GSE 7409.
The microarrays were scanned using a ScanArray Expressscanner (Perkin Elmer Inc., MA, USA). Signal intensitieswere quantified using the ScanArray Express software andfurther analysis carried out in R version 2.2.1 [61] soft-ware package Linear Models for Microarray Analysis(Limma version 2.7.2) [62-64]. Mean foreground intensi-ties were background corrected using the Edwards method[65] implemented in Limma using the median back-ground intensities, and log-ratios were printtip loess nor-malised within arrays. The duplicate correlation functionin Limma was used to consider the duplicate printing ofeach feature. As a quality check, MA-plots (M = log2594/log2488, A = (log2594 + log2488)/2), image plots and boxplots were constructed using the Limma tools for visuali-sation of the data before and after normalisation. Forassessing differential expression, Limma uses linear mod-els in combination with an empirical Bayes method tomoderate the standard errors of the estimated log-foldchanges. The nominal p-values were corrected for multi-ple testing by false discovery rates (FDR) using Benjaminiand Hochberg approach [66] and adjusted p-values < 0.01were considered significant.
Since the Limma statistic provides a parametric test, itmight be affected by outlier records. Therefore, we alsoconducted a more robust, but less powerful non-paramet-ric test, namely Fisher's Sign Test (FST) [67].
The features of the arrays were mapped to a LocusLinkidentifier and an annotation package was built using theBioconductor package AnnBuilder (version 1.9.14). Testsfor significantly overrepresentation of GO terms (p < 0.01and more than 10 significant genes) were conducted usingthe GOHyperG function of the Bioconductor packageGOstats (version 1.6.0) [68,69].
Quantitative rcPCR analysis and quantitative real-time RT-PCR analysesA real competitive (rc) PCR gene expression analysis wasused to verify some of the results from the microarray
Page 11 of 16(page number not for citation purposes)
BMC Genomics 2007, 8:405 http://www.biomedcentral.com/1471-2164/8/405
study. The method is build upon the MassARRAY meth-odology using the Quantitative Gene Expression (QGE)iPLEX system (Sequenom, CA, USA). Total RNA was iso-lated from testes by using the automatic DNA/RNA extrac-tor (BioRobot M48 workstation; Qiagen; CA, USA) andfirst strand cDNA synthesis was conducted on 0.5 µg totalRNA using SuperScript™-II Rnase H- Reverse Transcriptase(Invitrogen, Carlsbad, CA, USA). Purified total RNA wastreated with TURBO DNA-free™ (Ambion, Huntingdon,UK) for removal of contaminating DNA. Assay designs forthe genes included in this study (See Additional file 10:Gene transcripts included in the rcPCR analyses) weremultiplexed into a single reaction using MassARRAY QGEAssay Design software (Sequenom, CA, USA). The com-petitors, a synthetic DNA molecule that matched thesequence of the targeted cDNA region at all positionsexcept for one single base served as an internal standardfor each transcript. A 10-fold dilution of competitor wasinitially used over a wide range of concentrations to deter-mine an approximate equivalence point, followed by a 7-fold dilution of competitor from 4.04 × 10⁻¹¹ to 1.43 × 10-
19 to achieve more accurate results. The cDNA and com-petitor were co-amplified in the same PCR reaction withthe conditions 95°C for 15 minutes, 45 cycles each of95°C for 20 second, 56°C for 30 seconds and 72°C for 1minute, and finally 72°C for 3 minutes. After a clean-upstep to remove unincorporated nucleotides, the PCRproducts served as templates for the primer extensionreaction. The iPLEX reaction cocktail mix and PCR condi-tions were done as described in the Sequenom applicationguide [70]. Parallel PCR-reactions were performed for allsamples and each of the products was printed with 2 rep-licates on a SpectroCHIP. The primer extension reactiongenerates distinct mass signals for competitor and cDNA-derived products, and mass spectrometric analysis gener-ated signals from which the peak areas were calculated.
Because of collaborative reasons between two labs,another verification method used for the D boars wasquantitative real-time PCR. Gene specific primers for fourselected genes were generated from the Primer 3 software(See Additional file 11: Real-time PCR primers). PorcineACTB and 18S rRNA amplifier set probes were used asendogenous control for normalisation. The gene ACTBwas detected by Taqman probe whereas other genes weredetected by SYBR Green probes. The same Duroc RNAsamples as the ones used for the microarray experimentswere applied. The RNA was synthesised into first-strandcDNA using SuperScript II Reverse Transcriptase (Invitro-gen Corporation, CA, USA). The real-time PCR reactionwas composed of 5 µL of Taqman master mix, 2 µL cDNA,0.3 µL of forward and reverse primers (10 µM) and 0.05µL of probe (10 µM). The real-time cycler conditions were50°C for 2 minutes, 95°C for 10 minutes and 40 cycleseach of 95°C for 15 seconds and annealing/extension at
60°C for 1 minute. Each reaction was conducted in tripli-cate on each individual sample with ACTB and 18S rRNAamplified as internal control genes. The real-time PCRamplification was performed using ABI PRISM 7900 HTsequence detection system. A cycle threshold value (CT)was recorded for each sample and a standard curve madefrom 4×, 2×, 1×, 0.5×, 0.125× and 0.0625× was used tocalculate the relative mRNA levels.
In the rcPCR study, the gene expression levels of H and Landrostenone boars were analysed using the softwareTITAN version 1.0–13 [71] that runs in the R statisticalenvironment. The raw data from the Genotype AnalyzerSoftware (Sequenom) was imported into TITAN and ana-lysed using the default values of linear least squares poly-nomial regression with 4000 bootstrap replicates. ThecDNA concentrations were corrected with respect to thehousekeeping gene (HPRT), and p-values and confidenceintervals for the fold changes were calculated. Detailsabout the TITAN software are available at web [72].
Quantification of the real-time PCR amplification wasperformed using ABI PRISM 7900 HT sequence detectionsystem. The standard curve method was used to calculatethe relative mRNA levels.
List of abbreviationsDH, Duroc High androstenone, NLH, Norwegian Lan-drace High androstenone, DL, Duroc Low androstenone,NLL, Norwegian Landrace Low androstenone, ACTB, β-actin, AKR1C1, Aldo-keto reductase family 1, member C1,AKR1C4, Aldo-keto reductase family 1, member C4,ALAS1, 5-aminolevulinate synthase, AR, androgen recep-tor, ARA70, androgen receptor, CYB5, Cytochrome b5,CYP11A1, Cytochrome P450, subfamily XIA, polypeptide1, CYP17, Cytochrome P450 c17, CYP19, CytochromeP450 c19, CYP51, Cytochrome P450 51, DHRS8, Dehy-drogenase/reductase family member 8, DMAPP, Dimeth-ylallyl diphosphate, EBP, Emopamit-binding protein,EEF1A1, Translation elongation factor 1 alpha 1, EEF1B2,Translation elongation factor 1 beta 2, FDX1, Ferredoxin,FTH1, Ferritin heavy-chain, FTL, Ferritin light polypep-tide, FST, Fisher's sign test, GO, Gene ontology, GSTO1,Glutathione S-transferase omega, HPRT, Hypoxanthineguanine phosphoribosyltransferase 1, HSDs, Hydroxys-teroid dehydrogenases, HSD17B4, 17-beta-Hydroxyster-oid dehydrogenase IV, HST, Hydroxysteroidsulfotransferase, IDI1, Isopentenyl-diphosphate delta iso-merase, IPP, Isopentenyl diphosphate, limma, linearmodels for microarray analysis, MAP1LC3A, Microtubule-associated protein light chain 3 isoform A, MGST1, Glu-tathione S-transferase, NCOA2, Nuclear receptor co-acti-vator 2, NCOA4, Nuclear receptor co-activator 4, NR3C2,nuclear receptor subfamily 3, group C, member 2, NR5A1,Nuclear receptor subfamily 5 group A member 1,
Page 12 of 16(page number not for citation purposes)
BMC Genomics 2007, 8:405 http://www.biomedcentral.com/1471-2164/8/405
PGRMC1, Progesterone receptor membrane component1, POU3F2, Class III POU transcription factor, rcPCR, realcompetitive PCR, SC4MOL, Sterol-C4-methyl oxidase iso-form 1, SF-1, Steroidogenic factor 1, SMPD1, Sphingo-myrlin phosphodiesterase 1, SNPs, single nucleotidepolymorphisms, StAR, Steroidogenic acute regulatoryprotein, SULT, Sulfotransferase, SULT2A1, Sulfotrans-ferase family 2A, dehydroepiandrosterone-preferring,member 1, SULT2B1, Sulfotransferase family 2A, dehy-droepiandrosterone-preffering member 1
Authors' contributionsMM carried out microarray molecular work, performedstatistical analysis and drafted the paper. TM was involvedin power calculations, performing statistical analysis andcontributed to the paper. SL was involved in planning theproject and writing the paper. CB was involved in plan-ning the project and in charge of the lab facilities perform-ing the microarray studies. XW carried out the real-timePCR work. LNC was involved in the microarray molecularwork. IB was involved in statistical analysis. EG coordi-nated the study, was involved in planning the project, car-ried out rcPCR molecular work, and contributed towriting the paper. All authors have read and approved thefinal manuscript.
Additional material
Additional file 1Boxplot of the arrays. Boxplots displaying the average log2-ratio distribu-tion of raw background corrected log ratios and printtiploess normalised log ratios for the Duroc (a and c, respectively) and Norwegian Landrace (b and d, respectively) arrays. After within array normalisation, the log ratios were evenly distributed around 0, indicating no need for between array normalisation.Click here for file[http://www.biomedcentral.com/content/supplementary/1471-2164-8-405-S1.png]
Additional file 2Microarray results analysed using Limma, Duroc. Gene profiling was done using 30 arrays and the cut-off for differentially expressed genes was a p-value of 0.01 after FDR correction. A positive t-statistics indicates up-regulation in animals with high androstenone values and vice versa. M-values are fold changes. The clone names are sequences with a hit to human, mouse or pig genes. Some genes are represented by several differ-ent clones on the array and may therefore show up more than once in the table, while some have no hits to the abovementioned species.Click here for file[http://www.biomedcentral.com/content/supplementary/1471-2164-8-405-S2.txt]
Additional file 3Microarray results analysed using Limma, Norwegian Landrace. Gene profiling was done using 30 arrays and the cut-off for differentially expressed genes was a p-value of 0.01 after FDR correction. A positive t-statistics indicates up-regulation in animals with high androstenone val-ues and vice versa. M-values are fold changes. The clone names are sequences with a hit to human, mouse or pig genes. Some genes are rep-resented by several different clones on the array and may therefore show up more than once in the table, while some have no hits to the abovemen-tioned species.Click here for file[http://www.biomedcentral.com/content/supplementary/1471-2164-8-405-S3.txt]
Additional file 4Genes common for Duroc and Norwegian Landrace at p < 0.01. There were 72 genes in common for Duroc and Landrace at significance level p < 0.01.Click here for file[http://www.biomedcentral.com/content/supplementary/1471-2164-8-405-S4.xls]
Additional file 5Microarray results analysed using Fisher's sign test, Duroc. Gene pro-filing was done using 30 arrays and the cut-off for differentially expressed genes was a FDR of 0.01. A -1 indicates up-regulation, while a 1 indicates down-regulation in boars with high androstenone levels. The clone names are sequences with a hit to human, mouse or pig genes. Some genes are represented by several different clones on the array and may therefore show up more than once in the table, while some have no hits to the above-mentioned species.Click here for file[http://www.biomedcentral.com/content/supplementary/1471-2164-8-405-S5.txt]
Additional file 6Microarray results analysed using Fisher's sign test, Norwegian Lan-drace. Gene profiling was done using 30 arrays and the cut-off for differ-entially expressed genes was a FDR of 0.05. A -1 indicates up-regulation, while a 1 indicates down-regulation in boars with high androstenone lev-els. The clone names are sequences with a hit to human, mouse or pig genes. Some genes are represented by several different clones on the array and may therefore show up more than once in the table, while some have no hits to the abovementioned species.Click here for file[http://www.biomedcentral.com/content/supplementary/1471-2164-8-405-S6.txt]
Additional file 7Gene ontology (GO) results for the cellular component ontology, Duroc. The genes differentially expressed at p < 0.01 in Duroc were ana-lysed for over-represented GO terms in the cellular component ontology (p < 0.01).Click here for file[http://www.biomedcentral.com/content/supplementary/1471-2164-8-405-S7.txt]
Page 13 of 16(page number not for citation purposes)
BMC Genomics 2007, 8:405 http://www.biomedcentral.com/1471-2164/8/405
AcknowledgementsThe microarrays were constructed at the Faculty of Agricultural Sciences (DJF), University of Aarhus, and the work was financed by the Norwegian pig breeders association (NORSVIN) and The Research Council of Nor-way. Work at DJF was supported by the EU-project SABRE. We want to thank Elin Bergseth at NORSVIN for collecting samples, Dr. Peter Sørensen, Dr. Jakob Hedegaard, Henrik Hornshøj and Helle Jensen at the microarray platform at Aarhus University for kind assistance, Dr. Paul Oeth at Sequenom for performing the rcPCR primer design and Dr. Rebecca-Ayme Cue for valuable help with English grammar.
References1. Babol J, Squires EJ, Lundström K: Relationship between oxidation
and conjugation metabolism of skatole in pig liver and con-centrations of skatole in fat. Journal of Animal Science 1998,76:829-838.
2. Dijksterhuis GB, Engel B, Walstra P, Font i Furnols M, Agerhem H,Fischer K, Oliver MA, Claudi-Magnussen C, Siret F, Bèague MP,Homer DB, Bonneau M: An international study on the impor-tance of androstenone and skatole for boar taint: II. Sensoryevaluation by trained panels in seven European countries.Meat Science 2000, 54:261-269.
3. Vold E: Fleischproduktionseigenschaften bei ebern und kas-traten. Meldinger fra Norges Landbrukshøgskole 1970, 49:1-25.
4. Patterson RLS: 5alpha-androst-16-ene-3-one: - Compoundresponsible for taint in boar fat. Journal of the Science of Food andAgriculture 1968, 19:.
5. Sellier P, Le Roy P, Fouilloux MN, Gruand J, Bonneau M: Responsesto restricted index selection and genetic parameters for fatandrostenone level and sexual maturity status of youngboars. Livestock Production Science 2000, 63:265-274.
6. Varona L, Vidal O, Quintanilla R, Gil.M., Sànches A, Folch JM, HortosM, Ruis MA, Amills M, Noguera.J.L.: Bayesian analysis of quantita-tive trait loci for boar taint in a landrace outbred population.Journal of animal science 2005, 83:301-307.
7. Willeke H: Possibilities of breeding for low 5a-androstenonecontent in pigs. Pig News and Information 1993, 14:31N-3.
8. Prevention of boar taint in pig production. Abstracts of the19th Symposium of the Nordic Committee for VeterinaryScientific Cooperation, Gardermoen, Norway, 21-22November 2005. Acta Vet Scand 2005, 48 Suppl 1:P1-S16.
9. Perry GC, Patterson RLS, MacFie HJH, Stinson CG: Pig courtshipbehaviour: pheromonal property of androstene steroids inmale submaxillary secretion. Animal production 1980,31:191-199.
10. Reed HCB, Melrose DR, Patterson RLS: Androgen steroids as anaid to the detection of oestrus in pig artificial insemination.British Veterinary Journal 1974, 130:61-67.
11. Brooks RI, Pearson AM: Steroid hormone pathways in the pig,with special emphasis on boar odor: a review. Journal of animalscience 1986, 62:632-645.
12. Katkov T, Gower DB: The biosynthesis of androst-16-enes inboar testis tissue. Biochemical journal 1970, 117:533-538.
13. Meadus WJ, Mason JI, Squires EJ: Cytochrome P450c17 from por-cine and bovine adrenal catalyses the formation of 5,16-androstadien-3 beta-ol from pregnenolone in the presenceof cytochrome b5. Journal Steroid Biochem Mol Biol 1993,46(5):565-572.
14. Davis SM, Squires EJ: Association of cytochrome b5 with 16-androstene steroid synthesis in the testis and accumulationin the fat of male pigs. Journal of animal science 1999,77:1230-1235.
15. Lin Z, Lou Y, Squires EJ: Identification of a single nucleotide pol-ymorphism in porcine testis cytochrome P450-c17 (CYP17)and its effect on steroidogenesis. Biochemical genetics 2005,43:531-542.
16. Lin Z, Lou Y, Peacock J, Squires EJ: A novel polymorphism in the5' untranslated region of the porcine cytochrome b5 (CYB5)gene is associated with decreased fat androstenone level.Mammalian genome 2005, 16:367-373.
17. Glatt H, Meinl W: Pharmacogenetics of soluble sulfotrans-ferases (SULTs). Naunyn-Schmiedeberg's Archives of Pharmacology2004, 369:55-68.
18. Sinclair PA, Squires EJ, Raeside JI, Renaud R: Synthesis of free andsulphoconjugated 16-androstene steroids by the Leydig cellsof the mature domestic boar. J Steroid Biochem Mol Biol 2005,96(2):217-228.
19. Sinclair PA, Squires EJ: Testicular sulfoconjugation of the 16-androstene steroids by hydroxysteroid sulfotransferase: itseffect on the concentration of 5alpha-androstenone inplasma and fat of the mature domestic boar. Journal of animalscience 2005, 83:358-365.
20. Xue J, Dial GD, Holton EE, Vickers Z, Squires EJ, Lou Y, Godbout D,Morel N: Breed differences in boar taint: relationshipbetween tissue levels of boar taint compounds and sensoryanalysis of taint. Journal of animal science 1996, 74:2170-2177.
21. Christenson LK, Strauss JF 3rd: Steroidogenic acute regulatoryprotein (StAR) and the intramitochondrial translocation ofcholesterol. Biochim Biophys Acta 2000, 1529(1–3):175-187.
22. Grinberg AV, Hannemann F, Schiffler B, Müller J, Heinemann U, Bern-hardt R: Adrenodoxin: Structure, stability, and electrontransfer properties. Proteins 2000, 40(4):590-612.
23. Schiffler B, Zöllner A, Bernhardt R: Stripping down the mito-chondrial cholesterol hydroxylase system, a kinetics study.The Journal of Biological Chemistry 2004, 279:34269-34276.
24. Debeljak N, Fink M, Rozman D: Many facets of mammalianlanosterol 14alpha-demethylase from the evolutionarily con-served cytochrome P450 family CYP51. Arch Biochem Biophys2003, 409(1):159-171.
25. Silve S, Dupuy PH, Labit-Lebouteiller C, Kaghad M, Chalon P, RahierA, Taton M, Lupker J, Shire D, Loison G: Emopamil-binding pro-tein, a mammalian protein that binds a series of structurallydiverse neuroprotective agents, exhibits delta8-delta7 sterolisomerase activity in yeast. The Journal of Biological Chemistry1996, 271:22434-22440.
Additional file 8Gene ontology (GO) results for the cellular component ontology, Nor-wegian Landrace. The genes differentially expressed at p < 0.01 in Duroc were analysed for over-represented GO terms in the cellular component ontology (p < 0.01).Click here for file[http://www.biomedcentral.com/content/supplementary/1471-2164-8-405-S8.txt]
Additional file 9Androstenone values. Animals were paired randomly between the high and low androstenone groups within each breed. The androstenone values (µg/g) in Duroc high (DH), Duroc low (DL), Norwegian Landrace high (NLH) and Norwegian Landrace low (NLL) animals are shown.Click here for file[http://www.biomedcentral.com/content/supplementary/1471-2164-8-405-S9.doc]
Additional file 10Gene transcripts included in the rcPCR analyses.Click here for file[http://www.biomedcentral.com/content/supplementary/1471-2164-8-405-S10.doc]
Additional file 11Real-time PCR primers. Primers designed to test four selected genes using quantitative real-time RT-PCR.Click here for file[http://www.biomedcentral.com/content/supplementary/1471-2164-8-405-S11.doc]
Page 14 of 16(page number not for citation purposes)
http://www.ncbi.nlm.nih.gov/entrez/query.fcgi?cmd=Retrieve&db=PubMed&dopt=Abstract&list_uids=9535344
http://www.ncbi.nlm.nih.gov/entrez/query.fcgi?cmd=Retrieve&db=PubMed&dopt=Abstract&list_uids=9535344
http://www.ncbi.nlm.nih.gov/entrez/query.fcgi?cmd=Retrieve&db=PubMed&dopt=Abstract&list_uids=9535344
http://www.ncbi.nlm.nih.gov/entrez/query.fcgi?cmd=Retrieve&db=PubMed&dopt=Abstract&list_uids=4856526
http://www.ncbi.nlm.nih.gov/entrez/query.fcgi?cmd=Retrieve&db=PubMed&dopt=Abstract&list_uids=4856526
http://www.ncbi.nlm.nih.gov/entrez/query.fcgi?cmd=Retrieve&db=PubMed&dopt=Abstract&list_uids=3516959
http://www.ncbi.nlm.nih.gov/entrez/query.fcgi?cmd=Retrieve&db=PubMed&dopt=Abstract&list_uids=3516959
http://www.ncbi.nlm.nih.gov/entrez/query.fcgi?cmd=Retrieve&db=PubMed&dopt=Abstract&list_uids=4392931
http://www.ncbi.nlm.nih.gov/entrez/query.fcgi?cmd=Retrieve&db=PubMed&dopt=Abstract&list_uids=4392931
http://www.ncbi.nlm.nih.gov/entrez/query.fcgi?cmd=Retrieve&db=PubMed&dopt=Abstract&list_uids=8880419
http://www.ncbi.nlm.nih.gov/entrez/query.fcgi?cmd=Retrieve&db=PubMed&dopt=Abstract&list_uids=8880419
http://www.ncbi.nlm.nih.gov/entrez/query.fcgi?cmd=Retrieve&db=PubMed&dopt=Abstract&list_uids=8880419
http://www.ncbi.nlm.nih.gov/entrez/query.fcgi?cmd=Retrieve&db=PubMed&dopt=Abstract&list_uids=8798407

BMC Genomics 2007, 8:405 http://www.biomedcentral.com/1471-2164/8/405
26. Miller WL, Gaylor JL: Investigation of the component reactionsof oxidative sterol demethylation. The Journal of Biological Chem-istry 1970, 245:5369-5374.
27. Hentze MW, Kühn LC: Molecular control of vertebrate ironmetabolism: mRNA-based regulatory circuits operated byiron, nitric oxide, and oxidative stress. Proc Natl Acad Sci U S A1996, 93(16):8175-8182.
28. Bonfils C, Balny C, Maurel P: Direct evidence for electron trans-fer from ferrous cytochrome b5 to the oxyferrous interme-diate of liver microsomal cytochrome P-450 LM2. Journal ofbiological chemistry 1981, 256:9457-9465.
29. Fraser DJ, Zumsteg A, Meyer UA: Nuclear receptors constitutiveandrostane receptor and pregnane X receptor activate adrug-responsive enhancer of the murine 5-aminolevulinicacid synthase gene. The Journal of Biological Chemistry 2003,278:39392-39401.
30. Claus R, Hoffman B: Oestrogens, compared to other steroids oftesticular origin, in bloodplasma of boars. Acta Endocrinologica1980, 94:404-411.
31. Corbin CJ, Khalil MW, Conley AJ: Functional ovarian and placen-tal isoforms of porcine aromatase. Mol Cell Endocrinol 1995,113(1):29-37.
32. Squires EJ, Gullett EA, Fisher KRS, Partlow GD: Comparison ofandrost-16-ene steroid levels determined by a colorimetricassay with boar taint estimated by a trained sensory panel.Journal of animal science 1991, 69:1092-1100.
33. Babol J, Squires EJ, Lundstrom K: Relationship between metabo-lism of androstenone and skatole in intact male pigs. J AnimSci 1999, 77:84-92.
34. Santana P, Llanes L, Hernandez I, Gallardo G, Quintana J, Gonzales J,Estevez F, Ruiz de Galarreta C, Fanjul LF: Ceramide mediatestumor necrosis factor effects on P450-aromatase activity incultured granulosa cells. Endocrinology 1995, 136:2345-2348.
35. Adamski J, Normand T, Leenders F, Monte D, Begue A, Stehelin D,Jungblut PW, de Launoit Y: Molecular cloning of a novel videlyexpressed human 80 kDa 17b-hydroxysteroid dehydroge-nase IV. Biochemical journal 1995, 311:437-443.
36. Adamski J, Husen B, Marks F, Jungblut PW: Purification and prop-erties of oestradiol 17b-dehydrogenase extracted from cyto-plasmic vesicles of porcine endometrial cells. Biochemicaljournal 1992, 288:375-381.
37. de Launoit Y, Adamski J: Unique multifunctional HSD17B4 geneproduct: 17b-hydroxysteroid dehydrogenase 4 and D-3-hydroxyacyl-coenzyme A dehydrogenase/hydratase involvedin Zellweger syndrome. Journal of Molecular Endocrinology 1999,22:227-240.
38. Carstensen JF, Tesdorpf JG, Kaufmann M, Markus MM, Husen B,Leenders F, Jakob F, de Launoit Y, Adamski J: Characterization of17 beta-hydroxysteroid dehydrogenase IV. Journal of endocrinol-ogy 1996, 150:.
39. Kaufmann M, Carstensen J, Husen B, Adamski J: The tissue distri-bution of porcine 17b-estradiol dehydrogenase and its induc-tion by progesterone. J Steroid Biochem Mol Biol 1995, 55(5–6):535-539.
40. Penning TM, Burczynski ME, Jez JM, Hung C, Lin H, Ma H, Moore M,Palackal N, Ratnam K: Human 3alpha-hydroxysteroid dehydro-genase isoforms (AKR1C1-AKR1C4) of the aldo-ketoreductase superfamily: functional plasticity and tissue distri-bution reveals roles in the inactivation and formation ofmale and female sex hormones. Biochemical journal 2000,351:67-77.
41. Steckelbroeck S, Jin Y, Gopishetty S, Oyesanmi B, Penning TM:Human cytosolic 3alpha-hydroxysteroid dehydrogenases ofthe aldo-keto reductase superfamily display significant3beta-hydroxysteroid dehydrogenase activity. Implicationsfor steroid hormone metabolism and action. Journal of biologi-cal chemistry 2004, 279:10784-10795.
42. Sugawara T, Kiriakidu M, McAllister JM, Kallen CB, Strauss III JF: Mul-tiple steroidogenic factor 1 binding elements in the humansteroidogenic acute regulatory protein gene 5'-flankingregion are required for maximal promoter activity and cyclicAMP responsiveness. Biochemistry 1997, 36:7249-7255.
43. Clemens JW, Lala DS, Parker KL, Richards JS: Steroidogenic fac-tor-1 binding and transcriptional activity of the cholesterolside-chain cleavage promoter in rat granulosa cells. Endo-crinology 1994, 134:1499-1508.
44. Bakke M, Lund J: Mutually exclusive interactions of two nuclearorphan receptors determine activity of a cyclic adenosine3',5'-monophosphate-responsive sequence in the bovineCYP17 gene. Molecular endocrinology 1995, 9:327-339.
45. Fitzpatrick SL, Richards JS: Cis-acting elements of the rat aro-matase promoter required for cyclic adenosine 3',5'-mono-phosphate induction in ovarian granulosa cells andconstitutive expression in R2C Leydig cells. Molecular endo-crinology 1993, 7:341-354.
46. Coughtrie MWH, Sharp S, Maxwell K, Innes NP: Biology and func-tion of the reversible sulfation pathway catalysed by humansulfotransferases and sulfatases. Chemico-biological interactions1998, 109:3-27.
47. Sinclair PA, Squires EJ, Raeside JI, Renaud R: Synthesis of free andsulphoconjugated 16-androstene steroids by the Leydig cellsof the mature domestic boar. J Steroid Biochem Mol Biol 2005,96(2):217-228.
48. Sinclair PA, Gilmore WJ, Lin Z, Lou Y, Squires EJ: Molecular cloningand regulation of porcine SULT2A1: relationship betweenSULT2A1 expression and sulfoconjugation of androstenone.Journal of Molecular Endocrinology 2006, 36:301-311.
49. Meloche CA, Falany CN: Expression and characterization of thehuman 3 beta-hydroxysteroid sulfotransferases (SULT2B1aand SULT2B1b). J Steroid Biochem Mol Biol 2001, 77(4–5):261-269.
50. Listowsky I, Abramovitz M, Homma H, Niitsu Y: Intracellular bind-ing and transport of hormones and xenobiotics by glutath-ione S-transferase. Drug metabolism reviews 1988, 19:305-318.
51. Homma H, Listowsky I: Identification of Yb-glutathione-S-transferase as a major rat liver protein labeled with dexam-ethasone 21-methanesulfonate. Proc Natl Acad Sci U S A 1985,82(21):7165-7169.
52. Benbrahim-Tallaa L, Tabone E, Tosser-Klopp G, Hatey F, BenahmedM: Glutathione S-transferase alpha expressed in porcine ser-toli cells is under the control of follicle-stimulating hormoneand testosterone. Biology of reproduction 2002, 66:1734-1742.
53. Diaz GJ, Squires EJ: Phase II in vitro metabolism of 3-methylin-dole metabolites in porcine liver. Xenobiotica 2003, 33:485-498.
54. Moe M, Grindflek E, Doran O: Expression of 3beta-hydroxyster-oid dehydrogenase, cytochrome P450-c17, and sulfotrans-ferase 2B1 proteins in liver and testis of pigs of two breeds:relationship with adipose tissue androstenone concentra-tion. J Anim Sci 2007, 85(11):2924-2931.
55. Christenson RK, Ford JJ: Puberty and estrus in confinement-reared gilts. Journal of animal science 1979, 49:743-751.
56. Tuomola M, Harpio R, Knuuttila P, Mikola H, Løvgren T: Time-resolved fluoroimmunoassay for the measurement ofandrostenone in porcine serum and fat samples. Journal of Agri-cultural Food Chemistry 1997, 45:3529-3534.
57. Andresen O: Development of a radioimmunoassay for 5alpha-androst-16-en-3-one in pig peripheral plasma. ActaEndocrinol (Copenh) 1974, 76(2):377-387.
58. Gorodkin J, Cirera S, Hedegaard J, Gilchrist MJ, Panitz F, Jorgensen C,Scheibye-Knudsen K, Arvin T, Lumholdt S, Sawera M, Green T,Nielsen BJ, Havgaard JH, Rosenkilde C, Wang J, Li H, Li R, Liu B, HuS, Dong W, Li W, Yu J, Wang J, Staefeldt HH, Wernersson R, MadsenLB, Thomsen B, Hornshoj H, Bujie Z, Wang X, Wang X, Bolund L,Brunak S, Yang H, Bendixen C, Fredholm M: Porcine transcrip-tome analysis based on 97 non-normalized cDNA librariesand assembly of 1,021,891 expressed sequence tags. GenomeBiol 2007, 8:R45.
59. Wernersson R, Schierup RH, Jørgensen FG, Gorodkin J, Panitz F,Staerfeldt HH, Christensen OF, Mailund T, Hornshøj H, Klein A,Wang J, Liu B, Hu S, Dong W, Li W, Wong GK, Yu J, Wang J, BendixenC, Fredholm M, Brunak.S., Yang H, Bolund L: Pigs in sequencespace: a 0.66X pig genome survey based on shotgunsequencing. BMC Genomics 2005, 6:.
60. 2007 [http://www.ncbi.nlm.nih.gov/geo/].61. Ihaka R, Gentleman R: R: A language for data analysis and
graphics. Journal of Computational and Graphical Statistics 1996,5:299-314.
62. Smyth GK: Linear models and empirical bayes methods forassessing differential expression in microarray experiments.Stat Appl Genet Mol Biol 2004, 3:Article3. Epub
63. Smyth GK, Speed TP: Normalization of cDNA microarray data.Methods 2003, 31:265-273.
Page 15 of 16(page number not for citation purposes)
http://www.ncbi.nlm.nih.gov/entrez/query.fcgi?cmd=Retrieve&db=PubMed&dopt=Abstract&list_uids=4394228
http://www.ncbi.nlm.nih.gov/entrez/query.fcgi?cmd=Retrieve&db=PubMed&dopt=Abstract&list_uids=4394228
http://www.ncbi.nlm.nih.gov/entrez/query.fcgi?cmd=Retrieve&db=PubMed&dopt=Abstract&list_uids=8710843
http://www.ncbi.nlm.nih.gov/entrez/query.fcgi?cmd=Retrieve&db=PubMed&dopt=Abstract&list_uids=8710843
http://www.ncbi.nlm.nih.gov/entrez/query.fcgi?cmd=Retrieve&db=PubMed&dopt=Abstract&list_uids=8710843
http://www.ncbi.nlm.nih.gov/entrez/query.fcgi?cmd=Retrieve&db=PubMed&dopt=Abstract&list_uids=7287694
http://www.ncbi.nlm.nih.gov/entrez/query.fcgi?cmd=Retrieve&db=PubMed&dopt=Abstract&list_uids=7287694
http://www.ncbi.nlm.nih.gov/entrez/query.fcgi?cmd=Retrieve&db=PubMed&dopt=Abstract&list_uids=7287694
http://www.ncbi.nlm.nih.gov/entrez/query.fcgi?cmd=Retrieve&db=PubMed&dopt=Abstract&list_uids=7191612
http://www.ncbi.nlm.nih.gov/entrez/query.fcgi?cmd=Retrieve&db=PubMed&dopt=Abstract&list_uids=7191612
http://www.ncbi.nlm.nih.gov/entrez/query.fcgi?cmd=Retrieve&db=PubMed&dopt=Abstract&list_uids=8674811
http://www.ncbi.nlm.nih.gov/entrez/query.fcgi?cmd=Retrieve&db=PubMed&dopt=Abstract&list_uids=8674811
http://www.ncbi.nlm.nih.gov/entrez/query.fcgi?cmd=Retrieve&db=PubMed&dopt=Abstract&list_uids=2061241
http://www.ncbi.nlm.nih.gov/entrez/query.fcgi?cmd=Retrieve&db=PubMed&dopt=Abstract&list_uids=2061241
http://www.ncbi.nlm.nih.gov/entrez/query.fcgi?cmd=Retrieve&db=PubMed&dopt=Abstract&list_uids=7720683
http://www.ncbi.nlm.nih.gov/entrez/query.fcgi?cmd=Retrieve&db=PubMed&dopt=Abstract&list_uids=7720683
http://www.ncbi.nlm.nih.gov/entrez/query.fcgi?cmd=Retrieve&db=PubMed&dopt=Abstract&list_uids=7720683
http://www.ncbi.nlm.nih.gov/entrez/query.fcgi?cmd=Retrieve&db=PubMed&dopt=Abstract&list_uids=7487879
http://www.ncbi.nlm.nih.gov/entrez/query.fcgi?cmd=Retrieve&db=PubMed&dopt=Abstract&list_uids=7487879
http://www.ncbi.nlm.nih.gov/entrez/query.fcgi?cmd=Retrieve&db=PubMed&dopt=Abstract&list_uids=7487879
http://www.ncbi.nlm.nih.gov/entrez/query.fcgi?cmd=Retrieve&db=PubMed&dopt=Abstract&list_uids=1463443
http://www.ncbi.nlm.nih.gov/entrez/query.fcgi?cmd=Retrieve&db=PubMed&dopt=Abstract&list_uids=1463443
http://www.ncbi.nlm.nih.gov/entrez/query.fcgi?cmd=Retrieve&db=PubMed&dopt=Abstract&list_uids=1463443
http://www.ncbi.nlm.nih.gov/entrez/query.fcgi?cmd=Retrieve&db=PubMed&dopt=Abstract&list_uids=8943781
http://www.ncbi.nlm.nih.gov/entrez/query.fcgi?cmd=Retrieve&db=PubMed&dopt=Abstract&list_uids=8943781
http://www.ncbi.nlm.nih.gov/entrez/query.fcgi?cmd=Retrieve&db=PubMed&dopt=Abstract&list_uids=8547179
http://www.ncbi.nlm.nih.gov/entrez/query.fcgi?cmd=Retrieve&db=PubMed&dopt=Abstract&list_uids=8547179
http://www.ncbi.nlm.nih.gov/entrez/query.fcgi?cmd=Retrieve&db=PubMed&dopt=Abstract&list_uids=8547179
http://www.ncbi.nlm.nih.gov/entrez/query.fcgi?cmd=Retrieve&db=PubMed&dopt=Abstract&list_uids=9188726
http://www.ncbi.nlm.nih.gov/entrez/query.fcgi?cmd=Retrieve&db=PubMed&dopt=Abstract&list_uids=9188726
http://www.ncbi.nlm.nih.gov/entrez/query.fcgi?cmd=Retrieve&db=PubMed&dopt=Abstract&list_uids=9188726
http://www.ncbi.nlm.nih.gov/entrez/query.fcgi?cmd=Retrieve&db=PubMed&dopt=Abstract&list_uids=8119192
http://www.ncbi.nlm.nih.gov/entrez/query.fcgi?cmd=Retrieve&db=PubMed&dopt=Abstract&list_uids=8119192
http://www.ncbi.nlm.nih.gov/entrez/query.fcgi?cmd=Retrieve&db=PubMed&dopt=Abstract&list_uids=8119192
http://www.ncbi.nlm.nih.gov/entrez/query.fcgi?cmd=Retrieve&db=PubMed&dopt=Abstract&list_uids=7776979
http://www.ncbi.nlm.nih.gov/entrez/query.fcgi?cmd=Retrieve&db=PubMed&dopt=Abstract&list_uids=7776979
http://www.ncbi.nlm.nih.gov/entrez/query.fcgi?cmd=Retrieve&db=PubMed&dopt=Abstract&list_uids=7776979
http://www.ncbi.nlm.nih.gov/entrez/query.fcgi?cmd=Retrieve&db=PubMed&dopt=Abstract&list_uids=8387157
http://www.ncbi.nlm.nih.gov/entrez/query.fcgi?cmd=Retrieve&db=PubMed&dopt=Abstract&list_uids=8387157
http://www.ncbi.nlm.nih.gov/entrez/query.fcgi?cmd=Retrieve&db=PubMed&dopt=Abstract&list_uids=8387157
http://www.ncbi.nlm.nih.gov/entrez/query.fcgi?cmd=Retrieve&db=PubMed&dopt=Abstract&list_uids=9566730
http://www.ncbi.nlm.nih.gov/entrez/query.fcgi?cmd=Retrieve&db=PubMed&dopt=Abstract&list_uids=9566730
http://www.ncbi.nlm.nih.gov/entrez/query.fcgi?cmd=Retrieve&db=PubMed&dopt=Abstract&list_uids=9566730
http://www.ncbi.nlm.nih.gov/entrez/query.fcgi?cmd=Retrieve&db=PubMed&dopt=Abstract&list_uids=3068032
http://www.ncbi.nlm.nih.gov/entrez/query.fcgi?cmd=Retrieve&db=PubMed&dopt=Abstract&list_uids=3068032
http://www.ncbi.nlm.nih.gov/entrez/query.fcgi?cmd=Retrieve&db=PubMed&dopt=Abstract&list_uids=3068032
http://www.ncbi.nlm.nih.gov/entrez/query.fcgi?cmd=Retrieve&db=PubMed&dopt=Abstract&list_uids=3864152
http://www.ncbi.nlm.nih.gov/entrez/query.fcgi?cmd=Retrieve&db=PubMed&dopt=Abstract&list_uids=3864152
http://www.ncbi.nlm.nih.gov/entrez/query.fcgi?cmd=Retrieve&db=PubMed&dopt=Abstract&list_uids=3864152
http://www.ncbi.nlm.nih.gov/entrez/query.fcgi?cmd=Retrieve&db=PubMed&dopt=Abstract&list_uids=4406598
BMC Genomics 2007, 8:405 http://www.biomedcentral.com/1471-2164/8/405
Publish with BioMed Central and every scientist can read your work free of charge
"BioMed Central will be the most significant development for disseminating the results of biomedical research in our lifetime."
Sir Paul Nurse, Cancer Research UK
Your research papers will be:
available free of charge to the entire biomedical community
peer reviewed and published immediately upon acceptance
cited in PubMed and archived on PubMed Central
yours — you keep the copyright
Submit your manuscript here:http://www.biomedcentral.com/info/publishing_adv.asp
BioMedcentral
64. Smyth GK: Limma: linear models for microarray data. In Bio-informatics and Computational Biology Solutions using R and BioconductorEdited by: Gentleman R, Carey V, Dudoit S, Irizarry R and Huber W.New York, Springer; 2005:397-420.
65. Edwards D: Non-linear normalization and background correc-tion in one-channel cDNA microarray studies. Bioinformatics2003, 19(7):825-833.
66. Benjamini Y, Hochberg Y: Controlling the false discovery rate: Apractical and powerful approach to multiple testing. JournalOf The Royal Statistical Society Series B 1995, 57:289-300.
67. Hollander M, Wolfe DA: Nonparametric statistical methods Wiley, NewYork; 1973.
68. Falcon S, Gentleman R: Using GOstats to test gene lists for GOterm association. Bioinformatics 2006, 23:257-258.
69. Hedegaard J, Skovgaard K, Mortensen S, Sørensen P, Jensen TK,Hornshøj H, Bendixen C, Heegaard PM: Molecular characterisa-tion of the early response in pigs to experimental infectionwith Actinobacillus pleuropneumoniae using cDNA micro-arrays. Acta Vet Scand 2007, 49(1):11.
70. 2007 [http://www.sequenom.com].71. Elvidge GP, Price TS, Glenny L, Ragoussis J: Development and eval-
uation of real competitive PCR for high-throughput quanti-tative applications. Analytical Biochemistry 2005, 339:231-241.
72. 2007 [http://itmat.upenn.edu/~tsprice/software.html].
Page 16 of 16(page number not for citation purposes)