Gender differences in healthy life years within the EU: an exploration of the...
13
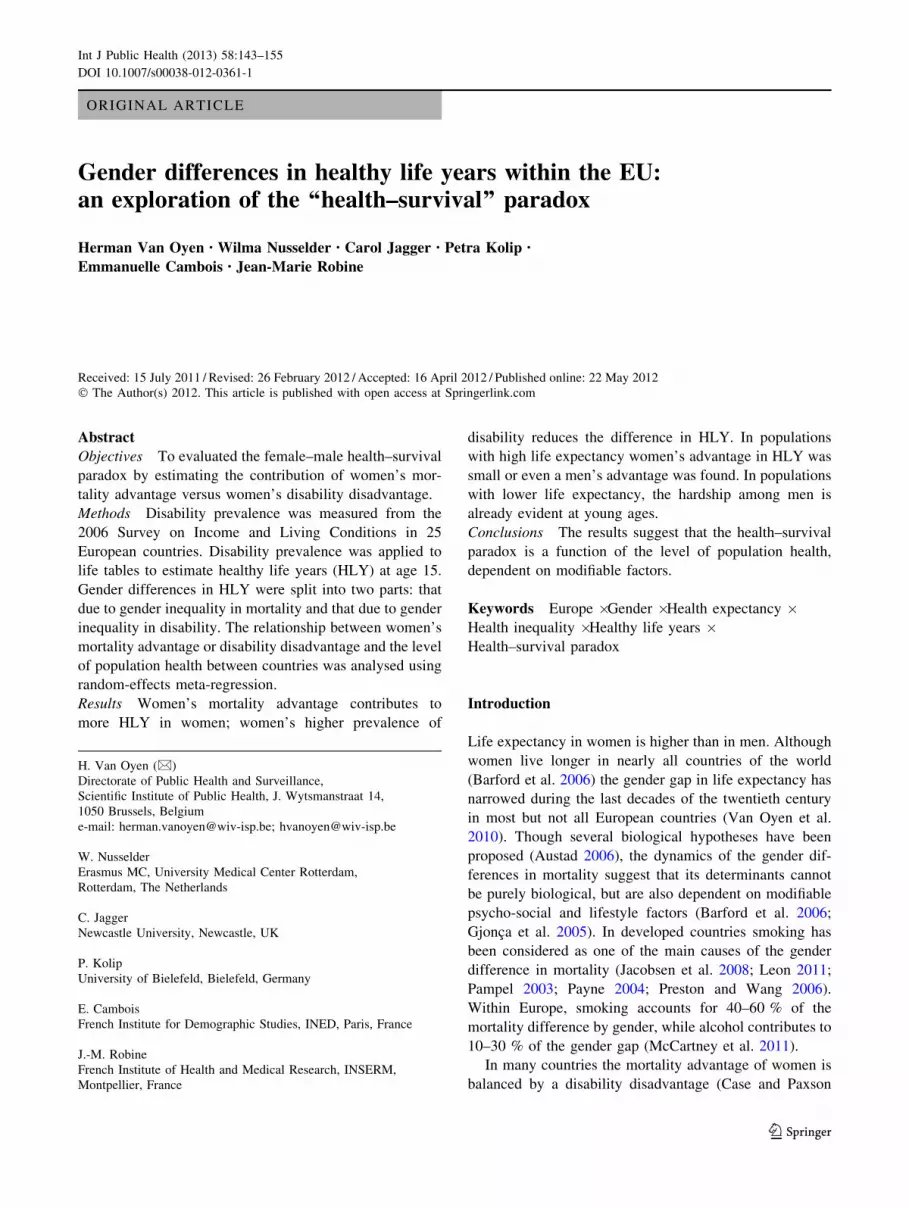
ORIGINAL ARTICLE Gender differences in healthy life years within the EU: an exploration of the ‘‘health–survival’’ paradox Herman Van Oyen • Wilma Nusselder • Carol Jagger • Petra Kolip • Emmanuelle Cambois • Jean-Marie Robine Received: 15 July 2011 / Revised: 26 February 2012 / Accepted: 16 April 2012 / Published online: 22 May 2012 Ó The Author(s) 2012. This article is published with open access at Springerlink.com Abstract Objectives To evaluated the female–male health–survival paradox by estimating the contribution of women’s mor- tality advantage versus women’s disability disadvantage. Methods Disability prevalence was measured from the 2006 Survey on Income and Living Conditions in 25 European countries. Disability prevalence was applied to life tables to estimate healthy life years (HLY) at age 15. Gender differences in HLY were split into two parts: that due to gender inequality in mortality and that due to gender inequality in disability. The relationship between women’s mortality advantage or disability disadvantage and the level of population health between countries was analysed using random-effects meta-regression. Results Women’s mortality advantage contributes to more HLY in women; women’s higher prevalence of disability reduces the difference in HLY. In populations with high life expectancy women’s advantage in HLY was small or even a men’s advantage was found. In populations with lower life expectancy, the hardship among men is already evident at young ages. Conclusions The results suggest that the health–survival paradox is a function of the level of population health, dependent on modifiable factors. Keywords Europe Á Gender Á Health expectancy Á Health inequality Á Healthy life years Á Health–survival paradox Introduction Life expectancy in women is higher than in men. Although women live longer in nearly all countries of the world (Barford et al. 2006) the gender gap in life expectancy has narrowed during the last decades of the twentieth century in most but not all European countries (Van Oyen et al. 2010). Though several biological hypotheses have been proposed (Austad 2006), the dynamics of the gender dif- ferences in mortality suggest that its determinants cannot be purely biological, but are also dependent on modifiable psycho-social and lifestyle factors (Barford et al. 2006; Gjonc ¸a et al. 2005). In developed countries smoking has been considered as one of the main causes of the gender difference in mortality (Jacobsen et al. 2008; Leon 2011; Pampel 2003; Payne 2004; Preston and Wang 2006). Within Europe, smoking accounts for 40–60 % of the mortality difference by gender, while alcohol contributes to 10–30 % of the gender gap (McCartney et al. 2011). In many countries the mortality advantage of women is balanced by a disability disadvantage (Case and Paxson H. Van Oyen (&) Directorate of Public Health and Surveillance, Scientific Institute of Public Health, J. Wytsmanstraat 14, 1050 Brussels, Belgium e-mail: [email protected]; [email protected] W. Nusselder Erasmus MC, University Medical Center Rotterdam, Rotterdam, The Netherlands C. Jagger Newcastle University, Newcastle, UK P. Kolip University of Bielefeld, Bielefeld, Germany E. Cambois French Institute for Demographic Studies, INED, Paris, France J.-M. Robine French Institute of Health and Medical Research, INSERM, Montpellier, France Int J Public Health (2013) 58:143–155 DOI 10.1007/s00038-012-0361-1 123
-
Upload
independent -
Category
Documents
-
view
1 -
download
0
Transcript of Gender differences in healthy life years within the EU: an exploration of the...
ORIGINAL ARTICLE
Gender differences in healthy life years within the EU:an exploration of the ‘‘health–survival’’ paradox
Herman Van Oyen • Wilma Nusselder • Carol Jagger • Petra Kolip •
Emmanuelle Cambois • Jean-Marie Robine
Received: 15 July 2011 / Revised: 26 February 2012 / Accepted: 16 April 2012 / Published online: 22 May 2012
� The Author(s) 2012. This article is published with open access at Springerlink.com
Abstract
Objectives To evaluated the female–male health–survival
paradox by estimating the contribution of women’s mor-
tality advantage versus women’s disability disadvantage.
Methods Disability prevalence was measured from the
2006 Survey on Income and Living Conditions in 25
European countries. Disability prevalence was applied to
life tables to estimate healthy life years (HLY) at age 15.
Gender differences in HLY were split into two parts: that
due to gender inequality in mortality and that due to gender
inequality in disability. The relationship between women’s
mortality advantage or disability disadvantage and the level
of population health between countries was analysed using
random-effects meta-regression.
Results Women’s mortality advantage contributes to
more HLY in women; women’s higher prevalence of
disability reduces the difference in HLY. In populations
with high life expectancy women’s advantage in HLY was
small or even a men’s advantage was found. In populations
with lower life expectancy, the hardship among men is
already evident at young ages.
Conclusions The results suggest that the health–survival
paradox is a function of the level of population health,
dependent on modifiable factors.
Keywords Europe � Gender � Health expectancy �Health inequality � Healthy life years �Health–survival paradox
Introduction
Life expectancy in women is higher than in men. Although
women live longer in nearly all countries of the world
(Barford et al. 2006) the gender gap in life expectancy has
narrowed during the last decades of the twentieth century
in most but not all European countries (Van Oyen et al.
2010). Though several biological hypotheses have been
proposed (Austad 2006), the dynamics of the gender dif-
ferences in mortality suggest that its determinants cannot
be purely biological, but are also dependent on modifiable
psycho-social and lifestyle factors (Barford et al. 2006;
Gjonca et al. 2005). In developed countries smoking has
been considered as one of the main causes of the gender
difference in mortality (Jacobsen et al. 2008; Leon 2011;
Pampel 2003; Payne 2004; Preston and Wang 2006).
Within Europe, smoking accounts for 40–60 % of the
mortality difference by gender, while alcohol contributes to
10–30 % of the gender gap (McCartney et al. 2011).
In many countries the mortality advantage of women is
balanced by a disability disadvantage (Case and Paxson
H. Van Oyen (&)
Directorate of Public Health and Surveillance,
Scientific Institute of Public Health, J. Wytsmanstraat 14,
1050 Brussels, Belgium
e-mail: [email protected]; [email protected]
W. Nusselder
Erasmus MC, University Medical Center Rotterdam,
Rotterdam, The Netherlands
C. Jagger
Newcastle University, Newcastle, UK
P. Kolip
University of Bielefeld, Bielefeld, Germany
E. Cambois
French Institute for Demographic Studies, INED, Paris, France
J.-M. Robine
French Institute of Health and Medical Research, INSERM,
Montpellier, France
Int J Public Health (2013) 58:143–155
DOI 10.1007/s00038-012-0361-1
123
2005). This contrast is called the female–male health–
survival paradox (Oksuzyan et al. 2008). The proposed
explanations for the health–survival paradox are rooted
in biological, social, and psychological interpretations
(Oksuzyan et al. 2008). Although selection and information
bias from gender differences in participation in surveys and
reporting cannot be excluded, the contribution of both
biases to the health–survival paradox is considered to be
small (Oksuzyan et al. 2009).
To better understand the dynamics of population health
and especially, the female–male health–survival paradox,
the use of composite health indicators, such as health
expectancies, has been proposed (Nusselder et al. 2010b).
Health expectancies are summary measures of population
health bringing together data on both the quantity and the
quality of life (Robine 2006). They are considered to be
important population health outcome measures (Stiefel
et al. 2010). Health expectancies, predominantly disability-
free life expectancy (DFLE), are available for many
countries worldwide (Robine et al. 2003). Within the
European Union, it was decided to estimate DFLE based on
a measure of long-term activity limitations (Van Oyen
et al. 2006), the healthy life years (HLY). Similar to life
expectancy, HLY at a given age corresponds to the average
life span free of activity limitation. The average life span
with activity limitation is called unhealthy life years
(ULY).
Gender difference in both HLY and ULY, can be split
into two components: (1) the difference due to inequality in
age-specific mortality rates (‘‘mortality effect’’: gender
difference in life expectancy without or with activity lim-
itations due to differential mortality); and (2) difference
due to gender inequality in age-specific prevalence of
activity limitations (‘‘disability effect’’: difference in life
expectancy without or with activity limitations because of
differences in the prevalence of activity limitations).
The current paper aims to better understand the health–
survival paradox within the EU by examining the contri-
bution of women’s mortality advantage versus the
disability disadvantage, and their differences between
countries with better and worse population health. More
specifically, we explore the following questions:
1. Does the mortality advantage and/or disability disad-
vantage of women vary between countries with high
versus low life expectancy? We expect that in
populations with high life expectancy, the gender gap
in HLY is smaller because of a combination of a
smaller mortality advantage and a larger disability
disadvantage in females.
2. Is there a shift in the concentration of the mortality and
disability effects on the gender gap in HLY towards
older age groups (50 years and above) when indicators
of population health (e.g., having a longer life, a longer
life without activity limitations or a shorter life with
activity limitations) are improving? We hypothesize
that in countries with better scores on the population
health indicators, the effects of both mortality and
disability on the gender gap in HLY is more concen-
trated in older age groups.
The added value of the paper is to study the health–
survival paradox through HLY, which combines both
health and survival.
Methods
Data
We used EU member states specific data of the European
Health Expectancy Monitoring Unit Information System
(http://www.ehemu.eu): age and sex-specific data on (1)
number of deaths (2006); (2) population (2006, 2007); and
(3) prevalence of activity limitations (number of persons
with activity limitations and the total number in the sam-
ple) from the 2006 Statistics of Living and Income Survey
(SILC). The SILC is an EU-wide survey, initiated in 2005.
A description of the survey can be found in ‘‘http://
circa.europa.eu/public/irc/dsis/eusilc.library’’. The SILC
survey population consists of nationally representative
probabilistic samples from community dwelling popula-
tions. The 2006 SILC survey covers a total of 375,243
participants of age 16 years and above. Overall response
rate averaged over countries is about 20 % but with large
between countries variations (from 95 % in Cyprus to
60 % in Denmark and Belgium) (Eurostat 2009).
Activity limitations
The SILC contains the Minimum European Health Module
(Robine and Jagger 2003), which includes a disability
measure, the global activity limitation indicator (GALI).
The GALI (‘‘For at least the last 6 months, have you been
limited because of a health problem in activities people
usually do?’’) aims to capture long-term limitation in usual
activities, caused by ill-health (Van Oyen et al. 2006) and
provides the health status information to calculate HLY.
The validity and the reliability of the GALI have been
documented (Cox et al. 2009; Jagger et al. 2010; Van Oyen
et al. 2006).
Statistical methods
HLY at age 15 was calculated using the Sullivan method,
which integrates age-specific disability prevalence into the
144 H. Van Oyen et al.
123
life table (Jagger et al. 2007; Sullivan 1971). ULY are
calculated as the difference between life expectancy (LE)
and HLY.
To estimate the contribution of the mortality and dis-
ability effects to the gender differences (females - males)
in HLY and ULY, a decomposition methodology was used
(Nusselder et al. 2005; Nusselder and Looman 2004). This
method is an extension of the decomposition techniques
used in mortality research (Arriaga 1984) to assess the
contribution of age or specific diseases to differences in
LE. Gender inequalities in LE reflect differences in mor-
tality rates only. Gender differences in HLY or ULY are a
result of differences in mortality combined with differences
in the prevalence of activity limitations. The decomposi-
tion method allows the estimation of the percentage of
mortality or disability effects of the gender difference in
HLY (or in ULY) that are due to differences in specific age
groups (e.g., younger ages (15–49 years) or older ages
(50? years)). Calculations were done using R. A statistical
description of the decomposition methods including a
manual for the R-macro has been described http://www.
eurohex.eu/pdf/Reports_2010/2010TR7.1_Decomposition
%20tools.pdf (Nusselder et al. 2010a). The variance and
95 % CI around the mortality and disability effects were
estimated by a bootstrap procedure with 1,000 resamples
(Efron and Tibshirani 1993) with the assumption that the
number of age-specific deaths followed a Poisson distri-
bution, and the number of persons with activity limitations
resampled within the sample size of the age-specific survey
groups followed a binomial distribution. The 2.5 and 97.5
percentile of the bootstrap distribution defined the 95 % CI
boundaries.
To evaluate the health–survival paradox we investigate
the relationship between the mortality advantage or the
disability disadvantage that women experience over men
and the duration and/or the gender gap in the duration of
total, healthy or unhealthy life using random-effects meta-
regression models in STATA-10 (Sutton and Abrams
2001). In contrast to ordinary regression models, these
models account for the uncertainty around the country-
specific mortality or disability effect.
We use three univariable models (model Type 1) each
assessing the relationship of the mortality effect of the
gender difference in HLY (dependent variable) with an
independent variable representing the overall length of life
(women’s LE, men’s LE and gender difference in LE).
Model Type 2 is multivariable, adjusting the gender dif-
ference in LE for women’s LE to account for the
association between gender difference in LE and longer life
(Van Oyen et al. 2010). A similar modelling process (Type
1 and Type 2) is adopted for assessing the relationship
between the mortality effect of the gender difference in
HLY and overall HLY (women’s HLY, men’s HLY and
gender difference in HLY) and then overall ULY. Finally,
the whole is repeated for assessing (1) the relationship of
the disability effect of the gender difference in HLY with
the overall length of life, of healthy life and of unhealthy
life and (2) the relationship of the mortality or disability
effect of the gender difference in ULY with the overall
length of life, of healthy life and of unhealthy life. We
present the univariable associations by line graphs of the
fitted values, with the estimates from each member state
represented by circles, the circle sizes depending on the
precision of each estimate (the inverse of its within-country
variance), which is the weight given to each country in the
model. Similar models were used when the dependent
variable was the relative contribution (%) of older age
(50? years) to the mortality and disability effect of the
gender difference in HLY or in ULY.
Results
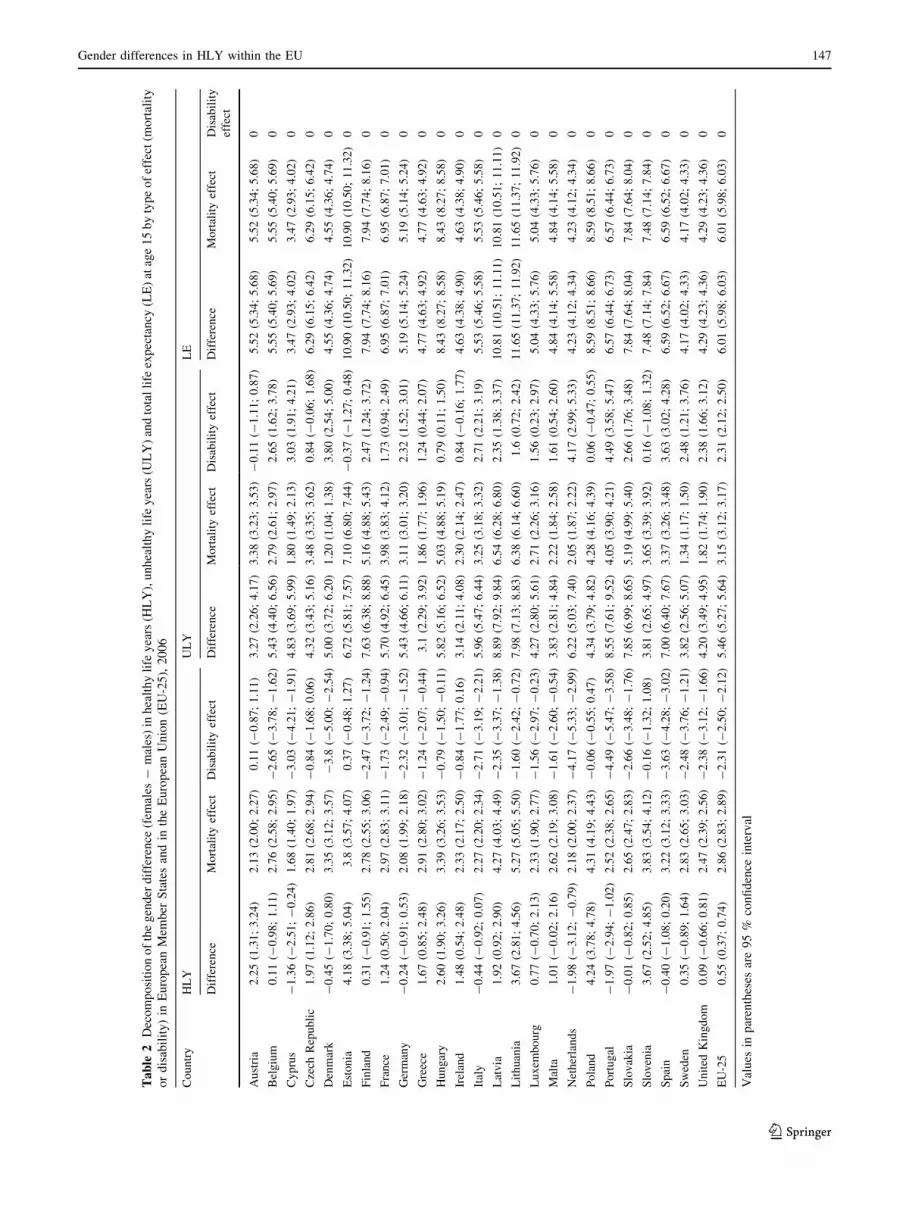
Tables 1 and 2 provide the estimates of the different health
expectancy indicators, the gender differences (female -
male) and the decomposition by type of effect at age
15 years. Data are summarized by boxplots (Fig. 1).
Women’s LE at age 15 years always exceeds male LE, but
LE varies substantially across countries as does the gender
difference which varies from 3.5 to 11.6 years.
The median gender difference in HLY (0.8 years) is less
than that for LE (5.6 years). The variation in the gender
difference in HLY [interquartile range (IQR): 2.4, range:
6.2] is also smaller than that for LE (IQR: 3.2, range: 8.2).
In 7 countries (Cyprus, Denmark, Germany, Italy, the
Netherlands, Portugal and Spain), men at age 15 can expect
to live more years without activity limitations than women,
the gender difference in HLY reaching statistical signifi-
cance in 3 of these countries (Cyprus, the Netherlands and
Portugal). In all countries, women live more years with
activity limitations than men, the median gender difference
in ULY being 5.4 years (IQR 2.8, range 5.8).
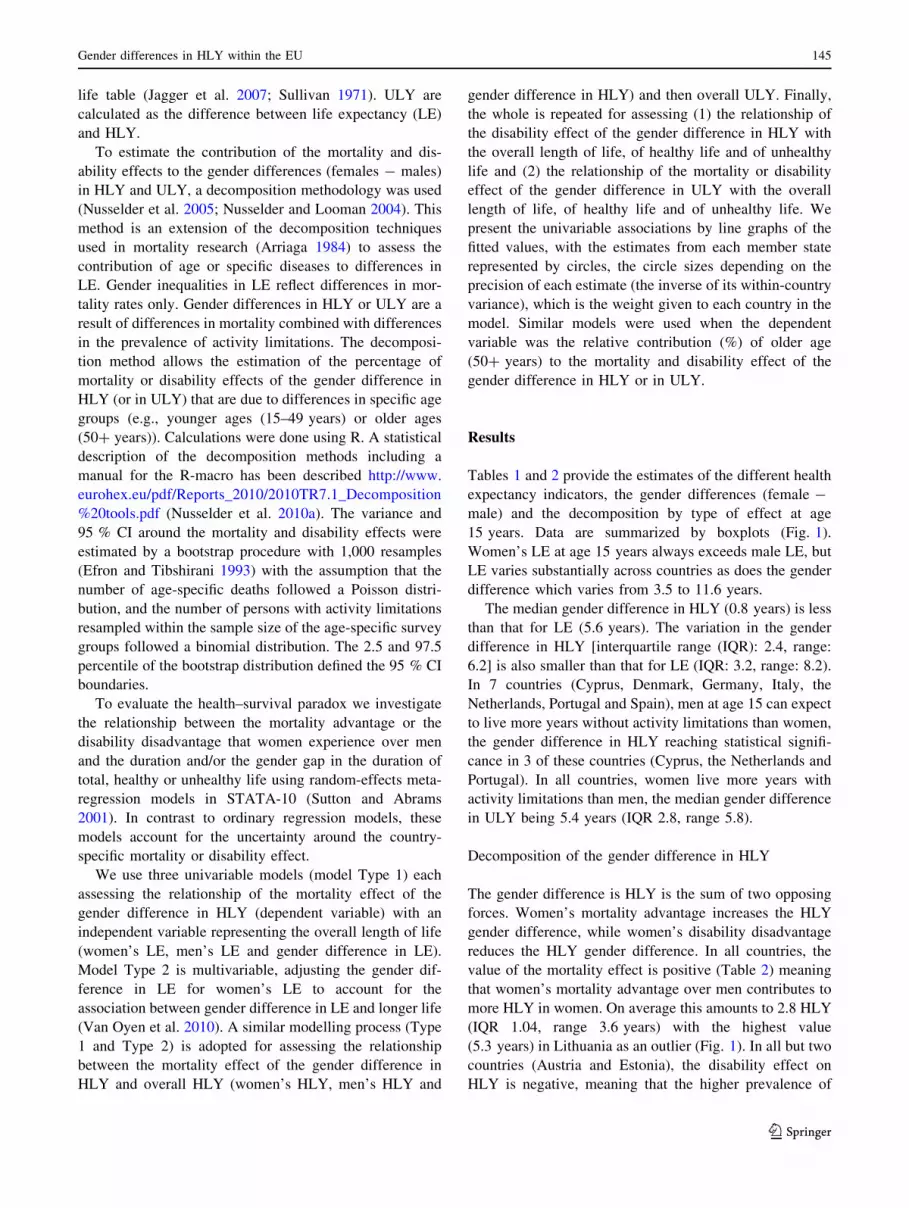
Decomposition of the gender difference in HLY
The gender difference is HLY is the sum of two opposing
forces. Women’s mortality advantage increases the HLY
gender difference, while women’s disability disadvantage
reduces the HLY gender difference. In all countries, the
value of the mortality effect is positive (Table 2) meaning
that women’s mortality advantage over men contributes to
more HLY in women. On average this amounts to 2.8 HLY
(IQR 1.04, range 3.6 years) with the highest value
(5.3 years) in Lithuania as an outlier (Fig. 1). In all but two
countries (Austria and Estonia), the disability effect on
HLY is negative, meaning that the higher prevalence of
Gender differences in HLY within the EU 145
123

Ta
ble
1H
ealt
hy
(HL
Y),
un
hea
lth
yli
fey
ears
(UL
Y),
Lif
eE
xp
ecta
ncy
(LE
)an
dth
e%
of
rem
ain
ing
life
ing
oo
dh
ealt
h(%
HL
Y)
atag
e1
5in
Eu
rop
ean
Mem
ber
Sta
tes
and
inth
eE
uro
pea
n
Un
ion
(EU
-25
),2
00
6
Co
un
try
Mal
esF
emal
es
HL
YU
LY
LE
%H
LY
/LE
HL
YU
LY
LE
%H
LY
/LE
Au
stri
a4
4.2
3(4
3.5
2;
44
.84
)1
8.2
4(1
7.6
3;
18
.96
)6
2.4
8(6
2.3
5;
62
.61
)7
0.8
(69
.66;
71
.76
)4
6.4
8(4
5.8
1;
47
.20
)2
1.5
1(2
0.7
9;
22
.20
)6
7.9
9(6
7.8
8;
68
.11
)6
8.3
6(6
7.3
6;
69
.43
)
Bel
giu
m4
8.5
5(4
7.9
0;
49
.29
)1
3.4
0(1
2.6
5;
14
.07
)6
1.9
6(6
1.8
4;
62
.06
)7
8.3
7(7
7.2
9;
79
.58
)4
8.6
7(4
7.8
3;
49
.44
)1
8.8
4(1
8.0
5;
19
.64
)6
7.5
0(6
7.4
0;
67
.60
)7
2.1
0(7
0.9
1;
73
.27
)
Cy
pru
s4
9.9
5(4
9.1
3;
50
.82
)1
4.0
4(1
3.1
8;
14
.85
)6
3.9
9(6
3.5
8;
64
.37
)7
8.0
5(7
6.8
2;
79
.37
)4
8.5
9(4
7.8
0;
49
.45
)1
8.8
7(1
8.0
1;
19
.73
)6
7.4
7(6
7.1
0;
67
.84
)7
2.0
3(7
0.8
1;
73
.24
)
Cze
chR
epu
bli
c4
3.7
1(4
3.0
9;
44
.28
)1
5.0
9(1
4.5
3;
15
.72
)5
8.8
(58
.70
;5
8.9
1)
74
.34
(73
.27;
75
.30
)4
5.6
8(4
5.0
6;
46
.27
)1
9.4
1(1
8.8
0;
20
.05
)6
5.1
0(6
5.0
0;
65
.19
)7
0.1
8(6
9.2
0;
71
.10
)
Den
mar
k5
3.4
0(5
2.6
0;
54
.13
)8
.03
(7.2
9;
8.8
0)
61
.43
(61
.28
;6
1.5
7)
86
.93
(85
.67;
88
.12
)5
2.9
5(5
2.0
2;
53
.92
)1
3.0
3(1
2.0
5;
14
.00
)6
5.9
8(6
5.8
5;
66
.12
)8
0.2
5(7
8.8
1;
81
.72
)
Est
on
ia3
5.6
9(3
5.0
6;
36
.27
)1
7.2
8(1
6.6
9;
17
.88
)5
2.9
6(5
2.6
5;
53
.29
)6
7.3
8(6
6.2
6;
68
.45
)3
9.8
7(3
9.2
6;
40
.51
)2
4.0
0(2
3.3
3;
24
.61
)6
3.8
6(6
3.6
0;
64
.12
)6
2.4
2(6
1.4
9;
63
.43
)
Fin
lan
d3
9.2
1(3
8.3
6;
40
.03
)2
1.0
6(2
0.2
4;
21
.92
)6
0.2
7(6
0.1
4;
60
.42
)6
5.0
6(6
3.6
4;
66
.42
)3
9.5
2(3
8.5
5;
40
.45
)2
8.6
9(2
7.7
9;
29
.63
)6
8.2
1(6
8.0
8;
;6
8.3
7)
57
.94
(56
.53;
59
.29
)
Fra
nce
48
.55
(48
.03
;4
9.0
2)
14
.12
(13
.64;
14
.63
)6
2.6
7(6
2.6
2;
62
.71
)7
7.4
7(7
6.6
5;
78
.23
)4
9.7
9(4
9.2
4;
50
.38
)1
9.8
2(1
9.2
3;
20
.38
)6
9.6
1(6
9.5
6;
69
.66
)7
1.5
2(7
0.7
2;
72
.38
)
Ger
man
y4
4.1
8(4
3.6
6;
44
.66
)1
8.2
8(1
7.7
8;
18
.80
)6
2.4
5(6
2.4
1;
62
.50
)7
0.7
4(6
9.9
0;
71
.52
)4
3.9
4(4
3.4
4;
44
.52
)2
3.7
0(2
3.1
3;
24
.21
)6
7.6
4(6
7.6
1;
67
.68
)6
4.9
6(6
4.2
0;
65
.80
)
Gre
ece
51
.76
(51
.21
;5
2.3
0)
10
.69
(10
.15;
11
.23
)6
2.4
5(6
2.3
5;
62
.56
)8
2.8
8(8
2.0
2;
83
.74
)5
3.4
3(5
2.8
2;
54
.06
)1
3.8
0(1
3.1
7;
14
.39
)6
7.2
3(6
7.1
4;
67
.32
)7
9.4
8(7
8.6
0;
80
.40
)
Hu
ng
ary
40
.11
(39
.62
;4
0.5
9)
14
.67
(14
.19;
15
.15
)5
4.7
7(5
4.6
7;
54
.88
)7
3.2
2(7
2.3
4;
74
.09
)4
2.7
1(4
2.2
3;
43
.19
)2
0.4
9(2
0.0
1;
20
.98
)6
3.2
0(6
3.1
0;
63
.31
)6
7.5
8(6
6.8
2;
68
.33
)
Irel
and
48
.97
(48
.34
;4
9.6
0)
13
.81
(13
.19;
14
.45
)6
2.7
8(6
2.6
1;
62
.95
)7
8.0
0(7
6.9
8;
79
.00
)5
0.4
5(4
9.7
7;
51
.13
)1
6.9
6(1
6.2
4;
17
.66
)6
7.4
1(6
7.2
2;
67
.59
)7
4.8
4(7
3.8
2;
75
.88
)
Ital
y5
0.1
8(4
9.8
5;
50
.49
)1
3.5
9(1
3.2
7;
13
.91
)6
3.7
7(6
3.7
2;
63
.81
)7
8.6
9(7
8.1
7;
79
.19
)4
9.7
4(4
9.3
8;
50
.07
)1
9.5
5(1
9.2
5;
19
.91
)6
9.2
9(6
9.2
5;
69.3
3)
71
.78
(71
.26
;7
2.2
4)
Lat
via
36
.71
(36
.08
;3
7.4
1)
14
.53
(13
.86;
15
.19
)5
1.2
5(5
1.0
0;
51
.48
)7
1.6
4(7
0.4
2;
72
.93
)3
8.6
3(3
7.9
2;
39
.36
)2
3.4
2(2
2.7
1;
24
.13
)6
2.0
6(6
1.8
5;
62
.26
)6
2.2
6(6
1.1
6;
63
.41
)
Lit
huan
ia3
8.4
8(3
7.8
8;
39
.08
)1
2.5
4(1
1.9
3;
13
.12
)5
1.0
1(5
0.8
2;
51
.22
)7
5.4
2(7
4.2
9;
76
.59
)4
2.1
5(4
1.5
3;
42
.80
)2
0.5
1(1
9.8
3;
21
.13
)6
2.6
6(6
2.4
9;
62
.84
)6
7.2
6(6
6.2
7;
68
.33
)
Lu
xem
bo
urg
46
.78
(45
.83
;4
7.7
0)
15
.14
(14
.26;
16
.17
)6
1.9
2(6
1.3
9;
62
.47
)7
5.5
5(7
4.0
4;
76
.95
)4
7.5
5(4
6.4
3;
48
.63
)1
9.4
1(1
8.3
4;
20
.53
)6
6.9
5(6
6.4
6;
67
.47
)7
1.0
1(6
9.3
7;
72
.60
)
Mal
ta5
3.4
9(5
2.6
9;
54
.29
)8
.81
(8.1
2;
9.5
3)
62
.30
(61
.81;
62
.86
)8
5.8
7(8
4.7
4;
86
.96
)5
4.5
(53
.70;
55
.29
)1
2.6
3(1
1.8
5;
13
.43
)6
7.1
3(6
6.6
7;
67
.62
)8
1.1
8(8
0.0
8;
82
.32
)
Net
her
lan
ds
50
.90
(50
.06
;5
1.6
9)
12
.19
(11
.40;
13
.02
)6
3.0
9(6
3.0
1;
63
.17
)8
0.6
8(7
9.3
7;
81
.93
)4
8.9
1(4
8.0
3;
49
.73
)1
8.4
1(1
7.5
8;
19
.29
)6
7.3
2(6
7.2
5;
67
.40
)7
2.6
6(7
1.3
4;
73
.89
)
Po
lan
d4
4.0
9(4
3.7
4;
44
.43
)1
2.3
9(1
2.0
6;
12
.74
)5
6.4
8(5
6.4
1;
56
.54
)7
8.0
6(7
7.4
5;
78
.64
)4
8.3
3(4
7.9
7;
48
.73
)1
6.7
4(1
6.3
4;
17
.11
)6
5.0
7(6
5.0
1;
65
.12
)7
4.2
8(7
3.7
1;
74
.89
)
Po
rtu
gal
45
.21
(44
.59
;4
5.8
6)
15
.71
(15
.04;
16
.31
)6
0.9
2(6
0.8
1;
61
.02
)7
4.2
1(7
3.2
5;
75
.30
)4
3.2
4(4
2.4
9;
43
.99
)2
4.2
6(2
3.4
8;
24
.99
)6
7.4
9(6
7.4
0;
67
.60
)6
4.0
6(6
2.9
6;
65
.19
)
Slo
vak
ia4
0.4
9(3
9.9
0;
41
.07
)1
5.5
8(1
5.0
3;
16
.20
)5
6.0
8(5
5.9
2;
56
.23
)7
2.2
1(7
1.1
3;
73
.22
)4
0.4
8(3
9.8
4;
41
.08
)2
3.4
3(2
2.8
2;
24
.06
)6
3.9
1(6
3.7
8;
64
.06
)6
3.3
4(6
2.3
4;
64
.27
)
Slo
ven
ia4
3.6
8(4
2.8
8;
44
.47
)1
5.9
5(1
5.1
8;
16
.77
)5
9.6
3(5
9.3
9;
59
.88
)7
3.2
5(7
1.9
4;
74
.53
)4
7.3
5(4
6.4
9;
48
.19
)1
9.7
7(1
8.9
1;
20
.61
)6
7.1
1(6
6.8
9;
67
.35
)7
0.5
5(6
9.2
8;
71
.79
)
Sp
ain
49
.38
(48
.97
;4
9.7
9)
13
.67
(13
.26;
14
.07
)6
3.0
5(6
2.9
9;
63
.10
)7
8.3
2(7
7.6
8;
78
.98
)4
8.9
8(4
8.4
6;
49
.50
)2
0.6
7(2
0.1
5;
21
.17
)6
9.6
5(6
9.5
9;
69.7
0)
70
.33
(69
.60
;7
1.0
8)
Sw
eden
52
.58
(51
.73
;5
3.4
4)
11
.48
(10
.61;
12
.33
)6
4.0
6(6
3.9
5;
64
.17
)8
2.0
8(8
0.7
5;
83
.45
)5
2.9
3(5
1.9
7;
53
.90
)1
5.3
0(1
4.3
5;
16
.27
)6
8.2
3(6
8.1
3;
68
.34
)7
7.5
7(7
6.1
7;
78
.97
)
Un
ited
Kin
gd
om
50
.71
(50
.20
;5
1.1
9)
12
.07
(11
.61;
12
.58
)6
2.7
8(6
2.7
3;
62
.83
)8
0.7
7(7
9.9
8;
81
.52
)5
0.8
0(5
0.1
9;
51
.38
)1
6.2
7(1
5.7
0;
16
.87
)6
7.0
7(6
7.0
3;
67
.12
)7
5.7
4(7
4.8
5;
76
.60
)
EU
-25
47
.36
(47
.25
;4
7.4
8)
14
.30
(14
.18;
14
.42
)6
1.6
6(6
1.6
5;
61
.68
)7
6.8
1(7
6.6
2;
77
.00
)4
7.9
1(4
7.7
9;
48
.05
)1
9.7
6(1
9.6
3;
19
.88
)6
7.6
7(6
7.6
6;
67.6
9)
70
.70
(70
.62
;7
1.0
0)
HL
Yan
dU
LY
are
esti
mat
edu
sin
gth
eS
ull
ivan
met
ho
d;
mem
ber
stat
esg
end
eran
dag
e-sp
ecifi
cm
ort
alit
yan
dm
orb
idit
y(S
ILC
20
06
)d
ata.
Val
ues
inp
aren
thes
esar
e9
5%
con
fid
ence
inte
rval
146 H. Van Oyen et al.
123
Ta
ble
2D
eco
mp
osi
tio
no
fth
eg
end
erd
iffe
ren
ce(f
emal
es-
mal
es)
inh
ealt
hy
life
yea
rs(H
LY
),u
nh
ealt
hy
life
yea
rs(U
LY
)an
dto
tal
life
exp
ecta
ncy
(LE
)at
age
15
by
typ
eo
fef
fect
(mo
rtal
ity
or
dis
abil
ity
)in
Eu
rop
ean
Mem
ber
Sta
tes
and
inth
eE
uro
pea
nU
nio
n(E
U-2
5),
20
06
Cou
ntr
yH
LY
UL
YL
E
Dif
fere
nce
Mort
alit
yef
fect
Dis
abil
ity
effe
ctD
iffe
rence
Mort
alit
yef
fect
Dis
abil
ity
effe
ctD
iffe
rence
Mort
alit
yef
fect
Dis
abil
ity
effe
ct
Au
stri
a2
.25
(1.3
1;
3.2
4)
2.1
3(2
.00
;2
.27)
0.1
1(-
0.8
7;
1.1
1)
3.2
7(2
.26
;4
.17)
3.3
8(3
.23
;3
.53
)-
0.1
1(-
1.1
1;
0.8
7)
5.5
2(5
.34
;5
.68)
5.5
2(5
.34
;5
.68
)0
Bel
giu
m0
.11
(-0
.98;
1.1
1)
2.7
6(2
.58
;2
.95)
-2
.65
(-3
.78;
-1
.62)
5.4
3(4
.40
;6
.56)
2.7
9(2
.61
;2
.97
)2
.65
(1.6
2;
3.7
8)
5.5
5(5
.40
;5
.69)
5.5
5(5
.40
;5
.69
)0
Cyp
rus
-1
.36
(-2
.51;
-0
.24
)1
.68
(1.4
0;
1.9
7)
-3
.03
(-4
.21;
-1
.91)
4.8
3(3
.69
;5
.99)
1.8
0(1
.49
;2
.13
)3
.03
(1.9
1;
4.2
1)
3.4
7(2
.93
;4
.02)
3.4
7(2
.93
;4
.02
)0
Cze
chR
epu
bli
c1
.97
(1.1
2;
2.8
6)
2.8
1(2
.68
;2
.94)
-0
.84
(-1
.68;
0.0
6)
4.3
2(3
.43
;5
.16)
3.4
8(3
.35
;3
.62
)0
.84
(-0
.06
;1
.68)
6.2
9(6
.15
;6
.42)
6.2
9(6
.15
;6
.42
)0
Den
mar
k-
0.4
5(-
1.7
0;
0.8
0)
3.3
5(3
.12
;3
.57)
-3
.8(-
5.0
0;
-2
.54)
5.0
0(3
.72
;6
.20)
1.2
0(1
.04
;1
.38
)3
.80
(2.5
4;
5.0
0)
4.5
5(4
.36
;4
.74)
4.5
5(4
.36
;4
.74
)0
Est
on
ia4
.18
(3.3
8;
5.0
4)
3.8
(3.5
7;
4.0
7)
0.3
7(-
0.4
8;
1.2
7)
6.7
2(5
.81
;7
.57)
7.1
0(6
.80
;7
.44
)-
0.3
7(-
1.2
7;
0.4
8)
10
.90
(10
.50;
11
.32
)1
0.9
0(1
0.5
0;
11
.32
)0
Fin
lan
d0
.31
(-0
.91;
1.5
5)
2.7
8(2
.55
;3
.06)
-2
.47
(-3
.72;
-1
.24)
7.6
3(6
.38
;8
.88)
5.1
6(4
.88
;5
.43
)2
.47
(1.2
4;
3.7
2)
7.9
4(7
.74
;8
.16)
7.9
4(7
.74
;8
.16
)0
Fra
nce
1.2
4(0
.50
;2
.04)
2.9
7(2
.83
;3
.11)
-1
.73
(-2
.49;
-0
.94)
5.7
0(4
.92
;6
.45)
3.9
8(3
.83
;4
.12
)1
.73
(0.9
4;
2.4
9)
6.9
5(6
.87
;7
.01)
6.9
5(6
.87
;7
.01
)0
Ger
man
y-
0.2
4(-
0.9
1;
0.5
3)
2.0
8(1
.99
;2
.18)
-2
.32
(-3
.01;
-1
.52)
5.4
3(4
.66
;6
.11)
3.1
1(3
.01
;3
.20
)2
.32
(1.5
2;
3.0
1)
5.1
9(5
.14
;5
.24)
5.1
9(5
.14
;5
.24
)0
Gre
ece
1.6
7(0
.85
;2
.48)
2.9
1(2
.80
;3
.02)
-1
.24
(-2
.07;
-0
.44)
3.1
(2.2
9;
3.9
2)
1.8
6(1
.77
;1
.96
)1
.24
(0.4
4;
2.0
7)
4.7
7(4
.63
;4
.92)
4.7
7(4
.63
;4
.92
)0
Hu
ng
ary
2.6
0(1
.90
;3
.26)
3.3
9(3
.26
;3
.53)
-0
.79
(-1
.50;
-0
.11)
5.8
2(5
.16
;6
.52)
5.0
3(4
.88
;5
.19
)0
.79
(0.1
1;
1.5
0)
8.4
3(8
.27
;8
.58)
8.4
3(8
.27
;8
.58
)0
Irel
and
1.4
8(0
.54
;2
.48)
2.3
3(2
.17
;2
.50)
-0
.84
( -1
.77;
0.1
6)
3.1
4(2
.11
;4
.08)
2.3
0(2
.14
;2
.47
)0
.84
(-0
.16
;1
.77)
4.6
3(4
.38
;4
.90)
4.6
3(4
.38
;4
.90
)0
Ital
y-
0.4
4(-
0.9
2;
0.0
7)
2.2
7(2
.20
;2
.34)
-2
.71
(-3
.19;
-2
.21)
5.9
6(5
.47
;6
.44)
3.2
5(3
.18
;3
.32
)2
.71
(2.2
1;
3.1
9)
5.5
3(5
.46
;5
.58)
5.5
3(5
.46
;5
.58
)0
Lat
via
1.9
2(0
.92
;2
.90)
4.2
7(4
.03
;4
.49)
-2
.35
(-3
.37;
-1
.38)
8.8
9(7
.92
;9
.84)
6.5
4(6
.28
;6
.80
)2
.35
(1.3
8;
3.3
7)
10
.81
(10
.51;
11
.11
)1
0.8
1(1
0.5
1;
11
.11
)0
Lit
huan
ia3
.67
(2.8
1;
4.5
6)
5.2
7(5
.05
;5
.50)
-1
.60
(-2
.42;
-0
.72)
7.9
8(7
.13
;8
.83)
6.3
8(6
.14
;6
.60
)1
.6(0
.72
;2
.42
)1
1.6
5(1
1.3
7;
11
.92
)1
1.6
5(1
1.3
7;
11
.92
)0
Lu
xem
bo
urg
0.7
7(-
0.7
0;
2.1
3)
2.3
3(1
.90
;2
.77)
-1
.56
(-2
.97;
-0
.23)
4.2
7(2
.80
;5
.61)
2.7
1(2
.26
;3
.16
)1
.56
(0.2
3;
2.9
7)
5.0
4(4
.33
;5
.76)
5.0
4(4
.33
;5
.76
)0
Mal
ta1
.01
(-0
.02;
2.1
6)
2.6
2(2
.19
;3
.08)
-1
.61
(-2
.60;
-0
.54)
3.8
3(2
.81
;4
.84)
2.2
2(1
.84
;2
.58
)1
.61
(0.5
4;
2.6
0)
4.8
4(4
.14
;5
.58)
4.8
4(4
.14
;5
.58
)0
Net
her
lands
-1
.98
(-3
.12;
-0
.79
)2
.18
(2.0
0;
2.3
7)
-4
.17
(-5
.33;
-2
.99)
6.2
2(5
.03
;7
.40)
2.0
5(1
.87
;2
.22
)4
.17
(2.9
9;
5.3
3)
4.2
3(4
.12
;4
.34)
4.2
3(4
.12
;4
.34
)0
Po
lan
d4
.24
(3.7
8;
4.7
8)
4.3
1(4
.19
;4
.43)
-0
.06
(-0
.55;
0.4
7)
4.3
4(3
.79
;4
.82)
4.2
8(4
.16
;4
.39
)0
.06
(-0
.47
;0
.55)
8.5
9(8
.51
;8
.66)
8.5
9(8
.51
;8
.66
)0
Po
rtu
gal
-1
.97
(-2
.94;
-1
.02
)2
.52
(2.3
8;
2.6
5)
-4
.49
(-5
.47;
-3
.58)
8.5
5(7
.61
;9
.52)
4.0
5(3
.90
;4
.21
)4
.49
(3.5
8;
5.4
7)
6.5
7(6
.44
;6
.73)
6.5
7(6
.44
;6
.73
)0
Slo
vak
ia-
0.0
1(-
0.8
2;
0.8
5)
2.6
5(2
.47
;2
.83)
-2
.66
(-3
.48;
-1
.76)
7.8
5(6
.99
;8
.65)
5.1
9(4
.99
;5
.40
)2
.66
(1.7
6;
3.4
8)
7.8
4(7
.64
;8
.04)
7.8
4(7
.64
;8
.04
)0
Slo
ven
ia3
.67
(2.5
2;
4.8
5)
3.8
3(3
.54
;4
.12)
-0
.16
(-1
.32;
1.0
8)
3.8
1(2
.65
;4
.97)
3.6
5(3
.39
;3
.92
)0
.16
(-1
.08
;1
.32)
7.4
8(7
.14
;7
.84)
7.4
8(7
.14
;7
.84
)0
Sp
ain
-0
.40
( -1
.08;
0.2
0)
3.2
2(3
.12
;3
.33)
-3
.63
(-4
.28;
-3
.02)
7.0
0(6
.40
;7
.67)
3.3
7(3
.26
;3
.48
)3
.63
(3.0
2;
4.2
8)
6.5
9(6
.52
;6
.67)
6.5
9(6
.52
;6
.67
)0
Sw
eden
0.3
5(-
0.8
9;
1.6
4)
2.8
3(2
.65
;3
.03)
-2
.48
(-3
.76;
-1
.21)
3.8
2(2
.56
;5
.07)
1.3
4(1
.17
;1
.50
)2
.48
(1.2
1;
3.7
6)
4.1
7(4
.02
;4
.33)
4.1
7(4
.02
;4
.33
)0
Un
ited
Kin
gd
om
0.0
9(-
0.6
6;
0.8
1)
2.4
7(2
.39
;2
.56)
-2
.38
(-3
.12;
-1
.66)
4.2
0(3
.49
;4
.95)
1.8
2(1
.74
;1
.90
)2
.38
(1.6
6;
3.1
2)
4.2
9(4
.23
;4
.36)
4.2
9(4
.23
;4
.36
)0
EU
-25
0.5
5(0
.37
;0
.74)
2.8
6(2
.83
;2
.89)
-2
.31
(-2
.50;
-2
.12)
5.4
6(5
.27
;5
.64)
3.1
5(3
.12
;3
.17
)2
.31
(2.1
2;
2.5
0)
6.0
1(5
.98
;6
.03)
6.0
1(5
.98
;6
.03
)0
Val
ues
inp
aren
thes
esar
e9
5%
con
fid
ence
inte
rval
Gender differences in HLY within the EU 147
123

activity limitations in women reduces the gender difference
in HLY. The size of these two opposing effects varies
according to the country: women’s disability disadvantage
cancels out women’s mortality advantage in seven coun-
tries so that in these countries men have a longer
expectation of life without activity limitations.
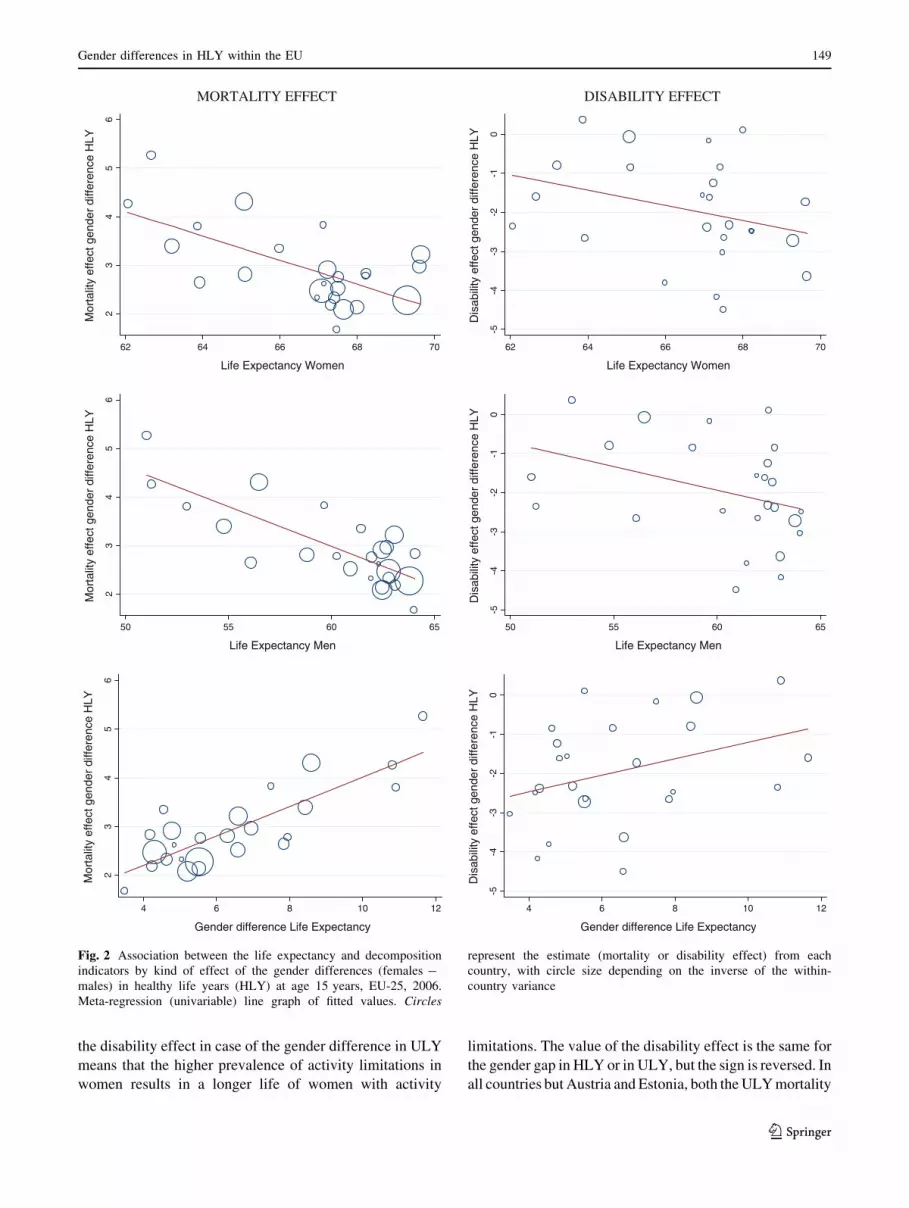
Figure 2 shows the results of six different univariable
meta-regression analyses. In the left column, the contri-
bution of mortality to the gender gap in HLY is presented
as a function of women’s LE, men’s LE and gender dif-
ference in LE. The right column presents the disability
effect. When women’s or men’s LE is larger, the HLY
gender gap is reduced mainly because women’s mortality
advantage is smaller but also to a lesser extent due to a
larger disability disadvantage although the latter did not
reach statistical significance (Table 3a). For example, a
1-year increase in women’s LE goes along with a 0.25-year
decrease of the mortality effect of the HLY gender gap
(coefficientwomen’s LE: -0.25, Table 3a) while the effect of
women’s disability disadvantage is larger (coeffi-
cientwomen’s LE: -0.20, Table 3a). For every increase of
1 year in women’s LE, the HLY gender gap is reduced by
0.45 years [(-0.25) ? (-0.20)].
The wider the gender gap in LE, the larger the gender
difference in HLY due to a larger mortality women
advantage (coefficientLE_gender_gap: 0.30), and a smaller
women’s disability disadvantage (coefficientLE_gender_gap:
0.21). For every increase of 1 year in the gender gap in LE,
the HLY gender gap increases by 0.51 years
[(0.30) ? (0.21)]. Only the mortality component of the
HLY gender difference is significantly associated with the
gender difference in LE and the association remains sig-
nificant after adjustment for women’s LE.
When the health of populations improves (measured by
a higher LE, higher HLY or a lower ULY), gender dif-
ferences in mortality at older ages (50 years and above)
contribute more proportionally to the mortality effect of the
gender difference in HLY. For instance, for every increase
of 1 year in women’s LE, the gender differences in the
age group 50? years contribute almost 3 % more to the
mortality effect of the gender difference in HLY (coeffi-
cientwomen’s LE is 2.96, Table 4a). On the other hand, when
the gender difference in either LE, HLY or ULY is large,
the percentage of the mortality effect on the gender dif-
ference in HLY that can be attributed to gender differences
in mortality at older ages decreases (e.g., a decrease of
3.3 % for every increase of 1 year in the gender difference
in LE). None of the associations of the relative contribution
of older age to the disability effect on the gender difference
in HLY were statistically significant.
Decomposition of the gender difference in ULY
A positive value of the ULY mortality effect indicates that
women’s mortality advantage results in longer life with
activity limitations in women (Table 2). A positive value of
020
4060
80
le_w le_m hly_w hly_m uly_w uly_m
-50
510
15
dif_le dif_hly mef_hly def_hly dif_uly mef_uly def_uly
*: m = males, w = women le_m, le_w: life expectancy men, women hly_m, hly_w: healthy life years men, women uly_m, uly_w: unhealthy life years men, women
*: dif_le: gender difference (women minus men) in LE dif_hly: gender difference in HLY mef_hly: mortality effect gender difference in HLY def_hly: disability effect gender difference in HLY dif_uly: gender difference in ULY mef_uly: mortality effect gender difference in ULY def_uly: disability effect gender difference in ULY
Fig. 1 Distribution (in years) of life expectancy (le_*), healthy and unhealthy live years (hly_*, uly_*), the gender differences (female - male;
dif_*) and the decomposition indicators by kind of effect (mortality (mef_*) and disability (def_*) effect) at age 15 years, EU-25, 2006
148 H. Van Oyen et al.
123
the disability effect in case of the gender difference in ULY
means that the higher prevalence of activity limitations in
women results in a longer life of women with activity
limitations. The value of the disability effect is the same for
the gender gap in HLY or in ULY, but the sign is reversed. In
all countries but Austria and Estonia, both the ULY mortality
ID TCEFFE YTILATROM SABILITY EFFECT 2
34
56
Mor
talit
y ef
fect
gen
der
diffe
renc
e H
LY
62 64 66 68 70
Life Expectancy Women
-5-4
-3-2
-10
Dis
abili
ty e
ffect
gen
der
diffe
renc
e H
LY
62 64 66 68 70
Life Expectancy Women
23
45
6
Mor
talit
y ef
fect
gen
der
diffe
renc
e H
LY
50 55 60 65
Life Expectancy Men
-5-4
-3-2
-10
Dis
abili
ty e
ffect
gen
der
diffe
renc
e H
LY
50 55 60 65
Life Expectancy Men
23
45
6
Mor
talit
y ef
fect
gen
der
diffe
renc
e H
LY
4 6 8 10 12
Gender difference Life Expectancy
-5-4
-3-2
-10
Dis
abili
ty e
ffect
gen
der
diffe
renc
e H
LY
4 6 8 10 12
Gender difference Life Expectancy
Fig. 2 Association between the life expectancy and decomposition
indicators by kind of effect of the gender differences (females -
males) in healthy life years (HLY) at age 15 years, EU-25, 2006.
Meta-regression (univariable) line graph of fitted values. Circles
represent the estimate (mortality or disability effect) from each
country, with circle size depending on the inverse of the within-
country variance
Gender differences in HLY within the EU 149
123

Ta
ble
3A
sso
ciat
ion
of
the
mo
rtal
ity
and
dis
abil
ity
effe
cto
fth
eg
end
erd
iffe
ren
ces
iny
ears
(fem
ales
-m
ales
)in
hea
lth
yli
fey
ears
(HL
Y)
and
inu
nh
ealt
hy
life
yea
rs(U
LY
)w
ith
the
life
exp
ecta
ncy
(LE
),H
LY
and
UL
Yat
age
15
yea
rs,
EU
,2
00
6
Mo
rtal
ity
effe
ctD
isab
ilit
yef
fect
Mo
del
Ty
pe
1(9
un
ivar
iab
lem
od
els)
aM
od
elT
yp
e2
(3m
ult
ivar
iab
lem
od
els)
bM
od
elT
yp
e1
(9u
niv
aria
ble
mo
del
s)M
od
elT
yp
e2
(3m
ult
ivar
iab
lem
od
els)
(a)
Gen
der
dif
fere
nce
inH
LY
LE
LE
1:
LE
men
-0
.16
c*
*1
:L
Em
en-
0.1
2
2:
LE
wo
men
-0
.25
**
1:
LE
wo
men
-0
.05
2:
LE
wo
men
-0
.20
1:
LE
wo
men
-0
.08
3:
Gen
der
dif
fere
nce
LE
0.3
0*
*1
:G
end
erd
iffe
ren
ceL
E0
.27
**
3:
Gen
der
dif
fere
nce
LE
0.2
11
:G
end
erd
iffe
ren
ceL
E0
.16
HL
YH
LY
4:
HL
Ym
en-
0.0
8*
*4
:H
LY
men
-0
.10
5:
HL
Yw
om
en-
0.0
62
:H
LY
wo
men
-0
.03
5:
HL
Yw
om
en-
0.0
32
:H
LY
wo
men
0.0
3
6:
Gen
der
dif
fere
nce
HL
Y0
.33
**
2:
Gen
der
dif
fere
nce
HL
Y0
.31
**
6:
Gen
der
dif
fere
nce
HL
Y0
.65
**
2:
Gen
der
dif
fere
nce
HL
Y0
.67
**
UL
YU
LY
7:
UL
Ym
en-
0.0
47
:U
LY
men
0.1
0
8:
UL
Yw
om
en0
.01
3:
UL
Yw
om
en-
0.0
88
:U
LY
wo
men
-0
.01
3:
UL
Yw
om
en0
.19
*
9:
Gen
der
dif
fere
nce
UL
Y0
.16
3:
Gen
der
dif
fere
nce
UL
Y0
.28
*9
:G
end
erd
iffe
ren
ceU
LY
-0
.35
**
3:
Gen
der
dif
fere
nce
UL
Y-
0.6
3*
*
(b)
Gen
der
dif
fere
nce
inU
LY
LE
LE
1:
LE
men
-0
.35
**
1:
LE
men
0.1
2
2:
LE
wo
men
-0
.49
**
1:
LE
wo
men
0.0
52
:L
Ew
om
en0
.20
1:
LE
wo
men
0.0
8
3:
Gen
der
dif
fere
nce
LE
0.7
0*
*1
:G
end
erd
iffe
ren
ceL
E0
.73
**
3:
Gen
der
dif
fere
nce
LE
-0
.21
1:
Gen
der
dif
fere
nce
LE
-0
.16
HL
YH
LY
4:
HL
Ym
en-
0.2
9*
*4
:H
LY
men
0.1
0*
5:
HL
Yw
om
en-
0.3
1*
*2
:H
LY
wo
men
-0
.28
**
5:
HL
Yw
om
en0
.03
2:
HL
Yw
om
en-
0.0
3
6:
Gen
der
dif
fere
nce
HL
Y0
.49
**
2:
Gen
der
dif
fere
nce
HL
Y0
.32
**
6:
Gen
der
dif
fere
nce
HL
Y-
0.6
5*
*2
:G
end
erd
iffe
ren
ceH
LY
-0
.67
**
UL
YU
LY
7:
UL
Ym
en0
.29
**
7:
UL
Ym
en0
.10
8:
UL
Yw
om
en0
.31
**
3:
UL
Yw
om
en0
.19
8:
UL
Yw
om
en-
0.0
13
:U
LY
wo
men
0.1
9*
9:
Gen
der
dif
fere
nce
UL
Y0
.65
**
3:
Gen
der
dif
fere
nce
UL
Y0
.36
*9
:G
end
erd
iffe
ren
ceU
LY
-0
.35
**
3:
Gen
der
dif
fere
nce
UL
Y-
0.6
3*
*
*S
ign
ifica
nt
atp
=0
.05
;*
*si
gn
ifica
nt
atp
=0
.01
aM
od
elT
yp
e1
:u
niv
aria
ble
met
a-re
gre
ssio
nb
Mo
del
Ty
pe
2:
mu
ltiv
aria
ble
met
a-re
gre
ssio
n:
the
asso
ciat
ion
of
gen
der
dif
fere
nce
inth
eL
E,
HL
Y,
or
UL
Yw
ith
the
mo
rtal
ity
effe
cto
rd
isab
ilit
yef
fect
(in
yea
rs)
of
the
gen
der
dif
fere
nce
in
(a)
HL
Yo
rin
(b)
UL
Yis
adju
sted
for
the
du
rati
on
of
LE
,H
LY
,o
rU
LY
amo
ng
fem
ales
cC
oef
fici
ent
of
the
met
a-re
gre
ssio
nin
dic
atin
gth
ech
ang
ein
the
dep
end
ent
var
iab
les
(e.g
.m
ort
alit
yef
fect
or
dis
abil
ity
effe
ct(i
ny
ears
)o
fth
eg
end
erd
iffe
ren
cein
(a)
HL
Yo
rin
(b)
UL
Y)
in
fun
ctio
no
fth
ech
ang
ein
the
ind
epen
den
tv
aria
ble
s[L
E,
HL
Y,
or
UL
Y,
Gen
der
dif
fere
nce
(in
LE
,H
LY
,o
rU
LY
)in
yea
rs]
150 H. Van Oyen et al.
123
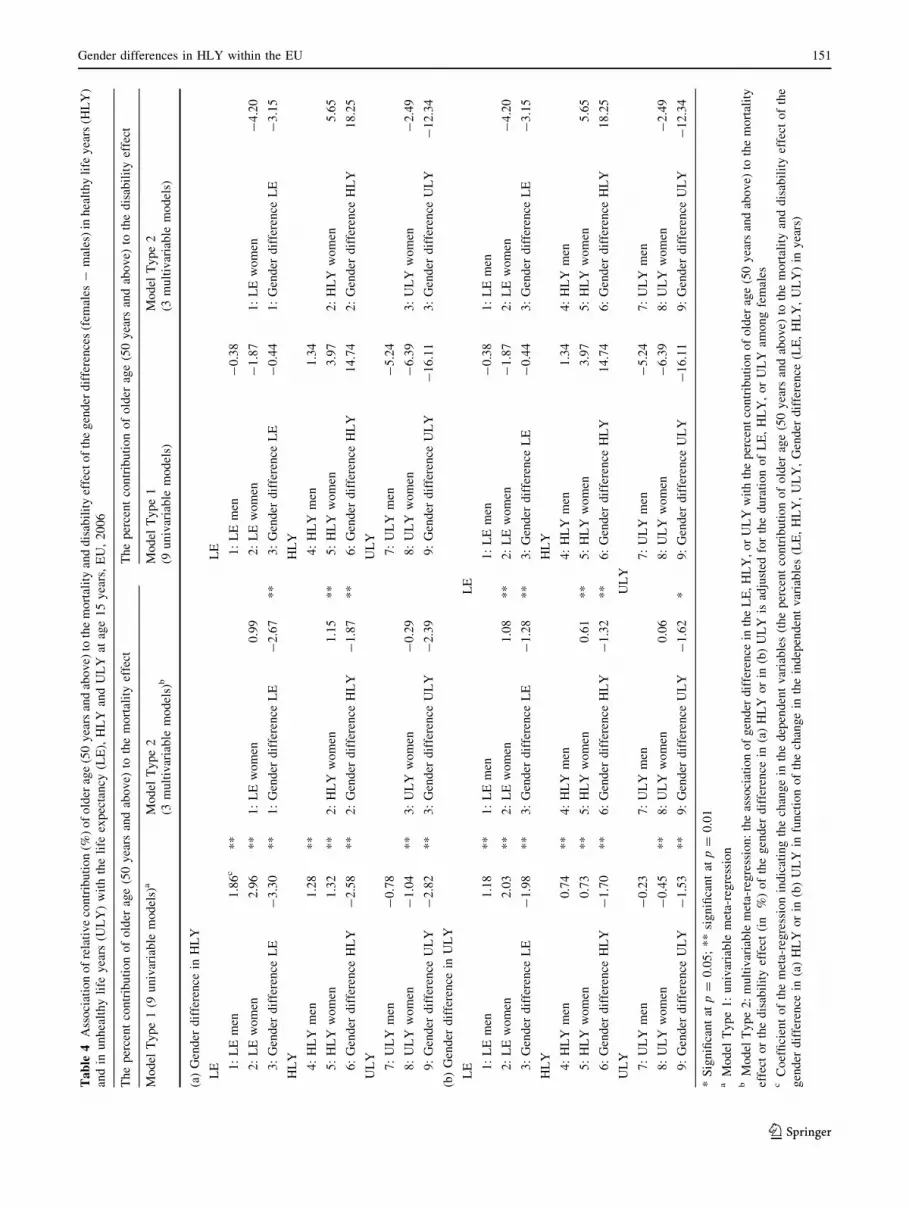
Ta
ble
4A
sso
ciat
ion
of
rela
tiv
eco
ntr
ibu
tio
n(%
)o
fo
lder
age
(50
yea
rsan
dab
ov
e)to
the
mo
rtal
ity
and
dis
abil
ity
effe
cto
fth
eg
end
erd
iffe
ren
ces
(fem
ales
-m
ales
)in
hea
lth
yli
fey
ears
(HL
Y)
and
inu
nh
ealt
hy
life
yea
rs(U
LY
)w
ith
the
life
exp
ecta
ncy
(LE
),H
LY
and
UL
Yat
age
15
yea
rs,
EU
,2
00
6
Th
ep
erce
nt
con
trib
uti
on
of
old
erag
e(5
0y
ears
and
abo
ve)
toth
em
ort
alit
yef
fect
Th
ep
erce
nt
con
trib
uti
on
of
old
erag
e(5
0y
ears
and
abo
ve)
toth
ed
isab
ilit
yef
fect
Mo
del
Ty
pe
1(9
un
ivar
iab
lem
od
els)
aM
od
elT
yp
e2
(3m
ult
ivar
iab
lem
od
els)
bM
od
elT
yp
e1
(9u
niv
aria
ble
mo
del
s)
Mo
del
Ty
pe
2
(3m
ult
ivar
iab
lem
od
els)
(a)
Gen
der
dif
fere
nce
inH
LY
LE
LE
1:
LE
men
1.8
6c
**
1:
LE
men
-0
.38
2:
LE
wo
men
2.9
6*
*1
:L
Ew
om
en0
.99
2:
LE
wo
men
-1
.87
1:
LE
wo
men
-4
.20
3:
Gen
der
dif
fere
nce
LE
-3
.30
**
1:
Gen
der
dif
fere
nce
LE
-2
.67
**
3:
Gen
der
dif
fere
nce
LE
-0
.44
1:
Gen
der
dif
fere
nce
LE
-3
.15
HL
YH
LY
4:
HL
Ym
en1
.28
**
4:
HL
Ym
en1
.34
5:
HL
Yw
om
en1
.32
**
2:
HL
Yw
om
en1
.15
**
5:
HL
Yw
om
en3
.97
2:
HL
Yw
om
en5
.65
6:
Gen
der
dif
fere
nce
HL
Y-
2.5
8*
*2
:G
end
erd
iffe
ren
ceH
LY
-1
.87
**
6:
Gen
der
dif
fere
nce
HL
Y1
4.7
42
:G
end
erd
iffe
ren
ceH
LY
18
.25
UL
YU
LY
7:
UL
Ym
en-
0.7
87
:U
LY
men
-5
.24
8:
UL
Yw
om
en-
1.0
4*
*3
:U
LY
wo
men
-0
.29
8:
UL
Yw
om
en-
6.3
93
:U
LY
wo
men
-2
.49
9:
Gen
der
dif
fere
nce
UL
Y-
2.8
2*
*3
:G
end
erd
iffe
ren
ceU
LY
-2
.39
9:
Gen
der
dif
fere
nce
UL
Y-
16
.11
3:
Gen
der
dif
fere
nce
UL
Y-
12
.34
(b)
Gen
der
dif
fere
nce
inU
LY
LE
LE
1:
LE
men
1.1
8*
*1
:L
Em
en1
:L
Em
en-
0.3
81
:L
Em
en
2:
LE
wo
men
2.0
3*
*2
:L
Ew
om
en1
.08
**
2:
LE
wo
men
-1
.87
2:
LE
wo
men
-4
.20
3:
Gen
der
dif
fere
nce
LE
-1
.98
**
3:
Gen
der
dif
fere
nce
LE
-1
.28
**
3:
Gen
der
dif
fere
nce
LE
-0
.44
3:
Gen
der
dif
fere
nce
LE
-3
.15
HL
YH
LY
4:
HL
Ym
en0
.74
**
4:
HL
Ym
en4
:H
LY
men
1.3
44
:H
LY
men
5:
HL
Yw
om
en0
.73
**
5:
HL
Yw
om
en0
.61
**
5:
HL
Yw
om
en3
.97
5:
HL
Yw
om
en5
.65
6:
Gen
der
dif
fere
nce
HL
Y-
1.7
0*
*6
:G
end
erd
iffe
ren
ceH
LY
-1
.32
**
6:
Gen
der
dif
fere
nce
HL
Y1
4.7
46
:G
end
erd
iffe
ren
ceH
LY
18
.25
UL
YU
LY
7:
UL
Ym
en-
0.2
37
:U
LY
men
7:
UL
Ym
en-
5.2
47
:U
LY
men
8:
UL
Yw
om
en-
0.4
5*
*8
:U
LY
wo
men
0.0
68
:U
LY
wo
men
-6
.39
8:
UL
Yw
om
en-
2.4
9
9:
Gen
der
dif
fere
nce
UL
Y-
1.5
3*
*9
:G
end
erd
iffe
ren
ceU
LY
-1
.62
*9
:G
end
erd
iffe
ren
ceU
LY
-1
6.1
19
:G
end
erd
iffe
ren
ceU
LY
-1
2.3
4
*S
ign
ifica
nt
atp
=0
.05
;*
*si
gn
ifica
nt
atp
=0
.01
aM
od
elT
yp
e1
:u
niv
aria
ble
met
a-re
gre
ssio
nb
Mo
del
Ty
pe
2:
mu
ltiv
aria
ble
met
a-re
gre
ssio
n:
the
asso
ciat
ion
of
gen
der
dif
fere
nce
inth
eL
E,
HL
Y,
or
UL
Yw
ith
the
per
cen
tco
ntr
ibu
tio
no
fo
lder
age
(50
yea
rsan
dab
ov
e)to
the
mo
rtal
ity
effe
cto
rth
ed
isab
ilit
yef
fect
(in
%)
of
the
gen
der
dif
fere
nce
in(a
)H
LY
or
in(b
)U
LY
isad
just
edfo
rth
ed
ura
tio
no
fL
E,
HL
Y,
or
UL
Yam
on
gfe
mal
esc
Co
effi
cien
to
fth
em
eta-
reg
ress
ion
ind
icat
ing
the
chan
ge
inth
ed
epen
den
tv
aria
ble
s(t
he
per
cen
tco
ntr
ibu
tio
no
fo
lder
age
(50
yea
rsan
dab
ov
e)to
the
mo
rtal
ity
and
dis
abil
ity
effe
cto
fth
e
gen
der
dif
fere
nce
in(a
)H
LY
or
in(b
)U
LY
infu
nct
ion
of
the
chan
ge
inth
ein
dep
end
ent
var
iab
les
(LE
,H
LY
,U
LY
,G
end
erd
iffe
ren
ce(L
E,
HL
Y,
UL
Y)
iny
ears
)
Gender differences in HLY within the EU 151
123

and disability effect contribute to the fact that women are
living more years with activity limitations. The mortality
effect is positive in all countries [median ULY mortality
effect: 3.4 years (IQR 2.5, range 5.9, Fig. 1)]. In all but two
countries (Austria and Estonia), women also live more years
with activity limitations because they have a higher preva-
lence of activity limitations.
High LE in either females or males, is associated with a
reduction of the gender difference in ULY mainly since
women’s mortality advantage is smaller [e.g., the coeffi-
cientwomen’s LE is -0.49 or a 1-year increase in women’s
LE is associated with a decrease in the mortality effect of
the gender difference in ULY by almost 0.5 years
(Table 3b)]. When the gender gap in LE is wide the gender
gap in ULY is large mainly because of women’s larger
mortality advantage (coefficient 0.70; Table 3b). The
associations between the disability effect of the gender
gaps in ULY and the LE indicators were not statistically
significant. In populations with better health, there is a shift
of the age groups contributing to the mortality effect of the
gender difference in ULY towards older ages [coeffi-
cientwomen’s LE is 2.03: the percent contribution of the age
groups 50? years to the mortality effect of the gender
difference in ULY increases with 2 % when the LE in
women is 1 year higher (Table 4b)]. When the gender
difference in either LE, HLY or ULY is larger, a smaller
part of the mortality effect on the gender difference in ULY
can be attributed to difference in mortality at older ages
(coefficientgender difference LE is -1.98 %, Table 4b).
Discussion
In this paper, we approach the health–survival paradox by
using composite indicators, HLY and ULY, which contain
information on both components of the paradox: mortality
and the prevalence of (ill)-health. Mortality and disability
tend to play in opposite ways on the magnitude of the
gender differentials in HLY. While women’s longer life
and higher disability prevalence translate into more years
to be lived with disability by women, in all but two
countries the disability effect compensates the mortality
effect reducing the gender difference in HLY. Even more,
in some countries, the disability effect overpasses the
mortality effect and women live fewer years without dis-
ability. The health–survival paradox appears to be a
function of the level of population health indicators and
their gender difference. We observed that in populations
with a high LE, the gender difference in HLY is small or
even negative. Current cross-sectional analysis does not
recognize that the health trajectories and the evolution of
the LE during the last decades of the twentieth century
were substantially different in Western European countries
compared to countries of Central and Eastern Europe or the
Baltic States (Leon 2011). Therefore, it is important to
stress that a small or negative gender difference in HLY
may mask important evolutions in the gender differences in
mortality and/or activity limitations as it is a result of two
opposing forces of the paradox: the survival with a smaller
women’s mortality advantage and the health part with a
larger women’s disability disadvantage. This observation is
consistent with reports on trends in health expectancy
indicators over time where more often evidence for com-
pression of morbidity is reported among men alongside
evidence for expansion among women (Robine et al. 2005;
Van Oyen et al. 2008). The differences in evolution by
gender in populations with a high LE may result from
women having already reached extreme older ages and that
changes in health are much more concentrated at the
frontier of human life span. In populations with low life
expectancy, we observed that the gender gap in HLY or
ULY is large predominantly because of the large gender
difference in mortality with the gender difference in the
prevalence of activity limitations being less important. In
populations with less favourable population health indica-
tors such as low LE, low HLY and high ULY, the hardship
among men is already evident at young ages (15–49 years),
with men having higher mortality alongside a prevalence of
activity limitations which is closer to that of women,
yielding both an important mortality disadvantage and a
lack of disability advantage relative to women. This con-
firms the double burden on men living in less healthy
populations (countries of Central and Eastern Europe or the
Baltic States) since together with their shorter life, they
also have a shorter healthy life and a longer unhealthy life
with a poorer health and higher mortality starting at young
ages (Nusselder et al. 2010b).
Our analysis has several strengths. The country data
were not pooled and the substantial heterogeneity in HLY
and ULY among the EU member states is used (Jagger
et al. 2008). The uncertainty around the estimates is
accounted for in the meta-regression. The gender differ-
ence in HLY and ULY were subsequently separated into
two parts to disentangle the health–survival paradox: one
that can be explained by a differential age-specific mor-
tality selection and the other that is due to a different age-
specific prevalence of activity limitations.
Limitations of the study that should be considered are
related to the cross-sectional design and the Sullivan
method. The latter produces health expectancy indicators
which are not period indicators and which may introduce
bias in the absence of a steady state (Barendregt et al. 1994;
Mathers and Robine 1997). The decomposition compo-
nents do not represent the underlying processes of the
incidence and recovery of activity limitations (Nusselder
and Looman 2004). Further, the SILC survey is limited to
152 H. Van Oyen et al.
123
the community dwelling population and no information is
available on the health status of the institutionalized pop-
ulation. Not only does the proportion of the population
within institutions differ between the EU countries, but the
type of care-related institutions is also heterogeneous.
Ignoring differences in health status between residents in
the community and in institutions probably leads to an
overestimation of the expected years without activity lim-
itations. It is unknown if this bias occurs similarly in men
and women in which case it would not affect gender dif-
ferences. Even so, the bias may be larger in countries with
a higher proportion of the population in institutions. A final
limitation is related to the remaining problems in the har-
monization of the GALI instrument (Van Oyen et al. 2010)
Multiple causes have been considered to explain the
mechanisms which drive the health–survival paradox
between the genders. The impact of methodological issues
such as gender differences in survey participation or in
reporting health problems have been minimized (Oksuzyan
et al. 2009). Among the biological explanations most
attention has been given to hormonal, autoimmune and
genetic differences (Oksuzyan et al. 2008). The European
LE experience during the most recent decades of last
century suggests an impact of lifestyles and environmental
factors including political, social and economic determi-
nants of health, improvement of education, standards of
living and health care (Leon 2011). Young men were more
vulnerable to the negative health consequences of the rapid
economic transition in the former communist states
resulting in a high mortality of injuries, violence, cardio-
vascular diseases and cancers caused by high levels of
alcohol consumption, especially binge drinking, smoking
and poor nutrition (Mckee and Shkolnikov 2001). The
lower quality of medical care in the Central and Eastern
European Countries or the Baltic States may have further
contributed to the more unfavourable health position of
men (Newey et al. 2004). Both HLY and HLY gender gap
are associated with country-specific macro-level indicators
which are less favourable in countries of Central and
Eastern Europe or the Baltic States (Jagger et al. 2008; Van
Oyen et al. 2010). More specifically, the gender gap in
HLY decreased as the gross domestic product, the expen-
diture on elderly care and the lifelong learning among men
increased while it increased with a growing inequality in
the income distribution (Van Oyen et al. 2010). Social
position is an important determinant of inequality in health
expectancy indictors (Bossuyt et al. 2004; Cambois et al.
2001; Crimmins and Saito 2001; Davis et al. 1999; Pe-
renboom et al. 2005; Van Oyen et al. 2011). Women and
especially older women have a lower social position as a
result of a lower education or socio-economic position and
this may affect the gender difference in health and func-
tional disability (Bird and Rieker 2008). Several lifestyle
factors, which have a differential uptake in men compared
to women, not only affect LE, but are also associated with
expected years of life without disability (Juel et al. 2008).
Some of the lifestyle factors may especially influence
mortality and reduce both the years lived with and without
limitations; while other factors such as obesity mainly
expand the years lived with disability (Reuser et al. 2009).
Men have an excess of diseases which shorten life, while
the disease pattern in women creates an excess in non-
lethal conditions (NCHS 2009). Contributing causes of
morbidity to the mortality effect of the gender difference in
the disability-free life expectancy in the Netherlands were
heart diseases, cancer, and COPD. Causes contributing to
the disability effect of the gender difference in DFLE are
heart disease, arthritis, back complaints, diabetes and
COPD (Nusselder and Looman 2004). Within Europe, the
wide range of gender differences in LE, HLY or ULY;
the changing importance of either the mortality effect, the
disability effect or the age groups contributing to the
gender difference in HLY or ULY, is at the same time a
statement that the health–survival paradox is not an arte-
fact, but whatever determines the health–survival paradox
is dependent on modifiable societal, social and behavioural
factors.
The novelty of this paper studying the health–survival
paradox is the use of HLY and the exploration of the two
components of the gender difference in HLY: difference
due to inequality in survival and difference due to
inequality in disability. We observed large inequalities in
the gender difference in health between European countries
which corroborate our hypotheses. In populations with a
high LE the gender difference in HLY is smaller because of
the additive effect of a reduced mortality effect and a larger
disability effect. In countries with a lower level of popu-
lation health as indicated by a low LE, a low HLY and a
large ULY, men are in the worst position having not only a
higher mortality compared to women but also a high
prevalence of activity limitations. Additionally, in contrast
to men in populations with a better health profile, the ill-
health of these men begins early in life.
Acknowledgments This work was supported by the European
Public Health Programme (EHLEIS Project Grant Number 2006 109).
Open Access This article is distributed under the terms of the
Creative Commons Attribution License which permits any use, dis-
tribution, and reproduction in any medium, provided the original
author(s) and the source are credited.
References
Arriaga EE (1984) Measuring and explaining the change in life
expectancies. Demography 21:83–96
Gender differences in HLY within the EU 153
123
Austad SN (2006) Why women live longer than men: sex differences
in longevity. Gend Med 3:79–92
Barendregt JJ, Bonneux L, Van der Maas PJ (1994) Health
expectancy: an indicator for change? J Epidemiol Community
Health 48:482–487
Barford A, Dorling D, Smith G, Shaw M (2006) Life expectancy:
women now on top everywhere. BMJ 332:808
Bird CE, Rieker PP (2008) Gender and health: the effect of
constrained choice and social policies. Cambridge University
Press, New York
Bossuyt N, Gadeyne S, Deboosere P, Van Oyen H (2004) Socio-
economic inequalities in healthy expectancy in Belgium. Public
Health 118:3–10
Cambois E, Robine JM, Hayard M (2001) Social inequality in
disability-free life expectancy in the French male population,
1980–1991. Demography 38:513–524
Case A, Paxson C (2005) Sex differences in morbidity and mortality.
Demography 42:189–214
Cox B, Van Oyen H, Cambois E, Jagger C, Le Roy S, Robine JM,
Romieu I (2009) The reliability of the Minimum European
Health Module. Int J Public Health 54:55–60
Crimmins EM, Saito Y (2001) Trends in healthy life expectancy in
the United States, 1970–1990: gender, racial, and educational
differences. Soc Sci Med 52:1629–1641
Davis P, Graham P, Pearce N (1999) Health expectancy in New
Zealand, 1981–1991: social variations and trends in a period of
rapid social and economic change. J Epidemiol Community
Health 53:519–527
Efron B, Tibshirani R (1993) An introduction to the bootstrap.
Chapman and Hall, New York
Eurostat (2009) Comparative final EU quality report 2006. European
Commission, Luxembourg
Gjonca A, Tomassini C, Toson B, Smallwood S (2005) Sex
differences in mortality. A comparison of the United Kingdom
and other developed countries. Health Stat Q 26:6–16
Jacobsen R, Oksuzyan A, Engberg H, Jeune B, Vaupel J, Christensen
K (2008) Sex differential in mortality trends of old-aged Danes:
a nation wide study of age, period and cohort effects. Eur J
Epidemiol 23:723–730
Jagger C, Cox B, Le Roy S, Clavel A, Robine JM, Romieu I, Van
Oyen H (2007) Health expectancy calculation by the Sullivan
method: a practical guide. EHEMU, Montpellier
Jagger C, Gillies C, Moscone F, Cambois E, Van Oyen H, Nusselder
W, Robine JM (2008) Inequalities in healthy life years in the 25
countries of the European Union in 2005: a cross-national meta-
regression analysis. Lancet 372:2124–2131
Jagger C, Gillies C, Cambois E, Van Oyen H, Nusselder W, Robine
JM (2010) The Global Activity Limitation Index measured
function and disability similarly across European countries.
J Clin Epidemiol 63:892–899
Juel K, Sorensen J, Bronnum-Hansen H (2008) Risk factors and
public health in Denmark. Scand J Public Health 36:211–227
Leon DA (2011) Trends in European life expectancy: a salutary view.
Int J Epidemiol 40:271–277
Mathers CD, Robine JM (1997) How good is Sullivan’s method for
monitoring changes in population health expectancies. J Epidem-
iol Community Health 51:80–86
McCartney G, Mahmood L, Leyland AH, Batty GD, Hunt K (2011)
Contribution of smoking-related and alcohol-related deaths to
the gender gap in mortality: evidence from 30 European
countries. Tob Control 20:166–168
Mckee M, Shkolnikov V (2001) Understanding the toll of premature
death among men in Eastern Europe. BMJ 323:1051–1055
NCHS (2009) Health, United States, 2008, with chartbook. National
Center for Health Statistics, Hyattsville
Newey C, Nolte E, Mckee M, Mossialos E (2004) Avoidable
mortality in the enlarged European Union. Institut des Sciences
de la Sante, Paris
Nusselder WJ, Looman CWN (2004) Decomposition of differences in
health expectancy by cause. Demography 41:315–334
Nusselder WJ, Looman CW, Mackenbach JP, Huisman M, Van Oyen
H, Deboosere P, Gadeyne S, Kunst AE (2005) The contribution
of specific diseases to educational disparities in disability-free
life expectancy. Am J Public Health 95:2035–2041
Nusselder W, Jagger C, Cox B, Cambois E, Van Oyen H, Robine JM,
EHLEIS Team (2010a) WP7: Decomposition tools. Technical
report on decomposition. EHEMU, Montpellier
Nusselder W, Looman C, Van Oyen H, Robine JM, Jagger C (2010b)
Gender differences in health of EU10 and EU15 populations: the
double burden of EU10 men. Eur J Ageing 7:219–227
Oksuzyan A, Juel K, Vaupel J, Christensen K (2008) Men: good
health and high mortality. Sex differences in health and aging.
Aging Clin Exp Res 20:91–102
Oksuzyan A, Petersen I, Stovring H, Bingley P, Vaupel JW,
Christensen K (2009) The male-female health–survival paradox:
a survey and register study of the impact of sex-specific selection
and information bias. Ann Epidemiol 19:504–511
Pampel FC (2003) Sex differences in mortality from lung cancer in
high-income nations. Demography 40:45–65
Payne S (2004) Gender in lung cancer and smoking research. WHO,
Geneva
Perenboom RJM, van Herten LM, Boshuizen HC, van den Bos GAM
(2005) Life expectancy without chronic morbidity: trends in
gender and socioeconomic disparities. Public Health Rep
120:46–54
Preston SH, Wang H (2006) Sex mortality differences in the United
States: the role of cohort smoking patterns. Demography
43:631–646
Reuser M, Bonneux L, Willekens F (2009) Smoking kills, obesity
disables: a multistate approach of the US Health and Retirement
Survey. Obesity 17:783–789
Robine JM (2006) Summarizing health status. In: Pencheon D, Guest
C, Melzer D, Jam G (eds) Oxford handbook of public health.
Oxford University Press, Oxford, pp 160–168
Robine JM, Jagger C (2003) Creating a coherent set of indicators to
monitor health across Europe: the Euro-REVES 2 project. Eur J
Public Health 13:6–14
Robine JM, Romieu I, Michel JP (2003) Trends in health expectan-
cies. In: Robine JM, Jagger C, Mathers CD, Crimmins E,
Suzman R (eds) Determining health expectancies. Wiley,
Chichester, pp 75–101
Robine JM, Jagger C, Van Oyen H, Cambois E, Romieu I, Clavel A,
Barker G, Le Roy S (2005) Are we living longer, healthier lives
in the EU? Disability-Free Life Expectancy (DFLE) in EU
countries from 1991 to 2003 based on the European Household
Panel. EHEMU, Montpellier
Stiefel MC, Perla RJ, Zell BL (2010) A healthy bottom line: healthy
life expectancy as an outcome measure for health improvement
efforts. Milbank Q 88:30–53
Sullivan DF (1971) A single index of mortality and morbidity.
HSMHA Health Rep 86:347–354
Sutton AJ, Abrams KR (2001) Bayesian methods in meta-analysis and
evidence synthesis. Stat Methods Med Res 10:277–303
Van Oyen H, Van der Heyden J, Perenboom R, Jagger C (2006)
Monitoring population disability: evaluation of a new Global
Activity Limitation Indicator (GALI). Soz Praventiv Med
51:153–161
Van Oyen H, Cox B, Deboosere P, Lorant V (2008) Trends in health
expectancy indicators in the older adults population in Belgium
between 1997 and 2004. Eur J Ageing 5:137–146
154 H. Van Oyen et al.
123
Van Oyen H, Cox B, Jagger C, Cambois E, Nusselder W, Gilles C,
Robine JM (2010) Gender gaps in life expectancy and expected
years with activity limitations at age 50 in the European Union:
associations with macro-level structural indicators. Eur J Ageing
7:229–237
Van Oyen H, Charafeddine R, Deboosere P, Cox B, Lorant V,
Nusselder W, Demarest S (2011) Contribution of mortality and
disability to the secular trend in health inequality at the turn of
century in Belgium. Eur J Public Health 21:781–787
Gender differences in HLY within the EU 155
123