Gender Differences Among College Students
32
From the AERA Online Paper Repository http://www.aera.net/repository Paper Title Making YouTube and Facebook Videos: Gender Differences Among College Students Anu Vedantham, University of Pennsylvania Author(s) Media Creation and Use in Learning Session Title Paper Session Type 4/4/2014 Presentation Date Philadelphia, Pennsylvania Presentation Location Gender Studies, Media, Universities Descriptors Quantitative Methodology SIG-Media, Culture, and Curriculum Unit Each presenter retains copyright on the full-text paper. Repository users should follow legal and ethical practices in their use of repository material; permission to reuse material must be sought from the presenter, who owns copyright. Users should be aware of the . Citation of a paper in the repository should take the following form: [Authors.] ([Year, Date of Presentation]). [Paper Title.] Paper presented at the [Year] annual meeting of the American Educational Research Association. Retrieved [Retrieval Date], from the AERA Online Paper Repository. AERA Code of Ethics
-
Upload
khangminh22 -
Category
Documents
-
view
2 -
download
0
Transcript of Gender Differences Among College Students

From the
AERA Online Paper Repositoryhttp://www.aera.net/repository
Paper Title Making YouTube and Facebook Videos: Gender Differences Among College Students Anu Vedantham, University of PennsylvaniaAuthor(s) Media Creation and Use in LearningSession Title
PaperSession Type4/4/2014Presentation Date
Philadelphia, PennsylvaniaPresentation Location
Gender Studies, Media, UniversitiesDescriptorsQuantitativeMethodology
SIG-Media, Culture, and CurriculumUnit
Each presenter retains copyright on the full-text paper. Repository users should follow legal and ethical practices in their use of repository material; permission to reuse material must be sought from the presenter, who owns copyright. Users should be aware of the .
Citation of a paper in the repository should take the following form: [Authors.] ([Year, Date of Presentation]). [Paper Title.] Paper presented at the [Year] annual meeting of the American Educational Research Association. Retrieved [Retrieval Date], from the AERA Online Paper Repository.
AERA Code of Ethics
MAKING'YOUTUBE'VIDEOS'AND'GENDER''
'
1'
Making YouTube and FaceBook Videos: Gender Differences among College Students
Introduction
Computer use in the United States is gendered in complex ways, with women
demonstrating different preferences than men for video game choices in early childhood (Pinkard
2005), online activities during adolescence (Pryor and Hurtado 2008), and career decisions in
adulthood (Ahuja 2002). Women have been underrepresented in computer programming and
graphic design (Camp 1997; Cohoon and Aspray 2006), but are achieving parity in social
networking (Ellison, Steinfield, and Lampe 2006). Studies point to gender differences in
attitudes toward computing (Margolis, Fisher, and Miller 1999; Turkle 1995), in video game
creation (Kafai 2006), and video sharing (Yang et al. 2009). Online video creation, an activity
recently popular with undergraduate students (Gannes 2009; Madden 2009; Rideout, Foehr, and
Roberts 2010) provides an interesting forum for considering gender effects because it includes
both software mastery and social networking.
Objectives
As part of a larger mixed-methods exploration (Vedantham, 2011), this quantitative study
examines two research questions:
1. For first-year traditional-age college students attending a highly selective research
university, what gender differences exist in online video creation?
2. Do measures drawn from theories of self-efficacy, technology acceptance, stereotype
threat and learned helplessness explain observed gender differences after controlling
for demographic characteristics?
Theoretical frameworks
Self-efficacy theory, the Technology Acceptance Model (TAM), stereotype threat theory

MAKING'YOUTUBE'VIDEOS'AND'GENDER''
'
2'
and learned helplessness theory inform the conceptual framework presented in Figure 1; these
four theories have substantial overlap (Rozell and Gardner 2000; Venkatesh et al. 2003).
Bandura (1997) explores the role of human agency in self-efficacy theory, including
‘proxy control’ where an individual might hand over a task due to lack of confidence. He
emphasizes the relevance of self-efficacy in activities where performance (creating a video)
determines outcome (self-publishing video on YouTube or Facebook).
Formal training can increase confidence with computer use (Torkzadeh and Van Dyke
2002; Shannon 2008). Approaching video-editing with confidence is essential given frequent
software upgrades (Adobe 2010; Apple 2010). One’s ability to tinker confidently (Turkle 1995;
Beckwith and Kissinger 2006) can foster success with video creation.
The TAM (Davis 1989) converged on two concepts – ‘perceived ease of use’ and
‘perceived usefulness’. Venkatesh et al. (2003) use a taxonomy of eight models and add a
component of ‘social influence’. This study’s conceptual model builds on Yang, Hsu and Tan
(2009) who examine Taiwanese college student creation of YouTube videos.
Stereotype threat theory (Steele and Aronson 1995) proposes that aspects of identity can
be triggered by situational factors to negatively affect performance. Studies have applied
stereotype threat theory in the context of computer use by women (Cooper 2006; Koch, Müller,
and Sieverding 2008; Christofides, Islam, and Desmarais 2009).
Learned Helplessness (LH) theory (Abramson et al. 1978), argues that experiences with
uncontrollable events lead people to cede control over future events, leading to self-fulfilling
negative expectations. Rozell and Gardner (2000) found that learned helplessness impacts
undergraduate student computer use.
[Insert Figure 1 here.]

MAKING'YOUTUBE'VIDEOS'AND'GENDER''
'
3'
Methods of inquiry
The study’s survey instrument includes the Attitudes Toward Computer Usage Scale
(ATCUS) v2.0 (Morris et al. 2009), an update of the well-established ATCUS scale (Popovich et
al. 1987), and details nine video-creation roles (listed in Table 1).
[Insert Table 1 here.]
Logistic and multinomial logistic regression techniques were used. The dependent
variables are: creation of at least one online video, number of videos created and roles played.
Descriptive analysis is conducted on self-assessment of video-editing expertise and choice of
video-editing software. Table 2 lists all variables.
[Insert Table 2 here.]
Data sources
Data was collected in September 2010 from first-year students at a large, highly selective
research university in the eastern United States, with a Carnegie classification as one of 263
“Research Universities” and one of 96 with “Very High Research Activity”. The student body is
representative of the set of 96 on all except two factors: having an unusually high (top 5 %)
representation of international students and students not eligible for Pell grants. The
questionnaire was pilot-tested and administered online and with a small paper sample. The data
collection achieved a 79% completion rate, collecting 841 responses. Of these, 752 (89%) were
valid and usable. The resulting dataset includes 31% of the population of first-year students, and
substantially exceeds the required sample size of 333. Table 3 provides descriptive statistics.
[Insert Table 3 here.]

MAKING'YOUTUBE'VIDEOS'AND'GENDER''
'
4'
Results
Significant and complex gender differences emerge (see Table 4) in some aspects of
online video creation. A higher percentage of men report making online videos both in general
and for required school projects. Men are more likely to report experience with five of the nine
roles. At over 15 percentage points, gender gaps are especially large for adding
music/images/titles and editing multiple clips. When judging one’s own video-editing expertise,
a higher percentage of women than men (81% versus 59%) ranked themselves as ‘beginner’.
[Insert Table 4 here.]
The second research question asks if the conceptual framework explains observed gender
differences. Descriptive analysis on demographic variables revealed (see Table 5) large gender
gaps (over 20 percentage points) in only two sub-groups - Asians and second-generation
immigrant students. Men reported higher motivation (see Table 6) than women to create videos
in order to improve skills and to bolster online reputations.
[Insert Table 5 here.]
[Insert Table 6 here.]
Logistic regression was used in four iterations based on the blocks from the conceptual
framework (see Table 7) to analyze the likelihood of creating at least one online video. The first
iteration, including only gender, showed that women are less likely to create online videos than
men. The second iteration adds the demographic variables and these do not remove the
significance of gender.
The third iteration adds the Attitudes Toward Computers, and this addition removes the
significance of gender. Both computer confidence and positive attitudes toward computers are
associated with greater likelihood of creating videos.

MAKING'YOUTUBE'VIDEOS'AND'GENDER''
'
5'
The last iteration adds the TAM factors, as well as variables for family encouragement
and computer platform experience. Again, gender is no longer a significant predictor. The results
reveal overlap between the second and third blocks of the framework. The ‘ease of video
creation’ factor and Macintosh (Apple) platform use are significant.
Overall, the conceptual framework successfully explains observed gender differences.
Goodness of fit improves steadily. The percent of cases correctly classified increases steadily to
66%. Pseudo-R2 increases steadily but remains relatively low.
[Insert Table 7 here.]
Logistic regression analysis is used to explore the nine video-creation roles. The
reference category includes both students who have not made any videos and those who have
made videos but have not participated in that particular role; as a result care is needed in
interpretation. The model has statistical significance for eight of the nine roles (see Table 8) and
classifies between 68% and 84% of cases. Gender is not a significant predictor for any of the
eight roles. Several components of the conceptual framework help explain observed gender
differences.
[Insert Table 8 here.]
Significant differences by gender also emerged for components of the conceptual
framework; notable results are listed in Table 9.
[Insert Table 9 here.]
Discussion.
The first research question explored gender differences in online video creation to reveal
substantial and complex gender differences. A higher percentage of men (59%) than women
(49%) reported making online videos. Hargittai and Walejko (2008) find similar conclusions at
MAKING'YOUTUBE'VIDEOS'AND'GENDER''
'
6'
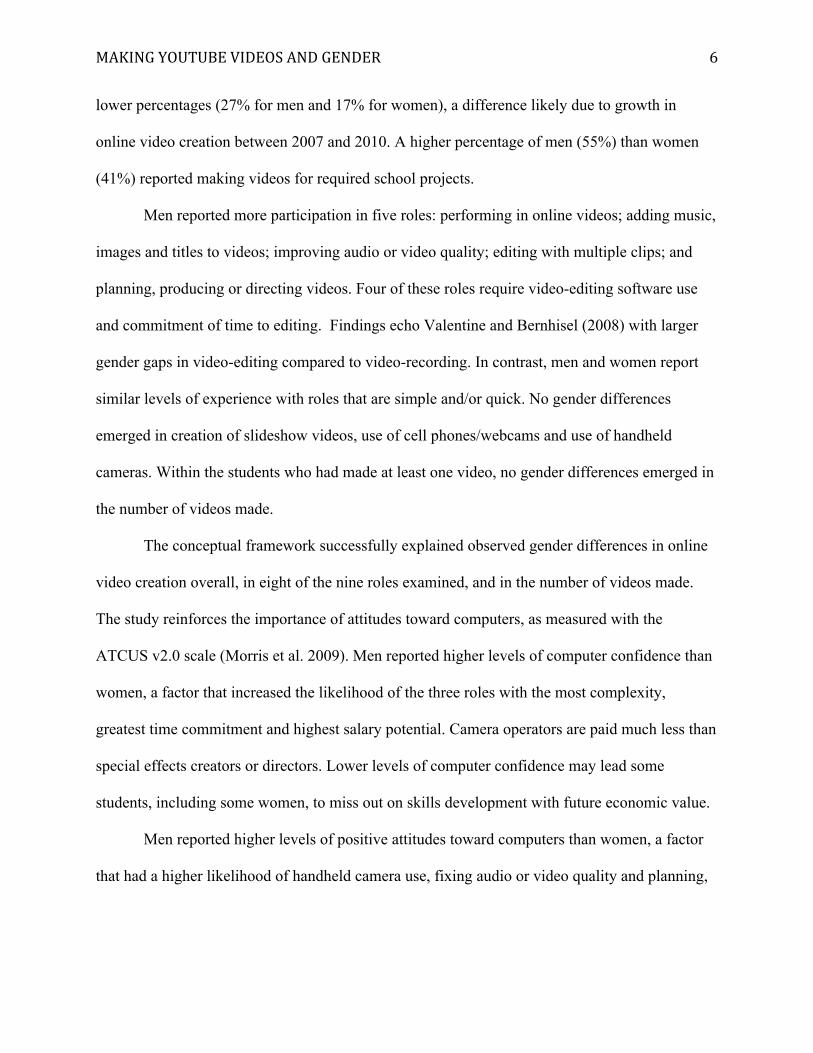
lower percentages (27% for men and 17% for women), a difference likely due to growth in
online video creation between 2007 and 2010. A higher percentage of men (55%) than women
(41%) reported making videos for required school projects.
Men reported more participation in five roles: performing in online videos; adding music,
images and titles to videos; improving audio or video quality; editing with multiple clips; and
planning, producing or directing videos. Four of these roles require video-editing software use
and commitment of time to editing. Findings echo Valentine and Bernhisel (2008) with larger
gender gaps in video-editing compared to video-recording. In contrast, men and women report
similar levels of experience with roles that are simple and/or quick. No gender differences
emerged in creation of slideshow videos, use of cell phones/webcams and use of handheld
cameras. Within the students who had made at least one video, no gender differences emerged in
the number of videos made.
The conceptual framework successfully explained observed gender differences in online
video creation overall, in eight of the nine roles examined, and in the number of videos made.
The study reinforces the importance of attitudes toward computers, as measured with the
ATCUS v2.0 scale (Morris et al. 2009). Men reported higher levels of computer confidence than
women, a factor that increased the likelihood of the three roles with the most complexity,
greatest time commitment and highest salary potential. Camera operators are paid much less than
special effects creators or directors. Lower levels of computer confidence may lead some
students, including some women, to miss out on skills development with future economic value.
Men reported higher levels of positive attitudes toward computers than women, a factor
that had a higher likelihood of handheld camera use, fixing audio or video quality and planning,

MAKING'YOUTUBE'VIDEOS'AND'GENDER''
'
7'
directing or producing videos. More positive attitudes toward computers may help students adapt
more quickly to new gadgets.
The TAM items produced four factors: ease of video creation, value of video creation,
self-perception of ability and comfort with social risk. Men reported stronger belief in ease of
video creation than women, a factor that had a higher likelihood of creating videos, and of two
roles requiring sophisticated control of content. Men and women felt similarly about the value of
video creation, a factor that had a higher likelihood of the most complex role: planning,
producing or directing a video. Men expressed stronger belief in self-perception of ability
compared to women, a factor that had a higher likelihood of participation in creating slideshows
and adding music/images/titles. Measurement of self-perception of ability links closely to
theories of learned helplessness and stereotype threat. Men expressed stronger comfort with
social risk compared to women, a factor that had a higher likelihood of performing on videos and
using cell phones or webcams to make videos. Both these roles are linked to creation of casual
videos with the potential for embarrassment, and relate to social networking behaviors. Women
and men reported similar levels of experience with the Mac platform, and results reinforced
recognition of the platform’s ease of use (Cusumano 2008).
Significance of the study
Hobbs and Frost (2003) argue for considering media creation skills in parallel with
reading and writing skills. Creators of media are more savvy consumers of media (Johnston and
Bloom 2010). Gender imbalances in video creation also reduce the diversity of viewpoints
represented in videos available for the general public. This study builds on earlier work on
gender differences in computer confidence, computer programming and social networking to

MAKING'YOUTUBE'VIDEOS'AND'GENDER''
'
8'
examine the new area of online video creation. It documents gender differences in behavior by
first-year undergraduates and proposes a conceptual framework.
More men than women reported making videos for required class projects, a striking
result if projects are assigned in gender-neutral contexts. Examining how group projects
differentially affect acquisition of video-editing skills could inform assignment design.
Designing group projects to value individual acquisition of video creation skills might ensure
female participation in such projects; Rosser (1998) provides guidance on possible interventions.
School activities can affect student perceptions about the ease and value of video
creation. Simple recording activities during class can help students gain experience. Multimedia
literacy is increasingly seen as applicable to national standards (National Governors Association
2010). Faculty and teachers can discuss the advantages of creating videos. The study draws
attention to the importance of considering ways to build computer confidence as well as
implications pertaining to self-efficacy, stereotype threat and learned helplessness. Insights
gathered from qualitative exploration in the larger study (Vedantham, 2011) add nuance to the
statistics, bringing in aspects related to motivation, local context and perceptions of leisure,
exploration and flow.
This study can inform college-level interventions to encourage women to consider
courses, majors and careers that build on video creation skills. Significant gaps exist in online
video creation across genders. Online video creation assignments as part of graded course
activities raise concerns for gender equity. Video creation in the instructional context should
consider gender-related factors. This study has indicated the need for educators to explore
interventions that build confidence and provide scaffolding for all students to master video
creation.
Bibliography
Abramson, L. Y., Seligman, M. E., & Teasdale, J. D. (1978). Learned helplessness in humans: Critique and reformulation. Journal of Abnormal Psychology, 87(1), 49-74.
Adobe, Inc. (2010). Adobe Press Releases. Retrieved January 30, 2010, from http://www.adobe.com/aboutadobe/pressroom/pressreleases/prcategory.html#52
Ahuja, M. (2002). Women in the information technology profession: A literature review, synthesis, and research agenda. European Journal of Information Systems, 11, 20-34.
Apple, Inc. (2010). Apple - press info - press release library. (2010). Retrieved January 30, 2010, from http://www.apple.com/pr/library/
Bandura, A. (1997). Self-efficacy: The exercise of control. New York: W.H. Freeman.
Beckwith, L., & Kissinger, C. (2006). Tinkering and gender in end-user programmers' debugging. Proceedings of the SIGCHI conference on human factors in computing systems. Canada; Montreal: ACM Press.
Camp, T. (1997). The incredible shrinking pipeline. Communications of the ACM, 40(10), 103-110.
Christofides, E., Islam, T., & Desmarais, S. (2009). Gender stereotyping over instant messenger: The effects of gender and context. Computers in Human Behavior, 25(4), 897-901.
Cohoon, J. M., & Aspray, W. (2006). Women and information technology: Research on Underrepresentation. Cambridge, MA. MIT Press.
Cooper, J. (2006). The digital divide: The special case of gender. Journal of Computer Assisted Learning, 22(5), 320-334.
Cusumano, M. (2008). Technology strategy and management: the puzzle of Apple. Communications of the ACM, 51(9), 22-24.
Davis, F. D. (1989). Perceived usefulness, perceived ease of use, and user acceptance of information technology. MIS Quarterly, 13(3), 319-340.
Ellison, N., Steinfield, C. & Lampe, C. (2006). Spatially bounded online social networks and social capital: The role of Facebook. Proceedings of the Annual Conference of the International Communication Association. doi: 10.1.1.85.5541
Gannes, L. (2009). YouTube changes everything: The online video revolution in The Economics of Information, Communication and Entertainment, Television Goes Digital. (Gerbarg, Darcy Ed.), New York: Springer.
Hargittai, E., & Walejko, G. (2008). The Participation Divide: Content creation and sharing in the digital age. Information, Communication & Society, 11(2), 239-256.

Hobbs, R., & Frost, R. (2003). Measuring the acquisition of media-literacy skills. Reading Research Quarterly, 38(3), pp. 330-355.
Johnston, K. M., & Bloom, K. (2010). Digging into YouTube videos: Using media literacy and participatory culture to promote cross-cultural understanding. Journal of Media Literacy Education, 2(2).
Kafai, Y. B. (2006). Playing and making games for learning: Instructionist and constructionist perspectives for game studies. Games and Culture, 1(1), 36–40.
Koch, S. C., Müller, S. M., & Sieverding, M. (2008). Women and computers: Effects of stereotype threat on attribution of failure. Computers & Education, 51(4), 1795-1803.
Madden, M. (2009). The audience for online video-sharing sites shoots up. Pew Internet & American Life Project. Retrieved March 27, 2010 from http://www.pewinternet.org/Reports/2009/13--The-Audience-for-Online-VideoSharing-Sites-Shoots-Up.aspx?r=1
Margolis, J., Fisher, A., & Miller, F. (1999). Caring about connections: Gender and computing. IEEE Technology and Society Magazine, 18(4), 13-20.
Morris, S. A., Gullekson, N. L., Morse, B. J., & Popovich, P. M. (2009). Updating the attitudes toward computer usage scale using American undergraduate students. Computers in Human Behavior, 25(2), 535-543.
National Governors Association. (2010). Common core state standards for English, Language Arts and Literacy in History / Social Studies & Science. Retrieved March 30, 2010, from http://www.corestandards.org/Standards/K12/
Pinkard, N. (2005). How the perceived Masculinity and/or femininity of software applications influences students' software preferences. Journal of Educational Computing Research, 32(1), 57-78.
Popovich, P. M., Hyde, K. R., Zakrajsek, T., & Blumer, C. (1987). The development of the attitudes toward computer usage scale. Educational and Psychological Measurement, 47(1), 261.
Pryor, J. H., & Hurtado, S. (2008). The American Freshman: National norms for fall 2008. Los Angeles, CA: Higher Education Research Institute, Graduate School of Education & Information Studies, University of California, Los Angeles.
Rideout, V. J., Foehr, U. G., & Roberts, D. F. (2010). GENERATION M2: Media in the lives of 8- to 18-year-olds. Menlo Park, California: Henry J. Kaiser Family Foundation.
Rosser, S. V. (1998). Group work in science, engineering, and mathematics: Consequences of ignoring gender and race. College Teaching, 46(3), 82-88.

Rozell, E. J., & Gardner III, W. L. (2000). Cognitive, motivation, and affective processes associated with computer-related performance: A path analysis. Computers in Human Behavior, 16(2), 199-222.
Shannon, L. (2008). Information and communication technology literacy issues in higher education. Information Systems Education Journal, 6(23), 1-23.
Steele, C. M., & Aronson, J. (1995). Stereotype threat and the intellectual test performance of African Americans. Journal of Personality and Social Psychology, 69(5), 797-811.
Torkzadeh, G., & Van Dyke, T. P. (2002). Effects of training on Internet self-efficacy and computer user attitudes. Computers in Human Behavior, 18(5), 479-494.
Turkle, S. (1995). Life on the screen: Identity in the age of the Internet. New York: Simon & Schuster.
Valentine, B., & Bernhisel, S. (2008). Teens and their technologies in high school and college: Implications for teaching and learning. Journal of Academic Librarianship, 34(6), 502-512.
Vedantham, A. (2011). Making Youtube and Facebook Videos: Gender Differences in Online Video Creation Among First-Year Undergraduate Students Attending a Highly Selective Research University. (Doctoral dissertation). University of Pennsylvania Graduate School of Education. Downloaded from http://works.bepress.com/anu/11/
Venkatesh, V., Morris, M. G., Davis, G. B. & Davis, F. D. (2003). User acceptance of information technology: Toward a unified view. MIS Quarterly, 27(3), 425-478.
Yang, C., Hsu, Y. C., & Tan, S. (2009). Predicting the determinants of users' intentions for using YouTube to share video: Moderating gender effects. Cyberpsychology & Behavior: The Impact of the Internet, Multimedia and Virtual Reality on Behavior and Society.

Figure 1. Conceptual Framework !
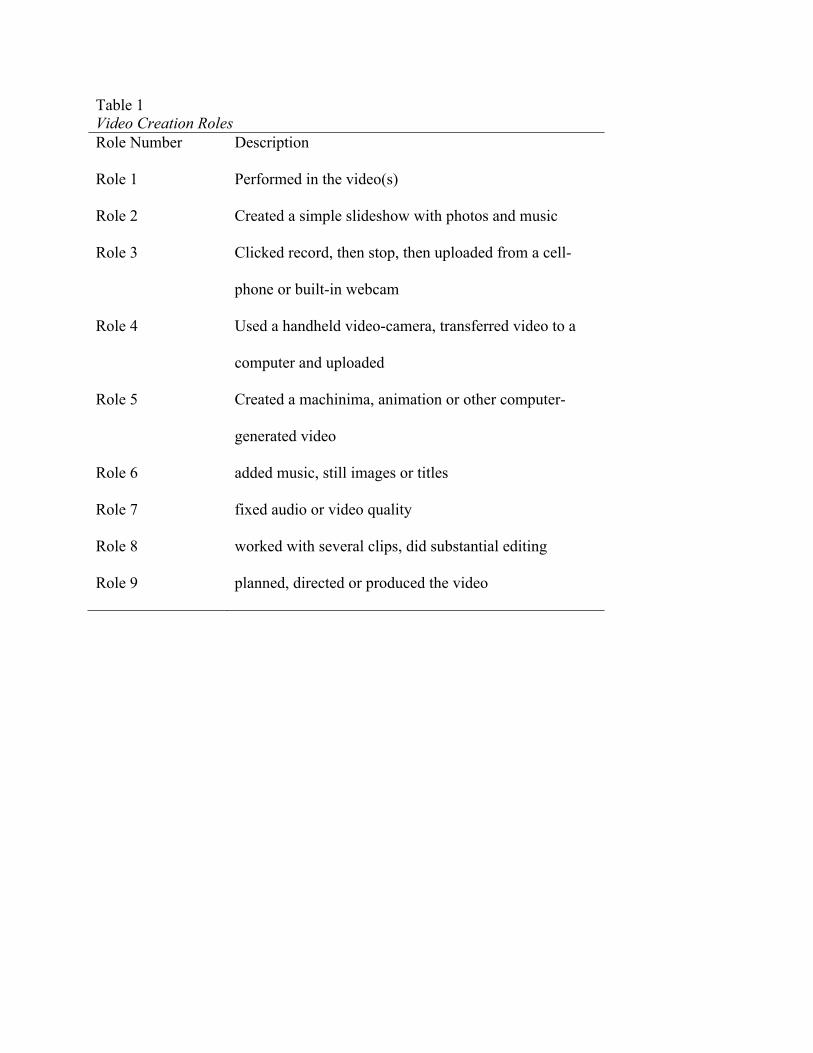
Table 1 Video Creation Roles Role Number Description
Role 1 Performed in the video(s)
Role 2 Created a simple slideshow with photos and music
Role 3 Clicked record, then stop, then uploaded from a cell-
phone or built-in webcam
Role 4 Used a handheld video-camera, transferred video to a
computer and uploaded
Role 5 Created a machinima, animation or other computer-
generated video
Role 6 added music, still images or titles
Role 7 fixed audio or video quality
Role 8 worked with several clips, did substantial editing
Role 9 planned, directed or produced the video

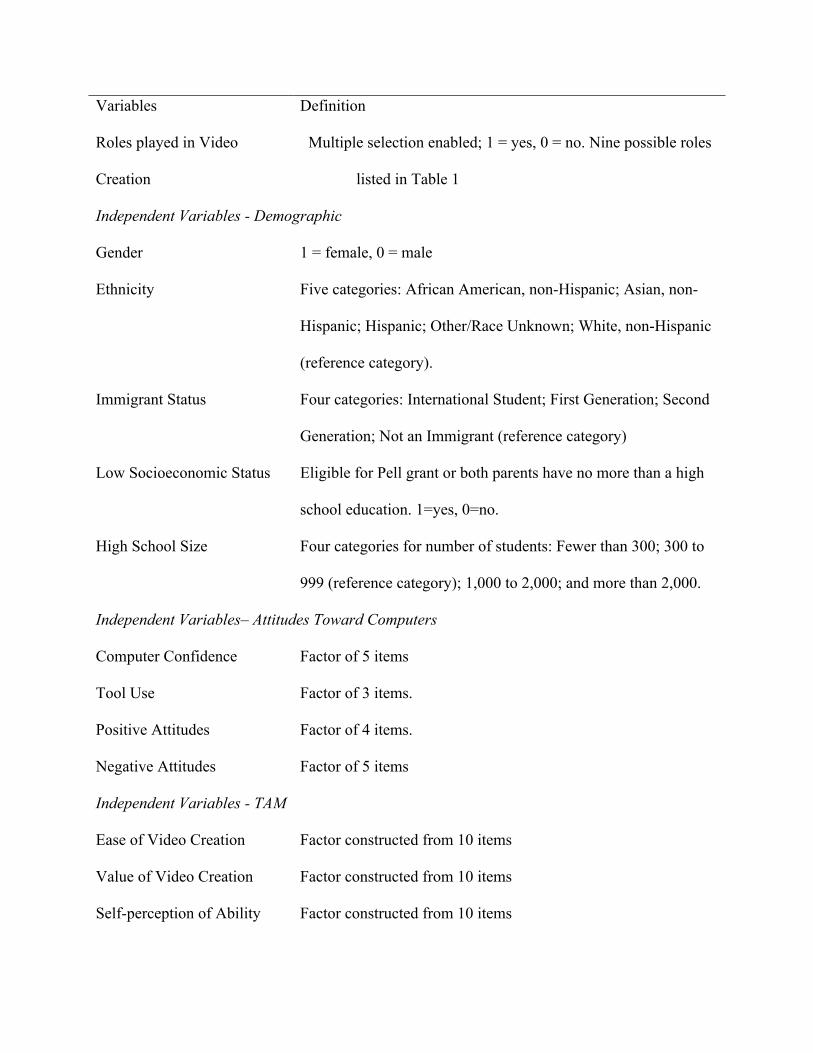
Table 2 Dependent and Independent Variables Variables Definition
Variables used only for Descriptive Analyses
Videos for required school
projects
Most videos were made for required school projects; 1 = yes, 0
= no.
Self-rating in Video Creation Three categories: 1 = Beginner, 2 = Intermediate, 3 = Expert
Video Editing Software
Complexity Level
Three categories: 1 = Low complexity, 2 = Medium
complexity, 3 = High complexity
Importance in decision to
create video:
Friends and classmates
Fame, online reputation
Having Fun on a Computer
Influencing others, advocacy
Desire to improve video
creation skills
Each of the five variables is scored on a five-point Likert scale:
Not important / A little important / Somewhat important /
Important / Very Important
No high speed Internet access High speed Internet not available at home or school during high
school years. 1 = yes, 0 = no.
Dependent Variables Descriptor
Video Creation One or more online videos created; 1 = yes, 0 = no.
Number of Videos Created 0 = Reference level of one to two, 1 = Low level of 3 to 5, 2 =
Medium level of 6 to 10, 3 = High level of more than 10.
Variables Definition
Roles played in Video
Creation
Multiple selection enabled; 1 = yes, 0 = no. Nine possible roles
listed in Table 1
Independent Variables - Demographic
Gender 1 = female, 0 = male
Ethnicity Five categories: African American, non-Hispanic; Asian, non-
Hispanic; Hispanic; Other/Race Unknown; White, non-Hispanic
(reference category).
Immigrant Status Four categories: International Student; First Generation; Second
Generation; Not an Immigrant (reference category)
Low Socioeconomic Status Eligible for Pell grant or both parents have no more than a high
school education. 1=yes, 0=no.
High School Size Four categories for number of students: Fewer than 300; 300 to
999 (reference category); 1,000 to 2,000; and more than 2,000.
Independent Variables– Attitudes Toward Computers
Computer Confidence Factor of 5 items
Tool Use Factor of 3 items.
Positive Attitudes Factor of 4 items.
Negative Attitudes Factor of 5 items
Independent Variables - TAM
Ease of Video Creation Factor constructed from 10 items
Value of Video Creation Factor constructed from 10 items
Self-perception of Ability Factor constructed from 10 items

Variables Definition
Comfort with Social Risk Factor constructed from 10 items
Computer platform
experience
PC
Mac
Linux or Other
Multiple choices enabled across the three platform choices. For
each of the three choices, 1=yes, 0=no.
Family career encouragement Family encouragement for careers in computer science,
multimedia design. 1=yes, 0=no.

Table 3
Descriptive Statistics
Demographic Variable % of sample
Gender (Female) 58.5
Ethnicity
African American (non Hispanic)
Asian (non Hispanic)
Hispanic
Other/Race Unknown (non Hispanic)
White (non Hispanic)
7.8
25.3
8.2
18.9
39.8
Immigrant Status
International Student
First Generation
Second Generation
Not an Immigrant
10.1
11.1
27.5
51.3
Low Socioeconomic Status 25.4
High School Size
Fewer than 300 students
300 to 999 students
1,000 to 2,000 students
More than 2,000 students
12.8
37.3
31.8
18.2
Computer platform experienced
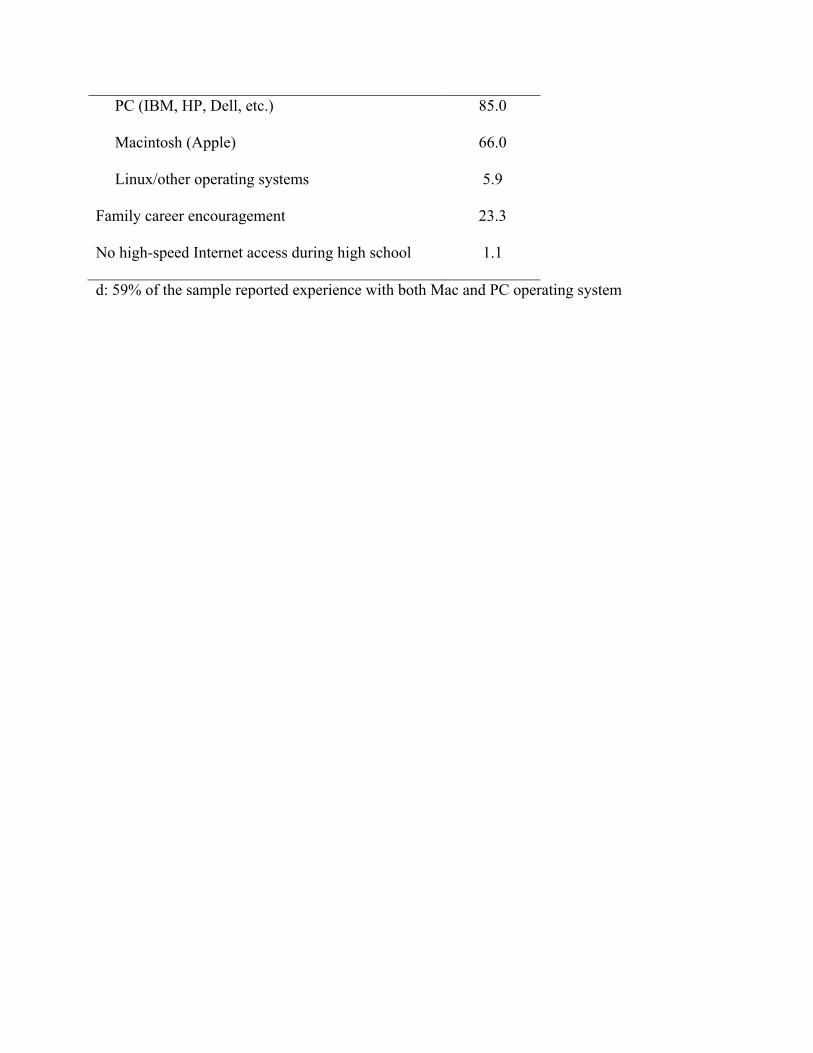
PC (IBM, HP, Dell, etc.)
Macintosh (Apple)
Linux/other operating systems
85.0
66.0
5.9
Family career encouragement 23.3
No high-speed Internet access during high school 1.1
d: 59% of the sample reported experience with both Mac and PC operating system

Table 4
Percentage of Men and Women who Reported Video Creation
Total
Percent
(%)
Males
Percent (%)
Females
Percent (%)
Gender Gap
(M-F)
Percentage
points (%)
Created an online video 54.1 58.6 48.6 9.9*
Videos required school
projects
44.9 54.5 40.6 14.0*
Roles played
1. Performance in video
2. Created Slideshow
3. Used Cell phone /
Webcam
4. Used Handheld
Camera
5. Animation /
Machinima
6. Added Music /
Images / Titles
7. Fixed Audio Video
Quality
8. Edited multiple clips
79.3
48.4
45.1
58.4
6.5
59.2
31.0
42.7
86.0
51.3
45.3
64.0
9.3
68.0
39.3
52.0
76.7
45.0
44.4
55.0
4.4
51.7
26.1
36.7
9.3*
6.3
0.9
9.0
4.9
16.3**
13.2*
15.3**
Total
Percent
(%)
Males
Percent (%)
Females
Percent (%)
Gender Gap
(M-F)
Percentage
points (%)
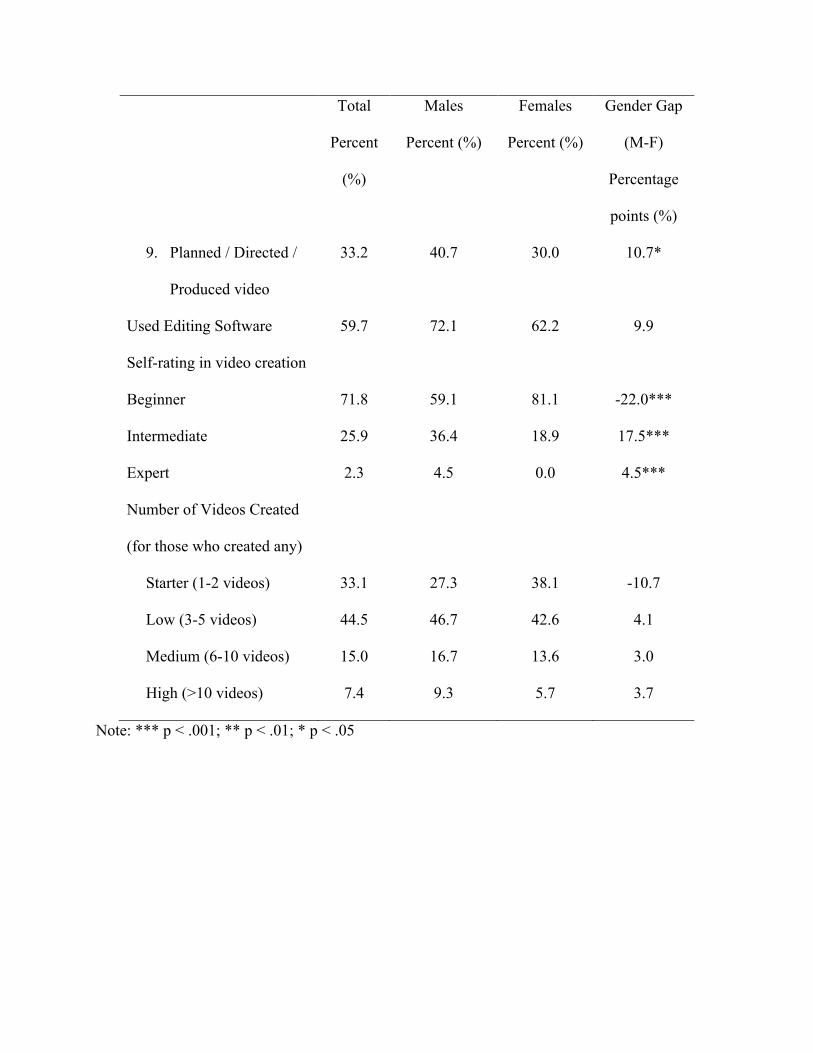
9. Planned / Directed /
Produced video
33.2 40.7 30.0 10.7*
Used Editing Software 59.7 72.1 62.2 9.9
Self-rating in video creation
Beginner
Intermediate
Expert
71.8
25.9
2.3
59.1
36.4
4.5
81.1
18.9
0.0
-22.0***
17.5***
4.5***
Number of Videos Created
(for those who created any)
Starter (1-2 videos)
Low (3-5 videos)
Medium (6-10 videos)
High (>10 videos)
33.1
44.5
15.0
7.4
27.3
46.7
16.7
9.3
38.1
42.6
13.6
5.7
-10.7
4.1
3.0
3.7
Note: *** p < .001; ** p < .01; * p < .05

Table 5
Percentage of Men and Women Reporting Video Creation by Ethnicity, Immigrant Status
Characteristic
N Total
Percent
(%)
Males
Percent
(%)
Females
Percent
(%)
Gender Gap (M-F)
Percent (%)
All students 752 54.1 58.6 48.6 9.9*
Ethnicity Category
Asian (non Hispanic)
African American (non
Hispanic)
Hispanic
White (non Hispanic)
Other or Race Unknown+
(non Hispanic)
190
59
62
299
142
55.3
52.5
45.2
52.5
60.6
70.1
40.9
48.4
57.8
62.5
47.2
59.5
41.9
48.2
53.3
23.0**
-18.6
6.5
9.6
9.2
Immigrant Status
Non-immigrants
Second-generation
immigrants
First-generation immigrants
International Students
304
163
66
60
50.3
63.8
54.5
26.6
53.0
75.3
65.2
23.8
48.3
54.4
48.8
28.2
4.8
20.9**
16.4
-4.4
Note: *** p < .001; ** p < .01; * p < .05
+Some missing gender data

Table 6
Reasons Important in Decision to Create Videos Among Students who Create Videos
Mean Response Value (std. dev.) Men Women Gender Gap
Friends and classmates
Fame, online reputation
Having Fun on a Computer
Influencing others, advocacy
Desire to improve video creation skills
3.47 (1.22)
1.80 (1.01)
3.00 (1.19)
2.20 (1.14)
2.51 (1.19)
3.54 (1.15)
1.49 (0.77)
3.08 (1.14)
1.97 (1.09)
2.15 (1.14)
-0.07
0.32**
-0.03
0.23
0.36**
Notes: Items are measured on a five-point Likert scale.
*** p < .001; ** p < .01; * p < .05.

Table 7 Logistic Regression Results for Online Video Creation Independent Variable
(Odds Ratios reported)
Iteration 1
Gender only
Iteration 2
Demographic
Iteration 3
Attitudes
Iteration 4
TAM
Demographics Variables
Female
Male (Ref. Category)
0.671* 0.648* 0.812 0.817
African American non Hispanic
Asian non Hispanic
Hispanic
Other/Race Unknown non Hispanic
White non Hispanic (Ref. Category)
1.083
1.044
0.585
1.611
0.919
0.997
0.514
1.764
0.831
1.313
0.521
2.037
International Student
First Generation
Second Generation
Not an Immigrant (Ref. Category)
0.387*
1.229
1.896*
0.426*
1.090
1.871*
0.361*
1.002
1.811*
Low Socioeconomic Status 0.937 0.930 0.897

Independent Variable
(Odds Ratios reported)
Iteration 1
Gender only
Iteration 2
Demographic
Iteration 3
Attitudes
Iteration 4
TAM
Small High School
Large High School
Very Large High School
Medium Size High School (Ref. Category)
0.635
1.155
0.997
0.648
1.129
1.012
0.684
1.293
1.116
Attitudes Toward Computers Variables
Computer Confidence Factor 1.250* 1.046
Tool Use Factor 1.074 1.101
Positive Attitudes Factor 1.226* 1.168
Negative Attitudes Factor 0.886 0.905
TAM Variables
Ease of Video Creation Factor 1.320**
Value of Video Creation Factor 1.063
Self-perception of Ability Factor 1.218
Comfort with Social Risk Factor 1.188

Independent Variable
(Odds Ratios reported)
Iteration 1
Gender only
Iteration 2
Demographic
Iteration 3
Attitudes
Iteration 4
TAM
Computer platform experience
PC (IBM)
Macintosh (Apple)
Linux and other operating systems
0.723
1.964**
1.036
Family encourages multimedia careers 0.849
Number of cases in the analyses (N) 633 592 566 557
Model χ2, df
Pseudo-R2
Hosmer-Lemeshow χ2, df
Percent of cases correctly classified
6.1, 1*
0.007
NA
54.3
40.2,12***
0.049
3.3,8
61.3
47.0,16***
0.060
14.7,8
61.8
75.5,24***
0.098
5.3,8
65.5
Note: *** p < .001; ** p < .01; * p < .05
Table 8
Logistic Regression Predicting 8 of 9 Roles Played in Video Creation
Independent Variable
(Odds Ratios reported)
1.
Perform
in video
2.
Slideshow
3. Cell
phone /
Webcam
4.
Handheld
Camera
6.
Music /
Images /
Titles
7. Fix
Audio /
Video
8. Clip
Editing
9. Video
Production
Percent of students playing role 41.0 25.0 23.3 30.2 30.6 16.0 22.0 17.1
Demographic Variables
Female
Male (Ref. Category)
0.69 0.90 0.88
0.70
0.69
0.59
0.68 0.77
African American
Asian
Hispanic
Other/Race Unknown
White (Ref. Category)
0.83
1.33
0.52
1.27
0.70
1.14
0.64
2.57
0.87
1.12
0.52
0.75
1.38
0.98
0.49
1.11
1.05
1.07
0.71
1.36
1.39
1.16
0.80
2.88
1.09
1.25
0.84
1.57
1.36
1.05
0.52
3.14
International Student 0.38* 0.68 0.94 0.32* 0.56 0.55 0.26 0.43

Independent Variable
(Odds Ratios reported)
1.
Perform
in video
2.
Slideshow
3. Cell
phone /
Webcam
4.
Handheld
Camera
6.
Music /
Images /
Titles
7. Fix
Audio /
Video
8. Clip
Editing
9. Video
Production
First Generation
Second Generation
Not Immigrant (Ref. Category)
1.18
2.08*
1.46
1.59
0.99
1.82
1.42
1.79*
1.61
1.80
2.09
1.97
1.04
1.26
1.24
1.65
Low Socioeconomic Status 1.07 1.52 0.95 1.05 1.41 1.36 1.12 1.14
Small High School
Large High School
Very Large High School
Medium Size (Ref. Category)
1.04
1.65*
1.03
0.96
1.62
1.20
0.65
0.93
1.05
0.80
1.30
0.88
0.87
1.44
1.15
1.22
1.45
1.00
1.11
1.62
1.08
1.87
1.95*
1.16
Computer Confidence 1.12 1.38 1.04 1.17 1.33 1.57* 1.45* 1.57*
Tool Use 1.07 1.16 1.07 0.94 1.04 0.86 0.88 0.83
Positive Attitudes 1.06 1.19 1.05 1.26* 1.16 1.33* 1.24 1.31*
Negative Attitudes 0.98 1.08 1.00 0.96 0.99 1.09 1.16 0.95

Independent Variable
(Odds Ratios reported)
1.
Perform
in video
2.
Slideshow
3. Cell
phone /
Webcam
4.
Handheld
Camera
6.
Music /
Images /
Titles
7. Fix
Audio /
Video
8. Clip
Editing
9. Video
Production
TAM Variables
Ease of Video Creation 1.22 1.24 1.17 1.14 1.45** 1.30 1.52** 1.25
Value of Video Creation 1.18 1.18 1.17 1.11 1.12 1.07 1.07 1.35*
Self-perception of Ability 1.04 1.28* 1.25 1.14 1.30* 1.13 1.29 1.31
Comfort with Social Risk 1.28* 0.98 1.10* 1.07 1.04 0.90 1.06 1.16
Computer platform
PC (IBM)
Macintosh (Apple)
Linux and other operating systems
0.82
2.03**
1.02
0.99
2.39**
0.67
1.10
3.04***
0.75
1.19
1.50
0.74
0.98
2.02**
0.53
0.93
2.05*
0.57
0.64
2.25**
0.42
0.76
1.94*
0.42
Family encourages multimedia
careers
0.86 0.88 0.85 1.08 1.07 1.55 1.40 1.05
Number of cases (N) 555 555 555 555 555 555 555 555

Independent Variable
(Odds Ratios reported)
1.
Perform
in video
2.
Slideshow
3. Cell
phone /
Webcam
4.
Handheld
Camera
6.
Music /
Images /
Titles
7. Fix
Audio /
Video
8. Clip
Editing
9. Video
Production
Model χ2, df
Pseudo-R2
Hosmer-Lemeshow χ2, df
Percent of cases correctly classified
78.3,24
***
0.104
6.8,8
67.6
76.9,24
***
0.125
15.2,8
78.0
49.1,24
**
0.080
5.5,8
77.3
56.3,24
***
0.083
15.3,8
71.4
88.6,24
***
0.131
11.4,8
74.2
70.5,24
***
0.142
7.6,8
84.1
91.2,24***
0.152
15.0,8
77.3
58.5,24
***
0.130
7.4,8
83.1
Note: *** p < .001; ** p < .01; * p < .05.
a: This model does not achieve sufficient validity and has a model probability > χ2 of 0.26. All the other models reach adequate levels
for model probability.

Table 9
Observed Differences between Men and Women for Key Variables
Independent Variable Men Women Gender Gap
(M-F)
Attitudes Toward Computers Variables
Computer Confidence Factor
Tool Use Factor
Positive Attitudes Factor
Negative Attitudes Factor
0.37
0.23
0.27
0.15
-0.26
-0.16
-0.19
-0.11
0.64***
0.40***
0.45***
0.26**
TAM Variables
Ease of Video Creation Factor
Value of Video Creation Factor
Self-perception of Ability Factor
Comfort with Social Risk Factor
0.26
-0.02
0.25
0.22
-0.18
0.02
-0.17
-0.18
0.44***
-0.03
0.42***
0.40***
Computer platform experience
Macintosh (Apple)
0.62
0.69
-0.07

Independent Variable Men Women Gender Gap
(M-F)
Learned Helplessness / Stereotype Threat item (5
category Likert):
I have natural ability / talent to work with
computers.
3.47
2.99
0.48***
Note: *** p < .001; ** p < .01; * p < .05. All factors are standardized variables. The Macintosh experience is a yes-no variable.