Gender differences in elite Olympic distance triathlon performances
12
VOLUME 7 | ISSUE 2 | 2012 | 434 Gender differences in elite Olympic distance triathlon performances ROBERTO CEJUELA 1 , JUAN M. CORTELL-TORMO 1 , JUAN J. CHINCHILLA-MIRA 1 , JOSÉ A. PÉREZ-TURPIN 1 , JOSÉ G. VILLA 2 1 Faculty of Education, University of Alicante, Spain 2 Department of Physical Education and Sports, University of León, Spain ABSTRACT Cejuela R, Cortell-Tormo JM, Chinchilla-Mira JJ, Pérez-Turpin JA, Villa JG. Gender differences in elite Olympic distance triathlon performances. J. Hum. Sport Exerc. Vol. 7, No. 2, pp. 434-445, 2012. To analyze the overall Olympic distance triathlon performances at elite male and female World Championship and Olympic Games events from 2000 to 2008. Time, lost time and partial position for each segment and transition, gender differences in performance for the three disciplines, and overall times of the males and females were analysed. The only significant difference between the sexes with regard to the percentage time used in the swimming segment (16.3±0.6M versus 15.6±0.6F). The gender (SD) difference in power output for the winners in swimming, cycling, running were 13.7±16.1%, 67.1±4.3%, 29.8±8.4%, respectively. The correlation coefficients between the lost time for each segment and transition, and the final overall classification were (0.4 M versus 0.48 F) for swimming, (0.28 M versus 0.3) for T1, (0.34 M versus 0.31 F) for Lost Time T1, (0.63 M versus 0.77 F) for cycling, r=0.33 (0.33 M versus 0.34 F) for T2, (0.43 M versus 0.29 F) for Lost Time T2 and (0.83 M versus 0.84 F) for running. The running segment is the most decisive, having a more obvious correlation for males because there are less breakaways or hilly segments that break up the main pack, while the level of performance is similar for most competitors. With females, performance is more varied and there are further variables that make the running segment less decisive. However, small differences in seconds that occurred in the swimming segment and transitions can have a significant impact on the outcome of the competition. Key words: GENDER, SEX DIFFERENCE, TACTICS, COMPETITION ANALYSIS 1 Corresponding author. Faculty of Education. University of Alicante (Spain). Campus de San Vicente del Raspeig, 03540. San Vicente del Raspeig (Alicante), Spain. E-mail: [email protected] Submitted for publication October 2011 Accepted for publication December 2011 JOURNAL OF HUMAN SPORT & EXERCISE ISSN 1988-5202 © Faculty of Education. University of Alicante doi:10.4100/jhse.2012.72.09 Original Article
-
Upload
independent -
Category
Documents
-
view
0 -
download
0
Transcript of Gender differences in elite Olympic distance triathlon performances

VOLUME 7 | ISSUE 2 | 2012 | 434
Gender differences in elite Olympic distance triathlon performances ROBERTO CEJUELA1
, JUAN M. CORTELL-TORMO1, JUAN J. CHINCHILLA-MIRA1, JOSÉ A. PÉREZ-TURPIN1, JOSÉ G. VILLA2
1Faculty of Education, University of Alicante, Spain 2Department of Physical Education and Sports, University of León, Spain
ABSTRACT
Cejuela R, Cortell-Tormo JM, Chinchilla-Mira JJ, Pérez-Turpin JA, Villa JG. Gender differences in elite Olympic distance triathlon performances. J. Hum. Sport Exerc. Vol. 7, No. 2, pp. 434-445, 2012. To analyze the overall Olympic distance triathlon performances at elite male and female World Championship and Olympic Games events from 2000 to 2008. Time, lost time and partial position for each segment and transition, gender differences in performance for the three disciplines, and overall times of the males and females were analysed. The only significant difference between the sexes with regard to the percentage time used in the swimming segment (16.3±0.6M versus 15.6±0.6F). The gender (SD) difference in power output for the winners in swimming, cycling, running were 13.7±16.1%, 67.1±4.3%, 29.8±8.4%, respectively. The correlation coefficients between the lost time for each segment and transition, and the final overall classification were (0.4 M versus 0.48 F) for swimming, (0.28 M versus 0.3) for T1, (0.34 M versus 0.31 F) for Lost Time T1, (0.63 M versus 0.77 F) for cycling, r=0.33 (0.33 M versus 0.34 F) for T2, (0.43 M versus 0.29 F) for Lost Time T2 and (0.83 M versus 0.84 F) for running. The running segment is the most decisive, having a more obvious correlation for males because there are less breakaways or hilly segments that break up the main pack, while the level of performance is similar for most competitors. With females, performance is more varied and there are further variables that make the running segment less decisive. However, small differences in seconds that occurred in the swimming segment and transitions can have a significant impact on the outcome of the competition. Key words: GENDER, SEX DIFFERENCE, TACTICS, COMPETITION ANALYSIS 1 Corresponding author. Faculty of Education. University of Alicante (Spain). Campus de San Vicente del Raspeig, 03540. San
Vicente del Raspeig (Alicante), Spain. E-mail: [email protected] Submitted for publication October 2011 Accepted for publication December 2011 JOURNAL OF HUMAN SPORT & EXERCISE ISSN 1988-5202 © Faculty of Education. University of Alicante doi:10.4100/jhse.2012.72.09
Original Article

Cejuela et al / Gender differences in elite triathlon performances JOURNAL OF HUMAN SPORT & EXERCISE
435 | 2012 | ISSUE 2 | VOLUME 7 © 2012 University of Alicante
INTRODUCTION The triathlon will start on the decade of the 70s and they are held over a variety of distances, the four most common being the Sprint (750m swim, 20km bike, 5km run), Olympic (1.5km swim, 40km bike, 10km run), half Ironman (1.9km swim, 90km bike, 21.1km run) and Ironman (3.8km swim, 180km bike, 42.2km marathon run) distance triathlons. The “Olympic” distance triathlon is the most popular event with elite athletes competing in a series of races held worldwide to establish the International Triathlon Union (ITU) World Champion (Vleck et al., 2006). The elite Olympic distance triathlon has specific physiological demands that distinguish this event both from longer or non elite triathlon races as well as from the individual endurance events of which it is composed (Bentley et al., 2002). The main difference with the long distance events is the use of drafting, something that makes the preparation and execution of these events completely different (Chatard et al., 1998; Millet et al., 2011). Transitions take place in specifically dedicated closed areas (of which there may be one or two) from swimming to cycling (T1) and from cycling to running (T2). Many of the physiological factors that affect the Olympic triathlon have been studied and described (Bentley et al., 2007; Hausswirth et al., 1997; Hue et al., 1998; Hue et al., 2002; Millet & Vleck, 2000). There are studies that indicated a progressive reduction in speed, power out and heart rate, coupled with an increase in variability during the event. The Olympic distance triathlon requires a higher aerobic and anaerobic involvement than constant-workload cycling exercises classically analyzed in laboratory settings (i.e., time trial) or Ironman triathlons (Bernart et al., 2009; Meur et al., 2009). Although few studies have analysed the external factors (times and positions) that affect performance and the evolution over the years (Cejuela et al., 2007; Landers, 2002; Paton & Hopkins, 2005). However, there is only one study that analyses these variables longitudinally over time (Lepers, 2008), although over the Ironman distance. The aim of the present study is to analyse the gender-related differences in the time of the different segments and transitions of the triathlon over the years in international competitions (nine top-level Olympic-distance events) and relate it to the final performance in these competitions. MATERIAL AND METHODS Eighteen top-level triathlon competitions held from 2000 to 2008 were studied (9 male race and 9 female race): 12 World Championships (WC: 2000, 2001, 2004, 2006, 2007 and 2008) and 6 Olympic Games (OG: 2000, 2004 and 2008). There were 1306 participants (710 males and 596 females), with an average of 59.6±11.1 participants per male competition and 50.3±8.2 per female competition. All the triathletes who finished the race were considered for the analysis. We discarded the partial results of competitors who were disqualified or retired. All the participants gave their informed written consent to take part to this study that was conducted according to the Declaration of Helsinki. The Ethics and Research Committee of the Alicante University approved the study.

Cejuela et al / Gender differences in elite triathlon performances JOURNAL OF HUMAN SPORT & EXERCISE
VOLUME 7 | ISSUE 2 | 2012 | 436
We gathered the data for all events in collaboration with the International Triathlon Union (ITU). In order to gather the times for all competitions we used the “ChampionChip®” microchip timing system. All athletes wore the chip on their left ankles during the races. When they crossed the reading mats, the partial times for each segment, transition and total competition times were recorded. These mats were placed at the start, entrance/exit to/from the transition area and at the finish line. The data at the 2002, 2003 and 2005 World Championships were not analysed due to the fact that the timing system did not record the time taken to carry out the transitions separately (T1 & T2) but including them into the cycling time. Lost time in transitions T1 and T2 is the time lag between the first tri-athlete starts cycling or running leaving the transition area, and the rest of the triathletes who arrived at the transition area in the same swimming or cycling pack. This time depends on two factors. Firstly, the position of the triathlete in the swimming or cycling pack when entering into the transition area. The lower the rank is, the longer is the time lost during transition and vice versa. The higher the rank is, the shorter time is lost. Secondly, the time taken by the triathlete to carry out the specific actions required in the transition area, as changing equipment and crossing the designated area. This time is only valid as a reference for the swimming or cycling pack in which each triathlete reaches the transition area. It cannot be compared with other groups getting into the transition areas at different times. The time lost in the transitions can be calculated by filming and analysing the videos of each entrance and exit from the transition area (Cejuela et al., 2008) or by mathematical calculations based on partial times. Lost time in T1 is calculated by the difference (in seconds) between the best partial accumulated time (at the end of T1) and the partial accumulated time of each tri-athlete belonging to the same swimming pack. The criteria used to decide whether two tri-athletes belong to the same pack is when the difference between them at the end of the swimming segment does not exceed 5 seconds. Lost Time T1 = Best partial accumulated time – accumulated time of each triathlete in the same swimming pack. Accumulated time =Time for the swimming segment + time for the swimming-cycling transition (T1). Lost time in T2 is calculated by the difference (in seconds) between the best partial accumulated time (at the end of T2) and the partial accumulated time of each tri-athlete belonging to the same cycling pack. As in T1, the criteria used to decide whether two tri-athletes belong to the same pack is when the difference between them at the end of the cycling segment does not exceed 5 seconds. Lost Time T2 = Best partial accumulated time – accumulated time of each triathlete in the same cycling pack. Accumulated time = Time for the swimming segment + Time for transition T1 + Time for the cycling segment + Time for transition T2. The reason to set five seconds as the bench mark is based on results found in the literature. Hydrodynamic resistance calculations have shown that the ideal distance to draft behind another tri-athlete has not been exactly determined. However, it has been demonstrated that swimming more than five seconds behind the

Cejuela et al / Gender differences in elite triathlon performances JOURNAL OF HUMAN SPORT & EXERCISE
437 | 2012 | ISSUE 2 | VOLUME 7 © 2012 University of Alicante
preceding tri-athlete does not provide any advantage over swimming alone (Chatard et al., 1998; Bentley et al., 2007). Similar studies in cycling have shown that riding with practically inexistent separations between wheels can lead into 44% reduction in aerodynamic resistance, and up to 27% with a separation of two metres (McCole et al., 1990; Lucía et al., 2001; Faria et al., 2005). This is the main reason why five seconds has also been use as the bench mark in the cycling segment to consider whether two tri-athletes belong to the same pack. Data analysis Standard statistical methods were used to calculate mean, SD, and percentages. Time distribution was assessed via a general linear model with repeated-measures analysis of variance (ANOVA) to compare swim, bike, and run by gender. Additionally, a Levene test for homogeneity of variances was completed on each dependent variable during the ANOVA, and, in each case, homogeneity of variance was found. Post hoc comparisons were completed using a Tukey HSD least significant difference. T test was used to determine differences in T1 and T2 by gender. Pearson correlation coefficients were used to determine the relationships between times spent and lost time for each segment and transition and the partial position occupied. For all tests, the significance level was set at p<0.05 and p<0.001. The analyses were done using SPSS 15.0 (SPSS Inc. Chicago, IL). RESULTS Table 1 shows the change in gender difference in time for swimming, T1, cycling, T2 running, and total event between 2000 and 2008. There are significant (p<0.05) differences for the time spent on all segments and the average total time used by the winners of the competitions (both males and females). We did not find significant differences in the time taken by each sex to carry out the transitions. However, if we express the time in relative fashion, significant differences (p<0.05) between the sexes only exist in the percentage time used in the swimming segment, both for the mean of all participants (16.3±0.6M versus 15.6±0.6F; 52.7±1.4M versus 53.1±1.4F; 29.9±0.7M versus 30.1±0.8F), for the mean of the winners (16.7±0.7M versus 15.8±0.7F; 53.5±1.3M versus 54±1.3F; 28.7±0.5 versus 28.9±1.2), and for the top ten participants (16.7±0.7M versus 15.6±0.6F; 53.8±1.4M versus 53.6±1.4F; 29.1±0.7 versus 29.2±0.9). Table 1. Comparison of the average times in each part of the race between all the competitors, top 10 and
the winners in all the races analysed.
Time Swiming T1 Cycling T2 Running Total Time Average Males 18min19s±25s* 42s±16s 59min9s±3min41s* 19s±7s 33min30s±44s* 1h52min5s±04min*
Average Females 19min37s±36s 47s±20s 1h6min40s±4min7s 32s±7s 37min48s±51s 2h5min27s±4min41s Top 10 Males 18min18s±25s 44s±15s 58min48s±3min27s 26s±7s 31min31s±43s* 1h49min32s±3min53s
Top 10 Females 19min15s±15s 42s±15s 1h6min14s±1min15s 31s±6s 36min30s±30s 2h3min±3min30s Average winners Males 18min9s±25s* 39s±15s 57min56s±3min20s* 26s±9s 31min3s±51s* 1h48min13s±3min44s*
Average winners Females 19min4s±16s 39s±18s 1h6min11s±1min20s 30s±6s 36min13s±1min24s 2h2min41s±2min53s* *Significant difference (p<0.05).

Cejuela et al / Gender differences in elite triathlon performances JOURNAL OF HUMAN SPORT & EXERCISE
VOLUME 7 | ISSUE 2 | 2012 | 438
We calculated the correlation of the time spent and lost time for each segment and transition and the partial position occupied with the final classification in order to discover whether these time distributions and the partial positions occupied had any relationship with the final classification obtained. The results can be seen in Table 2. As the event draws nearer to its end, we see a greater value for the partial position occupied when correlated with the final position. Table 2. Correlation between the final position occupied in the competition and three variables: time spent,
lost time and partial classification in each segment and transition.
Correlation between final
classification and: Swimming T1
Lost Time T1 Cycling T2
Lost Time T2 Running
Group 1 Group 2 breakaway Group 1 Group 2 Time spent
Males 0.36±0.16* 0.25±0.13
0.62±0.26 0.33±0.1
0.83±0.06
Time spent Females 0.48±0.17* 0.3±0.2 0.77±0.11* 0.36±0.14 0.84±0.05
Lost time males 0.4±0.13 0.28±0.11 0.34±0.21* 0.4±0.34 0.63±0.16 0.33±0.08 -0.01±0.82* 0.43±0.1* 0.23±0.1 0.83±0.03
Lost time females 0.48±0.17 0.3±0.2 0.07±0.45 0.31±0.21 0.77±0.12 0.34±0.15 0.19±0.65 0.29±0.17 0.27±0.24 0.84±0.04
Partial position occupied males 0.4±0.19* 0.43±0.18
0.72±0.16 0.73±0.15
0.88±0.06
Partial position occupied females
0.53±0.17 0.55±0.18 0.76±0.14 0.79±0.11 0.85±0.04
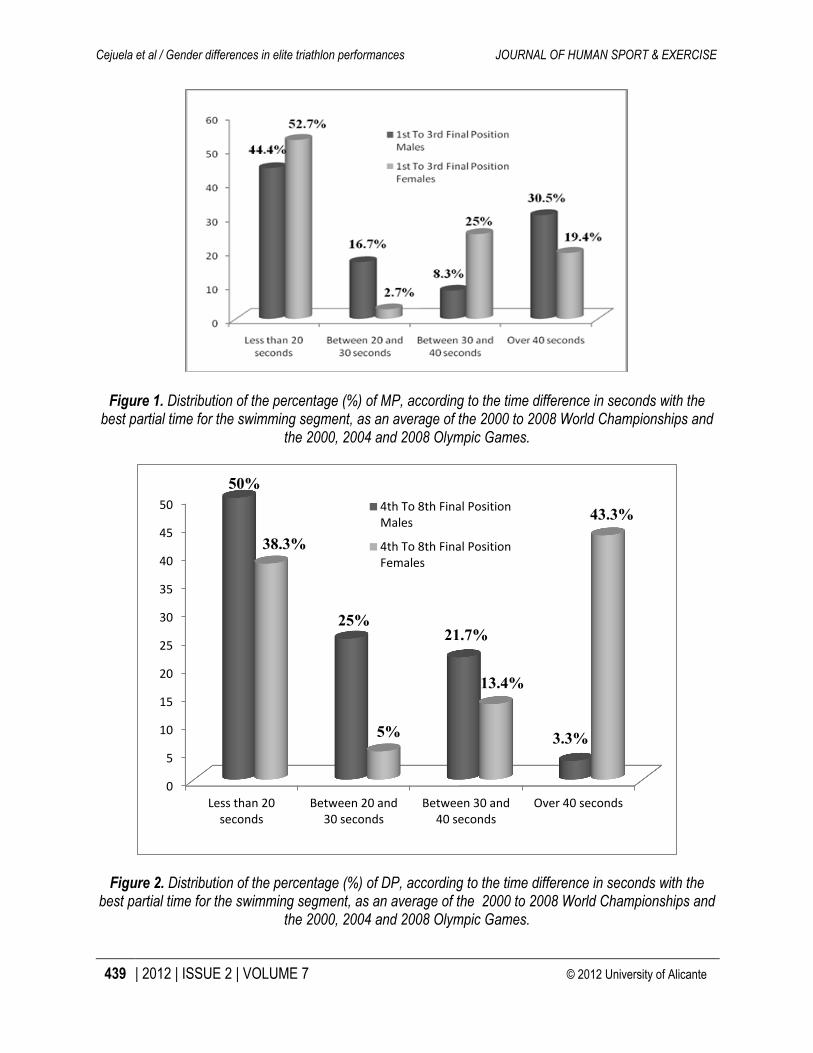
*Significant differences (p<0.05). We calculated the relationship between the time differences of the swimming segment and the final positions obtained for the first 3 competitors classified (Figure 1), corresponding to the medal-winning positions (MP), and the 4th to 8th positions, corresponding to the Olympic diploma positions (DP) in the Olympic Games triathlon event (Figure 2). Taking the average of the competitions analysed for males, 69.4% of the MP in the final classification lost less than 40 seconds compared with the best partial time of the swimming segment. It was higher in females 80.6% lost less than 40 seconds. This figure is more plausible (96.6%) when applied to the DP in males but in females it is lower (56.7%).
Cejuela et al / Gender differences in elite triathlon performances JOURNAL OF HUMAN SPORT & EXERCISE
439 | 2012 | ISSUE 2 | VOLUME 7 © 2012 University of Alicante
Figure 1. Distribution of the percentage (%) of MP, according to the time difference in seconds with the best partial time for the swimming segment, as an average of the 2000 to 2008 World Championships and
the 2000, 2004 and 2008 Olympic Games.
Figure 2. Distribution of the percentage (%) of DP, according to the time difference in seconds with the best partial time for the swimming segment, as an average of the 2000 to 2008 World Championships and
the 2000, 2004 and 2008 Olympic Games.
0
10
20
30
40
50
60
Less than 20 seconds Between 20 and 30 seconds Between 30 and 40 seconds Over 40 seconds
44.4%
16.7%
8.3%
30.5%
52.7%
2.7%
25% 19.4%
1st To 3rd Final Position Males 1st To 3rd Final Position Females
0
5
10
15
20
25
30
35
40
45
50
Less than 20 seconds
Between 20 and 30 seconds
Between 30 and 40 seconds
Over 40 seconds
50%
25% 21.7%
3.3%
38.3%
5%
13.4%
43.3% 4th To 8th Final Position Males
4th To 8th Final Position Females

Cejuela et al / Gender differences in elite triathlon performances JOURNAL OF HUMAN SPORT & EXERCISE
VOLUME 7 | ISSUE 2 | 2012 | 440
We also calculated the relationship between the time differences of the running segment and the final positions obtained for the MP (Figure 3) and for DP (Figure 4). Taking the average of the competitions analysed for males, 57.2% of the MP lost less than 10 seconds compared with the best partial time of the running segment. But for females this percentage is much lower at 30.5%. These figures are very different when we talk about DP positions. For males, only 3.3% lost less than 10 seconds and females 5%. But when the difference is increased to 60 seconds, it affected 78.4% of males but only 21.7% of women.
Figure 3. Distribution of the percentage (%) of MP, according to the time difference in seconds with the best partial time for the running segment, as an average of the 2000 to 2008 World Championships and
the 2000, 2004 and 2008 Olympic Games.
Figure 4. Distribution of the percentage (%) of DP, according to the time difference in seconds with the best partial time for the running segment, as an average of the 2000 to 2008 World Championships and
the 2000, 2004 and 2008 Olympic Games.
0 5
10 15 20 25 30 35 40 45 50
Less than 10 seconds
Between 10 and 20
seconds
Between 20 and 30
seconds
Between 30 and 60
seconds
over 60 seconds
47.2%
22.2%
11.1% 11.1% 8.3%
30.5%
2.7% 8.3%
16.6%
41.6% 1st To 3rd Final Position Males 1st To 3rd Final Position Females
0 10 20 30 40 50 60 70 80
Less than 10 seconds
Between 10 and 20
seconds
Between 20 and 30
seconds
Between 30 and 60
seconds
over 60 seconds
3.3% 11.6%
20%
43.3%
21.6%
5% 3.3% 1.7% 11.7%
78.3% 4th To 8th Final Position Males
4th To 8th Final Position Females

Cejuela et al / Gender differences in elite triathlon performances JOURNAL OF HUMAN SPORT & EXERCISE
441 | 2012 | ISSUE 2 | VOLUME 7 © 2012 University of Alicante
DISCUSSION The performance–time difference between the sexes as regards the time used for each segment, gives a more correct representation of underlying gender differences in physiological capacity (Seiler et al., 2007). For example, the gender difference in power output (velocity) is more consistent with the reported difference in lower- and upper-body muscle mass and maximal strength (Vanderburgh et al., 1997). The total length of the event, each segment and transition are completely conditioned by the specific circumstances of each competition and their organisation. Weather conditions have been shown to be a source of variability as regards event time in the Olympic Triathlon (Paton & Hopkins, 2005), this being higher in hot conditions. Swimming segment There is a significant difference (p<0.05) between sexes in the percentage of the time used in the swimming segment, this being greater for males. However, this is the segment with the least absolute differences in time between the sexes. This may be due to the fact that females float better as a result of their higher fat percentage (Lepers, 2008). Secondly, at lower speed, a woman’s drag coefficient drops somewhat compared with men in any similar water conditions (Toussaint et al., 1988), something that leads to fewer differences in performance between the sexes. In a high percentage, 69.5% for males and more for females (80.5%), options for victory (MP) depend on swimming in the leading pack and not losing more than 40 seconds. This difference may explain the significant difference (p<0.05) in the correlation of the swimming time with the final classification, between the sexes, being greater for females. Drafting is very important, in order to save as much energy as possible for the rest of the event (Chatard et al., 1998; Millet et al., 2002). The transitions are a vital part of the event, requiring speed and precision to move from one segment to another (Millet & Vleck, 2000). In our study, we took another step in analysing performance during the Olympic Triathlon and divided the competition into the three segments, the transitions and the lost time in each of the stages. Lost time in T1 is different for each swimming pack. We identified two swimming groups exiting to the cycling segment (Table 2). There are significant differences in the correlation of lost time in T1 and the final classification between the sexes. This may be due to the fact that the males pushed the pace harder during the T1 contrary to the female triathletes, who were more affected by changes in slope during the cycling and running segment (Meur et al., 2009). Cycling segment Most competitions take place over flat courses with the creation of 1, 2, or 3 groups of triathletes. Those not arriving in the first group rarely have options for winning, something shown by the high correlation between the lost time or the partial position occupied at the end of the cycling segment and the final classification obtained. There are significant differences (p<0.05) between the competitions analysed. These differences may be due to two reasons: one, the individual or group tactics adopted by the triathletes during the segment, i.e. aggressive when seeking to break away from the pack to reach the running segment with a time advantage, or conservative when the decrease in power output at the end of the cycling segment the triathlon could be related to a strategy to prepare for the subsequent running part (Bernard et al., 2009). Second, the orography of the segment, if the segment has hills the correlation is higher than if it is flat. With

Cejuela et al / Gender differences in elite triathlon performances JOURNAL OF HUMAN SPORT & EXERCISE
VOLUME 7 | ISSUE 2 | 2012 | 442
flat profiles, drafting in a pack is more feasible and beneficial than when the riders have to climb slopes and deal with difficult hills, passes, etc. (Faria et al., 2005). There is a significant difference (p<0.05) between the sexes, being higher for females. This may be due to the fact that the average performance level in the men’s competition is more homogeneous and the average number of participants is greater, meaning that packs are more likely to be formed and link up with each other. With females, we obtain higher correlations, even higher than the running segment, in three competitions (the 2000 OG and the 2004, 2006 WC), and very similar in another three (2004, 2008 OG and the 2001 WC). It may be that less numerous packs of triathletes lead to more time differences between the triathletes and their adopting more aggressive tactics than the males. Another reason why group tactics are not adopted by national teams may be the low number of participants per country (1 to 3). The final placing in the cycling segment conditions how T2 is carried out and the time lost in the same. Lost Time The second transition has been described as the most important with regard to the final result of the competition (Vleck et al., 2006). When a large pack arrives at the transition area, a clean, fast transition normally becomes a performance factor that affects the final result. Identifying this parameter provides information, although well known to trainers, whose importance had not been determined with regard to final performance. The time oscillates between 1 and 15 seconds and shows an average correlation with final performance in competitions lasting for about 2 hours, where several events are being decided by final sprints with differences of very few seconds. Therefore, this time may well be decisive for the final classification of some competitions. Time lost in T2 is valid for determining the final performance of the triathletes who reach T2 in the same cycling pack. Losing the least time in T2 or not losing any depends on two factors, firstly arriving at T2 in the leading positions of the pack and, secondly, carrying out the actions required in T2 as quickly as possible. There are significant differences between the groups analysed in the competitions and between the sexes. In some competitions a breakaway is formed in the cycling segment and this obtains enough of an advantage for its members to dispute the final victory. In these men’s (OG 2000: 1; WC 2001: 0.88; and 2006: 0.77) and women’s (WC 2000: 0.91; 2004: 0.79 and 2008: 1; OG 2004: 0.73) competitions, the seconds of time lost in T2 were a decisive performance factor as regards the final results of the competitions. When the circumstances of the competition lead to the arrival of big groups at the transition area, the time lost in T2 can be increased for those triathletes arriving in the last positions of the pack and the correlation with the final classification is greater, as with the WC 2007 (0.62), this correlation is greater than that of the time for the swimming segment and similar to that of the time spent on the cycling segment (Cejuela et al., 2008). It has been found that the triathletes run the first kilometre of the running segment significantly faster than the average speed of the segment, something that indicates the intensity with which the triathletes execute the T2 and start running the final segment. However, it is not clear whether this strategy is the best for obtaining higher performance (Vleck et al., 2008). High correlations have also been observed by associating the speed of movement with the position at the start and end of each segment (Vleck et al., 2008). These changes in rhythm may increase the time lost in the same.

Cejuela et al / Gender differences in elite triathlon performances JOURNAL OF HUMAN SPORT & EXERCISE
443 | 2012 | ISSUE 2 | VOLUME 7 © 2012 University of Alicante
Running segment This has been identified as the segment that shows the greatest variability in its time (1.6% swimming; 2.3% cycling; 3.6% running; ~ 01% transitions) (Paton & Hopkins, 2005). It shows the highest correlation values with the final classification and has been described as the most influential segment (Bentley et al., 2007; Hue et al., 1998; Sleivert & Rowlands, 1996). We found significant differences (p<0.05) between the sexes and positions (MP and DP) for the time lost with regard to the best partial time for the segment and the final position obtained (Figures 3 and 4), with the differences being greater for females. This may be due to the greater difference in the production of relative power (p<0.05) between sexes for the winners, compared with the mean for all participants. Some studies (Meur et al., 2009) indicate that the cadences of the competition and the relative intensity of each segment are not affected by gender, although they analyse a small sample (n=12) from a single competition. On the contrary, our results may well indicate that the tactics adopted in the cycling segment will determine the greater or lesser correlation of the time taken, time lost and the partial position in the running segment with final performance, identifying two race situations that we have described above and which can cause differences: one, where the profile of the cycling segment has significant orographic difficulties and, second, where aggressive tactics are adopted during the cycling segment, leading to time differences between packs. CONCLUSIONS According to the data analysed, the running segment is the most decisive with regard to final performance in the Olympic Triathlon. With males, the correlation is more obvious because the main pack of triathletes is rarely split up due to events during the cycling segment (breakaways or hilly profiles) and the level of performance in the other segments is very high and similar for most competitors. With females, these kinds of events happen more frequently, and performance levels vary more, meaning that there are more variables that make the running segment less decisive, even though it continues to be very decisive. However, small differences in seconds obtained during the swimming segment and transitions can have a significant impact on the outcome of the competition. The execution of transitions should be automatic and done in the shortest possible time for all races. REFERENCES
1. ATKINSON G, NEVILL AM. Statistical methods for assessing measurement error (reliability) in variables relevant to sports medicine. Sports Medicine. 1998; 26:217-238. doi:10.2165/00007256-199826040-00002 [Back to text]
2. BENTLEY DJ, COX GR, GREEN D, LAURSEN PB. Maximising performance in triathlon: Applied physiological and nutritional aspects of elite and non-elite competitions. J Sci Med Sport. 2007; 12:234-242. doi:10.1016/j.jsams.2006.05.004 [Back to text]
3. BENTLEY DJ, LIBICZ S, JOUGLAC A, COSTEC O, MANETTAC J, CHAMARIE K, MILLET GP. The effects of exercise intensity or drafting during swimming on subsequent cycling performance in triathletes. J Sci Med Sport. 2007; 10:234-243. doi:10.1016/j.jsams.2006.05.004 [Back to text]
4. BENTLEY DJ, MILLET GP, VLECK VE, MCNAUGHTON LR. Specific aspects of contemporary triathlon: implications for physiological analysis and performance. Sports Med. 2002; 32:345-359. doi:10.2165/00007256-200232060-00001 [Back to text]

Cejuela et al / Gender differences in elite triathlon performances JOURNAL OF HUMAN SPORT & EXERCISE
VOLUME 7 | ISSUE 2 | 2012 | 444
5. BERNARD T. HAUSSWIRTH C, MEUR YL, BIGNET F, DOREL S, BRISSWALTER J. Distribution of power output during the cycling stage of a triathlon world cup. Med. Sci. Sports Exerc. 2009; 41(6):1296-1302. doi:10.1249/MSS.0b013e318195a233 [Back to text]
6. CEJUELA R, PEREZ-TURPIN JA, CORTELL JM, VILLA JG. An analysis of transition time in the world championship of triathlon - Hamburg 2007: Determination of the Lost Time T2. In: Jiang Y, Hong YL, Sun JH (Eds.). Proceedings of 1st Joint International Pre-Olympic Conference of Sports Science y Sports Engineering. Nanjing PR China: World Academic Union; 2008, 2:193-198. [Back to text]
7. CEJUELA R, PEREZ-TURPIN JA, VILLA JG, CORTELL JM, RODRIGUEZ-MARROYO JA. An analysis of performance factors in sprint distance triathlon. J Hum Sport Exer. 2007; 2(2):1-25. doi:10.4100/jhse.2007.22.01 [Back to text]
8. CHATARD JC, CHOLLET D, MILLET G. Performance and drag during drafting swimming in highly trained Triathletes. Med Sci Sport Exer. 1998; 30:276-1280. doi:10.1097/00005768-199808000-00015 [Back to text]
9. FARIA EW, PARKER DL, FARIA IE. The science of cycling. Factors affecting performance – Part 2. Sport Med. 2005; 35(4):313-337. doi:10.2165/00007256-200535040-00003 [Back to text]
10. HAUSSWIRTH C, BIGARD AX, GUEZENNEC CY. Relationships between running mechanics and energy cost of running at the end of a triathlon and a marathon. Int J Sport Med. 1997; 18:330-339. doi:10.1055/s-2007-972642 [Back to text]
11. HUE O, LE GALLAIS D, CHOLLET D, BOUSSANA A, PREFAUT C. The influence of prior cycling on biomechanical and cardiorespiratory response profiles during running in triathletes. Eur J Appl Physio. 1998; 77(1-2):98-105. doi:10.1007/s004210050306 [Back to text]
12. HUE O, VALLUET A, BLONC S, HERTOGH C. Effects of multicycle-run training on triathlete performance. Res Quart Exerc Sport. 2002; 73(3):289-295. [Abstract] [Back to text]
13. LANDERS GJ. Anatomical, biomechanical and physiological loading during human endurance performance at selected limb cadences via triathlon. Doctoral Thesis: Department of Human Movement and Exercise Science. The University of Western Australia; 2002. [Back to text]
14. LEPERS R. Analysis of Hawaii ironman performances in elite triathletes from 1981 to 2007. Med. Sci. Sports Exerc. 2008; 40(10):1828-1834. doi:10.1249/MSS.0b013e31817e91a4 [Back to text]
15. LUCÍA A, HOYOS J, CHICHARRO JL. Preferred pedaling cadence in professional cycling. Med Sci Sport Exer. 2001; 33:1361-1366. doi:10.1097/00005768-200108000-00018 [Back to text]
16. MCCOLE SD, CLANEY K, CONTE JC. Energy expenditure during bicycling. J Appl Physio. 1990; 68:748-52. [Abstract] [Back to text]
17. MEUR YL, HAUSSWIRTH C, DOREL S, BIGNET F, BRISSWALTER J, BERNARD T. Influence of gender on pacing adopted by elite triathletes during a competition. Eur J Appl Physio. 2009; 10(6):535-545. doi:10.1007/s00421-009-1043-4 [Back to text]
18. MILLET GP, CANDAU RB, BARBIER B, BUSSO T, ROUILLON JD, CHATARD JC. Modelling the transfers of training effects on performance in elite triathletes. Int J Sports Med. 2002; 23(1):55-63. doi:10.1055/s-2002-19276 [Back to text]
19. MILLET GP, VLECK VE, BENTLEY DJ. Physiological requirements in triathlon. J Hum Sport Exer. 2011; 6(2):184-204. doi:10.4100/jhse.2011.62.01 [Back to text]
20. MILLET GP, VLECK VE. Physiological and biomechanical adaptations to the cycle to run transition in Olympic triathlon: review and practical recommendations for training. Br J Sports Med. 2000; 34(5):384-90. doi:10.1136/bjsm.34.5.384 [Back to text]
21. PATON CD, HOPKINS WG. Competitive performance of elite Olympic-distance triathletes: reliability and smallest worthwhile enhancement. Sport science. 2005; 9:1-5. [Full Text] [Back to text]

Cejuela et al / Gender differences in elite triathlon performances JOURNAL OF HUMAN SPORT & EXERCISE
445 | 2012 | ISSUE 2 | VOLUME 7 © 2012 University of Alicante
22. SEILER S, DE KONING JJ, FOSTER C. The fall and rise of gender difference in elite anaerobic performance 1952-2006. Med Sci Sports Exerc. 2007; 39(3):534-40. doi:10.1249/01.mss.0000247005.17342.2b [Back to text]
23. SLEIVERT GG, ROWLANDS DS. Physical and physiological factors associated with success in the triathlon. Sport Med. 1996; 22(1):8-18. doi:10.2165/00007256-199622010-00002 [Back to text]
24. TOUSSAINT HM, DE GROOT G, SAVELBERG HM, VERVOORN K, HOLLANDER AP, VAN INGEN SCHEANU GJ. Active drag related to velocity in male and female swimmers. J Biomech. 1988; 21:435-38. doi:10.1016/0021-9290(88)90149-2 [Back to text]
25. VANDERBURGH PM, KASUNO M, SHARP M, NINDL B. Gender differences in muscular strength: an allometric model approach. Biomed Sci Instrum. 1997; 33:100-5. [Abstract] [Back to text]
26. VLECK VE, BENTLEY DJ, MILLET GP, BÜIRGI A. Pacing during an elite Olympic distance triathlon: comparison between male and female competitors. J Sci Med Sport. 2008; 11:424-432. doi:10.1016/j.jsams.2007.01.006 [Back to text]
27. VLECK VE, BÜRGI A, BENTLEY DJ. The consequences of swim, cycle, and run performance on overall result in elite Olympic distance triathlon. Int J Sports Med. 2006; 27:43-48. doi:10.1055/s-2005-837502 [Back to text]