
Fuzzy Based Smart Charging Station for Electric Vehicle ...
239
Fuzzy Based Smart Charging Station for Electric Vehicle Application to Mitigate Peak Power Demand Kannan T.
-
Upload
khangminh22 -
Category
Documents
-
view
4 -
download
0
Transcript of Fuzzy Based Smart Charging Station for Electric Vehicle ...

Fuzzy Based Smart Charging Station for Electric Vehicle Application to
Mitigate Peak Power Demand
Kannan T.

TH-1265_KANNANT

Fuzzy Based Smart Charging Station for Electric VehicleApplication to Mitigate Peak Power Demand
A
Thesis submitted
for the award of the degree of
Doctor of Philosophy
By
Kannan T.
Department of Electronics and Electrical Engineering
Indian Institute of Technology Guwahati
Guwahati - 781 039, Assam, India
January 2014TH-1265_KANNANT

TH-1265_KANNANT

Dedicated to
My Beloved Parents,Punithamani T. and Thirugnanam A.;
My Teacher,Dr. Praveen Kumar;
and
My Sisters,Dr. Sumathi T., Dr. Gomathi T.,Malathi T. and Lakshmi Prabha T.
TH-1265_KANNANT

TH-1265_KANNANT

Certificate
This is to certify that the thesis entitled “Fuzzy Based Smart Charging Station for Electric
Vehicle Application to Mitigate Peak Power Demand”, submitted byKannan T. (09610215), a
research scholar in theDepartment of Electronics and Electrical Engineering, Indian Institute of
Technology Guwahati, for the award of the degree ofDoctor of Philosophy, is a record of an original
research work carried out by him under my supervision and guidance. The thesis has fulfilled all
requirements as per the regulations of the institute and in my opinion has reached the standard needed
for submission. The results embodied in this thesis have notbeen submitted to any other University
or Institute for the award of any degree or diploma.
Date: Dr. Praveen Kumar,
Place: Guwahati. Assistant Professor,
Dept. of Electronics and Electrical Engg.,
Indian Institute of Technology Guwahati,
Guwahati - 781 039, Assam, India.
TH-1265_KANNANT

TH-1265_KANNANT

Acknowledgements
First and foremost, I feel it as a great privilege in expressing my deepest and most sincere gratitude
to my supervisor Dr. Praveen Kumar, for his excellent guidance throughout my study. His kindness,
dedication, hard work and attention to detail have been a great inspiration to me. My heartfelt thanks
to you sir for the unlimited support and patience shown to me.I have no doubts that finishing my
degree in a proper and timely manner was impossible without his helps, suggestions and advices.
I am also very thankful to my doctoral committee members Professor Sanjay Kumar Bose, Pro-
fessor Somanath Majhi, Dr. Indrani Kar and Dr. Sisir Kumar Nayak for sparing their precious time to
evaluate the progress of my work. I would also like to thank the Head of the Department and the other
faculty members for their kind help in carrying out this work. I am also grateful to all the members
of the research and technical staff of the department without whose help I could not have completed
this thesis.
I express my heartfelt thanks to Professor Govinda Bol Shrestha, Dr. Praveen Tripathy and Dr.
Deepak kumar M Fulwani for providing valuable suggestions on this work.
I express my heartfelt thanks to Ezhil Reena Joy .T . P for providing valuable suggestions on this
thesis and her kind support. My work and stay in this IITG would have been impossible without her.
Thank you very much my dear friend for your kind support and guidance.
I would also like to thank the Head of the Department and the other faculty members for their
kind help in carrying out this work. I am also grateful to all the members of the research and technical
staff of the department without whose help I could not have completed this thesis.
My special thanks to Mr. Sanjib Das for maintaining an excellent computing facility and various
resources useful for the research work. Thanks also go out toall my friends at the Image and Signal
Processing Laboratory. They have always been around to provide useful suggestions, companionship
and created a peaceful research environment. They all contributed directly or indirectly to this thesis,
be it academic help, proofreading and volunteering to be a test subject.
I am extremely thankful to Mr. Mohammed Nasir Ansari, Dr. Mukesh Singh and Mr. Ramesh
Chandra Mishra for their kind support. My work and stay in this IITG would have been impossible
TH-1265_KANNANT

without them. Thank you very much for your kind support and guidance.
I have no words to express my thanks to my seniors, Dr. Shyam Anand, Dr. Senthil Kumar, Dr.
Padam Priyal, Dr. AnanthaRaj, Dr. Anand Kumar, Dr. Sakthivel, N. Vinoth Kumar and P. Saravanan.
My work in this remote place definitely would not be possible without their love and care that helped
me to enjoy my new life in IITG.
I express my heartfelt thanks to my batch mates (2009-2013) for providing valuable suggestions
and kind support.
I have no words to express my thanks to seven most important persons namely, Someswaran,
Satheesh Kumar, Kanmani, Basker Naik, Mirdul, Ankit and Premavathi. My work in this place
definitely would not be possible without their love and care that helped me to enjoy my new life in
IITG.
I thank all my fellow research students and B Tech students especially Himanshu Saini, and Rajibh
Das for their cooperation. During these five years at IITG I have had several friends that have helped
me in several ways, I would like to say a big thank you to all of them for their friendship and support.
I thank all my fellow research students for their cooperation. During these five years at IITG I
have had several friends that have helped me in several ways,I would like to say a big thank you to
all of them for their friendship and support.
I also thanks my master degree class mates namely, Ms. Gomathy, Mr. Loganthan, Mr. Liv-
ingston, Mr. Abbas Kayasudeen, Mr. Senthil, Mr. Pugazhendhi and Mr. Jawahar Babu for their kind
suggestions and support.
My deepest gratitude goes to my parents for their continuouslove and support throughout my
studies. The opportunities that they have given me and theirunlimited sacrifices are the reasons
where I am and what I have accomplished so far.
My relatives also played a great role in my PhD works and they are Dr. Sumathi, Dr. Gomathi, Ms.
Malathi, my lovable sister Ms. Lakshimi Prabha, my lovable baby Vishalini, Anbu Selvan, Ranjith,
Thendral and AmmuKutty. I am very grateful to them.
Finally, I believe this research experience will greatly benefit my career in the future.
Kannan Thirugnanam
x
TH-1265_KANNANT

Abstract
This thesis proposes a fuzzy based smart charging station (SCS) for electric vehicle’s
(EVs) application to mitigate the peak power demand of typical city. The SCS, as pro-
posed in this thesis is a place where the EVs come together to charge (drawn power from
grid) or discharge (support the grid) their batteries basedon the distribution node (DN)
voltage and the available energy in the EVs’ batteries. The SCS has various charging
points, which enables EVs of different battery ratings to charge and discharge. However,
allowing the EVs to discharge or charge without any control may lead to voltage devia-
tion in the DN. If multiple EVs can be discharged or charged ina controlled fashion, then
they can act as distributed energy storage system (DESS). A proper implementation of
controlled charging and discharging can mitigate the peak power demand of the DN by
providing power to grid (peak shaving) or drawn power from the grid (valley filling).
In this thesis, the active power control strategies have been modeled for V2G system to
enable peak shaving and valley filling. If EVs’ batteries areintended to perform charg-
ing or discharging operations, it would get subjected to varying node voltage conditions.
Such frequent charging/discharging operating conditionsaffect the internal circuit param-
eters due to change in state of charge, charge rate of the battery. Moreover, the capacity of
EVs’ batteries would decrease due to frequent charging/discharging process at different
charge rate. Therefore, a precise model of EV battery is verymuch required, to pre-
dict the performance of EVs in real-time V2G interaction. Hence, an electric equivalent
circuit based battery model and capacity fade/loss model suitable for EVs in V2G appli-
cations has been developed. By using the BM, the mathematical modeling and control
of contactless based SCS in V2G scenario has been designed. Fuzzy logic controllers
and aggregator have been used to control the power flow between the SCS and the grid.
TH-1265_KANNANT

The aggregator has been designed to distribute the reference power signal among the
EVs’ batteries present in the SCS during charging or discharging process. Finally, math-
ematical model for economic analysis of energy transfer between EVs’ batteries and grid
has been developed. Also, beneficiary calculation for EVs owners, grid operators and
consumers has been proposed.
The major contributions of this thesis are as follows:
• Electric equivalent circuit based battery and capacity loss model has been developed
for EVs’ batteries to analyze the interaction between EVs’ batteries and the grid.
• A smart charging station has been developed based on the fuzzy logic control, which
the bidirectional power flow between EVs’ batteries and gridduring the peak hours,
normal hours and off-peak hours.
• A mathematical model for the economic analysis of energy transfer between EVs
and grid has been developed. In this work, the economic analysis has been done in
such a way that the battery related liabilities do not becomea financial burden to
EVs owners.
Index Terms: Battery, contactless power transfer, distributed energystorage, electric ve-
hicles, economic evaluation, fuzzy logic control, geneticalgorithm, synchronization and
vehicle-to-grid.
TH-1265_KANNANT

Contents
List of Figures xix
List of Tables xxv
List of Acronyms xxviii
List of Symbols xxxii
Glossary xxxix
1 Introduction 1
1.1 Introduction . . . . . . . . . . . . . . . . . . . . . . . . . . . . . . . . . . . .. . . 2
1.2 Electric Vehicles in Smart Grid . . . . . . . . . . . . . . . . . . . . .. . . . . . . . 5
1.2.1 Vehicle to Grid . . . . . . . . . . . . . . . . . . . . . . . . . . . . . . . . . 6
1.2.2 Major Issues in V2G Interactions . . . . . . . . . . . . . . . . . .. . . . . 8
1.2.3 Literature Survey . . . . . . . . . . . . . . . . . . . . . . . . . . . . . .. . 9
1.2.3.1 Aggregator . . . . . . . . . . . . . . . . . . . . . . . . . . . . . . 11
1.2.3.2 Energy Storage System or EVs Batteries . . . . . . . . . . .. . . 12
1.2.3.3 Inductive Power Transfer . . . . . . . . . . . . . . . . . . . . . .12
1.2.3.4 Synchronization . . . . . . . . . . . . . . . . . . . . . . . . . . . 13
1.2.3.5 Economic Impacts of EVs and Grid . . . . . . . . . . . . . . . . .14
1.2.4 Possible Solution Related to V2G Interactions . . . . . .. . . . . . . . . . . 16
1.3 Motivation and Reason to Adopt the Method . . . . . . . . . . . . .. . . . . . . . . 17
1.4 Aim of the Thesis . . . . . . . . . . . . . . . . . . . . . . . . . . . . . . . . . .. . 20
1.5 Bidirectional Contactless Charging System for V2G Power Transfer . . . . . . . . . 22
1.6 Main Contributions . . . . . . . . . . . . . . . . . . . . . . . . . . . . . . .. . . . 23
1.7 Thesis Organization . . . . . . . . . . . . . . . . . . . . . . . . . . . . . .. . . . . 24
xiii
TH-1265_KANNANT
Contents
2 Mathematical Modeling of Li-Ion Battery Using Genetic Algorithm Approach for V2GApplications 27
2.1 Introduction . . . . . . . . . . . . . . . . . . . . . . . . . . . . . . . . . . . .. . . 28
2.2 Battery Model . . . . . . . . . . . . . . . . . . . . . . . . . . . . . . . . . . . .. . 31
2.2.1 Charge/Discharge Rate and SOC Calculations . . . . . . . .. . . . . . . . . 33
2.2.2 Battery Power and Processed Energy . . . . . . . . . . . . . . . .. . . . . 35
2.3 Parameter Extraction Using Genetic Algorithm Approach. . . . . . . . . . . . . . . 36
2.3.1 Genetic Algorithm . . . . . . . . . . . . . . . . . . . . . . . . . . . . . .. 36
2.3.2 Parameter Extraction Process Using GA . . . . . . . . . . . . .. . . . . . . 37
2.3.2.1 Parameter Specifications . . . . . . . . . . . . . . . . . . . . . .37
2.3.2.2 Generation of Initial Solution Set . . . . . . . . . . . . . .. . . . 37
2.3.2.3 Coding . . . . . . . . . . . . . . . . . . . . . . . . . . . . . . . . 38
2.3.2.4 Fitness Function . . . . . . . . . . . . . . . . . . . . . . . . . . . 39
2.3.2.5 Selection . . . . . . . . . . . . . . . . . . . . . . . . . . . . . . . 39
2.3.2.6 Reproduction . . . . . . . . . . . . . . . . . . . . . . . . . . . . 40
2.3.2.7 Crossover . . . . . . . . . . . . . . . . . . . . . . . . . . . . . . 40
2.3.2.8 Mutation . . . . . . . . . . . . . . . . . . . . . . . . . . . . . . . 42
2.4 Capacity Fade Model . . . . . . . . . . . . . . . . . . . . . . . . . . . . . . .. . . 43
2.5 Model Validation . . . . . . . . . . . . . . . . . . . . . . . . . . . . . . . . .. . . 47
2.5.1 Performance Characteristics of BM . . . . . . . . . . . . . . . .. . . . . . 48
2.5.2 Capacity Fade Analysis . . . . . . . . . . . . . . . . . . . . . . . . . .. . . 54
2.6 Summary . . . . . . . . . . . . . . . . . . . . . . . . . . . . . . . . . . . . . . . . 60
3 Modeling and Control of Contactless based Smart Charging Station in V2G Scenario 61
3.1 Introduction . . . . . . . . . . . . . . . . . . . . . . . . . . . . . . . . . . . .. . . 62
3.2 Modeling of Multi-Point Smart Charging Stations . . . . . .. . . . . . . . . . . . . 64
3.2.1 Distribution Network Model . . . . . . . . . . . . . . . . . . . . . .. . . . 64
3.2.2 Multi-Point Smart Charging Station(SCS) . . . . . . . . . .. . . . . . . . . 65
3.2.3 EV Battery Model . . . . . . . . . . . . . . . . . . . . . . . . . . . . . . . 66
xiv
TH-1265_KANNANT
Contents
3.3 Modeling of Smart Charging Station . . . . . . . . . . . . . . . . . .. . . . . . . . 67
3.3.1 Central Control Unit (CCU) and CS Aggregator . . . . . . . .. . . . . . . . 67
3.3.2 Synchronization Mechanism . . . . . . . . . . . . . . . . . . . . . .. . . . 69
3.3.3 Multi-Point BCCS Unit . . . . . . . . . . . . . . . . . . . . . . . . . . .. 74
3.3.3.1 G2V Operation . . . . . . . . . . . . . . . . . . . . . . . . . . . 76
3.3.3.2 V2G Operation . . . . . . . . . . . . . . . . . . . . . . . . . . . 79
3.3.4 Crate and SOC Calculation . . . . . . . . . . . . . . . . . . . . . . . . . . . 81
3.4 Application Scenario of Multi-Point SCS . . . . . . . . . . . . .. . . . . . . . . . 84
3.5 Results and Discussion . . . . . . . . . . . . . . . . . . . . . . . . . . . .. . . . . 85
3.6 Summary . . . . . . . . . . . . . . . . . . . . . . . . . . . . . . . . . . . . . . . . 99
4 Mathematical Modeling For Economic Evaluation Of Electric Vehicle To Smart GridInteraction 101
4.1 Introduction . . . . . . . . . . . . . . . . . . . . . . . . . . . . . . . . . . . .. . . 102
4.2 Capacity Fade/Loss Model . . . . . . . . . . . . . . . . . . . . . . . . . .. . . . . 104
4.3 Mathematical Model for Economic Evaluation . . . . . . . . . .. . . . . . . . . . . 105
4.3.1 Notations . . . . . . . . . . . . . . . . . . . . . . . . . . . . . . . . . . . . 105
4.3.2 Assumptions . . . . . . . . . . . . . . . . . . . . . . . . . . . . . . . . . . 105
4.3.3 Energy Required by EV Battery . . . . . . . . . . . . . . . . . . . . .. . . 107
4.3.4 Peak Hour Energy Supplied to Grid . . . . . . . . . . . . . . . . . .. . . . 108
4.3.5 Capacity Loss Compensation . . . . . . . . . . . . . . . . . . . . . .. . . . 110
4.3.6 Determination of Tariff for Grid Operators . . . . . . . . .. . . . . . . . . 112
4.3.7 Determination of Tariff for Consumers . . . . . . . . . . . . .. . . . . . . 113
4.4 Electric Vehicle Without Supporting the Grid . . . . . . . . .. . . . . . . . . . . . 114
4.5 Analysis of Energy Trading Scenario Under Different Charging/Discharging Rates . 115
4.6 Summary . . . . . . . . . . . . . . . . . . . . . . . . . . . . . . . . . . . . . . . . 124
5 Conclusion and Future Works 125
5.1 Summary of the Present Work . . . . . . . . . . . . . . . . . . . . . . . . .. . . . 126
5.2 Complete V2G System and Control Architecture . . . . . . . . .. . . . . . . . . . 127
xv
TH-1265_KANNANT
Contents
5.3 Contributions of the Present Work . . . . . . . . . . . . . . . . . . .. . . . . . . . 128
5.4 Scope for Future Research . . . . . . . . . . . . . . . . . . . . . . . . . .. . . . . 130
A Battery Sample Calculation, Initial Population and Solution Set 133
A.1 Sample Calculation for Battery Model . . . . . . . . . . . . . . . .. . . . . . . . . 134
A.1.1 Current SOC (S OCcr) and Charge rate (Cr ) Calculation . . . . . . . . . . . . 134
A.1.2 Battery Power and Processed Energy . . . . . . . . . . . . . . . .. . . . . 134
A.2 Capacity Fade Model . . . . . . . . . . . . . . . . . . . . . . . . . . . . . . .. . . 135
A.3 Genetic Algorithm . . . . . . . . . . . . . . . . . . . . . . . . . . . . . . . .. . . 135
A.3.1 Initial Population . . . . . . . . . . . . . . . . . . . . . . . . . . . . .. . . 136
A.4 Polynomial Coefficients (a1 − a31) . . . . . . . . . . . . . . . . . . . . . . . . . . . 137
A.5 Battery Parameters . . . . . . . . . . . . . . . . . . . . . . . . . . . . . . .. . . . 137
B Fuzzy Logic Controller 143
B.1 Introduction . . . . . . . . . . . . . . . . . . . . . . . . . . . . . . . . . . . .. . . 144
B.1.1 Fuzzification . . . . . . . . . . . . . . . . . . . . . . . . . . . . . . . . . .145
B.1.2 Defuzzification . . . . . . . . . . . . . . . . . . . . . . . . . . . . . . . .. 146
C Filter Design 153
C.1 dc-dc Converter Design . . . . . . . . . . . . . . . . . . . . . . . . . . . .. . . . . 154
C.1.1 Modes of Operation . . . . . . . . . . . . . . . . . . . . . . . . . . . . . .154
C.2 Contactless Power Transfer System . . . . . . . . . . . . . . . . . .. . . . . . . . . 156
C.2.1 Self and Mutual Inductance Calculation . . . . . . . . . . . .. . . . . . . . 156
C.2.2 Electrical Circuit Parameter Calculation . . . . . . . . .. . . . . . . . . . . 157
C.2.3 Operating Frequency . . . . . . . . . . . . . . . . . . . . . . . . . . . .. . 159
C.2.4 Compensation Level . . . . . . . . . . . . . . . . . . . . . . . . . . . . .. 160
C.3 Filter Design for Bidirectional Converters . . . . . . . . . .. . . . . . . . . . . . . 161
C.4 LCL Filter Design . . . . . . . . . . . . . . . . . . . . . . . . . . . . . . . . .. . . 165
D Synchronization 167
D.1 Sample Calculation . . . . . . . . . . . . . . . . . . . . . . . . . . . . . . .. . . . 168
xvi
TH-1265_KANNANT

Contents
D.2 Synchronization Operation . . . . . . . . . . . . . . . . . . . . . . . .. . . . . . . 169
D.2.1 Control Process . . . . . . . . . . . . . . . . . . . . . . . . . . . . . . . .. 170
E Economic Beneficiary Calculation for EVs Owners, Grid Operators and Consumers 173
E.1 Sample Calculation . . . . . . . . . . . . . . . . . . . . . . . . . . . . . . .. . . . 174
References 177
List of Publications 191
Bio-Data 195
xvii
TH-1265_KANNANT

Contents
xviii
TH-1265_KANNANT
List of Figures
1.1 India’s present power generation from various power plants. . . . . . . . . . . . . . 2
1.2 Grid load (p.u) and voltage profile of the Guwahati city, Sishugram 132/33kV Grid
Substation. . . . . . . . . . . . . . . . . . . . . . . . . . . . . . . . . . . . . . . . 3
1.3 Types of energy storage system. . . . . . . . . . . . . . . . . . . . . .. . . . . . . 4
1.4 Vehicle-to-grid operation. . . . . . . . . . . . . . . . . . . . . . . .. . . . . . . . . 6
1.5 Electric vehicle-to-grid interaction with different type of power mitigation. . . . . . . 7
1.6 Layout of the literature review for grid connected system. . . . . . . . . . . . . . . . 15
1.7 Illustration of smart charging station. . . . . . . . . . . . . .. . . . . . . . . . . . . 19
1.8 Block diagram of primary and secondary side converter with contactless charging
system. . . . . . . . . . . . . . . . . . . . . . . . . . . . . . . . . . . . . . . . . . 23
2.1 Types of battery Models. . . . . . . . . . . . . . . . . . . . . . . . . . . .. . . . . 29
2.2 Battery manufacturers’ catalogue data (a) Charge rate characteristics of EIG battery
(b) discharge rate characteristics of EIG battery [1]. . . . .. . . . . . . . . . . . . . 31
2.3 Non-linear battery model. . . . . . . . . . . . . . . . . . . . . . . . . .. . . . . . . 33
2.4 Functional flow chart forCr andS OCcr. . . . . . . . . . . . . . . . . . . . . . . . . 34
2.5 Flow chart for parameter extraction using genetic algorithm approach. . . . . . . . . 41
2.6 New offsprings (O1 andO2) generated from the parents (P1 andP2). . . . . . . . . . 42
2.7 Mutation process for thenth offspring. . . . . . . . . . . . . . . . . . . . . . . . . . 42
2.8 Battery performance characteristics for a cycle. . . . . .. . . . . . . . . . . . . . . 44
2.9 Functional flow chat for capacity loss. . . . . . . . . . . . . . . .. . . . . . . . . . 45
2.10 Block diagram of battery and capacity fade model. . . . . .. . . . . . . . . . . . . 46
2.11 Comparison of proposed model result with EIG battery at1Cr and 1Dr . . . . . . . . 48
xix
TH-1265_KANNANT

List of Figures
2.12 Comparison of proposed model result with EIG battery at4Cr and 4Dr . . . . . . . . 49
2.13 Comparison of proposed model result with Sony US18650 battery at 1Cr and 1Dr . . . 50
2.14 Comparison of proposed model result with Sony US18650 battery at 2Cr and 2Dr . . . 51
2.15 Comparison of proposed model result with Panasonic battery at 1Cr and 1Dr . . . . . 52
2.16 Comparison of proposed model result with Panasonic battery at 0.9398Cr and 1.8795Dr. 53
2.17 Comparison of proposed model result with Sanyo batteryat 1Cr/1Dr . . . . . . . . . 54
2.18 Comparison of proposed model result with Sanyo batteryat 2Cr/2Dr . . . . . . . . . 55
2.19 Capacity loss characteristics of EIG battery. . . . . . . .. . . . . . . . . . . . . . . 56
2.20 Capacity loss characteristics of Sony US18650 battery. . . . . . . . . . . . . . . . . 57
2.21 Capacity loss characteristics of Panasonic battery. .. . . . . . . . . . . . . . . . . . 58
2.22 Capacity loss characteristics of Sanyo battery. . . . . .. . . . . . . . . . . . . . . . 59
3.1 Smart charging station architecture. . . . . . . . . . . . . . . .. . . . . . . . . . . 63
3.2 Radial distribution system of Guwahati city. . . . . . . . . .. . . . . . . . . . . . . 64
3.3 Layout of multi-point smart charging station. . . . . . . . .. . . . . . . . . . . . . 65
3.4 CCU and CS Aggregator. . . . . . . . . . . . . . . . . . . . . . . . . . . . . .. . . 68
3.5 Fuzzy based CCU control structure in p.u (a) input:Vnode, (b) input:ET , D (c) output:
Pgrid. . . . . . . . . . . . . . . . . . . . . . . . . . . . . . . . . . . . . . . . . . . . 69
3.6 Synchronization mechanism between DN and BCCS unit. . . .. . . . . . . . . . . . 70
3.7 Synchronization waveform. . . . . . . . . . . . . . . . . . . . . . . . .. . . . . . . 70
3.8 Load angle control. . . . . . . . . . . . . . . . . . . . . . . . . . . . . . . .. . . . 71
3.9 Fuzzy membership function for LA-FLC control (a) input:Er (b) output:δ. . . . . . 73
3.10 Circuit topology of individual BCCS unit . . . . . . . . . . . .. . . . . . . . . . . 75
3.11 Circuit topology for G2V operating mode. . . . . . . . . . . . .. . . . . . . . . . . 77
3.12 Charging current control. . . . . . . . . . . . . . . . . . . . . . . . .. . . . . . . . 78
3.13 Fuzzy membership function for CC-FLC control (a) input: E′r (b) output:D′. . . . . 78
3.14 Energy injection control. . . . . . . . . . . . . . . . . . . . . . . . .. . . . . . . . 79
3.15 Circuit topology for V2G operating mode. . . . . . . . . . . . .. . . . . . . . . . . 80
xx
TH-1265_KANNANT

List of Figures
3.16 DC link voltage control. . . . . . . . . . . . . . . . . . . . . . . . . . .. . . . . . 81
3.17 Fuzzy membership function for DLV-FLC (a) inputs:E′′r and∆E′′r (b) output:D′′. . . 81
3.18 Crate and SOC calculation. . . . . . . . . . . . . . . . . . . . . . . . . . . . . . . . 82
3.19 Flow chart for energy transfer in V2G and G2V operationsbased on DNC command. 83
3.20 Power at each terminal of BCCS unit. . . . . . . . . . . . . . . . . .. . . . . . . . 86
3.21 Power factor of the BCCS unit. . . . . . . . . . . . . . . . . . . . . . .. . . . . . . 87
3.22 Charging currents of individual EVs’ batteries. . . . . .. . . . . . . . . . . . . . . 88
3.23 Power at each terminal of EVs’ batteries. . . . . . . . . . . . .. . . . . . . . . . . . 88
3.24 Initial and final SOC of the EVs’ batteries . . . . . . . . . . . .. . . . . . . . . . . 89
3.25 Discharging current of EVs’ batteries. . . . . . . . . . . . . .. . . . . . . . . . . . 90
3.26 Power supplied from the EV battery. . . . . . . . . . . . . . . . . .. . . . . . . . . 90
3.27 Power at the terminals of inverter of individual EVs. . .. . . . . . . . . . . . . . . . 91
3.28 Power factor of the BCCS unit. . . . . . . . . . . . . . . . . . . . . . .. . . . . . . 91
3.29 DC link reference voltage at the primary side. . . . . . . . .. . . . . . . . . . . . . 92
3.30 Initial and final SOC of the EVs’ batteries . . . . . . . . . . . .. . . . . . . . . . . 92
3.31 Battery current for charging and discharging case. . . .. . . . . . . . . . . . . . . . 93
3.32 Power supplied/drawn from/to the grid. . . . . . . . . . . . . .. . . . . . . . . . . 94
3.33 Inverter power at the primary side. . . . . . . . . . . . . . . . . .. . . . . . . . . . 94
3.34 Power factor of BCCS unit. . . . . . . . . . . . . . . . . . . . . . . . . .. . . . . . 95
3.35 Initial and final SOC of the EVs’ batteries . . . . . . . . . . . .. . . . . . . . . . . 95
3.36 Changing the SOC level of the EV battery (8kWh, 250V) with respect to theVnode. . 96
3.37 Battery current in unsynchronized G2V operating mode.. . . . . . . . . . . . . . . 97
3.38 Battery power in unsynchronized G2V operating mode. . .. . . . . . . . . . . . . . 98
3.39 Node voltage in unsynchronized G2V operating mode. . . .. . . . . . . . . . . . . 98
3.40 Power drawn from the node in unsynchronized G2V operating mode. . . . . . . . . . 99
4.1 Capacity loss for a 40 kWh battery without grid-interaction. . . . . . . . . . . . . . 114
4.2 Capacity loss for 53.33 kWh energy interactions of a 40 kWh battery (1Cr /1Dr). . . . 116
xxi
TH-1265_KANNANT
List of Figures
4.3 Capacity loss for 53.33 kWh energy interactions of a 40 kWh battery (2Cr /2Dr). . . . 117
4.4 Capacity loss for 53.33 kWh energy interactions of a 40 kWh battery (3Cr /3Dr). . . . 117
4.5 Compensation money charged by the EV owners for capacityloss of the battery. . . . 119
4.6 Energy obtained by the grid in kWh during V2G interaction. . . . . . . . . . . . . . 119
4.7 Tariff paid by grid operators to EV owner per kWh energy. .. . . . . . . . . . . . . 120
4.8 Money paid by the grid operators to the EV for the grid stress energy. . . . . . . . . 120
4.9 Money paid by the consumers to the grid operators for the energy used by EV for
transportation. . . . . . . . . . . . . . . . . . . . . . . . . . . . . . . . . . . . .. . 121
4.10 Profit Obtained by EV per day for transportation and V2G interaction. . . . . . . . . 122
4.11 Profit obtained by the grid operators per day in V2G interaction. . . . . . . . . . . . 122
5.1 Complete V2G system along with the control architecture. . . . . . . . . . . . . . . 128
A.1 Process energy for charging and discharging scenario at1Cr and 1Dr . . . . . . . . . 135
B.1 Functional block diagram of fuzzy logic controller. . . .. . . . . . . . . . . . . . . 145
B.2 Membership functions for CCU controller (a)Vnode(p.u), (b) ET(p.u), (c)D, (d) Pgrid
and (e) rules contribution. . . . . . . . . . . . . . . . . . . . . . . . . . . .. . . . . 148
B.3 Crisp value of thePgrid. . . . . . . . . . . . . . . . . . . . . . . . . . . . . . . . . . 149
B.4 Membership functions for CCU controller (a)Vnode(p.u), (b) ET(p.u), (c)D, (d) Pgrid
and (e) rules contribution. . . . . . . . . . . . . . . . . . . . . . . . . . . .. . . . . 150
B.5 Crisp value of thePgrid. . . . . . . . . . . . . . . . . . . . . . . . . . . . . . . . . . 151
C.1 Buck-boost converter circuit diagram, modes of operation and waveforms. . . . . . . 155
C.2 Parameters of the rectangular coils for any dimension and any relative position be-
tween them [2] . . . . . . . . . . . . . . . . . . . . . . . . . . . . . . . . . . . . . 156
C.3 Circuit topology and mutual inductance coupling model.. . . . . . . . . . . . . . . 158
C.4 Circuit diagram of bidirectional 3Φ and 1Φ ac-dc converter with filter. . . . . . . . . 162
C.5 Equivalent circuit diagram fornth order harmonics. . . . . . . . . . . . . . . . . . . 162
C.6 Equivalent circuit of grid connected inverter. . . . . . . .. . . . . . . . . . . . . . . 165
xxii
TH-1265_KANNANT

List of Figures
D.1 Detailed block diagram of the FLC based synchronizationcontroller. . . . . . . . . . 169
D.2 Detailed circuit topology of individual BCCS unit . . . . .. . . . . . . . . . . . . . 171
xxiii
TH-1265_KANNANT

List of Figures
xxiv
TH-1265_KANNANT

List of Tables
2.1 Polynomial Coefficients (PC)a1 to a31 for charging and discharging scenario. . . . . 43
2.2 Pre-exponential and adjustable factors . . . . . . . . . . . . .. . . . . . . . . . . . 46
2.3 Specifications of batteries . . . . . . . . . . . . . . . . . . . . . . . .. . . . . . . . 47
2.4 Results obtained from battery and capacity fade model. .. . . . . . . . . . . . . . . 59
3.1 Existing load profile of the substation. . . . . . . . . . . . . . .. . . . . . . . . . . 65
3.2 Rule base for CCU-FLC. . . . . . . . . . . . . . . . . . . . . . . . . . . . . .. . . 69
3.3 Rule base for LA-FLC. . . . . . . . . . . . . . . . . . . . . . . . . . . . . . .. . . 73
3.4 Control parameters . . . . . . . . . . . . . . . . . . . . . . . . . . . . . . .. . . . 74
3.5 Rule base for CC-FLC. . . . . . . . . . . . . . . . . . . . . . . . . . . . . . .. . . 78
3.6 Rule base for DLV-FLC. . . . . . . . . . . . . . . . . . . . . . . . . . . . . .. . . 81
3.7 Specifications of EV batteries. . . . . . . . . . . . . . . . . . . . . .. . . . . . . . 84
3.8 Specifications of BCCS unit. . . . . . . . . . . . . . . . . . . . . . . . .. . . . . . 85
3.9 Summary of power and required energy of case I. . . . . . . . . .. . . . . . . . . . 86
3.10 THD and power factor of the BCCS unit during the G2V operating mode. . . . . . . 89
3.11 Summary of power and available energy of case II. . . . . . .. . . . . . . . . . . . 89
3.12 THD and pf of the BCCS unit during the V2G operating mode.. . . . . . . . . . . . 92
3.13 Summary of power and required/available energy of caseIII. . . . . . . . . . . . . . 93
3.14 THD and pf of the BCCS unit during the G2V and V2G operating mode. . . . . . . . 96
3.15 Summary of SOC for EVs’ batteries. . . . . . . . . . . . . . . . . . .. . . . . . . . 97
3.16 Summary of node voltage before and after supporting . . .. . . . . . . . . . . . . . 98
4.1 Average financial value for a normal EV . . . . . . . . . . . . . . . .. . . . . . . . 115
xxv
TH-1265_KANNANT

List of Tables
4.2 Average values of the financial and energy transaction. .. . . . . . . . . . . . . . . 123
A.1 Initial population matrix . . . . . . . . . . . . . . . . . . . . . . . . .. . . . . . . 138
A.2 Initial set of polynomial coefficients . . . . . . . . . . . . . . .. . . . . . . . . . . 139
A.3 EIG battery parameters at 0.5Cr (charge rate). . . . . . . . . . . . . . . . . . . . . . 140
A.4 EIG battery parameters at 0.5Dr (discharge rate). . . . . . . . . . . . . . . . . . . . 141
B.1 Rule base for CCU-FLC. . . . . . . . . . . . . . . . . . . . . . . . . . . . . .. . . 146
xxvi
TH-1265_KANNANT

List of Tables
xxvii
TH-1265_KANNANT

xxviii
TH-1265_KANNANT

List of Acronyms
List of Acronyms
A Ampere
Ah Ampere hour
AC Alternating current
BB Buck-boost
BCCS Bidirectional contactless charging system
BM Battery model
B Big
CB Circuit breaker
CC Contactless coil
CC-FLC Current control - fuzzy logic controller
CCU Central control unit
CCU-FLC Central control unit - fuzzy logic controller
CFM Capacity fade model
CL Capacity loss/fade
CPT Contactless power transfer
CS Charging Station
DC Direct current
DESS Distributed energy storage system
DN Distribution node/network
DOD Depth-of-discharge
DODcr Current DOD
DLV-FLC Direct current link voltage - fuzzy logic controller
EEC Electric equivalent circuit
xxix
TH-1265_KANNANT
List of Acronyms
EIG Energy injection control
EOCV End of charge voltage
EODV End of discharge voltage
EVs Electric vehicles
FLC Fuzzy logic controller
GA Genetic algorithm
G2V Grid-to-vehicle
H High
ICE Internal combustion engine
IPT Inductive power transfer
J Joules
KVA Kilovolt-ampere
kV Kilovolt
kW Kilo-watt
kWh Kilo-watt hour
L Low
LA-FLC Load angle - fuzzy logic controller
LCL Filter circuit
Li-ion Lithium-ion
LPF Low pass filter
M Medium
MVA Mega volt-ampere
MW Mega watt
NB Negative big
NH Negative high
NL Negative low
NM Negative medium
NS Negative small
xxx
TH-1265_KANNANT

List of Acronyms
PC Polynomial coefficients
PEVs Plug-in electric vehicle
PH Positive high
PHEVs Plug-in hybrid electric vehicle
PLL Phase locked loop
PL Positive low
PM Positive medium
PS Positive small
PB Positive big
SPWM Sine pulse width modulation
RES Renewable energy source
S Small
SCS Smart charging station
SOC State-of-charge
S OCcr Current SOC
SS Secondary side
VB Very big
V Voltage
VL Very low
VH Very high
VS Very small
V2G Vehicle-to-grid
W Watts
Wh Watt hour
Z Zero
xxxi
TH-1265_KANNANT

xxxii
TH-1265_KANNANT

List of Symbols
List of Symbols
A Total money to be paid for energy consumption
abc− dq0 Three phase to two phase transformation
amk,n nth coefficient of thekth solution set
APcp Net cost price of the energy for EV owners
APcg Total amount paid by the consumers to the grid operators during a complete day
APevg Total amount paid by EV owner to grid operators during a complete day
APgev Total amount paid by the grid operators to EV owner during a complete day
APloss Total financial loss to the EV owners during V2G interaction
a1 − a31 Polynomial coefficients
c Total quantity of energy supplied by the grid to the EV duringthe peak hours
c′ Total quantity of energy supplied by the grid to the battery during the off-peak hours
C Battery capacitance
Cb1Cb2 Filter capacitance of the single ac to dc converter and buck-boost converter
Cdc Filter capacitance
Cm Compensation money for energy loss
Me Money equivalent of the capacity lost
Cr Charge rate
Ccrtr Current charge rate
CBCCSr Charge/discharge rate of the individual BCCS unit
Clmtr Charge rate limit
Cminr Minimum charge/discharge rate
Cuserr User defined charge/discharge rate of the EVs
C1,C2 Compensation capacitance
xxxiii
TH-1265_KANNANT

List of Symbols
D Duration
Dn Number of days the battery takes to depreciate its value to zero
Dr Discharge rate
Dcrtr Current discharge rate
Dlmtr Discharge rate limit
DODcr Current depth-of-discharge
DODmax Maximum depth-of-discharge
D1 − D14 Diodes
δ Power or load angle
δtc Difference in charging time
δtd Difference in discharging time
Ea activation Energy
Eavail Amount of available energy for discharging scenario
Ebn nth EV battery available or required energy to charge or discharge
Eco Expected count
EGib input energy provided to the battery by the grid
Eo f f−peak Total energy consumed during off-peak hour
El Energy lost due to other reasons
Epeak Total energy consumed during the peak hour
Epos Possible quantity of energy available in the battery that can be sold to the grid
Eq Energy lost due to the capacity loss
Erem Energy remained in the battery after vehicle transportation
Er , E′r Error rate
Esup Actual quantity of energy supplied by the EV battery to the grid
Estor Amount of stored energy for charging scenario
Etranspor Energy used by EV for the transportation purpose
Etrans Actual quantity of energy obtained by the grid from the EV
ET /Etotal Total energy of the EVs batteries or CS/Total processed energy of the battery
xxxiv
TH-1265_KANNANT
List of Symbols
f (x) Difference between measured and calculated values of theCr andDr characteristics
f ′(x) Difference between measured and calculated values of the CL characteristics
F(x) Fitness function of the charge and discharge rate characteristics
F′(x) Fitness function of the capacity loss characteristics
Freq Frequency
Favg Average fitness function value
fs System operating frequency
gen Generation
genmax Maximum generation
Iabc Three phase current
Ic Charging current
Id Discharging current
Ipc Primary current of the contactless coil
Ire f Reference current
Isc Secondary current of the contactless coil
I ∗ Reference signal for battery switch
I ∗pre Previous reference current
k Percentage of energy loss due to capacity loss
k′ Percentage of energy loss due to other reasons
Lb Buck-Boost converter inductance
Lp Self inductance of the primary side coil
Lr Resonant inductance
Ls Self inductance of the secondary side coil
M Initial cost of purchasing the EV battery
Mdep Depreciated monetary value of the battery after a particular number of cycles
n Number of cycles that the battery has interacted with the grid
n′ Maximum number of cycles that the battery can charge/discharge in its life span
n′′ Daily average number of cycles of battery-grid interaction
xxxv
TH-1265_KANNANT

List of Symbols
n×m Population matrix size
O1, O2 Off-string one and two
PEc Processed energy for charging scenario
PEd Processed energy for discharging scenario
Pc Battery power for charging scenario
Pd Battery power for discharging scenario
Pco Crossover probability
Pbn Distributed power tonth EV battery
Pes Probability of each selected string
Pgrid Total power transfer between EVs and grid during V2G or G2V operation
Pm Mutation probability
Pmea Measured power of the BCCS unit
P1, P2 Parents one and two
q Total capacity loss of the battery
Q Nominal battery capacity
Ql Capacity loss/fading
Qr Remaining battery capacity
QClk
kth calculated value of the capacity loss characteristics
QMlk
kth measured value of the capacity loss characteristics
R Gas constant
Rpeak Tariff of energy during the peak hour
R′o f f−peak Tariff of energy during the off-peak hour
Rs. Monetary value is defined as per the Indian Currency
RT Total resistance
R1R2 Battery internal resistance
R′, R′′ Reference output of the fuzzy logic controller
s Total quantity of energy obtained by the grid during the peakhours
s′ Total quantity of energy obtained by the grid during the off-peak hours
xxxvi
TH-1265_KANNANT

List of Symbols
sin cos Unit vectors
S OCcr Current state-of-charge
S OCini Initial state-of-charge
S OCmax Maximum state-of-charge
Sn Population size
S OClt User define SOC/DOD limits
S1 − S14 Switches
tc Charging time
td Discharging time
T Temperature
Ts Simulation Time
Vabc Three phase voltage
VCci
i th calculated value of the battery terminal voltage for charging scenario
VMci
i th measured value of the battery terminal voltage for chargingscenario
VCdj
j th calculated value of the battery terminal voltage for discharging scenario
VMdj
j th measured value of the battery terminal voltage for discharging scenario
Vmeadc dc measured voltage at primary side of three phase ac to dc converter
Vre fdc dc reference voltage of the DC link voltage controller
Vdq0 Direct and quadrature axis voltage
Vnode Node voltage
Vmax Maximum voltage
Vmin Minimum voltage
Vpc Primary side contactless coil voltage
Vprim Primary side voltage of the BCCS unit
Vsc Secondary side contactless coil voltage
V0 Open-circuit voltage
ωt Angular frequency
xxxvii
TH-1265_KANNANT

List of Symbols
x Tariff paid by EV owner to grid per kWh during peak hour
x′ Tariff paid by EV owner to grid per kWh during off-peak hour
XT Total reactance of the system
xL1 Lower bit element of the sub-string
xU1 Upper bit element of the sub-string
x1 Tariff paid by consumers to grid operators per kWh peak hour energy
x′1 Tariff paid by consumers to grid operators per kWh off-peak hour energy
x2 Tariff paid by grid operators to EV owner per kWh peak hour energy
x′2 Tariff paid by grid operators to EV owner per kWh off-peak hour energy
z Money charged by the EV owners to compensate for capacity loss.
xxxviii
TH-1265_KANNANT

Glossary
• ac to dc converter: Converts alternating current into direct current.
• Ancillary services: The ancillary services are necessary to support the distribution system and
control the flow of active power in order to maintain power quality, reliability and stability of
the distribution system.
• Charge/discharge rate (Cr/Dr): A common method for indicating the discharge, as well as the
charge current of a battery.
• Current depth-of-discharge (DODcr): Depth-of-discharge is another method to indicate a bat-
teries state-of-charge. The depth-of-discharge is the inverse of state of charge: as one increases,
the other decreases. In other words, the Depth-of-discharge is usually defined as the amount of
energy removed from a battery.
• Current state-of-charge (S OCcr): The state-of-charge is related to the electric charge stored by
the battery at a given time. It is defined as the ratio between the available charge at a given time
and the maximum capacity.
• Cycle life: The number of charge/discharge cycles the battery can experience before it fails
to meet performance criteria. Cycle life is estimated for charge and discharge conditions. The
actual operating life of the battery is affected by the rate,depth of cycles and by other conditions
such as temperature.
• dc to ac converter: It receives dc voltage at input side and converts ac voltage at output side.
The output voltage can controlled by varying the on and off time of the converter switch.
xxxix
TH-1265_KANNANT

Glossary
• dc to dc converter: Converts dc voltage to regulated dc voltage. Regulation canbe achieved by
controlling the duty ratio.
• Frequency regulation: The frequency regulation is required for reliable operation of the elec-
tric grid. To maintain grid frequency within permissible limits, electric vehicles (EVs) batteries
are used to inject/support the power from/to grid. If load exceeds the generation, the frequency
of the system decrease which indicates the grid required “regulation up” and vice versa. The
EVs batteries can support/inject the power to/from grid forregulation up/down for matching
the generation and load demand.
• Fuzzy logic: It is derived from fuzzy set theory which can deal with uncertainties in systems.
Fuzzy logic incorporates a simple, IF-THEN rule based approach to solve a control problem
rather than attempting to mathematically model a system.
• Grid-to-vehicle (G2V): The EVs’ batteries are charged from the grid during the off-peak hours.
During this operation the power flow from grid to EVs’ batteries based on node voltage and
available energy of the EVs’ batteries.
• Internal resistance (R1R2): The internal resistance of battery is varying with respectto change
in S OCcr/DODcr andCr /Dr .
• Open-circuit voltage (V0): The open-circuit voltage is the voltage under a no-load condition,
which is usually a close approximation to the battery terminal voltage.
• Smart grid: A smart grid is an electric network which is supply the electricity to consumers
based on the digital technology. These digital systems control the electricity and improve the
efficiency, reduce the energy consumption and cost.
• Terminal voltage (VCci
or VCdi
): It is defined as the voltage measured between the battery termi-
nals under load condition. The terminal voltage varies withstate of charge and the charge or
discharge current.
xl
TH-1265_KANNANT

Glossary
• Vehicle-to-grid (V2G): EVs’ batteries are used as a distributed energy storage system which
can support the grid during peak hours or parking hours.
• Voltage regulation: To maintain system voltage within permissible limits at various points of
the distribution system, reactive power compensation plays vital role. By inject/support the
reactive power from/to the grid which impacts the distribution node voltage maintain within
limits and also maintain system stability.
xli
TH-1265_KANNANT

Glossary
xlii
TH-1265_KANNANT

1Introduction
Contents1.1 Introduction . . . . . . . . . . . . . . . . . . . . . . . . . . . . . . . . . . . .. 2
1.2 Electric Vehicles in Smart Grid . . . . . . . . . . . . . . . . . . . . .. . . . . . 5
1.3 Motivation and Reason to Adopt the Method . . . . . . . . . . . . .. . . . . . 17
1.4 Aim of the Thesis . . . . . . . . . . . . . . . . . . . . . . . . . . . . . . . . . . 20
1.5 Bidirectional Contactless Charging System for V2G Power Transfer . . . . . . 22
1.6 Main Contributions . . . . . . . . . . . . . . . . . . . . . . . . . . . . . . .. . 23
1.7 Thesis Organization . . . . . . . . . . . . . . . . . . . . . . . . . . . . . .. . . 24
1
TH-1265_KANNANT

1. Introduction
1.1 Introduction
Electricity is a form of energy. It plays a very important role in everyday human life. The demand
for this electrical energy is gradually increasing with therising population. Electrical energy has
led to development of society, its economic growth and high standard of living. The generation
and consumption of electrical energy has been one of the mostpressing challenges for the modern
societies, due to ever increasing gap between the generation and consumption. Engineering efforts
and solutions can address these challenges to bridge the gap.
In India, the installed power generation capacity is 229.133 Giga-watt (GW) [3,4]. About 57.18%
of the electricity is generated from coal based power plants, 17.62% from hydroelectric power plants,
12.45% from renewable-energy sources, 9.03% from gas basedpower plants, 3.15% from nuclear
power plants and 0.57%from oil based power plants [3]. The base load requirement is 861,291Megau-
nit (MU) against availability of 788,355MU which is a shortage of 8.5%. Due to population growth
and economic development, the demand for energy has increased at a rate of 3.6% per annum over the
past 30 years and the approximate energy consumption per capita is 96kWh in rural area and 288kWh
in urban area [3–6]. During peak hours, the demand is 139.29GW against availability of 110.76GW
which is a shortage of 20.48% [4]. The peak load energy shortage prevails in all regions of the coun-
try and varies from 5.98% in the North-Eastern region to 14.51% in the Southern region [3]. Due
to shortage of electricity, power cuts are common throughout India and this has adversely affected
the country’s economic growth. Therefore, bridging the gapbetween the energy generation and its
consumption becomes essential for the nation’s development. The present energy generation in India
from the various energy sources is shown in Fig. 1.1.
57.18%
17.62%
12.45%
9.03%
3.15%0.57%
CoalHydroelectricRenewableGasNuclearOil
Figure 1.1: India’s present power generation from various power plants.
2
TH-1265_KANNANT

1.1 Introduction
The estimated total peak load demand for electricity in India is expected to cross 298GW by
2022 [3–5]. The peak load shortage would prevail in all the regions of the country and for North-
Eastern region it would be 17.58GW. Assam which is a part of North-Eastern region will have peak
power demand of 1.93GW [7]. The peak load demand for 132/33kVSishugram substation in the city
of Guwahati, Assam will be 0.62MW [8, 9]. From the power plantusage data it is seen that most of
the power plants are underutilized during the off-peak hours. If some energy storage device can be
used to store the energy during the off-peak hours, then an energy gap of 500kW during peak power
demand can be met. Therefore, an energy storage system (ESS)is required to solve the issue of
energy gap during peak hours. In order to handle the peak power demand, one possible solution can
be to ramp-up the power generation capacity, but this optionwould require significant infrastructure
cost of the power plants.
0.8
0.9
1
1.1
1.2
1.3
1.4
1.5
1.6
Lo
ad
(p
.u)
Time (hrs)
00:00hrs 04:00hrs 08:00hrs 12:00hrs 16:00hrs 20:00hrs 24:00hrs0.85
0.9
0.95
1
1.05
1.1
Vn
od
e (p
.u)
Voltage profile Load profile
Node voltage
Valley fillingPeak shaving
Existing load
Valley filling
Figure 1.2: Grid load (p.u) and voltage profile of the Guwahati city, Sishugram 132/33kV Grid Substation.
The approximate overview of the grid load and voltage profileof Guwahati city, Assam is shown
in Fig. 1.2 [10]. The energy demand is high during the peak hours from 07:00hrs to 10:00hrs and
18:00hrs to 22:00hrs. During these hours, power plants mustramp-up generation in order to meet
up the demand. It is expensive to produce power in the peak hours because the increased generation
usually comes from high cost fuel such natural gas. From Fig.1.2, it can be seen that there is big
difference between the peak power demand and off peak power demand. The gap between the peak
3
TH-1265_KANNANT
1. Introduction
and off-peak power demand can be reduced if ESS is used. During the off-peak hours the ESS can be
charged and during peak hours the stored energy can be injected back to the grid.
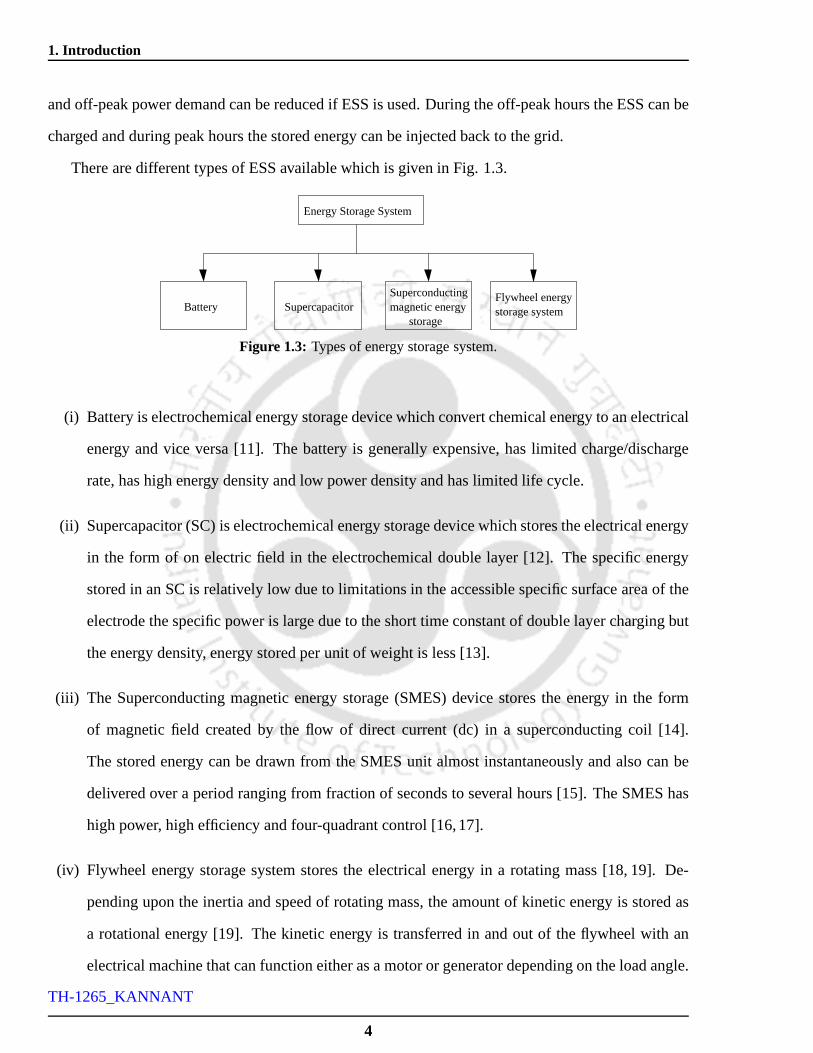
There are different types of ESS available which is given in Fig. 1.3.
Battery Supercapacitor
Energy Storage System
storage
Superconductingmagnetic energy
Flywheel energystorage system
Figure 1.3: Types of energy storage system.
(i) Battery is electrochemical energy storage device whichconvert chemical energy to an electrical
energy and vice versa [11]. The battery is generally expensive, has limited charge/discharge
rate, has high energy density and low power density and has limited life cycle.
(ii) Supercapacitor (SC) is electrochemical energy storage device which stores the electrical energy
in the form of on electric field in the electrochemical doublelayer [12]. The specific energy
stored in an SC is relatively low due to limitations in the accessible specific surface area of the
electrode the specific power is large due to the short time constant of double layer charging but
the energy density, energy stored per unit of weight is less [13].
(iii) The Superconducting magnetic energy storage (SMES) device stores the energy in the form
of magnetic field created by the flow of direct current (dc) in asuperconducting coil [14].
The stored energy can be drawn from the SMES unit almost instantaneously and also can be
delivered over a period ranging from fraction of seconds to several hours [15]. The SMES has
high power, high efficiency and four-quadrant control [16,17].
(iv) Flywheel energy storage system stores the electrical energy in a rotating mass [18, 19]. De-
pending upon the inertia and speed of rotating mass, the amount of kinetic energy is stored as
a rotational energy [19]. The kinetic energy is transferredin and out of the flywheel with an
electrical machine that can function either as a motor or generator depending on the load angle.
4
TH-1265_KANNANT
1.2 Electric Vehicles in Smart Grid
The flywheels have high power density, high energy density, ability to handle high power levels
and need low recharge time [20].
The difference between daily peak and off-peak power demandis varying every year. In case the
difference is small for a day, then the normal battery facilities become suitable. Since these normal
battery energy storage facilities have not proven economical except in functional applications such as
distributed energy storage system (DESS) upgrade a reasonable storage system is required to mitigate
daily peak and off-peak power demand with less infrastructure cost.
The electric vehicles (EVs) can be used to mitigate the peak power demand because most of the
time these vehicles are kept parked [21–24]. The batteries of EVs can be used as a DESS to support
the electric grid when the power demand is high and store the excess amount of energy during the
off-peak hours [22, 23, 25–37]. The EVs are idle most of the time and the batteries are expected to
retain a significant amount of energy when the EVs are not in use [21–23,34].
There are different types of batteries used in EVs such as lead acid, lithium-ion (Li-ion), alka-
line battery etc. In the recent decades much attention has been given to the Li-ion batteries due to
numerous advantages [38, 39]. The Li-ion batteries have high power (800-2000 W/kg), high specific
energy (100-250Wh/kg), high working cell voltage, long life cycle, high power rate density (three
time of the lead acid battery and one and half time of the alkaline battery), low self discharge rate and
no memory effect [40]. Therefore, Li-ion batteries are mostsuitable for EVs and the higher energy
density of these batteries makes them suitable as DESS. In the next section, mitigation of peak and
off-peak hour power demand by using EVs is presented.
1.2 Electric Vehicles in Smart Grid
The EVs are driven only by the energy stored in rechargeable battery and use electric motors and
controllers for propulsion. Charging/discharging characteristics of the EV depend on its range and its
owner’s driving patterns. EVs are plugged into a charging station (CS) or plug-in point to charge or
discharge the battery. The energy required by a typical EV for driving 40 to 60 km using its battery
energy is around 10 to 15 kWh [22], potentially making EVs oneof the biggest energy consumers in
future [41]. The time required to charge the battery of 10 to 15 kWh is about 2 to 3 hours [42].
5
TH-1265_KANNANT

1. Introduction
Wheel
EVs side
Converter
Unit
SS
Controller
Motor
Gear Box
Battery
Wheel
Wheel
Wheel
CS side
Converter
Unit
Grid
EV
information
Control signal
Power flow
Contactless
power transfer
Primary Side (PS) Secondary Side (SS)
Pbn
PS
Controller
Controller
Aggregator
Grid
information
EVs energy
information
EVs energy
information
Pgrid
Pbn
Figure 1.4: Vehicle-to-grid operation.
On an average a typical EVs travels only 3 to 6 hours a day and rest of the time these EVs are
available in the parking bays [22]. The parked EVs can act as aload or source by storing the energy
or feeding the energy back to grid. Therefore, the EVs’ batteries can be used as a DESS for injecting
its excess stored energy to the grid during peak hours and storing energy during the off-peak hours.
The Fig. 1.4 shows the block diagram representation of vehicle-to-grid operation. In contactless
power transfer system, the primary side (PS) is on the CS and the secondary side (SS) is on the
vehicle. To transfer the power in either direction, contactless coil has been used to eliminate direct
contact. The controller and aggregator are used to control the power flow during peak and off-peak
demand hours. The EV battery charge or discharge based on thegrid voltage and the available energy
in the EV. Similarly, multiple EVs are connected to the grid to solve the peak and off-peak hours
power demand. If the grid voltage is high (≥ 1 per-unit), then the controllers do not allow to discharge
the EVs’ batteries for grid support.
1.2.1 Vehicle to Grid
The EVs battery can be charged from the grid and support the grid during peak hours or parking
hours. V2G interaction enables EVs to earn financial incentives while discharging the power to grid.
6
TH-1265_KANNANT

1.2 Electric Vehicles in Smart Grid
Thus, V2G interaction can facilitate the supply/demand balance by discharging during peak hours and
charging during off-peak hours [24,26,28,32,43,44]. One solution to mitigate the impact of EVs on
the grid is to schedule their charging/discharging profilesbased on node voltage conditions. This can
be done by aggregating different sets of EVs for charging or discharging such that grid constraints
(voltage and frequency limits) are maintained within the limit. The various types of services that
can be provided by the EVs to grid interaction are shown in Fig. 1.5. These are mainly divided
into two parts: unidirectional and bidirectional. The G2V implies that energy flows from the grid to
the vehicle. It can be achieved with the help of scheduled charging (based on the node voltage) and
voltage control (to keep node voltage and frequency stable).
Peak load leveling
Regulation
Voltage
Spinning reserves
Ancillary service
Connect more
Power quality improvement
Scheduled charging Voltage control
Electric vehiclesSmart grid
Increase power level
Reduction of losses
Scheduling and dispatch
Energy imbalance control
Stored energy
fed back to grid
FrequencyVoltage and Frequency
EVs
BidirectionalUnidirectional
Figure 1.5: Electric vehicle-to-grid interaction with different typeof power mitigation.
The bidirectional power flow can be divided into two parts: peak load leveling and the ancillary
service. Peak load leveling is a method to balance the load and demand. It can be achieved with the
help of regulation, stored energy fed back to the grid and spinning reserve. The regulation can be
divided into two separate entities such as voltage and frequency regulation [45,46]. The voltage reg-
ulation maintains the system voltage within permissible limits. This is required for proper operation
of electrical equipment and to prevent it from failure [47].With reduced system voltage, the current
must increase to meet up the power demand. It further leads tothe load consuming more reactive
power and the system voltage getting reduced. If the currentincreases too much, the transmission
lines goes off [48, 49]. Therefore, reactive power control improves the voltage imbalance. Hence,
reactive power and voltage control are two aspects that can affect reliability of the grid [46, 47, 49].
7
TH-1265_KANNANT
1. Introduction
The frequency regulation is a method to balance the generation and consumption which causes the
system frequency to remain constant at the desired value [50]. For load demand greater than genera-
tion, the frequency decreases and in the reverse condition frequency increases. Therefore, frequency
regulation is a real-time control which increases or decreases the output power level. Frequency reg-
ulation can also regulate the sudden fluctuations in the loaddemand. Another possible solution to
maintain grid frequency within permissible limits is by using the EVs batteries to inject/draw the
power to/from grid. In case the load exceeds the generation,the frequency of the system decrease,
which indicates the grid requires “ regulation up” and vice versa. The EVs batteries can inject/draw
power to/from the grid for regulation up/down to match the generation and load demand. Apart from
this, to mitigate the peak power demand, the stored energy inthe EVs’ batteries is used as a DESS
which can support the grid during EVs parking hours. The spinning reserve is achieved by connecting
additional generators or increase the power level to compensate the sudden increase or unpredicted
load demand [51,52]. These generators are already synchronized with the grid but these are not oper-
ating at rated power [51–53]. If suddenly the load increasesor decreases, the reserve generators starts
operating at rated power or reduced power level by increasing or decreasing the turbine rotation [54].
Spinning reserve maintains system frequency stability during emergency operating conditions and un-
predicted load swings [54–56]. The EVs batteries are utilized for the ancillary services such as power
quality improvement, reduction of power losses, scheduling and dispatch, energy imbalance control
and voltage and frequency control. The ancillary services are necessary to support the distribution
system and control the flow of active power in order to maintain power quality, reliability and stabil-
ity of the distribution system [57]. Therefore, the EVs are used as a distributed energy sources which
injects or draws the power to/from grid for solving the peak power demand. This method reduces the
transmission and distribution losses, provide power for ancillary services and maintains voltage and
frequency within the regulation.
1.2.2 Major Issues in V2G Interactions
From the above discussion, major issues in V2G interaction are given below:
(i) Uncoordinated charging methodology which can significantly stress the distribution system
8
TH-1265_KANNANT
1.2 Electric Vehicles in Smart Grid
causing severe voltage fluctuations, performance degradations and over load to the grid.
(ii) Uncontrolled and random EV support to the grid can causeincreased power losses and voltage
fluctuations.
(iii) The load and economic considerations eventually impose the voltage and frequency fluctuations
on distribution systems.
It is claimed by many researchers, that the EVs can provide energy to grid for voltage and fre-
quency regulation, spinning reserve and ancillary services [21–23,26,27,43,44,58–60]. The area has
seen significant research activity in the last few years and several works have been done in order to
support the utility grid. Among these, some of the importantworks are reported in the next section.
1.2.3 Literature Survey
Several works has been reported in the literature where the EVs are being used as a DESS to solve
the peak power demand. In most of the work, an optimal charging station and control strategies has
been developed which can store/support power from/to electric grid. Many researchers have devel-
oped a dynamic model and analyzed the power flow between the electric grid and system. The EVs
and HEVs are becoming very popular these days. These vehicles are charged by plugging into electric
outlets. Kemptonet alhas developed control strategies and business models for the implementation of
V2G concept. In this work, the electric-drive vehicle (battery, fuel cell or hybrid) provides the power
to electric markets [23]. In [21], the differences between three approaches by using dynamic model of
EVs’ batteries to grid application have been proposed. Tomic et alhas proposed that the electric-drive
vehicles can provide the power to the electric grid when theyare parked or provide power to specific
electricity market while they are not in use [22]. In [44], itis reported that the EVs can be used
to supply the power to grid for stabilization and peak load shaving. They have also focused on the
infrastructure and the implementation of V2G technology. Ekmanet al has investigated the effects
of different types of EV charging strategies on the balance between wind power generation and con-
sumption [26]. They have developed a control algorithm to store the energy in the EV batteries when
the power consumption is low on the grid. In [58], the intelligent solutions has been developed for
9
TH-1265_KANNANT

1. Introduction
monitoring and controlling the electrical grid when the PEVs and EVs are connected in distribution
network.
In [27], the EVs have been used as a flexible DESS to charge their batteries. This work investigates
the impacts of EVs with V2G capability to power system operation. Hedegaardet al has developed
the EVs’ batteries that are charged/discharged intelligently, it can also provide energy back to electric
grid and reduce the need for new coal/natural gas power capacities [59].
The frequency regulation is considered as the most promising and practical challenges in V2G
services [61]. It has focused, on amount of power that can be delivered from vehicle-to-grid based on
the frequency regulation and the EVs are coordinated by using the aggregator. In [28], the different
types of ESS are studied with a simple probabilistic method to predict the ability of energy storage
to increase the penetration of intermittent renewable-energy generation on weak electricity grid. Kim
et al has addressed dynamic modeling and control of grid connected hybrid generation system such
as wind turbine, photovoltaic array and battery. In this work three types of control strategies has
been used to control the power flow between grid and hybrid system [62]. In [37,63], the design and
simulation of a fast CS for PHEVs batteries has been developed. V2G algorithm has been developed
to optimize energy scheduling, load regulation and spinning reserve [57]. This work focuses on the
maximum profit to the aggregator and it also provides additional system flexibility, low costs of EV
charging for the customer. An optimal scheduling scheme forcharging and discharging the EV battery
with the grid has been proposed in [64, 65]. In [66], the coordination of PHEVs and EVs charging
methods are presented and its impact on the distribution network is analyzed in terms of voltage
deviations and power losses. Leeet al has analyzed PHEVs behavior of charging and its impacts on
the electric grid by using the daily driving schedule [40]. Areal-time smart load management system
has been proposed which can coordinate the multiple PHEVs and EVs charging and maintain the grid
voltage in the stable region [24]. Liet al has developed a methodology of modeling and controlling
the charging demand of PHEVs [67]. A sophisticated control methodology has been proposed for
modeling and analyzing the load demand in a distribution system in [36]. In [68], a conceptual
frame has been studied, successfully integrating the EVs toelectric power system. The impacts of
PHEVs charging on the distribution system using a case studybased on a small residential distribution
10
TH-1265_KANNANT

1.2 Electric Vehicles in Smart Grid
network has been comprehensively analyzed in [69, 70]. In [71], a bidirectional power flow between
EV and grid has been reported by using the integrated traction machine and converter topology. The
impact of the PHEVs charging on the distribution grid has been analyzed through a residential feeder
of the distribution network in [72]. The preceding section has the detailed literature survey about the
aggregator that has been used in the V2G integration, which distributes the power between the electric
grid and the charging system.
1.2.3.1 Aggregator
An efficient optimal aggregator has been proposed for frequency regulation which can transfer
the power between EVs and grid [73]. In [74], a large fleet of EVs supports the grid and charges its
battery based on the grid condition. In this work, a fuzzy based control strategy has been used to
control the power flow between grid and EVs’ batteries. In [75], the PEVs charging rate has been
controlled based on the charging behavior estimated from the graphical strategies data. They have
studied different charging strategies and the impacts of PEVs charging on the DN by using standard
load flow analysis. The application of aggregators to frequency regulation by making fair use of
their energy storage capacity has been addressed in [50]. The coordinated charging control of a V2G
aggregator has been discussed, which aims at minimizing thecharging cost and reducing the power
losses incurred by the fluctuating load [76].
An aggregator has been designed to predict the impacts of PHEVs on the electricity demand
profile in a specific region [61]. In [34], a multi-charging station has been developed for EVs’ battery
charging during the off-peak hours and supports the grid during peak hours. They have proposed
fuzzy based control scheme. An aggregator has been developed to estimate the required power to
charge the EV battery or available power to support the grid and distribute the power to each charging
station. An operating framework for aggregator of PEVs has been designed in [77, 78]. A minimum
load scheduling algorithm has developed to determine the purchase of energy in a day-ahead market,
based on the forecasted electricity and PEVs power demand. Adynamic dispatch algorithm has been
developed, used for distributing the purchased energy to PEVs on the operating day in [77]. The
major research work on the batteries or ESS is presented in the next section.
11
TH-1265_KANNANT
1. Introduction
1.2.3.2 Energy Storage System or EVs Batteries
Dynamic Li-ion battery model has been developed to represent virtual prototyping of portable
battery power systems in [79]. They have taken into account non-linearity, temperature, thermal
effects and the transients. Doggeret al has proposed that Li-ion battery can used as a DES for grid
support. They have developed an intelligent control algorithm which minimizes the degradation rate
and maximize the financial benefits to EV battery owners [80].An autonomous distributed V2G
control scheme providing a distributed spinning reserve for the unexpected intermittency of RES has
been discussed in [31]. In this work, large scale RES has beenintegrated to the power grid and the
EV battery performs an important role of smoothing their natural intermittency and ensuring grid
stability. In [38, 81], the possibility of extending the life cycle of PEVs batteries used for stationary
application and the advantages of Li-ion battery has been discussed. In [35], EV battery has been
used as an ESS that can be integrated with the distribution network of IEEE 30 node power system
model. In this work, a decision making algorithm is established for the deployment of battery energy
stored capacity, state of charge, time of day, electricity prices and vehicle charging requirements. In
the next section, a detailed major research about the inductive power transfer between grid and EVs
charging/discharging system is presented.
1.2.3.3 Inductive Power Transfer
The Inductive power transfer (IPT) or contactless power transfer (CPT) system overcomes the
problem of failure in connection, sparking and the risk of electrical shock. Also, it is safe to operate,
reliable and convenient to handle [82–85]. In vehicle applications, the IPT system was reported more
than two decades back [67, 86–89], but till date there is onlylimited commercial development has
taken place mainly due to the difficulties in transferring significant amount of power to a moving
vehicle without improving the constraints on vehicle moments. Sallanet al has developed a detailed
design procedure for IPT system with a 2kW prototype model [2]. The IPT system for EVs battery
using neither of loosely nor tightly coupled contactless coils has been presented in [67, 87]. Bieleret
al has developed the CPT system which can transfer the power from EVs battery to grid [90]. In [91],
a bidirectional power flow capability has been reported by using the converter and chopper. An
12
TH-1265_KANNANT

1.2 Electric Vehicles in Smart Grid
extensive closed loop control algorithm has been used to control the bidirectional power flow. In [92],
the contactless charging systems are preferred for EVs application due to the elimination of direct
electric contacts. They have developed IPT system for roadway vehicle minimizing each vehicle’s
on-board power pickup weight. Sophisticated and robust control strategies have been developed based
on power frequency droop charging of IPT system [93]. In thiswork, regulation of the power flow
in both directions has been studied without a communicationlink. In [82], an IPT system has been
proposed using a direct ac-ac converter configuration that generates a high-frequency ac current for
the contactless coil. A robust control strategy was developed for generating high-frequency in the
primary side of the converter configuration. A general analysis has been proposed for the design
of loosely coupled IPT system using net impedance or load seen by the source [87, 94]. In [95],
the IPT system has been proposed that is suitable for EV battery charging system. In this work, a
misalignment of the contactless coil and the possible combination of the compensation topologies
(series, parallel, series-parallel and parallel-series)has been presented. The CPT system synchronizes
with the electric grid and thus power flows in either of the directions. In the next section, literature
review on the synchronization of the system with grid is explored.
1.2.3.4 Synchronization
A unidirectional and a bidirectional grid connected converter with IPT systems, requires sophis-
ticated control strategies to control the power flow. The power flow is not guaranteed without syn-
chronization of the system with grid [96]. In this work, a sophisticated control strategy has been
developed for the synchronization technique in a bidirectional power flow between the grid and sys-
tem. Yazdanietet al has developed a new adaptive notch filtering approach for thesynchronization
of the converter connected to DESS [97, 98]. A sophisticatedcontrol algorithm has been developed
for synchronization of grid connected converter and the advantage of this proposed system does not
required phased locked loop (PLL). Grid synchronization with distributed generation using the PLL
techniques has been reported in [87, 99–104]. In [105, 106],a sophisticated synchronization strat-
egy has been reported for a single phase and a three-phase converter connected with the distributed
generators. Due power transfer between EVs and grid, both the EV owners and grid operators earn
13
TH-1265_KANNANT
1. Introduction
incentives. In next section, the detail literature review of economic benefits to the EV and grid owners
is presented.
1.2.3.5 Economic Impacts of EVs and Grid
Many researchers have investigated the economic benefits toEV owners and the electric grid.
In [107], the effect of the PHEVs battery degradation and itseffect on battery lifetime have been
estimated under the driving and charging conditions. Quinnet al has studied the effects of battery
state of charge limitations on V2G interaction and its economic benefits [25]. The economic and envi-
ronmental benefits of EVs and HEVs have been compared with theconventional ICE based vehicles
in [108]. In [109], an energy and economic evaluation is donefor PHEVs interaction with the power
grid and the energy market. The cost and benefits of PHEVs based on the comprehensive ownership
cost model is studied in [110]. They have performed a sensitivity analysis to understand the total own-
ership cost, payback period to model parameters and modeledcomponents of ownership costs. Dietz
et al investigated a smart charging strategy and the economic benefits for the EVs owner against a zero
intelligence charging strategy in a simulation based analysis [111]. The smart charging strategies re-
duce charging cost to the EVs owners by more than 50%. The researchers claim that EVs and PHEVs
could provide energy to the ancillary services and to an electric grid. In [99], a simulation model
has been proposed to analyze the economic and environmentalperformance of EVs operated under
different conditions such as electricity generation mix, smart charging control strategies and real-time
pricing mechanisms. In [112], the charge scheduling has been studied to provide the benefits to both
the utility grid and the EVs owners. A cash flow model has been developed for different type of ve-
hicle [113]. They have focused on ownership costs (capital investments, infrastructure and operating
costs), potential revenue for ancillary services and specifically regulation services. In [114], various
type of sources are used to evaluate the economic and environmental comparisons of the four types
of vehicles such as conventional, hybrid, electric and hydrogen fuel cell. The power system integra-
tion with EVs and economic dispatch of PHEV to the electric grid is presented in [115]. They have
discussed scheduling problem considering other renewable-energy resources and risk management
of PHEVs penetration in power system. The detail reviews hasbeen presented for V2G interaction
14
TH-1265_KANNANT

1.2 Electric Vehicles in Smart Grid
requirements, economic costs, challenges and strategies for V2G interfaces [116].
Voltage control
Plug−in system
Unidirectionalpower flow
Bidirectionalpower flow
Contactless system
Unidirectionalpower flow
Bidirectionalpower flow
Distributed ESS
Design of an aggregator
EVs and PHEVs charging
Frequency control
Regulation Contingency
Distribution NetworkTransmission network
Utility Grid
EVs and HEVs support the gridEconomic benefitsOptimal design of an aggregatorInductive power transfer system
Economic analysis
EV battery modeling
This thesis focus on1. Mathematical model for EV battery
2. Design of bidirectional converter and inverter
3. Develop a smart charging station
4. Analyzed the impacts in the distribution network
5. Synchronization with DN
6. Economic analysis
Converter topologyDirect ac to ac conversion
Figure 1.6: Layout of the literature review for grid connected system.
From the above literature it is evident that EVs batteries can act as distributed energy storage,
which stores the excess amount of energy during the off-peakhours or peak shaving and supports the
grid during peak hours or valley filling. Most of the time (an average of 95%) the EVs are available
in the parking bay [22, 23], thus can be used for interacting with grid. The power transfer between
EVs batteries and grid is based on the node voltage of the gridand energy status of the EVs batteries.
However, the implementation of the EVs batteries drawing/injecting the power from/to grid with the
converter unit, its control methodology and coordination of the multiple EVs still needs to analyzed.
Fig. 1.6 shows the detailed literature review of the presentresearch on V2G implementation based
on the inductive power transfer. Many research works have discussed V2G system and the impact
of charging system on the distribution node (DN). These studies have been done on the system level
(converter and inverters are not designed) analysis and mainly focus on the voltage and frequency
regulation. Most of the researchers have focused on the voltage regulation which draws power from
15
TH-1265_KANNANT

1. Introduction
the DN or support the DN using the DESS energy.
Numerous research works has been done for bidirectional power flow between grid and EVs’ bat-
teries with contactless system. The contactless charging systems are preferable for EVs applications
due to the elimination of direct electric contacts [2, 92]. However, one of the works so far has dis-
cussed the converter configurations, control and coordination of the EVs batteries with the grid. Also,
no literature has discussed the proper synchronization between the EVs batteries charging/discharging
system and the grid. It is important to validate the peak power shaving and valley filling concepts in
a coordinated manner, because the EVs are having different voltage and energy rating. This complex
problem requires an exhaustive analysis and should be presented with the proper converter config-
uration and its control methodology. Moreover, none of the studies have attempted to analyze the
economic impacts to the EV owners and grid operator. Therefore, the economic benefits for EVs
owners and electric grid operator needs to be analyzed in detail.
1.2.4 Possible Solution Related to V2G Interactions
(i) The peak power demand is reduced by providing the stored energy back to grid.
(ii) Coordinated charging methodologies improve the voltage fluctuations and performance of the
system.
(iii) Controlled and aggregated EVs’ batteries energy can support the grid which reduce the power
losses and improve the voltage fluctuations.
(iv) If the load exceeds the generation or vice versa, then the EVs’ batteries will be able to regulate
the grid frequency and voltage.
(v) The scheduled charging strategies provide the ancillary services to grid and improve the grid
frequency.
(vi) The mathematical battery model is used to analyze the charge/discharge rate characteristics and
capacity degradation.
16
TH-1265_KANNANT

1.3 Motivation and Reason to Adopt the Method
1.3 Motivation and Reason to Adopt the Method
In literature, many researchers have validated the EVs and PEVs can be used as distributed energy
storage system for grid support. They have implemented an extensive control strategy for scheduled
charging/discharging of the EVs’ batteries by controllingthe charge/discharge rate. In few research
papers, large scale renewable-energy source has been integrated with the power grid and it has been
observed that the EVs’ batteries play an important role for smoothening the natural intermittency and
frequency stability. However, few researchers have analyzed the technical impacts of the distributed
generators with ESS. Therefore, the EVs would support the grid during peak power demand and store
the energy during off-peak hours. Several works has been developed to validate the V2G implemen-
tation. They have demonstrated various control algorithmsto supply the power to electric grid for
stabilization and peak load shaving. Tomicet al have demonstrated that the EVs can provide power
to grid when they are parked in parking bay or not in use. Few research papers, they have focused on
frequency regulation to coordinate multiple EVs with an optimal aggregator. They have designed an
optimal scheduled charging methodology and an aggregator for multiple EVs coordination which can
support the grid. Singhet al have designed an aggregated EVs energy system which can support the
grid and charge their battery based on the grid condition. They have developed fuzzy based control
strategy which can control the power in either direction. Moreover, they have analyzed system level
control methodology for voltage regulation. They have not designed converter and inverter which can
provide/take the power to/from grid [74]. Also, the aggregated V2G system minimizes the charging
cost and reduces the power losses incurred by the fluctuatingload. Leeet al have analyzed PHEVs
charging behavior and its impacts on the electric grid by using the daily driving schedule. Some re-
searchers have implemented sophisticated control methodology for modeling the system and analyzed
load demand in a distribution system due to EV charging.
In most of the research work that have been reported, the V2G implementation with grid is as a
plug-in or wired system. Only recently, contactless or inductive power transfer charging system is
gaining attention for EVs and HEVs application due to elimination of direct electric contact. These
charging systems overcomes the drawbacks of traditional wired charging systems such as heating of
the sockets and cables, risk of fire, electrical injuries andcable breakage [2,92]. Many research works
17
TH-1265_KANNANT

1. Introduction
has been reported in literature to validate the IPT for V2G system. They have developed robust con-
trol methodology for controlling the power in either direction. Sallanet al has developed a detailed
design procedure for IPT system with 2kW prototype model. Many researchers have modeled con-
verter and inverter configuration for transferring the power. The power transfer takes place only when
the charging system is synchronized with the grid. In other words, the power flow is not being guar-
anteed without synchronization of the system with grid. ThePLL based synchronization technique is
most suitable for DESS. In few papers, they have developed sophisticated control algorithm for the
synchronization of grid connected with converter system. Numerous research works has analyzed the
losses, economic burden and the impacts of DN while transferring the power. The economic burden
to the EVs owners and the electric grid operator has been reported in few papers.
It can be concluded from the above literature that, to mitigate the peak power demand multiple
EVs batteries are required to support the grid and store the energy during off-peak hours. However,
coordination of multiple EVs for grid support requires an optimal aggregator. Therefore, a sophis-
ticated charging station is required which provide aggregated energy for the grid support. EVs are
charged at a place called as CS and this CS is situated near theDN in the parking bay. The parking
bay can be a residential complex or an office complex or even a shopping complex. The EVs normally
stay for longer duration in the parking bay and thus V2G concept can be achieved.
Sishugram power substation in Guwahati city has been considered for this analysis. The distri-
bution network has been developed in MATLAB Simulink environment based on the data obtained
from this substation. The multiple EVs are connected to the distribution node (11kV/440V) via ac
bus. Therefore, the EVs can provide the power based on the DN status and energy availability of the
CS.
If EVs’ batteries are intended to perform V2G operation, it would get subjected to varying node
voltage conditions. Also, during acceleration and regenerative breaking conditions, the EVs’ batteries
would get discharged and charged frequently. Such frequentcharging/discharging operating condi-
tions affect the internal circuit parameters due to change in state-of-charge or depth-of-discharge,
charge rate or discharge rate of the battery. Moreover, the capacity of EVs’ batteries would decrease
due to frequent charging/discharging process at differentcharge/discharge rate. Therefore, a suitable
18
TH-1265_KANNANT
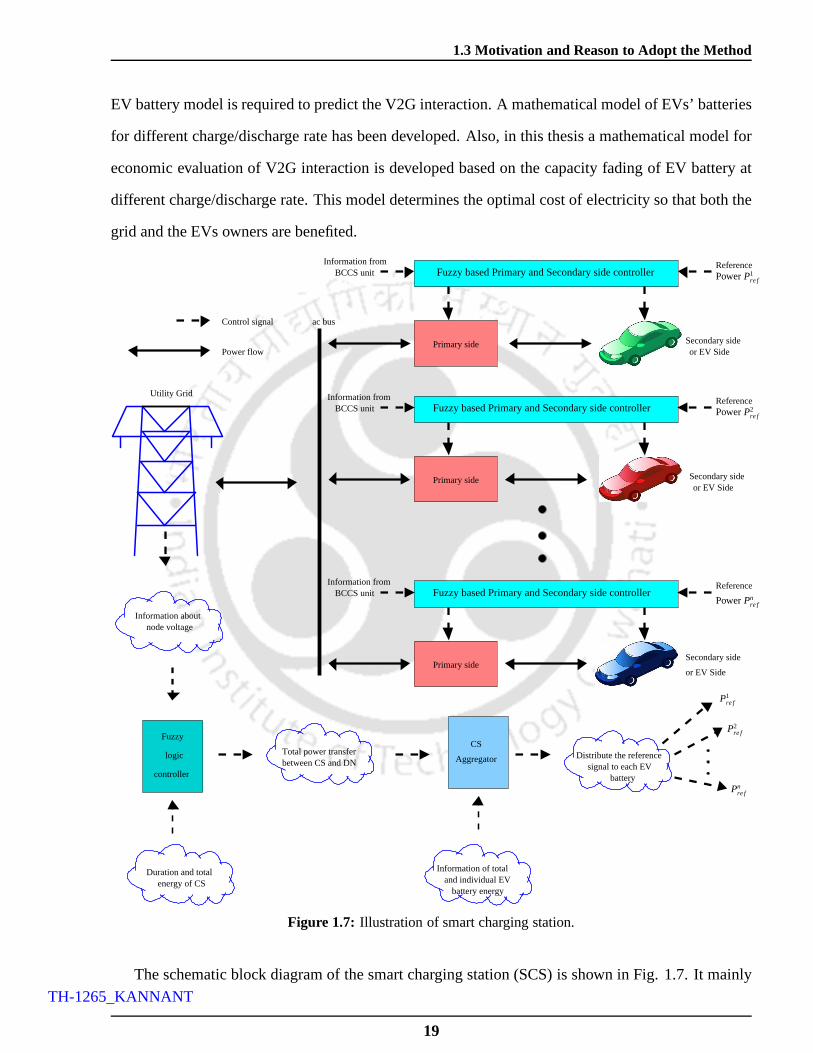
1.3 Motivation and Reason to Adopt the Method
EV battery model is required to predict the V2G interaction.A mathematical model of EVs’ batteries
for different charge/discharge rate has been developed. Also, in this thesis a mathematical model for
economic evaluation of V2G interaction is developed based on the capacity fading of EV battery at
different charge/discharge rate. This model determines the optimal cost of electricity so that both the
grid and the EVs owners are benefited.
Primary side
Fuzzy
logic
controller
Aggregator
CS
Primary side
Primary side
Fuzzy based Primary and Secondary side controller
Fuzzy based Primary and Secondary side controller
Fuzzy based Primary and Secondary side controller
Information aboutnode voltage
Information of totaland individual EV
battery energy
Distribute the referencesignal to each EV
battery
Total power transferbetween CS and DN
Duration and totalenergy of CS
Information fromBCCS unit
Reference
BCCS unitInformation from Reference
ReferenceBCCS unit
Information from
Power flow
Control signal
Secondary side
or EV Side
Secondary sideor EV Side
Secondary sideor EV Side
Utility Grid
ac bus
PowerP1re f
PowerP2re f
PowerPnre f
P1re f
P2re f
Pnre f
Figure 1.7: Illustration of smart charging station.
The schematic block diagram of the smart charging station (SCS) is shown in Fig. 1.7. It mainly
19
TH-1265_KANNANT

1. Introduction
consist of (a) utility grid, (b) fuzzy based central controlunit (CCU), (c) CS aggregator,(d) primary
side (PS) and secondary side (SS) converter units, (e) contactless coil coupled with the PS and SS
converter unit and lastly (f) controller for the converter unit. Total power (Pgrid) flow in either direc-
tion has been controlled by designing an extensive fuzzy based controller which decides the amount
and direction of power flow. The fuzzy based CCU output could be positive or negative. The positive
power implies that batteries getting charged and the negative power imply that batteries discharging
for the grid support. The CCU decides the total power based onthe node voltage (Vnode), avail-
able/required energy (Eavail/Estor) of the EVs batteries present in the CS and duration to support/inject
the power from/to grid. Then, the CS aggregator gives the reference power (Pbn) signal to nth EV
battery based on thePgrid, Eavail/Estor and individual energy (Ebn) of the EV battery. The PS and SS
controller would control the power flow based on thePbn.
1.4 Aim of the Thesis
From the previous section, it can be concluded that coordination of multiple EVs can be achieved
through proper design of mathematical model for EVs’ batteries, charging station, controllers and CS
aggregator. The primary objective of this thesis is to transfer the power between EVs’ batteries and
grid during off-peak and peak hours. The CS would transfer power based on the varying node voltage
with respect to time. Hence, the charge/discharge current of the EV battery is varying based on the
DN voltage. Therefore, a mathematical EV battery model is required to analyze the amount of power
flow from/to EV battery. Based on these aspects, the main motivations of this work are given below:
(i) An electric equivalent circuit based battery model (BM)and capacity fade model (CFM) should
be required to predict the performance characteristics at different charge and discharge rate for
V2G applications.
(ii) The BM parameters should be in the form of polynomial equation with exponential function
because the charge/discharge characteristics are exponentially increasing or decreasing.
(iii) The polynomial equations with exponential function have polynomial coefficients, which is
optimized by using genetic algorithm (GA).
20
TH-1265_KANNANT

1.4 Aim of the Thesis
(iv) A control algorithm should be required to regulate the charge and discharge current. This will
estimate processed energy for charging/discharging scenario, charge/discharge power, Current
state-of-charge (S OCcr) and depth-of-discharge (DODcr) of the battery, user definedS OD/DOD
limits and charge/discharge rate.
(v) A complete capacity fade analysis should be carried out to quantify the capacity loss with
respect to processed energy for charging/ discharging scenario and different charge/discharge
rate.
(vi) The BM and CFM have to develop in MATLAB Simulink environment and it is compared
with the different types of battery manufacturer’s characteristics such as charge and discharge
voltage, available and stored energy, battery power and capacity loss.
(vii) Validation of the proposed battery and capacity fade model will compare with four different
types of battery manufacturers’ catalogue.
The second objective of this thesis is to develop an smart charging station (SCS) by using the BM,
bidirectional converter unit and associated controller tomitigate the peak power demand during peak
hours or stored the energy into the EVs’ battery during off-peak hours. The main features of this work
are given below:
(i) An extensive SCS should be required to mitigate the peak and off-peak power demand.
(ii) An optimal charging station aggregator is necessary tocoordinate the multiple EVs present in
the SCS.
(iii) Sophisticated and robust control methodology shouldbe required for power transfer between
EVs’ batteries and the grid.
(iv) The fuzzy logic controllers are used to control the power flow because it is well suited for
uncertain situations of EVs arrival in the SCS.
(v) The converter and inverter unit should be to develop for EVs’ batteries charging/discharging
system.
21
TH-1265_KANNANT

1. Introduction
(vi) Contactless or IPT system should be design to overcome the traditional wired charging system.
(vii) Fuzzy based synchronization controller should be required for the grid connected converter
unit. Also, robust control strategies have to design for theprimary side and secondary side
converter units.
Finally, a mathematical model for economic evaluation of V2G integration should be required
based on the energy transfer. In this work, a real-time modelis formulated to calculate the economic
benefits of V2G implementation. This mathematical model calculates beneficiary cost for grid oper-
ators while charging the EV battery and estimate the beneficiary cost for EV owners during the grid
support. The main features are given below:
(i) Mathematical modeling for economic benefits of the EVs owners, grid operator and consumers
have to analyze based on the different charge and discharge rate of the EV battery.
(ii) To determine the optimal cost of energy transfer between the EVs batteries and grid so that both
the grid and the EVs owners are financially benefited.
1.5 Bidirectional Contactless Charging System for V2G Power Transfer
In the SCS, multiple EVs participate for the grid support andalso to charge their batteries. To
charge/discharge the EV battery from/to grid, a suitable charging system is essential. Fig. 1.8 shows
the block diagram of bidirectional contactless charging system (BCCS). The PS and SS converter
unit is called as the BCCS which enable the bidirectional power flow between EVs batteries and grid
based on the CS aggregator command. It mainly consists of twoparts; called bidirectional primary
converter units (BPCU) and bidirectional secondary converter units (BSCU), which are separated by
an air gap and magnetically coupled to each other. The power flow from either direction is through
weak or loose magnetic coupling. Generally, controllers are employed on each side to regulate the
power flow in either direction. The BPCU comprises of the bidirectional three-phase ac to dc and dc
to high-frequency ac converter. This unit is connected to DNvia circuit breaker (CB), transformer and
LCL filter as shown in Fig. 1.8. The BSCU is connected to the EV battery through high-frequency ac
to dc and dc to dc (buck-boost) converter.
22
TH-1265_KANNANT

1.6 Main Contributions
convertermotorTraction
converter
dc−dcconverter
Batterypack
Gear box
converter converterFilter
Tf, CB
Air gap
Bidirectional contactless
Secondary side
Primary side
charging unit
Bidirectional power flow
Parking bay in smart charging station
EV body
Rear wheelFront wheel
Utility Grid
dc− 3φac
1Φac− dc
1Φac− dc 3φac− dc
Figure 1.8: Block diagram of primary and secondary side converter with contactless charging system.
1.6 Main Contributions
The main contributions of this thesis are given below:
(i) Battery model has been developed for EVs batteries basedon the polynomial equation with
exponential function.
(ii) A new methodology has been developed for extracting thebattery charge/discharge rate char-
acteristics, capacity fading and total processed energy for charging and discharging scenarios.
(iii) The polynomial coefficients are optimized by using theGA.
(iv) A charging station has been developed based on the fuzzylogic control (FLC) and verified the
bidirectional power flow between EV battery and distribution network during the peak hours,
normal hours and off-peak hours.
(v) An FLC based synchronization methodology has been developed for grid connected bidirec-
tional contactless charging system.
(vi) Fuzzy based control strategy has been developed for converter and inverter unit.
(vii) A mathematical model for the economic analysis of energy transfer between EVs and grid has
been developed. In this work, the economic analysis has beendone in such a way that the
battery related liabilities do not become a financial burdento EV owners.
23
TH-1265_KANNANT

1. Introduction
(viii) Finally, optimal cost of electricity has been determined such that the both the grid operators and
EV owners are benefitted.
1.7 Thesis Organization
This thesis contains five (5) chapters presented as follows:An electric equivalent circuit (EEC)
based battery model (BM) and capacity fade/loss model (CFM)suitable for EVs in V2G applications
has been developed in Chapter 2. The circuit parameters of battery model is extracted using genetic
algorithm based optimization method. A control algorithm has been developed for the battery, which
calculates the processed energy, charge or discharge rate and state of charge limits of the battery in
order to satisfy the future requirements of EVs. A complete capacity fade analysis has been carried
out to quantify the capacity loss with respect to processed energy and cycling. The BM is tested by
simulation and its characteristics such as charge and discharge voltage, available and stored energy,
battery power and its capacity loss are extracted. The propriety of the proposed model is validated
by superimposing the results with four typical manufacturers’ data. The battery profiles of different
manufacturers’ like EIG, Sony, Panasonic, and Sanyo have been taken and its characteristics are
compared with proposed models. The obtained battery characteristics are in close agreement with the
measured (manufacturers’ catalogue) characteristics.
In Chapter 3, the mathematical modeling and control of contactless based charging station in V2G
scenario is presented. Various charging points, also called multi-point is present in a charging station.
The SCS is a place where EVs of particular area comes to chargeas well as to participate for the grid
support. A multi-point bidirectional contactless based SCS with its control structure has been modeled
in this chapter. A smart control algorithm is developed for the CS, which has the ability to decide the
power flow between EVs and grid. The control algorithm modulates the charging/discharging rates
of individual EV batteries by updating the power requirement and realizes a fast and synchronized
response amongst multiple EVs. Each charging point is designed for a maximum peak power handling
capacity of 50kW. The performance of the CS with its control system is investigated with multiple EVs
of different battery ratings, connected under a single power distribution node of a grid. Simulation
studies show that the CS can effectively perform scheduled charging/discharging based on the grid
24
TH-1265_KANNANT
1.7 Thesis Organization
condition and EVs’ batteries constraints.
In Chapter 4, mathematical model for economic analysis of energy transfer between EV battery
and grid has been developed. The objective of this work is to develop a mathematical model for the
integration of EVs to the grid. Integrating the EV with the grid would help in simultaneous charging of
numerous EVs and also provide peak hour energy to the grid by the EVs. This bidirectional exchange
of energy between the grid and EVs results in a complex financial calculations. A simple model has
been proposed to meet up this issue. The energy provided by the EVs to the grid depends on the
battery capacity and further battery capacity is affected by capacity loss (CL). The model includes the
possible cases of CL, such as CL due to battery usage that is its discharge during vehicle transportation
and CL due to the grid interaction.
Finally, the conclusions and future works are presented in chapter 5.
25
TH-1265_KANNANT

1. Introduction
26
TH-1265_KANNANT
2Mathematical Modeling of Li-Ion Battery
Using Genetic Algorithm Approach for V2GApplications
Contents2.1 Introduction . . . . . . . . . . . . . . . . . . . . . . . . . . . . . . . . . . . .. 28
2.2 Battery Model . . . . . . . . . . . . . . . . . . . . . . . . . . . . . . . . . . . . 31
2.3 Parameter Extraction Using Genetic Algorithm Approach . . . . . . . . . . . 36
2.4 Capacity Fade Model . . . . . . . . . . . . . . . . . . . . . . . . . . . . . . .. 43
2.5 Model Validation . . . . . . . . . . . . . . . . . . . . . . . . . . . . . . . . .. . 47
2.6 Summary . . . . . . . . . . . . . . . . . . . . . . . . . . . . . . . . . . . . . . . 60
27
TH-1265_KANNANT

2. Mathematical Modeling of Li-Ion Battery Using Genetic Algorithm Approach for V2G Applications
2.1 Introduction
With the increased penetration of electric vehicles in the market, batteries are considered as one of
the important components in the automobile industry [117, 118]. Among various available batteries,
Lithium-ion batteries are more suitable for EV due to its long cycle life, less self discharge rate, high
energy density, high efficiency, low maintenance and safe use [119].
EVs’ batteries are charged from the distribution node and can be support the DN during parking
hours or having excess amount of energy [120]. This concept is referred as grid-to-vehicle (G2V)
and vehicle-to-grid (V2G) technology [121]. If EVs’ batteries are intended to perform G2V and V2G
operations, it would get subjected to varying node voltage conditions [120]. Also, during acceleration
and regenerative breaking conditions, the EVs’ batteries would get discharged and charged frequently.
Such frequent charging/discharging operating conditionsaffect the internal circuit parameters due to
change in state-of-charge (SOC) or depth-of-discharge (DOD), charge rate (Cr) or discharge rate
(Dr) of the battery. Moreover, the capacity of EVs’ batteries would decrease due to frequent charg-
ing/discharging process at differentCr /Dr [122, 123]. Therefore, a precise model of EV battery is
very much required, to predict the performance of EVs in real-time V2G interaction. Capacity fade
study is mainly required to predict batteries life time, which has been neglected in most battery mod-
els [124–126]. The capacity fade is proportional to charge or discharge rate and temperature of the
battery [122,123,127].
An accurate battery model (BM) and capacity fade model (CFM)have three advantages as follows:
(i) It provides precise battery data for the simulation of EVs to predict the performance of the
system.
(ii) To analyze the changes in circuit parameters accordingto SOC variations, for providing stable
control in the system.
(iii) It is possible to analyze the capacity loss and hence topredict the lifetime of the battery.
In literature, there are four types of battery models such asexperimental, electrochemical, mathe-
matical and electric circuit models [121,128–141] which isgiven in Fig. 2.1.
28
TH-1265_KANNANT
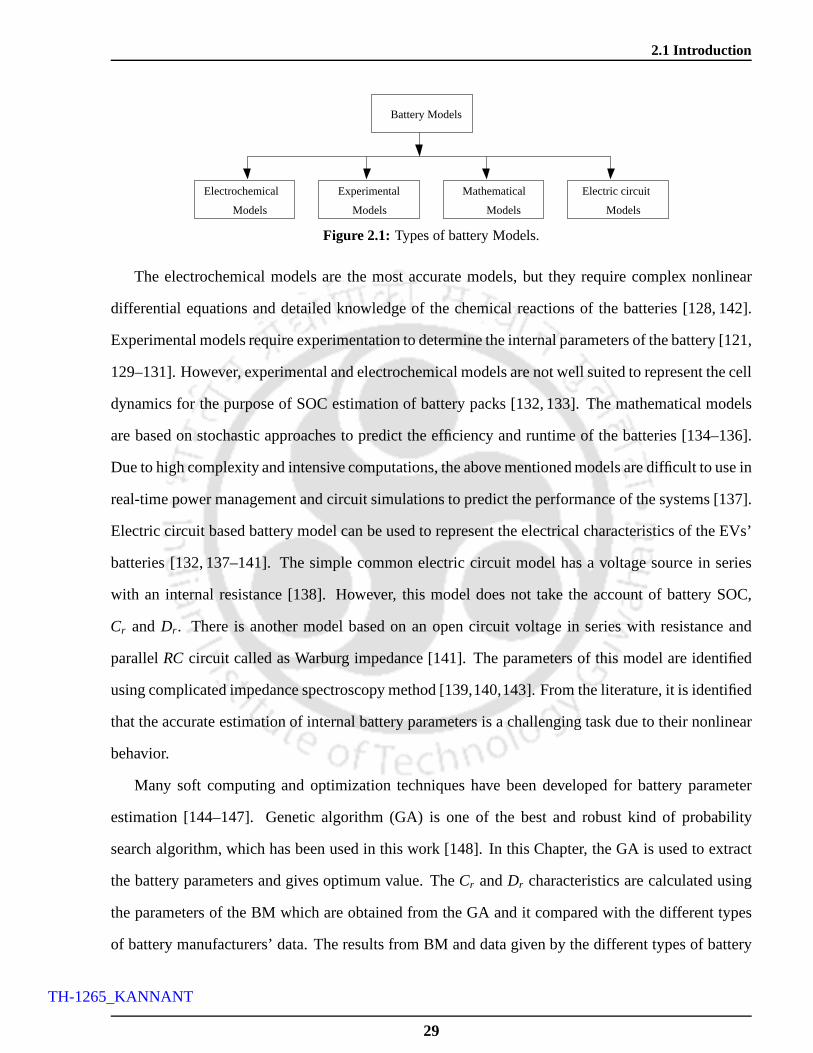
2.1 Introduction
Mathematical
Models
Battery Models
Electrochemical
Models
Electric circuit
Models
Experimental
Models
Figure 2.1: Types of battery Models.
The electrochemical models are the most accurate models, but they require complex nonlinear
differential equations and detailed knowledge of the chemical reactions of the batteries [128, 142].
Experimental models require experimentation to determinethe internal parameters of the battery [121,
129–131]. However, experimental and electrochemical models are not well suited to represent the cell
dynamics for the purpose of SOC estimation of battery packs [132, 133]. The mathematical models
are based on stochastic approaches to predict the efficiencyand runtime of the batteries [134–136].
Due to high complexity and intensive computations, the above mentioned models are difficult to use in
real-time power management and circuit simulations to predict the performance of the systems [137].
Electric circuit based battery model can be used to represent the electrical characteristics of the EVs’
batteries [132, 137–141]. The simple common electric circuit model has a voltage source in series
with an internal resistance [138]. However, this model doesnot take the account of battery SOC,
Cr and Dr . There is another model based on an open circuit voltage in series with resistance and
parallelRC circuit called as Warburg impedance [141]. The parameters of this model are identified
using complicated impedance spectroscopy method [139,140,143]. From the literature, it is identified
that the accurate estimation of internal battery parameters is a challenging task due to their nonlinear
behavior.
Many soft computing and optimization techniques have been developed for battery parameter
estimation [144–147]. Genetic algorithm (GA) is one of the best and robust kind of probability
search algorithm, which has been used in this work [148]. In this Chapter, the GA is used to extract
the battery parameters and gives optimum value. TheCr andDr characteristics are calculated using
the parameters of the BM which are obtained from the GA and it compared with the different types
of battery manufacturers’ data. The results from BM and datagiven by the different types of battery
29
TH-1265_KANNANT

2. Mathematical Modeling of Li-Ion Battery Using Genetic Algorithm Approach for V2G Applications
manufacturers’ are in good agreement. Hence, it can be concluded that the GAs are able to extract
the parameters of the BM effectively.
There are several other experimental works found in the literature, which have focused on capacity
fade analysis of a particular manufacturers’ battery [122,123,149–151]. However, performing exper-
iments to determine the capacity fade of a battery for differentCr andDr is a tedious as well as time
consuming process [127]. Moreover, these studies are confined only for a particular type of battery.
The results would differ for other battery types with differentCr andDr , which cannot be performed
experimentally every time. Therefore, there is a requirement of BM and CFM which can be used for
any type of battery by reducing testing time and optimizing battery parameters for differentCr and
Dr . Based on these aspects, the main motivations of this work are:
(i) To develop a simple circuit based BM and CFM, which can be used for any type of battery.
(ii) To extract the parameters of the model using GA approach.
(iii) To validate the developed model with different types of battery manufacturers’ catalogue.
(iv) The model is computationally inexpensive and does not need experimentation.
This Chapter describes an electric circuit based BM and CFM which represents different type
of battery manufacturers’Cr andDr characteristics. The parameters of the BM is represented bya
polynomial equation, which is optimized using GA approach.A control algorithm has been developed
inside the battery, which calculates the processed energy,Cr /Dr , current SOC (S OCcr) and DOD
(DODcr) constraints of the battery. Simulations are performed with the developed BM and CFM. The
validation of the models have been carried out by comparing the simulated results with the real-time
battery data obtained from four manufacturers’ data sheetssuch as EIG [1], Sony US18650 [127,152],
Panasonic [153] and Sanyo [154]. Due to the unavailability of battery manufacturers’ data, this work
consider the low nominal voltage and Ampere-Hour ratings.
The Chapter is organized as follows. Section 2.2 describes the proposed battery model. The
details of battery parameter extraction using GA approach is discussed in Section 2.3. Section 2.4
describes the capacity fade model. The model validation have been done in Section 2.5 by comparing
30
TH-1265_KANNANT

2.2 Battery Model
the proposed model result with manufactures’ data and summary of the present work is given in
Section 2.6.
2.2 Battery Model
Fig. 2.2 shows the typical performance characteristics of EIG battery at different charge and
discharge rate [1]. Energy extracted from the battery or stored into the battery is directly proportional
to Cr for charging scenario andDr for discharging scenario. It is concluded from the Fig. 2.2(a)
and 2.2(b), behavior of theCr andDr characteristics are exponentially increasing and decreasing with
respect toCr andDr . Therefore, polynomial equation with exponential function is the best way to
represent the battery charge and discharge rate characteristics.
0 0.1 0.2 0.3 0.4 0.5 0.6 0.7 0.8 0.9 12
2.2
2.4
2.6
2.8
Ch
arg
ing
vo
ltag
e (
V)
SOCcr
0.5C
r2C
r4C
r6C
r8C
r
Cr characteristics
of EIG battery
(a)
0 0.1 0.2 0.3 0.4 0.5 0.6 0.7 0.8 0.9 11
1.5
2
2.5
3
DODcr
Dis
cha
rgin
g v
olta
ge
(V
)
0.5Dr
2Dr
4Dr
6Dr
8Dr
Dr characteristics of
EIG battery
(b)
Figure 2.2: Battery manufacturers’ catalogue data (a) Charge rate characteristics of EIG battery (b) dischargerate characteristics of EIG battery [1].
An accurate, intuitive and simple electric circuit based BMis developed using an open circuit
voltage (V0) with a series resistance (R1), and the parallel combination of resistance-capacitance(R2C)
as shown in Fig. 2.3. TheV0 is defined as the voltage between the terminals of battery in open circuit
condition. The parameters of the battery are multi-variable functions ofS OCcr, DODcr, Cr , Dr ,
temperature and cycle number. The parametersV0, R1 in series with parallelR2C characterizes the
usable capacity, instantaneous voltage drop and self discharge energy. TheR2C network in the model
is similar to Thevenins’ model which simulates the transient response. The battery parametersR1,
R2, V0 andC have an exponential nature [155] and are approximated by polynomial functions. The
general polynomial equations for the parameters are given in Eq. (2.1) - Eq. (2.4). The values of the
battery parameters for charging and discharging scenariosare given in Appendix A.
31
TH-1265_KANNANT
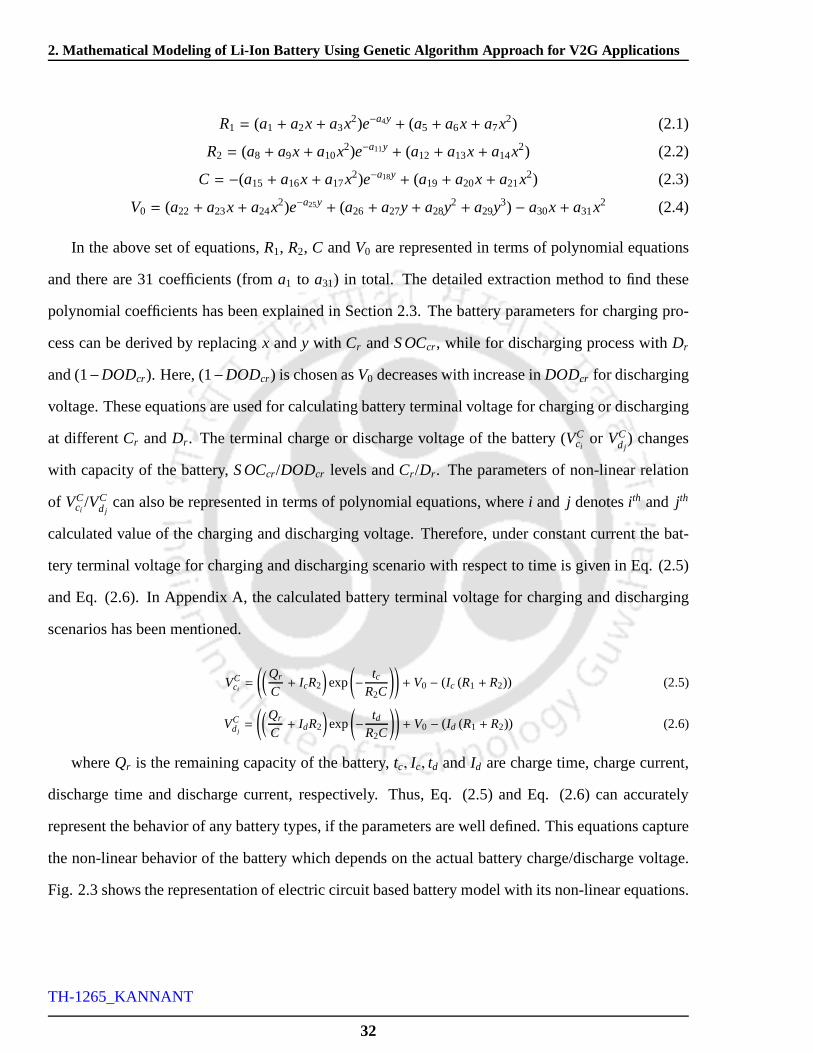
2. Mathematical Modeling of Li-Ion Battery Using Genetic Algorithm Approach for V2G Applications
R1 = (a1 + a2x+ a3x2)e−a4y+ (a5 + a6x+ a7x2) (2.1)
R2 = (a8 + a9x+ a10x2)e−a11y+ (a12+ a13x+ a14x2) (2.2)
C = −(a15 + a16x+ a17x2)e−a18y + (a19+ a20x+ a21x2) (2.3)
V0 = (a22 + a23x+ a24x2)e−a25y
+ (a26 + a27y+ a28y2+ a29y
3) − a30x+ a31x2 (2.4)
In the above set of equations,R1, R2, C andV0 are represented in terms of polynomial equations
and there are 31 coefficients (froma1 to a31) in total. The detailed extraction method to find these
polynomial coefficients has been explained in Section 2.3. The battery parameters for charging pro-
cess can be derived by replacingx andy with Cr andS OCcr, while for discharging process withDr
and (1−DODcr). Here, (1−DODcr) is chosen asV0 decreases with increase inDODcr for discharging
voltage. These equations are used for calculating battery terminal voltage for charging or discharging
at differentCr andDr . The terminal charge or discharge voltage of the battery (VCci
or VCdj
) changes
with capacity of the battery,S OCcr/DODcr levels andCr /Dr . The parameters of non-linear relation
of VCci
/VCdj
can also be represented in terms of polynomial equations, wherei and j denotesi th and j th
calculated value of the charging and discharging voltage. Therefore, under constant current the bat-
tery terminal voltage for charging and discharging scenario with respect to time is given in Eq. (2.5)
and Eq. (2.6). In Appendix A, the calculated battery terminal voltage for charging and discharging
scenarios has been mentioned.
VCci=
(
(Qr
C+ IcR2
)
exp
(
− tcR2C
))
+ V0 − (Ic (R1 + R2)) (2.5)
VCdj=
(
(Qr
C+ IdR2
)
exp
(
− tdR2C
))
+ V0 − (Id (R1 + R2)) (2.6)
whereQr is the remaining capacity of the battery,tc, Ic, td andId are charge time, charge current,
discharge time and discharge current, respectively. Thus,Eq. (2.5) and Eq. (2.6) can accurately
represent the behavior of any battery types, if the parameters are well defined. This equations capture
the non-linear behavior of the battery which depends on the actual battery charge/discharge voltage.
Fig. 2.3 shows the representation of electric circuit basedbattery model with its non-linear equations.
32
TH-1265_KANNANT

2.2 Battery Model
switch
SourceControlled voltage
Signal
electric circuit (EC)
VCd =
((
Qr
C + IdR2
)
× exp(
− tdR2C
))
+ V0 − (Id (R1 + R2))
R
I ∗ < 0
I ∗ > 0
Ic or Id
I ∗ reference current
VCc =
((
Qr
C + IcR2
)
× exp(
− tcR2C
))
+ V0 − (Ic (R1 + R2))
R1
V0VC
dj
S OCcr,DODcr,
VCci
or
Calculate:Qr ,
I ∗, tc, td
VCci
or VCdj
R2
C
Figure 2.3: Non-linear battery model.
2.2.1 Charge/Discharge Rate and SOC Calculations
The charge or discharge rate algorithm is used to determine the amount of energy stored or ex-
tracted from the EV battery. TheCr andS OCcr of the battery varies depending on the present condi-
tion of the battery.
Fig. 2.4 explains the calculation ofCr andS OCcr for charging scenario. The control algorithm
developed inside the battery checks the battery status and then calculates the current charge rate (Ccrtr )
of the EV battery. It has also taken into account of user defined Cr limit (Clmtr ) and initial battery SOC
(S OCini). TheCcrtr andDcrt
r of the battery can be expressed as given in Eq. (2.7) - Eq. (2.8).
Cr = Ccrtr =
Ic
Qr(2.7)
Dr = Dcrtr =
Id
Qr(2.8)
This is calculated based on current status of the battery, which is the ratio of current and remaining
capacity of the battery. The algorithm chooses the minimum of charge rate based on theClmtr andCcrt
r
to regulate the charge current of the battery. Similar type of control algorithm is used for discharging
scenario.
33
TH-1265_KANNANT

2. Mathematical Modeling of Li-Ion Battery Using Genetic Algorithm Approach for V2G Applications
if
if
Yes
if
Yes
No
No
Yes
Yes
Stop
if
Calculation for
Calculation for
No
No
To BM and CFM
≥ S OCmin
≤ S OCmax
S OCini is
Ccrtr ≤ Clmt
r
tctc tc
tc = tc + (Ts − T pres ) tc = 0
Ic
Ccrtr
Ts = 0
Ccrtr = Clt
r
sign of Ic
I ∗ × I ∗pre > 1
S OCini
Ts Clmtr QrS OCmax S OCmin
∆tc = (tc − delay(tc))
S OCini = S OCcr
tc = 0
T pres = delay(Ts); I ∗pre = delay(I ∗)
Ic
S OCcr = S OCini +Ic×∆tcQ3600
S OCmax,S OCmin,S OCini ,Ts, Ic,Qr , I ∗, tcIc
I ∗
tc
Figure 2.4: Functional flow chart forCr andS OCcr.
34
TH-1265_KANNANT

2.2 Battery Model
The S OCcr and DODcr can be calculated from Eq. (2.9) - Eq. (2.10). TheS OCcr and tc is
estimated from theCr control algorithm which is given in Fig. 2.4. Similarly, theDODcr and td is
calculated for discharging scenario.
S OCcr = S OCini +
(
Ic∆tcQr3600
)
(2.9)
DODcr = DODini +
(
Id∆tdQr3600
)
(2.10)
Here,S OCini is the initial SOC of the battery. TheS OCmax andDODmax are the maximum user
definedS OCandDOD limits. If S OCcr andDODcr of the battery reachesS OCmax andDODmax, then
the control algorithm should not allow to charge or discharge the battery to prevent over charging
or discharging. The control algorithm used to charge/discharge the EVs’ batteries from/to grid have
been explained in Chapter 3. The sample calculation forS OCcr, Cr , etc. has been given in Appendix
A.
2.2.2 Battery Power and Processed Energy
The battery power for charging (Pc) and discharging (Pd) scenario is given in Eq. (2.11) - Eq.
(2.12).Pc = VC
ciIc (2.11)
Pd = VCdj
Id (2.12)
The amount of stored energy (Estor) during charging process depends on increase inVCci
andS OCcr,
which is given in Eq. (2.13).Estor = VC
ciQr∆S OCcr (2.13)
where,∆S OCcr is the change in currentS OCcr. The processed energy (PEc) for charging scenario
is given in Eq. (2.14).PEc =
∑
Estor (2.14)
The available energy (Eavail) in the battery during discharging process decreasesVCdi
with increase
in DODcr, which can be calculated using Eq. (2.15).
Eavail = VCdj
Qr∆DODcr (2.15)
35
TH-1265_KANNANT

2. Mathematical Modeling of Li-Ion Battery Using Genetic Algorithm Approach for V2G Applications
where,∆DODcr is the change in currentDODcr. The processed energy (PEd) for discharging
scenario is given in Eq. (2.16).
PEd =
∑
Eavail (2.16)
The total processed energy (Etotal) of the battery in a cycle is calculated using Eq. (2.17).
Etotal =
∑
(PEc + PEd) (2.17)
Eq. (2.11) to Eq. (2.17) represents the real-time performance of the battery during charging and
discharging process. Simulations are done based on these equations for the developed BM and has
been validated with the manufacturers’ catalogue which is discussed in Section 2.5. In Appendix A,
battery power and processed energy calculation details hasbeen mentioned.
2.3 Parameter Extraction Using Genetic Algorithm Approach
2.3.1 Genetic Algorithm
Finding the polynomial coefficients for battery model is a simple polynomial fit problem. In the
direct methods, the initial iteration value of the battery coefficients should be very close to solution set.
To overcome this problem, the GA has been used for finding the battery parameters at different charge
and discharge rate. Genetic algorithm is a technique for stochastic search, learning and optimization.
GA imitates the process of biological evolution, includingselection, crossover and mutation based on
the principle; good individuals survive and breed good individuals [147,156]. Battery parameters are
extracted using GA based optimization technique. Different types of manufacturers’ data of Li-ion
batteries are considered for extraction purpose. The main objective of GA is to optimize the battery
parameters polynomial coefficients (a1 − a31) to evaluate the equations given from Eq. (2.1) to Eq.
(2.6).
The main advantages of using GA to optimize the battery coefficients are given below:
(i) The purpose of using GA for battery parameter extractionproblem lies in the fact that it requires
only manufacturersCr and Dr characteristics and gives consistent polynomial coefficient of
battery model during relatively fewer iterations.
36
TH-1265_KANNANT

2.3 Parameter Extraction Using Genetic Algorithm Approach
(ii) GA is more flexible in extracting the battery parameterswith any initial values, while other
numerical methods are incapable of obtaining satisfactorysolution.
(iii) The algorithm is easy to understand and can be optimized using fitness function.
(iv) With its optimizing capability, GA steer the fitness function to be more representative and yields
an accurate solution set even if the initial values are far from the solutions.
(v) GA encodes an optimum value based on simple chromosome.
(vi) By its evolutionary character, GA does not suffer from convergence problem and can be dealt
with any number of coefficients in a defined boundary limits.
2.3.2 Parameter Extraction Process Using GA
The main objective is to find the battery parameters for the developed BM, which should exactly
match the manufacturers’ data. GA assigns random values andapply standard mutation and crossover
operators without any impact on the periodic or continuous nature of the solution. The details of
parameters extraction problem is given below.
2.3.2.1 Parameter Specifications
The charge or discharge rate characteristics of the batterymodel depends on polynomial coeffi-
cients (a1 − a31) which is given in Eq. (2.1) - Eq. (2.4). To perform GA based optimization, the
population size (Sn) has been considered as a matrix size of 300×31. The length of the string is taken
as 15. The crossover (Pc) and mutation probability (Pm) are taken to be 0.85 and 0.05. The measured
(manufacturers’ catalogue value) battery terminal voltage for charging (VMci
) and discharging (VMdi
)
scenarios are obtained from manufacturers’ catalogue to optimize the polynomial coefficients.
2.3.2.2 Generation of Initial Solution Set
GA process begins with the generation of an initial random solution set to the problem. The entire
solution set (300× 31) is discretized and the variable is defined with a discretebinary set of strings
(ami ,1...ami ,n). Each string is a combination of different representationof sub-strings (am1,n...ami ,n). Let,
37
TH-1265_KANNANT

2. Mathematical Modeling of Li-Ion Battery Using Genetic Algorithm Approach for V2G Applications
Sn is the random solution set of battery coefficient havingm columns andn rows and is given in Eq.
(2.18). Here,ami ,n denotesnth coefficient ofi th solution set. The initial random solution set has been
mentioned in Appendix A.
Sn =
am1,1 . . . am1,n.... . .
...
ami ,1 · · · ami ,n
(2.18)
Eachnth coefficients ofi th string in the solution set has a 15 bit number of a total of 465 bits. The
15 bit number in a single coefficient is denoted by Eq. (2.19).
ami ,n = (x1x2...xl) (2.19)
wherex1 andxl is the lower and upper bit element in a single coefficient. Thebinary numbers in the
strings are converted to real value, which will be manipulated with different genetic operators.
2.3.2.3 Coding
An important step in GA is to encode the vector (amk,n) into binary string. Thus, the entire
population vector is decritized and the variable is defined with a discrete binary set of sub-strings
(amk,1...amk,n). Each string is a combination of different sub-strings (amk,1), the length of the sub-string
considered as 15. This process is referred as coding. The string in next generation is manipulated with
different genetic operators. The genes of individual codedstrings are represented with binary digits.
The length of the string is determined according to the desired solution accuracy. Each variable is
defined with a discrete set of binary set of strings. These group of strings can be called as population.
Each string corresponds to a precision value of the corresponding actual value of the variable. The
length of the string defines the accuracy in the solution. Thestrings are converted to decoded value
(Si) which is given in Eq. (2.20).
Si =
li−1∑
i=1
2iami ,n (2.20)
where l i is the length of the string which is 15,ami ,n ∈ (0, 1) and stringami ,n is represented by
(al−1al−2........a2a1a0). The decoded value should convert in to corresponding realor parameter value.
The real value for thei th polynomial coefficients is given in the Eq. (2.21).
38
TH-1265_KANNANT

2.3 Parameter Extraction Using Genetic Algorithm Approach
ai = aiL+
aiU − ai
L
2l − 1× Si (2.21)
whereaLi andaU
i are the lower and upper boundary limits of the parameter extraction problem. The
sample calculation for string to decoded value and real value conversion for the parameter extraction
problem has been given in Appendix A.
2.3.2.4 Fitness Function
The next requirement after generation of random solution set is the measure of quality of solution
set. This can be achieved by establishing a fitness function (F(x)), which is rated by each solution
according to its fitness. The function that has to be maximized (F(x) = 1) is called as fitness function.
The difference between measured (catalogue value) (VMci
or VMdj
) and the calculated (VCci
or VCdj
) char-
acteristics for charging or discharging case is determinedas given in Eq. (2.5) or Eq. (2.6). Based on
the calculated fitness value, the best list get updated and the lowest fitness is discarded. IfF(x) has
to be maximized, thenf (x) should be minimized which is mathematically expressed as given in Eq.
(2.22).
F(x) =1
1+ f (x)(2.22)
Fitness function is followed by checking its optimal condition to know whether the solution set has
reached the best fitness. Otherwards, the best fitness function is taken to be the parent for next gen-
eration based on Roulette-Wheel method [157]. The mathematical formulation of f (x) for charging
and discharging scenario is given in Eq. (2.23).
f (x) =
n∑
i=0
∣
∣
∣
∣
(
VMci− VC
ci
)
∣
∣
∣
∣
m∑
j=0
∣
∣
∣
∣
(
VMdj− VC
dj
)
∣
∣
∣
∣
(2.23)
2.3.2.5 Selection
The individual having the highest fitness value is allowed toremain in the next generation as an
elite individual. The selection operator is used to choose individual for evolution. Roulette-wheel
39
TH-1265_KANNANT

2. Mathematical Modeling of Li-Ion Battery Using Genetic Algorithm Approach for V2G Applications
method is used to select the best individuals based on the high value ofF(x). The biggerf (x) value
has worse quality of solution set. The selection of the fitness values for the next iteration can be
obtained from Eq. (2.24) to Eq. (2.26). Here,Favg is the average fitness function value,Eco is
expected count andPes is the probability of each string selected.
Favg =
∑
f (x)Sn
(2.24)
Eco =F(x)Favg
(2.25)
Pes=Eco
Sn(2.26)
Thus, the fitness values are arranged based on the maximum probability. The best solution set
values are converted from real value to binary string of solution set. The string manipulation has been
carried out using genetic operators such as reproduction, crossover and mutation.
2.3.2.6 Reproduction
This process rejects many worstF(x) values and selects best values whose fitness is aboveFavg. It
picks the best fitness value from the current population and forms a mating pool. Multiple copies are
inserted in the mating pool in a probabilistic manner. In order to choose the strings for next generation,
a random numbers between 0’s and 1’s are generated. The cumulative probability is calculated based
on the individual string probabilities. A string is chosen from the random number and is compared
with the previous best solution set based on the cumulative probability. The string with higher fitness
is selected and is copied to mating pool.
2.3.2.7 Crossover
After the next generation of solution set, the crossover genetic operators will be applied for the
selected solution set. During crossover new strings are created by exchanging information among
strings in the mating pool. A couple of parent (P1 andP2) strings are selected to perform crossover to
get two new offspring strings. If the selected parents have the probability ofPco ≤ 0.85, it performs
crossover or else it is copied to the next generation.
40
TH-1265_KANNANT

2.3 Parameter Extraction Using Genetic Algorithm Approach
Start
gen=gen+1
Yes
No
Yes
Read the measured valuesRead the measured values for
Select population size (n), crossover prob−
If No
Charging orDischarging
Select a maximum
Yes
No
for i= 1 to m
Calculate battery parameters for charging or
i=i+1
Save the values of solution
if
donecharging/discharging
Save the values of solution
Stop
generated for next generationNew solution set has
Mutation
Crossover
them in the mating poolSelect good string and place
String to decode value anddecode value to real value conversion
Real value to string conversion
If
Discharging
for charging scenario (VMci
)discharging scenario (VMdj
)
ability (Pco) and mutation probability (Pm)
generation number:genmax
of strings for solution sets (n×m)Randomly generate a population
Initialization
gen> genmax &&
Charging
F(x) < 0.85
Cr ,Dr ,DODmax, F(x), gen= 1,Qr ,S OCmax
Calculate
Ic, tc,S OCcr or Id, td,DODcr
discharging secnario:R1,R2,C,V0
CalculateVCci
or VCdi
f (x) =n∑
i=1
∣
∣
∣VMci− VC
ci
∣
∣
∣ or f (x) =n∑
i=1
∣
∣
∣VMdi− VC
di
∣
∣
∣
F(x) = 1(1+ f (x))
sets (a1 to a31)
a31)sets (a1 to
Sn = Sn + 1
wheren = 1 to 300Sn = nth solution set
Sn ≥ 300
(Eq. (2.1) to Eq. (2.4))
(Eq. (2.5) or Eq. (2.6))
Figure 2.5: Flow chart for parameter extraction using genetic algorithm approach.
41
TH-1265_KANNANT

2. Mathematical Modeling of Li-Ion Battery Using Genetic Algorithm Approach for V2G Applications
001110001 010010
101000110 001101
010010 001101101000110 001110001
Parent 1 (P1) Parent 2 (P2)
Offspring 1 (O1)
Offspring 2 (O2)
Figure 2.6: New offsprings (O1 andO2) generated from the parents (P1 andP2).
To illustrate this process, two parentsP1, P2 are picked up from the mating pool. The crossover
point is chosen to be 9 bit. Two offspringsO1, O2 are created by exchanging information among
string in the matting pool as shown in Fig. 2.6. When reproduction happened between two intelligent
genes, the probability to produce an intelligent gene is high. Good parent strings are combined to
form a better child string, if an appropriate site is chosen.But good children strings may or may not
be produced. This is not considered much because bad children strings would be discarded in the
future mating pool based on their fitness.
2.3.2.8 Mutation
Mutation selects a particular offspring and randomly perform changes for one or more characters
in the string by changing 0 to 1 or vice versa. The offspring selection is based onPm which is evaluated
from fitness. If the selected number is less thanPm, it performs mutation by altering the chosen string
to create a better child string; otherwise it keeps the bit unaltered which is used for next generation.
Fig. 2.7 shows the mutation process of the selected offspring.
After crossover After mutation
After crossover After mutation
0 0 1 1 1 0 0 1 0 1 0 0 1 00
1 0 1 0 0 0 1 1 0 0 0 101 1
0 1 1 1 1 0 0 1 0 1 0 0 1 00
1 0 1 0 0 0 1 1 0 0 0 001 1
(O1) (Q1)
(O2) (Q2)
Figure 2.7: Mutation process for thenth offspring.
After several generations, the algorithm converges the best individuals to represent the optimal
solution. Fig. 2.5 shows the functional flow chart to obtain the polynomial coefficients of the battery.
The obtained polynomial coefficients for charging and discharging scenario is given in Table 2.1.
42
TH-1265_KANNANT

2.4 Capacity Fade Model
Table 2.1: Polynomial Coefficients (PC)a1 to a31 for charging and discharging scenario.
PC for charging scenario PC for discharging scenarioPC Values PC Values PC Values PC Valuesa1 0.02109 a17 0.028163 a1 0.05256 a17 0.004548a2 0.000579 a18 0.668211 a2 0.002547 a18 15.90916a3 0.000064 a19 5.235634 a3 0.000587 a19 134.2356a4 42.76495 a20 0.110554 a4 30.3548 a20 0.012207a5 0.01246 a21 0.063747 a5 0.05215 a21 0.002661a6 0.000396 a22 0.012559 a6 0.003147 a22 1.01254a7 0.000033 a23 42.78011 a7 0.00032 a23 20.2145a8 0.009526 a24 2.146841 a8 0.022546 a24 2.5423a9 0.000238 a25 0.188108 a9 0.012547 a25 0.22547a10 0.000003 a26 0.024947 a10 0.022657 a26 0.1101a11 29.38634 a27 0.002864 a11 18.26547 a27 0.02103a12 0.00687 a28 0.162724 a12 0.010001 a28 0.00151a13 0.000324 a29 0.015353 a13 0.00088 a29 0.0009a14 0.000025 a30 0.011420 a14 0.000023 a30 1.42546a15 8.635732 a31 0.00642 a15 1.222364 a31 0.00032a16 0.369508 - - a16 0.010693 - -
2.4 Capacity Fade Model
The energy storage capacity of battery decreases due to frequent charging or discharging. In
this work, the capacity loss is calculated based on variablecharge or discharge rate at an ambient
temperature. The charge and discharge characteristics fora cycle is illustrated in Fig. 2.8. A cycle
is defined as an interval during which the battery charges till S OCmax and discharges up toDODmax.
When the battery experiences different charge and discharge cycles, it fails to meet its performance
thus reducing its life expectancy. Therefore, it is required to study the capacity fade to quantify the
capacity loss with respect to number of cycles. The capacityfade calculation with an example has
been mentioned in Appendix A.
Capacity fade of the battery can be quantified using Arrhenius equation for constant charge or
discharge rate [122]. The mathematical model used to quantify the capacity fade is based on Arrhenius
equation and is given in Eq. (2.27) [122, 123]. Here,A is pre-exponential factor,Ql represents
the capacity loss (Ah),Ea denotes the activation energy (J),R is the gas constant (JmolK ), T is the
temperature (K),t is the time andz is the adjustable factor.
Ql = Aexp(
− Ea
RT
)
tz (2.27)
Eq. (2.27) is used for calculating capacity fade under constant Cr . However, in real-time grid
43
TH-1265_KANNANT
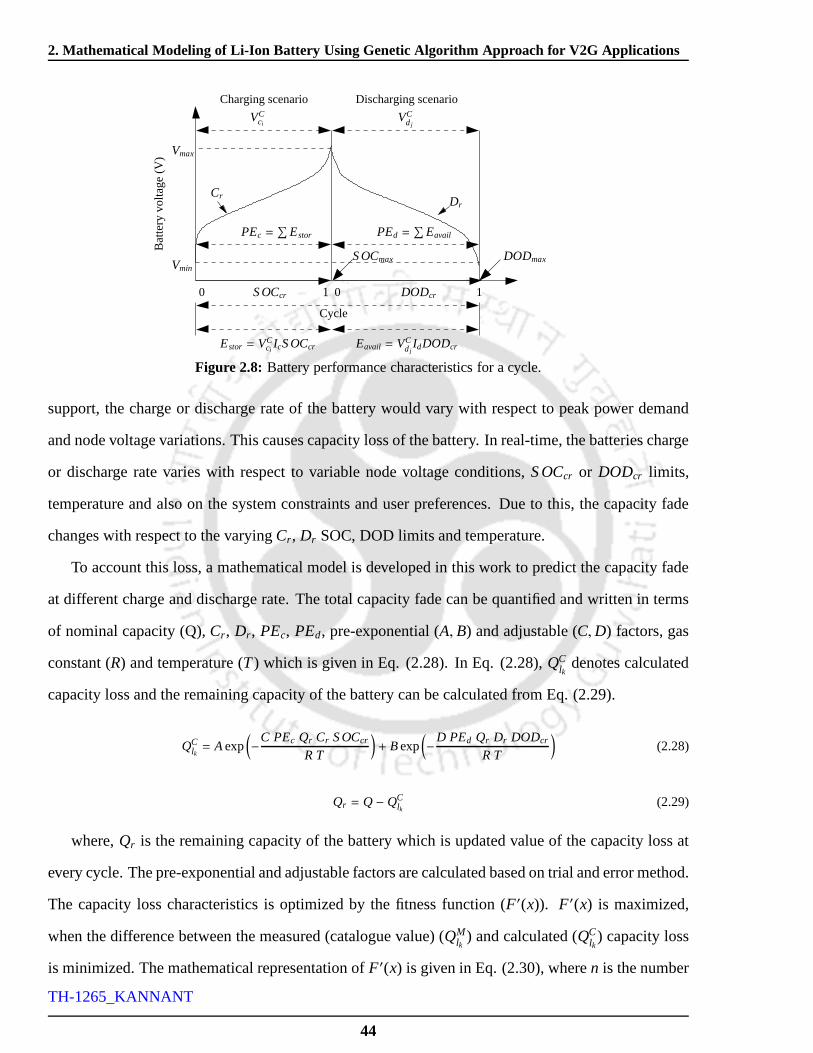
2. Mathematical Modeling of Li-Ion Battery Using Genetic Algorithm Approach for V2G Applications
Bat
tery
vol
tage
(V
)
Charging scenario Discharging scenario
0 10
Cycle
Vmax
Vmin
DrCr
VCci
VCdj
PEd =∑
EavailPEc =∑
Estor
Estor = VCci
IcS OCcr Eavail = VCdj
IdDODcr
S OCcr DODcr1
DODmaxS OCmax
Figure 2.8: Battery performance characteristics for a cycle.
support, the charge or discharge rate of the battery would vary with respect to peak power demand
and node voltage variations. This causes capacity loss of the battery. In real-time, the batteries charge
or discharge rate varies with respect to variable node voltage conditions,S OCcr or DODcr limits,
temperature and also on the system constraints and user preferences. Due to this, the capacity fade
changes with respect to the varyingCr , Dr SOC, DOD limits and temperature.
To account this loss, a mathematical model is developed in this work to predict the capacity fade
at different charge and discharge rate. The total capacity fade can be quantified and written in terms
of nominal capacity (Q),Cr , Dr , PEc, PEd, pre-exponential (A, B) and adjustable (C,D) factors, gas
constant (R) and temperature (T) which is given in Eq. (2.28). In Eq. (2.28),QClk
denotes calculated
capacity loss and the remaining capacity of the battery can be calculated from Eq. (2.29).
QClk= Aexp
(
−C PEc Qr Cr S OCcr
R T
)
+ Bexp(
−D PEd Qr Dr DODcr
R T
)
(2.28)
Qr = Q− QClk
(2.29)
where,Qr is the remaining capacity of the battery which is updated value of the capacity loss at
every cycle. The pre-exponential and adjustable factors are calculated based on trial and error method.
The capacity loss characteristics is optimized by the fitness function (F′(x)). F′(x) is maximized,
when the difference between the measured (catalogue value)(QMlk
) and calculated (QClk) capacity loss
is minimized. The mathematical representation ofF′(x) is given in Eq. (2.30), wheren is the number
44
TH-1265_KANNANT
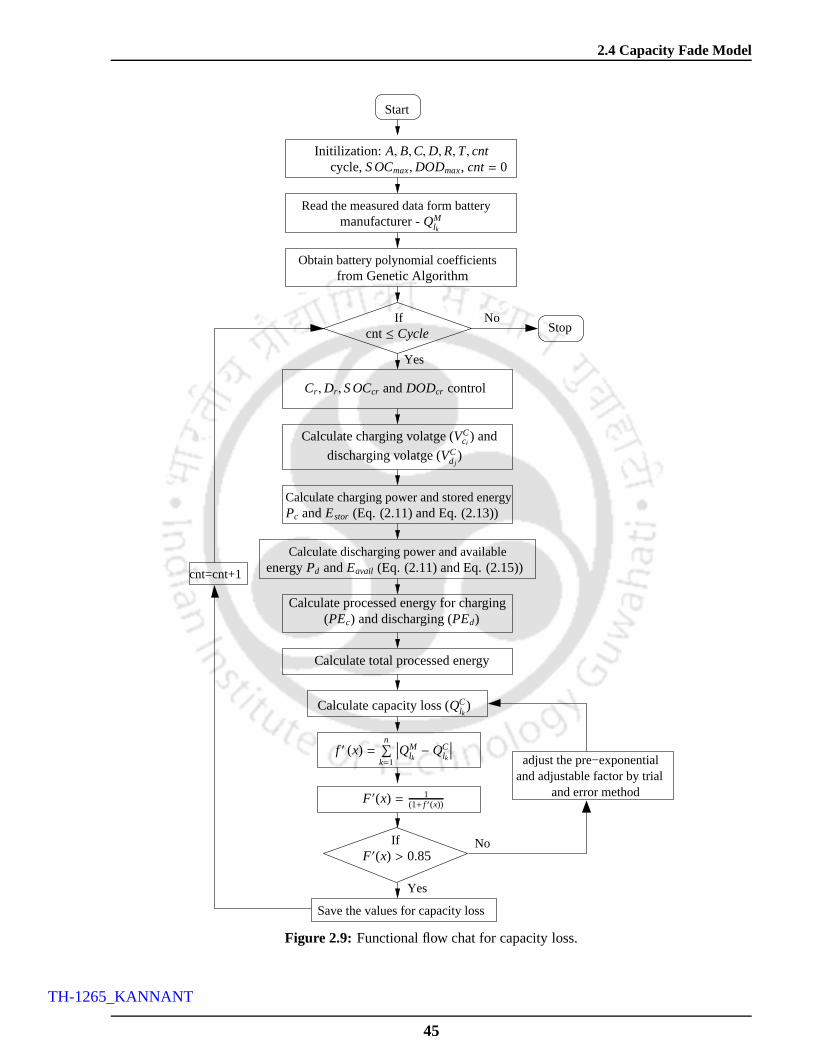
2.4 Capacity Fade Model
Start
If
adjust the pre−exponentialand adjustable factor by trial
and error method
StopNo
cnt=cnt+1
Read the measured data form battery
Calculate charging power and stored energy
Yes
If
Yes
No
Obtain battery polynomial coefficients
Save the values for capacity loss
Calculate discharging power and available
F′(x) > 0.85
Calculate processed energy for charging
manufacturer -QMlk
F′(x) = 1(1+ f ′(x))
f ′ (x) =n∑
k=1
∣
∣
∣QMlk− QC
lk
∣
∣
∣
(PEc) and discharging (PEd)
Calculate charging volatge (VCci
) and
discharging volatge (VCdj
)
Cr ,Dr ,S OCcr andDODcr control
cnt≤ Cycle
Initilization: A, B,C,D,R,T, cntcycle,S OCmax,DODmax, cnt= 0
from Genetic Algorithm
Calculate total processed energy
Calculate capacity loss (QClk)
Pc andEstor (Eq. (2.11) and Eq. (2.13))
energyPd andEavail (Eq. (2.11) and Eq. (2.15))
Figure 2.9: Functional flow chat for capacity loss.
45
TH-1265_KANNANT

2. Mathematical Modeling of Li-Ion Battery Using Genetic Algorithm Approach for V2G Applications
of measured (catalogue value) and calculated values.
F′(x) =1
1+n∑
k=1
(
QMlk− QC
lk
)
(2.30)
The functional flow chart for capacity loss calculation is shown in Fig. 2.9 has explained the
complete process to calculate the capacity fade of the battery. Where,cnt denotes the number cy-
cles involved in the calculation process. Table 2.2 shows the optimal values of pre-exponential and
adjustable factors. Simulations are done to verify the developed capacity fade model and have been
validated with different manufacturers’ catalogue.
Table 2.2: Pre-exponential and adjustable factors
Pre-exponential factor Adjustable factorA B C D
0.01511 0.040144 7.8995 0.941e-40.09051 0.003873 1.295 1.442e-50.12053 0.000073 0.7961 1.9874e-4.40.00149 0.00993 1.4987 0.642e-2.2
Calculation for
Calculation for
Polynomial coefficients obtainedCalculation
processed energyCalculation for
processed energyCalculation for
battery power
Polynomial coefficients obtained
Calculation for Calculation foravailable energy
Battery modelfor charging
Battery modelfor discharging
Calculation for
Calculation for Calculation forstored energy
Nominal capacity (Q)
A, B, C, D
(Eq. 21)
Calculation for
capacity fade
battery power
Qr=Q− QCl
Etotal
from GA (a1 − a31)
VCdj
Qr
Cr andDr
Qr
PEd
PEc
Estor
from GA (a1 − a31)
Ic S OCmax S OCcr
Eavail
Eavail
DODcrDODmax
PdVCdj
Id
Id
VCc
VCd
Estor
PEc
S OCcrQr
DODcr
VCci RTDrCr ,
tc, S OCcr
td, DODcr
QCl
Crlmt/D
rlmt
Ic andId
Cr/Dr
control
VCci
PEd
PcIc
S OCmax
DODmaxDODini
S OCini
(Pc)
(Pd)
Figure 2.10: Block diagram of battery and capacity fade model.
Fig. 2.10 shows the detailed block diagram used to validate the proposed battery and capacity
46
TH-1265_KANNANT
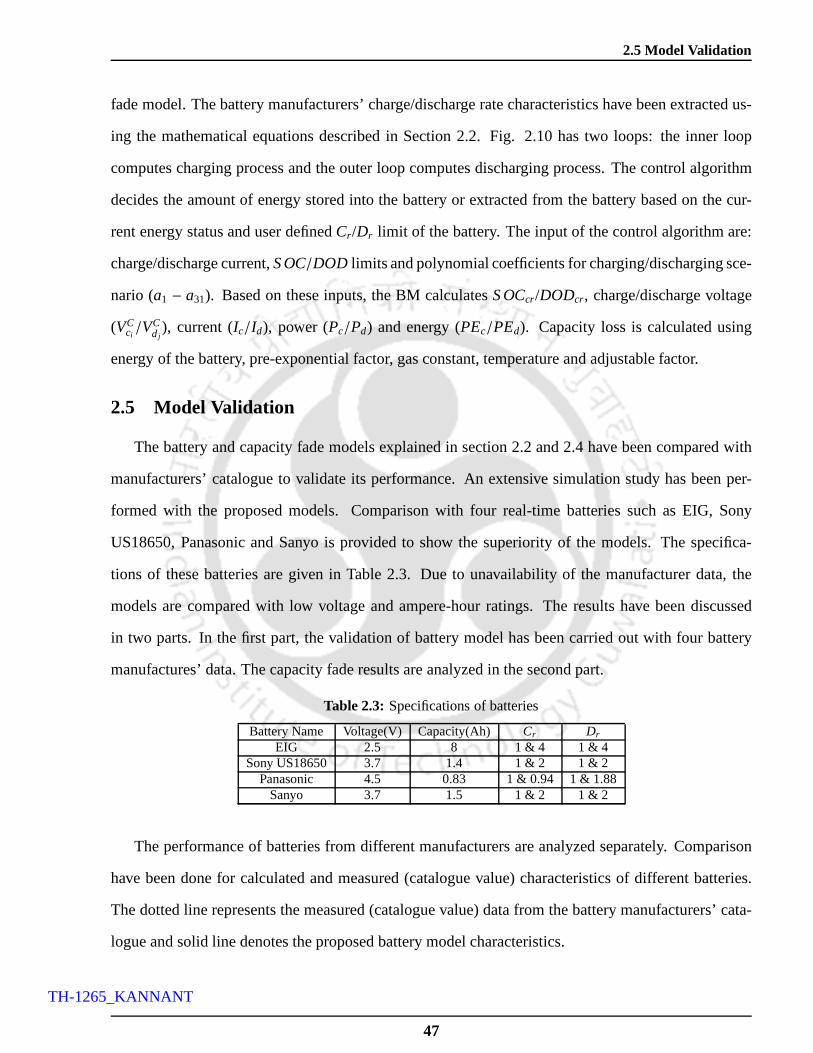
2.5 Model Validation
fade model. The battery manufacturers’ charge/discharge rate characteristics have been extracted us-
ing the mathematical equations described in Section 2.2. Fig. 2.10 has two loops: the inner loop
computes charging process and the outer loop computes discharging process. The control algorithm
decides the amount of energy stored into the battery or extracted from the battery based on the cur-
rent energy status and user definedCr /Dr limit of the battery. The input of the control algorithm are:
charge/discharge current,S OC/DOD limits and polynomial coefficients for charging/discharging sce-
nario (a1 − a31). Based on these inputs, the BM calculatesS OCcr/DODcr, charge/discharge voltage
(VCci/VC
dj), current (Ic/Id), power (Pc/Pd) and energy (PEc/PEd). Capacity loss is calculated using
energy of the battery, pre-exponential factor, gas constant, temperature and adjustable factor.
2.5 Model Validation
The battery and capacity fade models explained in section 2.2 and 2.4 have been compared with
manufacturers’ catalogue to validate its performance. An extensive simulation study has been per-
formed with the proposed models. Comparison with four real-time batteries such as EIG, Sony
US18650, Panasonic and Sanyo is provided to show the superiority of the models. The specifica-
tions of these batteries are given in Table 2.3. Due to unavailability of the manufacturer data, the
models are compared with low voltage and ampere-hour ratings. The results have been discussed
in two parts. In the first part, the validation of battery model has been carried out with four battery
manufactures’ data. The capacity fade results are analyzedin the second part.
Table 2.3: Specifications of batteries
Battery Name Voltage(V) Capacity(Ah) Cr Dr
EIG 2.5 8 1 & 4 1 & 4Sony US18650 3.7 1.4 1 & 2 1 & 2
Panasonic 4.5 0.83 1 & 0.94 1 & 1.88Sanyo 3.7 1.5 1 & 2 1 & 2
The performance of batteries from different manufacturersare analyzed separately. Comparison
have been done for calculated and measured (catalogue value) characteristics of different batteries.
The dotted line represents the measured (catalogue value) data from the battery manufacturers’ cata-
logue and solid line denotes the proposed battery model characteristics.
47
TH-1265_KANNANT
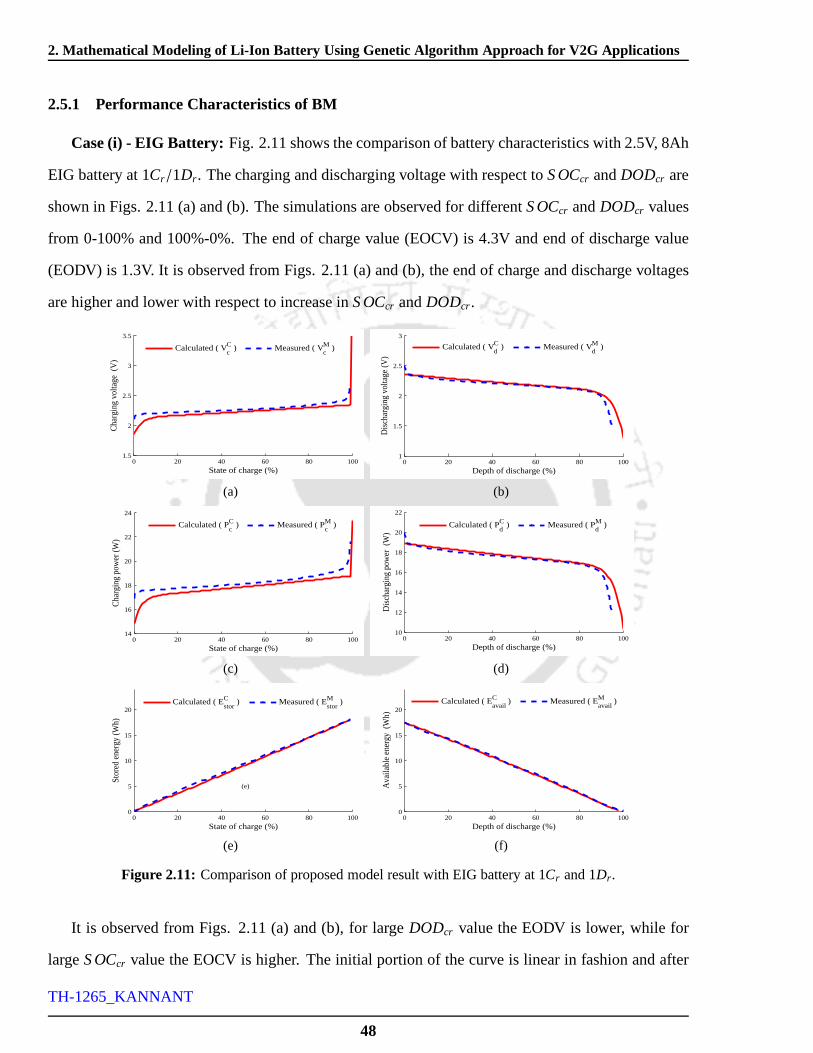
2. Mathematical Modeling of Li-Ion Battery Using Genetic Algorithm Approach for V2G Applications
2.5.1 Performance Characteristics of BM
Case (i) - EIG Battery: Fig. 2.11 shows the comparison of battery characteristics with 2.5V, 8Ah
EIG battery at 1Cr/1Dr . The charging and discharging voltage with respect toS OCcr andDODcr are
shown in Figs. 2.11 (a) and (b). The simulations are observedfor differentS OCcr andDODcr values
from 0-100% and 100%-0%. The end of charge value (EOCV) is 4.3V and end of discharge value
(EODV) is 1.3V. It is observed from Figs. 2.11 (a) and (b), theend of charge and discharge voltages
are higher and lower with respect to increase inS OCcr andDODcr.
0 20 40 60 80 1001.5
2
2.5
3
3.5
State of charge (%)
Cha
rgin
g vo
ltage
(V
)
Calculated ( VcC ) Measured ( V
cM )
(a)
0 20 40 60 80 1001
1.5
2
2.5
3
Depth of discharge (%)
Dis
char
ging
vol
tage
(V)
Calculated ( V
dC ) Measured ( V
dM )
(b)
0 20 40 60 80 10014
16
18
20
22
24
State of charge (%)
Cha
rgin
g po
wer
(W)
Calculated ( P
cC ) Measured ( P
cM )
(c)
0 20 40 60 80 10010
12
14
16
18
20
22
Depth of discharge (%)
Dis
char
ging
pow
er (
W)
Calculated ( PdC ) Measured ( P
dM )
(d)
0 20 40 60 80 1000
5
10
15
20
State of charge (%)
Sto
red
ener
gy (W
h)
Calculated ( EstorC ) Measured ( E
storM )
(e)
(e)
0 20 40 60 80 1000
5
10
15
20
Depth of discharge (%)
Ava
ilabl
e en
ergy
(W
h)
Calculated ( E
availC ) Measured ( E
availM )
(f)
Figure 2.11: Comparison of proposed model result with EIG battery at 1Cr and 1Dr .
It is observed from Figs. 2.11 (a) and (b), for largeDODcr value the EODV is lower, while for
largeS OCcr value the EOCV is higher. The initial portion of the curve is linear in fashion and after
48
TH-1265_KANNANT
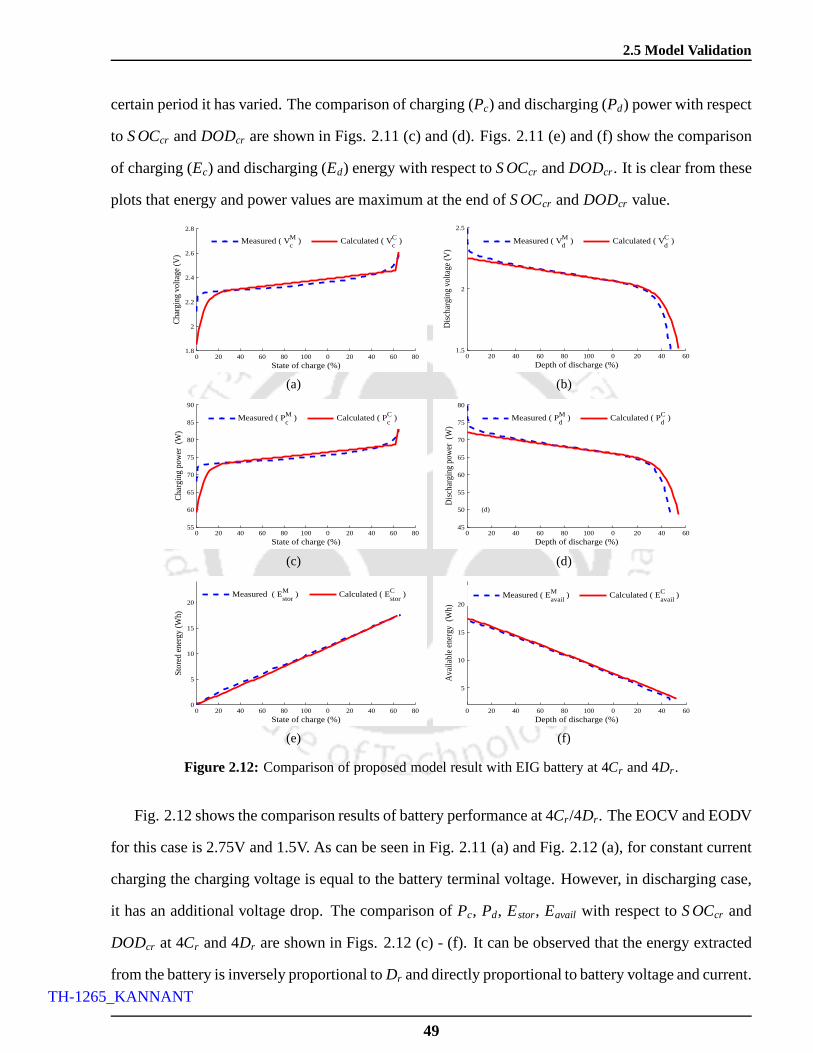
2.5 Model Validation
certain period it has varied. The comparison of charging (Pc) and discharging (Pd) power with respect
to S OCcr andDODcr are shown in Figs. 2.11 (c) and (d). Figs. 2.11 (e) and (f) showthe comparison
of charging (Ec) and discharging (Ed) energy with respect toS OCcr andDODcr. It is clear from these
plots that energy and power values are maximum at the end ofS OCcr andDODcr value.
0 20 40 60 80 100 0 20 40 60 801.8
2
2.2
2.4
2.6
2.8
State of charge (%)
Cha
rgin
g vo
ltage
(V)
Measured ( VcM ) Calculated ( V
cC )
(a)
0 20 40 60 80 100 0 20 40 601.5
2
2.5
Depth of discharge (%)
Dis
char
ging
vol
tage
(V)
Measured ( VdM ) Calculated ( V
dC )
(b)
0 20 40 60 80 100 0 20 40 60 8055
60
65
70
75
80
85
90
State of charge (%)
Cha
rgin
g po
wer
(W
)
Measured ( PcM ) Calculated ( P
cC )
(c)
0 20 40 60 80 100 0 20 40 6045
50
55
60
65
70
75
80
Depth of discharge (%)
Dis
char
ging
pow
er (
W)
Measured ( PdM ) Calculated ( P
dC )
(d)
(d)
0 20 40 60 80 100 0 20 40 60 800
5
10
15
20
State of charge (%)
Sto
red
ener
gy (W
h)
Measured ( EstorM ) Calculated ( E
storC )
(e)
0 20 40 60 80 100 0 20 40 60
5
10
15
20
Depth of discharge (%)
Ava
ilabl
e en
ergy
(W
h)
Measured ( EavailM ) Calculated ( E
availC )
(f)
Figure 2.12: Comparison of proposed model result with EIG battery at 4Cr and 4Dr .
Fig. 2.12 shows the comparison results of battery performance at 4Cr /4Dr . The EOCV and EODV
for this case is 2.75V and 1.5V. As can be seen in Fig. 2.11 (a) and Fig. 2.12 (a), for constant current
charging the charging voltage is equal to the battery terminal voltage. However, in discharging case,
it has an additional voltage drop. The comparison ofPc, Pd, Estor, Eavail with respect toS OCcr and
DODcr at 4Cr and 4Dr are shown in Figs. 2.12 (c) - (f). It can be observed that the energy extracted
from the battery is inversely proportional toDr and directly proportional to battery voltage and current.
49
TH-1265_KANNANT
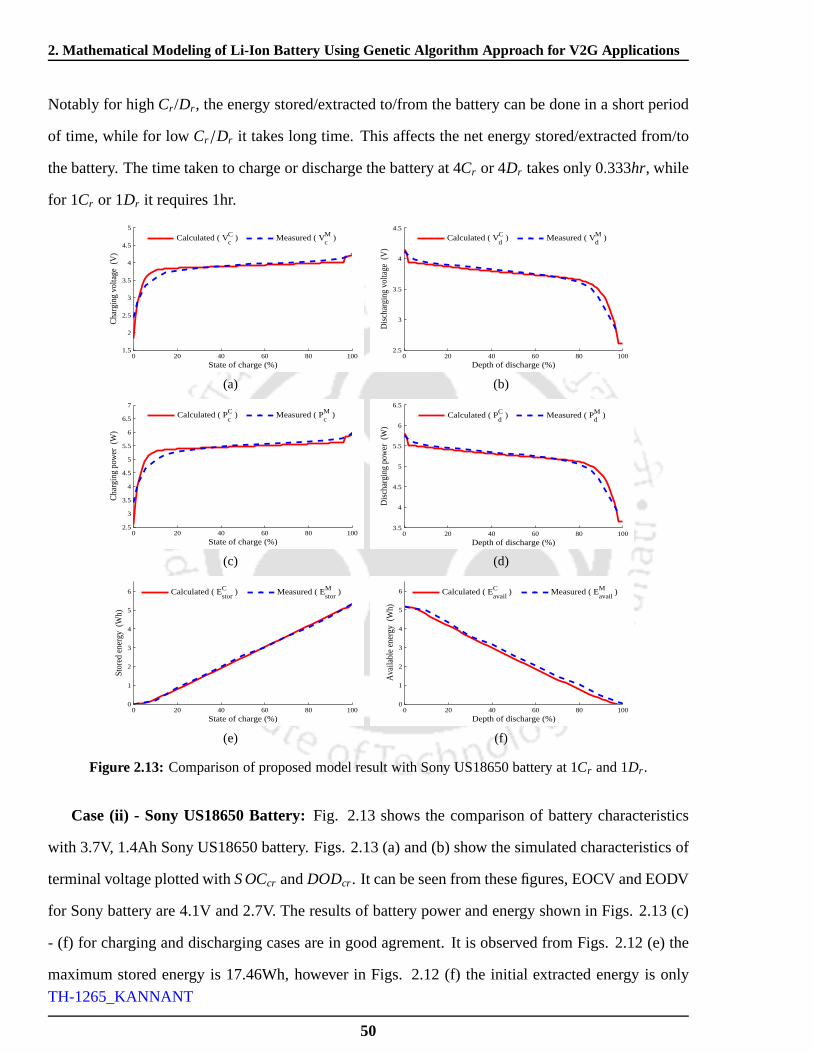
2. Mathematical Modeling of Li-Ion Battery Using Genetic Algorithm Approach for V2G Applications
Notably for highCr /Dr , the energy stored/extracted to/from the battery can be done in a short period
of time, while for lowCr/Dr it takes long time. This affects the net energy stored/extracted from/to
the battery. The time taken to charge or discharge the battery at 4Cr or 4Dr takes only 0.333hr, while
for 1Cr or 1Dr it requires 1hr.
0 20 40 60 80 1001.5
2
2.5
3
3.5
4
4.5
5
State of charge (%)
Cha
rgin
g vo
ltage
(V
)
Calculated ( V
cC ) Measured ( V
cM )
(a)
0 20 40 60 80 1002.5
3
3.5
4
4.5
Depth of discharge (%)
Dis
char
ging
vol
tage
(V
)
Calculated ( V
dC ) Measured ( V
dM )
(b)
0 20 40 60 80 1002.5
3
3.5
4
4.5
5
5.5
6
6.5
7
State of charge (%)
Cha
rgin
g po
wer
(W
)
Calculated ( P
cC ) Measured ( P
cM )
(c)
0 20 40 60 80 1003.5
4
4.5
5
5.5
6
6.5
Depth of discharge (%)
Dis
char
ging
pow
er (
W)
Calculated ( P
dC ) Measured ( P
dM )
(d)
0 20 40 60 80 1000
1
2
3
4
5
6
State of charge (%)
Sto
red
ener
gy (
Wh)
Calculated ( E
storC ) Measured ( E
storM )
(e)
0 20 40 60 80 1000
1
2
3
4
5
6
Depth of discharge (%)
Ava
ilabl
e en
ergy
(W
h)
Calculated ( E
availC ) Measured ( E
availM )
(f)
Figure 2.13: Comparison of proposed model result with Sony US18650 battery at 1Cr and 1Dr .
Case (ii) - Sony US18650 Battery:Fig. 2.13 shows the comparison of battery characteristics
with 3.7V, 1.4Ah Sony US18650 battery. Figs. 2.13 (a) and (b)show the simulated characteristics of
terminal voltage plotted withS OCcr andDODcr. It can be seen from these figures, EOCV and EODV
for Sony battery are 4.1V and 2.7V. The results of battery power and energy shown in Figs. 2.13 (c)
- (f) for charging and discharging cases are in good agrement. It is observed from Figs. 2.12 (e) the
maximum stored energy is 17.46Wh, however in Figs. 2.12 (f) the initial extracted energy is only
50
TH-1265_KANNANT
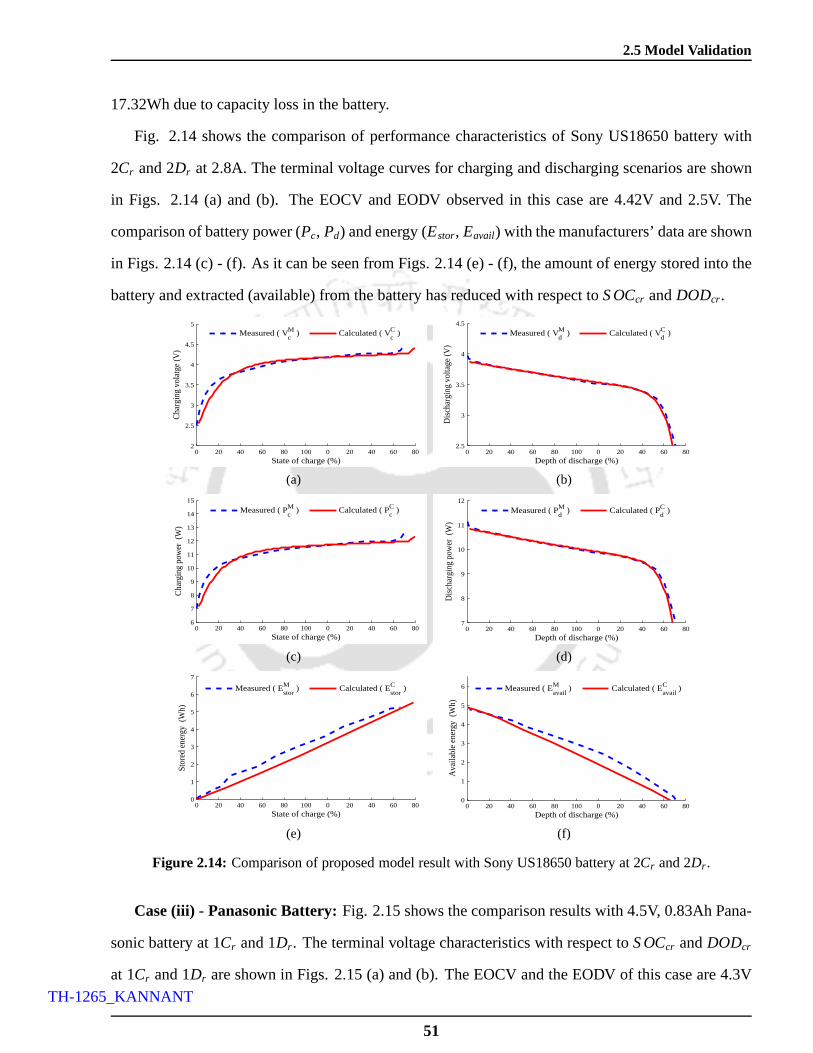
2.5 Model Validation
17.32Wh due to capacity loss in the battery.
Fig. 2.14 shows the comparison of performance characteristics of Sony US18650 battery with
2Cr and 2Dr at 2.8A. The terminal voltage curves for charging and discharging scenarios are shown
in Figs. 2.14 (a) and (b). The EOCV and EODV observed in this case are 4.42V and 2.5V. The
comparison of battery power (Pc, Pd) and energy (Estor, Eavail) with the manufacturers’ data are shown
in Figs. 2.14 (c) - (f). As it can be seen from Figs. 2.14 (e) - (f), the amount of energy stored into the
battery and extracted (available) from the battery has reduced with respect toS OCcr andDODcr.
0 20 40 60 80 100 0 20 40 60 802
2.5
3
3.5
4
4.5
5
State of charge (%)
Cha
rgin
g vo
latg
e (V
)
Measured ( V
cM ) Calculated ( V
cC )
(a)
0 20 40 60 80 100 0 20 40 60 802.5
3
3.5
4
4.5
Depth of discharge (%)
Dis
char
ging
vol
tage
(V)
Measured ( V
dM ) Calculated ( V
dC )
(b)
0 20 40 60 80 100 0 20 40 60 806
7
8
9
10
11
12
13
14
15
State of charge (%)
Cha
rgin
g po
wer
(W
)
Measured ( P
cM ) Calculated ( P
cC )
(c)
0 20 40 60 80 100 0 20 40 60 807
8
9
10
11
12
Depth of discharge (%)
Dis
char
ging
pow
er (
W)
Measured ( P
dM ) Calculated ( P
dC )
(d)
0 20 40 60 80 100 0 20 40 60 800
1
2
3
4
5
6
7
State of charge (%)
Sto
red
ener
gy (
Wh)
Measured ( E
storM ) Calculated ( E
storC )
(e)
0 20 40 60 80 100 0 20 40 60 800
1
2
3
4
5
6
Depth of discharge (%)
Ava
ilabl
e en
ergy
(W
h)
Measured ( E
availM ) Calculated ( E
availC )
(f)
Figure 2.14: Comparison of proposed model result with Sony US18650 battery at 2Cr and 2Dr .
Case (iii) - Panasonic Battery:Fig. 2.15 shows the comparison results with 4.5V, 0.83Ah Pana-
sonic battery at 1Cr and 1Dr . The terminal voltage characteristics with respect toS OCcr andDODcr
at 1Cr and 1Dr are shown in Figs. 2.15 (a) and (b). The EOCV and the EODV of this case are 4.3V
51
TH-1265_KANNANT

2. Mathematical Modeling of Li-Ion Battery Using Genetic Algorithm Approach for V2G Applications
and 3V. Figs. 2.15 (c) - (f) show the performance characteristics of battery power and energy. In all
the cases, the measured (catalogue value) data agrees with the proposed data.
0 20 40 60 80 1003.4
3.6
3.8
4
4.2
4.4
State of charge (%)
Cha
rge
volta
ge (V
)
Calculated ( V
cC ) Measured ( V
cM )
(a)
0 20 40 60 80 1003
3.5
4
4.5
Depth of discharge (%)
Dis
char
ging
vol
tage
(V)
Calculated ( V
dC ) Measured ( V
dM )
(b)
0 20 40 60 80 1001.9
2
2.1
2.2
2.3
2.4
2.5
State of charge (%)
Cha
rgin
g po
wer
(W)
Calculated ( P
cC ) Measured ( P
cM )
(c)
0 20 40 60 80 1002
2.5
3
3.5
4
Depth of discharge (%)
Dis
char
ging
pow
er (
W)
Calculated ( P
dC ) Measured ( P
dM )
(d)
0 20 40 60 80 1000
0.5
1
1.5
2
2.5
3
3.5
4
4.5
State of charge (%)
Sto
red
ener
gy (W
h)
Calculated ( E
storC ) Measured ( E
storM )
(e)
0 20 40 60 80 1000
0.5
1
1.5
2
2.5
3
3.5
4
4.5
Depth of discharge (%)
Ava
ilabl
e en
ergy
(W
h)
Calculated ( E
availC ) Measured ( E
availM )
(f)
Figure 2.15: Comparison of proposed model result with Panasonic batteryat 1Cr and 1Dr .
The comparison of Panasonic battery with proposed model is shown in Fig. 2.16. Figs. 2.16 (a)
and (b) show the comparison of terminal voltage characteristics with 0.9398Cr at 0.78A and 1.8795Dr
at 1.56A. The charge and discharge voltage characteristicsare shown in Figs. 2.16 (a) and (b). The
EOCV and EODV observed in this case are 4.3V and 3V. Figs. 2.16(c) and (d) show the performance
of battery power. The amount of stored and available energy are shown in Figs. 2.16 (e) and (f).
Case (iv) - Sanyo Battery: The battery used in this case for comparison is Sanyo which has
a nominal capacity 1.5Ah and a voltage of 3.7V. Here the battery is charged and discharged with
a constant current of 1.5A. Figs. 2.17 (a) and (b) show the terminal voltage curves of charge and
52
TH-1265_KANNANT
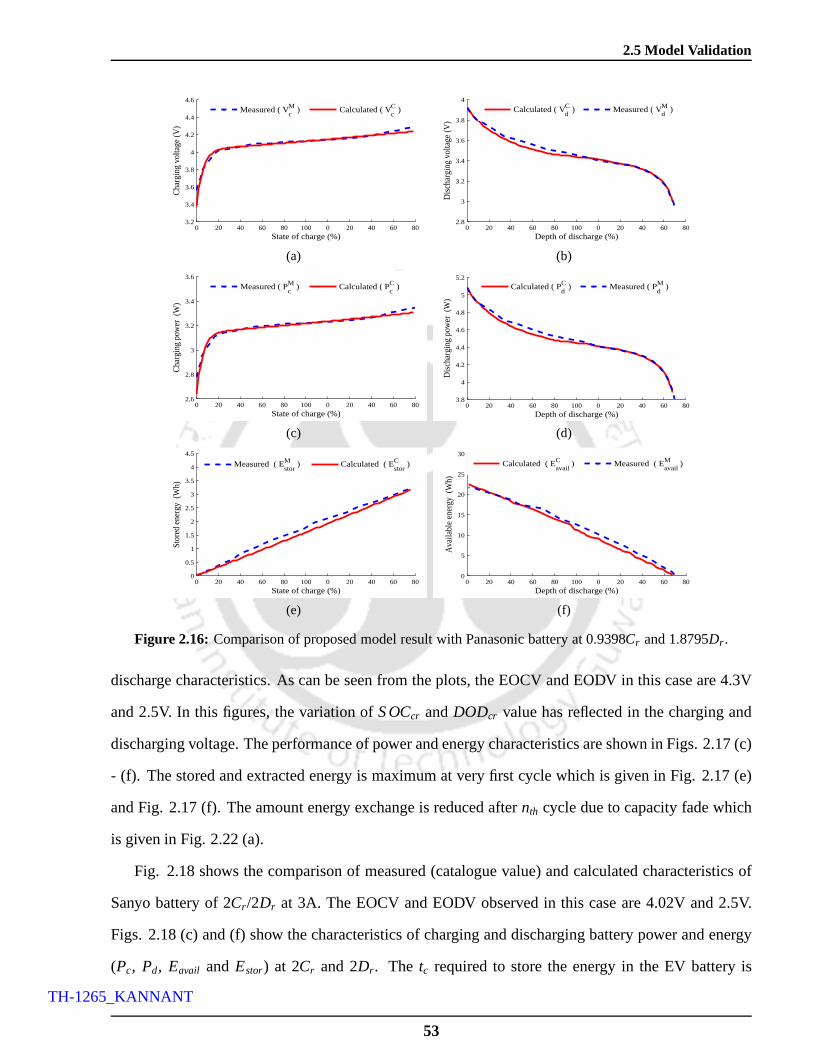
2.5 Model Validation
0 20 40 60 80 100 0 20 40 60 803.2
3.4
3.6
3.8
4
4.2
4.4
4.6
State of charge (%)
Cha
rgin
g vo
ltage
(V)
Measured ( V
cM ) Calculated ( V
cC )
(a)
0 20 40 60 80 100 0 20 40 60 802.8
3
3.2
3.4
3.6
3.8
4
Depth of discharge (%)
Dis
char
ging
vol
tage
(V)
Calculated ( V
dC ) Measured ( V
dM )
(b)
0 20 40 60 80 100 0 20 40 60 802.6
2.8
3
3.2
3.4
3.6
State of charge (%)
Cha
rgin
g po
wer
(W
)
Measured ( P
cM ) Calculated ( P
cC )
(c)
0 20 40 60 80 100 0 20 40 60 803.8
4
4.2
4.4
4.6
4.8
5
5.2
Depth of discharge (%)
Dis
char
ging
pow
er (
W)
Calculated ( P
dC ) Measured ( P
dM )
(d)
0 20 40 60 80 100 0 20 40 60 800
0.5
1
1.5
2
2.5
3
3.5
4
4.5
State of charge (%)
Sto
red
ener
gy (
Wh)
Measured ( E
storM ) Calculated ( E
storC )
(e)
0 20 40 60 80 100 0 20 40 60 800
5
10
15
20
25
30
Depth of discharge (%)
Ava
ilabl
e en
ergy
(W
h)
Calculated ( E
availC ) Measured ( E
availM )
(f)
Figure 2.16: Comparison of proposed model result with Panasonic batteryat 0.9398Cr and 1.8795Dr .
discharge characteristics. As can be seen from the plots, the EOCV and EODV in this case are 4.3V
and 2.5V. In this figures, the variation ofS OCcr andDODcr value has reflected in the charging and
discharging voltage. The performance of power and energy characteristics are shown in Figs. 2.17 (c)
- (f). The stored and extracted energy is maximum at very firstcycle which is given in Fig. 2.17 (e)
and Fig. 2.17 (f). The amount energy exchange is reduced after nth cycle due to capacity fade which
is given in Fig. 2.22 (a).
Fig. 2.18 shows the comparison of measured (catalogue value) and calculated characteristics of
Sanyo battery of 2Cr /2Dr at 3A. The EOCV and EODV observed in this case are 4.02V and 2.5V.
Figs. 2.18 (c) and (f) show the characteristics of charging and discharging battery power and energy
(Pc, Pd, Eavail and Estor) at 2Cr and 2Dr . The tc required to store the energy in the EV battery is
53
TH-1265_KANNANT

2. Mathematical Modeling of Li-Ion Battery Using Genetic Algorithm Approach for V2G Applications
0 20 40 60 80 100 0 20 40 60 80
2.5
3
3.5
4
4.5
State of charge (%)
Cha
rgin
g vo
ltage
(V)
Measured ( V
cM ) Calculated ( V
cC )
(a)
0 20 40 60 80 100 0 20 40 60 80
2.5
3
3.5
4
4.5
Depth of discharge (%)
Dis
char
ging
vol
tage
(V)
Measured ( V
dM ) Calculated ( V
dC )
(b)
0 20 40 60 80 100 0 20 40 60 803.5
4
4.5
5
5.5
6
6.5
7
7.5
State of charge (%)
Cha
rgin
g po
wer
(W
)
Measured ( P
cM ) Calculated ( P
cC )
(c)
0 20 40 60 80 100 0 20 40 60 803.5
4
4.5
5
5.5
6
6.5
7
7.5
Depth of discharge (%)
Dis
char
ging
pow
er (
W)
Calculated ( P
dC ) Measured ( P
dM )
(d)
0 20 40 60 80 100 0 20 40 60 800
1
2
3
4
5
6
7
State of charge (%)
Sto
red
ener
gy (W
h)
Calculated ( E
storC ) Measured ( E
storM )
(e)
0 20 40 60 80 100 0 20 40 60 800
1
2
3
4
5
6
7
Depth of discharge (%)
Ava
ilabl
e en
ergy
(W
h)
Calculated ( E
availC ) Measured ( E
availM )
(f)
Figure 2.17: Comparison of proposed model result with Sanyo battery at 1Cr/1Dr .
reduced due to highCr which is shown in Fig 2.18 (e). It is observed from Fig. 2.18 (f) the energy
extracted from the battery is reduced due to the highDr .
Thus, it is observed from Fig. 2.11 to Fig. 2.18, the proposedbattery model characteristics exactly
fits the manufacturers’ characteristics and in some cases ithas an error less than 5%.
2.5.2 Capacity Fade Analysis
The validation of capacity fade study has also been carried out by comparing the proposed model
with four manufacturers’ data. The capacity loss data is taken from the battery catalogues provided
by the battery manufacturers. However, due to limited availability of measured (catalogue value)
data, the comparison has been done only for specified charge and discharge rate. Fig. 2.19 to Fig.
54
TH-1265_KANNANT

2.5 Model Validation
0 20 40 60 80 100 0 20 40 60 802.5
3
3.5
4
4.5
State of charge (%)
Cha
rgin
g vo
latg
e (V
)
Measured ( V
cM ) Calculated ( V
cC )
(a)
0 20 40 60 80 100 0 20 40 60 802.5
3
3.5
4
4.5
Depth of discharge (%)
Dis
char
ging
vol
tage
(V)
Measured ( V
dM ) Calculated ( V
dC )
(b)
0 20 40 60 80 100 0 20 40 60 807
8
9
10
11
12
13
State of charge (%)
Cha
rgin
g po
wer
(W
)
Measured ( P
cM ) Calculated ( P
cC )
(c)
0 20 40 60 80 100 0 20 40 60 807
8
9
10
11
12
13
Depth of discharge (%)
Dis
char
ging
pow
er (
W)
Measured ( P
dM ) Calculated ( P
dC )
(d)
0 20 40 60 80 100 0 20 40 60 800
1
2
3
4
5
6
State of charge (%)
Sto
red
ener
gy (
Wh)
Measured ( E
storM ) Calculated ( E
storC )
(e)
0 20 40 60 80 100 0 20 40 60 800
1
2
3
4
5
6
7
Depth of discharge (%)
Ava
ilabl
e en
ergy
(W
h)
Measured ( E
availM ) Calculated ( E
availC )
(f)
Figure 2.18: Comparison of proposed model result with Sanyo battery at 2Cr/2Dr .
2.22 reports the results obtained from capacity fade study.The parameters of capacity fade analysis
have been taken from the capacity loss data provided by the battery manufacturers’ catalogue. Due to
limited data, the capacity loss comparison only done for specified charge and discharge rate. Due to
unavailability of the battery manufacturers’ capacity loss data at differentCr andDr , only specified
Cr andDr is discussed in this work. The results obtained aftern number of cycle for each types of
batteries are summarized from Table 2.4. The variation of capacity loss is shown with respect to cycle
number and total processed energy. The remaining capacity of the battery has been given in each case
to show the net processed energy.
Case (i) - EIG Battery: Fig. 2.19 shows the comparison of capacity fade characteristics of EIG
battery. Figs. 2.19 (a) shows the capacity loss as a functionof cycle number for EIG battery.
55
TH-1265_KANNANT
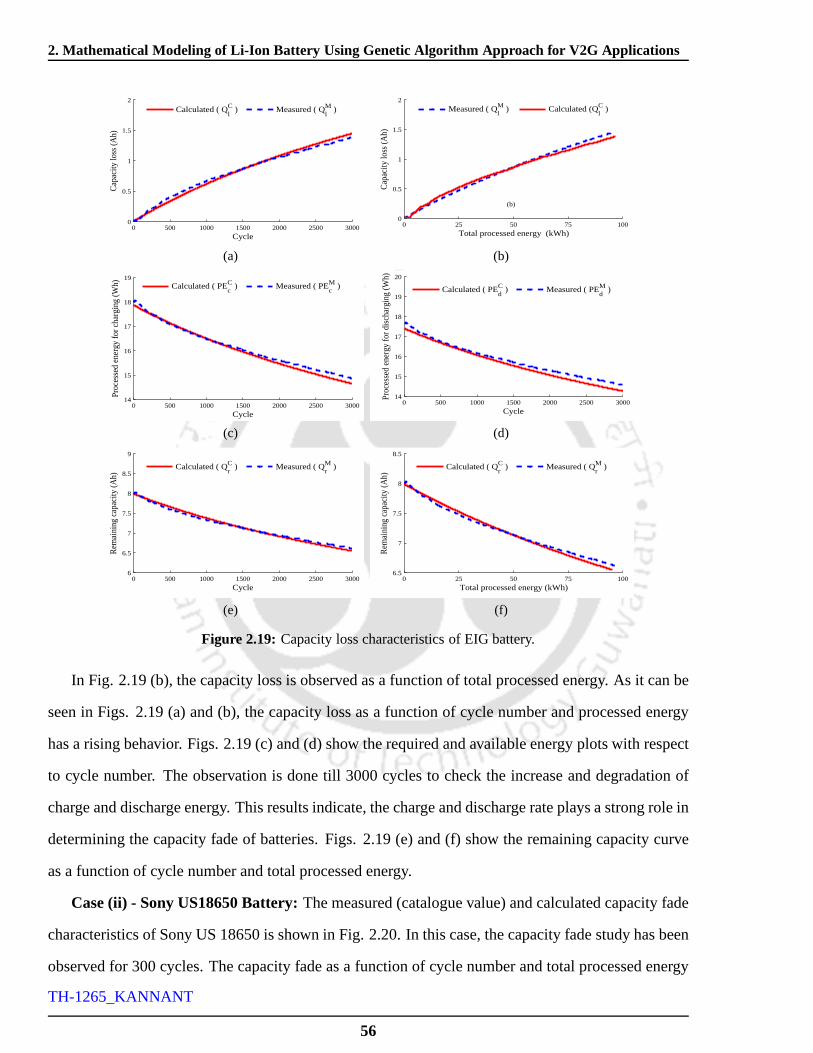
2. Mathematical Modeling of Li-Ion Battery Using Genetic Algorithm Approach for V2G Applications
0 500 1000 1500 2000 2500 30000
0.5
1
1.5
2
Cycle
Cap
acity
loss
(Ah)
Calculated ( Q
lC ) Measured ( Q
lM )
(a)
0 25 50 75 1000
0.5
1
1.5
2
Total processed energy (kWh)
Cap
acity
loss
(Ah)
Measured ( Q
lM ) Calculated (Q
lC )
(b)
(b)
0 500 1000 1500 2000 2500 300014
15
16
17
18
19
Cycle
Pro
cess
ed e
nerg
y fo
r cha
rgin
g (W
h)
Calculated ( PE
cC ) Measured ( PE
cM )
(c)
0 500 1000 1500 2000 2500 300014
15
16
17
18
19
20
Cycle
Pro
cess
ed e
nerg
y fo
r dis
char
ging
(Wh)
Calculated ( PEdC ) Measured ( PE
dM )
(d)
0 500 1000 1500 2000 2500 30006
6.5
7
7.5
8
8.5
9
Cycle
Rem
aini
ng c
apac
ity (A
h)
Calculated ( QrC ) Measured ( Q
rM )
(e)
0 25 50 75 1006.5
7
7.5
8
8.5
Total processed energy (kWh)
Rem
aini
ng c
apac
ity (A
h)
Calculated ( QrC ) Measured ( Q
rM )
(f)
Figure 2.19: Capacity loss characteristics of EIG battery.
In Fig. 2.19 (b), the capacity loss is observed as a function of total processed energy. As it can be
seen in Figs. 2.19 (a) and (b), the capacity loss as a functionof cycle number and processed energy
has a rising behavior. Figs. 2.19 (c) and (d) show the required and available energy plots with respect
to cycle number. The observation is done till 3000 cycles to check the increase and degradation of
charge and discharge energy. This results indicate, the charge and discharge rate plays a strong role in
determining the capacity fade of batteries. Figs. 2.19 (e) and (f) show the remaining capacity curve
as a function of cycle number and total processed energy.
Case (ii) - Sony US18650 Battery:The measured (catalogue value) and calculated capacity fade
characteristics of Sony US 18650 is shown in Fig. 2.20. In this case, the capacity fade study has been
observed for 300 cycles. The capacity fade as a function of cycle number and total processed energy
56
TH-1265_KANNANT

2.5 Model Validation
are shown in Figs. 2.20 (a) and (b).
0 50 100 150 200 250 3000
0.02
0.04
0.06
0.08
0.1
0.12
0.14
0.16
Cycle
Cap
acity
loss
(Ah)
Calculated ( Q
lC ) Measured ( Q
lM )
(a)
0 500 1000 1500 2000 2500 30000
0.02
0.04
0.06
0.08
0.1
0.12
0.14
0.16
Total processed energy (Wh)
Cap
acity
loss
(Ah)
Calculated ( Q
lC ) Measured ( Q
lM )
(b)
0 50 100 150 200 250 3004.7
4.8
4.9
5
5.1
5.2
5.3
5.4
Cycle
Pro
cess
ed e
nerg
y fo
r cha
rgin
g (W
h)
Calculated ( PEcC ) Measured ( PE
cM )
(c)
0 50 100 150 200 250 3004.6
4.7
4.8
4.9
5
5.1
5.2
5.3
CycleP
roce
ssed
ene
rgy
for d
isch
argi
ng (W
h)
Calculated ( PE
dC ) Measured ( PE
dM )
(d)
0 50 100 150 200 250 3001.26
1.28
1.3
1.32
1.34
1.36
1.38
1.4
1.42
1.44
Cycle
Rem
aini
ng c
apac
ity (A
h)
Calculated ( Q
rC ) Measured ( Q
rM )
(e)
0 500 1000 1500 2000 2500 30001.26
1.28
1.3
1.32
1.34
1.36
1.38
1.4
1.42
1.44
Total processed energy (Wh)
Rem
aini
ng c
apac
ity (A
h)
Claculated ( Q
rC ) Measured ( Q
rM )
(f)
Figure 2.20: Capacity loss characteristics of Sony US18650 battery.
Figs. 2.20 (c) and (d) show the characteristics of charge anddischarge energy as a function of
cycle number, while the characteristics of remaining capacity and total processed energy are shown
in Figs. 2.20 (e) and (f). It is noticed from the plots, the energy and remaining capacity of battery
with increase in cycle has a falling behavior.
Case (iii) - Panasonic Battery:Fig. 2.21 shows the measured (catalogue value) and calculated
characteristics of capacity fade for Panasonic battery. Here the study has been done till 500 cycles.
Figs. 2.21 (a) and (b) show the capacity loss as a function of cycle number and energy. The capacity
loss as a function of total processed energy is shown in Fig. 2.21 (b).
The characteristics of required and available energy as a function of cycle number are shown
57
TH-1265_KANNANT

2. Mathematical Modeling of Li-Ion Battery Using Genetic Algorithm Approach for V2G Applications
in Figs. 2.21 (c) and (d). It can be seen, the energy stored or extracted from or to the battery has
decreased with increased in cycle number due to capacity loss. Figs. 2.21 (e) and (f) show the
remaining capacity curve as a function of cycle number and total processed energy. As like previous
cases, the energy and capacity loss characteristics have falling behavior with increase in cycle number
and processed energy.
0 50 100 150 200 250 300 350 400 450 5000
20
40
60
80
100
120
Cycle
Cap
acity
loss
(mA
h)
Calculated ( Q
lC ) Measured ( Q
lM )
(a)
0 500 1000 1500 2000 2500 30000
20
40
60
80
100
120
140
Total processed energy (Wh)
Cap
acity
loss
(mA
h)
Calculated ( Q
lC ) Measured ( Q
lM )
(b)
0 50 100 150 200 250 300 350 400 450 5002.8
2.9
3
3.1
3.2
3.3
3.4
3.5
Cycle
Pro
cess
ed e
nerg
y fo
r cha
rgin
g (W
h)
Calculated ( PE
cC ) Measured ( PE
cM )
(c)
0 50 100 150 200 250 300 350 400 450 5002.6
2.7
2.8
2.9
3
3.1
3.2
3.3
Cycle
Pro
cess
ed e
nerg
y fo
r dis
char
ging
(Wh)
Calculated ( PE
dC ) Measured ( PE
dM )
(d)
0 50 100 150 200 250 300 350 400 450 500700
720
740
760
780
800
820
840
Cycle
Rem
aini
ng c
apac
ity (m
Ah)
Calculated ( Q
rC ) Measured ( Q
rM )
(e)
0 500 1000 1500 2000 2500 3000700
720
740
760
780
800
820
840
Total processed energy (Wh)
Rem
aini
ng c
apac
ity (m
Ah)
Calculated ( Q
rC ) Measured ( Q
rM )
(f)
Figure 2.21: Capacity loss characteristics of Panasonic battery.
Case (iv) - Sanyo Battery:Fig. 2.22 shows the comparison of capacity fade profiles of Sanyo
battery. The capacity loss as a function of cycle number and total processed energy are shown in Figs.
2.22 (a) and (b). As can be seen from these plots, the characteristics have rising behavior with respect
to cycle and total processed energy.
Figs. 2.22 (c) and (d) show the characteristics of required and available energy as a function of
58
TH-1265_KANNANT
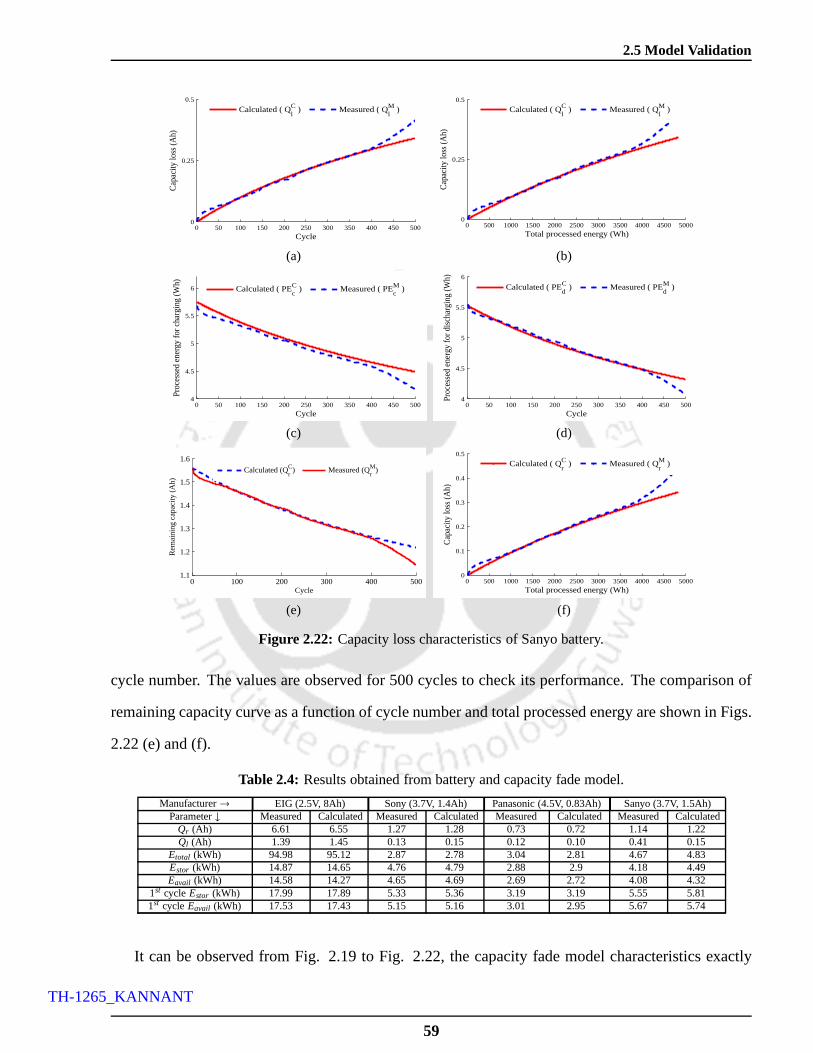
2.5 Model Validation
0 50 100 150 200 250 300 350 400 450 5000
0.25
0.5
Cycle
Cap
acity
loss
(Ah)
Calculated ( Q
lC ) Measured ( Q
lM )
(a)
0 500 1000 1500 2000 2500 3000 3500 4000 4500 50000
0.25
0.5
Total processed energy (Wh)
Cap
acity
loss
(Ah)
Calculated ( Q
lC ) Measured ( Q
lM )
(b)
0 50 100 150 200 250 300 350 400 450 5004
4.5
5
5.5
6
Cycle
Pro
cess
ed e
nerg
y fo
r cha
rgin
g (W
h)
Calculated ( PE
cC ) Measured ( PE
cM )
(c)
0 50 100 150 200 250 300 350 400 450 5004
4.5
5
5.5
6
Cycle
Pro
cess
ed e
nerg
y fo
r dis
char
ging
(Wh)
Calculated ( PE
dC ) Measured ( PE
dM )
(d)
0 100 200 300 400 5001.1
1.2
1.3
1.4
1.5
1.6
Cycle
Rem
aini
ng c
apac
ity (
Ah)
Calculated (Q
rC) Measured (Q
rM)
(e)
0 500 1000 1500 2000 2500 3000 3500 4000 4500 50000
0.1
0.2
0.3
0.4
0.5
Total processed energy (Wh)
Cap
acity
loss
(Ah)
Calculated ( Q
rC ) Measured ( Q
rM )
(f)
Figure 2.22: Capacity loss characteristics of Sanyo battery.
cycle number. The values are observed for 500 cycles to checkits performance. The comparison of
remaining capacity curve as a function of cycle number and total processed energy are shown in Figs.
2.22 (e) and (f).
Table 2.4: Results obtained from battery and capacity fade model.
Manufacturer→ EIG (2.5V, 8Ah) Sony (3.7V, 1.4Ah) Panasonic (4.5V, 0.83Ah) Sanyo (3.7V, 1.5Ah)Parameter↓ Measured Calculated Measured Calculated Measured Calculated Measured Calculated
Qr (Ah) 6.61 6.55 1.27 1.28 0.73 0.72 1.14 1.22Ql (Ah) 1.39 1.45 0.13 0.15 0.12 0.10 0.41 0.15
Etotal (kWh) 94.98 95.12 2.87 2.78 3.04 2.81 4.67 4.83Estor (kWh) 14.87 14.65 4.76 4.79 2.88 2.9 4.18 4.49Eavail (kWh) 14.58 14.27 4.65 4.69 2.69 2.72 4.08 4.32
1st cycle Estor (kWh) 17.99 17.89 5.33 5.36 3.19 3.19 5.55 5.811st cycle Eavail (kWh) 17.53 17.43 5.15 5.16 3.01 2.95 5.67 5.74
It can be observed from Fig. 2.19 to Fig. 2.22, the capacity fade model characteristics exactly
59
TH-1265_KANNANT

2. Mathematical Modeling of Li-Ion Battery Using Genetic Algorithm Approach for V2G Applications
fits with the different battery manufacturers’ curves. The typical simulation and measured (catalogue
value) results of different battery types such as for EIG (till 3000 cycle), Sony (till 300 cycles),
Panasonic (till 500 cycles) and Sanyo (till 500 cycles) are shown in Table 2.4.
2.6 Summary
• In this Chapter, an accurate electric circuit based batteryand capacity fade model have been
proposed.
• The battery parameters are extracted using genetic algorithm based optimization method which
optimize the polynomial coefficients.
• Different performance characteristics like charge voltage, discharge voltage, power, energy,
total processed energy and capacity loss are analyzed.
• Four different battery manufacturers’ data are used for validating the result.
• The proposed battery and capacity models are simple and it accurately represents the measured
(catalogue value) charge and discharge curves of the manufacturers’ data sheets.
• The simulation and measured (catalogue value) results are in good agreement.
• BM and CFM has been developed to analyze the power flow betweenEVs’ batteries and grid.
In the next Chapter, a charging station has been developed byusing the battery model for grid
support during the peak load demand and charge the EVs’ batteries during the peak shaving hours.
The charging station connected with the distribution node of the grid with bidirectional contactless
charging system which enables the power transfer between the EVs’ batteries and grid.
Note: This work, Mathematical Modeling of Li-Ion Battery Using Genetic Algorithm Approach
for V2G Applications has been published in IEEE Transactionon Energy Conversion.
60
TH-1265_KANNANT

3Modeling and Control of Contactless based
Smart Charging Station in V2G Scenario
Contents3.1 Introduction . . . . . . . . . . . . . . . . . . . . . . . . . . . . . . . . . . . .. 62
3.2 Modeling of Multi-Point Smart Charging Stations . . . . . . . . . . . . . . . . 64
3.3 Modeling of Smart Charging Station . . . . . . . . . . . . . . . . . .. . . . . . 67
3.4 Application Scenario of Multi-Point SCS . . . . . . . . . . . . .. . . . . . . . 84
3.5 Results and Discussion . . . . . . . . . . . . . . . . . . . . . . . . . . . .. . . 85
3.6 Summary . . . . . . . . . . . . . . . . . . . . . . . . . . . . . . . . . . . . . . . 99
61
TH-1265_KANNANT

3. Modeling and Control of Contactless based Smart ChargingStation in V2G Scenario
3.1 Introduction
Contactless charging systems are preferable for electric vehicle applications due to the elimina-
tion of direct electric contacts. These charging system overcomes the drawbacks of traditional wired
charging systems such as heating of the sockets and cables, risk of fire and electrical injuries, cable
breakage etc., [2, 92]. Indeed, EVs’ batteries have enough potential to be used as distributed energy
storage through multi-point bidirectional contactless charging system (BCCS), which are proven to be
the most efficient and compatible technologies for an improved power system operation [82,158,159].
This bidirectional power flow functionality of BCCS module can be referred as grid-to-vehicle and
vehicle-to-grid capability [159]. Many studies have been conducted on V2G system with most of the
work focused on the impact of charging systems on the distribution network [66,73,160]. Some sim-
ulation studies have shown EVs acting as a smart storage and can provide fast and accurate response
for frequency and spinning reserves [73, 160]. However, these studies have only done the system
level analysis and are mainly focused on the frequency and voltage regulation. On the other hand,
present area work on multi-point contactless systems are mainly focused on converter configurations,
compensation circuits and control strategies of those systems [2, 82, 92, 158, 159]. These works have
studied the component level description of BCCS systems. However, none of the studies have at-
tempted to study the control and coordination of BCCS unit with multiple EVs in a charging station
(CS) connected to a distribution node (DN) of the grid. To overcome the above shortcomings, the
present work is mainly focussed on the following objectives:
(i) Developing a multi-point BCCS with its controllers to control the power flow during V2G and
G2V operations.
(ii) Developing the controllers and CS aggregator, to obtain the control and coordination of large
fleet of EVs with respect to the variations in the DN voltage.
In detail, this Chapter describes a multi-point BCCS unit present in a CS connected with the DN
of the grid is investigated. A multi-point BCCS unit has various charging points, which are accessible
to multiple EVs. However, a large fleet of EVs with different battery charging/discharging rates (in
this Chapter the charge rate (Cr) and discharge rate (Dr) is referred asCrate for simplicity) in BCCS
62
TH-1265_KANNANT

3.1 Introduction
units, distributed across a power grid network may stress the power system operation which results
in extensive grid outages [66, 73, 74, 160]. In such case, theBCCS unit should necessarily have a
controlled and coordinated smart charging station (SCS) asshown in Fig. 3.1.
BCCSCentral Control
Unit (CCU)
.
. . .
..
Charging System (BCCS)
D
Distribution Node (DN)
CS Aggregator
Controllers
Bidirectional Contactless
D − Duration
Vnode
EbnEb1
Pbn
Pb1PgridVnode - Node voltage
ET - Total available energy
Pgrid - Total power
Ebn - Individual energy
Pbn - Individual power
ET
ET
Figure 3.1: Smart charging station architecture.
The purpose of SCS is to distribute the power among differentEVs, control theCrate of EVs’
batteries and to ensure grid voltage stability. In particular, the SCS will have the ability to receive and
respond the charge/discharge instruction based on grid condition and the individual energy of EVs’
batteries. The SCS developed has a main controller named as central control unit (CCU) and a Charg-
ing Station aggregator called as CS aggregator, which distributes the power requirement based on the
energy demand and grid conditions. Apart from these controllers, a closed loop control strategy has
been developed inside the BCCS module, which controls the power flow during charging/discharging
operations based on CS aggregator output. The performance of the BCCS module and the control
scheme is tested with multiple EVs of different battery ratings and are evaluated by simulation con-
sidering a practical distribution system of Guwahati city,Assam, India [74]. Although the present
work is modeled for contactless based charging station but the proposed concept can be applied to
any multi-point charging station as well.
The rest of the sections in the Chapter are organized as follows. Section 3.2 describes the modeling
of multi-point SCS. Section 3.3 explains the details of problem formulation. An application scenario
63
TH-1265_KANNANT
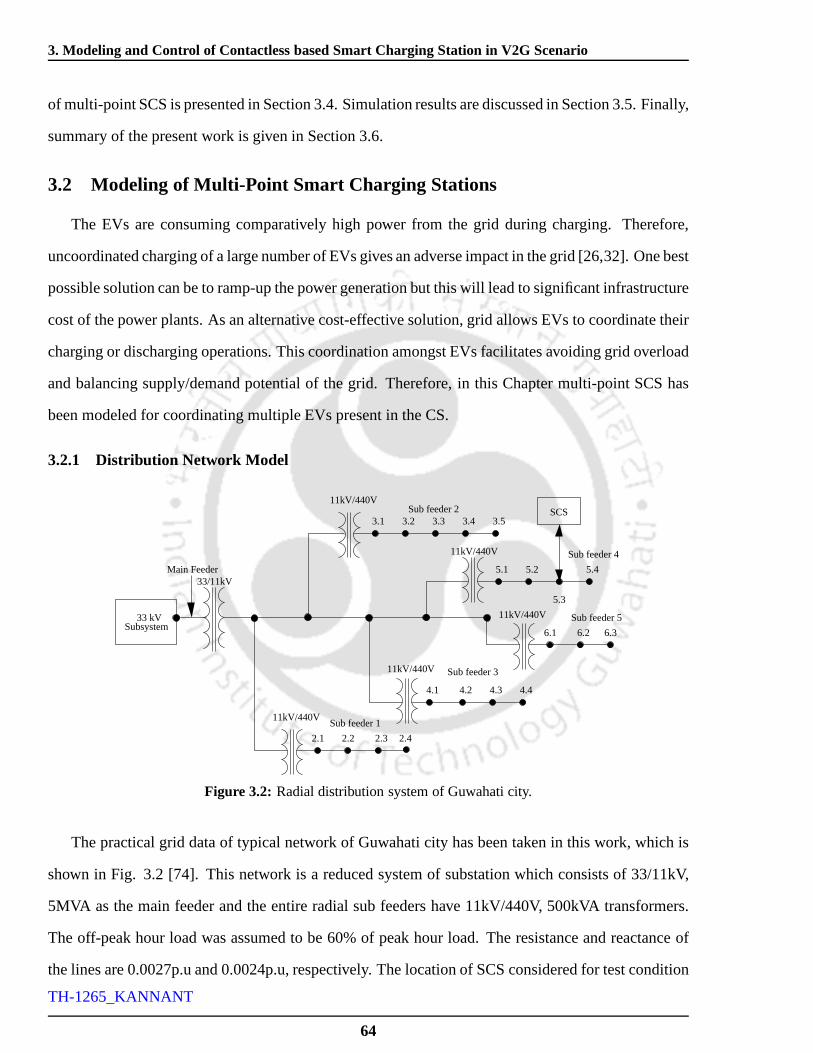
3. Modeling and Control of Contactless based Smart ChargingStation in V2G Scenario
of multi-point SCS is presented in Section 3.4. Simulation results are discussed in Section 3.5. Finally,
summary of the present work is given in Section 3.6.
3.2 Modeling of Multi-Point Smart Charging Stations
The EVs are consuming comparatively high power from the gridduring charging. Therefore,
uncoordinated charging of a large number of EVs gives an adverse impact in the grid [26,32]. One best
possible solution can be to ramp-up the power generation butthis will lead to significant infrastructure
cost of the power plants. As an alternative cost-effective solution, grid allows EVs to coordinate their
charging or discharging operations. This coordination amongst EVs facilitates avoiding grid overload
and balancing supply/demand potential of the grid. Therefore, in this Chapter multi-point SCS has
been modeled for coordinating multiple EVs present in the CS.
3.2.1 Distribution Network Model
Sub feeder 511kV/440V
6.36.26.1Subsystem
Main Feeder
33 kV
5.3
5.25.1 5.4
Sub feeder 411kV/440V
11kV/440V
4.44.34.24.1
Sub feeder 3
3.53.43.33.23.1
11kV/440VSub feeder 2
Sub feeder 111kV/440V
2.22.1 2.42.3
SCS
33/11kV
Figure 3.2: Radial distribution system of Guwahati city.
The practical grid data of typical network of Guwahati city has been taken in this work, which is
shown in Fig. 3.2 [74]. This network is a reduced system of substation which consists of 33/11kV,
5MVA as the main feeder and the entire radial sub feeders have11kV/440V, 500kVA transformers.
The off-peak hour load was assumed to be 60% of peak hour load.The resistance and reactance of
the lines are 0.0027p.u and 0.0024p.u, respectively. The location of SCS considered for test condition
64
TH-1265_KANNANT

3.2 Modeling of Multi-Point Smart Charging Stations
is connected in the distribution network at the node5.3, as shown in Fig. 3.2. Table 3.1 shows the
existing peak hour load of substation at different nodes.
Table 3.1: Existing load profile of the substation.
Nodes P (p.u.) Q (p.u.) Nodes P (p.u.) Q (p.u.)2.1 0.50 0.22 4.2 0.63 0.382.2 0.47 0.23 4.3 0.67 0.232.3 1.13 0.64 4.4 0.53 0.372.4 0.27 0.15 5.1 0.45 0.393.1 0.42 0.29 5.2 0.23 0.133.2 0.94 0.43 5.3 0.84 0.463.3 0.13 0.09 5.4 - -3.4 - - 6.1 0.37 0.183.5 0.25 0.17 6.2 0.23 0.134.1 0.23 0.13 6.3 0.73 0.45
3.2.2 Multi-Point Smart Charging Station(SCS)
The layout of contactless based multi-point SCS is shown in Fig. 3.3. The proposed SCS has
multi-charging points, where EVs’ batteries of different ratings are connected. The individual charg-
ing points are contactless, bidirectional and it is connected to the DN of the grid via ac bus. Hence,
it is called as BCCS. The complete architecture of SCS is divided into three units: the central control
unit, the CS aggregator and the multi-point BCCS unit.
Energycalculationdistribution
PowerCentralControl
Unit (CCU)
Primary Side(PS)
Primary Side(PS)
...
EV1
EVn
.
ac bus
Node (DN)Distribution
.
. . .
BCCS unit n
BCCS unit 1
.
Primary control Secondary control
Contactless point
(SS)Secondary Side
Primary control Secondary control
Contactless point
(SS)Secondary Side
CS Aggregator
D
Pbn
Pb1
Ebn
Eb1Pgrid
Vnode
ET
ET Eb1 Ebn
Figure 3.3: Layout of multi-point smart charging station.
The CCU decides the net power flow between the DN of the grid andthe CS. The CS aggregator
distributes the net power among the EVs’ batteries. The CCU takes decisions of power flow (Pgrid)
65
TH-1265_KANNANT

3. Modeling and Control of Contactless based Smart ChargingStation in V2G Scenario
based on three inputs: DN Voltage (Vnode) of the grid, total energy availability (ET) of SCS and
duration in hours (D) to support the grid. The direction ofPgrid can be either positive or negative.
Positive power implies the CS will charge the EVs’ batteriesand negative power implies the CS has
to support the grid. ThePgrid obtained from CCU has to be distributed among the EVs by the CS
aggregator. The CS aggregator takes individual energy available (Eb1, Eb2,...Ebn) from each EVs’
batteries,ET of the SCS as well asPgrid and distributes the power among individual BCCS unit (Pb1,
Pb2...Pbn). The distributed power can be either positive or negative depending upon the energy state of
the batteries andPgrid as decided by CCU. The positive power allocated to the battery will get charged
and the batteries with negative power will get discharged. The BCCS unit has two parts: the primary
side and the secondary side (pick-up), which is separated byan air-gap and is magnetically coupled to
each other. The power is transferred from the primary to the pick-up through weak magnetic coupling.
Primary and secondary controllers are employed on either side of contactless coil, to control the power
flow from G2V and V2G. Based on the information of power received from the CS aggregator, the
controllers of the BCCS unit takes necessary action to control theCrate of the battery. By this complete
SCS arrangement, an EVs’ batteries will be able to charge by absorbing power from the DN of the
grid and supply the excess stored energy of EVs into the DN of the grid. The controllers present at
the multi-point BCCS unit controls the power flow between individual EVs’ batteries and DN of the
grid.
3.2.3 EV Battery Model
Electric equivalent circuit (EEC) based battery model is used in this work for representing the
real-time EVs’ batteries, which is given in Fig. 2.3. The electrical parameters of EEC are repre-
sented by polynomial equation explained in Chapter 2 Section 2.2. The terminal voltage for charg-
ing/discharging scenario is given in Eq. (2.5) and Eq. (2.6). The EVs’ batteries come to the SCS for
both charging/ discharging operation. The batteries with excess energy (Eavail) would discharge and
support the grid and EVs with less energy would charge (Estor) by taking energy from the grid. The
Estor andEavail are calculated from Eq. (2.13) and Eq. (2.14). The total energy (ET) of SCS depends
on the sum of stored energy into the battery and available energy to support the grid which is given in
66
TH-1265_KANNANT

3.3 Modeling of Smart Charging Station
Eq. (2.17).
3.3 Modeling of Smart Charging Station
The impact of EVs on DN and the quality of power in the node depends on the charging method-
ology adopted in EVs [161, 162]. Therefore, SCS is developedwhich can handle EVs’ batteries of
different capacity and can coordinate with the DN of the grid. In this SCS context, an entity called
CCU and CS aggregator with multi-point BCCS unit would eventually play a vital role in coordinat-
ing the charging/discharging of large fleet of EVs. In view ofthis discussion, the main contributions
of the present work are:
• Developing the controllers and CS aggregator for the SCS andits coordination with the DN.
These controllers and CS aggregator would control the powerflow between the DN and the
EVs’ batteries.
• In order to achieve the desired power flow, multi-point BCCS unit is modeled with its associated
controllers. BCCS have many advantages including the convenience of being cordless and
safety during high power charging/discharging [82,158,159].
• The entire CS has been controlled by using the fuzzy logic controller, which control and coor-
dinate the EV’s arriving at CS to drawn the power from grid or to support the grid during peak
hours.
3.3.1 Central Control Unit (CCU) and CS Aggregator
In this section, the functioning of CCU and the CS aggregatorare described. As explained in the
previous section, the CCU receives information ofVnode, ET and D. Accordingly, it decides thePgrid
which should flow between the DN and SCS. The CS aggregator allocates the power among different
EVs’ batteries.
The CCU is designed using a fuzzy logic controller (FLC). This FLC has three inputs (Vnode, ET
andD) and one output (Pgrid) as shown in Fig. 3.4. ThePgrid obtained from CCU has to be distributed
67
TH-1265_KANNANT

3. Modeling and Control of Contactless based Smart ChargingStation in V2G Scenario
Distribution Unit(Aggregator)
PowerFLC based
Central controlUnit (CCU)
D
CCU
EnergyCalculation
from multiInformation
charging point(BCCS)
CS Aggregator
. . .
...Pb1
Pbn
Pgrid
Vnode
ET
ET
Eb1 Ebn
Figure 3.4: CCU and CS Aggregator.
among different EVs by the CS aggregator. The distribution of power (Pbn) for nth EVs’ batteries are
calculated from Eq. (3.1).
Pbn =Ebn
ETPgrid (3.1)
The FLC has been used in the CCU because it is most suitable forthis type of uncertain environ-
ments, which eliminates the need for complex mathematical models of the systems [34]. The control
logic for CCU-FLC can be modeled by simple IF-THEN rules. Mamdani type inference is used here
for the implication of rules. In order to achieve a fast and accurate result, center of gravity method
is chosen for defuzzification process. Three fuzzy subsets such as low (L), medium (M) and high
(H) have been chosen for the input variables. negative high (NH), negative medium (NM), negative
Low(NL), positive low (PL), positive medium (PM) and positive high (PH) are chosen as output in
order to obtain the required control action. Triangular membership function is used as it is simpler
and easier to implement as shown in Fig. 3.5. The rule base forCCU-FLC is given in Table 3.2. The
Fuzzification and defuzzification example for the CCU-FLC has been demonstrated in the Appendix
B.
The detail sample calculation of CS aggregator has been given in Appendix D. The main feature
of the fuzzy based cental control unit and the CS aggregator is given below:
• It estimates the total energy availability of the CS and individual EVs available/required energy.
• The fuzzy based CCU decides the amount and direction of powerflow based on the node volt-
age, total energy availability of the CS and duration to support the grid.
• The power distribution unit estimate the required power to BCCS unit or EVs’ batteries.
68
TH-1265_KANNANT

3.3 Modeling of Smart Charging Station
L M H
0.8 0.95 1.10
1M H
0 0.5 1
L
NH NM PLNL PM
−0.6 −0.2−1 0.2 0.6 1
PH
0
0
1
1
(a) (b)
(c)
Vnode ET
Pgrid
Figure 3.5: Fuzzy based CCU control structure in p.u (a) input:Vnode, (b) input: ET , D (c) output:Pgrid.
Table 3.2: Rule base for CCU-FLC.
Vnode ET D Pgrid Vnode ET D Pgrid
L L L NH M M H NLL L M NM M H L NHL L H NL M H M NML M L NH M H H NLL M M NM H L L PHL M H NL H L M PML H L NH H L H PLL H M NM H M L PHL H H NL H M M PMM L L PL H M H PLM L M PL H H L PHM L H PL H H M PMM M L NH H H H PLM M M NM - - - -
3.3.2 Synchronization Mechanism
When EVs arrive at the CS, the BCCS unit will get connected with the DN and when it leaves the
CS, the BCCS unit will get disconnected. However, in the cases of charging/discharging operation of
EVs, the initial synchronization process with the grid is necessary without which the real power
transfer in any direction cannot be controlled. The importance of synchronization of any power
converters connected to the grid is explained in [163] and synchronization of BCCS unit has been
described in detail in references [96]. The synchronization between the DN and the BCCS unit can
be described by a simple system consisting of two interconnected sources as shown in Fig. 3.6.
TheVprim represents the transformer terminal voltage of BCCS unit,RT is the total resistance and
XT represents total reactance of the system which includes transformer reactance, grid impedance
and a third order LCL filter. The LCL filter is designed based onthe standard level determined by
69
TH-1265_KANNANT

3. Modeling and Control of Contactless based Smart ChargingStation in V2G Scenario
Bidirectional power flowVnode Vprim
XTRT
Figure 3.6: Synchronization mechanism between DN and BCCS unit.
IEEE519 for harmonic limits, which considers the level of current harmonics injected into the grid
network [164]. The power transferred between the terminalsof BCCS unit and DN is given in Eq.
(3.2).
Pbn =VnodeVprim
XTsin(δ) (3.2)
Here,δ denotes power angle betweenVnodeandVprim. This power is equal to the distributed power
from the CS aggregator. The real power control between EV batteries and the DN is regulated by
controlling theδ. The value ofδ can be derived from Eq. (3.2).
δ = sin−1
(
PbnXT
VnodeVprim
)
(3.3)
0 0.01 0.02 0.03 0.04 0.05 0.06 0.07 0.08−1
−0.8
−0.6
−0.4
−0.2
0
0.2
0.4
0.6
0.8
1
Time (Sec)
Vn
od
e an
d V
prim
Vprim
CB
Inphasevoltage
Vprim
leadsV
node at an
angle δ
Floating condition
Vnode
Figure 3.7: Synchronization waveform.
For the discussion of power flow, voltage waveform forVnode and Vprim is shown in Fig. 3.7.
For example, let us consider that the Root-Mean-Square (RMS) value of theVnode andVprim is 440V,
the Pb1 is 9.8077kW and reactance (XT) of the system is given in Table 3.8. Therefore,δ = −8.43
70
TH-1265_KANNANT

3.3 Modeling of Smart Charging Station
required to transfer the power (Pb1) from BCCS unit to DN. In Appendix D, the detail calculation of
power angle has been mentioned.
The BCCS unit and the DN will be in floating condition till the system gets synchronized with the
DN. When the system gets synchronized with the DN, the circuit breaker (CB) closes and the angleδ
determines the power flow between the BCCS unit and the DN.
To achieve this synchronization operation and to control the real power, load/power angle control
have been used in Fig. 3.8.
conversionp.u.
SPWM
wt
converterLCL filterTransformer
Distribution
Node
Circuit Breaker
L
CL
P
Freq
sin_cossin_cos
Freq
3 ph
ase
PLL
Power estimator
wtwt
dq0 to abctransformation
3 phase PLL
abc to dq0transformation
Freq
sin_cossin_cos
Control signal Synchronizationcondition checkSynchronization
parameters
1 or 0
LA − FLC
Carrier signal
Gat
e P
ulse
Vnode
Pmea
Vprim IprimVprim
Vdq0
Vabc
δ
Vdq0
Vnode
Vnode
δ
Pbn
Er
δ
Figure 3.8: Load angle control.
The load angle control has used enhanced fuzzy based phase locked loop (PLL) based synchro-
nization technique, which takes DN voltage as reference andestimates the frequency and phase se-
quence components of the grid to synchronize the BCCS unit with the DN. Besides, the converter
voltage (Vprim) and current (Iprim) of BCCS unit is given as input to the power estimator block and
Pmeasis obtained. Based onPmeasandPbn from aggregator, the Load Angle FLC (LA-FLC) generates
the requiredδ as shown in Fig. 3.8. The amount and direction of real power transfer takes place,
when the voltage produced by the BCCS unit leads or lags the voltage of the DN. A leading phase of
BCCS voltage constitutes power transfer from V2G and lagging phase enables power transfer from
71
TH-1265_KANNANT

3. Modeling and Control of Contactless based Smart ChargingStation in V2G Scenario
G2V. The brief overview of the load angle controller is givenbelow:
• The three-phase phase locked loop (PLL) estimate the unit vectors (sinθ andcosθ), frequency
and angular time of the BCCS unit and grid.
• The measured power has been calculated from the power estimator unit based on the BCCS
unit three-phase voltage and current, unit vectors and frequency of the system.
• The fuzzy based load angle controller decide the power anglebased on thePmea and thePbn
which is obtained from the CS aggregtor.
• The park transformation has been used to convert the three-phase (abc) to two phase (dq0)
transformation.
• The required power angle has been added with the two phase quantities and then it converted
into three-phase transformation.
• The three-phase voltage is the reference signal for sine pulse width modulation (SPWM).
Fig. 3.8 mainly consists of discrete three-phase PLL units,which extract the synchronization pa-
rameters (frequency and phase sequence) of the node and converter voltage, three-phase to two phase
transformation and vice versa, FLC based load angle controller (LAC-FLC) and power estimator.
Three-phasesVnode is the input forabc− dq0 transformation unit and discrete three-phases PLL. The
abc− dq0 transformation unit converts the three-phase (abc) stationary components of theVnode to
two phase (dq0) reference frame [99]. The three-phase DN voltage can be represented by Eq. (3.4).
Vnode= Vabc = Vm
∣
∣
∣
∣
sin(ωt) sin(
ωt − 2π3
)
sin(
ωt + 2π3
)
∣
∣
∣
∣
T(3.4)
whereVm is the peak voltage. The three-phase to two phase transformation is given in Eq. (3.5)
[165].
Vd
Vq
V0
=23
cosωt cos(
ωt − 2π3
)
cos(
ωt + 2π3
)
sin(ωt) sin(
ωt − 2π3
)
sin(
ωt + 2π3
)
12
12
12
Va
Vb
Vc
(3.5)
72
TH-1265_KANNANT
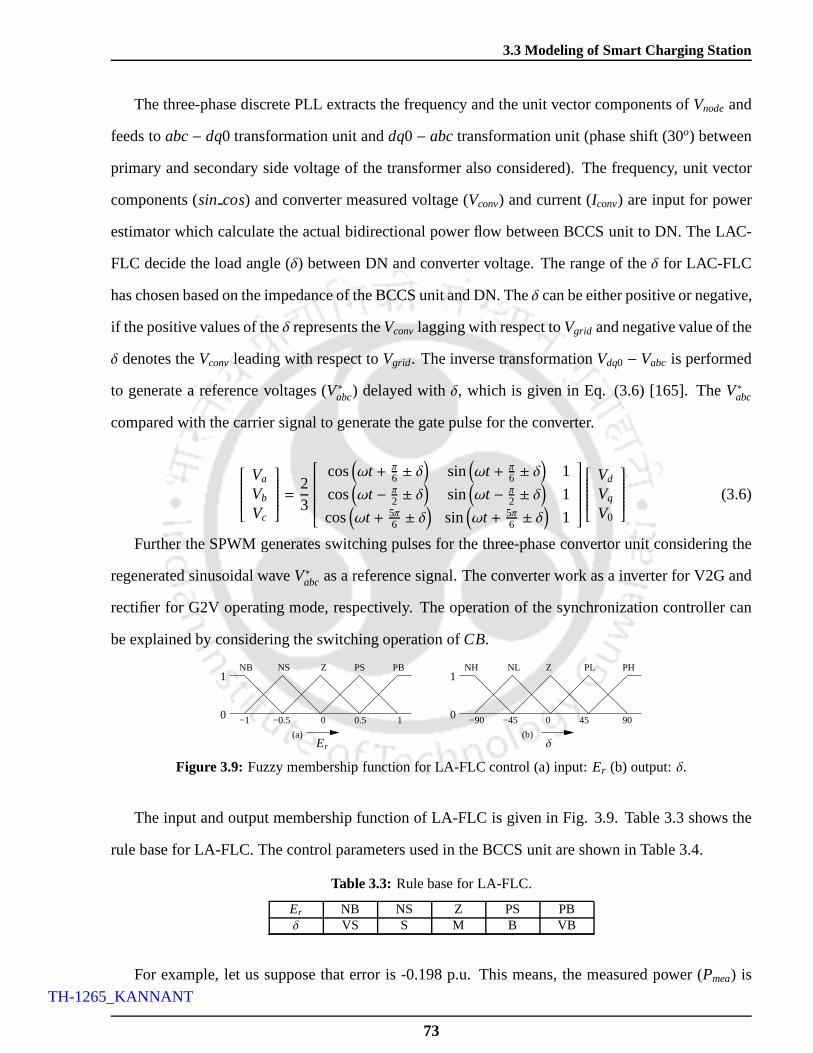
3.3 Modeling of Smart Charging Station
The three-phase discrete PLL extracts the frequency and theunit vector components ofVnode and
feeds toabc− dq0 transformation unit anddq0− abc transformation unit (phase shift (30o) between
primary and secondary side voltage of the transformer also considered). The frequency, unit vector
components (sin cos) and converter measured voltage (Vconv) and current (Iconv) are input for power
estimator which calculate the actual bidirectional power flow between BCCS unit to DN. The LAC-
FLC decide the load angle (δ) between DN and converter voltage. The range of theδ for LAC-FLC
has chosen based on the impedance of the BCCS unit and DN. Theδ can be either positive or negative,
if the positive values of theδ represents theVconv lagging with respect toVgrid and negative value of the
δ denotes theVconv leading with respect toVgrid. The inverse transformationVdq0 − Vabc is performed
to generate a reference voltages (V∗abc) delayed withδ, which is given in Eq. (3.6) [165]. TheV∗abc
compared with the carrier signal to generate the gate pulse for the converter.
Va
Vb
Vc
=23
cos(
ωt + π6 ± δ)
sin(
ωt + π6 ± δ)
1
cos(
ωt − π2 ± δ)
sin(
ωt − π2 ± δ)
1
cos(
ωt + 5π6 ± δ
)
sin(
ωt + 5π6 ± δ
)
1
Vd
Vq
V0
(3.6)
Further the SPWM generates switching pulses for the three-phase convertor unit considering the
regenerated sinusoidal waveV∗abc as a reference signal. The converter work as a inverter for V2G and
rectifier for G2V operating mode, respectively. The operation of the synchronization controller can
be explained by considering the switching operation ofCB.
NB NS Z PS PB
−1 −0.5 0 0.5 10
1
(a)
−90 −45 0 45 90
NL Z PLNH PH
(b)
1
0
Er δ
Figure 3.9: Fuzzy membership function for LA-FLC control (a) input:Er (b) output:δ.
The input and output membership function of LA-FLC is given in Fig. 3.9. Table 3.3 shows the
rule base for LA-FLC. The control parameters used in the BCCSunit are shown in Table 3.4.
Table 3.3: Rule base for LA-FLC.
Er NB NS Z PS PBδ VS S M B VB
For example, let us suppose that error is -0.198 p.u. This means, the measured power (Pmea) is
73
TH-1265_KANNANT
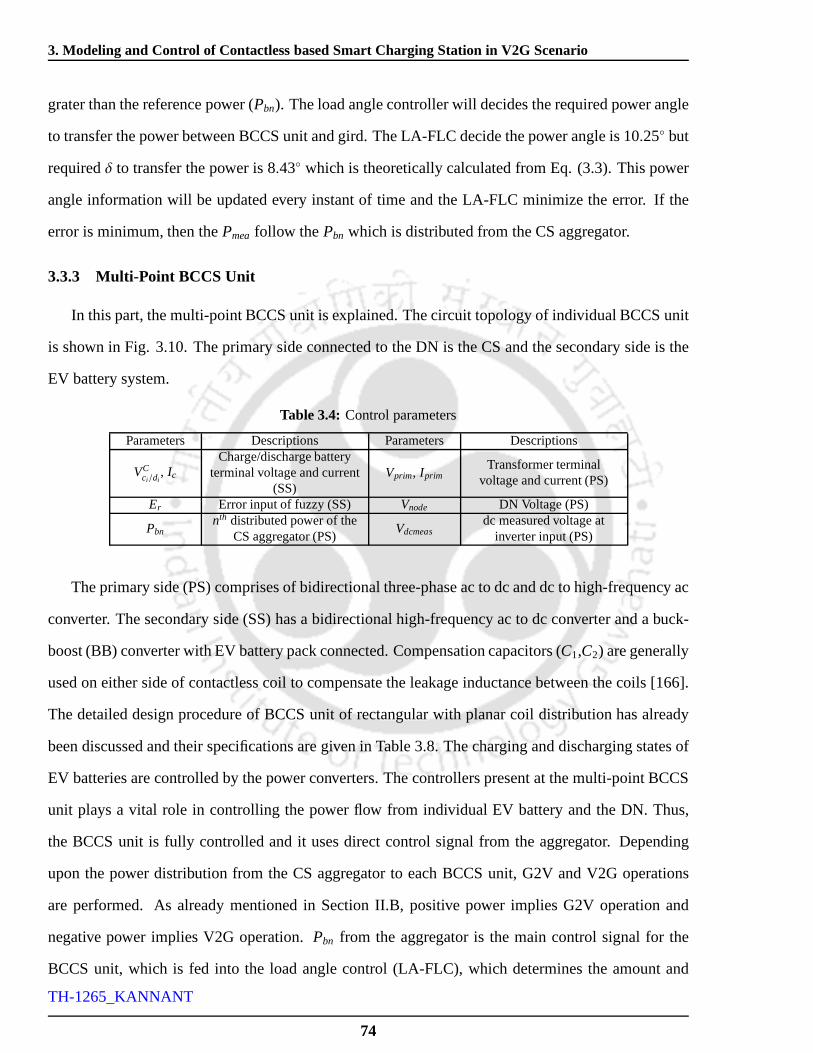
3. Modeling and Control of Contactless based Smart ChargingStation in V2G Scenario
grater than the reference power (Pbn). The load angle controller will decides the required powerangle
to transfer the power between BCCS unit and gird. The LA-FLC decide the power angle is 10.25 but
requiredδ to transfer the power is 8.43 which is theoretically calculated from Eq. (3.3). This power
angle information will be updated every instant of time and the LA-FLC minimize the error. If the
error is minimum, then thePmea follow the Pbn which is distributed from the CS aggregator.
3.3.3 Multi-Point BCCS Unit
In this part, the multi-point BCCS unit is explained. The circuit topology of individual BCCS unit
is shown in Fig. 3.10. The primary side connected to the DN is the CS and the secondary side is the
EV battery system.
Table 3.4: Control parameters
Parameters Descriptions Parameters Descriptions
VCci/di
, Ic
Charge/discharge batteryterminal voltage and current
(SS)Vprim, Iprim
Transformer terminalvoltage and current (PS)
Er Error input of fuzzy (SS) Vnode DN Voltage (PS)
Pbnnth distributed power of the
CS aggregator (PS)Vdcmeas
dc measured voltage atinverter input (PS)
The primary side (PS) comprises of bidirectional three-phase ac to dc and dc to high-frequency ac
converter. The secondary side (SS) has a bidirectional high-frequency ac to dc converter and a buck-
boost (BB) converter with EV battery pack connected. Compensation capacitors (C1,C2) are generally
used on either side of contactless coil to compensate the leakage inductance between the coils [166].
The detailed design procedure of BCCS unit of rectangular with planar coil distribution has already
been discussed and their specifications are given in Table 3.8. The charging and discharging states of
EV batteries are controlled by the power converters. The controllers present at the multi-point BCCS
unit plays a vital role in controlling the power flow from individual EV battery and the DN. Thus,
the BCCS unit is fully controlled and it uses direct control signal from the aggregator. Depending
upon the power distribution from the CS aggregator to each BCCS unit, G2V and V2G operations
are performed. As already mentioned in Section II.B, positive power implies G2V operation and
negative power implies V2G operation.Pbn from the aggregator is the main control signal for the
BCCS unit, which is fed into the load angle control (LA-FLC),which determines the amount and
74
TH-1265_KANNANT

3.3M
odelingofS
martC
hargingS
tation
EV
Battery
Pack
Grid
L
S2
S1 S3
S4
S5
S6
S8
S7S9
S10
S11
S12
S13
D2
D1 D3
D4
D5
D6
D8
D7
D9
D10
D11
D12
D13
S14
D14C1 C2
Cdc Cb1 Cb2Lb
PrimaryCoil
Circuit
breaker
3Φ ac to dc converter dc to high frequency ac
converter
1Φ ac to dc
converterdc to dc converter
Ipc
SecondaryCoilTransformer L
C
Contactless
coil
Lr
Load angle control Energy injection control 1Φ SPWM DC Voltage
control
Charging current
control
Primary Side Secondary Side
Control signal
Lr
Isc
Ic/d
/i i
C
c dVmea
dcV
Vprim
Power flow
Figure 3.10: Circuit topology of individual BCCS unit
75
TH-1265_KANNANT

3. Modeling and Control of Contactless based Smart ChargingStation in V2G Scenario
direction of power flow from/to the DN as shown in Fig. 3.8 for both G2V and V2G operation. As
it is not desired to deplete or overcharge the battery, an algorithm has been used to control the power
flow of the EV battery which calculates theCrate; and the energy status is calculated by considering
the SOC limits (Chapter 3, Section 3.3, 3.3.4). Based on this, Pbn is also fed into the controller of
buck boost converter in the battery side; which determines the reference current signal. The detailed
control process and controllers involved for both G2V and V2G operations is explained below. Load
angle control, energy injection control and charging current control is used for G2V operation and
load angle control, sine pulse width modulation (SPWM) technique and DC link voltage control is
utilized for V2G operation.
3.3.3.1 G2V Operation
The detailed circuit diagram for V2G operation is shown in Fig. 3.11. In Fig. 3.11, the primary
side (PS) controlled rectifiers are used to convert three-phase ac to dc using bidirectional switches
(S1−S6). These switches are controlled based on SPWM using load angle control taking DN voltage
as reference. The amount of power supplied to the battery is controlled based onδ. Then the inverter
switches (S7 − S8) converts dc to high-frequency ac using energy injection control [67, 167] which
is given in Fig. 3.14. In the secondary side (SS), the diodes (D9 − D12) convert high-frequency ac
to dc. Diode rectification is used here, as the system employstight magnetic coupling. Obviously,
controlled rectifiers can be used, if the system has a specialrequirement to control the misalignments
between the PS and SS. Further, the buck boost converter (S13,D14) controls the charging current of
the battery. The buck-boost converter is required in this case because the sudden flow of high current
may damage the EVs’ batteries.Pbn from the aggregator is fed into the charging current controller of
the buck boost converter. Fig. 3.12. shows the charging current control,Pbn and the battery terminal
voltage generates the reference current (Ire f ) for the controller. For convenience, the controller is
normalized in per unit (p.u) values. Error (E′r) is obtained from Eq. (3.7).
E′r =
1−VC
ciIc
Pbn
(3.7)
TheEr is given as input to charging current FLC (CC-FLC), which generate the required duty ratio
76
TH-1265_KANNANT

3.3M
odelingofS
martC
hargingS
tation
EV
Battery
Pack
Grid
L
S2
S1 S3
S4
S5
S6
S8
S7S9
S10
S11
S12
S13
D2
D1 D3
D4
D5
D6
D8
D7
D9
D10
D11
D12
D13
S14
D14C1 C2
Cdc Cb1 Cb2Lb
PrimaryCoilCB
3Φ ac to dc converter dc to high frequency ac
converter
1Φ ac to dc
converterdc to dc converter
Ipc
SecondaryCoilTransformer L
C
Contactless
coil
Lr
Load angle control Energy injection control Charging current
control
Primary Side Secondary Side
Control signal
Lr
Isc
mea
dcV
VconvVnode
Ic/d
/i i
C
c dV
Power flow
Figure 3.11: Circuit topology for G2V operating mode.
77
TH-1265_KANNANT

3. Modeling and Control of Contactless based Smart ChargingStation in V2G Scenario
LPF
LPF
CarrierSignal
p.u
CC−FLC
I25 kHz
LPF − Low pass filter
Ire fPbn Er S13Pbn
VCci
R′
VCci
.
Figure 3.12: Charging current control.
for pulse generation. Low pass filters (LPF) is used in the output of CC-FLC, to obtain oscillation
free output. The rule base and membership function used for CC-FLC is given in Fig. 3.13 and Table
3.5. The triangular membership function has been used for both input and output which is shown in
Fig. 3.13. Five fuzzy subsets are chosen as input variable (Er): negative high (NH), negative low
(NL), zero (Z), positive low (PL) and positive high (PH). Thefuzzy subsets chosen for reference (R)
output: very low (VL), low (L), medium (M), high (H) and very high (VH).
NL Z PL
10 0.5−0.5−1
(a)
0 0.25 0.5 0.75 1
L M H
(b)
0
1
0
1PH VHVLNH
Er R′
Figure 3.13: Fuzzy membership function for CC-FLC control (a) input:E′r (b) output:D′.
Table 3.5: Rule base for CC-FLC.
E′r NH NL Z PL PHD’ VL L M H VH
For example, let us suppose thatPb1 is 12.52kW, the measured battery terminal voltage (VCci
) is
258V and the charging current (Ic) is 20.45A. The reference current (Ire f ) has been calculated from
the ratio between thePb1 and theVCci
, it is 48.53A. Then the error (E′r) sinal is 0.5786 p.u. This means,
the Ic is much less thanIre f . Therefore, the charging current controller is increase the duty ratio (D′)
of the BB converter. If theD′ is increased with respect to theE′r , then the BB converter switching
time (ton) has been increased. Therefore, the energy stored in the inductor (Lb) will increase. This
information will be updated every instant of time and the CCCmaintain the batteryIc is equal to the
Ire f by increasing theD′.
78
TH-1265_KANNANT

3.3 Modeling of Smart Charging Station
AND
0
NOT
High frequency
S7
S8
Ipc
.
Figure 3.14: Energy injection control.
The block diagram of energy injection control is given in Fig. 3.14. The primary side current is
compared with the zero, then the gate pulse is generated for switchesS7 andS8 which converts dc
current to high-frequency ac current.
3.3.3.2 V2G Operation
The detailed circuit diagram for V2G operation is shown in Fig. 3.15. In V2G operation, the
EVs’ batteries supplies power to the DN. The BCCS unit shouldmaintain the line-line peak voltage
of the node (625V) for supporting the grid. This is achieved by controlling the secondary side dc-
dc converter (S14, D13) using DC link voltage based FLC (DLV-FLC) which is shown in Fig. 3.16.
Further, the dc voltage is converted to high-frequency ac (S9-S12) using SPWM technique [168]. In
the PS, the diodes (D7 andD8) convert high-frequency ac to dc and inversion operation isperformed
by the switches (S1-S6) using load angle control as shown in Fig. 3.8. The amount of power supplied
to the grid is based on the power signal obtained from the aggregator. The Error (E′′r ) for DC link
voltage controller is calculated from the equation given below.
E′′r =
1−Vmea
dc
Vre fdc
(3.8)
The membership function of DLV-FLC is shown in Fig. 3.17. Five fuzzy subsets are chosen as
input variables forE′′r and∆E′′r : negative big (NB), negative small (NS), zero (Z), positivesmall (PS)
and positive big (PB). The output reference (D′′) is given by very small (VS), small (S), medium (M),
big (B) and very big (VB). The rule base for DLV-FLC is given inTable 3.6.
For example, let us consider thatVmeadc is 600V andVre f
dc is 625V. TheE′′r is 0.04 p.u and the∆E′′r
is 0.008 p.u. This means, theVmeadc is almost equal to theVre f
dc . Therefore, the DLV-FLC will increase
the duty ratio (D′′) of the BB converter. If theD′′ is increased with respect to theE′′r and∆E′′r , then
79
TH-1265_KANNANT

3.M
odel
ing
and
Con
trol
ofC
onta
ctle
ssba
sed
Sm
artC
harg
ingS
tatio
nin
V2G
Sce
nario
EV
Battery
Pack
Grid
L
S2
S1 S3
S4
S5
S6
S8
S7S9
S10
S11
S12
S13
D2
D1 D3
D4
D5
D6
D8
D7
D9
D10
D11
D12
D13
S14
D14C1 C2
Cdc Cb1 Cb2Lb
PrimaryCoil
CB
Vdcmeaa
3Φ ac to dc converter dc to high frequency ac
converter
1Φ ac to dc
converterdc to dc converter
Ipc
SecondaryCoilTransformer L
C
Contactless
coil
Lr
Load angle control 1Φ SPWM DC Voltage
control
Primary Side Secondary Side
Control signal
Lr
Isc
VconvVnode
Ic/d
/i i
C
c dV
Power flow
Figure 3.15: Circuit topology for V2G operating mode.
80
TH-1265_KANNANT

3.3 Modeling of Smart Charging Station
LPF
LPF
25 kHz
p.u
DLV−FLC
Delay SignalCarrier
LPF − Low pass filter
S14
Vre fdc
∆E′r
E′r R′′
Vmeadc
Figure 3.16: DC link voltage control.
−1 −0.5 0 0.5 1
NB NS Z PS PB
0
1
0.25 0.5 0.750
VS S M B VB
10
1
(b)(a)R′′E′r and∆E′r
Figure 3.17: Fuzzy membership function for DLV-FLC (a) inputs:E′′r and∆E′′r (b) output:D′′.
Table 3.6: Rule base for DLV-FLC.
E′′r ∆E′′r D′′ E′′r ∆E′′r D′′
PB NB M Z PS BPB NS B Z PB BPB Z B NS NB VSPB PS VB NS NS SPB BP VB NS Z SPS NB S NS PS MPS NS M NS PB BPS Z B NB NB VSPS PS B NB NS VSPS PB VB NB Z SZ NB S NB PS SZ NS S NB PB MZ Z M - - -
the BB converterton has been increased. This information will be updated every instant of time and
the DLV-FLC maintain theVmeadc is equal to theVre f
dc by increasing theD′′.
3.3.4 Crate and SOC Calculation
As it is not desired to deplete or overcharge the battery, theCrate and SOC (in this Chapter SOC de-
notes bothS OCcr andDODcr for simplicity) of the batteries are monitored. The capacity fading of the
EVs’ batteries is not considered in this work. An algorithm is used to control the charging/discharging
of EVs’ batteries by changing theCrate of EVs’ batteries. TheCrate of BCCS unit is calculated from
Eq. (3.9).
81
TH-1265_KANNANT

3. Modeling and Control of Contactless based Smart ChargingStation in V2G Scenario
CBCCSrate =
Pmax
VCci/di
Q(3.9)
where,Pmax is the maximum peak power handling capability of charging point. The algorithm
has also taken into account of user definedCrate (Cuserrate) and the currentCrate (Ccrt
rate) of the battery. The
Ccrtrate calculated from the equation given below.
Ccrtrate =
Pbn
VCci/di
Q(3.10)
V
Filter
Calculation for battery powercalculation
Energy
Switch
Polynomial coefficients
ControlledVoltageSource
Calculation for
Calculation for
for charging
Battery model
for dischargingBattery model
Q
Sign
Q
Polynomial coefficients
CuserrateCBCCS
rate Ccrtrate
I ∗ > 0
I ∗ < 0
for discharging (a1 − a31)
Ic, tc, Cr , S OC
Id, td, Dr , DOD
Pmax
VCci/di
VCci/di
Pnre f
Ebn Pc/d
tc/d
Ic/d
I ∗
R
Ic/d
Pbn
VCci/di
User defined DOD limits
User defined SOC limitsfor charging (a1 − a31)
VCci/di
Crate
min(CBCCSrate ,Cuser
rate ,Ccrtrate)
Figure 3.18: Crate and SOC calculation.
The control algorithm chooses the minimum of theCrate (CBCCSrate ,Ccrt
rate andCuserrate) to regulate the
current flows of individual EV battery. The minimum of theCrate (Cminrate) will be the processedCrate
of the charging point. Besides, the SOC limits of vehicle owners are also considered in this work.
When the SOC is near to full (empty), a high power charging or discharging should not be allowed
for preventing over charge (over discharge). Therefore,S OCmin andS OCmax of the EVs’ batteries are
taken into account. Based on these limits, the control algorithm is implemented using Eq. (2.13) and
Eq. (2.14). Fig. 3.18 shows the block diagram ofCrate and SOC evaluation used in EV batteries of
SCS.
The main features of the charge rate control is given below:
• Control the minimumCrate to regulate the battery current based on the user defineCrate, BCCS
unit Crate and currentCrate of the battery.
82
TH-1265_KANNANT
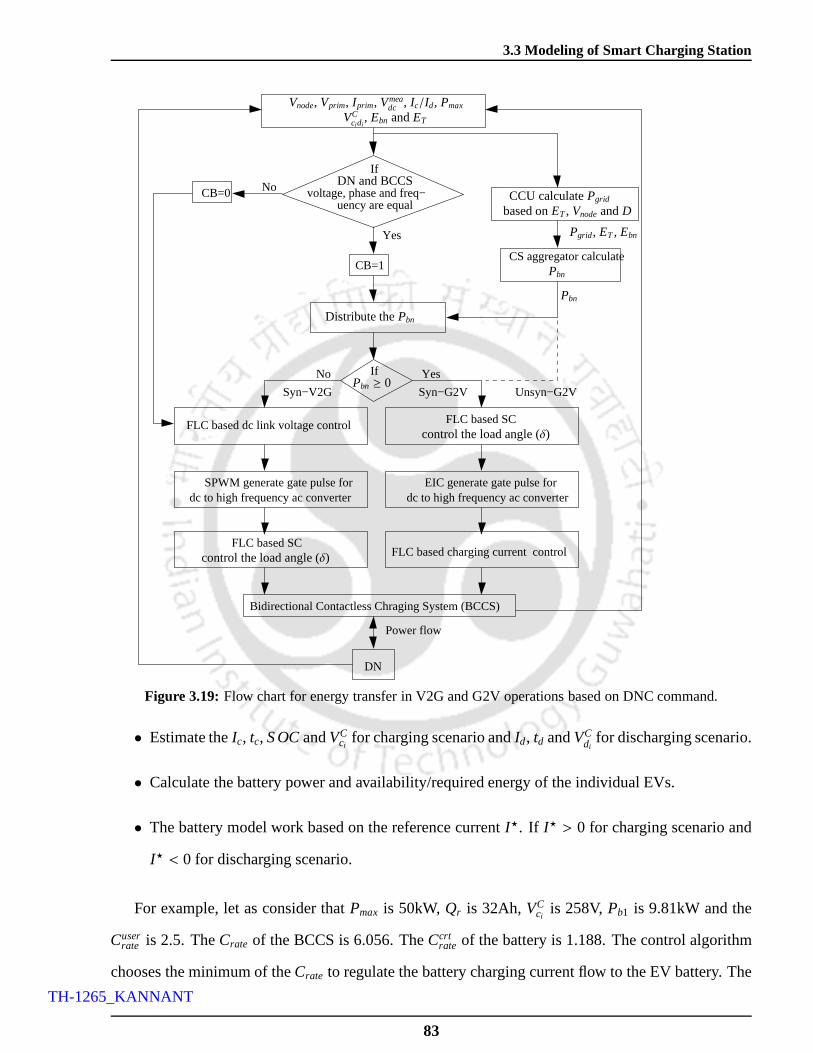
3.3 Modeling of Smart Charging Station
Bidirectional Contactless Chraging System (BCCS)
CB=1
CB=0
If
SPWM generate gate pulse fordc to high frequency ac converter dc to high frequency ac converter
EIC generate gate pulse for
FLC based SC
Syn−G2V
No Yes
No
Yes
Unsyn−G2VSyn−V2G
Power flow
If
voltage, phase and freq−uency are equal
FLC based dc link voltage control
FLC based SCFLC based charging current control
DN
CS aggregator calculate
Pbn ≥ 0
control the load angle (δ)
DN and BCCS
based onET , VnodeandD
Vnode, Vprim, Iprim, Vmeadc , Ic/Id, Pmax
VCcidi
, Ebn andET
CCU calculatePgrid
Pgrid, ET , Ebn
control the load angle (δ)
Pbn
Pbn
Distribute thePbn
Figure 3.19: Flow chart for energy transfer in V2G and G2V operations based on DNC command.
• Estimate theIc, tc, S OCandVCci
for charging scenario andId, td andVCdi
for discharging scenario.
• Calculate the battery power and availability/required energy of the individual EVs.
• The battery model work based on the reference currentI⋆. If I⋆ > 0 for charging scenario and
I⋆ < 0 for discharging scenario.
For example, let as consider thatPmax is 50kW,Qr is 32Ah,VCci
is 258V,Pb1 is 9.81kW and the
Cuserrate is 2.5. TheCrate of the BCCS is 6.056. TheCcrt
rate of the battery is 1.188. The control algorithm
chooses the minimum of theCrate to regulate the battery charging current flow to the EV battery. The
83
TH-1265_KANNANT
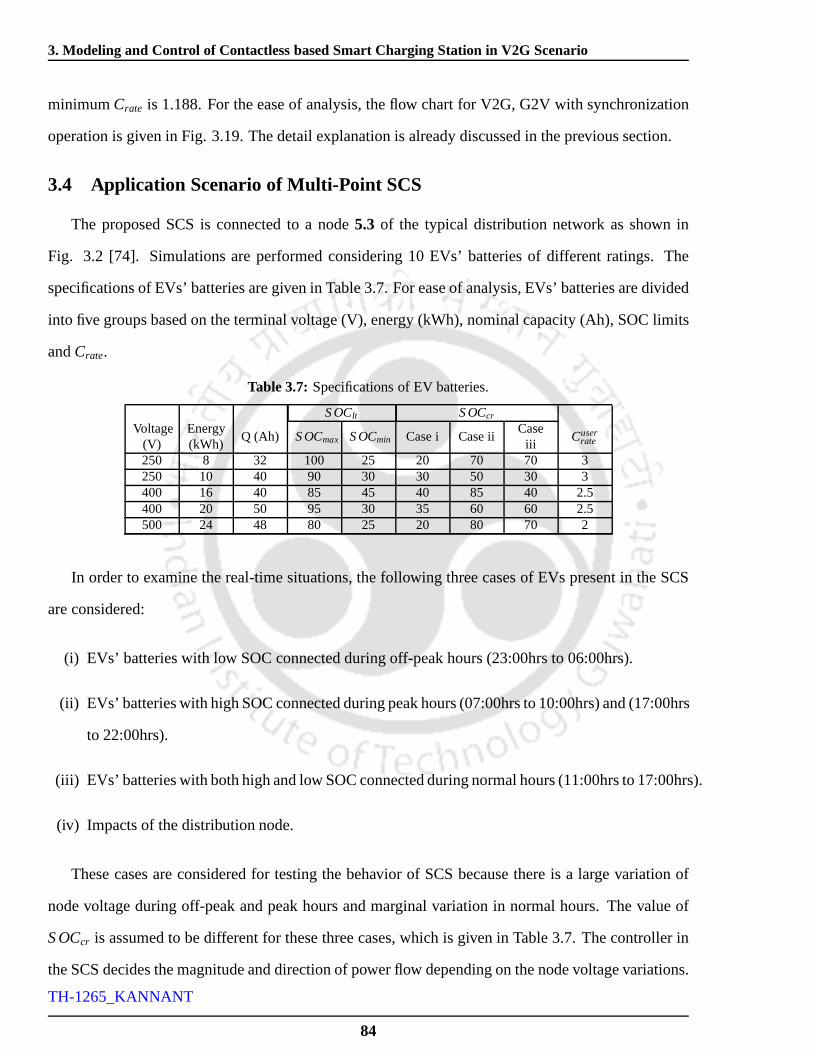
3. Modeling and Control of Contactless based Smart ChargingStation in V2G Scenario
minimumCrate is 1.188. For the ease of analysis, the flow chart for V2G, G2V with synchronization
operation is given in Fig. 3.19. The detail explanation is already discussed in the previous section.
3.4 Application Scenario of Multi-Point SCS
The proposed SCS is connected to a node5.3 of the typical distribution network as shown in
Fig. 3.2 [74]. Simulations are performed considering 10 EVs’ batteries of different ratings. The
specifications of EVs’ batteries are given in Table 3.7. For ease of analysis, EVs’ batteries are divided
into five groups based on the terminal voltage (V), energy (kWh), nominal capacity (Ah), SOC limits
andCrate.
Table 3.7: Specifications of EV batteries.
S OClt S OCcr
Voltage(V)
Energy(kWh)
Q (Ah) S OCmax S OCmin Case i Case iiCaseiii
Cuserrate
250 8 32 100 25 20 70 70 3250 10 40 90 30 30 50 30 3400 16 40 85 45 40 85 40 2.5400 20 50 95 30 35 60 60 2.5500 24 48 80 25 20 80 70 2
In order to examine the real-time situations, the followingthree cases of EVs present in the SCS
are considered:
(i) EVs’ batteries with low SOC connected during off-peak hours (23:00hrs to 06:00hrs).
(ii) EVs’ batteries with high SOC connected during peak hours (07:00hrs to 10:00hrs) and (17:00hrs
to 22:00hrs).
(iii) EVs’ batteries with both high and low SOC connected during normal hours (11:00hrs to 17:00hrs).
(iv) Impacts of the distribution node.
These cases are considered for testing the behavior of SCS because there is a large variation of
node voltage during off-peak and peak hours and marginal variation in normal hours. The value of
S OCcr is assumed to be different for these three cases, which is given in Table 3.7. The controller in
the SCS decides the magnitude and direction of power flow depending on the node voltage variations.
84
TH-1265_KANNANT

3.5 Results and Discussion
EVs’ batteries will not charge, if the node voltage is low (peak hours) and batteries will not discharge
when the node voltage is high (off-peak hours). However, if the voltage is within the specified limit
(0.95 to 1.05 p.u), some batteries would charge and some would discharge depending on the energy
availability or requirement of the individual battery.
The following assumptions have been made in this work:
• Each BCCS unit of the SCS is designed for maximum peak power handling capacity of 50 kW.
• The EV batteries are not allowed to discharge below theS OCmin and the batteries are not al-
lowed to charge aboveS OCmax.
Fig. 3.10 shows the circuit topology of individual BCCS unitand its specifications of parameters
are given in Table 3.8. The battery parameters (R1, R2, C, andVo) depends on the status of SOC. In
Table 3.8, the battery parameter is mentioned for a single EVbattery having the rating of 250V, 8kWh
and SOC level of 70%.
Table 3.8: Specifications of BCCS unit.
Parameter Descriptions Values Parameter Descriptions Values
LCL 3 Φ filter (PS)0.6mH, 0.08mF,
0.8mHC1, C2
PS and SScompensationcapacitance
1.17F, 1.17F
Cdcdc link capacitor
(PS)10mF M
Mutualinductance
8.83µH
Lp, Ls, Lrinductance of PS,
SS, resonant34.8µH, 34.8µH,
30µHLb, Cb1,
Cb2
BB inductance,capacitance
0.48mH, 5.47mF
R1, R2, C,Vo
Batteryparameters
0.0407Ω,0.0102Ω,1.5027F,275.19V
XT , fs
Total reactance,system operating
frequency2.894Ω, 25kHz
3.5 Results and Discussion
In this section, SCS behavior is analyzed for three cases (off-peak, peak, normal hours of a day)
as discussed. To avoid the repetition of similar graphs, only five EVs batteries results are shown
throughout this section.
Case I: EVs’ batteries with low SOC connected during off-peak hours. In this case, the SCS
is tested during off-peak hours, where the node voltage (Vnode) is generally high (1.05p.u to 1.1p.u).
85
TH-1265_KANNANT

3. Modeling and Control of Contactless based Smart ChargingStation in V2G Scenario
Also, it is considered that during off-peak hours, EVs batteries arrive at the SCS have low value of
SOC as mentioned in Table 3.7. In this case, CCU-FLC at the grid side decides a total of 180kW
of power which is required to charge the EVs’ batteries and itis shown in Table 3.9. The summary
of individual energy, total available energy of SCS, division of power from CS aggregator and the
minimumCrate (Cminrate) chosen by the proposed SCS are summarized in Table 3.9.
Table 3.9: Summary of power and required energy of case I.
Energy (kWh)
Parameter Estor Eavail ParameterPower(kW)
Cminrate
Eb1-Eb2 6.4 - Pb1-Pb2 12.63 1.58Eb3-Eb4 6.0 - Pb3-Pb4 11.84 1.18Eb5-Eb6 8.0 - Pb5-Pb6 15.79 0.99Eb7-Eb8 12.0 - Pb7-Pb8 23.68 1.18Eb9-Eb10 13.2 - Pb9-Pb10 26.06 1.08
ET 45.6×2=91.2 Pgrid 90×2=180
Fig. 3.20 shows the power distributed across the terminals of ac bus of each BCCS unit of SCS.
The individual BCCS units are operated at resonant state to decrease the conduction loss of the system.
When the system operates at resonance condition, maximum power is transferred in the system and
the power factor (pf) of the system is maintained to unity or near to unity [169]. The pf of the proposed
SCS lies between 0.99 to 1 as shown in Fig. 3.21.
0 0.2 0.4 0.6 0.8 1 1.2 1.4 1.6 1.8 2−10
0
10
20
30
Time (Sec)
Po
we
r a
t a
c b
us (
kW
)
26.05
23.68
15.7912.63
11.84
Synchronization period
Figure 3.20: Power at each terminal of BCCS unit.
The charging current controller controls the charging current of individual EV battery. It is evident
from Fig. 3.22, the EVs’ batteries are charging at constant current, which shows the effectiveness of
86
TH-1265_KANNANT

3.5 Results and Discussion
0 0.2 0.4 0.6 0.8 1 1.2 1.4 1.6 1.8 2
0.9955
0.996
0.9965
0.997
0.9975
0.998
0.9985
0.999
Time (Sec)
Po
we
r fa
cto
r
0.99730.9976
0.9978
0.99820.9985
Figure 3.21: Power factor of the BCCS unit.
the controller. There will be a small negative flow of currentduring synchronization period. Actually
during synchronization period, the system is controlled and there is no power transfer between DN
and EVs’ batteries. This is because, the EVs’ arrive at the CSwill make a closed path through
converters switches having low resistance and there is someinitial current flow through LCL filter
and this consumes very less power. This can be seen from Fig. 3.20 and Fig. 3.23. Fig. 3.20 shows
the power distributed at each terminal of BCCS (i.e., near toac bus at grid side), there is no power
transfer during synchronization. However, Fig. 3.23 showsthe battery power there is some initial
negative power flow at the time of synchronization. The detailed circuit topology of individual BCCS
unit with current flow direction during the synchronizationperiod is given in Fig. 3.15.
Fig. 3.23. shows the power delivered by each battery. The efficiency of the system is calculated
based on the ratio of the EV battery power and the distributedpower from CS aggregator (Pbn). The
efficiency of this case lies between 86% to 94%, with reduced losses of around 0.6kW to 0.8kW.
After synchronization operation, the direction of power transfer is decided. This must be satisfied for
all EVs in the charging station arriving with high and low values of SOC. The buck-boost converter
present in the EV battery system handles this operation. Theduty ratio of the buck-boost converter is
controlled and does the necessary operation and maintains the voltage level in the grid side. Initially,
the EVs’ batteries have to discharge its energy to perform the synchronization operation.
Fig. 3.24. shows the initial and final SOC values of five groupsof EVs’ batteries. It is clear from
87
TH-1265_KANNANT

3. Modeling and Control of Contactless based Smart ChargingStation in V2G Scenario
0 0.2 0.4 0.6 0.8 1 1.2 1.4 1.6 1.8 2
0
10
20
30
40
50
60
Time (Sec)
Ba
tte
ry C
urr
en
t (A
)56.25
48.98
46.48 44.05
37.11
Synchronization period
Figure 3.22: Charging currents of individual EVs’ batteries.
0 0.2 0.4 0.6 0.8 1 1.2 1.4 1.6 1.8 2−5
0
5
10
15
20
25
30
Time (Sec)
Ba
tte
ry P
ow
er
(kW
)
Synchronization period
Figure 3.23: Power at each terminal of EVs’ batteries.
the Figure that EVs batteries have not crossed the SOC limit as mentioned in Table 3.15.
The Total harmonic distortion (THD) and the pf of the BCCS unit is give in Table 3.10. The THD
of the BCCS unit is found in the range of 1.897% to 2.939% and the power factor of the BCCS unit
is found in the range of 0.9982 to 0.9982. The THD and power factors are allowable as per the IEEE
standard 519-1992 [170].
Case II: EVs’ batteries with high SOC connected during peak hours. The V2G operation has
been considered for the negative value ofPnre f . Power flow from EV’s batteries to DN will take place
in proportion withδ. All the BCCS units connected at the CS together suppliesPgrid to the DN.
88
TH-1265_KANNANT

3.5 Results and Discussion
0
20
40
60
80
100
SO
C(%
)
SOCfinal2
SOCfinal3
SOCfinal4
SOCfinal5
SOCinitial5
SOCinitial4SOC
initial3
SOCinitial2
SOCinitial1
SOCfinal1
Figure 3.24: Initial and final SOC of the EVs’ batteries
Table 3.10:THD and power factor of the BCCS unit during the G2V operatingmode.
Sl. No THD (%) Power factor1. 2.939 0.99762. 1.897 0.99733. 1.897 0.99784. 2.028 0.99825. 2.545 0.9985
Voltage profile of the DN improved due to support the DN in the peak hours. The node voltage varies
with respect to the magnitude ofPtotal drawn from the node. The graphical results for battery power
and current, ac bus power,Ptotal andVnode for V2G operating mode has been presented. In this case,
all 10 EVs arrive at SCS with high energy. The CCU-FLC at the grid side decides to draw -170kW
of power for supporting the grid as given in Table 3.11. During peak hours,Vnode is generally low
(0.95p.u to 0.97p.u). The controllers in the SCS allow the EVs’ batteries to discharge its energy. The
EV batteries discharge based on the SOC limit prescribed by the EV owner.
Table 3.11:Summary of power and available energy of case II.
Energy (kWh)Parameter Estor Eavail Parameter Power (kW) Crate
Eb1-Eb2 - 3.6 Pb1-Pb2 -9.81 1.23Eb3-Eb4 - 2.0 Pb3-Pb4 -5.44 0.55Eb5-Eb6 - 6.4 Pb5-Pb6 -17.45 1.09Eb7-Eb8 - 6.0 Pb7-Pb8 -16.35 0.82Eb9-Eb10 - 13.2 Pb9-Pb10 -35.95 1.49
ET 31.2× 2=62.4 Pgrid -85×2=-170
Fig. 3.25-3.26 shows the discharging current of EVs’ batteries and the power supplied from each
89
TH-1265_KANNANT
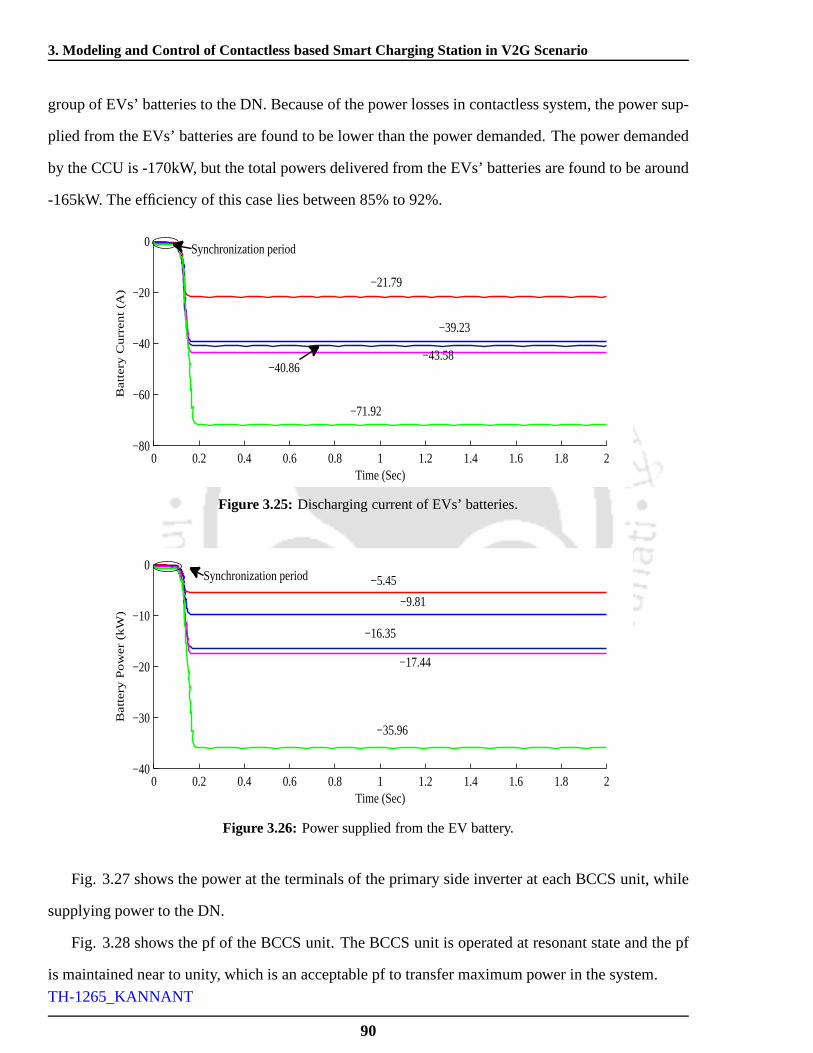
3. Modeling and Control of Contactless based Smart ChargingStation in V2G Scenario
group of EVs’ batteries to the DN. Because of the power lossesin contactless system, the power sup-
plied from the EVs’ batteries are found to be lower than the power demanded. The power demanded
by the CCU is -170kW, but the total powers delivered from the EVs’ batteries are found to be around
-165kW. The efficiency of this case lies between 85% to 92%.
0 0.2 0.4 0.6 0.8 1 1.2 1.4 1.6 1.8 2−80
−60
−40
−20
0
Time (Sec)
Ba
tte
ry C
urr
en
t (A
)
Synchronization period
−21.79
−39.23
−43.58
−71.92
−40.86
Figure 3.25: Discharging current of EVs’ batteries.
0 0.2 0.4 0.6 0.8 1 1.2 1.4 1.6 1.8 2−40
−30
−20
−10
0
Time (Sec)
Ba
tte
ry P
ow
er
(kW
)
Synchronization period
−17.44
−16.35
−9.81
−5.45
−35.96
Figure 3.26: Power supplied from the EV battery.
Fig. 3.27 shows the power at the terminals of the primary sideinverter at each BCCS unit, while
supplying power to the DN.
Fig. 3.28 shows the pf of the BCCS unit. The BCCS unit is operated at resonant state and the pf
is maintained near to unity, which is an acceptable pf to transfer maximum power in the system.
90
TH-1265_KANNANT

3.5 Results and Discussion
0 0.2 0.4 0.6 0.8 1 1.2 1.4 1.6 1.8 2−50
−40
−30
−20
−10
0
Time (Sec)
Po
we
r a
t a
c b
us (
kW
)
Synchronization period
−33.25
−15.42
−14.58
−4.83−8.89
Figure 3.27: Power at the terminals of inverter of individual EVs.
0 0.2 0.4 0.6 0.8 1 1.2 1.4 1.6 1.8 20.99
0.992
0.994
0.996
0.998
1
Time (Sec)
Po
we
r fa
cto
r
0.9991
0.9982
0.9965
0.9926
0.9984
Figure 3.28: Power factor of the BCCS unit.
The DC link voltage controller controls the DC link voltage input of three-phase inverter at the
primary side of BCCS unit, which is shown in Fig. 3.29. This control action is necessary to maintain
the voltage level to make the circuit in synchronized condition to cause the power flow.
Fig. 3.30 shows the initial and final SOC of EVs’ batteries of this case. It is observed from the
figure, the EV batteries are not discharged beyond the SOC limit preferred by the owner.
The THD and the pf of the BCCS unit for V2G operating mode is give in Table 3.12. The THD of
the BCCS unit is found in the range of 1.95391% to 3.08595% andthe pf of the BCCS unit is found
in the range of 0.9982 to 0.9991. The THD and power factors areallowable as per the IEEE standard
91
TH-1265_KANNANT
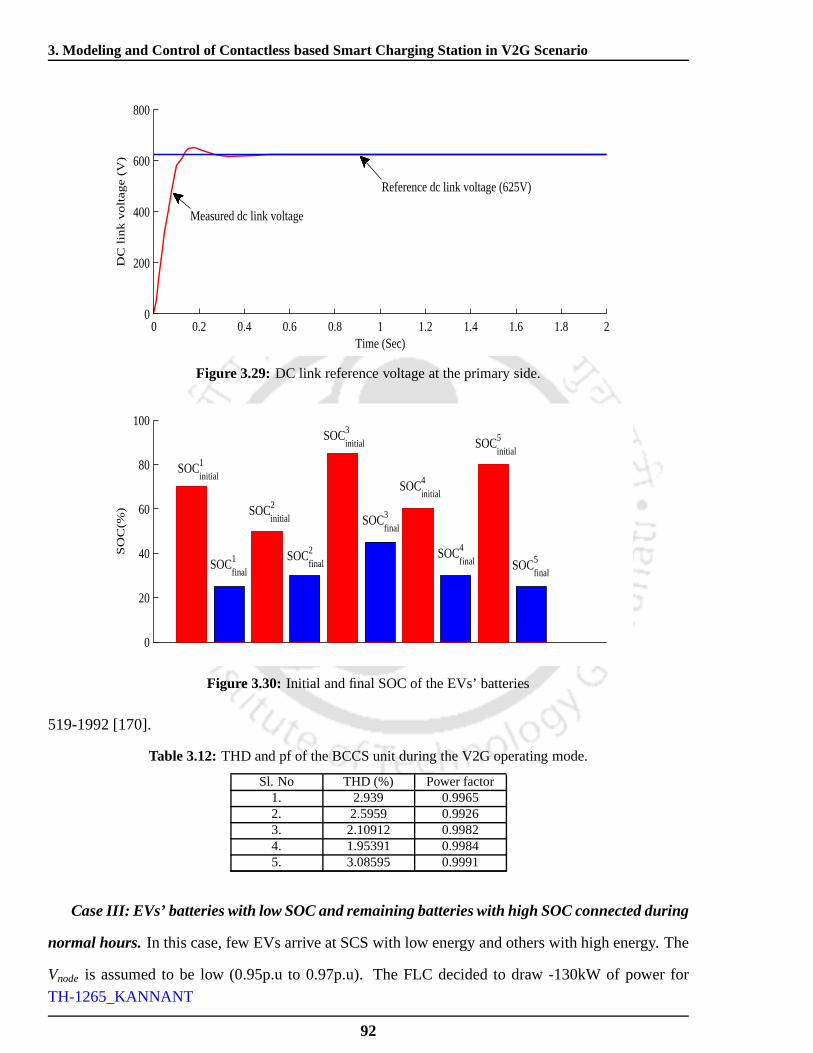
3. Modeling and Control of Contactless based Smart ChargingStation in V2G Scenario
0 0.2 0.4 0.6 0.8 1 1.2 1.4 1.6 1.8 20
200
400
600
800
Time (Sec)
DC
lin
k v
olta
ge
(V
)
Measured dc link voltage
Reference dc link voltage (625V)
Figure 3.29: DC link reference voltage at the primary side.
0
20
40
60
80
100
SO
C(%
)
SOCinitial1
SOCinitial2
SOCfinal2
SOCinitial3
SOCfinal3
SOCinitial4
SOCfinal4
SOCinitial5
SOCfinal5SOC
final1
Figure 3.30: Initial and final SOC of the EVs’ batteries
519-1992 [170].
Table 3.12:THD and pf of the BCCS unit during the V2G operating mode.
Sl. No THD (%) Power factor1. 2.939 0.99652. 2.5959 0.99263. 2.10912 0.99824. 1.95391 0.99845. 3.08595 0.9991
Case III: EVs’ batteries with low SOC and remaining batteries with high SOC connected during
normal hours. In this case, few EVs arrive at SCS with low energy and others with high energy. The
Vnode is assumed to be low (0.95p.u to 0.97p.u). The FLC decided to draw -130kW of power for
92
TH-1265_KANNANT
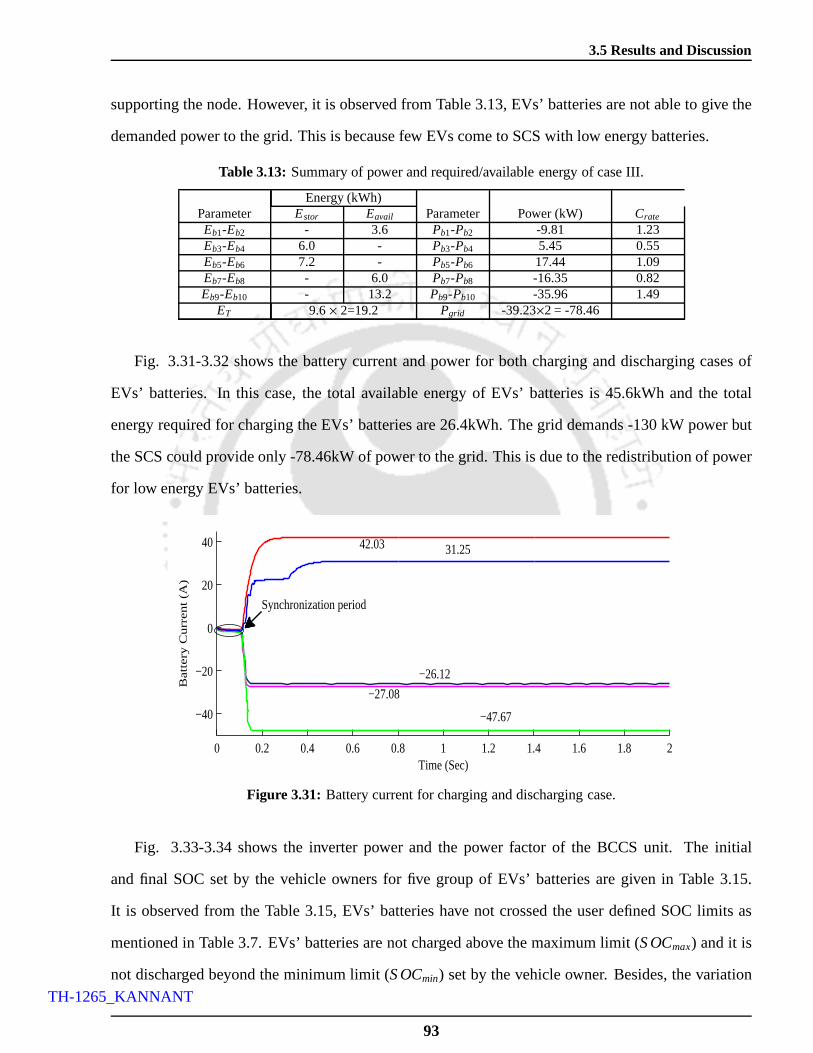
3.5 Results and Discussion
supporting the node. However, it is observed from Table 3.13, EVs’ batteries are not able to give the
demanded power to the grid. This is because few EVs come to SCSwith low energy batteries.
Table 3.13:Summary of power and required/available energy of case III.
Energy (kWh)Parameter Estor Eavail Parameter Power (kW) Crate
Eb1-Eb2 - 3.6 Pb1-Pb2 -9.81 1.23Eb3-Eb4 6.0 - Pb3-Pb4 5.45 0.55Eb5-Eb6 7.2 - Pb5-Pb6 17.44 1.09Eb7-Eb8 - 6.0 Pb7-Pb8 -16.35 0.82Eb9-Eb10 - 13.2 Pb9-Pb10 -35.96 1.49
ET 9.6× 2=19.2 Pgrid -39.23×2 = -78.46
Fig. 3.31-3.32 shows the battery current and power for both charging and discharging cases of
EVs’ batteries. In this case, the total available energy of EVs’ batteries is 45.6kWh and the total
energy required for charging the EVs’ batteries are 26.4kWh. The grid demands -130 kW power but
the SCS could provide only -78.46kW of power to the grid. Thisis due to the redistribution of power
for low energy EVs’ batteries.
0 0.2 0.4 0.6 0.8 1 1.2 1.4 1.6 1.8 2
−40
−20
0
20
40
Time (Sec)
Ba
tte
ry C
urr
en
t (A
)
42.03 31.25
Synchronization period
−47.67
−27.08
−26.12
Figure 3.31: Battery current for charging and discharging case.
Fig. 3.33-3.34 shows the inverter power and the power factorof the BCCS unit. The initial
and final SOC set by the vehicle owners for five group of EVs’ batteries are given in Table 3.15.
It is observed from the Table 3.15, EVs’ batteries have not crossed the user defined SOC limits as
mentioned in Table 3.7. EVs’ batteries are not charged abovethe maximum limit (S OCmax) and it is
not discharged beyond the minimum limit (S OCmin) set by the vehicle owner. Besides, the variation
93
TH-1265_KANNANT

3. Modeling and Control of Contactless based Smart ChargingStation in V2G Scenario
0 0.2 0.4 0.6 0.8 1 1.2 1.4 1.6 1.8 2−30
−20
−10
0
10
20
Time (Sec)
Ba
tte
ry P
ow
er
(kW
)
−23.83
Synchronization period
Figure 3.32: Power supplied/drawn from/to the grid.
in the node voltages are also observed for three cases of the proposed SCS. TheVnode of case I and
case II varies from 1.053 p.u to 1.03 p.u and 0.98 p.u to 1.01 p.u. While, for case III their is only a
marginal variation between 0.95 p.u to 1.05 p.u and 0.96 p.u to 1.03 p.u, respectively.
0 0.2 0.4 0.6 0.8 1 1.2 1.4 1.6 1.8 2−30
−20
−10
0
10
20
Time (Sec)
Po
we
r a
t a
c b
us (
kW
)
Synchronization period
10.83
−6.11−10.29
−22.41
13.02
Figure 3.33: Inverter power at the primary side.
Fig. 3.35 shows the initial and final SOC of EVs’ batteries of this case.
An EV battery of 8kWh with an initial SOC of 20% (S OCcr) starts charging during off-peak hours
and reaches 90%. At 17:00hrs, the node voltage fall below 1p.u and the battery discharges to the grid
in peak hours. At 21:00hrs the battery reaches to 40% SOC. It is observed from the figure, the SOC
of the EV battery increases due to charging of the EV battery (G2V) and SOC level decreases due to
94
TH-1265_KANNANT

3.5 Results and Discussion
0 0.2 0.4 0.6 0.8 1 1.2 1.4 1.6 1.8 20.99
0.992
0.994
0.996
0.998
1
Time (Sec)
Po
we
r fa
cto
r 0.99790.9981
0.99830.9984
0.9961
Figure 3.34: Power factor of BCCS unit.
0
20
40
60
80
100
SO
C(%
)
SOCinitial3
SOCfinal1
SOCinitial2
SOCinitial1
SOCfinal2
SOCfinal3
SOCinitial4
SOCfinal4
SOCinitial5
SOCfinal5
Figure 3.35: Initial and final SOC of the EVs’ batteries
discharging of the EV battery (V2G).
Fig. 3.36 shows the change of SOC against the node voltage variation. An EV battery of 8kWh
with an initial SOC of 20% (S OCcr) starts charging during off-peak hours and reaches 90%. At
17:00hrs, the node voltage fall below 1p.u and the battery discharges to the grid in peak hours. At
21:00hrs the battery reaches to 40% SOC. It is observed from the figure, the SOC of the EV battery
increases due to charging of the EV battery (G2V) and SOC level decreases due to discharging of the
EV battery (V2G). Node voltage variation has been observed for bulk charging and discharging of
EVs.
95
TH-1265_KANNANT

3. Modeling and Control of Contactless based Smart ChargingStation in V2G Scenario
13:00 14:00 15:00 16:00 17:00 18:00 19:00 20:00 21:000
20
40
60
80
100
SO
C (%
)
Time (hrs)
0.98
0.99
1
1.01
1.02
1.03
Vn
od
e (p
.u)
G2V operation
SOCVnode
p.u
V2G operation
Figure 3.36: Changing the SOC level of the EV battery (8kWh, 250V) with respect to theVnode.
The THD and the pf of the BCCS unit for combined G2V and V2G operating mode is give in
Table 3.14. The THD of the BCCS unit is found in the range of 1.88604% to 2.79205% and the pf of
the BCCS unit is found in the range of 0.9961 to 0.9984. The THDand power factors are allowable
as per the IEEE standard 519-1992 [170].
Table 3.14:THD and pf of the BCCS unit during the G2V and V2G operating mode.
Sl. No THD (%) Power factor1. 1.88604 0.9972. 2.01082 0.99613. 2.7486 0.99814. 1.98975 0.99835. 2.79205 0.9984
Table 3.15 shows the summary of the SOC variation of EVs’ batteries. In Case I, the batteries
SOC are increased because the EVs are charging during the off-peak hours. The EVs’ batteries SOC
levels are decreasing in Case II due to grid support. The peakpower demand has been mitigated by
using the EVs as a DESS to supporting the grid. In Case III, theEVs’ batteries are charging as well
as discharging due to low and high SOC level of the EVs’ batteries.
Case IV: Impacts on the Distribution Node. Special case has been consider to analyze the impacts
in the distribution node during the G2V operation. In this case, the BCCS units are not synchroniza-
tion with distribution network which means the power flow from grid to BCCS unit after a random
time interval. Unsynchronized V2G operation has not been considered, as the power flow from EV
96
TH-1265_KANNANT
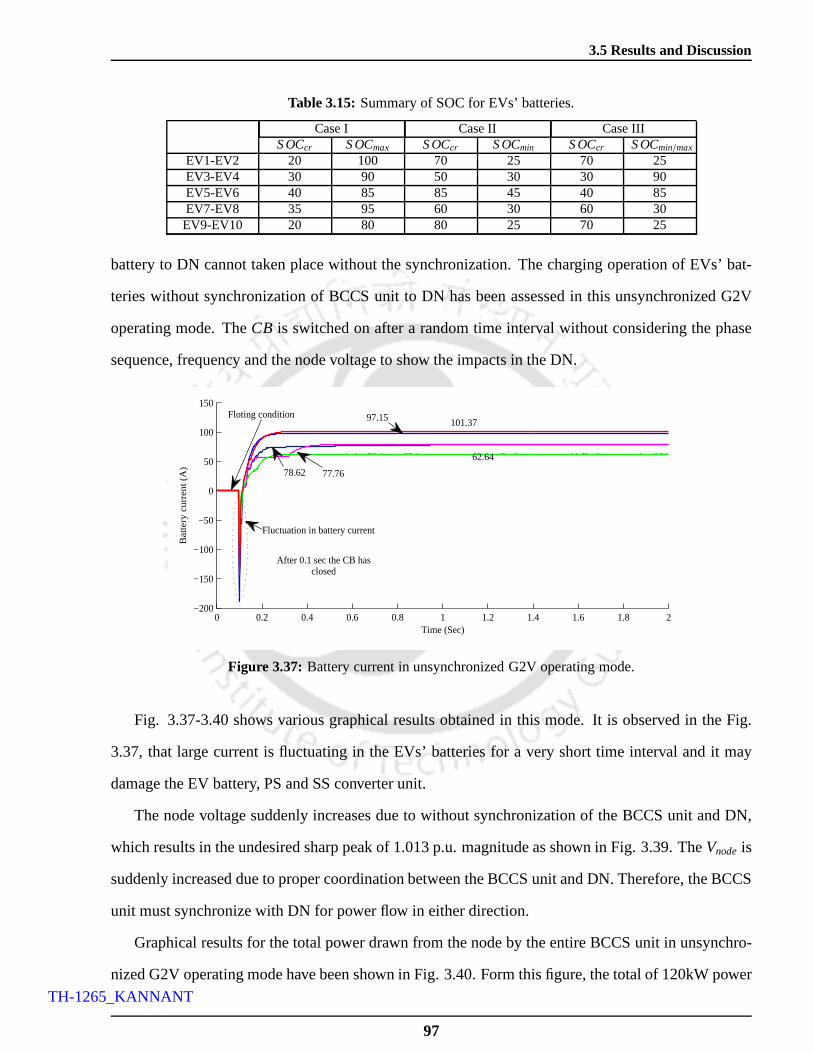
3.5 Results and Discussion
Table 3.15:Summary of SOC for EVs’ batteries.
Case I Case II Case IIIS OCcr S OCmax S OCcr S OCmin S OCcr S OCmin/max
EV1-EV2 20 100 70 25 70 25EV3-EV4 30 90 50 30 30 90EV5-EV6 40 85 85 45 40 85EV7-EV8 35 95 60 30 60 30EV9-EV10 20 80 80 25 70 25
battery to DN cannot taken place without the synchronization. The charging operation of EVs’ bat-
teries without synchronization of BCCS unit to DN has been assessed in this unsynchronized G2V
operating mode. TheCB is switched on after a random time interval without considering the phase
sequence, frequency and the node voltage to show the impactsin the DN.
0 0.2 0.4 0.6 0.8 1 1.2 1.4 1.6 1.8 2−200
−150
−100
−50
0
50
100
150
Time (Sec)
Ba
tte
ry c
urr
en
t (A
) 62.64
97.15
Fluctuation in battery current
Floting condition
78.62 77.76
After 0.1 sec the CB hasclosed
101.37
Figure 3.37: Battery current in unsynchronized G2V operating mode.
Fig. 3.37-3.40 shows various graphical results obtained inthis mode. It is observed in the Fig.
3.37, that large current is fluctuating in the EVs’ batteriesfor a very short time interval and it may
damage the EV battery, PS and SS converter unit.
The node voltage suddenly increases due to without synchronization of the BCCS unit and DN,
which results in the undesired sharp peak of 1.013 p.u. magnitude as shown in Fig. 3.39. TheVnode is
suddenly increased due to proper coordination between the BCCS unit and DN. Therefore, the BCCS
unit must synchronize with DN for power flow in either direction.
Graphical results for the total power drawn from the node by the entire BCCS unit in unsynchro-
nized G2V operating mode have been shown in Fig. 3.40. Form this figure, the total of 120kW power
97
TH-1265_KANNANT

3. Modeling and Control of Contactless based Smart ChargingStation in V2G Scenario
0 0.2 0.4 0.6 0.8 1 1.2 1.4 1.6 1.8 2−50
−40
−30
−20
−10
0
10
20
30
40
Time (Sec)
ac
bu
s p
ow
er
po
we
r (k
W)
15.66
25.63
After 0.1 sec the CB hasclosed
24.29
19.4417.19
Floting condition
Fluctuation in battery power
Figure 3.38: Battery power in unsynchronized G2V operating mode.
0 0.2 0.4 0.6 0.8 1 1.2 1.4 1.6 1.8 20.985
0.99
0.995
1
1.005
1.01
1.015
Time (Sec)
No
de
vo
ltag
e (
V) Fluctuation in
the node voltage
Floting condition
1.0125 p.u
0.986 p.u
Figure 3.39: Node voltage in unsynchronized G2V operating mode.
has been drawn by the node as soon as theCB is switched on, which is settled to 113.7 kW in 0.4
seconds.
It is evident from Fig. 3.37 to Fig. 3.40, the power should flowbetween grid and BCCS unit after
the synchronization of BCCS unit.
Table 3.16 shows the summary of node voltage before and aftersupporting the distribution node.
Table 3.16:Summary of node voltage before and after supporting
Vnode Vnode
Case I 1.05 1.053Case II 0.98 1.01Case III 0.95 - 1.05 0.96 - 1.03
98
TH-1265_KANNANT
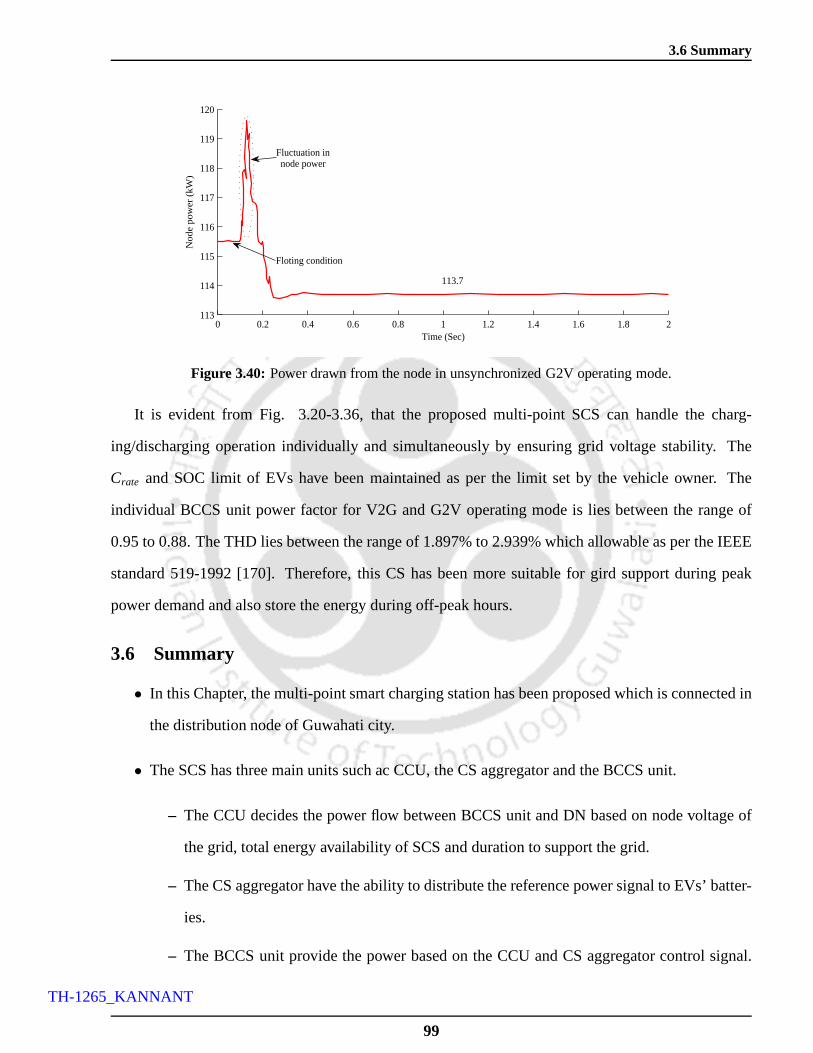
3.6 Summary
0 0.2 0.4 0.6 0.8 1 1.2 1.4 1.6 1.8 2113
114
115
116
117
118
119
120
Time (Sec)
No
de
po
we
r (k
W)
Floting condition
Fluctuation innode power
113.7
Figure 3.40: Power drawn from the node in unsynchronized G2V operating mode.
It is evident from Fig. 3.20-3.36, that the proposed multi-point SCS can handle the charg-
ing/discharging operation individually and simultaneously by ensuring grid voltage stability. The
Crate and SOC limit of EVs have been maintained as per the limit set by the vehicle owner. The
individual BCCS unit power factor for V2G and G2V operating mode is lies between the range of
0.95 to 0.88. The THD lies between the range of 1.897% to 2.939% which allowable as per the IEEE
standard 519-1992 [170]. Therefore, this CS has been more suitable for gird support during peak
power demand and also store the energy during off-peak hours.
3.6 Summary
• In this Chapter, the multi-point smart charging station hasbeen proposed which is connected in
the distribution node of Guwahati city.
• The SCS has three main units such ac CCU, the CS aggregator andthe BCCS unit.
– The CCU decides the power flow between BCCS unit and DN based onnode voltage of
the grid, total energy availability of SCS and duration to support the grid.
– The CS aggregator have the ability to distribute the reference power signal to EVs’ batter-
ies.
– The BCCS unit provide the power based on the CCU and CS aggregator control signal.
99
TH-1265_KANNANT

3. Modeling and Control of Contactless based Smart ChargingStation in V2G Scenario
Further, the BCCS unit has three main units such as primary side, secondary side and
contactless coil.
∗ The primary side and the secondary side, which is separated by an air-gap and is
magnetically coupled to each other. The power is transferred from the primary to the
secondary side through weak or loose magnetic coupling.
∗ Primary and secondary controllers are employed on either side of contactless coil to
control the power flow.
• The BCCS unit modeled has 10 charging points, which is accessible for EVs of different battery
ratings. Each charging points of BCCS unit are designed for amaximum peak power handling
capacity of 50kW.
• The complete multi-point SCS and real-time grid data of Guwahati city has been implemented
in MATLAB Simulink environment.
• The EVs’ batteries are not charged/discharged beyond the SOC limits and maximumCrate de-
fined by the EV owner.
• The SCS has been used for grid support during peak power demand and store the energy during
off-peak hours.
In the next Chapter, the economic burdens (beneficiary calculation) to EVs owners and grid op-
erator while transferring the energy in either direction (from grid to EVs or vice versa) have been
presented. Also, the economics beneficiary calculation hasbeen analyzed based on the capacity loss
in the EVs’ batteries.
Note: This work, Modeling and Control of Contactless based Smart Charging Station in V2G
Scenario has been published in IEEE Transaction on Smart Grid.
100
TH-1265_KANNANT

4Mathematical Modeling For Economic
Evaluation Of Electric Vehicle To Smart GridInteraction
Contents4.1 Introduction . . . . . . . . . . . . . . . . . . . . . . . . . . . . . . . . . . . .. 102
4.2 Capacity Fade/Loss Model . . . . . . . . . . . . . . . . . . . . . . . . . .. . . 104
4.3 Mathematical Model for Economic Evaluation . . . . . . . . . .. . . . . . . . 105
4.4 Electric Vehicle Without Supporting the Grid . . . . . . . . . . . . . . . . . . . 114
4.5 Analysis of Energy Trading Scenario Under Different Charging/DischargingRates . . . . . . . . . . . . . . . . . . . . . . . . . . . . . . . . . . . . . . . . . 115
4.6 Summary . . . . . . . . . . . . . . . . . . . . . . . . . . . . . . . . . . . . . . . 124
101
TH-1265_KANNANT

4. Mathematical Modeling For Economic Evaluation Of Electric Vehicle To Smart Grid Interaction
4.1 Introduction
Conventional internal combustion engine vehicle depends on oil based energy sources. Along with
it, the environmental issue and the regular hike in the fuel price has prompted to look for alternatives.
Electric vehicles have emerged as an alternative to the ICE vehicles [171]. Presently researchers are
trying to integrate the EVs with the recently developed technologies.
The EV’s higher fuel efficiency, lower per km cost, eco-friendly are some of the advantages. EV’s
disadvantages are mainly in the form of limited driving range, higher refueling time (battery recharge
time), higher purchasing cost (due to high cost of the battery), bulky battery size and weight [172].
The EV’s named disadvantages are mainly related to the battery. Numerous research work is being
carried out to neutralize all such battery related problems. Though there is increasing demand for
EVs, but its large scale implementation remains a challenge. EV’s untimely charging pattern will
create a major problem to the grid operators [173,174].
Simultaneous charging of a large number of vehicles can leadto grid instability. This can be
avoided, if the EVs are integrated with the grid. For grid, this will provide an option to minimize peak
power demand [22, 175, 176]. Researchers are evaluating thetechnical feasibility of the scheme and
finding the solutions to the problems [32]. In a different approach, optimal scheduling for charging
and discharging of EVs in V2G scenario has been developed [64]. In V2G scheme, the peak hour
energy supplied by the EV to the grid depends on the battery capacity. The battery capacity represents
the maximum amount of energy that can be extracted from the battery. The battery capacity is affected
by capacity fade (CF) or capacity loss (CL). Capacity fade isdirectly proportional toCr and Dr
[177, 178]. The capacity of the battery also decreases with its usage and with time (due to its self-
reacting chemicals).
Though the above paragraph has established the technical advantages of V2G, but to practically
implement the scheme it has to be checked on the scale of its financial feasibility. The economic
aspects of V2G have been reported in various literatures [77, 179]. Coordinating V2G services for
energy trading has been discussed in [179].
Integrating the EV to the grid results in capacity loss of thebattery, which mainly depends onCr .
This capacity fade results in energy loss. Battery capability is mainly affected due to the CL during
102
TH-1265_KANNANT

4.1 Introduction
V2G interaction [9, 68, 74, 174, 177, 180–184]. This loss is dependent on the chemical structure of
the battery. Hence, this is a characteristic loss which can never be eliminated. The CL results in
financial loss to the EV owners. Also while replacing the battery, its high cost becomes a burden to
the EV owners. For the EV’s to sustain, EV owners should neverlose money specially due to V2G
interaction. The vehicle owners will cooperate with the grid operators only if they are financially
benefited. The grid operators also have some constraints on the amount of money it can charge from
consumers and the amount with which it purchases energy fromthe EV owners [8]. In this work, a
method has been described for the grid to minimize peak hour energy demand by considering the EV
as an distributed storage source. Further the energy transfer between the grid and the EV has been
discussed at differentCr , Dr and some of the important financial results have been analyzed.
The main features of the model have been summarized below:
(i) For the bidirectional flow of energy between the EV and grid, the monetary calculation for per
km transportation becomes complex. This Chapter has made this complex calculation into a
fairly simple calculation using a set of equations.
(ii) As integration of the EVs to the grid is arguably profitable, this work compares the per km
transportation cost for the EV with and without integrationto the grid. It has found that due to
peak hour transfer of energy between the EVs and the grid, theper km cost for the EV integrated
to the grid is higher.
(iii) Capacity loss has been determined for the integrationof the EV’s to the grid. Based on the
capacity loss, all the major financial calculation have beendone, i.e., the economics related to
the capacity loss has been analyzed.
(iv) The capacity losses in the integration of the EVs to the grid for different charge/discharge rate
have been calculated.
This Chapter is organized as follows: Section 4.2 presents the capacity loss model of Li-Ion
battery. The mathematical model for economic evaluation ofthe V2G has been formulated in Section
4.3. In this section the process of bidirectional energy transfer between the EVs and the grid has been
103
TH-1265_KANNANT
4. Mathematical Modeling For Economic Evaluation Of Electric Vehicle To Smart Grid Interaction
identified and analyzed. In section 4.4, a scenario has been analyzed where the EV is not integrated
to the grid. The cost benefit related calculations for energytransferred from grid-to-vehicle (G2V)
and vehicle-to-grid (V2G) are discussed in Section 4.5. In this section the energy flow from V2G and
G2V is analyzed at differentCr andDr . Section 4.6 summary of the present work.
4.2 Capacity Fade/Loss Model
In this section, mathematical model for capacity loss of theEV battery is presented. The electric
equivalent circuit (EEC) for EV battery is given in Fig. 2.3.The EEC model has three parameters:
an open circuit voltage (V0), internal resistances (R1 and R2) and capacitance (C). This model is
used to determine the circuit parameters for differentCr andDr . The battery parameter values are
different for the different charge or discharge rate. The battery parameters are determined using the
measured value of the battery manufacturer’s characteristics data. If the charge or discharge rate is
constant, the electrical equivalent circuit parameters (R1, R2, C andV0) are approximately constant
from 20% SOC to 100% SOC, but changes exponentially from 0% SOC to 20% SOC. This is due
to the electrochemical reaction inside the battery [39]. The variation of small parameters among
the curves for different charge or discharge rate indicate that these parameters are approximately
independent of charge or discharge currents. The mathematical representations forR1, R2, C andV0
under constant current charging conditions are given in Chapter 2, Section 2.2.
The terminal voltage (VCci/dj
) of charging/discharging scenario is given in Eq. (2.5) andEq. (2.6).
The terminal voltage of the battery equivalent circuit depends on the parameters of the polynomial
equation. The quantity of energy stored (Estor) to charge the EV battery depends on the SOC of the
battery which is given in Eq. (2.13). The total processed energy (PEc) for charging scenario is given
in Eq. 2.14. The energy available (Eavail) from the EV battery can be calculated from Eq. (2.15).
The processed energy (PEd) for discharging scenario is given in Eq. 2.16. Using Eq. (2.15) and Eq.
(2.16), the total processed energy (Etotal) of the EV battery is defined as the sum of processed energy
for charge and discharging scenarios.
It should be noted here that the total processed energy is notequal to the energy that can be
processed. The total processed energy is the sum of the energy that has been injected and extracted
104
TH-1265_KANNANT

4.3 Mathematical Model for Economic Evaluation
from the battery. For example, assuming a 20kWh battery, if 5kWh is extracted from it and 5kWh is
injected back into it, then the total processed energy is 10kWh. Whereas the total energy that can be
processed is 40kWh, i.e. if the battery is new and has 100% SOCthen 20kWh can be extracted from
it and once its SOC is 0% then 20kWh can be injected into it.
The amount of energy that can be extracted from the battery orstored in the battery decreases
rapidly due to the CL in the EV battery. The CL mainly depends on total processed energy during
charging/discharging,Cr , Dr and temperature [180].Cr andDr varies with respect to the grid condi-
tion [185]. Therefore, a mathematical model is required to predict the CL at differentCr andDr . The
battery capacity depends on certain specified conditions such asCr , Dr , SOC and temperature [181].
In this work, room temperature has been consider. The mathematical model for CL at differentCr
andDr is given in Eq. (2.28).
4.3 Mathematical Model for Economic Evaluation
Due to the bidirectional energy transfer between the grid and the EV, determination of the amount
of money that the consumers (who uses the EV for transportation) have to pay becomes complex.
Normally, the electricity tariff is based on peak and off-peak hours demand [186]. However, due to
the bidirectional energy transfer, the current tariff structure is not suitable for the immediate future.
Therefore, a model should be formulated such that large scale implementation of EVs does not result
in a complex financial calculation. This section discusses such a possible model for V2G.
4.3.1 Notations
While doing the mathematical modeling we need to define few notations and they are as follows:
• q is the total capacity loss of the EV battery in Ah. Using Eq. (2.28),q can be mathematically
represented as:q =
∑
QClk
(4.1)
4.3.2 Assumptions
The following assumptions have been made.
• Peak hour is that period of the day when the demand for the electrical energy is maximum. On
105
TH-1265_KANNANT

4. Mathematical Modeling For Economic Evaluation Of Electric Vehicle To Smart Grid Interaction
an average, the duration of peak hour is assumed to be13 of the day i.e 8 hours [187]. So the
duration of off-peak hour is 16 hours. Therefore, the total energy consumed by EV in a day can
be mathematically represented as:
Etotal = Epeak+ Eo f f−peak (4.2)
where,Etotal is the total energy consumed in kWh,Epeak is the total energy consumed during
peak hours in kWh andEo f f−peak is the total energy consumed during off-peak hours in kWh.
Using Eq. (4.2), the monetary equivalent of energy consumedcan be represented as:
A = RpeakEpeak+ R′o f f−peakEo f f−peak (4.3)
where,A is the total money to be paid for energy consumption (Rs.), Rpeak is the tariff of energy
during the peak hours ((Rs.)/kWh) andR′o f f−peak is the tariff of energy during the off-peak hours
((Rs.)/kWh).
• EV owners are the proprietor of the EVs. The consumers are thepeople who use the EV for
transportation only. In terms of EV to grid coordination, EVowners are the participants in V2G
and G2V scheme. Consumers are participants only in the G2V scheme.
• When the EV owner uses the EV, the owner itself becomes its customer as it (the EV owner)
pays for the cost incurred for transportation. The EV ownersand the consumers are the different
entity for the same EV.
• Efficiency of the EV battery has been assumed 90%. This lower efficiency is due factors such
as heat, faulty electrical components, etc [188].
• Scheduling of peaks hours power plant is very costly as well as complex. Also the cost of the
battery is very high. So whenever energy is required by the grid, if the EVs supply it then it
gets money. So, it’s economically beneficial for both the EVsand the grid operators.
• For ease of calculation, all the financial and energy transactions are calculated on per day basis.
The sample calculation has been demonstrated in the Appendix E. The next subsection discusses
about the energy required by the EV battery.
106
TH-1265_KANNANT

4.3 Mathematical Model for Economic Evaluation
4.3.3 Energy Required by EV Battery
To supply the energy, the battery has to charge itself (storeenergy). For a battery with 90%
efficiency (assumed), 10% of the energy supplied to it by the grid is always lost. Therefore, 90%
input energy to the battery should be equal to the energy required by the battery. Mathematically, this
can be represented as:
(
90100
)
EGib = Estor
EGib = Estor ×
(
10090
) (4.4)
where,EGib is the input energy to the battery provided by the grid. The grid operators will charge
the EV owners depending upon the total quantity of energy consumed by the battery. Using Eq. (4.3),
the amount paid by EV owner to grid operators is given by the following equation:
APevg= cx+ c′x′ (4.5)
where,APevg is the total amount of money paid by the EV owners to the grid operators during
a complete day,c is the total quantity of energy supplied by the grid to the EV battery during peak
hours,c′ is the total quantity of energy supplied by the grid to the EV battery during the off-peak
hours,x is the tariff paid by EV owner to grid operators per kWh duringpeak hour (Rs.) andx′ is the
tariff paid by EV owner to grid operators per kWh during off-peak hour (Rs.).
Using Eq. (4.5), the total energy supplied by the grid is equal to c+c′. Assuming grid transmission
lines to be lossless, this energy is also the input energy to the battery. Therefore, this energy is equal
to EGib. Mathematically, this can be represented as:
c+ c′ = EGib
⇒ c+ c′ = Estor
0.9
(4.6)
The EV battery has been charged withEGib, the energy that can be extracted from EV battery which
is less thanEstor. Using Eq. (2.15),Eavail is the energy that can be extracted from the EV battery. The
next subsection describes the possible quantity of energy that the EV can supply to the grid during
stress.
107
TH-1265_KANNANT

4. Mathematical Modeling For Economic Evaluation Of Electric Vehicle To Smart Grid Interaction
4.3.4 Peak Hour Energy Supplied to Grid
During the V2G interaction the battery exchanges energy with the grid. This also results in capac-
ity fade. The total capacity loss is calculated using the CFMwhich is mentioned in Eq. (4.1). This
equation provides a easier method to calculate capacity loss.
If the EV has sufficient energy after its transportation use,then only the EV can support the grid.
For a battery with nominal capacityQ, the minimum level up to which the battery is usable for grid
interactions and its daily requirements for transportation purposes isQ3 . The value ofQ3 chosen for
transportation requirements is user defined. It has been chosen so that the initial energy that the EV
can give to the grid, after the losses, is at least 50% of the initial energy that the EVs has extracted
to charge its battery. The EV owner invests in a battery that can store 3 times the energy due to the
following reasons:
• EVs can support the grid during stress.
• To match performance of the conventional vehicles, EVs requires a large battery.
• EVs can sustain itself in sudden requirement of long distance travel. Fuel engine based vehicle
has the option to instantaneously refill itself, at present the EVs does not enjoy such facility.
The EV has remaining energy(
2Q3
)
, which also includes the losses. Mathematically,
Etranspor =Eavail
3(4.7)
Erem =2Eavail
3(4.8)
Eq = k (Erem) =2kEavail
3(4.9)
El = k′ (Erem) =2k′Eavail
3(4.10)
where,Etranspor is the energy used by EV for the transportation purpose,Erem is the energy re-
mained in the system after its usage for the transportation purpose,k is the percentage of energy loss
108
TH-1265_KANNANT

4.3 Mathematical Model for Economic Evaluation
due to CL,k′ is the percentage of energy loss due to other reasons,El is the energy loss due to other
reasons such as faulty circuits, components, etc andEq is the energy lost due to capacity loss. This
CL is due to grid interaction and as well as transportation.
The EVs are available in the parking bay [22, 23], thus can be used for interacting with grid. The
battery energy that can be sold back to grid during peak hours. It is equal to remaining energy in the
EV battery minus losses. Mathematically,
Epos= Erem− Eq − El (4.11)
where,Epos is the possible amount of energy available in the battery that can be sold to the grid.
Substitute Eq. (4.8), Eq. (4.9) and Eq. (4.10) in Eq. (4.11).
Epos=2Eavail
3(
1− k− k′)
(4.12)
It must be noted here that the energy sold by the EV owner to thegrid operators may be different
from the possible amount of energy available in the battery.It is the EV owners who decides and
supplies the amount of energy to the grid. The above scenariois validated with the assumption that
the grid obtains as much peak hour energy as provided to them.The quantity of energy received by
the grid depends on the discharging efficiency of the battery. For a 90% efficient battery (assumed),
the energy obtained by the grid can be mathematically represented as:
Etrans =
(
90100
)
Esup (4.13)
where,Etrans is the actual amount of energy that the grid obtains from the EV and Esup is the
amount of energy supplied by the EV battery to the grid. The supplied energy (Esup) is equal to the
possible energy (Ppos) available for grid support. Therefore, substitute Eq. (4.12) in Eq. (4.13).
Etrans =
(
90100
)
Epos (4.14)
The grid operators pay for the quantity of energy actually received from the EV. Using Eq. (4.3),
the amount paid by the grid operators to EV owner is given by the following mathematical equation:
APgev= sx2+s′x2′ (4.15)
109
TH-1265_KANNANT

4. Mathematical Modeling For Economic Evaluation Of Electric Vehicle To Smart Grid Interaction
where,APgev is the total amount of money paid by the grid operators to the EV owners during a
complete day,s is the total energy obtained by the grid during the peak hours, s′ is the total energy
obtained by the grid during the off-peak hours,x2 is the tariff paid by grid operators to EV owner per
kWh during peak hour energy (Rs.) andx′2 is the tariff paid by grid operators to EV owner per kWh
during off-peak hour energy (Rs.). Using Eq. (4.15), the total energy obtained by the grid is equal to
s+ s′. Mathematically, this can be represented as:
s+ s′ = Etrans
⇒ s+ s′ =(
90100
)
Epos(4.16)
4.3.5 Capacity Loss Compensation
For a battery, charging is the process of accumulation of energy and discharging is the process of
dissipation of energy. The process of charging and discharging for one time completes one battery
life cycle. Due to natural limitations, the usage of a battery is limited to a fixed number of cycles,
after which the battery is of no use to the EV owner. Let,Mdep be the depreciated value of the battery
aftern number of cycles of V2G interaction. The battery is expectedto lastn′ number of cycles. The
average per unit cost of the battery in terms of number of V2G cycle is Mn′ . So aftern number of V2G
interactions, the depreciated value is given by the following mathematical equation:
Mdep=nn′
M (4.17)
where,M is the initial cost of the battery andMdep is the depreciated value of the battery aftern
number of cycles. The energy loss (Eq) due to capacity loss is estimated by running the iteration of
CL modeln times and assuming that onlyEp amount of energy is being exchanged from the battery.
This is an additional loss to the EV owners. Therefore, they should be compensated for this loss.
The sum of compensation money charged by the EV owners shouldbe greater than or equal to the
monetary equivalent of the energy lost due to degradation ofcapacity of the battery. This will ensure
that the EV owners are beneficiary participants. Mathematically,
Cm ≥ Me (4.18)
110
TH-1265_KANNANT

4.3 Mathematical Model for Economic Evaluation
where,Cm is the compensation money for energy loss andMe is the money equivalent of the
capacity lost. The capacity loss mainly depends on the number of cycles of V2G interaction and the
energy associated with it [180]. In this work, the SOC limit has been assumed from 20% SOC to 100%
SOC for charging scenario and 100% SOC to 20% SOC for discharging scenario. If the SOC limit is
interrupted, then the amount of energy processed for charging and discharging scenarios will change.
As the capacity losses also depends on the processed energy for charging and discharging scenario,
the capacity losses will have different value if the SOC limit is interrupted. The compensation money
is calculated using the above mentioned factors. Mathematically, it can be denoted as:
Cm ∝ nPEc/d
orCm = znPEc/d
(4.19)
where,z is the compensation money charged by the EV owners for capacity loss andPEc/d is
the processed energy for charging (PEc) and discharging (PEc) scenarios. With time and usage, the
battery does not provide the energy it had provided in the very first cycle. This generates a loss of
energy as well as loss of money. Therefore, the capacity lossshould be compensated. As capacity
loss is a permanent loss, it can only be compensated in terms of money. Hence, the capacity loss is
compensated, then the financial losses for the EV owner are taken care off. The maximum energy
available from the battery isEavail. So the cost of per unit of battery isMEavail. This per unit battery
cost is true only when the total energy can be used. For transportation purpose, the maximum energy
that the battery can use is up toEavail
3 . The remaining energy is2Eavail
3 , which also includes the losses
(capacity and other loss). The capacity loss depends on the number of cycles of V2G interaction, soz
is calculated using the depreciated value of the battery. Therefore, the per unit energy cost which also
includes the losses of the battery isMdep2Eavail
3
. Hence, the monetary equivalent of the capacity loss of the
battery can be mathematically represented as:
Me =3Mdep
2EavailEq (4.20)
Using Eq. (4.17) to Eq. (4.20) the above condition is formulated as:
nzPEc/d ≥3Mdep
2EavailEq (4.21)
111
TH-1265_KANNANT

4. Mathematical Modeling For Economic Evaluation Of Electric Vehicle To Smart Grid Interaction
z≥3MdepEq
2EavailnPEc/d(4.22)
Using Eq. (4.21) and Eq. (4.22), the value ofzcan be determined. It should be noted that the EV’s
CL is due to grid support during peak hour. Therefore, gird operators provide compensation money to
EV owners for capacity loss. Eventually the grid recover this cost from the consumers while selling
the energy in peak hours. The next subsection presents the amount of money that has to be paid by
the grid operators (for peak hour energy) to the EV owners.
4.3.6 Determination of Tariff for Grid Operators
The high cost of battery (M) and the capacity loss of the battery are the major financial liabilities
to the EV owners. For EV owners, these liabilities can be attributed as losses. Mathematically,
Tloss= z+ Mdep (4.23)
where,Tloss is the total losses to the EV owners during V2G interaction. The total cost price of
energy for the EV owners is the sum of the money paid to the gridoperators to charge the EV battery
and the loss incurred during V2G interaction. Mathematically,
APcp = APevg+ Tloss
= APevg+ z+ Mdep
⇒ APcp = cx+ c′x′ + z+(
nMn′
)
(4.24)
where,APcp is net cost price of the energy for the EV owners. In Eq. (4.24), z andMdep are de-
pendent on the full battery discharge. It may take days or months or years for the battery to discharge
completely. Therefore, Eq. (4.24) has to be normalized. Mathematically,
Acp = cx+ c′x′ +z+ nM
n′
Dn(4.25)
where,Dn is the number of days the battery takes to depreciate its value to zero. D′ can be
mathematically represented as
Dn =n′
n′′(4.26)
112
TH-1265_KANNANT
4.3 Mathematical Model for Economic Evaluation
where,n′ is the maximum number of cycles that the battery can charge/discharge in its life span
(this value is fixed by the manufacturer) andn′′ is the average number of cycles of daily G2V inter-
action. From the economic point of view, this cost price has to be raised by selling energy to the grid
operators. Mathematically,APcp = APgev
⇒ cx+ c′x′ +z+ nM
n′Dn= sx2+s′x2
′ (4.27)
EV owners to get profit, tariff paid by grid operators to EV owner per kWh during peak hour (x2)
should be greater than tariff paid by EV owner to grid per kWh during peak hour (x) and tariff paid by
grid operators to EV owner per kWh during off-peak hour (x′2) greater than tariff paid by EV owner
to grid per kWh during off-peak hour (x′). Mathematically,
x2 ≥ xx2′ ≥ x′
(4.28)
The cost of per kWh energy charged by the EV during selling is more than the money it had paid to
buy the energy. The cost charge by the EV also includes the battery cost and the capacity loss. As the
result EV always gains money, whenever they sell energy to the grid. While the cost of battery is very
high, but participation of EVs in V2G can be safely assumed. To meet the peak hour demand, the grid
may install extra generators. Functioning of these generators are very economically costly and also
very complex. So buying energy from the EVs to meet the peak hour energy demand is economical
more beneficial for the grid. So by participating the EV owners also can obtain the battery cost from
the grid. So this is also beneficial for the EV owners. The nextsubsection determines the amount the
consumers (passengers) have to pay for EV transportation service.
4.3.7 Determination of Tariff for Consumers
The grid had supplied energy(
Estor
0.9
)
to the EV. The EV pays for it and the grid operators obtain its
cost price. When the EV sells back the energy(
0.9Esup
)
to the grid, the EV gets its money including its
battery price. So if the consumers pay for(
0.9Esup
)
, then the total quantity of energy exchanged during
the complete process is financially accounted. Using Eq. (4.3), the amount paid by the consumers to
grid operators is given by the following mathematical equation:
Acg= sx1+s′x1′ (4.29)
where,Acg is the total amount of money paid by the consumers to the grid operators during a complete
113
TH-1265_KANNANT

4. Mathematical Modeling For Economic Evaluation Of Electric Vehicle To Smart Grid Interaction
day,x1 is the tariff paid by consumers to grid operators per kWh peakhour energy (Rs.) andx′1 is the
tariff paid by consumers to grid operators per kWh off-peak hour energy (Rs.).
Grid operators to get profit, tariff paid by consumers to gridoperators per kWh peak hour energy
(x′1) greater than tariff paid by grid operators to EV owner per kWh during peak hour (x2) and tariff
paid by consumers to grid operators per kWh during off-peak hour (x′1) greater than tariff paid by grid
operators to EV owner per kWh during off-peak hour (x′2 ). Mathematically,
x1 ≥ x2
x1′ ≥ x2
′ (4.30)
The next section presents the scenario where EV uses its complete energy for transportation with-
out supporting the grid.
4.4 Electric Vehicle Without Supporting the Grid
This section presents the scenario where EV is not supporting the grid during peak hours. The
EV uses its complete energy for transportation. An EV with a battery of 80% SOC, nominal capacity
100 Ah, constant terminal voltage 400 V and 90% efficiency hasbeen considered in this Section. The
capacity of the battery for the complete life cycle for differentCr andDr is shown in Fig. 4.1.
0 500 1000 1500 2000 2500 3000 3500 4000 45000
20
40
60
80
100
Cycle
Ca
pa
city
(A
h)
1C
2C
3C
Figure 4.1: Capacity loss for a 40 kWh battery without grid-interaction.
The critical level (or value) has been chosen based on the battery capacity. When the battery
capacity is reduced to 46.65 Ah, the corresponding cycle number is called critical value. Using Eq.
(4.4) and Eq. (4.5), the financial parameters are calculatedand are listed in Table 4.1. It is observed
that the average per km transportation cost for 1Cr-1Dr to 3Cr-3Dr is almost same. This is due to the
114
TH-1265_KANNANT

4.5 Analysis of Energy Trading Scenario Under Different Charging/Discharging Rates
fact that the per unit battery cost is almost same for all theCr-Dr .
Table 4.1: Average financial value for a normal EV
1Cr -1Dr 2Cr -2Dr 3Cr -3Dr
Battery reaches itscritical level
2664th cycle 2461th cycle 2352th cycle
Consumer pay toGrid (Rs.)
254.84 264.13 269.78
Cost/Per km (Rs.) 1.13 1.17 1.20
The next section presents the cost benefit related calculations for a model where EV is supporting
the grid during peak hour. This section discusses the financial aspects of V2G and G2V.
4.5 Analysis of Energy Trading Scenario Under Different Charging/DischargingRates
Among the present types of batteries, Li-ion battery has a low self-discharging rate. Also Li-ion
battery has better energy density, long durability, low cost and intrinsic safety when compared to
other battery types [189]. Therefore, Li-ion battery has been considered for this model. Nowadays
the Li-ion battery is widely used in the EV. Generally the EV uses battery which ranges from 20kWh
to 55kWh [190,191]. In this work, a 40 kWh battery system has been considered.
For a 40 kWh battery system, the voltage and current associated with it must be high. With high
current, theI2R loss increases. Therefore, a nominal value of current is desired to minimize this loss.
For the present work, a battery with nominal capacity 100 Ah and constant terminal voltage of 400 V
is considered [192].
The total CL is mathematically calculated using Eq. (4.1). At present, the parameters required
in Eq. (4.1) are not available for the required battery. Hence, the parameters of a chosen battery
are theoretically (by simulation) expanded to meet the desired condition. Here a SONY 18650 US
battery has been used to produce the required data. It shouldbe noted that the battery parameters and
its associated characteristics varies with respect to the type of battery and its manufacturer.
Assuming SOC of the battery to be 80%, the maximum energy thatcan be extracted from the
battery is 32 kWh. After complete discharge, the battery hasto be charged with 32 kWh of energy.
Out of this, 10.67 kWh (32kWh3 ) is used for transportation and 21.33 kWh (2
3(32kWh)) is the remained
energy that can be used for grid support. This 21.33 kWh also includes the losses. The energy
115
TH-1265_KANNANT

4. Mathematical Modeling For Economic Evaluation Of Electric Vehicle To Smart Grid Interaction
required for EV’s transportation is constant, but the energy supplied by the EV to grid during peak
hour decreases as capacity of the battery decreases. Mathematically,
Estor = 32kWhErem =
23 (32kWh) = 21.33kWh
Erem =23 (32kWh) = 21.33kWh
(4.31)
The CL of the battery results in its lower energy storing capability. The battery can be used till it
supplies sufficient energy for EV’s transportation. Therefore, the battery is useful till it can store and
supply 10.66 kWh. Hence, the useful energy that the battery supplies for supporting the grid is 21.34
kWh (32 kWh - 10.66 kWh). The constant terminal voltage is 400V. Therefore, the useful nominal
capacity range is 53.35 Ah (21.34 kWh/400 V). Hence, the battery is useful till its nominal capacity
has reached 46.65 Ah (100 Ah - 53.35 Ah). Thei th cycle, until which the battery is useful, is said to
be the critical point of the battery. In this model,n is the critical point and it is the maximum number
of cycle of possible G2V and V2G interaction.
0 500 1000 1500 2000 2500 3000 350030
40
50
60
70
80
90
100
Cycle
Ca
pa
city
(A
h)
Energy losses due togrid interaction and
transportation
n = 2081
Energy losses due togrid interaction
Energy losses dueto transportation
Figure 4.2: Capacity loss for 53.33 kWh energy interactions of a 40 kWh battery (1Cr /1Dr ).
The capacity of the battery during the complete life cycle under differentCr andDr are shown
in Fig. 4.2 to Fig. 4.4. The graphs are expectedly similarly decreasing in nature, as it represent
the capacity of the battery. This decreasing in the capacityis due to the capacity loss. The graphs
obtained are linear in nature. It has been claimed by some of the manufacturers that the capacity loss
are linear in nature. In this work the capacity loss are calculated using base values (data) provided
116
TH-1265_KANNANT

4.5 Analysis of Energy Trading Scenario Under Different Charging/Discharging Rates
by the manufacturers. In the above graph the only differencelies in the number of cycles required
to reach the critical value (n). As the CL is directly proportional to theCr andDr , higherCr or Dr
degrades the battery very quickly. This can be seen in Fig. 4.2 to Fig. 4.4. While 3Cr-3Dr takes 2041
cycles to reach its critical state, 2Cr-2Dr takes 2544 cycles and 1Cr-1Dr takes 2801 cycles to reach its
respective critical state.
0 500 1000 1500 2000 2500 3000 350030
40
50
60
70
80
90
100
Cycle
Ca
pa
city
(A
h)
Energy losses dueto transportation
Energy losses due togrid interaction
Energy losses due togrid interaction and
transportation
n = 2544
Figure 4.3: Capacity loss for 53.33 kWh energy interactions of a 40 kWh battery (2Cr /2Dr ).
To calculate the monetary equivalent of the energy losses, the cost of the battery is required. The
optimum cost of a high energy Li-ion battery is approximatedto be 7,500 (Rs.)/kWh, so the total cost
of purchasing the 40 kWh battery, (M) comes out to be 3,00,000 (Rs.) [193].
0 500 1000 1500 2000 2500 3000 350020
30
40
50
60
70
80
90
100
Cycle
Ca
pa
city
(A
h)
Energy losses due togrid interaction
Energy losses dueto transportation
n = 2044
Energy losses due togrid interaction and
transportation
Figure 4.4: Capacity loss for 53.33 kWh energy interactions of a 40 kWh battery (3Cr /3Dr ).
117
TH-1265_KANNANT

4. Mathematical Modeling For Economic Evaluation Of Electric Vehicle To Smart Grid Interaction
For mathematical calculation, certain parameters are assumed and they are as follows:
• The EV charge their battery during the off-peak hours. UsingEq. (4.6),c = 0 andc′ = Estor
0.9 .
• The EV supports the grid during peak hours. Using Eq. (4.16),s= 0.9Esup ands′ = 0
• The peak rate of energy consumption (xi) is assumed to be 40% higher than the off-peak con-
sumption rate (x′i ). xi= 1.4(xi′)
• The off-peak hour electrical tariff in Assam, India is 4 (Rs.)/kWh [8]. During charging, the EVs
are consumer to the Grid. Therefore,x = 5.6 (Rs.) andx′ = 4 (Rs.).
• The EV will charge itself during the off-peak hours and support the grid in the peak hours. This
process will take a complete day. Therefore, the average number of daily grid interactions can
be assumed to be 1. Mathematically it will represent asn′′ = 1.
• Using Eq. (4.26), the number of days, required by the batteryto completely discharge is shown
below: Dn =n′
n′′ =n′
1 = n′
• An EV with 40kWh battery is expected to give a mileage of 225 kmper charge [194].
• Let the profit percentage bep. Using Eq. (4.30),x1 can be mathematically represented as:
x1 = x2
(
1+p
100
)
(4.32)
In this modelp has been assumed to be 0.1% such thatx1 remains as low as possible.
Using Eq. (2.15), Eq. (2.17), Eq. (4.7) - Eq. (4.10), Eq. (4.17) and Eq. (4.24), the compensation
money for capacity loss for 1Cr-1Dr , 2Cr-2Dr and 3Cr-3Dr is shown in Fig. 4.5. The compensation
money is highest for 3Cr-3Dr , when the battery discharges comparatively faster than 1Cr-1Dr and
2Cr-2Dr . This is due to the fact that per cycle battery cost is highestin 3Cr-3Dr . So, 3Cr-3Dr is the
favorable case for the EV owners. It can be observed from the graph that thez is lower than expected.
With capacity loss the ratioMdep
Eavailincreases, but the ratioEq
Epdecreases very quickly, asEp increases
with each cycle. Alson in the denominator further normalizes the compensation money. These factors
contribute to the low compensation money for capacity loss.In the work, the total processed energy
118
TH-1265_KANNANT

4.5 Analysis of Energy Trading Scenario Under Different Charging/Discharging Rates
has been considered for calculating the compensation moneyfor capacity losses. This can be replaced
by the processed energy during discharging process, whenever required.
0 500 1000 1500 2000 2500 30000
0.2
0.4
0.6
0.8
1
1.2
1.4
1.6
1.8
2
Cycle
Co
mp
en
satio
n m
on
ey
(IN
R)
2C
1C
3C
Figure 4.5: Compensation money charged by the EV owners for capacity loss of the battery.
Using Eq. (4.11) and Eq. (4.14) the net energy obtained by thegrid during V2G interaction is
shown in Fig. 4.6. Maximum energy is transferred during the first cycle and least during the last. The
per cycle average transferred energy is same for 1Cr-1Dr , 2Cr-2Dr and 3Cr-3Dr . As n is more for
1Cr-1Dr , maximum quantity of energy is transferred in this case. Hence, 1Cr-1Dr is the most useful
case for the grid as it gets the maximum possible energy.
0 500 1000 1500 2000 2500 30000
2
4
6
8
10
12
14
16
18
20
Cycle
En
erg
y (k
Wh
)
1C
2C
3C
Figure 4.6: Energy obtained by the grid in kWh during V2G interaction.
Using Eq. (4.21), Eq. (4.26) and Eq. (4.27), the tariff paid by grid operators to EV owner per kWh
energy (x2) is shown in Fig. 4.7.x2 is linearly increasing upto 1401 cycles. Therefore, only the linear
part ofx2 has been shown in the graph. Since the EV deals in money only with the grid operators, this
119
TH-1265_KANNANT
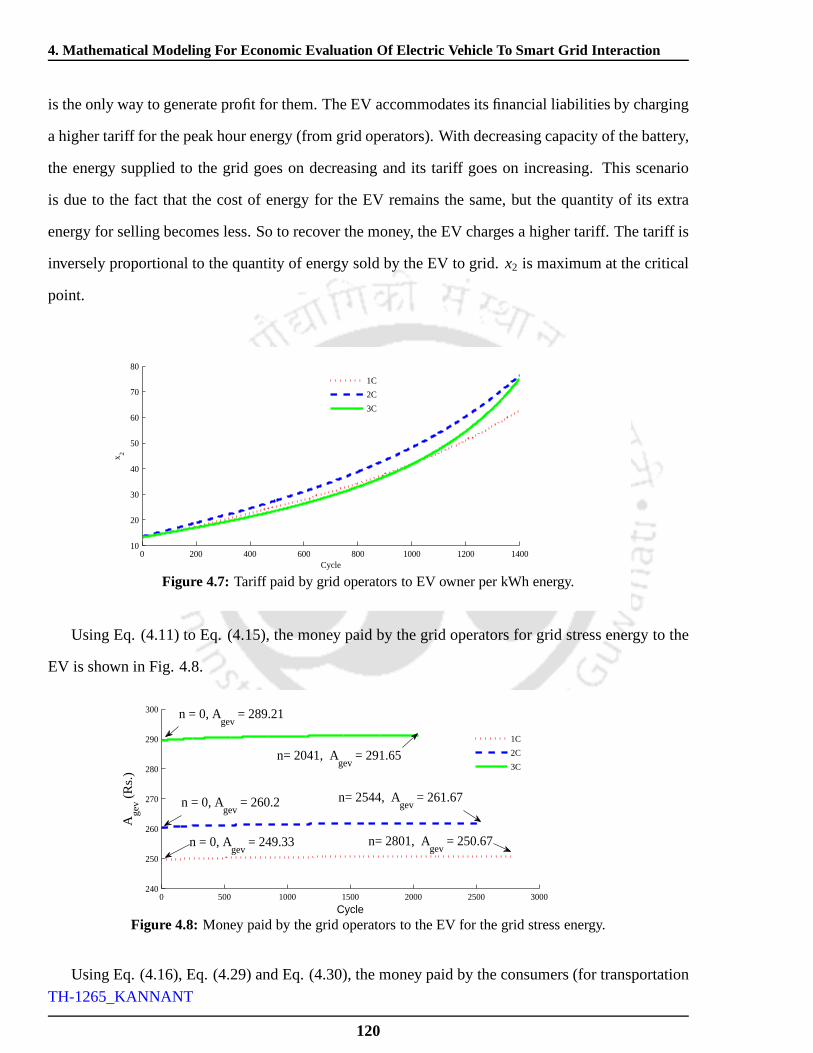
4. Mathematical Modeling For Economic Evaluation Of Electric Vehicle To Smart Grid Interaction
is the only way to generate profit for them. The EV accommodates its financial liabilities by charging
a higher tariff for the peak hour energy (from grid operators). With decreasing capacity of the battery,
the energy supplied to the grid goes on decreasing and its tariff goes on increasing. This scenario
is due to the fact that the cost of energy for the EV remains thesame, but the quantity of its extra
energy for selling becomes less. So to recover the money, theEV charges a higher tariff. The tariff is
inversely proportional to the quantity of energy sold by theEV to grid. x2 is maximum at the critical
point.
0 200 400 600 800 1000 1200 140010
20
30
40
50
60
70
80
Cycle
x 2
1C
2C
3C
Figure 4.7: Tariff paid by grid operators to EV owner per kWh energy.
Using Eq. (4.11) to Eq. (4.15), the money paid by the grid operators for grid stress energy to the
EV is shown in Fig. 4.8.
0 500 1000 1500 2000 2500 3000240
250
260
270
280
290
300
Cycle
Ag
ev (
Rs.
)
1C
2C
3C
n = 0, Agev
= 289.21
n = 0, Agev
= 260.2
n = 0, Agev
= 249.33 n= 2801, Agev
= 250.67
n= 2544, Agev
= 261.67
n= 2041, Agev
= 291.65
Figure 4.8: Money paid by the grid operators to the EV for the grid stress energy.
Using Eq. (4.16), Eq. (4.29) and Eq. (4.30), the money paid bythe consumers (for transportation
120
TH-1265_KANNANT

4.5 Analysis of Energy Trading Scenario Under Different Charging/Discharging Rates
usage) to the grid operators is shown in Fig. 4.9.
0 500 1000 1500 2000 2500 3000240
250
260
270
280
290
300
Cycle
Acg
(R
s.)
1C
2C
3C
n = 0, Acg
= 289.5
n = 0, Acg
= 260.46
n= 2041, Acg
= 291.34
n= 2544, Acg
= 261.93
n = 0, Acg
= 249.58 n= 2801, Acg
= 250.92
Figure 4.9: Money paid by the consumers to the grid operators for the energy used by EV for transportation.
As the variation in the compensation money for the CL is very low,Apgev andAcg is almost constant
for the complete battery cycles. The money paid in 1Cr-1Dr in both cases is lower when compared to
2Cr-2Dr and 3Cr-3Dr . This is due to the fact that in 1Cr-1Dr the per cycle battery cost is lower when
compared to 2Cr-2Dr and 3Cr-3Dr . Hence, the average cost price of energy for the EV is lower in
1Cr-1Dr .
The grid operators and the EV should benefit for their service. For the EV owners, cost price is
the money paid for obtaining the energy to recharge the battery and revenue is the money obtained by
providing grid services. Mathematically, the EV’s profit and grid operators’s profit can be denoted as:
pro f it = revenue− costprice (4.33)
EVpro f it = APgev− APcp (4.34)
For the grid operators, cost price is the money paid for obtaining the energy from the power
generation set-up and the EV owners (during grid stress) andrevenue is the money they obtain from
the EV owners (charging the EV) and the consumers (transportation).
Gridpro f it = APcg + APevg− APgev− APcpg (4.35)
where,APcpg is the cost price of the energy which is sold by the grid operators to the EV. Using
Eq. (4.15), Eq. (4.25), Eq. (4.26) and Eq. (4.30), the profit gained by the EV is shown in Fig. 4.10.
121
TH-1265_KANNANT

4. Mathematical Modeling For Economic Evaluation Of Electric Vehicle To Smart Grid Interaction
0 500 1000 1500 2000 2500 30000
0.2
0.4
0.6
0.8
1
1.2
1.4
1.6
1.8
2
Cycle
EV
pro
fit (
Rs.
)
1C
2C
3C
Figure 4.10: Profit Obtained by EV per day for transportation and V2G interaction.
Using Eq. (4.5), Eq. (4.15) and Eq. (4.29), the profit gained by the grid operators is shown in Fig.
4.11.
0 500 1000 1500 2000 2500 30000.24
0.25
0.26
0.27
0.28
0.29
0.3
Cycle
Grid
Pro
fit (
Rs.
)
1C
2C
3C
n = 0, Pg = 0.289
n= 2041, Pg = 0.291
n = 0, Pg = 0.26
n = 0, Pg = 0.249
n= 2544, Pg = 0.262
n= 2801, Pg = 0.251
Figure 4.11: Profit obtained by the grid operators per day in V2G interaction.
While EV profit increases with battery cycle, grid operators’ profit is almost constant for the
complete battery cycle. This is due to the fact that while theEV owners receives the compensation
money for the CL, the grid operators does not receives any such financial benefits. Also the profit
gained in both the cases are extremely small. The profits can be desirably increased by manipulating
x2. Here the least possible value ofx2 was considered such that the consumers had to pay the least
possible amount. when compared 3Cr-3Dr proves to be a better option for the EV owners and the
grid operators. In this model the battery has been assumed toreach its zero depreciated value when
its capacity reaches 10.66 kWh or 46.65 (Ah). In reality thisbattery can again be used for different
122
TH-1265_KANNANT

4.5 Analysis of Energy Trading Scenario Under Different Charging/Discharging Rates
purposes. So this depreciated battery is also worth money which varies locally. This turns to be added
profit to the EV owners. Also the consumers pays for the energyduring grid stress. So this energy is
available to the grid as zero cost energy, which it sells to get an extra profit.
Using the above data (Fig. 4.5 to Fig. 4.11) the average values of the parameters are listed in
Table 4.2. It is observed that the money paid by the EV to the grid operators is same for 1Cr-1Dr ,
2Cr-2Dr and 3Cr-3Dr . Ideally the EV should be penalized for fast charging. Any penalty for the EV
will result in a higher tariff for the grid operators, which will force the consumers to pay more. To
avoid financial burden to the consumers, the EVs are not penalized. Table 4.2 also shows the cost
per km for differentCr andDr . 1Cr-1Dr is the most favorable case for consumers. Also, it can be
seen that the average energy required during grid stress is 5.41 kWh and the EV uses 10.66 kWh of
energy for transportation. So the passengers (consumers) pays for 50.75% of the net energy used for
transportation. This will prompt the consumers to willingly pay for the grid support energy.
Table 4.2: Average values of the financial and energy transaction.
1Cr - 1Dr 2Cr - 2Dr 3Cr - 3Dr
Battery reaches its critical level 2801th cycle 2544th cycle 2041th cyclezmin (Rs.) 0.97 1.06 1.32
Energy obtained by Grid (kWh) 5.41 5.41 5.41Ap
gev (Rs.) 250.54 261.52 290.82Aveg (Rs.) 142.223 142.223 142.223Acg (Rs.) 250.30 261.12 290.53x2 (Rs.) 46.31 48.36 53.73
EV profit (Rs.) 0.97 1.12 1.32Grid profit (Rs.) 0.25 0.26 0.29
Cost/Per km (Rs.) 3.34 3.49 3.88
Using Table 4.1 and Table 4.2, it can be seen that the EV supporting the grid during peak hour has
a higher average per km transportation cost when compared toan EV, which is not supporting with
the grid. But still integration of the EV with the grid is moreuseful, as stated by the following points:
• It supports the grid when required.
• The consumers pays for almost half the energy (it had used fortransportation) at an escalated
price. With technology development this price is expected to be lower.
With technological development, this is also going to be financially beneficiary. Also in grid
supporting scheme, only one-third of the total energy is used for transportation. In the other scheme,
123
TH-1265_KANNANT
4. Mathematical Modeling For Economic Evaluation Of Electric Vehicle To Smart Grid Interaction
all the energy was utilized for transportation. This is the main cause for the higher per km cost of
transportation for the EV integrated with the grid. Integration of the EV with the grid is desired, as
this will enable an option for grid support when required.
4.6 Summary
• In this Chapter, a mathematical model for economic evaluation of EV to grid interaction taking
into account the capacity fading/losses of EV battery is presented.
• The economic evaluation of the bidirectional energy transfer from V2G and G2V was formu-
lated.
• The bidirectional energy transfer between EV battery and grid has been discussed at different
charge and discharge rate.
• The capacity wear (loss) model was used to study the performance of battery during V2G
interaction.
• The energy transfer between EV battery and grid, the money exchanged among the grid and
EV owners was determined such that all are benefitted.
• The objective of this work is to determine the optimal cost ofelectricity so that both,the grid
and the EVs owner are beneficiary.
In the next chapter, conclusions of the present work and the motivation of future research based
on the grid support during the peak power demand and store theenergy during the off-peak hours
have been presented.
Note: This work, Mathematical Modeling for Economic Evaluation of Electric Vehicle To Smart
Grid Interaction has been published in IEEE Transaction on Smart Grid.
124
TH-1265_KANNANT

5Conclusion and Future Works
Contents5.1 Summary of the Present Work . . . . . . . . . . . . . . . . . . . . . . . . .. . 126
5.2 Complete V2G System and Control Architecture . . . . . . . . .. . . . . . . . 127
5.3 Contributions of the Present Work . . . . . . . . . . . . . . . . . . .. . . . . . 128
5.4 Scope for Future Research . . . . . . . . . . . . . . . . . . . . . . . . . .. . . 130
125
TH-1265_KANNANT

5. Conclusion and Future Works
5.1 Summary of the Present Work
The objective of the work presented in this thesis is to mitigate the peak power demand and
store the excess amount of energy in EVs’ batteries during peak and off-peak hours. To address this
issue, electrical equivalent circuit based mathematical model for EVs’ batteries has been developed,
which estimate the performance characteristics of EVs’ batteries. The validation of the model has
been carried out by comparing the simulated results with thereal-time battery data obtained from
four manufacturers’ data sheets. Further, an SCS has been developed based on the battery model
and fuzzy logic controllers, which control the power flow between EVs’ batteries and grid. Also, this
thesis focuses to predict the capacity fade at different charge and discharge rate and beneficiary model
of EVs owners and grid operator for vehicle-to-grid interaction.
In Chapter 2, an accurate electric circuit based BM and CFM has been proposed. The BM pa-
rameters are extracted by using genetic algorithm. The developed BM and CFM performance char-
acteristics are compared with battery manufacturers’ catalogue such as voltage, power, energy, total
processed energy and capacity fade. Four different batterymanufacturers’ data are used for validating
the result. The proposed battery and capacity fade models are simple and it accurately represents the
charge and discharge curves of the manufacturers’ data sheets. The simulated values of capacity fade
were found to be in good agreement with the manufacturers’ data at different cycle numbers.
The multi-point SCS has been proposed in Chapter 3. The SCS has three main units: CCU,
the CS aggregator and the BCCS unit. The CCU together with theCS aggregator has the ability
to decide and distribute the power flow between EVs’ batteries and the grid. Thus, this approach
does not require extensive off-line optimization or driving pattern, except the real-time information
of grid and the EVs’ batteries. The BCCS unit modeled has 10 charging points, which is accessible
for EVs of different battery ratings. Each charging point ofBCCS unit is designed for a maximum
peak power handling capacity of 50kW. The complete multi-point SCS is verified with a real-time
grid data of Guwahati city. The control algorithm proposed in this work considers the limits preferred
by EV battery owner regarding the battery;S OCcr andCrate. It is observed that EVs’ batteries are
not charged/discharged beyond the SOC limit and maximumCrate prescribed by the EV owner, which
proves the effectiveness of the proposed system.
126
TH-1265_KANNANT
5.2 Complete V2G System and Control Architecture
In the last part of this thesis work, a mathematical modelingfor economic evaluation of the
vehicle-to-grid has been presented. During the peak hour, grid requires extra energy to fulfill the
energy demand. The EVs would supply energy to the grid duringpeak hour and recharge itself during
the off-peak hour. This will enable the EVs to act as a distributed energy source. Hence, a mathemat-
ical model has been developed for economic evaluation of thebidirectional energy transfer between
EVs and grid. The bidirectional energy transfer has been discussed at different charge/discharge rate.
The CFM model has been used to study the performance of the EV battery during vehicle-to-grid
interaction. The total energy exchanged between the grid and the vehicle has been analyzed. On the
basis of energy transfer, the money exchanged among the grid, EV and the consumers (EV users) has
been determined such that all are benefited. In Chapter 4, a financial model for integrating the vehicle
into the grid has been developed. This model can be used in anygiven scenario of the vehicle-to-grid
interactions.
In all the works presented in this thesis, fuzzy based smart charging station has been implemented
for the peak power shaving and valley filling. To analyze the energy transfer between EV battery
and grid, an EEC based mathematical model for EV battery has been developed. This battery model
predicts the charge and discharge rate characteristic of the EV battery and capacity losses at different
charge and discharge rate. Moreover, an economic beneficiary model has been developed for EV
battery and grid operator. This mathematical model can estimate the optimal cost required to charge
the EV battery during the off-peak hours and support the gridduring the peak hours.
5.2 Complete V2G System and Control Architecture
In this thesis, Chapter 2 discusses about the electric equivalent circuit based mathematical model
of EVs’ batteries. This Chapter, GA is used to extract the battery parameters and gives optimum value.
TheCr andDr characteristics are calculated using the parameters of theBM which are obtained from
the GA and it compared with the different types of battery manufacturers’ data. The results from BM
and data given by the different types of battery manufacturers’ are in good agreement.
In Chapter 3, discuss about the multi-point BCCS unit present in a SCS connected with the DN of
the grid by using the developed battery model. A multi-pointBCCS unit has various charging points,
which are accessible to multiple EVs.
127
TH-1265_KANNANT

5. Conclusion and Future Works
In this thesis, Chapter 4 discusses about the economical beneficiary calculation for EVs owners,
grid operators and consumers. This chapter lacks discussion about the per km cost for consumers,
beneficiary cost for EVs’ owners and grid operators based on the energy transfer between EVs’ and
grid.
It has been observed that, each Chapter of this thesis presented a real time implementation of
battery modeling, coordination of multiple EVs in the SCS tomitigate peak power demand during
peak and off-peak hours and economic evaluation based on theenergy transfer between EVs’ batteries
and the grid. If, all the works of V2G presented in this thesisis combined together, the complete
system can solve the peak power demand of the distribution node as well as maintain the voltage
profile of the grid throughout a day. The complete V2G system along with the control architecture is
shown in Fig. 5.1.
Energy
Estimation
Distribution
Node
Central Control
UnitCS Aggregator
EVs Ownersinputs
Display the Cost
ac bus
Duration
Economic Model
Power Flow
Control signal
information
Charging StationSmart
Pb1 Pbn
Vnode
ET
Pgrid
ET
Ebn
Eb1
Energy,Cr andDr
Batteryinformation
Figure 5.1: Complete V2G system along with the control architecture.
5.3 Contributions of the Present Work
The important contribution of this research work reported in this thesis is the implementation of
the SCS for EVs’ batteries based on the fuzzy logic controller. The main contributions are given
below:
128
TH-1265_KANNANT

5.3 Contributions of the Present Work
(i) An EEC based mathematical model (battery model) has beendeveloped for EVs’ batteries to
analysis the performance (charge or discharge rate) characteristics.
(ii) Polynomial equation with exponential function is formulated to represent the EEC parameters,
this is because of battery performance characteristics areexponentially increasing or decreasing
nature.
(iii) GA has been used to optimize the BM polynomial coefficient.
(iv) Capacity fade model has been developed based on theS OCcr/DODcr, Cr /Dr and processed
energy for charging/discharging scenario.
(v) A closed-loop control algorithm has been developed, which can estimate the charge rate, charg-
ing time andS OCcr for charging scenario and discharge rate, discharging timeandDODcr for
discharging scenario.
(vi) User defined charge/discharge rate, SOC/DOD limits areconsidered while developing the BM.
Moreover, the closed-loop control logics are not allowed tocharge/discharge beyond the user
defined charge/discharge rate and SOC/DOD limits.
(vii) An FLC based SCS has been developed to mitigate the peakpower demand and store the excess
amount of energy in the ESS.
(viii) FLC based CCU has been used to control the total power flow between grid and SCS.
(ix) An aggregator has been designed for SCS which coordinate multiple EVs present in the SCS
and distribute the reference power signal to each EV batterybased on the updated values of the
energy status of each individual EV battery, total energy availability of the SCS and total power
generated from CCU.
(x) Bidirectional converter and inverter are used to transfer the power in either direction.
(xi) Contactless charging systems are used due to elimination of direct electric contacts, heating of
the sockets, burning of cables, risk of fire and electrical injuries.
129
TH-1265_KANNANT

5. Conclusion and Future Works
(xii) An FLC based control techniques are developed for bidirectional converter and inverter, which
can control the battery charging current, maintain constant dc-link voltage and power angle.
(xiii) FLC based synchronization controller has been used to synchronize the BCCS unit with grid.
(xiv) Mathematical model for economic evaluation of energytransfer between EVs’ batteries and
grid has been developed, which can estimate the financial benefit for EV owners, grid operators
and consumers.
5.4 Scope for Future Research
In this section some important scope for future research work is presented.
(i) The battery parameters are optimized with less number ofpolynomial coefficients.
(ii) A general battery model can be developed for other typesof batteries (lead acid, lithium-ion
and alkaline battery, etc.) based on the manufacturer’s data.
(iii) An optimization method can be developed to predict thepre-exponential and adjustable factor
at different charge and discharge rate.
(iv) The implementation of reactive power control for voltage regulation can be studied to analyze
the impacts in the distribution system.
(v) Multi SCS has to be modeled for BCCS unit, which can supply/inject the active or reactive or
both active and reactive power for voltage regulation. Thismulti SCS can be connected in the
multi node of the Guwahati city distribution system. This methodology would solve the peak
power demand of city.
(vi) The power transfer between grid and EVs battery can be studied by using the DC bus which
has to be placed between the three-phase ac to dc and dc to high-frequency ac conversion.
In this case, the synchronization time gets reduces becausethe BCCS unit having only one
bidirectional converter.
130
TH-1265_KANNANT

5.4 Scope for Future Research
(vii) The integration of both renewable-energy source and EV battery can be implemented in the
SCS. The impact of the distribution node due to interaction of RES and EVs’ can also be
analyzed.
(viii) The effect of the coupling variations (misalignments of the coil or changes in the dimensions
of the air gap) in contactless coil can also be analyzed.
(ix) A suitable FLC based controller can be designed for the misalignment of primary and secondary
side coil. This controller maintains the voltage constant with respect of the misalignments in
the coils by controlling the resonant frequency of the system.
(x) The economic evaluation model for V2G interaction can also be developed by using the driving
pattern of EVs. This will be more accurate and convincing forbeneficiary calculation of EV
owners and grid operators.
131
TH-1265_KANNANT

5. Conclusion and Future Works
132
TH-1265_KANNANT

ABattery Sample Calculation, Initial
Population and Solution Set
133
TH-1265_KANNANT

A. Battery Sample Calculation, Initial Population and Solution Set
A.1 Sample Calculation for Battery Model
In this section, the detail calculation forCr , S OCcr, PEc, Etotal, etc. during charging the battery
has been shown. Similarly, the values can be calculate for discharging scenario.
A.1.1 Current SOC (S OCcr) and Charge rate (Cr) Calculation
The example of Chapter 2 has taken and the following values are considered for sample calcula-
tion: Battery type - EIG,Q=8, S OCini=70, Ic=1, VCc100=2.2723,S OCini=100,S OCmin=0,VC
dj=2.1596,
Ts=37 andClmtr =8.
The calculated value ofCcrtr is given in Eq. (A.1).
Cr = Ccrtr =
88= 1 (A.1)
The EIG battery calculated values oftc andS OCcr is given in Eq. (A.2) - Eq. (A.3).
tc =
(
(3600× 8) −(
70100
)
× 3600× 8)
8+ (37− 36)= 1081 (A.2)
S OCcr = 70+
(
8× (1081− 1045)8× 3600
)
= 70.01 (A.3)
Similarly, td, DODcr, Dr andId can obtained by using Eq. (2.6) - Eq. (2.16).
A.1.2 Battery Power and Processed Energy
ThePc andPd for charging and discharging scenario is given in Eq. (A.4).
Pc = 2.2723× 8 = 18.1784Pd = 2.1596× 8 = 17.2768
(A.4)
The amount of stored and available energy during charging and discharging process at 70% of
S OCcr andDODcr is given in Eq. (A.6).
Estor = 2.2723× 8×(
70−69100
)
= 0.18184
Eavail = 2.1596× 8×(
70−69100
)
= 0.172552 (A.5)
The processed energy for charging and discharging case is calculated form Fig. A.1
PEc = 17.8942PEd = 17.4297
(A.6)
134
TH-1265_KANNANT

A.2 Capacity Fade Model
0 50 100 60 80 1000
2
4
6
8
10
12
14
16
18
State of charge (%)
E stor
(Wh)
Calculated
0 50 100 60 80 1002
4
6
8
10
12
14
16
18
Depth of discharge (%)
E avai
l (Wh)
Calculated
PEd =Σ E
avail=17.4297PE
c =Σ E
stor=17.8942
Figure A.1: Process energy for charging and discharging scenario at 1Cr and 1Dr .
The total processed energy is calculated by substitute the values ofPEc andPEd in Eq. 2.17.
Etotal = (17.8942+ 17.4297)= 35.3239 (A.7)
A.2 Capacity Fade Model
A sample calculation of the capacity fade at different charge and discharge rate is given in Eq.
(A.8).
QClk= 0.09051× exp
(
− 24.9872×0.000073×17.8942×8×1×0.78.01499×298.16
)
+7.8995× exp(
− 24.9872×7.9812−4×8×17.4297×1×0.78.01499×298.16
)
QClk=7.8936 (A.8)
where, 24.9872 is the dimensional analysis constant. The capacity fade characteristic is optimized
by the fitness function (F′(x)). The F′(x) is maximized, when the difference betweenQMlk
andQClk
capacity loss is minimized. The value ofF′(x) is given in Eq. (A.9), wheren=1,∑
QMl1
is 7.9998.
F′(x) =1
1+ (7.9998− 7.8936)= 0.903996 (A.9)
A.3 Genetic Algorithm
To solve the battery parameter extraction problem, the optimum solution set process typically in-
volves modeling of the system, objective function for the optimization problem which give optimal
solution. The objective function to be minimized may be non-convex and have several local minima
values. Then, a global optimization method is needed to prevent the local minimum. Therefore, in the
recent years, there has been a great deal of interest in developing methods for solving global optimiza-
tion problems. A Genetic Algorithm (GA) is used for solving the parameter extraction problem which
135
TH-1265_KANNANT

A. Battery Sample Calculation, Initial Population and Solution Set
gives the global optimum values. The population is the main element of GA and the genetic operators
such as reproduction, crossover and mutation are manipulating the population for next generation if
the system is not optimized. The final optimal solution has a ”close to optimal” solution set.
A.3.1 Initial Population
The first step in GA is to generate random number of initial population with having upper (xUi =
163.835) and lower (xLi = 0) boundary. In this problem, the population size has been taken as matrix
size of 300× 465. The length of the each string is 15 which are given in Table A.1. Then, the string
should be decoded by using the Eq. (2.20).
Example, let take first string from Table A.1ami ,n=110000110101000
S1 = 20(0)+ 21(0)+ 22(0)+ 23(1)+ 24(0)+ 25(1)+ 26(0)+ 27(1)+ 28(1)+ 29(0)+ 210(0)+ 211(0)+
212(0)+ 213(1)+ 214(1)
S1 = 0+ 0+ 0+ 8+ 0+ 32+ 0+ 128+ 256+ 0+ 0+ 0+ 0+ 8192+ 16384
S1 = 25000
Then, the decoded values should convert into real values. The corresponding real of theS1 is given
below:
a1 = aiL+
aiU−ai
L
2l−1 × Si
a1 = 0+ 163.835−032767 × 25000
a1 = 125
The initial value os the polynomial coefficienta1 is 125.00 which is given in Table A.2. Let take
second string from Table A.1:
ami ,n = 000100110001011
S1 = 20(1)+ 21(1)+ 22(0)+ 23(1)+ 24(0)+ 25(0)+ 26(0)+ 27(1)+ 28(1)+ 29(0)+ 210(0)+ 211(1)+
212(0)+ 213(0)+ 214(0)
S1 = 0+ 0+ 0+ 8+ 0+ 32+ 0+ 128+ 256+ 0+ 0+ 0+ 0+ 8192+ 16384
S1 = 2443
Then, the decoded values should convert into real values. The corresponding real of theS1 is given
below:
136
TH-1265_KANNANT

A.4 Polynomial Coefficients (a1 − a31)
a2 = 0+ 163.835−032767 × 2443
a2 = 12.215
The initial value os the polynomial coefficienta2 is 12.22 which is given in Table A.2. Similarly, the
corresponding real values is calculated for remaining values of the Table A.1.
A.4 Polynomial Coefficients (a1 − a31)
The performance characteristics of the battery model depends on the parameters (R1,R2,C and
V0) of the electrical equivalent circuit. The battery parameters is obtained based on the optimized
value of the polynomial coefficients (a1 − a31). The initial polynomial coefficients are given in Table
A.2 which is calculated from Eq. (2.21).
A.5 Battery Parameters
A simple electric equivalent circuit based BM has shown in Fig. 2.3, which consists open-circuit
voltage (V0) with a series resistance (R1) and the parallel resistance and capacitance (R2C) circuit
as shown in Fig. 2.3. Ideally, the battery model parameters are dependent on multi-variable func-
tions like SOC, DOD,Cr , Dr , temperature and cycle number. The parametersV0,R1 with parallel
R2C characterizes the usable capacity, instantaneous voltagedrop and self discharge energy loss. The
R2C network in the model is similar to that in Thevenin based model, which simulates the transient
response. The battery parameters’R1,R2,V0 andC have an exponential nature [194] and are repre-
sented as a function ofS OC, DOD, Cr andDr for charging and discharging scenarios in terms of
polynomial equations. Therefore, the general polynomial equation for denoting the battery charge
and discharge rate characteristics has given in Eq. (2.1) - Eq. (2.6).
Thus,R1,R2, C andV0 are represented in terms of polynomial equations using coefficients from
a1 to a31. The detailed extraction method to find the polynomial coefficient is based on GA based
optimization approach. The optimized polynomial coefficients for EIG battery by using GA is shown
in Table A.3. Similarly, the battery parameters of SONYUS18650, PANASONIC and SANYO at
differentCr andDr also can extract from GA.
137
TH-1265_KANNANT

A. Battery Sample Calculation, Initial Population and Solution Set
Table A.1: Initial population matrix
Initial population froma1 to a8String -a1 String -a2 String -a3 String -a4 String -a29 String -a30 String -a31
1 110000110101000 000100110001011 111100010001000 101001101100110 . . . 111001000001111 101111111011100 0100111011101112 111110011111000 011000011110001 011000011111100 011100011101111 . . . 000010111100011 001111111101001 1110111111000103 111001001100101 011011110011000 010111100001010 001001111010011 . . . 111110110100101 001101010010101 0110110110001004 110010101011101 101111110110101 101111101100100 100011100011010 . . . 001010100011011 011000010110011 1110010010001005 000000100110111 111111001000111 001011010100000 110011110110110 . . . 011000000001111 011000101111111 1100110011011116 011011101000100 001010110101000 000011011000000 010111000101011 . . . 011010100111110 110010011010001 0010101011000007 111010111000100 011000100001101 010011010010100 111110001000100 . . . 000011101011100 111000101100001 1000100011000108 101010000011010 000010110001111 101001011111100 100101100100010 . . . 000010111100101 011110110110000 0001000010100009 001011110010011 011100110011010 001001100101010 100111110100001 . . . 000101000011010 011101010111001 10010110010101110 001000000100011 000111101100111 010000001011011 110000001111011 . . . 001010010101010 001011001001100 10000101011111111 010101101100010 110111000100000 001000011101101 011100100010111 . . . 101010010011001 000011101011110 01100010111111012 110101110010100 111101000101011 101000101001111 110111111001111 . . . 111111011111111 011000100001101 01001001010001113 111110101011001 111000010010100 011100111110000 111000010100110 . . . 001101100000100 001110101001111 00001000001111114 100111111100101 101001001001110 001000010001110 101101001010100 . . . 011000100111100 100101111001001 01010011100000115 001000111001001 110111001000110 100010111100000 100000000010010 . . . 100011000010111 101101001111010 00011111001110016 101110000100001 111001100110000 000100110010101 110011101101011 . . . 001110000001000 011101100111011 10111110011010017 000100101001011 011100010110000 100010000101010 100001101111101 . . . 010000011000100 011111001001110 10011111100011118 011111110101110 010010010110011 111110110110010 001001111100001 . . . 110111100110100 001101001111001 00010001011111119 010101101100011 110111000100000 001000011101101 011100100010111 . . . 000111111001001 001010010001101 11000110100101120 111010011111111 101100111001000 011010100100010 011000011000100 . . . 101010010011001 000011101011110 01100010111111021 011000010100110 110111001000100 110110110000010 110001010011011 . . . 101100011001100 000011100110100 01110010000100022 101100000110001 101110100100111 101001010010010 111010001001000 . . . 000110111011001 101010000011101 10011011100111023 100111011010011 010011010001000 001111010010100 111001011011100 . . . 110111011101111 001011101001101 00110000011000124 110001010000011 100000100110110 001111000111010 011111011100101 . . . 010001010111101 110011000110101 00011000100110125 000110111110100 000000011000001 011001110011011 010100001001110 . . . 010100101001011 101000000000111 10100100010101126 110101110010100 111101000101011 101000101001111 110111111001111 . . . 111111011111111 011000100001101 01001001010001127 101110101010110 101001100011011 111101010011000 111111010100111 . . . 110000001101100 010110010101000 10111100111100128 111100100011001 110111111011111 101001111101011 010111001001001 . . . 110101010101001 101010110000001 11010000111001029 010111001001110 001000001011001 101101001100001 010011101100111 . . . 000100101010011 000010101011110 01111111101000130 110111110011110 101001100001110 010011101100011 111000111001100 . . . 011010111101011 010010110100111 11100001111101031 011100011111101 000011110001100 100010110000111 111011001100100 . . . 110000001001001 101000010100011 10001010011110032 111111110111001 111000111111100 100001111000001 001011100111110 . . . 100111001010001 101000001001000 11000000001000133 101110010000100 001000110001100 111011001111000 100011101101111 . . . 101001010101101 000011110010000 11100000100100034 001111010101010 001010001000000 001010110001001 010110001010110 . . . 000101011000111 101110001010010 11101101001110035 011101100111100 001111000010100 011010101100011 001101111010011 . . . 001111100011110 001001010111110 10010100001100136 101010100011000 001010111000000 001110100001011 101111110011000 . . . 010001111001010 100010011001001 00111010110000037 001100011111111 001010001101010 011101101101111 101000110100100 . . . 000011001111110 100010110110000 01100110110110138 000011110000001 000101001110100 001011010000111 011010010001001 . . . 011000000001110 001011010100111 01101000111010039 010111111000111 110001001110110 010010000111100 111001111111000 . . . 100001110100111 101110110010010 00011011011110140 100001110100110 111011110111101 101010111001100 001101100101101 . . . 010101101101010 110111110111111 101110111000110
.
.
.
.
.
.
.
.
.
.
.
.
.
.
.
.
.
.
.
.
.
265 000110110110010 010110111001010 001001111001111 010010111100001 . . . 010011010010110 010111001011010 111100100111101266 100110000001011 111100011110111 010010011011100 000010101010101 . . . 101100101110001 111010110011011 011111010111111267 111001101011011 001101110010101 000100011111111 110101111010010 . . . 111111101001110 110110000101011 110100100101000268 001100010111100 010001010001101 010000001000100 000001011011000 . . . 010100110001101 111111101110001 001011111101001269 010011111000110 011100000100001 011111100100111 010100101110000 . . . 100100101011101 011000000110101 110000111011000270 010000110100001 111010110101010 111001100010111 010110011110100 . . . 110001011100111 010010011100000 101110110011010271 011011110011001 111110100011111 111101001011101 001011001010111 . . . 001110011011111 001111011000101 001001111100001272 111101100011001 000100011001101 011110010100011 000110111000011 . . . 010011101010010 011011000010101 010110011000010273 010111110001101 011101011001110 110100001010111 011011010000001 . . . 000001111001010 100010010001101 001110101100000274 011101100111100 001111000010100 011010101100011 001101111010011 . . . 011100010000011 111000110001100 110011100111111275 000110011001111 011001011100110 011101000111111 101011100011101 . . . 001010010101010 011011001001100 100001010111111276 001000000100011 000111101100101 010000001001011 110000001111011 . . . 000000011100100 011111000100000 110010110100011277 111001101011011 001101110010101 000100011111111 110101111010010 . . . 010100110001101 111111101110001 001011111101001278 100100000011011 110111010101010 110110111011101 100100100100011 . . . 000100100100100 101111001110000 101101110110000279 001000000100110 001010111001001 111111101011011 001000100010110 . . . 001000101101110 000101010000011 011111100001111280 110110101000001 000000010101110 111101110011101 110000001001101 . . . 111001000001111 101111111101001 111011111100010281 110000110101000 000100110001011 111100010001000 101001101100110 . . . 000011001111110 100010110110000 011001101101101282 000011110000001 000101001110100 001011010000111 100000110100100 . . . 010100110001101 111111101110001 001011111101001283 111001101011011 001101110010101 000100011111111 110101111010010 . . . 111110000101010 100010010010111 001100000001101284 110000001101110 101110100000111 110000010010101 110010001000100 . . . 001000000000101 111000010100001 110111110001111285 010001010100001 101011001010011 010110101101101 101010001110001 . . . 011000000001110 001011010100111 011010001110100286 001100011111111 001010001101010 011101101101111 011010010001001 . . . 011000000001111 011000101111111 110011001101111287 011011101000100 001010110101000 000011011000000 010111000101011 . . . 100011000010111 101101001111010 000111110011100288 101110001100001 111001100110000 000100111100000 100000000010010 . . . 010001010111101 110011000110101 000110001001101289 110001010000011 100000100110110 001111000111010 011111011100101 . . . 001101110001001 110101001101000 000101110101011290 110000001101110 101100010111110 011111010001100 000000110110000 . . . 000111101101000 001010000000110 010110100011111291 110100110110001 001001010000100 010011111100101 100100010010111 . . . 000111111001001 001110010001101 110001101001011292 111010011111111 101100111001000 011010100100010 011000011000100 . . . 011010111101011 010010110100111 111000011111010293 010111001001110 001000001011001 101101001100011 111000111001100 . . . 100001010100111 101110110010010 000110110000110294 010111111000111 110001001110110 010010000111100 111001111111000 . . . 110100111000011 100011110111111 100111110001100295 100000101000110 010101000011101 010101011000100 111011110110111 . . . 001111100011110 001001010111110 100101000011001296 101010100011000 001010111000010 001110100001011 101111110011000 . . . 110111100110100 011111001001110 100111111000111297 011111110101110 010010010110011 111110110110010 011001111100001 . . . 010001111001010 100010011001101 001110101100000298 011101100111100 001111000010100 011010101100011 001101111010011 . . . 011110100000011 001000000111000 100010001001100299 110011100100010 000011111001010 100000111010101 011000101101101 . . . 101100011001100 000011100110100 011100100001000300 101100000110001 101110100100111 101001010010010 111010001001000 . . . 101100011001100 000011100110100 011100100001000
138
TH-1265_KANNANT

A.5 Battery Parameters
Table A.2: Initial set of polynomial coefficients
Initial solution seta1 a2 a3 a4 a5 a6 a7 a25 a26 a27 a28 a29 a30 a31
1 125 12.215 154.28 106.75 38.665 145.19 66.18 . . . 146.04 34.61 43.37 38.69 146 122.7 50.5152 159.96 62.645 62.7 72.875 65.535 18.245 75.46 . . . 136.42 12.965 97.46 39 7.535 40.845 153.453 146.43 71.16 60.21 25.375 132.07 163.6 96.795 . . . 64.115 120.3 6.355 43.52 160.83 34.025 70.14 129.75 122.51 122.1 91.01 36.24 151.36 105.74 . . . 151.49 88.205 155.33 54.885 27.015 62.335 146.265 1.555 161.64 28.96 132.75 135.48 71.2 69.67 . . . 33.955 74.68 129.91 132.21 61.515 63.355 131.126 70.74 27.72 8.64 59.095 11.86 103.88 22.335 . . . 32.825 156 133.05 58.475 68.15 129.05 27.367 150.74 62.785 49.38 159.06 103.13 47.755 30.795 . . . 97.33 110.54 127.37 135.93 9.42 145.13 87.538 107.65 7.115 106.22 96.17 0.03 46.16 134.45 . . . 91.47 161.5 156.63 142.13 7.545 78.96 10.649 30.175 73.73 24.53 101.93 28.55 58.005 121.88 . . . 6.12 29.705 55.15 61.785 12.93 75.165 96.21510 20.655 19.715 41.415 123.5 100.68 135.94 52.65 . . . 112.04 11.58 84.5 74.975 26.45 28.54 85.43511 55.53 140.96 21.665 73.075 25.56 139.81 63.74 . . . 23.145 76.35 87.085 96.085 108.29 9.43 63.3512 137.7 156.38 104.08 143.12 58.17 80.43 90.18 . . . 126.19 69.71 8.12 29.19 162.56 62.785 46.89513 160.45 144.1 74.16 144.19 95.44 9.77 16.16 . . . 152.68 117.39 37.505 61.545 34.58 37.515 5.27514 102.27 105.35 21.19 115.62 44.61 95.03 106.3 . . . 94.765 146.27 143.34 159.23 63.02 97.005 53.44515 22.765 141.15 89.44 82.01 47.525 2.545 19.795 . . . 5.955 152.25 39.48 15.485 89.715 115.81 19.9816 117.93 147.44 12.265 132.38 37.3 135.73 39.81 . . . 108.76 49.415 105.92 104.7 35.88 75.815 121.8617 11.895 72.56 87.25 86.385 21.325 103.86 132.8 . . . 1.71 136.54 2.825 30.285 41.94 79.75 102.1218 81.51 46.975 160.89 25.445 30.715 148.37 31.59 . . . 125.1 11.025 90.255 60.365 142.34 33.885 11.19519 55.535 140.96 21.665 73.075 25.56 139.81 63.74 . . . 10.89574.215 89.055 109.83 20.205 26.305 127.120 149.76 114.92 68.01 62.42 24.575 71.965 130.29 . . . 23.145 76.35 87.085 96.085 108.29 9.43 63.3521 62.27 141.14 140.17 126.22 7.3 29.12 159.51 . . . 126.52 117.04 103.93 100.17 113.66 9.22 7322 112.89 119.24 105.69 148.84 116.84 50.555 18.985 . . . 15.81 122.66 87.27 36.25 17.725 107.67 99.5923 100.9 49.32 39.14 147.02 142.23 69.955 81.32 . . . 79.465 68.21 95.155 115.69 142 29.825 30.96524 126.1 83.47 38.69 80.505 15.255 162.7 7.72 . . . 131.89 115.95 98.9 5.12 44.465 130.83 15.74525 17.86 0.965 66.055 51.59 36.25 110.11 133.44 . . . 74.615 5.245 80.08 79.19 52.855 102.44 105.1826 137.7 156.38 104.08 143.12 58.17 80.43 82.5 . . . 126.18 69.71 8.08 29.19 162.56 62.785 46.89527 119.47 106.38 156.92 162.12 118.02 32.045 29.285 . . . 61.265 71.65 53.04 84.73 123.42 57.16 120.9328 155.01 143.2 107.42 59.245 141.58 60.465 40.25 . . . 153.05 6.355 25.435 31.555 136.53 109.45 133.6929 59.27 20.925 115.69 50.435 29.665 125.14 115.96 . . . 128.7 27.27 128.75 41.495 11.935 6.87 81.68530 142.87 106.31 50.415 145.66 40.43 23.245 151.24 . . . 138.78 107.54 5.46 117.67 69.015 48.195 144.6131 72.945 9.66 88.995 151.54 105.9 133.11 36.47 . . . 66.495 123.83 109.67 55.68 123.25 103.22 88.6232 163.49 145.9 86.725 29.75 129.32 124.29 160.56 . . . 97.28 115.67 33.015 122.86 100.25 102.76 122.9733 118.42 22.46 151.64 91.435 90.18 161.97 8.36 . . . 33.765 24.965 51.72 91.68 105.83 9.68 143.7234 39.25 25.92 27.565 56.75 24.695 93.57 56.205 . . . 57.785 162.31 132.02 40.845 13.795 118.17 151.8235 75.82 38.5 68.335 35.615 122.55 19.935 85.22 . . . 68.105 103.92 115.9 54.405 39.83 23.99 94.84536 108.92 27.84 37.175 122.36 35.345 92.9 55.43 . . . 104.36 57.695 15.45 85.09 45.81 88.045 37.637 31.995 26.13 76.075 104.5 156.8 155.3 7.445 . . . 81.35 37.125 135.19 26.425 8.31 89.2 65.82538 9.605 13.38 28.835 67.245 136.37 135.86 88.25 . . . 110.12 57.215 127.55 5.205 61.51 28.995 67.1439 61.155 126.03 46.38 148.44 149.34 93.01 109 . . . 113.47 144.88 65.36 51.845 86.595 119.77 17.58540 86.59 153.27 109.82 34.785 94.74 25.055 64.215 . . . 139.42144.77 132.12 115.54 55.57 143.04 120.0341 16.945 118.1 103.22 8.185 12.89 104.05 129.36 . . . 3.935 45.34 114.57 69.325 79.735 72.59 72.542 22.965 110.48 32.705 159.93 138.06 88.155 150.62 . . . 47.51 134.11 139.16 130.72 19.185 66.995 133.0643 81.51 46.975 160.89 66.405 30.715 148.36 31.59 . . . 113.47144.88 65.36 51.845 85.315 119.77 17.31
.
.
.
.
.
.
.
.
.
.
.
.
.
.
.
.
.
.
.
.
.
.
.
.
.
.
.
.
.
.
.
.
.
.
.
.
.
.
.
.
.
.
259 108.260 63.715 5.505 50.755 13.210 24.095 157.690 . . . 22.415 40.290 102.410 142.515 78.415 13.805 6.760260 58.430 75.710 127.575 69.775 27.735 121.025 124.395 . . .154.930 87.370 27.395 31.760 12.090 123.610 89.300261 108.920 27.850 37.175 122.280 35.345 92.900 55.410 . . . 126.515 117.040 24.565 100.165 113.660 9.220 73.000262 112.885 119.235 105.690 148.840 116.820 29.120 159.510. . . 27.145 103.915 115.900 54.405 39.830 23.990 94.845263 100.135 43.190 75.010 72.975 162.145 21.630 127.580 . . .79.465 68.210 95.155 115.690 141.995 29.825 30.965264 100.895 49.320 39.140 147.020 142.230 69.955 81.320 . . .21.400 113.595 88.835 69.560 143.235 88.610 69.860265 17.530 58.610 25.355 48.485 101.870 71.215 120.110 . . . 10.815 136.265 39.710 76.525 49.390 59.330 155.185266 97.335 154.835 47.180 6.825 75.930 121.375 12.210 . . . 134.000 63.010 142.915 13.820 114.485 150.535 80.315267 147.655 35.305 11.515 138.010 129.655 15.010 50.070 . . .34.975 149.985 7.040 152.325 162.950 138.455 134.600268 31.660 44.225 41.300 3.640 50.160 163.265 114.770 . . . 50.835 149.955 25.005 70.910 53.185 163.125 30.605269 50.910 71.845 80.835 53.040 157.350 64.155 105.650 . . . 97.410 147.675 124.095 123.235 93.905 61.705 125.240270 43.045 150.610 147.315 57.540 127.185 77.765 23.550 . . .50.290 28.345 75.650 48.145 106.260 5.625 118.325271 71.165 160.155 156.625 28.595 81.150 30.105 15.230 . . . 40.000 121.145 23.575 144.730 126.595 47.200 119.810272 157.565 11.265 77.615 17.615 94.425 70.055 10.865 . . . 7.480 75.505 48.880 81.000 36.955 39.385 25.445273 60.865 75.270 133.555 69.765 113.550 132.125 141.725 . .. 106.955 148.625 38.485 40.960 50.330 69.225 57.290274 75.820 38.500 68.335 35.615 122.545 60.885 85.220 . . . 104.355 57.695 15.450 85.090 4.850 87.745 37.600275 16.395 65.150 74.555 111.505 67.565 74.260 42.055 . . . 119.495 16.525 110.065 14.475 72.335 145.340 132.155276 20.655 19.705 41.335 123.495 100.680 135.940 52.650 . . .112.035 11.580 84.500 74.975 26.450 69.500 85.435277 147.655 35.305 11.515 138.010 129.655 11.895 73.780 . . .59.800 104.615 61.565 30.120 1.140 79.520 130.095278 92.295 141.650 140.625 93.615 37.065 61.090 50.070 . . . 50.825 149.945 25.005 70.910 53.185 163.125 30.605279 20.670 27.885 163.015 21.870 42.145 142.320 57.375 . . . 101.110 99.750 157.470 111.390 11.700 120.880 117.360280 139.845 0.870 158.225 123.265 41.125 162.545 67.810 . . .54.105 84.665 105.865 46.905 22.310 13.455 80.715281 125.000 12.215 154.280 106.750 38.665 145.190 66.180 . .. 146.040 34.610 43.360 38.690 145.995 122.765 153.450282 9.605 13.380 28.835 84.020 156.800 155.295 7.445 . . . 80.070 37.125 135.185 5.945 8.310 89.200 65.825283 147.655 35.305 11.515 138.010 129.655 15.010 50.070 . . .50.825 149.955 25.005 70.910 53.185 163.125 30.605284 123.430 119.075 123.625 128.340 98.700 102.295 55.980 .. . 92.460 160.790 15.705 111.085 158.930 87.795 30.785285 44.325 110.495 58.145 108.085 155.420 79.015 78.430 . . .152.275 31.510 122.660 142.960 20.505 144.165 142.795286 31.995 26.130 76.075 67.245 136.365 135.855 88.250 . . . 110.120 57.215 127.545 5.205 61.510 28.995 67.140287 70.740 27.720 8.640 59.095 11.860 21.960 22.335 . . . 33.955 74.680 129.905 132.205 61.515 63.355 131.115288 118.245 147.440 12.640 82.010 47.525 2.545 19.795 . . . 5.955 152.245 39.480 15.480 89.715 115.810 19.980289 126.095 83.470 38.690 80.505 15.255 162.700 7.720 . . . 131.885 115.950 98.900 5.120 44.465 130.825 15.745290 123.430 113.590 80.060 2.160 159.985 159.530 87.835 . . .68.820 18.495 56.170 131.560 35.245 136.200 14.935291 135.285 23.700 51.065 92.915 119.825 155.100 146.815 . .. 50.805 82.610 157.450 102.450 19.720 25.630 57.755292 149.755 114.920 68.010 62.420 24.575 71.965 130.290 . . .10.895 74.215 89.055 109.825 20.205 36.545 127.095293 59.270 20.925 115.695 145.660 40.430 23.245 151.235 . . .138.775 107.540 5.460 117.670 69.015 48.195 144.610294 61.155 126.030 46.380 148.440 149.340 93.010 103.880 . .. 113.470 144.880 65.360 51.845 85.315 119.770 17.310295 83.550 53.905 54.740 153.235 68.620 16.700 48.725 . . . 35.560 35.820 9.715 126.245 135.375 91.835 101.820296 108.920 27.850 37.175 122.360 35.345 92.900 55.430 . . . 68.105 103.915 115.900 54.405 39.830 23.990 94.845297 81.510 46.975 160.890 66.405 30.715 148.370 31.590 . . . 125.095 11.025 90.255 60.365 142.340 79.750 102.115298 75.820 38.500 68.335 35.615 122.545 60.885 85.220 . . . 104.355 57.695 15.450 85.090 45.810 88.065 37.600299 132.010 9.970 84.265 63.265 135.735 139.020 81.515 . . . 69.110 84.100 12.840 15.415 78.095 20.760 87.420300 112.885 119.235 105.690 148.840 116.820 29.120 159.510. . . 126.515 117.040 24.565 100.165 113.660 9.220 73.000
139
TH-1265_KANNANT
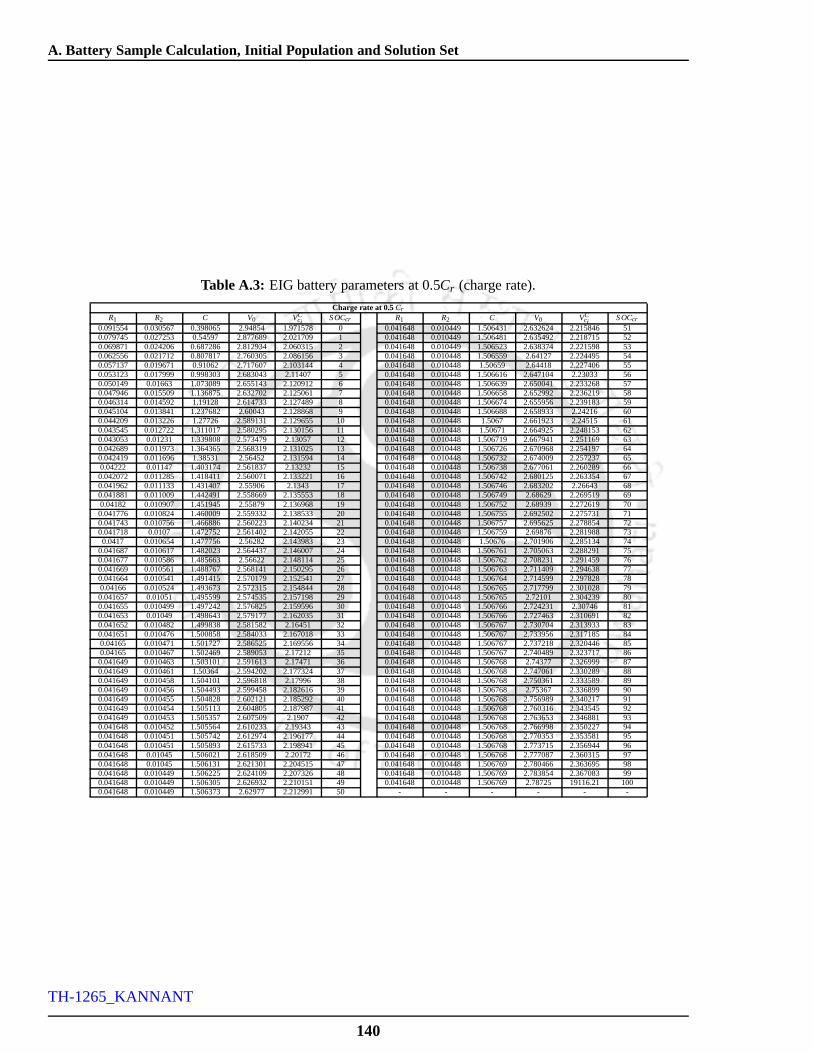
A. Battery Sample Calculation, Initial Population and Solution Set
Table A.3: EIG battery parameters at 0.5Cr (charge rate).
Charge rate at 0.5CrR1 R2 C V0 VC
ciS OCcr R1 R2 C V0 VC
ciS OCcr
0.091554 0.030567 0.398065 2.94854 1.971578 0 0.041648 0.010449 1.506431 2.632624 2.215846 510.079745 0.027253 0.54597 2.877689 2.021709 1 0.041648 0.010449 1.506481 2.635492 2.218715 520.069871 0.024206 0.687286 2.812934 2.060315 2 0.041648 0.010449 1.506523 2.638374 2.221598 530.062556 0.021712 0.807817 2.760305 2.086156 3 0.041648 0.010448 1.506559 2.64127 2.224495 540.057137 0.019671 0.91062 2.717607 2.103144 4 0.041648 0.010448 1.50659 2.64418 2.227406 550.053123 0.017999 0.998303 2.683043 2.11407 5 0.041648 0.010448 1.506616 2.647104 2.23033 560.050149 0.01663 1.073089 2.655143 2.120912 6 0.041648 0.010448 1.506639 2.650041 2.233268 570.047946 0.015509 1.136875 2.632702 2.125061 7 0.041648 0.010448 1.506658 2.652992 2.236219 580.046314 0.014592 1.19128 2.614733 2.127489 8 0.041648 0.010448 1.506674 2.655956 2.239183 590.045104 0.013841 1.237682 2.60043 2.128868 9 0.041648 0.010448 1.506688 2.658933 2.24216 600.044209 0.013226 1.27726 2.589131 2.129655 10 0.041648 0.010448 1.5067 2.661923 2.24515 610.043545 0.012722 1.311017 2.580295 2.130156 11 0.041648 0.010448 1.50671 2.664925 2.248153 620.043053 0.01231 1.339808 2.573479 2.13057 12 0.041648 0.010448 1.506719 2.667941 2.251169 630.042689 0.011973 1.364365 2.568319 2.131025 13 0.041648 0.010448 1.506726 2.670968 2.254197 640.042419 0.011696 1.38531 2.56452 2.131594 14 0.041648 0.010448 1.506732 2.674009 2.257237 650.04222 0.01147 1.403174 2.561837 2.13232 15 0.041648 0.010448 1.506738 2.677061 2.260289 660.042072 0.011285 1.418411 2.560071 2.133221 16 0.041648 0.010448 1.506742 2.680125 2.263354 670.041962 0.011133 1.431407 2.55906 2.1343 17 0.041648 0.010448 1.506746 2.683202 2.26643 680.041881 0.011009 1.442491 2.558669 2.135553 18 0.041648 0.010448 1.506749 2.68629 2.269519 690.04182 0.010907 1.451945 2.55879 2.136968 19 0.041648 0.010448 1.506752 2.68939 2.272619 700.041776 0.010824 1.460009 2.559332 2.138533 20 0.041648 0.010448 1.506755 2.692502 2.275731 710.041743 0.010756 1.466886 2.560223 2.140234 21 0.041648 0.010448 1.506757 2.695625 2.278854 720.041718 0.0107 1.472752 2.561402 2.142055 22 0.041648 0.010448 1.506759 2.69876 2.281988 730.0417 0.010654 1.477756 2.56282 2.143983 23 0.041648 0.010448 1.50676 2.701906 2.285134 74
0.041687 0.010617 1.482023 2.564437 2.146007 24 0.041648 0.010448 1.506761 2.705063 2.288291 750.041677 0.010586 1.485663 2.56622 2.148114 25 0.041648 0.010448 1.506762 2.708231 2.291459 760.041669 0.010561 1.488767 2.568141 2.150295 26 0.041648 0.010448 1.506763 2.711409 2.294638 770.041664 0.010541 1.491415 2.570179 2.152541 27 0.041648 0.010448 1.506764 2.714599 2.297828 780.04166 0.010524 1.493673 2.572315 2.154844 28 0.041648 0.010448 1.506765 2.717799 2.301028 790.041657 0.01051 1.495599 2.574535 2.157198 29 0.041648 0.010448 1.506765 2.72101 2.304239 800.041655 0.010499 1.497242 2.576825 2.159596 30 0.041648 0.010448 1.506766 2.724231 2.30746 810.041653 0.01049 1.498643 2.579177 2.162035 31 0.041648 0.010448 1.506766 2.727463 2.310691 820.041652 0.010482 1.499838 2.581582 2.16451 32 0.041648 0.010448 1.506767 2.730704 2.313933 830.041651 0.010476 1.500858 2.584033 2.167018 33 0.041648 0.010448 1.506767 2.733956 2.317185 840.04165 0.010471 1.501727 2.586525 2.169556 34 0.041648 0.010448 1.506767 2.737218 2.320446 850.04165 0.010467 1.502469 2.589053 2.17212 35 0.041648 0.010448 1.506767 2.740489 2.323717 860.041649 0.010463 1.503101 2.591613 2.17471 36 0.041648 0.010448 1.506768 2.74377 2.326999 870.041649 0.010461 1.50364 2.594202 2.177324 37 0.041648 0.010448 1.506768 2.747061 2.330289 880.041649 0.010458 1.504101 2.596818 2.17996 38 0.041648 0.010448 1.506768 2.750361 2.333589 890.041649 0.010456 1.504493 2.599458 2.182616 39 0.041648 0.010448 1.506768 2.75367 2.336899 900.041649 0.010455 1.504828 2.602121 2.185292 40 0.041648 0.010448 1.506768 2.756989 2.340217 910.041649 0.010454 1.505113 2.604805 2.187987 41 0.041648 0.010448 1.506768 2.760316 2.343545 920.041649 0.010453 1.505357 2.607509 2.1907 42 0.041648 0.010448 1.506768 2.763653 2.346881 930.041648 0.010452 1.505564 2.610233 2.19343 43 0.041648 0.010448 1.506768 2.766998 2.350227 940.041648 0.010451 1.505742 2.612974 2.196177 44 0.041648 0.010448 1.506768 2.770353 2.353581 950.041648 0.010451 1.505893 2.615733 2.198941 45 0.041648 0.010448 1.506768 2.773715 2.356944 960.041648 0.01045 1.506021 2.618509 2.20172 46 0.041648 0.010448 1.506768 2.777087 2.360315 970.041648 0.01045 1.506131 2.621301 2.204515 47 0.041648 0.010448 1.506769 2.780466 2.363695 980.041648 0.010449 1.506225 2.624109 2.207326 48 0.041648 0.010448 1.506769 2.783854 2.367083 990.041648 0.010449 1.506305 2.626932 2.210151 49 0.041648 0.010448 1.506769 2.78725 19116.21 1000.041648 0.010449 1.506373 2.62977 2.212991 50 - - - - - -
140
TH-1265_KANNANT

A.5 Battery Parameters
Table A.4: EIG battery parameters at 0.5Dr (discharge rate).
Discharge rate at 0.5DrR1 R2 C V0 VC
diDODcr R1 R2 C V0 VC
diDODcr
0.0416 0.0104 1.5068 2.7869 2.3701 0 0.0416 0.0104 1.5063 2.6269 2.2102 510.0416 0.0104 1.5068 2.7839 2.3671 1 0.0416 0.0104 1.5062 2.6241 2.2073 520.0416 0.0104 1.5068 2.7805 2.3637 2 0.0416 0.0104 1.5061 2.6213 2.2045 530.0416 0.0104 1.5068 2.7771 2.3603 3 0.0416 0.0105 1.506 2.6185 2.2017 540.0416 0.0104 1.5068 2.7737 2.3569 4 0.0416 0.0105 1.5059 2.6157 2.1989 550.0416 0.0104 1.5068 2.7704 2.3536 5 0.0416 0.0105 1.5057 2.613 2.1962 560.0416 0.0104 1.5068 2.767 2.3502 6 0.0416 0.0105 1.5056 2.6102 2.1934 570.0416 0.0104 1.5068 2.7637 2.3469 7 0.0416 0.0105 1.5054 2.6075 2.1907 580.0416 0.0104 1.5068 2.7603 2.3435 8 0.0416 0.0105 1.5051 2.6048 2.188 590.0416 0.0104 1.5068 2.757 2.3402 9 0.0416 0.0105 1.5048 2.6021 2.1853 600.0416 0.0104 1.5068 2.7537 2.3369 10 0.0416 0.0105 1.5045 2.5995 2.1826 610.0416 0.0104 1.5068 2.7504 2.3336 11 0.0416 0.0105 1.5041 2.5968 2.18 620.0416 0.0104 1.5068 2.7471 2.3303 12 0.0416 0.0105 1.5036 2.5942 2.1773 630.0416 0.0104 1.5068 2.7438 2.327 13 0.0416 0.0105 1.5031 2.5916 2.1747 640.0416 0.0104 1.5068 2.7405 2.3237 14 0.0416 0.0105 1.5025 2.5891 2.1721 650.0416 0.0104 1.5068 2.7372 2.3204 15 0.0417 0.0105 1.5017 2.5865 2.1696 660.0416 0.0104 1.5068 2.734 2.3172 16 0.0417 0.0105 1.5009 2.584 2.167 670.0416 0.0104 1.5068 2.7307 2.3139 17 0.0417 0.0105 1.4998 2.5816 2.1645 680.0416 0.0104 1.5068 2.7275 2.3107 18 0.0417 0.0105 1.4986 2.5792 2.162 690.0416 0.0104 1.5068 2.7242 2.3075 19 0.0417 0.0105 1.4972 2.5768 2.1596 700.0416 0.0104 1.5068 2.721 2.3042 20 0.0417 0.0105 1.4956 2.5745 2.1572 710.0416 0.0104 1.5068 2.7178 2.301 21 0.0417 0.0105 1.4937 2.5723 2.1548 720.0416 0.0104 1.5068 2.7146 2.2978 22 0.0417 0.0105 1.4914 2.5702 2.1525 730.0416 0.0104 1.5068 2.7114 2.2946 23 0.0417 0.0106 1.4888 2.5681 2.1503 740.0416 0.0104 1.5068 2.7082 2.2915 24 0.0417 0.0106 1.4857 2.5662 2.1481 750.0416 0.0104 1.5068 2.7051 2.2883 25 0.0417 0.0106 1.482 2.5644 2.146 760.0416 0.0104 1.5068 2.7019 2.2851 26 0.0417 0.0107 1.4778 2.5628 2.144 770.0416 0.0104 1.5068 2.6988 2.282 27 0.0417 0.0107 1.4728 2.5614 2.1421 780.0416 0.0104 1.5068 2.6956 2.2789 28 0.0417 0.0108 1.4669 2.5602 2.1402 790.0416 0.0104 1.5068 2.6925 2.2757 29 0.0418 0.0108 1.46 2.5593 2.1385 800.0416 0.0104 1.5068 2.6894 2.2726 30 0.0418 0.0109 1.4519 2.5588 2.137 810.0416 0.0104 1.5067 2.6863 2.2695 31 0.0419 0.011 1.4425 2.5587 2.1356 820.0416 0.0104 1.5067 2.6832 2.2664 32 0.042 0.0111 1.4314 2.5591 2.1343 830.0416 0.0104 1.5067 2.6801 2.2634 33 0.0421 0.0113 1.4184 2.5601 2.1332 840.0416 0.0104 1.5067 2.6771 2.2603 34 0.0422 0.0115 1.4032 2.5618 2.1323 850.0416 0.0104 1.5067 2.674 2.2572 35 0.0424 0.0117 1.3853 2.5645 2.1316 860.0416 0.0104 1.5067 2.671 2.2542 36 0.0427 0.012 1.3644 2.5683 2.131 870.0416 0.0104 1.5067 2.6679 2.2512 37 0.0431 0.0123 1.3398 2.5735 2.1306 880.0416 0.0104 1.5067 2.6649 2.2482 38 0.0435 0.0127 1.311 2.5803 2.1302 890.0416 0.0104 1.5067 2.6619 2.2452 39 0.0442 0.0132 1.2773 2.5891 2.1297 900.0416 0.0104 1.5067 2.6589 2.2422 40 0.0451 0.0138 1.2377 2.6004 2.1289 910.0416 0.0104 1.5067 2.656 2.2392 41 0.0463 0.0146 1.1913 2.6147 2.1275 920.0416 0.0104 1.5067 2.653 2.2362 42 0.0479 0.0155 1.1369 2.6327 2.1251 930.0416 0.0104 1.5066 2.65 2.2333 43 0.0501 0.0166 1.0731 2.6551 2.1209 940.0416 0.0104 1.5066 2.6471 2.2303 44 0.0531 0.018 0.9983 2.683 2.1141 950.0416 0.0104 1.5066 2.6442 2.2274 45 0.0571 0.0197 0.9106 2.7176 2.1031 960.0416 0.0104 1.5066 2.6413 2.2245 46 0.0626 0.0217 0.8078 2.7603 2.0862 970.0416 0.0104 1.5065 2.6384 2.2216 47 0.0699 0.0242 0.6873 2.8129 2.0603 980.0416 0.0104 1.5065 2.6355 2.2187 48 0.0797 0.0273 0.546 2.8777 2.0217 990.0416 0.0104 1.5064 2.6326 2.2158 49 0.0931 0.031 0.3803 2.9573 1.5649 1000.0416 0.0104 1.5064 2.6298 2.213 50 - - - -
141
TH-1265_KANNANT

A. Battery Sample Calculation, Initial Population and Solution Set
142
TH-1265_KANNANT

BFuzzy Logic Controller
143
TH-1265_KANNANT

B. Fuzzy Logic Controller
B.1 Introduction
In this section, the fuzzification and defuzzification method of the fuzzy central controller is dis-
cussed, which has used in Chapter 3. Similarly, the explanation can be suitable for other controllers
such as the fuzzy based synchronization controller, dc-link voltage controller and charging current
controller. The uncontrolled charging or discharging of the EVs causes voltage fluctuation in the DN
at which the SCS has been connected. Therefore, there is a need of coordinating the EVs at the SCS
to control the power flow between the EVs and the DN. The charging and discharging of the EVs’
batteries have been controlled using a Fuzzy Logic Controller (FLC). For example, the input param-
eters of the CCU are taken as the available energy in the CS, voltage profile at the DN and duration
to support the grid. For a low energy and high node voltage, EVwill charge while for a high SOC
and low node voltage, EV will discharge. However, there may also be cases where both the available
energy and node voltages are high or both are low. For such situations, low charging or discharging
needs to be employed. Thus, the FLC has been fine tuned to take care of such situations as well, so
as to keep the node voltage fluctuations within the permissible limits.
Fuzzy logic is another class of artificial inelegance but thehistory and its applications are more re-
cent than those of expert system [165]. Fuzzy logic derived from fuzzy set theory which can deal with
uncertainties in systems. Fuzzy logic incorporates a simple, IF-THEN rule based approach to solve a
control problem rather than attempting to mathematically model a system. Fig. B.1 shows the func-
tional block diagram of a fuzzy logic controller. Unlike binary logic, Fuzzy Logic is a many-valued
logic where the fuzzy logic variables may have truth values ranging in different degrees between 0
and 1. Fuzzy Logic can deal with the uncertainties in the system through a simple IF-THEN rule
based approach, thereby eliminating the need for a mathematical model of the system. This is very
much useful for complex system where the complete mathematical model representation may not be
possible. It consists of fuzzification, knowledge system, inference engine and defuzzification, which
is shown in Fig. B.1. The crisp input is converted or translates into crisp values by using the fuzzifi-
cation. The rule or knowledge base collects the control rules which describe expert’s knowledge and
experience in the fuzzy set. Based on the rule base and fuzzification output, the fuzzy control values
have been generated in the inference engine. Then, the fuzzyvalues are converted into crisp values
144
TH-1265_KANNANT

B.1 Introduction
by using the defuzzification method.
Fuzzification Inferenceengine
Rule base
Knowledge base
DefuzzificationCrisp output
inputCrisp
Fuzzy Fuzzyinput output
Figure B.1: Functional block diagram of fuzzy logic controller.
The following steps are required to implement fuzzy logic technique:
• Fuzzification convert real value or crisp data into fuzzy data or Membership Functions (MFs).
• Inference Engine combine membership functions with the control rules to derive the fuzzy
output.
• Defuzzification is a process which convert fuzzy quantitiesinto crisp quantities.
Mamdani type inference is used here for the implication of rules. In order to achieve a fast and
accurate result, center of gravity method is chosen for defuzzification process. Three fuzzy subsets
such as Low (L), Medium (M) and High (H) have been chosen as theinput variables. Negative High
(NH), Negative Medium (NM), Negative Low (NL), Positive Low(PL), Positive Medium (PM) and
Positive High (PH) are chosen as output in order to obtain therequired control action. The triangular
membership function has been used in this work because the calculations and implementation are
easy, which is given in Fig. B.1. It is very difficult to calculate the arithmetic operations in case of
Bell, Sigmoidal, Asymmetric and Guassian. The rule base forCCU-FLC is given in Table B.1.
B.1.1 Fuzzification
Fuzzification is the first step to apply a fuzzy inference system. Most variables existing in the real
world are crisp or classical variables. One needs to convertthose crisp variables to fuzzy variables.
Then apply fuzzy inference to process those data to obtain the desired output. Generally, fuzzification
process involves deriving the MFs for input and outputting variables and representing them with
linguistic variables such as Low, Medium, etc,. The triangular MFs have been used in this work.
145
TH-1265_KANNANT

B. Fuzzy Logic Controller
Table B.1: Rule base for CCU-FLC.
Vnode ET D Pgrid Vnode ET D Pgrid
L L L NH M M H NLL L M NM M H L NHL L H NL M H M NML M L NH M H H NLL M M NM H L L PHL M H NL H L M PML H L NH H L H PLL H M NM H M L PHL H H NL H M M PMM L L PL H M H PLM L M PL H H L PHM L H PL H H M PMM M L NH H H H PLM M M NM - - - -
B.1.2 Defuzzification
Defuzzification is a method which converts fuzzy output intocrisp output. The generated fuzzy
outputs are not possible to use. Hence, it is necessary to convert the fuzzy output into crisp output.
This can be archived by using defuzzification process. Several methods of defuzzification are used
in practice such as center of area (also called as center of gravity), maxima, mean of maxima, height
and modified height methods. The most popular method is center of area which estimate the center
of gravity of the fuzzy set. The general expression for the center of area is given below:
Pgrid =
n∑
i=1Pgridiµ
(
Pgridi
)
n∑
i=1µ(
Pgridi
)
(B.1)
Detailed fuzzy logic process is explained with numerical example of the CCU-FLC.
(i) Step - 1: The rule base for CCU-FLC has been decided based on the total available energy of
the CS, distribution node voltage and duration to support orinject the power. If the node voltage
is low, total energy availability of the CS is high, the duration is medium then the CS support
the grid with very high power value. The distribution node voltage (Vnode) is 0.965, the total
energy availability (ET) is 0.9 and the duration (D) is 0.9.
(ii) Step - 2: Estimate the Degree of Membership Function (DOF) ofµ(Vnode(p.u)), µ(ET(p.u))
andµ(D(p.u)) for the equal fuzzy sets.µM(Vnode) = 0.9, µH(Vnode) = 0.1, µM(ET) = 0.2,
146
TH-1265_KANNANT

B.1 Introduction
µH(ET) = 0.8, µM(D) = 0.1 andµH(D) = 0.9.
(iii) Step - 3: The rule base for the CCU-FLU is given in Table B.1. Identify the eight rules from
this Table forM,H values ofµ(Vnode(p.u)), µ(ET(p.u)) andµ(D(p.u)).
• Rule 1: Ifµ(Vnode) = M AND µ(ET) = M AND µH(D) = M THEN µ(Pgrid) = NM.
• Rule 2: Ifµ(Vnode) = M AND µ(ET) = M AND µH(D) = H THEN µ(Pgrid) = NL.
• Rule 3: Ifµ(Vnode) = M AND µ(ET) = H AND µH(D) = M THEN µ(Pgrid) = NM.
• Rule 4: Ifµ(Vnode) = M AND µ(ET) = H AND µH(D) = H THEN µ(Pgrid) = NL.
• Rule 5: Ifµ(Vnode) = H AND µ(ET) = M AND µH(D) = M THEN µ(Pgrid) = PM.
• Rule 6: Ifµ(Vnode) = H AND µ(ET) = M AND µH(D) = H THEN µ(Pgrid) = PL.
• Rule 7: Ifµ(Vnode) = H AND µ(ET) = H AND µH(D) = M THEN µ(Pgrid) = PM.
• Rule 8: Ifµ(Vnode) = H AND µ(ET) = H AND µH(D) = H THEN µ(Pgrid) = PL.
Then, estimate the DOF of each rules sing the min or AND operator.
• DOF1: min µM(Vnode), µM(ET), µM(D) = min0.9, 0.2, 0.1 = 0.1.
• DOF2: min µM(Vnode), µM(ET), µH(D) = min0.9, 0.2, 0.9 = 0.2.
• DOF3: min µM(Vnode), µH(ET), µM(D) = min0.9, 0.8, 0.1 = 0.1.
• DOF4: min µM(Vnode), µH(ET), µH(D) = min0.9, 0.8, 0.9 = 0.8.
• DOF5: min µH(Vnode), µM(ET), µM(D) = min0.1, 0.2, 0.1 = 0.1.
• DOF6: min µH(Vnode), µM(ET), µH(D) = min0.1, 0.2, 0.9 = 0.1.
• DOF7: min µH(Vnode), µH(ET), µM(D) = min0.1, 0.8, 0.1 = 0.1.
• DOF8: min µH(Vnode), µH(ET), µH(D) = min0.1, 0.8, 0.9 = 0.1.
(iv) Step - 4: Estimate the total power flow between in either directionµPgridifor corresponding
rules in the above Table.
• µ(Pgrid1) := −0.6 for NM corresponding toDOF1=0.1.
147
TH-1265_KANNANT

B. Fuzzy Logic Controller
0.1
0.9
Rule 1(R1)
Rule 2(R2)
HL
0.8 0.95 1.1
(a)
0
1 M
0.9
0.1
HL
0.8 0.95 1.1
(a)
0
1 M
Rule 3(R3)
0.1
0.9HL
0.8 0.95 1.1
(a)
0
1 M
Rule 4(R4)
0.1
HL
0.8 0.95 1.1
(a)
0
1 M
Rule 5(R5)
0.1
0.9HL
0.8 0.95 1.1
(a)
0
1 M
Rule 6(R6)
0.1
0.9HL
0.8 0.95 1.1
(a)
0
1 M
Rule 7(R7)
0.1
0.9HL
0.8 0.95 1.1
(a)
0
1 M
Rule 8(R8)
0.1
0.9HL
0.8 0.95 1.1
(a)
0
1 M
(e)
−1 −0.6 −0.2 0.2 0.6 10
(e)
−1 −0.6 −0.2 0.2 0.6 10
(e)
−1 −0.6 −0.2 0.2 0.6 10
(e)
−1 −0.6 −0.2 0.2 0.6 10
−1 −0.6 −0.2 0.2 0.6 1
(e)
0
(e)
−1 −0.6 −0.2 0.2 0.6 10
Rule 3 contribution
(e)
−1 −0.6 −0.2 0.2 0.6 1
Rule 2 contribution
−1 −0.6 −0.2 0.2 0.6 1
(e)
Rule 1 contribution
Rule 6 contribution
Rule 5 contribution
Rule 7 contribution
Rule 8 contribution
NH NM NL PL PM PH
−1 −0.6 −0.2 0.2 0.6 1
(d)
0
10.9
0.1
HL M
0 0.5 10
(c)
1
0.2
0.8
M HL
0 0.5 10
1
(b)
0.2
0.8M HL
0 0.5 10
1
(b)
0.9
0.1
HL M
0 0.5 10
1
(c)
NH NM NL PL PM PH
−1 −0.6 −0.2 0.2 0.6 1
(d)
0
1
NH NM NL PL PM PH
−1 −0.6 −0.2 0.2 0.6 1
(d)
0
10.9
0.1
HL M
0 0.5 10
1
(c)
0.8
0.2
M HL
0 0.5 10
1
(b)
0.8
0.2
M HL
0 0.5 10
1
(b)
0.9
0.1
HL M
0 0.5 10
1
(c)
NH NM NL PL PM PH
−1 −0.6 −0.2 0.2 0.6 1
(d)
0
1
NH NM NL PL PM PH
−1 −0.6 −0.2 0.2 0.6 1
(d)
0
10.9
0.1
HL M
0 0.5 10
1
(c)
0.8
0.2
M HL
0 0.5 10
1
(b)
0.9
0.1
HL M
0 0.5 10
1
(c)
0.8
0.2
M HL
0 0.5 10
1
(b)
NH NM NL PL PM PH
−1 −0.6 −0.2 0.2 0.6 1
(d)
0
1
NH NM NL PL PM PH
−1 −0.6 −0.2 0.2 0.6 1
(d)
0
1
NH NM NL PL PM PH
−1 −0.6 −0.2 0.2 0.6 1
(d)
0
10.9
0.1
HL M
0 0.5 10
1
(c)
0.9
0.1
HL M
0 0.5 10
1
(c)
0.8
0.2
M HL
0 0.5 10
1
(b)
0.8
0.2
M HL
0 0.5 10
1
(b)
0.9 0.90.965
0.1
0.1
0.1
0.1
0.8
0.1
0.2
0.1
Rule 4 contribution
µ(Vnode)
µ(Vnode)
µ(Vnode)
µ(Vnode)
µ(Vnode)
µ(Vnode)
µ(Vnode)
µ(Vnode) µ(Pgrid)
µ(Pgrid)
µ(Pgrid)
µ(Pgrid)
µ(Pgrid)
µ(Pgrid)
µ(Pgrid)
µ(Pgrid)µ(Pgrid)µ(D)µ(ET)
µ(ET) µ(D) µ(Pgrid)
µ(Pgrid)µ(D)µ(ET)
µ(ET) µ(D) µ(Pgrid)
µ(Pgrid)µ(D)µ(ET)
µ(D)µ(ET) µ(Pgrid)
µ(Pgrid)
µ(Pgrid)µ(D)
µ(D)
µ(ET)
µ(ET)
Pgrid(p.u)
Pgrid(p.u)Vnode(p.u) ET(p.u) D(p.u)
Vnode(p.u) D(p.u)ET(p.u)
Vnode(p.u) ET(p.u) D(p.u)
D(p.u)ET(p.u)Vnode(p.u)
Vnode(p.u) ET(p.u) D(p.u)
D(p.u)Vnode(p.u) ET(p.u)
Vnode(p.u)
Vnode(p.u)
ET(p.u)
ET(p.u)
D(p.u)
D(p.u)
Pgrid(p.u)
Pgrid(p.u)
Pgrid(p.u)
Pgrid(p.u)
Pgrid(p.u)
Pgrid(p.u) Pgrid(p.u)
Pgrid(p.u)
Pgrid(p.u)
Pgrid(p.u)
Pgrid(p.u)
Pgrid(p.u)
Pgrid(p.u)
Pgrid(p.u)
Figure B.2: Membership functions for CCU controller (a)Vnode(p.u), (b) ET(p.u), (c)D, (d) Pgrid and (e) rulescontribution.
• µ(Pgrid2) := −0.2 for NL corresponding toDOF1=0.2.
• µ(Pgrid3) := −0.6 for NM corresponding toDOF1=0.1.
• µ(Pgrid4) := −0.2 for NL corresponding toDOF1=0.8.
• µ(Pgrid5) := 0.6 for PM corresponding toDOF1=0.1.
• µ(Pgrid6) := 0.6 for PL corresponding toDOF1=0.1.
• µ(Pgrid7) := 0.6 for PM corresponding toDOF1=0.1.
• µ(Pgrid8) := 0.6 for PL corresponding toDOF1=0.1.
148
TH-1265_KANNANT

B.1 Introduction
(v) Step - 5: Estimate the crisp outputµPgrid by the center of area method.
Pgrid =
(0.1× −0.96) + (0.1× −0.56) + (0.2× −0.52) + (0.8× −0.28)+(0.8× −0.12) + (0.2× 0.12) + (0.1× 0.16) + (0.1× 0.24) + (0.1× 0.56)
0.1+ 0.1+ 0.2+ 0.8+ 0.8+ 0.2+ 0.1+ 0.1+ 0.1(B.2)
Pgrid = −0.1824. (B.3)
−1 −0.6 −0.2 0.2 0.6 1
Contribution of R1, R3
Contribution of R2
Contribution of R5,R6,R7,R8
Contribution of R4
µ(Pgrid)
Pgrid(p.u)
Figure B.3: Crisp value of thePgrid.
From Eq. (B.2), the crisp value of the output power is shown inFig. B.3. The defuzzified value of
the total power flow in either direction is value is−0.1824p.u. The controller has decide the negative
sign and low value ofPgrid which means the power will plow from CS to grid and the grid voltage
near to unity. Therefore, the CS support the grid with low power level.
Detailed fuzzy logic process is explained with another numerical example:
(i) Step - 1: The distribution node voltage (Vnode) is 1.05, the total energy availability (ET) is 0.3
and the duration (D) is 0.5.
(ii) Step - 2: Estimate the Degree of Membership Function (DOF) ofµ(Vnode(p.u)), µ(ET(p.u))
and µ(D(p.u)) for the equal fuzzy sets.µM(Vnode) = 0.5, µH(Vnode) = 0.5, µL(ET) = 0.4,
µM(ET) = 0.6 andµM(D) = 1.
(iii) Step - 3: The rule base for the CCU-FLU is given in Table B.1. Identify the eight rules from
this Table forM,H values ofµ(Vnode(p.u)), µ(ET(p.u)) andµ(D(p.u)).
• Rule 1: Ifµ(Vnode) = M AND µ(ET) = L AND µH(D) = M THEN µ(Pgrid) = PL.
• Rule 2: Ifµ(Vnode) = M AND µ(ET) = M AND µH(D) = M THEN µ(Pgrid) = NM.
149
TH-1265_KANNANT

B. Fuzzy Logic Controller
• Rule 3: Ifµ(Vnode) = H AND µ(ET) = L AND µH(D) = M THEN µ(Pgrid) = PM.
• Rule 4: Ifµ(Vnode) = H AND µ(ET) = M AND µH(D) = M THEN µ(Pgrid) = PM.
Then, estimate the DOF of each rules sing the min or AND operator.
• DOF1: min µM(Vnode), µL(ET), µM(D) = min0.5, 0.4, 1 = 0.4.
• DOF2: min µM(Vnode), µM(ET), µM(D) = min0.5, 0.6, 1 = 0.5.
• DOF3: min µH(Vnode), µL(ET), µM(D) = min0.5, 0.4, 1 = 0.4.
• DOF4: min µH(Vnode), µM(ET), µM(D) = min0.5, 0.6, 1 = 0.5.
Rule 1(R1)
Rule 2(R2)
HL
0.8 0.95 1.1
(a)
0
1 M
HL
0.8 0.95 1.1
(a)
0
1 M
Rule 3(R3)
HL
0.8 0.95 1.1
(a)
0
1 M
Rule 4(R4)
HL
0.8 0.95 1.1
(a)
0
1 M
−1 −0.6 −0.2 0.2 0.6 1
(e)
0
(e)
−1 −0.6 −0.2 0.2 0.6 10
(e)
−1 −0.6 −0.2 0.2 0.6 1
−1 −0.6 −0.2 0.2 0.6 1
(e)
NH NM NL PL PM PH
−1 −0.6 −0.2 0.2 0.6 1
(d)
0
1HL M
0 0.5 10
(c)
1M HL
0 0.5 10
1
(b)
M HL
0 0.5 10
1
(b)
HL M
0 0.5 10
1
(c)
NH NM NL PL PM PH
−1 −0.6 −0.2 0.2 0.6 1
(d)
0
1
NH NM NL PL PM PH
−1 −0.6 −0.2 0.2 0.6 1
(d)
0
1HL M
0 0.5 10
1
(c)
M HL
0 0.5 10
1
(b)
M HL
0 0.5 10
1
(b)
HL M
0 0.5 10
1
(c)
NH NM NL PL PM PH
−1 −0.6 −0.2 0.2 0.6 1
(d)
0
1
0.5
0.5
0.5
0.5
0.9
0.1
0.9
0.10.6
0.4
0.6
0.4
0.6
0.4
0.6
0.4
1.05 0.3 0.5
Rule 4 contribution
Rule 3 contribution
0.4
0.5
Rule 1 contribution
Rule 2 contribution
0.4
0.5
µ(Vnode)
µ(Vnode)
µ(Vnode)
µ(Vnode) µ(Pgrid)
µ(Pgrid)
µ(Pgrid)
µ(Pgrid)µ(Pgrid)µ(D)µ(ET)
µ(ET) µ(D) µ(Pgrid)
µ(Pgrid)µ(D)µ(ET)
µ(ET) µ(D) µ(Pgrid)
Pgrid(p.u)
Pgrid(p.u)Vnode(p.u) ET(p.u) D(p.u)
Vnode(p.u) D(p.u)ET(p.u)
Vnode(p.u) ET(p.u) D(p.u)
D(p.u)ET(p.u)Vnode(p.u)
Pgrid(p.u)
Pgrid(p.u) Pgrid(p.u)
Pgrid(p.u)
Pgrid(p.u)
Pgrid(p.u)
Figure B.4: Membership functions for CCU controller (a)Vnode(p.u), (b) ET(p.u), (c)D, (d) Pgrid and (e) rulescontribution.
(iv) Step - 4: Estimate the total power flow between in either directionµPgridifor corresponding
rules in the above Table.
• µ(Pgrid1) := 0.2 for NM corresponding toDOF1=0.4.
• µ(Pgrid2) := −0.6 for NL corresponding toDOF1=0.5.
• µ(Pgrid3) := 0.6 for NM corresponding toDOF1=0.4.
• µ(Pgrid4) := 0.6 for NL corresponding toDOF1=0.5.
150
TH-1265_KANNANT

B.1 Introduction
(v) Step - 5:Estimate the crisp outputµPgrid by using Eq. B.1.
Pgrid = 0.2896. (B.4)
−1 −0.6 −0.2 0.2 0.6 1
Contribution of R2
Contribution of R1 Contribution of R4
Contribution of R3
µ(Pgrid)
Pgrid(p.u)
Figure B.5: Crisp value of thePgrid.
From Eq. (B.2), the crisp value of the output power is shown inFig. B.5. The defuzzified value
of the total power flow in either direction is value is 0.2896p.u. The controller has decide the positive
sign and medium value ofPgrid which means the power will plow from grid to CS and the grid voltage
greater than unity. Therefore, the CS inject the power from grid.
151
TH-1265_KANNANT

B. Fuzzy Logic Controller
152
TH-1265_KANNANT

CFilter Design
153
TH-1265_KANNANT

C. Filter Design
C.1 dc-dc Converter Design
There are different types of circuit topologies has been reported for bidirectional dc to dc Buck-
Boost (BB) converter [195–199]. A simple dc-dc converter topology is used in the BCCS unit. Fig.
C.1 (a) shows the circuit diagram for bidirectional BB converter with two switches (S13 andS14) and
two diodes (D13 andD14). This circuit diagram has the ability to provide an output voltage higher or
lower than the input voltage and also it can transfer power inboth directions. Moreover, this circuit
diagram has few number of switches are used for bidirectional power flow. This circuit topology
selected due to its simple structure, well-known dynamic behavior, pulse by pulse currant limitation
and instantaneous shutdown. The output voltage is controlled in either direction by controlling the
duty (D) ratio of theS13 or S14.
C.1.1 Modes of Operation
During G2V operation the switchS13 and diodeD14 will conduct and V2G operation switchS14
and diodeD14 would conduct.
The BB converter operates by storing the energy in the inductor (Lb) during the interval of Switch
S13 in turnedon (ton). The stored energy is transferred to load or distributed energy source when the
switchS13 is turnedo f f (to f f ). During this operating interval, theLb provides a least resistance path.
Hence, the maximum current flows through theLb. The capacitorCb2 is used to remove the ripples in
the output voltage. Fig. C.1(b) and Fig. C.1 (c) shows the equivalent circuit diagram for G2V modes
operation and corresponding waveforms. When theS13 is turnedon, the energy is stored into theLb,
the inductor current (Ib1) is reaching to the maximum (Imax) after a time intervalkT which is shown
in Fig C.1 (c). The voltage across the switchS13 is low and the current provided from the source (Idc)
to load is maximum. The switchS13 is turnedo f f , then the current falls to zero but theIb2 starts to
flow through the load and diodeD14. The stored energy in theLb will transfer to the load. TheIb2 is
decreased, then the switchS13 would be turnedon again in the next cycle.
The net impedance (Znet) of the output side is calculated from Eq. (C.1).
Znet =V2
c/d
Pcs(C.1)
154
TH-1265_KANNANT

C.1 dc-dc Converter Design
Load
(a) Circuit diagram
Load
Load
(b) Modes of operation
Mode : 1
Mode : 2
kT T
kT
kT
kT
T
T
T
T
kT
t
t
t
t
t
T+kT
T+kT
T+kT
T+kT
T+kT
2T
2T
2T
2T
2T0
1
D13 D14
S13 S14
Lb Cb2Vdc
Ib
ICb2
Vt
I
D14
Lb Cb2
Ib
ICb2
Vt
D13
S13
Lb Cb2Vdc
Ib
ICb2
Vt
I
I
Imax
Imax
Ib
Imax
VCb2
I
Imin
Imax
Imin
Imax
VCb2max
VCb2min
∆Ib
∆VCb2
to f fton ton to f f
Figure C.1: Buck-boost converter circuit diagram, modes of operation and waveforms.
whereVc/d is the battery terminal voltage or output voltage of the dc-dc converter andPcs is
the maximum power handling capacity of the BCCS unit. The peak to peak ripple current (∆Ib) is
calculated from Eq. (C.2).
∆Ib =Vdc
f Lb(C.2)
whereVdc is the supply voltage or input voltage of the BB converter andf is the switching fre-
quency. The peak to peak ripple voltage (∆VCb2) is calculated from Eq. (C.3).
∆VCb2 =Ik
fCb2(C.3)
wherek is the duty cycle. The output voltage of the BB converter is given in Eq. (C.4).
Vc/d = −Vdck1− k
(C.4)
The equation forLb andCb2 is derived from Eq. (C.2) and Eq. (C.3) which is given below. Assume
the peak to peak ripple voltage is 3% of the maximum voltage and the ripple current is 3% of the rated
155
TH-1265_KANNANT
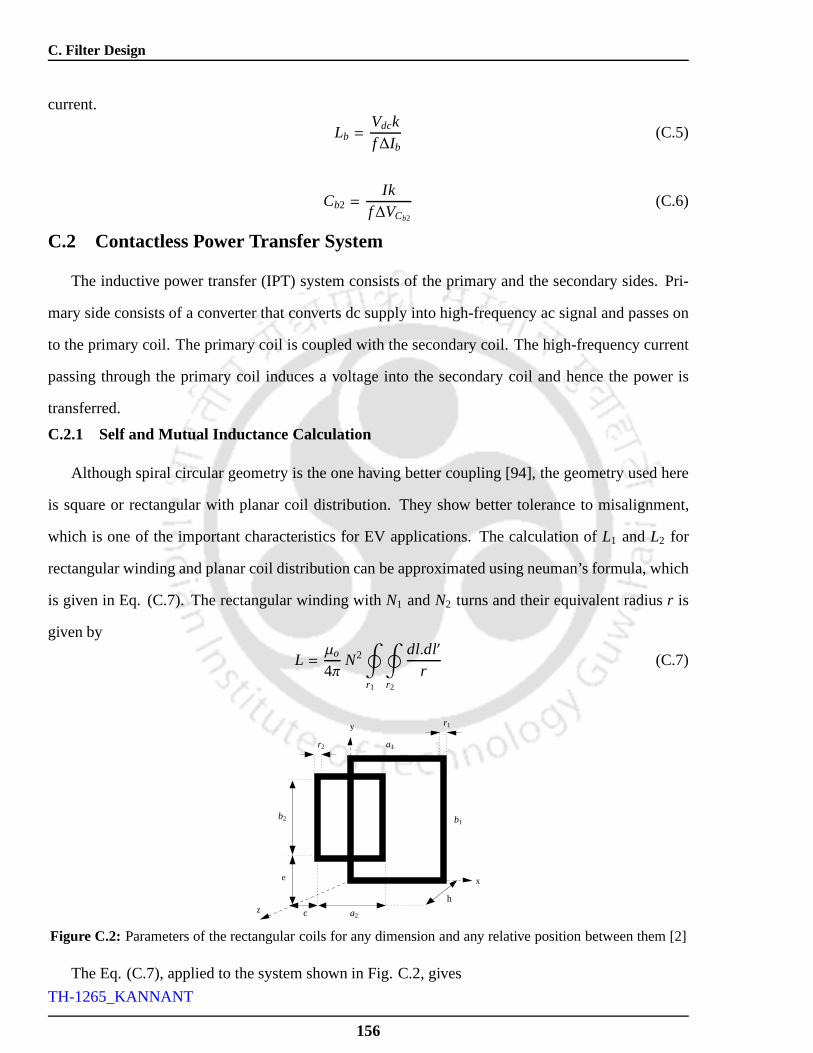
C. Filter Design
current.
Lb =Vdckf∆Ib
(C.5)
Cb2 =Ik
f∆VCb2
(C.6)
C.2 Contactless Power Transfer System
The inductive power transfer (IPT) system consists of the primary and the secondary sides. Pri-
mary side consists of a converter that converts dc supply into high-frequency ac signal and passes on
to the primary coil. The primary coil is coupled with the secondary coil. The high-frequency current
passing through the primary coil induces a voltage into the secondary coil and hence the power is
transferred.
C.2.1 Self and Mutual Inductance Calculation
Although spiral circular geometry is the one having better coupling [94], the geometry used here
is square or rectangular with planar coil distribution. They show better tolerance to misalignment,
which is one of the important characteristics for EV applications. The calculation ofL1 andL2 for
rectangular winding and planar coil distribution can be approximated using neuman’s formula, which
is given in Eq. (C.7). The rectangular winding withN1 andN2 turns and their equivalent radiusr is
given by
L =µo
4πN2
∮
r1
∮
r2
dl.dl′
r(C.7)
y
z
xe
r1
r2 a1
b1b2
c a2
h
Figure C.2: Parameters of the rectangular coils for any dimension and any relative position between them [2]
The Eq. (C.7), applied to the system shown in Fig. C.2, gives
156
TH-1265_KANNANT

C.2 Contactless Power Transfer System
L =µoπ
Ni2
ai. ln2aibi
r i(ai+
√ai
2+bi2+ bi . ln
2aibi
r i (bi+
√ai
2+bi2
−2(ai + bi −√
ai2 + bi
2) + 0.25(ai + bi)
(C.8)
Wherer i is the equivalent radius of the winding, defined as
r i =
√
NiSi
π(C.9)
Winding resistanceRi is given by the following expression:
Ri = ρCuNi2(ai + bi)
Si(C.10)
Where in Eq. (C.8) - Eq. (C.10),i = 1 should be used for the primary winding andi = 2 for the
secondary winding. To consider the possibility of having winding of different sizes and significant
misalignment can occur while transferring the power from primary side to secondary side via contact-
less coil. Therefore, an general expression for mutual inductance of the primary and secondary side
coil is given in Eq. (C.11).
M =µ0
4πN1N2
∮
r1
∮
r2
dl.dl′
r(C.11)
Fig. C.3 shows the induced and reflected voltages, which are specified in terms of mutual induc-
tanceM, the operational frequencyωo and Ip, Is, Vp, Vs are the primary and secondary current and
voltages. The mutual inductance is related to the magnetic coupling coefficient,k and is given by
k =M
√
LpLs
(C.12)
C.2.2 Electrical Circuit Parameter Calculation
Fig. C.3 shows the series-series compensation circuit topology and mutual inductance coupling
model of a series compensated contactless coil.
The voltage induced at the secondary side of the contactlesscoil is given in Eq. (C.13).
Vs = jωMIp (C.13)
Reflected impedance at the primary side can be expressed as the ratio of the reflected voltage and
157
TH-1265_KANNANT

C. Filter Design
(b) Mutual inductance coupling model(a) Baisc circuit topology
Cp
Vp Vs
Ls CsLp
Ip Is
− jωMIs jωMIp
Ip
Lp Ls
Cp CsIs IL
Figure C.3: Circuit topology and mutual inductance coupling model.
the primary current.
Zr =jωMIs
Ip(C.14)
The secondary current can be expressed as the ratio of the secondary voltage (reflected upon by
primary coil) and secondary impedance (Zs).
Is =jωMIp
Zs(C.15)
Hence, the general expression reflected impedanceZr from the secondary to the primary is found
by dividing the reflected voltage by the primary current resulting in
Zr =ωo
2M2
Zs(C.16)
whereZs is the impedance of the secondary network and depends on the selected compensation
topology. Assuming load resistance to beR, the secondary side reflected impedances for the is given
below.
Zs = jωLs+1
jωCs+ Rs+ R (C.17)
whereω is the angular frequency which isω = 1√LsCs
. The load impedance (Zt) seen by the power
supply can be found by combining the primary impedance and the reflected impedance. In the case
of series-compensated primary,
Zt =1
jωCp+ jωLp + Rp + Zr (C.18)
158
TH-1265_KANNANT
C.2 Contactless Power Transfer System
The power transferred from the primary to the secondary is given by
P = (ReZr)Ip2 (C.19)
Where the operatorRe represents the real component of corresponding variable. The current
flowing through the secondary winding is given by
Is =jωoMIp
Zs(C.20)
The voltages across the primary and secondary windings is given in Eq. (C.21) and Eq. (C.22).
Vp = jωoLpIp − jωoMIs (C.21)
Vs = jωoMIp − jωoLsIs (C.22)
Efficiency of the system (ignoring switching losses) can be determined by
η =RI22
R1I2p + R2I2
s + RI22(C.23)
C.2.3 Operating Frequency
The primary side and secondary side operating frequency should be same. The change in primary
operating frequency is mainly to attain zero phase angle (ZPA) operations by nullifying or minimizing
the reactive impedance as seen by the power supply. This is done to minimize the VA rating of the
power supply. However, the ZPA frequency must be within a certain range of the resonant frequency,
else it would affect the power transfer capability of the system. Also, the operation frequency may be
changed to control power flow from primary to secondary. By detuning the system, the power transfer
capability of the system is reduced. This method is often used to control the secondary side voltage
or current from primary side.
159
TH-1265_KANNANT

C. Filter Design
C.2.4 Compensation Level
There are four basic compensation topology has been reported in literature such as series-series
(SS), series-parallel (SP), parallel-series (PS) and parallel-parallel (PP). Although, series-series com-
pensation has been used for in this work because, its requireless copper mass and lower current.
Compensation of the primary and secondary coil is a very important element of the IPT system.
Firstly, operation at or near to resonance points help in maximizing power transfer capability. Sec-
ondly, compensation helps in reducing VA rating of the powersupply. In the absence of compensation,
a higher magnitude of current would be needed to sustain the system. This would result in greater
resistive losses in wires and also during switching. Hence,the primary compensation is necessary to
minimize the VA rating of the supply. In the secondary compensation, it is essential for maximizing
power transfer capability, which is normally low due to losecoupling.
Selection of topology is based on various theoretical as well as practical considerations. The series
compensated secondary resembles a voltage source while parallel compensated secondary resembles
a current source. Assuming secondary coil resistance to be zero, the reflected resistances (real part
of impedance) comes out to beω2M2
R and ω2M2
L2s
, respectively and then using Eq. (C.19), one can see
the validity of the statement. A series compensated primaryis used to keep primary coil voltage
and current at manageable levels while parallel compensated secondary is used for generating high
current. Hence, the selection of the circuit topology is based on the application. Moreover, there are
more factors that vary along with the circuit topology and affect the selection of primary operation
frequency and primary capacitance.
The series resonant circuit shown in Fig. C.2 is formed by compensation capacitorsCp andCs,
and leakage inductanceLp and Ls. The approximate resonant frequency of the resonant circuit is
given by
ωo =1
√
(Lp + n2Ls).(Cp +Cs
n2 )(C.24)
where,n = Np
Nsis the turn’s ratio of the transformer. Therefore, the required compensation,Ccomp
of the series capacitor is given by
160
TH-1265_KANNANT

C.3 Filter Design for Bidirectional Converters
Ccomp=1
ωo2Lleak
(C.25)
A usual method of design is to select the primary operation frequency as the nominal frequency
(secondary resonant frequency). In this case, it is assumedthat the load and the magnetic coupling
don’t vary much. The ZPA frequency is made the same as the nominal frequency by selecting the
primary capacitance such that it nullifies the reactive impedance as seen by the power source at the
nominal frequency. The choice of primary capacitance depends on the topology selected.
• Series compensated secondary reflects only real impedance on the primary side at nominal
frequency. Hence, in series-series topology, primary capacitance can be tuned independent of
coupling and load.
• In parallel-series topology, the imaginary part of the impedance as seen by the source and hence
primary capacitance tuning depends on load as well coupling.
• Parallel compensated secondary reflects the load independent capacitive reactance on the pri-
mary side. In series-parallel topology, primary capacitance tuning depends on the magnetic
coupling but not load.
• In parallel-parallel topology, tuning depends on both magnetic coupling and load.
Hence, after selection of the primary capacitance for fixed frequency operation in PP and PS
topology, it has to be ensured that the load and coupling variation is within limits and doesn’t lead to
significant shift in ZPA frequency and hence increase VA rating. Similarly in the case of SP topology,
variation of load must be in limits. Theoretically, SS topology can be considered to be most desirable
as its primary capacitance tuning is independent of magnetic coupling or load. However, due to
practical considerations, it may be preferable to use parallel compensation on one of the sides.
C.3 Filter Design for Bidirectional Converters
The converters are used to convert one form electrical energy into another form of electrical energy
based on the switching operations. Fig. C.4 shows the circuit diagram of bidirectional 3Φ and 1Φ ac-
dc converter with filter. These converters are used in the industrial application, variable speed control
161
TH-1265_KANNANT

C. Filter Design
and voltage regulator, etc. These converters are act as a rectifier and inverter during G2V and V2G
operating modes, respectively.
S9 S11
S10S12
D9 D11
D12 D10
Vin
(b) 1Φ ac to dc converter
S1
S4
S3
S6
D4
S2
S5
D6 D2
D5D3D1
(a) 3Φ ac to dc converter
Th
reeΦ
acvo
ltag
e
CdcVdc Vdc
Figure C.4: Circuit diagram of bidirectional 3Φ and 1Φ ac-dc converter with filter.
In the G2V operation, the electric grid supplies the excess amount of energy to store in the EVs’
batteries during off-peak hours. Then, the 3Φ ac voltage is converted into dc voltage by using the
switches’S1 to S6. Further, the 1Φ high-frequency voltage is converted into dc voltage. The output
voltage of this converter is not a pure dc voltage, some ac component also raiding in the top of the
dc voltage. Therefore, filter circuit is required to remove the harmonics in the dc output voltage. The
filter circuit has been design based on the net reflected impedance seen from the source, which is
given in Eq. (C.26).
Znet =V2
dc
Pcs(C.26)
(a) Circuit diagram
Vnh(nω)
L
XC =1
nωC f
L f
C f
R
Vdc(nω)
XL = nωL f
Figure C.5: Equivalent circuit diagram fornth order harmonics.
The equivalent circuit of the harmonics is shown in Fig. C.5.The nth harmonic ripple current
to pass through the filter capacitance. Therefore, the load impedance, much greater than the filter
capacitance [200].
162
TH-1265_KANNANT
C.3 Filter Design for Bidirectional Converters
√
R2 + (nωL)2 >>1
nωC f=
10nωC f
(C.27)
The root-mean-square (rms) value of thenth harmonic component appearing on the output of the
ac to dc converter, which is given in Eq. (C.28).
Von =
−1nωC f
nωL f − 1nωC f
Vnh (C.28)
Von =−1
(nω)2C f L f − 1Vnh (C.29)
The ripple voltage due to harmonic is given in Eq. (C.31)
Vac =
∞∑
n=2,4,6,...
V2on
12
(C.30)
The Fourier series for ac to dc converter is given in Eq. (C.32).
Vo (t) = Vdc+
∞∑
n=2,4,6,...
(an cosnωt + bn sinnωt) (C.31)
The output voltage of the ac to dc converter,an andbn are given below:
Vdc =12π
2π∫
0
V0 (t) dωt
Vdc =22π
π∫
0
Vm sinωtdωt = 2Vmπ
(C.32)
an =1π
2π∫
0
V0 cosnωtdωt = 2π
π∫
0
Vm sinωt cosnωtdωt
an =
∞∑
n=2,4,6,...
−1(n−1)(n+1) forn = 2, 4, 6, ..
0forn= 1, 3, 5, ...
(C.33)
bn =1π
2π∫
0
V0 sinnωtdωt = 2π
π∫
0
Vm sinωt sinnωtdωt
bn = 0
(C.34)
Substitute the values ofVdc, an andbn in Eq. (C.31).
163
TH-1265_KANNANT

C. Filter Design
bn =1π
2π∫
0
V0 sinnωtdωt = 2π
π∫
0
Vm sinωt sinnωtdωt
bn = 0
(C.35)
V0 (t) = 2Vm
π+
∞∑
n=2,4,6,...
4Vm
π−1
(n−1)(n+1) cosnωt
V0 (t) = 2Vm
π− 4Vm
3π cos 2ωt − 4Vm
15π cos 4ωt − 4Vm
35π cos 6ωt − −4Vm
62π cos 8ωt...(C.36)
From Eq. (C.36), the second order harmonic is the dominant and the rms value is given in Eq.
(C.38).
V2h =4Vm
3√
2π(C.37)
Substituten = 2 in Eq. (C.29)
V02 =−1
(2ω)2(
L f C f − 1)V2h (C.38)
The value of the filter capacitance (C f ) is given in below equation
√
R2 + (2ωL)2=
102ωC f
(C.39)
Simplifying the above equation,
C f =10
4π f√
R2 + (4π f L)2(C.40)
The value of the filter inductance can be calculated from ripple factor (rf) which is defined as the
ratio between the input and output voltage of the converter.
r f =Vac
Vdc=
V02
Vdc=
V2h
Vdc
1
(4π f )2L f C f − 1(C.41)
Assume, 5% of the ripples in the output voltage,
L f =10.428
(4π f )2C f
(C.42)
Similarly, the value of the filter capacitance and inductance for 3Φ ac to dc converter is given
below,
C f =10
(12π f )2√
R2 + (12π f L)2(C.43)
164
TH-1265_KANNANT
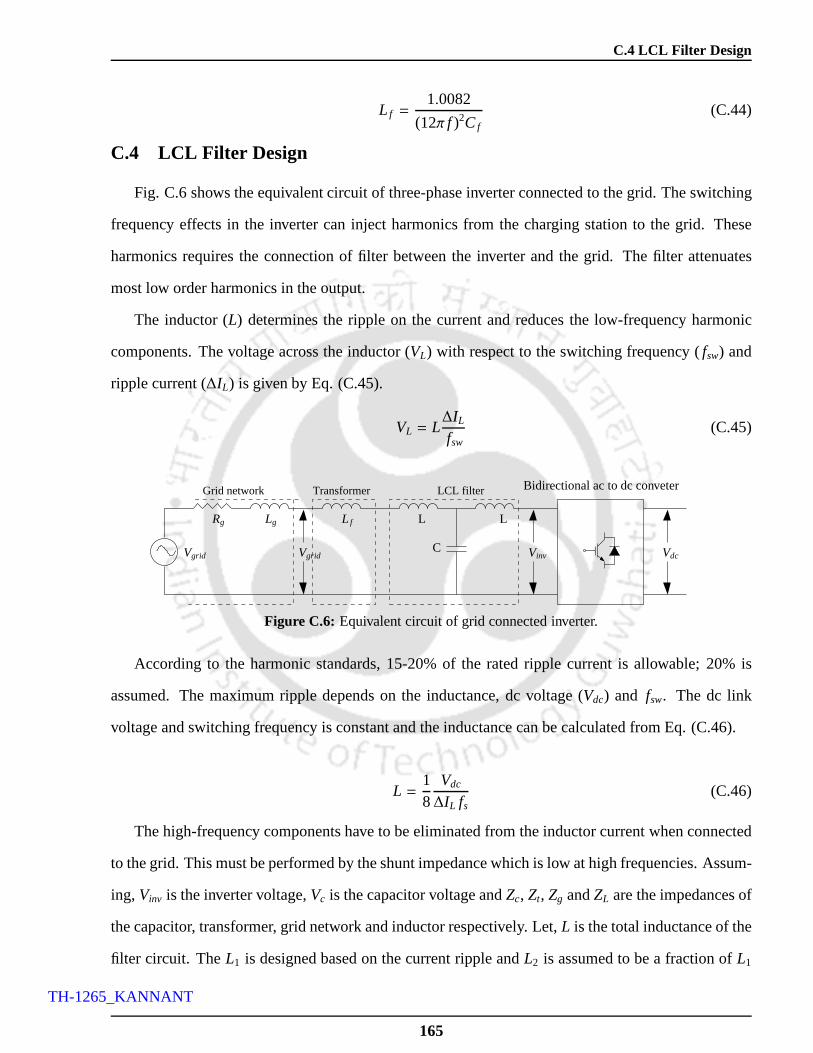
C.4 LCL Filter Design
L f =1.0082
(12π f )2C f
(C.44)
C.4 LCL Filter Design
Fig. C.6 shows the equivalent circuit of three-phase inverter connected to the grid. The switching
frequency effects in the inverter can inject harmonics fromthe charging station to the grid. These
harmonics requires the connection of filter between the inverter and the grid. The filter attenuates
most low order harmonics in the output.
The inductor (L) determines the ripple on the current and reduces the low-frequency harmonic
components. The voltage across the inductor (VL) with respect to the switching frequency (fsw) and
ripple current (∆IL) is given by Eq. (C.45).
VL = L∆IL
fsw(C.45)
Grid network LCL filterTransformer
Vdc
Rg Lg L f
VgridC
L
Vinv
Bidirectional ac to dc conveter
Vgrid
L
Figure C.6: Equivalent circuit of grid connected inverter.
According to the harmonic standards, 15-20% of the rated ripple current is allowable; 20% is
assumed. The maximum ripple depends on the inductance, dc voltage (Vdc) and fsw. The dc link
voltage and switching frequency is constant and the inductance can be calculated from Eq. (C.46).
L =18
Vdc
∆IL fs(C.46)
The high-frequency components have to be eliminated from the inductor current when connected
to the grid. This must be performed by the shunt impedance which is low at high frequencies. Assum-
ing, Vinv is the inverter voltage,Vc is the capacitor voltage andZc, Zt, Zg andZL are the impedances of
the capacitor, transformer, grid network and inductor respectively. Let,L is the total inductance of the
filter circuit. TheL1 is designed based on the current ripple andL2 is assumed to be a fraction ofL1
165
TH-1265_KANNANT

C. Filter Design
or greater than or less than ofL1. Therefore, the total inductance of the filter circuit is defined as the
sum of filter inductanceL1 andL2 (L = L1 + L2). The relationship between theL1 andL2 is L1 = aL2.
The transfer function of the Fig. C.6 is given in Eq. (C.47).
Io(s)Vinv(s)
=Zc(s)(Zt(s) + Zg(s))
Zc(s)(Zt(s) + Zg(s) + ZL1(s)) + ZL1(s)(Zt(s) + Zg(s))(C.47)
The LCL filter transfer function which affects the closed loop system bandwidth in grid connected
mode of operation is
io(s)Vinv(s)
=1
s3LC(
Lg + Lt
)
+ s2LRgC + s(
L + Lt + Lg
)
+ Rg
(C.48)
The filter capacitance value has been obtained from the aboveequation.
C = −sk
(
L + Lt + Lg
)
+ kRg − 1
Lks2(
s(
Lg + Lt
)
+ Rg
) (C.49)
where,k = ioVinv
. Consider a charging system have 80kW peak power handling capacity and the
three-phase inverter connected to a grid network through anisolation transformer 11kV/440V∆/Y.
The dc-link voltage is 650V and switched frequency of the three-phase inverter is 4kHz. From Eq.
(C.46), the filter inductance will be 0.000008548845451H. The standards state that the harmonic
orders greater than 35 must not exceed 0.2% rated current [201]. Thus, the calculated value of the
filter capacitance isC = 0.5343028409e−5F. The grid network impedanceLg andRg vary depending
on where CS is connected to the grid. The grid impedance used in the analysis isLg = 6.422× 10⁻⁵
andRg= 0.08064. The maximum current flow from inverter to grid is givenbelow,
io =Pcs√3Vgrid
(C.50)
The simplified equation for the filter capacitance by substituting the values in Eq. (C.49) and
s= Inω,
C =6399.99(1.1949e6s− 0.9869)
s2(7.3987e6s+ 0.08064)(C.51)
166
TH-1265_KANNANT

DSynchronization
167
TH-1265_KANNANT
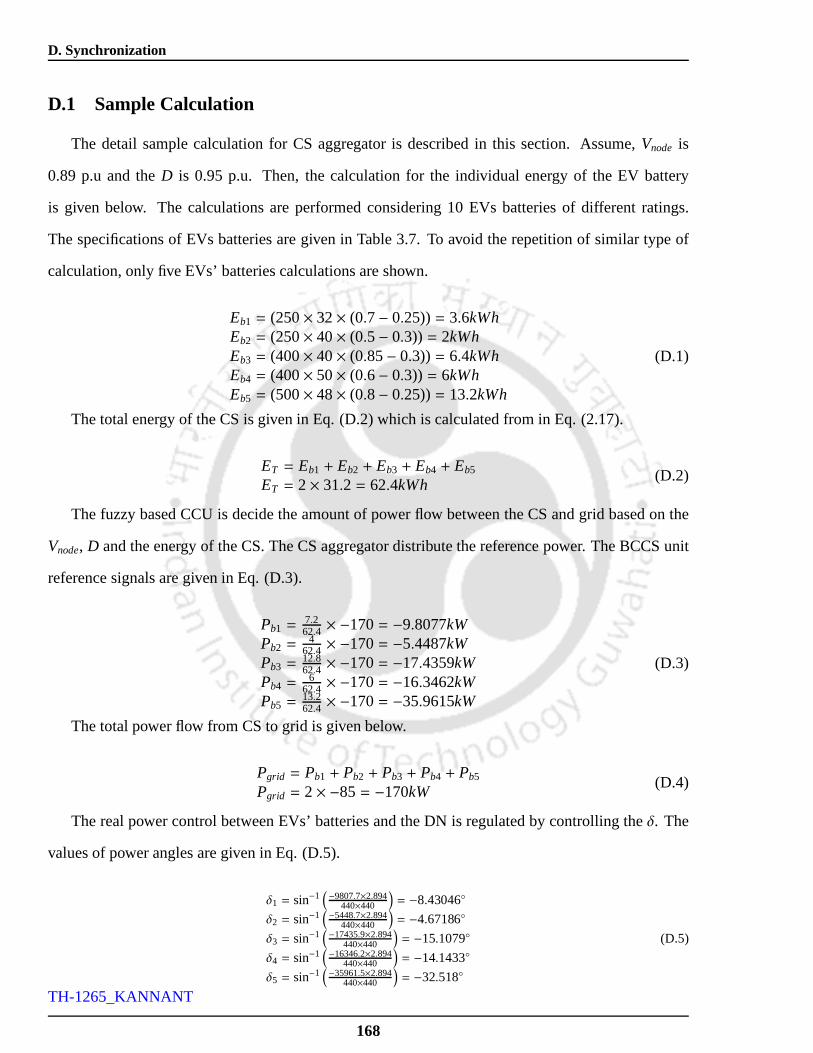
D. Synchronization
D.1 Sample Calculation
The detail sample calculation for CS aggregator is described in this section. Assume,Vnode is
0.89 p.u and theD is 0.95 p.u. Then, the calculation for the individual energyof the EV battery
is given below. The calculations are performed considering10 EVs batteries of different ratings.
The specifications of EVs batteries are given in Table 3.7. Toavoid the repetition of similar type of
calculation, only five EVs’ batteries calculations are shown.
Eb1 = (250× 32× (0.7− 0.25)) = 3.6kWhEb2 = (250× 40× (0.5− 0.3)) = 2kWhEb3 = (400× 40× (0.85− 0.3)) = 6.4kWhEb4 = (400× 50× (0.6− 0.3)) = 6kWhEb5 = (500× 48× (0.8− 0.25)) = 13.2kWh
(D.1)
The total energy of the CS is given in Eq. (D.2) which is calculated from in Eq. (2.17).
ET = Eb1 + Eb2 + Eb3 + Eb4 + Eb5
ET = 2× 31.2 = 62.4kWh(D.2)
The fuzzy based CCU is decide the amount of power flow between the CS and grid based on the
Vnode, D and the energy of the CS. The CS aggregator distribute the reference power. The BCCS unit
reference signals are given in Eq. (D.3).
Pb1 =7.262.4 × −170= −9.8077kW
Pb2 =4
62.4 × −170= −5.4487kWPb3 =
12.862.4 × −170= −17.4359kW
Pb4 =6
62.4 × −170= −16.3462kWPb5 =
13.262.4 × −170= −35.9615kW
(D.3)
The total power flow from CS to grid is given below.
Pgrid = Pb1 + Pb2 + Pb3 + Pb4 + Pb5
Pgrid = 2× −85= −170kW(D.4)
The real power control between EVs’ batteries and the DN is regulated by controlling theδ. The
values of power angles are given in Eq. (D.5).
δ1 = sin−1(
−9807.7×2.894440×440
)
= −8.43046
δ2 = sin−1(
−5448.7×2.894440×440
)
= −4.67186
δ3 = sin−1(
−17435.9×2.894440×440
)
= −15.1079
δ4 = sin−1(
−16346.2×2.894440×440
)
= −14.1433
δ5 = sin−1(
−35961.5×2.894440×440
)
= −32.518
(D.5)
168
TH-1265_KANNANT

D.2 Synchronization Operation
D.2 Synchronization Operation
Fig. D.1 shows the functional block diagram of the synchronization controller. It mainly consists
of discrete three-phase PLL units, which extract the synchronization parameters (frequency and phase
sequence) of the DN andVprim, three-phase to two phase transformation and vice versa, LA-FLC and
power estimator. three-phaseVnode is the input forabc− dq0 transformation unit and discrete three-
phase PLL.
conversionp.u.
SPWM
wt
converterLCL filterTransformer
Distribution
Node
Circuit Breaker
L
CL
P
Freq
sin_cossin_cos
Freq
3 ph
ase
PLL
Power estimator
wtwt
dq0 to abctransformation
3 phase PLL
abc to dq0transformation
Freq
sin_cossin_cos
Control signal Synchronizationcondition checkSynchronization
parameters
1 or 0
LA − FLC
Carrier signal
Gat
e P
ulse
Vnode
Pmea
Vprim IprimVprim
Vdq0
Vabc
δ
Vdq0
Vnode
Vnode
δ
Pbn
Er
δ
Figure D.1: Detailed block diagram of the FLC based synchronization controller.
One of the important conditions for synchronizing any Distributed Energy Resource (DER) with
the grid is the line voltage of the DER system which must be equal or slightly greater than the line
voltage of the grid. To satisfy this condition, the EVs batteries arrive at the charging station would
discharge some energy initially for synchronizing with thegrid. The system will be in floating con-
dition for some period and no power transfer occurs. After synchronization operation, the direction
of power transfer is decided. This must be satisfied for all EVs in the charging station arriving with
high and low values of SOC. The buck-boost converter presentin the EV battery system handles this
operation. The duty ratio of the buck-boost converter is controlled and does the necessary operation
and maintains the voltage level in the grid side. Initially,the EVs batteries have to discharge its energy
169
TH-1265_KANNANT

D. Synchronization
to perform the synchronization operation. The control process is briefly described here.
D.2.1 Control Process
The objective of the control system is to control the charging/ discharging process of EVs’ batter-
ies, which mainly depend on DN voltage, energy status of the EVs’ batteries and duration to support
the grid (Vnode, ET andD). These inputs are given to Central Control Unit (CCU) and Charging Sta-
tion (CS) aggregator, from whichPbn is fed inside the BCCS unit to control the charging/discharging
states of EVs’ batteries.
The input from the CS aggregator (Pbn) is the main control signal for the controllers in the BCCS
unit. ThePbn is fed into the LA-FLC, which determines the amount and direction of power flow
from/to the DN for both G2V and V2G operation.Pbn is also fed into the charging current control
of the buck-boost converter in the battery side; which determines the reference current signal for the
inner CC-FLC, as we required controlling the charging rate of the battery.
When EVs arrive at the CS, the BCCS unit will get connected with the DN and when it leaves
the CS, the BCCS unit will get disconnected. However, the cases of charging/discharging operation
of EVs; the initial synchronization process with the grid isnecessary; without which the real power
transfers in any direction cannot be controlled. The importance of synchronization of any power
converters connected to the grid is explained in [168] and synchronization of BCCS unit has been
described in reference [158]. For achieving this synchronization operation and to control the real
power flow, we have load/power angle control in our work shownin Fig. 3.8. The LA-FLC provides
the requiredδ to cause the power flow in any direction. The amount and direction of real power
transfer take place, when the voltage produced by the BCCS unit leads or lags the voltage of the DN.
This process is done by controlling the load angle of the BCCSunit. Thus, the charging/discharging
process of EVs are controlled through appropriate control of the power converter based on the control
signal from the CS aggregator.
During the synchronization period, the system is controlled and there is no power transfer between
DN and EVs’ batteries. However, the EVs arrive at the CS will have some initial discharge of energy.
There will be a small negative flow of current during the synchronization period. This is because, the
170
TH-1265_KANNANT

D.2
Synchronization
Operation
EV
Battery
Pack
Grid
L
S2
S1 S3
S4
S5
S6
S8
S7S9
S10
S11
S12
S13
D2
D1 D3
D4
D5
D6
D8
D7
D9
D10
D11
D12
D13
S14
D14C1 C2
Cdc Cb1 Cb2Lb
PrimaryCoil
Circuit
breaker
Vdcmeaa
3Φ ac to dc converter dc to high frequency ac
converter
1Φ ac to dc
converterdc to dc converter
Ipc
SecondaryCoilTransformer L
C
Contactless
coil
Lr
Load angle control 1Φ SPWM DC Voltage
control
Primary Side Secondary Side
Control signal
Lr
Isc
Ic/d
/i i
C
c dV
Power flow
Figure D.2: Detailed circuit topology of individual BCCS unit
171
TH-1265_KANNANT

D. Synchronization
EVs’ arrive at the CS will make a closed path through converter switches having low resistance and
there is some initial current flow through LCL filter and this consumes very less power. The detailed
circuit topology of individual BCCS unit with current flow direction at the initial synchronization
period is shown in Fig. D.2.
172
TH-1265_KANNANT
EEconomic Beneficiary Calculation for EVs
Owners, Grid Operators and Consumers
173
TH-1265_KANNANT

E. Economic Beneficiary Calculation for EVs Owners, Grid Operators and Consumers
E.1 Sample Calculation
In this Section, sample calculation for economic beneficiary of EV owners and grid operators is
described. Let, capacity of the battery is 80.025 after 332 (n’) cycle. The following data’s are obtained
from battery and capacity fade model:PEc/d = 56.05kWh, Eq = 3.392kWh, Estor = 25.61kWh,
Etranspor = 10.67 andErem = Estor − Etranspor = 25.61− 10.67= 14.94kWh.
Also, the following assumptions are made:c = 0 (energy supplied by the grid to EVs’ batteries
during peak hours),s′ = 0 (energy obtained by the grid during peak hours), total lifeof the battery
(n = 2801),D = 1, M =Rs.3, 00, 000 andx′ = 4.
The input energy to the battery provided by the grid has been calculated from Eq. (4.4).
EGib = 32×
(
10090
)
EGib = 35.55kWh
(E.1)
The total amount of money paid by the EV owners to grid operators during a complete day is
given in Eq. (4.5).
APevg= cx+ c′x′ = 0x+ c′x′
APevg= 35.55× 4 = Rs.142.222.(E.2)
The actual amount of energy that the grid obtains from the EV is calculated from Eq. (4.13).
Etrans =
(
90100
)
14.94= 13.446kWh (E.3)
The amount paid by the grid operators to EV owner is obtained from Eq. (4.15).
APgev= sx2+s′x2′= sx2 + 0x′2
APgev= sx2(E.4)
Thex2 is relative quantity, it can be determined from Eq. (4.27).
⇒ cx+ c′x′ +z+ nM
n′D = sx2+s′x2
′
cx+ c′x′ +z+ nM
n′D = sx2 + s′x2
0+ 32×40.9 +
z+ 332×3000002801
2801 = 13.446x2 + 0x′2142.22+ z+35558.73
2801 = 13.446x2
x2 = 11.5214+ z37662.246
(E.5)
The value ofz can be determined by using Eq. (4.21) and Eq. (4.22).
174
TH-1265_KANNANT

E.1 Sample Calculation
z≥ 3MdepEq
2EavailnPEc/d
z≥ 3MdepEq
2EavailnPEc/d
z≥ 3×300000×6.3922×14.94×2801×56.05 ≥ 1.226
z= 1.23
(E.6)
Substitute the value ofz in Eq. (E.5),
x2 = 11.5214+ 1.2337662.246
x2 = Rs.11.52(E.7)
The total amount of money paid by the grid operators to the EV owners during a complete day is
calculated from Eq. (4.15).
APgev= sx2 + s′x2 = sx2 + 0x2
APgev= sx2 = 13.446× 11.52APgev= Rs.145.89792
(E.8)
Profit for EV owners is calculated from Eq. (4.28)
x2′ ≥ x′x2 ≥ x′ ≥ 4 (E.9)
The total amount of money paid by the consumers to the grid operators during a complete day is
calculated from Eq. (4.29).
Acg= sx1+s′x1 = sx1
Acg=13.446× 11.53Acg=Rs.155.03
(E.10)
Profit for grid operators is calculated from Eq. (4.30).
x1 ≥ x2 ≥ Rs.11.52 (E.11)
Total energy consumed per kilometer is225km40kWh = 5.625km/kWh. To charge the EVs’ battery from
grid, the consumers payRs. 154.056 per day. Therefore, cost per km isRs. 3.34.
175
TH-1265_KANNANT

E. Economic Beneficiary Calculation for EVs Owners, Grid Operators and Consumers
176
TH-1265_KANNANT
Bibliography
[1] EIG, “Battery Charge Rate Characteristics,” http://www.eigbattery.com/.
[2] J. Sallan, J. Villa, A. Llombart, and J. Sanz, “Optimal design of ICPT systems applied to electric vehiclebattery charge,”IEEE Trans. Ind. Electron., vol. 56, no. 6, pp. 2140–2149, June 2009.
[3] “Electricity Generation in India and Power Sector at a Glance ”ALL INDIA”,”http://en.wikipedia.org/wiki/Electricitysectorin Indiaandhttp://www.powermin.nic.in/indianelectricity scenario/introduction.htm.
[4] “Indian Energy Sector: An Overview,” http://http://en.wikipedia.org/wiki/Electricitysectorin India.
[5] “Energy Calculation per Capita,” http://www.indexmundi.com/g/r.aspx?v=81000.
[6] “Electricity Generation in India,” http://www.teriin.org/events/docs/Cop14/mitigation.pdf.
[7] “Peak power demand in assam,” http://articles.economictimes.indiatimes.com/2012-12-27/news/360220941 power-projects-power-allocation-free-power.
[8] AERC, “Assam Electricity Regulatory Commission,” http://aerc.nic.in/.
[9] M. Singh, P. Kumar, and I. Kar, “Analysis of vehicle to grid concept in indian scenario,” 14th Int. PowerElectron. and Motion Control Conf. (EPE/PEMC’10), pp. T6–149–T6–156, Sept. 2010.
[10] “Design Department of Assam Electricity Grid Corporation Ltd. [online].”Available:http://www.aegclsldc.org/1024.html,2010.
[11] “Battery (electricity),” Available:http://en.wikipedia.org/wiki/Battery28electricity29 andhttp://batteryuniversity.com/learn/article/charginglithium ion batteries.
[12] S. Buller, E. Karden, D. Kok, and R. De Doncker, “Modeling the dynamic behavior of supercapacitorsusing impedance spectroscopy,”IEEE Trans. Ind. Appl., vol. 38, no. 6, pp. 1622–1626, Nov./Dec. 2002.
[13] D. Cericola, P. Ruch, R. KAJtz, P. NovAk, and A. Wokaun, “Simulation of a supercapacitor/Li-ionbattery hybrid for pulsed applications,”J. of Power Sources, vol. 195, no. 9, pp. 2731–2736, May 2010.
[14] W. Hassenzahl, “Superconducting magnetic energy storage,” in Proc. of IEEE, vol. 71, no. 9, pp. 1089–1098, Sept. 1983.
[15] W. Buckles and W. Hassenzahl, “Superconducting magnetic energy storage,”IEEE Power EngineeringReview, vol. 20, no. 5, pp. 16–20, May 2000.
[16] H. Louie and K. Strunz, “Superconducting magnetic energy storage (SMES) for energy cache controlin modular distributed hydrogen-electric energy systems,” IEEE Trans. Appl. Supercond., vol. 17, no. 2,pp. 2361–2364, 2007.
177
TH-1265_KANNANT
BIBLIOGRAPHY
[17] D. Wang, Z. hui Wu, G. Xu, D. da Wang, M. Song, and X. tao Peng, “Real-time power control ofsuperconducting magnetic energy storage,”IEEE Int. Conf. on Power Syst. Technol. (POWERCON’12),Oct./Nov. 2012.
[18] M. Komori and Y. Uchimura, “Improving the dynamics of two types of flywheel energy storage systemswith SMBs,” IEEE Trans. Appl. Supercond., vol. 15, no. 2, pp. 2261–2264, June 2005.
[19] A. Buchroithner, I. Andrasec, and M. Bader, “Optimal system design and ideal application of flywheelenergy storage systems for vehicles,”IEEE Int. Energy Conf. and Exhibition (ENERGYCON’12), pp.991–996, Sept. 2012.
[20] “Flywheel,” http://advantage-environment.com/framtid/energy-storage-with-flywheel-technology/.
[21] R. Hein, P. R. Kleindorfer, and S. Spinler, “Valuation of electric vehicle batteries in vehicle-to-grid andbattery-to-grid systems,”Technological Forecasting and Social Change, vol. 79, no. 9, pp. 1654–1671,Nov. 2012.
[22] J. Tomic and W. Kempton, “Using fleets of electric-drive vehicles for grid support,”J. of Power Sources,vol. 168, no. 2, pp. 459–468, June 2007.
[23] W. Kempton and J. Tomic, “Vehicle-to-grid power implementation: From stabilizing the grid to support-ing large-scale renewable energy,”J. of Power Sources, vol. 144, no. 1, pp. 280–294, June 2005.
[24] S. Deilami, A. Masoum, P. Moses, and M. A. S. Masoum, “Real-time coordination of plug-in electricvehicle charging in smart grids to minimize power losses andimprove voltage profile,”IEEE Trans.Smart Grid, vol. 2, no. 3, pp. 456–467, Sept. 2011.
[25] C. Quinn, D. Zimmerle, and T. Bradley, “An evaluation ofstate-of-charge limitations and actuationsignal energy content on plug-in hybrid electric vehicle, vehicle-to-grid reliability, and economics,”IEEETrans. Smart Grid, vol. 3, no. 1, pp. 483–491, Mar. 2012.
[26] C. K. Ekman, “On the synergy between large electric vehicle fleet and high wind penetration - an analysisof the danish case,”Renewable Energy, vol. 36, no. 2, pp. 546–553, Feb. 2011.
[27] J. M. L. Camila Fernandes, Pablo Frias, “Impact of vehicle-to-grid on power system operation costs:The spanish case study,”Applied Energy, vol. 96, no. 0, pp. 194–202, Aug. 2012.
[28] J. Barton and D. Infield, “Energy storage and its use withintermittent renewable energy,”IEEE Trans.Energy Convers., vol. 19, no. 2, pp. 441–448, June 2004.
[29] C.-S. Wang, O. Stielau, and G. Covic, “Design considerations for a contactless electric vehicle batterycharger,”IEEE Trans. Ind. Electron., vol. 52, no. 5, pp. 1308–1314, Oct. 2005.
[30] Y. Ma, T. Houghton, A. Cruden, and D. Infield, “Modeling the benefits of vehicle-to-grid technology toa power system,”IEEE Trans. Power Syst., vol. 27, no. 2, pp. 1012–1020, May 2012.
[31] Y. Ota, H. Taniguchi, T. Nakajima, K. Liyanage, J. Baba,and A. Yokoyama, “Autonomous distributedV2G (vehicle-to-grid) satisfying scheduled charging,”IEEE Trans. Smart Grid, vol. 3, no. 1, pp. 559–564, Mar. 2012.
[32] L. Pieltain Fernandez, T. Roman, R. Cossent, C. Domingo, and P. Frias, “Assessment of the impact ofplug-in electric vehicles on distribution networks,”IEEE Trans. Power Syst., vol. 26, no. 1, pp. 206–213,Feb. 2011.
178
TH-1265_KANNANT
BIBLIOGRAPHY
[33] Z. Darabi and M. Ferdowsi, “Aggregated impact of plug-in hybrid electric vehicles on electricity demandprofile,” IEEE Trans. Sustain. Energy, vol. 2, no. 4, pp. 501–508, Oct. 2011.
[34] M. Singh, P. Kumar, and I. Kar, “A multi charging stationfor electric vehicles and its utilization for loadmanagement and the grid support,” pp. 1026–1037, June 2013.
[35] Y. Ma, T. Houghton, A. Cruden, and D. Infield, “Modeling the benefits of vehicle-to-grid technology toa power system,”IEEE Trans. Power Syst., vol. 27, no. 2, pp. 1012–1020, May 2012.
[36] K. Qian, C. Zhou, M. Allan, and Y. Yuan, “Modeling of loaddemand due to EV battery charging indistribution systems,”IEEE Trans. Power Syst., vol. 26, no. 2, pp. 802–810, May 2011.
[37] G. Joos, M. De Freige, and M. Dubois, “Design and simulation of a fast charging station for PHEV/EVbatteries,”IEEE Electric Power and Energy Conf. (EPEC’10), pp. 1–5, Aug. 2010.
[38] C. Alaoui, “Solid-state thermal management for lithium-ion EV batteries,”IEEE Trans. Veh. Technol.,vol. 62, no. 1, pp. 98–107, Jan. 2013.
[39] M. Chen and G. Rincon-Mora, “Accurate electrical battery model capable of predicting runtime and I-Vperformance,”IEEE Trans. Energy Convers., vol. 21, no. 2, pp. 504–511, June 2006.
[40] T.-K. Lee, B. Adornato, and Z. Filipi, “Synthesis of real-world driving cycles and their use for estimatingPHEV energy consumption and charging opportunities: Case study for Midwest/U.S.”IEEE Trans. Veh.Technol., vol. 60, no. 9, pp. 4153–4163, Nov. 2011.
[41] RicardoFariaandPedroMouraandJoaquimDelgadoandAnibalT.deAlmeida, “A sustainability assessmentof electric vehicles as a personal mobility system,”Energy Conversion and Management, vol. 61, pp.19–30, Sept. 2012.
[42] “Electric vehicle battery,” http://en.wikipedia.org/wiki/Electric vehicle battery.
[43] P. H. Andersen, J. A. Mathews, and M. Rask, “Integratingprivate transport into renewable energy policy:The strategy of creating intelligent recharging grids for electric vehicles,”Energy Policy, vol. 37, no. 7,pp. 2481–2486, July 2009.
[44] J. Mullan, D. Harries, T. Braunl, and S. Whitely, “The technical, economic and commercial viability ofthe vehicle-to-grid concept,”Energy Policy, vol. 48, no. 0, pp. 394–406, Sept. 2012.
[45] Y. A. R. I. Mohamed and E. El-Saadany, “Hybrid variable-structure control with evolutionary optimum-tuning algorithm for fast grid-voltage regulation using inverter-based distributed generation,”IEEETrans. Power Electron., vol. 23, no. 3, pp. 1334–1341, May 2008.
[46] H. Sepahvand, J. Liao, and M. Ferdowsi, “Investigationon capacitor voltage regulation in cascaded h-bridge multilevel converters with fundamental frequency switching,” IEEE Trans. Ind. Elect., vol. 58,no. 11, pp. 5102–5111, Nov. 2011.
[47] H. Fujita and H. Akagi, “Voltage-regulation performance of a shunt active filter intended for installationon a power distribution system,”IEEE Trans. Power Electron., vol. 22, no. 3, pp. 1046–1053, May 2007.
[48] E. Demirok, P. Casado Gonzaalez, K. Frederiksen, D. Sera, P. Rodriguez, and R. Teodorescu, “Localreactive power control methods for overvoltage preventionof distributed solar inverters in low-voltagegrids,” IEEE Journal of Photovoltaics, vol. 1, no. 2, pp. 174–182, Oct. 2011.
179
TH-1265_KANNANT

BIBLIOGRAPHY
[49] F. Wang, J. Duarte, and M. A. M. Hendrix, “Pliant active and reactive power control for grid-interactiveconverters under unbalanced voltage dips,”IEEE Trans. Power Electron., vol. 26, no. 5, pp. 1511–1521,May 2011.
[50] J. Escudero-Garzas, A. Garcia-Armada, and G. Seco-Granados, “Fair design of plug-in electric vehiclesaggregator for V2G regulation,”IEEE Trans. Veh. Technol., vol. 61, no. 8, pp. 3406–3419, Oct. 2012.
[51] G. Liu and K. Tomsovic, “Quantifying spinning reserve in systems with significant wind power penetra-tion,” IEEE Trans. Power Syst., vol. 27, no. 4, pp. 2385–2393, Nov. 2012.
[52] N. Chowdhury and R. Billinton, “Export/import of spinning reserve in interconnected generation sys-tems,”IEEE Trans. Power Syst., vol. 6, no. 1, pp. 43–50, Feb. 1991.
[53] A. Abiri-Jahromi, M. Fotuhi-Firuzabad, and E. Abbasi,“Optimal scheduling of spinning reserve basedon well-being model,”IEEE Trans. Power Syst., vol. 22, no. 4, pp. 2048–2057, Nov. 2007.
[54] M. Q. Wang and H. Gooi, “Spinning reserve estimation in microgrids,” IEEE Trans. Power Syst., vol. 26,no. 3, pp. 1164–1174, Aug. 2011.
[55] N. Chowdhury and R. Billinton, “Assessment of spinningreserve in interconnected generation systemswith export/import constraints,”IEEE Trans. Power Syst., vol. 4, no. 3, pp. 1102–1109, Aug. 1989.
[56] ——, “Export/import of spinning reserve in interconnected generation systems,”IEEE Trans. PowerSyst., vol. 6, no. 1, pp. 43–50, Feb. 1991.
[57] E. Sortomme and M. El-Sharkawi, “Optimal scheduling ofvehicle-to-grid energy and ancillary services,”IEEE Trans. Smart Grid, vol. 3, no. 1, pp. 351–359, March 2012.
[58] H. Khayyam, H. Ranjbarzadeh, and V. Marano, “Intelligent control of vehicle to grid power,”J. of PowerSources, vol. 201, no. 0, pp. 1–9, Mar. 2012.
[59] S. Han, S. Han, and K. Sezaki, “Effects of electric vehicles on power systems in northern europe,”Energy, vol. 48, no. 1, pp. 356–368, Dec. 2012.
[60] Bessa, R. J., and M. A. Matos, “The role of an aggregator agent for ev in the electricity market,” 7th
Mediterranean Conf. and Exhibition on Power Gener. Transm.Distrib. and Energy Convers. (Med-Power’10), Nov. 2010.
[61] S. Han, S. Han, and K. Sezaki, “Estimation of achievablepower capacity from plug-in electric vehiclesfor V2G frequency regulation: Case studies for market participation,” IEEE Trans. Smart Grid, vol. 2,no. 4, pp. 632–641, Dec. 2011.
[62] S.-K. Kim, J.-H. Jeon, C.-H. Cho, J.-B. Ahn, and S.-H. Kwon, “Dynamic modeling and control of a grid-connected hybrid generation system with versatile power transfer,”IEEE Trans. Ind. Electron., vol. 55,no. 4, pp. 1677–1688, Apr. 2008.
[63] M. De Freige, G. Joos, and M. Dubois, “Energy management& scheduling in a fast charging station forPHEV batteries,”IEEE Power and Energy Society General Meeting (PES’11), pp. 1–5, July 2011.
[64] Y. He, B. Venkatesh, and L. Guan, “Optimal scheduling for charging and discharging of electric vehi-cles,” IEEE Trans. Smart Grid, vol. 3, no. 3, pp. 1095–1105, Sept. 2012.
[65] E. Sortomme and M. El-Sharkawi, “Optimal charging strategies for unidirectional vehicle-to-grid,”IEEETrans. Smart Grid, vol. 2, no. 1, pp. 131–138, March 2011.
180
TH-1265_KANNANT
BIBLIOGRAPHY
[66] K. Clement-Nyns, E. Haesen, and J. Driesen, “The impactof charging plug-in hybrid electric vehicleson a residential distribution grid,”IEEE Trans. Power Syst., vol. 25, no. 1, pp. 371–380, Feb. 2010.
[67] G. Li and X.-P. Zhang, “Modeling of plug-in hybrid electric vehicle charging demand in probabilisticpower flow calculations,”IEEE Trans. Smart Grid, vol. 3, no. 1, pp. 492–499, March 2012.
[68] J. Lopes, F. Soares, and P. Almeida, “Integration of electric vehicles in the electric power system,”inProc. of IEEE, vol. 99, no. 1, pp. 168–183, Jan. 2011.
[69] S. S. Raghavan and A. Khaligh, “Impact of plug-in hybridelectric vehicle charging on a distributionnetwork in a smart grid environment,”IEEE PES Innovative Smart Grid Technol. (ISGT’12), pp. 1–7,Jan. 2012.
[70] E. Sortomme, E. Doheny, and M. El-Sharkawi, “The effectof electric vehicle drive efficiency on biddingvehicle-to-grid services,”IEEE Int. Electric Machines Drives Conf. (IEMDC’11), pp. 1288–1293, May2011.
[71] M. Khan, I. Husain, and Y. Sozer, “Integrated electric motor drive and power electronics for bidirec-tional power flow between electric vehicle and DC or AC grid,”IEEE Energy Convers. Congress andExposition (ECCE’12), pp. 3403–3410, Sept. 2012.
[72] L. Hui-ling, B. Xiao-min, and T. Wen, “Impacts of plug-in hybrid electric vehicles charging on distribu-tion grid and smart charging,”IEEE Int. Conf. on Power Syst. Technol. (POWERCON’12), pp. 1–5, Oct.2012.
[73] S. Han, S. Han, and K. Sezaki, “Development of an optimalvehicle-to-grid aggregator for frequencyregulation,”IEEE Trans. Smart Grid, vol. 1, no. 1, pp. 65–72, June 2010.
[74] M. Singh, P. Kumar, and I. Kar, “Implementation of vehicle to grid infrastructure using fuzzy logiccontroller,” IEEE Trans. Smart Grid, vol. 3, no. 1, pp. 565–577, Mar. 2012.
[75] D. Steen, L. Tuan, O. Carlson, and L. Bertling, “Assessment of electric vehicle charging scenarios basedon demographical data,”IEEE Trans. Smart Grid, vol. 3, no. 3, pp. 1457–1468, Sept. 2012.
[76] J. Xu and V. Wong, “An approximate dynamic programming approach for coordinated charging controlat vehicle-to-grid aggregator,”IEEE Int. Conf. on Smart Grid Communications (SmartGridComm’11),pp. 279–284, Oct. 2011.
[77] D. Wu, D. Aliprantis, and L. Ying, “Load scheduling and dispatch for aggregators of plug-in electricvehicles,”IEEE Trans. Smart Grid, vol. 3, no. 1, pp. 368–376, March 2012.
[78] C. Wu, H. Mohsenian-Rad, and J. Huang, “Vehicle-to-aggregator interaction game,”IEEE Trans. SmartGrid, vol. 3, no. 1, pp. 434–442, Mar. 2012.
[79] L. Gao, S. Liu, and R. Dougal, “Dynamic lithium-ion battery model for system simulation,”IEEE Trans.Comp. Packag. Technol., vol. 25, no. 3, pp. 495–505, Sept. 2002.
[80] J. Dogger, B. Roossien, and F. Nieuwenhout, “Characterization of li-ion batteries for intelligent manage-ment of distributed grid-connected storage,”IEEE Trans. Energy Convers., vol. 26, no. 1, pp. 256–263,Mar. 2011.
[81] S. Beer, T. Gomez, D. Dallinger, I. Momber, C. Marnay, M.Stadler, and J. Lai, “An economic analysisof used electric vehicle batteries integrated into commercial building microgrids,”IEEE Trans. SmartGrid, vol. 3, no. 1, pp. 517–525, Mar. 2012.
181
TH-1265_KANNANT

BIBLIOGRAPHY
[82] U. Madawala and D. Thrimawithana, “A bidirectional inductive power interface for electric vehicles inV2G systems,”IEEE Trans. Ind. Electron., vol. 58, no. 10, pp. 4789–4796, Oct. 2011.
[83] ——, “A single controller for inductive power transfer systems,”IEEE 35th Annual Conf. of Ind. Elec-tron. (IECON ’09), pp. 109–113, Nov. 2009.
[84] D. Thrimawithana and U. Madawala, “A three-phase bi-directional IPT system for contactless chargingof electric vehicles,”IEEE Int. Symp. on Ind. Electron. (ISIE’11), pp. 1957–1962, June 2011.
[85] M. Budhia, G. Covic, and J. Boys, “A new IPT magnetic coupler for electric vehicle charging systems,”36th Annual Conf. on IEEE Ind. Electron. Society (IECON’10), pp. 2487–2492, Nov. 2010.
[86] M. Pinuela, D. Yates, S. Lucyszyn, and P. Mitcheson, “Maximizing DC-to-load efficiency for inductivepower transfer,”IEEE Trans. Power Electronics, vol. 28, no. 5, pp. 2437–2447, May 2013.
[87] C.-S. Wang, G. Covic, and O. Stielau, “Power transfer capability and bifurcation phenomena of looselycoupled inductive power transfer systems,”IEEE Trans. Ind. Electron., vol. 51, no. 1, pp. 148–157, Feb.2004.
[88] S. Mohagheghi, B. Parkhideh, and S. Bhattacharya, “Inductive power transfer for electric vehicles: Po-tential benefits for the distribution grid,”IEEE Int. Electric Veh. Conf. (IEVC’12), pp. 1–8, March 2012.
[89] H. L. Li, A. Hu, and G. Covic, “A direct AC - AC converter for inductive power-transfer systems,”IEEETrans. Power Electron., vol. 27, no. 2, pp. 661–668, Feb. 2012.
[90] T. Bieler, M. Perrottet, V. Nguyen, and Y. Perriard, “Contactless power and information transmission,”IEEE Trans. Ind. Appl., vol. 38, no. 5, pp. 1266–1272, Sept./Oct. 2002.
[91] J. Zhao, J. Jiang, and X. Yang, “AC-DC-DC isolated converter with bidirectional power flow capability,”IET Trans. Power Electron., vol. 3, no. 4, pp. 472–479, July 2010.
[92] G. Covic, J. Boys, M. Kissin, and H. Lu, “A three-phase inductive power transfer system for roadway-powered vehicles,”IEEE Trans. Ind. Electron., vol. 54, no. 6, pp. 3370–3378, Dec. 2007.
[93] U. Madawala, M. Neath, and D. Thrimawithana, “A power - frequency controller for bidirectional in-ductive power transfer systems,”IEEE Trans. Ind. Electron., vol. 60, no. 1, pp. 310–317, Jan. 2013.
[94] J. Hayes, M. Egan, J. M. D. Murphy, S. Schulz, and J. Hall,“Wide-load-range resonant converter sup-plying the SAE J-1773 electric vehicle inductive charging interface,”IEEE Trans. Ind. Appl., vol. 35,no. 4, pp. 884–895, Jul./Aug. 1999.
[95] J. Villa, J. Sallan, J. Sanz Osorio, and A. Llombart, “High-misalignment tolerant compensation topologyfor ICPT systems,”IEEE Trans. Ind. Electron., vol. 59, no. 2, pp. 945–951, Feb. 2012.
[96] D. Thrimawithana, U. Madawala, and M. Neath, “A synchronization technique for bidirectional IPTsystems,”IEEE Trans. Ind. Electron., vol. 60, no. 1, pp. 301–309, Jan. 2013.
[97] D. Yazdani, A. Bakhshai, G. Joos, and M. Mojiri, “A nonlinear adaptive synchronization technique forgrid-connected distributed energy sources,”IEEE Trans. Power Electron., vol. 23, no. 4, pp. 2181–2186,July 2008.
[98] Y. F. Wang and Y. W. Li, “Grid synchronization PLL based on cascaded delayed signal cancellation,”IEEE Trans. Power Electron., vol. 26, no. 7, pp. 1987–1997, July 2011.
182
TH-1265_KANNANT

BIBLIOGRAPHY
[99] L. Zhang, L. Harnefors, and H.-P. Nee, “Power-synchronization control of grid-connected voltage-sourceconverters,”IEEE Trans. Power Syst., vol. 25, no. 2, pp. 809–820, May 2010.
[100] S. Z. Chen, N. Cheung, Y. Zhang, M. Zhang, and X.-M. Tang, “Improved grid synchronization control ofdoubly fed induction generator under unbalanced grid voltage,” IEEE Trans. Energy Convers., vol. 26,no. 3, pp. 799–810, Sept. 2011.
[101] F. Blaabjerg, R. Teodorescu, M. Liserre, and A. Timbus, “Overview of control and grid synchronizationfor distributed power generation systems,”IEEE Trans. Ind. Electron., vol. 53, no. 5, pp. 1398–1409,Oct. 2006.
[102] T. Sharma, B. Sen, and B. C. Babu, “Improved grid synchronization algorithm for DG system usingDSRF PLL under grid disturbances,”IEEE Students Conf. on Engg. and Syst. (SCES ’12), pp. 1–6, Mar.2012.
[103] P. Rodriguez, A. Luna, R. Muoz-Aguilar, I. Etxeberria-Otadui, R. Teodorescu, and F. Blaabjerg, “Astationary reference frame grid synchronization system for three-phase grid-connected power convertersunder adverse grid conditions,”IEEE Trans. Power Electron., vol. 27, no. 1, pp. 99–112, Jan. 2012.
[104] S. Golestan, M. Monfared, F. Freijedo, and J. Guerrero, “Design and tuning of a modified power-basedpll for single-phase grid-connected power conditioning systems,”IEEE Trans. Power Electron., vol. 27,no. 8, pp. 3639–3650, Aug. 2012.
[105] M. P. D. Yazdani and A. Bakhshai, “Three-phase grid synchronization techniques for grid connectedconverters in distributed generation systems,”IEEE Int. Symp. on Ind. Electron. (ISIE’09), pp. 1105–1110, July 2009.
[106] ——, “Single-phase grid-synchronization algorithmsfor converter interfaced distributed generation sys-tems,”IEEE Canadian Conf. on Electrical and Computer Engineering(CCECE’09), pp. 127–131, May2009.
[107] E. Wood, M. Alexander, and T. H. Bradley, “Investigation of battery end-of-life conditions for plug-inhybrid electric vehicles,”J Power Sources, vol. 196, no. 11, pp. 5147–5154, Feb. 2011.
[108] H.-K. Tseng, J. S. Wu, and X. Liu, “Affordability of electric vehicles for a sustainable transport system:An economic and environmental analysis,”Energy Policy, vol. 61, no. 0, pp. 441–447, June 2013.
[109] V. Marano and G. Rizzoni, “Energy and economic evaluation of PHEVs and their interaction with re-newable energy sources and the power grid,”in Proc. IEEE Int. Conf. on Vehicular Electron. and Safety(ICVES’08), pp. 84–89, Sept. 2008.
[110] B. M. Al-Alawi and T. H. Bradley, “Total cost of ownership, payback, and consumer preference modelingof plug-in hybrid electric vehicles,”Applied Energy, vol. 103, no. 0, pp. 488–506, Nov. 2013.
[111] B. Dietz, K. Ahlert, A. Schuller, and C. Weinhardt, “Economic benchmark of charging strategies forbattery electric vehicles,”IEEE Trondheim Power Tech. 2011, pp. 1–8, June 2011.
[112] M. Fasugba and P. Krein, “Cost benefits and vehicle-to-grid regulation services of unidirectional charg-ing of electric vehicles,”in Proc. IEEE Energy Conversion Congress and Expo. (ECCE’11), pp. 827–834, Sept. 2011.
[113] A. De Los Rios, J. Goentzel, K. E. Nordstrom, and C. Siegert, “Economic analysis of vehicle-to-grid(V2G)-enabled fleets participating in the regulation service market,”in Proc. IEEE PES Innovative SmartGrid Technol. (ISGT’12), pp. 1–8, Jan. 2012.
183
TH-1265_KANNANT
BIBLIOGRAPHY
[114] M. Granovskii, I. Dincer, and M. A. Rosen, “Economic and environmental comparison of conventional,hybrid, electric and hydrogen fuel cell vehicles,”J Power Sources, vol. 159, no. 2, pp. 1186–1193, Jan.2006.
[115] M. Peng, L. Liu, and C. Jiang, “A review on the economic dispatch and risk management of the large-scale plug-in electric vehicles (phevs)-penetrated powersystems,”Renewable and Sustainable EnergyReviews, vol. 16, no. 3, pp. 1508–1515, Jan. 2012.
[116] M. Yilmaz and P. Krein, “Review of the impact of vehicle-to-grid technologies on distribution systemsand utility interfaces,”IEEE Trans. Power Electron., vol. 28, no. 12, pp. 5673–5689, Dec. 2013.
[117] E. Sortomme and M. El-Sharkawi, “Optimal combined bidding of Vehicle-to-Grid ancillary services,”IEEE Trans. on Smart Grid, vol. 3, no. 1, pp. 70–79, Mar. 2012.
[118] V. Agarwal, K. Uthaichana, R. DeCarlo, and L. Tsoukalas, “Development and validation of a batterymodel useful for discharging and charging power control andlifetime estimation,”IEEE Trans. EnergyConvers., vol. 25, no. 3, pp. 821–835, Sept. 2010.
[119] C. Alaoui, “Solid-state thermal management for lithium-ion EV batteries,”IEEE Trans. on VehicularTech., vol. 62, no. 1, pp. 98–107, Jan. 2013.
[120] M. Singh, P. Kumar, and I. Kar, “Implementation of vehicle to grid infrastructure using fuzzy logiccontroller,” IEEE Trans. on Smart Grid, vol. 3, no. 1, pp. 565–577, Mar. 2012.
[121] J. Dogger, B. Roossien, and F. Nieuwenhout, “Characterization of li-ion batteries for intelligent manage-ment of distributed grid-connected storage,”IEEE Trans. Energy Convers., vol. 26, no. 1, pp. 256–263,Mar. 2011.
[122] P. Ramadass, B. Haran, R. White, and B. N. Popov, “Mathematical modeling of the capacity fade ofli-ion cells,” J Power Sources, vol. 123, pp. 230–240, Mar. 2003.
[123] R. Spotnitz, “Simulation of capacity fade in lithium-ion batteries,”J Power Sources, vol. 113, pp. 72–80,Jan. 2003.
[124] C. M. Shepherd, “Design of primary and secondary cells- part 2. an equation describing battery dis-charge,”J Electroche. Soc., vol. 112, pp. 657–664, Jul. 1965.
[125] O. Tremblay, L.-A. Dessaint, and A.-I. Dekkiche, “A generic battery model for the dynamic simulationof hybrid electric vehicles,”IEEE Int. Vehicle Power and Propulsion Conf. (VPPC’07), pp. 284–289,Sept. 2007.
[126] L. Gao, S. Liu, and R. Dougal, “Dynamic lithium-ion battery model for system simulation,”IEEE Trans.on Comp. Packag. Technol., vol. 25, no. 3, pp. 495–505, Sept. 2002.
[127] G. Ning, B. Haran, and B. N. Popov, “Capacity fade studyof lithium-ion batteries cycled at high dis-charge rates,”J Power Sources, vol. 117, pp. 160–169, Dec. 2003.
[128] R. Rao, S. Vrudhula, and D. Rakhmatov, “Battery modeling for energy aware system design,”Computer,vol. 36, no. 12, pp. 77–87, Dec. 2003.
[129] S. Tian, M. Hong, and M. Ouyang, “An experimental studyand nonlinear modeling of discharge I-Vbehavior of valve-regulated lead-acid batteries,”IEEE Trans. Energy Convers., vol. 24, no. 2, pp. 452–458, Jun. 2009.
184
TH-1265_KANNANT

BIBLIOGRAPHY
[130] G. Capizzi, F. Bonanno, and G. Tina, “Recurrent neuralnetwork-based modeling and simulation oflead-acid batteries charge-discharge,”IEEE Trans. Energy Convers., vol. 26, no. 2, pp. 435–443, Jun.2011.
[131] Y.-H. Liu, C.-H. Hsieh, and Y.-F. Luo, “Search for an optimal five-step charging pattern for li-ion bat-teries using consecutive orthogonal arrays,”IEEE Trans. Energy Convers., vol. 26, no. 2, pp. 654–661,Jun. 2011.
[132] T. Kim and W. Qiao, “A hybrid battery model capable of capturing dynamic circuit characteristics andnonlinear capacity effects,”IEEE Trans. Energy Convers., vol. 26, no. 4, pp. 1172–1180, Dec. 2011.
[133] M. Jongerden and B. Haverkort, “Which battery model touse?”IET Software, vol. 3, no. 6, pp. 445–457,Dec. 2009.
[134] H. Duval, “Computer model of the lead/acid starter battery in automobiles,”J Power Sources, vol. 53,no. 2, pp. 351–357, Feb. 1995.
[135] P. M. Gomadam, J. W. Weidner, R. A. Dougal, and R. E. White, “Mathematical modeling of lithium-ionand nickel battery systems,”J Power Sources, vol. 110, no. 2, pp. 267–284, Aug. 2002.
[136] Z. Salameh, M. Casacca, and W. A. Lynch, “A mathematical model for lead-acid batteries,”IEEE Trans.Energy Convers., vol. 7, no. 1, pp. 93–98, Mar. 1992.
[137] M. Chen and G. Rincon-Mora, “Accurate electrical battery model capable of predicting runtime and I-Vperformance,”IEEE Trans. on Energy Conv., vol. 21, no. 2, pp. 504–511, Jun. 2006.
[138] M. Durr, A. Cruden, S. Gair, and J. McDonald, “Dynamic model of a lead acid battery for use in adomestic fuel cell system,”J Power Sources, vol. 161, no. 2, pp. 1400–1411, Oct. 2006.
[139] H. Blanke, O. Bohlen, S. Buller, R. W. D. Doncker, B. Fricke, A. Hammouche, D. Linzen, M. Thele, andD. U. Sauer, “Impedance measurements on lead-acid batteries for state-of-charge, state-of-health andcranking capability prognosis in electric and hybrid electric vehicles,”J Power Sources, vol. 144, no. 2,pp. 418 – 425, Jun. 2005.
[140] F. Huet, “A review of impedance measurements for determination of the state-of-charge or state-of-healthof secondary batteries,”J Power Sources, vol. 70, no. 1, pp. 59 – 69, Jan. 1998.
[141] E. Kuhn, C. Forgez, P. Lagonotte, and G. Friedrich, “Modelling Ni-mH battery using cauer and fosterstructures,”J Power Sources, vol. 158, no. 2, pp. 1490–1497, Aug. 2006.
[142] T. F. F. M. Doyle and J. Newman, “Modeling of galvanostatic charge and discharge of thelithium/polymer/insertion cell,”J. Electrochem. Soc., vol. 140, no. 6, pp. 1526–1533, Jun. 1993.
[143] P. Mauracher and E. Karden, “Dynamic modelling of lead/acid batteries using impedance spectroscopyfor parameter identification,”Journal of Power Sources, vol. 67, no. 1-2, pp. 69–84, Jul.-Aug. 1997.
[144] Y.-S. Lee, W.-Y. Wang, and T.-Y. Kuo, “Soft computing for battery state-of-charge (BSOC) estimationin battery string systems,”IEEE Trans. on Ind. Elect., vol. 55, no. 1, pp. 229–239, Jan. 2008.
[145] I.-H. Li, W.-Y. Wang, S.-F. Su, and Y.-S. Lee, “A mergedfuzzy neural network and its applications inbattery state-of-charge estimation,”IEEE Trans. Energy Convers., vol. 22, no. 3, pp. 697–708, Sept.2007.
[146] M. Einhorn, F. Conte, C. Kral, and J. Fleig, “Comparison, selection, and parameterization of electricalbattery models for automotive applications,”IEEE Trans. Power Electron., Mar. 2013.
185
TH-1265_KANNANT

BIBLIOGRAPHY
[147] K. Deb, “Optimization for engineering design: Algorithms and examples,”Prentice Hall, India, 1998.
[148] R. Escarela-Perez, T. Niewierowicz, and E. Campero-Littlewood, “Synchronous machine parametersfrom frequency-response finite-element simulations and genetic algorithms,”IEEE Trans. Energy Con-vers., Jun. 2001.
[149] P. Ramadass, B. Haran, R. White, and B. N. Popov, “Capacity fade of sony 18650 cells cycled at elevatedtemperatures Part I. cycling performance,”J Power Sources, vol. 112, pp. 606–613, Aug. 2002.
[150] B. Y. Liaw, R. G. Jungst, G. Nagasubramanian, H. L. Case, and D. H. Doughty, “Modeling capacity fadein lithiumion cells,”J Power Sources, vol. 140, pp. 157–161, Aug. 2005.
[151] P. Ramadass, B. Haran, R. White, and B. N. Popov, “Capacity fade of sony 18650 cells cycled at elevatedtemperatures Part II. capacity fade analysis,”J Power Sources, vol. 112, pp. 614–620, Aug. 2002.
[152] SONY-US18650, “Lithium Ion Rechargeable Batteries -Technical Handbook,”http://www.sony.com.cn/products/ed/battery/download.pdf.
[153] PANASONIC, “Lithium Ion Batteries - Individual Data Sheet,”http://www.batteryspace.com/prod-specs/4666.pdf.
[154] SANYO, “Battery specification,” http://www.manualslib.com/manual/148360/Sanyo-Ur18500f.htmland http://www.sanyoindia.com/index.aspx.
[155] M. Chen and G. Rincon-Mora, “Dynamic lithium-ion battery model for system simulation,”IEEE Trans.on Energy Conver., vol. 21, no. 2, p. 504511, Jun. 2006.
[156] P. Kumar, “A framework for multi-objective optimization and multi-criteria decision making for designof electrical drives,”Ph.D Thesis, pp. 47–99, Oct. 2008.
[157] L. Zhang, H. Chang, and R. Xu, “Equal-width partitioning roulette wheel selection in genetic algorithm,”in Proc. Conf. on Tech. and Appl. of Artificial Intelligence (TAAI’12), pp. 62–67, Nov. 2012.
[158] D. J. Thrimawithana, U. K. Madawala, M. Neath, and T. Geyer, “A sense winding based synchronizationtechnique for bi-directional IPT pick-ups,”in Proc. IEEE Energy Convers. Congress and Exposition(ECCE’11), pp. 1405–1410, Sept. 2011.
[159] R. M. Miskiewicz, A. J. Moradewicz, and M. P. Kazmierkowski, “Contactless battery charger with bi-directional energy transfer for plug-in vehicles with vehicle-to-grid capability,”in Proc. IEEE Int. Symp.on Ind. Electron. (ISIE’11), pp. 1969–1973, Jun. 2011.
[160] A. Masoum, S. Deilami, P. Moses, M. Masoum, and A. Abu-Siada, “Smart load management of plug-in electric vehicles in distribution and residential networks with charging stations for peak shaving andloss minimisation considering voltage regulation,”IET Gener. Transm. and Distrib., vol. 5, no. 8, pp.877–888, Aug. 2011.
[161] P. Stroehle, S. Becher, S. Lamparter, A. Schuller, andC. Weinhardt, “The impact of charging strategiesfor electric vehicles on power distribution networks,”in Proc.8th Int. Conf. on European Energy Market(EEM’11), pp. 51–56, May 2011.
[162] C. Camus and T. Farias, “Impacts of electric vehicles’charging strategies in the electricity prices,”inProc.8th Int. Conf. on Energy Market (EEM’11), pp. 833–838, May 2011.
186
TH-1265_KANNANT

BIBLIOGRAPHY
[163] P. Rodriguez, A. Luna, I. Candela, R. Mujal, R. Teodorescu, and F. Blaabjerg, “Multiresonant frequency-locked loop for grid synchronization of power converters under distorted grid conditions,”IEEE Trans.Ind. Electron., vol. 58, no. 1, pp. 127–138, Jan. 2011.
[164] K. Ahmed, S. Finney, and B. Williams, “Passive filter design for three-phase inverter interfacing indistributed generation,”in Proc. Compatibility in Power Electronics (CPE ’07), pp. 1–9, June 2007.
[165] B. K. Bose, “Modern power electronics and AC drives,”Prentice Hall PTR, 2002.
[166] C.-S. Wang, G. Covic, and O. Stielau, “General stability criterions for zero phase angle controlledloosely coupled inductive power transfer systems,”IEEE 27th Annual Conf. on Ind. Electron. Society(IECON’01), vol. 2, pp. 1049–1054, Dec. 2001.
[167] H. L. Li, A. Hu, and G. A. Covic, “Development of a discrete energy injection inverter for contactlesspower transfer,”in Proc. 3rd IEEE Conf. on Ind. Electron. and Appl. (ICIEA’08), pp. 1757–1761, Jun.2008.
[168] B. Bouneb, D. M. Grant, A. Cruden, and J. R. McDonald, “Grid connected inverter suitable for economicresidential fuel cell operation,”European Conf. on Power Electron. and Appl. (ECPEA’05), Sept. 2005.
[169] S. C. Rho, S. H. kim, Y. H. Ahn, and B. Kim, “A study on power transmission system using resonantfrequency tracking method and contactless transformer with multiple primary winding,”in Proc. Int.Conf. on Electrical Machines and Syst. (ICEMS’07), pp. 1635–1639, Oct. 2007.
[170] T. M. Blooming and D. J. Carnovale, “Application of IEEE STD 519-1992 harmonic limits,”Pulp andPaper Ind. Tech. Conf., pp. 1–9, June 2006.
[171] Rony Argueta, “The Electric Vehicle,” http://www.writing.ucsb.edu/faculty/holms/Writing2E- EVTechnicalResearchReport.pdf.
[172] N. Bhat, “Advantages and Disadvantages,” http://library.thinkquest.org/C008050/ecars4.html.
[173] G. Stoeckl, R. Witzmann, and J. Eckstein, “Analyzing the capacity of low voltage grids for electricvehicles,”IEEE Electrical Power and Energy Conf. (EPEC’11), vol. 3, no. 1, pp. 415–420, Oct. 2011.
[174] U. Reiner, C. Elsinger, and T. Leibfried, “Distributed self organising electric vehicle charge controllersystem: Peak power demand and grid load reduction with adaptive ev charging stations,”IEEE Int.Electric Vehicle Conf. (IEVC’12), vol. 3, no. 1, pp. 1–6, March 2012.
[175] J. A. P. Lopes, “Demystifying the smart grid boston,”Electric vehicle grid integration, Nov. 2009.
[176] S. I. Inage, “Modelling load shifting using electric vehicles in a smart grid environment,”https://www.iea.org/publications/freepublications/publication/loadshifting.pdf,.
[177] G. Ning, B. Haran, and B. N. Popov, “Capacity fade studyof lithium-ion batteries cycled at high dis-charge rates,”J. Power Sources, vol. 117, pp. 160–169, Dec. 2003.
[178] P. Ramadass, B. Haran, R. White, and B. N. Popov, “Mathematical modeling of the capacity fade ofli-ion cells,” J. Power Sources, vol. 123, pp. 230–240, March 2003.
[179] T. Ali, A. Awami, and E. Sortomme, “Coordinating vehicle-to-grid services with energy trading,”IEEETrans. Smart Grid, vol. 3, no. 1, pp. 453–462, Mar. 2012.
[180] P. Ramadass, B. Haran, R. White, and B. N. Popov, “Capacity fade of sony 18650 cells cycled at elevatedtemperatures Part I. cycling performance,”J. Power Sources, vol. 112, pp. 606–613, Aug. 2002.
187
TH-1265_KANNANT

BIBLIOGRAPHY
[181] A. T. Stamps, C. E. Holland, R. E. White, and E. P. Gatzke, “Analysis of capacity fade in a lithium ionbattery,”J. of Power Sources, vol. 150, pp. 229–239, Oct. 2005.
[182] S. Shao, M. Pipattanasomporn, and S. Rahman, “Grid integration of electric vehicles and demand re-sponse with customer choice,”IEEE Trans. Smart Grid, vol. 3, no. 1, pp. 543–550, Mar. 2012.
[183] T. Morgan, “Smart Grids and Electric Vehicles: Made for Each Other,”http://www.internationaltransportforum.org/jtrc/DiscussionPapers/DP201202.pdf.
[184] S. Han and S. Han, “Economics of V2G frequency regulation in consideration of the battery wear,” 3rd
IEEE PES Int. Conf. and Exhibition on Innovative Smart Grid Technologies (ISGT’12), pp. 1–8, Oct.2012.
[185] D. Trowler and B. Whitaker, “Bi-directional inverterand energy storage system,”Texas InstrumentsAnalog Design Contest, May 2008.
[186] Indian Express, “Different power rates for peak and off-peak hours,”http://www.indianexpress.com/news/soon-different-power-rates-for-peak-offpeak-hours/917100.
[187] M. Singh, P. Kumar, and I. Kar, “Designing a multi charging station for electric vehicles and its utilizationfor the grid support,”IEEE Power and Energy Society General Meeting (PESGM’12), pp. 1–8, Jul. 2012.
[188] Nlukin, “Battery losses,” http://www.teslamotors.com/forum/forums/battery-charging-and-discharging-losses.
[189] W. Luo, C. Lv, L. Wang, and C. Liu, “Study on impedance model of Li-ion battery,”in Proc. 6th IEEEConf. on Ind. Electron. and Applications (ICIEA’11), pp. 1943–1947, June 2011.
[190] U. Department Of Energy, “Electric Vehicles: Compare Side-by-Side,”http://www.fueleconomy.gov/feg/evsbs.shtml.
[191] Battery University, “Electric Vehicle,” http://www.batteryuniversity.com/learn/article/electricvehicle.
[192] B. Berman, “The Hybrid Car Battery: A Definitive Guide,”http://www.hybridcars.com/hybrid-car-battery.
[193] Center for Transportation Research Argonne NationalLaboratory, “Costs of Lithium-Ion Batteries forVehicles,” http://www.transportation.anl.gov/pdfs/TA/149.pdf/.
[194] Simanaitis, “EV Glossary,” http://simanaitissays.com/2012/12/04/ev-glossary/.
[195] H.-H. Chung, W. C. Chow, S. Hui, and S. Lee, “Development of a switched-capacitor DC-DC converterwith bidirectional power flow,”IEEE Trans. Circuits and Systems I: Fundamental Theory and Applica-tions, vol. 47, no. 9, pp. 1383–1389, Sept. 2000.
[196] Y. Du, S. Lukic, B. Jacobson, and A. Huang, “Review of high power isolated bi-directional DC-DC con-verters for phev/ev dc charging infrastructure,”IEEE Energy Conver. Congress and Expo. (ECCE’11),pp. 553–560, Sept. 2011.
[197] N. Wong and M. Kazerani, “A review of bidirectional on-board charger topologies for plugin vehicles,”25th IEEE Canadian Conf. on Electrical Computer Engg. (CCECE’12), pp. 1–6, 2012.
[198] D. Gunasekaran and L. Umanand, “Integrated magneticsbased multi-port bidirectional DC-DC con-verter topology for discontinuous-mode operation,”IET Power Electron., vol. 5, no. 7, pp. 935–944,Aug. 2012.
188
TH-1265_KANNANT

BIBLIOGRAPHY
[199] D. Xu, C. Zhao, and H. Fan, “A pwm plus phase-shift control bidirectional DC-DC converter,”IEEETrans. Power Electron., vol. 19, no. 3, pp. 666–675, may 2004.
[200] M. H. Rashied, “Power electronics: Circuit, devices and applications,”Third Edition, Dorling Kindersley(India) pvt. Ltd.,, 2009.
[201] I. S. 519-1992, “Recommended practices and requirements for harmonic control in electric power sys-tems,” 1992.
189
TH-1265_KANNANT

BIBLIOGRAPHY
190
TH-1265_KANNANT
List of Publications
List of Publications
Journal Publications
1. Kannan Thirugnanam, Ezhil Reena Joy T.P, Mukesh Singh, “Mathematical Modeling of
Li-Ion Battery using Genetic Algorithm Approach for V2G App lications,” IEEE Trans. on
Energy Convers., vol. 29, Issue. 2, pp. 332 - 343, June 2014.
2. Kannan Thirugnanam, Ezhil Reena Joy .T. P, Mukesh Singh and Praveen Kumar, “Modeling
and Control of Contactless based Smart Charging Station in V2G Scenario,” IEEE Trans.
on Smart Grid, vol. 5, No. 1, pp. 377-348, Jan. 2014.
3. Rajib Das,Kannan Thirugnanam, Praveen Kumar, Rajender Lavudiya and Mukesh Singh,
“Mathematical Modeling For Economic Evaluation Of Electric Vehicle To Smart Grid
Interaction ,” IEEE Trans. on Smart Grid, Vol. 5, Issue. 2, pp. 712-721, Feb. 2014.
4. Mukesh Singh,Kannan Thirugnanam, Praveen Kumar, and Indrani Kar, “Real Time coordi-
nation of Electric Vehicles to Support the Grid at the Distribution Substation Level,” IEEE
Systems Journal, vol. PP, No. 99, pp. 1-12, Sept. 2013.
Submitted:
1. Ezhil Reena Joy T.P,Kannan Thirugnanam, Mukesh Singh and Praveen Kumar, “Impact of
Electric Vehicle Charging Station on Industrial Load Area Network,” Manuscript has been
submitted in IEEE Transaction on Energy Conversion.
Conference Publications
National:
1. Kannan Thirugnanam, Mohammed Nasir Ansari and Praveen Kumar, “Selection and Re-
quirements of Hybrid Electric Drivetrain Based on Energy Storage Devices,” National
Round Table Meet on Hybrid Renewable Energy Sources for public transportation systems, IIT
Guwahati, Oct. 2010.
191
TH-1265_KANNANT

List of Publications
International:
1. Kannan Thirugnanam, Himanshu Saini and Praveen Kumar, “Mathematical Modeling of
Li-Ion Battery for Charge/Discharge rate and Capacity fading Characteristics using Ge-
netic Algorithm Approach ,” IEEE Transportation Electrification Conf. and Expo (ITEC’12),
pp. 1-6, Jun., 2012.
2. Kannan Thirugnanam, Ezhil Reena Joy T.P, and Praveen Kumar, “A Novel Fuzzy based
Phase Angle Estimation Scheme for Grid Connected Bidirectional Contactless Power
Transfer System suitable for EVs and PHEVs,” IEEE Int. Conf. on Adv. Research in Engg.
and Tech. (ICARET’13), Jan., 2013.
3. Kannan Thirugnanam, Ezhil Reena Joy T.P, and Praveen Kumar, “A Fuzzy Based Frequency
Control Technology for Bidirectional Contactless Charging System,” IEEE Int. Conf. on
Adv. Research in Engg. and Tech. (ICARET’13), Jan., 2013.
4. Kannan Thirugnanam, Swati Shukla, Mukesh Singh and Praveen Kumar, “Synchronization of
Grid Connected Vehicle-to-Grid System with Bidirectional Contactless Charging,” IEEE
PES Innovative Smart Grid Technologies Conference (ISGT’13), pp. 1-6, Nov. 2013.
5. Ezhil Reena Joy T.P,Kannan Thirugnanam and Praveen Kumar, “A New Concept for Bidi-
rectional Inductively Coupled Battery Charging System based on Direct AC-AC Con-
verter for HEV’s and EV’s using Fuzzy Logic Approach,” IEEE Transportation Electrifica-
tion Conf. and Expo (ITEC’12), pp. 1-6, Jun., 2012.
6. Ezhil Reena Joy T.P,Kannan Thirugnanam and Praveen Kumar, “Bidirectional Contactless
Charging System using Li-Ion Battery Model,” 7th Int. Conf. on Ind. and Information Sys.
(ICIIS’12), Aug., 2012.
7. Ezhil Reena Joy .T .P,Kannan Thirugnanam and Praveen Kumar, “A Multi-Point Bidirec-
tional Contactless Charging System in a Charging Station Suitable for EVs and PHEVs
Applications,” Presented in INDICON 2013, Dec. 2013.
192
TH-1265_KANNANT

List of Publications
8. Ezhil Reena Joy T.P,Kannan Thirugnanam and Praveen Kumar, “Novel Reduced Switch
Count Bidirectional Contactless Charging System for EVs and PHEVs Applications,”
IEEE Students Conf. on Engg. and Syst. (SCES’13), pp. 1-6, Apr., 2013.
9. Himanshu Saini,Kannan Thirugnanam and Praveen Kumar, “Mathematical Modeling for
Economic Evaluation of Electric Vehicle to Smart Grid Interaction,” IEEE Int. Conf. on
Adv. Research in Engg. and Tech. (ICARET’13), Jan., 2013.
10. Mohammed Nasir Ansari,Kannan Thirugnanam, Ezhil Reena Joy .T .P and Praveen Kumar,
“Power-train Selection for Electric City Bus Based on the Multi-criteria Decision Mak-
ing,” IEEE 14th Int. Power Elect. and Motion Control Conf. (EPE/PEMC’10), pp. T6-140 -
T6-148, Sept., 2010.
11. Mukesh Singh,Kannan Thirugnanam, S. Swami, Praveen Kumar and Indrani Kar, “Coordination
of Electric Vehicles in Charging Stations Connected at Different Nodes of a Distribution
Substation,” Annual IEEE India Conf. (INDICON’12), pp.1260-1265, Dec., 2012.
12. Venkata Ramana Kasi,Kannan Thirugnanam, Praveen Kumar and Somanath Majhi, “Node
Identification for Placing EVs and PAs in a Distribution Network ,” Manuscript has been
accepted in IEEE Power & Energy Society General Meeting 2014(IEEE PES GM’14).
193
TH-1265_KANNANT

List of Publications
194
TH-1265_KANNANT

Bio-Data
Bio-Data
1 Name: Kannan T.
2 Date of Birth: 1 June 1983
3 Educational Qualifications: April - 2005 (B.E.),
June - 2009 (M.E.),
June - 2014 (Ph.D.),
4 Permanent Address: S/O A. Thirugnanam,
63, Thottakkadu, Kamaraj Nagar,
Ramapuram - Post,
Thanjavur (District),
Tamil Nadu, India,
Pin code - 613 003.
5 Contact Address: Room No B-121,
Barak Hostel,
Indian Institute of Technology Guwahati,
Guwahati - 781 039,
Assam, India.
6 Contact Number 0(+91)-4362-250456
195
TH-1265_KANNANT

Bio-Data
196
TH-1265_KANNANT

Bio-Data
197
TH-1265_KANNANT