
Fuzzy based controller for dynamic Unified Power Flow Controller to enhance power transfer...
14
Fuzzy based controller for dynamic Unified Power Flow Controller to enhance power transfer capability Shameem Ahmad a , Fadi M. Albatsh a , Saad Mekhilef a,⇑ , Hazlie Mokhlis b a Power Electronics and Renewable Energy Research Laboratory (PEARL), Department of Electrical Engineering, University of Malaya, Kuala Lumpur, Malaysia b Department of Electrical Engineering, Faculty of Engineering, University of Malaya, 50603 Kuala Lumpur, Malaysia article info Article history: Received 14 August 2013 Accepted 20 December 2013 Available online 31 January 2014 Keywords: Flexible AC transmission systems Unified Power Flow Controller Power transfer capability Power losses Fuzzy logic controller PSCAD abstract In this paper, a dynamic model of Unified Power Flow Controller (UPFC) is developed to improve the power transfer capability (PTC) through the transmission line. Improvement of the bus voltages profiles along with the reduction of total power losses is also intended with UPFC’s presence. The UPFC shunt and series controllers are developed based on Fuzzy Logic (FL) which has been designed as a stand-alone module in PSCAD environment. Sinusoidal pulse width modulation (SPWM) technique is applied as a modulation technique to generate switching signals for the converter switches. The proposed UPFC con- troller is tested by using IEEE-5 and 14 bus systems with various case studies. The performance of the proposed controllers is also compared with different control methods. From the test results, significant improvement of PTC has been achieved with the minimization of total power losses. Ó 2014 Elsevier Ltd. All rights reserved. 1. Introduction The continuous expansion and up-gradation of power system have become essential to satisfy the ever growing power demand due to limited energy resources, and deregulated electricity mar- ket. In addition, building new transmission lines to meet the increasing electricity demand has also been restricted by economic and environmental constraints [1]. As a result, utilities are com- pelled to optimally utilize the existing resources which made the transmission lines overloaded followed by reduced stability, volt- age variation increment and looped power flow [2]. These issues have led the system planners to look for the new strategies to im- prove the power system performance with economic means to transfer bulk power. As a solution to the mentioned issues, keen attention has been paid to Flexible Alternating Current Transmission System (FACTS) devices which are driven from modern power electronics compo- nents. Over last decade FACTS devices have been extensively used to improve PTC through the transmission lines and enhance system controllability resulting in minimizing power losses in transmis- sion network [3]. Among different types of FACTS devices UPFC has got the epic popularity. Since, it comprises with the actions of two FACTS devices which made it capable of voltage regulation, series compensation, and phase angle regulation simultaneously, lead to the discrete control of active and reactive power transmit- ted together through the line [4,5]. In the past, several steady state model of FACTS devices such as for SVC [6,7], STATCOM [8], TCSC [9–11] and UPFC [12–14] have been proposed. These models were used in power system planning to enhance power transfer capability (PTC), reduce power losses and minimize voltage deviation. The models cannot be used to study real time operation of power system network. Therefore, it is essential to develop dynamic model of FACTS devices so that the real time analysis of power system network can be conducted. However, the biggest challenge of the real time applications of FACTS devices is the design of their internal controllers. Especially control system of UPFC because it is a multi-variable controller. If the control system of the shunt and the series converters of UPFC is such that the shunt converter is not able to meet the real power de- mand of the series converter, then the DC capacitor voltage might collapse resulting in the removal of the UPFC from the power sys- tem [15]. Different control strategies for UPFC have been designed in the literatures. In [16–18], decoupled control method has ap- plied to UPFC to control the active/reactive powers flow. Here, the transmission line current has divided into D-axis and Q-axis currents which control individually the real power and reactive power of the transmission line. However, because of the variation of the power system operating points the transmission parameters change continuously. Therefore, the performance of a decoupling control system may vary significantly depending on the operating 0196-8904/$ - see front matter Ó 2014 Elsevier Ltd. All rights reserved. http://dx.doi.org/10.1016/j.enconman.2013.12.042 ⇑ Corresponding author. Address: Power Electronics and Renewable Energy Research Laboratory (PEARL), Department of Electrical Engineering, University of Malaya, Kuala Lumpur, Malaysia, Tel: +60379676851, Fax: +60379675316. E-mail addresses: [email protected] (S. Ahmad), fbatsh83@ yahoo.com (F.M. Albatsh), [email protected] (S. Mekhilef), [email protected] (H. Mokhlis). Energy Conversion and Management 79 (2014) 652–665 Contents lists available at ScienceDirect Energy Conversion and Management journal homepage: www.elsevier.com/locate/enconman
Transcript of Fuzzy based controller for dynamic Unified Power Flow Controller to enhance power transfer...

Energy Conversion and Management 79 (2014) 652–665
Contents lists available at ScienceDirect
Energy Conversion and Management
journal homepage: www.elsevier .com/locate /enconman
Fuzzy based controller for dynamic Unified Power Flow Controllerto enhance power transfer capability
0196-8904/$ - see front matter � 2014 Elsevier Ltd. All rights reserved.http://dx.doi.org/10.1016/j.enconman.2013.12.042
⇑ Corresponding author. Address: Power Electronics and Renewable EnergyResearch Laboratory (PEARL), Department of Electrical Engineering, University ofMalaya, Kuala Lumpur, Malaysia, Tel: +60379676851, Fax: +60379675316.
E-mail addresses: [email protected] (S. Ahmad), [email protected] (F.M. Albatsh), [email protected] (S. Mekhilef), [email protected](H. Mokhlis).
Shameem Ahmad a, Fadi M. Albatsh a, Saad Mekhilef a,⇑, Hazlie Mokhlis b
a Power Electronics and Renewable Energy Research Laboratory (PEARL), Department of Electrical Engineering, University of Malaya, Kuala Lumpur, Malaysiab Department of Electrical Engineering, Faculty of Engineering, University of Malaya, 50603 Kuala Lumpur, Malaysia
a r t i c l e i n f o a b s t r a c t
Article history:Received 14 August 2013Accepted 20 December 2013Available online 31 January 2014
Keywords:Flexible AC transmission systemsUnified Power Flow ControllerPower transfer capabilityPower lossesFuzzy logic controllerPSCAD
In this paper, a dynamic model of Unified Power Flow Controller (UPFC) is developed to improve thepower transfer capability (PTC) through the transmission line. Improvement of the bus voltages profilesalong with the reduction of total power losses is also intended with UPFC’s presence. The UPFC shunt andseries controllers are developed based on Fuzzy Logic (FL) which has been designed as a stand-alonemodule in PSCAD environment. Sinusoidal pulse width modulation (SPWM) technique is applied as amodulation technique to generate switching signals for the converter switches. The proposed UPFC con-troller is tested by using IEEE-5 and 14 bus systems with various case studies. The performance of theproposed controllers is also compared with different control methods. From the test results, significantimprovement of PTC has been achieved with the minimization of total power losses.
� 2014 Elsevier Ltd. All rights reserved.
1. Introduction
The continuous expansion and up-gradation of power systemhave become essential to satisfy the ever growing power demanddue to limited energy resources, and deregulated electricity mar-ket. In addition, building new transmission lines to meet theincreasing electricity demand has also been restricted by economicand environmental constraints [1]. As a result, utilities are com-pelled to optimally utilize the existing resources which made thetransmission lines overloaded followed by reduced stability, volt-age variation increment and looped power flow [2]. These issueshave led the system planners to look for the new strategies to im-prove the power system performance with economic means totransfer bulk power.
As a solution to the mentioned issues, keen attention has beenpaid to Flexible Alternating Current Transmission System (FACTS)devices which are driven from modern power electronics compo-nents. Over last decade FACTS devices have been extensively usedto improve PTC through the transmission lines and enhance systemcontrollability resulting in minimizing power losses in transmis-sion network [3]. Among different types of FACTS devices UPFChas got the epic popularity. Since, it comprises with the actions
of two FACTS devices which made it capable of voltage regulation,series compensation, and phase angle regulation simultaneously,lead to the discrete control of active and reactive power transmit-ted together through the line [4,5].
In the past, several steady state model of FACTS devices such asfor SVC [6,7], STATCOM [8], TCSC [9–11] and UPFC [12–14] havebeen proposed. These models were used in power system planningto enhance power transfer capability (PTC), reduce power lossesand minimize voltage deviation. The models cannot be used tostudy real time operation of power system network. Therefore, itis essential to develop dynamic model of FACTS devices so thatthe real time analysis of power system network can be conducted.However, the biggest challenge of the real time applications ofFACTS devices is the design of their internal controllers. Especiallycontrol system of UPFC because it is a multi-variable controller. Ifthe control system of the shunt and the series converters of UPFC issuch that the shunt converter is not able to meet the real power de-mand of the series converter, then the DC capacitor voltage mightcollapse resulting in the removal of the UPFC from the power sys-tem [15]. Different control strategies for UPFC have been designedin the literatures. In [16–18], decoupled control method has ap-plied to UPFC to control the active/reactive powers flow. Here,the transmission line current has divided into D-axis and Q-axiscurrents which control individually the real power and reactivepower of the transmission line. However, because of the variationof the power system operating points the transmission parameterschange continuously. Therefore, the performance of a decouplingcontrol system may vary significantly depending on the operating

Nomenclature
Kp proportional gain of PI controllerVmag_sh magnitude of injected shunt voltageVs_measured measured value of sending – end voltageVdc_measured measured value of DC link capacitor voltageVs_a, Vs_b, Vs_c phase voltages of sending – enda_s phase angle of sending-end voltageQmeasured measured reactive powerQreference reference reactive powerVq quadrature components of the series injected voltagea_r phase angle of receiving – end voltageFACTS flexible AC transmission systemsPTC power transfer capabilityPLL Phase Locked LoopVSC voltage source converterSVC static var compensatorSSSC static synchronous series compensatorUPFC Unified Power Flow ControllerGA genetic algorithmANN artificial neural network
Ki integrator gain of PI controllerangle_sh angle of injected shunt voltageVs_reference reference value of sending – end voltageVdc_reference reference value of DC link capacitor voltageVr_a, Vr_b, Vr_c phase voltages of receiving – endPmeasured measured real powerPreference reference real powerVd direct components of the series injected voltageVmag_se magnitude of injected series voltagesin () trigonometric functionFL fuzzy logicPI proportional-integralSPWM sinusoidal pulse width modulationSTATCOM static synchronous compensatorTCSC thyristor controlled series capacitorEP evolutionary programmingPSO particle swarm optimizationHS harmony searchOPF optimal power flow
S. Ahmad et al. / Energy Conversion and Management 79 (2014) 652–665 653
point of power system network. By considering the variation of thepower system parameters in [19–21] another control algorithm forUPFC has been proposed based on cross-coupled method. Thedrawbacks of both decoupled and cross-coupled based UPFC con-troller is the ignorance of the dynamics of the DC link capacitorwhile designing the control system. Also the interaction betweenthe two converters has not eliminated completely. To eliminatethis interaction in [22] another controller for UPFC based on coor-dination control of real and reactive powers has proposed. Thoughthe problem of interaction has overcome but the shortcoming ofthis strategy is the complexity of the control system has increased.Two control loops (inner and outer) are required to regulate thereal and reactive power flow. Afterwards simplified controllersfor UPFC have been developed in [23–25] where only a single loophas used to regulate each power system parameters. There is acommon requirement of all the controllers discussed above is theneed of output feedback control system for regulating the powersystem parameters. The problem in the design of an output feed-back proportional-integral (PI) control system for UPFC is the pres-ence of low margin of stability associated with the seriesinductance of the transmission line. Later on intelligent controllerswith specific reference to fuzzy logic controllers or artificial neuralnetwork have been proposed to overcome the problem. UPFC hasemployed in [26,27] to damp oscillation and improve transient sta-bility where the controllers of both converters have been designedusing ANN. But the difficulty of ANN based controller is to generatethe training patterns of the controller for complex power systemnetwork.
In contrast, FL controller is capable of solving complex problemswhose system behavior is not well understood. Another advantageof FL controller is its robustness to system parameters and operat-ing conditions changes [28]. Different controllers for UPFC havebeen presented in [29–31], based on FL. However, all the UPFC’scontrol methods are developed for the application of oscillationdamping of power system network. Very few literatures are re-ported on FL based UPFC’s application to enhance the power flowand maintain voltage profile of the system dynamically. In [32], dy-namic flow of power is analyzed using FL based UPFC where onlyshunt converter has designed with FL. For series converter rotatingorthogonal-coordinate method has used. However, during theshunt converter design, instead of taking sending end voltage asfeedback signal it considered receiving end voltage as feedback.
Another study [33] proposed controller of UPFC using FL to im-prove voltage profile.
Different from previous works, in this study a new control sys-tem for dynamic UPFC is proposed to enhance PTC and bus voltageprofile, as well as to reduce power capacity loss. Both controllers ofseries and shunt converters of UPFC are developed using FL con-troller. By using FL controller, the problem of stability that usuallyoccurs with PI controller based feedback control can be overcome.Furthermore, the application of FL controller reduced the complex-ity of UPFC’s internal control system, which commonly occurs inconventional controllers such as decoupled and cross coupled con-trollers. In this study, PSCAD software is used to model and test theproposed UPFC controller. Since PSCAD doesn’t provide FL toolbox,a new module for the FL is developed in C language. By using C, thesimulation can be done within the PSCAD environment. The pro-posed UPFC controller is tested by using IEEE-5 and 14 bus sys-tems. In addition, comparative studies also have been conductedto prove the advantage of the proposed controller over differentcontrol methods of UPFC.
The rest of the paper is organized as follows: Section 2 focuseson UPFC model. Section 3discusses about the newly developedshunt and series control systems of UPFC along with the FL toolbox design in PSCAD. Section 4presents the simulation results afterconnecting UPFC in two IEEE case studies including two compara-tive studies to prove the effectiveness of the proposed controller.The significant points of this paper are summarized in theconclusion.
2. UPFC model
The dynamic model of the UPFC is shown in Fig. 1. UPFC con-nects to the transmission line with shunt and series voltage sourceconverters (VSC) which are coupled via a common DC link. Nor-mally, the shunt VSC is considered as STATCOM and series one asa static synchronous series compensator (SSSC). Low pass AC filtersare connected in each phase to prevent the flow of harmonic cur-rents generated due to switching. The transformers connected atthe output of converters to provide the isolation, modify voltage/current levels and also to prevent DC capacitor being shorted dueto the operation of various switches. Insulated gate bipolar transis-
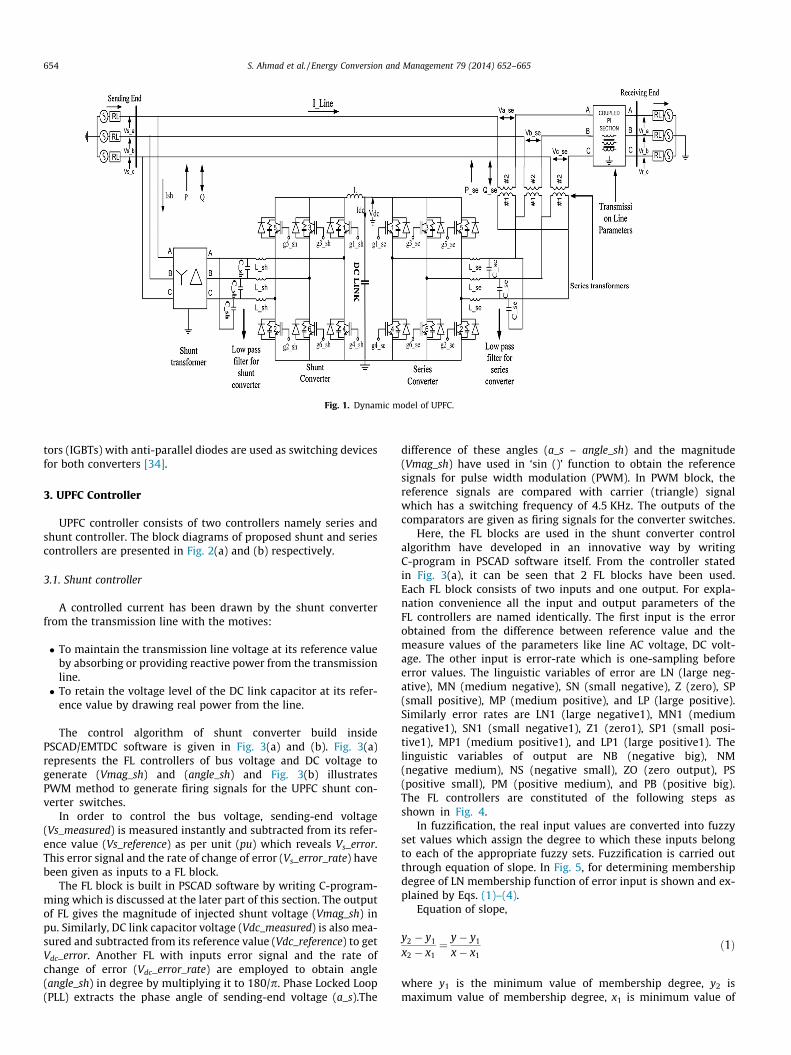
Fig. 1. Dynamic model of UPFC.
654 S. Ahmad et al. / Energy Conversion and Management 79 (2014) 652–665
tors (IGBTs) with anti-parallel diodes are used as switching devicesfor both converters [34].
3. UPFC Controller
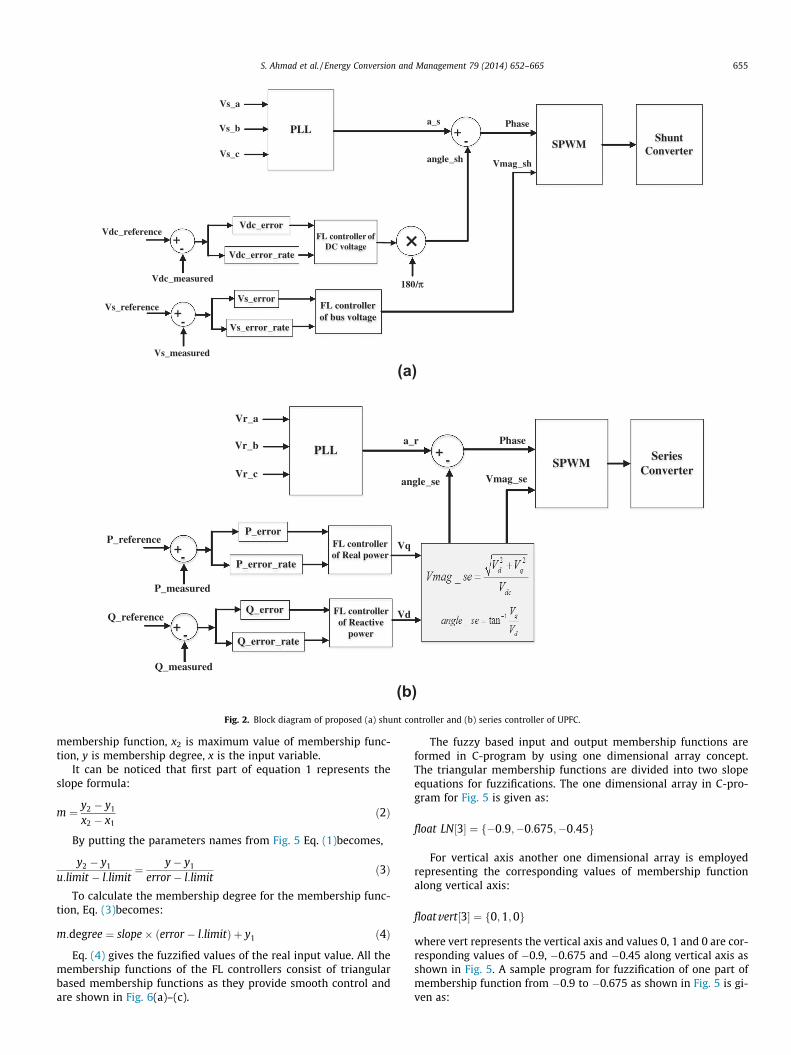
UPFC controller consists of two controllers namely series andshunt controller. The block diagrams of proposed shunt and seriescontrollers are presented in Fig. 2(a) and (b) respectively.
3.1. Shunt controller
A controlled current has been drawn by the shunt converterfrom the transmission line with the motives:
� To maintain the transmission line voltage at its reference valueby absorbing or providing reactive power from the transmissionline.� To retain the voltage level of the DC link capacitor at its refer-
ence value by drawing real power from the line.
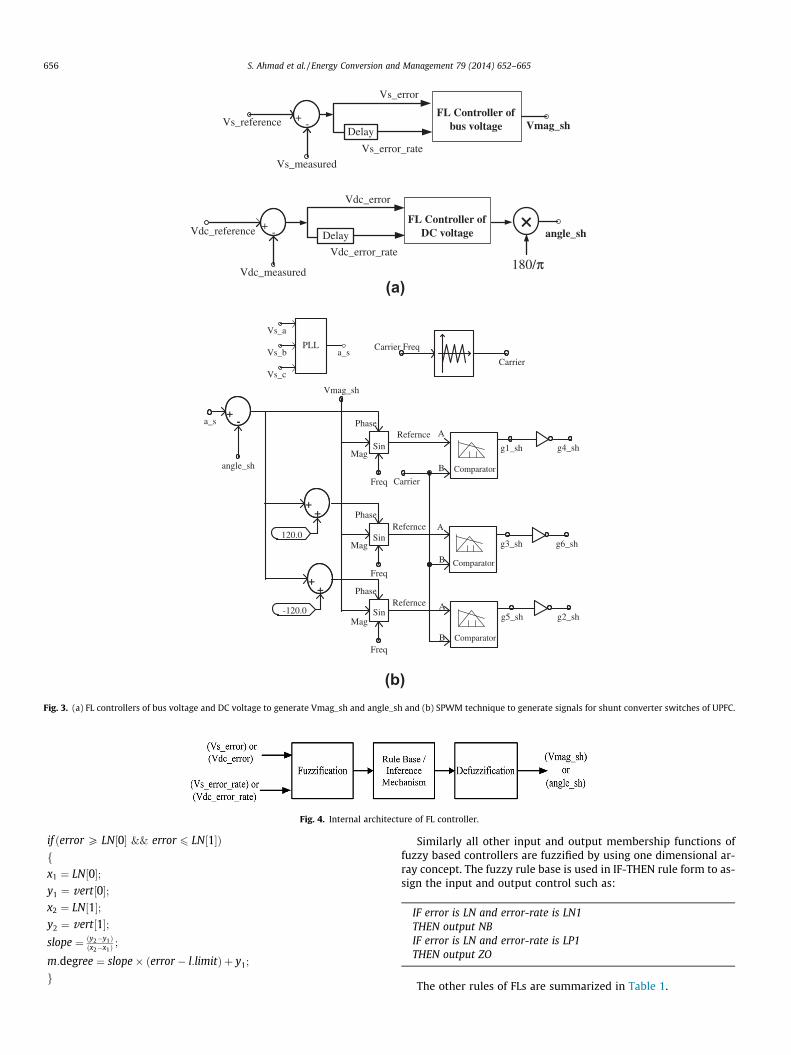
The control algorithm of shunt converter build insidePSCAD/EMTDC software is given in Fig. 3(a) and (b). Fig. 3(a)represents the FL controllers of bus voltage and DC voltage togenerate (Vmag_sh) and (angle_sh) and Fig. 3(b) illustratesPWM method to generate firing signals for the UPFC shunt con-verter switches.
In order to control the bus voltage, sending-end voltage(Vs_measured) is measured instantly and subtracted from its refer-ence value (Vs_reference) as per unit (pu) which reveals Vs_error.This error signal and the rate of change of error (Vs_error_rate) havebeen given as inputs to a FL block.
The FL block is built in PSCAD software by writing C-program-ming which is discussed at the later part of this section. The outputof FL gives the magnitude of injected shunt voltage (Vmag_sh) inpu. Similarly, DC link capacitor voltage (Vdc_measured) is also mea-sured and subtracted from its reference value (Vdc_reference) to getVdc_error. Another FL with inputs error signal and the rate ofchange of error (Vdc_error_rate) are employed to obtain angle(angle_sh) in degree by multiplying it to 180/p. Phase Locked Loop(PLL) extracts the phase angle of sending-end voltage (a_s).The
difference of these angles (a_s – angle_sh) and the magnitude(Vmag_sh) have used in ‘sin ()’ function to obtain the referencesignals for pulse width modulation (PWM). In PWM block, thereference signals are compared with carrier (triangle) signalwhich has a switching frequency of 4.5 KHz. The outputs of thecomparators are given as firing signals for the converter switches.
Here, the FL blocks are used in the shunt converter controlalgorithm have developed in an innovative way by writingC-program in PSCAD software itself. From the controller statedin Fig. 3(a), it can be seen that 2 FL blocks have been used.Each FL block consists of two inputs and one output. For expla-nation convenience all the input and output parameters of theFL controllers are named identically. The first input is the errorobtained from the difference between reference value and themeasure values of the parameters like line AC voltage, DC volt-age. The other input is error-rate which is one-sampling beforeerror values. The linguistic variables of error are LN (large neg-ative), MN (medium negative), SN (small negative), Z (zero), SP(small positive), MP (medium positive), and LP (large positive).Similarly error rates are LN1 (large negative1), MN1 (mediumnegative1), SN1 (small negative1), Z1 (zero1), SP1 (small posi-tive1), MP1 (medium positive1), and LP1 (large positive1). Thelinguistic variables of output are NB (negative big), NM(negative medium), NS (negative small), ZO (zero output), PS(positive small), PM (positive medium), and PB (positive big).The FL controllers are constituted of the following steps asshown in Fig. 4.
In fuzzification, the real input values are converted into fuzzyset values which assign the degree to which these inputs belongto each of the appropriate fuzzy sets. Fuzzification is carried outthrough equation of slope. In Fig. 5, for determining membershipdegree of LN membership function of error input is shown and ex-plained by Eqs. (1)–(4).
Equation of slope,
y2 � y1
x2 � x1¼ y� y1
x� x1ð1Þ
where y1 is the minimum value of membership degree, y2 ismaximum value of membership degree, x1 is minimum value of
Vdc_measured
Vs_measured
PLL
Vs_a
Vs_b
Vs_c
+-
a_s
angle_sh
SPWM
Phase
Vmag_sh
ShuntConverter
Vdc_reference
180/π π
+-
FL controller of bus voltage
+-
FL controller ofDC voltage
Vdc_error
Vdc_error_rate
Vs_error
Vs_error_rate
Vs_reference
×
(a)
+-
FL controller of Reactive
power
Q_reference
Q_measured
+-
FL controller of Real power
P_reference
P_measured
PLL
Vr_a
Vr_b
Vr_c
+-
a_r
angle_se
SPWM
Phase
Vmag_se
SeriesConverter
P_error
P_error_rate
Q_error
Q_error_rate
Vq
Vd
(b) Fig. 2. Block diagram of proposed (a) shunt controller and (b) series controller of UPFC.
S. Ahmad et al. / Energy Conversion and Management 79 (2014) 652–665 655
membership function, x2 is maximum value of membership func-tion, y is membership degree, x is the input variable.
It can be noticed that first part of equation 1 represents theslope formula:
m ¼ y2 � y1
x2 � x1ð2Þ
By putting the parameters names from Fig. 5 Eq. (1)becomes,
y2 � y1
u:limit � l:limit¼ y� y1
error � l:limitð3Þ
To calculate the membership degree for the membership func-tion, Eq. (3)becomes:
m:degree ¼ slope� ðerror � l:limitÞ þ y1 ð4Þ
Eq. (4) gives the fuzzified values of the real input value. All themembership functions of the FL controllers consist of triangularbased membership functions as they provide smooth control andare shown in Fig. 6(a)–(c).
The fuzzy based input and output membership functions areformed in C-program by using one dimensional array concept.The triangular membership functions are divided into two slopeequations for fuzzifications. The one dimensional array in C-pro-gram for Fig. 5 is given as:
float LN½3� ¼ f�0:9;�0:675;�0:45g
For vertical axis another one dimensional array is employedrepresenting the corresponding values of membership functionalong vertical axis:
floatvert½3� ¼ f0;1;0g
where vert represents the vertical axis and values 0, 1 and 0 are cor-responding values of �0.9, �0.675 and �0.45 along vertical axis asshown in Fig. 5. A sample program for fuzzification of one part ofmembership function from �0.9 to �0.675 as shown in Fig. 5 is gi-ven as:
+-
Vs_measured
Vmag_sh
Vdc_reference
Vs_reference
+- angle_sh
Vdc_measured
Delay
Vs_error_rate
Vs_error
FL Controller of bus voltage
Delay
Vdc_error_rate
Vdc_error
FL Controller of DC voltage
×
180/π
(a)
A
B
A
B
+
A
B
++
-120.0
Freq
Phase
MagSin
Freq
Phase
MagSin
Phase
MagSin
Freq
Refernce
Vmag_sh
g1_sh g4_sh
g3_sh g6_sh
g5_sh g2_sh
+-a_s
angle_sh
Carrier Freq
Carrier
+
120.0
Vs_b
Vs_a
Vs_c
PLLa_s
Comparator
Comparator
Comparator
Carrier
Refernce
Refernce
(b) Fig. 3. (a) FL controllers of bus voltage and DC voltage to generate Vmag_sh and angle_sh and (b) SPWM technique to generate signals for shunt converter switches of UPFC.
Fig. 4. Internal architecture of FL controller.
656 S. Ahmad et al. / Energy Conversion and Management 79 (2014) 652–665
if ðerror P LN½0� && error 6 LN½1�Þfx1 ¼ LN½0�;y1 ¼ vert½0�;x2 ¼ LN½1�;y2 ¼ vert½1�;slope ¼ ðy2�y1Þ
ðx2�x1Þ;
m:degree ¼ slope� ðerror � l:limitÞ þ y1;
g
Similarly all other input and output membership functions offuzzy based controllers are fuzzified by using one dimensional ar-ray concept. The fuzzy rule base is used in IF-THEN rule form to as-sign the input and output control such as:
IF error is LN and error-rate is LN1THEN output NBIF error is LN and error-rate is LP1THEN output ZO
The other rules of FLs are summarized in Table 1.
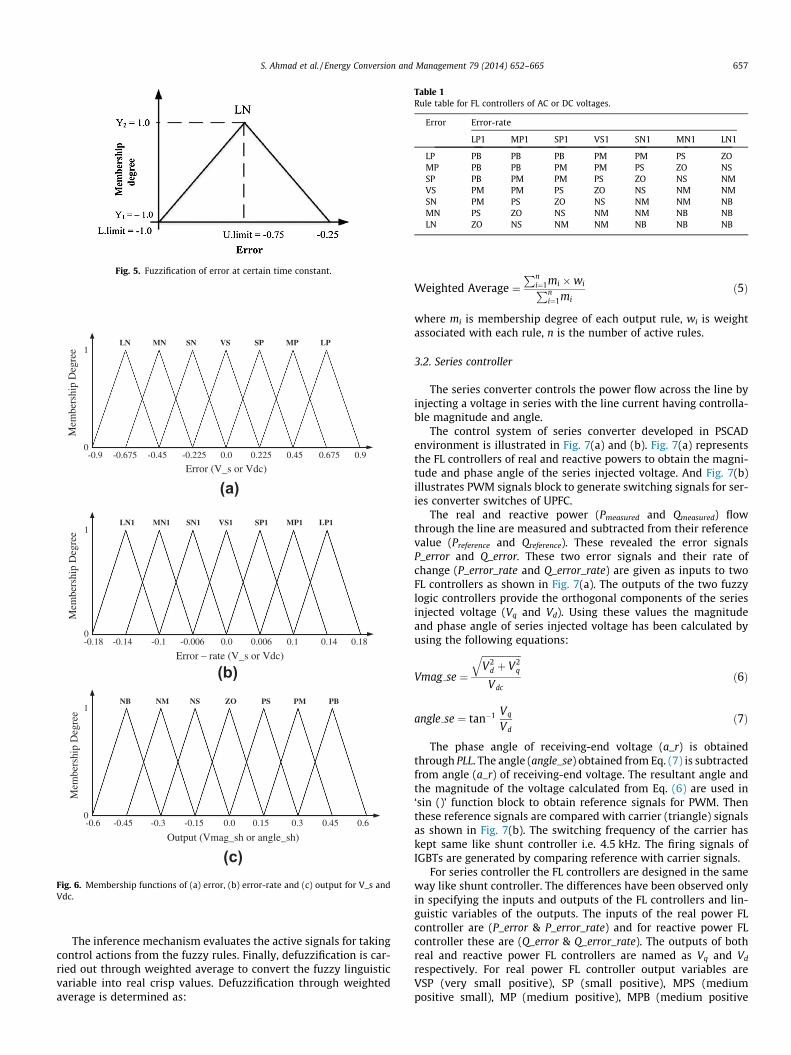
Fig. 5. Fuzzification of error at certain time constant.
LN MN SN VS SP MP LP1
0
Error (V_s or Vdc)
Mem
bers
hip
Deg
ree
(a)
1
0
Error – rate (V_s or Vdc)
Mem
bers
hip
Deg
ree
(b)
1
0
-0.9 -0.675 -0.45 -0.225 0.0 0.225 0.45 0.675 0.9
-0.18 -0.14 -0.1 -0.006 0.0 0.006 0.1 0.14 0.18
LN1 MN1 SN1 VS1 SP1 MP1 LP1
NB NM NS ZO PS PM PB
-0.6 -0.45 -0.3 -0.15 0.0 0.15 0.3 0.45 0.6
Output (Vmag_sh or angle_sh)
Mem
bers
hip
Deg
ree
(c)Fig. 6. Membership functions of (a) error, (b) error-rate and (c) output for V_s andVdc.
Table 1Rule table for FL controllers of AC or DC voltages.
Error Error-rate
LP1 MP1 SP1 VS1 SN1 MN1 LN1
LP PB PB PB PM PM PS ZOMP PB PB PM PM PS ZO NSSP PB PM PM PS ZO NS NMVS PM PM PS ZO NS NM NMSN PM PS ZO NS NM NM NBMN PS ZO NS NM NM NB NBLN ZO NS NM NM NB NB NB
S. Ahmad et al. / Energy Conversion and Management 79 (2014) 652–665 657
The inference mechanism evaluates the active signals for takingcontrol actions from the fuzzy rules. Finally, defuzzification is car-ried out through weighted average to convert the fuzzy linguisticvariable into real crisp values. Defuzzification through weightedaverage is determined as:
Weighted Average ¼Pn
i¼1mi �wiPni¼1mi
ð5Þ
where mi is membership degree of each output rule, wi is weightassociated with each rule, n is the number of active rules.
3.2. Series controller
The series converter controls the power flow across the line byinjecting a voltage in series with the line current having controlla-ble magnitude and angle.
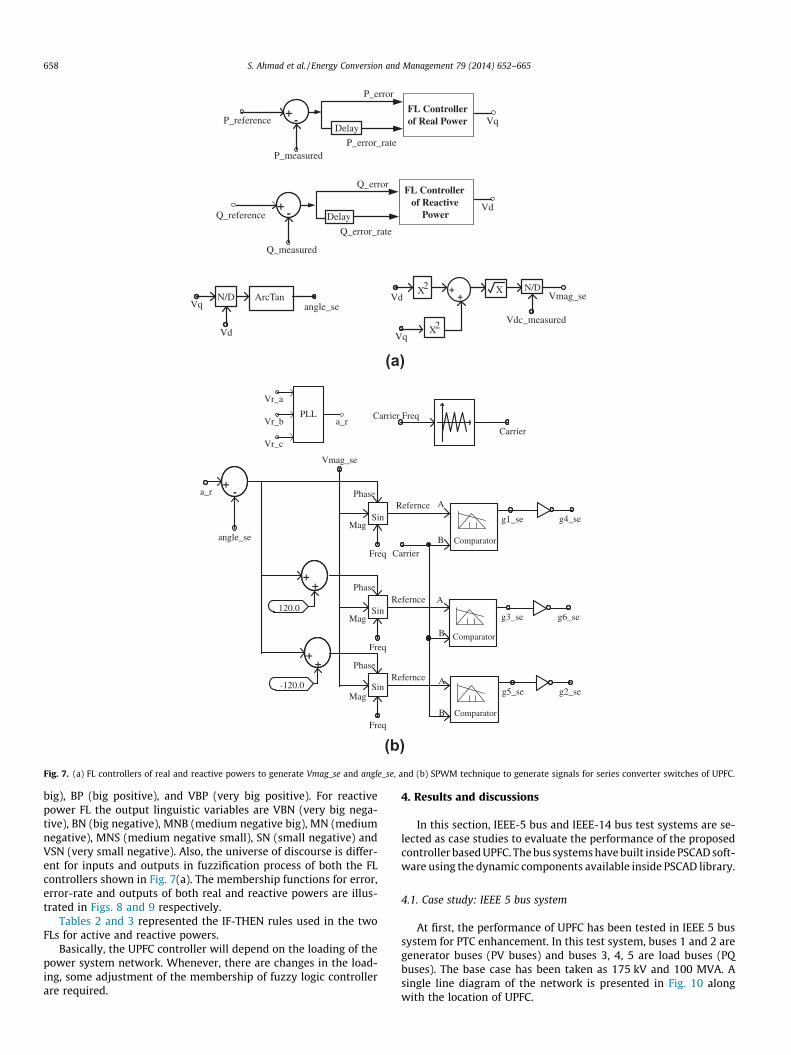
The control system of series converter developed in PSCADenvironment is illustrated in Fig. 7(a) and (b). Fig. 7(a) representsthe FL controllers of real and reactive powers to obtain the magni-tude and phase angle of the series injected voltage. And Fig. 7(b)illustrates PWM signals block to generate switching signals for ser-ies converter switches of UPFC.
The real and reactive power (Pmeasured and Qmeasured) flowthrough the line are measured and subtracted from their referencevalue (Preference and Qreference). These revealed the error signalsP_error and Q_error. These two error signals and their rate ofchange (P_error_rate and Q_error_rate) are given as inputs to twoFL controllers as shown in Fig. 7(a). The outputs of the two fuzzylogic controllers provide the orthogonal components of the seriesinjected voltage (Vq and Vd). Using these values the magnitudeand phase angle of series injected voltage has been calculated byusing the following equations:
Vmag se ¼
ffiffiffiffiffiffiffiffiffiffiffiffiffiffiffiffiffiV2
d þ V2q
q
Vdcð6Þ
angle se ¼ tan�1 Vq
Vdð7Þ
The phase angle of receiving-end voltage (a_r) is obtainedthrough PLL. The angle (angle_se) obtained from Eq. (7) is subtractedfrom angle (a_r) of receiving-end voltage. The resultant angle andthe magnitude of the voltage calculated from Eq. (6) are used in‘sin ()’ function block to obtain reference signals for PWM. Thenthese reference signals are compared with carrier (triangle) signalsas shown in Fig. 7(b). The switching frequency of the carrier haskept same like shunt controller i.e. 4.5 kHz. The firing signals ofIGBTs are generated by comparing reference with carrier signals.
For series controller the FL controllers are designed in the sameway like shunt controller. The differences have been observed onlyin specifying the inputs and outputs of the FL controllers and lin-guistic variables of the outputs. The inputs of the real power FLcontroller are (P_error & P_error_rate) and for reactive power FLcontroller these are (Q_error & Q_error_rate). The outputs of bothreal and reactive power FL controllers are named as Vq and Vd
respectively. For real power FL controller output variables areVSP (very small positive), SP (small positive), MPS (mediumpositive small), MP (medium positive), MPB (medium positive
P_reference
Q_reference
+ -
P_measured
Vq
+ - Vd
Q_measured
Delay
P_error_rate
P_error
FL Controller of Real Power
Delay
Q_error_rate
Q_error
++
N/DVd
Vq
Vdc_measured
Vmag_se
X2
X2 X
FL Controller of Reactive
Power
ArcTanVq
Vd
N/Dangle_se
(a)
A
B
A
B
+
A
B
++
-120.0
Freq
Phase
MagSin
Freq
Phase
MagSin
Phase
MagSin
Freq
Refernce
Vmag_se
g1_se g4_se
g3_se g6_se
g5_se g2_se
+-a_r
angle_se
Carrier Freq
Carrier
+
120.0
Vr_b
Vr_a
Vr_c
PLLa_r
Comparator
Comparator
Comparator
Carrier
Refernce
Refernce
(b) Fig. 7. (a) FL controllers of real and reactive powers to generate Vmag_se and angle_se, and (b) SPWM technique to generate signals for series converter switches of UPFC.
658 S. Ahmad et al. / Energy Conversion and Management 79 (2014) 652–665
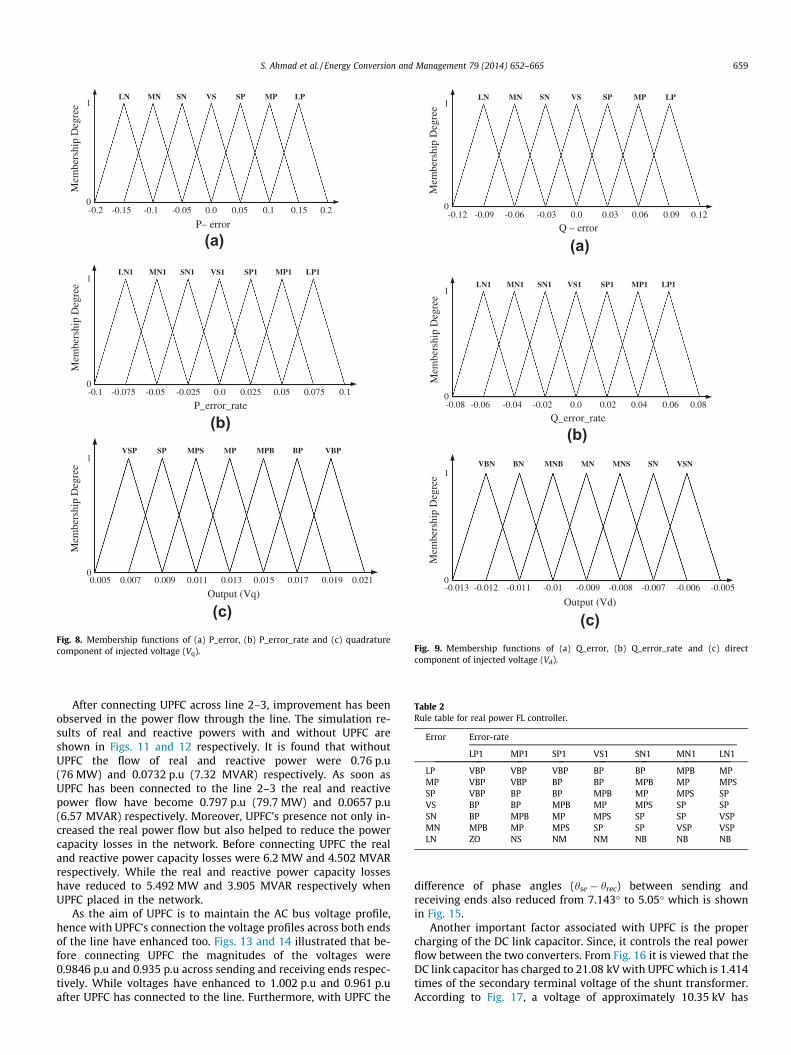
big), BP (big positive), and VBP (very big positive). For reactivepower FL the output linguistic variables are VBN (very big nega-tive), BN (big negative), MNB (medium negative big), MN (mediumnegative), MNS (medium negative small), SN (small negative) andVSN (very small negative). Also, the universe of discourse is differ-ent for inputs and outputs in fuzzification process of both the FLcontrollers shown in Fig. 7(a). The membership functions for error,error-rate and outputs of both real and reactive powers are illus-trated in Figs. 8 and 9 respectively.
Tables 2 and 3 represented the IF-THEN rules used in the twoFLs for active and reactive powers.
Basically, the UPFC controller will depend on the loading of thepower system network. Whenever, there are changes in the load-ing, some adjustment of the membership of fuzzy logic controllerare required.
4. Results and discussions
In this section, IEEE-5 bus and IEEE-14 bus test systems are se-lected as case studies to evaluate the performance of the proposedcontroller based UPFC. The bus systems have built inside PSCAD soft-ware using the dynamic components available inside PSCAD library.
4.1. Case study: IEEE 5 bus system
At first, the performance of UPFC has been tested in IEEE 5 bussystem for PTC enhancement. In this test system, buses 1 and 2 aregenerator buses (PV buses) and buses 3, 4, 5 are load buses (PQbuses). The base case has been taken as 175 kV and 100 MVA. Asingle line diagram of the network is presented in Fig. 10 alongwith the location of UPFC.
1
0
P– error
Mem
bers
hip
Deg
ree
(a)
1
0
P_error_rate
Mem
bers
hip
Deg
ree
(b)
1
0
-0.2 -0.15 -0.1 -0.05 0.0 0.05 0.1 0.15 0.2
LN MN SN VS SP MP LP
-0.1 -0.075 -0.05 -0.025 0.0 0.025 0.05 0.075 0.1
LN1 MN1 SN1 VS1 SP1 MP1 LP1
VSP SP MPS MP MPB BP VBP
0.005 0.007 0.009 0.011 0.013 0.015 0.017 0.019 0.021
Output (Vq)
Mem
bers
hip
Deg
ree
(c)Fig. 8. Membership functions of (a) P_error, (b) P_error_rate and (c) quadraturecomponent of injected voltage (Vq).
1
0
Q – error
Mem
bers
hip
Deg
ree
(a)
1
0
Q_error_rate M
embe
rshi
p D
egre
e(b)
1
0
Output (Vd)
Mem
bers
hip
Deg
ree
-0.12 -0.09 -0.06 -0.03 0.0 0.03 0.06 0.09 0.12
LN MN SN VS SP MP LP
-0.08 -0.06 -0.04 -0.02 0.0 0.02 0.04 0.06 0.08
LN1 MN1 SN1 VS1 SP1 MP1 LP1
-0.013 -0.012 -0.011 -0.01 -0.009 -0.008 -0.007 -0.006 -0.005
VBN BN MNB MN MNS SN VSN
(c) Fig. 9. Membership functions of (a) Q_error, (b) Q_error_rate and (c) directcomponent of injected voltage (Vd).
Table 2Rule table for real power FL controller.
Error Error-rate
LP1 MP1 SP1 VS1 SN1 MN1 LN1
LP VBP VBP VBP BP BP MPB MPMP VBP VBP BP BP MPB MP MPSSP VBP BP BP MPB MP MPS SPVS BP BP MPB MP MPS SP SPSN BP MPB MP MPS SP SP VSPMN MPB MP MPS SP SP VSP VSPLN ZO NS NM NM NB NB NB
S. Ahmad et al. / Energy Conversion and Management 79 (2014) 652–665 659
After connecting UPFC across line 2–3, improvement has beenobserved in the power flow through the line. The simulation re-sults of real and reactive powers with and without UPFC areshown in Figs. 11 and 12 respectively. It is found that withoutUPFC the flow of real and reactive power were 0.76 p.u(76 MW) and 0.0732 p.u (7.32 MVAR) respectively. As soon asUPFC has been connected to the line 2–3 the real and reactivepower flow have become 0.797 p.u (79.7 MW) and 0.0657 p.u(6.57 MVAR) respectively. Moreover, UPFC’s presence not only in-creased the real power flow but also helped to reduce the powercapacity losses in the network. Before connecting UPFC the realand reactive power capacity losses were 6.2 MW and 4.502 MVARrespectively. While the real and reactive power capacity losseshave reduced to 5.492 MW and 3.905 MVAR respectively whenUPFC placed in the network.
As the aim of UPFC is to maintain the AC bus voltage profile,hence with UPFC’s connection the voltage profiles across both endsof the line have enhanced too. Figs. 13 and 14 illustrated that be-fore connecting UPFC the magnitudes of the voltages were0.9846 p.u and 0.935 p.u across sending and receiving ends respec-tively. While voltages have enhanced to 1.002 p.u and 0.961 p.uafter UPFC has connected to the line. Furthermore, with UPFC the
difference of phase angles (hse � hrec) between sending andreceiving ends also reduced from 7.143� to 5.05� which is shownin Fig. 15.
Another important factor associated with UPFC is the propercharging of the DC link capacitor. Since, it controls the real powerflow between the two converters. From Fig. 16 it is viewed that theDC link capacitor has charged to 21.08 kV with UPFC which is 1.414times of the secondary terminal voltage of the shunt transformer.According to Fig. 17, a voltage of approximately 10.35 kV has
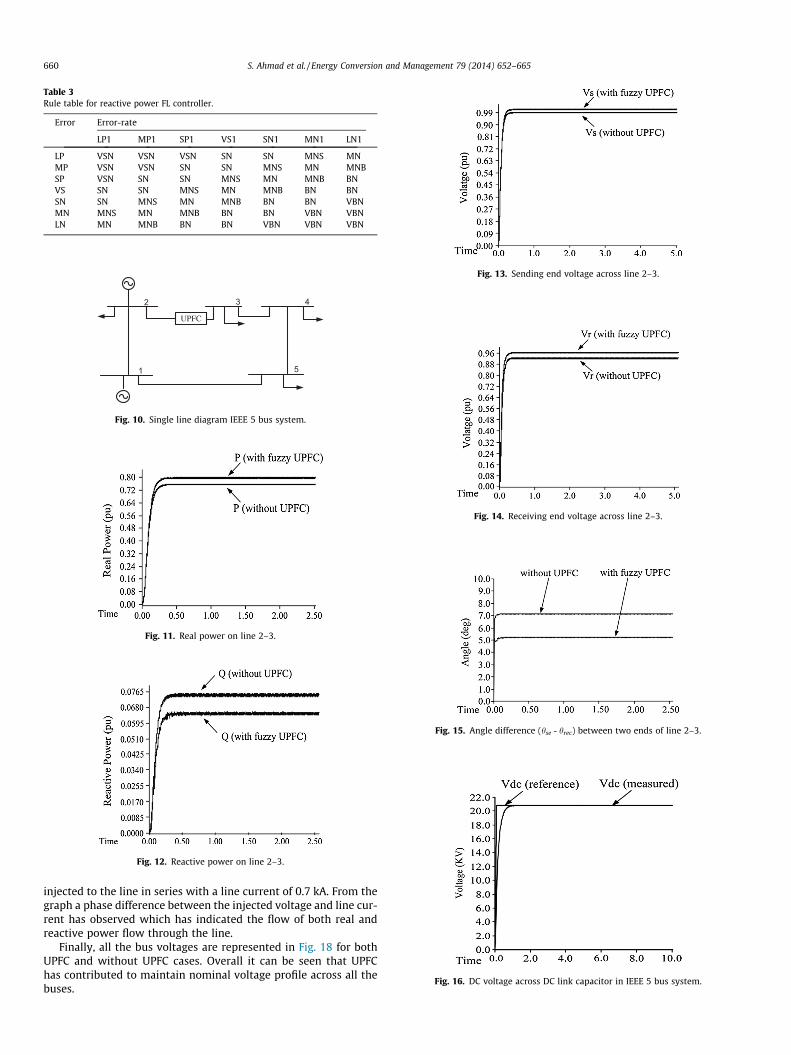
Table 3Rule table for reactive power FL controller.
Error Error-rate
LP1 MP1 SP1 VS1 SN1 MN1 LN1
LP VSN VSN VSN SN SN MNS MNMP VSN VSN SN SN MNS MN MNBSP VSN SN SN MNS MN MNB BNVS SN SN MNS MN MNB BN BNSN SN MNS MN MNB BN BN VBNMN MNS MN MNB BN BN VBN VBNLN MN MNB BN BN VBN VBN VBN
2
1 5
3 4
UPFC
Fig. 10. Single line diagram IEEE 5 bus system.
Fig. 11. Real power on line 2–3.
Fig. 12. Reactive power on line 2–3.
Fig. 13. Sending end voltage across line 2–3.
Fig. 14. Receiving end voltage across line 2–3.
Fig. 15. Angle difference (hse - hrec) between two ends of line 2–3.
Fig. 16. DC voltage across DC link capacitor in IEEE 5 bus system.
660 S. Ahmad et al. / Energy Conversion and Management 79 (2014) 652–665
injected to the line in series with a line current of 0.7 kA. From thegraph a phase difference between the injected voltage and line cur-rent has observed which has indicated the flow of both real andreactive power flow through the line.
Finally, all the bus voltages are represented in Fig. 18 for bothUPFC and without UPFC cases. Overall it can be seen that UPFChas contributed to maintain nominal voltage profile across all thebuses.
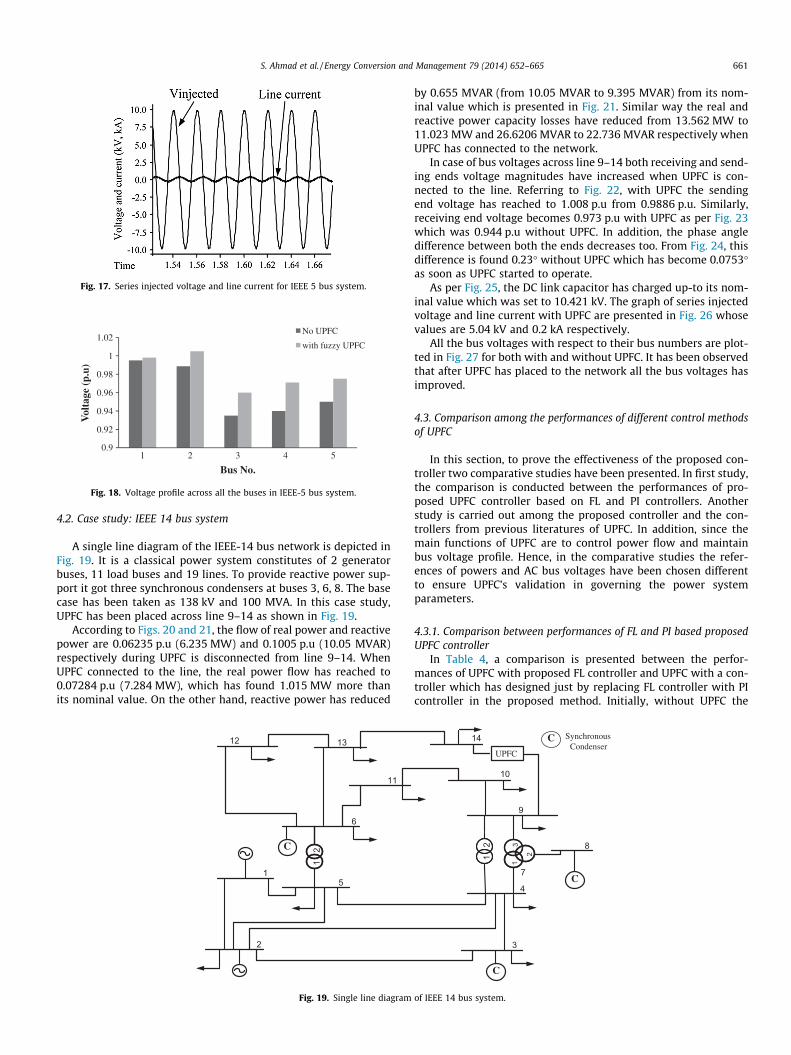
Fig. 17. Series injected voltage and line current for IEEE 5 bus system.
0.9
0.92
0.94
0.96
0.98
1
1.02
1 2 3 4 5
Vol
tage
(p.
u)
Bus No.
No UPFC
with fuzzy UPFC
Fig. 18. Voltage profile across all the buses in IEEE-5 bus system.
S. Ahmad et al. / Energy Conversion and Management 79 (2014) 652–665 661
4.2. Case study: IEEE 14 bus system
A single line diagram of the IEEE-14 bus network is depicted inFig. 19. It is a classical power system constitutes of 2 generatorbuses, 11 load buses and 19 lines. To provide reactive power sup-port it got three synchronous condensers at buses 3, 6, 8. The basecase has been taken as 138 kV and 100 MVA. In this case study,UPFC has been placed across line 9–14 as shown in Fig. 19.
According to Figs. 20 and 21, the flow of real power and reactivepower are 0.06235 p.u (6.235 MW) and 0.1005 p.u (10.05 MVAR)respectively during UPFC is disconnected from line 9–14. WhenUPFC connected to the line, the real power flow has reached to0.07284 p.u (7.284 MW), which has found 1.015 MW more thanits nominal value. On the other hand, reactive power has reduced
1
2
5
12
6
12 13
11
C
Fig. 19. Single line diagram
by 0.655 MVAR (from 10.05 MVAR to 9.395 MVAR) from its nom-inal value which is presented in Fig. 21. Similar way the real andreactive power capacity losses have reduced from 13.562 MW to11.023 MW and 26.6206 MVAR to 22.736 MVAR respectively whenUPFC has connected to the network.
In case of bus voltages across line 9–14 both receiving and send-ing ends voltage magnitudes have increased when UPFC is con-nected to the line. Referring to Fig. 22, with UPFC the sendingend voltage has reached to 1.008 p.u from 0.9886 p.u. Similarly,receiving end voltage becomes 0.973 p.u with UPFC as per Fig. 23which was 0.944 p.u without UPFC. In addition, the phase angledifference between both the ends decreases too. From Fig. 24, thisdifference is found 0.23� without UPFC which has become 0.0753�as soon as UPFC started to operate.
As per Fig. 25, the DC link capacitor has charged up-to its nom-inal value which was set to 10.421 kV. The graph of series injectedvoltage and line current with UPFC are presented in Fig. 26 whosevalues are 5.04 kV and 0.2 kA respectively.
All the bus voltages with respect to their bus numbers are plot-ted in Fig. 27 for both with and without UPFC. It has been observedthat after UPFC has placed to the network all the bus voltages hasimproved.
4.3. Comparison among the performances of different control methodsof UPFC
In this section, to prove the effectiveness of the proposed con-troller two comparative studies have been presented. In first study,the comparison is conducted between the performances of pro-posed UPFC controller based on FL and PI controllers. Anotherstudy is carried out among the proposed controller and the con-trollers from previous literatures of UPFC. In addition, since themain functions of UPFC are to control power flow and maintainbus voltage profile. Hence, in the comparative studies the refer-ences of powers and AC bus voltages have been chosen differentto ensure UPFC’s validation in governing the power systemparameters.
4.3.1. Comparison between performances of FL and PI based proposedUPFC controller
In Table 4, a comparison is presented between the perfor-mances of UPFC with proposed FL controller and UPFC with a con-troller which has designed just by replacing FL controller with PIcontroller in the proposed method. Initially, without UPFC the
3
4
9
7
12
13
2
8
10
14
C
C
C SynchronousCondenser
UPFC
of IEEE 14 bus system.
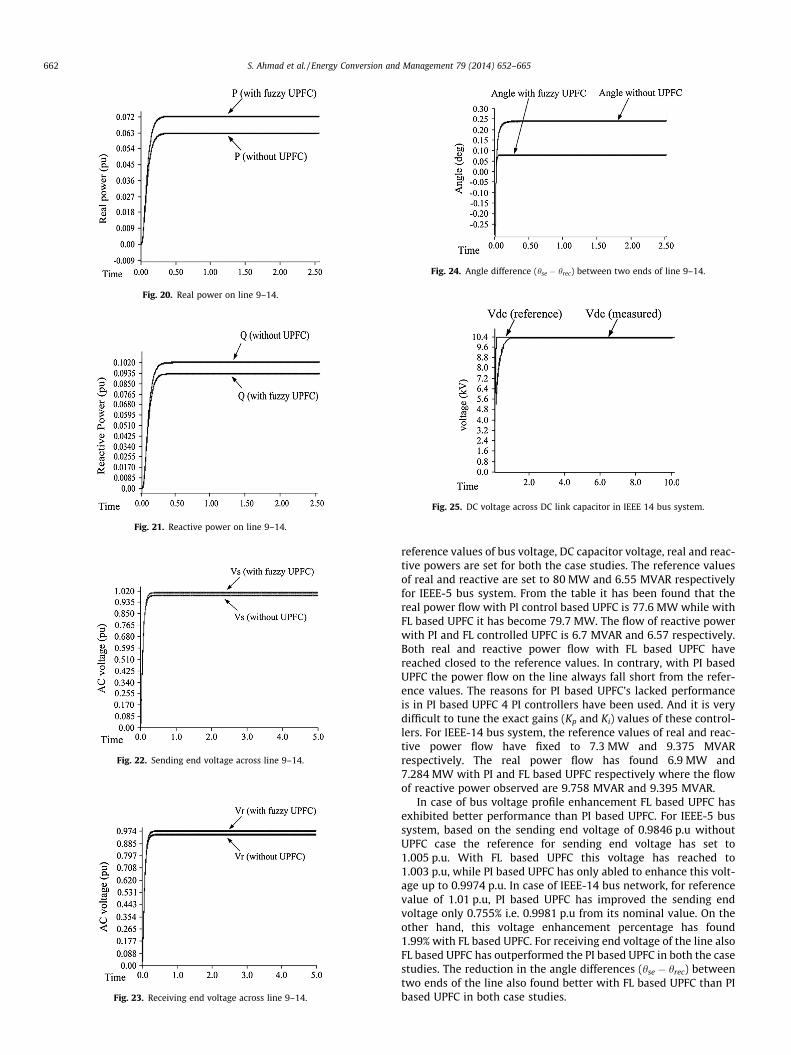
Fig. 20. Real power on line 9–14.
Fig. 21. Reactive power on line 9–14.
Fig. 22. Sending end voltage across line 9–14.
Fig. 23. Receiving end voltage across line 9–14.
Fig. 24. Angle difference (hse � hrec) between two ends of line 9–14.
Fig. 25. DC voltage across DC link capacitor in IEEE 14 bus system.
662 S. Ahmad et al. / Energy Conversion and Management 79 (2014) 652–665
reference values of bus voltage, DC capacitor voltage, real and reac-tive powers are set for both the case studies. The reference valuesof real and reactive are set to 80 MW and 6.55 MVAR respectivelyfor IEEE-5 bus system. From the table it has been found that thereal power flow with PI control based UPFC is 77.6 MW while withFL based UPFC it has become 79.7 MW. The flow of reactive powerwith PI and FL controlled UPFC is 6.7 MVAR and 6.57 respectively.Both real and reactive power flow with FL based UPFC havereached closed to the reference values. In contrary, with PI basedUPFC the power flow on the line always fall short from the refer-ence values. The reasons for PI based UPFC’s lacked performanceis in PI based UPFC 4 PI controllers have been used. And it is verydifficult to tune the exact gains (Kp and Ki) values of these control-lers. For IEEE-14 bus system, the reference values of real and reac-tive power flow have fixed to 7.3 MW and 9.375 MVARrespectively. The real power flow has found 6.9 MW and7.284 MW with PI and FL based UPFC respectively where the flowof reactive power observed are 9.758 MVAR and 9.395 MVAR.
In case of bus voltage profile enhancement FL based UPFC hasexhibited better performance than PI based UPFC. For IEEE-5 bussystem, based on the sending end voltage of 0.9846 p.u withoutUPFC case the reference for sending end voltage has set to1.005 p.u. With FL based UPFC this voltage has reached to1.003 p.u, while PI based UPFC has only abled to enhance this volt-age up to 0.9974 p.u. In case of IEEE-14 bus network, for referencevalue of 1.01 p.u, PI based UPFC has improved the sending endvoltage only 0.755% i.e. 0.9981 p.u from its nominal value. On theother hand, this voltage enhancement percentage has found1.99% with FL based UPFC. For receiving end voltage of the line alsoFL based UPFC has outperformed the PI based UPFC in both the casestudies. The reduction in the angle differences (hse � hrec) betweentwo ends of the line also found better with FL based UPFC than PIbased UPFC in both case studies.
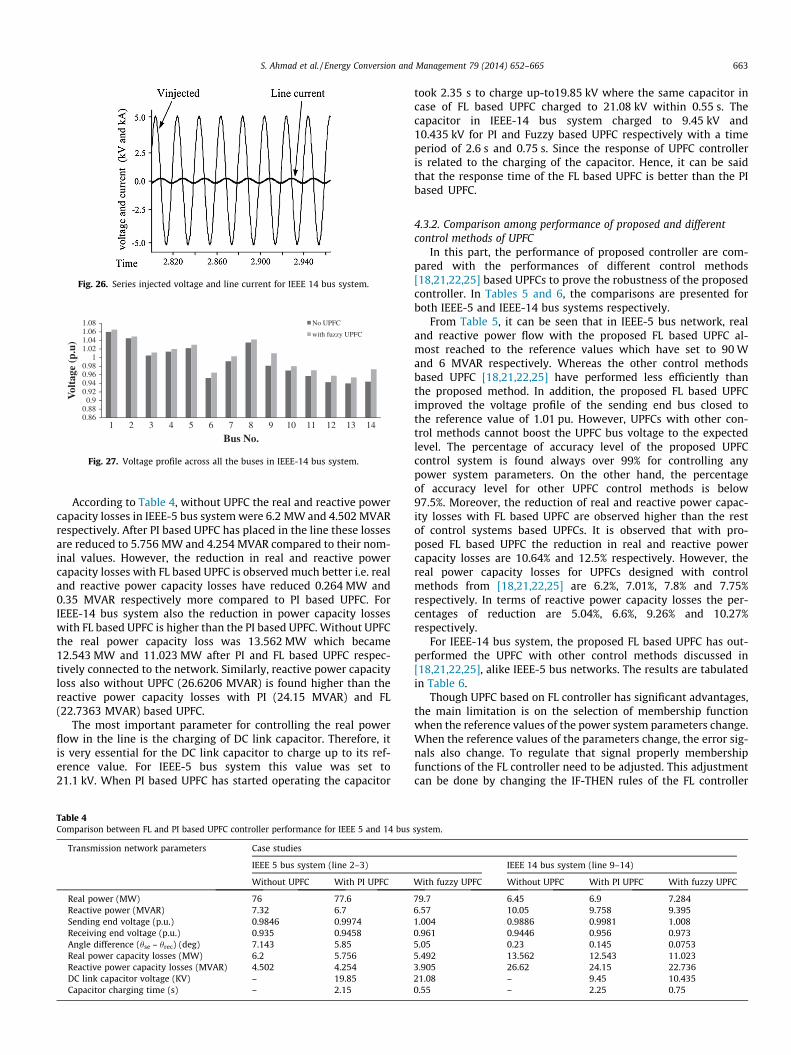
Fig. 26. Series injected voltage and line current for IEEE 14 bus system.
0.860.880.9
0.920.940.960.98
11.021.041.061.08
1 2 3 4 5 6 7 8 9 10 11 12 13 14
Vol
tage
(p.
u)
Bus No.
No UPFC
with fuzzy UPFC
Fig. 27. Voltage profile across all the buses in IEEE-14 bus system.
S. Ahmad et al. / Energy Conversion and Management 79 (2014) 652–665 663
According to Table 4, without UPFC the real and reactive powercapacity losses in IEEE-5 bus system were 6.2 MW and 4.502 MVARrespectively. After PI based UPFC has placed in the line these lossesare reduced to 5.756 MW and 4.254 MVAR compared to their nom-inal values. However, the reduction in real and reactive powercapacity losses with FL based UPFC is observed much better i.e. realand reactive power capacity losses have reduced 0.264 MW and0.35 MVAR respectively more compared to PI based UPFC. ForIEEE-14 bus system also the reduction in power capacity losseswith FL based UPFC is higher than the PI based UPFC. Without UPFCthe real power capacity loss was 13.562 MW which became12.543 MW and 11.023 MW after PI and FL based UPFC respec-tively connected to the network. Similarly, reactive power capacityloss also without UPFC (26.6206 MVAR) is found higher than thereactive power capacity losses with PI (24.15 MVAR) and FL(22.7363 MVAR) based UPFC.
The most important parameter for controlling the real powerflow in the line is the charging of DC link capacitor. Therefore, itis very essential for the DC link capacitor to charge up to its ref-erence value. For IEEE-5 bus system this value was set to21.1 kV. When PI based UPFC has started operating the capacitor
Table 4Comparison between FL and PI based UPFC controller performance for IEEE 5 and 14 bus
Transmission network parameters Case studies
IEEE 5 bus system (line 2–3)
Without UPFC With PI UPFC
Real power (MW) 76 77.6Reactive power (MVAR) 7.32 6.7Sending end voltage (p.u.) 0.9846 0.9974Receiving end voltage (p.u.) 0.935 0.9458Angle difference (hse – hrec) (deg) 7.143 5.85Real power capacity losses (MW) 6.2 5.756Reactive power capacity losses (MVAR) 4.502 4.254DC link capacitor voltage (KV) – 19.85Capacitor charging time (s) – 2.15
took 2.35 s to charge up-to19.85 kV where the same capacitor incase of FL based UPFC charged to 21.08 kV within 0.55 s. Thecapacitor in IEEE-14 bus system charged to 9.45 kV and10.435 kV for PI and Fuzzy based UPFC respectively with a timeperiod of 2.6 s and 0.75 s. Since the response of UPFC controlleris related to the charging of the capacitor. Hence, it can be saidthat the response time of the FL based UPFC is better than the PIbased UPFC.
4.3.2. Comparison among performance of proposed and differentcontrol methods of UPFC
In this part, the performance of proposed controller are com-pared with the performances of different control methods[18,21,22,25] based UPFCs to prove the robustness of the proposedcontroller. In Tables 5 and 6, the comparisons are presented forboth IEEE-5 and IEEE-14 bus systems respectively.
From Table 5, it can be seen that in IEEE-5 bus network, realand reactive power flow with the proposed FL based UPFC al-most reached to the reference values which have set to 90 Wand 6 MVAR respectively. Whereas the other control methodsbased UPFC [18,21,22,25] have performed less efficiently thanthe proposed method. In addition, the proposed FL based UPFCimproved the voltage profile of the sending end bus closed tothe reference value of 1.01 pu. However, UPFCs with other con-trol methods cannot boost the UPFC bus voltage to the expectedlevel. The percentage of accuracy level of the proposed UPFCcontrol system is found always over 99% for controlling anypower system parameters. On the other hand, the percentageof accuracy level for other UPFC control methods is below97.5%. Moreover, the reduction of real and reactive power capac-ity losses with FL based UPFC are observed higher than the restof control systems based UPFCs. It is observed that with pro-posed FL based UPFC the reduction in real and reactive powercapacity losses are 10.64% and 12.5% respectively. However, thereal power capacity losses for UPFCs designed with controlmethods from [18,21,22,25] are 6.2%, 7.01%, 7.8% and 7.75%respectively. In terms of reactive power capacity losses the per-centages of reduction are 5.04%, 6.6%, 9.26% and 10.27%respectively.
For IEEE-14 bus system, the proposed FL based UPFC has out-performed the UPFC with other control methods discussed in[18,21,22,25], alike IEEE-5 bus networks. The results are tabulatedin Table 6.
Though UPFC based on FL controller has significant advantages,the main limitation is on the selection of membership functionwhen the reference values of the power system parameters change.When the reference values of the parameters change, the error sig-nals also change. To regulate that signal properly membershipfunctions of the FL controller need to be adjusted. This adjustmentcan be done by changing the IF-THEN rules of the FL controller
system.
IEEE 14 bus system (line 9–14)
With fuzzy UPFC Without UPFC With PI UPFC With fuzzy UPFC
79.7 6.45 6.9 7.2846.57 10.05 9.758 9.3951.004 0.9886 0.9981 1.0080.961 0.9446 0.956 0.9735.05 0.23 0.145 0.07535.492 13.562 12.543 11.0233.905 26.62 24.15 22.73621.08 – 9.45 10.4350.55 – 2.25 0.75
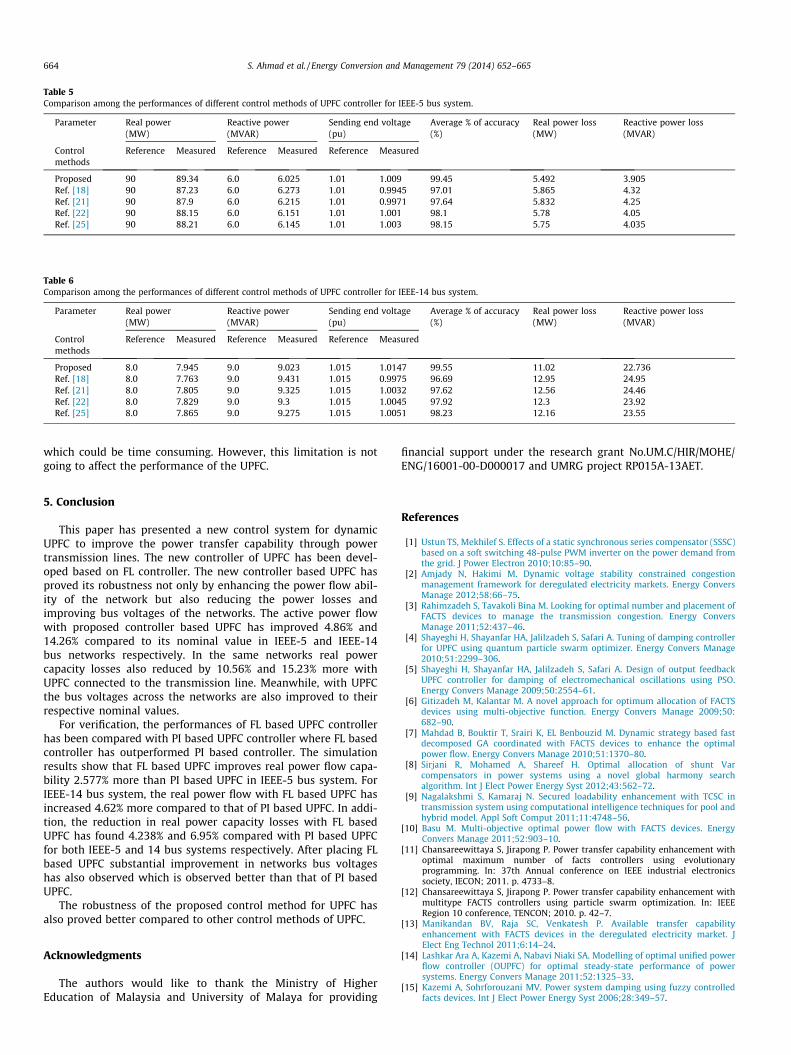
Table 5Comparison among the performances of different control methods of UPFC controller for IEEE-5 bus system.
Parameter Real power(MW)
Reactive power(MVAR)
Sending end voltage(pu)
Average % of accuracy(%)
Real power loss(MW)
Reactive power loss(MVAR)
Controlmethods
Reference Measured Reference Measured Reference Measured
Proposed 90 89.34 6.0 6.025 1.01 1.009 99.45 5.492 3.905Ref. [18] 90 87.23 6.0 6.273 1.01 0.9945 97.01 5.865 4.32Ref. [21] 90 87.9 6.0 6.215 1.01 0.9971 97.64 5.832 4.25Ref. [22] 90 88.15 6.0 6.151 1.01 1.001 98.1 5.78 4.05Ref. [25] 90 88.21 6.0 6.145 1.01 1.003 98.15 5.75 4.035
Table 6Comparison among the performances of different control methods of UPFC controller for IEEE-14 bus system.
Parameter Real power(MW)
Reactive power(MVAR)
Sending end voltage(pu)
Average % of accuracy(%)
Real power loss(MW)
Reactive power loss(MVAR)
Controlmethods
Reference Measured Reference Measured Reference Measured
Proposed 8.0 7.945 9.0 9.023 1.015 1.0147 99.55 11.02 22.736Ref. [18] 8.0 7.763 9.0 9.431 1.015 0.9975 96.69 12.95 24.95Ref. [21] 8.0 7.805 9.0 9.325 1.015 1.0032 97.62 12.56 24.46Ref. [22] 8.0 7.829 9.0 9.3 1.015 1.0045 97.92 12.3 23.92Ref. [25] 8.0 7.865 9.0 9.275 1.015 1.0051 98.23 12.16 23.55
664 S. Ahmad et al. / Energy Conversion and Management 79 (2014) 652–665
which could be time consuming. However, this limitation is notgoing to affect the performance of the UPFC.
5. Conclusion
This paper has presented a new control system for dynamicUPFC to improve the power transfer capability through powertransmission lines. The new controller of UPFC has been devel-oped based on FL controller. The new controller based UPFC hasproved its robustness not only by enhancing the power flow abil-ity of the network but also reducing the power losses andimproving bus voltages of the networks. The active power flowwith proposed controller based UPFC has improved 4.86% and14.26% compared to its nominal value in IEEE-5 and IEEE-14bus networks respectively. In the same networks real powercapacity losses also reduced by 10.56% and 15.23% more withUPFC connected to the transmission line. Meanwhile, with UPFCthe bus voltages across the networks are also improved to theirrespective nominal values.
For verification, the performances of FL based UPFC controllerhas been compared with PI based UPFC controller where FL basedcontroller has outperformed PI based controller. The simulationresults show that FL based UPFC improves real power flow capa-bility 2.577% more than PI based UPFC in IEEE-5 bus system. ForIEEE-14 bus system, the real power flow with FL based UPFC hasincreased 4.62% more compared to that of PI based UPFC. In addi-tion, the reduction in real power capacity losses with FL basedUPFC has found 4.238% and 6.95% compared with PI based UPFCfor both IEEE-5 and 14 bus systems respectively. After placing FLbased UPFC substantial improvement in networks bus voltageshas also observed which is observed better than that of PI basedUPFC.
The robustness of the proposed control method for UPFC hasalso proved better compared to other control methods of UPFC.
Acknowledgments
The authors would like to thank the Ministry of HigherEducation of Malaysia and University of Malaya for providing
financial support under the research grant No.UM.C/HIR/MOHE/ENG/16001-00-D000017 and UMRG project RP015A-13AET.
References
[1] Ustun TS, Mekhilef S. Effects of a static synchronous series compensator (SSSC)based on a soft switching 48-pulse PWM inverter on the power demand fromthe grid. J Power Electron 2010;10:85–90.
[2] Amjady N, Hakimi M. Dynamic voltage stability constrained congestionmanagement framework for deregulated electricity markets. Energy ConversManage 2012;58:66–75.
[3] Rahimzadeh S, Tavakoli Bina M. Looking for optimal number and placement ofFACTS devices to manage the transmission congestion. Energy ConversManage 2011;52:437–46.
[4] Shayeghi H, Shayanfar HA, Jalilzadeh S, Safari A. Tuning of damping controllerfor UPFC using quantum particle swarm optimizer. Energy Convers Manage2010;51:2299–306.
[5] Shayeghi H, Shayanfar HA, Jalilzadeh S, Safari A. Design of output feedbackUPFC controller for damping of electromechanical oscillations using PSO.Energy Convers Manage 2009;50:2554–61.
[6] Gitizadeh M, Kalantar M. A novel approach for optimum allocation of FACTSdevices using multi-objective function. Energy Convers Manage 2009;50:682–90.
[7] Mahdad B, Bouktir T, Srairi K, EL Benbouzid M. Dynamic strategy based fastdecomposed GA coordinated with FACTS devices to enhance the optimalpower flow. Energy Convers Manage 2010;51:1370–80.
[8] Sirjani R, Mohamed A, Shareef H. Optimal allocation of shunt Varcompensators in power systems using a novel global harmony searchalgorithm. Int J Elect Power Energy Syst 2012;43:562–72.
[9] Nagalakshmi S, Kamaraj N. Secured loadability enhancement with TCSC intransmission system using computational intelligence techniques for pool andhybrid model. Appl Soft Comput 2011;11:4748–56.
[10] Basu M. Multi-objective optimal power flow with FACTS devices. EnergyConvers Manage 2011;52:903–10.
[11] Chansareewittaya S, Jirapong P. Power transfer capability enhancement withoptimal maximum number of facts controllers using evolutionaryprogramming. In: 37th Annual conference on IEEE industrial electronicssociety, IECON; 2011. p. 4733–8.
[12] Chansareewittaya S, Jirapong P. Power transfer capability enhancement withmultitype FACTS controllers using particle swarm optimization. In: IEEERegion 10 conference, TENCON; 2010. p. 42–7.
[13] Manikandan BV, Raja SC, Venkatesh P. Available transfer capabilityenhancement with FACTS devices in the deregulated electricity market. JElect Eng Technol 2011;6:14–24.
[14] Lashkar Ara A, Kazemi A, Nabavi Niaki SA. Modelling of optimal unified powerflow controller (OUPFC) for optimal steady-state performance of powersystems. Energy Convers Manage 2011;52:1325–33.
[15] Kazemi A, Sohrforouzani MV. Power system damping using fuzzy controlledfacts devices. Int J Elect Power Energy Syst 2006;28:349–57.

S. Ahmad et al. / Energy Conversion and Management 79 (2014) 652–665 665
[16] García-González P, García-Cerrada A. Detailed analysis and experimentalresults of the control system of a UPFC. IEE Proc-Gen, Transm Distrib 2003;150:147–54.
[17] Liu L, Zhu P, Kang Y, Chen J. Design and dynamic performance analysis of aunified power flow controller. In: 31st Annual conference of IEEE industrialelectronics society, IECON; 2005. p. 1300–6.
[18] Dong L, Zhang L, Crow M. A new control strategy for the unified power flowcontroller. In: IEEE Power engineering society winter meeting; 2002. p. 562–6.
[19] Yu Q, Norum L, Undeland T, Round S. Investigation of dynamic controllers for aunified power flow controller. In: 22nd IEEE International conference onindustrial electronics, control, and instrumentation, IECON; 1996. p. 1764–9.
[20] Fujita H, Akagi H, Watanabe Y. Dynamic control and performance of a unifiedpower flow controller for stabilizing an AC transmission system. IEEE TransPower Electron 2006;21:1013–20.
[21] Hosseini S, Ajami A. Voltage regulation and transient stability enhancement ofa radial AC transmission system using UPFC. In: 30th Annual conference ofIEEE industrial electronics society, IECON; 2004. p. 1150–4.
[22] Kannan S, Jayaram S, Salama M. Real and reactive power coordination for aunified power flow controller. IEEE Trans Power Syst 2004;19:1454–61.
[23] Padiyar K, Kulkarni A. Control design and simulation of unified power flowcontroller. IEEE Trans Power Deliv 1998;13:1348–54.
[24] Gholipour E, Saadate S. Improving of transient stability of power systems usingUPFC. IEEE Trans Power Deliv 2005;20:1677–82.
[25] Jiang X, Chow JH, Edris A-A, Fardanesh B, Uzunovic E. Transfer path stabilityenhancement by voltage-sourced converter-based FACTS controllers. IEEETrans Power Deliv 2010;25:1019–25.
[26] Mishra S. Neural-network-based adaptive UPFC for improving transientstability performance of power system. IEEE Trans Neural Networks 2006;17:461–70.
[27] Venayagamoorthy GK, Kalyani RP. Two separate continually online-trainedneurocontrollers for a unified power flow controller. IEEE Trans Ind Appl2005;41:906–16.
[28] Elsayed BA, Hassan M, Mekhilef S. Decoupled third-order fuzzy sliding modelcontrol for cart-inverted pendulum system. Appl Math 2013;7:193–201.
[29] Eldamaty A, Faried SO, Aboreshaid S. Damping power system oscillations usinga fuzzy logic based unified power flow controller. In: IEEE Canadian conferenceon electrical and computer engineering; 2005. p. 1950–3.
[30] Orizondo R, Alves R. UPFC Simulation and Control Using the ATP/EMTP andMATLAB/Simulink programs. In: IEEE Transmission & distribution conferenceand exposition: Latin, America; 2006. p. 1–7.
[31] Ma T, Lo K. Nonlinear power system damping control strategies for the unifiedpower flow controller (UPFC). In: IEEE International conference on powersystem technology; 2000. p. 673–8.
[32] Saribulut L, Teke A, Tümay M. Dynamic control of unified power flowcontroller under unbalanced network conditions. Simul Model Pract Theor2011;19:817–36.
[33] Elgamal ME, Lotfy A, Ali G. Voltage profile enhancement by fuzzy controlledMLI UPFC. Int J Elect Power Energy Syst 2012;34:10–8.
[34] Shayeghi H, Shayanfar H, Jalilzadeh S, Safari A. A PSO based unified power flowcontroller for damping of power system oscillations. Energy Convers Manage2009;50:2583–92.