Fuzzy-Art Neural Networks for Predicting Chi-Chi Earthquake ...
13
Volume 10 Issue 1 Article 4 Fuzzy-Art Neural Networks for Predicting Chi-Chi Earthquake Induced Fuzzy-Art Neural Networks for Predicting Chi-Chi Earthquake Induced Liquefaction in Yuan-Lin Area Liquefaction in Yuan-Lin Area S. G. Chern Professor, Department of Harbor and River Engineering, National Taiwan Ocean University, Keelung, Taiwan, R.O.C. R. F. Hu Graduate Student, Department of Harbor and River Engineering, National Taiwan Ocean University, Keelung, Taiwan, R.O.C. Y. J. Chang Graduate Student, Department of Harbor and River Engineering, National Taiwan Ocean University, Keelung, Taiwan, R.O.C. I. F. Tsai Graduate Student, Department of Harbor and River Engineering, National Taiwan Ocean University, Keelung, Taiwan, R.O.C. Follow this and additional works at: https://jmstt.ntou.edu.tw/journal Part of the Civil and Environmental Engineering Commons Recommended Citation Recommended Citation Chern, S. G.; Hu, R. F.; Chang, Y. J.; and Tsai, I. F. (2002) "Fuzzy-Art Neural Networks for Predicting Chi-Chi Earthquake Induced Liquefaction in Yuan-Lin Area," Journal of Marine Science and Technology: Vol. 10 : Iss. 1 , Article 4. DOI: 10.51400/2709-6998.2297 Available at: https://jmstt.ntou.edu.tw/journal/vol10/iss1/4 This Research Article is brought to you for free and open access by Journal of Marine Science and Technology. It has been accepted for inclusion in Journal of Marine Science and Technology by an authorized editor of Journal of Marine Science and Technology.
-
Upload
khangminh22 -
Category
Documents
-
view
0 -
download
0
Transcript of Fuzzy-Art Neural Networks for Predicting Chi-Chi Earthquake ...

Volume 10 Issue 1 Article 4
Fuzzy-Art Neural Networks for Predicting Chi-Chi Earthquake Induced Fuzzy-Art Neural Networks for Predicting Chi-Chi Earthquake Induced Liquefaction in Yuan-Lin Area Liquefaction in Yuan-Lin Area
S. G. Chern Professor, Department of Harbor and River Engineering, National Taiwan Ocean University, Keelung, Taiwan, R.O.C.
R. F. Hu Graduate Student, Department of Harbor and River Engineering, National Taiwan Ocean University, Keelung, Taiwan, R.O.C.
Y. J. Chang Graduate Student, Department of Harbor and River Engineering, National Taiwan Ocean University, Keelung, Taiwan, R.O.C.
I. F. Tsai Graduate Student, Department of Harbor and River Engineering, National Taiwan Ocean University, Keelung, Taiwan, R.O.C.
Follow this and additional works at: https://jmstt.ntou.edu.tw/journal
Part of the Civil and Environmental Engineering Commons
Recommended Citation Recommended Citation Chern, S. G.; Hu, R. F.; Chang, Y. J.; and Tsai, I. F. (2002) "Fuzzy-Art Neural Networks for Predicting Chi-Chi Earthquake Induced Liquefaction in Yuan-Lin Area," Journal of Marine Science and Technology: Vol. 10 : Iss. 1 , Article 4. DOI: 10.51400/2709-6998.2297 Available at: https://jmstt.ntou.edu.tw/journal/vol10/iss1/4
This Research Article is brought to you for free and open access by Journal of Marine Science and Technology. It has been accepted for inclusion in Journal of Marine Science and Technology by an authorized editor of Journal of Marine Science and Technology.
Journal of Marine Science and Technology, Vol. 10, No. 1, pp. 21-32 (2002) 21
FUZZ-ART NEURAL NETWORKS FORPREDICTING CHI-CHI EARTHQUAKE
INDUCED LIQUEFACTION IN YUAN-LIN AREA
S. G. Chern*, R. F. Hu**, Y. J. Chang**, and I. F. Tsai**
Paper Received Oct. 9, 2001. Author for Correspondence: S. G. Chern.*Professor, Department of Harbor and River Engineering, National Taiwan
Ocean University, Keelung, Taiwan, R.O.C.**Graduate Student, Department of Harbor and River Engineering,
National Taiwan Ocean University, Keelung, Taiwan, R.O.C.
Key words: Fuzz-ART, ART, fuzzy rule, geotechnical engineering.
ABSTRACT
In this study, a fuzzy adaptive network “Fuzz-ART”, based onadaptive resonance theory (ART) combined with fuzzy set theory isdeveloped to evaluate liquefaction potentials induced by Chi-Chiearthquake in Yuan-Lin area. The proposed system combines thebackpropagation algorithm for parameter learning and the fuzzy ARTalgorithm for structure learning. With the help of case studies, it isshown that the “Fuzz-ART” network is able to predict liquefactionpotentials much more satisfactorily than conventional artificial neu-ral network methods. If more data are collected, it may well evaluateliquefaction potentials induced by Chi-Chi earthquake.
INTRODUCTION
There are hundreds of recent cases of ground fail-ure and damage to structures due to liquefaction duringearthquake in Taiwan, Japan, Yugaslavia, Chile, China,Central America and the United States. During the 1964and 1995 earthquakes in Niigata and Kobe, Japan, manystructures settled several feet and suffered up to 80degrees of tilting (Oshaki, 1970; Yomamuro et al.,1997). The same year of Niigata earthquake, in Valdez,Alaska, extensive flow slides washed entire sections ofthe waterfront into the sea. Recently in 1999, liquefac-tion caused a considerable amount of damage in thecentral part of Taiwan during Chi-Chi earthquake(NCREE, 2000).
Numerous studies have been conducted to under-stand the behavior of cohesionless soil under earth-quake loading. Many of these studies have been basedon the principle of subjecting representative soil ele-ments to the same loading conditions in the laboratory,as they would encounter in the field, and assessing theprobable field performance from the resulting behavior
of the laboratory test specimens. Considerable amountof theoretical and empirical methods have also beendeveloped for liquefaction evaluation.
Many of the existing assessment methods are de-veloped from observations of the performance of sitesduring earthquakes (Seed et al., 1974; Tokimatsu et al.,1983; Robertson et al., 1992). Using field records likeStandard Penetration Test blowcount SPT-N or ConePenetration Test resistance CPT-qc, empirical correla-tions are established between the soil and the seismicproperties and the occurrence or nonoccurrence of liq-uefaction at the site.
The feasibility of using neural networks for as-sessing liquefaction potential from actual field recordshave been examined by many researchers (Goh, 1994;Juang, 2000; Wu, 1995). Neural networks are computermodels whose architectures essentially mimic the bio-logical system of the brain. Neural networks have beenfound to be useful for analyzing complex relationshipsinvolving a multitude of variables, in place of a conven-tional mathematical model. In neural networks, themathematical relationship between the variables doesnot have to be specified. Instead, they learn from theexamples and fed to them. An overview of neuralnetwork is presented, followed by a description of theproposed Fuzz-ART neural network model.
OVERVIEW OF NEURAL NETWORKS
A neural network consists of a number of intercon-nected proceeding units commonly referred to asneurodes or neurons. Each neuron receives an inputsignal from neurons to which it is connected. Each ofthese connections has numerical weights associatedwith it. These weights determine the nature and strengthof the influence between the interconnected neurons.The signals from each input are then processed througha weighted sum of the inputs, and the processed outputsignal is then transmitted to another neuron via a trans-fer or activation function. A typical transfer function isthe sigmoid transfer function. The sigmoid functionmodulates the weight sum of the inputs so that the
Journal of Marine Science and Technology, Vol. 10, No. 1 (2002)22
output approaches unity when the input gets larger andapproaches zero when the input gets smaller.
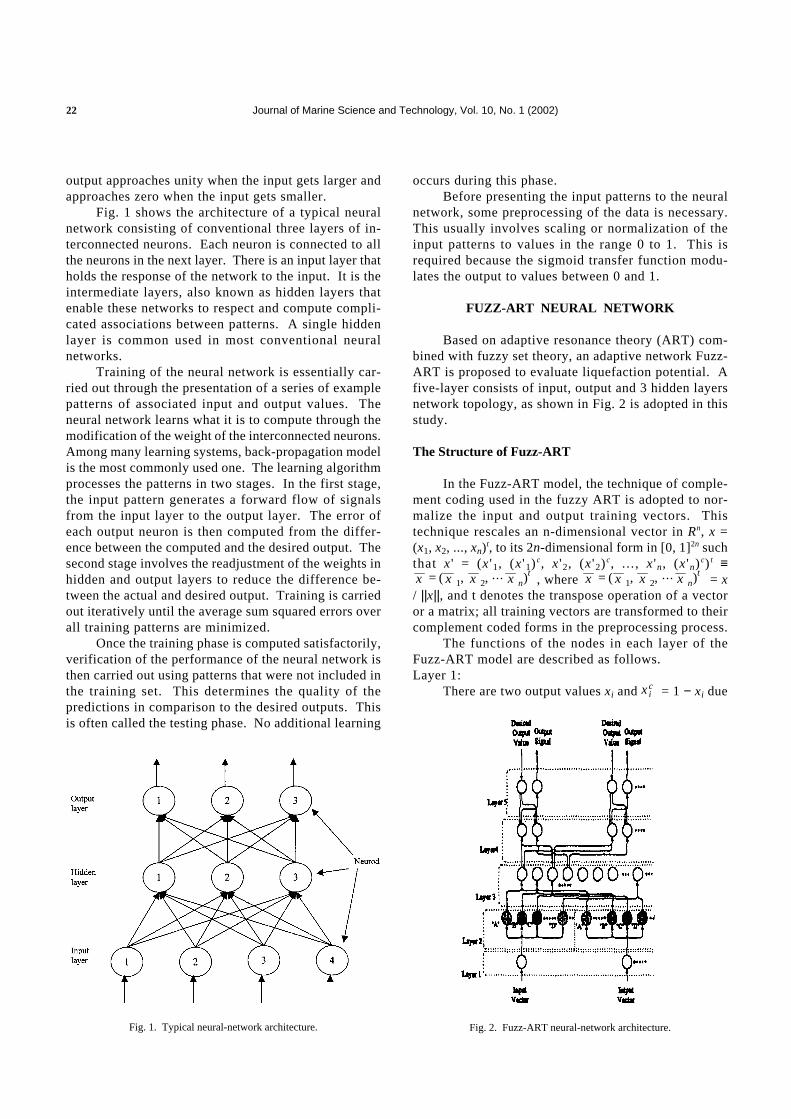
Fig. 1 shows the architecture of a typical neuralnetwork consisting of conventional three layers of in-terconnected neurons. Each neuron is connected to allthe neurons in the next layer. There is an input layer thatholds the response of the network to the input. It is theintermediate layers, also known as hidden layers thatenable these networks to respect and compute compli-cated associations between patterns. A single hiddenlayer is common used in most conventional neuralnetworks.
Training of the neural network is essentially car-ried out through the presentation of a series of examplepatterns of associated input and output values. Theneural network learns what it is to compute through themodification of the weight of the interconnected neurons.Among many learning systems, back-propagation modelis the most commonly used one. The learning algorithmprocesses the patterns in two stages. In the first stage,the input pattern generates a forward flow of signalsfrom the input layer to the output layer. The error ofeach output neuron is then computed from the differ-ence between the computed and the desired output. Thesecond stage involves the readjustment of the weights inhidden and output layers to reduce the difference be-tween the actual and desired output. Training is carriedout iteratively until the average sum squared errors overall training patterns are minimized.
Once the training phase is computed satisfactorily,verification of the performance of the neural network isthen carried out using patterns that were not included inthe training set. This determines the quality of thepredictions in comparison to the desired outputs. Thisis often called the testing phase. No additional learning
occurs during this phase.Before presenting the input patterns to the neural
network, some preprocessing of the data is necessary.This usually involves scaling or normalization of theinput patterns to values in the range 0 to 1. This isrequired because the sigmoid transfer function modu-lates the output to values between 0 and 1.
FUZZ-ART NEURAL NETWORK
Based on adaptive resonance theory (ART) com-bined with fuzzy set theory, an adaptive network Fuzz-ART is proposed to evaluate liquefaction potential. Afive-layer consists of input, output and 3 hidden layersnetwork topology, as shown in Fig. 2 is adopted in thisstudy.
The Structure of Fuzz-ART
In the Fuzz-ART model, the technique of comple-ment coding used in the fuzzy ART is adopted to nor-malize the input and output training vectors. Thistechnique rescales an n-dimensional vector in Rn, x =(x1, x2, ..., xn)t, to its 2n-dimensional form in [0, 1]2n suchthat x ' = (x ' 1, (x ' 1) c, x ' 2, (x ' 2) c, . . . , x 'n, (x 'n) c) t ≡
x = ( x 1, x 2, x n)t, where x = ( x 1, x 2, x n)t
= x/ ||x||, and t denotes the transpose operation of a vectoror a matrix; all training vectors are transformed to theircomplement coded forms in the preprocessing process.
The functions of the nodes in each layer of theFuzz-ART model are described as follows.Layer 1:
There are two output values xi and x ic = 1 − xi due
Fig. 1. Typical neural-network architecture. Fig. 2. Fuzz-ART neural-network architecture.
S.G. Chern et al.: Fuzz-Art Neural Networks for Predicting Chi-Chi Earthquake Induced Liquefaction in Yuan-Lin Area 23
to the complement coding for each input node i. Thenodes in this layer transmit input signals to the nextlayer directly.Layer 2:
Each node in this layer acts as membership function.The generalized bell membership function is used here.We denote the two weights on the link from input nodeas uij and v ij
c that define the membership function.Layer3:
Each node in this layer represents one fuzzy logicrule and the links are used to perform preconditionmatching of fuzzy logic rules. This forms a multi-dimensional generalized bell membership function.Layer 4:
In this layer, each node has two operating modes,i.e. down-up transmission and up-down transmissionmodes. In down-up transmission mode, the links inLayer 4 perform the fuzzy OR operation. While in up-down transmission mode, the nodes here and the links inLayer 5 function are the same as those in Layer 2. Inother words, there are also two weighs on each up-downtransmission links in Layer 5 to define hyperboxes inthe output space.Layer 5:
There are also two kinds of nodes in Layer 5. Oneis up-down transmission for training data to feed intothe networks acting like Layer 1. The other is down-uptransmission for decision signal output. These nodesand the Layer 5 down-up transmission links attached tothem act as a defuzzifier.
Input Clustering Algorithm
We use the fuzzy ART fast-learning algorithm tofind the input membership function parameter.1. Input vector:
Each input I is an n-dimensional vector, whereeach component Ii is in the interval [0,1].2. Choice function:
T j(I) =
I ∧ w
α + w j
, where the fuzzy AND operator ∧
is defined by (x ∧ y)i ≡ min(xi, yi) and where the norm
| | is defined by x = x iΣi = 1
M
The category choice is indexed by J, where Tj =max{Tj: j = 1 ... N}3. Match function:
If I ∧ w
I≥ ρ , resonance will occur and if
I ∧ w j
I
< ρ, mismatch reset will occur.Where ρ is a vigilance parameter.
4. Weight update rule equation:
The weight vector is updated according to theequation
w jnew = β(I ∧ w j
old) + (1 – β)w jold
Fast learning corresponds to setting β = 1.
Case Studies
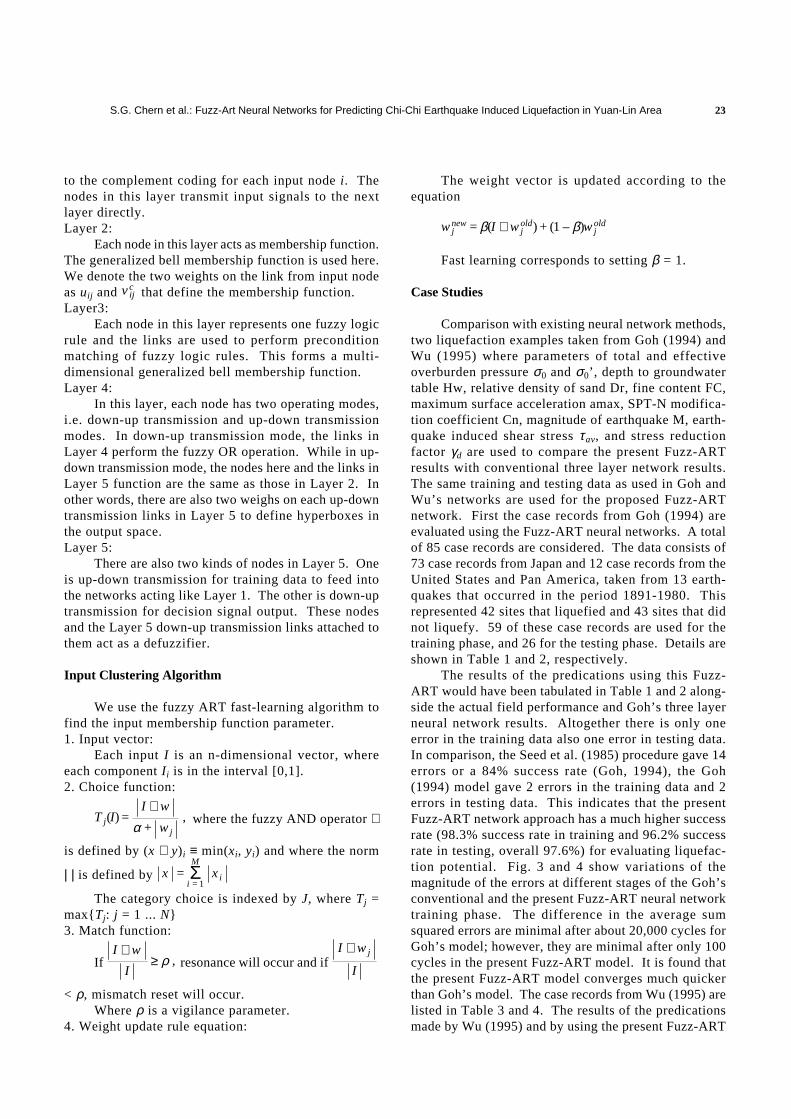
Comparison with existing neural network methods,two liquefaction examples taken from Goh (1994) andWu (1995) where parameters of total and effectiveoverburden pressure σ0 and σ0’, depth to groundwatertable Hw, relative density of sand Dr, fine content FC,maximum surface acceleration amax, SPT-N modifica-tion coefficient Cn, magnitude of earthquake M, earth-quake induced shear stress τav, and stress reductionfactor γd are used to compare the present Fuzz-ARTresults with conventional three layer network results.The same training and testing data as used in Goh andWu’s networks are used for the proposed Fuzz-ARTnetwork. First the case records from Goh (1994) areevaluated using the Fuzz-ART neural networks. A totalof 85 case records are considered. The data consists of73 case records from Japan and 12 case records from theUnited States and Pan America, taken from 13 earth-quakes that occurred in the period 1891-1980. Thisrepresented 42 sites that liquefied and 43 sites that didnot liquefy. 59 of these case records are used for thetraining phase, and 26 for the testing phase. Details areshown in Table 1 and 2, respectively.
The results of the predications using this Fuzz-ART would have been tabulated in Table 1 and 2 along-side the actual field performance and Goh’s three layerneural network results. Altogether there is only oneerror in the training data also one error in testing data.In comparison, the Seed et al. (1985) procedure gave 14errors or a 84% success rate (Goh, 1994), the Goh(1994) model gave 2 errors in the training data and 2errors in testing data. This indicates that the presentFuzz-ART network approach has a much higher successrate (98.3% success rate in training and 96.2% successrate in testing, overall 97.6%) for evaluating liquefac-tion potential. Fig. 3 and 4 show variations of themagnitude of the errors at different stages of the Goh’sconventional and the present Fuzz-ART neural networktraining phase. The difference in the average sumsquared errors are minimal after about 20,000 cycles forGoh’s model; however, they are minimal after only 100cycles in the present Fuzz-ART model. It is found thatthe present Fuzz-ART model converges much quickerthan Goh’s model. The case records from Wu (1995) arelisted in Table 3 and 4. The results of the predicationsmade by Wu (1995) and by using the present Fuzz-ART
Journal of Marine Science and Technology, Vol. 10, No. 1 (2002)24
Table 1. The result of prediction for training set (Goh, 1994)
Field The result of prediction
M σ0 σ'0 N a/g τ av / σ0' F D50 Reference Proposed
behavior neural network Fuzz-ART
7.9 186.4 96.1 20 0.32 0.36 0 0.46 Yes Yes Yes7.9 130.5 81.4 10 0.32 0.32 5 0.28 Yes Yes Yes7.9 111.8 71.6 17 0.28 0.28 3 0.80 Yes Yes Yes7.9 93.2 67.7 13 0.28 0.25 4 0.60 Yes Yes Yes7.9 122.6 93.2 10 0.20 0.16 10 0.25 Yes Yes Yes7.9 141.3 102.0 1 0.20 0.17 14 0.25 Yes Yes Yes7.9 71.6 69.7 2.2 0.20 0.13 22 0.18 Yes Yes Yes7.9 149.1 80.4 16.5 0.20 0.23 1 0.28 Yes Yes Yes7.9 93.2 63.8 11.9 0.20 0.19 5 0.30 Yes Yes Yes7.9 93.2 73.6 5.7 0.20 0.16 20 0.20 No No No7.9 149.1 100.1 2 0.20 0.18 33 0.15 No No No8 89.3 59.8 8 0.20 0.19 10 0.40 Yes Yes Yes8 64.7 35.3 1 0.20 0.24 27 0.20 Yes Yes Yes8 50.0 45.1 2 0.20 0.15 30 0.15 Yes Yes Yes8 130.5 81.4 10 0.16 0.16 5 0.28 Yes Yes Yes7.3 66.7 35.3 7 0.35 0.39 35 0.13 No No No7.3 141.3 70.6 29 0.35 0.39 2 0.80 No No No7.3 123.6 91.2 19 0.35 0.27 4 0.65 Yes Yes Yes7.3 74.6 47.1 8 0.40 0.38 0 0.45 Yes Yes Yes7.3 100.1 51.0 8 0.40 0.45 21 0.10 No No No7.3 128.5 63.8 20 0.40 0.45 0 0.45 No No No7.5 130.5 71.6 8 0.16 0.17 2 0.30 Yes Yes Yes7.5 130.5 71.6 12 0.16 0.17 2 0.30 No No No7.5 128.5 79.5 18 0.16 0.15 2 0.30 No No No7.5 186.4 98.1 10 0.16 0.17 2 0.30 Yes Yes Yes7.5 186.4 98.1 16 0.16 0.17 2 0.30 No No No7.5 186.4 105.9 20 0.16 0.15 2 0.30 No No No7.5 80.4 38.3 4 0.16 0.21 10 0.40 Yes Yes Yes7.5 111.8 65.7 27 0.16 0.16 0 0.30 No No No7.5 93.2 68.7 12 0.16 0.13 0 0.36 No No No7.5 84.4 46.1 6 0.16 0.18 0 0.40 Yes Yes Yes7.9 74.6 45.1 5 0.20 0.21 20 0.12 Yes Yes Yes7.9 111.8 72.6 28 0.23 0.22 5 0.25 No No No7.9 74.6 41.2 6 0.23 0.27 5 0.25 Yes Yes Yes7.9 74.6 45.1 16 0.23 0.25 5 0.25 No No No6.7 118.7 66.7 10 0.10 0.09 0 0.60 No No No6.7 61.8 34.3 5 0.12 0.12 5 0.70 Yes Yes Yes6.7 61.8 41.2 7 0.12 0.1 4 0.28 No No No6.7 80.4 47.1 11 0.12 0.11 0 0.40 No No No6.7 80.4 54.9 4 0.12 0.09 10 0.40 No No No6.7 61.8 41.2 13 0.12 0.10 7 1.60 No No No6.7 80.4 41.2 9 0.12 0.13 12 1.20 No No No6.7 103.0 83.4 9 0.14 0.09 5 0.34 No No No6.7 108.9 70.6 8 0.14 0.11 4 0.36 No No No6.7 59.8 56.9 11 0.14 0.08 5.0 0.53 No No No6.7 74.6 59.8 6 0.14 0.09 10 0.25 No No No6.7 93.2 68.7 9 0.14 0.10 20 0.15 No No No6.7 111.8 77.5 12 0.14 0.11 3 0.35 No No No6.7 74.6 49.1 4 0.12 0.10 10 0.15 No No No5.5 111.8 48.1 6 0.19 0.10 3 0.20 No No No8.3 56.9 53.0 10 0.16 0.22 10 0.20 Yes Yes Yes6.6 72.6 86.3 9 0.45 0.29 20 0.10 Yes Yes Yes7.5 72.6 28.4 8 0.14 0.17 3 1.00 Yes Yes Yes7.5 93.2 34.3 8 0.14 0.14 3 1.00 Yes Yes Yes7.5 58.9 62.8 14 0.14 0.13 3 1.00 No Yes Yes6.6 107.9 51.0 31 0.60 0.45 11 0.12 No No No6.6 58.9 51.0 4 0.60 0.45 25 0.12 No No No6.6 686.7 51.0 11 0.60 0.45 19 0.10 Yes Yes Yes6.6 72.6 46.1 7 0.20 0.21 34 0.09 No No No7.4 118.7 66.7 10 0.20 0.21 0 0.60 Yes No Yes
The shadow determinates the error of prediction
S.G. Chern et al.: Fuzz-Art Neural Networks for Predicting Chi-Chi Earthquake Induced Liquefaction in Yuan-Lin Area 25
model are tabulated in Table 3 alongside the actual fieldperformance. The success rates of the Wu’s and Fuzz-ART neural networks are summarized in Table 5. Theresults indicate that the Fuzz-ART neural network is
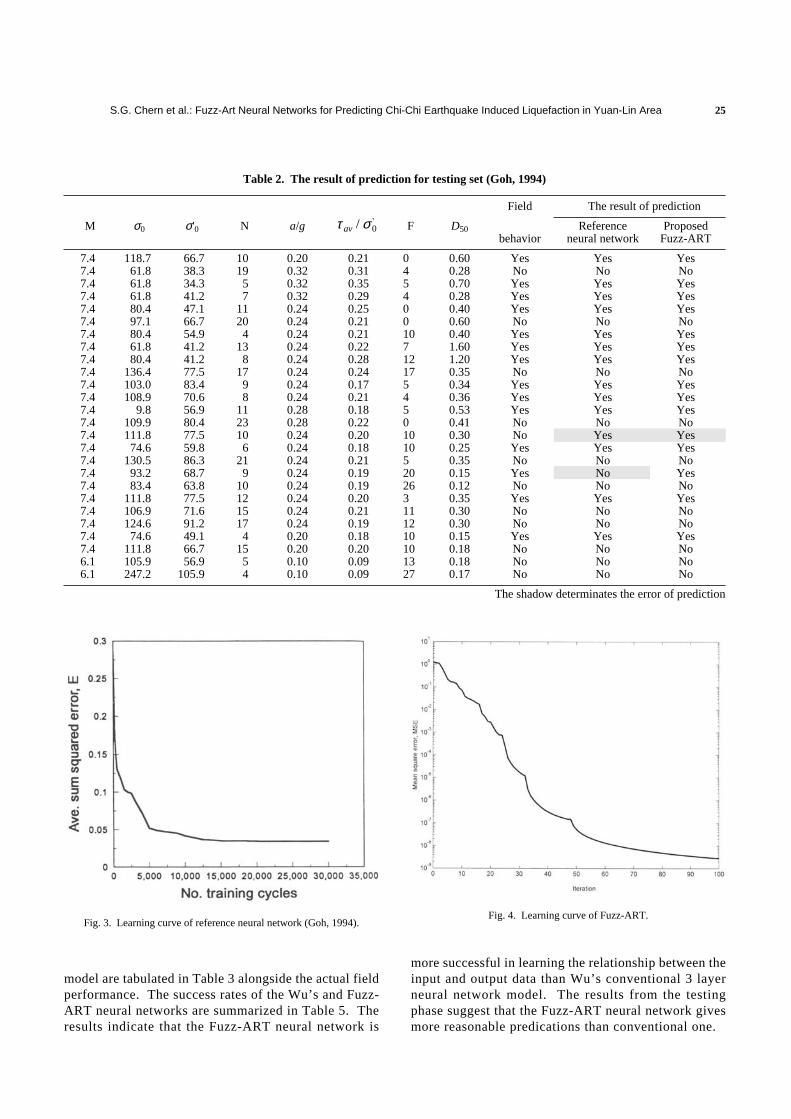
Table 2. The result of prediction for testing set (Goh, 1994)
Field The result of prediction
M σ0 σ'0 N a/g τ av / σ0' F D50 Reference Proposed
behavior neural network Fuzz-ART
7.4 118.7 66.7 10 0.20 0.21 0 0.60 Yes Yes Yes7.4 61.8 38.3 19 0.32 0.31 4 0.28 No No No7.4 61.8 34.3 5 0.32 0.35 5 0.70 Yes Yes Yes7.4 61.8 41.2 7 0.32 0.29 4 0.28 Yes Yes Yes7.4 80.4 47.1 11 0.24 0.25 0 0.40 Yes Yes Yes7.4 97.1 66.7 20 0.24 0.21 0 0.60 No No No7.4 80.4 54.9 4 0.24 0.21 10 0.40 Yes Yes Yes7.4 61.8 41.2 13 0.24 0.22 7 1.60 Yes Yes Yes7.4 80.4 41.2 8 0.24 0.28 12 1.20 Yes Yes Yes7.4 136.4 77.5 17 0.24 0.24 17 0.35 No No No7.4 103.0 83.4 9 0.24 0.17 5 0.34 Yes Yes Yes7.4 108.9 70.6 8 0.24 0.21 4 0.36 Yes Yes Yes7.4 9.8 56.9 11 0.28 0.18 5 0.53 Yes Yes Yes7.4 109.9 80.4 23 0.28 0.22 0 0.41 No No No7.4 111.8 77.5 10 0.24 0.20 10 0.30 No Yes Yes7.4 74.6 59.8 6 0.24 0.18 10 0.25 Yes Yes Yes7.4 130.5 86.3 21 0.24 0.21 5 0.35 No No No7.4 93.2 68.7 9 0.24 0.19 20 0.15 Yes No Yes7.4 83.4 63.8 10 0.24 0.19 26 0.12 No No No7.4 111.8 77.5 12 0.24 0.20 3 0.35 Yes Yes Yes7.4 106.9 71.6 15 0.24 0.21 11 0.30 No No No7.4 124.6 91.2 17 0.24 0.19 12 0.30 No No No7.4 74.6 49.1 4 0.20 0.18 10 0.15 Yes Yes Yes7.4 111.8 66.7 15 0.20 0.20 10 0.18 No No No6.1 105.9 56.9 5 0.10 0.09 13 0.18 No No No6.1 247.2 105.9 4 0.10 0.09 27 0.17 No No No
The shadow determinates the error of prediction
Fig. 3. Learning curve of reference neural network (Goh, 1994).Fig. 4. Learning curve of Fuzz-ART.
more successful in learning the relationship between theinput and output data than Wu’s conventional 3 layerneural network model. The results from the testingphase suggest that the Fuzz-ART neural network givesmore reasonable predications than conventional one.
Journal of Marine Science and Technology, Vol. 10, No. 1 (2002)26
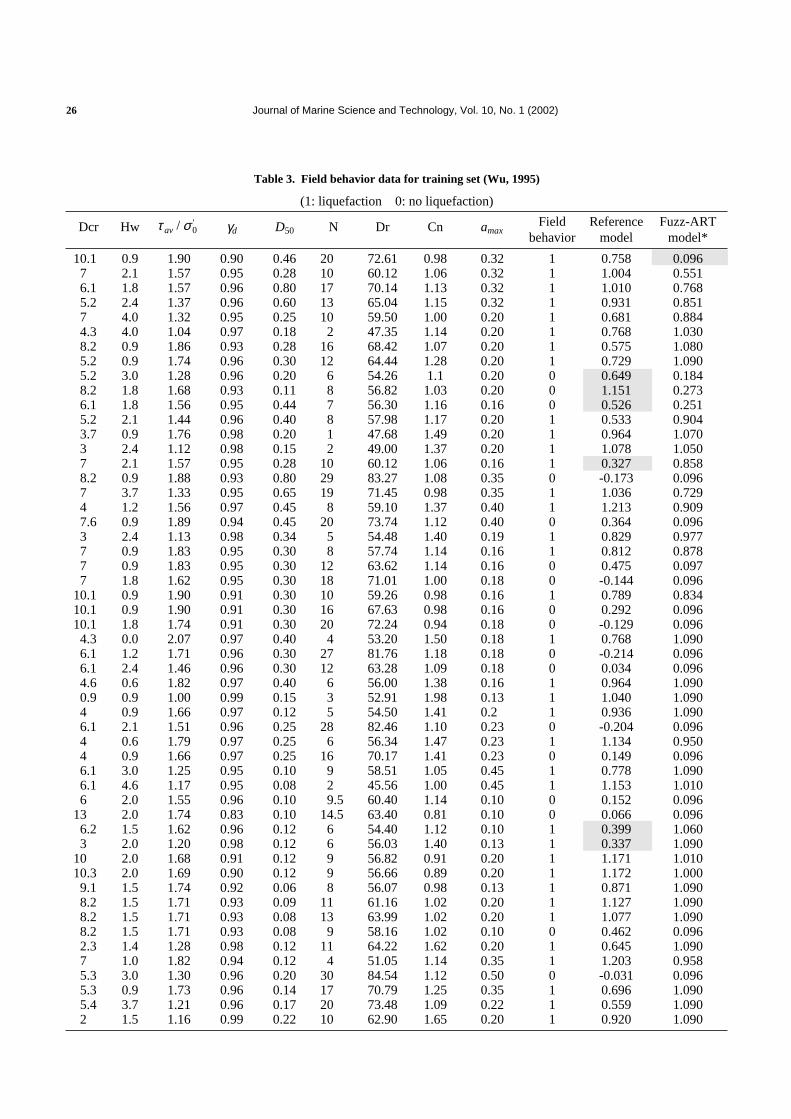
Table 3. Field behavior data for training set (Wu, 1995)
(1: liquefaction 0: no liquefaction)
Field Reference Fuzz-ARTDcr Hw τ av / σ0' γd D50 N Dr Cn amax
behavior model model*
10.1 0.9 1.90 0.90 0.46 20 72.61 0.98 0.32 1 0.758 0.0967 2.1 1.57 0.95 0.28 10 60.12 1.06 0.32 1 1.004 0.5516.1 1.8 1.57 0.96 0.80 17 70.14 1.13 0.32 1 1.010 0.7685.2 2.4 1.37 0.96 0.60 13 65.04 1.15 0.32 1 0.931 0.8517 4.0 1.32 0.95 0.25 10 59.50 1.00 0.20 1 0.681 0.8844.3 4.0 1.04 0.97 0.18 2 47.35 1.14 0.20 1 0.768 1.0308.2 0.9 1.86 0.93 0.28 16 68.42 1.07 0.20 1 0.575 1.0805.2 0.9 1.74 0.96 0.30 12 64.44 1.28 0.20 1 0.729 1.0905.2 3.0 1.28 0.96 0.20 6 54.26 1.1 0.20 0 0.649 0.1848.2 1.8 1.68 0.93 0.11 8 56.82 1.03 0.20 0 1.151 0.2736.1 1.8 1.56 0.95 0.44 7 56.30 1.16 0.16 0 0.526 0.2515.2 2.1 1.44 0.96 0.40 8 57.98 1.17 0.20 1 0.533 0.9043.7 0.9 1.76 0.98 0.20 1 47.68 1.49 0.20 1 0.964 1.0703 2.4 1.12 0.98 0.15 2 49.00 1.37 0.20 1 1.078 1.0507 2.1 1.57 0.95 0.28 10 60.12 1.06 0.16 1 0.327 0.8588.2 0.9 1.88 0.93 0.80 29 83.27 1.08 0.35 0 -0.173 0.0967 3.7 1.33 0.95 0.65 19 71.45 0.98 0.35 1 1.036 0.7294 1.2 1.56 0.97 0.45 8 59.10 1.37 0.40 1 1.213 0.9097.6 0.9 1.89 0.94 0.45 20 73.74 1.12 0.40 0 0.364 0.0963 2.4 1.13 0.98 0.34 5 54.48 1.40 0.19 1 0.829 0.9777 0.9 1.83 0.95 0.30 8 57.74 1.14 0.16 1 0.812 0.8787 0.9 1.83 0.95 0.30 12 63.62 1.14 0.16 0 0.475 0.0977 1.8 1.62 0.95 0.30 18 71.01 1.00 0.18 0 -0.144 0.096
10.1 0.9 1.90 0.91 0.30 10 59.26 0.98 0.16 1 0.789 0.83410.1 0.9 1.90 0.91 0.30 16 67.63 0.98 0.16 0 0.292 0.09610.1 1.8 1.74 0.91 0.30 20 72.24 0.94 0.18 0 -0.129 0.0964.3 0.0 2.07 0.97 0.40 4 53.20 1.50 0.18 1 0.768 1.0906.1 1.2 1.71 0.96 0.30 27 81.76 1.18 0.18 0 -0.214 0.0966.1 2.4 1.46 0.96 0.30 12 63.28 1.09 0.18 0 0.034 0.0964.6 0.6 1.82 0.97 0.40 6 56.00 1.38 0.16 1 0.964 1.0900.9 0.9 1.00 0.99 0.15 3 52.91 1.98 0.13 1 1.040 1.0904 0.9 1.66 0.97 0.12 5 54.50 1.41 0.2 1 0.936 1.0906.1 2.1 1.51 0.96 0.25 28 82.46 1.10 0.23 0 -0.204 0.0964 0.6 1.79 0.97 0.25 6 56.34 1.47 0.23 1 1.134 0.9504 0.9 1.66 0.97 0.25 16 70.17 1.41 0.23 0 0.149 0.0966.1 3.0 1.25 0.95 0.10 9 58.51 1.05 0.45 1 0.778 1.0906.1 4.6 1.17 0.95 0.08 2 45.56 1.00 0.45 1 1.153 1.0106 2.0 1.55 0.96 0.10 9.5 60.40 1.14 0.10 0 0.152 0.096
13 2.0 1.74 0.83 0.10 14.5 63.40 0.81 0.10 0 0.066 0.0966.2 1.5 1.62 0.96 0.12 6 54.40 1.12 0.10 1 0.399 1.0603 2.0 1.20 0.98 0.12 6 56.03 1.40 0.13 1 0.337 1.090
10 2.0 1.68 0.91 0.12 9 56.82 0.91 0.20 1 1.171 1.01010.3 2.0 1.69 0.90 0.12 9 56.66 0.89 0.20 1 1.172 1.0009.1 1.5 1.74 0.92 0.06 8 56.07 0.98 0.13 1 0.871 1.0908.2 1.5 1.71 0.93 0.09 11 61.16 1.02 0.20 1 1.127 1.0908.2 1.5 1.71 0.93 0.08 13 63.99 1.02 0.20 1 1.077 1.0908.2 1.5 1.71 0.93 0.08 9 58.16 1.02 0.10 0 0.462 0.0962.3 1.4 1.28 0.98 0.12 11 64.22 1.62 0.20 1 0.645 1.0907 1.0 1.82 0.94 0.12 4 51.05 1.14 0.35 1 1.203 0.9585.3 3.0 1.30 0.96 0.20 30 84.54 1.12 0.50 0 -0.031 0.0965.3 0.9 1.73 0.96 0.14 17 70.79 1.25 0.35 1 0.696 1.0905.4 3.7 1.21 0.96 0.17 20 73.48 1.09 0.22 1 0.559 1.0902 1.5 1.16 0.99 0.22 10 62.90 1.65 0.20 1 0.920 1.090
S.G. Chern et al.: Fuzz-Art Neural Networks for Predicting Chi-Chi Earthquake Induced Liquefaction in Yuan-Lin Area 27
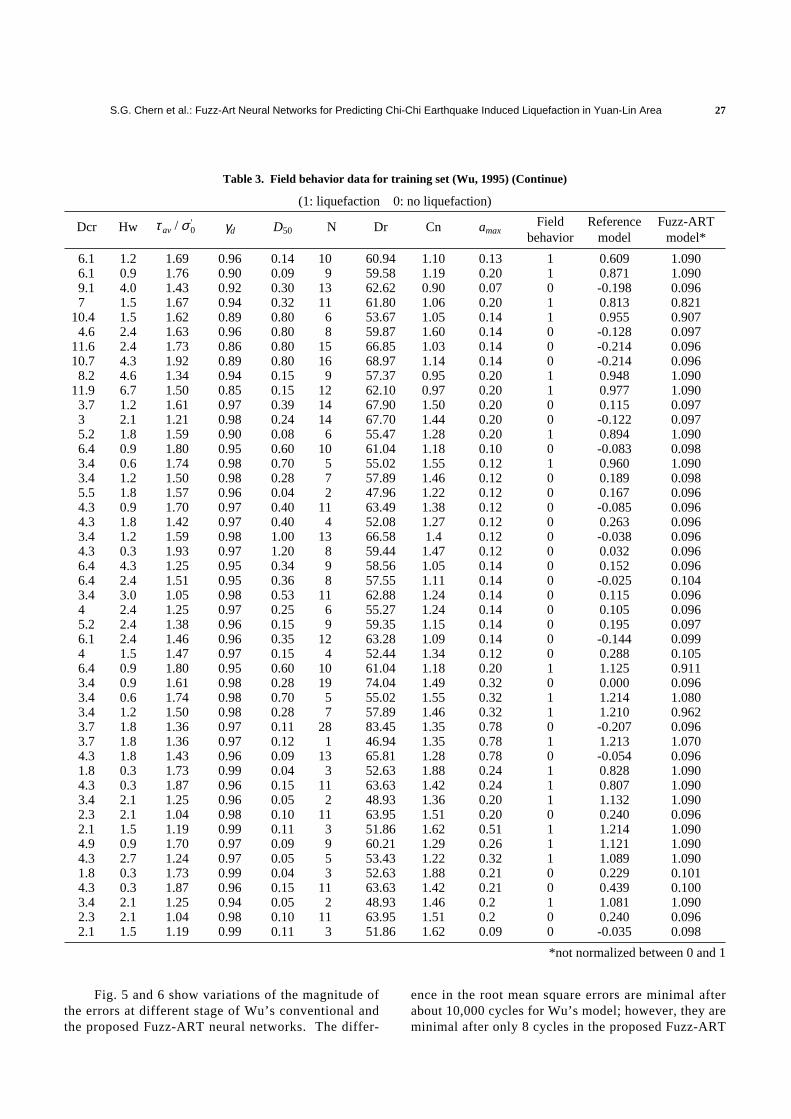
Table 3. Field behavior data for training set (Wu, 1995) (Continue)
(1: liquefaction 0: no liquefaction)
Field Reference Fuzz-ARTDcr Hw τ av / σ0' γd D50 N Dr Cn amax
behavior model model*
6.1 1.2 1.69 0.96 0.14 10 60.94 1.10 0.13 1 0.609 1.0906.1 0.9 1.76 0.90 0.09 9 59.58 1.19 0.20 1 0.871 1.0909.1 4.0 1.43 0.92 0.30 13 62.62 0.90 0.07 0 -0.198 0.0967 1.5 1.67 0.94 0.32 11 61.80 1.06 0.20 1 0.813 0.821
10.4 1.5 1.62 0.89 0.80 6 53.67 1.05 0.14 1 0.955 0.9074.6 2.4 1.63 0.96 0.80 8 59.87 1.60 0.14 0 -0.128 0.097
11.6 2.4 1.73 0.86 0.80 15 66.85 1.03 0.14 0 -0.214 0.09610.7 4.3 1.92 0.89 0.80 16 68.97 1.14 0.14 0 -0.214 0.0968.2 4.6 1.34 0.94 0.15 9 57.37 0.95 0.20 1 0.948 1.090
11.9 6.7 1.50 0.85 0.15 12 62.10 0.97 0.20 1 0.977 1.0903.7 1.2 1.61 0.97 0.39 14 67.90 1.50 0.20 0 0.115 0.0973 2.1 1.21 0.98 0.24 14 67.70 1.44 0.20 0 -0.122 0.0975.2 1.8 1.59 0.90 0.08 6 55.47 1.28 0.20 1 0.894 1.0906.4 0.9 1.80 0.95 0.60 10 61.04 1.18 0.10 0 -0.083 0.0983.4 0.6 1.74 0.98 0.70 5 55.02 1.55 0.12 1 0.960 1.0903.4 1.2 1.50 0.98 0.28 7 57.89 1.46 0.12 0 0.189 0.0985.5 1.8 1.57 0.96 0.04 2 47.96 1.22 0.12 0 0.167 0.0964.3 0.9 1.70 0.97 0.40 11 63.49 1.38 0.12 0 -0.085 0.0964.3 1.8 1.42 0.97 0.40 4 52.08 1.27 0.12 0 0.263 0.0963.4 1.2 1.59 0.98 1.00 13 66.58 1.4 0.12 0 -0.038 0.0964.3 0.3 1.93 0.97 1.20 8 59.44 1.47 0.12 0 0.032 0.0966.4 4.3 1.25 0.95 0.34 9 58.56 1.05 0.14 0 0.152 0.0966.4 2.4 1.51 0.95 0.36 8 57.55 1.11 0.14 0 -0.025 0.1043.4 3.0 1.05 0.98 0.53 11 62.88 1.24 0.14 0 0.115 0.0964 2.4 1.25 0.97 0.25 6 55.27 1.24 0.14 0 0.105 0.0965.2 2.4 1.38 0.96 0.15 9 59.35 1.15 0.14 0 0.195 0.0976.1 2.4 1.46 0.96 0.35 12 63.28 1.09 0.14 0 -0.144 0.0994 1.5 1.47 0.97 0.15 4 52.44 1.34 0.12 0 0.288 0.1056.4 0.9 1.80 0.95 0.60 10 61.04 1.18 0.20 1 1.125 0.9113.4 0.9 1.61 0.98 0.28 19 74.04 1.49 0.32 0 0.000 0.0963.4 0.6 1.74 0.98 0.70 5 55.02 1.55 0.32 1 1.214 1.0803.4 1.2 1.50 0.98 0.28 7 57.89 1.46 0.32 1 1.210 0.9623.7 1.8 1.36 0.97 0.11 28 83.45 1.35 0.78 0 -0.207 0.0963.7 1.8 1.36 0.97 0.12 1 46.94 1.35 0.78 1 1.213 1.0704.3 1.8 1.43 0.96 0.09 13 65.81 1.28 0.78 0 -0.054 0.0961.8 0.3 1.73 0.99 0.04 3 52.63 1.88 0.24 1 0.828 1.0904.3 0.3 1.87 0.96 0.15 11 63.63 1.42 0.24 1 0.807 1.0903.4 2.1 1.25 0.96 0.05 2 48.93 1.36 0.20 1 1.132 1.0902.3 2.1 1.04 0.98 0.10 11 63.95 1.51 0.20 0 0.240 0.0962.1 1.5 1.19 0.99 0.11 3 51.86 1.62 0.51 1 1.214 1.0904.9 0.9 1.70 0.97 0.09 9 60.21 1.29 0.26 1 1.121 1.0904.3 2.7 1.24 0.97 0.05 5 53.43 1.22 0.32 1 1.089 1.0901.8 0.3 1.73 0.99 0.04 3 52.63 1.88 0.21 0 0.229 0.1014.3 0.3 1.87 0.96 0.15 11 63.63 1.42 0.21 0 0.439 0.1003.4 2.1 1.25 0.94 0.05 2 48.93 1.46 0.2 1 1.081 1.0902.3 2.1 1.04 0.98 0.10 11 63.95 1.51 0.2 0 0.240 0.0962.1 1.5 1.19 0.99 0.11 3 51.86 1.62 0.09 0 -0.035 0.098
*not normalized between 0 and 1
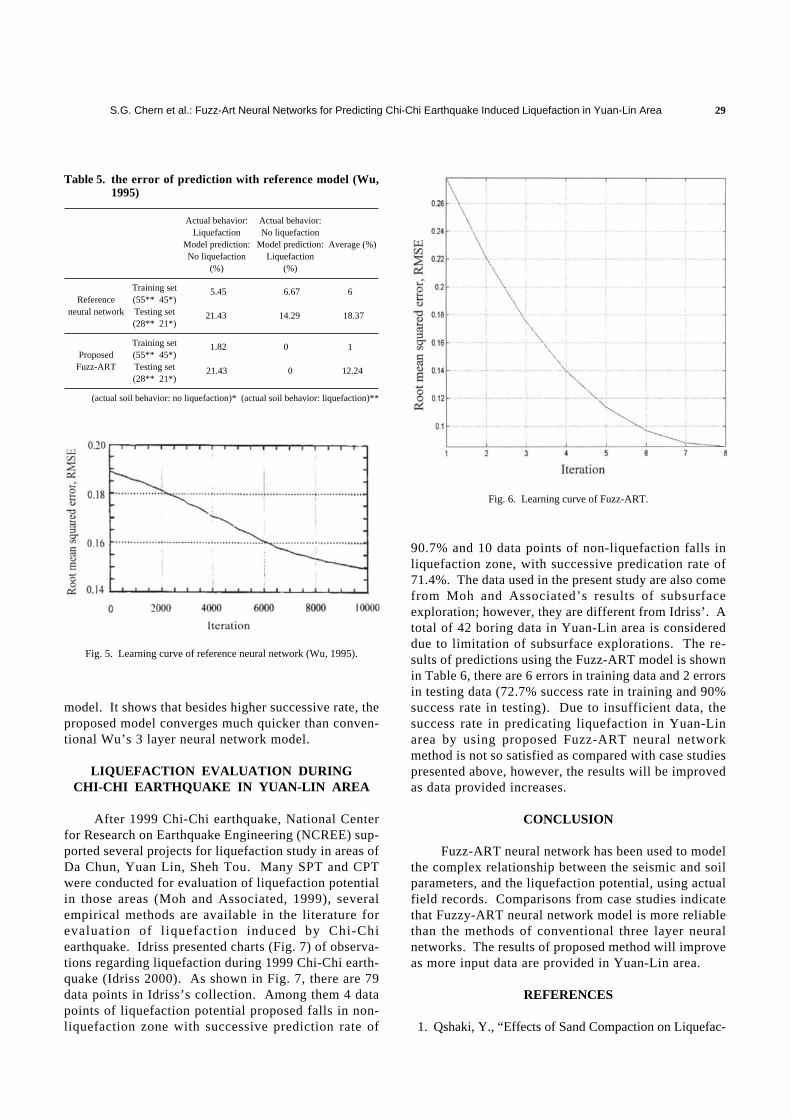
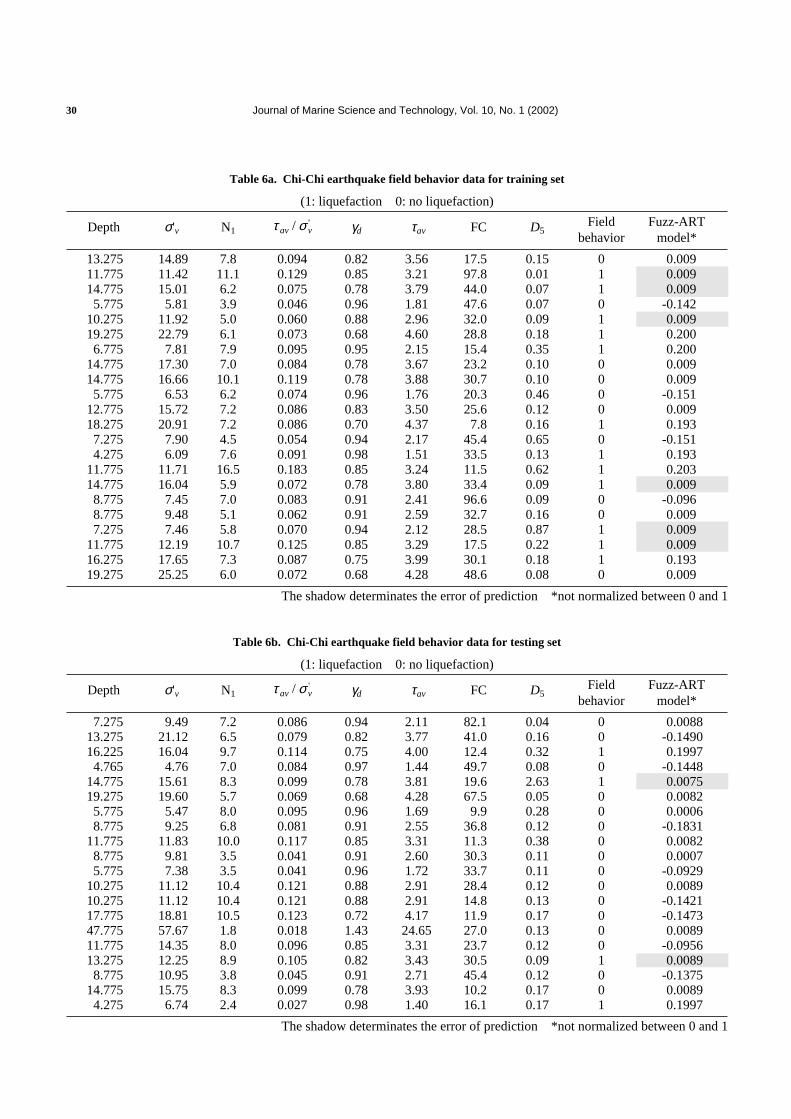
Fig. 5 and 6 show variations of the magnitude ofthe errors at different stage of Wu’s conventional andthe proposed Fuzz-ART neural networks. The differ-
ence in the root mean square errors are minimal afterabout 10,000 cycles for Wu’s model; however, they areminimal after only 8 cycles in the proposed Fuzz-ART
Journal of Marine Science and Technology, Vol. 10, No. 1 (2002)28
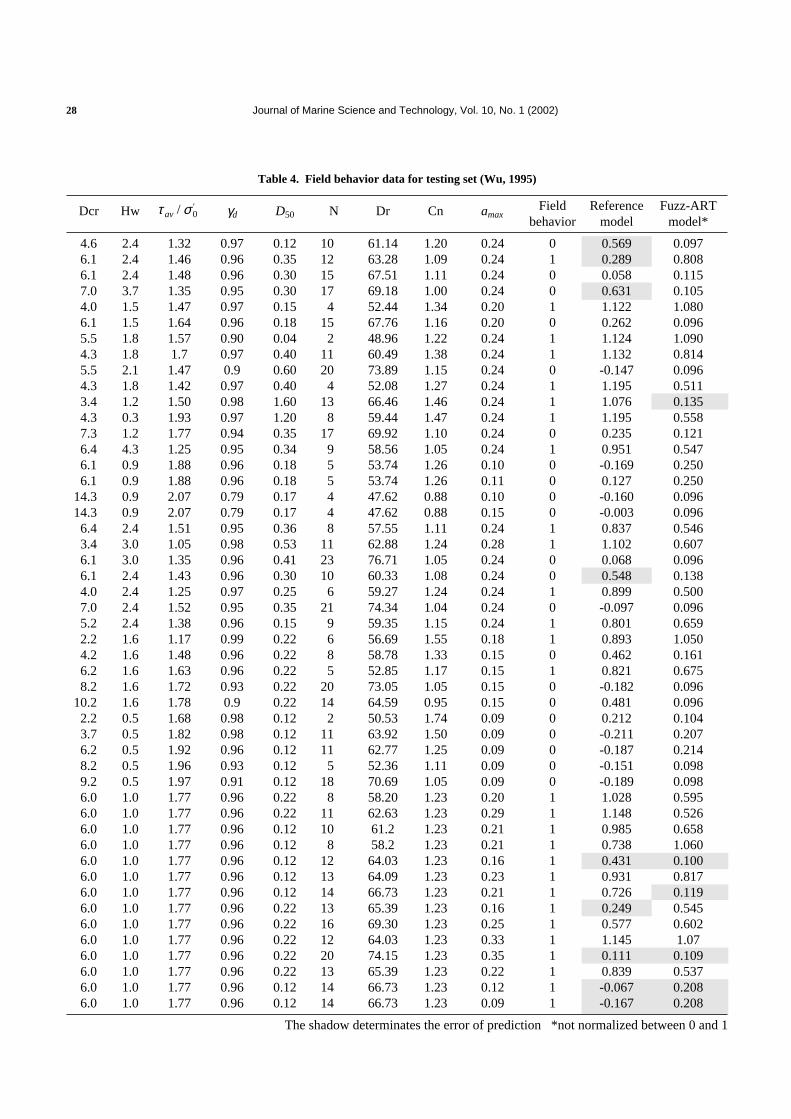
Table 4. Field behavior data for testing set (Wu, 1995)
Field Reference Fuzz-ARTDcr Hw τ av / σ0' γd D50 N Dr Cn amax
behavior model model*
4.6 2.4 1.32 0.97 0.12 10 61.14 1.20 0.24 0 0.569 0.0976.1 2.4 1.46 0.96 0.35 12 63.28 1.09 0.24 1 0.289 0.8086.1 2.4 1.48 0.96 0.30 15 67.51 1.11 0.24 0 0.058 0.1157.0 3.7 1.35 0.95 0.30 17 69.18 1.00 0.24 0 0.631 0.1054.0 1.5 1.47 0.97 0.15 4 52.44 1.34 0.20 1 1.122 1.0806.1 1.5 1.64 0.96 0.18 15 67.76 1.16 0.20 0 0.262 0.0965.5 1.8 1.57 0.90 0.04 2 48.96 1.22 0.24 1 1.124 1.0904.3 1.8 1.7 0.97 0.40 11 60.49 1.38 0.24 1 1.132 0.8145.5 2.1 1.47 0.9 0.60 20 73.89 1.15 0.24 0 -0.147 0.0964.3 1.8 1.42 0.97 0.40 4 52.08 1.27 0.24 1 1.195 0.5113.4 1.2 1.50 0.98 1.60 13 66.46 1.46 0.24 1 1.076 0.1354.3 0.3 1.93 0.97 1.20 8 59.44 1.47 0.24 1 1.195 0.5587.3 1.2 1.77 0.94 0.35 17 69.92 1.10 0.24 0 0.235 0.1216.4 4.3 1.25 0.95 0.34 9 58.56 1.05 0.24 1 0.951 0.5476.1 0.9 1.88 0.96 0.18 5 53.74 1.26 0.10 0 -0.169 0.2506.1 0.9 1.88 0.96 0.18 5 53.74 1.26 0.11 0 0.127 0.250
14.3 0.9 2.07 0.79 0.17 4 47.62 0.88 0.10 0 -0.160 0.09614.3 0.9 2.07 0.79 0.17 4 47.62 0.88 0.15 0 -0.003 0.0966.4 2.4 1.51 0.95 0.36 8 57.55 1.11 0.24 1 0.837 0.5463.4 3.0 1.05 0.98 0.53 11 62.88 1.24 0.28 1 1.102 0.6076.1 3.0 1.35 0.96 0.41 23 76.71 1.05 0.24 0 0.068 0.0966.1 2.4 1.43 0.96 0.30 10 60.33 1.08 0.24 0 0.548 0.1384.0 2.4 1.25 0.97 0.25 6 59.27 1.24 0.24 1 0.899 0.5007.0 2.4 1.52 0.95 0.35 21 74.34 1.04 0.24 0 -0.097 0.0965.2 2.4 1.38 0.96 0.15 9 59.35 1.15 0.24 1 0.801 0.6592.2 1.6 1.17 0.99 0.22 6 56.69 1.55 0.18 1 0.893 1.0504.2 1.6 1.48 0.96 0.22 8 58.78 1.33 0.15 0 0.462 0.1616.2 1.6 1.63 0.96 0.22 5 52.85 1.17 0.15 1 0.821 0.6758.2 1.6 1.72 0.93 0.22 20 73.05 1.05 0.15 0 -0.182 0.096
10.2 1.6 1.78 0.9 0.22 14 64.59 0.95 0.15 0 0.481 0.0962.2 0.5 1.68 0.98 0.12 2 50.53 1.74 0.09 0 0.212 0.1043.7 0.5 1.82 0.98 0.12 11 63.92 1.50 0.09 0 -0.211 0.2076.2 0.5 1.92 0.96 0.12 11 62.77 1.25 0.09 0 -0.187 0.2148.2 0.5 1.96 0.93 0.12 5 52.36 1.11 0.09 0 -0.151 0.0989.2 0.5 1.97 0.91 0.12 18 70.69 1.05 0.09 0 -0.189 0.0986.0 1.0 1.77 0.96 0.22 8 58.20 1.23 0.20 1 1.028 0.5956.0 1.0 1.77 0.96 0.22 11 62.63 1.23 0.29 1 1.148 0.5266.0 1.0 1.77 0.96 0.12 10 61.2 1.23 0.21 1 0.985 0.6586.0 1.0 1.77 0.96 0.12 8 58.2 1.23 0.21 1 0.738 1.0606.0 1.0 1.77 0.96 0.12 12 64.03 1.23 0.16 1 0.431 0.1006.0 1.0 1.77 0.96 0.12 13 64.09 1.23 0.23 1 0.931 0.8176.0 1.0 1.77 0.96 0.12 14 66.73 1.23 0.21 1 0.726 0.1196.0 1.0 1.77 0.96 0.22 13 65.39 1.23 0.16 1 0.249 0.5456.0 1.0 1.77 0.96 0.22 16 69.30 1.23 0.25 1 0.577 0.6026.0 1.0 1.77 0.96 0.22 12 64.03 1.23 0.33 1 1.145 1.076.0 1.0 1.77 0.96 0.22 20 74.15 1.23 0.35 1 0.111 0.1096.0 1.0 1.77 0.96 0.22 13 65.39 1.23 0.22 1 0.839 0.5376.0 1.0 1.77 0.96 0.12 14 66.73 1.23 0.12 1 -0.067 0.2086.0 1.0 1.77 0.96 0.12 14 66.73 1.23 0.09 1 -0.167 0.208
The shadow determinates the error of prediction *not normalized between 0 and 1
S.G. Chern et al.: Fuzz-Art Neural Networks for Predicting Chi-Chi Earthquake Induced Liquefaction in Yuan-Lin Area 29
model. It shows that besides higher successive rate, theproposed model converges much quicker than conven-tional Wu’s 3 layer neural network model.
LIQUEFACTION EVALUATION DURINGCHI-CHI EARTHQUAKE IN YUAN-LIN AREA
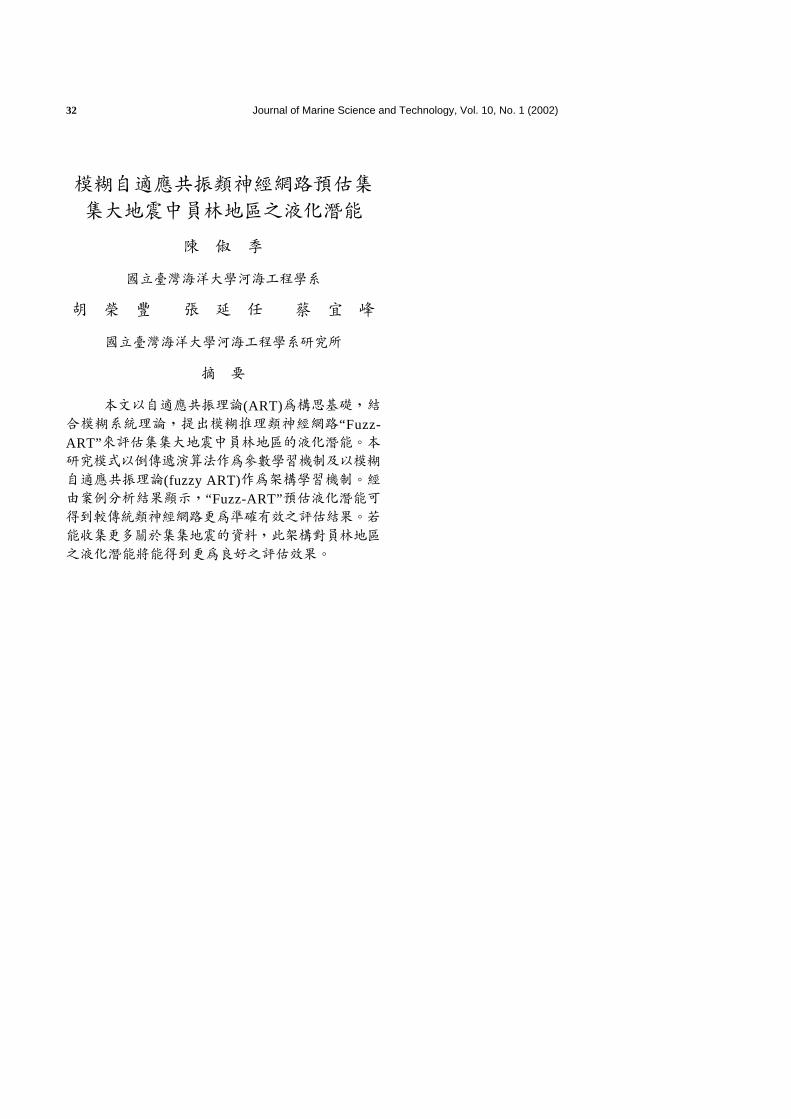
After 1999 Chi-Chi earthquake, National Centerfor Research on Earthquake Engineering (NCREE) sup-ported several projects for liquefaction study in areas ofDa Chun, Yuan Lin, Sheh Tou. Many SPT and CPTwere conducted for evaluation of liquefaction potentialin those areas (Moh and Associated, 1999), severalempirical methods are available in the literature forevaluation of l iquefaction induced by Chi-Chiearthquake. Idriss presented charts (Fig. 7) of observa-tions regarding liquefaction during 1999 Chi-Chi earth-quake (Idriss 2000). As shown in Fig. 7, there are 79data points in Idriss’s collection. Among them 4 datapoints of liquefaction potential proposed falls in non-liquefaction zone with successive prediction rate of
Table 5. the error of prediction with reference model (Wu,1995)
Actual behavior: Actual behavior:Liquefaction No liquefaction
Model prediction: Model prediction: Average (%)No liquefaction Liquefaction
(%) (%)
Training set 5.45 6.67 6Reference (55** 45*)
neural network Testing set 21.43 14.29 18.37(28** 21*)
Training set 1.82 0 1Proposed (55** 45*)
Fuzz-ART Testing set 21.43 0 12.24(28** 21*)
(actual soil behavior: no liquefaction)* (actual soil behavior: liquefaction)**
Fig. 5. Learning curve of reference neural network (Wu, 1995).
Fig. 6. Learning curve of Fuzz-ART.
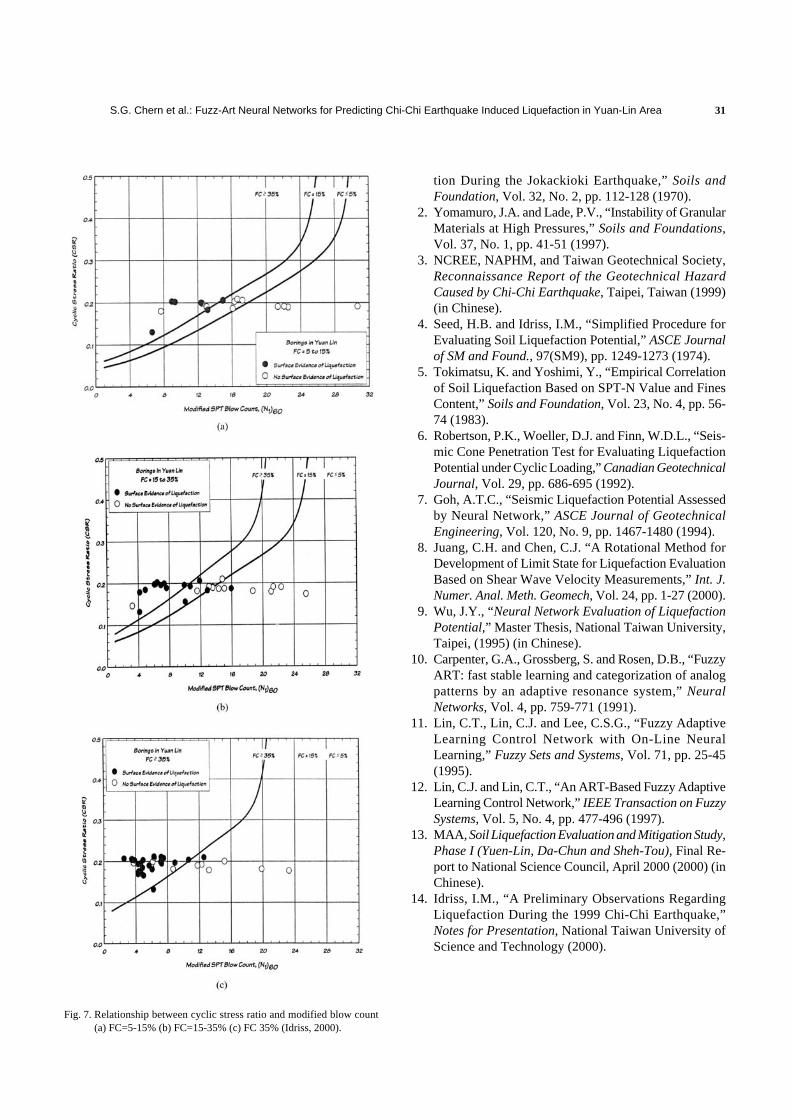
90.7% and 10 data points of non-liquefaction falls inliquefaction zone, with successive predication rate of71.4%. The data used in the present study are also comefrom Moh and Associated’s results of subsurfaceexploration; however, they are different from Idriss’. Atotal of 42 boring data in Yuan-Lin area is considereddue to limitation of subsurface explorations. The re-sults of predictions using the Fuzz-ART model is shownin Table 6, there are 6 errors in training data and 2 errorsin testing data (72.7% success rate in training and 90%success rate in testing). Due to insufficient data, thesuccess rate in predicating liquefaction in Yuan-Linarea by using proposed Fuzz-ART neural networkmethod is not so satisfied as compared with case studiespresented above, however, the results will be improvedas data provided increases.
CONCLUSION
Fuzz-ART neural network has been used to modelthe complex relationship between the seismic and soilparameters, and the liquefaction potential, using actualfield records. Comparisons from case studies indicatethat Fuzzy-ART neural network model is more reliablethan the methods of conventional three layer neuralnetworks. The results of proposed method will improveas more input data are provided in Yuan-Lin area.
REFERENCES
1. Qshaki, Y., “Effects of Sand Compaction on Liquefac-
Journal of Marine Science and Technology, Vol. 10, No. 1 (2002)30
Table 6a. Chi-Chi earthquake field behavior data for training set
(1: liquefaction 0: no liquefaction)
Field Fuzz-ARTDepth σ'v N1 τ av / σ v' γd τav FC D5
behavior model*
13.275 14.89 7.8 0.094 0.82 3.56 17.5 0.15 0 0.00911.775 11.42 11.1 0.129 0.85 3.21 97.8 0.01 1 0.00914.775 15.01 6.2 0.075 0.78 3.79 44.0 0.07 1 0.0095.775 5.81 3.9 0.046 0.96 1.81 47.6 0.07 0 -0.142
10.275 11.92 5.0 0.060 0.88 2.96 32.0 0.09 1 0.00919.275 22.79 6.1 0.073 0.68 4.60 28.8 0.18 1 0.2006.775 7.81 7.9 0.095 0.95 2.15 15.4 0.35 1 0.200
14.775 17.30 7.0 0.084 0.78 3.67 23.2 0.10 0 0.00914.775 16.66 10.1 0.119 0.78 3.88 30.7 0.10 0 0.0095.775 6.53 6.2 0.074 0.96 1.76 20.3 0.46 0 -0.151
12.775 15.72 7.2 0.086 0.83 3.50 25.6 0.12 0 0.00918.275 20.91 7.2 0.086 0.70 4.37 7.8 0.16 1 0.1937.275 7.90 4.5 0.054 0.94 2.17 45.4 0.65 0 -0.1514.275 6.09 7.6 0.091 0.98 1.51 33.5 0.13 1 0.193
11.775 11.71 16.5 0.183 0.85 3.24 11.5 0.62 1 0.20314.775 16.04 5.9 0.072 0.78 3.80 33.4 0.09 1 0.0098.775 7.45 7.0 0.083 0.91 2.41 96.6 0.09 0 -0.0968.775 9.48 5.1 0.062 0.91 2.59 32.7 0.16 0 0.0097.275 7.46 5.8 0.070 0.94 2.12 28.5 0.87 1 0.009
11.775 12.19 10.7 0.125 0.85 3.29 17.5 0.22 1 0.00916.275 17.65 7.3 0.087 0.75 3.99 30.1 0.18 1 0.19319.275 25.25 6.0 0.072 0.68 4.28 48.6 0.08 0 0.009
The shadow determinates the error of prediction *not normalized between 0 and 1
Table 6b. Chi-Chi earthquake field behavior data for testing set
(1: liquefaction 0: no liquefaction)
Field Fuzz-ARTDepth σ'v N1 τ av / σ v' γd τav FC D5
behavior model*
7.275 9.49 7.2 0.086 0.94 2.11 82.1 0.04 0 0.008813.275 21.12 6.5 0.079 0.82 3.77 41.0 0.16 0 -0.149016.225 16.04 9.7 0.114 0.75 4.00 12.4 0.32 1 0.19974.765 4.76 7.0 0.084 0.97 1.44 49.7 0.08 0 -0.1448
14.775 15.61 8.3 0.099 0.78 3.81 19.6 2.63 1 0.007519.275 19.60 5.7 0.069 0.68 4.28 67.5 0.05 0 0.00825.775 5.47 8.0 0.095 0.96 1.69 9.9 0.28 0 0.00068.775 9.25 6.8 0.081 0.91 2.55 36.8 0.12 0 -0.1831
11.775 11.83 10.0 0.117 0.85 3.31 11.3 0.38 0 0.00828.775 9.81 3.5 0.041 0.91 2.60 30.3 0.11 0 0.00075.775 7.38 3.5 0.041 0.96 1.72 33.7 0.11 0 -0.0929
10.275 11.12 10.4 0.121 0.88 2.91 28.4 0.12 0 0.008910.275 11.12 10.4 0.121 0.88 2.91 14.8 0.13 0 -0.142117.775 18.81 10.5 0.123 0.72 4.17 11.9 0.17 0 -0.147347.775 57.67 1.8 0.018 1.43 24.65 27.0 0.13 0 0.008911.775 14.35 8.0 0.096 0.85 3.31 23.7 0.12 0 -0.095613.275 12.25 8.9 0.105 0.82 3.43 30.5 0.09 1 0.00898.775 10.95 3.8 0.045 0.91 2.71 45.4 0.12 0 -0.1375
14.775 15.75 8.3 0.099 0.78 3.93 10.2 0.17 0 0.00894.275 6.74 2.4 0.027 0.98 1.40 16.1 0.17 1 0.1997
The shadow determinates the error of prediction *not normalized between 0 and 1
S.G. Chern et al.: Fuzz-Art Neural Networks for Predicting Chi-Chi Earthquake Induced Liquefaction in Yuan-Lin Area 31
tion During the Jokackioki Earthquake,” Soils andFoundation, Vol. 32, No. 2, pp. 112-128 (1970).
2. Yomamuro, J.A. and Lade, P.V., “Instability of GranularMaterials at High Pressures,” Soils and Foundations,Vol. 37, No. 1, pp. 41-51 (1997).
3. NCREE, NAPHM, and Taiwan Geotechnical Society,Reconnaissance Report of the Geotechnical HazardCaused by Chi-Chi Earthquake, Taipei, Taiwan (1999)(in Chinese).
4. Seed, H.B. and Idriss, I.M., “Simplified Procedure forEvaluating Soil Liquefaction Potential,” ASCE Journalof SM and Found., 97(SM9), pp. 1249-1273 (1974).
5. Tokimatsu, K. and Yoshimi, Y., “Empirical Correlationof Soil Liquefaction Based on SPT-N Value and FinesContent,” Soils and Foundation, Vol. 23, No. 4, pp. 56-74 (1983).
6. Robertson, P.K., Woeller, D.J. and Finn, W.D.L., “Seis-mic Cone Penetration Test for Evaluating LiquefactionPotential under Cyclic Loading,” Canadian GeotechnicalJournal, Vol. 29, pp. 686-695 (1992).
7. Goh, A.T.C., “Seismic Liquefaction Potential Assessedby Neural Network,” ASCE Journal of GeotechnicalEngineering, Vol. 120, No. 9, pp. 1467-1480 (1994).
8. Juang, C.H. and Chen, C.J. “A Rotational Method forDevelopment of Limit State for Liquefaction EvaluationBased on Shear Wave Velocity Measurements,” Int. J.Numer. Anal. Meth. Geomech, Vol. 24, pp. 1-27 (2000).
9. Wu, J.Y., “Neural Network Evaluation of LiquefactionPotential,” Master Thesis, National Taiwan University,Taipei, (1995) (in Chinese).
10. Carpenter, G.A., Grossberg, S. and Rosen, D.B., “FuzzyART: fast stable learning and categorization of analogpatterns by an adaptive resonance system,” NeuralNetworks, Vol. 4, pp. 759-771 (1991).
11. Lin, C.T., Lin, C.J. and Lee, C.S.G., “Fuzzy AdaptiveLearning Control Network with On-Line NeuralLearning,” Fuzzy Sets and Systems, Vol. 71, pp. 25-45(1995).
12. Lin, C.J. and Lin, C.T., “An ART-Based Fuzzy AdaptiveLearning Control Network,” IEEE Transaction on FuzzySystems, Vol. 5, No. 4, pp. 477-496 (1997).
13. MAA, Soil Liquefaction Evaluation and Mitigation Study,Phase I (Yuen-Lin, Da-Chun and Sheh-Tou), Final Re-port to National Science Council, April 2000 (2000) (inChinese).
14. Idriss, I.M., “A Preliminary Observations RegardingLiquefaction During the 1999 Chi-Chi Earthquake,”Notes for Presentation, National Taiwan University ofScience and Technology (2000).
Fig. 7. Relationship between cyclic stress ratio and modified blow count(a) FC=5-15% (b) FC=15-35% (c) FC 35% (Idriss, 2000).
Journal of Marine Science and Technology, Vol. 10, No. 1 (2002)32
�� !"#$%&'()*+,
�� !"#$ %&'()*
�� �!
�� !"#$%&"'(%)
�� �!��"�#�$��%�&�'
�� !"#$%&"'(%)*+,
��
�� !"#$%&'(ART)�� !"#$�� !"#$%&'� (#)*+,-“Fuzz-ART”�� !!"#$%&'#()*+,-./�� !"#$%&'()*+,-./01" 2
�� !"#$(fuzzy ART)�� !"#$%&'�� !"#$%&'“Fuzz-ART”�� !"#$�� !"#$%&'()*+,-./01234
�� !"#$ %&'()*+,-./0%1
�� !"#"$%&'()�*+,-.