Functionally Stable and Phylogenetically Diverse Microbial Enrichments from Microbial Fuel Cells...
12
Functionally Stable and Phylogenetically Diverse Microbial Enrichments from Microbial Fuel Cells during Wastewater Treatment Shun’ichi Ishii 1,2,4 *, Shino Suzuki 1 , Trina M. Norden-Krichmar 1 , Kenneth H. Nealson 1,3 , Yuji Sekiguchi 2 , Yuri A. Gorby 3 , Orianna Bretschger 1 1 J. Craig Venter Institute, San Diego, California, United States of America, 2 Biomedical Research Institute, National Institute of Advanced Industrial Science and Technology (AIST), Tsukuba, Ibaraki, Japan, 3 University of Southern California, Los Angeles, California, United States of America, 4 Japan Society for the Promotion of Science (JSPS), Chiyoda-ku, Tokyo, Japan Abstract Microbial fuel cells (MFCs) are devices that exploit microorganisms as biocatalysts to recover energy from organic matter in the form of electricity. One of the goals of MFC research is to develop the technology for cost-effective wastewater treatment. However, before practical MFC applications are implemented it is important to gain fundamental knowledge about long-term system performance, reproducibility, and the formation and maintenance of functionally-stable microbial communities. Here we report findings from a MFC operated for over 300 days using only primary clarifier effluent collected from a municipal wastewater treatment plant as the microbial resource and substrate. The system was operated in a repeat- batch mode, where the reactor solution was replaced once every two weeks with new primary effluent that consisted of different microbial and chemical compositions with every batch exchange. The turbidity of the primary clarifier effluent solution notably decreased, and 97% of biological oxygen demand (BOD) was removed after an 8–13 day residence time for each batch cycle. On average, the limiting current density was 1000 mA/m 2 , the maximum power density was 13 mW/m 2 , and coulombic efficiency was 25%. Interestingly, the electrochemical performance and BOD removal rates were very reproducible throughout MFC operation regardless of the sample variability associated with each wastewater exchange. While MFC performance was very reproducible, the phylogenetic analyses of anode-associated electricity-generating biofilms showed that the microbial populations temporally fluctuated and maintained a high biodiversity throughout the year-long experiment. These results suggest that MFC communities are both self-selecting and self-optimizing, thereby able to develop and maintain functional stability regardless of fluctuations in carbon source(s) and regular introduction of microbial competitors. These results contribute significantly toward the practical application of MFC systems for long-term wastewater treatment as well as demonstrating MFC technology as a useful device to enrich for functionally stable microbial populations. Citation: Ishii S, Suzuki S, Norden-Krichmar TM, Nealson KH, Sekiguchi Y, et al. (2012) Functionally Stable and Phylogenetically Diverse Microbial Enrichments from Microbial Fuel Cells during Wastewater Treatment. PLoS ONE 7(2): e30495. doi:10.1371/journal.pone.0030495 Editor: Arum Han, Texas A&M University, United States of America Received July 22, 2011; Accepted December 16, 2011; Published February 7, 2012 Copyright: ß 2012 Ishii et al. This is an open-access article distributed under the terms of the Creative Commons Attribution License, which permits unrestricted use, distribution, and reproduction in any medium, provided the original author and source are credited. Funding: This work was supported by Grant-in-Aid for JSPS Fellows (Award no. 07J06446; http://www.jsps.go.jp/english/), National Science Foundation- Biotechnology, Biochemical, and Biomass Engineering (NSF-BBBE) (Award no. 0933145; http://www.nsf.gov/funding/pgm_summ.jsp?pims_id=501024) and NSF Ecosystem Science Cluster (Award no. 0918983; http://www.nsf.gov/funding/pgm_summ.jsp?pims_id=503663). The funders had no role in study design, data collection and analysis, decision to publish, or preparation of the manuscript. Competing Interests: The authors have declared that no competing interests exist. * E-mail: [email protected] Introduction Presently, wastewater treatment is an energy intensive and expensive process. In the USA over 126 billion liters of domestic wastewater are treated daily at an annual cost of over $25 billion [1]. Therefore decreasing total energy consumption during wastewater treatment is an important goal that can be accom- plished through several strategies including: 1) implementing energy efficient equipment and practices; 2) recovering energy during treatment processes; and 3) optimizing treatment methods to minimize overall disposal costs of wastewater effluents and biosolids. Here we address the use of microbial fuel cells (MFCs) for the degradation of carbon sources in primary clarifier effluents from a conventional wastewater treatment plant. MFC treatment may be utilized to replace or supplement conventional secondary treat- ment systems and minimize the overall costs associated with aeration, secondary clarification, and secondary sludge treatment. MFC technology exploits biological fermentation and respiratory mechanisms to directly recover energy as electricity during the degradation of organic matter contained in wastewater and/or sludge [2,3,4]. Relative to conventional primary and secondary treatment processes, MFC systems also have the benefit of reducing overall operational costs because aeration is not needed [5]. In addition, lower overall sludge volumes can be realized because the growth of secondary biomass is limited under anaerobic MFC conditions [6]. A MFC reactor physically separates the oxidation and reduction reactions [7]. The biological oxidation of organic matter proceeds in the anode chamber of a MFC under anaerobic conditions. PLoS ONE | www.plosone.org 1 February 2012 | Volume 7 | Issue 2 | e30495
Transcript of Functionally Stable and Phylogenetically Diverse Microbial Enrichments from Microbial Fuel Cells...

Functionally Stable and Phylogenetically DiverseMicrobial Enrichments from Microbial Fuel Cells duringWastewater TreatmentShun’ichi Ishii1,2,4*, Shino Suzuki1, Trina M. Norden-Krichmar1, Kenneth H. Nealson1,3, Yuji Sekiguchi2,
Yuri A. Gorby3, Orianna Bretschger1
1 J. Craig Venter Institute, San Diego, California, United States of America, 2 Biomedical Research Institute, National Institute of Advanced Industrial Science and
Technology (AIST), Tsukuba, Ibaraki, Japan, 3 University of Southern California, Los Angeles, California, United States of America, 4 Japan Society for the Promotion of
Science (JSPS), Chiyoda-ku, Tokyo, Japan
Abstract
Microbial fuel cells (MFCs) are devices that exploit microorganisms as biocatalysts to recover energy from organic matterin the form of electricity. One of the goals of MFC research is to develop the technology for cost-effective wastewatertreatment. However, before practical MFC applications are implemented it is important to gain fundamental knowledgeabout long-term system performance, reproducibility, and the formation and maintenance of functionally-stable microbialcommunities. Here we report findings from a MFC operated for over 300 days using only primary clarifier effluent collectedfrom a municipal wastewater treatment plant as the microbial resource and substrate. The system was operated in a repeat-batch mode, where the reactor solution was replaced once every two weeks with new primary effluent that consisted ofdifferent microbial and chemical compositions with every batch exchange. The turbidity of the primary clarifier effluentsolution notably decreased, and 97% of biological oxygen demand (BOD) was removed after an 8–13 day residence time foreach batch cycle. On average, the limiting current density was 1000 mA/m2, the maximum power density was 13 mW/m2,and coulombic efficiency was 25%. Interestingly, the electrochemical performance and BOD removal rates were veryreproducible throughout MFC operation regardless of the sample variability associated with each wastewater exchange.While MFC performance was very reproducible, the phylogenetic analyses of anode-associated electricity-generatingbiofilms showed that the microbial populations temporally fluctuated and maintained a high biodiversity throughout theyear-long experiment. These results suggest that MFC communities are both self-selecting and self-optimizing, thereby ableto develop and maintain functional stability regardless of fluctuations in carbon source(s) and regular introduction ofmicrobial competitors. These results contribute significantly toward the practical application of MFC systems for long-termwastewater treatment as well as demonstrating MFC technology as a useful device to enrich for functionally stable microbialpopulations.
Citation: Ishii S, Suzuki S, Norden-Krichmar TM, Nealson KH, Sekiguchi Y, et al. (2012) Functionally Stable and Phylogenetically Diverse Microbial Enrichmentsfrom Microbial Fuel Cells during Wastewater Treatment. PLoS ONE 7(2): e30495. doi:10.1371/journal.pone.0030495
Editor: Arum Han, Texas A&M University, United States of America
Received July 22, 2011; Accepted December 16, 2011; Published February 7, 2012
Copyright: � 2012 Ishii et al. This is an open-access article distributed under the terms of the Creative Commons Attribution License, which permits unrestricteduse, distribution, and reproduction in any medium, provided the original author and source are credited.
Funding: This work was supported by Grant-in-Aid for JSPS Fellows (Award no. 07J06446; http://www.jsps.go.jp/english/), National Science Foundation-Biotechnology, Biochemical, and Biomass Engineering (NSF-BBBE) (Award no. 0933145; http://www.nsf.gov/funding/pgm_summ.jsp?pims_id=501024) and NSFEcosystem Science Cluster (Award no. 0918983; http://www.nsf.gov/funding/pgm_summ.jsp?pims_id=503663). The funders had no role in study design, datacollection and analysis, decision to publish, or preparation of the manuscript.
Competing Interests: The authors have declared that no competing interests exist.
* E-mail: [email protected]
Introduction
Presently, wastewater treatment is an energy intensive and
expensive process. In the USA over 126 billion liters of domestic
wastewater are treated daily at an annual cost of over $25 billion
[1]. Therefore decreasing total energy consumption during
wastewater treatment is an important goal that can be accom-
plished through several strategies including: 1) implementing
energy efficient equipment and practices; 2) recovering energy
during treatment processes; and 3) optimizing treatment methods
to minimize overall disposal costs of wastewater effluents and
biosolids.
Here we address the use of microbial fuel cells (MFCs) for the
degradation of carbon sources in primary clarifier effluents from a
conventional wastewater treatment plant. MFC treatment may be
utilized to replace or supplement conventional secondary treat-
ment systems and minimize the overall costs associated with
aeration, secondary clarification, and secondary sludge treatment.
MFC technology exploits biological fermentation and respiratory
mechanisms to directly recover energy as electricity during the
degradation of organic matter contained in wastewater and/or
sludge [2,3,4]. Relative to conventional primary and secondary
treatment processes, MFC systems also have the benefit of
reducing overall operational costs because aeration is not needed
[5]. In addition, lower overall sludge volumes can be realized
because the growth of secondary biomass is limited under
anaerobic MFC conditions [6].
A MFC reactor physically separates the oxidation and reduction
reactions [7]. The biological oxidation of organic matter proceeds
in the anode chamber of a MFC under anaerobic conditions.
PLoS ONE | www.plosone.org 1 February 2012 | Volume 7 | Issue 2 | e30495
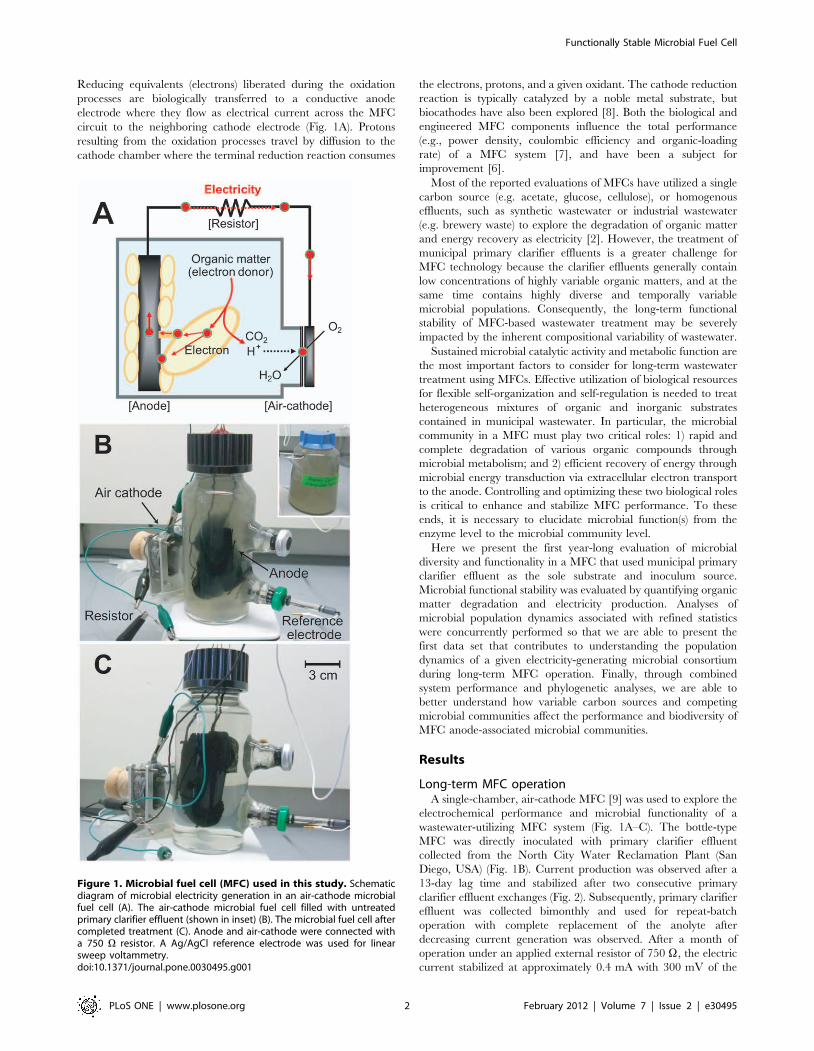
Reducing equivalents (electrons) liberated during the oxidation
processes are biologically transferred to a conductive anode
electrode where they flow as electrical current across the MFC
circuit to the neighboring cathode electrode (Fig. 1A). Protons
resulting from the oxidation processes travel by diffusion to the
cathode chamber where the terminal reduction reaction consumes
the electrons, protons, and a given oxidant. The cathode reduction
reaction is typically catalyzed by a noble metal substrate, but
biocathodes have also been explored [8]. Both the biological and
engineered MFC components influence the total performance
(e.g., power density, coulombic efficiency and organic-loading
rate) of a MFC system [7], and have been a subject for
improvement [6].
Most of the reported evaluations of MFCs have utilized a single
carbon source (e.g. acetate, glucose, cellulose), or homogenous
effluents, such as synthetic wastewater or industrial wastewater
(e.g. brewery waste) to explore the degradation of organic matter
and energy recovery as electricity [2]. However, the treatment of
municipal primary clarifier effluents is a greater challenge for
MFC technology because the clarifier effluents generally contain
low concentrations of highly variable organic matters, and at the
same time contains highly diverse and temporally variable
microbial populations. Consequently, the long-term functional
stability of MFC-based wastewater treatment may be severely
impacted by the inherent compositional variability of wastewater.
Sustained microbial catalytic activity and metabolic function are
the most important factors to consider for long-term wastewater
treatment using MFCs. Effective utilization of biological resources
for flexible self-organization and self-regulation is needed to treat
heterogeneous mixtures of organic and inorganic substrates
contained in municipal wastewater. In particular, the microbial
community in a MFC must play two critical roles: 1) rapid and
complete degradation of various organic compounds through
microbial metabolism; and 2) efficient recovery of energy through
microbial energy transduction via extracellular electron transport
to the anode. Controlling and optimizing these two biological roles
is critical to enhance and stabilize MFC performance. To these
ends, it is necessary to elucidate microbial function(s) from the
enzyme level to the microbial community level.
Here we present the first year-long evaluation of microbial
diversity and functionality in a MFC that used municipal primary
clarifier effluent as the sole substrate and inoculum source.
Microbial functional stability was evaluated by quantifying organic
matter degradation and electricity production. Analyses of
microbial population dynamics associated with refined statistics
were concurrently performed so that we are able to present the
first data set that contributes to understanding the population
dynamics of a given electricity-generating microbial consortium
during long-term MFC operation. Finally, through combined
system performance and phylogenetic analyses, we are able to
better understand how variable carbon sources and competing
microbial communities affect the performance and biodiversity of
MFC anode-associated microbial communities.
Results
Long-term MFC operationA single-chamber, air-cathode MFC [9] was used to explore the
electrochemical performance and microbial functionality of a
wastewater-utilizing MFC system (Fig. 1A–C). The bottle-type
MFC was directly inoculated with primary clarifier effluent
collected from the North City Water Reclamation Plant (San
Diego, USA) (Fig. 1B). Current production was observed after a
13-day lag time and stabilized after two consecutive primary
clarifier effluent exchanges (Fig. 2). Subsequently, primary clarifier
effluent was collected bimonthly and used for repeat-batch
operation with complete replacement of the anolyte after
decreasing current generation was observed. After a month of
operation under an applied external resistor of 750 V, the electric
current stabilized at approximately 0.4 mA with 300 mV of the
Figure 1. Microbial fuel cell (MFC) used in this study. Schematicdiagram of microbial electricity generation in an air-cathode microbialfuel cell (A). The air-cathode microbial fuel cell filled with untreatedprimary clarifier effluent (shown in inset) (B). The microbial fuel cell aftercompleted treatment (C). Anode and air-cathode were connected witha 750 V resistor. A Ag/AgCl reference electrode was used for linearsweep voltammetry.doi:10.1371/journal.pone.0030495.g001
Functionally Stable Microbial Fuel Cell
PLoS ONE | www.plosone.org 2 February 2012 | Volume 7 | Issue 2 | e30495

cell voltage. Some differences in current maxima were apparent
when the solution was replaced with newly collected wastewater or
stored wastewater (at 4uC for up to two weeks) likely due to the
lower concentration of BOD contained in the stored samples
(Fig. 2).
During the long-term MFC operation, current generation was
also impacted by biofilm formation on the cathode surface. After
three months of operation, a dense biofilm was visibly apparent at
the cathode surface and led to a reduction of current generation
due to an overall increase in internal resistance (Fig. 2). To restore
previously observed current generation and internal resistance
measurements, the cathode was mechanically treated to remove
the attached biofilm. This treatment occurred twice during the
300 day operational period, the first time on day 88 and again at
day 192. Subsequently, stable current production was observed to
be approximately 0.25 mA, and the repeat-batch cycles were 8–15
days depending on the condition of primary clarifier effluents.
Organic matter degradationThe purpose of repeat-batch cycling was to observe the
reproducible organic matter degradation as measured by a
decrease in turbidity, removal of chemical oxygen demand
(COD), biological oxygen demand (BOD), and inorganic com-
pounds. Although turbidity of the original sample was high, the
anolyte solution was almost completely clear after the 8–13 day
residence time (Fig. 1C). Organic matter as determined by COD
also consistently decreased with current generation (Fig. S1). Our
results show an average of 8662% of COD was removed in a
typical cycle. Organic matter as determined by BOD also
significantly decreased with 97% of BOD being removed in a
single batch (Table 1). These results suggest that the depletion of
biodegradable organic chemicals coincided with the decrease in
current generation. Electron recovery was calculated as coulombic
efficiency, which was found to be stable at 2661% over the
repeat-batch cycles. That is, approximately 75% of electrons
associated with the COD degradation of each sample were
consumed by competing reactions such as oxygen respiration,
anaerobic respiration with soluble electron acceptors such as
sulfate or nitrate reduction, and/or biosynthesis. During long-term
operation we did not visibly observe any liquid displacement or
significant volume changes with gas production in the reactor
suggesting that fermentation, methanogenesis and/or hydrogen-
esis could not occur at high rates.
Other components of the primary clarifier effluent sample and
treated MFC anolyte are compared in Table 1. These compar-
isons show that potential anaerobic electron acceptors such as
sulfate and nitrite were slightly reduced during the MFC batch
cycle. These data suggest that alternative electron acceptors
existed in the primary clarifier wastewater but were not used as the
preferential terminal electron acceptors during anaerobic respira-
tion. Oxygen is known to permeate the air-breathing cathodes
used in these experiments. However, thick biofilms were observed
at the cathode surface (data not shown) and were likely responsible
for the removal of oxygen at the cathode surface and maintenance
of anaerobic conditions at the anode. The concentrations of
several inorganic heavy metals (except for manganese and
strontium) were significantly decreased in the process; however,
the oxidation states of these metals were not quantified so it is
unknown if the metals served as electron acceptors or if abiotic
adsorption contributed to these observed values. The conductivity
(1.7 mS/cm) and pH (7.57) of the MFC anolyte were unchanged
from their values seen in the raw primary clarifier effluent, and
were stable throughout each cycle.
High pressure liquid chromatography (HPLC) analysis of the
raw primary clarifier effluent and treated MFC anolytes revealed
that various organic chemicals were nearly completely degraded in
the MFC process (Fig. S2). While there was a clear decrease in
number and amounts of organics, many of the peaks could not be
matched to known standards of volatile fatty acids due to the
complex nature of the raw sample. The publically available, North
City Water Reclamation Plant (NCWRP) annual report indicates
that approximately 30 mg/l of n-hexane extractable material
(organic solvents) and 8 mg/l of methylene blue active substances
(MBAS) (surfactants) were present in the primary clarifier effluent
[10]. It is possible that many of the unidentified peaks in the
HPLC chromatographs may be related to organic solvents and/or
surfactants.
Electricity productionPerformance of MFC systems are commonly evaluated in terms
of power and current densities [11]. Electricity production was
monitored as current versus time, but additional electrochemical
Figure 2. Long-term electricity generation in an air-cathode MFC operating with a 750 V external resistance. Filled arrow, removal ofcathode biofilm; Open arrow, anode biofilm sampling for DNA extraction; Filled arrowhead, solution replacement with primary clarifier effluentscollected on the same day; Open arrowhead, solution replacement with primary clarifier effluents stored at 4uC for 5–10 days; Solid star, linear sweepvoltammetry to analyze anode performance.doi:10.1371/journal.pone.0030495.g002
Functionally Stable Microbial Fuel Cell
PLoS ONE | www.plosone.org 3 February 2012 | Volume 7 | Issue 2 | e30495

measurements were performed to thoroughly characterize the
MFC system. On day 32, anodic, cathodic and whole electro-
chemical cell polarization curves were determined by using a
graded series of external resistors (Fig. 3). These curves showed an
open circuit cell voltage of 550 mV, open circuit anode potential
of 2270 mV vs Standard Hydrogen Electrode (SHE), and open
circuit cathode potential of +280 mV vs SHE. The maximum
power density per projected anode surface area was 12.4 mW/m2
(with 750 V of external resistance), while the maximum power
output per reactor volume was 0.3 W/m3. The limiting current
density was 84 mA/m2 with 10 V of external resistance (Fig. 3A).
The anodic and cathodic polarization curves apparently revealed
that reactor performance was cathode limited (Fig. 3B), suggesting
that the cell polarization curve did not reflect the available
microbial biocatalytic activity at the anode [9,12].
In order to better analyze the microbial current generating
properties, the anode polarization curves were determined by
linear sweep voltammetry (LSV) (Fig. 4). Using a potentiostat, the
anode potential was varied from the open circuit anode potential
to +300 mV vs SHE at a scan rate of 0.5 mV/sec, allowing
measurement of anodic activity independent of cathode limitations
[12]. The anode polarization curves on day 64 (Fig. 4A) revealed a
limiting current density of approximately 600 mA/m2. After
another 3 months of operation, the limiting current density
improved to 1,000 mA/m2 (day 141), indicating that electricity
generating microorganisms were further optimized during the
repeat-batch operation. However, the limiting current density did
not increase again after another 100 days of operation (measured
on day 264), suggesting that electricity generating performance
had stabilized between day 141 and day 264. This current density
of 1,000 mA/m2 represents the limiting anodic biocatalytic
activity and may be a function of low ionic conductivity in the
anolyte (1.7 mS/cm), increasing the ohmic losses in the system;
and/or low substrate concentration at the biofilm surface (the
COD was 260 mg/L) as a result of diffusion limitations.
Correlation between anode biomass and electricityproduction
Each repeat-batch cycle began with new and different
suspensions of chemical compounds and microbes. The anode
polarization curves were also measured during the representative
single batch-feed from day 139 to day 152 (Fig. 4B). The
polarization curves revealed similar trends through the initial 6
days, while the curves after day 9 showed an abrupt decrease in
maximum current density and a more electropositive open circuit
anode potential. These changes affirm the drop in current
production as a result of the reduction of available organic matter.
The relationship between each new microbial cell suspension
and the observed patterns of electricity production and organic
matter degradation was also examined. The suspended cell
concentrations decreased during the residence time associated
with each batch cycle. During a representative cycle, it was found
that the suspended cell counts decreased from 7.56107 cells/ml at
day 139 to 1.26107 cells/ml at day 152, suggesting that planktonic
microbial cells were not contributing to organic matter degrada-
tion or electricity generation in the MFC. This is also visibly
evident in the turbidity changes shown in Fig. 1B and 1C.
Scanning electron microscope (SEM) observations of the anode
surface at day 152 clearly revealed a dense biofilm constructed on
the surface (Fig. S3). The biomass density of the biofilm was
determined as total protein concentration per anode surface area,
resulting in 1.25 mg-protein/cm2 on day 152. In order to analyze
normalized biocatalytic activity of the anode biofilm, the per-
biomass electron-donating rate was calculated to be 52.4 mmol-
electron g-protein21 min21.
Table 1. Chemical composition of primary clarifier effluent and MFC effluent.
Primary clarifier effluentb MFC effluentc Removal ratio (%)
COD (mg/L)a 263.3 36.8 86
BOD (mg/L)a 181.4 6.2 97
TSS (mg/L)a 116.0 22.3 81
Turbidity (NTU) 88.7 41.2 54
Nitrate-N (mg/L) 0.03 0.03 0
Nitrite-N (mg/L) 0.15 ,0.01 .93
Ammonia-N (mg/L) 32.4 26.2 19
Sulfate (mg/L) 262.1 218.1 17
Heavy metal conc. (mg/L)
Fe 1688 1027 39
Sr 1120 1010 10
Al 717 120 83
Mn 125 129 23
Cu 82 23 72
Zn 79 33 58
Mo 12 3 75
Cr 6 1 80
aCOD = chemical oxygen demand, BOD = biological oxygen demand, and TSS = total suspended solid.bPrimary clarifier effluent was collected on day 225 and was directly added to the MFC.cThe MFC effluent was collected on day 239.doi:10.1371/journal.pone.0030495.t001
Functionally Stable Microbial Fuel Cell
PLoS ONE | www.plosone.org 4 February 2012 | Volume 7 | Issue 2 | e30495

These data, when taken together, suggest that microbial growth
primarily occurred at the electrode surfaces and that the anode
consortium was primarily responsible for organic matter degra-
dation and current production in the MFC.
Phylogenetic compositionTo analyze the microbial community composition dynamics of
the anode biofilm, we constructed 16 S rRNA gene clone libraries
of anode biofilm samples collected at day 44 (W1), day 133 (W2),
day 263 (W3), and day 294 (W4). Clone libraries prepared from
raw primary clarifier effluent samples collected at day 14 (PC1),
day 152 (PC2), and day 304 (PC4) were also analyzed because
these samples served as carbon and inoculum sources for each
repeat-batch cycle.
The rarefaction-curve analysis for the MFC anode and primary
clarifier samples showed that the anode biofilm community at any
given time was more diverse than the communities of primary
clarifier effluents (Fig. 5). This result indicates that counts of
phylotypes in the anode biofilm were not reduced throughout the
year long enrichment process. The Shannon’s diversity index,
Simpson diversity index, and Chao-1 richness also suggest this
trend (Table 2).
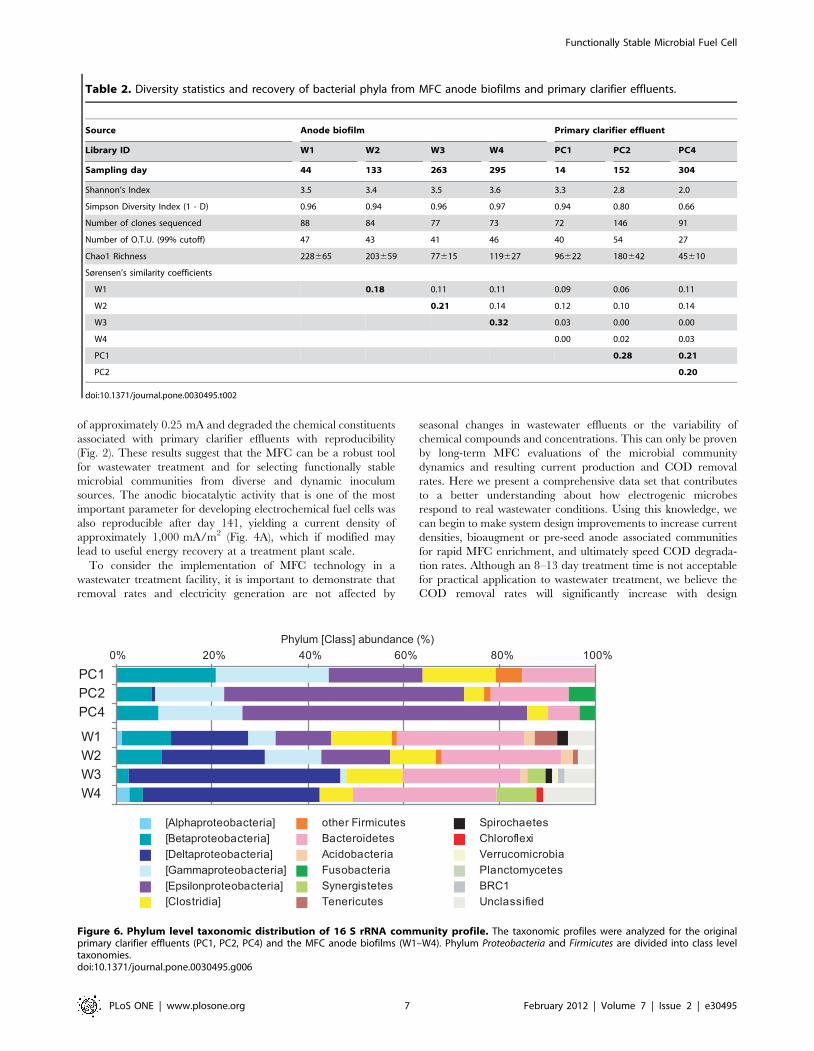
Results from the seven different 16 S rRNA clone library
analyses are shown in Fig. 6 and summarize the phylogenetic
affiliations to taxa at the phylum or class level. The analyses
indicate that all clones were affiliated with the domain Bacteria.
The relatively high abundant phyla in the 16 S rRNA clone
libraries of both the anode biofilm and primary clarifier effluents
were Proteobacteria, Firmicutes, and Bacteroidetes. Those phylotypes are
considered as relatively abundant species in the microbial
communities. Of the Proteobacteria, members of the class Deltapro-
teobacteria were abundant in the anode biofilm samples and
significantly increased in abundance throughout the long-term
MFC operation. In contrast, those of the Betaproteobacteria,
Gammaproteobacteria, and Epsilonproteobacteria decreased in abun-
dance within the anode biofilm samples even though these
members were abundant in every characterized primary clarifier
effluent sample. These results indicate that deltaproteobacterial
species are important for electricity generation in the anode
biofilm. Furthermore, the frequency of the phylum Bacteroidetes in
the anode biofilm was slightly higher than that of primary clarifier
effluents, suggesting that Bacteroidetes could also be important for
efficient biofilm function.
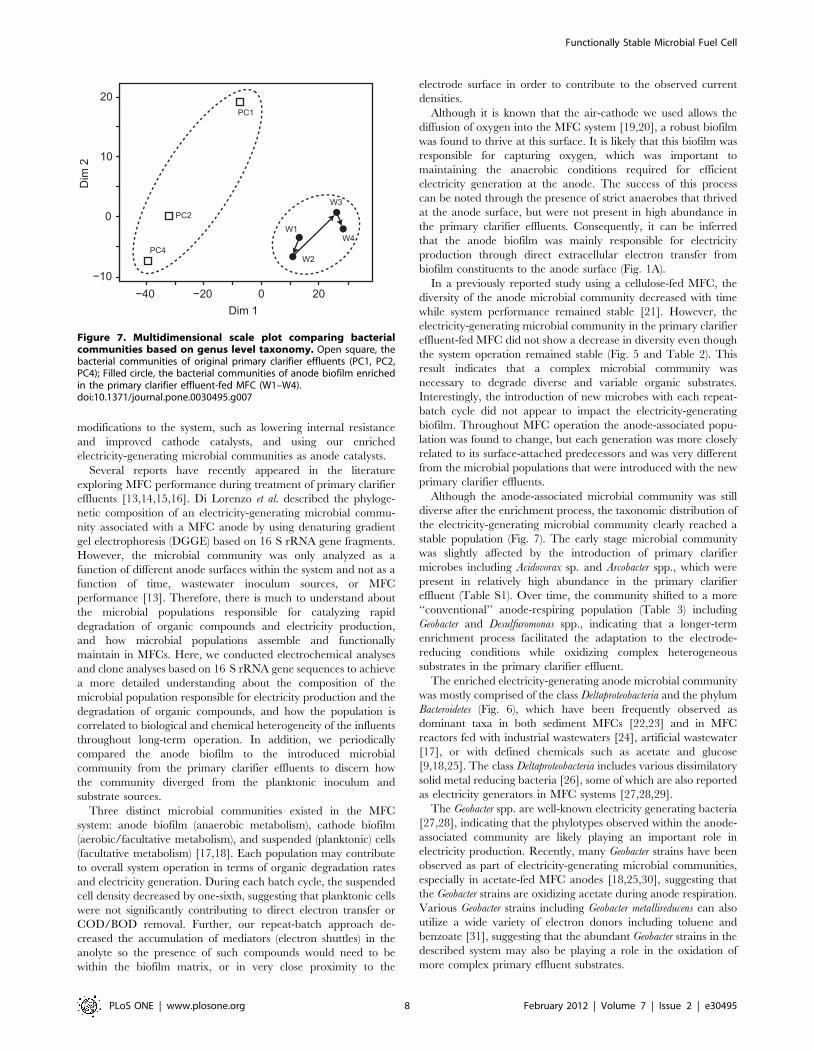
In order to further compare the microbial communities, a
multidimensional scale plot (MDS) was created based on genus
level taxonomy (Fig. 7). The plot suggests that the microbial
communities associated with primary clarifier effluents were more
diverse than those of the anode biofilm, and there was a significant
difference between those two groups. Sørensen’s similarity
coefficient was also used to statistically compare the similarity of
these two types of microbial communities. The summary of
Sørensen’s similarity coefficients among the seven microbial
communities based on operational taxonomy unit (OTU) at
99% cut off is shown in Table 2. These results indicate that the
functionally enriched anode community varies slightly with time,
but is significantly different than the planktonic populations that
challenge the existing biofilm with each repeat-batch cycle.
In the early phases of MFC operation (W1 and W2), the anodic
microbial communities had slight similarities to the microbial
communities of the primary clarifier effluents. These results
suggest that some of the initial bacteria introduced to the MFC
reactor attached and then established the electricity-generating
microbial community in the anode biofilm. Furthermore, the data
indicate that the established biofilm was not susceptible to invasion
by new microbial populations introduced with the primary clarifier
repeat-batch anolyte replacements.
Electricity-generating bacteriaTable 3 shows the abundant phylotypes, containing more than
5 clones, from the anode electricity-generating biofilm samples
W1–W4. Large portions (,50%) of the biofilm clones were
categorized into the minor phylotypes, which are summarized in
Table S1.
Deltaproteobacteria. As mentioned above, Deltaproteobacteria
are potentially important bacteria for extracellular electron
transfer in the anode biofilm, however, the dominant phylotypes
within this class changed over time. During the early stage of MFC
operation (day 44, W1 clone library) the Deltaproteobacteria were
primarily comprised of a phylotype W1_B02, which is closely
related to Geobacter sp. Ply1. However, during the following stage
(day 133, W2 clone library) the dominant phylotype was
W2_M05, which is more related to Geobacter lovleyi SZ. Over 200
days of operation, the matured biofilm samples represented in W3
(day 263) and W4 (day 294) clone libraries showed that the
dominate phylotypes at the early stages had diminished, and
another five abundant phylotypes were apparent in the class
Deltaproteobacteria. The phylotype W2_A03, which appeared first in
the W2 clone library, subsequently became dominant as the
biofilm continued to mature, was found to be closely related to
Desulfuromonas acetexigens.
Figure 3. Power curve and polarization curves in the primaryclarifier effluent-fed MFC. Power curve (A) and anodic and cathodicpolarization (B) measured from the MFC after stable current productionwas observed on day 32. Anode potential (solid square), cathodepotential (solid triangle), and cell voltages (solid diamond) weremeasured at various external resistances and plotted versus currentdensity normalized to the projected anode surface area. Reactor powerperformance is represented by power density per anode surface area(open circle).doi:10.1371/journal.pone.0030495.g003
Functionally Stable Microbial Fuel Cell
PLoS ONE | www.plosone.org 5 February 2012 | Volume 7 | Issue 2 | e30495

Epsilonproteobacteria. A phylotype W1_J08, which is
closely related to Arcobacter cryaerophilus, was highly abundant in
only the early stages of anode microbial community development
(Table 3). This phylotype was also abundantly present in the
primary clarifier effluent (Table S2), suggesting that the bacterium
was simply introduced from the wastewater but did not thrive at
the anode surface during prolonged electricity generating
conditions.
Bacteroidetes. The phylum Bacteroidetes was also abundant in
the anode biofilm and various abundant phylotypes were observed
throughout the long-term MFC operation (Table 3). Interestingly,
the Bacteroidetes phylotypes that were found in the anode-associated
consortia were not observed in the raw primary clarifier effluent
(Table S2); furthermore, the phylotypes were not closely related to
isolated Bacteroidetes strains (Table 3).
Discussion
The present study successfully investigated the performance and
phylogenetic diversity of an MFC community fed solely with raw
primary clarifier effluent from a municipal wastewater treatment
plant for over 300 days and 31 solution changes (Fig. 2). Despite
the regular changes in organic matter composition [10] and
repeated exposure to new microbial populations (Table S2), the
reported MFC system was able to continuously generate a current
Figure 4. Anode polarization curves in the primary clarifier effluent-fed MFC determined by linear sweep voltammetry. The anodepolarization curves during the enrichment process of electricity generating mixed community (A). The anode polarization curves during a singlebatch operation from day 139 to day 151, current generations are shown in the inset (B). Cathode polarization curve (black line) was determined onday 108.doi:10.1371/journal.pone.0030495.g004
Figure 5. Rarefaction curves for the different phylotypesobtained from 16 S rRNA gene clone libraries. The raw primaryclarifier effluent samples were collected at day 14 (PC1), day 152 (PC2),and day 304 (PC4). The anode biofilm samples were collected on day 44(W1), day 133 (W2), day 263 (W3), and day 294 (W4).doi:10.1371/journal.pone.0030495.g005
Functionally Stable Microbial Fuel Cell
PLoS ONE | www.plosone.org 6 February 2012 | Volume 7 | Issue 2 | e30495
of approximately 0.25 mA and degraded the chemical constituents
associated with primary clarifier effluents with reproducibility
(Fig. 2). These results suggest that the MFC can be a robust tool
for wastewater treatment and for selecting functionally stable
microbial communities from diverse and dynamic inoculum
sources. The anodic biocatalytic activity that is one of the most
important parameter for developing electrochemical fuel cells was
also reproducible after day 141, yielding a current density of
approximately 1,000 mA/m2 (Fig. 4A), which if modified may
lead to useful energy recovery at a treatment plant scale.
To consider the implementation of MFC technology in a
wastewater treatment facility, it is important to demonstrate that
removal rates and electricity generation are not affected by
seasonal changes in wastewater effluents or the variability of
chemical compounds and concentrations. This can only be proven
by long-term MFC evaluations of the microbial community
dynamics and resulting current production and COD removal
rates. Here we present a comprehensive data set that contributes
to a better understanding about how electrogenic microbes
respond to real wastewater conditions. Using this knowledge, we
can begin to make system design improvements to increase current
densities, bioaugment or pre-seed anode associated communities
for rapid MFC enrichment, and ultimately speed COD degrada-
tion rates. Although an 8–13 day treatment time is not acceptable
for practical application to wastewater treatment, we believe the
COD removal rates will significantly increase with design
Table 2. Diversity statistics and recovery of bacterial phyla from MFC anode biofilms and primary clarifier effluents.
Source Anode biofilm Primary clarifier effluent
Library ID W1 W2 W3 W4 PC1 PC2 PC4
Sampling day 44 133 263 295 14 152 304
Shannon’s Index 3.5 3.4 3.5 3.6 3.3 2.8 2.0
Simpson Diversity Index (1 - D) 0.96 0.94 0.96 0.97 0.94 0.80 0.66
Number of clones sequenced 88 84 77 73 72 146 91
Number of O.T.U. (99% cutoff) 47 43 41 46 40 54 27
Chao1 Richness 228665 203659 77615 119627 96622 180642 45610
Sørensen’s similarity coefficients
W1 0.18 0.11 0.11 0.09 0.06 0.11
W2 0.21 0.14 0.12 0.10 0.14
W3 0.32 0.03 0.00 0.00
W4 0.00 0.02 0.03
PC1 0.28 0.21
PC2 0.20
doi:10.1371/journal.pone.0030495.t002
Figure 6. Phylum level taxonomic distribution of 16 S rRNA community profile. The taxonomic profiles were analyzed for the originalprimary clarifier effluents (PC1, PC2, PC4) and the MFC anode biofilms (W1–W4). Phylum Proteobacteria and Firmicutes are divided into class leveltaxonomies.doi:10.1371/journal.pone.0030495.g006
Functionally Stable Microbial Fuel Cell
PLoS ONE | www.plosone.org 7 February 2012 | Volume 7 | Issue 2 | e30495
modifications to the system, such as lowering internal resistance
and improved cathode catalysts, and using our enriched
electricity-generating microbial communities as anode catalysts.
Several reports have recently appeared in the literature
exploring MFC performance during treatment of primary clarifier
effluents [13,14,15,16]. Di Lorenzo et al. described the phyloge-
netic composition of an electricity-generating microbial commu-
nity associated with a MFC anode by using denaturing gradient
gel electrophoresis (DGGE) based on 16 S rRNA gene fragments.
However, the microbial community was only analyzed as a
function of different anode surfaces within the system and not as a
function of time, wastewater inoculum sources, or MFC
performance [13]. Therefore, there is much to understand about
the microbial populations responsible for catalyzing rapid
degradation of organic compounds and electricity production,
and how microbial populations assemble and functionally
maintain in MFCs. Here, we conducted electrochemical analyses
and clone analyses based on 16 S rRNA gene sequences to achieve
a more detailed understanding about the composition of the
microbial population responsible for electricity production and the
degradation of organic compounds, and how the population is
correlated to biological and chemical heterogeneity of the influents
throughout long-term operation. In addition, we periodically
compared the anode biofilm to the introduced microbial
community from the primary clarifier effluents to discern how
the community diverged from the planktonic inoculum and
substrate sources.
Three distinct microbial communities existed in the MFC
system: anode biofilm (anaerobic metabolism), cathode biofilm
(aerobic/facultative metabolism), and suspended (planktonic) cells
(facultative metabolism) [17,18]. Each population may contribute
to overall system operation in terms of organic degradation rates
and electricity generation. During each batch cycle, the suspended
cell density decreased by one-sixth, suggesting that planktonic cells
were not significantly contributing to direct electron transfer or
COD/BOD removal. Further, our repeat-batch approach de-
creased the accumulation of mediators (electron shuttles) in the
anolyte so the presence of such compounds would need to be
within the biofilm matrix, or in very close proximity to the
electrode surface in order to contribute to the observed current
densities.
Although it is known that the air-cathode we used allows the
diffusion of oxygen into the MFC system [19,20], a robust biofilm
was found to thrive at this surface. It is likely that this biofilm was
responsible for capturing oxygen, which was important to
maintaining the anaerobic conditions required for efficient
electricity generation at the anode. The success of this process
can be noted through the presence of strict anaerobes that thrived
at the anode surface, but were not present in high abundance in
the primary clarifier effluents. Consequently, it can be inferred
that the anode biofilm was mainly responsible for electricity
production through direct extracellular electron transfer from
biofilm constituents to the anode surface (Fig. 1A).
In a previously reported study using a cellulose-fed MFC, the
diversity of the anode microbial community decreased with time
while system performance remained stable [21]. However, the
electricity-generating microbial community in the primary clarifier
effluent-fed MFC did not show a decrease in diversity even though
the system operation remained stable (Fig. 5 and Table 2). This
result indicates that a complex microbial community was
necessary to degrade diverse and variable organic substrates.
Interestingly, the introduction of new microbes with each repeat-
batch cycle did not appear to impact the electricity-generating
biofilm. Throughout MFC operation the anode-associated popu-
lation was found to change, but each generation was more closely
related to its surface-attached predecessors and was very different
from the microbial populations that were introduced with the new
primary clarifier effluents.
Although the anode-associated microbial community was still
diverse after the enrichment process, the taxonomic distribution of
the electricity-generating microbial community clearly reached a
stable population (Fig. 7). The early stage microbial community
was slightly affected by the introduction of primary clarifier
microbes including Acidovorax sp. and Arcobacter spp., which were
present in relatively high abundance in the primary clarifier
effluent (Table S1). Over time, the community shifted to a more
‘‘conventional’’ anode-respiring population (Table 3) including
Geobacter and Desulfuromonas spp., indicating that a longer-term
enrichment process facilitated the adaptation to the electrode-
reducing conditions while oxidizing complex heterogeneous
substrates in the primary clarifier effluent.
The enriched electricity-generating anode microbial community
was mostly comprised of the class Deltaproteobacteria and the phylum
Bacteroidetes (Fig. 6), which have been frequently observed as
dominant taxa in both sediment MFCs [22,23] and in MFC
reactors fed with industrial wastewaters [24], artificial wastewater
[17], or with defined chemicals such as acetate and glucose
[9,18,25]. The class Deltaproteobacteria includes various dissimilatory
solid metal reducing bacteria [26], some of which are also reported
as electricity generators in MFC systems [27,28,29].
The Geobacter spp. are well-known electricity generating bacteria
[27,28], indicating that the phylotypes observed within the anode-
associated community are likely playing an important role in
electricity production. Recently, many Geobacter strains have been
observed as part of electricity-generating microbial communities,
especially in acetate-fed MFC anodes [18,25,30], suggesting that
the Geobacter strains are oxidizing acetate during anode respiration.
Various Geobacter strains including Geobacter metallireducens can also
utilize a wide variety of electron donors including toluene and
benzoate [31], suggesting that the abundant Geobacter strains in the
described system may also be playing a role in the oxidation of
more complex primary effluent substrates.
Figure 7. Multidimensional scale plot comparing bacterialcommunities based on genus level taxonomy. Open square, thebacterial communities of original primary clarifier effluents (PC1, PC2,PC4); Filled circle, the bacterial communities of anode biofilm enrichedin the primary clarifier effluent-fed MFC (W1–W4).doi:10.1371/journal.pone.0030495.g007
Functionally Stable Microbial Fuel Cell
PLoS ONE | www.plosone.org 8 February 2012 | Volume 7 | Issue 2 | e30495

In the highly enriched electricity-generating anode microbial
communities (W3 and W4), four other Deltaproteobacteria phylotypes
closely related to genera Desulfuromonas, Desulfobacter, Desulfocapsa,
and Desulfobulbus were also observed (Table 3). The most abundant
phylotype W2_A03 in the mature biofilm was found to be closely
related with Desulfuromonas acetexigens, which has been reported as a
solid iron/electrode reducer [32]. The strain has also been
observed in electrically active anode biofilms in sediment MFCs
[22,23], and may therefore be contributing to electricity
generation in our system. Other prevalent phylotypes were closely
associated to Desulfocapsa and Desulfobulbus, which have both been
previously reported as potential electrode reducers [22,29,33].
The prevalence of different electricity generating phylotypes in
our primary clarifier MFC implies that several species within the
Deltaproteobacteria class were syntrophically cooperating to produce
electricity from the wide varieties of chemical compounds in the
primary clarifier effluents. Interestingly, the dominant Deltaproteo-
bacteria species changed with time, but the electricity generating
performance and chemical oxidation rates remained stable. This
phenomenon clearly suggests that the anode-associated microbial
population can be functionally maintained for the treatment of
primary clarifier effluents and sustain energy recovery in the
process.
We hypothesize that the phylotypes associated with Deltaproteo-
bacteria species were primarily responsible for direct electricity
production; however the other highly abundant anode-associated
phylotypes were closely related to the phylum Bacteroidetes and
observed in all stages of anode biofilm enrichment. While the
phylum Bacteroidetes has mainly been described as a fermentor in
the human gut [34], Shimoyama et al. recently demonstrated that
Bacteroidetes was an abundant phylum correlated with electricity
generation from artificial wastewater treatment in a continuous-
flow cassette-electrode MFC [17]. However, our phylotypes were
not closely related to the other previously reported Bacteroidetes
strains including the clone CE38 abundantly observed in the
cassette-electrode MFC. These results suggest that MFC enriched
Bacteroidetes species may possess diverse functional traits and may
thus represent an interesting phylum worthy of further study. To
address the potential roles of these dominant phylotypes classified
to Bacteroidetes within our MFC system, we will attempt to isolate
these strains and analyze their genomic and functional character-
istics in future work.
Table 3. Abundant phylotypes obtained from the enriched electricity-generating consortiaa.
Phylum-Class Phylotype No. of clone in the library % Database match (Accession No.)
W1 W2 W3 W4
Proteobacteria - Deltaproteobacteria
W1_B02 11 - - - 98% Geobacter sp. Ply1 (EF527233)
W2_M05 - 13 - - 99% Geobacter lovleyi SZ (CP001089)
W3_M01 - 1 6 3 96% Geobacter lovleyi SZ (CP001089)
W2_A03 - 1 7 8 99% Desulfuromonas acetexigens (U23140)
W3_A19 - - 4 2 99% Desulfobacter postgatei DSM 2034 (AF418180)
W3_O19 - - 3 3 99% Desulfocapsa thiozymogenes (X95181)
W3_O03 - - 2 3 91% Desulfobulbus rhabdoformis Mic5c02 (AB546248)
Proteobacteria - Betaproteobacteria
W1_F12 3 2 - - 100% Acidovorax sp. PPs-5 (FJ605421)
Proteobacteria - Gammaproteobacteria
W2_C01 - 5 1 - 100% Pseudomonas sp. SMT-9 partial (AM689953)
Proteobacteria - Epsilonproteobacteria
W1_J08 9 10 - - 100% Arcobacter cryaerophilus (U34387)
Bacteroidetes
W2_I23 2 1 3 3 88% Ruminofilibacter xylanolyticum S1 (DQ141183)
W1_B10 4 3 1 1 87% Cellulophaga tyrosinoxydans EM41 (EU443205)
W1_J04 4 - 1 - 93% Parabacteroides goldsteinii JCM13446 (EU136697)
W2_C17 - 3 2 - 90% Prolixibacter bellariivorans F2 (AY918928)
W4_O10 - - 4 3 90% Cytophaga fermentans (M58766)
W3_A07 - - 4 2 88% Cytophaga fermentans (M58766)
Firmicutes - Clostridia
W1_H18 3 3 1 - 97% Fusibacter sp. SA1 (AF491333)
Synergistetes
W3_A23 - - 3 4 90% Aminomonas paucivorans (AF072581)
Othersb 52 42 35 41
Total clone 88 84 77 73
aAbundant phylotype was defined as a phylotype containing more than 5 clones within four clone libraries.bFor a list of other phylotypes (minor phylotypes), refer to the supplementary materials (Table S1).doi:10.1371/journal.pone.0030495.t003
Functionally Stable Microbial Fuel Cell
PLoS ONE | www.plosone.org 9 February 2012 | Volume 7 | Issue 2 | e30495

Other less dominant phylotypes observed in the anode-
associated biofilm were very diverse and functionally unknown
(Table S1). Some phylotypes could be contaminants from the
primary clarifier effluent (Table S2), while others could be
contributing to the degradation of various types of organic
chemicals. The long-term survival of these less abundant
phylotypes suggest that they have a functional role in organic
compound degradation and perhaps even within extracellular
electron transfer.
In summary, while MFC performance was very reproducible,
the phylogenetic analyses of anode-associated electricity-generat-
ing biofilms demonstrated that the microbial populations fluctu-
ated temporally while maintaining high biodiversity throughout
the year-long experiment. These results suggest that MFC
operation induces a self-optimizing process toward functional
performance from diverse, heterogeneous microbial communities,
and therefore can be used to reproducibly select for functional
microbial communities regardless of carbon source. These results
contribute significant knowledge toward the practical application
of MFC systems for long-term wastewater treatment, while
demonstrating the utility of MFCs for enrichment of functionally
stable microbial populations capable of organic compound
degradation and extracellular electron transfer.
Additional impact of the reported results is provided by the
ability to observe the metabolic activities and energy transduction
within a complex consortium. This has significant benefits to the
field of microbial ecology and may yield insight into numerous
geochemical cycles that involve biological transformations of
extracellular material, such as iron and manganese oxides. Future
studies will apply metagenomics and metatranscriptomics to the
anode biofilm to describe gene expression profiles associated with
carbon metabolism and extracellular electron transfer during the
degradation of complex organic substrates. Gene expression data
will further elucidate metabolic networks and energy transduction
in complex consortia.
Materials and Methods
MFC configuration and operationA single-chamber, air-cathode MFC was used for municipal
sewage wastewater treatment with power generation. The MFC
was a bottle-type reactor (350 ml in capacity), with two joined
anode electrodes made of carbon cloth (7 cm63 cm, or 84 cm2
total projected surface area per reactor; TMIL, Japan) [9]. The
air-cathode was made with a 30 wt% wet-proofed carbon cloth
(type B-1B, E-TEK) coated with platinum (0.5 mg/cm2), Nafion,
and PTFE as described elsewhere [20]. The air-cathode was
placed at the side port, providing a total projected cathode surface
area (one side) of 4.9 cm2.
After sterilization of the fully assembled MFC, the chamber was
filled with municipal wastewater collected from the primary
clarifier at the North City Water Reclamation Plant (San Diego,
USA) without any pretreatment except the mechanical removal of
grit, rags and scum. The sole inoculum source consisted of those
microorganisms present in the primary clarifier effluents. The
MFC was gently mixed with a magnetic stirrer, and incubated at
room temperature (22uC63uC) throughout the duration of testing.
The anode and cathode electrodes were connected with an
external resistor of 750 V. Cell voltages across the resistor were
recorded every 30 min using a voltage recorder (GL200A,
Graphtec) and the corresponding electric current was calculated
using Ohm’s law (V = IR). When the electric current decreased
due to depletion of the organic matter in the wastewater, the
anode solution was fully discarded and the reactor was refilled with
either the fresh wastewater collected that day or with aged
wastewater stored at 4uC. This repeat-batch process occurred
twice monthly with fresh wastewater, and weekly with aged
wastewater, for 300 days. Each wastewater sample introduced to
the reactor included the naturally occurring microorganisms and
various chemical compounds, no filtration or additional pretreat-
ment was conducted. On days 88 and 195, the biofilm formed on
the cathode surface was mechanically removed to recover the
cathode performance.
Polarization analysesTo obtain polarization and power density curves, an Ag/AgCl
reference electrode (+200 mV vs SHE, RE-5B, BASi) was placed
in the side port of the MFC. The external resistance across the
circuit was then changed stepwise from 3.3 kV to 10 V and the
cell voltage, the anode potential, and the cathode potential were
recorded after they had stabilized over a period of at least 7 min
[9]. Current density per projected anode surface area was
calculated from the voltage measured across the known resistor.
Power density was calculated as the product of current density and
the cell voltage.
In order to obtain anode polarization curves without cathodic
reaction limitation, linear sweep voltammetry analyses were
conducted using a potentiostat (Reference 600TM, Gamry) [12].
The anode potential was swept from open circuit anode potential
to +300 mV vs SHE at a scan rate of 0.5 mV/sec and the
corresponding anodic current, resulting from the active biofilm,
was recorded.
Chemical analysesChemical oxygen demand (COD) was determined using a
potassium chromide assay according to the manufacturer’s
instructions (Orion CODHP0, Thermo Scientific). Coulombic
efficiency, CE (%), was calculated as CE = Cp/Cth6100, where Cp
(C) is the total charge passed during a single batch, and Cth (C) is
the theoretical amount of charge allowable from a complete COD
decrease (assuming that reducing one mole of oxygen requires the
transfer of four electrons). Biological oxygen demand (BOD), total
suspended solid (TSS), turbidity, nitrate-N, nitrite-N, ammonium-
N, sulfate, and heavy metal concentrations were determined in
accordance with US EPA and state of California requirements by
CRG Marine Laboratories, Inc (Torrance CA, USA). Conduc-
tivity of the solution was determined by portable pH/ORP/DO/
ionic meter (Orion 1215000, Thermo Scientific). Acetate and
other volatile fatty acids were determined using a high-pressure
liquid chromatography (HPLC) machine equipped with DI
detector (Agilent 1200 series) and a packed C18 column (Epic
Polar, ES Industries). The eluant was 50 mM phosphoric acid
(pH 1.87) at a flow rate of 1.0 ml/min.
In order to determine the total bacterial cell density on the
anode surface, part of the anode (7 mm67 mm) containing cells
was removed from the MFC (n = 3). Total protein was extracted
from the electrodes as described elsewhere [9,28]. Bacterial cell
concentrations in the solution were also determined by direct cell
counts. Cells were stained with 2 mg/L of 4,6-diamidino-2-
phenylindole (DAPI) for 5 min then observed using an AX10
fluorescence microscope (Carl Zeiss).
Scanning electron microscopy (SEM)A small portion of carbon cloth was collected from the anode,
fixed with 1.25% gultaraldehyde, dehydrated using a graded series
of ethanol solutions, and dried using a critical point drier
(Autosamdri 815, Tousimis) [35]. The specimen was coated with
Pt/Pd and imaged at 2 kV on a LEO 1540XB Field Emission
Functionally Stable Microbial Fuel Cell
PLoS ONE | www.plosone.org 10 February 2012 | Volume 7 | Issue 2 | e30495

SEM (Carl Zeiss SMT AG). The imaging was conducted at the
Western Nanofabrication Facility, University of Western Ontario
(Canada).
PCR amplification, cloning and sequencing of 16 S rRNAgene fragments
Total DNA was extracted from the biofilm associated with the
carbon cloth anode or from the suspended cells in the primary
clarifier effluent. All DNA extractions were performed using the
UltraCleanH Soil DNA Isolation Kit (MO bio) according to
manufacturer instructions, which employed physical cell disrup-
tion. PCR amplification of 16 S rRNA gene fragments was
performed using Taq DNA polymerase (ExTaq, Takara) with
universal primers U27f (59-AGAGTTTGATCCTGGCTCAG-39)
and U1492r (59-GGTTACCTTGTTACGACTT-39) [36]. The
amplification conditions were as follows: an initial step of 94uC for
3 min, 25 cycles consisting of 94uC for 30 sec, 55uC for 30 sec and
72uC for 90 sec, and a final elongation step at 72uC for 10 min.
Amplified fragments were ligated into a pGEM-T vector
(Promega) and cloned into Escherichia coli JM109 competent cells.
PCR-amplified 16 S rRNA gene fragments were recovered by
PCR using primers M13f and M13r (the primers targeted the
pGEM-T vector sequences flanking the insertion), then sequenced
by ABI 3730xl sequencers using primer U907r (59-CCGY-
CAATTCMTTTRAGTTT-39) [37]. The nucleotide sequences
reported in this paper have been deposited in the GSDB, DDBJ,
EMBL and NCBI nucleotide sequence databases under accession
numbers HQ688300 to HQ688420 for the primary clarifier
effluents, and HQ688421 to HQ688596 for the anode biofilm.
Phylogenetic analysesSequences of partial 16 S rRNA genes determined in this study
were aligned to each other using CLC genomics work bench
version 3.6.5 (CLC bio), and assigned to phylotypes (classified as
an operational taxonomic unit, .99% cut-off). Database searches
for related 16 S rRNA gene sequences were conducted using the
BLAST program [38]. Checks for chimeric sequences and a
multidimensional scale (MDS) plot were conducted using JCVI
16 S/18 S small sub-unit analysis pipeline. A rarefaction analysis
was conducted using the Analytic Rarefaction program [21].
Chao1 richness was calculated using web-based software (http://
www2.biology.ualberta.ca./jbrzusto/rarefact.php). A Shannon’s
index, Simpson diversity index, and Sorensen similarities among
the bacterial communities were calculated using Estimate S [39].
Supporting Information
Figure S1 Typical batch cycle of current generation andCOD concentrations in the primary clarifier effluent-fedMFC. Thin black line, electric current (mA); Thick red line,
accumulated electron production expressed as ‘mM equivalent
(eq.)’ calculated as the number of total electrons passing across the
circuit from the available COD in solution; solid square blue line,
total COD (mg/L) in solution.
(EPS)
Figure S2 HPLC chromatographs of wastewater sam-ples before and after MFC treatment. Organic compounds
were detected at wavelengths of 210 nm (A, B) or 254 nm (C, D).
The untreated primary clarifier effluent chromatographs indicate
the presence of several different compounds (A, C), most of which
were no longer present in the MFC treated samples (B, D).
(EPS)
Figure S3 FE-SEM images for anode biofilms adheringonto carbon cloth anodes (day 152). Bar in panel A is
100 mm, bar in panel B is 10 mm, and bars in panel C and D are
2 mm.
(EPS)
Table S1 All phylotypes obtained from the enrichedelectricity-generating consortia.
(XLS)
Table S2 All phylotypes obtained from the primaryclarifier effluents.
(XLS)
Acknowledgments
We thank Nancy Coglan (North City Water Reclamation Plant) and her
laboratory members for providing samples of the primary clarifier effluent.
We thank Greg Wanger for observing the biofilm by FE-SEM. We also
thank Kelvin Li for technical assistance with executing the JCVI 16 S/18 S
rRNA Pipeline, Jeff McQuaid for experimental setup, Angela Wu and Eric
Son for technical assistance of clone library analysis.
Author Contributions
Conceived and designed the experiments: SI SS YAG OB. Performed the
experiments: SI SS. Analyzed the data: SI SS TMN-K. Contributed
reagents/materials/analysis tools: SI SS TMN-K YS. Wrote the paper: SI
SS KHN OB.
References
1. WIN (2000) Clean Safe Water for the 21st Century: Water Infrastructure
Network.
2. Pant D, Van Bogaert G, Diels L, Vanbroekhoven K (2010) A review of the
substrates used in microbial fuel cells (MFCs) for sustainable energy production.
Biores Technol 101: 1533–1543.
3. Rulkens W (2008) Sewage sludge as a biomass resource for the production of
energy: Overview and assessment of the various options. Energy Fuels 22: 9–15.
4. Huang LP, Logan BE (2008) Electricity generation and treatment of paper recycling
wastewater using a microbial fuel cell. Appl Microbiol Biotech 80: 349–355.
5. Rozendal RA, Hamelers HV, Rabaey K, Keller J, Buisman CJ (2008) Towards
practical implementation of bioelectrochemical wastewater treatment. Trends
Biotechnol 26: 450–459.
6. Logan BE, Hamelers B, Rozendal R, Schroder U, Keller J, et al. (2006)
Microbial fuel cells: methodology and technology. Environ Sci Technol 40:
5181–5192.
7. Rabaey K, Verstraete W (2005) Microbial fuel cells: novel biotechnology for
energy generation. Trends Biotechnol 23: 291–298.
8. Rismani-Yazdi H, Carver SM, Christy AD, Tuovinen IH (2008) Cathodic
limitations in microbial fuel cells: An overview. J Power Sources 180: 683–694.
9. Ishii S, Watanabe K, Yabuki S, Logan BE, Sekiguchi Y (2008) Comparison of
electrode reduction activities of Geobacter sulfurreducens and an enriched
consortium in an air-cathode microbial fuel cell. Appl Environ Microbiol 74:
7348–7355.
10. Meyer S (2009) North City Water Reclamation Plant Annual Monitoring
Report 2009. SDRWQCB Order No 97-03: 30.
11. Logan BE (2008) Chapter 4 Power generation. Microbial Fuel Cells. Hoboken,
New Jersey, USA: John Wiley & Sons. pp 44–60.
12. Tsujimura S, Fujita M, Tatsumi H, Kano K, Ikeda T (2001) Bioelectrocatalysis-
based dihydrogen/dioxygen fuel cell operating at physiological pH. Phys Chem
Chem Phys 3: 1331–1335.
13. Di Lorenzo M, Scott K, Curtis TP, Katuri KP, Head IM (2009) Continuous
feed microbial fuel cell using an air cathode and a disc anode stack for
wastewater treatment. Energy Fuels 23: 5707–5716.
14. Liu H, Ramnarayanan R, Logan BE (2004) Production of electricity during
wastewater treatment using a single chamber microbial fuel cell. Environl Sci
Technol 38: 2281–2285.
15. Cheng S, Liu H, Logan BE (2006) Increased power generation in a continuous
flow MFC with advective flow through the porous anode and reduced electrode
spacing. Environ Sci Technol 40: 2426–2432.
16. Ahn Y, Logan BE (2010) Effectiveness of domestic wastewater treatment using
microbial fuel cells at ambient and mesophilic temperatures. Biores Technol
101: 469–475.
Functionally Stable Microbial Fuel Cell
PLoS ONE | www.plosone.org 11 February 2012 | Volume 7 | Issue 2 | e30495

17. Shimoyama T, Yamazawa A, Ueno Y, Watanabe K (2009) Phylogenetic
analyses of bacterial communities developed in a cassette-electrode microbialfuel cell. Microb Environ 24: 188–192.
18. Xing D, Cheng S, Regan JM, Logan BE (2009) Change in microbial
communities in acetate- and glucose-fed microbial fuel cells in the presence oflight. Biosens Bioelectron 25: 105–111.
19. Liu H, Logan BE (2004) Electricity generation using an air-cathode singlechamber microbial fuel cell in the presence and absence of a proton exchange
membrane. Environ Sci Technol 38: 4040–4046.
20. Cheng S, Liu H, Logan BE (2006) Increased performance of single-chambermicrobial fuel cells using an improved cathode structure. Electrochem Commun
8: 489–494.21. Ishii S, Shimoyama T, Hotta Y, Watanabe K (2008) Characterization of a
filamentous biofilm community established in a cellulose-fed microbial fuel cell.BMC Microbiol 8: 6.
22. Tender LM, Reimers CE, Stecher HA, 3rd, Holmes DE, Bond DR, et al. (2002)
Harnessing microbially generated power on the seafloor. Nat Biotechnol 20:821–825.
23. Holmes DE, Bond DR, O’Neil RA, Reimers CE, Tender LR, et al. (2004)Microbial communities associated with electrodes harvesting electricity from a
variety of aquatic sediments. Microb Ecol 48: 178–190.
24. Kiely PD, Cusick R, Call DF, Selembo PA, Regan JM, et al. (2011) Anodemicrobial communities produced by changing from microbial fuel cell to
microbial electrolysis cell operation using two different wastewaters. BioresTechnol 102: 388–394.
25. Chae KJ, Choi MJ, Lee JW, Kim KY, Kim IS (2009) Effect of differentsubstrates on the performance, bacterial diversity, and bacterial viability in
microbial fuel cells. Biores Technol 100: 3518–3525.
26. Lovley DR, Holmes DE, Nevin KP (2004) Dissimilatory Fe(III) and Mn(IV)reduction. Adv Microb Physiol 49: 219–286.
27. Bond DR, Holmes DE, Tender LM, Lovley DR (2002) Electrode-reducingmicroorganisms that harvest energy from marine sediments. Science 295:
483–485.
28. Bond DR, Lovley DR (2003) Electricity production by Geobacter sulfurreducens
attached to electrodes. Appl Environ Microbiol 69: 1548–1555.29. Holmes DE, Bond DR, Lovley DR (2004) Electron transfer by Desulfobulbus
propionicus to Fe(III) and graphite electrodes. Appl Environ Microbiol 70:
1234–1237.30. Jung S, Regan JM (2007) Comparison of anode bacterial communities and
performance in microbial fuel cells with different electron donors. ApplMicrobiol Biotechnol 77: 393–402.
31. Lovley DR, Giovannoni SJ, White DC, Champine JE, Phillips EJ, et al. (1993)
Geobacter metallireducens gen. nov. sp. nov., a microorganism capable of couplingthe complete oxidation of organic compounds to the reduction of iron and other
metals. Arch Microbiol 159: 336–344.32. Roden EE, Lovley DR (1993) Dissimilatory Fe(III) Reduction by the marine
microorganism Desulfuromonas acetoxidans. Appl Environ Microbiol 59: 734–742.33. Reimers CE, Girguis P, Stecher HA, Tender LM, Ryckelynck N, et al. (2006)
Microbial fuel cell energy from an ocean cold seep. Geobiology 4: 123–136.
34. Karlsson FH, Ussery DW, Nielsen J, Nookaew I (2011) A closer look atBacteroides: phylogenetic relationship and genomic implications of a life in the
human gut. Microb Ecol 61: 473–485.35. Gorby YA, Yanina S, McLean JS, Rosso KM, Moyles D, et al. (2006)
Electrically conductive bacterial nanowires produced by Shewanella oneidensis
strain MR-1 and other microorganisms. PNAS 103: 11358–11363.36. DeLong EF (1992) Archaea in coastal marine environments. PNAS 89:
5685–5689.37. Watanabe K, Kodama Y, Harayama S (2001) Design and evaluation of PCR
primers to amplify bacterial 16 S ribosomal DNA fragments used for communityfingerprinting. J Microbiol Methods 44: 253–262.
38. Karlin S, Altschul SF (1990) Methods for assessing the statistical significance of
molecular sequence features by using general scoring schemes. PNAS 87:2264–2268.
39. Colwell RK (2009) EstimateS: Statistical estimation of species richness andshared species from samples. Version 8.2. User’s Guide and application.
Available: http://purl.oclc.org/estimates. Accessed 2011 Dec 23.
Functionally Stable Microbial Fuel Cell
PLoS ONE | www.plosone.org 12 February 2012 | Volume 7 | Issue 2 | e30495