Nonlinear free vibration of size-dependent functionally graded microbeams
Upload
independentCategory
view
0download
0
Functionally Enigmatic Genes: A Case Study of the BrainIgnoromeAshutosh K. Pandey1*, Lu Lu1, Xusheng Wang1,2, Ramin Homayouni3, Robert W. Williams1
1 UT Center for Integrative and Translational Genomics and Department of Anatomy and Neurobiology, University of Tennessee Health Science Center, Memphis,
Tennessee, United States of America, 2 St. Jude Children’s Research Hospital, Memphis, Tennessee, United States of America, 3 Department of Biological Sciences,
Bioinformatics Program, University of Memphis, Memphis, Tennessee, United States of America
Abstract
What proportion of genes with intense and selective expression in specific tissues, cells, or systems are still almostcompletely uncharacterized with respect to biological function? In what ways do these functionally enigmatic genes differfrom well-studied genes? To address these two questions, we devised a computational approach that defines so-calledignoromes. As proof of principle, we extracted and analyzed a large subset of genes with intense and selective expression inbrain. We find that publications associated with this set are highly skewed—the top 5% of genes absorb 70% of the relevantliterature. In contrast, approximately 20% of genes have essentially no neuroscience literature. Analysis of the ignoromeover the past decade demonstrates that it is stubbornly persistent, and the rapid expansion of the neuroscience literaturehas not had the expected effect on numbers of these genes. Surprisingly, ignorome genes do not differ from well-studiedgenes in terms of connectivity in coexpression networks. Nor do they differ with respect to numbers of orthologs, paralogs,or protein domains. The major distinguishing characteristic between these sets of genes is date of discovery, early discoverybeing associated with greater research momentum—a genomic bandwagon effect. Finally we ask to what extent massivegenomic, imaging, and phenotype data sets can be used to provide high-throughput functional annotation for an entireignorome. In a majority of cases we have been able to extract and add significant information for these neglected genes. Inseveral cases—ELMOD1, TMEM88B, and DZANK1—we have exploited sequence polymorphisms, large phenome data sets,and reverse genetic methods to evaluate the function of ignorome genes.
Citation: Pandey AK, Lu L, Wang X, Homayouni R, Williams RW (2014) Functionally Enigmatic Genes: A Case Study of the Brain Ignorome. PLoS ONE 9(2): e88889.doi:10.1371/journal.pone.0088889
Editor: Christos A. Ouzounis, The Centre for Research and Technology, Hellas, Greece
Received November 10, 2013; Accepted January 14, 2014; Published February 11, 2014
Copyright: � 2014 Pandey et al. This is an open-access article distributed under the terms of the Creative Commons Attribution License, which permitsunrestricted use, distribution, and reproduction in any medium, provided the original author and source are credited.
Funding: This work was supported by Integrative Neuroscience Initiative on Alcoholism grants U01AA016662, U01AA13499, U24AA13513, U01AA014425 (RWW),University of Memphis Bioinformatics Program and the Assisi Foundation of Memphis (RH). The funders had no role in study design, data collection and analysis,decision to publish, or preparation of the manuscript.
Competing Interests: Co-author Dr. Ramin Homayouni is a PLOS ONE Editorial Board member. The authors confirm that this does not alter their adherence toall the PLOS ONE policies on sharing data and materials.
* E-mail: [email protected]
Introduction
The distribution of research on genes is highly skewed and is
made up of a small set with dense literature coverage and a larger
set with minimal coverage [1]. The distribution follows a power
law [2], probably because researchers tend to work collaboratively
and collectively on genes they perceive to be important [3]. Pfeiffer
and Hoffmann highlight the social bias that can produce this type
of bandwagon effect, but they also point to the opposite tendency
to explore the unknown. The disappointing fact is that after two
decades of intense and sophisticated molecular and genetic
analyses, more than a third of all protein-coding genes have
almost no literature or known function. We refer to this subset of
the genome as an ignorome. If ‘‘real knowledge is to know the
extent of one’s ignorance’’ (paraphrasing Confucius, analects
2:17), then we currently need to determine the extent of the
ignorome and whether it arises from social patterns of research or
unusual biological properties.
An ignorome can be computed at the level of an entire genome,
but as we show here, an ignorome can also be computed at the
level of a single organ, tissue, or cell type using patterns and levels
of expression as a metric of functional importance. These more
refined ignoromes are particularly useful when the goal is to define
gene or protein function. In the present study we focus on the
mammalian CNS—mainly of mouse and human. We have
computed ignorome scores that are a function of (1) gene
expression in the brain, (2) selectivity of expression in brain versus
other organs, and (3) the size of the neuroscience literature. Two
steps are essential to define an ignorome using this quantitative
approach: accurate assignment of expression data to the correct
gene, and precise estimation of the neuroscience literature
coverage for each gene. For the first step we used deep RNA-
seq data that we recently generated for whole brain [4–6] to
correctly assign genes in large expression data sets. For the second
step, we used a generalizable data mining approach that
minimizes irrelevant and false literature linkages created by
ambiguous gene names. Using these methods we have been able
to extract the most interesting fraction of the ignorome that has
both intense and highly selective expression (ISE) in the brain.
These genes are likely to have greater impact on brain function
and behavior, and can be more readily evaluated using genetic,
genomic, and phenotypic resources.
Remarkably, we find that the ignorome does not differ from
well-studied genes in terms of connectivity in coexpression
PLOS ONE | www.plosone.org 1 February 2014 | Volume 9 | Issue 2 | e88889

networks. Numbers of orthologs, paralogs, or protein domains do
not differ greatly between the two types of genes. This strongly
supports the idea that the neglected subset of the genome is more
of a matter of the sociology of science that of inherent differences
in biology. Supporting this hypothesis we find that well-studied
genes have much earlier discovery dates by an average of 10 years.
We used multiple genomic resources and a variety of
approaches to provide a useful functional context for a significant
majority of brain ignorome genes including: gene coexpression
analysis, protein domain comparison, analysis of in situ expression
in many CNS cell types, and a novel genetic method referred to as
reverse complex trait analysis [6,7]. We close by giving several
specific and intriguing examples of ignorome genes likely to be of
importance in CNS function. The methods we have developed
here can be applied widely to prioritize genes for detailed
functional analysis in many different tissues, cells, and systems.
Results
Genes with intense and selective expression in the brainTo extract the list of genes with intense and selective expression
we compared patterns of gene expression in the brain with those in
more than 20 other organs and tissue types using both Illumina
MouseWG-6 v2 and Affymetrix M430 2.0 arrays. We selected all
assays of mRNA expression—probes and probe sets—that had at
least eight-fold higher expression in brain compared to other
tissues (Methods). We identified 493 and 615 probes and probe
sets with intense and selective expression (ISE) in brain,
respectively. While we have mostly exploited murine data sets,
in the text below, we have used human gene symbols whenever
possible.
Annotation of intense and selectively expressed genes. Many
probes that target specific transcripts in the brain are still poorly
annotated, and as a result probes that actually target well-studied
genes can be incorrectly nominated as part of an ignorome. We used
deep RNA sequencing (RNA-seq) for whole brain (,1 billion
strand-specific tags from 34 strains of mice, see Methods) to
reevaluate the annotation for a small subset of ambiguous probes
and their associated transcripts (n = 28, Table S1). For example,
Affymetrix probe set 1457743_at was not assigned to any gene in the
original annotation file, but actually maps to the distal 39 UTR of
RGS7BP. Similarly, probe set 1443205_at was initially assigned to
the ignorome gene D5Buc30e, but correctly maps to the distal 39
UTR of GABRB1 (Figure S1).
We removed redundant probes and retained 406 and 478 ISE
genes in the two data sets (Table S2 and S3), and a union of ,650
genes. Not surprisingly, this set of 650 genes contains intensively
studied genes known to be involved in brain function and
development. With the exception of Zfp941, all 650 have
unequivocal human orthologs and also have supporting identifiers
in different databases including Refseq, MGI, and Ensemble.
More than 98% are conserved across five or more species. A few
genes, such as CMTM5 and PRR18, appear to be restricted to
mammals. Many others, such as SGTB and RNFT2, are conserved
in more than 10 species (n = 170 genes). We have used the union of
the two ISE sets as starting material to define a brain ignorome.
Neuroscience-specific literature coverageThe number of publications for these 650 ISE genes is highly
skewed (Figure 1). The top 5% account for ,68% of the relevant
literature whereas the bottom 50% of genes account for only 1%
of the literature. Forty-six genes including GFAP, MBP, VIP,
GRIA1, and GRIA2 are associated with over 1000 PubMed
citations each. In contrast, approximately one-sixth of these genes
comprise the core brain ignorome, and are associated with fewer
than one paper each (38 papers total). One-tenth of these ISE
genes are not associated with any citations and are part of an
absolute ignorome. A sample of genes that have no neuroscience
publications as of February 2013 include FAM155A, C16orf45,
C8orf46, VSTM2A, PNMAL1, LONRF2, PGBD5, and MAP7D2.
Their high brain expression selectivity (Figure 2) was confirmed
independently using multiple sources (Methods), with the expected
exception that several have high expression in pituitary, retina,
and more rarely, testis.
There are a number of technical issues associated with precisely
determining the neuroscience literature coverage of ISE genes. We
briefly discuss some steps used to minimize the retrieval of
irrelevant literature.
1. Ambiguity associated with gene names: Ambiguity of gene names—
symbols, aliases and other designations—adds significant error
to estimates of literature coverage derived from PubMed [8].
We used a simple disambiguation approach that combines
ambiguous gene names with informative and gene-specific key
words (Methods). For example, NSE is an alias for ENO2, a
neuronal enolase. However, NSE also stands for ‘‘normal
squamous epithelia’’ and ‘‘neutron spin-echo’’. By combining
‘‘NSE’’ with ‘‘enolase’’ to produce a joint search, we were able
to disambiguate PubMed analysis for this gene.
2. Neuroscience-restricted search: The literature for many ISE genes is
not restricted to neuroscience. For example, pleiotrophin
(PTN), a neurotrophic factor for spinal motor neurons, has
been studied primarily in the context of bone morphogenesis
[9,10]. As described in Methods, we developed a simple
algorithm that enables us to restrict PubMed searches to a
specific literature subset—in this case a neuroscience-specific
subset.
3. Inflation due to a noisy or uninformative literature: Large-scale
genomic studies often list hundreds of genes but provide only
generic and cursory annotations. Notable examples include
studies representing genome-wide surveys such as ‘‘The
transcriptional landscape of the mammalian genome’’ [11].
We generated a list of approximately 850 of these articles
(Methods) and excluded them from downstream analysis.
Functional characterization of the ignoromeThe ignorome score is a function of both literature coverage
information and expression selectivity and ranges from 0 (relatively
well known) to 1 (relatively unknown, Table S4).We have defined
the core brain ignorome as those genes that have no more than a
single neuroscience article in PubMed (Table S4). One-hundred
and six out of 650 ISE genes belong to this core ignorome. One-
tenth still retain their original names given by the RIKEN Mouse
Gene Encyclopedia project [12]. Other subsets belong to the
solute carrier family (SLC39A12, SLC35F3, SLC35F1), the TAFA
family [13] (FAM123C, FAM131B, FAM155A, FAM171B,
FAM189A1, FAM19A1, FAM19A2, and FAM81A), and the family
of transmembrane proteins (TMEM130, TMEM145, TMEM178A,
TMEM179, TMEM59L, TMEM88B, TMEM91).
Calculation of the ignorome score relied on whole brain gene
expression, and as expected 95% of the core has both intense and
relatively uniform expression across many brain regions. However,
there are interesting exceptions (Figure 3): (1) KIAA1239 has
extraordinarily high and selective expression in Purkinje cells,
habenula, pyriform cortex, superficial layer 2 of neocortex, and
CA3 of hippocampus; (2) C8orf46 has extremely high expression
only in cortex (archi-, paleo- and neocortex) but low expression in
Analysis of an Ignorome
PLOS ONE | www.plosone.org 2 February 2014 | Volume 9 | Issue 2 | e88889

layer 4 of neocortex and part of CA3; (3) FAM123C has highest
expression in granule cells of cerebellum, dentate gyrus, and
olfactory bulbs, and finally, (4) FRRS1L has highest expression in
Purkinje cells, neocortex, and CA1–3. We also used in situ
hybridization images downloaded from the Allen Brain Atlas [14]
to evaluate patterns of expression in subsets of easily resolvable cell
types (e.g., Purkinje cells, Bergmann glia, astrocytes, dentate gyrus
granule cells, pyramidal neurons, and white matter oligodendro-
cytes). Again, more than 95% of ignorome genes have high
expression in neurons (e.g., ZCCHC18 has pan-neuronal expres-
sion in Figure 3) and comparatively modest, if any, expression in
oligodendrocyte or astrocyte. Only two ignorome genes
(SLC39A12, CMTM5) are expressed preferentially in astrocytes,
Bergmann glia, and oligodendrocytes (Figure 3).
Eighty-five percent of the core ignorome contains known
protein domains cataloged in InterPro [15] or Pfam [16]. As
shown in Table S5, common domains include leucine-rich repeats
(SLITRK4, LRRC40, LRRC24), C2 calcium-dependent membrane
targeting domains (SYT16, CPNE9, CPNE4), small GTPase
domains (DIRAS2, RAB9B, DIRAS1), and zinc finger motifs
(Zfp941, RNFT2, ZMAT4, LONRF2, ZCCHC18, and DZANK1).
A subset of core ignorome genes (n = 10) have known orthologs
in worm. With few exceptions, such as SLITRK4 and SMAP1 that
are associated with embryonic lethality in worms, we were
unfortunately not able to add significant functional annotation
using this comparative approach and exploiting WormBase [17].
Gene function can often be predicted from patterns of
coexpression—guilt by association. We extracted the top 100
covariates of each member of the core ignorome and carried out
gene ontology (GO) enrichment analysis using the hypergeometric
distribution (FDR-corrected p value ,0.05) [18]. Every ignorome
gene was successfully assigned to one or more GO terms, including
ion-channel activity, beta-amyloid binding, GABA metabolic
process, neurotransmitter transport, neuron migration, synapse,
and voltage-gated calcium channel complex (Table S5).
Network properties of the ignoromeWe defined large sets of genes that covary with members the
ISE set (n = 306, see Methods) using several large brain
transcriptome data sets (whole brain, cerebellum, hippocampus,
nucleus accumbens, and prefrontal cortex) at thresholds of
|r| = 0.75, 0.80, 0.85, 0.90, and 0.95. Remarkably, there is no
correlation between the depth of literature coverage and the
number of super-threshold covariates in any data set at any level.
We conclude that connectivity of ISE genes in any of several well
defined brain regions does not predict how well it has been
studied. A few ignorome genes including RUFY3, TRNP1,
FAM81A, SLITRK4, and CNIH3 are among the top 20 most
highly connected genes in the brain and have higher connectivity
than extraordinarily well-studied genes such as GABRB3, MBP,
SYP, and SNCA.
Homolog properties of the ignoromeParalog comparison. There is no significant correlation
between paralog abundance and literature coverage for ISE genes
(r = 20.08). The average numbers of known paralogs for 100
ignorome genes and 100 of the best-studied ISE genes are closely
matched—2.2 and 3.0, respectively. Similar results were obtained
for human orthologs. The correlation between paralog counts and
literature coverage is very close to zero (20.085).
Figure 1. Literature density of 648 genes with intense and selective expression in the brain. The x-axis represents the number ofneuroscience-related references in PubMed as of February 2013. The left y-axis represents the number of genes. The right y-axis represents thecumulative literature distribution for ISE genes. A subset of ,30 genes to the far right (last two bars) absorb two-thirds of the total neuroscienceliterature. In contrast, ,200 genes to the far left (first two bars) absorb only 0.1% of the literature.doi:10.1371/journal.pone.0088889.g001
Analysis of an Ignorome
PLOS ONE | www.plosone.org 3 February 2014 | Volume 9 | Issue 2 | e88889
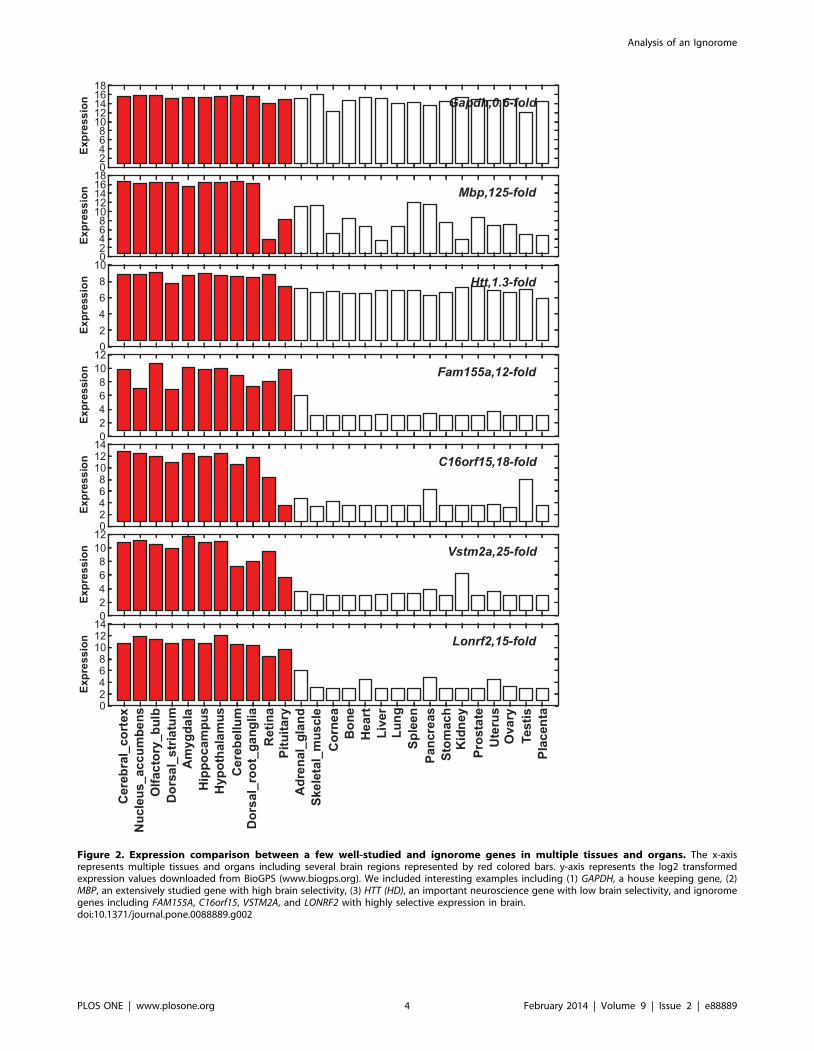
Figure 2. Expression comparison between a few well-studied and ignorome genes in multiple tissues and organs. The x-axisrepresents multiple tissues and organs including several brain regions represented by red colored bars. y-axis represents the log2 transformedexpression values downloaded from BioGPS (www.biogps.org). We included interesting examples including (1) GAPDH, a house keeping gene, (2)MBP, an extensively studied gene with high brain selectivity, (3) HTT (HD), an important neuroscience gene with low brain selectivity, and ignoromegenes including FAM155A, C16orf15, VSTM2A, and LONRF2 with highly selective expression in brain.doi:10.1371/journal.pone.0088889.g002
Analysis of an Ignorome
PLOS ONE | www.plosone.org 4 February 2014 | Volume 9 | Issue 2 | e88889

Ortholog comparison. Using comparative data for 21
species in HomoloGene (ftp.ncbi.nih.gov/pub/HomoloGene)[19],
there is a highly statistically significant positive correlation between
ortholog number and literature coverage (r = 0.16) using the
logarithm of the literature coverage to normalize the distribution.
Ignorome members have slightly fewer orthologs with a slope of
0.4 orthologs per 10-fold increase in literature, but this difference
while significant, only accounts for 2–3% of the variance. The
average numbers of known orthologs for 100 ignorome genes and
100 of the best-studied ISE genes are—8.19 and 9.79, respectively.
Protein signature analysis. The correlation between the
logarithm of the neuroscience literature and numbers of protein
domains for all 650 ISE gene is again weakly positive (+0.7
domains per 10-fold increase in literature, r2 = 4.2%) but is still
highly significant (p,.0001). This trend is much more evident in
the extremes of the distribution—the average domain count for
the best studied set of 100 genes is more than twice that of the
worst studied subset of 100 genes (n = 4.7 vs 2.0 domains). Twenty
ignorome genes have no known protein signatures, whereas all
well-studied ISE genes have at least one protein domain.
Time series analysis of the ignoromeWe evaluated whether sparse functional annotation and lack of
scientific attention focused on the ignorome is simply a matter of
discovery date and duration of study. For every ISE gene, we
retrieved the year that the gene or its orthologs were first
referenced in sequence databases including GenBank
(ftp.ncbi.nlm.nih.gov/refseq/M_musculus/mRNA_Prot). In most
cases, this date corresponds to the year the first cDNA clone was
submitted to GenBank (ftp.ncbi.nlm.nih.gov/refseq/M_muscu-
lus/mRNA_Prot). As anticipated, the well-studied subset of genes
was generally introduced earlier to the research community than
the ignorome subset— with medians of 1988 and 2002,
respectively (p,10218, one sided t test). Forty percent of ignorome
genes were introduced during the watershed sequencing years
(2001–2003) for mouse and human genomes (Figure 4). However,
it is serious concern that 60% of the ignorome have been well
defined protein-coding genes for over a decade.
Rate of evaporation. Will untargeted and semi-random
community research effectively remove the ignorome in the next
few years? To address this question we calculated the rate at which
the ignorome has shrunk over the past two decades? Our starting
point for this analysis was 1991. At this early stage of genomics,
two-thirds of our reference set of 648 ISE genes had no literature
at all. This number has been reduced by 90% and only 67 genes
are still part of an absolute ignorome with no neuroscience
literature and almost no literature in an area of research. While the
average rate of decrease was rapid between 1991 and 2000 (225
genes/year), the rate has been lethargic over the past five years
(26.4 genes/yr, Figure 5). This trend is surprising given the sharp
increase in the rate of addition to the neuroscience literature. As a
result, the number of neuroscience articles associated with the
elimination of a single ignorome gene has gone up by a factor of
three between 1991 and 2012 (Figure 5). The rate at which the
ignorome is shrinking is approaching an asymptote, and without
focused effort to functionally annotate the ignorome, it will likely
make up 40–50 functionally important genes for more than a
decade.
Genetic analysis of the ignoromeWe used a reverse complex trait approach combined with a
massive phenome data set in GeneNetwork [20] to evaluate the
range of CNS and behavioral phenotypes that map downstream of
ignorome genes. More specifically we exploited sequence variants
in ignorome genes that are known to segregate in the BXD family
of inbred strains [6,21,22]. We provide three concrete examples
below, and we provide more specific instructions that can be used
to apply this technique in the Methods section.
N Expression of ELMOD1 is associated with a strong cis-eQTL in
a massive RNA-seq brain data set that we generated (UTHSC
Mouse BXD Whole Brain RNA Sequence Exon Level RPKM, see
Methods). The LRS peaks at a value of 23 and the D allele is
associated with high expression. ELMOD1 is also a cis eQTL in
several regional data sets, including the hippocampus
(LRS = 43), hypothalamus (LRS = 21), prefrontal cortex
(LRS = 37), striatum (LRS = 25), and cerebellum (LRS = 24).
One likely causal variant is a ,6200 bp long interspersed
nuclear element that is present in all family members that
Figure 3. Expression of ignorome transcripts in the C57BL/6Jbrain. Pairs of low (scale on the lower left represents 1500 microns)and high (scale on the lower right represents 750 microns) resolutionimages of C57BL/6J brain sagittal sections (labeled using in situ probes)for six ignorome gene members taken from the Allen Brain Atlas (http://www.brain-map.org/). A) and B) are low and high resolution imagesshowing in situ expression of ZCCHC18 in sagittal sections. C) and D)show expression of FRRS1L. E) and F) show expression of C8orf46 and G)and H) show expression of FAM123C, I) and J) show expression ofKIAA2139, and K) and L) show expression of CMTM5.doi:10.1371/journal.pone.0088889.g003
Analysis of an Ignorome
PLOS ONE | www.plosone.org 5 February 2014 | Volume 9 | Issue 2 | e88889

inherit the B haplotype relative to the D wildtype haplotype.
This analysis provides a reason to suspect that variants in
ELMOD1 may have downstream effects on higher order
phenotypes. In support of this idea, four independent studies
have shown that variation in locomotor activity maps to the
ELMOD1 locus on chromosome 9 (GeneNetwork traits:
GN10566 [23], GN11518 [24], GN10132 [25], and
GN10010 [26]). Hearing sensitivity also maps to this region
(GN10654), and ELMOD1 is a strong candidate gene for this
trait given independent evidence that mutations in this gene
cause hearing and balance deficits [27].
N Expression of TMEM88B is consistently associated with cis-
eQTLs in whole brain (LRS = 12), hippocampus (LRS = 25),
hypothalamus (LRS = 13), and striatum (LRS = 13). The B
allele is associated with higher expression. A high impact
missense SNP (rs32361880) in exon 1 substitutes a polar
arginine (D haplotype) for a nonpolar glycine (B haplotype)
within the transmembrane helix as predicted by TMHMM
[28]. Several feeding and gustatory traits have been mapped to
this part of chromosome 4, including GN10578 [29] and
GN10475 [30]).These gustatory traits are already known to be
caused by a mutant D allele of the TAS1R3 sweet receptor
[31]. However, handling-induced convulsion, GN10578 [29],
is still a viable candidate trait that may be functionally linked to
the missense mutation in TMEM88B.
N DZANK1 is also consistently associated with cis-eQTLs in
mouse brain (LRS = 17), hypothalamus (LRS = 16), amygdala
(LRS = 32), and striatum (LRS = 23). DZANK1 has a missense
mutation that substitutes a valine (D haplotype) for an
isoleucine (B haplotype). Traits that map to the DZANK1
interval on chromosome 2 (139–150 Mb) include an assay for
depression (GN11432, the tail suspension test [24]) and
ambulatory activity (GN12890 [21]). Expression of DZANK1
in amygdala covaries strongly with both of these traits (r = 0.70
and r = 20.77) and both are therefore downstream phenotypes
that may well be associated with the DZANK1 missense
mutation and cis-eQTL.
Discussion
After two decades of systematic genomic studies of the nervous
system [35–37] nearly one-sixth (n,106) of all genes with highly
specific expression in the brain are still part of the core ignorome.
The skewed distribution of literature may be due to the inherent
differences in the importance of these genes, but we suspect that
initial bias in discovery and social and scientific research
momentum is a much more likely factor. Hoffman and Valencia
[1] showed no correlation between a gene’s impact in the scientific
literature and it’s centrality in protein-protein interactions, a
finding that certainly is concordant with our main results.
However, some skew in the literature could also be due to
intrinsic differences among ISE genes, particularly the number of
known protein domains. It is possible that the well-studied genes
have still undiscovered characteristics that justify the extra
affection that they continue to receive. Interestingly, we did not
find any prominent differences between well studied and ignorome
sets at any level of analysis, including expression selectivity, co-
expression connectivity, and species conservation (paralog and
ortholog abundance). We argue that that ignored genes will
ultimately prove to be as important as the well-studied genes such
as MBP, GABRA1, and GRIN1.
Figure 4. Year of discovery of genes. The x-axis represents the timeline. The line represents the perecentage of ISE genes whose mRNA orprotein have been referenced into GenBank.doi:10.1371/journal.pone.0088889.g004
Analysis of an Ignorome
PLOS ONE | www.plosone.org 6 February 2014 | Volume 9 | Issue 2 | e88889

Defining an ignoromeIgnoromes can be defined for whole systems or for single cell
fractions. Ignoromes can also be calculated for different states such
as a disease or response to a drug treatment. The only restriction
in computing different types of ignoromes is that the literature
pertaining to the relevant area of research must be sufficiently
large. Large literature size will ensure a relatively smooth
distribution of scores and adequate resolution and ranking of
genes. For example, pancreatic beta cells (,20,000 papers) and
astrocytes (,36,000 papers) have enormous literatures and
ignoromes could be easily computed given the literature and
numerous ‘omics’ data sets, even at the cellular level. In every case,
careful manual curation will be essential to avoid errors introduced
by ambiguous nomenclature or incorrect gene models. The
methods and code that we provide in the Methods section should
provide a start to systematically define what the blind spots in
genome functional annotation.
Assuming that the literature distribution of ISE genes for any
tissue follows a power law, the size of the ignorome will depend on
number of genes that show intense and selective expression. For
the expression data set that we used in our study [32], four other
common tissues—testis, placenta, embryonic stem cells, and
heart—also have comparatively large numbers of ISE genes. In
contrast, tissues with modest cellular diversity or widely shared
functions will often have smaller numbers of ISE genes and may
also have smaller ignoromes. However, since the ignorome is also
a function of literature coverage, there will be important
exceptions and tissues with small numbers of ISE genes may have
large ignoromes.
Depending on the goal of a study or system of interest, different
quantitative metrics can be used to evaluate the ‘genetic’ or
biological importance of genes. Expression selectivity, sequence
conservation or centrality in protein networks are some charac-
teristics that can be used to rank potential biological importance.
Whole transcriptome data sets have advantages. The first of these
is comprehensiveness—the availability of expression data for
nearly all protein-coding genes. In contrast, mammalian protein
interactomes are still incomplete and many proteins lack
interaction data. The second, almost paradoxical advantage of
expression data is the lack of association between a gene’s
expression selectivity score and its literature coverage. Expression
selectivity scores are computed without reference to the literature.
In contrast, specific protein–protein interactions are frequently
reported in the literature. As a result, proteins with high numbers
of interacting partners will obviously have high literature counts.
For expression data, the literature is only minimally ‘‘contami-
nated’’ by large ‘omics’ studies and literature contaminants are
easily removed.
Using tissue-selectivity scores as a metric overlooks genes that
have widespread expression but that have highly specific function.
For example, BDNF is expressed in many tissues [33,34], including
the brain, prostate, kidney and eyes, but is known to play an
important role in development and adult brain function.
In this study we have defined a core CNS ignorome using
stringent criteria, and the ignorme genes in Table S5 have at most
Figure 5. Shrinkage of the ignorome. The x-axis represents the timeline. The solid line represents the percentage of ignorome genes in the ISEbrain set. The dotted line represents the number of neuroscience specific literature (in thousands).doi:10.1371/journal.pone.0088889.g005
Analysis of an Ignorome
PLOS ONE | www.plosone.org 7 February 2014 | Volume 9 | Issue 2 | e88889

a single article link in PubMed. Broadening inclusion criteria to
include genes with as many as five articles could be easily justified
and would expand the brain ignorome to ,200 genes—almost
one-third of the ISE brain set. In this study we have also applied a
very high expression selectively criterion—8-fold higher expression
in brain than in other tissue. This criterion could easily be relaxed
to 4-fold, and the size of the brain ignorome would double. As
shown in Figure 1, half of all brain ISE genes absorb only 1% of
the neuroscience literature and from this vantage point could
easily be defined as below the poverty line. Appropriate thresholds
to define an ignorome will differ greatly depending on research
context. The threshold we have used is suitable for highlighting
only the most blatantly neglected starving genes that deserve much
more research attention.
Absolute versus relative ignoromesIt is practical to calculate global and local ignoromes for a given
system. The global ignorome consists of genes with no literature
coverage whatsoever. In contrast a local ignorome consists of
genes that may have some literature coverage but no or very little
literature coverage with respect to a particular system. In this
paper, we focused on the brain ignorome but calculated both
global and local (neuroscience-specific) ignoromes. We found that
only a few of the local brain ignorome genes, including COPG,
SMAP1, JPH4 and MAGEE1, have been studied to some extent
outside of neuroscience. Thus our stringent brain ignorome is
nearly equivalent to a global ignorome.
Annotating the ignoromeWe have used diverse resources to add useful functional
annotation to several core ignorome genes. We exploited InterPro
and Pfam, in situ hybridization expression data from the Allen
Brain Institute, and GeneNetwork’s massive compendium of
phenotype and transcript expression data. This overlay of
bioinformatic and genetic annotation, summarized in Table S5,
is helpful as an initial pointer, but even when we combine these
resources we cannot provide mechanistically validated functional
annotation. For example, information on protein domains is
helpful as a clue to function, but domains such as the leucine-rich
repeats have been identified in a large number of functionally
unrelated proteins [33]. As made clear by our retrospective
analysis of the brain ignorome going back twenty years (Figure 5),
molecular and genetic studies are essential to confidently remove a
gene from the list.
Network properties of the ignorome versus well-studiedgenes
Ignorome genes and well-studied genes showed no connectivity
difference in brain co-expression networks. This suggests that
ignorome genes may well prove to be as important as well-studied
genes. Literature coverage of ISE genes showed a very weak but
statistically significant correlation with both ortholog and protein
domain numbers. But none of these factors accounted for more
than 5% of the variance observed in literature coverage.
Potentially important brain ignorome membersWe conclude by highlighting a few examples of potentially
important brain ignorome genes that by definition have minimal
literature, but that already have intriguing, if tentative, links to
neurological and psychiatric disorders.
N CSMD3 encodes a transmembrane protein selectively ex-
pressed in adult and fetal brains and is a strong candidate for
autism spectrum disorders [35] and benign adult familial
myoclonic epilepsy [36]. Expression is extremely intense in the
dorsomedial hypothalamic nucleus and hippocampus but weak
in cerebellum. No clear function has been assigned to this
gene, but it mRNA covaries well (r = 0.72) in mouse
hippocampus with a voltage-gated sodium channel (SCN3A)
that itself is linked to autism and epilepsy [37]. The expression
of CSMD3 in human forebrain [38] is strongly linked with
genes involved in GABAergic interneuron fate commitment
(adjusted p (adjP) = 0.0039) and neuron development
(adjP = 0.010).
N CSRNP3 is expressed almost exclusively in brain and pineal
gland. CSRNP3 has cell death-inducing activities and is
predicted to play role in brain development [39]. Csrnp3
mRNA covaries well in mouse hippocampus with ataxin
1(ATXN1, r = 0.65) and PTEN (r = 0.64). ATNX1 is linked with
spinocerebellar ataxia 1[40] and PTEN is linked with
glioblastoma, autism, and several other syndromes[41,42]. In
human forebrain, CSRNP3 covaries well with genes involved in
alcohol transmembrane transporter activity (adjP = 0.018).
N TCBA1 is well conserved among mammalian species. The
human ortholog is expressed exclusively in brain and thymus
[43]. SNPs in and around TCBA1 are linked to neurological
phenotypes [44] and are associated with developmental delay
[43]. TCBA1 covaries remarkably well with APP in forebrain of
mouse and human (r = 0.75 and r = 0.65).
N Nine genes from TAFA family, including FAM123A,
FAM123C, FAM131B, FAM155A, FAM171B, FAM189A1,
FAM19A1, FAM19A2, and FAM81A. All nine are highly
expressed in specific regions of the brain and they have been
postulated to function as neurokines [13].
N FRRS1L is the human ortholog of the murine 6430704M03Rik
gene. It is a novel brain-specific transcript that has been linked
to familial dysautonomia [45]. It covaries well in mouse
hippocampus with GRIA1 (r = 0.4) and SNCA (r = 20.43).
GRIA1 is linked with spatial learning and memory [46]
whereas SNCA is linked with Parkinson disease [47]. In human
forebrain, the expression of this gene is strongly linked with
neurotransmitter secretion (adjP = .03).
N DIRAS1 and DIRAS2 belong to DIRAS gene family. DIRAS1 is
likely to be a neural tumor suppressor [48], and DIRAS2 is
associated with an adult form of attention deficit hyperactivity
disorder [49]. DIRAS1 in human forebrain is strongly linked
with genes involved in nervous system development (adjP
= 0.008) and neurofilament cytoskeleton organization (adjP
= 0.004). DIRAS2 is strongly linked with genes involved in
hydrogen ion transmembrane transporter activity (adjP
= 0.043).
Materials and Methods
Generating expression data sets for different tissuesIn order to estimate the relative selectivity of expression of genes
in the brain versus other tissues, we dissected 26 organs and tissue
types from young animals belonging to two fully inbred strains of
mice —C57BL/6J and DBA/2J. (All data are available at the
following link: http://genenetwork.org/dbdoc/
ILM_B_D_CNS_GI_avg_0508.html.) Approximately 100 mg of
each tissue was homogenized in 1 ml of RNA STAT-60 reagent.
The purity of RNA was determined and in all cases the 260/280
ratio was between 1.9 and 2.1. Samples were amplified with the
Illumina TotalPrep RNA kit and run on MouseWG-6 v2.0 arrays.
Data were normalized using the rank invariant method. The
Analysis of an Ignorome
PLOS ONE | www.plosone.org 8 February 2014 | Volume 9 | Issue 2 | e88889

variance across arrays was stabilized by converting values to z
scores. These z scores have some disadvantages: half of all values
are negative, and the range of values does not correspond to the
original log2 values. To avoid these two problems we doubled z
scores and added an offset of 8 units. The mean of these modified z
scores is therefore 8 and the standard deviation is 2. Values are
reasonably close to the original log2 scale and a two-fold difference
in mRNA concentration corresponds roughly to a 1 unit [50].
Expression levels below 6 are close to background noise levels. We
also exploited two other multiple organ expression data sets. The
first is an Affymetrix data downloaded from NCBI Gene
Expression Omnibus (www.ncbi.nlm.nih.gov/geo/query/acc.
cgi?acc = GSE9954) [32] consists of transcriptome estimates
generated across 19 organs and tissues from young adult
C57BL/6 (3 to 5 males and females), whole bodies of E16 mice,
placenta, and embryonic stem cells derived from C57BL/6JOla.
We preprocessed the data using robust multichip analysis (RMA).
We standardized expression values as described above for Illumina
data. The second data set is part of the BioGPS suite (www.biogps.
org) [51,52]. BioGPS was used to independently confirm the
selectivity of ISE gene expression in brain. All animal work was
conducted according to an approved animal use protocol and in
accordance with procedures approved by the Institutional Animal
Care and Use Committee at UTHSC.
Intensely and selectively expressed genes in brainWe computed a brain selectivity score for every probe by
dividing its expression in brain by its average expression across all
other tissues. Probes (genes) were operationally defined as
preferentially expressed in brain if this ratio was greater than 8.
Many probes(genes) with high expression in brain also have high
expression in testis and retina [53]. As a result, we relaxed our
criteria for inclusion to allow for a limited level of expression in no
more than 5 of 22 comparisons. The final list used for computing a
generic brain ignorome is therefore selective rather than exclusive.
When two or more probe identifiers mapped to the same gene
identifiers, we retained one with the highest brain selectivity. We
excluded probe sets that (1) mapped to multiple locations (2)
belong to a non-protein-coding gene. We also removed probe sets
containing SNPs and small indels between B6 and D2 to avoid
false expression estimates caused by hybridization artifacts [54].
We converted brain selectivity scores into relative brain
selectivity scores by dividing them with the highest brain selectivity
score for that array. The resulting relative scores for both arrays
ranged between 0 and 1 and were merged together to form a
single data set. In case where the gene was common to both arrays,
the highest relative selectivity score was retained.
Expression analysis using RNA-seqTotal RNA was isolated from the whole brains of adult mice
using RNA STAT-60 (Tel-Test Inc) as described in Li, Mulligan,
and colleague [6]. RNA samples with RNA integrity number
greater than 8 were used to generate transcriptome libraries,
which were sequenced on the SOLiD platform. Short sequence
reads were analyzed using Applied Biosystems whole transcrip-
tome software tools. Reads were mapped to the C57BL/6J
reference genome (NCBI build 37) with a minimum mapping
quality of 25. We were aware of the allelic bias problem in aligning
reads of DBA2/J (D2) origin to the B6 reference genome.
However, our purpose of using RNA-seq results was to determine
exact 39 UTR length rather than quantitative expression
difference between B6 and D2 transcriptome. Expression estimates
were calculated as the reads per kilobase of transcript per million
mapped reads (RPKM). This metric normalizes a transcript’s read
count by both its length and the total number of mapped reads in
the sample.
Validation of annotation of ISE brain genesAnnotations of microarray probes are still surprisingly poor.
Most of the probes we have exploited target the 39 UTRs of
mRNAs, and unfortunately, annotations of 39 UTRs of genes with
high expression in the brain are especially poor due to their
extreme length [55]. We generated deep RNA-seq data (.1 billion
50 nt oriented tags from rRNA-minus whole brain RNA) to
reliably determine the maximal length of 39 UTRs of mRNAs in
the brain and the full extent of the cognate genes. All of our
summed brain RNAseq tag count data are accessible at
ucscbrowser.genenetwork.org and whole brain gene expression
level expression data (RPKM) for 28 strains of mice are accessible
at www.genenetwork.org. Go to www.genenetwork.org. Select
‘‘Mouse’’ as species, ‘‘BXD’’ as group, ‘‘Brain mRNA’’ as type,
and ‘‘UTHSC Mouse BXD Whole Brain RNA Sequence Exon
Level (Nov12) RPKM’’ as dataset. This RNA-seq data enabled us
to accurately confirm and revise gene models and correct
annotation errors, particularly those related to long brain specific
39 UTRs.
Collecting gene and homolog information for ISE genesWe used annotation files from Affymetrix and Illumina to map
probes to genes. We also manually curated probes using RNA-seq
data. We used mouse-human and mouse-rat ortholog files from
Mouse Genome Informatics (www.informatics.jax.org) and the
HomoloGene file from NCBI (ftp.ncbi.nih.gov/pub/Homolo-
Gene/current) to get corresponding gene identifiers for mouse,
human and rat. HomoloGene was also used to compute the
number of orthologs for ISE genes.
Constructing gene nomenclature table and selectingambiguous gene names
We retrieved official gene names, symbols, aliases, and other
designation, including protein names for genes in mouse and their
orthologs from NCBI (ftp.ncbi.nlm.nih.gov/gene/DATA/GEN-
E_INFO/Mammalia). A total of 7,563 gene aliases and other
designations are available for 648 ISE genes. We selected the
subset of ambiguous gene names as follows. We downloaded a list
of English words (www.mieliestronk.com/wordlist.html) and used
this list to select gene names associated with common English
language words—for example CALM, Brain-1. We also selected
gene names that were too short, for example, ‘sp’, ‘F3’, ‘A-2’. We
used biomedical acronym resolver ARGH (http://etblast.vbi.vt.
edu/argh/index.shtml) and selected gene names that are also
acronyms for other non-relevant biomedical terms. We found 974
ambiguous gene names (symbols or aliases), and of these 118 gene
names match English words; 155 gene names have been used with
multiple senses in PubMed; 701 gene names that are too short for
non-ambiguous retrieval.
Generating gene-specific informative keywordsWe collected official full gene and protein names for genes in
mouse, human, and rat as described above. We split compound
gene and protein names into constituents. Uninformative words
such as ‘‘protein’’, ‘‘factor’’, ‘‘family’’, and ‘‘binding’’ were
removed. We also removed words that occurred at high frequency
(.20 occurrences) from the collection. For every gene we
manually selected one of its constituent words that occur with
low frequency.
Analysis of an Ignorome
PLOS ONE | www.plosone.org 9 February 2014 | Volume 9 | Issue 2 | e88889

Generating neuroscience specific keywordsWe extracted MeSH terms from ,50,000 articles belonging to
40 different neuroscience journals. For this purpose we used the
title abbreviation tag (TA) to limit PubMed searches to neurosci-
ence journals and counted frequencies of MeSH terms. The same
was done for ,150,000 non-neuroscience articles. We selected
MeSH terms that occurred at a relatively higher frequency
(.20%) in neuroscience articles and relatively low frequency in
(,1%) non-neuroscience articles. The final list of 155 terms used
to define the neuroscience literature (Appendix S2) consists of 129
computationally extracted terms (e.g., postsynaptic, prefrontal,
hippocamp*, amygdala, psychomotor, somatosensory, neuropsy-
chological, gyrus, metabatropic, parkison*, bicuculline) and 26
relatively generic neuroscience terms (e.g., neuron, axon, brain,
autis* CNS, nerve, glial, seizure).
Generating a list of noisy articlesWe extract the subset of genes that are associated with more
than 50 genes in PubMed using gene2pubmed (ftp.ncbi.nlm.nih.gov/
gene/DATA/gene2pubmed.gz). While some of these 800 papers
have useful functional annotation for ignorome genes, a manual
overview of ,50 of these articles shows that they add minimal if
any significant insight into brain function or disease.
Estimating literature coverageIn order to estimate literature coverage for each gene we
developed a concatenated PubMed query using NCBI EUtils. The
query had the following structure:
1) Subject of the query: All unambiguous aliases, gene symbols, and
gene names were joined using the OR operator to create a
comprehensive query. In those cases in which gene names
were ambiguous, they were joined with gene-specific key-
words.
2) Neuroscience membership: The set of 155 neuroscience-specific
keywords were combined with the query above.
3) Range of species: The search term ‘‘AND (Mus musculus OR
Homo sapiens OR Rattus norvegicus)’’ was added to further restrict
the search.
4) Range of text fields: The title and abstract tag (TIAB) was used to
avoid inclusion of irrelevant fields.
We provide one full example of this complex concatenated
query for the gene synapsin 1 (Syn1) in Appendix S1.
Calculating an ignorome scoreFor every ISE gene we calculated two fractional scores. First was
the fraction of ISE genes with higher relative brain selectivity than
the gene and second was the fraction of ISE genes with less
neuroscience literature size. Finally, we calculated an ignorome
score by taking the harmonic mean of the above two fractions.
Estimating paralog abundanceWe downloaded M. musculus and H. sapiens paralog data from
Ensembl BioMart (www.ensembl.org/info/data/biomart.html)
[56,57]. We only used paralogs defined by Ensembl as—
within_species_paralogs to compute numbers of paralogs for each
gene.
Genetic correlation analysis of ignorome genesWe used a BXD whole-brain Affymetrix M430 2.0 data set
consisting of ,44,000 probe sets. To avoid spurious correlations
with poorly expressed transcripts, we removed all probe sets with
expression ,8 units. We also removed probe sets containing SNPs
and small indels between B6 and D2 to avoid false correlation
caused by hybridization artifacts [54]. We computed Pearson
product-moment correlations between the ignorome genes (probe
sets) and other probe sets in the brain (,37,000) using a data set
consisting of at least 30 different strains of mice (see http://
genenetwork.org/webqtl/main.
py?FormID = sharinginfo&GN_AccessionId = 123) [18]. To ex-
clude spurious high correlations caused by linkage, we eliminated
data for pairs of transcripts that are chromosomal neighbors
(within 5 Mb of each other).
Reverse complex trait analysisWe selected a subset of 15 ignorome genes that are cis-
modulated (cis-eQTL) in one or more of 35 brain expression data
sets generated for the BXD family [54]. The following criteria
were used: (1) an LRS score .12, (2) expression .7, and (3)
moderate or high impact coding variants. For reverse complex
trait analysis we exploited GeneNetwork.org, a database consisting
of ,3,800 phenotypes known to vary widely across the BXD
family. Phenotypes that mapped to within 5 Mb of each ignorome
gene with an LRS .10 were defined as candidate traits using the
following search string: ‘‘LRS = (10 999 ChrZ XX YY)’’ where Z
is replaced with the correct chromosome and XX and YY are
genome positions (in megabases) located 5 Mb proximal and distal
to the ignorome gene.
Supporting Information
Figure S1 Location of 1443205_at probe set. Snapshot of
the brain RNAseq data confirming the location of the probe
1443205_at in the distal 39 UTR of the Gabrb1 gene. BR+BXD All
track represents the expression on the plus strand.
(XLS)
Table S1
(XLS)
Table S2
(XLS)
Table S3
(XLS)
Table S4
(XLS)
Table S5
(XLS)
Appendix S1
(DOCX)
Appendix S2
(DOCX)
Acknowledgments
The authors gratefully thank Dr. Paul Pavlidis and Dr. Megan Mulligan for
their intellectual contribution to the study.
Author Contributions
Conceived and designed the experiments: AKP RH RWW. Performed the
experiments: AKP LL. Analyzed the data: AKP XW. Contributed
reagents/materials/analysis tools: LL. Wrote the paper: AKP RWW.
Analysis of an Ignorome
PLOS ONE | www.plosone.org 10 February 2014 | Volume 9 | Issue 2 | e88889

References
1. Hoffmann R, Valencia A (2003) Life cycles of successful genes. Trends Genet 19:79–81.
2. Su AI, Hogenesch JB (2007) Power-law-like distributions in biomedicalpublications and research funding. Genome Biol 8: 404.
3. Pfeiffer T, Hoffmann R (2007) Temporal patterns of genes in scientificpublications. Proc Natl Acad Sci U S A 104: 12052–12056.
4. Chesler EJ, Williams RW (2004) Brain gene expression: genomics and genetics.
Int Rev Neurobiol 60: 59–95.5. Mozhui K, Ciobanu DC, Schikorski T, Wang X, Lu L, et al. (2008) Dissection of
a QTL hotspot on mouse distal chromosome 1 that modulates neurobehavioralphenotypes and gene expression. PLoS Genet 4: e1000260.
6. Li Z, Mulligan MK, Wang X, Miles MF, Lu L, et al. (2010) A transposon in
Comt generates mRNA variants and causes widespread expression andbehavioral differences among mice. PLoS One 5: e12181.
7. Overall RW, Kempermann G, Peirce J, Lu L, Goldowitz D, et al. (2009)Genetics of the hippocampal transcriptome in mouse: a systematic survey and
online neurogenomics resource. Front Neurosci 3: 55.
8. Sehgal AK, Srinivasan P (2006) Retrieval with gene queries. BMC Bioinfor-matics 7: 220.
9. Lehmann W, Schinke T, Schilling AF, Catala-Lehnen P, Gebauer M, et al.(2004) Absence of mouse pleiotrophin does not affect bone formation in vivo.
Bone 35: 1247–1255.10. Tare RS, Oreffo RO, Sato K, Rauvala H, Clarke NM, et al. (2002) Effects of
targeted overexpression of pleiotrophin on postnatal bone development.
Biochem Biophys Res Commun 298: 324–332.11. Carninci P, Kasukawa T, Katayama S, Gough J, Frith MC, et al. (2005) The
transcriptional landscape of the mammalian genome. Science 309: 1559–1563.12. Okazaki Y, Furuno M, Kasukawa T, Adachi J, Bono H, et al. (2002) Analysis of
the mouse transcriptome based on functional annotation of 60,770 full-length
cDNAs. Nature 420: 563–573.13. Tom Tang Y, Emtage P, Funk WD, Hu T, Arterburn M, et al. (2004) TAFA: a
novel secreted family with conserved cysteine residues and restricted expressionin the brain. Genomics 83: 727–734.
14. Lein ES, Hawrylycz MJ, Ao N, Ayres M, Bensinger A, et al. (2007) Genome-wide atlas of gene expression in the adult mouse brain. Nature 445: 168–176.
15. Mulder NJ, Apweiler R (2008) The InterPro database and tools for protein
domain analysis. Curr Protoc Bioinformatics Chapter 2: Unit 2 7.16. Punta M, Coggill PC, Eberhardt RY, Mistry J, Tate J, et al. (2012) The Pfam
protein families database. Nucleic Acids Res 40: D290–301.17. Chen N, Lawson D, Bradnam K, Harris TW, Stein LD (2004) WormBase as an
integrated platform for the C. elegans ORFeome. Genome Res 14: 2155–2161.
18. Castillo-Davis CI, Hartl DL (2003) GeneMerge–post-genomic analysis, datamining, and hypothesis testing. Bioinformatics 19: 891–892.
19. Wheeler DL, Church DM, Lash AE, Leipe DD, Madden TL, et al. (2001)Database resources of the National Center for Biotechnology Information.
Nucleic Acids Res 29: 11–16.20. Wu CC, Huang HC, Juan HF, Chen ST (2004) GeneNetwork: an interactive
tool for reconstruction of genetic networks using microarray data. Bioinformatics
20: 3691–3693.21. Andreux PA, Williams EG, Koutnikova H, Houtkooper RH, Champy MF, et al.
(2012) Systems genetics of metabolism: the use of the BXD murine referencepanel for multiscalar integration of traits. Cell 150: 1287–1299.
22. Koutnikova H, Laakso M, Lu L, Combe R, Paananen J, et al. (2009)
Identification of the UBP1 locus as a critical blood pressure determinant using acombination of mouse and human genetics. PLoS Genet 5: e1000591.
23. Risinger FO, Quick E, Belknap JK (2000) Quantitative trait loci for acutebehavioral sensitivity to paraoxon. Neurotoxicol Teratol 22: 667–674.
24. Philip VM, Duvvuru S, Gomero B, Ansah TA, Blaha CD, et al. (2010) High-throughput behavioral phenotyping in the expanded panel of BXD recombinant
inbred strains. Genes Brain Behav 9: 129–159.
25. Demarest K, McCaughran J Jr, Mahjubi E, Cipp L, Hitzemann R (1999)Identification of an acute ethanol response quantitative trait locus on mouse
chromosome 2. J Neurosci 19: 549–561.26. Alexander RC, Wright R, Freed W (1996) Quantitative trait loci contributing to
phencyclidine-induced and amphetamine-induced locomotor behavior in inbred
mice. Neuropsychopharmacology 15: 484–490.27. Johnson KR, Longo-Guess CM, Gagnon LH (2012) Mutations of the mouse
ELMO domain containing 1 gene (Elmod1) link small GTPase signaling to actincytoskeleton dynamics in hair cell stereocilia. PLoS One 7: e36074.
28. Krogh A, Larsson B, von Heijne G, Sonnhammer EL (2001) Predicting
transmembrane protein topology with a hidden Markov model: application tocomplete genomes. J Mol Biol 305: 567–580.
29. Roberts AJ, Phillips TJ, Belknap JK, Finn DA, Keith LD (1995) Genetic analysisof the corticosterone response to ethanol in BXD recombinant inbred mice.
Behav Neurosci 109: 1199–1208.30. Phillips TJ, Crabbe JC, Metten P, Belknap JK (1994) Localization of genes
affecting alcohol drinking in mice. Alcohol Clin Exp Res 18: 931–941.
31. Lush IE (1989) The genetics of tasting in mice. VI. Saccharin, acesulfame, dulcinand sucrose. Genet Res 53: 95–99.
32. Thorrez L, Van Deun K, Tranchevent LC, Van Lommel L, Engelen K, et al.(2008) Using ribosomal protein genes as reference: a tale of caution. PLoS One
3: e1854.
33. Ernfors P, Wetmore C, Olson L, Persson H (1990) Identification of cells in rat
brain and peripheral tissues expressing mRNA for members of the nerve growth
factor family. Neuron 5: 511–526.
34. Yamamoto M, Sobue G, Yamamoto K, Terao S, Mitsuma T (1996) Expression
of mRNAs for neurotrophic factors (NGF, BDNF, NT-3, and GDNF) and their
receptors (p75NGFR, trkA, trkB, and trkC) in the adult human peripheral
nervous system and nonneural tissues. Neurochem Res 21: 929–938.
35. Floris C, Rassu S, Boccone L, Gasperini D, Cao A, et al. (2008) Two patients
with balanced translocations and autistic disorder: CSMD3 as a candidate gene
for autism found in their common 8q23 breakpoint area. Eur J Hum Genet 16:
696–704.
36. Shimizu A, Asakawa S, Sasaki T, Yamazaki S, Yamagata H, et al. (2003) A
novel giant gene CSMD3 encoding a protein with CUB and sushi multiple
domains: a candidate gene for benign adult familial myoclonic epilepsy on
human chromosome 8q23.3–q24.1. Biochem Biophys Res Commun 309: 143–
154.
37. Weiss LA, Escayg A, Kearney JA, Trudeau M, MacDonald BT, et al. (2003)
Sodium channels SCN1A, SCN2A and SCN3A in familial autism. Mol
Psychiatry 8: 186–194.
38. Webster JA, Gibbs JR, Clarke J, Ray M, Zhang W, et al. (2009) Genetic control
of human brain transcript expression in Alzheimer disease. Am J Hum Genet 84:
445–458.
39. Yamada K, Akiyama N, Yamada S, Tanaka H, Saito S, et al. (2008) Taip2 is a
novel cell death-related gene expressed in the brain during development.
Biochem Biophys Res Commun 369: 426–431.
40. Matilla-Duenas A, Goold R, Giunti P (2008) Clinical, genetic, molecular, and
pathophysiological insights into spinocerebellar ataxia type 1. Cerebellum 7:
106–114.
41. Wang SI, Puc J, Li J, Bruce JN, Cairns P, et al. (1997) Somatic mutations of
PTEN in glioblastoma multiforme. Cancer Res 57: 4183–4186.
42. Redfern RE, Daou MC, Li L, Munson M, Gericke A, et al. (2010) A mutant
form of PTEN linked to autism. Protein Sci 19: 1948–1956.
43. Yue Y, Stout K, Grossmann B, Zechner U, Brinckmann A, et al. (2006)
Disruption of TCBA1 associated with a de novo t(1;6)(q32.2;q22.3) presenting in
a child with developmental delay and recurrent infections. J Med Genet 43:
143–147.
44. Bocciardi R, Giorda R, Marigo V, Zordan P, Montanaro D, et al. (2005)
Molecular characterization of a t(2;6) balanced translocation that is associated
with a complex phenotype and leads to truncation of the TCBA1 gene. Hum
Mutat 26: 426–436.
45. Chadwick BP, Leyne M, Gill S, Liebert CB, Mull J, et al. (2000) Cloning,
mapping, and expression of a novel brain-specific transcript in the familial
dysautonomia candidate region on chromosome 9q31. Mamm Genome 11: 81–
83.
46. Schmitt WB, Sprengel R, Mack V, Draft RW, Seeburg PH, et al. (2005)
Restoration of spatial working memory by genetic rescue of GluR-A-deficient
mice. Nat Neurosci 8: 270–272.
47. Ibanez P, Bonnet AM, Debarges B, Lohmann E, Tison F, et al. (2004) Causal
relation between alpha-synuclein gene duplication and familial Parkinson’s
disease. Lancet 364: 1169–1171.
48. Ellis CA, Vos MD, Howell H, Vallecorsa T, Fults DW, et al. (2002) Rig is a
novel Ras-related protein and potential neural tumor suppressor. Proc Natl Acad
Sci U S A 99: 9876–9881.
49. Reif A, Nguyen TT, Weissflog L, Jacob CP, Romanos M, et al. (2011) DIRAS2
is associated with adult ADHD, related traits, and co-morbid disorders.
Neuropsychopharmacology 36: 2318–2327.
50. Geisert EE, Lu L, Freeman-Anderson NE, Templeton JP, Nassr M, et al. (2009)
Gene expression in the mouse eye: an online resource for genetics using 103
strains of mice. Mol Vis 15: 1730–1763.
51. Wu C, Orozco C, Boyer J, Leglise M, Goodale J, et al. (2009) BioGPS: an
extensible and customizable portal for querying and organizing gene annotation
resources. Genome Biol 10: R130.
52. Lattin J, Zidar DA, Schroder K, Kellie S, Hume DA, et al. (2007) G-protein-
coupled receptor expression, function, and signaling in macrophages. J Leukoc
Biol 82: 16–32.
53. Guo J, Zhu P, Wu C, Yu L, Zhao S, et al. (2003) In silico analysis indicates a
similar gene expression pattern between human brain and testis. Cytogenet
Genome Res 103: 58–62.
54. Ciobanu DC, Lu L, Mozhui K, Wang X, Jagalur M, et al. (2010) Detection,
validation, and downstream analysis of allelic variation in gene expression.
Genetics 184: 119–128.
55. Smibert P, Miura P, Westholm JO, Shenker S, May G, et al. (2012) Global
patterns of tissue-specific alternative polyadenylation in Drosophila. Cell Rep 1:
277–289.
56. Haider S, Ballester B, Smedley D, Zhang J, Rice P, et al. (2009) BioMart Central
Portal–unified access to biological data. Nucleic Acids Res 37: W23–27.
57. Vilella AJ, Severin J, Ureta-Vidal A, Heng L, Durbin R, et al. (2009)
EnsemblCompara GeneTrees: Complete, duplication-aware phylogenetic trees
in vertebrates. Genome Res 19: 327–335.
Analysis of an Ignorome
PLOS ONE | www.plosone.org 11 February 2014 | Volume 9 | Issue 2 | e88889
Copyright © 2022 FDOKUMEN