Functionally low-literate consumers' use of food labels in the ...
170
Functionally low-literate consumers’ use of food labels in the rural area of Valspan in the Northern Cape of South Africa F Irvine 21684146 Dissertation submitted in fulfilment of the requirements for the degree Magister Scientiae in Consumer Science at the Potchefstroom Campus of the North-West University Supervisor: Prof M van der Merwe Co-Supervisor: Prof MJC Bosman Assistant Supervisor: Dr J van Staden September 2014
-
Upload
khangminh22 -
Category
Documents
-
view
0 -
download
0
Transcript of Functionally low-literate consumers' use of food labels in the ...

Functionally low-literate consumers’ use of food labels in the rural area of
Valspan in the Northern Cape of South Africa
F Irvine
21684146
Dissertation submitted in fulfilment of the requirements for the degree Magister Scientiae in Consumer Science
at the Potchefstroom Campus of the North-West University
Supervisor: Prof M van der Merwe
Co-Supervisor: Prof MJC Bosman
Assistant Supervisor: Dr J van Staden
September 2014

i
Acknowledgements
Heavenly Father, for His love and grace.
Prof Daleen van der Merwe, Prof Lena Bosman and Dr Hanlie van Staden for their outstanding guidance, setting high standards and for making this project a success.
Dr Ellis, for completing the statistical analysis and her assistance with interpretation of results.
Liesbet Barrat and Christi Niesing, for providing the link between the WIN project and Consumer Science and Joyful Fieldworkers
AUTHeR and NRF and Food and Beverage SETA, for financial contributions.
Prof Daleen van der Merwe, for arranging NRF funding for statistical analysis and for her assistance in obtaining NRF bursaries.
The respondents, who took the time to fill out the questionnaires without any reward or idea of how much they inspired me to successfully complete this project.
Roelien Havenga, for mentorship, assistance, love, laughs and support.
My Mom, Marion, and Dad, Greg, and sister, Loreen, for their unending love and support.

ii
Summary
Functionally low-literate consumers may often struggle to complete everyday adult tasks, such
as reading food labels. Food labels are an important source of information for consumers, and
assist them to make informed and wise food purchase decisions. However, the manner in which
functionally low-literate consumers read, understand and apply this information to their decision-
making, is different to literate consumers, and minimal research has been conducted regarding
functionally low-literate consumers and their use of food labels in South Africa. This study was
conducted in a predominantly low-literate and low-income rural area of Valspan, South Africa.
Therefore, using food labels to make healthy and financially sound food choices may be
considered especially important for this group of consumers. The current study served to
conduct an in-depth literature review of functionally low-literate consumers‟ use of food labels in
a rural area; explore whether and how functionally low-literate consumers use (read, understand
and apply to decision-making) food label information; explore and describe the differences
between the demographic characteristics of low-literate consumers and their use (reading,
understanding and application) of food labels; make recommendations to educators on how
functionally low-literate consumers can improve their use of food labels in a rural area; as well
as to make recommendations on how food labels can be adapted to be more user-friendly to
functionally low-literate consumers. Data was collected, using 292 interviewer administrated
questionnaires, using purposive criterion sampling. The inclusion criteria for respondents were
that they: had to be older than 18 years, living in Valspan and must have completed between
grades 5 and 8 at school. Data analysis was done, using descriptive statistics, T-tests,
ANOVA‟s, Spearman‟s rank order correlations and two-way frequency tables. Effect sizes were
taken into consideration for all differences and associations. The results showed that
respondents in this study did read food labels. They were also able to understand some simple
aspects of the food label, but struggled with other aspects. When respondents struggled to
understand food labels, they were selective about who they would ask to assist them, favouring
the help of familiar family members and friends. Regarding the respondents‟ ability to apply food
label information to their decision-making, respondents were able to identify several store logos,
probably due to their tendency to pictorial thinking. Food-related calculations were relatively well
completed; however, certain calculation-related terminology was not well understood by
respondents. Food label symbols were not well identified, indicating that respondents did not
have a good understanding of the meaning of these symbols. Literacy is vital to the use of food
labels, as respondents who showed higher literacy levels showed a tendency towards better
understanding of food label information, food label symbols and store logos. They also tended
to be better equipped to correctly execute product-related calculations. Regarding
demographics, respondents who spoke English and Afrikaans and who had a higher income

iii
had a tendency to better understand food label information, than respondents who spoke other
languages and belonged to lower-income groups. If food labels are adapted, so that even low-
literate consumers are able to efficiently use food labels, they will be able to make informed and
wise food product choices. This situation would be beneficial to low-literate and low-income
consumers, marketers and retailers, as products with usable labels may consequently become
the preferred choice of low-literate consumers and money wary low-income consumers.
Additionally, marketers and retailers would be able to capitalise on the mass purchasing power
that this target market represents.
Key words
Consumer, food label, functionally low-literate, rural, label use

iv
Opsomming
Lae-geletterde verbruikers mag dalk gereeld sukkel om daaglikse volwasse take te voltooi, soos
byvoorbeeld, om voedseletikette te lees. Voedseletikette is „n belangrike bron van inligting vir
verbruikers en help verbruikers om ingeligte en wyse voedsel aankoopbesluite te neem. Die
manier waarop lae-geletterde verbruikers egter die inligting lees, verstaan en op hulle
besluitnemingsproses toepas, verskil van die van geletterde verbruikers en daar is nog min
navorsing oor lae-geletterde verbruikers en hulle gebruik van voedseletikette in Suid-Afrika
gedoen. Die studie is in die landelike Valspan area in Suid-Afrika gedoen, waar „n groot
hoeveelheid lae geletterde verbruikers met „n lae inkomste woon. Om hierdie rede kan die
gebruik van voedseletikette om gesonde en finansieel betroubare voedselkeuses te maak, dalk
veral belangrik vir hierdie groep verbruikers wees. Die doel van die huidige studie was om „n
in-diepte literatuurstudie van die gebruik van voeldseletikette deur funksionele lae-geletterde
verbruikers uit te voer; om uit te vind of en hoe funksionele lae-geletterede verbruikers die
inligting op voedseletikette gebruik (lees, verstaan en op die besluitnemingsproses toepas); om
die verskille tussen die demografiese eienskappe van lae-geletterede verbruikers en hul gebruik
(lees, verstaan en toepassing op die besluitnemingsproses) van voedseletikette te verken en te
beskryf; om aanbevelings te maak oor hoe opvoeders funksionele lae-geletterde verbruikers
kan help om hul gebruik van voedseletikette in „n landelike gebied te verbeter; asook om
aanbevelings te maak oor hoe voedseletikette aangepas kan word om meer
verbruikersvriendelik te wees vir funksionele lae-geletterde verbruikers. Die data is deur 292
vraelyste wat met behulp van onderhoudvoerders geadministreer was, ingesamel deur middel
van doelgerigte, kriteriumsteekproefneming. Die insluitingskriteria vir respondents was: hulle
moes ouer as 18 jaar wees; in Valspan gebly het, en tussen Graad 5 en 8 op skool voltooi het.
Data-analise is deur beskrywende statistiek, T-toets, variansie analises, Spearman se rangorde
korrelasies en tweerigting frekwensie tabelle uitgevoer. Effekgroottes is vir alle verskille en
assosiasies in ag geneem. Die resultate het aangetoon dat respondente wel voedseletikette
lees. Hulle het ook eenvoudige aspekte van die voedseletiket verstaan, maar het met moeiliker
aspekte gesukkel. Wanneer respondente gesukkel het om etikette te verstaan, was hulle
selektief oor wie hulle om hulp sou vra, en het die hulp van familie en vriende verkies. Met
verwysing na die respondente se vermoë om die voedseletiket-inligting op hulle besluitneming
toe te pas, is gevind dat respondente verskeie winkels se handelsmerke kon identifiseer,
moontlik omdat hulle „n neiging tot piktografiese denke het. Voedselverwante berekeninge was
relatief goed uitgevoer, alhoewel respondente sekere berekeningsverwante terminologie nie
goed verstaan het nie. Respondente kon ook nie voedselsimbole goed identifiseer nie, wat
daarop dui dat die respondente nie „n goeie begrip van die betekenis van die simbole gehad het
nie. Geletterdheid is noodsaaklik vir die gebruik van voedseletikette, want respondente met

v
hoër geletterheidsvlakke, het ook „n neiging tot beter begrip van voedseletiketinligting, simbole
en winkelhandelsmerke getoon. Hulle was ook geneig om beter toegerus te wees om
produkverwante berekeninge korrek uit te voer. Ten opsigte van demografie, het respondente
wat Engels en Afrikaans gepraat het en „n hoër inkomste gehad het, „n neiging getoon om
inligting op voedseletikette beter te verstaan, as respondent wat ander tale gepraat het en wat
in laer inkomstegroepe was. Indien voedseletikette aangepas sou word sodat selfs lae-
geletterde verbruikers die voedsletiket doeltreffend kan gebruik, sal hulle in staat wees om
ingeligte en wyse voedelprodukkeuses te maak. Hierdie situasie sou voordelig vir lae-geletterde
verbruikers, lae-inkomste verbruikers, bemarkers en kleinhandelaars wees, want produkte met
bruikbare etikette, sal dalk die voorkeurkeuse vir lae-geletterde sowel as lae inkomste
verbruikers word; terwyl bemarkers en kleinhandelaars op die massa aankoopkrag van hierdie
teikenmark sou kon kapitaliseer.
Sleutelwoorde
Etiketgebruik, funksionele lae-geletterde, landelike, verbruiker, voeseletiket

vi
Table of Contents
Acknowledgements .................................................................................................................. i
Summary .................................................................................................................................. ii
Key words ............................................................................................................................... iii
Opsomming ............................................................................................................................ iv
Sleutelwoorde .......................................................................................................................... v
Table of Contents ................................................................................................................... vi
List of Annexures……………………………………………………………..………………….……xii
List of Abbreviations ............................................................................................................ xiii
List of Tables ........................................................................................................................ xiv
List of Figures ...................................................................................................................... xvi

vii
1. CHATPER 1: INTRODUCTION.............................................................................1
1.1 Background and motivation ............................................................................ 1
1.1.1 The South African consumer .............................................................................. 1
1.1.2 Functional low-literacy ........................................................................................ 2
1.1.3 Food labels ......................................................................................................... 2
1.1.4 Functionally low-literate consumers‟ use of food labels ....................................... 3
1.1.5 Malnutrition in South Africa ................................................................................. 5
1.1.6 Low-income rural South Africa ............................................................................ 7
1.1.7 Food labels as a tool for improving decision-making ........................................... 7
1.2 Problem statement ......................................................................................... 10
1.3 Research questions ........................................................................................ 10
1.4 Aims and objectives ....................................................................................... 11
1.4.1 Aim ................................................................................................................... 11
1.4.2 Objectives ......................................................................................................... 11
1.5 Conceptual framework ................................................................................... 11
1.6 Concept clarification ...................................................................................... 13
1.7 Structure of the dissertation .......................................................................... 15
1.8 Authors’ contributions ................................................................................... 16
1.9 Reference list ............................................................................................... ...18

viii
2. CHAPTER 2: LITERATURE REVIEW................................................................26
2.1 Introduction .................................................................................................... 26
2.2 Literacy............................................................................................................ 29
2.2.1 Literacy defined ................................................................................................ 29
2.2.2 Literacy in South Africa ..................................................................................... 29
2.2.3 Causes of low-literacy in South Africa ............................................................... 30
2.2.4 Literacy measurement ...................................................................................... 32
2.3 Functionally low-literate consumers ............................................................. 33
2.4 Food labels ..................................................................................................... 34
2.4.1 Food label information and attributes ................................................................ 34
2.4.2 Consumers‟ use of food labels .......................................................................... 36
2.4.3 Consumers‟ reading of food label information ................................................... 36
2.4.4 Consumers‟ understanding of food label information ........................................ 38
2.4.5 Consumers‟ application of food label information .............................................. 39
2.5 Cognitive predilections of functionally low-literate consumers .................. 39
2.5.1 Concrete reasoning .......................................................................................... 39
2.5.2 Pictorial thinking ............................................................................................... 40
2.6 Challenges encountered and coping strategies applied by functionally low-
literate consumers .......................................................................................... 42
2.6.1 Cognitive challenges and coping strategies ...................................................... 42
2.6.2 Product related challenges and coping strategies ............................................. 44
2.6.3 Social challenges and coping strategies ........................................................... 45
2.6.4 Affective challenges and coping strategies ....................................................... 46

ix
2.7 The consumer decision-making process ...................................................... 47
2.7.1 Single attribute decision making ....................................................................... 49
2.7.2 Habitual decision-making .................................................................................. 50
2.8 Low-income consumers ................................................................................. 51
2.9 Rural areas in South Africa ............................................................................ 52
2.9.1 Stores in rural areas ......................................................................................... 53
2.9.2 Valspan rural community .................................................................................. 54
2.10 Malnutrition in South Africa ........................................................................... 56
2.11 Conclusion ...................................................................................................... 58
2.12 Reference list .................................................................................................. 59
3. CHAPTER 3: RESEARCH ARTICLE.................................................................70
3.1 Introduction and background ...................................................................... 72
3.2 Literature review ............................................................................................. 73
3.2.1 Low-income, rural South Africa ......................................................................... 73
3.2.2 Functionally low-literate consumers .................................................................. 73
3.3 Food labels ..................................................................................................... 74
3.4 Methodology ................................................................................................... 75
3.4.1 Research design ............................................................................................... 75
3.4.2 Ethical considerations ....................................................................................... 75
3.4.3 Sampling .......................................................................................................... 76
3.4.4 Data collection .................................................................................................. 76
3.5 Measuring instrument .................................................................................... 76
3.5.1 Low-literate consumers‟ literacy assessment .................................................... 76

x
3.5.2 Measuring low-literate consumers‟ use of food labels ....................................... 77
3.6 Data analysis................................................................................................... 77
3.7 Results and discussion .................................................................................. 78
3.7.1 Demographics .................................................................................................. 78
3.7.2 Respondents‟ literacy levels assessment .......................................................... 80
3.7.3 Functionally low-literate consumers‟ use of food labels ..................................... 80
3.7.3.1 Functionally low-literate consumers‟ reading of food labels............................... 80
3.7.3.2 Functionally low-literate consumers‟ understanding of food labels .................... 82
3.7.3.3 Low-literate consumers‟ application of food label information during pre-
and post-purchase decision-making ................................................................. 84
3.7.4 Demographic differences between low-literate respondents and their use
(reading, understanding and application) of food labels .................................... 86
3.7.5 Associations among demographic variables and use (reading,
understanding and application) of food labels by functionally low-literate
respondents ...................................................................................................... 88
3.8 Practical implications ..................................................................................... 89
3.9 Limitations and future research prospects................................................... 90
3.10 Reference list .................................................................................................. 91
4. CHAPTER 4: CONCLUSION..............................................................................97
4.1 Introduction .................................................................................................... 97
4.2 Conclusion ...................................................................................................... 97
4.3 Practical applications of the research ........................................................... 99
4.3.1 Applications for functionally low-literate consumers .......................................... 99
4.3.2 Applications for product manufacturers, marketers and retailers ..................... 100
4.3.3 Applications for the food industry regulators ................................................... 101

xi
4.4 Recommendations regarding consumer education ................................... 101
4.5 Applications for future research .................................................................. 102
4.6 Limitations and recommendations .............................................................. 103

xii
List of Annexures
Annexure 1: Declaration of dissertation submission ....................................................... 104
Annexure 2: Research methodology ................................................................................. 105
1. Research design ............................................................................................. 105
2. Sampling and study population ....................................................................... 106
3. Data collection ................................................................................................ 107
4. Measuring instrument ..................................................................................... 108
5. Pilot study ....................................................................................................... 111
6. Data analysis .................................................................................................. 111
7. Ethical considerations ..................................................................................... 112
8. Validity and reliability ...................................................................................... 113
9. Reference list.................................................................................................. 115
Annexure 3: Ethical approval for study ............................................................................. 117
Annexure 4: Consent form.................................................................................................. 118
Annexure 5: Additional results tables ............................................................................... 119
Annexure 6: Author guidelines .......................................................................................... 128
Annexure 7: Proof of language editing of document ........................................................ 134
Annexure 8: Proof of submission to Turnitin .................................................................... 135
Annexure 9: Questionnaire and show cards used in the study ....................................... 138

xiii
List of Abbreviations
ANOVA - Analysis of Variance
HIV/AIDS - Human Immunodeficiency Virus/ Acquired Immune Deficiency Virus
IBM - International Business Machine
KMO - Kaiser Meyer Olkin
NWU - North West University
SA - South Africa
SD - Standard deviation
SPSS - Statistical Package for Social Sciences
UNESCO - United Nations Educational, Scientific and Cultural Organisation
UNICEF -United Nations International Children's Emergency Fund

xiv
List of Tables
CHAPTER 1: INTRODUCTION
Table 1: Authors‟ contribution to the study. …………………………………………………..................……..16
CHAPTER 3: RESEARCH ARTICLE
Table I: Demographic distribution of the sample.........…………………….…………..….…………...………..79
Table II: Different resources used to read food labels…………………………………………………….…...81
Table III: Reasons for not reading food labels……………………………………………………………..…..…82
Table IV: Summary of exploratory factor analysis of respondents' understanding of food labels
(n = 292)………………………………………………………………………………………......…….….....…..83
Table V: Product related calculation techniques displayed by functionally low-literate
respondents………………………………………………………………….…..………………………....…....85
ANNEXURE 2: RESEARCH METHODOLOGY
Table 1: Table to show relevant information of the questions used in the
questionnaire……………………………………………………….………………....……..110
ANNEXURE 5: ADDITIONAL RESULTS TABLES
Table :1 Descriptive analysis of literacy assessment……………………………………………....…..119
Table 2: Food label use (reading) .................................................. ………………………..…….119
Table 3: Frequency of food label use ...................................................................................... 119
Table 4: Frequency of food shopping ..................................................................................... 120
Table 5: Different resources used to read food labels ............................................................. 120
Table 6: Reasons for not reading food labels ......................................................................... 120
Table 7: Product related calculation techniques displayed by functionally low-literate
respondents .................................................................................................................. 121
Table 8: Application of food label information, pre- and post-purchase ................................... 121

xv
Table 9: Food label quality indicators ..................................................................................... 121
Table 10: Understanding of different aspects of the food label ............................................... 122
Table 11: Understanding of food label symbols ...................................................................... 122
Table 12: Food product related calculations ........................................................................... 122
Table 13: Identification of store logos ..................................................................................... 123
Table 14: Summary of exploratory factor analysis of the literacy assessment Test (n =292) .. 124
Table 15: Summary of exploratory factor analysis of respondents understanding of food labels
(n = 292)........................................................................................................................ 125
Table 16: Summary of exploratory factor analysis of respondents‟ understanding of food related
symbols (n = 292) .......................................................................................................... 126
Table 17: Summary of exploratory factor analysis of respondents ability to recognise store logos
(n = 292)........................................................................................................................ 126
Table 18: Correlation matrix between demographical characteristics and literacy using
Spearman‟s rank order correlation (r) ............................................................................ 127
Table 19: Correlations between literacy and food label use, using Spearman‟s rank order
correlation (r) ................................................................................................................. 127
Table 20: Correlation matrix between food related symbols, complex nutrition related
information and food product calculations, using Spearman‟s rank order correlation
(r)......................................................................................................................................127

xvi
List of Figures
CHAPTER 1: INTRODUCTION
Figure 1: Conceptual framework: The use (reading, understanding and application of
information to decision-making) of food labels by functionally low-literate consumers in a
rural area. ........................................................................................................................ 12
CHAPTER 2: LITERATURE REVIEW
Figure 2: Theoretical framework to illustrate the connection between functionally low-literate
consumers, food labels and rural areas. .......................................................................... 28

1
1. CHAPTER 1: INTRODUCTION
1.1 Background and motivation
1.1.1 The South African consumer
In South Africa (SA), approximately 11% of household expenditure is used on food (Statistics
South Africa, 2012a:42), indicating that food is an important component of consumers‟ budget.
For consumers living in rural areas, budgets are usually restricted and selecting nutritious food
products, which provide good value for money, may be considered less important. Therefore,
consulting food labels, which are the primary link between consumers and products, may be
recommended to provide information to assist in food selection (Sharf et al., 2012:531).
The South African population represents a range of wealth and education (Prinsloo et al.,
2012:94), with the living conditions for consumers varying from wealthy urban areas to less
developed, poor areas (Schönfeldt & Gibson, 2010:130; Steyn et al., 2006a:259). This diversity
has led to several issues prevalent in SA. Firstly, although the average annual income for South
African households was R103 204 per annum for 2011, the lowest two quintiles (40%) of South
African households receive no more than R10 009 per year (Statistics SA, 2012a:10, 41),
suggesting a very low income for these consumers. A total of 69% of adult consumers in rural
areas of SA live in poverty (UNICEF, 2010:7), indicating that the majority of consumers living in
rural areas, struggle with a low-income. Secondly, in 2011, a nationwide study showed that
19.1% of South African individuals were functionally low-literate, with an education of grade 7 or
less (Statistics SA, 2012b:39), implying that almost one fifth of South African consumers may
experience difficulties with reading and writing. In this study, the term functional low-literacy also
encompassed the definition of functional illiteracy. Thirdly, SA is challenged by malnutrition,
which is influenced by low-income and functional low-literacy. Malnutrition is a condition that
develops as a result of improper nutrient consumption and occurs in two extremes, namely,
under and over nutrition (Bosman et al., 2011:1372). The prevalence of malnutrition is
concerning as many South Africans have inadequate knowledge to choose appropriate types
and quantities of healthy foods (Temple & Steyn, 2011:507). This information therefore implies
that not all consumers are equipped with the necessary literacy skills to read and understand
the information that appears on food labels (Adkins & Ozanne, 2005b:101), to allow them to
make informed decisions regarding food products.
Previous studies have focused on consumers‟ use (Hess et al., 2011; Jacobs et al., 2010;
Kempen et al., 2011) and understanding (Jacobs et al., 2010; Sørensen et al., 2012) of food

2
labels, of which those of Jacobs et al. (2010) and Kempen et al. (2011) were in a South African
context. These studies were food label specific, and similar research by Viswanathan et al.
(2009a) has investigated low-literate consumers‟ understanding and use of nutritional aspects of
food labels. However, it has been proposed that further research regarding low-literate
consumers‟ use of food labels is necessary (Jay et al., 2009:30), especially in a South African
context. Research investigating the connection between poverty and literacy has also been
conducted (Krishna, 2006; Yagi, 2006); however, these studies were conducted in India.
Nutrition interventions have previously been executed as part of various studies, targeting low-
literate and malnourished consumers (Pappas et al., 2008; Pigone et al., 2004). However, social
and economic causes, such as poor quality education and low-literacy, in low-income areas
have not been addressed by such interventions (Chapora, 2003:645), which might contribute to
malnutrition still being prevalent in SA. There is thus a lack of South African research
specifically linking functionally low-literate consumers in a rural area to their use of food labels.
1.1.2 Functional low-literacy
In order for consumers to read and understand information found on food products, a specific
literacy level is essential (Wallendorf, 2001:505). Literacy is directly related to simple reading,
writing (Kirsch & Guthrie, 1977:488; Posel, 2011:41) and calculation tasks (Adkins & Ozanne,
2005b:93), through which literate consumers are able to process and analyse information using
critical thinking skills in order to function in today‟s society (Ntiri, 2009:98; Wallendorf 2001:505).
Consequently, consumers with lower literacy skills may experience a poorer understanding of
written information (Rothman et al., 2006:392) due to their inability to process and critically
analyse information. These consumers are often termed functionally low-literate as they do not
have the competency to complete tasks for adequate everyday adult functioning (Kirsch &
Guthrie, 1977:488; White, 2011:132), such as reading food labels. This study therefore,
specifically targeted functionally low-literate consumers, as this group of consumers experience
literacy problems, which could also possibly cause problems with food label use.
1.1.3 Food labels
A food label can be described as information that is written, printed or otherwise attached to a
food product (South Africa, 2010:10). Food labels are often considered the most effective
source of information to acquire food knowledge (Ali & Kapoor, 2009:725), and, as an external

3
source of information, aids in-store decision-making to select suitable food products (Barreiro-
Hurle et al., 2010:427), by allowing consumers freedom of choice, independent decisions and
reducing the effort required to search for product-related information (Barreiro-Hurle et al.,
2010:427; Sharf et al., 2012:531).
Consumers generally do not have a good understanding of food label information (Barreiro-
Hurle et al., 2010:426) and consequently labels have limited significance for consumers who
cannot comprehended and interpret the information, which is prevalent with less literate and
educated consumers (Prinsloo et al., 2012:91). These consumers may be disadvantaged with
regard to food labels, specifically in reading and understanding the information (Cowburn &
Stockley, 2005:24), whereas the ability to use such information would assist them to make
suitable, healthy and reasonable food product choices. This study investigated functionally low-
literate consumers who might experience difficulty reading, understanding, and applying
information found on food labels to their decision-making, with the aim to develop suggestions
which will assist these consumers in their use of food labels, in order for them to be able to
make more informed food-related decisions in the future.
1.1.4 Functionally low-literate consumers‟ use of food labels
Reading a food label is an activity with which many functionally low-literate consumers may
struggle to apply and engage with (Cooter, 2006:698). Food labels are an essential tool which
can be used to assist decision-making (Howard & Allen, 2006:439). A consumer‟s level of
literacy can be viewed as a cognitive, multi-faceted indicator, involving the ability to draw critical,
logical conclusions when using written information (Van Staden, 2012:7) as found in food labels.
However, literacy cannot be referred to as only a cognitive function, but the social context, such
as the retail environment, in which literacy is applied, is also important (Adkins & Ozanne,
2005a:153). Therefore, functionally low-literate consumers who struggle to read food labels may
be at a disadvantage when acquiring food product information and making food related
decisions.
For functionally low-literate consumers, shopping is often a stressful activity, and they may
experience several challenges when interpreting information on food products (Adkins &
Ozanne, 2005a:153; Viswanathan et al., 2005:23). These challenges can be regarded as
cognitive, product, social and affective-related (Gau & Viswanathan, 2008). When faced with

4
challenges, consumers may try to manage external and internal demands (Lazarus & Folkman,
1984:141), as will be shown in this study, where the store environment (external) and low-
literacy (internal) are combined in order for low-literate consumers to be able to act as capable
consumers (Hamilton & Catterall, 2008:551; Viswanathan, 2009:46).
Specifically, regarding cognitive challenges, low-literate consumers may use concrete reasoning
and pictorial thinking (Schiffman & Kanuk, 2010:493; Viswanathan, 2009:45; Viswanathan et al.,
2005:19,21) when in the retail environment. Concrete thinkers use single pieces of information
on which to base decisions, without giving attention to remaining product attributes (Schiffman &
Kanuk, 2010:493; Viswanathan, 2009:45). Pictorial thinking can be described as attaching an
analogical meaning to information or content (Kunda & Goel, 2008:305) and research has
shown that consumers with lower literacy levels often use information indicators, such as
pictures or images to process information (Adkins & Ozanne, 2005b: 96; Viswanathan et al.,
2005: 21), instead of reading the information. Typical cognitive challenges may include trouble
with writing shopping lists (Viswanathan et al., 2008:303) and reading in-store signage, locating
products (Viswanathan, 2009:45) and reading nutritional information (Viswanathan et al.,
2009a:137). Coping strategies often applied to these challenges include dependency on people
(for example, friends and store personnel) to assist with shopping (Adkins & Ozanne,
2005a:155; Ozanne et al., 2005:259; Viswanathan & Gau 2005:189), shopping at familiar stores
(Viswanathan et al., 2005: 25; Gau & Viswanathan, 2008), and trusting the cashier with all
available money and hoping to receive the correct change (Viswanathan et al., 2005:24;
Viswanathan & Gau, 2005:189).
Product-related challenges include aspects involved in product comparison (Gau &
Viswanathan, 2008; Viswanathan et al., 2009a:136), and are related to interpreting numerical
nutritional information (Borgmeier & Westenhoefer, 2009:185; Maubach et al., 2009:297) and
comparing product weight, size and prices (Gau & Viswanathan, 2008; Viswanathan et al.,
2009a:136). Popular product-related coping strategies may include adopting the same in-store
behaviour as literate consumers (Viswanathan, 2009:46), evaluating a product, following only
one attribute (Viswanathan & Gau, 2005:189), and exhibiting increased brand loyalty to prevent
reading the information of new and unfamiliar products (Sridharan & Viswanathan, 2008:457).
Social related challenges are associated with consumer relationships (Schiffman & Kanuk,
2010:118), such as interaction with hostile sales personnel (Gau & Viswanathan, 2008) and
exploitation by store owners (Ozanne et al., 2005:256; Viswanathan et al., 2008:302).

5
Functionally low-literate consumers cope with these types of challenges through using sight
vocabulary (recognising words as pictures) to hide poor literacy skills (Ozanne et al., 2005:258;
Sabatini et al., 2010:129), and by often faking a headache or poor eye sight when unable to
read product information (Adkins & Ozanne, 2005b:98).
Affective-related challenges are related to emotions (Viswanathan et al., 2005:16), such as
consumers experiencing fear that their limited literacy skills will be exposed and also
experiencing emotional stress such as embarrassment and shame (Ozanne et al., 2005:256), or
anxiety and decreased self-esteem (Viswanathan et al., 2005:23). Common coping strategies
used to cope with affective challenges include avoiding asking for help, to prevent
embarrassment (Viswanathan et al., 2008:303; Viswanathan et al., 2010:530).
Previous research shows that functionally low-literate consumers clearly experience challenges
in the marketplace, not only with reading and writing, related to shopping tasks, but also
challenges involving store relationships and paying for products (Gau & Viswanathan, 2008).
Although functionally low-literate consumers apply coping strategies to deal with such
challenges, in-store decision-making may not be competently completed. Therefore, this study
explored functionally low-literate consumers‟ use of food labels, in addition to the challenges
experienced in the food retail environment and the coping strategies that they use.
1.1.5 Malnutrition in South Africa
Globally, and especially in Africa, many communities experience malnutrition (Bosman et al.,
2011:1372). Malnutrition is a condition primarily caused by an excessive or deficient intake of
energy or nutrients, as well as by diseases (Black et al., 2008:248; Whitney & Rolfes, 2008:20).
Although over nutrition (excessive intake of energy/nutrients) is common in rural SA (Kimani-
Murage et al., 2011:1114), the present study focused on malnutrition regarding energy and
nutrient deficiency. The HIV/AIDS pandemic in South Africa has also led to an increase in
malnutrition in South African children (Bourne et al., 2007:234), as HIV/AIDS have a synergistic
relationship with malnutrition (Bloem et al., 2010:134S). Underlying causes of malnutrition in SA
are household food insecurity and the quality of the diet (Kimani-Murage et al., 2010:165), a
limited variety in food and diet (Steyn et al., 2006b: 648), as well as inadequate care, an
unhealthy household environment and poverty (Black et al., 2008:248).

6
The consequences of malnutrition are far reaching (Bosman et al., 2011:1377), since they
contribute to 60% of deaths in children under five years old, primarily in rural areas in SA
(UNICEF, 2012a:6,9). Malnutrition sufferers may experience underdevelopment as well as
related health problems and micronutrient deficiencies (Faber & Wenhold, 2007:393).
Malnutrition is also the cause of diseases, stunting, wasting, reduced growth (Black et al.,
2008:343), reduced intellectual ability, and weakened immune systems (UNICEF, 2012b:26).
The outcome of failing to successfully address malnutrition in SA may result in malnourished
children who are unable to perform optimally throughout their school career and subsequently
earn a lower income (Victoria et al., 2008:348), which, in turn, contributes to continued poverty
in SA (Alkire & Foster, 2011:485). This also affects food purchasing behaviour (Sanlier &
Karakus, 2010:141), as low-income households are unable to afford nutritious foods in the
correct quantity and quality.
National efforts to address the problem of malnutrition in SA have been undertaken by focusing
on the encouragement of good nutrition and a healthy lifestyle (Bourne et al., 2007:231). The
National Food Consumption Survey (NFCS), completed in 1999, indicated that many South
African children lack a diet containing sufficient energy and nutrients (Labadarios et al.,
2005:104) whilst Steyn et al. (2006a:273) suggests that insufficient diets are more prevalent
among children living in rural areas. Another initiative that targeted primary school children was
the National School Nutrition Programme (NSNP), which aimed to improve the health and
nutritional status of these children, to enable them to attend school and learn effectively (Public
Service Commission, 2008:viii). The Integrated Food Security and Nutrition Programme (IFSNP)
aimed to eliminate hunger, malnutrition and food insecurity by 2015, through ensuring that all
South Africans had physical, social and economic access to safe and nutritious food (South
Africa, 2012).
However, the continued prevalence of malnutrition suggests that the nutrition interventions and
studies completed thus far have been inadequate to alleviate food insecurity and malnutrition in
SA (Kimani-Murage et al., 2010:169). The present study aimed to explore consumers‟ use of
food labels in a rural area to determine if functionally low-literate consumers used food labels in
their decision making, through reading and understanding and applying the information found
on food labels. Results of this study may provide consumer scientists, educators, marketers and
other food industry role players with information, ideas and suggestions as to how a food label
can be used as an information source, to make healthy food choices and contribute to
malnutrition prevention in the future.

7
1.1.6 Low-income rural South Africa
Valspan is a rural community, situated in Jan Kempdorp, on the border of the Northern Cape
and western area of the North West Province, with approximately 2000-5000 residents (Collins
Maps, 2012). The Valspan community is officially located in the Northern Cape (Maplandia,
2005). In general, consumers living in rural areas have low monthly incomes, as well as low
literacy levels (Van Biljon & Jansen van Rensburg, 2011:9549; Vorster et al., 2005:480) and
experience high rates of malnutrition (Faber & Wenhold, 2007:396).
In a needs assessment, conducted by Coetzee (2011:17), problematic issues in this community
were highlighted by consumers living in the Vaalharts area, which includes Valspan. It was
noted that there is a need for reading and writing programmes, especially among the older,
illiterate generations, due to limited access to education. Such programmes can uplift the
current illiteracy rates present in the communities (Coetzee, 2011:20; Posel, 2011:39). This
finding is of importance, as it has been suggested that low literacy and poor socio-economic
circumstances can be related to poor health (Nutbeam, 2008:2072). Poverty and high
unemployment rates were also visible throughout the Vaalharts area (Coetzee, 2011:20), which
could be a direct result of poor education. Low-income consumers do not hold much individual
purchasing power, and because of their restricted budgets, often do not have the means to
purchase healthy, high quality foods (Maubach et al., 2009:298). Furthermore, as low-income
consumers are often also low-literate, they may possibly make uninformed purchase decisions.
Therefore, food labels should be presented in a format which all consumers can understand,
even consumers with limited literacy skills and income, living in the rural Valspan area, to
enable them to select appropriate food products that are nutritious and will provide the best
value for money (Viswanathan et al., 2009b:85).
Therefore, the demographic profile of functionally low-literate food label users in this area was
also explored, in order to determine the possible connection between food label use, gender,
age, monthly income and education level.
1.1.7 Food labels as a tool for improving decision-making
It is important to note that food labels have the potential to impact consumers, both on an
individual and community level, and should be considered a public health tool (Sharf et al.,
2012:534). However, consumers who are well aware of food labels do not necessarily adopt
healthy dietary behaviour (Lewis et al., 2009:1357), and in order to change their habitual

8
preferences, it is essential that nutritional information is available in an accessible format
(Maubach et al., 2009:301). This is even more important for consumers who experience limited
literacy skills.
Consumers make food-related decisions daily and it is through the decision-making process
(Rousseau, 2007:259) that consumers select which products they need, buy and use (Cant et
al., 2006:193; Schiffman & Kanuk, 2010:478). The decision-making process usually follows a
sequential order, beginning with need recognition, information search, evaluation of alternatives
(pre-purchase decision-making), selection of the product, and concluding with post purchase
evaluation (post-purchase decision-making) (Schiffman & Kanuk, 2010:483). It must be noted
that functionally low-literate consumers follow unique decision-making processes and may
evade some of the stages, such as the pre-purchase search and evaluation of alternatives
stages (Viswanathan, 2009:46). The summary below indicates how the information on food
labels can be applied at each stage of the decision-making process:
• Stage 1 – Need recognition. According to Maslow‟s hierarchy of needs, food is a basic
physiological need (Schiffman & Kanuk, 2010:116), triggered by an inner hunger and need for
food. However, when consumers are exposed to and see a certain stimulus, the stimulus may
trigger a need (Schiffman & Kanuk, 2010:175). An example of such a stimulus is a food label,
which may trigger a need for healthy food. Similarly, consumers may have a need to search for
information which may allow them to make informed food choices (Jacobs et al., 2010:511),
which can be evoked/ recognized by exposure to a food label.
• Stage 2 – Information search. An effective way to gain food knowledge is to read a food
label (Ali & Kapoor, 2009:725), as labels can provide information regarding the product, such as
brand name, nutritional content and expiry date. Nutritional information should be presented in a
way that it requires little conscious effort and knowledge from the consumer to understand the
label (Maubach et al., 2009:297), even so for functionally low-literate consumers.
• Stage 3 – Evaluation of alternatives. Information found on the food label can be used to
evaluate alternative products. Improved understanding of basic nutritional principles reflected on
food labels (Sharf et al., 2012:534) and illustrating how food labels should correctly be used,
may also assist in encouraging consumers to adopt healthier dietary behaviour (Lewis et al.,
2009:1356), such as evaluating products based on nutritional value, not size or colour.

9
• Stage 4 – Alternative selection. Through label information and education, consumers
should be equipped to select more diverse and nutritionally adequate foods (Altman et al.,
2009:359), which could also play a role in preventing malnutrition.
• Stage 5 – Post-purchase evaluation. It is important that consumers are able to read the
food label at this stage so that information, such as the expiry date, which indicates the period
of time the product is safe to eat (Mackey & Metz, 2009:375; Peters-Texeira & Badrie,
2005:512), is recognised. The comprehension of such information may then assist in ensuring
optimal use and value from the product.
Food labels are involved in every aspect of consumers‟ food related decisions and therefore this
study explored functionally low-literate consumers‟ reading, understanding and application of
food label information, in their decision-making.

10
1.2 Problem statement
Minimal research has been conducted in South Africa, regarding functionally low-literate
consumers‟ use of food labels in a rural area, which has led to a lack of information in this field.
Malnutrition and functional low-literacy are issues in South Africa – especially in low-income,
rural areas – and the former can be alleviated through the consumption of nutritious, healthy
foods. Food labels are a source of information, with the potential to assist consumers to make
healthy food choices, since consumers are exposed to these labels on a daily basis. However,
being equipped to comprehend food label information is essential to allow consumers to make
informed decisions. Unfortunately, some functionally low-literate consumers are unable to read
and effectively comprehend the information found on food labels. Such low-literate consumers
may experience cognitive, product-related, social and affective challenges when entering the
retail environment, and apply coping strategies to attempt to cope with these challenges, to
present themselves as competent consumers. Therefore, low-literate consumers may be unable
to effectively assess a food product or select the most nutritious product for the best value for
money, thus putting them at a disadvantage, when compared to functionally literate consumers.
1.3 Research questions
With reference to functionally low-literate consumers‟ use of food labels, the following research
questions will guide this study:
• Do functionally low-literate consumers read food labels and, if so, when?
• Do functionally low-literate consumers understand food labels?
• Do functionally low-literate consumers apply the information found on food labels to their
decision-making and post purchase evaluations and, if so, how?
• Are there differences between the use (reading, understanding and application) of food
labels for low-literate consumers with different demographics?
• Are there ways in which functionally low-literate consumers‟ use of food labels in a rural
area can be improved?

11
1.4 Aims and objectives
1.4.1 Aim
The main research aim of this study was to explore and describe functionally low-literate
consumers‟ use of food labels in the rural area of Valspan in the Northern Cape of South Africa.
1.4.2 Objectives
The specific objectives of this study were to:
• Explore and describe whether and when functionally low-literate consumers read food
labels;
• Explore and describe functionally low-literate consumers‟ understanding of food labels;
• Explore and describe whether and how functionally low-literate consumers apply the
information found on food labels during their pre- and post-purchase decision-making;
• Explore and describe the differences between the demographic characteristics of low-
literate consumers and their use (reading, understanding and application) of food labels;
• Make recommendations to educators on how functionally low-literate consumers can
improve their use of food labels in a rural area; and
• Make recommendations on how food labels can be modified to be more user-friendly to
functionally low-literate consumers.
1.5 Conceptual framework
The conceptual framework presented in Figure 1 serves as a guide to the dissertation. It
provides different concepts of functional low-literacy, food label use and recommendations;
showing how these concepts fit together in this study.

12
Figure 1: Conceptual framework: The use (reading, understanding and application of information to decision-making) of food labels by functionally low-literate consumers in a rural area.
As shown in Figure 1, functional low-literacy is associated with literacy level, residing area which
in this case is a rural area and the socio-economic status (low-income). These factors affect the
food label use. This study and subsequent chapters show the interrelation between these
factors.
01
Functional low-literacy
Literacy level
Rural area
Income (Low)
Recommendations
Food industry
Consumers
Food labels
Food label use
Reading
Understanding
Application of
information to
decision-making
FUNCTIONALLY LOW-
LITERATE CONSUMER

13
1.6 Concept clarification
Consumer
A person who recognises a need or desire, makes a purchase and disposes of a product
(Solomon, 2011:647).
Consumer application of food labels
Application to decision-making is associated with how consumers employ the information
provided on a food label, to make decisions and post-purchase evaluations.
Food label
A food label is any means written, printed, or permanently attached to a food product through a
tag, brand, mark, pictorial, graphic or other descriptive matter, with the purpose of promoting the
foodstuffs‟ sale or disposal (South Africa, 2010:10).
Food label attributes
Food label attributes include the physical attributes (product dimensions, legibility of font size
and style) and label information which transfers attributes such as the ingredient list, expiry
date, health and nutrition-related claims, nutritional information, country of origin, allergen
information, logos, identification and address of the manufacturer, quality guarantee,
instructions for use, number of servings (Prinsloo et al., 2012:93)
Food label use
For the purpose of this study, the term food label use will include three components, namely,
reading, understanding and applying of food label information.
Functional literacy
Functional literacy is the term used to describe the competency required to complete individual
and community related tasks, required for everyday adequate adult functioning (Kirsch &
Guthrie, 1977:488; UNESCO, 2006:154), in addition to using reading, writing and calculation to
further personal development (UNESCO, 2006:154).
Functional low-literacy
School qualification can be used as an indicator of functional literacy, as grade 7 or lower
represents functionally low-literate consumers (Statistic South Africa, 2012b:39). It is important

14
to consider that there is no finite demarcation to define consumers as literate or non-literate and
that the connection between low literacy and literacy, rather, is a continuum (Mårtensson &
Hensing, 2012:156; Stedman & Kaestle, 1987:10).
Literacy
The definition of literacy involves reading and writing and includes information processing and
critical thinking skills required by consumers to function in the modern marketplace (Ntiri,
2009:98; Wallendorf, 2001:505).
Rural area
A rural area is regarded as a formal or semi-formal village or settlement without a local authority
and is characterised by houses, huts and rondavels (Statistics South Africa, 2003:4), a lack of
socio-economic development, infrastructure, opportunities for employment and income
generation (Kehler, 2013:46), as well as malnutrition (Kimani-Murage et al., 2010:165) and high
HIV/AIDS rates (Bärnighausen et al., 2008:142).
Reading
Reading comprises of two components: word recognition (which converts print into language)
and language comprehension (which makes sense of the printed information) (Catts et al.,
2006:279).
Understanding
The ability to comprehend, know or grasp the intended meaning of information presented
(Cowburn & Stockley, 2005:22).

15
1.7 Structure of the dissertation
This dissertation is presented in article format. Chapter 1 provides an introduction to the study
and contains the background and motivation of the study, as well as the conceptual framework,
problem statement, aim and objectives. Literature review regarding literacy in South Africa, food
labels, the low-literate consumer and low-income, rural South Africa is provided in Chapter 2.
Chapter 3 consists of a research article, which was written and is to be submitted to the
International Journal of Emerging Markets, and contains an overview as well as the results of
the study. The format and references for this article were done in accordance with the journal‟s
editorial and referencing guidelines. The dissertation is concluded in Chapter 4, with a summary
of the results. The limitations of the study are also discussed and recommendations for future
research are made. Each chapter contains a reference list, written according to the Harvard
referencing style, as required by the North-West University. Additionally, Annexures, such as
an overall in-depth description of the study‟s research methodology. For comprehensiveness,
the questionnaire and show cards, letter of consent, additional information, findings and results
are also attached (see Annexures).

16
1.8 Authors’ contributions
The study reported in this dissertation was designed and conducted by a team of researchers.
The contribution of each researcher is given in Table 1 below:
Table 1: Authors’ contribution to the study.
NAME ROLE IN STUDY
Miss F. Irvine Author, responsible for literature research
and adaption of questionnaire and further
questionnaire development, the gathering
and interpretation of data, and preparation of
this dissertation.
Prof M. van der Merwe Supervisor: Study leader and co-author,
supervising of literature research and
questionnaire development, interpretation of
results, as well as completion of this
dissertation. Provided funding for statistical
analysis and assisted in obtaining additional
funding for this study.
Prof M.J.C. Bosman Co-supervisor: Co-study leader and co-
author, supervising of literature research and
questionnaire development, interpretation of
results, as well as completion of this
dissertation.
Dr H. van Staden Co-supervisor: Co-study leader and co-
author, supervising of literature research and
questionnaire development, interpretation of
results, as well as completion of this
dissertation.
Dr S. Ellis Co-author of research article: Responsible
for all data analyses as well as interpretation
of data and results.

17
The following is a statement from the co-authors, confirming their individual role in the study and
giving their permission that the article may form part of this dissertation.
I declare that I have approved the article included in this dissertation, that my role in the study,
as indicated above, is representative of my actual contribution and that I hereby give my
consent that it may be published as part of the Magister in Consumer Sciences‟ dissertation of
Ms. F. Irvine.
____________________________ ___________________________
Fay Irvine Prof M. van der Merwe
Student Supervisor
_______________________________ _______________________________
Prof M.J.C. Bosman Dr H. van Staden
Co-supervisor Co-supervisor
___________________________
Dr S.M. Ellis
Co-author of the research article

18
1.9 Reference list
Adkins, N.R. & Ozanne, J.L. 2005a. Critical consumer education: empowering the low-literate
consumer. Journal of macromarketing, 25(2):153-162.
Adkins, N.R. & Ozanne, J.L. 2005b. The low-literate consumer. Journal of consumer research,
32(1):93-105.
Ali, J. & Kapoor, S. 2009. Understanding consumers‟ perspectives of food labelling in India.
International journal of consumer studies, 33(6):724-734.
Alkire, S., & Foster, J. 2011. Counting and multidimensional poverty measurement. Journal of
public economics, 95(7):476-487.
Altman, M., Hart, T.G.B. & Jacobs, P.T. 2009. Household food security status in South Africa.
Agrekon, 48(4):345-361.
Bärnighausen, T., Tanser, F., Gqwede, Z., Mbizana, C., Herbst, K. & Newell, M. L. 2008. High
HIV incidence in a community with high HIV prevalence in rural South Africa: findings from a
prospective population-based study. Aids, 22(1):139-144.
Barreiro-Hurle, J., Gracia, A. & de-Magistris, T. 2010. The effects of multiple health and
nutrition labels on consumer food choices. Journal of agricultural economics, 61(2):426-443.
Black, R. E., Allen, L. H., Bhutta, Z. A., Caulfield, L. E., De Onis, M., Ezzati, M., Mathers, C. &
Rivera, J. 2008. Maternal and child undernutrition: global and regional exposures and health
consequences. The lancet, 371(9608):243-260.
Bloem, M. W., Semba, R. D. & Kraemer, K. 2010. Castel Gandolfo workshop: an introduction
to the impact of climate change, the economic crisis, and the increase in the food prices on
malnutrition. The journal of nutrition, 140(1):132S-135S.
Borgmeier, I. & Westenhoefer, J. 2009. Impact of different food label formats on healthiness
evaluation and food choice of consumers: a randomized-controlled study. BMC public health,
9(1):184-196.
Bosman, L., Herselman, M.G., Kruger, H.S. & Labadarios, D. 2011. Secondary analysis of
anthropometric data from a South African National Food Consumption Survey, using different
growth reference standards. Maternal and child health journal, 15(8):1372-1380.

19
Bourne, L.T., Hendricks, M.K., Marais, D. & Eley, B. 2007. Addressing malnutrition in young
children in South Africa. Setting the national context for paediatric food-based dietary
guidelines. Maternal and child nutrition, 3(4):230-238.
Cant, M.C., Brink, A. & Brijball, S. 2006. Consumer Behaviour. Cape Town: Juta & Co.
Catts, H. W., Adlof, S. M. & Weismer, S. E. 2006. Language deficits in poor comprehenders: a
case for the simple view of reading. Journal of speech, language and hearing research,
49(2):278-293.
Chapora, M. 2003. Risk factors for undernutrition of young children in a rural area of Southern
Africa. Public health nutrition, 6(7):645-652.
Coetzee, H. & Du Toit, I.M. 2011. Research report 2: Needs assessment conducted in the
Vaalharts region, North-West and Northern Cape Provinces, South Africa: a North-West living
labs baseline project. Potchefstroom: NWU, AUTHer Group. (Unpublished).
Collins maps. 2012. Valspan, Northern Cape, Republic of South Africa. http://www.collinsm
aps.com/maps/Republic-of-South-Africa/Northern-Cape/Valspan/P860873.00.aspx. Date of
access: 27 March 2013.
Cooter, K.S. 2006. When mama can‟t read: counteracting intergenerational low-literacy. The
reading teacher, 59(7):698-702.
Cowburn, G. & Stockley, L. 2005. Consumer understanding and use of nutrition labelling: a
systematic review. Public health nutrition, 8(1):21-28.
Faber, M. & Wenhold, F. 2007. Nutrition in contemporary South Africa. Water SA, 33(3):393-
400.
Gau, R. & Viswanathan, M. 2008. The retail shopping experience for low-literate consumers.
Journal of research for consumers, 15. http://www.Jrconsumers.com/data/page/5882/Low_
literate_consumers_academic_final3.pdf. Date of access: 6 March 2013.
Hamilton, K. & Catterall, M. 2008. I can do it: Consumer coping and poverty. Advances in
consumer research, 35:551-556.
Hess, R., Visschers, V.H. & Siegrist, M. 2011. The role of health-related, motivational and
sociodemographic aspects in predicting food label use: a comprehensive study. Public health
nutrition, 15(3):407-414.

20
Howard, P.H. & Allen, P. 2006. Beyond organic: consumers interest in new labeling schemes
in the central coast of California. International journal of consumer studies, 30(5):439-451.
Jacobs, S.A., de Beer, H. & Larney, M. 2010. Adults‟ consumers‟ understanding and use of
information on food labels: a study among consumers living in Potchefstroom and Klerksdorp
regions, South Africa. Public health nutrition, 14(3):510-522.
Jay, M. Adams, M., Herring, S.J., Gillespie, C., Ark, T., Feldman, H., Jones, V., Zabar, S.,
Stevens, D. & Kalet, A. 2009. A randomized trial of a brief multimedia intervention to improve
comprehension of food labels. Preventative medicine, 48(1):25-31.
Kehler, J. 2013. Women and poverty: the South African experience. Journal of international
women's studies, 3(1):41-53.
Kempen, E., Bosman, M., Bouwer, C., Klein, R. & Van der Merwe, D. 2011. An exploration of
the influence of food labels on South African consumers‟ purchasing behaviour. International
journal of consumer studies, 35(1):69-78.
Kimani-Murage, E.W., Kahn, K., Pettifor, J.M., Tollman, S.M., Dunger, D.B., Gomez-Olive, X.F.
& Norris, S.A. 2010. The prevalence of stunting, overweight and obesity and metabolic disease
risk in rural South African children. BMC public health, 10(1):158-170.
Kimani-Murage, E. W., Pettifor, J. M., Tollman, S. M., Klipstein-Grobusch, K. & Norris, S. A.
2011. Predictors of adolescent weight status and central obesity in rural South Africa. Public
health nutrition, 14(6):1114-1122.
Kirsch, I. & Guthrie, J.T. 1977. The concept and measurement of functional literacy. Reading
research quarterly, 13(4):485-507.
Krishna, A. 2006. Pathways into and out of poverty in 36 villages of Andhra Pradesh, India.
World development, 34(2):271–288.
Kunda, M. & Goel, A.K. 2008. How thinking in pictures can explain many characteristic
behaviors of autism development and learning, 304-309. http://ieeexplore.ieee.org/xpls/abs_
mall.jsp?arnumber=4640847&tag=1. Date of access: 3 May 2013.
Labadarios, D., Steyn, N. P., Mgijima, C. & Daldla, N. 2005. Review of the South African
nutrition policy 1994-2002 and targets for 2007: achievements and challenges. Nutrition,
21(1):100-108.

21
Lazarus, R.S. & Folkman, S. 1984. Stress, appraisal and coping. New York: Spring publishing
company.
Lewis, J. E., Arheart, K. L., LeBlanc, W. G., Fleming, L. E., Lee, D. J., Davila, E. P., Caban-
Martinez, A.J., Dietz, N.A., McCollister, K.E., Bandiera, F.C. & Clark, J. D. 2009. Food label
use and awareness of nutritional information and recommendations among persons with
chronic disease. The American journal of clinical nutrition, 90(5):1351-1357.
Mackey, M.A. & Metz, M. 2009. Ease of reading of mandatory information on Canadian food
product labels. International journal of consumer studies, 33(4):369-381.
Maplandia. 2005. Valspan map – satellite images of Valspan. http://www.maplandia.com/so
uth-africa/northern-cape/hartswater/valspan/. Date of access: 7 March 2014.
Mårtensson, L. & Hensing, G. 2012. Health literacy–a heterogeneous phenomenon: a
literature review. Scandinavian journal of caring sciences, 26(1):151-160.
Maubach, N., Hoek, J. & McCreanor, T. 2009. An exploration of parents‟ purchasing
behaviour. Appetite, 53(3):297-302.
Ntiri, D.W. 2009. Toward a functional and culturally salient definition of literacy. Adult basic
education and literacy journal, 3(2):97-104.
Nutbeam, D. 2008. The evolving concept of health literacy. Social science and medicine,
67(12):2072-2078.
Ozanne, J.L., Adkins, N.R. & Sandlin, J.A. 2005. Shopping [for] power: how adult literacy
learners negotiate the marketplace. Adult education quarterly, 55(4):251-268.
Pappas, G., Agha, A., Rafique, G., Khan, K. S., Badruddin, S. H. & Peermohamed, H. 2008.
Community-based approaches to combating malnutrition and poor education among girls in
resource-poor settings: report of a large scale intervention in Pakistan. Rural and remote
health, 8(3):820.
Peters‐Texeira, A. & Badrie, N. 2005. Consumers‟ perception of food packaging in Trinidad,
West Indies and its related impact on food choices. International journal of consumer studies,
29(6):508-514.
Pigone, M., DeWalt, D.A., Sheridan, M.D., Berkman, N. & Lohr, K.N. 2004. Interventions to
improve health outcomes for patients with low-literacy. Journal of general international
medicine, 20(2):185-192.

22
Posel, D. 2011. Adult literacy rates in South Africa: a comparison of different measures.
Language matters: studies in the languages of Africa, 42(1):39-49.
Prinsloo, N., van der Merwe, D., Bosman, M. & Erasmus, A. 2012. A critical review of the
significance of food labelling during consumer decision-making. Journal of family ecology and
consumer science, 40:83-98.
Public Service Commission. 2008. Report on the evaluation of the national school nutrition
programme (NSNP). http://www.info.gov.za/view/DownloadFileAction?id=88572. Date of
access: 3 June 2013.
Rothman, R. L., Housam, R., Weiss, H., Davis, D., Gregory, R., Gebretsadik, T., Shintani, A. &
Elasy, T.A. 2006. Patient understanding of food labels: the role of literacy and numeracy.
American journal of preventative medicine, 31(5):391-398.
Rousseau, D. 2007. Consumer decision process. (In du Plessis, P.J. & Rousseau, G.G., ed.
Buyer behaviour. Cape Town: Oxford Southern Africa. p. 259-286).
Sabatini, J.P., Sawaki, Y., Shore, J.R. & Scarborough, H.S. 2010. Relationships among
reading skills of adults with low-literacy. Journal of learning disabilities, 43(2):122-138.
Sanlier, N. & Karakus, S.S. 2010. Evaluation of food purchasing behaviour of consumers from
supermarkets. British food journal, 112(2):140-150.
Schiffman, L.G. & Kanuk, L.L. 2010. Consumer Behaviour. 10th ed. New Jersey: Pearson.
Schönfeldt, H.C & Gibson, N. 2010. Food composition data in health communication.
European journal of clinical nutrition, 64:128-133.
Sharf, M., Slea, R., Zentner, G., Shoob, H., Shai, I. & Stein-Zamir, C. 2012. Figuring out food
labels. Young adults‟ understanding of nutritional information presented on food labels is
inadequate. Appetite, 58(2):531-534.
Solomon, M.R. 2011. Consumer behaviour. 9th ed, New Jersey: Pearson.
Sørensen, S.H., Clement, J. & Gabrielsen, G. 2012. Food labels – an exploratory study into
label information and what consumers see and understand. The international review of retail,
distribution and consumer research, 22(1):101-114.
South Africa. 2010. Regulations relating to the labelling and advertising of foodstuffs.
Proclamation no R146, 2010. Government gazette 32975:3-53, 1 March.

23
South Africa. 2012. Integrated Food Security and Nutrition Programme (IFSNP).
http://www.info.gov.za/aboutgovt/programmes/agriculture/food-security.html. Date of access: 3
June 2013.
Sridharan, S. & Viswanathan, M. 2008. Marketing in subsistence marketplaces: consumption
and entrepreneurship in a South Indian context. Journal of consumer marketing, 25(7):455-462.
Statistics South Africa. 2003. Investigations into appropriate definitions of urban and rural
areas for South Africa. http://www.statssa.gov.za/census01/html/UrbanRural.pdf. Date of
access: 11 June 2013.
Statistics South Africa. 2012a. Income and expenditure of households. http://www.statssa.
gov.za/Publications/ statsdownload.asp?PPN=P0100. Date of access: 31 May 2013.
Statistics South Africa. 2012b. Census 2011. http://www.statssa.gov.za/publications/P0 301
4/P030142011.pdf. Date of access: 6 March 2013.
Stedman, L.C. & Kaestle, C.F. 1987. Literacy and reading performance in the United States,
from 1880 to the present. Reading research quarterly, 22(1):8-46.
Steyn, N.P., Bradshaw, D., Norman, R., Joubert, J.D., Schneider, M. & Steyn, K. 2006a.
Dietary changes and the health transition in South Africa: implications for health policy. (In FAO.
2006. The double burden of malnutrition: Case studies from six developing countries. Rome.
FAO. p. 259-304).
Steyn, N. P., Nel, J. H., Nantel, G., Kennedy, G. & Labadarios, D. 2006b. Food variety and
dietary diversity scores in children: are they good indicators of dietary adequacy?. Public Health
Nutrition, 9(5):644-650.
Temple, N. J. & Steyn, N. P. 2011. The cost of a healthy diet: A South African perspective.
Nutrition, 27(5):505-508.
UNESCO. 2006. Understandings of literacy. http://www.unesco.org/education/GMR2006/f ull/
chapt6_eng.pdf. Date of access: 9 April 2013.
UNICEF. 2010. Discussion paper on equity and child rights in South Africa. Presented ,
Pretoria, South Africa, 11-12 October. http://www.google.co.za/#q=UNICEF+sout
h+africa+poverty+rural+2010&oq=UNICEF+south+africa+poverty+rural+2010&gs_l=serp.3...34
49.5048.0.5345.10.10.0.0.0.0.208.1167.4j3j3.10.0...0.0...1c.1.15.serp.5cOuG0C6mvg&bav=on.
2,or.&fp=68ec7c0c1b0b0841&biw=1366&bih=675. Date of access: 31 May 2013.

24
UNICEF. 2012a. South Africa annual report 2011. http://www.unicef.org/southafr
ica/search.php?q=malnutrition&Go.x=0&Go.y=0. Date of access: 31 May 2013.
UNICEF. 2012b. Child rights seminar report 2012. http://www.unicef.org/southafrica
/SAF_resources_childrightssem2012.pdf. Date of access: 2 June 2013.
Van Biljon, W. & Jansen van Rensburg, M. 2011. Branding and packaging design: key insights
on marketing milk to low-income markets in South Africa. African journal of business
management, 5(22):9548-9558.
Van Staden, J. 2012. The use of clothing labels by female black low-literate consumers.
Potchefstroom: NWU. (Thesis – PhD).
Victora, C. G., Adair, L., Fall, C., Hallal, P. C., Martorell, R., Richter, L. & Sachdev, H. S. 2008.
Maternal and child undernutrition: consequences for adult health and human capital. Lancet,
371(9609):340-357.
Viswanathan, M. 2009. Consumer behavior across literacy and resource barriers. (In Wiley
international encyclopedia of marketing, 44(10), Oxford: Wiley-Blackwell. p. 44-54).
Viswanathan, M. & Gau, R. 2005. Functional low-literacy and nutritional education in the
United States: A research based approach to the development of nutrition education materials
for functionally low-literate consumers. Journal of macromarketing, 25(2):187-201.
Viswanathan, M., Gajendiran, S. & Venkatesan, R. 2008. Understanding and enabling
marketplace literacy in subsistence contexts: the development of a consumer and
entrepreneurial literacy educational program in South India. International journal of educational
development, 28(3):300-319.
Viswanathan, M., Hastak, M. & Gau, R. 2009a. Understanding and facilitating the usage of
nutritional labels by low-literate consumers. Journal of public policy and marketing, 28(2):135-
145.
Viswanathan, M., Rosa, J.A. & Edwin Harris, J. 2005. Decision-making and coping of
functionally low-literate consumers and some implications for marketing management.
American marketing association, 69(1):15-31.
Viswanathan, M., Sridharhan, S. & Gau, R. 2009b. Designing marketplace literacy education in
resource constrained contexts: implications for public policy and marketing. Journal of public
policy and marketing, 28(1):85-94.

25
Viswanathan, M., Torelli, C., Yoon, S. & Riemer, H. 2010. “Fish out of water”: understanding
decision-making and coping strategies of English as a second language consumers through a
situational literacy perspective. Journal of consumer marketing, 27(6):524-533.
Vorster, H.H., Venter, C.S., Wissing, M.P. & Margetts, B.M. 2005. The nutrition and health
transition in the North West Province of South Africa : A review of the THUSA (transition and
health during urbanisation of South Africans) study. Public health nutrition, 8(5):480-490.
Wallendorf, M. 2001. Literal literacy. Journal of consumer research, 27(4):505-511.
White, S. 2011. Understanding adult functional literacy: connecting text features, task
demands, and respondent skills. New York: Routledge.
Whitney, E. & Rolfes, S.R. 2008. Understanding nutrition. 11th ed. California: Thompson
Wadsworth.
Yagi, R. 2006. Training and supporting the „volunteers‟: revisiting total literacy campaigns in
India. International journal of educational development, 26(1):67–87.

26
2. CHAPTER 2: LITERATURE REVIEW
2.1 Introduction
South Africa (SA) is a diverse, multicultural and multilingual country (Jacobs et al., 2010:510;
Mubangizi & Mubangizi, 2005:277). The South African population - speaking 11 official
languages - represents a range of wealth and education (Nel et al., 2012:920, Prinsloo et al.,
2012:94). South Africa is a unique country in that the living conditions vary widely, ranging from
wealthy urban suburbs to less developed, poorer rural areas (Schönfeldt & Gibson, 2010:130;
Steyn et al., 2006:259). Consumers in rural areas are predominantly less wealthy than their
urban counterparts and it is common that consumers living in such areas are often classified in
lower socio-economic groups, where both monthly income and literacy levels are low (Howells
et al., 2005:1835; Van Biljon & Jansen van Rensburg, 2011:9549; Vorster et al., 2005: 480)
(Figure 1). In poorer areas, malnutrition is present (Oldewage-Theron & Slabbert, 2008:96),
particularly in rural areas (Faber & Wenhold, 2007:396). People who experience malnutrition are
prone to micro-nutrient deficiencies which may cause health problems, such as physical
underdevelopment (Faber & Wenhold, 2007:393) and poor cognition (Whitney & Rolfes,
2008:606). Therefore, literate or low-literate, urban or rural, wealthy or poor, healthy or
malnourished, South Africans share the common need to make informed food choices (Jacobs
et al., 2010:510).
Food related behaviour fulfils a variety of functions, namely, communicating culturally and
socially acceptable behaviour and values, satisfying nutritional needs and providing emotional
comfort (Whitney & Rolfes, 2008:4). Food purchases, which often comprise the majority of a
household‟s income, are important to consumers‟ physical, social, emotional and cultural well-
being (Prinsloo et al., 2012:94; Schönfeldt & Gibson, 2010:128; Von Braun, 2008:32). Food
labels are a primary source of information that provide product-related information (Campos et
al., 2011:1496; Kempen et al., 2012:20) and, specifically, nutritional information which is
important for consumers when comparing products and making informed, nutritionally
appropriate purchase decisions (Grunert & Wills, 2007:385; Kempen et al., 2012:20). For this
reason, food labels fulfil an integral role in consumers‟ everyday lives. For consumers to be able
to use a food label, a certain level of literacy is required, in order to read and interpret the
information presented (Kumar et al., 2010:314).

27
The term literacy encompasses not only competency in reading and writing (Kirsch & Guthrie,
1977; Posel, 2011:41), but also being able to make mathematical calculations (UNESCO,
2006:155). Due to South Africa‟s unique history, the consequence of the apartheid era is that
many adults experience low levels of literacy (Posel, 2011:39), which can be problematic in a
society where reading and writing form the basis of many everyday tasks. Functional literacy is
the term used to describe the competency of an adult to complete tasks for adequate, everyday
functioning (Kirsch & Guthrie, 1977:488), for example, the use of written information
(Wallendorf, 2001:505), such as the information found on food labels which can be used to
assist in making informed and healthy food related decisions. Despite potential benefits related
to food labels, many consumers do not use food label information provided, and difficultly in
comprehending food label information has been marked as a primary barrier to food label use,
specifically in consumer groups where literacy levels are low (Jay et al., 2009:25).
A definite link between low-literacy and malnutrition has been identified (Nutbeam, 2008:2072)
and, in the past, there have been nutrition interventions, targeting poor and malnourished
consumers. However, such interventions have failed to address the wider causes of
malnutrition, such as social and economic causes (Chapora, 2003:645), which may include a
lack of education and low-literacy in low-income areas. Additionally, previous studies have
focused largely on literate consumers, and research investigating the association between the
use of nutritional information on food products and literacy is almost non-existent (Viswanathan
et al., 2009a:135). It is evident therefore that further food label research should be conducted,
which takes consumers‟ knowledge, preferences and problems experienced into consideration
(Prinsloo et al., 2012:94).
A food label related problem that South African consumers experience is the difficulty in
understanding information on food labels (Jacobs et al., 2010:520; Kempen et al., 2011:70).
Low-literate consumers‟ use and understanding of food labels, as well as their behaviour in the
retail environment (Gau & Viswanathan, 2008; Sabatini et al., 2010:122), specifically in less
wealthy markets (Van Biljon & Jansen van Rensburg, 2011:9548), is limited. It is important to
investigate the food buying behaviour of this group of low-literate consumers, as they contribute
to the larger group of consumers in SA holding much of the purchasing power (Hanushek &
Woessmann, 2008:653). This review of literature aims to encompass all the themes mentioned
in the theoretical framework (Figure 2), in order to illustrate how functionally low-literate
consumers, who live in rural areas, cope with the challenges surrounding daily food purchases,
and further to highlight the importance of literacy, in order to make optimal food choices to

28
prevent malnutrition. Although care was taken to include the most recent research in this area,
some classic sources were also incorporated for comprehensiveness.
Figure 2: Theoretical framework to illustrate the connection between functionally low-literate consumers, food labels and rural areas.
This theoretical framework (Figure 2) serves to orientate the reader to the study. The role of
literacy and food labels, the behaviour of functionally low-literate consumers, the state of literacy
in SA and the measurement thereof, will be addressed in more detail in the literature review.
This review serves to discuss food labels and food label attributes in general, and to investigate
functionally low-literate consumers‟ use of food labels (which include using reading,
FUNCTIONALLY LOW-LITERATE
CONSUMERS
Challenges encountered by
functionally low-literate
consumers and coping
strategies applied.
o Cognitive
o Product related
o Social
o Affective
Cognitive predilections of
functionally low-literate
consumers
o Pictorial thinking
o Concrete thinking
Consumer decision-making
o Types of decisions
FOOD
LABELS LITERACY
Food label attributes
Consumers‟ food label
knowledge
Consumers‟ use of food
labels
o Reading
o Understanding
o Application
Literacy in SA
Causes of low-
literacy in SA
Literacy measured
RURAL AREAS
Rural areas in South
Africa
Vaalharts rural
community
Malnutrition
Low-income consumers

29
understanding and application). In addition to challenges that these consumers may encounter
in the retail setting, the coping strategies they apply to manage (cope with) these challenges, as
well as the cognitive predilections and relevant decision-making approaches of functionally low-
literate consumers, will also be addressed. An overview of rural areas in SA is presented, with
the focus on the Valspan rural community in which the study was conducted. Malnutrition and
low-income consumers are also discussed, as these issues are often associated with rural
areas.
2.2 Literacy
2.2.1 Literacy defined
The term literacy has encompassed the connection between basic reading and writing
competencies (Kirsch & Guthrie, 1977:488; Posel, 2011:41). However, the definition of literacy
no longer involves simply reading and writing, but rather includes information processing and
critical thinking skills required by consumers to function in the modern marketplace
(Ntiri, 2009:98; Wallendorf, 2001:505). Global innovation and development has led to new
literacy spheres, such as financial literacy, media literacy, computer literacy and health literacy
(Ntiri, 2009:98). Furthermore, literacy cannot be isolated from social (Bengtsson & Firat,
2006:375), cultural and political contexts in which it functions (Ntiri, 2009:98). Shared cultural
and social factors differentiate people from different cultures from one another. These values
are often facilitated by language (Rousseau, 2007b:48) and the attitudes and values associated
with reading will affect home, school, work and community literacy, as well as the materials and
practices used to teach others about literacy (Pretorius, 2002:170).
2.2.2 Literacy in South Africa
To be functionally literate is important because of consumers‟ dependence on the use of text
and processing of information (Wallendorf, 2001:505), which allows them to fully participate in
society – both economically and socially (Nutbeam, 2008:2072). Literate consumers are able to
obtain employment, acquire transport and cope with economic necessities (Kirsch & Guthrie,
1977:490) better, and with more control than non-literate consumers (Nutbeam, 2008:2072).
Literacy also ensures that consumers are able to learn facts, encourages the development of
general knowledge and assists in learning certain procedures and related skills (Abdi &
Cleghorn, 2005:7). Such procedures and skills may include those carried out when purchasing

30
food, such as reading food label information, comparing different products and paying for
selected items.
According to the results of the census that took place in 2011, there were approximately 51.8
million consumers living in SA (Statistics South Africa, 2012:14). Of these consumers, 8.6%
adults aged 15 years and older had not received any formal education, while 19.1% had only
completed formal education of Grade 7 or less (Statistics South Africa, 2012:39). This indicates
that, for many South African adults, education and consequent literacy levels are low, which
places SA in a predicament as many adults are not suitably equipped to complete everyday
adult tasks.
Low-literacy levels are found among all racial groups in SA, but significantly more among black
adults (Posel, 2011:40; Statistics South Africa, 2012:39). With regard to the nine provinces in
SA, the Eastern Cape has the highest level of functional low-literacy (26,4%), whilst the
Northern Cape has the third highest functional low-literacy rate at 26% (Statistics South Africa,
2012:39), implying that these provinces may require interventions to improve literacy education
the most. Female consumers exhibit higher percentages of functional low-literacy than males
(Statistics South Africa, 2012:39), which is of importance seeing that in many households,
females are primary caregivers, responsible for household food purchases and preparation
(Lake et al., 2006:483; Patel et al., 2006:39). If a caregiver is unable to read or interpret product
information, such as food label information, it may result in poor decision-making (Wallendorf,
2001:509), substandard food product choices and consequent poor nutrition. The South African
society is multilingual, and to read product information that is mostly provided in English (South
Africa, 2010:15), which is often not the mother tongue for many South Africans (Pretorius,
2002:174), may be difficult for these consumers. Furthermore, consumers‟ attitude or motivation
towards reading will determine the level of motivation they have to read, (Morgan & Fuchs,
2007:177), for example, information on food labels.
2.2.3 Causes of low-literacy in South Africa
The possible causes of low-literacy levels in SA are multi-dimensional. In previously
disadvantaged schools, learning and teaching quality was influenced by factors such as under-
qualified staff and poor infrastructure (Posel, 2011:40). Another issue which has led to current
literacy problems, is the failure of education departments to provide quality services to schools,

31
such as the timely delivering of textbooks (Bornman et al., 2013:26,31). In some South African
schools, text books are a scarce resource and can possibly result in poor reading development
(Van der Berg, 2008:148), and consequent low-literacy levels. The student-teacher ratio can
also be considered a factor leading to low-literacy (Posel, 2011:40), as the average ratio is 31
students to one teacher in schools across SA (UNESCO, 2010). In the past, the ratio was as
high as 41 students to one teacher in black schools in 1989 (Kirlidog & Zeeman, 2011:49),
which is applicable today, as it is the students educated in previous years who represent
functionally low-literate adult consumers today. However, specifically in rural schools, it has
been reported that 60% of rural school teachers teach classes of 46 students or more
(Phurutse, 2005:5). It must be noted that these are average values, and it is probable that there
are and were classes of both smaller and bigger sizes than what the average values suggest.
Additionally, some South African schools still do not have access to electricity (Bornman et al.,
2013:9) and, consequently, light, which may affect the children‟s‟ ability to productively work in
the classroom.
Language is another obstacle that contributed to low-literacy levels in SA. Minimal printed texts
are available in African languages, with English text books and learning material dominating the
market (Setati, 2008:106), resulting, in many cases, that learners are taught in a language
different to the one most frequently spoken at home (Hornberger & Vaish, 2009:305).
Additionally, parents play an important role in assisting their children with homework and
influence their reading abilities too (Law, 2008:41) as some may not be able to assist with
homework involving basic reading, writing and calculations. Moreover, it is often black African
children who are brought up in cultures where an oral language culture is encouraged, where
stories are not read from books but rather passed on from generation to generation by word of
mouth (Pretorius, 2002:190). Culture is important in communicating values, beliefs and customs
to guide consumers to behave in culturally acceptable ways (Schiffman & Kanuk, 2010:366),
and although verbal story-telling may still lead to learning, the lack of exposure to written
content may hinder literacy development.
Many rural, low-income households in SA lack modern sources of energy to provide heat and
light in their homes (Javidi et al., 2013:403). These households, which do not have access to
electricity, may result in homework and reading after dark becoming problematic (Fleisch,
2008:51), which could discourage learners from reading and improving their literacy skills. As a
result of poverty, consumers may be prone to consuming fewer nutritious foods, which makes

32
listening, learning and concentrating challenging (Jansen, 2013:24). Consequently, poverty can
also be considered a contributing factor responsible for low levels of literacy in SA.
2.2.4 Literacy measurement
Literacy can be measured, using level of education, such as the number of school years
completed (Kirsch & Guthrie, 1977:407). In SA, functional literacy has been measured by the
completion of Grade 6 or 7 (Posel, 2011:41). When studying consumers, it is important to
consider that there is no finite demarcation to define consumers as literate or non-literate and
that the connection between low-literacy and literacy, rather, is a continuum (Mårtensson &
Hensing, 2012:156; Stedman & Kaestle, 1987:10). This suggests that level of education should
be used as a guideline to measuring functional literacy and not a concrete measurement. When
considering school qualification as an indicator of functional literacy, almost one fifth of the
population can be regarded as functionally low-literate, as only 19.1% of South Africans 15
years and older completed Grade 7 or lower (Statistic South Africa, 2012:39).
There are several problems associated with the measurement of literacy, using education
levels. Firstly, when using level of education it must also be noted that whilst such measurement
may be applicable to school children, education as a level of measurement may not be suitable
for adults, due to the complex skills required in today‟s society (Dowse et al., 2010:464).
Examples of complex skills may include calculating percentage changes in price and reading
and understanding complex, abstract information found on food labels. Furthermore, this
method of measurement may not necessarily reflect consumers‟ reading and writing abilities, as
many South Africans do not speak English as mother tongue and may obtain literacy skills
outside of formal education (Posel, 2011:41). Another issue associated with the measurement
of consumer literacy, using education level, is that an education attainment does not necessarily
reflect literacy, especially in SA where the quality of education may differ from school to school
(Posel, 2011:40). Furthermore, there is often a variation of consumers‟ individual cognitive
abilities and specific learning skills within each grade at school level (Kirsch & Guthrie,
1977:493), which may make it difficult to classify consumers into groups, using education level
as a primary indicator. Regardless of these issues, literacy in SA is still measured, using the
grade of completed education (Statistics South Africa, 2012:39).

33
2.3 Functionally low-literate consumers
In today‟s shopping environment, consumers are required to complete a variety of activities
before making a purchase. Consumers need to negotiate store floor plans, use labels to select
a suitable product and calculate product prices; this makes simple shopping quite an
intimidating task (Viswanathan et al., 2005:15). Consumers, who are placed in low-literacy
groups, are often only able to read straightforward passages and draw simple deductions from
written text. In most cases, more challenging reading material and complicated terminology is
too difficult for them to process (Jae et al., 2008:441; Sabatini et al., 2010:122). Even
straightforward tasks may cause functionally low-literate consumers to feel as if they are
exerting considerable effort (Wallendorf, 2001:508). Functionally low-literate consumers may
thus struggle to comprehend information found on food labels, as well as make basic
calculations, relative to food labels, and decipher store layouts (Viswanathan et al., 2005:16).
Consequently, functional literacy is of specific importance where consumers are presented with
a variety of product displays, brands and sizes (Viswanathan & Gau, 2005:188) to select from
daily.
Previous studies have proved that consumers with low functional literacy skills take
considerable time to locate and compare products, compared to functionally literate consumers
(Viswanathan et al., 2009a:136). Further research completed by Viswanathan et al. (2009a:136)
shows that processing a single attribute at a time is possible for functionally low-literate
consumers, but relating two attributes (such as product price and size) simultaneously, is more
difficult. This means that functionally low-literate consumers may make decisions grounded on a
single product attribute, such as price, size or expiry date. Additionally, functionally low-literate
consumers may favour reliance on product advertising and packaging to make product choices
(Jae & DelVecchio, 2004:344), without looking at information such as expiry date or nutrition
information. Research into functionally low-literate consumers‟ use of food labels is important,
as food labels educate consumers to ensure they are informed and able to make nutritionally
sound food choices (Wills et al., 2009:102). As functionally low-literate South Africans are a
unique group of consumers, research exploring their use and understanding of food labels and
consequent decision-making behaviour regarding food purchases, is essential in order to assist
them to make better food choices in the future.

34
2.4 Food labels
Food labels serve as a primary source of information to consumers when shopping and a
communication tool between consumers and retailers (Grunert & Wills, 2007:385; Wills et al.,
2009:102,105). As a result, it is of utmost importance that consumers understand the
information provided at the point-of-purchase, as it is often used to guide decision-making
(Cowburn & Stockley, 2005:22).
Many consumers often find it easy to understand simple terms found on food labels, but difficult
to comprehend more complex information (Cowburn & Stockley, 2005:23; Grunert & Wills,
2007:386), such as nutritional information. Consequently, consumers with low-literacy skills may
find it even more challenging to read, understand and apply the information found on food labels
(Jay et al., 2009:25; Rothman et al., 2006:396), when compared to literate consumers, who
perform such tasks with modest effort (Viswanathan et al., 2009a:136). Some consumers
experience food labels as too complicated to use and feel that labels should be refined to
simplify the use, whilst others differ in opinion, believing food labels are useful in aiding
improved food choices (Borra, 2006:1235). For consumers with lower levels of education, food
label information can be perceived as daunting (Prinsloo et al., 2012:87), and for this reason
consumers may choose not to use food labels. The misinterpretation of information or the
decision not to use food labels at all, may disadvantage consumers and effectively cause them
to make suboptimal food related decisions.
2.4.1 Food label information and attributes
Food label attributes include: the physical characteristics (product dimensions, legibility of font
size and style) and label information, which transfers product information, such as the nutritional
information, ingredient list, health and nutrition-related claims, expiry date, country of origin,
allergen information, logos, identification and address of the manufacturer, quality guarantee,
instructions for use, as well as number of servings (Prinsloo et al., 2012:93). Currently, food
labels are regulated in SA and this regulation is important in order to protect consumers
(especially vulnerable groups of consumers, such as low-literate consumers) who do not have
the ability, skills or means to query information (Prinsloo et al., 2012:85) displayed on products.
Labels are to be presented in English and should be both visible and legible (South Africa,
2010:15) on the food product. The following information and attributes are mandatory for food
labels in SA.

35
• The name of the food product (South Africa, 2010:16);
• The name and address of the manufacturer or importer or seller;
• Specific storage conditions;
• The net content of the product;
• The country of origin;
• A best before/ use by or sell by date;
• Instructions describing how the product should be used (South Africa, 2010:17);
• An ingredient list (South Africa, 2010:20);
• Possible allergens used in the product (South Africa, 2010:25);
• Nutritional information (South Africa, 2010:28); and
• Approved health claims (South Africa, 2010:28).
This information is important, as it guides consumers in their decision making and selection
process, specific to their personal preferences and needs (Annunziata et al., 2011:519).
However, this information is rendered useless if consumers cannot interpret it or make use of
the information found on food labels (Dimara & Skuras, 2005:92), which might occur with low-
literate consumers (Prinsloo et al., 2012:91). Therefore, it is imperative that the information
presented on food labels is clear and concise (Annunziata et al, 2011:520), so that all
consumers are able to understand and use the label to make food purchases.
Different consumer groups may find different attributes or information important, and thus pay
special attention to that given attribute. For example, some consumers may consider nutritional
value important (Barreiro-Hurle´ et al., 2008:180), whilst other consumers may be attracted to
energy values (Sharf et al., 2012:533). In a South African-based study, it was found that some
food label nutritional attributes concerning weight and health, such as fat, kilojoules,
carbohydrate and protein content, were of importance (Van der Merwe et al., 2010:14-15).
Some consumers may consider the appearance of a label and specific information, such as
ingredients and price, of importance (Van der Merwe et al., 2010:14), whilst others consider
manufacturing information, such as the expiry date and preparation of food, important (Van der
Merwe et al., 2010:15). Most consumers‟ use (including reading, understanding and application
of food label information to decision-making) is influenced by factors such as age, social class
and interest in health and nutrition (Grunert et al., 2010:276), which affect the attributes in which
consumers are interested.

36
Functionally low-literate consumers may struggle to evaluate more than one product attribute
simultaneously. Although price is not mandatory information that must appear on a food label, it
is often indicated above or below the product, or placed on the product with a sticker and is an
attribute that functionally low-literate consumers often base their purchase decisions on, without
evaluating the other product information or the product as a whole (Viswanathan et al., 2005:19;
Viswanathan, 2009:45). Functionally low-literate consumers also often select the cheapest
product, without comparing the size-price ratio (Viswanathan, 2009:45), which may lead to
selecting products that are lower in value or products that do not optimally fulfil their needs. As
price and nutritional information are both important factors in making food related decisions,
there might be a need for assisting consumers to select the most nutritious product at the best
value price, by using the food label (Jacobs et al., 2010:520).
2.4.2 Consumers‟ use of food labels
For the purpose of this study, the term food label use will include three components, namely,
reading, understanding and application of food label information. Primary reasons that motivate
consumers to use food labels include buying a product for the first time and checking nutritional
information (Kempen et al., 2011:70), the expiry date (Jacobs et al., 2010:520), and ingredient
list (Singla, 2010:90). Additionally, cultural, economic and demographic factors also have an
influence on food label use (Kempen et al., 2011:70). For example, studies have found that
women are primary users of food labels (Cowburn & Stockley, 2005:24; Satia et al., 2005:392),
and that these consumers are of a relatively higher social class (Cowburn & Stockley, 2005:24).
Consumers with greater health awareness are also more likely to use food labels than other
consumer groups (Cowburn & Stockley, 2005:24; Satia et al., 2005:392), and it is these groups
of consumers that read, interpret and evaluate the information found on food labels (Jacobs et
al., 2010:512). The effective use of information can be linked to nutrition-related knowledge and
skills, which may improve consumers‟ productrelated decision-making, and consumers who use
food labels may have a higher tendency to follow a healthier diet (Fitzgerald et al., 2008:964).
2.4.3 Consumers‟ reading of food label information
Academic success is often related to superior reading skills (Logan et al., 2011:124), and
similarly, good food selection can be attributed to consumers‟ ability to successfully read food
labels. Reading is especially important when consumers are required to select from a number of
choices on supermarket shelves, to select nutritional food products (Sanlier & Karakus,

37
2010:144). Therefore, consumers require realistic, trustworthy and applicable nutritional
information in order to make informed food choices (Schönfeldt & Gibson, 2010:132). There are
various potential benefits related to using food labels, such as making healthy dietary choices
(Graham et al., 2012:417), comparing products and selecting products with or without certain
ingredients, and selecting products to follow a specific diet. However, many consumers do not
read to make use of information found on food labels (Jay et al., 2009:25).
Consumers‟ lack of reading and using food label information could be attributed to a number of
reasons discussed below. Information found on food labels is often presented in one language
only, due to size and space constraints (Prinsloo et al., 2012:91), which can be problematic
because SA has 11 official languages and non-English speaking consumers may not
understand the information presented in English. Some consumers may simply find the
information on food labels too difficult to comprehend (Borra, 2006:1235; Cowburn & Stockley,
2005:24; Singla, 2010:90), or they may not have adequate literacy skills to read the label (Jay et
al., 2009:25; Rothman et al., 2006:396). Additionally, in some cases, the size of the letters on
food labels are too small to read (Cowburn & Stockley, 2005:24; Singla, 2010:90). Many
consumers may not be willing to sacrifice their time reading nutrition labels (Cowburn &
Stockley, 2005:24; Drichoutis et al., 2006:2), unless such reading results in a direct benefit to
them, such as guaranteed health improvement. It is therefore important that role players in the
food industry be realistic about consumers‟ reading of food labels (Borra, 2006:1235), so that
food labels can be designed to better suit consumers‟ needs and encourage them to read them.
Research has indicated that interpretational aids (such as pictures and symbols) may be useful
in reading label information (Cowburn & Stockley, 2005:25; Grunet & Wills, 2007:386), and also
in assisting consumers to use the nutritional value on food labels and enabling consumers to
make educated and healthier product selections. Such interpretational aids can be of specific
importance to low-literate consumers, who may avoid relying on labels for information such as
nutrition related information (Viswanathan et al., 2009a:143), possibly because they are unable
to use the information. Alternatively, for consumers to overcome literacy problems that may be
encountered when using food labels, imagery can be used on labels and packaging (Jacobs et
al., 2010:521; Van Biljon & Van Rensburg, 2011:9557).

38
2.4.4 Consumers‟ understanding of food label information
Being able to understand a food label is imperative in order to effectively use food labels and
maximise the benefits that labels can provide (Jacobs et al., 2010:520). Understanding is of
specific importance as low-literate consumers may be able to read simple text but are unable to
read and understand more challenging reading material at a higher level (Sabatini et al.,
2010:122). They are also only able to extract low level deductions from text (Adkins & Ozanne,
2005b:93; Sabatini et al., 2010:122). Furthermore, food label information is better understood by
consumers who have higher education qualifications (Jacobs et al., 2010:519). Consumers‟
successful search for information regarding a product is often dependent on their ability to
perceive and process information (Dimara & Skuras, 2005:92), which may be limited in the case
of low-literate consumers. Consequently, consumers‟ use and interpretation of a food label is
also affected by their knowledge of the information (Prinsloo et al., 2012:91), and therefore
consumers with better food label knowledge or education may use and interpret labels
optimally. Unfortunately, it is has been suggested that it is difficult to introduce initiatives to
teach or assist less educated consumers to better make use of food label information (Prinsloo
et al., 2012:91) and improve their use of food labels.
Consumers‟ degree of understanding of food label information depends largely on their
cognitive ability to read and deduce the meaning of text (Cowburn & Stockley, 2005:22).
Consumers often lack the ability to understand the information presented on food labels
(Schönfeldt & Gibson, 2010:132) and are confused by technical and numerical information
(Cowburn & Stockley, 2005:23). Functionally low-literate consumers may further struggle to
understand abstract information, such as calories and nutritional value (Viswanathan et al.,
2009a:136), and make product related calculations, such as price discounts and cumulative
totals (Viswanathan et al., 2008:303; Viswanathan et al., 2009a:136). Through simplifying the
language used on food labels, low-literate consumers may be able to better evaluate products
(Jae & DelVecchio, 2004:352) and consequently make better choices. In a previous study by
Jay et al. (2009:29), results show that short, interactive interventions that made use of
multimedia were more effective than standard printed government materials, in improving
consumers‟ understanding of food labels. Nutritional information may also be better compared if
the relevant information is summarised on the front on the package (Wills et al., 2009:102), as
consumers are often reluctant to exert considerable effort in searching for information.

39
2.4.5 Consumers‟ application of food label information
Application of information during decision-making is associated with determining how
functionally low-literate consumers use information available to them to make decisions
(Viswanathan et al., 2005:22). It further includes how the information provided (such as price,
brand logos or nutritional tables) may affect their decision-making and post-purchase evaluation
of a product. This is supported by Wills et al. (2009:102), who agree that food labels are a
helpful tool in assisting consumers to make informed decisions and therefore consumers must
be able to easily read, understand and apply information on these labels (Prinsloo et al.,
2012:86), without confusion.
2.5 Cognitive predilections of functionally low-literate consumers
Functionally low-literate consumers demonstrate unique cognitive predilections (Viswanathan et
al., 2005:16) and decision-making styles (Viswanathan et al., 2009a:137), which assist them in
coping and interacting in the marketplace and with other consumers. Low-literate consumers
may practice different cognitive approaches when using information on food labels (Viswanthan
et al., 2009a:137), evident in their use of concrete reasoning and pictorial thinking.
2.5.1 Concrete reasoning
Functionally low-literate consumers reveal concrete reasoning when they use single pieces of
information on which to base a decision, without giving attention to remaining product attributes
(Schiffman & Kanuk, 2010:493; Viswanathan et al., 2005:19; Viswanathan, 2009:45). An
attribute that functionally low-literate consumers commonly focus on is price, as mentioned
before, which often causes a price fixation as a result of concrete reasoning (Viswanathan et al.,
2005:19). This results in minimal or no consideration of the relationship between price and size,
in order to calculate value for money (Schiffman & Kanuk, 2010:493). Concrete reasoning is
further evident when consumers prefer to shop at familiar stores and purchase familiar products,
and learn to use numerical information, such as expiry date and price, without fully
understanding its meaning (Viswanathan, 2009:45). This way of thinking is problematic when
consumers need to draw abstract conclusions from information provided on food labels (such as
the nutritional value of food or terminology, for example, kilojoule values in nutritional tables) to
critically select and pay for products.

40
When low-literate consumers use concrete reasoning to make decisions, trade-offs often take
place. If consumers must choose between two products, it leads to a trade-off, where one
attribute is sacrificed or compromised, for another. Emotional trade-offs occur when consumers
make decisions based on emotions, due to unsuccessful interaction in the marketplace
(Viswanathan et al., 2010:529). For example, some consumers may rather take the risk of
selecting an incorrect, or more expensive product, than asking someone to help them read a
food label and admit their lack of literacy skills and experience related emotions. Emotions,
which consumers might experience, include frustration and anxiety (Gau & Viswanathan, 2008),
which in the case of the functionally low-literate consumers, might be the result of not
understanding food labels, not being able to locate label information, or calculating prices, or
paying for items purchased. Low-literate consumers often struggle to draw logical inferences
and think critically when they have to make purchase decisions (Wallendorf, 2001:505), which
can be attributed to their tendency to reason concretely.
2.5.2 Pictorial thinking
Pictorial thinking can be described as attaching an analogical meaning to information or content
(Kunda & Goel, 2008:305), and is illustrated as low-literate consumers often use information
signals, such as pictures, to process information (Adkins & Ozanne, 2005b: 96; Jae &
DelVecchio, 2004: 343; Viswanathan et al., 2005:21). Functionally low-literate consumers may,
for example, visualise the quantity of a product they may need to buy (Viswanathan et al.,
2009a:136), in relation to the actual product, instead of using the information provided on the
label, such as volume or weight, to select a more accurate product. Additionally, consumers
who make use of pictorial thinking may recall the required ingredients to make a specific dish
and purchase items accordingly. They may also envision the money they have available and
products they desire in pictures, relative to one another in pictures, to be able to determine if
they can afford specific items or not (Viswanathan et al., 2009a:136).
For years, pictures or symbols have been used as an effective tool in communicating important
information, such as road signage, direction boards and other icons (Dowse & Ehlers,
2004:687), which form an integral part of everyday life. An effective method of conveying
information to consumers who struggle with literacy is to make use of visual aids, such as
pictograms (Richler et al., 2012:220). Pictograms convey meaning to a physical object through
resemblance, in order to stimulate consumer imagination and allow consumers to identify and
recall instructions or information, without reading written words (Dowse & Ehlers, 2004:688).

41
This means that consumers attach a literal meaning to a pictorial element, such as pictures,
colour, font or words. By doing so, consumers are able to process visual information and link
such information to a concept, without struggling with text (Viswanathan et al., 2010:527). This
technique is useful for low-literate consumers who may struggle to read large quantities of text.
Functionally low-literate consumers rely on pictures and symbolic information to a high degree
(Schiffman & Kanuk, 2010:493), and also memorise brands as a combination of letters and
images, without reading the brand name as a word (Viswanathan et al., 2009b:3). Therefore,
when a colour or font is altered (on a name, package or signage) confusion is experienced by
functionally low-literate consumers (Viswanathan et al., 2005:21). The result of such thinking is
that consumers may make brand or product comparisons, based on the pictures they see,
rather than reading and using specific product information, such as product weight or actual
price (Schiffman & Kanuk, 2010:493).
Some studies have shown that pictorial thinking may be also advantageous to assist low-literate
consumers in remembering brands (Viswanathan et al., 2009a:136). Brand literacy is described
as the ability of the consumer to engage with a certain brand or brand image, and can be
acquired through consumption of goods, advertising, interaction with other consumers, and
cultural media (Bengtsson & Firat, 2006:375). Brand literacy is important as it has an effect on
consumer consumption processes and the consumer-brand relationship (Bengtsson & Firat,
2006:379), which can encourage or discourage a consumer to purchase a specific brand. Brand
signatures, including brand logo and associated pictures, result in superior brand recall and
familiarity for low-literate consumers (Viswanathan et al., 2009b:91), which may increase
consumer loyalty and purchases of a specific brand. The disadvantage of this type of thinking is
that enhanced brand literacy and loyalty may discourage consumers from exploring other
products and brands, whereby they may exclude themselves from exposure to better quality,
lower priced and more advantageous alternatives.
Pictorial thinking is relative to functionally low-literate consumers as some label concepts, such
as nutritional information, cannot easily be visualised, due to their abstract nature (Viswanathan
et al., 2009a:136). This means that functionally low-literate consumers may experience difficulty
in comprehending nutritional information, expiry dates and other abstract information (Jay et al.,
2009:25; Rothman et al., 2006:396). Functionally low-literate consumers do not function in a

42
symbolic and abstract domain, but rather visually and concretely (Viswanathan et al., 2005:22),
which explains their tendency to pictorial thinking.
2.6 Challenges encountered and coping strategies applied by functionally low-literate
consumers
Purchase encounters are often a stressful activity for functionally low-literate consumers
(Viswanathan et al., 2005:23), that might result in incorrect decisions, or selecting a product or
service of poor quality (Duhachek & Iacobucci, 2005:52). Functionally low-literate consumers,
who do not have the skills and knowledge to function adequately in the marketplace, may
experience several more challenges when interpreting product information and selecting food
products, than the average consumer (Adkins & Ozanne, 2005a:153). When attempting to
process information, difficulties experienced by functionally low-literate consumers include
cognitive risks and high levels of anxiety (Schiffman & Kanuk, 2010:493; Wallendorf, 2001:508),
and are categorised as cognitive, product related, social and affective challenges (Gau &
Viswanathan, 2008).
When consumers cannot act competently, due to their low-literacy skills (Ozanne et al.,
2005:265), they display unique coping behaviour, sometimes in ingenious and creative ways
(Viswanathan et al., 2005:16; Viswanathan, 2009:44). Coping is the term used to describe both
continually transforming behavioural and cognitive endeavours that consumers use to manage
external (store environment) and internal (low-literacy) demands (Lazarus & Folkman,
1984:141), to be able to act as competent consumers whilst maintaining a positive self-identity
when making a purchase (Adkins & Ozanne, 2005b:99; Hamilton & Catterall, 2008:551;
Viswanathan, 2009:46). The coping behaviour can be either emotional, behavioural or task
orientated in nature (Skinner & Zimmer-Gembeck, 2007:123), and therefore different strategies
may be applied by consumers in different situations, which cannot be viewed separately from
one another.
2.6.1 Cognitive challenges and coping strategies
Cognitive learning involves making a decision or solving a problem after processing specific
information (Schiffman & Kanuk, 2010:228), such as reading text or interpreting numbers. A
major cognitive challenge that functionally low-literate consumers may experience is an
overload of information and product choice in a retail store (Gau & Viswanathan, 2008), and

43
consequent inability to process the information and select a product. Additionally, tasks which
may be routine for literate consumers require additional time and effort from functionally low-
literate consumers (Viswanathan et al., 2005:16; Viswanathan, 2009:45). Consumers in this
group may also struggle to complete tasks, such as writing a shopping list and comparing and
checking prices (Viswanathan et al., 2008:303), which may lead to anxiety – especially when
entering a new store (Viswanathan et al., 2005:20). Low-literate consumers may also find it
difficult to locate stores, read in-store signage and locate specific products (Gau & Viswanathan,
2008; Viswanathan et al., 2005:15; Viswanathan, 2009:45). Regarding nutritional information
found on food labels, functionally low-literate consumers are often unable to interpret the
meaning of numerical nutritional terms (Viswanathan et al., 2009a:137). Consequently, there
are a variety of reading, writing and numerical cognitive challenges with which low-literate
consumers are faced.
As a way of coping with the cognitive challenges that shopping poses, low-literate consumers
often depend on others to assist them with shopping tasks (Viswanathan et al., 2010:530).
Some functionally low-literate consumers may plan their shopping visits around the shifts of
store personnel, so that these visits coincide with familiar and helpful store assistants (Ozanne
et al., 2005:259; Viswanathan et al., 2005:23). Similarly, they may rely on family or friends to
assist them whilst shopping (Adkins & Ozanne, 2005a:155), and to help write shopping lists
(Jay & Rohl, 2005:61). Some low-literate consumers are even able to make coded lists to assist
them in remembering to purchase specific products, without having to correctly spell the item
(Adkins & Ozanne, 2005b:97). Functionally low-literate consumers may pay higher prices or
forfeit functional product attributes (Viswanathan & Gau, 2005:189), for example, when buying a
product with poor nutritional value, in order to appear competent. Low-literate consumers are
loyal to trusted and familiar brands (Sridharan & Viswanathan, 2008:457), and this can be
attributed to their tendency to use pictographic thinking, which links images and brands and the
consumer‟s memory (Viswanathan et al., 2009a:136). Another coping strategy that functionally
low-literate consumers may implement to overcome cognitive challenges is to avoid promotions
where percentage price calculations must be made (Viswanathan et al., 2005:24). Furthermore,
some functionally low-literate consumers may hand all of their cash available to cashiers,
trusting that the cashier will return the correct change (Viswanathan & Gau, 2005:189;
Viswanathan et al., 2005:24), in order to avoid making total cost calculations themselves.
Another method of calculating the total cost of products purchased is to round prices up or down
to the closest whole number, then add the total up and compare it to the money available to the
consumer (Adkins & Ozanne, 2005b:98).

44
2.6.2 Product related challenges and coping strategies
Product-related challenges are directly linked to consumers struggling to understand or make
use of various product attributes, and are associated with cognitive challenges as much of the
information that needs to be processed regarding a product requires cognitive thinking
(Schiffman & Kanuk, 2010:228), which makes use of working memory (Welsh et al., 2010:43).
Product-related challenges include the difficulty that consumers experience in comparing
product attributes, such as weight, size and price (Viswanathan et al., 2009a:136), as well as
problems in processing numerical product information, for instance calculating unit prices,
discount prices and price checking at the counter (Gau & Viswanathan, 2008; Viswanathan,
2009:45). Functionally low-literate consumers may also experience that processing written
product information, including unfamiliar brand names and label information, is difficult. This
may lead to misinterpretation of information or using visual cues, such as colours and pictures,
to gather information (Gau & Viswanathan, 2008). Low-literate consumers may also use a single
aspect of nutritional information found on food labels (for example, the presence or absence of
an ingredient) to base decisions on without making their judgment relative to other product
attributes or compared to similar products (Viswanathan et al., 2009a:136). Consumers with
low-literacy skills may find it difficult to apply information (such as nutritional tables and symbols)
found on the food label to their decision-making (Gau & Viswanathan, 2008), and, in some
instances, may fail to cook food correctly (Ozanne et al., 2005:258), as they struggle to read
and understand preparation instructions.
After purchasing a product, few functionally low-literate consumers rationally re-evaluate their
purchases. If a purchase was found unsatisfactory, they often blame someone else
(Viswanathan et al., 2005:26), perhaps not realising that it is due to their low-literacy skills that
they were unsatisfied with the product. This example of post purchase evaluation could cause
the consumer to feel dissatisfied, as their previous expectations of the purchase were
disconfirmed (Schiffman & Kanuk, 2010:498). To cope with product-related challenges,
functionally low-literate consumers may adopt the same type of in-store behaviour as literate
consumers (Viswanathan, 2009:46), so that others may think they are able to function
competently. Another coping strategy low-literate consumers may apply is to evaluate an entire
product, based on one product attribute (Viswanathan & Gau, 2005:189), such as appearance,
price, size, brand name or other information relevant to the food label.

45
2.6.3 Social challenges and coping strategies
Social challenges and coping strategies are linked to inter-consumer relationships and are
driven by emotions, such as belonging and acceptance (Schiffman & Kanuk, 2010:118). Social
challenges that functionally low-literate consumers face include language barriers and difficulty
interacting with other consumers and store personnel. A primary reason for this challenge might
be that information on food labels, advertisements and product related information, are
presented in English, and although this is the primary language to convey product information in
SA (Dowse et al., 2010:465), it is often not the consumer‟s first language (Wallendorf,
2001:507). The result of this language challenge is that consumers may purchase lower quality
goods that they may not actually want, as they cannot effectively read, interpret or communicate
the information available. Furthermore, storekeepers may exploit or cheat consumers (Ozanne
et al., 2005:256; Viswanathan et al., 2008:302), who are unable to act capably, due to social
challenges. Functionally low-literate consumers may also experience fear that their limited
literacy skills will be exposed to other consumers, who might judge them (Ozanne et al.,
2005:256).
Coping strategies that low-literate consumers may apply to cope with social challenges vary.
Functionally low-literate consumers may hide their poor reading and decoding skills with sight
vocabulary (Ozanne et al., 2005:258; Sabatini et al., 2010:129). In other words, these
consumers may not read text, but simply read familiar words based on the appearance of the
word and not the comprehension thereof. This action increases brand loyalty, as consumers
return to favourable and familiar products for repeat purchases (Rousseau, 2007a:272;
Solomon, 2011:360). Poor reading abilities may force some consumers to fake vision problems
by pretending to have forgotten their glasses, standing in an aisle pretending to compare
products or claiming insufficient time to read, and having a headache (Adkins & Ozanne,
2005b:98; Viswanathan et al., 2005:24). These are strategies that functionally low-literate
consumers apply to avoid reading product-related information (Adkins & Ozanne, 2005b:98), in
order to prevent store personnel and other consumers from detecting their inability to read
(Viswanathan et al., 2005:24). Therefore, consumers may rely on friends and family members to
assist them in obtaining product-related information when shopping (Viswanathan & Gau, 2005;
189). Low-literate shoppers may also prefer to visit stores that are smaller and familiar
(Viswanathan et al., 2005: 25), as such stores that may offer a comfortable, non-threatening
environment.

46
2.6.4 Affective challenges and coping strategies
Functional low-literacy can be the cause of emotional stress in consumers (Viswanathan et al.,
2005:16), and is considered an affective challenge. Functionally low-literate consumers, who
experience a poor understanding of product information and encounters with sales personnel,
who may appear hostile, can experience negative emotions (Adkins & Ozanne, 2005b:93; Gau
& Viswanathan, 2008), such as embarrassment and shame (Ozanne et al., 2005:256), anxiety
and decreased self-esteem (Viswanathan et al., 2005:23). In some cases, a stigma may be
attached to functionally low-literate consumers, resulting in the fact that consumers may choose
to accept or fight such a stigma (Adkins & Ozanne, 2005b:96; Gau et al., 2012:1687), which can
also affect the consumer‟s self-esteem.
In order to avoid feelings of humiliation and to protect their self-esteem, functionally low-literate
consumers may make use of trade-offs, by using functional attributes or prices of products
(Viswanathan et al., 2010:525) to justify their decisions. Consumers may pay higher prices or
select products that do not optimally fulfil their needs, to prevent embarrassment. Some
consumers may also leave the store if they are unable to locate a specific product (Viswanathan
et al., 2010:530). Another avoidance coping strategy is to evade any emotionally charged
situation, such as asking someone for help, in order to prevent embarrassment (Viswanathan et
al., 2008:303; Viswanathan et al., 2010:530). In many cases, where purchased goods are
defective or incorrect, consumers may try to give away the product or alternatively retain it in
order to prevent interactions which may leave them feeling misunderstood or which reveal their
lack of knowledge (Viswanathan et al., 2010:530). This post purchase behaviour is important,
as it may encourage consumers to search for an alternative that will better fulfil their needs in
the future (Schiffman & Kanuk, 2010:498).
Low-literate consumers are faced with a variety of task-orientated and emotional challenges on
a daily basis. It is important to note that different coping strategies may be applied by
consumers, to allow them to cope with the retail environment, to make objective purchase
decisions and function effectively as consumers.

47
2.7 The consumer decision-making process
Consumer decision-making is a procedure that occurs on a daily basis (Rousseau, 2007a:259)
and determines which products and services consumers want, buy and use (Cant et al.,
2006:193; Schiffman & Kanuk, 2010:478). It is a cognitive procedure that aims to release
tension caused by an unfulfilled need or problem (Solomon, 2011:337). The decision-making
process usually follows a sequential order, beginning with need recognition, information search,
evaluation of alternatives (pre-purchase decision-making), selection of the product, and
concluding with post purchase evaluation (post-purchase decision-making) (Schiffman & Kanuk,
2010:483). However, the stages in the decision-making process do not necessarily maintain a
chronological order, and therefore consumers are often able to skip stages or engage in any of
the five stages at any time (Cant et al., 2006:193). It must be noted that functionally low-literate
consumers follow unique decision-making processes and may pay minimal attention to some
stages of the decision-making process and, in some cases, even evade some stages
(Viswanathan, 2009:46). In today‟s retail environment, where consumers are faced with self-
service product displays and multiple choices, decision-making for functionally low-literate
consumers is important (Viswanathan & Gau, 2005:188). There are four different types of
characters exhibited during decision-making, which include the economic individual, passive
individual, emotional individual and cognitive individual (Schiffman & Kanuk, 2010:481). These
groups may also use the model differently, according to their priorities and needs. Economic
individuals make rational decisions that have been carefully calculated, based on inclusive
education. Passive individuals act impulsively and irrationally, as these consumers are not very
knowledgeable and can easily be manipulated by marketers (Schiffman & Kanuk, 2010:480).
Emotional individuals base their decisions on personal and unreasonable needs (Schiffman &
Kanuk, 2010:482). Consumers placed in the cognitive individual group base their decisions on
information, social groups, attitudes, perceptions and previous personal experiences. This type
of consumer will make use of all the evaluation criteria and will seek additional information
before making a decision (Schiffman & Kanuk, 2010:481). Low-literate consumers may be at a
disadvantage when having to process information, like economic and cognitive consumers do,
and therefore may be inclined to make passive or emotional decisions.
The first stage in the consumer decision-making process is need or problem recognition, which
commences when consumers realise that they have an unfulfilled need (Rousseau, 2007a:263;
Solomon, 2011:332), and may occur at every stage of the decision-making process (Cant et al.,
2006:196). For many functionally low-literate consumers, just to recognise their need and to

48
locate the product, can be extremely challenging, and they may, after locating the product,
continue directly to the purchase phase (Viswanathan, 2009:46).
Information search and processing is the second stage in the process, whereby consumers
make use of various resources to seek and process information (Solomon, 2011:337).
Consumers choose information relative to their needs, and in harmony with their beliefs and
attitudes (Cant et al., 2006:197; Rousseau, 2007a:267). They may search for information in two
ways: internally and externally. An internal search includes using information stored in a
consumer‟s memory from past experiences and learning (Cant et al., 2006:197; Schiffman &
Kanuk, 2010:485). Examples of such information include past experiences with sales people,
store layout, availability and price of items (Cant et al., 2006:198; Rousseau, 2007a:267), with
price often being the primary determinant for low-literate consumers when making purchases
(Viswanathan, 2009:46). For low-literate consumers, an internal search for information may be
evident in brand loyalty, as a result of familiar images and pictographic thinking (Sridharan &
Viswanathan, 2008:457). External information searches occur when consumers make use of
resources such as family members, reference groups, cultural and social groups, the economy,
advertisements, promotions and sales staff, or other businesses which are external to their own,
to make decisions (Rousseau, 2007a:267). The food label can also be considered as an
external information source, which may influence consumers‟ purchase decisions (Jacobs et al.,
2010:511). Low-literate consumers often rely on family members or friends to assist them with
their shopping activities (Viswanathan & Gau, 2005:189; Viswanathan et al., 2010:530), which is
the exhibition of external information searches during in-store decision-making. It is through the
search and processing of information (external or internal) that consumers learn and become
aware of different brands, stores, prices and consumer services (Cant et al., 2006:197).
The third stage in the consumer decision-making process is the evaluation of alternative
solutions to fulfil the need, identified in stage one (Cant et al., 2006:201). Evaluation involves
assessing and comparing the characteristics of the product, in order to determine the
advantages and disadvantages of each characteristic (Rousseau, 2007a:267; Solomon,
2011:351). Consumers make use of different criteria for different purchase decisions, in
response either to a situation or a specific environment (Schiffman & Kanuk, 2010:490). As
functionally low-literate consumers often rely on concrete reasoning on which to base their
decisions, it can be said that they may apply only one attribute, for example price, to compare
products (Viswanathan, 2009:47).

49
The action part of the consumer decision-making process occurs in the fourth stage, when
consumers make a decision to purchase the product, or not (Cant et al., 2006:202). The
purchase stage involves consumers making the most suitable choice between evaluated
alternatives (Rousseau, 2007a:268). Appropriate selection and decision-making depends on
sufficient information and consumers‟ ability to effectively use the information (Cant et al.,
2006:202), which may not always be the case with low-literate consumers, due to the
challenges they experience when reading and comprehending food label information (Adkins &
Ozanne, 2005a:153; Viswanathan et al., 2005:23) and the difficulty they encounter when
required to complete product related comparisons and calculations (Gau & Viswanathan, 2008;
Viswanathan et al., 2009a:136).
The concluding stage in the decision-making process is post purchase evaluation (Cant et al.,
2006:202). This stage involves the assessment of the performance of the service or product
purchased, in light of the consumers‟ expectations of the product (Rousseau, 2007a:269;
Schiffman & Kanuk, 2010:498). The result of consumers‟ evaluation of a purchased product can
be positive and satisfying, negative and dissatisfying, or neutral and indifferent (Rousseau,
2007a:269). This stage in the decision-making process is of specific importance for future
purchase behaviour. A positive evaluation may result in repeat purchases or increased brand
loyalty. If the product or service was unsatisfactory, consumers may voice their dissatisfaction
by switching to a different brand (Rousseau, 2007a:269; Schiffman & Kanuk, 2010:498). In
extreme cases, functionally low-literate consumers will avoid the entire decision-making process
by simply mimicking the decisions of other consumers, or by entrusting their shopping
responsibilities and decision-making to others (Viswanathan, 2009:46).
2.7.1 Single attribute decision making
It has been found that functionally low-literate consumers may base purchase decisions on a
single product attribute, repeat decisions habitually or make completely random decisions
(Viswanathan & Gau, 2005:189). When consumers make a decision based on a single product
attribute, such as price, ingredient or size, they are applying concrete reasoning to the situation
(Viswanathan et al., 2005:19). Accordingly, functionally low-literate consumers may shop until
their money is finished, without making price or size comparisons. As a result, these consumers
may not have enough food to sustain their household for a month, due to their inability to make
informed purchase decisions (Viswanathan et al., 2005:19), which is especially problematic in
lower income, rural areas where money is scarce. It has also been found that some functionally

50
low-literate consumers attempt to use the size of product packaging to deduce a size-price ratio,
but such calculations were unsuccessful. Consumers in the functionally low-literate group may
also use the presence or absence of a specific ingredient on which to base their decision
(Viswanathan et al., 2009a:136), such as sugar or sodium content (Viswanathan et al.,
2005:20). This type of decision-making contrasts that of functionally literate consumers, who
consider and compare multiple attributes before selecting a product (Viswanathan et al.,
2005:22).
2.7.2 Habitual decision-making
Habitual decisions are made with minimal conscious effort (Solomon, 2011:335) and are the
result of repeat purchases, based on initial product satisfaction (Cant et al., 2006:199;
Rousseau, 2007a:272). This type of decision-making is associated with limited information
search and brand evaluation, and consequent simplified decision-making (Cant et al.,
2006:200). Such purchases are not repeated as a result of complex information processing, but
rather on familiarity (Van Biljon & Jansen van Rensburg, 2011:9551; Viswanathan, 2010:527;
Wallendorf, 2001:508) of a colour, package or logo. Furthermore, some consumers habitually
select the smaller size of every product following the belief that smaller items will be cheaper
(Viswanathan et al., 2005:22). This means consumers are able to ensure product or service
satisfaction, whilst reducing the need to seek information to evaluate a product, service or brand
(Rousseau, 2007a:271).
Habitual decision-making is important for low-literate consumers, as it allows for the consumers
to save time and energy when making purchases. This type of decision making also reduces
risks, which occur when consumers have to make decisions (Wallendorf, 2001:508), and the
outcome or consequence of their decision is uncertain (Schiffman & Kanuk, 2010:201). The
types of risks that consumers may encounter are functional, financial and social. Functional
risks include the possibility that the given product may not perform as well as expected.
Financial risk occurs when the product may not be equal in value to the cost; and social risk
may be present when consumers are uncertain if the product choice will result in social approval
or rejection (Schiffman & Kanuk, 2010:202). Random decision-making may occur when the
consumer may select the first item that meets the eye, be it a planned or unplanned purchase
(Viswanathan et al., 2009a:46).

51
2.8 Low-income consumers
Low-literacy is related to low-income and consumers who are living in lower income areas, are
generally not well educated (Viswanathan, 2009:44; Viswanathan et al., 2005:16). Many low-
income consumers face a variety of challenges that restrict their ability to obtain required goods
and services, apart from common literacy related problems. Such challenges may leave
consumers experiencing a loss of control and alienation from normal consumer culture
(Hamilton & Catterall, 2008:551).
However, previous research has shown that low-income consumers display great skill in
controlling their lives and their immediate environment, to adapt to their financial constraints
(Hamilton & Catterall, 2008:552). These consumers may use strategies such as price
comparisons, discount stores, as well as using products and brands in innovative ways, in order
to cope with their financial circumstances (Hamilton & Catterall, 2008:552). Conversely,
functionally low-literate consumers may be unable to successfully compare product prices and
discounted prices, due to their limited literacy skills. Within the marketplace, low-income
consumers may often have to accept lower quality goods and services, often making use of
second hand products (Hamilton, 2009:545). Many low-income consumers also shop with lists
and a budget (Hamilton, 2009:548); however, for some, list making may be considered difficult
and these consumers may purchase items until their money is spent. Alternatively, those who
are able to make lists might use abbreviations, letters or symbols to denote the product they
want to purchase, for example B = bread (Adkins & Ozanne, 2005b:97). For low-literate
consumers, who struggle with numbers and writing and reading, this adaption technique may
not be applicable.
Socio-economic indicators, such as level of education and employment (Khumalo et al.,
2012:422), are often used to group consumers into different social classes. According to
Mubangizi and Mubangizi (2005:278), there is a noteworthy correlation between standard of
living, and educational attainment, whilst Jansen (2013:24) suggests a connection between
cognitive development and low-income households. Both sources essentially suggest a link
between income and education and, consequently, literacy. Poverty and low-income
households are not bound to any particular race or gender, however are more prevalent among
female-headed households and African consumers (Mubangizi & Mubangizi, 2005:278),
possibly because females earn half or just more than half of what their male counterparts earn
(Statistics South Africa, 2012:41).

52
2.9 Rural areas in South Africa
South Africa is categorised as a developing country of middle income, and the living conditions
for consumers in this country range from wealthy suburbs, to underdeveloped, poor rural areas
(Steyn et al., 2006:259). However, in comparison to other middle income countries, South Africa
also has exceptionally high levels of outright poverty (Altman et al., 2009:345), mostly found in
rural areas where good infrastructure lacks (Shackleton et al., 2007:559) and consequently
access to stores too. Rural areas also have fewer resources when compared to urban
counterparts, setting rural areas in a disadvantaged position (Bonthuys et al., 2011:424). In SA,
approximately 38% of the land is classified as rural (UNESCO, 2010), and as a result,
consumers living in such areas must travel to larger stores to buy groceries and other
household items (Viswanathan et al., 2008:302).
It is common that consumers living in rural areas are often from lower socio-economic groups
and that their literacy levels and monthly income is low (Howells et al., 2005:1835; Van Biljon &
Jansen van Rensburg, 2011:9549; Vorster et al., 2005: 480). Furthermore, consumers in rural
areas in SA tend to be troubled by poor psychological well-being and related problems
(Khumalo et al., 2012: 437). A concerning problem in many poorer South African households is
also the prevalence of HIV/AIDS (Bärnighausen et al., 2010:30; Mabungizi & Mabungizi,
2005:278), which adds to problems in rural areas, as poor households often have to cope with
fewer income-bearing members, as well as higher financial expenses, due to funeral, medical
and additional child care costs (Mabungizi & Mabungizi, 2005:288), resulting in less available
money for basic needs, such as food.
A dependence on locally produced foods is common for consumers in rural areas of SA, and
such foods can often be both scarce and expensive (Kruger et al., 2005:366). These consumers
often eat unfortified starchy foods, such as porridge and maize meal, bread and rice, and
include minimal quantities of animal-based proteins or vegetables in their diet (D‟Haese & Van
Huylenbroeck, 2005:109; Faber & Wenhold, 2007: 396; Kruger et al., 2005:369). The lack of
variety in rural consumers‟ diets could be due to lower income and limited access to stores
(D‟Haese & Van Huylenbroeck, 2005:109; Kruger et al., 2005:373). The consequences of such
a diet are that in many cases micro nutrients, for example: iron, zinc and vitamin A (Faber &
Wenhold, 2007:394) intake is low, which increases the risk of developing multiple micro nutrient
deficiencies and related diseases (Faber & Wenhold, 2007:393; Kruger et al., 2005:372).

53
2.9.1 Stores in rural areas
Lower income households spend approximately 60% of their income on food (Von Braun,
2008:32), which is often more than their urban counterparts (Altman et al., 2009:352).
Consumers in rural areas may face poor quality products sold at high prices and in limited
variety compared to bigger supermarkets (D‟Haese & Van Huylenbroeck, 2005:98). As a result
they may not consume balanced diets or receive adequate nutrition (Subrahmanyan & Gomez-
Arias, 2008:403). There have been initiatives from companies to offer nutritious foods such as
iodised salt (Whitney & Rolfes, 2008:456), high-calcium yoghurt and milk (Whitney & Rolfes,
2008:418) in smaller sizes so that lower income households can afford such products
(Subrahmanyan & Gomez-Arias, 2008:405). This may then allow lower income consumers to
receive nutritional benefits from these products. Consumers in this group also typically buy
groceries and other household items from cash-and-carry wholesalers (Makro and Metro),
retailers (Spar and Pick n Pay) as well as informal spaza stores (Van Biljon & Jansen van
Rensburg, 2011:9549). Vendors, small stores and spaza (Zulu for “hidden”) stores are often the
primary retail outlets in rural communities (D‟Haese & Van Huylenbroeck, 2005:98).
Spaza stores generally stock several basic products in large quantities (D‟Haese & Van
Huylenbroeck, 2005:98), such as cold drinks, cigarettes, candles, maize meal, alcohol, bread
and sugar (Ligthelm, 2005:208). Advantages of spaza stores to consumers living in rural areas
is that such stores are often close to or within walking distance of consumers‟ homes, service
offered is good and friendly with credit extension available, trading hours are often longer than
other stores (Ligthelm, 2005:210) and bargaining with store owners is possible (Viswanathan et
al., 2008: 303). Furthermore, spaza stores, run by home owners, are a unique and successful
way of generating income and alleviating poverty in rural areas (Ligthelm, 2005:212). Spaza
shop store owners benefit as they are able to manage word-of-mouth marketing and personally
handle difficult customer situations (Viswanathan et al., 2008:303). However, good service is
not always experienced by low-literate consumers as some shop owners may try to cheat and
disrespect consumers (Viswanathan et al., 2008:302) who do not have the knowledge or skills
to protect themselves. Further disadvantages of spaza shops are that these stores may have
stock shortages, are prone to be dirty store environments and offer poor product quality in
addition to expensive prices (Beneke, 2010:205; Ligthelm, 2005:210). Spaza stores also do not
stock cheaper, private label brands, due to their location (Beneke, 2010:205).

54
High income, educated consumers are often well informed and knowledgeable about food
products and are generally health conscious (Prinsloo et al., 2012:87). However, in rural
communities income levels are low, while low-literacy rates are high, and these consumers have
limited options regarding education (Viswanathan & Gau, 2005:187). Consumers in these areas
may be regarded as functionally low-literate and may not use food labels to the same degree as
their educated urban counterparts, resulting in fewer healthy food selections. Nevertheless, in
SA, the lower-income groups are generating increasing interest in marketers, due to their brand
loyalty and purchasing power (Van Biljon & Jansen van Rensburg, 2011:9548). As
supermarkets are obtaining a large portion of the food retail share, many retailers need to start
targeting low-income consumers in order to increase their market share of food purchased
(Humphrey, 2007:435), and recognise the collective purchasing power of these consumers
(Guesalaga & Marshall, 2008:413) for basic necessities, such as food, in order to capitalise on
the quantity of basic needs products this target market purchases.
2.9.2 Valspan rural community
Valspan is a rural community, situated on the border of the Northern Cape and the western area
of the North West Province, with approximately 2000-5000 residents (Collins Maps, 2012) but is
officially located in the Northern Cape (Maplandia, 2005). Communities, such as Valspan and
other communities in the area, experience poverty, which is often associated with a low quality
of life (Bonthuys et al., 2011:424). This has several effects on rural development and planning
when living standards and overall health are examined (Bonthuys et al., 2011:424). In this
community, a programme, Lifeplan®, has been developed in order to extend knowledge,
encourage interpersonal skills, promote thinking and planning, as well as motivation and action.
This programme strives to improve the well-being of individuals through health and nutrition
(Bonthuys et al., 2011:423), which has been widely identified in numerous studies as a factor
contributing to well-being (Oldewage-Theron & Egal, 2009:45; Prinsloo et al., 2012:94;
Schönfeldt & Gibson, 2010:128). Food choice can be considered a major factor in consumer
health, and is influenced by information found on food labels, and the association between them
can be considered of importance for the Lifeplan® programme. The Valspan community has a
high unemployment rate, and many community members are seasonal farm workers, which
implies that household incomes are inconsistent, due to the seasonal availability of work and
consequent income.

55
In a needs assessment conducted by Coetzee (2011:17), ten related themes were highlighted
by consumers living in the Vaalharts area, which includes Valspan. Some of the needs included
the need for basic government services, such as birth, death, and passport and identity
document registration. Regarding basic municipal services, results showed that the
communities are concerned about the availability of electricity, running water, draining systems
and waste management (Coetzee, 2011:19). Communities in the Vaalharts area also
experience a need for agricultural knowledge and skills, as well as improved and affordable
grocery stores (Coetzee, 2011:21). This need is typical of rural areas where consumers are
often offered substandard products at inflated prices when compared to larger stores (D‟Haese
& Van Huylenbroeck, 2005:98). With regard to infrastructure, housing is an important issue in
the area, as most houses are overcrowded. Recreational facilities, hospitals and clinics are
desired by most communities in the Vaalharts area, in addition to improved roads and reliable
transport (Coetzee, 2011:21). Improved roads and reliable transport may encourage the
consumers in this region to shop at larger, more affordable stores, as poor infrastructure is
currently a factor preventing them from doing so (Van Biljon & Jansen van Rensburg,
2011:9548).
Education is also an important aspect for the communities living in the Vaalharts area, and
related problems include: high school dropouts; unpaid school fees; minimal tertiary education
opportunities; and lack of parental involvement at schools (Coetzee, 2011:19). It was also noted
that there is a need for reading and writing programmes, especially among the older, low-literate
generations, due to previously limited access to education. Such programmes can uplift the
current illiteracy rates present in the communities (Coetzee, 2011:20; Posel, 2011:39). This
finding is of importance, as it has been suggested that low-literacy and poor socio economic
circumstances can be related to poor health (Nutbeam, 2008:2072). Poverty and high
unemployment rates were also visible throughout the Vaalharts area (Coetzee, 2011:20), which
could be a direct result of poor education.
Clothing and food are two important items that many community members cannot afford to
purchase or produce themselves (Coetzee, 2011:22). In Valspan, 80.7% of respondents
indicated their need for food in the community (Coetzee, 2011:38), and, consequently, a need
for nutrient-dense foods. The consumption of these foods might be encouraged through
informative, consumer-friendly labels, which can also be suitable for consumers with low-literacy
skills. Diet plays a vital role in supporting health and preventing diseases (Singla, 2010:89;
Whitney & Rolfes, 2008:24). Diseases, such as TB, hypertension and HIV/AIDS, are common in

56
the Valspan area (Coetzee, 2011:22), therefore consumers in this area should aim to maintain a
healthy immune system through their diet, to minimise the effects of such diseases. Therefore,
assisting low-literate consumers to use food labels to increase their consumption of nutritious
foods may assist in disease prevention and potentially improve the health status at individual
and community level (Sharf et al., 2012:534).
Lastly, a need for awareness campaigns addressing issues such as HIV/AIDS, nutrition and
exercise, family issues, hypertension, substance abuse, general coping skills and sanitation,
was expressed (Coetzee, 2011:23). This finding shows that issues, such as malnutrition and
nutrient deficiencies, have not been well addressed in Africa (Vorster et al., 2011:430), and the
residents of Valspan seek more information regarding similar nutrition issues (Coetzee,
2011:23). This finding is encouraging, as it shows that these consumers are aware of,
interested in, and willing to improve their nutrition and health status.
2.10 Malnutrition in South Africa
There have been substantial changes in the South African consumer‟s food consumption
patterns over recent decades (Kruger et al., 2005:366). Urbanisation is increasing in SA, and
with this transition the general black population is changing their diet, too. Traditional high
carbohydrate, high fibre diets are changing to refined carbohydrate intake, coupled with a high
animal source protein intake, along with salt and sugar (Schönfeldt & Gibson, 2010:129; Steyn
et al., 2006:268). The prevalence of malnutrition is often higher in rural areas (Faber &
Wenhold, 2007:394) and issues, such as high rates of unemployment, HIV/AIDS morbidity and
mortality, also affect consumers‟ (especially child consumers‟) access to adequate nutrition
(Madhavan & Townsend, 2007:108). Furthermore, and of specific importance to this review of
the literature, is the relationship between low-literacy and poor health (Nutbeam, 2008:2072),
including malnutrition.
Developing countries experience the double burden of malnutrition, illustrated by people who
are overweight and others who are underweight. Malnutrition can be referred to as under and
over nutrition, whereby under nutrition is characterised by insufficient dietary intake with regard
to energy, protein, vitamins and minerals (Altman et al., 2009:350; Whitney & Rolfes, 2008:20).
Results of malnutrition may include stunting and being underweight, which can lead to poor
cognitive development and low educational achievement (Altman et al., 2009:350) in later life,

57
which could, in turn, influence employment (Banerjee et al., 2008:727) and poverty. Over
nutrition is defined as an excess intake of energy or nutrients (Whitney & Rolfes, 2008:20), and
although common in rural SA (Kimani-Murage et al., 2011:1114), will not be the focus of this
study.
In SA, consumers who are under-nourished and, consequently, underweight and stunted, are
susceptible to increased morbidity and mortality (Mamabolo et al., 2005:501). Unemployment
and increased household size are all factors that play a role in the poor nutritional status of
these consumers (Steyn et al., 2005:11). Conversely, consumers who are well nourished
progress quicker and further academically at school (Yamauchi, 2008:679), suggesting
malnutrition might affect literacy levels in SA. Consumers who experience over nutrition may
also experience diabetes and heart-related diseases (Whitney & Rolfes, 2008:20).
Unfortunately, reducing malnutrition and hunger in SA remains a challenge (Oldewage-Theron
& Slabbert, 2008:92). A key factor involved in malnutrition is poor nutritional knowledge, and if
sources of health communication, such as food labels, can be improved, the nutritional status of
South Africans might also improve (Schönfeldt & Gibson, 2010:131). However, if functionally
low-literate consumers cannot understand the information presented on the food labels, such
methods will not be effective in combatting malnutrition in SA.
Previous studies aimed to address issues such as disease, malnutrition, illiteracy and poverty,
in order to promote urban development and national health (Oldewage-Theron & Slabbert,
2008:92), and suggestions for the need for interventions to address malnutrition in SA, were
made (Kimani-Murage et al., 2010:165). These results should be used to conduct future studies
in the field of consumer science and implement possible interventions to combat malnutrition in
South African communities, as healthy food choices are imperative to preventing malnutrition
and promoting consumer well-being (Oldewage-Theron & Egal, 2009:45)
Poverty, malnutrition and infectious disease co-exist (Faber & Wenhold, 2007:393), and a link
between literacy and health is suggested by Wallendorf (2001:509). Chronic diseases, such as
heart disease, hypertension and diabetes, can all be managed with the assistance of reading
food labels and implementing this information in food purchases (Post et al., 2010:631).
Oldewage-Theron and Egal (2009:45) suggest that healthy food choices are imperative to
preventing malnutrition and promoting consumer well-being, whilst Schönfeldt and Gibson

58
(2010:131) suggest that improved and nutritionally rich food products, combined with health
communication, such as food labels, that encourage consumers to make healthier food choices,
may be key to improving consumers‟ nutritional status, not only in SA, but globally.
2.11 Conclusion
It can be said, in conclusion to this literature review, that SA is a country with low-literacy rates
and many functionally low-literate consumers. Functionally low-literate consumers experience a
variety of challenges within the retail environment, some cognitive, others product based, social
or affective in nature. It can also be speculated from available literature that these consumers
might struggle with the reading of food labels. However, functionally low-literate consumers
have developed methods of coping in order to deal with such challenges. Functionally low-
literate consumers generally make use of concrete reasoning and pictorial thinking on which to
base their decisions, and often do not follow the conventional consumer decision-making
process. Currently, many consumers (literate and low-literate) struggle to understand and use
the information available on food labels. Understanding the information on a food label is
important, as many decisions can be based on this information. Food labels may be easier to
understand if important information is summarised on the label.
Valspan is a rural area, situated in the Northern Cape of SA, where low-literacy, low-income and
malnutrition are common problems. In a need assessment completed in the Valspan
community, one of the issues that was revealed was the need for education on health and
nutrition. A food label is one of the most effective communication mediums to convey
information, and thus should be recognised as an integral part of consumer‟s daily life, essential
in assisting consumers to make good, informed food-related decisions.

59
2.12 Reference list
Abdi, A.A. & Cleghorn, A. 2005. Issues in African education: sociological perspectives. New
York: Palgrave Macmillan.
Adkins, N.R. & Ozanne, J.L. 2005a. Critical consumer education: empowering the low-literate
consumer. Journal of macromarketing, 25(2):153-162.
Adkins, N.R. & Ozanne, J.L. 2005b. The low literate consumer. Journal of consumer research,
32(1):93-105.
Altman, M., Hart, T.G.B. & Jacobs, P.T. 2009. Household food security status in South Africa.
Agrekon, 48(4):345-361.
Annunziata, A., Ianuario, S. & Pascale, P. 2011. Consumers' attitudes toward labelling of
ethical products: the case of organic and fair trade products. Journal of food products
marketing, 17(5):518-535.
Banerjee, A., Galiani, S., Levinsohn, J., McLaren, Z. & Woolard, I. 2008. Why has
unemployment risen in the new South Africa? Economics of transition, 16(4):715-740.
Bärnighausen, T., Hosegood, V., Timeaeus, I.M. & Newell, M. 2010. The socioeconomic
determinants of HIV incidence: evidence from a longitudinal, population based study in rural
South Africa. AIDS, 21(7):29-38.
Barrerio-Hurlé, J. & De-Magistris, T. 2008. Using latent classes to determine consumer
heterogeneity in nutritional label valuation. Food economics, 5(3-4):178-193.
Beneke, J. 2010. Consumer perceptions of private label brands within the retail grocery sector
of South Africa. African journal of business management, 4(2):203-220.
Bengtsson, A. & Firat, F.A. 2006. Brand literacy: consumers‟ sense-making of brand
management. Advances in consumer research, 33:375-380.
Bonthuys, A., Botha, K.F.H., Nienaber, A.W., Freeks, F.E. & Kruger, A. 2011. The effect of the
lifeplan programme in the psychological well-being of a rural community in South Africa.
Journal of psychology in Africa, 21(3):423-431.
Bornman, S., Budlender, D., Clarke, Y., Manoek, S., Van der Westhuizen, C. & Watson, J.
2013. The state of the nation, government priorities and women in South Africa. Women‟s legal
centre. http://www.google.co.za/url?sa=t&rct=j&q=&esrc=s&source=web&cd=1&ve
d=0CCoQFjAA&url=http%3A%2F%2Fza.boell.org%2Fsites%2Fdefault%2Ffiles%2Fuploads%2

60
F2013%2F04%2Fsona_2013_wlc.pdf&ei=2CNWU-jUOKXb7AaB3oEw&usg=AFQjC NGo8g8_
qL-sHuU25tDO6na12KbUQQ&sig2=fdOsoDswyBjenONwIIIC_g. Date of access: 18 Match
2014.
Borra, S. 2006. Consumer perspectives on food labels. American journal of clinical nutrition,
83(5):1235.
Campos, S., Doxey, J. & Hammond, D. 2011. Nutrition labels on pre-packaged foods: a
systematic review. Public Health Nutrition, 14(8):1496-1506.
Cant, M.C., Brink, A. & Brijball, S. 2006. Consumer Behaviour. Cape Town: Juta.
Chapora, M. 2003. Risk factors for undernutrition of young children in a rural area of Southern
Africa. Public health nutrition, 6(7):645-652.
Coetzee, H. & Du Toit, I.M. 2011. Research report 2: Needs assessment conducted in the
Vaalharts region, North-West and Northern Cape Provinces, South Africa: a North-West living
labs baseline project. Potchefstroom: NWU, AUTHer Group. (Unpublished).
Collins maps. 2012. Valspan, Northern Cape, Republic of South Africa. http://www.collinsm
aps.com/maps/Republic-of-South-Africa/Northern-Cape/Valspan/P860873.00.aspx. Date of
access: 27 March 2013.
Cowburn, G. & Stockley, L. 2005. Consumer understanding and use of nutrition labelling: a
systematic review. Public health nutrition, 8(1):21-28.
D‟Haese, M. & Van Huylenbroeck, G. 2005. The rise of supermarkets and changing
expenditure patterns of poor rural households: case study in the Transkei area, South Africa.
Food policy, 30(1):97-113.
Dimara, E. & Skuras, D. 2005. Consumer demand for informative labelling of quality food and
drink products: a European Union case study. Journal of consumer marketing, 22(2):90-100.
Dowse, R. & Ehlers, M. 2004. Pictograms for conveying medicine instructions: comprehension
in various South African language groups. South African journal of science, 100(11-12):687-
693.
Dowse, R., Lecoko, L. & Ehlers, M.S. 2010. Applicability of the REALM health literacy test to
an English second-language South African population. Pharmacy world science, 32(4):464-
471.

61
Drichoutis, A., Lazaridis, P. & Nayga, R.M. 2006. Consumers' use of nutritional labels: a review
of research studies and issues. Academy of marketing science review, 2006(9):ii-22.
Duhachek, A. & Iacobucci, D. 2005. Consumer personality and coping: testing rival theories of
process. Journal of consumer psychology, 15(1):52-63.
Faber, M. & Wenhold, F. 2007. Nutrition in contemporary South Africa. Water SA, 33(3):393-
400.
Fitzgerald, N., Damio, G., Segura Perez, S. & Perez-Escamilla, R. 2008. Nutritional
knowledge, food label use, and food intake patterns among Latinas with and without type 2
diabetes. American dietetic association, 108(6):960-967.
Fleisch, B. 2008. Primary education in crisis. Cape Town: Juta.
Gau, R. & Viswanathan, M. 2008. The retail shopping experience for low-literate consumers,
Journal of Research for Consumers, 15. http://www.Jrconsumers.com/data/p
age/5882/Low_literate_consumers_academic_final3.pdf. Date of access 6: March 2013.
Gau, R., Jae, H. & Viswanathan, M. 2012. Studying low literate consumers through
experimental methods: implications for subsistence markets. Journal of business research,
65(12):1683-1691.
Graham, D. J. & Laska, M. N. 2012. Nutrition label use partially mediates the relationship
between attitude toward healthy eating and overall dietary quality among college students.
Journal of the academy of nutrition and dietetics, 112(3):414-418.
Grunert, K.G & Wills, J.M. 2007. A review of European research on consumer response to
nutrition information on food labels. Journal of public health, 15(5):385-399.
Grunert, K.G., Fernández-Celemín, L., Wills, J.M., genannt Bonsmann, S.S & Nureeva, L.
2010. Use and understanding of nutrition information on food labels in six European countries.
Journal of public health, 18(3):261-277.
Guesalaga, R., & Marshall, P. 2008. Purchasing power at the bottom of the pyramid:
differences across geographic regions and income tiers. Journal of consumer marketing,
25(7):413-418.
Hamilton, K & Catterall, M. 2008. I can do it: consumer coping and poverty. Advances in
consumer research, 35:551-556.

62
Hamilton, K. 2009. Low income families: experiences and responses to consumer exclusion.
International journal of sociology, 29(9-10):543-557.
Hanushek, E.A. & Woessmann, L. 2008. The role of cognitive skills in economic development.
Journal of economic literature, 46(3):607-668.
Hornberger, N. & Vaish, V. 2009. Multilingual language policy and school linguistic practice:
globalization and English‐language teaching in India, Singapore and South Africa. Compare,
39(3):305-320.
Howells M.I., Alfstad, T., Victor, D.G., Goldstein, G. & Remme, U. 2005. A model of household
energy services in a low-income rural African village. Energy policy, 33(14):1833-1851.
Humphrey, J. 2007. The supermarket revolution in developing countries: tidal wave or tough
competitive struggle. Journal of economic geography, 7(4):433-450.
Jacobs, S.A., de Beer, H. & Larney, M. 2010. Adults consumers‟ understanding and use of
information on food labels: a study among consumers living in Potchefstroom and Klerksdorp
regions, South Africa. Public health nutrition, 14(3):510-522.
Jae, H. & DelVecchio, D. 2004. Decision making by low-literacy consumers in the presence of
point-of-purchase information. The journal of consumer affairs, 38(2):342-354.
Jae, H., DelVecchio, D.S. & Cowles, D. 2008. Picture-text incongruency in print
advertisements among low- and high-literacy consumers. The journal of consumer affairs,
42(3):439-451.
Jansen, E. 2013. How poverty affects classroom engagement. Faces of poverty, 70(8):24-30.
Javadi, F. S., Rismanchi, B., Sarraf, M., Afshar, O., Saidur, R., Ping, H. W. & Rahim, N. A.
2013. Global policy of rural electrification. Renewable and sustainable energy reviews, 19:
402-416.
Jay, J. & Rohl, M. 2005. Constructing a family literacy program: challenges and successes.
International journal of early childhood, 37(1):57-78.
Jay, M. Adams, M., Herring, S.J., Gillespie, C., Ark, T., Feldman, H., Jones, V., Zabar, S.,
Stevens, D. & Kalet, A. 2009. A randomized trial of a brief multimedia intervention to improve
comprehension of food labels. Preventative medicine, 48(1):25-31.

63
Kempen, E., Bosman, M., Bouwer, C., Klein, R. & van der Merwe, D. 2011. An exploration of
the influence of food labels on South African consumers‟ purchasing behaviour. International
journal of consumer studies, 35(1):69-78.
Kempen, E.L., Muller, H., Symington, E. & Van Eeden, T. 2012. A study of the relationship
between health awareness, lifestyle behaviour and food label usage in Gauteng. South African
journal of clinical nutrition, 25(1):15-21.
Khumalo, I.P., Temane, Q.M. & Wissing, M.P. 2012. Socio demographic variables, general
psychological well-being and the mental health continuum in an African context. Social
indicators research, 105(3):419-442.
Kimani-Murage, E.W., Kahn, K., Pettifor, J.M., Tollman, S.M., Dunger, D.B., Gomez-Olive, X.F.
& Norris, S.A. 2010. The prevalence of stunting, overweight and obesity and metabolic disease
risk in rural South African children. BMC public health, 10(1):158-170.
Kimani-Murage, E. W., Pettifor, J. M., Tollman, S. M., Klipstein-Grobusch, K. & Norris, S. A.
2011. Predictors of adolescent weight status and central obesity in rural South Africa. Public
health nutrition, 14(6):1114-1122.
Kirlidog, M. & Zeeman, M. 2011. Equity in South African higher education after apartheid.
Technology and society magazine, IEEE, 30(1): 47-55.
Kirsch, I. & Guthrie, J.T. 1977. The concept and measurement of functional literacy. Reading
research quarterly, 13(4):485-507.
Kruger, H.S., Kruger, A., Vorster, H.H., Jooste, P.L. & Wolmarans, P. 2005. Urbanization of
Africans in the North West Province is associated with better micro nutrient status: the transition
and health during Urbanization study in South Africa. Nutrition research, 25(4):365-375.
Kumar, D., Sanders, L., Perrin, E. M., Lokker, N., Patterson, B., Gunn, V. & Rothman, R. L.
2010. Parental understanding of infant health information: health literacy, numeracy, and the
Parental Health Literacy Activities Test (PHLAT). Academic pediatrics, 10(5):309-316.
Kunda, M. & Goel, A.K. 2008. How thinking in pictures can explain many characteristic
behaviors of autism. 7th IEEE International Conference on development and learning, 304-309.
http://ieeexplore.ieee.org/xpls/abs_all.jsp?arnumber=4640847&tag=1. Date of access: 3 May
2013.

64
Lake, A.A., Hyland, R.M., Mathers, J.C., Rugg-Gunn, A.J., Wood, C.E. & Adamson, A.J. 2006.
Food shopping and preparation among the 30-somethings: whose job is it? (the ASH30 study).
British food journal, 108(6):475-486.
Law, Y. 2008. The relationship between extrinsic motivation, home literacy, classroom
instructional practices, and reading proficiency in second-grade Chinese children. Research in
education, 80(1):37-51.
Lazarus, R.S. & Folkman, S. 1984. Stress, appraisal and coping. New York: Spring publishing
company.
Ligthelm, A.A. 2005. Informal retailing through home-based spaza micro enterprises: the role
of spaza shops. Development Southern Africa, 22(2):199-214.
Logan, S., Medford, E. & Hughes, N. 2011. The importance of intrinsic motivation for high and
low ability readers‟ reading comprehension performance. Learning and individual differences,
21(1):124-128.
Madhaven, S. & Townsend, N. 2007. The social context of children‟s nutritional status in rural
South Africa. Scandinavian journal of public health, 35(69):107-117.
Mamabolo, R.L., Alberts, M., Steyn, N.P., Delemarre-van de Waal, H. & Levitt, S. 2005.
Prevalence and determinants of stunting and overweight in 3-year-old black South African
children residing in the central region of Limpopo province, South Africa. Public health nutrition,
8(5):501–508.
Maplandia. 2005. Valspan map – satellite images of Valspan. http://www.maplandia.com/so
uth-africa/north ern-cape/hartswater/valspan/. Date of access: 7 March 2014.
Mårtensson, L. & Hensing, G. 2012. Health literacy–a heterogeneous phenomenon: a
literature review. Scandinavian journal of caring sciences, 26(1):151-160.
Morgan, P.L. & Fuchs, D. 2007. Is there a bidirectional relationship between children's reading
skills and reading motivation? Council for exceptional children, 73(2):165-183.
Mubangizi, J.C. & Mubangizi, B.C. 2005. Poverty, human rights law and socio-economic
realities in South Africa. Development Southern Africa, 22(2):277-290.
Nel, J.A., Valchev, V.H., Rothman, S., van de Vijver, F.J.R., Meiring, D. & de Bruin, G.P. 2012.
Exploring the personality structures of the 11 languages of South Africa. Journal of personality,
80(4):915-948.

65
Ntiri, D.W. 2009. Toward a functional and culturally salient definition of literacy. Adult basic
education and literacy journal, 3(2):97-104.
Nutbeam, D. 2008. The evolving concept of health literacy. Social science and medicine,
67(12):2072-2078.
Oldewage-Theron, W.H. & Slabbert, T.J.C. 2008. Impact of food and nutrition interventions on
poverty in an informal settlement in the Vaal region of South Africa. Epidemiological and
nutrition transition, 67(1):91-97.
Oldewage-Theron, W.H. & Egal, A.A. 2009. The evaluation of a nutrition education programme
on the nutrition knowledge of children aged six and seven years. Journal of family ecology and
consumer sciences, 37(1):45-51.
Ozanne, J.L., Adkins, N.R. & Sandlin, J.A. 2005. Shopping [for] power: how adult literacy
learners negotiate the marketplace. Adult education quarterly, 55(4):251-268.
Patel. C.J., Govender, V., Paruk, Z. & Ramgoon, S. 2006. Working mothers: family-work
conflict, job performance and family/work variables. South African journal of industrial
psychology, 32(2):39-45.
Phurutse, M. C. 2005. Factors affecting teaching and learning in South African public schools.
Cape Town: HSRC Press.
Posel, D. 2011. Adult literacy rates in South Africa: a comparison of different measures.
Language matters: studies in the languages of Africa, 42(1):39-49.
Post, R. E., Mainous III, A. G., Diaz, V. A., Matheson, E. M. & Everett, C. J. 2010. Use of the
nutrition facts label in chronic disease management: results from the national health and
nutrition examination Survey. Journal of the American dietetic association, 110(4):628-632.
Pretorius, E.J. 2002. Reading ability and academic performance in South Africa: are we
fiddling while Rome is burning. Language matters: studies in the languages of Africa,
33(1):169-196.
Prinsloo, N., Van der Merwe, D., Bosman, M. & Erasmus, A. 2012. A critical review of the
significance of food labelling during consumer decision making. Journal of family ecology and
consumer science, 40:83-98.

66
Richler, M., Vaillancourt, R., Celetti, S.J., Besancon, L., Arun, K.P. & Sebastien, F. 2012. The
use of pictograms to convey health information regarding side effects and/or indications of
medications. Journal of communication in healthcare, 5(4):220-226.
Rothman, R. L., Housam, R., Weiss, H., Davis, D., Gregory, R., Gebretsadik, T., Shintani, A. &
Elasy, T.A. 2006. Patient understanding of food labels: the role of literacy and numeracy.
American journal of preventative medicine, 31(5):391-398.
Rousseau, D. 2007a. Consumer decision process. (In du Plessis, P.J. & Rousseau, G.G., ed.
Buyer behaviour. Cape Town: Oxford Southern Africa. p. 259-286).
Rousseau, D. 2007b. Cultural influences on buyer behaviour. (In du Plessis, P.J. & Rousseau,
G.G., ed. Buyer behaviour. Cape Town: Oxford Southern Africa. p. 47-67).
Sabatini, J.P., Sawaki, Y., Shore, J.R. & Scarborough, H.S. 2010. Relationships among
reading skills of adults with low literacy. Journal of learning disabilities, 43(2):122-138.
Sanlier, N. & Karakus, S.S. 2010. Evaluation of food purchasing behaviour of consumers from
supermarkets. British food journal, 112(2):140-150.
Satia, J. A., Galanko, J. A. & Neuhouser, M. L. 2005. Food nutrition label use is associated
with demographic, behavioral, and psychosocial factors and dietary intake among African
Americans in North Carolina. Journal of the American dietetic association, 105(3):392-402.
Schiffman, L.G. & Kanuk, L.L. 2010. Consumer Behaviour. 10th ed. New Jersey: Pearson.
Schönfeldt, H.C. & Gibson, N. 2010. Food composition data in health communication.
European journal of clinical nutrition, 64:128-133.
Setati, M. 2008. Access to mathematics versus access to the language of power: the struggle
in multilingual mathematics classrooms. South African journal of education, 28(1):103-116.
Shackleton, C.M., Shackleton, S.E., Buiten, E. & Bird, N. 2007. The importance of dry
woodlands and forests in rural livelihoods and poverty alleviation in South Africa. Food policy
and economics, 9(5):558-577.
Sharf, M., Slea, R., Zentner, G., Shoob, H., Shai, I. & Stein-Zamir, C. 2012. Figuring out food
labels. Young adults‟ understanding of nutritional information presented on food labels is
inadequate. Appetite, 58(2):531-534.
Singla, M. 2010. Usage and understanding of food and nutritional labels among Indian
consumers. British food journal, 112(1):83-92.

67
Skinner, E.A. & Zimmer-Gembeck, M.J. 2007. The development of coping. Annual review of
psychology, 58:119-144.
Solomon, M.R. 2011. Consumer behaviour. 9th ed, New Jersey: Pearson.
South Africa. 2010. Regulations relating to the labelling and advertising of foodstuffs.
(Proclamation no R146, 2010). Government gazette, 32975:3-53, 1 March.
Sridharan, S. & Viswanathan, M. 2008. Marketing in subsistence marketplaces: consumption
and entrepreneurship in a South Indian context. Journal of consumer marketing, 25(7):455-462.
Statistics South Africa. 2012. Census 2011. http://www.statssa.gov.za/publications/P0 301
4/P030142011.pdf. Date of access: 6 March 2013.
Stedman, L.C. & Kaestle, C.F. 1987. Literacy and reading performance in the United States,
from 1880 to the present. Reading research quarterly, 22(1):8-46.
Steyn, N.P., Labadarios, D., Maunder, E., Nel, J. & Lombard, C. 2005. Secondary
anthropometric data analysis of the National Food Consumption Survey in South Africa: the
double burden. Nutrition, 21(1):4–13.
Steyn, N.P., Bradshaw, D., Norman, R., Joubert, J.D., Schneider, M. & Steyn, K. 2006. Dietary
changes and the health transition in South Africa: Implications for health policy. (In Food and
Agricultural organization of the United Nations., ed. The double burden of malnutrition: Case
studies from six developing countries. Rome: FAO food nutrition. p. 259-304).
Subrahmanyan, S. & Gomez-Arias, J.T. 2008. Integrated approach to understanding
consumer behaviour at bottom of pyramid. Journal of consumer marketing, 25(7): 402-412.
UNESCO. 2006. Understandings of literacy. http://www.unesco.org/education/GMR2006/f ull/
chapt6_eng.pdf. Date of access: 9 April 2013.
UNESCO. 2010. General profile South Africa. http://stats.uis.unesco.org/unesco/TableView
er/document.aspx?ReportId=124&IF_Language=en&BR_Country=7100. Date of access: 19
March 2013.
Van Biljon, W. & Jansen van Rensburg, M. 2011. Branding and packaging design: key insights
on marketing milk to low-income markets in South Africa. African journal of business
management, 5(22):9548-9558.
Van der Berg, S. 2008. How effective are poor schools? Poverty and educational outcomes in
South Africa. Studies in educational evaluation, 34(3):145-154.

68
Van der Merwe, D., Kempen, E., Breedt, S. & de Beer, H. 2010. Food choice: student
consumers‟ decision-making process regarding food products with limited label information.
International journal of consumer studies, 34(1):11-18.
Viswanathan, M. 2009. Consumer behavior across literacy and resource barriers. (In Wiley
international encyclopedia of marketing, 44(10), Oxford: Wiley-Blackwell. p. 44-54).
Viswanathan, M. & Gau, R. 2005. Functional illiteracy and nutritional education in the United
States: A research based approach to the development of nutrition education materials for
functionally low-literate consumers. Journal of macromarketing, 25(2):187-201.
Viswanathan, M., Gajendiran, S. & Venkatesan, R. 2008. Understanding and enabling
marketplace literacy in subsistence contexts: the development of a consumer and
entrepreneurial literacy educational program in South India. International journal of educational
development, 28(3):300-319.
Viswanathan, M., Hastak, M. & Gau, R. 2009a. Understanding and facilitating the usage of
nutritional labels by low literate consumers. Journal of public policy and marketing, 28(2):135-
145.
Viswanathan, M., Rosa, J.A. & Edwin Harris, J. 2005. Decision making and coping of
functionally low-literate consumers and some implications for marketing management.
American marketing association, 69(1):15-31.
Viswanathan, M., Torelli, C.J. & Gau, R. 2009b. Understanding the influence of literacy on
consumer memory: the role of pictorial elements. Journal of consumer psychology, 19(3):389-
402.
Viswanathan, M., Torelli, C.J., Yoon, S. & Riemer, H. 2010. “Fish out of water” understanding
decision-making and coping strategies of English as a second language consumers through a
situational literacy perspective. Journal of consumer marketing, 27(6):524-533.
Von Braun, J. 2008. Rising food prices: what should be done? The agriculture economics
society and the European association of agricultural economists, 7(2):31-35.
Vorster, H.H., Kruger, A. & Margetts, B.M. 2011. The nutrition transition in Africa: can it be
steered into a more positive direction? Nutrition, 3(4):429-441.
Vorster, H.H., Venter, C.S., Wissing, M.P. & Margetts, B.M. 2005. The nutrition and health
transition in the North West Province of South Africa :a review of the THUSA (transition and
health during urbanisation of South Africans) study. Public health nutrition, 8(5):480-490.

69
Wallendorf, M. 2001. Literal literacy. Journal of consumer research, 27(4):505-511.
Welsh, J. A., Nix, R. L., Blair, C., Bierman, K. L. & Nelson, K. E. 2010. The development of
cognitive skills and gains in academic school readiness for children from low-income families.
Journal of educational psychology, 102(1): 43.
Whitney, E. & Rolfes, S.R. 2008. Understanding nutrition. 11th ed. California: Thompson
Wadsworth.
Wills, J.M., Schmidt, D.B., Pillo-Blocka, F. & Cairns, B. 2009. Exploring global consumer
attitudes toward nutrition information on food labels. Nutrition reviews, 67(5):102-106.
Yamauchi, F. 2008. Early childhood nutrition, schooling, and sibling inequality in a dynamic
context: evidence from South Africa. Economic development and cultural change, 56(3):657-
682.

70
3. CHAPTER 3: RESEARCH ARTICLE
TITLE
Functionally low-literate consumers’ use of food labels in the rural area of Valspan in the
Northern Cape of South Africa
(Manuscript to be submitted for publication in the International Journal of Emerging Markets)
This article has been written according to the author guidelines for this journal, and is provided
in Annexure 6.

71
Abstract
Purpose – The purpose of the study was to investigate and explore functionally low-literate
consumers living in a rural area of South Africa, and their use of food labels.
Research design, approach and method – Data was collected, using interviewer
administrated questionnaires and purposive criterion sampling. The inclusion criteria for
respondents were that they had to be over 18 years old, living in Valspan, and must have at
least completed between grades 5 and 8 at school.
Main findings – Respondents reported sometimes reading food labels, both in-store and at
home, often by themselves or with the assistance of their children (especially older
respondents). The most popular quality indicators used by respondents were best before date,
brand names and store logos. Seventy two percent of the respondents read simple food label
information, but struggled with more complex aspects such as nutritional aspects of food labels.
A practically significant correlation between literacy and correctly identifying “Complex nutritional
information” was identified. Consumers who were able to understand “Complex nutrition related
information,” also showed a practically significantly, better “Ability to correctly identify food-
related symbols,” and tended to calculate products, “50% off product” prices, correctly.
Practical implications – If marketers and industry role-players are able to make food labels
easy to understand for low-literate consumers, and can provide information to assist low-literate
consumers to make informed purchase decisions and food choices, a situation benefitting both
consumer and company can be created. Role players need to find ways of assisting low-literate
consumers to improve their purchase decisions and experience.
Originality/value – The study is unique as it is the first to focus on variables, such as
low-literate, low-income consumers‟ use of food labels in rural South Africa. Recommendations
provided will enable industry role players to better cater to the needs of low-literate consumers
living in rural areas.
Keywords - Consumer, food label, functionally low-literate, rural, label use
Paper type - Research paper
Acknowledgements: NRF and Food and Beverage SETA for financial support. Disclaimer:
„Any opinion, findings and conclusions or recommendations in this material are those of the
authors, and therefore the NRF does not accept any liability in regard thereto‟.

72
3.1 Introduction and background
A fast growing segment of the world‟s population is consumers living in rural areas of emerging
market countries (Craig and Douglas, 2011). Emerging countries are characterised by high
economic growth rates (Jansson, 2007), and include South Africa (SA) (Ramamurti, 2008). It
has been suggested that key growth potential of emerging markets lies in the large proportion of
lower income consumers living in rural areas, rather than higher income, elite consumers living
in urban areas (Mahajan and Banga, 2006).
The association between low-income and rural areas is apparent in SA, as a total of 69%
of adult consumers living in rural areas live in poverty (UNICEF, 2010). During 2011, the lowest
two quintiles (40%) of South African households received no more than R10 009 per year
(Statistics SA, 2012). Low-income has been linked to low-literacy (Viswanathan, 2009;
Viswanathan et al., 2005), which presents the problem of low-literacy in low-income, rural areas.
The characteristic rural consumer, struggling with low-income and living conditions, has thus led
to significantly different needs and purchasing practices, when compared to urban consumers
(Craig and Douglas, 2011; Schönfeldt and Gibson, 2010).
Budgets are usually restricted for consumers living in rural areas, and selecting a
nutritious product which provides good value for money can be assisted through consulting food
labels, which are the primary link between consumers and products (Sharf et al., 2012).
However, with the prevalence of functional low-literacy currently in SA, reading food labels and
making informed purchase decisions poses challenges to both consumers and industry role
players. Consumers are challenged as they attempt to manage the retail environment as
competent consumers, selecting and paying for products, without drawing unnecessary
attention to their lack of literacy skills. Industry role players are challenged as they discover the
need to adapt their marketing strategy to low-income, rural areas, incorporating factors, such as
literacy levels, into their labelling and marketing mix (Craig and Douglas, 2011).
Lower-income groups are generating increasing interest to marketers in SA, due to the
brand loyalty they exhibit and purchasing power they hold (Van Biljon and Jansen van
Rensburg, 2011). Retailers need to start targeting low-income consumers in order to increase
their market share of food purchased (Humphrey, 2007), and recognise the collective
purchasing power of these consumers (Guesalaga and Marshall, 2008) for basic necessities,
such as food, to capitalise on the quantity of basic needs products that this market purchases.
This study serves to determine how functionally low-literate consumers in rural areas read, use
and apply the information found on food labels to their decision-making, as well as highlight
demographic differences and associations regarding label use.
73
3.2 Literature review
3.2.1 Low-income, rural South Africa
In SA, approximately 38% of the land is classified as rural (UNESCO, 2010), housing
consumers from lower socio-economic groups, whose literacy levels and monthly income is low
(Van Biljon and Jansen van Rensburg, 2011; Vorster et al., 2005). Consumers categorised into
low-income households spend approximately 60% of their income on food (Von Braun, 2008),
often more than their urban counterparts (Altman et al., 2009). Low-income consumers typically
buy groceries from cash-and-carry wholesalers (Makro and Metro), retailers (Spar and Pick n
Pay), and informal spaza stores, which are said often to be the primary retail outlets in rural
communities (D‟Haese and Van Huylenbroeck, 2005). Consumers in this group face a variety of
challenges that restrict their ability to obtain required goods and services; however, research
has shown that they display great skill in controlling their lives and their immediate environment,
to adapt to their financial constraints (Hamilton and Catterall, 2008).
Strategies, such as price comparisons and using products and brands in innovative ways,
in order to cope with financial constraints, are common among low-literate consumers (Hamilton
and Catterall, 2008). For example, they may shop with lists and a budget (Hamilton, 2009),
although list making may be considered difficult, and some prefer to buy items until their money
is spent. Additionally, low-income consumers may accept lower quality goods and services,
often making use of second-hand products (Hamilton, 2009). Valspan is a rural community used
for this study, and is situated in the Northern Cape (Maplandia, 2005). A recent study in this
area indicated that 80.7% of respondents specified their need for food in the community
(Coetzee, 2011), illustrating a clear need for food for these low-income, rural consumers.
3.2.2 Functionally low-literate consumers
Functional literacy can be measured, using level of education, such as the number of school
years completed (Kirsch and Guthrie, 1977) which is grade 6 or 7 in SA (Posel, 2011). There is
no finite demarcation to define consumers as literate or low-literate, and the connection
between low literacy and literacy, rather, is a continuum (Mårtensson and Hensing, 2012;
Stedman and Kaestle, 1987), and therefore level of education should be used as a guideline for
measuring literacy, and not a concrete measurement.
Functional literacy allows consumers to fully participate in society – both economically and
socially (Nutbeam, 2008), and gain employment, acquire transport and cope with economic
necessities (Kirsch and Guthrie, 1977) better and with more control than non-literate consumers
(Nutbeam, 2008). Literacy also promotes the learning of facts and increase of knowledge, while

74
assisting in the learning of procedures and skills (Abdi and Cleghorn, 2005). Such procedures
and skills may include those carried out when purchasing food.
Functionally low-literate consumers may experience several challenges when interpreting
information on food labels and food packaging (Adkins and Ozanne, 2005a; Viswanathan et al.,
2005). These challenges can be regarded as cognitive-, product-, social- and affective-related
(Gau and Viswanathan, 2008). When faced with cognitive challenges, functionally low-literate
consumers may have a tendency to make use of concrete reasoning and pictorial thinking
(Viswanathan, 2009; Viswanathan et al., 2005), when in the retail environment. When resorting
to concrete reasoning, consumers may use single pieces of information on which to base
decisions, without giving attention to remaining product attributes (Viswanathan, 2009). This
means that functionally low-literate consumers may make decisions grounded on a single
product attribute, such as price, size, or expiry date. As low-literate consumers have an
inclination, or tendency, to pictorial thinking, they attach an analogical meaning to information or
content (Kunda and Goel, 2008). Low-literate consumers often use information signals, such as
graphics or pictures, to process information (Adkins and Ozanne, 2005b; Viswanathan et al.,
2005), instead of reading the information. Product-related challenges include aspects involved
in product comparison (Gau and Viswanathan, 2008; Viswanathan et al., 2009), whilst social
and affective-related challenges are similar in that both are related to consumer relationships
(Schiffman and Kanuk, 2010) and emotions (Viswanathan et al., 2005).
3.3 Food labels
Food labels serve as a link between consumer and retailer, while also acting as a primary
source of information when shopping (Grunert and Wills, 2007; Wills et al., 2009).
Consequently, it is essential that consumers understand the information provided at the point-
of-purchase, as this information is often used to guide decision-making (Cowburn and Stockley,
2005). Simple terms found on food labels are often well understood; however, more complex
information is often difficult to comprehend (Cowburn and Stockley, 2005; Grunert and Wills,
2007), even more so for consumers with low-literacy skills, who may find it even more difficult to
read, understand and apply the information found on food labels (Jay et al., 2009). Through the
misinterpretation of information, or inability to comprehend the information found on food labels,
consumers may consequently make poor food-related decisions.
For the purpose of this article, the term „food label use‟ will include three components;
namely, reading, understanding and applying of food label information to decision-making.
Consumers may be motivated to read food labels, especially when buying a product for the first
time, and when checking nutritional information (Kempen et al., 2011), the expiry date (Jacobs

75
et al., 2010), and ingredient list (Singla, 2010). Due to the variety of choices available on
supermarket shelves, reading is especially important, to select nutritional food products (Sanlier
and Karakus, 2010). Pictures, symbols (Cowburn and Stockley, 2005; Grunet and Wills, 2007)
and imagery (Jacobs et al., 2010; Van Biljon and van Rensburg, 2011) may be useful in
conveying the information found on food labels to consumers (Cowburn and Stockley, 2005;
Grunet and Wills, 2007), which may be of specific importance to low-literate consumers who
may avoid relying on labels for information (Viswanathan et al., 2009), possibly because they
are unable to use (read, understand and apply) the information.
Understanding the information on a food label is imperative, in order to effectively use
food labels and maximise the benefits that labels can provide (Jacobs et al., 2010). Cognitive
ability plays an important role in determining the extent to which consumers are able to
understand information found on food labels (Cowburn and Stockley, 2005). For functionally
low-literate consumers, understanding abstract information, such as kilojoules and nutritional
value, may be even more difficult (Viswanathan et al., 2009) than for functionally literate
consumers. It is additionally difficult for low-literate consumers to make product related
calculations, such as price discounts and cumulative totals (Viswanathan et al., 2008;
Viswanathan et al., 2009).
The third component of food label use, application of information during decision-making,
is associated with determining how functionally low-literate consumers use information available
to them to make decisions (Viswanathan et al., 2005), as well as how the information provided
(such as price, brand logos or nutritional tables) may affect their decision-making and post
purchase evaluation of a product.
3.4 Methodology
3.4.1 Research design
A quantitative research approach was used, in order to provide objective statistical results for
the study (Maree and Pietersen, 2010), to provide an indication of the relationship between the
variables that were investigated in the study (Leedy and Ormrod, 2010). A cross-sectional
survey, employing a descriptive design was used.
3.4.2 Ethical considerations
Ethical approval for this study was obtained from the ethics committee of the NWU (NWU-
00040-13-A1). Participation was voluntary, and respondents were able to withdraw from the
process at any time. Verbal consent was also obtained from the respondents, due to difficulties
with reading and writing, and anonymity was assured at all times (Christensen et al., 2011).

76
3.4.3 Sampling
Respondents were recruited by means of a convenience sampling method, namely, purposive
sampling. Respondents completed a basic literacy test, in order to classify their level of literacy,
before completing the food label questionnaire with the field worker. Inclusive criteria for
respondents to fill out the questionnaire included:
Respondents must have been 18 years or older;
Respondents must have been classified as functionally low-literate (by level of
education);
Respondents must have been living in the Valspan rural area.
3.4.4 Data collection
To prevent potential misinterpretation (Leedy and Ormrod, 2010), the questionnaire was
administered through an interviewer-administered approach. Trained field workers who spoke
both English and the local language (Setswana) conducted face-to-face interviews with
respondents in order to ensure that they understood and filled out all the questions of the
questionnaire, as recommended by Christensen et al. (2011) to overcome any literacy-related
problems. The questionnaire was translated and printed in two languages, English (as food
label information is printed in English) and Setswana (as this is the first language of many
potential respondents and field workers in Valspan). After discarding four questionnaires, the
final analysis was completed on 292 questionnaires.
3.5 Measuring instrument
3.5.1 Low-literate consumers‟ literacy assessment
The assessment was designed, using an international literacy survey conducted by Statistics
Canada, as a guideline, and aimed to measure prose and document literacy, numeracy, and
problem solving, as suggested by the published report (Statistics Canada, 2011). The literacy
assessment was also approved by an expert in literacy at the North West University (NWU).

77
3.5.2 Measuring low-literate consumers‟ use of food labels
The relationships between the variables (functionally low-literate consumers, food label use,
and a rural area) were observed and described, using descriptive theory (Bordens and Abbott,
2011). As research investigating the use of food labels by functionally low-literate consumers in
a rural area is relatively scarce, this study has subsequently provided new information and
valuable insight (Babbie, 2010), as an exploratory study (Babbie, 2010; Fouché and De Vos,
2011), focussing on the specific group of functionally low-literate consumers and their use of
food labels. The questionnaire was adapted from two previous questionnaires, which focused
on consumers‟ food label knowledge (Van der Merwe et al., 2012), and black, female low-
literate consumers‟ use of clothing labels (Van Staden, 2012).
The respondents‟ reading of food labels was self-reported, and thus reflects the subjective
opinion of respondents. Respondents were asked questions determining if they had ever
noticed food labels, how frequently they shopped for food and used food labels, and whether
they used the label information in the store, or at their home.
Respondents‟ understanding of food labels was objectively tested, using food label
relevant show cards to test their understanding. Similar show cards were successfully used in a
previous study (Van Staden, 2012), and were adapted to suit this study. Respondents were
asked to correctly identify specific food label information, and make product related calculations.
Respondents‟ application of the information found on food labels to their decision making
(either in-store or at home) was self-reported. Additionally, their tendency to pictographic
thinking was explored, using show cards representing modified brand names or logos, and
asking respondents to correctly identify the brand name or logo, also adapted from Van Staden,
2012.
3.6 Data analysis
The data collected for this study was analysed by the Statistical Consultation Services of the
NWU, Potchefstroom Campus. The statistical package used was the International Business
Machine (IBM) Statistical Package for Social Sciences (SPSS) Statistics Version 20, Release
20.0. Analyses that were applied included: descriptive statistics, T tests, Analysis of Variance
(ANOVA‟s), Spearman‟s rankorder correlation, and two-way frequency tables. A one-way
ANOVA was used to determine the statistical difference at p ≤ 0.05 levels, between
demographic information and label understanding. Practical significance was determined, using
Cohen‟s effect sizes: medium (d = 0.5) and large (d = 0.8) (Ellis and Steyn, 2003), where
practical significance was indicated by large effect sizes and medium effect sizes as an

78
indication of tendencies (Ellis and Steyn, 2003). For this study, d 0.45 and d 0.7 were
interpreted as medium and large effect sizes, respectively.
Statistically significant correlations (p ≤ 0.05) were determined between demographics
and respondents' reading, use and application of food labels to decision-making. Spearman's
correlation coefficients (r-value) vary, and scores of ≥ 0.30 indicate a medium effect size, and ≥
0.45, a large effect size (Ellis and Steyn, 2003). Large effect sizes indicated practical
significance, whilst medium coefficients indicate practically significant tendencies. For the
purpose of this study, r- values ≥ 0.25 were considered as medium effect sizes, and reported.
Bivariate analyses were conducted, including cross tabulations as measures of association
between variables. Cramer‟s V measured the strength of the association between categorical
variables (Field, 2009), where values ≥ 0.25 were considered medium, and ≥ 0.40 were
considered large, and indicated practical significance.
3.7 Results and discussion
The results of this study are presented, according to the objectives of the study.
3.7.1 Demographics
The demographic characteristics of the sample are depicted in Table I. Seventy two percent of
respondents were female. Many low-income households are headed by females (Kumanyika
and Grier, 2006), who were more likely to participate and have a higher likelihood of being low-
literate, compared to males (Statistics SA, 2012). The largest age groups were the 30-39 year
(32%) and 40-49 year (30%) olds, whilst only 12 respondents were 60 years and older. It is
significant that, despite changes to access in education and a focus on improving adult literacy
in SA (Posel, 2011), 21% of the study population were under the age of 30, and still not well
educated. The level of education among respondents was relatively evenly dispersed between
Grades 5 to 8, suggesting that respondents would not exhibit exemplary literacy levels and were
functionally low-literate (Posel, 2011). Almost 60% of the respondents were Setswana, followed
by IsiXhosa (19%) and Afrikaans (12%), which are the primary languages spoken in the
Northern Cape (Statistics SA, 2012). Regarding employment, 44% of respondents were
unemployed, which supports previous research, suggesting high unemployment rates in the
Valspan rural area (Coetzee, 2011), and that low-literate consumers may struggle to obtain
employment in general (Dent, 2007; Dugdale and Clark, 2008). Regarding respondents‟
monthly income, 33% received R500 (± US$50) or less, whilst 13% received more than R2000
(± US$200), which is significant as a connection between low-income and low-literacy has also
been identified in previous studies (Van Biljon and Jansen van Rensburg, 2011; Vorster et al.,
2005). Half of the respondents were never married, whilst 29% indicated they were married.

79
Over 80% of respondents had between one and three children living in their household, whilst
fewer than 10% of respondents cared for 5 or more children.
Table I: Demographic distribution of the sample
Demographic characteristics Total number of respondents (n)
Percentage of total sample (% of n)
Gender (n = 283) Male 80 28 Female 203 72 Age (n = 288) 18-29 60 21 30-39 92 32 40-49 87 30 50-59 37 13 60+ 12 4 Grade (n = 288) Grade 5 73 25 Grade 6 72 25 Grade 7 82 29 Grade 8 61 21 Primary household language (n = 283)
999
Afrikaans 35 12 English 7 3 Setswana 166 59 IsiXhosa 53 19 IsiZulu 4 1 Sesotho 18 6 Employment (n = 286) Unemployed 127 44 Cleaner 32 11 Domestic worker 52 18 Salesperson 19 7 Farmer 16 6 Pensioner 29 10 Teacher 11 4 Income (n = 284) Less than R500 94 33 R501-R1000 90 32 R1001-R2000 62 22 More than R2000 38 13 Marital status (n = 287) Never married 143 50 Married 84 29 Cohabiting 46 16 Divorced 6 2 Widowed 8 3 Number of children living in household (n = 283)
1-3 231 81 4 33 12 5+ 19 7

80
3.7.2 Respondents‟ literacy levels assessment
Factor analysis was performed on the literacy assessment, and a medium Kaiser Meyer Olkin
(KMO) value of 0.69, was obtained (Hutcheson and Sofroniou, 1999). The extracted factors
were able to explain 52.02% of the variance in the data, accounting for over half the spread.
The range of communalities from 0.38 to 0.75 suggests the factors represent different
proportions of common variance (Field, 2009). Four factors were extracted, which explain four
different types of literacy and included: “Comparison literacy”, “Comprehension literacy”,
“Numerical addition literacy” and “Higher order thinking/ application literacy”.
The Chronbach alpha coefficient, however, proved to be unreliable for the factor “Higher
order thinking/ application literacy”. Therefore, the reliability analysis was done for only one
literacy score, with one item, “Michael wants to buy coffee. However, he is uncertain as to which
tin will provide him the best value of money. Help Michael by selecting the best value for money
coffee tin.” omitted and analysed separately. This item, which was viewed individually, related to
the respondents‟ ability to compare two products and decide which would provide the best value
for money. In total, 62% of respondents answered this question correctly, indicating a good
general understanding of price comparison. A Chronbach alpha value of 0.63 was calculated,
using the remaining items, which was considered reliable as a psychological construct (literacy)
was being measured, in which case values ≤ 0.7 are acceptable (Kline, 1999).
The remaining items grouped together, using factor analysis, was named „Literacy‟. This
literacy assessment was used to assess the respondents‟ literacy levels, in addition to their
school qualification, to determine their functional literacy in the food marketplace. No
respondent answered every question in the literacy assessment correctly (mean = 79% correct),
which, when used in conjunction with education level, confirmed that all respondents were
functionally low-literate and met the inclusion criterion for this study.
3.7.3 Functionally low-literate consumers‟ use of food labels
3.7.3.1 Functionally low-literate consumers‟ reading of food labels
The majority of respondents shopped for food once a month (70%), whilst only a few (4%)
shopped weekly. When shopping, 66% of the respondents reported noticing food label
information on food products, and 67% indicated that they sometimes used food labels, implying
that one third of the study population did not notice or use food labels. With regard to reading
labels, 15% of respondents never read labels in-store and 18% never read labels at home.
Respondents were not objectively tested to see if they read labels and thus results reflect their
subjective responses. Respondents, who confirmed that they do read food labels, where

81
1=often; 2=sometimes; 3=never, were inclined to sometimes reading labels in store (mean =
1.69; SD ± .72), and at home (mean = 1.76; SD ± .74).
Consumers who are unable to read food labels, but still require food label information,
may use different resources to assist them to read labels and act as capable consumers when
making a purchase, as summarised in Table II and confirmed by Hamilton and Catterall (2008),
as well as Viswanathan (2009).
Table II: Different resources used to read food labels
People assisting with food label reading
(n) Often (%)
Sometimes (%)
Never (%)
Mean SD
Respondent self 260 72.3 18.1 9.2 1.38 .67 Child 216 54.6 25.0 20.4 1.66 .80 Family member 198 37.4 48.0 14.6 1.77 .69 Store assistant 201 25.4 34.8 39.8 2.14 .80 Friend 196 13.3 49.5 37.2 2.24 .67
SD = standard deviation
Often=1; Sometimes=2; Never=3
Results are ranked from highest to lowest, using “Often”
Regarding label reading, most respondents indicated that they often (72.3%) read labels
themselves, while more than half often (54.4%) asked their children for assistance when reading
food labels. Results confirm previous research, suggesting that low-literate consumers rely on
family members for assistance in reading tasks (Adkins and Ozanne, 2005b). Respondents did
not make use of the help of store assistants (39.8%) or friends (37.2%), as functional low-
literacy is often the cause of emotional stress for consumers (Viswanathan et al., 2005), linked
to humiliation and shame (Ozanne et al., 2005), which may occur when their literacy skills are
exposed through asking for assistance.
The results indicated problems that may often be reasons why functionally low-literate
respondents did not read food labels, which are presented in Table III. Previous research shows
that consumers experience label related problems, specifically with nutrition terms, technical
terms and calculations (Grunert and Wills, 2007).

82
Problems with food labels
(n) Often (%)
Sometimes
(%)
Never (%)
Mean SD
Words too small to read
262 48.9 34.7 16.4 1.68 .74
Too many words on label
260 43.5 42.3 14.2 1.71 .70
Take too much time to read
268 39.6 43.7 16.8 1.77 .72 Labels are not
important 247 33.2 33.6 33.2 2.00 .82
Do not trust labels 242 31.4 40.9 27.7 1.96 .77 Table III: Reasons for not reading food labels
Do not understand words
259 29.3 44.0 26.6 1.97 .75
Do not read food labels
241 26.1 39.4 34.4 2.08 .78
Cannot find information
239 18.4 43.1 38.5 2.20 .73
SD = standard deviation
Often=1; Sometimes=2; Never=3
Results are ranked, from highest to lowest, according to “Often”
The main problem often experienced by almost 50% of respondents was that the words were
too small to read, consistent with previous research (Cowburn and Stockley, 2005; Singla,
2010). On average, 18-49% of respondents reported often experiencing various problems
regarding food labels, indicating that food labels are not necessarily consumer friendly to low-
literate respondents.
3.7.3.2 Functionally low-literate consumers‟ understanding of food labels
Regarding low-literate respondents‟ ability to understand food label information, two reliable
factors, “Simple, obvious information” and “Complex nutrition-related information,” were
extracted (Table IV). The KMO score of 0.72 was considered good (Hutcheson and Sofroniou,
1999), and an acceptable variance of 59.61% explained the data spread. The question
regarding the specific vitamin on the product label had a communality of 0.16, and did not fall
into the acceptable range, suggesting minimal variance was explained for this item within the
factor (Field, 2009). The item was, however, not omitted from the factor analysis since it made
theoretically sense to include it, and since the whole factor analysis pattern made sense. The
remaining range in communalities was 0.47 to 0.80, suggesting that variables in these factors
were acceptable (Hair et al., 1998). However, in the average score, each item had equal weight
and therefore this limitation did not have any consequences. A Chronbach alpha score of ≤ 0.7
is acceptable when testing cognitive thinking (Kline, 1999), and thus the value of 0.63 is

83
acceptable. Respondents‟ responses to the question were interpreted as Wrong = 0; Correct =
1.
Item
Factor loading
Table IV: Summary of exploratory factor analysis of respondents’ understanding of food labels (N = 292)
1 – Simple, obvious information
2 –Complex nutrition related information
What vitamin is in the maize? 0.39
What is the best before date? 0.77
What is the brand of the maize? 0.68
What is the weight of the product? 0.82
How many kilojoules are in 100g of this food? 0.85
How much fat is in 100g of this food? 0.90
How much dietary fibre is in 100g of this food? 0.89
Range of communalities 0.42-0.67 0.16-0.80
Chronbach alpha coefficient 0.62 0.72
Mean factor score ± SD 81.85 ±29.01 25.0 ±27.34
Total variance explained by extracted sub-factors (%) 59.61
KMO 0.72
SD = standard deviation
The factor “Simple obvious information” rendered a mean factor score of 81.85%, indicating that
the information was correctly identified by the majority of respondents. Results may suggest that
respondents have been exposed to this type of information as it was well understood.
Concerning “Complex nutrition related information”, the mean factor score was 25%. The
respondent‟s ability to correctly identify the vitamin in the product was an exception, probably
since the word vitamin was indicated on the label, and 63% were able to identify the vitamin
correctly. Furthermore, only 25% of respondents could correctly identify kilojoules, fat, and fibre
quantities. This illustrates how low-literate consumers are able to understand simple
information, but struggle to comprehend challenging reading material (Jae et al., 2008; Sabatini
et al., 2010), proven by the overall poor mean factor score. It is evident that low-literate
respondents did not understand (in particular) complex nutrition related food label information.
Without understanding information, it may be difficult to seek the necessary information
(Schiffman and Kanuk, 2010) to make decisions.
When identifying food-related symbols on the label, one factor, “Ability to correctly identify
symbols,” was extracted. Respondents‟ responses to the question were interpreted as Wrong =
0; Correct = 1. The KMO value of 0.74 was considered good (Hutcheson and Sofroniou, 1999).
The variance of 56.34% accounts for the distribution in the data. The communalities found in the

84
data ranged from 0.70 to 0.78, indicating acceptable common variance (Hair et al., 1998), and a
Chronbach alpha value of 0.7 showed acceptable internal reliability (Field, 2009).
A mere 11% of respondents correctly identified food-related symbols according to the
mean factor score, and almost 90% of respondents were therefore unable to identify the
meaning of food label symbols. The item “recycle” was most often correctly identified by 27% of
respondents, possibly due to exposure of recycle symbols on a variety of non-food related
sources, such as paper and plastic. However, 73% of respondents could not correctly identify
this symbol, suggesting that their understanding of food label symbols was poor, although low-
literate consumers tend to use pictorial thinking and often use symbols to process information
(Adkins and Ozanne, 2005b; Jae and DelVecchio, 2004; Viswanathan et al., 2005). Results
propose that it is important to ensure that consumers understand the meaning of the symbols
that are used, before attempting to assist low-literate consumers through use of pictures and
symbols, as the value of using a symbol is lost if its meaning is not effectively conveyed.
3.7.3.3 Low-literate consumers‟ application of food label information during pre- and post-
purchase decision-making
Low-literate respondents ability to identify store information was explored as part of pre-
purchase decision-making by providing altered store logos (colour and shape) to them, and
testing their ability to identify them correctly. Respondents‟ responses to the question were
interpreted as Wrong = 0; Correct = 1. Factor analysis yielded one reliable factor, “Identification
of the stores”. The KMO value of 0.81 was considered exemplary (Hutcheson and Sofroniou,
1999), and 59,12% variance was explained by the factor (data not shown). Communalities
ranged from 0.36-0.74, indicating that the factor shared a variety of common variance between
items. A Chronbach alpha value of .85 was obtained, indicating acceptable internal reliability.
In general, 79% of the respondents could identify the store logos correctly, suggesting
previous exposure to these logos. Pick „n Pay and OK were the best recognised logos, as 83%
and 81% of respondents correctly identified these logos, respectively. Shoprite (73%), Checkers
(74%), Spar (73%), and Choppies (71%), were less well identified, although more than 70% of
respondents identified these logos correctly. Many respondents were able to successfully
identify most store logos after the font and shape had been altered, similar to previous research
in clothing stores (Van Staden, 2012), indicating a strong familiarity with store logos, possibly
due to repeated exposure to the logos, and respondents‟ tendency to use pictorial thinking to
recognise store logos as a picture or shape, and not a word.
During the investigation of respondents‟ application of information on a food label during
pre- and post-purchase decision-making (often = 1; sometime = 2; never =3), 82% reported

85
using the information frequently (often to sometimes) in-store (pre-purchase), whereas 85% of
respondents frequently (often to sometimes) used the information at home (post-purchase).
These results show that these low-literate respondents did not have a preference for using
information in-store or at home, and that they claimed to use this information frequently during
both pre-and post- purchase decision-making. This application of information to decision-making
was, however, not objectively tested, and respondents may have inaccurately reported their use
of food label information, possibly to impress field-workers, hide their lack of use of labels, and
prevent embarrassment (Ozanne et al., 2005).
When completing the numeracy application questions, 95% of the respondents correctly
added the cost of two products. This unexpectedly high frequency could be due to the
calculation being basic. Similarly, 89% could correctly calculate the unit price of a product. Only
one third of respondents could correctly calculate the cost of a product marked “50% off”,
possibly due to the confusing terminology (Gau and Viswanathan, 2008), thus affecting their
ability to correctly interpret and calculate the new cost. A solution to this problem could be to
include pictorial representation of this phrase, which may assist low-literate consumers‟
understanding of the discounted price concept (Adkins and Ozanne, 2005b). The different
techniques that functionally low-literate respondents used to address calculation- related
aspects of shopping were investigated and summarised in Table V.
Table V: Product related calculation techniques displayed by functionally low-literate respondents
Calculation technique (n) Often (%)
Sometimes (%)
Never (%)
Mean SD
Check for enough money in purse
276 75.7 15.9 8.3 1.33 .62
Use cell phone to calculate total price
284 52.5 27.1 20.4 1.70 .79
Pay for food products one at a time 277 42.6 31.8 25.6 1.83 .81
Calculate cost in head 274 34.7 38.0 27.4 1.93 .79
Ask someone to help calculate total price 280 21.4 38.2 40.4 2.19 .76
SD =standard deviation
Often=1; Sometimes=2; Never=3
Results are ranked from highest to lowest, according to “Often”
Numeracy skills and calculation techniques were investigated, using the scale: often = 1;
sometimes = 2 and never = 3. Most respondents often (75.7%) checked to see if there was
enough money in their purse to purchase desired products. The majority preferred not to ask
someone to assist in calculating the cost of two or more products, with 40% reporting that they

86
never ask for help. Using a calculator to add the cost of two or more products was a popular
method used by more than half (52.5%) of the respondents. This illustrates that some low-
literate consumers are often (34.7%) unable to add up multiple numbers in their heads, and are
comfortable using technological devices to assist them in managing retail environments
(Shankar et al., 2010). When this technique is applied, it may be to avoid the shame (Ozanne et
al., 2005) of not having enough money to pay for purchases (Hamilton, 2009). More than 40%
often paid for products, one at a time. This indicates their preference to concretely use one
piece of information (price) at a time, to calculate the total cost (Viswanathan, 2009). Paying for
items one at a time is also a coping strategy used to avoid the embarrassment of asking
someone for help (Viswanathan et al., 2008; Viswanathan et al., 2010).
Quality is an important aspect of food products, and indicates a specific value level
(Verbeke and Roosen, 2009). The brand name and store indicated quality to just fewer than
80% of the respondents, and are commonly used by low-literate consumers as motivation to
buy certain products (Ozanne et al., 2005). Best before date and price were highlighted as
quality indicators by over 90% of respondents, whilst 67% valued appearance of the product as
an indicator, suggesting these attributes are popular motives for purchases (Grunert, 2005;
Verbeke and Roosen, 2009). When using a single quality aspect on which to base a purchase
decision, low-literate respondents also confirmed their tendency to practise concrete thinking.
They refrain from comparing product attributes, and make decisions, using single pieces of
information (Viswanathan, 2009; Viswanathan et al., 2005). Additionally, low-literate consumers
may also develop shortcuts or rules, such as the presence of a useful and relevant quality
indicator, to assist with information overload and make a decision (Bloemer et al., 2009;
Schiffman and Kanuk, 2010), known as heuristics. This was evident in the study, as consumers
who could identify store logos, and also confirmed store logos as an indicator of quality could be
using the store logo as a heuristic to indicate quality.
3.7.4 Demographic differences between low-literate respondents and their use (reading,
understanding and application) of food labels
For the one way ANOVA, the languages were divided into the following groups: English and
Afrikaans, as well as IsiXhosa, IsiZulu, and Sesotho. Setswana was grouped on its own, since,
with Afrikaans and English, it is one of the most spoken languages in the Valspan area. There
was a tendency for English and Afrikaans- speaking respondents to better correctly identify
“Advanced nutrition related information” on the food label (d =.60), than respondents who spoke
Setswana (d =.60) and IsiXhosa, IsiZulu and Sesotho (d =.44). Additionally, English and
Afrikaans- speaking respondents also showed a higher tendency and “Ability to correctly identify
symbols” (d =.44), better than respondents who spoke Setswana, showing a tendency that

87
English and Afrikaans- speaking respondents had a better understanding of food label
information, possibly because food labels are printed primarily in English (South Africa, 2010),
making it easier for English- speaking respondents to understand. Afrikaans- speaking
consumers in SA are often bilingual in English (Deumert, 2005), which could account for their
better understanding of food labels than those speaking Tswana or other African languages.
There was a positive correlation of medium effect size between “Income” and understanding the
“Complex nutrition related information” factor (r = 0.25), suggesting a tendency that higher
income respondents were better able to understand the more difficult aspects of food labels,
possibly due to their tendency to demand more information about food products (Ali and
Kapoor, 2009), and their better knowledge of food products (Du Plessis and Rosseau, 2003)
than their low-income counterparts. Additionally, consumers in lower income groups are less
often targeted by marketing initiatives (Trujillo et al., 2010), and therefore may not be exposed
to more media sources, such as television and magazines, which could account for their poorer
understanding of food labels, than consumers in higher income groups.
Regarding age, older respondents tended to ask their children to assist with reading food
labels, more often than younger respondents (r =-0.30), possibly as a coping strategy. When
low-literate consumers are able to build a trusting relationship with someone who can assist
them with their shopping activities (Adkins and Ozanne, 2005a; Viswanathan and Gau, 2005),
such as their children, they are able to save time and effort (Viswanathan, 2009, Viswanathan et
al., 2005;), and prevent exposing their poor literacy skills (Ozanne et al., 2005). Secondly,
younger respondents tended to use the cell phone calculator to calculate the cost of two or
more products (r = 0.25), more than older respondents, which can be explained by an overall
cell- phone adoption avoidance by older respondents (Auter, 2007).
More cleaners (91%) and pensioners (70%) had a greater tendency to ask their children
to help them read food labels (Cramer‟s V = 0.29), than salespersons (64%), unemployed
respondents (48%), farmworkers (46%), domestic workers (44%) and respondents with other
occupations (17%). Both cleaners and pensioners may approach their children to assist them in
reading food labels as a coping mechanism, primarily because they may be unable to read and
require a reliable resource to help them read food labels (Adkins and Ozanne, 2005b;
Viswanathan et al., 2010), and hide their low literacy skills. Additionally, the small font on food
labels may be difficult for pensioners to read, as older consumers‟ eyesight often deteriorates
with age (Faraldo-García et al., 2012).

88
3.7.5 Associations among demographic variables and use (reading, understanding and
application) of food labels by functionally low-literate respondents
Correlations were determined between literacy levels and the application of literacy skills, when
using food labels. A practically significant correlation (r =0.43) was identified between the
factors “Literacy” and “Complex nutrition related information,” illustrating that respondents with
higher literacy levels had a better understanding of complex nutrition- related information, as
such nutrient and kilojoule quantities. This highlights that respondents with lower literacy levels
did not understand vital components of the food label, which is important for product
comparison and making informed, nutritionally appropriate food product decisions (Grunert and
Wills, 2007; Kempen et al., 2012).
The factor “Literacy” correlated positively with a medium effect size, with respondents‟
“Noticing food labels” (r = 0.28), indicating that those with higher literacy levels, tended to notice
food labels more often and read them on a regular basis, which might lead to better label
understanding (Kolodinsky et al., 2008). The remaining four medium- effect- sized correlations
were between the factor “Literacy” and food label information and food product related
calculations, such as the factors, “Identifying food related symbols” (r = 0.27), and “Identifying
shops” (r = 0.29), as well as the items “Calculation - 50% off” (r =.29), and “Calculation – cost of
two products” (r = 0.26). These correlations indicate a tendency between underlying literacy and
the identification of label symbols, as well as numeracy skills, identified by Rothman et al.
(2006). Thus, respondents with better literacy levels tended to be able to more effectively apply
their literacy skills to food labels, indicating a possible better understanding of food label
symbols and numeracy, than respondents with lower literacy levels.
The factor “Ability to correctly identify food related symbols” correlated practically,
significantly with the item relating to the cost of “50% off product” (r = 0.46), and the factor
“Complex nutrition-related information” (r = 0.53). Similarly, respondents who understood
“Complex nutrition-related information” tended to be able to calculate the “50% off product” price
(r = 0.30). As the majority of respondents did not correctly identify food related symbols (≥72%),
complex nutrition- related information (≥50%), and incorrectly calculated “50% off” (≥66%),
understanding this information and completing these more difficult tasks (Jae et al., 2008;
Sabatini et al., 2010), explains why the ability to correctly perform these three tasks were
correlated.
In conclusion, the results show that literacy is imperative to the use of food labels, and
respondents with higher literacy levels were able to use food labels more effectively, than their
less literate counterparts. This suggests that improving literacy is essential in improving food
label use among low-literate consumers. English and Afrikaans- speaking respondents, and
respondents with higher income levels, understood aspects of the food label better than
respondents who spoke African languages and received a lower income. Therefore, it is the

89
demographic groups who speak African languages and belonging to lower income groups that
should be targeted for label related interventions. Alternatively, role players in the food industry
can review the possibility of introducing food labels printed in an African language, to assist
consumers in this demographic group.
Retailers and marketers aiming to improve sales among this target group should concentrate on
improving and strengthening the power of their store and brand name, as these two aspects
commonly represent quality to low-literate consumers. Low-literate respondents were able to
complete basic calculations, however, certain terminology confused them. Retailers and
marketers should be aware of this, and possibly aim to assist their low-literate customers by
providing a picture-based representation of percentage-based promotions. This will also suit the
low-literate consumer‟s tendency to pictographic thinking.
The study showed that the majority of the respondents did read food labels, often
themselves, and also reported checking to see if they had enough money in their purses to pay
for all the items they wished to purchase, indicating a tendency to remain independent when
shopping. This behaviour should be accommodated by marketers and retailers aiming to
encourage low-literate consumers to retain their independence, by avoiding initiatives and in-
store programmes that require help from a store assistant, especially as store assistants were
not a popular resource often used by low-literate respondents to assist with label reading. If
marketers are able to incorporate these primary results into their food label design, and develop
initiatives to assist low-literate, low-income consumers living in rural areas, they will be able
better to fulfil the needs of low-literate consumers, and capitalise on the mass purchasing power
that this emerging market represents. Such development is important in developing countries,
such as SA, where consumers are diverse in areas of education, income and purchasing
practices.
Food industry regulators should continue to present important aspects of the food label,
such as best before date, brand name and weight, in a simple and easy to understand manner,
as these aspects were well identified by low-literate respondents. Regulators should also,
however, strive to make aspects, such as nutrition related information and food symbols, just as
easy to understand, in order to assist in improving functionally low-literate consumers‟
understanding and consequent use of food labels.
3.8 Practical implications
Minimal research has been completed, investigating functionally low-literate consumer‟s use of
food labels in a rural area. This study shows that there is a need for consumers living in rural
areas to improve their use of food label information. This can be done through improving the
consumer‟s literacy levels, or alternatively adapting food labels to cater better to the needs of

90
low-literate consumers living in rural SA. Additionally, store assistants can be trained to be
aware that low-literate consumers may require assistance reading food labels, and to be
sensitive to their needs when making product purchases. This will support low-literate
consumers to make more informed purchase decisions, and improve their food shopping
experience, whilst simultaneously assisting marketers, retailers and other food industry role
players in maximising their sales to low-literate, low-income consumers living in rural areas. This
target market should be recognised as important to marketers and retailers, as low-literate, low-
income consumers form a large percentage of the emerging market and South African
population.
3.9 Limitations and future research prospects
A limitation in this study was that the respondent‟s use of food labels was subjectively reported
and not objectively tested. However, the results gathered from this study have provided insight
into functionally low-literate consumers‟ use of food labels, and can be used as a starting point
for further research in this field. The exploratory nature of the study, and probability method of
sampling used suggest that the results cannot be generalised to all low-literate South African
consumers living in rural area. The results and consequent recommendations, however, can be
used to assist consumers in the Valspan community in an attempt to improve their food label
use in the future.
The results of this study can be used to pursue several future research avenues. Firstly,
the link/s between rural areas, low-income, low-literacy, food labels and malnutrition could be
investigated. Secondly, ways in which marketers and food industry role players could adapt
products to appear more low-literate consumer- friendly can be researched and recommended
and, finally, an investigation into how low-income consumers, living in a rural area, can improve
their purchase decisions, can be pursued. Similar research can also be conducted in other rural
areas of SA, to investigate the similarities and differences between functionally low-literate
consumers living in different areas, while a similar methodology could be adopted to investigate
food label use among low-literate consumers in other developing countries.

91
3.10 Reference list
Abdi, A.A. and Cleghorn, A. (2005), Issues in African education: sociological perspectives,
Palgrave Macmillan, New York.
Adkins, N.R. and Ozanne, J.L. (2005a), “Critical consumer education: empowering the low-
literate consumer”, Journal of Macromarketing, Vol. 25 No. 2, pp. 153-162.
Adkins, N.R. and Ozanne, J.L. (2005b), “The low-literate consumer”, Journal of Consumer
Research, Vol. 32 No. 1, pp. 93-105.
Ali, J. and Kapoor, S. (2009), “Understanding consumers‟ perspectives of food labelling in
India”, International Journal of Consumer Studies, Vol. 33 No. 6, pp. 724-734.
Altman, M., Hart, T.G.B. and Jacobs, P.T. (2009), “Household food security status in South
Africa”, Agrekon, Vol. 48 No. 4, pp. 345-361.
Auter, P.J. (2007), "Portable social groups: willingness to communicate, interpersonal
communication gratifications, and cell phone use among young adults", International
Journal of Mobile Communications, Vol. 5 No. 2, pp. 139-156.
Babbie, E. (2010), Practical social research, Wadsworth, Belmont.
Bloemer, J., Brijs, K. and Kasper, H. (2009), "The CoO-ELM model: A theoretical framework for
the cognitive processes underlying country of origin-effects", European Journal of
Marketing, Vol. 43 No. 1, pp. 62-89.
Bordens, K.S. and Abbott, B.B. (2011), Research design and methods, McGraw Hill, New York.
Christensen, L.B., Johnson, R.B. and Turner, L.A. (2011), Research methods, design and
analysis, Pearson, Boston.
Coetzee, H & Du Toit, I.M. (2011), “Research report 2: Needs assessment conducted in the
Vaalharts region, North West and Northern Cape Provinces, South Africa: a North-West
living labs baseline project.”, Potchefstroom: NWU, AUTHer Group, Unpublished.
Cowburn, G. and Stockley, L. (2005), “Consumer understanding and use of nutrition labelling: a
systematic review”, Public Health Nutrition, Vol. 8 No. 1, pp. 21-28.
Craig, C.S. and Douglas. S.P. (2011), “Empowering rural consumers in emerging markets”,
International Journal of Emerging Markets, Vol.6 No. 4, pp. 382-393.
D‟Haese, M. and Van Huylenbroeck, G. (2005), “The rise of supermarkets and changing
expenditure patterns of poor rural households: case study in the Transkei area, South
Africa”, Food Policy, Vol. 30 No. 1, pp. 97-113.
Dent, V.F. (2007), “Local economic development in Uganda and the connection to rural
community libraries and literacy”, International Journal of Emerging Markets, Vol. 108 No.
5/6, pp. 203-217.
Deumert, A. (2005), “The unbearable lightness of being bilingual: English-Afrikaans language
contact in South Africa”, Language Sciences, Vol. 27 No. 1, pp. 113-115.

92
Du Plessis, P.J. and Rosseau, G.G. (2003), Buyer behaviour: a multi-cultural approach, Oxford
University Press, Cape Town.
Dugdale, G. and Clark, C. (2008), “Literacy changes lives: an advocacy resource”, National
literacy trust, London.
Ellis, S.M. and Steyn, H.S. (2003), “Practical significance (effect sizes) versus or in combination
with statistical significance (p-values)”, Management Dynamics, Vol.12 No. 4, pp. 51-53.
Faraldo-García, A., Santos-Pérez, S., Crujeiras-Casais, R., Labella_Caballero, T. and Soto-
Varela, A. (2012), “Influence of age and gender in the sensory analysis of balance
control”, European Archives of Oto-Rhino-Laryngology, Vol. 269 No. 2, pp. 673-677.
Field, A. (2009), Discovering statistics using SPSS, Sage, London.
Fouché, C.B. and De Vos, A.S. (2011), “Formal formulations”, in de Vos, A.S., Strydom, H.,
Fouche, C.B. & Delport, C.S.L. (Ed.), Research at grassroots level for the social sciences
and human profession, Van Schaik, Pretoria, pp. 89-100.
Gau, R. and Viswanathan, M. (2008), “The retail shopping experience for low-literate
consumers”, Journal of Research for Consumers”, available at: http://www.Jrconsumers.
com/data/p age/5882/Low_literate_consumers_academic_final3.pdf (accessed 6 March
2013).
Grunert, K. G. (2005), “Food quality and safety: consumer perception and demand”, European
Review of Agricultural Economics, Vol. 32 No. 3, pp. 369-391.
Grunert, K.G. and Wills, J.M. (2007), “A review of European research on consumer response to
nutrition information on food labels”, Journal of Public Health, Vol. 15 No. 5, pp. 385-399.
Guesalaga, R. and Marshall, P. (2008), “Purchasing power at the bottom of the pyramid:
differences across geographic regions and income tiers”, Journal of Consumer Marketing,
Vol. 25 No. 7, pp. 413-418.
Hair, J.R., Anderson, R.E., Tatham, R.L. and Black, W.C. (1998), Multivariate data analysis,
Prentice-Hall, New Jersey.
Hamilton, K. and Catterall, M. (2008), “I can do it: consumer coping and poverty”, Advances in
Consumer Research, Vol. 35 pp. 551-556.
Hamilton, K. (2009), “Low income families: experiences and responses to consumer exclusion”,
International Journal of Sociology, Vol. 29 No. 9-10, pp. 543-557.
Humphrey, J. (2007), “The supermarket revolution in developing countries: tidal wave or tough
competitive struggle”, Journal of Economic Geography, Vol. 7 No. 4, pp. 433-450.
Hutcheson, G. and Sofroniou, N. (1999), The multivariate social scientis,. Sage, London.
Jacobs, S.A., de Beer, H. and Larney, M. (2010), “Adult consumers‟ understanding and use of
information on food labels: a study among consumers living in Potchefstroom and
Klerksdorp regions, South Africa”, Public Health Nutrition, Vol. 14 No. 3, pp. 510-522.

93
Jae, H. and DelVecchio, D. (2004), “Decision making by low-literacy consumers in the presence
of point-of-purchase information”, The Journal of Consumer Affairs, Vol. 38 No. 2, pp.
342-354.
Jae, H., Delvecchio, D.S. and Cowles, D. (2008), “Picture-text in congruency in print
advertisements among low- and high-literacy consumers”, The Journal of Consumer
Affairs, Vol. 42 No.3, pp. 439-451.
Jansson, H. (2007), International business marketing in emerging country markets: the third
wave of internationalization of firms, Edward Elgar Publishing, Cornwall.
Jay, M. Adams, M., Herring, S.J., Gillespie, C., Ark, T., Feldman, H., Jones, V., Zabar, S.,
Stevens, D. and Kalet, A. (2009), “A randomized trial of a brief multimedia intervention to
improve comprehension of food labels”, Preventative Medicine, Vol. 48 No. 1, pp. 25-31.
Kempen, E., Bosman, M., Bouwer, C., Klein, R. and Van der Merwe, D. (2011), “An exploration
of the influence of food labels on South African consumers‟ purchasing behaviour”,
International Journal of Consumer Studies, Vol. 35 No. 1, pp. 69-78.
Kempen, E.L., Muller, H., Symington, E. and Van Eeden, T. (2012), “A study of the relationship
between health awareness, lifestyle behaviour and food label usage in Gauteng”, South
African Journal of Clinical Nutrition, Vol. 25 No. 1, pp. 15-21.
Kirsch, I. and Guthrie, J.T. (1977), “The concept and measurement of functional literacy”,
Reading Research Quarterly, Vol.13 No .4, pp. 485-507.
Kline, P. (1999), The handbook of psychological testing, Routledge, London.
Kolodinsky, J., Green, J., Michahelles, M. and Harvey-Berino, J. R. (2008), “The use of
nutritional labels by college students in a food-court setting”, Journal of American College
Health, Vol. 57 No. 3, pp. 297-302.
Kumanyika, S. K. and Grier, S. (2006), “Targeting interventions for ethnic minority and low-
income populations”, The Future of Children, Vol. 16 No. 1, pp.187-207.
Kunda, M. and Goel, A.K. (2008), “How thinking in pictures can explain many characteristic
behaviors of autism”, paper presented at the 7th IEEE International Conference on
development and learning, available at: http://ieeexplore.ieee.org/xpls/abs_all.jsp?
Arnumber =4640847 a ndtag=1 (accessed 3 May 2013).
Leedy, P.D. and Ormrod, J.E. (2010), Practical research planning and design, Pearson, Boston.
Mahajan, V., and Banga, K. (2006), The 86% solution: How to succeed in the biggest marketing
opportunity of the next 50 years, Pearson, New Jersey.
Maplandia. (2005), “Valspan map – satellite images of Valspan”, available at:
http://www.maplandia.com/south-africa/northern-cape/hartswater/valspan/ (accessed 7
March 2014).
Maree, K. and Pietersen, J. (2007), “The quantitative research process”, in Maree, K. (Ed.), First
steps in research, Van Schaik, Pretoria, pp. 144-153.

94
Mårtensson, L. and Hensing, G. (2012), “Health literacy–a heterogeneous phenomenon: a
literature review”, Scandinavian Journal of Caring Sciences, Vol. 26 No. 1, pp.151-160.
Nutbeam, D. (2008), “The evolving concept of health literacy”, Social Science and Medicine,
Vol. 67 No. 12, pp. 2072-2078.
Ozanne, J.L., Adkins, N.R. and Sandlin, J.A. (2005), “Shopping [for] power: how adult literacy
learners negotiate the marketplace”, Adult Education Quarterly, Vol. 55 No. 4, pp. 251-
268.
Posel, D. (2011), “Adult literacy rates in South Africa: a comparison of different measures”,
Language Matters: Studies in the Languages of Africa, Vol. 42 No. 1, pp. 39-49.
Ramamurti, R. and Singh, J.V. (2009), “Why study emerging-market multinationals?”, in
Ramamurti, R. (Ed.), Emerging Multinationals in Emerging Markets, Caimbridge University
Press, New York, pp. 3-22.
Rothman, R. L., Housam, R., Weiss, H., Davis, D., Gregory, R., Gebretsadik, T., Shintani, A.
and Elasy, T.A. (2006), “Patient understanding of food labels: the role of literacy and
numeracy”, American Journal of Preventative Medicine, Vol. 31 No. 5, pp. 391-398.
Sabatini, J.P., Sawaki, Y., Shore, J.R. and Scarborough, H.S. (2010), “Relationships among
reading skills of adults with low-literacy”, Journal of Learning Disabilities, Vol. 43 No. 2,
pp. 122-138.
Sanlier, N. and Karakus, S.S. (2010), “Evaluation of food purchasing behaviour of consumers
from supermarkets”, British Food Journal, Vol. 112 No. 2, pp. 140-150.
Schiffman, L.G. and Kanuk, L.L. (2010), Consumer Behaviour, Pearson, New Jersey.
Schönfeldt, H.C and Gibson, N. (2010), “Food composition data in health communication”,
European Journal of Clinical Nutrition, Vol. 64, pp. 128-133.
Shankar, V., Venkatesh., Hofacker, C. and Naik, P. (2010), “Mobile marketing in the retail
environment: current insights and future research avenues”, Journal of Interactive
Marketing, Vol. 24 No. 2, pp. 111-120.
Sharf, M., Slea, R., Zentner, G., Shoob, H., Shai, I. and Stein-Zamir, C. (2012), “Figuring out
food labels. Young adults‟ understanding of nutritional information presented on food
labels is inadequate”, Appetite, Vol. 58 No.2, pp. 531-534.
Singla, M. (2010), “Usage and understanding of food and nutritional labels among Indian
consumers”, British Food Journal, Vol. 112 No. 1, pp. 83-92.
South Africa. (2010), “Regulations relating to the labelling and advertising of foodstuffs.
Proclamation no R146”, Government Gazette Vol. 32975, pp. 3-53.
Statistics Canada. (2011),“Literacy in the information age. Further results from the adult literacy
and life skills survey” (accessed 19 March 2013).

95
Statistics South Africa. (2012), “Income and expenditure of households”, available at:
http://www.statssa.gov.za/Publications/ statsdownload.asp?PPN=P0100 (accessed 31
May 2013).
Stedman, L.C. and Kaestle, C.F. (1987), “Literacy and reading performance in the United
States, from 1880 to the present”, Reading Research Quarterly, Vol. 22 No. 1, pp. 8-46.
Trujillo, C. A., Barrios, A., Camacho, S. M. and Rosa, J. A. (2010), “Low socioeconomic class
and consumer complexity expectations for new product technology”, Journal of Business
Research, Vol. 63 No. 6, pp. 538-547.
UNESCO. (2010), “General profile South Africa”, available at: http://stats.uis.unes com.org/ une
sco/Table View er/document.aspx?ReportId=124andIF_Lan guage=enandBR _Count
ry=7100 (accessed 19 March 2013).
UNICEF. (2010), “Discussion paper on equity and child rights in South Africa”, available at:
http://www.google.co.za/#q=UNICEF+south+africa+poverty+rural+2010andoq=UNICEF+s
outh+africa+poverty+rural+2010andgs_l=serp.3...3449.5048.0.5345.10.10.0.0.0.0.208.11
67.4j3j3.10.0...0.0...1c.1.15.serp.5cOuG0C6mvgandbav=on.2,or.andfp=68ec7c0c1b0b08
41andbiw=1366andbih=675 (accessed 31 May 2013).
Van Biljon, W. and Jansen van Rensburg, M. (2011), “Branding and packaging design: key
insights on marketing milk to low-income markets in South Africa”, African Journal of
Business Management, Vol. 5 No. 22, pp. 9548-9558.
Van der Merwe, D., Bosman, M., Ellis, S., de Beer, H. and Mielmann, A. (2012), “Consumers'
knowledge of food label information: an exploratory investigation in Potchefstroom, South
Africa”, Public Health Nutrition, Vol. 16 No. 3, pp. 403-408.
Van Staden, J. (2012). “The use of clothing labels by female black low-literate consumers”,
Doctoral thesis, Potchefstroom: North-West University.
Verbeke, W. and Roosen, J. (2009), “Market differentiation potential of country-of-origin, quality
and traceability labelling”, The Estey Centre Journal of International Law and Trade
Policy, Vol. 10 No. 1, pp. 20-35.
Viswanathan, M. (2009), “Consumer behavior across literacy and resource barriers”,
International Encyclopaedia of Marketing, Wiley-Blackwell, Oxford, Vol. 44, pp. 44-54.
Viswanathan, M. and Gau, R. (2005), “Functional illiteracy and nutritional education in the
United States: A research based approach to the development of nutrition education
materials for functionally low-literate consumers”, Journal of Macromarketing, Vol. 25 No.
2, pp.187-201.
Viswanathan, M., Gajendiran, S. and Venkatesan, R. (2008), “Understanding and enabling
marketplace literacy in subsistence contexts: the development of a consumer and
entrepreneurial literacy educational program in South India”, International Journal of
Educational Development, Vol. 28 No. 3, pp. 300-319.

96
Viswanathan, M., Hastak, M. and Gau, R. (2009), “Understanding and facilitating the usage of
nutritional labels by low-literate consumers”, Journal of Public Policy and Marketing, Vol.
28 No. 2, pp. 135-145.
Viswanathan, M., Rosa, J.A. and Edwin Harris, J. (2005), “Decision-making and coping of
functionally low-literate consumers and some implications for marketing management”,
American Marketing Association, Vol. 69 No. 1, pp. 15-31.
Viswanathan, M., Torelli, C., Yoon, S. and Riemer, H. (2010), “Fish out of water: understanding
decision-making and coping strategies of English as a second language consumers
through a situational literacy perspective”, Journal of Consumer Marketing, Vol. 27 No. 6,
pp. 524-533.
Von Braun, J. (2008), “Rising food prices: what should be done?” The Agriculture Economics
Society and the European Association of Agricultural Economists, Vol. 7 No. 2, pp. 31-35.
Vorster, H.H., Venter, C.S., Wissing, M.P. and Margetts, B.M. (2005), “The nutrition and health
transition in the North West Province of South Africa: a review of the THUSA (transition
and health during urbanisation of South Africans) study”, Public Health Nutrition, Vol. 8
No. 5, pp. 480-490.
Wills, J.M., Schmidt, D.B., Pillo-Blocka, F. and Cairns, B. (2009), “Exploring global consumer
attitudes toward nutrition information on food labels”, Nutrition Reviews, Vol. 67 No. 5, pp.
102-106.

97
4. CHAPTER 4: CONCLUSION
4.1 Introduction
This chapter serves to conclude the research dissertation, as well as discuss how the results of
the research can be applied by different interest groups. The value of this study for each group
differs; for example, low-literate consumers need to be able to read, understand and apply the
food label information, in order to be able to make informed purchase decisions. Manufacturers,
marketers and regulators need to know how product labels and packaging can be adapted, so
that the unique needs of low-literate consumers can be addressed. The scale and the nature of
the study will also be addressed, and aspects, which may have restricted the outcomes of the
study, will be discussed in the limitations. Recommendations for future studies will also be
provided.
4.2 Conclusion
The objectives of the study were to explore whether and when functionally low-literate
consumers use (read, understand and apply) food label information to assist their decision-
making; secondly, to explore the demographic differences between low-literate consumers and
their use of food labels; finally, to make recommendations on how food label use can be
improved and modified to be more friendly to low-literate consumers. A questionnaire was used
to collect data to achieve the specific objectives. The questionnaire included a literacy
assessment, which revealed that all the respondents in the study were functionally low-literate,
further confirmed by the respondents‟ level of education completed.
Regarding functionally low-literate consumer‟s ability to read food labels, the majority of the
respondents reported reading food labels. However, they also employed a variety of resources,
such as their children, other family members, and cell phone calculators, to assist them to read
food labels and cope in the retail environment. This suggests that, although they did report
reading food labels, they were not able to independently use food labels, and may look for
assistance to prevent experiencing emotions, such as humiliation and shame. Many
respondents refrained from asking store assistants for help, possibly to avoid emotional stress
and exposing their low-literacy skills. The challenges these consumers face are not lessened by
the presentation and format of food labels, as the study revealed that many respondents felt
that there are too many words on food labels, which are often too small to read.
When reviewing the respondents‟ understanding of food labels, the simple and obvious
information was well understood, perhaps due to frequent exposure to this type of information.

98
Conversely, complex-nutrition related information and food-related symbols, in their current
format, were more difficult for respondents to understand. This result is significant, as although
low-literate consumers often self-report reading food labels, when their understanding of the
information is tested, results reflect that they are unable to comprehend multiple aspects of food
label information. Additionally, although low-literate consumers tend to use pictorial thinking and
symbols to process information, results suggest that if the meaning of a symbol or picture is not
effectively conveyed, the value of using a symbol or picture is lost.
The application of food label information to decision-making was also investigated and, in
contrast to the symbols, many respondents were able to correctly identify altered store logos,
indicating their tendency to use pictorial thinking. The high percentage of correctly identified
logos, possibly could also be due to repeated exposure to these logos. Respondents in the
study claimed to read food label information regularly, during both pre- and post-decision
making, and did not appear to favour applying food label information, either in-store or at-home.
Regarding numeracy, the respondents were able to complete simple addition calculations
correctly, but experienced difficulty in calculating the cost of discounted products, probably due
to the confusing terminology associated with such calculations, and their limited numeracy skills.
To avoid embarrassment, many respondents often checked if they had enough money in their
purse before paying for the desired products, and also made use of cell phone calculators to
assist adding the cost of two or more products, illustrating that they are not hesitant to use
technology to assist their decision-making, especially those younger in age. Respondents in the
study also displayed concrete reasoning, when preferring to pay for items singly, to avoid
calculating the total cost of multiple products. These results show that respondents are sensitive
to taking precautions to ensure they develop coping strategies, which ensure they have enough
money, to pay for the desired products, when shopping.
Best before date, brand name and store were the most popular quality indicators used by
respondents in this study, and these findings have been confirmed by previous research. These
food label attributes and store logos acting as quality indicators could be due to a common
familiarity and increased exposure to these aspects of the food label, as both best before date
and brand name were correctly identified by the majority of respondents in the study. Similarly,
the majority of respondents also correctly identified store logos, and confirmed them as an
indicator of quality, which shows a tendency to use label attributes, or the store logo, as a
heuristic shortcut, to indicate a certain level of quality.
Most respondents in the study were female, aged between 30-49 years, and had completed
between Grade 5 and Grade 8 at school, perhaps due to a female-headed household tendency

99
among low-literate consumers. The majority of respondents spoke Setswana, and a large
percentage were unemployed and earned R500 or less monthly, indicating low-income. Half the
respondents were never married, and the majority had between one and three children living in
their household. Regarding the demographic similarities and differences of respondents in this
study, English and Afrikaans- speaking respondents showed a tendency to better understand
advanced nutrition related information and food related symbols, probably because food labels
are printed in English, and Afrikaans- speaking South Africans are often bilingual in English.
Additionally, respondents in higher income groups showed a tendency to superior
understanding of complex nutrition-related information, possibly due to an increased interest in
food label information. Older respondents and cleaners, who may struggle to read or have
deteriorated eyesight, favoured asking their children to assist them with food label use, and
older consumers also tended to avoid using a cell phone calculator to assist their in- store
product calculations, which could represent older generations avoidance of using technological
appliances.
There was also a practically significant correlation between literacy and correctly identifying
“Complex nutritional information”. Similarly, consumers who understood “Complex nutrition
related information,” also showed a practically significantly, better “Ability to correctly identify
food-related symbols,” and tended to calculate products, “50% off product” prices, correctly.
These tendencies collectively indicate that these are more difficult label-related tasks, and that
higher literacy levels may possibly lead to a better understanding of the more complex aspects
of food labels and numeracy, while also illustrating the importance of literacy and food label use.
In contrast, results from the study also show that consumers with lower literacy skills may
struggle to understand these aspects of food labels the most.
4.3 Practical applications of the research
4.3.1 Applications for functionally low-literate consumers
Literacy is an important skill required by modern day consumers to effectively function in the
marketplace. Retailers and marketers primarily address the needs of literate consumers, and
low-literate consumers are often faced with a variety of challenges when making food
purchases. When consumers purchase food products, they often make use of the food label as
a source of information to assist their decision-making process. If functionally low-literate
consumers were equipped and able to better understand the information available to them on a
food label, they might be able to evaluate two or more similar products better, and make more
informed, healthy and economic food choices in the retail environment. Additionally, if the

100
information on the food label can be used to increase the consumer‟s product knowledge on
aspects such as expiry date, recommendations for use and storage, as well as nutritional
information, consumers could be able to, better use the food product, avoid consuming already
expired products, and would be able to ensure products were stored in optimal conditions. This
would all contribute to improved safety for the consumer and, in turn, to improved post-purchase
satisfaction. Functionally low-literate consumers, who struggle financially, may also be assisted
to make wiser, more economical food choices, if their understanding of monetary terminology
and calculations of the food retail environment were improved.
These recommendations can be communicated to low-literate consumers through community
centred classes, Church groups and health clinics. The consumers can be educated about
different aspects of shopping, such as: how to read a food label, the meanings of food label
symbols, and how to calculate discounted prices. Practical food label education involving both
parents and children and store related tasks, can also be implemented at schools.
4.3.2 Applications for product manufacturers, marketers and retailers
Although the research was conducted from a consumer point of view, the results are also
applicable and advantageous for product manufacturers, marketers and retailers. Minimal
research has previously been conducted regarding functionally low-literate consumers and their
use of food labels; therefore, this study provides valuable insight in this regard. Manufacturers
and marketers should be aware of the specific terminology that low-literate consumes do and do
not understand. The phrase “50% off” should be avoided, as many low-literate consumers are
unable to understand it or, alternatively, a simple pictorial representation of the phrase should
be included by marketers to visually represent the meaning of the phrase.
Manufacturers and marketers should also investigate using simplified symbols and pictures to
which low-literate consumers can relate, to convey information as to the meanings behind the
symbols, as the symbols currently used in food labels were not well interpreted by respondents.
If manufacturers and marketers are able to design a food label, which adult functionally low-
literate consumers are able to easily understand, the possibility that school children, who also
have completed grades 5 to 8, will also be able to understand the information on the food label,
and their ability to apply it to their decision-making, will also improve. Thus, marketers will be
able to reach different aged target markets, simultaneously. Additionally, if the food labels
developed by manufacturers and marketers meet the needs of functionally low-literate South

101
African consumers, retailers will be able to capitalise on the large quantity of everyday food
products that this market purchases.
Retailers should also aim to train store assistants to better assist functionally low-literate
consumers, and make these assistants aware of the problems low-literate consumers may
experience, and special needs they have with regard to receiving assistance with reading the
information on the food label, and treating the low-literate customer with respect, to avoid
humiliation. Retail groups should also avoid changing store logos, since the low-literate
consumers‟ tendency to pictorial thinking currently assists them in correctly identifying store
logos.
4.3.3 Applications for the food industry regulators
The food industry regulators can use the findings to adapt regulations regarding food labelling,
to meet the demands of consumers in general, and improve the presentation of food labels so
that the information is easy to read and understand. It is recommended that food labelling
requirements be reviewed, as many functionally low-literate consumers are unable to
understand the information on food labels. Specifically, regulators could explore different
formats of presenting the information, such as the quantities of nutrients in the product, in order
to allow even functionally low-literate consumers to understand the complex nutritional
information presented on labels. A possible solution would be to explore the effectiveness of
introducing the traffic light food label system and format, currently implemented in other
countries. The reasons that low-literate respondents presented in this study for not reading food
labels should also be addressed, and, where possible, the size of the letters on food labels
should be increased, and number of words decreased.
4.4 Recommendations regarding consumer education
Government and educators may be able to assist low-literate consumers by aiming to improve
literacy levels in the Valspan rural area, as better literacy levels tend to reflect a better
understanding of complex aspects of food labels. Consumer scientists and educators can also
undertake interventions to assist low-literate adult consumers to learn how to make purchase-
related calculations, such as: calculating discounted prices; educate them to learn how to
compare the different prices and sizes of similar products; to encourage value for money
purchases; and assist low-literate consumers to understand the meaning of the information
found in nutrition tables.

102
Educators and consumer scientists can also ensure that the meaning of symbols and pictures,
which appear on food labels, are correctly explained and communicated to consumers,
because, at present, the respondents in this study showed a poor understanding of what these
images mean. If consumer scientists were able to assist low-literate consumers to better
understand the important terminology and food label aspects, related to food purchases, such
as “50% off” and “Food related symbols,” these consumers may be able to improve their food
label use and make better informed and economical food choices. Additionally, they may be
encouraged to overcome the challenges they are faced with, and may also decrease the
anxiety, stress and humiliation often experienced by them.
Consumer scientists can also strive to work with retailers, to ensure that shop assistants are
trained to accommodate low-literate consumers, with regard to the specific assistance they may
require, when shopping and using food labels. Additionally, they can encourage retailers to
make use of sales assistance in a verbal format, instead of written assistance material (such as
pamphlets and signs), so that even low-literate consumers, who struggle to read, are provided
with product information. Similarly, consumer scientists may also look to encourage retailers to
verbally advertise the nutritional benefits of their products. Finally, educators could collaborate
with the health industry to encourage patients to critically review and compare food products,
before making a purchase, in order to select the most nutritious product available.
4.5 Applications for future research
This study provides a good starting point for future research investigating variables, such as:
food label use; functionally low-literate consumers; and rural areas. Future research in this field
could include investigating the link between low-literacy and malnutrition, and low-literacy and
actual food consumption. Additionally, the results of this study could be used to develop an
educational or intervention programme, which specifically suits the needs of low-literate South
African consumers. Similar programmes may then also be implemented in other developing
countries, and could aim to improve low-literate consumers‟ food label use and, possibly,
improve their food related purchases, and feasibly alleviate malnutrition. Future health and
nutrition related research may also benefit from this research in providing important results
regarding low-literate consumers.

103
4.6 Limitations and recommendations
The sample size of the study was 292 respondents, recruited by purposive, probability sampling
methods. The size of the sample was determined at an accuracy level of 5%, and the sample
probabilities will not differ by more than 0.05 from the true population probabilities. However, by
using a larger sample size, the sample probabilities would not differ by more than 0.01 from the
true population probabilities (at an accuracy level of 1%).
Due to the probability sampling method used and the exploratory nature of this study, the
results were not intended to be generalised to all consumers living in rural areas of SA. The
results of this study however can be of assistance as a basis, when conducting further research
regarding functionally low-literate consumer‟s, their use of food labels, and other additional
research involving consumers living in a rural area.
As the study was based in the Valspan community in the Northern Cape, individuals were
recruited exclusively from this province. Future studies can be conducted in the remaining eight
provinces of SA, in order to determine if functionally low-literate consumers living in different
rural areas of SA share common characteristics, or display differences in their use of food
labels. Additionally, such research could result in a nationwide study.

104
ANNEXURES
Annexure 1: Declaration of dissertation submission


105
Annexure 2: Research methodology
1. Research design
This study focused on functionally low-literate consumers‟ use of food labels in the Valspan rural
area in the Northern Cape. Researchers have different beliefs and views about research and,
as a result, the ways in which research is conducted vary. Certain standards and principles
serve to direct researchers‟ actions, which lead to a framework of beliefs and guidelines that are
referred to as a paradigm (Christensen et al., 2011:10; Nieuwenhuis, 2010:47). It is important to
identify the paradigm used in a study, to provide insight as to why certain research approaches
and designs are used. A positivistic research paradigm, which typically provides simple
explanations of data based on objective findings (Nieuwenhuis, 2010:49), was applicable to this
study. In collaboration with a positivistic paradigm, a quantitative research approach was used,
in order to provide objective statistical results for the study (Maree & Pietersen, 2010c:145).
This approach was able to provide an indication of the association between the variables that
were investigated in the study (Leedy & Ormrod, 2010:94).
The relationships between the variables (functionally low-literate consumers, food label use,
and a rural area), were observed and described, using descriptive theory (Bordens & Abbott,
2011:39). As research investigating the use of food labels by functionally low-literate consumers
in a rural area is relatively scarce, this study aimed to provide new information and valuable
insight (Babbie, 2010:93), as an exploratory study (Babbie, 2010:92; Fouché & De Vos,
2011:95). These variables were measured, using a survey (Leedy & Ormrod, 2010:94), which is
suitable for non-experimental research (Christensen et al., 2011:330; Maree & Pietersen,
2010c: 152). The survey was used to capture quantitative information about the research topic
(Maree & Pietersen, 2010c:152), and was suitable to gather information and measure multiple
variables simultaneously for this study (Maree & Pietersen, 2010b:155). Additionally, the survey
allowed the researcher to measure activities and beliefs (Christensen et al., 2011:333), which
were appropriate for this study in which consumers‟ use (activities), of food labels was
investigated.

106
2. Sampling and study population
The following section will explain the different aspects of the sampling process.
The study population included respondents from the Valspan community in the Northern Cape.
Respondents were recruited by means of purposive sampling methods. Adult respondents, who
had completed schooling between grades 5 and 8, were included in this study. Although
educational levels between grades 6 and 7 are used to classify functional low-literacy in South
Africa (Posel, 2011:41), the larger inclusion criteria range allowed more respondents to
participate in the study. This was of particular importance to this study, as it was difficult to
locate adult respondents with the desired education levels. Respondents completed a basic
literacy test (Addendum A), in order to classify their level of literacy, before completing the food
label questionnaire with the field worker (Addendum B). Inclusive criteria for respondents to fill
out the questionnaire included that they must have been:
18 years or older;
classified as functionally low-literate (by level of education);and
living in the Valspan rural area
The study was performed in the Valspan community in the Northern Cape. This area was
selected because of an existing collaborative relationship between the NWU and the Valspan
community. Furthermore, Valspan is a rural area with many low-literate consumers, a
prerequisite for the study, thus further making it a suitable location. The questionnaires were
filled out by the field workers at the respondents‟ homes. Permission to conduct this study was
granted by community leaders in the Valspan community, by the Phokwane Municipality and the
NWU, which was facilitated by the project manager of the Water Innovative Network (WIN),
project co-ordinator, Miss Liesbet Barratt.
Purposive criterion sampling was used to select respondents for the general household survey.
This method of sampling suggests that respondents were selected due to specific
characteristics they possessed, which were needed for the study (Nieuwenhuis, 2011:79). The
characteristics of respondents were determined during the research design phase of the study
and included: age, level of education and residence (Nieuwenhuis, 2011:80). This non-
probability method of sampling cannot be used to make conclusions about the South African
low-literate population in general (Maree & Pietersen, 2011a:176), but allowed researchers to
collect valuable data specific to the Valspan community. The methods used in this study can

107
also be used as a reference for future studies on how studies regarding functionally low-literate
consumers can be approached, and where alternative sampling methods can be incorporated.
As this was a quantitative study, a survey using a large number of respondents was required
(Fouché & Delport, 2011:64; Maree & Pietersen, 2010b:155), in order to calculate meaningful
statistical results from which valid conclusions about functionally low-literate respondents‟ use of
food labels could be drawn. Initially, the sample size depended on the number of respondents
who are classified as functionally low-literate in the population. It was suggested by the
Statistical Consultation Services of the NWU, that a minimum number of 200 respondents would
be ideal for the study. In total, 292 questionnaires were completed and used in the study.
3. Data collection
The data for this study was collected by a survey, using a questionnaire as the measuring
instrument (Singh, 2007:69). The use of a questionnaire was valuable in gathering the
necessary information regarding variables from respondents (Maree & Pietersen, 2010c:152).
Questionnaires may often be misinterpreted, due to respondents‟ reading and writing skills
(Leedy & Ormrod, 2010:189), and therefore, to prevent potential misinterpretation, the
questionnaire was administered through an interviewer-administered approach. Trained field
workers walked from house to house in the Valspan community and conducted face-to-face
interviews with respondents, in order to ensure that they understood all the questions in the
questionnaire and helped fill out the questionnaire on behalf of the respondent, as
recommended by Christensen et al. (2011:337), to overcome literacy-related problems.
Trained field workers conducted data collection for this study, and because the field workers
were able to speak English, Afrikaans and Setswana, language barriers were prevented. These
field workers were trained by the researcher to successfully assist respondents in completing
the questionnaire, without giving respondents the right answer. Issues such as reliability,
remuneration and the importance of collecting the respondents‟ honest answers, were also
addressed. This training took place 5 days prior to the data collection. Show cards (Annexure
9), are a resource which was used to assist respondents in answering certain questions in the
questionnaire, employing three different show cards.

108
Card 1 - showed an example of a maize meal label and nutritional information - to test the
respondents‟ food label knowledge
Card 2 - presented various products and their prices – to test the respondents‟ ability to
calculate prices
Card 3 - showed various grocery shop logos and names – to test the respondents‟ brand
recognition and pictorial thinking.
These show cards were essential to the study, as they allowed the researcher to realistically
test respondents‟ use of food labels.
Respondents were recruited from within the Valspan community. Field workers, who had been
trained by the WIN project leaders and researchers, filled out the questionnaire together with
the respondents. The researcher of the present study was also involved in the training of the
field workers.
The collection of data was conducted from 9 September 2013 to 17 September 2013. Data was
collected at the respondents‟ homes, which is typical for a face-to-face interview method
(Bordens & Abbott, 2008:272; Christensen et al., 2011:337). During the afternoons, where
possible, honours students accompanied the field workers to the interview. Many field workers
also completed the interviews after hours.
4. Measuring instrument
The questionnaire was adapted to suit this study from two previous questionnaires, which
focused on consumers‟ food label knowledge (Van der Merwe et al., 2012), and clothing label
use by black female low-literate consumers (Van Staden, 2012), , since no exact previous
scales were available, addressing the same objectives as the present study. Additionally, a
range of demographic questions were included in the questionnaire, so that the demographic
profile of respondents who participated in the study could be determined.
The questionnaire was translated and printed in two languages, English and Setswana. English
was chosen, as food label information is presented in English in South Africa, and thus

109
consumers may be familiar with the English terms used. The questionnaire was also provided in
Setswana, as this is the first language of many respondents and field workers in the Valspan
area, and thus assisted in preventing miscommunication regarding the questionnaire used in
this study. The questionnaire was translated from English to Setswana by an accredited
translator and was translated back into English from Setswana by a Setswana mother tongue
speaking University employee. This ensured that the meaning of the original questionnaire was
not lost in the translation of the document. Section A of the questionnaire was used to
determine the demographic profile of the respondents who participated in the study. Section B
followed, with questions regarding the respondent‟s use of food labels and purchasing
behaviour, as well as challenges they may experience and coping strategies they may adopt,
when using food labels. Table 4 provides a summary of the questions, where the questions
originated from, and how they were used in this study.
The respondents were also asked to perform label related tasks, using realistic show cards
(Annexure 9), to test their abilities to read a food label, calculate prices and recognise brands.
These questions were included as part of section B of the questionnaire.

110
Table 1: Table to show relevant information of the questions used in the questionnaire
NUMBER QUESTION ORIGINALLY USED
IN
ORIGINAL
QUESTION
NUMBER
QUESTION
ORIGINAL/
EDITED
SCALE
USED
B1 What is your age? Van Staden (2012) A1 Original Ordinal
B2 What is your job? Van Staden (2012) A2 Edited Nominal
B3 What is your household monthly
income?
Van Staden (2012) A5 Original Interval
B4 What is the highest level that
you passed in school?
Van Staden (2012) A3 Original Ordinal
B5 What is your marital status? Van Staden (2012) A4 Edited Nominal
B6 How many children under the
age of 18 live with you?
Van Der Merwe et al.
(2012)
II.8 Original Ordinal
B7 Main language of household? Van Der Merwe et al.
(2012)
II. 6 Original Nominal
B8 What is your gender? New New New Ordinal
C1 Have you ever noticed the food
label information on food
products?
New New New Ordinal
C2 How often do you make use of
food labels?
Van Der Merwe et al.
(2012)
25 Edited Ordinal
Likert
C3 How often do you shop for food? Van Der Merwe et al.
(2012)
11 Edited Nominal
C4 Who do you ask to help you to
read food labels?
Van Staden (2012) B Original Ordinal
C5 What problems do you
experience with food labels?
Van Der Merwe et al.
(2012)
26 Edited Ordinal
Likert
C6 Do you do the following things
when you buy food?
Van Staden (2012) 19 Edited Ordinal
Likert
C7 Please tell me when do you use
the information on a label?
Van Staden (2012) 45-46 Edited Ordinal
Likert
C8 Do the following tell you
something about the quality of
the food?
Van Staden (2012) 47-54 Edited Nominal
C9 Please tell me the following on
the food label. Show card 1.
Van Staden (2012) 13 Edited
C10 Please tell me the meaning of
the symbol to you?
Van Der Merwe et al.
(2012)
48-51 Edited
C11 Please work out the following.
Show card 2.
Van Staden (2012) 24-26 Edited
C12 Can you identify (tell the names
of), the following shops? Show
card 3.
Van Staden (2012) 30-38 Edited
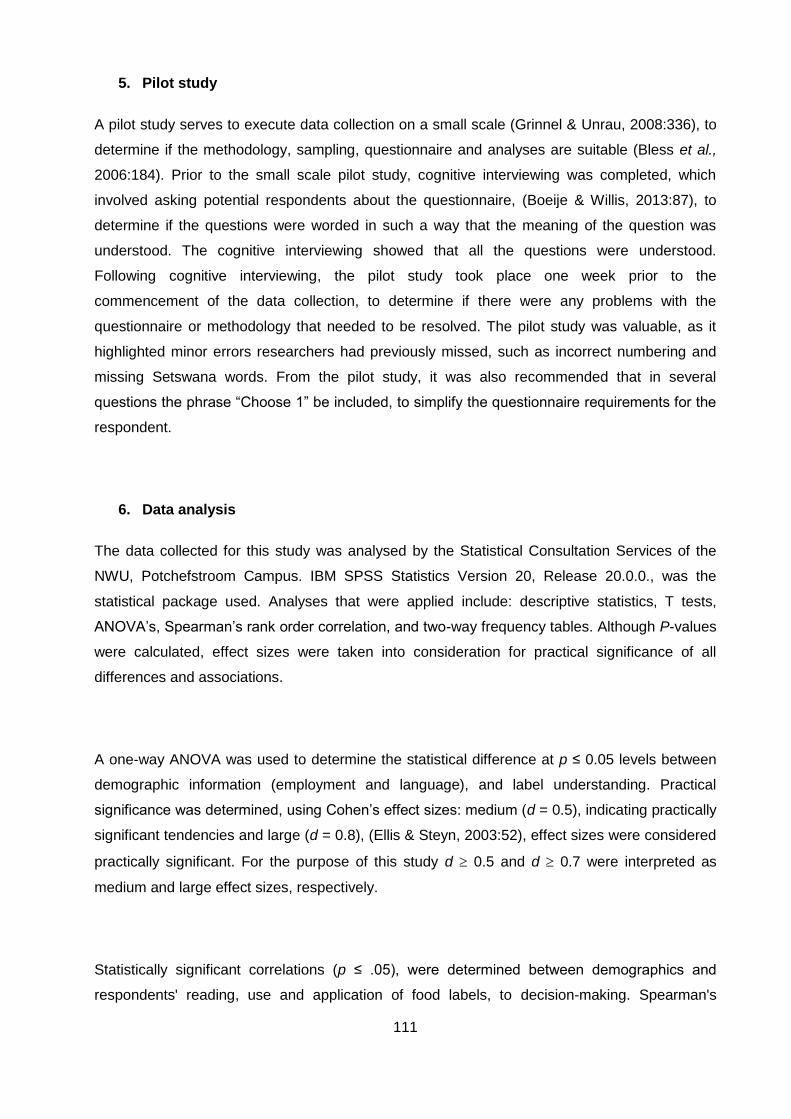
111
5. Pilot study
A pilot study serves to execute data collection on a small scale (Grinnel & Unrau, 2008:336), to
determine if the methodology, sampling, questionnaire and analyses are suitable (Bless et al.,
2006:184). Prior to the small scale pilot study, cognitive interviewing was completed, which
involved asking potential respondents about the questionnaire, (Boeije & Willis, 2013:87), to
determine if the questions were worded in such a way that the meaning of the question was
understood. The cognitive interviewing showed that all the questions were understood.
Following cognitive interviewing, the pilot study took place one week prior to the
commencement of the data collection, to determine if there were any problems with the
questionnaire or methodology that needed to be resolved. The pilot study was valuable, as it
highlighted minor errors researchers had previously missed, such as incorrect numbering and
missing Setswana words. From the pilot study, it was also recommended that in several
questions the phrase “Choose 1” be included, to simplify the questionnaire requirements for the
respondent.
6. Data analysis
The data collected for this study was analysed by the Statistical Consultation Services of the
NWU, Potchefstroom Campus. IBM SPSS Statistics Version 20, Release 20.0.0., was the
statistical package used. Analyses that were applied include: descriptive statistics, T tests,
ANOVA‟s, Spearman‟s rank order correlation, and two-way frequency tables. Although P-values
were calculated, effect sizes were taken into consideration for practical significance of all
differences and associations.
A one-way ANOVA was used to determine the statistical difference at p ≤ 0.05 levels between
demographic information (employment and language), and label understanding. Practical
significance was determined, using Cohen‟s effect sizes: medium (d = 0.5), indicating practically
significant tendencies and large (d = 0.8), (Ellis & Steyn, 2003:52), effect sizes were considered
practically significant. For the purpose of this study d 0.5 and d 0.7 were interpreted as
medium and large effect sizes, respectively.
Statistically significant correlations (p ≤ .05), were determined between demographics and
respondents' reading, use and application of food labels, to decision-making. Spearman's

112
correlation coefficients (r-value) vary, and scores of ≥ 0.25 indicate a medium effect size, and
≥ 0.40, a large effect size (Ellis & Steyn 2003:53). Large effect sizes indicated practical
significance, whilst medium coefficients indicate practically significant tendencies. Only r- values
≥ 0.25 were reported in this study. Bivariate analyses were conducted, including cross
tabulations as measures of association between variables. Cramer‟s V measured the strength of
the association between categorical variables (Field, 2009:727), where values ≥ 0.25 are
considered medium, and ≥ 0.40 are considered large, and indicated practical significance.
7. Ethical considerations
Ethical approval for this study was obtained from the Ethical Committee of the North-West
University (NWU), under the umbrella project, namely, “Sustainable livelihoods, health and well-
being in rural communities in South Africa – a trans disciplinary multi-level approach” (NWU-
00040-13-A1). An application for approval for this sub-study of the umbrella project was
submitted, after receiving the approval of the research proposal. In addition to the aspects
addressed in the ethical application, the following considerations deserve to be mentioned:
Potential respondents were not forced to participate in the study, as participation was
completely voluntary (Babbie, 2010:64; Christensen et al., 2011:106), and participants
were given the opportunity to withdraw from the study at any time (Leedy & Ormrod,
2010:101; Mechling & Gast, 2010:34).
Before the respondents answered the questionnaire, they were required to agree to a
consent form, where they gave their permission to participate in the study, after being
informed about any possible risks the study may have posed (Babbie, 2010:66;
Christensen et al., 2011:106). The consent form was verbally accepted after the
respondent had first been read a letter by the field worker, which provided the
researcher‟s personal details and contact information (Leedy & Ormrod, 2010:102).
The procedures employed in this study ensured that respondents were not harmed,
physically or emotionally (Christensen et al., 2012:107; Mechling & Gast, 2010:34), and
that personal information that could embarrass them (such as monthly income and
literacy level), was not revealed (Babbie, 2010:65). Furthermore, during the cognitive
interviewing process, if a respondent did not understand something, or gave the
incorrect answer, the researcher acted with sensitivity - not allowing the respondent to
see that the answer was incorrect.
The data collected in the study was also kept partly confidential (Christensen et al.,
2011:124; Leedy & Ormrod, 2010:102), meaning that data is not publicly available and

113
only accessed for research purposes, with permission from the NWU. As respondents
did not reveal their name or identity number, partial confidentiality was ensured.
The raw data is currently stored and archived in locked cabinets in building F15
(Consumer Sciences), of the Potchefstroom campus of the NWU, and will remain there
for at least seven years. Permission to see the original data needs to be obtained from
the NWU. The data was also coded and computerised and protected by a unique
password, kept by the principle researcher. The data will be destroyed after the
completed storage period, according to the regulations of the NWU.
The researcher also ensured that when the dissertation was written, information was not
falsified, data was represented as accurately as possible, and that plagiarism was not
committed (Christensen et al., 2011:128).
The researcher acted at all times with sensitivity and was aware of the disruption that the
study may cause (Mechling & Gast, 2010:39), to the Valspan community. The
researcher was also supervised by knowledgeable and experienced researchers
(Mechling & Gast, 2010:54), who ensured that the correct ethical practices were
followed.
8. Validity and reliability
Validity involves determining the extent to which the instrument (questionnaire), measures what
it is supposed to measure (Leedy & Ormrod, 2010:28; Pietersen & Maree, 2010:216; Singh,
2007:77). For this study, validity thus included how successfully the questionnaire was able to
measure functionally low-literate consumer‟s use of food labels in a rural area.
Construct validity measured how valid the instrument was in testing different constructs
(Pietersen & Maree, 2010:217). Exploratory factor analysis was performed on the literacy
assessment (Annexure 5), question C9; question C10; and question C13, to determine
construct validity, to determine if the variables shared any common underlying dimensions
(Bordens & Abbott, 2011:467), and to determine if the variables being investigated were
interrelated or not (Christensen et al., 2011:146). The Kaiser–Meyer–Olkin measure of sampling
adequacy was used to determine the relevance of factor analysis, and ranged from 0.69 to 0.81,
where values between 0.5 and 0.7 were considered medium, between 0.7 and 0.8 were
considered good, and between 0.8 and 0.9, exemplary (Hutcheson & Sofroniou, 1999, 224-
225). Principal axis factoring was performed and an Oblimin oblique rotation was used, with the
delta set at 0, suggesting less correlated factors (Field, 2009:644) were derived from the data.
The extracted factors all explained over 50% of the total variance in each scale, and the

114
communalities ranged from 0.30 to 0.80, suggesting factors represented different proportions of
common variance (Field, 2009:637). Ideal communalities exceeded 0.3 (Hair et al., 1998), and
all communalities, except one, were considered ideal. This communality (.16), suggests minimal
variance was explained by the factors for this item (Field, 2009:637), which was consequently
removed.
Face validity refers to the degree to which the instrument looked valid (Christensen et al.,
2011:146; Pietersen & Maree, 2010:217). In order to ensure face validity, cognitive interviewing
was completed as part of the pilot study. Cognitive interviewing involved asking potential
respondents about the questions in the questionnaire (not answers to the questions), (Boeije &
Willis, 2013:87), to determine if respondents‟ were able to understand each of the questions in
the questionnaire. All questions were understood. As the questionnaire was reviewed by a
panel of experts in consumer science and literacy, as well as experts from the NWU Statistical
Consultation Services, it was considered face valid.
Content validity describes how valid research is with regard to the construct covering the
content it is set out to measure (Bordens & Abbott, 2011:133; Pietersen & Maree, 2010:217). In
this study, the construct used was a combination of questionnaires, which were successfully
used in previous studies. Again, cognitive interviewing was used to determine if respondents
understood the questions in the questionnaire or not, thus adding to content validity.
Furthermore, because the questionnaire was reviewed by experts, its content can be
considered valid.
The questionnaires used to compile the questionnaire for this study were successfully used in
previous studies, which contributes to the reliability of the instrument. Cronbach‟s alpha was
used to measure internal reliability of the questionnaire, and ensure the questions in the
questionnaire measured the same construct (Christensen et al., 2011:144), through inter-item
correlation (Pietersen & Maree, 2010:216). Values ≥ 0.7 were accepted, to indicate acceptable
internal reliability, and in cases where psychological constructs, such as literacy, were being
measured, values ≤ 0.7 were also accepted, as indicated by Kline (1999). Since the
questionnaire was administered to respondents by field workers, the reliability of this study will
also depend on how consistent or dependable the field worker was, and how honestly the
questions were answered by the respondents. Care was thus taken in the proper training of field
workers, to ensure field worker reliability.

115
9. Reference list
Babbie, E. 2010. 12th ed. Practical social research. Belmont: Wadsworth.
Bless, C., Higson-Smith, C. & Kagee, A. 2007. Fundamentals in social research methods: an
African perspective. Cape Town: Juta.
Boejie, H. & Willis, G. 2013. The cognitive interviewing reporting framework (CIRF). Towards
the harmonization of cognitive testing reports. Methodology, 9(3):87-95.
Bordens, K.S. & Abbott, B.B. 2011. 8th ed. Research design and methods. New York
:McGraw Hill.
Christensen, L.B., Johnson, R.B., Turner, L.A. 2011. 11th ed. Research methods, design and
analysis. Boston: Pearson.
Ellis, S.M. & Steyn, H.S. 2003. Practical significance (effect sizes) versus or in combination
with statistical significance (p-values), Management Dynamics, 12(4):51-53.
Field A. 2009. Discovering Statistics Using SPSS. London: SAGE publications
Fouché, C.B. & De Vos, A.S. 2011. 4th ed. Formal formulations. (In Research at grassroots
level for the social sciences and human profession. Pretoria: Van Schaik. p. 89-100).
Fouché, C.B. & Delport, C.S.L. 2011. 4th ed. Introduction to the research process. (In
Research at grassroots level for the social sciences and human profession. Pretoria: Van
Schaik. p. 64-76).
Grinnell, R.M & Unrau, Y.A. 2008. Social work research and evaluation: foundations of
evidence based practice. New York: Oxford University Press.
Hair, J.R., Anderson, R.E., Tatham, R.L., & Black, W.C. 1998. Multivariate data analysis.
Prentice-Hall, New Jersey.
Hutcheson, G. & Sofroniou, N. 1999. The multivariate social scientist. London: Sage.
Kline, P. 1999. The handbook of psychological testing. London: Routledge.
Leedy, P.D. & Ormrod, J.E. 2010. 9th ed. Practical research planning and design. Boston:
Pearson.
Maree, K. & Pietersen, J. 2010a. Sampling. (In First steps in research. Pretoria: Van Schaik.
p. 171-181).

116
Maree, K. & Pietersen, J. 2010b. Surveys and the use of questionnaires. (In First steps in
research. Pretoria: Van Schaik. p. 154-170).
Maree, K. & Pietersen, J. 2010c. The quantitative research process. (In First steps in
research. Pretoria: Van Schaik. p. 144-153).
Mechling, L. & Gast, D.L. 2010. Ethical principles and practice. (In Single subject research
methodology in behavioural sciences. New York: Routledge. p. 32-56).
Nieuwenhuis, J. 2010. Introducing qualitative design. (In First steps in research. Pretoria: Van
Schaik. p. 46-68).
Pietersen, J. & Maree, K. 2010. Standardisation of a questionnaire. (In First steps in research.
Pretoria: Van Schaik. p. 214-223).
Posel, D. 2011. Adult literacy rates in South Africa: a comparison of different measures.
Language matters: studies in the languages of Africa, 42(1):39-49.
Singh, K. 2007. Quantitative social research methods. New Delhi: Sage.
Van der Merwe, D., Bosman, M., Ellis, S., de Beer, H. & Mielmann, A. 2012. Consumers'
knowledge of food label information: an exploratory investigation in Potchefstroom, South
Africa. Public health nutrition. 16(3):403-408.
Van Staden, J. 2012. The use of clothing labels by female black low-literate consumers.
Potchefstroom: NWU. (Thesis – PhD).

117
Annexure 3: Ethical approval for study

118
Annexure 4: Consent form
September 2013
THE PURPOSE OF THIS STUDY IS TO EXPLORE AND DESCRIBE FUNCTIONALLY LOW-
LITERATE CONSUMERS’ USE OF FOOD LABELS.
To all respondents
Miss Fay Irvine is doing a study about adults‟ use of food labels. The adults that she needs to
help her are those who only finished between grades 5 and 8 at school.
If you would like to be a part of this study and complete the questionnaire, it will be out of your
own free will, and if at any time you want to stop answering the questions you may do so. The
field worker will fill your answers in on the paper. You will not have to give your name and the
questions you answer won‟t be shown to anyone else.
The information from your answers will be used to help you make good food choices in the
future. Please, it is important to answer all the questions that are asked.
Thank you for your help
Miss Fay Irvine
Supervisor: Prof M. van der Merwe
Co-supervisor: Prof M. Bosman
Co-supervisor: Dr H. Van Staden
CONTACT DETAILS
Phone: 018 299 2470 / 018 299 2476
E mail: [email protected]

119
Annexure 5: Additional results tables
DESCRIPTIVE ANALYSIS FOR ALL QUESTIONS IN THE QUESTIONNAIRE PRESENTED
IN TABLES 1-13
Table 1: Descriptive analysis of literacy assessment
Question number
Question Incorrect (%) Correct (%)
A1.1 What is peanut butter made from? 4.6 95.4
A1.2 What is peanut butter used for? 5.4 94.6
A1.3 What vitamins are found in peanut butter? 16.8 83.2
A1.4.1 Select the most suitable answer to describe the word below. (manufactured)
47.2 52.8
A1.4.2 Select the most suitable answer to describe the word below. (allergy)
29.6 70.4
A2.1 What country receives the most bananas from South Africa? 13.8 86.2
A2.2 What country receives the least bananas from South Africa? 18.7 81.3
A3.1 How many cokes are in one box? 10.0 90.0
A3.2 How many cokes are there in two boxes? 18.0 82.0
A4.1 What was the most popular brand of milk? 10.0 90.0
A4.2 What was the total number of votes for all 3 milks? 37.4 62.6
A5.1 Which coffee tin will provide the best value for money? 36.9 63.1
Table 2: Food label use (reading)
Question number
Question Yes (%) No (%)
C1 Have you ever noticed the food label information on food products?
65.6 34.4
Table 3: Frequency of food label use
Question number
Question Often (%)
Sometimes (%)
Never (%)
Mean SD
C2 How often do you make use of food labels?
19.1 66.9 14 1.95 0.57
SD = standard deviation Often=1; Sometimes=2; Never=3

120
Table 4: Frequency of food shopping
Question number
How often do you shop for food? Yes (%)
Mean SD
C3a Once a month 70.0
1.54 0.93 C3b Once in two weeks 16.8
C3c Once a week 4.3
C3d Two or more times a week 8.9
SD = standard deviation Table 5: Different resources used to read food labels
Question no
Who do you ask to help you read food labels?
Often (%)
Sometimes (%)
Never (%)
Mean SD #Rank order
C4a I read myself
72.3 18.1 9.2 1.38 0.67 1
C4b A friend 13.3 49.5 37.2 2.24 0.67 5
C4c A family member
37.4 48.0 14.6 1.77 0.69 3
C4d My child 54.6 25.0 20.4 1.66 0.80 2 C4e The store
assistant 25.4 34.8 39.8 2.14 0.80 4
SD = standard deviation Often=1; Sometimes=2; Never=3 #Rank order according to frequency of consulting the source to read labels „often‟
Table 6: Reasons for not reading food labels
Question no
Problems with food labels
Often (%)
Sometimes (%)
Never (%)
Mean SD #Rank order
C5a Too much time to read
39.6 43.7 16.8 1.77 0.72 3
C5b Too many words on label
43.5 42.3 14.2 1.71 0.70 2
C5c Don‟t understand words
29.3 44.0 26.6 1.97 0.75 6
C5d Words too small to read
48.9 34.7 16.4 1.68 0.74 1
C5e Do not trust labels
31.4 40.9 27.7 1.96 0.77 5
C5f Labels are not important
33.2 33.6 33.2 2.00 0.82 4
C5g Can‟t find information
18.4 43.1 38.5 2.20 0.73 8
C5h Do not read food labels
26.1 39.4 34.4 2.08 0.78 7
SD = standard deviation Often=1; Sometimes=2; Never=3 #Rank order according to frequency of consulting the source to read labels „often‟

121
Table 7: Product related calculation techniques displayed by functionally low-literate respondents
Question no
Calculation technique
Often (%)
Sometimes (%)
Never (%)
Mean SD Rank order
C6a Use cell phone to calculate total price
52.5 27.1 20.4 1.70 0.79 2
C6b Ask someone to help calculate total price
21.4 38.2 40.4 2.19 0.76 5
C6c Calculate cost in head 34.7 38.0 27.4 1.93 0.79 4
C6d Pay for food products one at a time
42.6 31.8 25.6 1.83 0.81 3
C6e Check for enough money in purse
75.7 15.9 8.3 1.33 0.62 1
SD = standard deviation Often=1; Sometimes=2; Never=3 #Rank order according to frequency of consulting the source to read labels „often‟
Table 8: Application of food label information, pre- and post-purchase
Question number
When information on the label is used
Often (%)
Sometimes (%)
Never (%)
Mean SD
C7a In the shop 46.1 38.6 15.4 1.70 0.72
C7b At home 42.2 40.1 17.7 1.76 0.74
SD = standard deviation Often=1; Sometimes=2; Never=3
Table 9: Food label quality indicators
Question number
Do the following tell you something about the quality of the food?
Yes (%) No (%)
C8a Best before date 95.4 4.6
C8b Appearance of product 90.0 33.5
C8c Price 88.0 6.5
C8d Brand name 77.9 22.1
C8e The store where you buy (Shoprite, Choppies etc) 83.0 17.0

122
Table 10: Understanding of different aspects of the food label
Question number
Question Correct (%)
Incorrect (%)
C9 Please tell me the following on the food label (Show card 1)
C9a What vitamin is in the maize 63.8 36.2
C9b What is the best before date 81.0 19.0
C9c What is the brand of the maize 59.0 20.3
C9d What is the weight of the product 86.6 13.4
C9e How many kilojoules are in 100g of this food? 10.8 89.2
C9f How much fat is in 100g of this food? 12.5 87.5
C9g How much dietary fibre is in 100g of this food? 14.5 85.5
Table 11: Understanding of food label symbols
Question number
Question Correct (%)
Incorrect (%)
C10 Please tell me the meaning of the symbol to you
C10a Recycle 26.6 73.4
C10b Vegetarian 4.2 95.8
C10c Heart Foundation 5.3 94.7
C10d Halaal 9.9 90.1
Table 12: Food product related calculations
Question number
Question Correct (%)
Incorrect (%)
C11 Please work out the following (Show card 2)
C11a How much is the total price of a Ricoffy and a tea. One is R35 the other R20? 95.1 4.9
C11b The price of the noodles is R5.00 and the label says 50% off. What does it cost now?
33.7 66.3
C11c The four drumsticks cost R20. What does one cost? 88.9 11.1

123
Table 13: Identification of store logos
Question number
Question Correct (%)
Incorrect (%)
C12 Can you identify (tell the names of) the following shops (Show card 3)
C12a Pick n Pay 85.0 15.0
C12b Checkers 88.2 11.8
C12c Spar 61.7 38.3
C12d Choppies 79.1 20.9
C12e Shoprite 81.1 18.9
C12f OK 79.5 20.5

124
FACTOR ANALYSIS OF RESPONDENTS UNDERSTANDING OF THE LITERACY
ASSESSMENT AND VARIOUS ASPECTS OF THE FOOD LABEL (TABLES 14-16)
Table 14: Summary of exploratory factor analysis of the literacy assessment Test (N =292)
Item
Factor loading
1 –Comparison literacy
2 – Comprehension literacy
3 – Numerical addition literacy
4 – Higher order thinking / application literacy
Comprehension question – peanut butter
. 0.792
Comprehension question – peanut butter
0.568 -0.241
Comprehension question – peanut butter
0.337 0.409
Multiple choice – meaning of manufactured
0.698 -0.332
Multiple choice – meaning of allergy
0.632 -0.325
Comparison numeracy question – banana percentages
0.490 0.550
Comparison numeracy question - banana percentages
0.327 0.753
Numeracy question – counting cokes
0.393 -0.620
Numeracy question – multiplication cokes
-0.291 0.295 0.649
Comparison numeracy question – comparing milk
0.617
Comparison numeracy question- counting milk
0.576
Comparison numeracy question – value for money coffee
0.627
Range of communalities
0.38 -0.56 0.34-0.64 0.57-0.75 0.42-0.64
Chronbach alpha coefficient
0.23 0.42 0.60 -0.4
Total variance explained by extracted sub-factors (%) 52.02
KMO 0.69
Factor loadings indicated in bold are grouped together

125
Table 15: Summary of exploratory factor analysis of respondents understanding of
food labels (N = 292)
Item
Factor loading
1 – Simple, obvious information
2 – Complex nutrition related information
What vitamin is in the maize? 0.39
What is the best before date? 0.77
What is the brand of the maize? 0.68
What is the weight of the product 0.82
How many kilojoules are in 100g of this food?
0.85
How much fat is in 100g of this food? 0.90
How much dietary fibre is in 100g of this food?
0.89
Range of communalities 0.42-0.67 0.16-0.80
Chronbach alpha coefficient 0.62 0.72
Mean factor score ± SD 81.85 ±29.01 25.0 ±27.34
Total variance explained by extracted sub-factors (%) 59.61
KMO 0.716
SD =standard deviation

126
Table 16: Summary of exploratory factor analysis of respondents’ understanding of food related symbols (N = 292)
Item
Factor loading
1 – ability to correctly identify food symbols
Recycle 0.91
Vegetarian 0.90
Heart foundation 0.82
Halaal 0.79
Total variance explained by extracted sub-factors (%) 56.34
Range of communalities 0.70-0.79
KMO 0.740
Chronbach alpha coefficient 0.70
Mean ± SD (SD)
11.21 ± 21.95
30 SD = standard deviation
Table 17: Summary of exploratory factor analysis of respondents ability to recognise store logos (N = 292)
Item
Factor loading
1 – Ability to correctly identify store logo
Pick n Pay 0.734
Checkers 0.760
Spar 0.599
Choppies 0.859
Shoprite 0.856
OK grocers 0.788
Total variance explained by extracted sub-factors (%)
59.42
Range of communalities 0.30-0.74
KMO 0.81
Chronbach alpha coefficient 0.85
Mean factor score ± SD 79.07± 29.88
SD = standard deviation

127
CORRELATIONS BETWEEN DEMOGRAPHICIAL VARIABLES, LITERACY AND FOOD
LABELS (TABLES 18-20)
Table 18: Correlation matrix between demographical characteristics and literacy using Spearman’s rank order correlation (r)
Complex nutrition related information
Children assist reading labels
Use a cell-phone to calculate the price of 2 or more products
Age -0.167 -0.301* 0.254*
Income 0.251* 0.087 0.079
*Medium effect size
**Large effect size
Table 19: Correlations between literacy and food label use, using Spearman’s rank order correlation (r)
Literacy
Complex nutrition related information 0.428*
Food label symbols 0.266*
Store logos 0.291*
Calculation – R20 + R35 0.255*
Calculation - 50% off product 0.285*
Noticed food labels 0.277*
*Medium effect size
**Large effect size
Table 20: Correlation matrix between food related symbols, complex nutrition related information and food product calculations, using Spearman’s rank order correlation (r)
Ability to correctly identify food related symbols
50% off Complex nutrition related information
Ability to correctly identify food related symbols
1.00 0.46** 0.53**
50% off 0.46** 1.00 0.30*
Complex nutrition related information
0.53** 0.30* 1.00
*Medium effect size
**Large effect size

128
Annexure 6: Author guidelines
INTERNATIONAL JOURNAL OF EMERGING MARKETS
Manuscript requirements
Please prepare your manuscript before submission, using the following guidelines:
Format All files should be submitted as a Word document
Article Length Articles should be a maximum of 6000 words in length. This includes
all text including references and appendices. Please allow 280 words
for each figure or table.
Article Title A title of not more than eight words should be provided.
Article Title Page An Article Title Page should be submitted alongside each individual
article using the template provided. This should include:
Article Title
Author Details (see below)
Acknowledgements
Author Biographies
Structured Abstract (see below)
Keywords (see below)
Article Classification (see below)
Author Details Details should be supplied on the Article Title Page including:
Full name of each author
Affiliation of each author, at time research was completed
Where more than one author has contributed to the article,
details of who should be contacted for correspondence
E-mail address of the corresponding author
Brief professional biography of each author.
Structured Abstract Authors must supply a structured abstract on the Article Title Page,
set out under 4-7 sub-headings (see our "How to... write an abstract"

129
guide for practical help and guidance):
Purpose (mandatory)
Design/methodology/approach (mandatory)
Findings (mandatory)
Research limitations/implications (if applicable)
Practical implications (if applicable)
Social implications (if applicable)
Originality/value (mandatory)
Maximum is 250 words in total (including keywords and article
classification, see below).
Keywords Please provide up to 10 keywords on the Article Title Page, which
encapsulate the principal topics of the paper (see our "How to... ensure
your article is highly downloaded" guide for practical help and guidance
on choosing search-engine friendly keywords).
Whilst we will endeavour to use submitted keywords in the published
version, all keywords are subject to approval by Emerald‟s in house
editorial team and may be replaced by a matching term to ensure
consistency.
Article
Classification
Categorize your paper on the Article Title Page, under one of these
classifications:
Research paper
Viewpoint
Technical paper
Conceptual paper
Case study
Literature review
General review.
Headings Headings must be concise, with a clear indication of the distinction
between the hierarchy of headings.

130
The preferred format is for first level headings to be presented in bold
format and subsequent sub-headings to be presented in medium
italics.
Notes/Endnotes Notes or Endnotes should be used only if absolutely necessary and
must be identified in the text by consecutive numbers, enclosed in
square brackets and listed at the end of the article.
Research Funding Authors must declare all sources of external research funding in their
article and a statement to this effect should appear in the
Acknowledgements section. Authors should describe the role of the
funder or financial sponsor in the entire research process, from study
design to submission.
Figures All Figures (charts, diagrams, line drawings, web pages/screenshots,
and photographic images) should be submitted in electronic form.
All Figures should be of high quality, legible and numbered
consecutively with arabic numerals. Graphics may be supplied in
colour to facilitate their appearance on the online database.
Figures created in MS Word, MS PowerPoint, MS Excel,
Illustrator should be supplied in their native formats. Electronic
figures created in other applications should be copied from the
origination software and pasted into a blank MS Word
document or saved and imported into an MS Word document or
alternatively create a .pdf file from the origination software.
Figures which cannot be supplied in as the above are
acceptable in the standard image formats which are: .pdf, .ai,
and .eps. If you are unable to supply graphics in these formats
then please ensure they are .tif, .jpeg, or .bmp at a resolution of
at least 300dpi and at least 10cm wide.
To prepare web pages/screenshots simultaneously press the
"Alt" and "Print screen" keys on the keyboard, open a blank
Microsoft Word document and simultaneously press "Ctrl" and
"V" to paste the image. (Capture all the contents/windows on
the computer screen to paste into MS Word, by simultaneously

131
pressing "Ctrl" and "Print screen".)
Photographic images should be submitted electronically and of
high quality. They should be saved as .tif or .jpeg files at a
resolution of at least 300dpi and at least 10cm wide. Digital
camera settings should be set at the highest resolution/quality
possible.
Tables Tables should be typed and included in a separate file to the main
body of the article. The position of each table should be clearly labelled
in the body text of article with corresponding labels being clearly shown
in the separate file.
Ensure that any superscripts or asterisks are shown next to the
relevant items and have corresponding explanations displayed as
footnotes to the table, figure or plate.
References References to other publications must be in Harvard style and
carefully checked for completeness, accuracy and consistency. This is
very important in an electronic environment because it enables your
readers to exploit the Reference Linking facility on the database and
link back to the works you have cited through CrossRef.
You should cite publications in the text: (Adams, 2006) using the first
named author's name or (Adams and Brown, 2006) citing both names
of two, or (Adams et al., 2006), when there are three or more authors.
At the end of the paper a reference list in alphabetical order should be
supplied:
For books Surname, Initials (year), Title of Book, Publisher, Place of publication.
e.g. Harrow, R. (2005), No Place to Hide, Simon & Schuster, New
York, NY.
For book chapters Surname, Initials (year), "Chapter title", Editor's Surname, Initials, Title
of Book, Publisher, Place of publication, pages.
e.g. Calabrese, F.A. (2005), "The early pathways: theory to practice –

132
a continuum", in Stankosky, M. (Ed.), Creating the Discipline of
Knowledge Management, Elsevier, New York, NY, pp. 15-20.
For journals Surname, Initials (year), "Title of article", Journal Name, volume,
number, pages.
e.g. Capizzi, M.T. and Ferguson, R. (2005), "Loyalty trends for the
twenty-first century", Journal of Consumer Marketing, Vol. 22 No. 2,
pp. 72-80.
For published
conference
proceedings
Surname, Initials (year of publication), "Title of paper", in Surname,
Initials (Ed.), Title of published proceeding which may include place
and date(s) held, Publisher, Place of publication, Page numbers.
e.g. Jakkilinki, R., Georgievski, M. and Sharda, N. (2007), "Connecting
destinations with an ontology-based e-tourism planner", in Information
and communication technologies in tourism 2007 proceedings of the
international conference in Ljubljana, Slovenia, 2007, Springer-Verlag,
Vienna, pp. 12-32.
For unpublished
conference
proceedings
Surname, Initials (year), "Title of paper", paper presented at Name of
Conference, date of conference, place of conference, available at: URL
if freely available on the internet (accessed date).
e.g. Aumueller, D. (2005), "Semantic authoring and retrieval within a
wiki", paper presented at the European Semantic Web Conference
(ESWC), 29 May-1 June, Heraklion, Crete, available at: http://dbs.uni-
leipzig.de/file/aumueller05wiksar.pdf (accessed 20 February 2007).
For working papers Surname, Initials (year), "Title of article", working paper [number if
available], Institution or organization, Place of organization, date.
e.g. Moizer, P. (2003), "How published academic research can inform
policy decisions: the case of mandatory rotation of audit
appointments", working paper, Leeds University Business School,
University of Leeds, Leeds, 28 March.
For encyclopedia Title of Encyclopedia (year) "Title of entry", volume, edition, Title of

133
entries
(with no author or
editor)
Encyclopedia, Publisher, Place of publication, pages.
e.g. Encyclopaedia Britannica (1926) "Psychology of culture contact",
Vol. 1, 13th ed., Encyclopaedia Britannica, London and New York, NY,
pp. 765-71.
(For authored entries please refer to book chapter guidelines above)
For newspaper
articles (authored)
Surname, Initials (year), "Article title", Newspaper, date, pages.
e.g. Smith, A. (2008), "Money for old rope", Daily News, 21 January,
pp. 1, 3-4.
For newspaper
articles (non-
authored)
Newspaper (year), "Article title", date, pages.
e.g. Daily News (2008), "Small change", 2 February, p. 7.
For electronic sources If available online, the full URL should be supplied at the end of the
reference, as well as a date that the resource was accessed.
e.g. Castle, B. (2005), "Introduction to web services for remote
portlets", available at: http://www-
128.ibm.com/developerworks/library/ws-wsrp/ (accessed 12 November
2007).
Standalone URLs, i.e. without an author or date, should be included
either within parentheses within the main text, or preferably set as a
note (roman numeral within square brackets within text followed by the
full URL address at the end of the paper).

134
Annexure 7: Proof of language editing of document
3 Tuscany Grove
298 South Ridge Road
Durban 4019
To whom it may concern:
Dr Phil Joffe is the holder of a B. Hons degree in English, University of Natal, 1964, M.A.
degree in English, University of British Columbia, Canada, 1968, and the Ph D. degree, in
English, from Westfield College, London University, 1978.
He has lectured English and Media Studies for more than 30 years and is qualified to edit M.A.
and Ph. D. degrees in the English language.
I have read and edited Fay Irvine’s M. A. Thesis, and she has made all changes, to my
satisfaction.
Sincerely
(Dr) Phil Joffe

135
Annexure 8: Proof of submission to Turnitin
From: Turnitin No Reply <[email protected]> Thursday - March 20, 2014 7:36 PM
To: [email protected]; [email protected]
Subject: This is your Turnitin Digital Receipt
Dear FAY IRVINE,
You have successfully submitted the file "21684146:Chapter_1_turnitin_20_March.docx" to the
assignment "Chapter 1 _Final" in the class "e68c741a-1e33-4335-9272-89633653387c" on 20-
Mar-2014 07:35PM. Your full digital receipt can be downloaded from the download button in
your class assignment list in Turnitin or from the print/download button in the document viewer.
Thank you for using Turnitin,
The Turnitin Team
From: Turnitin No Reply <[email protected]> Monday - March 24, 2014 2:13 PM
To: [email protected]; [email protected]
Subject: This is your Turnitin Digital Receipt
Dear FAY IRVINE,
You have successfully submitted the file "21684146:Chapter_2_turnitin.doc" to the assignment
"Finale M-literatuurstudie" in the class "e68c741a-1e33-4335-9272-89633653387c" on 24-Mar-
2014 02:13PM. Your full digital receipt can be downloaded from the download button in your
class assignment list in Turnitin or from the print/download button in the document viewer.
Thank you for using Turnitin,
The Turnitin Team
From: Turnitin No Reply <[email protected]> Wednesday - March 26, 2014 5:36 PM
To: [email protected]; [email protected]
Subject: This is your Turnitin Digital Receipt
Dear FAY IRVINE,
You have successfully submitted the file "21684146:Annexures_turnitin_26_March.docx" to the
assignment "Methodology - Appendix" in the class "e68c741a-1e33-4335-9272-89633653387c"
on 26-Mar-2014 05:36PM. Your full digital receipt can be downloaded from the download
button in your class assignment list in Turnitin or from the print/download button in the
document viewer.

136
Thank you for using Turnitin,
The Turnitin Team
Print this page
This is your Turnitin Digital Receipt
From: Turnitin No Reply <[email protected]>
To: [email protected]; [email protected]
Date: Friday - May 9, 2014 11:38 AM
Subject: This is your Turnitin Digital Receipt
Attachments: TEXT.htm; Mime.822
Dear FAY IRVINE,
You have successfully submitted the file
"21684146:Fay_Irvine_Conclusion,_recommendations_and_limitations_Turnitin_9_May.docx"
to the assignment "Finale Hoofstuk - Conclusion" in the class "e68c741a-1e33-4335-9272-
89633653387c" on 09-May-2014 11:37AM. Your submission id is 425744435. Your full digital
receipt can be downloaded from the download button in your class assignment list in Turnitin or
from the print/download button in the document viewer.
Thank you for using Turnitin,
The Turnitin Team
Print this page
This is your Turnitin Digital Receipt
From: Turnitin No Reply <[email protected]>
To: [email protected]; [email protected]
Date: Thursday - May 8, 2014 6:18 PM
Subject: This is your Turnitin Digital Receipt
Attachments: TEXT.htm; Mime.822
Dear FAY IRVINE,
You have successfully submitted the file "21684146:Fay_Irvine_article_turnitin_8_May.docx" to
the assignment "Research article (chapter 3) Final" in the class "e68c741a-1e33-4335-9272-
89633653387c" on 08-May-2014 06:17PM. Your submission id is 425442180. Your full digital
receipt can be downloaded from the download button in your class assignment list in Turnitin or
from the print/download button in the document viewer.

137
Thank you for using Turnitin,
The Turnitin Team

138
Annexure 9: Questionnaire and show cards used in the study
Functionally low-literate consumers‟ use
of food labels in the rural area of
Valspan in the North West Province of
South Africa.
Researcher: Fay Irvine
September 2013

139
A. FUNCTIONAL LITERACY TEST /: TEKO YA BOKGONI JWA GO BALA LE GO KWALA
1. Peanut butter is a food paste made primarily from ground dry roasted peanuts. Peanut butter is used
mainly as a sandwich spread but can also be used for baking and to make other snacks. Peanut butter
(and peanuts) provides protein, vitamins B and E, magnesium and fibre. For people with a peanut
allergy, peanut butter can cause reactions, including anaphylactic shock. Below is a peanut butter label.
/ Sereledi sa Matonkomane ke sereledi se bogolo se dirilweng ka matonkomane a a omileng a a
besitsweng. Sereledi sa Matonkomane thata se dirisiwa go tshasa mo borothong mme se ka dirisiwa
gape go baka le go dira dijo dingwe. Sereledi sa Matonkomane(le matonkomane) se re fa poroteine,
dibitamini tsa B le E le magenesiamo le faebara. Mo bathong ba ba sa kgoneng go ja matonkomane
Sereledi sa Matonkomane se tlisa ditsibogo jaaka letshogo le go roroma. Ka mo tlase go na le pampiri
ya lebotlolo la Sereledi sa Matonkomane.
1.1 What is peanut butter made from? / Sereledi sa
Matonkomane se dirilwe ka eng
1.2 What is peanut butter used for? / Sereledi sa
Matonkomane se dirisiwa eng?
1.3 What vitamins are found in peanut butter? /
Sereledi sa Matonkomane se na le dibitamini dife?
1.4 Select the most suitable answer to describe the word below: (Choose one) /
Batla karabo e e siameng go feta go ka tlhalosa lefoko mo tlase: (Tlhopha e le nngwe)
1.4.1 Manufactured / Bopilwe
a) To make or produce something / Go dira kampo go
uma sengwe
b) To collect something / Go kgobokanya sengwe
c) To cover the surface of something / Go tswala
sengwe ka mo godimo
1.4.2 Allergy / Aleji
a) A tool used to make milkshakes / Sediriso sa go
dira Senotsididi sa Mašwi
b) Sensitivity to something that causes an unwanted
reaction / Ditsibogo tse di tlisiwang ke go sa
utlwane le sengwe ka mo mmeleng
c) A bag used to freeze food / Kgetsana e e
dirisiwang go tsidifatsa dijo

140
2. SOUTH AFRICA’S EXPORTING OF BANANAS OVERSEAS / GO ISA KWA MOSEJA GA
MAWATLE GA DIPANANA TSA AFORIKABORWA
South Africa‟s finest fresh bananas are being exported to overseas countries. The picture below shows the
percentage of bananas being exported to different countries. / Dipanana tse di siameng go feta tsa
Aforikaborwa di isiwa kwa mafatsheng a kwa moseja. Ditshwantsho tse di mo tlase di bontsha diphesente tsa
dipanana tse di isiwang kwa mafatsheng a a farologaneng.
2.1 Which country receives the most bananas from South
Africa? / Ke lefatshe lefe le le amogelang dipanana
tse dintsi go feta go tswa mo Aforikaborwa?
2.2 Which country receives the least bananas from South
Africa? / Ke lefatshe lefe le le amogelang dipanana
tse dinnye go tswa mo Aforikaborwa ?
b) China 16% / Tšhaena
16%
c) Italy 7% /
Itali 7%
e) France 24% / Fora
24%
d) Holland 26% / Holane 26%
a) Brazil 37% /Brazil
37%

141
3. Vusi runs a tuckshop at the high school in his street. He wants to buy enough Coke for the
upcoming sports day, but is unsure how many packs of Coke he must buy. Help Vusi by
calculating how many Cokes there are by looking at the pictures. / Vusi o na le Tuck Shop mo
sekolong se se mo seterateng sa gagwe. O batla go reka Coke e e lekaneng go rekisa ka
letsatsi la metshameko le le tlang mme ene ga a itse gore a reke di le kae. Thusa Vusi ka go
bala gore go na le Di-Coke tse kae ka go bala mo setshwantshong.
3.1 How many cokes are in one box / Go na le Di-Coke
tse kae ka mo lebokosong le le nngwe ?
3.2 How many cokes are there in two boxes? / Go na le
Di-Coke tse kae mo mabokosong a mabedi?

142
4. Mrs Ntemba wants to determine the best type of milk she should buy for her children. She cannot
decide herself so she asks everyone in the neighbourhood to vote for their favourite brand of milk. The
pictures below show the number of votes that the three different brand of milk received: /
Moh Ntemba a ka rata go tlhomamisa gore ke mofuta ofe wa mašwi o o siameng wa go rekela bana ba
gagwe. Ga a kgone go akanya ka bo-ene mme o kopa botlhe ba mo tikologong ya gagwe go vouta
gore ke mofuta ofe wa mašwi o ba o ratang go feta. Ditshwantsho tse di mo tlase di bontsha palo jaaka
batho ba voutetse mefuta e meraro ya mašwi.
MILK A – 15 votes / MAŠWI
A - Divoutu di le 15
MILK B – 73 votes / MAŠWI
B - Divoutu di le 73
MILK C – 28 votes / MAŠWI
C - Divoutu di le 28
4.1. What was the most popular brand of milk? /
Ke mofuta ofe wa mašwi o o ratiwang go feta?
4.2. What was the total number of votes for all 3
milks? / Fa go tlhakantshiwa divoutu tsotlhe go ne
go voutile batho ba bakae?
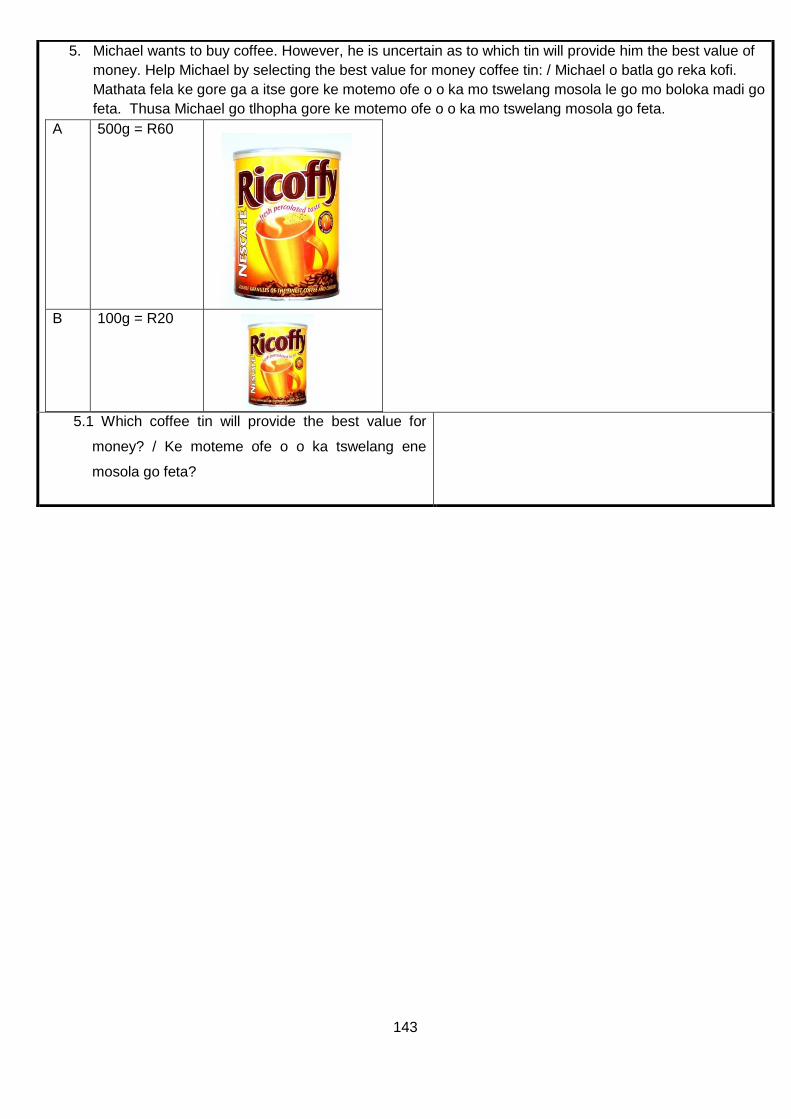
143
5. Michael wants to buy coffee. However, he is uncertain as to which tin will provide him the best value of
money. Help Michael by selecting the best value for money coffee tin: / Michael o batla go reka kofi.
Mathata fela ke gore ga a itse gore ke motemo ofe o o ka mo tswelang mosola le go mo boloka madi go
feta. Thusa Michael go tlhopha gore ke motemo ofe o o ka mo tswelang mosola go feta.
A 500g = R60
B 100g = R20
5.1 Which coffee tin will provide the best value for
money? / Ke moteme ofe o o ka tswelang ene
mosola go feta?

144
B. DEMOGRAPHIC INFORMATION/ POLELO KA GA DI PALOPALO TSA MORAFE
1. What is your gender? / Bong hwa gago ke eng?
a) Male / Banna
b) Female / Basadi
2. What is your age? / O na le dingwaga di le kae?
c) a) 18-29 years / Dingwaga tse 18-29
d) 30-39
e) 40-49
f) 50-59
g) 60 years and older / Dingwaga tse 60 le go feta
3. What is the highest level that you passed in school? (Formal education) / Ke mophato ofe o o kwa godimo o o o fetileng mo sekolong? (Thuto ya Tshwanelo)
a) Grade 5 / Standard 3 / Kereiti ya 5 kampo Mophato wa 3 wa kgale
b) Grade 6 / Standard 4 / Kereiti ya 6 kampo Mophato wa 4 wa kgale
c) Grade 7 / Standard 5 / Kereiti ya 7 kampo Mophato wa 5 wa kgale
d) Grade 8 / Standard 6 / Kereiti ya 8 kampo Mophato wa 6 wa pele
4. Main language of household: / Puo ya kwa gae ya lelapa:
a) Afrikaans / Seaforikanse
b) English / Seesimane
c) Setswana
d) IsiXhosa
e) IsiZulu
f) Sesotho
g) IsiNdebele
h) Sepedi
i) Tshivenda
j) Siswati
k) Xisonga
l) Other: / Tse dingwe:
5. What is your job? / Tiro ya gago ke eng?
a) Unemployed / Ga ke bereke
b) Cleaner / Mophephafatsi
c) Domestic worker / Modiri wa legae
d) Salesperson / Morekisi
e) Farm worker / Modiri wa polase
f) Pensioner / Mophenshene
g) Teacher / Morutabana
h) Other, please specify / Tse dingwe, tlhalosa:
6. What is your monthly household income? (approximately) / Lotseno la gago ka palogare ke bokae ka kgwedi?
a) Less than R500 / Tlase ga R500
b) R501-R1000
c) R1001- R2000
d) R2001- R3000
e) R3001- R4000
f) R4001- R5000 g) Other, please specify / Tse dingwe, tlhalosa

145
7. What is your marital status? / A o nyetse/nyetswe ga jaana?
a) Never married / Ga ke a nyala/nyalwa
b) Married / Ke nyetse/nyetswe
c) Cohabitation / Living together / Re dula mmogo
d) Divorced / Separated / Re tlhalane / Kgaogane le molekane
e) Widow / er / Ke motlholagadi/ moswagadi
8. How many children under the age of 18 live with you? / Go na le bana ba bakae ba ba dingwaga tse di tlase ga 18 ba ba dulang le wena?
a) 1
b) 2
c) 3
d) 4
e) 5
f) 5+

146
C. FOOD LABELING KNOWLEDGE / KITSO KA GA DITSHWAO MO DIJONG
The following section concerns about your knowledge on food labelling: / Kgaolo e e latelang e amana le
kitso ya gago ka ditshwao mo dijong
1. Have you ever noticed the food label information on
food products? / A o kile wa ela tlhoko
tshedimosetso e e mo dileiboleng tsa dijo?
Yes / Go ntse jalo No / Nnyaya gope
2. How often do you make use of food labels? / O
dirisa gakae dileibole le dikitsiso mo dijong?
Often / Gantsi Sometimes /
Gangwe le
gape
Never / Gope
3. How often do you shop for food? (Choose 1) / O reka dijo gakae? (Tlhopha e le nngwe)
a. Once a month/ O reka dijo gakae mo kweding
b. Once in two weeks/ O reka dijo gakae mo
bekeng tse pedi
c. Once a week / O reka dijo gakae mo bekeng
d. Two or more times a week/ Gabedi kgotsa go
feta mobekeng
4. Who do you ask to help you to read food labels?
Setsuana - O kopa mang go go thuso go buisa
ditshwao tsa dijo?
Often / Gantsi Sometimes /
Gangwe le
gape
Never /
Gope
a) I read it myself / Ke a di ipalela
b) A friend / Tsala ya me
c) A family member / Mongwe wa molosika
d) My child / Ngwana wa me
e) The store assistant / Modiri wa mo lebenkeleng

147
5. What problems do you experience with the food
labels? / O na le mathata afe ka ditshwao tsa mo
dijong?
Often / Gantsi Sometimes /
Gangwe le
gape
Never /
Gope
a) Takes too much time to read / Di tsaya nako e
telele go bala
b) Too many words on label / Setshwao se na le
mokwalo o montsi thata
c) I don‟t understand the words on label / Ga ke
tlhaloganye mafoko a mo setshwaong
d) Words too small to read / Mafoko a kwadile ka
ditlhaka tse dinnye thata
e) Do not trust labels / Ga ke tshepe ditshwao
f) Labels are not important / Ditshwao ga di
botlhokwa
g) Can‟t find information / Ga ke bone
tshedimosetso
h) Do not read food labels / Ga ke buise ditshwao
6. Do you do the following things when you buy food? /
A o dira ditiro tse di latelang fa o reka dijo?
Often / Gantsi Sometimes /
Gangwe le
gape
Never /
Gope
a) Do you use the calculator on the cell phone to
add up the price of two or more food products? /
A o dirisa sebaledi sa mo mogaleng wa letheka
go tlhakanya ditlhotlhwa tsa dijewa tse pedi le
go feta?
b) Do you ask somebody to help you to calculate
the total cost of two or more food products? / A o
kopa mongwe a go thuse ka go balela tlhotlhwa
yotlhe ya dijewa di le pedi le go feta?
c) Do you calculate the total cost of two or more
food products in your head? / A o balela
tlhotlhwa yotlhe ya dijewa di le pedi le go feta ka
mo tlhogong?
d) Do you pay the food products one at a time if
you buy many food items? / A o reka dijewa tse
di farologaneng ka bongwe ka bongwe fa o reka
dilo di le dintsi tsa dijewa?
e) Do you check if the money in your purse is
enough for all the food products you want to
buy? / A o netefatsa gore madi a o a tshwereng
a lekanela dijewa tsotlhe tse o batlang go di
reka?

148
7. Please tell me when do you use the information on a
label? / Ka kopo, mpolelele gore o dirisa leng
tshedimosetso e e ka mo setshwaong?
Often / Gantsi Sometimes /
Gangwe le
gape
Never /
Gope
a) In the shop? / Mo lebenkeleng?
b) At home? / Kwa gae?
8. Do the following tell you something about the quality
of the food? / A dintlha tse di latelang di go bolelela
sengwe ka ga boleng jwa dijo?
Yes / Go ntse jalo No / Nnyaya gope
a) Best before date / Botoka pele ga letlha le
b) Appearance of the product / Tebego ya sejewa
c) Price / Tlhotlhwa
d) Brand name / Leina la Letshwao
e) The store where you buy (Shoprite, Choppies
ect) / Lebenkele kwa o rekang teng (Shoprite,
Choppies jj.)
9. Please tell me the following on the food label (Show
card 1) / Mpolelele tshedimosetso e e latelang go
tswa mo Setshwaong(Bontsha karata ya 1)
Answer: / Karabo:
a) What vitamin is in the maize / Go na le dibitamini dife mo mmiding?
b) What is the best before date / Letlha la "Botoka pele ga letlha" ke eng?
c) What is the brand of the maize / Leina la Letshwao la mmidi ke eng?
d) What is the weight of the product / Boima jwa sejewa ke bokae?
e) How many kilojoules are in 100g of this food? / Go a le dikilojulu tse kae mo 100g mo dijong tse?
f) How much fat is in 100g of this food? / Go na le mafura a kana kang mo 100g ya dijo tse?
g) How much dietary fibre is in 100g of this food?Go na le faebara ya dijo e e kana kang mo 100g ya dijo tse?

149
10. Please tell the meaning of the symbol to you? /
Tlhalosa gore sekai se se go raya eng?
Answer / Karabo
a)
b)
c)
d)
11. Please work out the following (Show card 2) / Ka
kopo, dira ditiro tse di latelang(Bontsha karata ya 2)
Answer / Karabo
a. How much is the total price of a Ricoffy and a tea. One is R35 the other R20? / Tlhwatlhwa yotlhe ya Ricoffy le teye ke bokae? E nngwe ke R35 mme e nngwe ke R20?
b. The price of the noodles is R5.00 and the label says 50% off. What does it cost now? / Tlhotlhwa ya "Noodles" ke R5.00 mme setshwao sa re phokoletso ke 50%. Ke bokae jaanong?
c. The four drumsticks cost R20. What does one cost? / Dirope di le 4 tsa koko ke R20. E le nngwe ke bokae?
12. Can you identify (tell the names) of the following shops (Show card 3) / A o kgona go bitsa maina a
mabenkele a a latelang?(Bontsha karata ya 3)
Answer / Karabo
a)
b)
c)
d)
e)
f)

150
CARD 1 (Question C9)
BB – 05/12/2014

151
CARD 2 (Question C11)
a
+
=
R35 + R20 =
b
=
The noodles cost R5 What is the price of
50% off R5?
c
4 pieces chicken = R20 1 piece chicken = ?

152
CARD 3 (Question C12)
a
b
c
d
e
f